We have been named as defendants, targetsdefendant, target or a potentially responsible partiesparty (“PRP”) in a number of environmentalclean-ups relating to our current or former business units. We have disposed of a number of businesses in recent years and in certain cases, we have retained responsibility and potential liability for certain environmental obligations. We have received claims for indemnification from certain purchasers. We may be named as a PRP at other sites in the future for existing business units, as well as both divested and acquired businesses.
Certain environmental laws impose liability on current or previous owners or operators of real property for the cost of removal or remediation of hazardous substances at their properties or at properties at which they have disposed of hazardous substances. We cannot ensure youhave projects underway at several current and former manufacturing facilities to investigate and remediate environmental contamination resulting from our past operations or by other businesses that previously owned or used the properties. The cost of cleanup and other environmental liabilities can be difficult to accurately predict. In addition, environmental requirements will not change orand tend to become more stringent over time ortime. Thus, we cannot provide assurance that our eventual environmentalclean-up costs and liabilities will not exceed the amount of our current reserves.
We are exposed to certain regulatory and financial risks related to climate change.
Climate change is receiving ever increasing attention worldwide. Many scientists, legislators and others attribute global warming to increased levels of greenhouse gases, including carbon dioxide, which has led to significant legislative and regulatory efforts to limit greenhouse gas emissions. The U.S. Congress and federal and state regulatory agencies have been considering legislation and regulatory proposals that would regulate and limit greenhouse gas emissions. It is uncertain whether, when and in what form a federal mandatory carbon dioxide emissions reduction program may be adopted. Similarly, certain countries have adopted the Kyoto Protocol and this and other existing international initiatives or those under consideration could affect our international operations. To the extent our customers, particularly those involved in the oil and gas, power generation, petrochemical processing or petroleum refining industries, are subject to any of these or other similar proposed or newly enacted laws and regulations, we are exposed to risks that the additional costs by customers to comply with such laws and regulations could impact their ability or desire to continue to operate at similar levels in certain jurisdictions as historically seen or as currently anticipated, which could negatively impact their demand for our products and services. In addition, new laws and regulations that might favor the increased use of non-fossil fuels, including nuclear, wind, solar and bio-fuels or that are designed to increase energy efficiency, could dampen demand for oil and gas production or power generation resulting in lower spending by customers for our products and services. These actions could also increase costs associated with our operations, including costs for raw materials and transportation. Because it is uncertain what laws will be enacted, we cannot predict the potential impact of such laws on our future financial condition, results of operations and cash flows.
Our results of operations may be negatively impacted by litigation.
Our businesses expose us to potential litigation, such as product liability claims relating to the design, manufacture and sale of our products. While we currently maintain what we believe to be suitable product liability insurance, we cannot provide assurance that we will be able to maintain this insurance on acceptable terms or that this insurance will provide adequate protection against potential or previously existing liabilities. In
13
addition, we self-insure a portion of product liability claims. Successful claims against us for significant amounts could materially and adversely affect our product reputation, financial condition, results of operations and cash flows.
Risks Relating to the Distribution and the Merger
We may not realize the growth opportunities and cost synergies that are anticipated from the Merger.
The benefits that are expected to result from the Merger will depend, in part, on our ability to realize the anticipated growth opportunities and cost synergies as a result of the Merger. Our success in realizing these growth opportunities and cost synergies, and the timing of this realization, depends on the successful integration of the Pentair, Inc. and Flow Control businesses. Even if we are able to integrate the Pentair, Inc. and Flow Control businesses successfully, this integration may not result in the realization of the full benefits of the growth opportunities and cost synergies that we currently expect from this integration or that these benefits will be achieved within the anticipated time frame or at all. For example, we may not be able to eliminate duplicative costs. Moreover, we may incur substantial expenses in connection with the integration of the Pentair, Inc. and Flow Control businesses. While we anticipate that certain expenses will be incurred, such expenses are difficult to estimate accurately, and may exceed current estimates. Accordingly, the benefits from the Merger may be offset by costs incurred or delays in integrating the businesses.
The integration of the Pentair, Inc. and Flow Control businesses following the Merger may present significant challenges.
There is a significant degree of difficulty and management distraction inherent in the process of integrating the Pentair, Inc. and Flow Control businesses. These difficulties include:
the challenge of integrating the Pentair, Inc. and Flow Control businesses while carrying on the ongoing operations of each entity;
the necessity of coordinating geographically separate organizations;
the challenge of integrating the business cultures of the Pentair, Inc. and Flow Control businesses, which may prove to be incompatible;
the challenge and cost of integrating the information technology systems of the Pentair, Inc. and Flow Control businesses; and
the potential difficulty in retaining key executives and personnel of the Pentair, Inc. and Flow Control businesses.
The process of integrating operations could cause an interruption of, or loss of momentum in, the activities of the Pentair, Inc. and Flow Control businesses. Members of our senior management may be required to devote considerable amounts of time to this integration process, which will decrease the time they will have to manage our company, service existing customers, attract new customers and develop new products or strategies. If senior management is not able to effectively manage the integration process, or if any significant business activities are interrupted as a result of the integration process, the Pentair, Inc. and Flow Control businesses could suffer. There can be no assurance that we will successfully or cost-effectively integrate the Pentair, Inc. and Flow Control businesses. The failure to do so could have a material adverse effect on our business, financial condition and results of operations.
We share responsibility for certain income tax liabilities for tax periods prior to and including the date of the Distribution.
In connection with the Distribution, we entered into a tax sharing agreement (the “2012 Tax Sharing Agreement”) with Tyco and The ADT Corporation (“ADT”), which governs the rights and obligations of ADT, Tyco and us for certain pre-Distribution tax liabilities, including Tyco’s obligations under a separate tax sharing agreement (the “2007 Tax Sharing Agreement”) entered into by Tyco, Covidien Ltd. (“Covidien”) and TE
14
Connectivity Ltd. (“TE Connectivity”) in connection with the 2007 distributions of Covidien and TE Connectivity by Tyco (the “2007 Separation”). The 2012 Tax Sharing Agreement provides that we, Tyco and ADT will share (i) certain pre-Distribution income tax liabilities that arise from adjustments made by tax authorities to our, Tyco’s and ADT’s U.S. income tax returns, and (ii) payments required to be made by Tyco with respect to the 2007 Tax Sharing Agreement (the liabilities in clauses (i) and (ii) collectively, “Shared Tax Liabilities”). Tyco is responsible for the first $500 million of Shared Tax Liabilities. We and ADT will share 42% and 58%, respectively, of the next $225 million of Shared Tax Liabilities. We, ADT and Tyco will share 20%, 27.5% and 52.5%, respectively, of Shared Tax Liabilities above $725 million.
The 2007 Tax Sharing Agreement governs the rights and obligations of Tyco, Covidien and TE Connectivity with respect to certain pre-2007 Separation tax liabilities and certain tax liabilities arising in connection with the 2007 Separation. More specifically, Tyco, Covidien and TE Connectivity share 27%, 42% and 31%, respectively, of income tax liabilities that arise from adjustments made by tax authorities to Tyco’s, Covidien’s and TE Connectivity’s U.S. and certain non-U.S. income tax returns and certain taxes attributable to internal transactions undertaken in anticipation of the 2007 Separation. In addition, in the event that the 2007 Separation or certain related transactions are determined to be taxable as a result of actions taken after the 2007 Separation by Tyco, Covidien or TE Connectivity, the party responsible for such failure would be responsible for all taxes imposed on Tyco, Covidien or TE Connectivity as a result thereof. If none of the companies is responsible for such failure, then Tyco, Covidien and TE Connectivity would be responsible for such taxes, in the same manner and in the same proportions as other shared tax liabilities under the 2007 Tax Sharing Agreement. Costs and expenses associated with the management of these shared tax liabilities are generally shared equally among the parties.
With respect to years prior to and including the 2007 Separation, tax authorities have raised issues and proposed tax adjustments that are generally subject to the sharing provisions of the 2007 Tax Sharing Agreement and which may require Tyco to make a payment to a taxing authority, Covidien or TE Connectivity. With respect to adjustments raised by the IRS, although Tyco has resolved a substantial number of these adjustments, a few significant items remain open with respect to the audit of the 1997 through 2004 years. As of the date hereof, Tyco has not been able to resolve certain open items, which primarily involve the treatment of certain intercompany debt issued during the period, through the IRS appeals process. As a result, Tyco expects to litigate these matters once it receives the requisite statutory notices from the IRS, which is likely to occur within the next six months. However, the ultimate resolution of these matters is uncertain and could result in Tyco being responsible for a greater amount than it expects under the 2007 Tax Sharing Agreement.
Any payment that Tyco is required to make under the 2007 Tax Sharing Agreement could result in a material liability for us under the 2012 Tax Sharing Agreement. To the extent we are responsible for any liability under the 2012 Tax Sharing Agreement, and indirectly the 2007 Tax Sharing Agreement, there could be a material adverse impact on our financial condition, results of operations, cash flows or our effective tax rate in future reporting periods.
If the Merger, Distribution or certain internal transactions undertaken in anticipation of the Distribution are determined to be taxable for U.S. federal income tax purposes, we, our shareholders or Tyco could incur significant U.S. federal income tax liabilities.
Pentair, Inc. and Tyco received private letter rulings from the IRS in connection with the Distribution and the Merger regarding the U.S. federal income tax consequences of the Distribution and the Merger to the effect that, for U.S. federal income tax purposes: the Distribution will qualify as tax-free under Sections 355 and 361 of the Internal Revenue Code of 1986, as amended (the “Code”), except for cash received in lieu of fractional shares; certain internal transactions undertaken in anticipation of the Distribution will qualify for favorable treatment under the Code; the Merger will qualify as a reorganization under Section 368(a) of the Code; certain anticipated post-closing transactions will not prevent the tax-free treatment of the Distribution or the Merger; and Section 367(a)(1) of the Code will not cause the Merger to be taxable to Pentair, Inc. shareholders (except for a U.S. shareholder who is or will be a “five-percent transferee shareholder” within the meaning of applicable Treasury Regulations but who does not enter into a “gain recognition agreement with the IRS). In addition, Tyco received a legal opinion confirming the tax-free status of the Distribution for U.S. federal income tax purposes
15
and Tyco and Pentair, Inc. received legal opinions to the effect that the Merger will qualify as a reorganization under section 368(a) of the Code and that Section 367(a)(1) of the Code will not cause the Merger to be taxable to Pentair, Inc. shareholders (except for a U.S. shareholder who is or will be a “five-percent transferee shareholder” within the meaning of applicable Treasury Regulations but who does not enter into a “gain recognition agreement” with the IRS).
The private letter rulings and opinions relied on certain facts and assumptions, and certain representations and undertakings, from us, Tyco and Pentair, Inc. Notwithstanding the private letter rulings and the opinions, the IRS could determine on audit that the Distribution, the internal transactions or the Merger should be treated as taxable transactions if it determines that any of these facts, assumptions, representations or undertakings is not correct or has been violated, or that the Distribution, the internal transactions or the Merger should be taxable for other reasons, including as a result of significant changes in share or asset ownership after the Merger.
If the Distribution ultimately is determined to be taxable, the Distribution could be treated as a taxable dividend or capital gain to Tyco shareholders for U.S. federal income tax purposes, and Tyco shareholders could incur significant U.S. federal income tax liabilities. In addition, Tyco would recognize a gain in an amount equal to the excess of the fair market value of our common shares distributed to Tyco shareholders on the Distribution date over Tyco’s tax basis in such common shares, but such gain, if recognized, generally would not be subject to U.S. federal income tax. However, Tyco could incur significant U.S. federal income tax liabilities if it is ultimately determined that certain internal transactions undertaken in anticipation of the Distribution are taxable. If the Merger ultimately is determined to be taxable, Pentair, Inc. shareholders would recognize taxable gain or loss on their disposition of Pentair, Inc. common shares in the Merger.
Under the terms of the 2012 Tax Sharing Agreement, in the event the Distribution, the ADT distribution, the internal transactions or the Merger were determined to be taxable as a result of actions taken after the Distribution by us, ADT or Tyco, the party responsible for such failure would be responsible for all taxes imposed as a result thereof. If such failure is not the result of actions taken after the Distribution by us, ADT or Tyco, then we, ADT and Tyco would be responsible for any taxes imposed as a result of such determination in the same manner and in the same proportions as we, ADT and Tyco are responsible for Shared Tax Liabilities. Such tax amounts could be significant. In the event that any party to the 2012 Tax Sharing Agreement defaults in its obligation to pay certain taxes to another party that arise as a result of no party’s fault, each non-defaulting party would be responsible for an equal amount of the defaulting party’s obligation to make a payment to another party in respect of such other party’s taxes. In addition, if another party to the 2012 Tax Sharing Agreement that is responsible for all or a portion of an income tax liability were to default in its payment of such liability to a taxing authority, we could be legally liable under applicable tax law for such liabilities and required to make additional tax payments. Accordingly, under certain circumstances, we may be obligated to pay amounts in excess of our agreed-upon share of our, Tyco’s and ADT’s tax liabilities.
If the Distribution or the Merger are determined to be taxable for Swiss withholding or other tax purposes, we could incur significant Swiss withholding tax or other tax liabilities.
Generally, Swiss withholding tax of 35% is due on dividends and similar distributions to Tyco’s shareholders, regardless of the place of residency of the shareholder. As of January 1, 2011, distributions to shareholders out of qualifying contributed surplus (Kapitaleinlage) accumulated on or after January 1, 1997 are exempt from Swiss withholding tax if certain conditions are met (Kapitaleinlageprinzip). Tyco has obtained a ruling from the Swiss Federal Tax Administration confirming that the Distribution qualifies as payment out of such qualifying contributed surplus and no amount will be withheld by Tyco when making the Distribution.
As a condition to closing of the Merger, Tyco obtained rulings from the Swiss Federal Tax Administration confirming: (i) that the Merger will be a transaction that is generally tax-free for Swiss federal, cantonal, and communal tax purposes (including with respect to Swiss stamp tax and Swiss withholding tax); (ii) the relevant Swiss tax base of an acquisition subsidiary of ours for Swiss tax (including federal and cantonal and communal) purposes; (iii) the relevant amount of capital contribution reserves (Kapitaleinlageprinzip) which will be exempt
16
from Swiss withholding tax in the event of a distribution to our shareholders after the Merger; and (iv) that no Swiss stamp tax will be levied on certain post-Merger restructuring transactions.
These tax rulings rely on certain facts and assumptions, and certain representations and undertakings, from Tyco. Notwithstanding these tax rulings, the Swiss Federal Tax Administration could determine on audit that the Distribution or the Merger or certain internal transactions undertaken in anticipation of the Distribution should be treated as a taxable transaction for withholding tax or other tax purposes if it determines that any of these facts, assumptions, representations or undertakings is not correct or has been violated. If the Distribution or the Merger or certain internal transactions undertaken in anticipation of the Distribution ultimately are determined to be taxable for withholding tax or other tax purposes, we and Tyco could incur material Swiss withholding tax or other tax liabilities that could significantly detract from, or eliminate, the benefits of the Distribution and the Merger. In addition, we could become liable to indemnify Tyco for part of any Swiss withholding tax liabilities to the extent provided under the 2012 Tax Sharing Agreement.
We might not be able to engage in desirable strategic transactions and equity issuances because of restrictions relating to U.S. federal income tax requirements for tax-free distributions.
Our ability to engage in desirable strategic transactions or equity issuances could be significantly limited or restricted in order to preserve, for U.S. federal income tax purposes, the tax-free nature of the Distribution and certain related transactions. Even if the Distribution otherwise qualifies for tax-free treatment under Section 355 of the Code, it may result in corporate-level gain to Tyco under Section 355(e) of the Code if 50% or more, by vote or value, of our shares or Tyco’s shares are acquired or issued as part of a plan or series of related transactions that includes the Distribution. Any acquisitions or issuances of our shares or Tyco’s shares within two years after the Distribution are generally presumed to be part of such a plan, although we or Tyco may be able to rebut that presumption. For purposes of this test, the Merger might be treated as part of such a plan or series of related transactions, but if so would not, by itself, cause the Distribution to be taxable to Tyco since Pentair, Inc. shareholders acquired less than 50% of our common shares in the Merger. The change in ownership resulting from the Merger, if treated as part of a plan or series of related transactions that includes the Distribution, would be aggregated with other acquisitions or issuances of our shares that occur as part of a plan or series of related transactions that include the Distribution in determining whether a 50% change in ownership has occurred. The process for determining whether a change of ownership has occurred under the tax rules is complex, inherently factual and subject to interpretation of the facts and circumstances of a particular case. If we do not carefully monitor our compliance with these rules, we could inadvertently cause or permit a change of ownership to occur, triggering our obligation to indemnify Tyco or ADT pursuant to the 2012 Tax Sharing Agreement.
To preserve the tax-free treatment to Tyco of the Distribution, under the 2012 Tax Sharing Agreement, we are prohibited from taking or failing to take any action that prevents the Distribution and related transactions from being tax-free. Further, for the two-year period following the Distribution, without obtaining the consent of Tyco and ADT, a private letter ruling from the IRS or an unqualified opinion of a nationally recognized law firm, we may be prohibited from, among other things:
approving or allowing any transaction that results in a change in ownership of more than 35% of our common shares, when combined with any other changes in ownership of our common shares,
redeeming equity securities,
selling or otherwise disposing of more than 35% of our assets, or
engaging in certain internal transactions.
These restrictions may limit our ability to pursue strategic transactions or engage in new business or other transactions that may maximize the value of our business. Moreover, the 2012 Tax Sharing Agreement also
17
provides that we are responsible for any taxes imposed on Tyco or any of its affiliates or on ADT or any of its affiliates as a result of the failure of the Distribution or the internal transactions to qualify for favorable treatment under the Code if such failure is attributable to certain actions taken after the Distribution by or in respect of us, any of our affiliates or our shareholders.
Our accounting and other management systems and resources may not be adequately prepared to quickly integrate and update the financial reporting systems of the Flow Control business.
The financial results of the Flow Control business previously were included within the consolidated results of Tyco, and were not directly subject to the reporting and other requirements of the Securities Exchange Act of 1934 (the “Exchange Act”). As a result of the Distribution and the Merger, we are subject to reporting and other obligations under the Exchange Act. The Exchange Act requires that we file annual, quarterly and current reports with respect to our business and financial condition. We are responsible for ensuring that all aspects of our business comply with Section 404 of the Sarbanes-Oxley Act of 2002 (the “Sarbanes-Oxley Act”), which will require annual management assessments of the effectiveness of internal control over financial reporting and a report by an independent registered public accounting firm addressing these assessments. Although our management has experience with these reporting and related obligations, ensuring compliance with respect to the Flow Control business may place significant demands on management, administrative and operational resources, including accounting systems and resources.
Our report on our internal control over financial reporting (“ICFR”) in the Annual Report on Form 10-K for the year ended December 31, 2012 includes a scope exception for the acquired Flow Control business because it is a significant acquisition for which our management would otherwise have had only three months to evaluate and implement ICFR.
Under the Sarbanes-Oxley Act, we are required to maintain effective disclosure controls and procedures and internal controls over financial reporting. To comply with these requirements with respect to the Flow Control business, we may need to upgrade our systems; implement additional financial and management controls, reporting systems and procedures; and hire additional accounting and finance staff. It is expected that we will incur annual expenses for the purpose of addressing these requirements, and those expenses may be significant. If we are unable to upgrade its financial and management controls, reporting systems, information technology systems and procedures in a timely and effective fashion, our ability to comply with our financial reporting requirements and other rules that apply to reporting companies under the Exchange Act could be impaired. Any failure to achieve and maintain effective internal controls could have a material adverse effect on our business, financial condition, results of operations and cash flows.
Risks Relating to Our Liquidity
Disruptions in the financial markets could adversely affect us, our customers and our suppliers by increasing funding costs or reducing availability of credit.
In the normal course of our business, we may access credit markets for general corporate purposes, which may include repayment of indebtedness, acquisitions, additions to working capital, repurchase of common shares, capital expenditures and investments in our subsidiaries. Although we expect to have sufficient liquidity to meet our foreseeable needs, our access to and the cost of capital could be negatively impacted by disruptions in the credit markets, which have occurred in the past and made financing terms for borrowers unattractive or unavailable. These factors may make it more difficult or expensive for us to access credit markets if the need arises. In addition, these factors may make it more difficult for our suppliers to meet demand for their products or for prospective customers to commence new projects, as customers and suppliers may experience increased costs of debt financing or difficulties in obtaining debt financing. Disruptions in the financial markets have had adverse effects on other areas of the economy and have led to a slowdown in general economic activity that may continue to adversely affect our businesses. These disruptions may have other unknown adverse effects. One or more of these factors could adversely affect our business, financial condition, results of operations or cash flows.
18
Provisions of our Restated Articles of Incorporation, Bylaws and Minnesota law could deter takeover attempts.
Our credit agreements and inindentures contain customary financial covenants. Our ability to meet the financial covenants can be affected by events beyond our shareholder rights plan could prevent or delay transactionscontrol, and we cannot provide assurance that our shareholders may favor.
We may increase our debt or raise additional capital in the future, which could affect our financial condition, and may decrease our profitability.
As of December 31, 2012, we had $2.5 billion of total debt outstanding. We may increase our debt or raise additional capital in the future, subject to restrictions in our debt agreements. If our cash flow from operations is less than we anticipate, or if our cash requirements are more than we expect, we may require more financing. However, debt or equity financing may not be available to us on acceptable terms, if at all. If we incur additional debt or raise equity through the issuance of additional capital shares, the terms of the debt or capital shares issued may give the holders rights, preferences and privileges senior to those of holders of our common shares, particularly in the event of liquidation. The terms of the debt may also impose additional and more stringent restrictions on our operations than we currently have. If we raise funds through the issuance of additional equity, the percentage ownership of existing shareholders in our company would decline. If we are unable to raise additional capital when needed, our financial condition could be adversely affected. Also, regardless of the terms of our financings, the amount of our shares that we can issue may be limited because the issuance of our shares may cause the Distribution to be a taxable event for Tyco under Section 355(e) of the Code, and under the 2012 Tax Sharing Agreement, we could be required to indemnify Tyco for that tax. See discussion under “We might not be able to engage in desirable strategic transactions and equity issuances following the Distribution and the Merger because of restrictions relating to U.S. federal income tax requirements for tax-free distributions.”
Our leverage could have a material adverse effect on our business, financial condition or results of operations.
Our ability to make payments on and to refinance our indebtedness, including our existing debt as well as any future debt that we may incur, will depend on our ability to generate cash in the future from operations, financings or asset sales. Our ability to generate cash is subject to general economic, financial, competitive, legislative, regulatory and other factors that are beyond our control. If we are not able to repay or refinance our debt as it becomes due, we may be forced to sell assets or take other disadvantageous actions, including (i) reducing financing in the future for working capital, capital expenditures and general corporate purposes or (ii) dedicating an unsustainable level of our cash flow from operations to the payment of principal and interest on our indebtedness. The lenders who hold such debt could also accelerate amounts due, which could potentially trigger a default or acceleration of any of our other debt.
Risks Relating to Our Jurisdiction of Incorporation in Switzerland
Our status as a Swiss corporation may limit our flexibility with respect to certain aspects of capital management and may cause us to be unable to make distributions without subjecting our shareholders to Swiss withholding tax.
Swiss law allows shareholders to authorize share capital that can be issued by the board of directors without additional shareholder approval. This authorization is limited to 50% of the existing registered share capital and must be renewed by the shareholders every two years. Additionally, subject to specified exceptions, Swiss law grants preemptive rights to existing shareholders to subscribe to any new issuance of shares. Swiss law also does not provide as much flexibility in the various terms that can attach to different classes of shares as the laws of
19
some other jurisdictions. Swiss law also reserves for approval by shareholders certain corporate actions over which a board of directors would have authority in some other jurisdictions. These Swiss law requirements relating to our capital management may limit our flexibility, and situations may arise where greater flexibility would have provided substantial benefits to our shareholders.
Under Swiss law, a Swiss corporation may pay dividends only if the corporation has sufficient distributable profits from previous fiscal years, or if the corporation has distributable reserves, each as evidenced by its audited statutory balance sheet. Distributable reserves are generally recorded either as “free reserves” or as “qualifying contributed surplus” (contributions received from shareholders) in “Capital contribution reserve.” Distributions may be made out of registered share capital—the aggregate par value of a company’s registered shares—only by way of a capital reduction. After the Merger, the amount available for future dividends or capital reductions from reserve from capital contributions on a Swiss withholding tax free basis is CHF 8.7 billion. We are awaiting approval from the Swiss tax authorities of the reserve from capital contributions. We will not be able to pay dividends or make other distributions to shareholders on a Swiss withholding tax free basis in excess of that amount unless we increase our share capital or our reserves from capital contributions. We would also be able to pay dividends out of distributable profits or freely distributable reserves, but such dividends would be subject to Swiss withholding tax. There can be no assurance that we will have sufficient distributable profits, free reserves, reserves from capital contributions or registered share capital to pay a dividend or effect a capital reduction or that we will be able to meet the other legal requirements for dividend payments or distributions as a result of capital reductions.
Generally, Swiss withholding tax of 35% is due on dividends and similar distributions to our shareholders, regardless of the place of residency of the shareholder, unless the distribution is made to shareholders out of (i) a reduction of par value or (ii) assuming certain conditions are met, qualifying contributed surplus accumulated on or after January 1, 1997. A U.S. holder that qualifies for benefits under the Convention between the United States of America and the Swiss Confederation for the Avoidance of Double Taxation with Respect to Taxes on Income (the “U.S.-Swiss Treaty”) may apply for a refund of the tax withheld in excess of the 15% treaty rate (or in excess of the 5% reduced treaty rate for qualifying corporate shareholders with at least 10% participation in our voting shares, or for a full refund in the case of qualified pension funds). There can be no assurance that we will have sufficient qualifying contributed surplus to pay dividends free from Swiss withholding tax or that Swiss withholding rules will not be changed in the future. In addition, there can be no assurance that the current marketSwiss law with respect to distributions out of qualifying contributed surplus will not be changed or that a change in Swiss law will not adversely affect us or our shareholders, in particular as a result of distributions out of qualifying contributed surplus becoming subject to additional corporate law or other restrictions. There are currently motions pending in the Swiss Parliament that purport to limit the distribution of qualifying contributed surplus. In addition, over the long term, the amount of par value available to us for par value reductions or qualifying contributed surplus available to us to pay out as distributions is limited. If we are unable to make a distribution through a reduction in par value or out of qualifying contributed surplus, we may not be able to make distributions without subjecting our shareholders to Swiss withholding taxes.
Under present Swiss tax laws, repurchases of shares for the purposes of cancellation are treated as a partial liquidation subject to 35% Swiss withholding tax on the difference between the repurchase price and the par value except, since January 1, 2011, to the extent attributable to qualifying contributed surplus (Kapitaleinlagereserven) if any. If, and to the extent that, the repurchase of shares is out of retained earnings or other taxable reserves, the Swiss withholding tax becomes due. No partial liquidation treatment applies and no withholding tax is triggered if the shares are not repurchased for cancellation but held by us as treasury shares. However, should we not resell such treasury shares within six years, the withholding tax becomes due at the end of the six year period.
Although we may follow a share repurchase process for future share repurchases, if any, similar to a “second trading line” on the SIX Swiss Exchange in which Swiss institutional investors sell shares to us and are generally able to receive a refund of the Swiss withholding tax, if we are unable to use this process successfully, we may
20
not be able to repurchase shares for the purposes of capital reduction without triggering Swiss withholding tax if and to the extent that the repurchase of shares is made out of retained earnings or other taxable reserves. No withholding tax would be applicable if and to the extent that tax-free qualifying contributed surplus is attributable to the share repurchase.
Changes in the U.S. dollar/Swiss franc exchange rate could limit the amount of dividends authorized on our common stock.shares, and there can be no assurance that we will be able to continue to pay dividends on our common shares.
Prior to the consummation of the Merger, our board of directors proposed, and Tyco as our sole shareholder authorized, us to pay quarterly cash dividends through the first annual general meeting of our shareholders in 2013. The authorization provides that a dividend will be made out of our “contributed surplus” equity position in our statutory accounts to our shareholders in the amount of $0.23 for the second quarter of 2013. The deduction to our contributed surplus in our statutory accounts, which is required to be made in Swiss francs, will be determined based on the aggregate amount of the dividend and will be calculated based on the U.S. dollar/Swiss franc exchange rate in effect on September 14, 2012. The U.S. dollar amount of the dividend will be capped at an amount such that the aggregate reduction to our contributed surplus will not exceed 240 million Swiss francs. To the extent that a dividend payment would exceed the cap, the U.S. dollar per share amount of the current or future dividends will be reduced on a pro rata basis so that the aggregate amount of all dividends paid does not exceed the cap. In addition, the aggregate reduction in contributed surplus will be increased for any shares issued, and decreased for any shares acquired, after September 14, 2012 and before the record date for the applicable dividend payment.
Any future dividends that may be proposed by our board of directors will be subject to approval by our shareholders at our annual general meeting. There can be no assurance that our shareholders will approve dividends. Whether our board of directors exercises its discretion to propose any dividends to holders of our common shares will depend on many factors, including our financial condition, earnings, capital requirements of our business, covenants associated with debt obligations, legal requirements, regulatory constraints, industry practice and other factors that our board of directors deems relevant. There can be no assurance that we will continue to pay any dividend in the future.
Swiss laws differ from the laws in effect in the United States and may afford less protection to holders of our securities.
Because of differences between Swiss law and U.S. state and federal laws and differences between the governing documents of Swiss companies and those incorporated in the U.S., it may not be possible to enforce in Switzerland court judgments obtained in the United States against us based on the civil liability provisions of the federal or state securities laws of the United States. As a result, in a lawsuit based on the civil liability provisions of the U.S. federal or state securities laws, U.S. investors may find it difficult to:
effect service within the United States upon us or our directors and officers located outside the United States;
enforce judgments obtained against those persons in U.S. courts or in courts in jurisdictions outside the United States; and
enforce against those persons in Switzerland, whether in original actions or in actions for the enforcement of judgments of U.S. courts, civil liabilities based solely upon the U.S. federal or state securities laws.
Original actions against persons in Switzerland based solely upon the U.S. federal or state securities laws are governed, among other things, by the principles set forth in the Swiss Federal Act on Private International Law. This statute provides that the application of provisions of non-Swiss law by the courts in Switzerland shall be precluded if the result was incompatible with Swiss public policy. Also, mandatory provisions of Swiss law may be applicable regardless of any other law that would otherwise apply.
21
Switzerland and the United States do not have a treaty providing for reciprocal recognition of and enforcement of judgments in civil and commercial matters. The recognition and enforcement of a judgment of the courts of the United States in Switzerland is governed by the principles set forth in the Swiss Federal Act on Private International Law. This statute provides in principle that a judgment rendered by a non-Swiss court may be enforced in Switzerland only if:
the non-Swiss court had jurisdiction pursuant to the Swiss Federal Act on Private International Law;
the judgment of such non-Swiss court has become final and non-appealable;
the judgment does not contravene Swiss public policy;
the court procedures and the service of documents leading to the judgment were in accordance with the due process of law; and
no proceeding involving the same position and the same subject matter was first brought in Switzerland, or adjudicated in Switzerland, or that it was earlier adjudicated in a third state and this decision is recognizable in Switzerland.
ITEM 1B. UNRESOLVED STAFF COMMENTS
None.
| ITEM 2. PROPERTIES | |
Our principal executive office is located in leased premises in Schaffhausen, Switzerland, and our management office in the United States is located in leased premises in Golden Valley, Minnesota. Our operations are conducted in facilities throughout the world. These facilities house manufacturing and distribution operations, as well as sales and marketing, engineering and administrative offices.
We carry out our Water Group& Fluid Solutions manufacturing operations at 26 plants located throughout the United States and at 1434 plants located in 1017 other countries. In addition, our Water Group& Fluid Solutions has 1955 distribution facilities and 3558 sales offices located in numerous countries throughout the world.
We carry out our Technical Products GroupValves & Controls manufacturing operations at 611 plants located throughout the United States and 1052 plants located in 820 other countries. In
11
We carry out our Technical Solutions manufacturing operations at 10 plants located throughout the United States and 13 plants located in 11 other countries. In addition, Technical Solutions has 20 distribution facilities and 42 sales offices located in numerous countries throughout the world.
We believe that our production facilities are suitable for their purpose and are adequate to support our businesses.
| ITEM 3. LEGAL |
We have been made parties to a number of actions filed or have been given notice of potential claims relating to the conduct of our business, including those pertaining to commercial disputes, product liability, asbestos, environmental, safety and health, patent infringement and employment matters.
While we believe that a material adverse impact on our consolidated financial position, results of operations or cash flows from any such future chargesclaims or potential claims is unlikely, given the inherent uncertainty of litigation, a remote possibility exists that a future adverse ruling or unfavorable development could result in future charges that could have a material adverse impact. We do and will continue to periodically reexamine our estimates of probable liabilities
22
and any associated expenses and receivables and make appropriate adjustments to such estimates based on experience and developments in litigation. As a result, the current estimates of the potential impact on our consolidated financial position, results of operations and cash flows for the proceedings and claims described in “Legal Proceedings”the notes to our consolidated financial statements could change in the future.
EnvironmentalAsbestos Matters
Our subsidiaries and numerous other companies are named as defendants targetsin personal injury lawsuits based on alleged exposure to asbestos-containing materials. These cases typically involve product liability claims based primarily on allegations of manufacture, sale or PRPdistribution of industrial products that either contained asbestos or were attached to or used with asbestos-containing components manufactured by third-parties. Each case typically names between dozens to hundreds of corporate defendants. While we have observed an increase in a smallthe number of environmentalclean-ups,these lawsuits over the past several years, including lawsuits by plaintiffs with mesothelioma-related claims, a large percentage of these suits have not presented viable legal claims and, as a result, have been dismissed by the courts. Our historical strategy has been to mount a vigorous defense aimed at having unsubstantiated suits dismissed, and, where appropriate, settling suits before trial. Although a large percentage of litigated suits have been dismissed, we cannot predict the extent to which we will be successful in resolving lawsuits in the future.
As of December 31, 2012, there were approximately 1,900 lawsuits pending against our subsidiaries. A lawsuit might include several claims, and we have approximately 2,300 claims outstanding as of December 31, 2012. This amount is not adjusted for claims that are not actively being prosecuted, identified incorrect defendants, or duplicated other actions, which would ultimately reflect our current or former business units have generally been givende minimisstatus. To date, noneestimate of these claims have resulted inclean-up costs, fines, penalties or damages in an amount material to our financial position or results of operations. We have disposed of athe number of businessesviable claims made against us, our affiliates, or entities for which we assumed responsibility in connection with acquisitions or divestitures. In addition, the amount does not include certain claims pending against third parties for which we have provided an indemnification.
Our estimated liability for asbestos-related claims was $234.6 million and $0.6 million as of December 31, 2012 and 2011, respectively, and was recorded inOther non-current liabilities in the past yearsConsolidated Balance Sheets for pending and future claims and related defense costs. Our estimated receivable for insurance recoveries was $157.4 million at December 31, 2012, all of which was acquired in certain cases, suchthe Merger, and was recorded inOther non-current assets in the Consolidated Balance Sheets. We had no estimated receivable for insurance recoveries as the disposition of the Cross Pointe Paper Corporation uncoated paper businessDecember 31, 2011.
Environmental Matters
We are involved in 1995, the disposition of the Federal Cartridge Company ammunition business in 1997, the disposition of Lincoln Industrial in 2001 and the disposition of the Tools Group in 2004, weor have retained responsibility and potential liability for environmental obligations and legal proceedings related to our current business and, including pursuant to certain indemnification obligations, related to certain formerly owned businesses. We are responsible, or alleged to be responsible, for ongoing environmental obligations.investigation and/or remediation of sites in several countries. These sites are in various stages of investigation and/or remediation and at some of these sites our liability is considered de minimis. We received notification from the U.S. Environmental Protection Agency and from similar state and non-U.S. environmental agencies that several sites formerly or currently owned and/or operated by us, and other properties or water supplies that may be or may have been impacted from those operations, contain disposed or recycled materials or waste and require environmental investigation and/or remediation. Those sites include instances where we have been identified as a potentially responsible party under U.S. federal, state and/or non-U.S. environmental laws and regulations. For several formerly owned businesses, we have also received claims for indemnification from purchasers of these businesses and have established what we believe to be adequatebusinesses.
Our accruals for potential liabilities arising out of retained responsibilities. We settled someenvironmental matters are recorded on a site-by-site basis when it is probable that a liability has been incurred and the amount of the claims in prior years;liability can be reasonably estimated, based on current law and existing technologies. It can be difficult to dateestimate reliably the final costs of investigation and remediation due to various factors. In our opinion, the amounts accrued are appropriate based on facts and circumstances as currently known. Based upon our experience, current information regarding known contingencies and applicable laws, we have recorded accruals have been adequate.
23
2012 and 2011, respectively. We do not believe that projected response costsanticipate these environmental conditions will result inhave a material liability. We have also made claims against third parties for indemnification against potential liabilities foradverse effect on our financial position, results of operations or cash flows. However, unknown conditions, new details about existing conditions or changes in environmental remediations or other obligations. We cannot assure you that we will be successful in obtaining indemnity or reimbursement for such costs.
Product liability claims
We are subject to various product liability lawsuits and personal injury claims. A substantial number of these lawsuits and claims are insured and accrued for by Penwald, our captive insurance subsidiary. See discussion in ITEM 1 and ITEM 8, Note 12 of the Notes to Consolidated Financial Statements — Insurance subsidiary. Penwald records a liability for these claims based on actuarial projections of ultimate losses. For all other claims, accruals covering the claims are recorded, on an undiscounted basis, when it is probable that a liability
12
Compliance Matters
Prior to the Merger, the Flow Control business was subject to investigations by the DOJ and the SEC related to allegations that improper payments were made by the Flow Control business and other Tyco subsidiaries and third-party intermediaries in recent years in violation of the Foreign Corrupt Practices Act. Tyco reported to the DOJ and the SEC the remedial measures that it had taken in response to the allegations and Tyco’s own internal investigations. As a result of discussions with the DOJ and SEC aimed at resolving these matters, on September 24, 2012, Tyco entered into a settlement with the SEC and a non-prosecution agreement with the DOJ, pursuant to which the Flow Control business is for a three year period subject to yearly reporting to the DOJ concerning its continuing compliance efforts.
| ITEM 4. MINE |
13Not applicable.
24
Current executive officers of Pentair Ltd., their ages, current position and their business experience during at least the past five years are as follows:
Name | Age | |||
Current Position and Business Experience | ||||
Randall J. Hogan | Chief Executive Officer since January 2001 and Chairman of the Board | |||
Michael V. Schrock | President and Chief Operating Officer since September 2006; President and Chief Operating Officer of Filtration and Technical | |||
John L. Stauch | Executive Vice President and Chief Financial Officer since February 2007; Chief Financial Officer of the Automation and Control Systems unit of Honeywell International Inc., July 2005 — February 2007; Vice President, Finance and Chief Financial Officer of the Sensing and Controls unit of Honeywell International Inc., January 2004 — July 2005; Vice President, Finance and Chief Financial Officer of the Automation & Control Products unit of Honeywell International Inc., July 2002 — January 2004; Chief Financial Officer and IT Director of PerkinElmer Optoelectronics, a unit of PerkinElmer, Inc., April 2000 — April 2002; Various executive, investor relations and managerial finance positions with Honeywell International Inc. and its predecessor AlliedSignal Inc., 1994 — 2000. | |||
Frederick S. Koury | Senior Vice President, Human Resources, since August 2003; Vice President of Human Resources at Limited Brands, September 2000 — August 2003; PepsiCo, Inc., various executive positions, June 1985 — September 2000. | |||
Angela D. Lageson | Senior Vice President, General Counsel and Secretary since February 2010; Assistant General Counsel, November 2002 — February 2010; Shareholder and Officer of the law firm of Henson & Efron, P.A., January 2000 — 2002; Associate Attorney in the law firm of Henson & Efron, P.A. October 1996 — January 2000 and in the law firm of Felhaber Larson Fenlon & Vogt, P.A., 1992 — 1996. | |||
Todd R. Gleason | 42 | Senior Vice President, Growth since January 2013; President, Integration and Standardization, March 2012 — January 2013; Vice President, Marketing & Strategy June 2010 — March 2012; Vice President, Investor Relations and Business Analysis and Planning, June 2007 — June 2010; Director of Investor Relations with American Standard (now Ingersoll Rand), January 2005 — June 2007; Various business leadership positions with Honeywell International Inc. and its predecessor AlliedSignal Inc., 1998 — 2005. | ||
Michael G. Meyer | Vice President, Treasurer since September 2012; Vice President of Treasury and Tax | |||
Mark C. Borin | Corporate Controller and Chief Accounting Officer since March 2008; Partner in the audit practice of the public accounting firm KPMG LLP, June 2000 — March 2008; Various positions in the audit practice of KPMG LLP, September 1989 — June 2000. | |||
14
25
| ITEM 5. | MARKET FOR REGISTRANT’S COMMON |
Our common stock isshares are listed for trading on the New York Stock Exchange and tradestrade under the symbol “PNR.” As of December 31, 2010,2012, there were 3,73521,033 shareholders of record.
The high, low and closing sales price for our common stockshares and the dividends declaredpaid for each of the quarterly periods for 20102012 and 20092011 were as follows:
| 2010 | 2009 | |||||||||||||||||||||||||||||||
| First | Second | Third | Fourth | First | Second | Third | Fourth | |||||||||||||||||||||||||
High | $ | 36.40 | $ | 39.32 | $ | 35.68 | $ | 37.22 | $ | 26.38 | $ | 29.07 | $ | 31.69 | $ | 34.27 | ||||||||||||||||
Low | $ | 29.55 | $ | 30.62 | $ | 29.41 | $ | 31.89 | $ | 17.23 | $ | 20.91 | $ | 23.20 | $ | 28.18 | ||||||||||||||||
Close | $ | 36.08 | $ | 31.57 | $ | 33.57 | $ | 36.51 | $ | 22.05 | $ | 25.54 | $ | 29.26 | $ | 32.30 | ||||||||||||||||
Dividends declared | $ | 0.19 | $ | 0.19 | $ | 0.19 | $ | 0.19 | $ | 0.18 | $ | 0.18 | $ | 0.18 | $ | 0.18 | ||||||||||||||||
| 2012 | 2011 | |||||||||||||||||||||||||||||||
| First | Second | Third | Fourth | First | Second | Third | Fourth | |||||||||||||||||||||||||
High | $ | 48.77 | $ | 47.59 | $ | 45.21 | $ | 49.50 | $ | 38.97 | $ | 41.38 | $ | 42.43 | $ | 38.62 | ||||||||||||||||
Low | 33.88 | 36.31 | 37.43 | 40.30 | 34.85 | 36.74 | 29.73 | 30.38 | ||||||||||||||||||||||||
Close | 47.61 | 38.28 | 44.51 | 49.15 | 38.00 | 41.27 | 32.01 | 33.29 | ||||||||||||||||||||||||
Dividends paid | 0.22 | 0.22 | 0.22 | 0.22 | 0.20 | 0.20 | 0.20 | 0.20 | ||||||||||||||||||||||||
Pentair has paid 140148 consecutive quarterly dividends and has increased dividends each year for 3436 consecutive years.
15Future dividends on our common shares or reductions of registered share capital for distribution to shareholders, if any, must be approved by our shareholders. We expect to obtain shareholder approval of the annual dividend amount out of contributed surplus each year at our annual general meeting, and we expect to distribute the approved dividend amount in four quarterly installments, on dates determined by our Board of Directors. The timing, declaration and payment of future dividends to holders of our common shares will depend upon many factors, including our financial condition and results of operations, the capital requirements of our businesses, industry practice and any other relevant factors.
26
The following information under the caption “Stock“Share Performance Graph” in this ITEM 5 of this Annual Report onForm 10-K is not deemed to be “soliciting material” or to be “filed” with the SEC or subject to Regulation 14A or 14C under the Securities Exchange Act of 1934 or to the liabilities of Section 18 of the Securities Exchange Act of 1934 and will not be deemed to be incorporated by reference into any filing under the Securities Act of 1933 or the Securities Exchange Act of 1934, except to the extent we specifically incorporate it by reference into such a filing.
The following graph sets forth the cumulative total shareholder return on our common stockshares for the last five years, assuming the investment of $100 on December 31, 20052007 and the reinvestment of all dividends since that date to December 31, 2010.2012. The graph also contains for comparison purposes the S&P 500 Index, the S&P 500 Industrials Index and the S&P MidCap 400 Index, assuming the same investment level and reinvestment of dividends.
By virtue of our market capitalization, we are a component of the S&P 500 Index. Prior to the Merger, we used the S&P MidCap 400 Index. OnIndex as a comparison because we had not found a readily identifiable peer group and using a published industry index would have skewed results by including significantly larger companies. After the Merger, on the basis of our size and diversity of businesses, we have not found a readily identifiable peer group. We believe the S&P MidCap 400500 Industrials Index is an appropriate comparison. We have evaluated other published indices, but have determined that the results are skewed by significantly larger companies included in the indices. We believe such aindustry index for comparison would not be meaningful.
| Base Period | INDEXED RETURNS | |||||||||||||||||||||||
| December | Years Ending December 31: | |||||||||||||||||||||||
| Company/Index | 2005 | 2006 | 2007 | 2008 | 2009 | 2010 | ||||||||||||||||||
PENTAIR INC | 100 | 92.47 | 104.35 | 72.46 | 101.62 | 117.51 | ||||||||||||||||||
S&P 500 INDEX | 100 | 115.79 | 122.16 | 76.96 | 97.33 | 111.99 | ||||||||||||||||||
S&P MIDCAP 400 INDEX | 100 | 110.32 | 119.12 | 75.96 | 104.36 | 132.16 | ||||||||||||||||||
16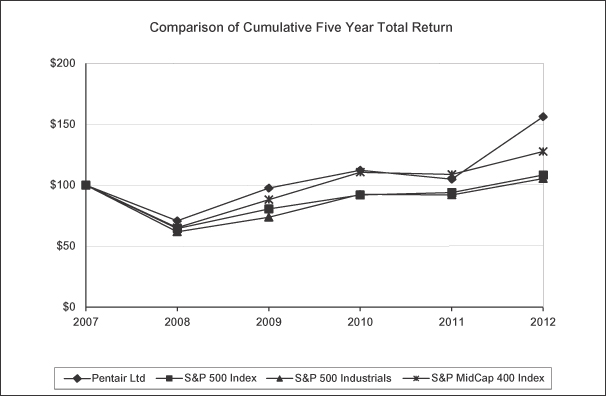
27
| Base Period December 2007 | INDEXED RETURNS Years ended December 31 | |||||||||||||||||||||||
| Company / Index | 2008 | 2009 | 2010 | 2011 | 2012 | |||||||||||||||||||
Pentair Ltd. | 100 | 69.44 | 97.38 | 112.61 | 104.90 | 158.20 | ||||||||||||||||||
S&P 500 Index | 100 | 63.00 | 79.67 | 91.68 | 93.61 | 108.59 | ||||||||||||||||||
S&P 500 Industrials | 100 | 60.08 | 72.65 | 92.07 | 91.53 | 105.58 | ||||||||||||||||||
S&P MidCap 400 Index | 100 | 63.77 | 87.61 | 110.94 | 109.02 | 128.51 | ||||||||||||||||||
The following table provides information with respect to purchases we made of our common stockshares during the fourth quarter of 2010:
| (c) | (d) | |||||||||||||||
| Total Number of | Dollar Value of | |||||||||||||||
| (a) | Shares Purchased | Shares that | ||||||||||||||
| Total Number | (b) | as Part of Publicly | May Yet Be | |||||||||||||
| of Shares | Average Price | Announced Plans | Purchased Under the | |||||||||||||
| Period | Purchased | Paid per Share | or Programs | Plans or Programs | ||||||||||||
| October 3 — October 30, 2010 | 205,137 | $ | 34.32 | 202,800 | $ | 15,253,293 | ||||||||||
| October 31 — November 27, 2010 | 201,029 | $ | 32.96 | 200,800 | $ | 8,634,761 | ||||||||||
| November 28 — December 31, 2010 | 273,209 | $ | 35.17 | 246,503 | $ | 0 | ||||||||||
Total | 679,375 | 650,103 | ||||||||||||||
| (a) | (b) | (c) | (d) | |||||||||||||
| Total number of shares purchased | Average price paid per share | Total number of purchased as part of publicly announced | Dollar value of shares that may yet be purchased under the plans or programs | |||||||||||||
September 30 – October 27, 2012 | 2,391,851 | $43.25 | 2,311,900 | $1,100,059,133 | ||||||||||||
October 28 – November 24, 2012 | 1,891,644 | 44.91 | 1,891,600 | 1,015,099,184 | ||||||||||||
November 25 – December 31, 2012 | 3,100,640 | 48.34 | 3,087,578 | 865,840,803 | ||||||||||||
| ||||||||||||||||
Total | 7,384,135 | 7,291,078 | ||||||||||||||
| (a) | The purchases in this column include 79,951 shares |
| (b) | The average price paid in this column includes shares repurchased as part of our publicly announced |
| (c) | The number of shares in this column represents the number of shares repurchased as part of our publicly announced |
| (d) |
17
28
ITEM 6. SELECTED FINANCIAL DATA
| Years Ended December 31, | ||||||||||||||||||||
| 2010 | 2009 | 2008 | 2007 | 2006 | ||||||||||||||||
Statement of Operations Data: | ||||||||||||||||||||
| Net sales | $ | 3,030,773 | $ | 2,692,468 | $ | 3,351,976 | $ | 3,280,903 | $ | 3,022,602 | ||||||||||
| Operating income | 334,155 | 219,948 | 324,685 | 379,049 | 312,943 | |||||||||||||||
| Income from continuing operations attributable to Pentair, Inc. | 198,454 | 115,512 | 256,363 | 212,118 | 186,251 | |||||||||||||||
Per Share Data: | ||||||||||||||||||||
| Basic: | ||||||||||||||||||||
| EPS from continuing operations attributable to Pentair, Inc. | $ | 2.02 | $ | 1.19 | $ | 2.62 | $ | 2.15 | $ | 1.87 | ||||||||||
| Weighted average shares | 98,037 | 97,415 | 97,887 | 98,762 | 99,784 | |||||||||||||||
| Diluted: | ||||||||||||||||||||
| EPS from continuing operations attributable to Pentair, Inc. | $ | 2.00 | $ | 1.17 | $ | 2.59 | $ | 2.12 | $ | 1.84 | ||||||||||
| Weighted average shares | 99,294 | 98,522 | 99,068 | 100,205 | 101,371 | |||||||||||||||
| Cash dividends declared per common share | $ | 0.76 | $ | 0.72 | $ | 0.68 | $ | 0.60 | $ | 0.56 | ||||||||||
Balance Sheet Data: | ||||||||||||||||||||
| Total assets | $ | 3,973,533 | $ | 3,911,334 | $ | 4,053,213 | $ | 4,000,614 | $ | 3,364,979 | ||||||||||
| Total debt | 707,472 | 805,637 | 954,092 | 1,060,586 | 743,552 | |||||||||||||||
| Total shareholders equity | 2,202,032 | 2,126,340 | 2,020,069 | 1,910,871 | 1,669,999 | |||||||||||||||
| Years ended December 31 | ||||||||||||||||||||
| In thousands, except per-share data | 2012 | 2011 | 2010 | 2009 | 2008 | |||||||||||||||
| Consolidated statements of operations and comprehensive income (loss) data | ||||||||||||||||||||
Net sales | $ | 4,416,146 | $ | 3,456,686 | $ | 3,030,773 | $ | 2,692,468 | $ | 3,351,976 | ||||||||||
Operating income (loss) | (43,119 | ) | 100,203 | 312,983 | 219,060 | 214,813 | ||||||||||||||
| Net income (loss) from continuing operations attributable to Pentair Ltd. | (107,186 | ) | (7,450 | ) | 185,539 | 114,970 | 189,341 | |||||||||||||
Per-share data | ||||||||||||||||||||
Basic: | ||||||||||||||||||||
Earnings (loss) per share from continuing operations attributable to Pentair Ltd. | $ | (0.84 | ) | $ | (0.08 | ) | $ | 1.89 | $ | 1.18 | $ | 1.93 | ||||||||
Weighted average shares | 127,368 | 98,233 | 98,037 | 97,415 | 97,887 | |||||||||||||||
Diluted: | ||||||||||||||||||||
Earnings (loss) per share from continuing operations attributable to Pentair Ltd. | $ | (0.84 | ) | $ | (0.08 | ) | $ | 1.87 | $ | 1.16 | $ | 1.91 | ||||||||
Weighted average shares | 127,368 | 98,233 | 99,294 | 98,522 | 99,068 | |||||||||||||||
| Cash dividends declared and paid per common share | $ | 0.88 | $ | 0.80 | $ | 0.76 | $ | 0.72 | $ | 0.68 | ||||||||||
| Cash dividends declared and unpaid per common share | 0.46 | — | — | — | — | |||||||||||||||
Consolidated balance sheets data | ||||||||||||||||||||
Total assets | $ | 11,795,311 | $ | 4,586,313 | $ | 3,973,533 | $ | 3,911,334 | $ | 4,053,213 | ||||||||||
Total debt | 2,457,374 | 1,309,087 | 707,472 | 805,637 | 954,092 | |||||||||||||||
Total equity | 6,483,357 | 2,047,392 | 2,205,032 | 2,126,340 | 2,020,069 | |||||||||||||||
Factors Affecting Comparability of our Water Group. Selected Financial Data
For periods prior to 2012, the Consolidated Statements of Operations and Comprehensive Income (Loss) and Consolidated Statements of Cash Flows include the historical results of Pentair, Inc. Following the consummation of the Merger on September 28, 2012, the consolidated financial statements include the results of Flow Control.
In May 2007,2011, we acquired as part of our Technical Products GroupWater & Fluid Solutions, the assetsClean Process Technologies division of Calmark. privately held Norit Holding B.V. In the fourth quarter of 2011, we recorded a pre-tax non-cash goodwill impairment charge of $200.5 million.
In June 2008, we entered into a transaction with GE that was accounted for as an acquisition of an 80.1 percent ownership interest in GE’s global water softener and residential water filtration business in exchange for a 19.9 percent interest in our global water softener and residential water filtration business.
18
29
| ITEM 7. | MANAGEMENT’S DISCUSSION AND ANALYSIS OF FINANCIAL CONDITION AND RESULTS OF OPERATIONS |
Forward-LookingForward-looking Statements
This report contains statements that we believe to be “forward-looking statements” within the meaning of the Private Securities Litigation Reform Act of 1995. Forward-lookingAll statements, give our current expectationsother than statements of historical fact are forward-looking statements. Without limitation, any statements preceded or forecasts of future events. Forward-looking statements generally can be identifiedfollowed by or that include the use of forward-looking terminology such as “may,words “targets,” “plans,” “believes,” “expects,” “intends,” “will,” “expect,“likely,” “intend,“may,” “estimate,“anticipates,” “anticipate,“estimates,” “believe,“projects,” “project,“should,” “would,” “positioned,” “strategy,” “future” or “continue,”words, phrases or terms of similar wordssubstance or the negative thereof, . From time to time, we also may provide oral or writtenare forward-looking statements. These forward-looking statements are not guarantees of future performance and are subject to risks, uncertainties, assumptions and other factors, some of which are beyond our control, which could cause actual results to differ materially from those expressed or implied by such forward-looking statements. These factors include the ability to successfully integrate Pentair, Inc. and the Flow Control (as defined below) business and achieve expected benefits from the Merger (as defined below); overall global economic and business conditions; competition and pricing pressures in the markets we serve; the strength of housing and related markets; volatility in currency exchange rates and commodity prices; inability to generate savings from excellence in operations initiatives consisting of lean enterprise, supply management and cash flow practices; increased risks associated with operating foreign businesses; the ability to deliver backlog and win future project work; failure of markets to accept new product introductions and enhancements; the impact of changes in laws and regulations, including those that limit U.S. tax benefits; the outcome of litigation and governmental proceedings; and the ability to achieve our long-term strategic operating goals. Additional information concerning these and other materials we release tofactors is contained in our filings with the public. Any or allU.S. Securities and Exchange Commission, including in Item 1A of ourthis Annual Report on Form 10-K. All forward-looking statements inspeak only as of the date of this report and in any public statements we make could be materially different from actual results. They can be affected by assumptions we might make or by known or unknown risks or uncertainties. Consequently, we cannot guarantee any forward-looking statements. Investors are cautioned not to place undue reliance on any forward-looking statements. Investors should also understand that it is not possible to predict or identify all such factors and should not consider the following list to be a complete statement of all potential risks and uncertainties.
19
Overview
Pentair Ltd., formerly known as Tyco Flow Control International Ltd. (as used prior to the Merger (as defined below), “Flow Control”), is a company organized under the laws of Switzerland. The terms “us, “we” or “our” refer to Pentair Ltd. and its consolidated subsidiaries. Our business took its current form on September 28, 2012 as a result of a spin-off of Flow Control from its parent, Tyco International Ltd. (“Tyco”), and a reverse acquisition involving Pentair, Inc.
Prior to the spin-off, Tyco engaged in an internal restructuring whereby it transferred to Flow Control certain assets related to the flow control business of Tyco, and Flow Control assumed from Tyco certain liabilities related to the flow control business of Tyco. On September 28, 2012 prior to the Merger (as defined below), Tyco effected a spin-off of Flow Control through the pro-rata distribution of 100% of the outstanding common shares of Flow Control to Tyco’s shareholders (the “Distribution”), resulting in the distribution of 110,898,934 of our common shares to Tyco’s shareholders. Immediately following the Distribution, an indirect, wholly-owned subsidiary of ours merged with and into Pentair, Inc., with Pentair, Inc. surviving as an indirect, wholly-owned subsidiary of ours (the “Merger”). At the effective time of the Merger, each Pentair, Inc. common share was converted into the right to receive one of our common shares, resulting in 99,388,463 of our common shares being issued to Pentair, Inc. shareholders. The Merger is intended to be tax-free for U.S. federal income tax purposes. After the Merger, our common shares are traded on the New York Stock Exchange under the symbol PNR. Tyco equity-based awards held by Flow Control employees and certain Tyco employees and directors outstanding prior to the completion of the Distribution were converted in connection with the Distribution into equity-based awards with respect to our common shares and were assumed by us. Pentair, Inc. equity-based awards outstanding prior to the completion of the Merger were converted upon completion of the Merger into equity-based awards with respect to our common shares and were assumed by us. The total purchase price for Flow Control was $4.9 billion, consisting of $4.8 billion of common shares issued to Tyco shareholders, $0.5 million of cash paid to Tyco shareholders in lieu of fractional shares, and $92.3 million in replacement equity-based awards to holders of Tyco equity-based awards. The Merger is accounted for under the acquisition method of accounting with Pentair, Inc. treated as the acquirer.
30
Following the Merger, we are a focused diversified industrial manufacturing company comprised of two operatingcomprising three reporting segments: Water & Fluid Solutions, Valves & Controls and Technical Products. OurSolutions. We classify our continuing operations into business segments based primarily on types of products offered and markets served:
The Water Group& Fluid Solutions segment designs, manufactures, markets and services innovative water management and fluid processing products and solutions. In select geographies, Water & Fluid Solutions offers a wide variety of pumps, valves and pipes for water transmission applications. The Flow Technologies, Filtration & Process, Aquatic Systems and Water & Environmental Systems GBUs comprise this segment.
The Valves & Controls segment designs, manufactures, markets, and services valves, fittings, automation and controls, and actuators and operates as a stand-alone GBU.
The Technical Solutions segment designs, manufactures and markets products that guard and protect some of the world’s most sensitive electronics and electronic equipment, as well as heat management solutions designed to provide thermal protection to temperature sensitive fluid applications. The Equipment Protection and Thermal Management GBUs comprise this segment.
In 2012, Water & Fluid Solutions and Technical Solutions accounted for 70 percent and 30 percent of total revenues through the first nine months of the year, respectively. Water & Fluid Solutions, Valves & Controls and Technical Solutions accounted for 44 percent, 31 percent and 25 percent of total revenues during the fourth quarter of the year, respectively, reflecting our post-Merger revenue mix.
In May 2011, Pentair, Inc. acquired, as part of the Water & Fluid Solutions reporting segment, the Clean Process Technologies (“CPT”) division of privately held Norit Holding B.V. for $715.3 million (€502.7 million translated at the May 12, 2011 exchange rate). CPT’s results of operations have been included in our consolidated financial statements since the date of acquisition. CPT is a global leader in providing innovative productsmembrane solutions and systems used worldwideclean process technologies in the movement, storage, treatmenthigh growth water and enjoymentbeverage filtration and separation segments.
In the fourth quarter of water. Our Technical Products Group is2012 and 2011, we completed our annual goodwill and intangible assets impairment reviews. As a leaderresult, we recorded a pre-tax non-cash impairment charge of $60.7 million for trade name intangibles and $200.5 million for goodwill in the global enclosuresfourth quarter of 2012 and thermal management markets, designing and manufacturing standard, modified and custom enclosures that house and protect sensitive electronics and electrical components and protect the people that use them. In 2010,2011, respectively. These represent impairments of trade names across several of our reporting units in Water Group& Fluid Solutions and Technical Products Group accounted for approximately 2/3 and 1/3 of total revenues, respectively.
Key Trends and Uncertainties Regarding Our Existing Business
Our net sales revenue for the full year2012 were $4.4 billion, and were composed of 2010 was approximately $3.0 billion, increasing 13% from sales in the prior year. Ourour reporting segments, as follows: Water Group sales increased 10% in the year to approximately $2.0& Fluid Solutions – $2.6 billion, compared to the same period in 2009. OurValves & Controls – $0.6 billion and Technical Products Group sales increased 17% to approximately $1.0 billion as compared to the same period in 2009.
20
Since 2010, most markets we serve have shown signs of improvement since the global recession in 2008 and 2009. Because our businesses are significantly affected by general economic trends, a lack of continued improvement in our most important markets addressed below would likely have an adverse impact on our results of operations for 2013 and beyond.
In the fourth quarter of 2011, as a result of economic conditions and continued softness in end markets, we recorded goodwill impairment charges of $200.5 million.
31
In September 2012, we completed the Merger. With an acquisition of this magnitude and complexity, there are uncertainties and risks associated with realizing the amount and timing of anticipated growth opportunities and cost and tax synergies as described in ITEM 1A – Risk Factors
We identified specific market opportunities that we continue to pursue that we find attractive, both within and outside the United States. We are reinforcing our businesses to more effectively address these opportunities through research and development and additional sales and marketing resources. Unless we successfully penetrate these product and geographic markets, our organic growth would likely be limited.
End markets for new home building and new pool starts are showing signs of rebound from their historically low levels in 2007—2011. New product introductions, expanded distribution, channel penetration and a recovering housing market have resulted in volume increases for 2012.
Despite the overall strength of our end-markets, some of them have exhibited differing levels of volatility and may continue to do so over the medium and longer term. While we believe the general trends are favorable, factors specific to each of our major end-markets may affect the capital spending plans of our customers.
Economic uncertainty in Western Europe has negatively impacted business results and may continue to do so for the foreseeable future.
Through 2011 and 2012, we experienced material and other cost inflation. We strive for productivity improvements, and we implement increases in selling prices to help mitigate this inflation. We expect the current economic environment will result in continuing price volatility for many of our raw materials. Commodity prices have begun to moderate, but we are uncertain as to the timing and impact of these market changes.
| • | |
We have a long-term goal to consistently generate free cash flow that equals or exceeds 100 percent of our net income. We define free cash flow as cash flow from |
In 2011,2013, our operating objectives include the following:
Increasing our presence in fast growth regions and vertical | |
21
Optimizing our technological capabilities to increasingly generate innovative new products;
Driving operating excellence through lean enterprise initiatives, with specific focus on sourcing and supply management, cash flow management and lean operations;
Focusing on developing global talent in light of our increased global presence; and
Integrating Pentair, Inc. and the Flow Control business.
We may seek to meet our objectives of expanding our geographic reach internationally and expanding our presence in our various channels to market andby acquiring technologies and products to broaden our businesses’ capabilities to serve additional markets thoughand through acquisitions. We may also consider the divestiture of discrete business units to further focus our businesses on theirour most attractive markets.
32
RESULTS OF OPERATIONS
Net Salessales
Consolidated net sales and the year-over-year changes were as follows:
| In thousands | 2012 | 2011 | $ change | % change | 2011 | 2010 | $ change | % change | ||||||||||||||||||||||||
Net sales | $ | 4,416,146 | $ | 3,456,686 | $ | 959,460 | 27.8% | $ | 3,456,686 | $ | 3,030,773 | $ | 425,913 | 14.1% | ||||||||||||||||||
| ||||||||||||||||||||||||||||||||
Net sales by segment and year-over-year changes were as follows:
| 2012 vs. 2011 | 2011 vs. 2010 | |||||||||||||||||||||||||||
| In thousands | 2012 | 2011 | 2010 | $ change | % change | $ change | % change | |||||||||||||||||||||
Water & Fluid Solutions | $ | 2,638,403 | $ | 2,369,804 | $ | 2,041,281 | $ | 268,599 | 11.3 % | $ | 328,523 | 16.1 % | ||||||||||||||||
Valves & Controls | 546,707 | — | — | 546,707 | — % | — | — % | |||||||||||||||||||||
Technical Solutions | 1,231,036 | 1,086,882 | 989,492 | 144,154 | 13.3 % | 97,390 | 9.8 % | |||||||||||||||||||||
| ||||||||||||||||||||||||||||
Total | $ | 4,416,146 | $ | 3,456,686 | $ | 3,030,773 | $ | 959,460 | 27.8 % | $ | 425,913 | 14.1 % | ||||||||||||||||
| ||||||||||||||||||||||||||||
The components of the net sales change were:were as follows:
| Percentages | 2010 vs. 2009 | 2009 vs. 2008 | ||||||
| Volume | 12.6 | (19.7 | ) | |||||
| Price | — | 1.2 | ||||||
| Currency | — | (1.2 | ) | |||||
| Net sales | 12.6 | (19.7 | ) | |||||
| 2012 vs. 2011 | 2011 vs. 2010 | |||||||||||||||||||||||||||
| Percentages | Water & Fluid Solutions | Valves & Controls | Technical Solutions | Total | Water & Fluid Solutions | Technical Solutions | Total | |||||||||||||||||||||
Volume | 0.7 | — | (5.2 | ) | (1.0 | ) | 2.4 | 6.2 | 3.7 | |||||||||||||||||||
Acquisition | 10.1 | 100.0 | 18.0 | 28.3 | 11.5 | — | 7.7 | |||||||||||||||||||||
Price | 1.5 | — | 1.5 | 1.5 | 1.0 | 1.9 | 1.3 | |||||||||||||||||||||
Currency | (1.0 | ) | — | (1.0 | ) | (1.0 | ) | 1.2 | 1.7 | 1.4 | ||||||||||||||||||
| ||||||||||||||||||||||||||||
Total | 11.3 | 100.0 | 13.3 | 27.8 | 16.1 | 9.8 | 14.1 | |||||||||||||||||||||
| ||||||||||||||||||||||||||||
Consolidated net sales
The 12.627.8 percentage point increase in consolidated net sales in 20102012 from 2009 was primarily driven by:
sales volume of the Flow Control businesses subsequent to the Merger of $886.5 million andyear-over-year changes were as follows:
| 2010 vs. 2009 | 2009 vs. 2008 | |||||||||||||||||||||||||||
| In thousands | 2010 | 2009 | 2008 | $ change | % change | $ change | % change | |||||||||||||||||||||
| Water Group | $ | 2,041,281 | $ | 1,847,764 | $ | 2,206,142 | $ | 193,517 | 10.5 | % | $ | (358,378 | ) | (16.2 | )% | |||||||||||||
| Technical Product Group | 989,492 | 844,704 | 1,145,834 | 144,788 | 17.1 | % | (301,130 | ) | (26.3 | )% | ||||||||||||||||||
| Total | $ | 3,030,773 | $ | 2,692,468 | $ | 3,351,976 | $ | 338,305 | 12.6 | % | $ | (659,508 | ) | (19.7 | )% | |||||||||||||
22
continued sales growth in 2010 from 2009 was primarily driven by:fast growth regions including in Latin America and Eastern Europe; and
selective increases in selling prices to mitigate inflationary cost increases.
These increases were partially offset by:
decreases in Technical Solutions sales volume in Western Europe and in the infrastructure vertical; and
unfavorable foreign currency effects.
33
The 16.214.1 percentage point decreaseincrease in Water Groupconsolidated net sales in 20092011 from 20082010 was primarily the result of:
higher sales volume related to the May 2011 acquisition of CPT;
organic sales growth in Water & Fluid Solutions primarily due to higher sales of certain pump, pool and filtration products primarily serving the North American residential housing market and other global markets;
higher sales within the industrial and energy verticals by Technical Products Group
favorable foreign currency effects; and
selective increases in selling prices to mitigate inflationary cost increases.
These increases were partially offset by:
2010 sales resulting from the Gulf Intracoastal Waterway Project which did not reoccur in 2011; and
lower sales within the infrastructure vertical by Technical Solutions.
Water & Fluid Solutions
The 26.311.3 percentage point decreaseincrease in Technical Products GroupWater & Fluid Solutions sales in 20092012 from 20082011 was primarily the result of:
sales volume of the Flow Control businesses subsequent to the Merger of $144.2 million and higher sales volume related to the May 2011 acquisition of CPT;
organic sales growth primarily due to higher sales of certain pump, pool and filtration products primarily serving the North American residential housing market in our residential & commercial vertical and other global markets;
continued sales growth in fast growth regions including Latin America and Eastern Europe;
increased sales in our Aquatic Systems business driven by pool dealer expansion and continued strong demand for our energy efficient products and solutions; and
selective increases in selling prices to mitigate inflationary cost increases.
These increases were partially offset by:
Decreases in sales due to continued weakness in Western Europe and low flood-related product sales in the U.S. due to unusually dry weather; and
unfavorable foreign currency effects.
The 16.1 percentage point increase in Water & Fluid Solutions sales in 2011 from 2010 was primarily the result of:
higher sales volume as a result of the May 2011 acquisition of CPT;
organic sales growth primarily due to higher sales of certain pump, pool and filtration products; continued sales growth in Latin America, India and emerging markets in the Asia Pacific region; favorable foreign currency effects; and |
23
34
selective increases in selling prices to mitigate inflationary cost increases.
These increases were partially offset by:
2010 sales resulting from the Gulf Intracoastal Waterway Project which did not reoccur in 2011.
Valves & Controls
The Valves & Controls sales in 2012 was the result of:
sales volume of the Flow Control businesses subsequent to the Merger of $546.7 million.
Technical Solutions
The 13.3 percentage point increase in Technical Solutions sales in 2012 from 2011 was primarily the result of:
sales volume of the Flow Control businesses subsequent to the Merger of $195.6 million;
sales increases in our enclosures & cabinets businesses in the industrial vertical; and
selective increases in selling prices to mitigate inflationary cost increases.
These decreases were partially offset by:
decreases in sales volume in Western Europe and the industrial vertical, including project delays; and
unfavorable foreign currency effects.
The 9.8 percentage point increase in Technical Solutions sales in 2011 from 2010 was primarily the result of:
an increase in sales in industrial, energy and infrastructure verticals;
favorable foreign currency effects; and
selective increases in selling prices to mitigate inflationary cost increases.
These increases were partially offset by:
lower sales within the infrastructure vertical.
Gross profit
| In thousands | 2012 | % of sales | 2011 | % of sales | 2010 | % of sales | ||||||||||||||||||
Gross profit | $ | 1,269,592 | 28.7% | $ | 1,073,722 | 31.1% | $ | 930,640 | 30.7% | |||||||||||||||
| ||||||||||||||||||||||||
Percentage point change | (2.4 | )pts | 0.4 | pts | ||||||||||||||||||||
Gross Profit
| In thousands | 2010 | % of sales | 2009 | % of sales | 2008 | % of sales | ||||||||||||||||||
| Gross Profit | $ | 930,640 | 30.7 | % | $ | 785,135 | 29.2 | % | $ | 1,014,550 | 30.3 | % | ||||||||||||
| Percentage point change | 1.5 | pts | (1.1 | ) pts | ||||||||||||||||||||
The 1.52.4 percentage point decrease in gross profit as a percentage of sales in 2012 from 2011 was primarily the result of:
higher cost of goods sold in 2012 as a result of inventory fair market value step-up and customer backlog recorded as part of the Merger purchase accounting; and
inflationary increases related to raw materials and labor costs.
35
These decreases were partially offset by:
cost savings generated from our Pentair Integrated Management System (“PIMS”) initiatives including lean and supply management practices;
selective increases in selling prices in Water & Fluid Solutions and Technical Solutions to mitigate inflationary cost increases; and
higher cost of goods sold in 2011 as a result of the inventory fair market value step-up and customer backlog recorded as part of the CPT purchase accounting.
The 0.4 percentage point increase in gross profit as a percentage of sales in 20102011 from 20092010 was primarily the result of:
higher sales volumes in Water & Fluid Solutions and Technical Solutions and higher fixed cost absorption resulting from that volume;
savings generated from our PIMS initiatives, including lean and supply management practices; and
selective increases in selling prices in Water & Fluid Solutions and Technical Solutions to mitigate inflationary cost increases.
These increases were partially offset by:
inflationary increases related to raw materials and labor costs; and
higher cost of goods sold in gross profit2011 as a percentresult of sales in 2009 from 2008 was primarilya fair market value inventory step-up and customer backlog recorded as a part of the result of:
These decreases were partially offset by:
| In thousands | 2010 | % of sales | 2009 | % of sales | 2008 | % of sales | ||||||||||||||||||
| *SG&A | $ | 529,329 | 17.5 | % | $ | 507,303 | 18.8 | % | $ | 627,415 | 18.7 | % | ||||||||||||
| Percentage point change | (1.3 | ) pts | 0.1 pts | |||||||||||||||||||||
24
| In thousands | 2012(1) | % of sales | 2011(2) | % of sales | 2010 | % of sales | ||||||||||||||||||
SG&A | $ | 1,219,154 | 27.6% | $ | 895,361 | 25.9% | $ | 550,501 | 18.2% | |||||||||||||||
| ||||||||||||||||||||||||
Percentage point change | 1.7 | pts | 7.7 | pts | ||||||||||||||||||||
| (1) | ||
Includes |
| (2) | Includes goodwill impairment charge of $200.5 million. |
The 1.31.7 percentage point decreaseincrease in SG&A expense as a percentage of sales in 20102012 from 20092011 was primarily due to:the result of:
“mark-to-market” actuarial losses related to pension and other post-retirement benefit plans for 2012 of $141.7 million, an increase of $73.4 million from 2011;
costs associated with the Merger, including $23.2 million in transaction advisory fees, $21.8 million of change of control costs and $34.1 million of other transaction costs;
restructuring actions taken in 2012;
trade name impairment charge of $60.7 million;
intangible asset amortization related to the Merger and to the May 2011 acquisition of CPT; and
continued investments in future growth with emphasis on international markets, including personnel and business infrastructure investments.
36
These decreasesincreases were partially offset by:
nonrecurring goodwill impairment charge in 2011 of $200.5 million in Water & Fluid Solutions; and
sales volume of the Flow Control businesses subsequent to the Merger, which resulted in increased leverage on our fixed operating expenses.
The 0.17.7 percentage point increase in SG&A expense as a percentpercentage of sales in 20092011 from 20082010 was primarily the result of:
goodwill impairment charge of $200.5 million in Water & Fluid Solutions;
integration costs and intangible asset amortization costs related to the May 2011 acquisition of CPT;
“mark-to-market” actuarial losses related to pension and other post-retirement benefit plans for 2011 of $68.3 million, an increase of $47.1 million from 2010;
restructuring actions taken in 2011;
insurance proceeds related to the Horizon litigation and other legal settlements received in 2010 which did not reoccur at the same levels in 2011;
continued investments in future growth with emphasis on international markets, including personnel and business infrastructure investments; and
certain increases for labor and related costs.
These increases were partially offset by:
higher sales volumes in both Water & Fluid Solutions and Technical Solutions, which resulted in increased leverage on our fixed operating expenses.
Research and development (R&D)
| In thousands | 2010 | % of sales | 2009 | % of sales | 2008 | % of sales | ||||||||||||||||||
| R&D | $ | 67,156 | 2.2 | % | $ | 57,884 | 2.2 | % | $ | 62,450 | 1.9 | % | ||||||||||||
| Percentage point change | — pts | 0.3 pts | ||||||||||||||||||||||
| In thousands | 2012 | % of sales | 2011 | % of sales | 2010 | % of sales | ||||||||||||||||||
R&D | $ | 93,557 | 2.1% | $ | 78,158 | 2.3% | $ | 67,156 | 2.2% | |||||||||||||||
| ||||||||||||||||||||||||
Percentage point change | (0.2 | )pts | 0.1 | pts | ||||||||||||||||||||
The 0.2 percentage point decrease in R&D expense as a percentage of sales in 20102012 from 2011 was flat comparedprimarily the result of:
sales volume of the Flow Control businesses subsequent to 2009 primarily as a result of:the Merger, which resulted in increased leverage on the R&D spending; and
higher sales volumes in Water & Fluid Solutions which resulted in increased leverage on the R&D spending.
These decreases were partially offset by:
25continued investments in the development of new products to generate growth.
37
The 0.30.1 percentage point increase in R&D expense as a percentpercentage of sales in 20092011 from 20082010 was primarily the result of:
higher costs associated with the May 2011 acquisition of CPT; and
continued investments in the development of new products to generate growth.
These increases were partially offset by:
higher sales volumes in Water & Fluid Solutions and Technical Solutions, which resulted in increased leverage on the R&D expense spending.
Operating income - Water & Fluid Solutions
| In thousands | 2012 | % of sales | 2011 | % of sales | 2010 | % of sales | ||||||||||||||||||
Operating income - Water & Fluid Solutions | $ | 168,043 | 6.4% | $ | 58,311 | 2.5% | $ | 231,588 | 11.3% | |||||||||||||||
| ||||||||||||||||||||||||
Percentage point change | 3.9 | pts | (8.8 | )pts | ||||||||||||||||||||
Water Group
| In thousands | 2010 | % of sales | 2009 | % of sales | 2008 | % of sales | ||||||||||||||||||
| Operating income | $ | 231,588 | 11.3 | % | $ | 163,745 | 8.9 | % | $ | 206,357 | 9.4 | % | ||||||||||||
| Percentage point change | 2.4 pts | (0.5 | ) pts | |||||||||||||||||||||
goodwill impairment charge in 2011 of $200.5 million;
lower margin associated with the May 2011 acquisition of CPT, including the fair market value inventory step-up and customer backlog, intangible asset amortization and integration costs;
higher sales volume in Water & Fluid Solutions, which resulted in increased leverage of our fixed cost base;
continued sales growth in fast growth regions led by strength in Latin America, India and emerging markets in the Asia Pacific region;
savings generated from our PIMS initiatives including lean and supply management practices; and
selective increases in selling prices to mitigate inflationary cost increases.
These increases were partially offset by:
cost of goods sold including inventory fair market value step-up and customer backlog recorded as part of the Merger purchase accounting;
trade name impairment charge of $49.1 million;
restructuring actions taken in 2012;
cost increases for certain raw materials and labor related costs; and
continued investments in future growth with emphasis on international markets, including personnel and business infrastructure investments.
38
The 0.58.8 percentage point decrease in Water Group operating income for Water & Fluid Solutions as a percentpercentage of net sales in 20092011 from 20082010 was primarily the result of:
goodwill impairment charge of $200.5 million;
lower margin associated with the May 2011 acquisition of CPT, including the fair market value inventory step-up and customer backlog, intangible asset amortization and integration costs;
cost increases for certain raw materials and labor;
incremental restructuring actions taken in 2011;
insurance proceeds related to the Horizon litigation and other legal settlements received in 2010 which did not reoccur at the same levels in 2011; and
continued investments in future growth with emphasis on international markets, including personnel and business infrastructure investments.
These decreases were partially offset by:
higher sales volume in Water & Fluid Solutions, which resulted in increased leverage of our fixed cost base;
savings generated from our PIMS initiatives including lean and supply management practices; and
selective increases in selling prices to mitigate inflationary cost increases.
Operating loss - Valves & Controls
| In thousands | 2012 | % of sales | 2011 | % of sales | 2010 | % of sales | ||||||||||||||||||
Operating loss - Valves & Controls | $ | (76,843 | ) | (14.1%) | $ | — | 0.0% | $ | — | 0.0% | ||||||||||||||
| ||||||||||||||||||||||||
Percentage point change | (14.1 | )pts | - | pts | ||||||||||||||||||||
The operating loss for Valves & Controls in 2012 was the result of:
Valves & Controls operations subsequent to the Merger. Valves & Controls is a new reporting segment, effective with the Merger and as a result, 2012 operating loss represents the segment’s operating results for the fourth quarter of 2012; and
cost of goods sold including inventory fair market value step-up and customer backlog recorded as part of the Merger purchase accounting.
26Operating income - Technical Solutions
| In thousands | 2012 | % of sales | 2011 | % of sales | 2010 | % of sales | ||||||||||||||||||
Operating income - Technical Solutions | $ | 165,017 | 13.4% | $ | 185,240 | 17.0% | $ | 151,533 | 15.3% | |||||||||||||||
| ||||||||||||||||||||||||
Percentage point change | (3.6 | ) pts | 1.7 | pts | ||||||||||||||||||||
The 3.6 percentage point decrease in operating income for Technical Solutions as a percentage of net sales in 2012 from 2011 was primarily the result of:
cost of goods sold including inventory fair market value step-up and customer backlog recorded as part of the Merger purchase accounting;
39
trade name impairment charge of $11.6 million;
restructuring actions taken in 2012;
inflationary increases related to raw materials and labor related costs; and
continued investment in future growth with emphasis on international markets, including personnel and business infrastructure investments.
These decreases were offset by:
savings generated from our PIMS initiatives including lean and supply management practices; and
selective increases in selling prices to mitigate inflationary cost increases.
Operating income
| In thousands | 2010 | % of sales | 2009 | % of sales | 2008 | % of sales | ||||||||||||||||||
| Operating income | $ | 151,533 | 15.3 | % | $ | 100,355 | 11.9 | % | $ | 169,315 | 14.8 | % | ||||||||||||
| Percentage point change | 3.4 pts | (2.9 | ) pts | |||||||||||||||||||||
higher sales volume, which resulted in increased leverage of our fixed cost base;
savings generated from our PIMS initiatives including lean and supply management practices; and
selective increases in selling prices to mitigate inflationary cost increases.
These increases were partially offset by:
cost increases for certain raw materials, such as carbon steel, as well as labor; and
continued investment in future growth with emphasis on international markets, including personnel and business infrastructure investments.
Net interest expense
| In thousands | 2012 | 2011 | $ change | % change | 2011 | 2010 | $ change | % change | ||||||||||||||||||||||||
Net interest expense | $ | 67,635 | $ | 58,835 | $ | 8,800 | 15.0 % | $ | 58,835 | $ | 36,116 | $ | 22,719 | 62.9 % | ||||||||||||||||||
| ||||||||||||||||||||||||||||||||
The 2.915.0 percentage point decreaseincrease in Technical Products Group operating income as a percent of net salesinterest expense in 20092012 from 20082011 was primarily the result of:
the impact of higher debt levels following the Merger;
This increase was | |
reduced overall interest expenserates in effect on our outstanding debt.
| In thousands | 2010 | 2009 | $ change | % change | 2009 | 2008 | $ change | % change | ||||||||||||||||||||||||
| Net interest expense | $ | 36,116 | $ | 41,118 | $ | (5,002 | ) | (12.2 | )% | $ | 41,118 | $ | 59,435 | $ | (18,317 | ) | (30.8 | )% | ||||||||||||||
The 12.262.9 percentage point decreaseincrease in net interest expense in 2011 from 2010 from 2009 was primarily the result of:
27
Loss on early extinguishment of debt
In October 2012, we commenced a cash tender offer for all of ourredeemed the remaining outstanding $250 million aggregate principal of our 5.65% fixed rate senior notes due 2013-2017 totaling $400 million and our 1.05% floating rate senior notes due 2013 totaling $100 million (the “Fixed/Floating Rate Notes”). The redemptions included make-whole premiums of $65.8 million. Concurrent with the Notes. Upon expirationredemption of the tenderFixed/Floating Rate Notes, we terminated a related interest rate swap that was designated as a cash flow hedge, which resulted in the reclassification of $3.4 million of previously
40
unrecognized variable to fixed swap losses fromAccumulated other comprehensive income (loss) (“AOCI”) to earnings in October 2012. All costs associated with the redemption were recorded as aLoss on the early extinguishment of debt including $0.6 million of unamortized deferred financing costs.
In December 2012, Pentair Finance S.A. (“PFSA”), completed an exchange offer on August 4, 2008, we purchased $116.1pursuant to which it exchanged $373 million in aggregate principal amount of 5.00% Senior Notes due 2021 of Pentair, Inc. a wholly-owned, indirect subsidiary of the Notes. AsCompany for a resultlike amount of this transaction, we recognizednew 5.00% Senior Notes due 2021 of PFSA, plus $5.6 million in transaction-related costs which were recorded as a loss of $4.6 millionLoss on the early extinguishment of debt in 2008. The loss included the write off of $0.1 million in unamortized deferred financing fees in addition to recognition of $0.6 million in previously unrecognized swap gains and cash paid of $5.1 million related to the tender premium and other costs associated with the purchase.
Provision (benefit) for income taxes
| In thousands | 2010 | 2009 | 2008 | |||||||||
| Income from continuing operations before income taxes and noncontrolling interest | $ | 300,147 | $ | 172,647 | $ | 367,140 | ||||||
| Provision for income taxes | 97,200 | 56,428 | 108,344 | |||||||||
| Effective tax rate | 32.4 | % | 32.7 | % | 29.5 | % | ||||||
| In thousands | 2012 | 2011 | 2010 | |||||||||
| Income (loss) from continuing operations before income taxes and noncontrolling interest | $ | (183,965) | $ | 43,266 | $ | 278,975 | ||||||
Provision (benefit) for income taxes | (79,353) | 46,417 | 88,943 | |||||||||
Effective tax rate | 43.1% | 107.3% | 31.9% | |||||||||
The 0.364.2% percentage point decrease in the effective tax rate in 20102012 from 20092011 was primarily due to:
the result of:unfavorable tax impact of the $200.5 million goodwill impairment charge in 2011.
the favorable resolution of U.S. federal and state tax audits in 2012 that did not occur in 2011;
the mix of global earnings, including the impact of the Merger and the CPT acquisition; and
the favorable tax impact related to the 2012 exchange offer.
The 3.2decreases were partially offset by:
nonrecurring impacts of the Merger, including non-deductible transaction costs and loss of domestic manufacturing deduction tax benefits.
The 75.4 percentage point increase in the tax rate in 2009 from 2008 was primarily the result of:
the unfavorable tax impact of the $200.5 million goodwill impairment charge in Water & Fluid Solutions. Excluding this item our tax rate reduction opportunities.would have been 27.0% in 2011.
28The increases were partially offset by:
certain discrete items in 2011 that did not occur in 2010;
the mix of global earnings, and;
LIQUIDITY AND CAPITAL RESOURCES
We generally fund cash requirements for working capital, capital expenditures, equity investments, acquisitions, debt repayments, dividend payments and share repurchases from cash generated from operations, availability under existing committed revolving credit facilities and in certain instances, public and private debt and equity offerings. We have grown our businesses in significant part in the past through acquisitions financed by credit provided under our revolving credit facilities and from time to time, by private or public debt issuance. Our primary revolving credit facilities have generally been adequate for these purposes, although we have negotiated additional credit facilities as needed to allow us to complete acquisitions; these are temporary loans that have in the past been repaid within less thanacquisitions. We intend to issue commercial paper to fund our financing needs on a year.
41
We are focusing on increasing our cash flow and repaying existing debt, while continuing to fund our research and development, marketing and capital investment initiatives. Our intent is to maintain investment grade ratings and a solid liquidity position.
We experience seasonal cash flows primarily due to seasonal demand in a number of markets within our Water Group.& Fluid Solutions. We generally borrow in the first quarter of our fiscal year for operational purposes, which usage reverses in the second quarter as the seasonality of our businesses peaks. End-user demand for pool and certain pumping equipment follows warm weather trends and is at seasonal highs from April to August. The magnitude of the sales spike is partially mitigated by employing some advance sale “early buy” programs (generally including extended payment termsand/or additional discounts). Demand for residential and agricultural water systems is also impacted by weather patterns, particularly by heavy flooding and droughts.
Operating activities
Cash provided by operating activities was $270.4$68.0 million in 20102012 or $12.0$252.2 million lower than in 2011. The decrease in cash provided by operating activities was due primarily to accelerated contributions of pension and other post-retirement obligations.
Cash provided by operating activities was $320.2 million in 2011 or $49.8 million higher than in 2009.2010. The increase in cash provided by operating activities was due primarily to higheran increase in net income from continuing operationsbefore non-cash items, partially offset by increased working capital necessary to support revenue growth.
Investing activities
Net cash provided by operatinginvesting activities was $258.4$375.6 million in 2009 or $54.22012. Net cash used in investing activities was $808.1 million higher thanand $60.3 million in 2008.2011 and 2010, respectively.
Acquisitions
In September 2012, we acquired $691.7 million of cash, in conjunction with the Merger.
In October 2012, we acquired, as part of Valves & Controls, the remaining 25% equity interest in Pentair Middle East Holding S.a.R.L. (“KEF”) for $100 million in cash.
Additionally, during 2012, we completed other small acquisitions in Water & Fluid Solutions with purchase prices totaling $121.2 million in cash, net of cash acquired.
In May 2011, we acquired as part of Water & Fluid Solutions, the CPT division of privately held Norit Holdings for $715.3 million.
Additionally, during 2011, we completed other small acquisitions in Water & Fluid Solutions with purchase prices totaling $21.6 million, consisting of $17.8 million in cash and $3.8 million as notes payable.
Capital expenditures
Capital expenditures in 2012, 2011 and 2010 were $94.5 million, $73.3 million and $59.5 million, respectively. The increase in cash provided by operating activities wascapital expenditures in 2012 from 2011 is primarily due primarily to a reduction in working capital, offset by an accelerated pension contribution of $25 million and lower income from continuing operations.
Financing activities
Net cash transactionused for $9.2 million. The results of Spa/Bath have been reported as discontinued operations for all periods presented.
29
42
debt, dividend payments and share repurchases. Additionally, financing activities included draw downs and repayments on our revolving credit facilities to fund our operations in the normal course of business, payments of dividends, cash received/used for stockshares issued to employees, repurchase of common stockshares and tax benefits related to stock-basedshare-based compensation.
In December 2012, our wholly-owned subsidiary, Pentair Finance S.A. (“PFSA”), completed an exchange offer (the “Exchange Offer”) pursuant to which it exchanged $373 million in aggregate principal amount of 5.00% Senior Notes due 2021 of Pentair, Inc., a wholly-owned, indirect subsidiary of the Company (the “2021 Notes”) for a like amount of new 5.00% Senior Notes due 2021 of PFSA (the “New 2021 Notes”) plus $5.6 million in transaction-related costs. Upon completion of the Exchange Offer, $127 million in aggregate principal amount of 2021 Notes remained outstanding. The Credit Facility createsremaining 2021 Notes and New 2021 Notes are guaranteed as to payment by Pentair Ltd.
In November 2012, PFSA completed a private offering of $350 million aggregate principal amount of 1.35% Senior Notes due 2015 (the “2015 Notes”) and $250 million aggregate principal amount of 2.65% Senior Notes due 2019 (the “2019 Notes” and, collectively, the “2015/2019 Notes”), which are guaranteed as to payment by Pentair Ltd. In certain circumstances, PFSA may be required to pay additional interest on the 2015/2019 Notes. We used the net proceeds from the sale of the 2015/2019 Notes to repay commercial paper and for general corporate purposes.
In October 2012, we redeemed the remaining outstanding aggregate principal of our 5.65% fixed rate senior notes due 2013-2017 totaling $400 million and our 1.05% floating rate senior notes due 2013 totaling $100 million (the “Fixed/Floating Rate Notes”). The redemptions included make-whole premiums of $65.8 million. Concurrent with the redemption of the Fixed/Floating Rate Notes, we terminated a related interest rate swap that was designated as a cash flow hedge, which resulted in the reclassification of $3.4 million of previously unrecognized variable to fixed swap losses from AOCI to earnings in October 2012. All costs associated with the redemption were recorded as aLoss on the early extinguishment of debt including $0.6 million of unamortized deferred financing costs.
In September 2012, PFSA, completed a private offering of $550 million aggregate principal amount of 3.15% Senior Notes due 2022 (the “2022 Notes”) and $350 million aggregate principal amount of 1.875% Senior Notes due 2017 (the “2017 Notes” and, collectively, the “2017/2022 Notes”), which are guaranteed as to payment by Pentair Ltd. In certain circumstances, PFSA may be required to pay additional interest on the 2017/2022 Notes. The 2017/2022 Notes remained outstanding after the Merger. A portion of the net proceeds from the 2017/2022 Notes offering were used to repay $435 million to Tyco in conjunction with the Distribution and the Merger.
In September 2012, Pentair, Inc. entered into a credit agreement providing for an unsecured, committed revolving credit facility (the “Credit Facility”) with initial maximum aggregate availability of up to $800$1,450 million. The Credit Facility replaced Pentair, Inc.’s $700 million Former Credit Facility (as defined below). The Credit Facility matures in September 2017. Upon the completion of the Merger, Pentair Ltd. became the guarantor under the Credit Facility and PFSA and certain other of our subsidiaries became affiliate borrowers under the Credit Facility. Borrowings under the Credit Facility generally bear interest at a variable rate equal to the London Interbank Offered Rate (“LIBOR”) plus a specified margin based upon PFSA’s credit ratings. PFSA must also pay a facility fee ranging from 10.0 to 30.0 basis points per annum (based upon PFSA’s credit ratings) on the amount of each lender’s commitment.
In May 2011, Pentair, Inc. completed a public offering of $500 million aggregate principal amount of the 2021 Notes. Pentair, Inc. used the net proceeds from the offering of the 2021 Notes to finance in part the CPT acquisition in 2011. The 2021 Notes which remain outstanding subsequent to the Exchange Offer are guaranteed as to payment by Pentair Ltd.
In April 2011, Pentair, Inc. entered into a Fourth Amended and Restated Credit Agreement that provided for an unsecured, committed revolving credit facility (the “Former Credit Facility”) of up to $700 million, with multi-currency sub facilitiesmulti-
43
currency sub-facilities to support investments outside the U.S. Borrowings under the Former Credit Facility bearbore interest at the rate of LIBOR plus 0.625%1.75%. Interest ratesWe used borrowings under the Former Credit Facility to fund a portion of the CPT acquisition in 2011 and fees onto repay $105 million of matured senior notes in May 2012. The Former Credit Facility was terminated in September 2012 in connection with the Merger and replaced by the Credit Facility, vary based on our credit ratings. We believe that internally generated funds and funds availableat which time the subsidiary guarantees in place under ourthe Former Credit Facility will be sufficientceased to support our normal operations, dividend payments, stock repurchases and debt maturities over the life of the Credit Facility.
PFSA is authorized to sell short-term commercial paper notes to the extent availability exists under the Credit Facility. We usePFSA uses the Credit Facility asback-up liquidity to support 100% of commercial paper outstanding. Our use of commercial paper as a funding vehicle depends upon the relative interest rates for our commercial paper compared to the cost of borrowing under our Credit Facility. As of December 31, 20102012 and 20092011, we had no$424.7 million and $3.5 million, respectively, of commercial paper outstanding, all of which was classified as long-term as we have the intent and the ability to refinance such obligations on a long-term basis under the Credit Facility.
We used borrowings under the Credit Facility and proceeds from the 2017/2022 Notes offering, to repay the Former Credit Facility and to pay other fees and expenses in connection with the Merger. Total availability under the Credit Facility was $1,025.3 million as of December 31, 2012, which was not limited by any covenants contained in the Credit Facility’s credit agreement. Subsequent to the Merger, we used the remaining proceeds from the 2017/2022 Notes offering and issuances of commercial paper.
Our debt agreements contain certain financial covenants, the most restrictive of which is a leverageare in the Credit Facility, including that we may not permit (i) the ratio (totalof our consolidated indebtedness, as defined, overdebt plus synthetic lease obligations to our consolidated earningsnet income (excluding, among other things, non-cash gains and losses) before interest, taxes, depreciation, amortization, non-cash share-based compensation expense, and amortizationup to $40 million of costs and expenses incurred in connection with the Merger (“EBITDA”) for the four consecutive fiscal quarters then ended (the “Leverage Ratio”) to exceed 3.50 to 1.00 on the last day of each fiscal quarter, and (ii) the ratio of our EBITDA for the four consecutive fiscal quarters then ended to our consolidated interest expense, including consolidated yield or discount accrued as to outstanding securitization obligations (if any), for the same period to be less than 3.00 to 1.00 as defined) that may not exceed 3.5of the end of each fiscal quarter. For purposes of the Leverage Ratio, the Credit Facility provides for the calculation of EBITDA giving pro forma effect to 1.0. Wethe Merger and certain acquisitions, divestitures and liquidations during the period to which such calculation relates. As of December 31, 2012, we were in compliance with all financial covenants underin our debt agreements as of December 31, 2010.
In addition to the Credit Facility, we have $40.0various other credit facilities with an aggregate availability of $89.0 million, of uncommittedwhich $3.0 million was outstanding at December 31, 2012. Borrowings under these credit facilities under whichbear interest at variable rates. Additionally, as part of the Merger and CPT acquisition we had $4.8assumed certain capital leases with an outstanding balance of $23.8 million of borrowings asand $15.8 million at December 31, 2012 and 2011, respectively.
As of December 31, 2010.
30
We expect to continue to have cash requirements to support working capital needs and capital expenditures, to pay interest and service debt and to pay dividends to shareholders annually.quarterly. We believe we have the ability and sufficient capacity to meet these cash requirements by using available cash and internally generated funds and to borrow under our committed and uncommitted credit facilities.
We paid dividends in 20102012 of $75.5$112.4 million, or $0.88 per common share, compared with $70.9$79.5 million, in 2009 and $67.3 million in 2008. We recently announced an increase in our dividend rate for 2011 from $0.76or $0.80 per share in 2010 to $0.80 percommon share, in 2011 and $75.5 million, or $0.76 per common share in 2010. Prior to the completion of the Merger, our board of directors proposed, and Tyco as our sole shareholder authorized, us to pay cash dividends of $0.23 per share on February 8, 2013 to shareholders of record on January 25, 2013 and $0.23 per share on
44
May 10, 2013, to shareholders of record on April 26, 2013 and we expect to continue paying dividends on a quarterly basis. We intend to seek authorization from our shareholders at our 2013 annual general meeting of shareholders to extend the increased dividend or increase the dividend for the remainder of 2013, which iswill mark the 35th37th consecutive year in which we have increased dividends.
Authorized shares
Our authorized share capital consists of 213.0 million common shares with a par value of CHF 0.50 per share. Our board of directors is authorized to increase the total share capital until September 14, 2014 by a maximum amount of 106.5 million shares. In addition, our dividend.
a maximum of 81.5 million shares upon the Boardexercise of Directorsconversion, option, exchange, warrant or similar rights for the subscription of shares granted to third parties or shareholders in connection with bonds, notes, options, warrants or other securities issued by us in national or international capital markets or pursuant to our existing and future contractual obligations (“Rights Bearing Obligations”); and/or
a maximum of 25.0 million shares upon the exercise of rights related to Rights-Bearing Obligations granted to members of the board of directors, members of the executive management, employees, contractors, consultants or other persons providing services for our benefit.
Share repurchases
Prior to the closing of the Merger, our board of directors, and Tyco as our sole shareholder, authorized the repurchase of shares of our common stock during 2008 up toshares with a maximum dollar limitaggregate value of $50 million. As$400.0 million following the closing of December 31, 2008, we had purchased 1,549,893 shares for $50 million pursuant to this authorization.the Merger. This authorization expired on December 31, 2008. No authorization for the repurchasedoes not have an expiration date. On October 1, 2012, our board of shares of our common stock was sought from or granted by our Board for 2009. On July 27, 2010 the Board of Directorsdirectors authorized the repurchase of our common shares with a maximum aggregate value of $800.0 million. This authorization expires on December 31, 2015 and is in addition to the $400.0 million share repurchase authorization. Under these authorizations, we repurchased 7,291,078 of our common stock up to a maximum dollar limit of $25shares in 2012 for $334.2 million. As of December 31, 2010 we had repurchased 734,603 shares for $25 million pursuant to this plan. In December 2010, the Board of Directors authorized the repurchase of shares of our common stock up to a maximum dollar limit of $25 million. The authorization expires December 2011.
Contractual obligations
The following summarizes our significant contractual obligations that impact our liquidity:
| Payments Due by Period | ||||||||||||||||||||||||||||
| More than | ||||||||||||||||||||||||||||
| In thousands | 2011 | 2012 | 2013 | 2014 | 2015 | 5 Years | Total | |||||||||||||||||||||
| Long-term debt obligations | $ | 4,951 | $ | 202,517 | $ | 200,003 | $ | 1 | $ | — | $ | 300,000 | $ | 707,472 | ||||||||||||||
| Interest obligations on fixed-rate debt , including effects of derivative financial instruments | 33,524 | 30,697 | 26,550 | 17,610 | 17,610 | 26,415 | 152,406 | |||||||||||||||||||||
| Operating lease obligations, net of sublease rentals | 21,088 | 17,521 | 12,250 | 9,337 | 7,458 | 11,865 | 79,519 | |||||||||||||||||||||
| Pension and post retirement plan contributions | 36,100 | 34,500 | 32,900 | 9,800 | 10,700 | 108,200 | 232,200 | |||||||||||||||||||||
| Other long-term liabilities | 235 | 118 | — | — | — | — | 353 | |||||||||||||||||||||
| Total contractual cash obligations, net | $ | 95,898 | $ | 285,353 | $ | 271,703 | $ | 36,748 | $ | 35,768 | $ | 446,480 | $ | 1,171,950 | ||||||||||||||
| Years ended December 31 | ||||||||||||||||||||||||||||
| In thousands | 2013 | 2014 | 2015 | 2016 | 2017 | Thereafter | Total | |||||||||||||||||||||
| Debt obligations | $ | — | $ | 65 | $ | 350,000 | $ | — | $ | 777,706 | $ | 1,305,793 | $ | 2,433,564 | ||||||||||||||
| Capital lease obligations | 3,096 | 3,171 | 6,036 | 1,236 | 1,236 | 9,035 | 23,810 | |||||||||||||||||||||
| Interest obligations on fixed-rate debt | 59,850 | 60,238 | 60,238 | 55,513 | 55,513 | 187,375 | 478,727 | |||||||||||||||||||||
| Operating lease obligations, net of sublease rentals | 52,306 | 40,190 | 28,785 | 20,715 | 16,322 | 31,831 | 190,149 | |||||||||||||||||||||
| Purchase obligations | 26,198 | 3,200 | — | — | — | — | 29,398 | |||||||||||||||||||||
| Pension and other post-retirement plan contributions | 33,200 | 38,800 | 38,800 | 30,300 | 17,200 | 189,600 | 347,900 | |||||||||||||||||||||
| ||||||||||||||||||||||||||||
| Total contractual obligations, net | $ | 174,650 | $ | 145,664 | $ | 483,859 | $ | 107,764 | $ | 867,977 | $ | 1,723,634 | $ | 3,503,548 | ||||||||||||||
| ||||||||||||||||||||||||||||
The majority of the purchase obligations represent commitments for raw materials to be utilized in the normal course of business. For purposes of the above table, arrangements are considered purchase obligations if a contract specifies all significant terms, including fixed or minimum quantities to be purchased, a pricing structure, and approximate timing of the transaction.
In addition to the summary of significant contractual obligations, we will incur annual interest expense on outstanding variable rate debt. As of December 31, 2010,2012, variable interest rate debt including the effects of derivative financial instruments, was $102.4$428 million at a weighted average interest rate of 1.05%0.67%.
45
The estimated annual pension plan contribution amounts are intended to achieve fully funded status of our domestic qualified pension plan in accordance with the Pension Protection Act of 2006.
31
Other financial measures
In addition to measuring our cash flow generation or usage based upon operating, investing and financing classifications included in the Consolidated Statements of Cash Flows, we also measure our free cash flow. We have a long-term goal to consistently generate free cash flow that equals or exceeds 100%100 percent conversion of net income from continuing operations. Free cash flow is a non-Generally Accepted Accounting Principles financial measure that we use to assess our cash flow performance. We believe free cash flow is an important measure of operating performance because they provideit provides us and our investors a measurement of cash generated from operations that is available to pay dividends, make acquisitions, repay debt and repurchase shares. In addition, free cash flow is used as a criterion to measure and pay compensation-based incentives. Our measure of free cash flow may not be comparable to similarly titled measures reported by other companies. The following table is a reconciliation of free cash flow:
| Twelve Months Ended December 31 | ||||||||||||
| In thousands | 2010 | 2009 | 2008 | |||||||||
| Net cash provided by (used for) continuing operations | $ | 270,376 | $ | 259,900 | $ | 212,612 | ||||||
| Capital expenditures | (59,523 | ) | (54,137 | ) | (53,089 | ) | ||||||
| Proceeds from sale of property and equipment | 358 | 1,208 | 4,741 | |||||||||
| Free cash flow | $ | 211,211 | $ | 206,971 | $ | 164,264 | ||||||
| Years ended December 31 | ||||||||||||
| In thousands | 2012 | 2011 | 2010 | |||||||||
Net cash provided by operations | $ | 67,960 | $ | 320,226 | $ | 270,376 | ||||||
Capital expenditures | (94,532 | ) | (73,348 | ) | (59,523 | ) | ||||||
Proceeds from sale of property and equipment | 5,508 | 1,310 | 358 | |||||||||
| ||||||||||||
Free cash flow | $ | (21,064 | ) | $ | 248,188 | $ | 211,211 | |||||
| ||||||||||||
Off-balance sheet arrangements
At December 31, 2010,2012, we had no off-balance sheet financing arrangements.
COMMITMENTS AND CONTINGENCIES
We have been made parties to a number of actions filed or have been given notice of potential claims relating to the conduct of our business, including those pertaining to commercial disputes, product liability, asbestos, environmental, safety and health, patent infringement and employment matters.
While we believe that a material impact on our consolidated financial position, results of operations or cash flows from any such future claims or potential claims is unlikely, given the inherent uncertainty of litigation, a remote possibility exists that a future adverse ruling or unfavorable development could result in future charges that could have a material impact. We do and will continue to periodically reexamine our estimates of probable liabilities and any associated expenses and receivables and make appropriate adjustments to such estimates based on experience and developments in litigation. As a result, the current estimates of the potential impact on our consolidated financial position, results of operations and cash flows for the proceedings and claims described in ITEM 8, Note 18 of the Notes to Consolidated Financial Statements could change in the future.
Asbestos Matters
Our subsidiaries and numerous other companies are named as defendants targetsin personal injury lawsuits based on alleged exposure to asbestos-containing materials. These cases typically involve product liability claims based primarily on allegations of manufacture, sale or PRPdistribution of industrial products that either contained asbestos
46
or were attached to or used with asbestos-containing components manufactured by third-parties. Each case typically names between dozens to hundreds of corporate defendants. While we have observed an increase in a smallthe number of environmentalclean-ups,these lawsuits over the past several years, including lawsuits by plaintiffs with mesothelioma-related claims, a large percentage of these suits have not presented viable legal claims and, as a result, have been dismissed by the courts. Our historical strategy has been to mount a vigorous defense aimed at having unsubstantiated suits dismissed, and, where appropriate, settling suits before trial. Although a large percentage of litigated suits have been dismissed, we cannot predict the extent to which we will be successful in resolving lawsuits in the future.
As of December 31, 2012, there were approximately 1,900 lawsuits pending against our subsidiaries. A lawsuit might include several claims, and we have approximately 2,300 claims outstanding as of December 31, 2012. This amount was not adjusted for claims that are not actively being prosecuted, identified incorrect defendants, or duplicated other actions, which would ultimately reflect our current or former business units have generally been givende minimisstatus. To date, noneestimate of these claims have resulted inclean-up costs, fines, penalties or damages in an amount material to our financial position or results of operations. We have disposed of athe number of businessesviable claims made against us, our affiliates, or entities for which we assumed responsibility in recent yearsconnection with acquisitions or divestitures. In addition, the amount does not include certain claims pending against third parties for which we have provided an indemnification.
Our estimated liability for asbestos-related claims was $234.6 million and $0.6 million as of December 31, 2012 and 2011, respectively, and was recorded inOther non-current liabilitiesin certain cases, suchthe Consolidated Balance Sheets for pending and future claims and related defense costs. Our estimated receivable for insurance recoveries was $157.4 million at December 31, 2012, all of which was acquired in the Merger, and was recorded inOther non-current assets in the Consolidated Balance Sheets. We had no estimated receivable for insurance recoveries as the disposition of the Cross Pointe Paper Corporation uncoated paper businessDecember 31, 2011.
Environmental Matters
We are involved in 1995, the disposition of the Federal Cartridge Company ammunition business in 1997, the disposition of Lincoln Industrial in 2001 and the disposition of the Tools Group in 2004, weor have retained responsibility and potential liability for environmental obligations and legal proceedings related to our current business and, including pursuant to certain indemnification obligations, related to certain formerly owned businesses. We are responsible, or alleged to be responsible, for ongoing environmental obligations.investigation and/or remediation of sites in several countries. These sites are in various stages of investigation and/or remediation and at some of these sites our liability is considered de minimis. We received notification from the U.S. Environmental Protection Agency and from similar state and non-U.S. environmental agencies that several sites formerly or currently owned and/or operated by us, and other properties or water supplies that may be or may have been impacted from those operations, contain disposed or recycled materials or waste and require environmental investigation and/or remediation. Those sites include instances where we have been identified as a potentially responsible party under U.S. federal, state and/or non-U.S. environmental laws and regulations. For several formerly owned businesses, we have also received claims for indemnification from purchasers of these businesses and have established what we believe to be adequatebusinesses.
Our accruals for potential liabilities arising out of retained responsibilities. We settled someenvironmental matters are recorded on a site-by-site basis when it is probable that a liability has been incurred and the amount of the claims in prior years;liability can be reasonably estimated, based on current law and existing technologies. It can be difficult to dateestimate reliably the final costs of investigation and remediation due to various factors. In our opinion, the amounts accrued are appropriate based on facts and circumstances as currently known. Based upon our experience, current information regarding known contingencies and applicable laws, we have recorded accruals have been adequate.
32
47
Product liability claims
We are subject to various product liability lawsuits and personal injury claims. A substantial number of these lawsuits and claims are insured and accrued for by Penwald, our captive insurance subsidiary. See discussion in ITEM 1 and ITEM 8, Note 2 of the Notes to Consolidated Financial Statements — Insurance subsidiary. Penwald records a liability for these claims based on actuarial projections of ultimate losses. For all other claims, accruals covering the claims are recorded, on an undiscounted basis, when it is probable that a liability has been incurred and the amount of the liability can be reasonably estimated based on existing information. The accruals are adjusted periodically as additional information becomes available. In 2004, we disposed of the Tools Group and we retained responsibility for certain product claims. We have not experienced significant unfavorable trends in either the severity or frequency of product liability lawsuits or personal injury claims.
Prior to the Merger, the Flow Control business was subject to investigations by the U.S. Department of Justice (“DOJ”) and the U.S. Securities and Exchange Commission (“SEC”) related to allegations that improper payments were made by the Flow Control business and other Tyco subsidiaries and third-party intermediaries in recent years in violation of the Foreign Corrupt Practices Act. Tyco reported to the DOJ and the SEC the remedial measures that it had taken in response to the allegations and Tyco’s own internal investigations. As a result of discussions with the DOJ and SEC aimed at resolving these matters, on September 24, 2012, Tyco entered into a settlement with the SEC and a non-prosecution agreement with the DOJ, pursuant to which the Flow Control business is for a three year period subject to yearly reporting to the DOJ concerning its continuing compliance efforts.
Stand-by lettersLetters of creditCredit, Bank Guarantees and bondsBonds
In certain situations, Tyco guaranteed Flow Control’s performance to third parties or provided financial guarantees for financial commitments of Flow Control. In situations where Flow Control and Tyco were unable to obtain a release from these guarantees in connection with the Spin-off, we will indemnify Tyco for any losses it suffers as a result of such guarantees.
In disposing of assets or businesses, we often provide representations, warranties and indemnities to cover various risks including unknown damage to the assets, environmental risks involved in the sale of real estate, liability to investigate and remediate environmental contamination at waste disposal sites and manufacturing facilities and unidentified tax liabilities and legal fees related to periods prior to disposition. We do not have the ability to reasonably estimate the potential liability due to the inchoate and unknown nature of these potential liabilities. However, we have no reason to believe that these uncertainties would have a material adverse effect on our financial position, results of operations or cash flows.
In the ordinary course of business, we are required to commit to bonds, letters of credit and bank guarantees that require payments to our customers for any non-performance. The outstanding face value of the bondsthese instruments fluctuates with the value of our projects in process and in our backlog. In addition, we issue financial stand-by letters of credit primarily to secure our performance to third parties under self-insurance programs and certain legal matters. programs.
As of December 31, 20102012 and 2009,2011, the outstanding value of these instrumentsbonds, letters of credit and bank guarantees totaled $116.5$493.2 million and $51.2$136.2 million, respectively.
NEW ACCOUNTING STANDARDS
See ITEM 8, Note 12 of the Notes to Consolidated Financial Statements, included in this form 10-K, for information pertaining to recently adopted accounting standards or accounting standards to be adopted in the future.
48
CRITICAL ACCOUNTING POLICIES
We have adopted various accounting policies to prepare the consolidated financial statements in accordance with accounting principles generally accepted in the United States.GAAP. Our significant accounting policies are more fully described in ITEM 8, Note 12 of the Notes to Consolidated Financial Statements. Certain of our accounting policies require the application of significant judgment by management in selecting the appropriate assumptions for calculating financial estimates. By their nature, these judgments are subject to an inherent degree of uncertainty. These judgments are based on our historical experience, terms of existing contracts, our observance of trends in the industry and information available from other outside sources, as appropriate. We consider an accounting estimate to be critical if:
it requires us to make assumptions about matters that were uncertain at the time we were making the estimate; and
changes in the estimate or different estimates that we could have selected would have had a material impact on our financial condition or results of operations.
Our critical accounting estimates include the following:
Impairment of Goodwillgoodwill and Indefinite-Lived Intangiblesindefinite-lived intangibles
Goodwill
Goodwill represents the excess of the cost of acquired businesses over the net of the fair value of identifiable tangible net assets and identifiable intangible assets purchased.
Goodwill is tested at least annually for impairment and is tested for impairment more frequently if events or changes in circumstances indicate that the asset might be impaired. The impairment test is performed using a two-step process. In the first step, the fair value of each reporting unit is compared with the carrying amount of the reporting unit, including goodwill. If the estimated fair value is less than the carrying amount of the reporting unit there is an indication that goodwill impairment exists and a second step must be completed in order to determine the amount of the goodwill impairment, if any that should be recorded. In the second step, an impairment loss is recognized for any excess of the carrying amount of the reporting unit’s goodwill over the implied fair value of that goodwill. The implied fair value of goodwill is determined by allocating the fair value of the reporting unit in a manner similar to a purchase price allocation.
The fair value of each reporting unit is determined using a discounted cash flow analysis and market approach. Projecting discounted future cash flows requires us to make significant estimates regarding future revenues and expenses, projected capital expenditures, changes in working capital and the appropriate discount rate. Use of the market approach consists of comparisons to comparable publicly-traded companies that are similar in size and industry. Actual results may differ from those used in our valuations.
In developing our discounted cash flow analysis, assumptions about future revenues and expenses, capital expenditures and changes in working capital are based on our annual operating plan and long-term business plan for each of our reporting units. These plans take into consideration numerous factors including historical experience, anticipated future economic conditions, changes in raw material prices and growth expectations for the industries and end markets we participate in. These assumptions are determined over a five year long-term planning period. The five year growth rates for revenues and operating profits vary for each reporting unit
33
Discount rate assumptions for each reporting unit take into consideration our assessment of risks inherent in the future cash flows of the respective reporting unit and our weighted-average cost of capital. We utilized a discount rate ranging from 13%12.0% to 15%13.0% in determining the discounted cash flows in our fair value analysis.
In estimating fair value using the market approach, we identify a group of comparable publicly-traded companies for each operatingreporting segment that are similar in terms of size and product offering. These groups of comparable companies are used to develop multiples based on total market-based invested capital as a multiple of EBITDA.earnings
49
before interest, taxes, depreciation and amortization (“EBITDA”). We determine our estimated values by applying these comparable EBITDA multiples to the operating results of our reporting units. The ultimate fair value of each reporting unit is determined considering the results of both valuation methods.
Impairment charge
We completed step one of our annual goodwill impairment evaluation during the fourth quarter for 2012 with each reporting unit’s fair value exceeding its carrying value. Accordingly, step two of the impairment analysis was not required.
For the year ended December 31, 2011, we recorded a pre-tax non-cash impairment charge of $200.5 million as a result of our annual goodwill impairment test, we determined that the fair valuetest. This represented impairment of onegoodwill in Water & Fluid Solutions. The impairment charge resulted from changes in our forecasts in light of our reporting units did not exceed its carrying value by a significant amount. Goodwill for this reporting unit was $436.6 million at December 31, 2010. If cash flow projections decreased by 2.7% or if the discount rate increased by 50 basis points (the discount rate usedeconomic conditions prevailing in these markets and due to continued softness in the impairment analysis was 13.5%), this reporting unit would have failed the step one test and a step two analysis would have been required.
Identifiable intangible assets
Indefinite-Lived Intangibles
The impairment test consists of a comparison of the fair value of the trade name with its carrying value. Fair value is measured using the relief-from-royalty method. This method assumes the trade name has value to the extent that the owner is relieved of the obligation to pay royalties for the benefits received from them. This method requires us to estimate the future revenue for the related brands, the appropriate royalty rate and the weighted average cost of capital. The impairment charge recorded in 20092012 was the result of significant declinesa rebranding strategy implemented in sales volume.
At December 31, 20102012 our goodwill and intangible assets were approximately $2,519.6$6,804.2 million and represented approximately 63.4%58% of our total assets. If we experience furtherfuture declines in sales and operating profit or do not meet our operating forecasts, we may be subject to future impairments. Additionally, changes in assumptions regarding the future performance of our businesses, increases in the discount rate used to determine the discounted cash flows of our businesses or significant declines in our stockshare price or the market as a whole could result in additional impairment indicators. Because of the significance of our goodwill and intangible assets, any future impairment of these assets could have a material adverse effect on our financial results.
Impairment of Long-lived Assetslong-lived assets
We review the recoverability of long-lived assets to be held and used, such as property, plant and equipment, when events or changes in circumstances occur that indicate the carrying value of the asset or asset group may not be recoverable. The assessment of possible impairment is based on our ability to recover the carrying
34
50
PensionPercentage of completion revenue recognition
Revenue from certain long-term contracts is recognized over the contractual period under the percentage of completion (“POC”) method of accounting. Under this method, sales and gross profit are recognized as work is performed either based on the relationship between the actual costs incurred and the total estimated costs at completion (“the cost-to-cost method”) or based on efforts expended for measuring progress towards completion in situations in which this approach is more representative of the progress on the contract than the cost-to-cost method. Changes to the original estimates may be required during the life of the contract and such estimates are reviewed on a regular basis. Sales and gross profit are adjusted using the cumulative catch-up method for revisions in estimated total contract costs and contract values. These reviews have not resulted in adjustments that were significant to our results of operations. Estimated losses are recorded when identified. Claims against customers are recognized as revenue upon settlement.
Pension and other post-retirement plans
We sponsor domestic and foreign defined-benefit pension and other post-retirement plans. The amounts recognized in our consolidated financial statements related to our defined-benefit pension and other post-retirement plans are determined from actuarial valuations. Inherent in these valuations are assumptions, includingincluding: expected return on plan assets, discount rates, rate of increase in future compensation levels and health care cost trend rates. These assumptions are updated annually and are disclosed in ITEM 8, Note 1214 to the Notes to Consolidated Financial Statements. Changes to theseDifferences in actual experience or changes in assumptions willmay affect pension expense, pension contributions and the funded status of our pension plans.
Discount rate
The discount rate reflects the current rate at which the pension liabilities could be effectively settled at the end of the year based on our December 31 measurement date. The discount rate was determined by matching our expected benefit payments to payments from a stream of AA or higher bonds available in the marketplace rated AA or higher, adjusted to eliminate the effects of call provisions. This produced a discount rate for our U.S. plans of 3.67% in 2012, 5.05% in 2011 and 5.90% in 2010, 6.00% in 2009 and 6.50% in 2008.2010. The discount rates on our foreign plans ranged from 0.50% to 4.50% in 2012, 0.75% to 5.00% in 2011 and 0.75% to 5.40% in 2010, 2.00% to 6.00% in 2009 and 2.00% to 6.25% in 2008.2010. There are no other known or anticipated changes in our discount rate assumption that will impact our pension expense in 2011.
Expected rate of return
Our expected rate of return on plan assets for our U.S. plans was 7.5% for 2012 and 8.0% in 2011 and 8.5% for 2010, 2009 and 2008.in 2010. The expected rate of return is designed to be a long-term assumption that may be subject to considerableyear-to-year variance from actual returns. In developing the expected long-term rate of return, we considered our historical returns, with consideration given to forecasted economic conditions, our asset allocations, input from external consultants and broader longer-term market indices.
During 2012, we adopted an investment strategy for our U.S. pension plans with a primary objective of preserving the funded status of the U.S. plans. This is achieved through investments in fixed interest instruments with interest rate sensitivity characteristics closely reflecting the interest rate sensitivity of our benefit obligations. Shifting of allocations away from equities to liability hedging fixed income investments is currently in progress. As equity investments are redeemed, proceeds are reinvested in fixed income instruments. After we have completed the transition, the U.S. pension expense orplans will have in excess of 90 percent allocation to fixed income investments. As a result of the adoption of this investment strategy, we will be decreasing our expected return on a market-related valuationassets for our funded U.S. pension plans to 3.75% in 2013, based on expectations of assets which reducesfuture market returns and the asset mix of the plans’ investments.
year-to-year volatility. This market-related valuation recognizes investmentIn the fourth quarter of 2012, we changed our method of recognizing actuarial gains or losses over a five-year period from the year in which they occur. Investment gains orand losses for this purpose arepension and other post-retirement benefits for all of our benefit plans. Historically, we have recognized the difference betweenactuarial gains and losses as a component ofEquity on our Consolidated Balance Sheets on an annual basis and have amortized them
51
into our operating results over the average future service period of the active employees of these plans, to the extent such gains and losses were outside of a corridor. We have elected to immediately recognize actuarial gains and losses in our operating results on the basis that it is preferable to accelerate the recognition of deferred gains and losses into income rather than to delay such recognition. Additionally, for purposes of calculating the expected return on plan assets, we will no longer use a calculated usingvalue for the market-related value of plan assets, but instead will use the actual fair value of our plan assets. These changes will improve transparency in our operating results by more quickly recognizing the effects of economic and interest rate conditions on plan obligations, investments and assumptions.
Under our new accounting method, we will recognize changes in the fair value of plan assets and the actual return based on the market-related value of assets. Since the market-related value of assets recognizesnet actuarial gains or losses over afive-year-period,annually in the future valuefourth quarter each year. The remaining components of pension expense, primarily service and interest costs and the expected return on plan assets, will be impactedrecorded on a quarterly basis as previously deferred gains or losses are recorded.
See ITEM 8, Note 14 of the Notes to Consolidated Financial Statements for further information regarding pension plans.
Loss contingencies
Accruals are recorded for various contingencies including legal proceedings, self-insurance and other claims that arise in the normal course of business. The accruals are based on judgment, the probability of losses and, where applicable, the consideration of opinions of internal and/or external legal counsel and actuarially determined estimates. Additionally, we record receivables from third party insurers when recovery has been determined to be probable.
We recognize asbestos-related liabilities on an undiscounted basis when a loss is probable and can be reasonably estimated. Certain of these liabilities are subject to insurance coverage. Our subsidiaries and numerous other companies are named as defendants in personal injury lawsuits based on alleged exposure to asbestos-containing materials. These cases typically involve product liability claims based primarily on allegations of manufacture, sale or distribution of industrial products that either contained asbestos or were attached to or used with asbestos-containing components manufactured by third-parties. The process of estimating asbestos-related liabilities and the corresponding insurance recoveries receivable is complex and dependent primarily on our historical claim experience, estimates of potential future claims, our legal strategy for resolving these claims, the availability of insurance coverage, and the solvency and creditworthiness of insurers.
See ITEM 8, Note 18 of the Notes to Consolidated Financial Statements for further information regarding loss contingencies.
Income taxes
In determining taxable income for financial statement purposes, we must make certain estimates and judgments. These estimates and judgments affect the calculation of certain tax liabilities and the determination of the recoverability of certain of the deferred tax assets, which arise from temporary differences between the tax and financial statement recognition of revenue and expense. In evaluating our ability to recover our deferred tax assets we consider all available positive and negative evidence including our past operating results, the existence of cumulative losses in the most recent years and our forecast of future taxable income. In estimating future taxable income, we develop assumptions including the amount of future pre-tax operating income, the reversal of temporary differences and the implementation of feasible and prudent tax planning strategies. These assumptions require significant judgment about the forecasts of future taxable income and are consistent with the plans and estimates we are using to manage the underlying businesses.
We currently have recorded valuation allowances that we will maintain until when, in the opinion of management, it is more likely than not that some portion or all of the deferred tax assets will not be realized. Our
52
income tax expense recorded in the future may be reduced to the extent of decreases in our valuation allowances. The realization of our remaining deferred tax assets is primarily dependent on future taxable income in the appropriate jurisdiction. Any reduction in future taxable income including but not limited to any future restructuring activities may require that we record an additional valuation allowance against our deferred tax assets. An increase in the valuation allowance could result in additional income tax expense in such period and could have a significant impact on our future earnings.
Changes in tax laws and rates could also affect recorded deferred tax assets and liabilities in the future. Management records the effect of a tax rate or law change on the Company’s deferred tax assets and liabilities in the period of enactment. Future tax rate or law changes could have a material effect on the Company’s financial condition, results of operations or cash flows.
In addition, the calculation of our tax liabilities involves dealing with uncertainties in the application of complex tax regulations in a multitude of jurisdictions across our global operations. We perform reviews of our income tax positions on a quarterly basis and accrue for uncertain tax positions. We recognize potential liabilities and record tax liabilities for anticipated tax audit issues in the tax jurisdictions in which we operate based on our estimate of whether, and the extent to which, additional taxes will be due. These tax liabilities are reflected net of related tax loss carryforwards. As events change or resolution occurs, these liabilities are adjusted, such as in the case of audit settlements with taxing authorities. The ultimate resolution may result in a payment that is materially different from our current estimate of the tax liabilities. If our estimate of tax liabilities proves to be less than the ultimate assessment, an additional charge to expense would result. If payment of these amounts ultimately proves to be less than the recorded amounts, the reversal of the liabilities would result in tax benefits being recognized in the period when we determine the liabilities are no longer necessary.
| ITEM 7A. | QUANTITATIVE AND QUALITATIVE DISCLOSURES ABOUT MARKET RISK |
Market risk is the potential economic loss that may result from adverse changes in the fair value of financial instruments. We are exposed to various market risks, including changes in interest rates and foreign currency rates. WePeriodically, we use derivative financial instruments to manage or reduce the impact of changes in interest rates. Counterparties to all derivative contracts are major financial institutions. All instruments are entered into for other than trading purposes. The major accounting policies and utilization of these instruments is described more fully in ITEM 8, Note 1 of the Notes to Consolidated Financial Statements.
35
Our debt portfolio excluding impact of swap agreements, as of December 31, 2010,2012, was comprised of debt predominantly denominated in U.S. dollars. This debt portfolio is comprised of 56%83% fixed-rate debt and 44% variable-rate debt, not considering the effects of our interest rate swaps. Taking into account the variable to fixed-rate swap agreements we entered into with an effective date of April 2006 and August 2007, our debt portfolio is comprised of 85% fixed-rate debt and 15%17% variable-rate debt. Changes in interest rates have different impacts on the fixed and variable-rate portions of our debt portfolio. A change in interest rates on the fixed portion of the debt portfolio impacts the fair value but has no impact on interest incurred or cash flows. A change in interest rates on the variable portion of the debt portfolio impacts the interest incurred and cash flows but does not impact the net financial instrument position.
Based on the fixed-rate debt included in our debt portfolio, as of December 31, 2010,2012, a 100 basis point increase or decrease in interest rates would result in a $20.0$120.4 million decrease or a $130.1 million increase or decrease in fair value.
Based on the variable-rate debt included in our debt portfolio including the interest rate swap agreements, as of December 31, 2010,2012, a 100 basis point increase or decrease in interest rates would result in a $1.0$4.2 million increase orin interest incurred. A decrease in our interest rates on our variable-rate debt of 66.4 basis points (to zero) would result in a decrease in interest incurred.
Foreign currency risk
We conduct business in various locations throughout the world and are subject to market risk due to changes in the value of foreign currencies in relation to our reporting currency, the U.S. dollar. We generally do notPeriodically, we use derivative financial instruments to manage these risks. The functional currencies of our foreign operating
53
locations are the local currency in the country of domicile. We manage these operating activities at the local level and revenues, costs, assets and liabilities are generally denominated in local currencies, thereby mitigating the risk associated with changes in foreign exchange. However, our results of operations and assets and liabilities are reported in U.S. dollars and thus will fluctuate with changes in exchange rates between such local currencies and the U.S. dollar.
From time to time, we may enter in tointo short duration foreign currency contracts to hedge foreign currency risk on intercompany transactions.
36
54
| ITEM | |
| FINANCIAL STATEMENTS AND SUPPLEMENTARY DATA |
MANAGEMENT’S REPORT ON INTERNAL CONTROL OVER FINANCIAL REPORTING
Management of Pentair Inc.Ltd. and its subsidiaries (the “Company”) is responsible for establishing and maintaining adequate internal control over financial reporting, as such term is defined inRules 13a-15(f) and15d-15(f) of the Securities Exchange Act of 1934. The Company’s internal control over financial reporting is designed to provide reasonable assurance regarding the reliability of financial reporting and the preparation of financial statements for external purposes in accordance with generally accepted accounting principles. The Company’s internal control over financial reporting includes those policies and procedures that (1) pertain to maintenance of records that, in reasonable detail, accurately and fairly reflect the transactions and dispositions of the assets of the Company; (2) provide reasonable assurance that transactions are recorded as necessary to permit preparation of the financial statements in accordance with generally accepted accounting principles and that receipts and expenditures of the Company are being made only in accordance with authorizations of management and directors of the Company; and (3) provide reasonable assurance regarding prevention or timely detection of unauthorized acquisition, use or disposition of the Company’s assets that could have a material effect on the financial statements.
Because of its inherent limitations, internal control over financial reporting may not prevent or detect misstatements. Also, projections of any evaluation of the effectiveness of internal control over financial reporting to future periods are subject to the risk that the controls may become inadequate because of changes in conditions or that the degree of compliance with the policies or procedures may deteriorate.
Management assessed the effectiveness of the Company’s internal control over financial reporting as of December 31, 2010.2012. In making this assessment, management used the criteria for effective internal control over financial reporting described inInternal Control-Integrated Frameworkissued by the Committee of Sponsoring Organizations of the Treadway Commission. Based on this assessment, management believes that, as of December 31, 2010,2012, the Company’s internal control over financial reporting was effective based on those criteria.
Management has excluded from its assessment the internal control over financial reporting at Tyco Flow Control International Ltd. (“Flow Control”), which we merged with on September 28, 2012 and whose financial statements constitute 60 percent of total assets and 20 percent of total revenues in the consolidated financial statements as of and for the year ended December 31, 2012.
Our independent registered public accounting firm, Deloitte & Touche LLP, has issued an attestation report on the Company’s internal control over financial reporting as of year ended December 31, 2010.2012. That attestation report is set forth immediately following this management report.
| Randall J. Hogan | John L. Stauch | |
Chairman and Chief Executive Officer | Executive Vice President and Chief Financial Officer |
37
55
To the Board of Directors and Shareholders of
We have audited the internal control over financial reporting of Pentair Inc.Ltd. and subsidiaries (the “Company”) as of December 31, 2010,2012, based on criteria established inInternal Control — Integrated Frameworkissued by the Committee of Sponsoring Organizations of the Treadway Commission. The Company’s management is responsible for maintaining effective internal control over financial reporting and for its assessment of the effectiveness of internal control over financial reporting, included in the accompanying Management’s Report on Internal Control over Financial Reporting. Our responsibility is to express an opinion on the Company’s internal control over financial reporting based on our audit.
We conducted our audit in accordance with the standards of the Public Company Accounting Oversight Board (United States). Those standards require that we plan and perform the audit to obtain reasonable assurance about whether effective internal control over financial reporting was maintained in all material respects. Our audit included obtaining an understanding of internal control over financial reporting, assessing the risk that a material weakness exists, testing and evaluating the design and operating effectiveness of internal control based on the assessed risk, and performing such other procedures as we considered necessary in the circumstances. We believe that our audit provides a reasonable basis for our opinion.
A company’s internal control over financial reporting is a process designed by, or under the supervision of, the company’s principal executive and principal financial officers, or persons performing similar functions, and effected by the company’s board of directors, management, and other personnel to provide reasonable assurance regarding the reliability of financial reporting and the preparation of financial statements for external purposes in accordance with generally accepted accounting principles. A company’s internal control over financial reporting includes those policies and procedures that (1) pertain to the maintenance of records that, in reasonable detail, accurately and fairly reflect the transactions and dispositions of the assets of the company; (2) provide reasonable assurance that transactions are recorded as necessary to permit preparation of financial statements in accordance with generally accepted accounting principles, and that receipts and expenditures of the company are being made only in accordance with authorizations of management and directors of the company; and (3) provide reasonable assurance regarding prevention or timely detection of unauthorized acquisition, use, or disposition of the company’s assets that could have a material effect on the financial statements.
Because of the inherent limitations of internal control over financial reporting, including the possibility of collusion or improper management override of controls, material misstatements due to error or fraud may not be prevented or detected on a timely basis. Also, projections of any evaluation of the effectiveness of the internal control over financial reporting to future periods are subject to the risk that the controls may become inadequate because of changes in conditions, or that the degree of compliance with the policies or procedures may deteriorate.
In our opinion, the Company maintained, in all material respects, effective internal control over financial reporting as of December 31, 2010,2012, based on the criteria established inInternal Control — Integrated Frameworkissued by the Committee of Sponsoring Organizations of the Treadway Commission.
We have also audited, in accordance with the standards of the Public Company Accounting Oversight Board (United States), the consolidated financial statements and financial statement schedule listed in the Index at Item 15 as of and for the year ended December 31, 20102012 of the Company and our report dated February 22, 201126, 2013 expressed an unqualified opinion on those consolidated financial statements and financial statement schedule.
[GRAPHIC ]
Minneapolis, Minnesota
February 22, 2011
38
56
To the Board of Directors and Shareholders of
We have audited the accompanying consolidated balance sheets of Pentair Inc.Ltd. and subsidiaries (the “Company”) as of December 31, 20102012 and 20092011, and the related consolidated statements of operations and comprehensive income (loss), changes in shareholders’ equity, and cash flows for each of the three years in the period ended December 31, 2010.2012. Our audits also included the financial statement schedule listed in the Index at Item 15. These financial statements and financial statement schedule are the responsibility of the Company’s management. Our responsibility is to express an opinion on the financial statements and financial statement schedule based on our audits.
We conducted our audits in accordance with the standards of the Public Company Accounting Oversight Board (United States). Those standards require that we plan and perform the audit to obtain reasonable assurance about whether the financial statements are free of material misstatement. An audit includes examining, on a test basis, evidence supporting the amounts and disclosures in the financial statements. An audit also includes assessing the accounting principles used and significant estimates made by management, as well as evaluating the overall financial statement presentation. We believe that our audits provide a reasonable basis for our opinion.
In our opinion, such consolidated financial statements present fairly, in all material respects, the financial position of the CompanyPentair Ltd. and subsidiaries at December 31, 20102012 and 20092011, and the results of their operations and their cash flows for each of the three years in the period ended December 31, 2010,2012, in conformity with accounting principles generally accepted in the United States of America. Also, in our opinion, such financial statement schedule, when considered in relation to the basic consolidated financial statements taken as a whole, present fairly, in all material respects, the information set forth therein.
As discussed in Note 3 to the consolidated financial statements, the Company has elected to change its method of accounting for defined benefit pension and other post-retirement benefit plan costs in 2012. Such changes are reflected in the accompanying consolidated balance sheet as of December 31, 2012 and 2011, and the related consolidated statements of operations and comprehensive income (loss), changes in equity and cash flows for each of the three years in the period ended December 31, 2012.
We have also audited, in accordance with the standards of the Public Company Accounting Oversight Board (United States), the Company’s internal control over financial reporting as of December 31, 2010,2012, based on the criteria established inInternal Control — Control—Integrated Frameworkissued by the Committee of Sponsoring Organizations of the Treadway Commission and our report dated February 22, 201126, 2013 expressed an unqualified opinion on the Company’s internal control over financial reporting.
[GRAPHIC]
Minneapolis, Minnesota
February 22, 2011
39
57
Consolidated Statements of Operations and Comprehensive Income (Loss)
| Years Ended December 31 | ||||||||||||
| In thousands, except per-share data | 2010 | 2009 | 2008 | |||||||||
| Net sales | $ | 3,030,773 | $ | 2,692,468 | $ | 3,351,976 | ||||||
| Cost of goods sold | 2,100,133 | 1,907,333 | 2,337,426 | |||||||||
| Gross profit | 930,640 | 785,135 | 1,014,550 | |||||||||
| Selling, general and administrative | 529,329 | 507,303 | 606,980 | |||||||||
| Research and development | 67,156 | 57,884 | 62,450 | |||||||||
| Legal settlement | — | — | 20,435 | |||||||||
| Operating income | 334,155 | 219,948 | 324,685 | |||||||||
| Other (income) expense: | ||||||||||||
| Gain on sale of interest in subsidiaries | — | — | (109,648 | ) | ||||||||
| Equity (income) losses of unconsolidated subsidiaries | (2,108 | ) | 1,379 | 3,041 | ||||||||
| Loss on early extinguishment of debt | — | 4,804 | 4,611 | |||||||||
| Interest income | (1,263 | ) | (999 | ) | (2,029 | ) | ||||||
| Interest expense | 37,379 | 42,117 | 61,464 | |||||||||
| Other | — | — | 106 | |||||||||
| Income from continuing operations before income taxes and noncontrolling interest | 300,147 | 172,647 | 367,140 | |||||||||
| Provision for income taxes | 97,200 | 56,428 | 108,344 | |||||||||
| Income from continuing operations | 202,947 | 116,219 | 258,796 | |||||||||
| Loss from discontinued operations, net of tax | — | — | (5,783 | ) | ||||||||
| Loss on disposal of discontinued operations, net of tax | (626 | ) | (19 | ) | (21,846 | ) | ||||||
| Net income before noncontrolling interest | 202,321 | 116,200 | 231,167 | |||||||||
| Noncontrolling interest | 4,493 | 707 | 2,433 | |||||||||
| Net income attributable to Pentair, Inc. | $ | 197,828 | $ | 115,493 | $ | 228,734 | ||||||
| Net income from continuing operations attributable to Pentair, Inc. | $ | 198,454 | $ | 115,512 | $ | 256,363 | ||||||
Earnings per common share attributable to Pentair, Inc. | ||||||||||||
Basic | ||||||||||||
| Continuing operations | $ | 2.02 | $ | 1.19 | $ | 2.62 | ||||||
| Discontinued operations | (0.01 | ) | — | (0.28 | ) | |||||||
| Basic earnings per common share | $ | 2.01 | $ | 1.19 | $ | 2.34 | ||||||
Diluted | ||||||||||||
| Continuing operations | $ | 2.00 | $ | 1.17 | $ | 2.59 | ||||||
| Discontinued operations | (0.01 | ) | — | (0.28 | ) | |||||||
| Diluted earnings per common share | $ | 1.99 | $ | 1.17 | $ | 2.31 | ||||||
Weighted average common shares outstanding | ||||||||||||
| Basic | 98,037 | 97,415 | 97,887 | |||||||||
| Diluted | 99,294 | 98,522 | 99,068 | |||||||||
| Years ended December 31 | ||||||||||||
| In thousands, except per-share data | 2012 | 2011 | 2010 | |||||||||
| Net sales | $ | 4,416,146 | $ | 3,456,686 | $ | 3,030,773 | ||||||
| Cost of goods sold | 3,146,554 | 2,382,964 | 2,100,133 | |||||||||
| ||||||||||||
| Gross profit | 1,269,592 | 1,073,722 | 930,640 | |||||||||
| Selling, general and administrative | 1,158,436 | 694,841 | 550,501 | |||||||||
| Research and development | 93,557 | 78,158 | 67,156 | |||||||||
| Impairment of trade names and goodwill | 60,718 | 200,520 | — | |||||||||
| ||||||||||||
| Operating income (loss) | (43,119 | ) | 100,203 | 312,983 | ||||||||
| Other (income) expense | ||||||||||||
| Loss on early extinguishment of debt | 75,367 | — | — | |||||||||
| Equity income of unconsolidated subsidiaries | (2,156 | ) | (1,898 | ) | (2,108 | ) | ||||||
| Interest income | (2,902 | ) | (1,432 | ) | (1,263 | ) | ||||||
| Interest expense | 70,537 | 60,267 | 37,379 | |||||||||
| ||||||||||||
| Income (loss) from continuing operations before income taxes and noncontrolling interest | (183,965 | ) | 43,266 | 278,975 | ||||||||
| Provision (benefit) for income taxes | (79,353 | ) | 46,417 | 88,943 | ||||||||
| ||||||||||||
| Income (loss) from continuing operations | (104,612 | ) | (3,151 | ) | 190,032 | |||||||
| Loss on disposal of discontinued operations, net of tax | — | — | (626 | ) | ||||||||
| ||||||||||||
| Net income (loss) before noncontrolling interest | (104,612 | ) | (3,151 | ) | 189,406 | |||||||
| Noncontrolling interest | 2,574 | 4,299 | 4,493 | |||||||||
| ||||||||||||
| Net income (loss) attributable to Pentair Ltd. | $ | (107,186 | ) | $ | (7,450 | ) | $ | 184,913 | ||||
| ||||||||||||
| Net income (loss) from continuing operations attributable to Pentair Ltd. | $ | (107,186 | ) | $ | (7,450 | ) | $ | 185,539 | ||||
| ||||||||||||
| Comprehensive income (loss), net of tax | ||||||||||||
| Net income (loss) before noncontrolling interest | $ | (104,612 | ) | $ | (3,151 | ) | $ | 189,406 | ||||
| Changes in cumulative translation adjustment | 35,830 | (93,706 | ) | (32,706 | ) | |||||||
| Amortization of pension and other post-retirement prior service cost and transition obligation | (253 | ) | (11 | ) | 153 | |||||||
| Changes in market value of derivative financial instruments | (3,630 | ) | 4,375 | 310 | ||||||||
| ||||||||||||
| Total comprehensive income (loss) | (72,665 | ) | (92,493 | ) | 157,163 | |||||||
| Less: Comprehensive income (loss) attributable to noncontrolling interest | 3,988 | 2,184 | 2,274 | |||||||||
| ||||||||||||
| Comprehensive income (loss) attributable to Pentair Ltd. | $ | (76,653 | ) | $ | (94,677 | ) | $ | 154,889 | ||||
| ||||||||||||
| Earnings (loss) per common share attributable to Pentair Ltd. | ||||||||||||
| Basic | ||||||||||||
| Continuing operations | $ | (0.84 | ) | $ | (0.08 | ) | $ | 1.89 | ||||
| Discontinued operations | — | — | (0.01 | ) | ||||||||
| ||||||||||||
| Basic earnings (loss) per common share | $ | (0.84 | ) | $ | (0.08 | ) | $ | 1.88 | ||||
| ||||||||||||
| Diluted | ||||||||||||
| Continuing operations | $ | (0.84 | ) | $ | (0.08 | ) | $ | 1.87 | ||||
| Discontinued operations | — | — | (0.01 | ) | ||||||||
| ||||||||||||
| Diluted earnings (loss) per common share | $ | (0.84 | ) | $ | (0.08 | ) | $ | 1.86 | ||||
| ||||||||||||
| Weighted average common shares outstanding | ||||||||||||
| Basic | 127,368 | 98,233 | 98,037 | |||||||||
| Diluted | 127,368 | 98,233 | 99,294 | |||||||||
| Dividends paid per common share | $ | 0.88 | $ | 0.80 | $ | 0.76 | ||||||
See accompanying notes to consolidated financial statements.
40
58
Consolidated Balance Sheets
| December 31, | December 31, | |||||||
| In thousands, except share and per-share data | 2010 | 2009 | ||||||
ASSETS | ||||||||
Current assets | ||||||||
| Cash and cash equivalents | $ | 46,056 | $ | 33,396 | ||||
| Accounts and notes receivable, net of allowances of $36,343 and $27,081, respectively | 516,905 | 455,090 | ||||||
| Inventories | 405,356 | 360,627 | ||||||
| Deferred tax assets | 56,349 | 49,609 | ||||||
| Prepaid expenses and other current assets | 44,631 | 47,576 | ||||||
| Total current assets | 1,069,297 | 946,298 | ||||||
Property, plant and equipment, net | 329,435 | 333,688 | ||||||
Other assets | ||||||||
| Goodwill | 2,066,044 | 2,088,797 | ||||||
| Intangibles, net | 453,570 | 486,407 | ||||||
| Other | 55,187 | 56,144 | ||||||
| Total other assets | 2,574,801 | 2,631,348 | ||||||
Total assets | $ | 3,973,533 | $ | 3,911,334 | ||||
LIABILITIES AND SHAREHOLDERS’ EQUITY | ||||||||
Current liabilities | ||||||||
| Short-term borrowings | $ | 4,933 | $ | 2,205 | ||||
| Current maturities of long-term debt | 18 | 81 | ||||||
| Accounts payable | 262,357 | 207,661 | ||||||
| Employee compensation and benefits | 107,995 | 74,254 | ||||||
| Current pension and post-retirement benefits | 8,733 | 8,948 | ||||||
| Accrued product claims and warranties | 42,295 | 34,288 | ||||||
| Income taxes | 5,964 | 5,659 | ||||||
| Accrued rebates and sales incentives | 33,559 | 27,554 | ||||||
| Other current liabilities | 80,942 | 85,629 | ||||||
| Total current liabilities | 546,796 | 446,279 | ||||||
Other liabilities | ||||||||
| Long-term debt | 702,521 | 803,351 | ||||||
| Pension and other retirement compensation | 209,859 | 234,948 | ||||||
| Post-retirement medical and other benefits | 30,325 | 31,790 | ||||||
| Long-term income taxes payable | 23,507 | 26,936 | ||||||
| Deferred tax liabilities | 169,198 | 146,630 | ||||||
| Other non-current liabilities | 86,295 | 95,060 | ||||||
| Total liabilities | 1,768,501 | 1,784,994 | ||||||
| Commitments and contingencies | ||||||||
Shareholders’ equity | ||||||||
Common shares par value $0.162/3; 98,409,192 and 98,655,506 shares issued and | ||||||||
| outstanding, respectively | 16,401 | 16,442 | ||||||
| Additional paid-in capital | 474,489 | 472,807 | ||||||
| Retained earnings | 1,624,605 | 1,502,242 | ||||||
| Accumulated other comprehensive income (loss) | (22,342 | ) | 20,597 | |||||
| Noncontrolling interest | 111,879 | 114,252 | ||||||
| Total shareholders’ equity | 2,205,032 | 2,126,340 | ||||||
Total liabilities and shareholders’ equity | $ | 3,973,533 | $ | 3,911,334 | ||||
| December 31 | ||||||||
| In thousands, except share and per-share data | 2012 | 2011 | ||||||
| Assets | ||||||||
| Current assets | ||||||||
| Cash and cash equivalents | $ | 261,341 | $ | 50,077 | ||||
| Accounts and notes receivable, net of allowances of $37,455 and $39,111, respectively | 1,292,648 | 569,204 | ||||||
| Inventories | 1,380,271 | 449,863 | ||||||
| Other current assets | 326,108 | 168,691 | ||||||
| ||||||||
| Total current assets | 3,260,368 | 1,237,835 | ||||||
| Property, plant and equipment, net | 1,224,488 | 387,525 | ||||||
| Other assets | ||||||||
| Goodwill | 4,894,512 | 2,273,918 | ||||||
| Intangibles, net | 1,909,656 | 592,285 | ||||||
| Other non-current assets | 506,287 | 94,750 | ||||||
| ||||||||
| Total other assets | 7,310,455 | 2,960,953 | ||||||
| ||||||||
| Total assets | $ | 11,795,311 | $ | 4,586,313 | ||||
| ||||||||
| Liabilities and Equity | ||||||||
| Current liabilities | ||||||||
| Current maturities of long-term debt and short-term borrowings | $ | 3,096 | $ | 4,862 | ||||
| Accounts payable | 569,596 | 294,858 | ||||||
| Employee compensation and benefits | 295,067 | 118,413 | ||||||
| Other current liabilities | 670,162 | 223,708 | ||||||
| ||||||||
| Total current liabilities | 1,537,921 | 641,841 | ||||||
| Other liabilities | ||||||||
| Long-term debt | 2,454,278 | 1,304,225 | ||||||
| Pension and other post-retirement compensation and benefits | 378,066 | 280,389 | ||||||
| Deferred tax liabilities | 488,102 | 188,957 | ||||||
| Other non-current liabilities | 453,587 | 123,509 | ||||||
| ||||||||
| Total liabilities | 5,311,954 | 2,538,921 | ||||||
| Equity | ||||||||
| Common shares CHF 0.50 par value, 213,000,000 authorized and issued at December 31, 2012; 250,000,000 shares authorized at December 31, 2011 and 98,622,564 shares issued and outstanding at December 31, 2011 | 113,454 | 47,526 | ||||||
| Common shares held in treasury, 6,862,540 shares at December 31, 2012 | (315,519 | ) | — | |||||
| Capital contribution reserve | 5,283,835 | 457,754 | ||||||
| Retained earnings | 1,292,288 | 1,465,780 | ||||||
| Accumulated other comprehensive income (loss) | (7,198 | ) | (37,731 | ) | ||||
| ||||||||
| Shareholders’ equity attributable to Pentair Ltd. | 6,366,860 | 1,933,329 | ||||||
| Noncontrolling interest | 116,497 | 114,063 | ||||||
| ||||||||
| Total equity | 6,483,357 | 2,047,392 | ||||||
| ||||||||
| Total liabilities and equity | $ | 11,795,311 | $ | 4,586,313 | ||||
| ||||||||
See accompanying notes to consolidated financial statements.
41
59
Consolidated Statements of Cash Flows
| Year Ended | ||||||||||||
| December 31, | December 31, | December 31, | ||||||||||
| In thousands | 2010 | 2009 | 2008 | |||||||||
Operating activities | ||||||||||||
| Net income before noncontrolling interest | $ | 202,321 | $ | 116,200 | $ | 231,167 | ||||||
Adjustments to reconcile net income to net cash provided by (used for) operating activities | ||||||||||||
| Loss from discontinued operations | — | — | 5,783 | |||||||||
| Loss on disposal of discontinued operations | 626 | 19 | 21,846 | |||||||||
| Equity (income) losses of unconsolidated subsidiaries | (2,108 | ) | 1,379 | 3,041 | ||||||||
| Depreciation | 57,995 | 64,823 | 59,673 | |||||||||
| Amortization | 26,184 | 40,657 | 27,608 | |||||||||
| Deferred income taxes | 29,453 | 30,616 | 40,754 | |||||||||
| Stock compensation | 21,468 | 17,324 | 20,572 | |||||||||
| Excess tax benefits from stock-based compensation | (2,686 | ) | (1,746 | ) | (1,617 | ) | ||||||
| Loss on sale of assets | 466 | 985 | 510 | |||||||||
| Gain on sale of interest in subsidiaries | — | — | (109,648 | ) | ||||||||
Changes in assets and liabilities, net of effects of business acquisitions and dispositions | ||||||||||||
| Accounts and notes receivable | (62,344 | ) | 11,307 | (18,247 | ) | |||||||
| Inventories | (44,495 | ) | 66,684 | (33,311 | ) | |||||||
| Prepaid expenses and other current assets | 2,777 | 16,202 | (27,394 | ) | ||||||||
| Accounts payable | 55,321 | (13,822 | ) | (1,973 | ) | |||||||
| Employee compensation and benefits | 27,252 | (22,431 | ) | (21,919 | ) | |||||||
| Accrued product claims and warranties | 8,068 | (7,440 | ) | (7,286 | ) | |||||||
| Income taxes | 1,791 | 1,972 | (4,409 | ) | ||||||||
| Other current liabilities | 561 | (21,081 | ) | 8,987 | ||||||||
| Pension and post-retirement benefits | (43,024 | ) | (39,607 | ) | 301 | |||||||
| Other assets and liabilities | (9,250 | ) | (2,141 | ) | 18,174 | |||||||
| Net cash provided by (used for) continuing operations | 270,376 | 259,900 | 212,612 | |||||||||
| Net cash provided by (used for) operating activities of discontinued operations | — | (1,531 | ) | (8,397 | ) | |||||||
| Net cash provided by (used for) operating activities | 270,376 | 258,369 | 204,215 | |||||||||
Investing activities | ||||||||||||
| Capital expenditures | (59,523 | ) | (54,137 | ) | (53,089 | ) | ||||||
| Proceeds from sale of property and equipment | 358 | 1,208 | 4,741 | |||||||||
| Acquisitions, net of cash acquired | — | — | (2,027 | ) | ||||||||
| Divestitures | — | 1,567 | 37,907 | |||||||||
| Other | (1,148 | ) | (3,224 | ) | (12 | ) | ||||||
| Net cash provided by (used for) investing activities | (60,313 | ) | (54,586 | ) | (12,480 | ) | ||||||
Financing activities | ||||||||||||
| Net short-term borrowings | 2,728 | 2,205 | (16,994 | ) | ||||||||
| Proceeds from long-term debt | 703,641 | 580,000 | 715,000 | |||||||||
| Repayment of long-term debt | (804,713 | ) | (730,304 | ) | (805,016 | ) | ||||||
| Debt issuance costs | (50 | ) | (50 | ) | (114 | ) | ||||||
| Excess tax benefits from stock-based compensation | 2,686 | 1,746 | 1,617 | |||||||||
| Stock issued to employees, net of shares withheld | 9,941 | 8,247 | 5,590 | |||||||||
| Repurchases of common stock | (24,712 | ) | — | (50,000 | ) | |||||||
| Dividends paid | (75,465 | ) | (70,927 | ) | (67,284 | ) | ||||||
| Distribution to noncontrolling interest | (4,647 | ) | — | — | ||||||||
| Net cash provided by (used for) financing activities | (190,591 | ) | (209,083 | ) | (217,201 | ) | ||||||
Effect of exchange rate changes on cash and cash equivalents | (6,812 | ) | (648 | ) | (5,985 | ) | ||||||
Change in cash and cash equivalents | 12,660 | (5,948 | ) | (31,451 | ) | |||||||
Cash and cash equivalents, beginning of period | 33,396 | 39,344 | 70,795 | |||||||||
Cash and cash equivalents, end of period | $ | 46,056 | $ | 33,396 | $ | 39,344 | ||||||
| Years ended December 31 | ||||||||||||
| In thousands | 2012 | 2011 | 2010 | |||||||||
Operating activities | ||||||||||||
Net income (loss) before noncontrolling interest | $ | (104,612 | ) | $ | (3,151 | ) | $ | 189,406 | ||||
| Adjustments to reconcile net income (loss) before noncontrolling interest to net cash provided by (used for) operating activities | ||||||||||||
Loss on disposal of discontinued operations | — | — | 626 | |||||||||
Equity income of unconsolidated subsidiaries | (2,156 | ) | (1,898 | ) | (2,108 | ) | ||||||
Depreciation | 87,835 | 66,235 | 57,995 | |||||||||
Amortization | 75,957 | 41,897 | 26,184 | |||||||||
Deferred income taxes | (146,896 | ) | (5,583 | ) | 29,453 | |||||||
Share-based compensation | 35,847 | 19,489 | 21,468 | |||||||||
Impairment of trade names and goodwill | 60,718 | 200,520 | — | |||||||||
Loss on early extinguishment of debt | 75,367 | — | — | |||||||||
Excess tax benefits from share-based compensation | (4,976 | ) | (3,310 | ) | (2,686 | ) | ||||||
Pension and other post-retirement expense | 167,536 | 84,345 | 34,098 | |||||||||
Pension and other post-retirement contributions | (238,014 | ) | (40,294 | ) | (52,992 | ) | ||||||
Loss (gain) on sale of assets | (2,276 | ) | 933 | 466 | ||||||||
| Changes in assets and liabilities, net of effects of business acquisitions | ||||||||||||
Accounts and notes receivable | 55,720 | 1,348 | (62,344 | ) | ||||||||
Inventories | 125,099 | 18,263 | (44,495 | ) | ||||||||
Other current assets | (6,696 | ) | 10,032 | 2,777 | ||||||||
Accounts payable | (61,990 | ) | (24,330 | ) | 55,321 | |||||||
Employee compensation and benefits | (81,313 | ) | (20,486 | ) | 27,252 | |||||||
Other current liabilities | 27,178 | (7,954 | ) | (795 | ) | |||||||
Other non-current assets and liabilities | 5,632 | (15,830 | ) | (9,250 | ) | |||||||
| ||||||||||||
Net cash provided by (used for) operating activities | 67,960 | 320,226 | 270,376 | |||||||||
Investing activities | ||||||||||||
Capital expenditures | (94,532 | ) | (73,348 | ) | (59,523 | ) | ||||||
Proceeds from sale of property and equipment | 5,508 | 1,310 | 358 | |||||||||
Acquisitions, net of cash acquired | 470,459 | (733,105 | ) | — | ||||||||
Other | (5,858 | ) | (2,943 | ) | (1,148 | ) | ||||||
| ||||||||||||
Net cash provided by (used for) investing activities | 375,577 | (808,086 | ) | (60,313 | ) | |||||||
Financing activities | ||||||||||||
Net short-term borrowings | (3,700 | ) | (1,239 | ) | 2,728 | |||||||
Proceeds from long-term debt | 1,536,146 | 1,421,602 | 703,641 | |||||||||
Repayment of long-term debt | (1,305,339 | ) | (832,147 | ) | (804,713 | ) | ||||||
Debt issuance costs | (9,704 | ) | (8,973 | ) | (50 | ) | ||||||
Debt extinguishment costs | (74,752 | ) | — | — | ||||||||
Excess tax benefits from share-based compensation | 4,976 | 3,310 | 2,686 | |||||||||
Shares issued to employees, net of shares withheld | 68,177 | 13,322 | 9,941 | |||||||||
Repurchases of common shares | (334,159 | ) | (12,785 | ) | (24,712 | ) | ||||||
Dividends paid | (112,397 | ) | (79,537 | ) | (75,465 | ) | ||||||
Distribution to noncontrolling interest | (1,554 | ) | — | (4,647 | ) | |||||||
| ||||||||||||
Net cash provided by (used for) financing activities | (232,306 | ) | 503,553 | (190,591 | ) | |||||||
Effect of exchange rate changes on cash and cash equivalents | 33 | (11,672 | ) | (6,812 | ) | |||||||
| ||||||||||||
Change in cash and cash equivalents | 211,264 | 4,021 | 12,660 | |||||||||
Cash and cash equivalents, beginning of year | 50,077 | 46,056 | 33,396 | |||||||||
| ||||||||||||
Cash and cash equivalents, end of year | $ | 261,341 | $ | 50,077 | $ | 46,056 | ||||||
| ||||||||||||
See accompanying notes to consolidated financial statements.
42
60
Ltd. and Subsidiaries
Consolidated Statements of Changes in Shareholders’ Equity
| Accumulated | Comprehensive | |||||||||||||||||||||||||||||||||||
| Additional | other | income (loss) | ||||||||||||||||||||||||||||||||||
| Common shares | paid-in | Retained | comprehensive | Total | Noncontrolling | attributable | ||||||||||||||||||||||||||||||
| In thousands, except share and per-share data | Number | Amount | capital | earnings | income (loss) | Pentair, Inc. | Interest | Total | to Pentair, Inc. | |||||||||||||||||||||||||||
Balance — December 31, 2007 | 99,221,831 | $ | 16,537 | $ | 476,242 | $ | 1,296,226 | $ | 121,866 | $ | 1,910,871 | $ | — | $ | 1,910,871 | |||||||||||||||||||||
| Net income | 228,734 | 228,734 | 228,734 | $ | 228,734 | |||||||||||||||||||||||||||||||
| Change in cumulative translation adjustment | (72,117 | ) | (72,117 | ) | (72,117 | ) | (72,117 | ) | ||||||||||||||||||||||||||||
| Adjustment in retirement liability, net of $42,793 tax | (66,933 | ) | (66,933 | ) | (66,933 | ) | (66,933 | ) | ||||||||||||||||||||||||||||
| Changes in market value of derivative financial instruments, net of ($6,284) tax | (9,431 | ) | (9,431 | ) | (9,431 | ) | (9,431 | ) | ||||||||||||||||||||||||||||
| Comprehensive income (loss) | $ | 80,253 | ||||||||||||||||||||||||||||||||||
| Cash dividends — $0.68 per common share | (67,284 | ) | (67,284 | ) | (67,284 | ) | ||||||||||||||||||||||||||||||
| Tax benefit of stock compensation | 2,247 | 2,247 | 2,247 | |||||||||||||||||||||||||||||||||
| Share repurchase | (1,549,893 | ) | (258 | ) | (49,742 | ) | (50,000 | ) | (50,000 | ) | ||||||||||||||||||||||||||
| Exercise of stock options, net of 121,638 shares tendered for payment | 322,574 | 53 | 4,948 | 5,001 | 5,001 | |||||||||||||||||||||||||||||||
| Issuance of restricted shares, net of cancellations | 366,005 | 61 | 388 | 449 | 449 | |||||||||||||||||||||||||||||||
| Amortization of restricted shares | 9,378 | 9,378 | 9,378 | |||||||||||||||||||||||||||||||||
| Shares surrendered by employees to pay taxes | (83,598 | ) | (14 | ) | (2,730 | ) | (2,744 | ) | (2,744 | ) | ||||||||||||||||||||||||||
| Stock compensation | 10,510 | 10,510 | 10,510 | |||||||||||||||||||||||||||||||||
| PRF Acquisition | 121,388 | 121,388 | ||||||||||||||||||||||||||||||||||
Balance — December 31, 2008 | 98,276,919 | $ | 16,379 | $ | 451,241 | $ | 1,457,676 | $ | (26,615 | ) | $ | 1,898,681 | $ | 121,388 | $ | 2,020,069 | ||||||||||||||||||||
| Net income | 115,493 | 115,493 | 707 | 116,200 | $ | 115,493 | ||||||||||||||||||||||||||||||
| Change in cumulative translation adjustment | 43,371 | 43,371 | (7,843 | ) | 35,528 | 43,371 | ||||||||||||||||||||||||||||||
| Adjustment in retirement liability, net of $164 tax | 256 | 256 | 256 | 256 | ||||||||||||||||||||||||||||||||
| Changes in market value of derivative financial instruments, net of ($2,323) tax | 3,585 | 3,585 | 3,585 | 3,585 | ||||||||||||||||||||||||||||||||
| Comprehensive income (loss) | $ | 162,705 | ||||||||||||||||||||||||||||||||||
| Cash dividends — $0.72 per common share | (70,927 | ) | (70,927 | ) | (70,927 | ) | ||||||||||||||||||||||||||||||
| Tax benefit of stock compensation | 1,025 | 1,025 | 1,025 | |||||||||||||||||||||||||||||||||
| Exercise of stock options, net of 124,613 shares tendered for payment | 433,533 | 72 | 7,639 | 7,711 | 7,711 | |||||||||||||||||||||||||||||||
| Issuance of restricted shares, net of cancellations | 24,531 | 4 | 516 | 520 | 520 | |||||||||||||||||||||||||||||||
| Amortization of restricted shares | 7,190 | 7,190 | 7,190 | |||||||||||||||||||||||||||||||||
| Shares surrendered by employees to pay taxes | (79,477 | ) | (13 | ) | (1,867 | ) | (1,880 | ) | (1,880 | ) | ||||||||||||||||||||||||||
| Stock compensation | 7,063 | 7,063 | 7,063 | |||||||||||||||||||||||||||||||||
Balance — December 31, 2009 | 98,655,506 | $ | 16,442 | $ | 472,807 | $ | 1,502,242 | $ | 20,597 | $ | 2,012,088 | $ | 114,252 | $ | 2,126,340 | |||||||||||||||||||||
| Net income | 197,828 | 197,828 | 4,493 | 202,321 | $ | 197,828 | ||||||||||||||||||||||||||||||
| Change in cumulative translation adjustment | (30,487 | ) | (30,487 | ) | (2,219 | ) | (32,706 | ) | (30,487 | ) | ||||||||||||||||||||||||||
| Adjustment in retirement liability, net of ($8,159) tax | (12,762 | ) | (12,762 | ) | (12,762 | ) | (12,762 | ) | ||||||||||||||||||||||||||||
| Changes in market value of derivative financial instruments, net of $229 tax | 310 | 310 | 310 | 310 | ||||||||||||||||||||||||||||||||
| Comprehensive income (loss) | $ | 154,889 | ||||||||||||||||||||||||||||||||||
| Tax benefit of stock compensation | 2,171 | 2,171 | 2,171 | |||||||||||||||||||||||||||||||||
| Cash dividends — $0.76 per common share | (75,465 | ) | (75,465 | ) | (75,465 | ) | ||||||||||||||||||||||||||||||
| Distribution to noncontrolling interest | (4,647 | ) | (4,647 | ) | ||||||||||||||||||||||||||||||||
| Share repurchase | (726,777 | ) | (121 | ) | (24,591 | ) | (24,712 | ) | (24,712 | ) | ||||||||||||||||||||||||||
| Exercise of stock options, net of 27,177 shares tendered for payment | 651,331 | 109 | 14,817 | 14,926 | 14,926 | |||||||||||||||||||||||||||||||
| Issuance of restricted shares, net of cancellations | (4,122 | ) | (1 | ) | 707 | 706 | 706 | |||||||||||||||||||||||||||||
| Amortization of restricted shares | 3,538 | 3,538 | 3,538 | |||||||||||||||||||||||||||||||||
| Shares surrendered by employees to pay taxes | (166,746 | ) | (28 | ) | (5,663 | ) | (5,691 | ) | (5,691 | ) | ||||||||||||||||||||||||||
| Stock compensation | 10,703 | 10,703 | 10,703 | |||||||||||||||||||||||||||||||||
Balance — December 31, 2010 | 98,409,192 | $ | 16,401 | $ | 474,489 | $ | 1,624,605 | $ | (22,342 | ) | $ | 2,093,153 | $ | 111,879 | $ | 2,205,032 | ||||||||||||||||||||
43
In thousands, except share | Common shares | Treasury shares | Capital | Retained | Accumulated | Total | Non- | |||||||||||||||||||||||||||||||||
| and per-share data | Number | Amount | Number | Amount | reserve | earnings | income (loss) | Pentair Ltd. | interest | Total | ||||||||||||||||||||||||||||||
Balance - December 31, 2009 | 98,655,506 | $ | 47,530 | — | $ | — | $ | 441,719 | $ | 1,443,319 | $ | 79,520 | $ | 2,012,088 | $ | 114,252 | $ | 2,126,340 | ||||||||||||||||||||||
Net income | — | — | — | — | — | 184,913 | — | 184,913 | 4,493 | 189,406 | ||||||||||||||||||||||||||||||
| Change in cumulative translation adjustment | — | — | — | — | — | — | (30,487 | ) | (30,487 | ) | (2,219 | ) | (32,706 | ) | ||||||||||||||||||||||||||
| Amortization of pension and other post-retirement prior service cost and transition obligation, net of $111 tax | — | — | — | — | — | — | 153 | 153 | — | 153 | ||||||||||||||||||||||||||||||
| Changes in market value of derivative financial instruments, net of $229 tax | — | — | — | — | — | — | 310 | 310 | — | 310 | ||||||||||||||||||||||||||||||
| Tax benefit of share-based compensation | — | — | — | — | 2,171 | — | — | 2,171 | — | 2,171 | ||||||||||||||||||||||||||||||
| Dividends declared | — | — | — | — | — | (75,465 | ) | — | (75,465 | ) | — | (75,465 | ) | |||||||||||||||||||||||||||
| Distribution to noncontrolling interest | — | — | — | — | — | — | — | — | (4,647 | ) | (4,647 | ) | ||||||||||||||||||||||||||||
| Share repurchase | (726,777 | ) | (350 | ) | — | — | (24,362 | ) | — | — | (24,712 | ) | — | (24,712 | ) | |||||||||||||||||||||||||
| Exercise of options, net of 27,177 shares tendered for payment | 651,331 | 314 | — | — | 14,612 | — | — | 14,926 | — | 14,926 | ||||||||||||||||||||||||||||||
| Issuance of restricted shares, net of cancellations | (4,122 | ) | (2 | ) | — | — | 708 | — | — | 706 | — | 706 | ||||||||||||||||||||||||||||
| Amortization of restricted shares | — | — | — | — | 3,538 | — | — | 3,538 | — | 3,538 | ||||||||||||||||||||||||||||||
| Shares surrendered by employees to pay taxes | (166,746 | ) | (80 | ) | — | — | (5,611 | ) | — | — | (5,691 | ) | — | (5,691 | ) | |||||||||||||||||||||||||
| Share-based compensation | — | — | — | — | 10,703 | — | — | 10,703 | — | 10,703 | ||||||||||||||||||||||||||||||
| ||||||||||||||||||||||||||||||||||||||||
| Balance - December 31, 2010 | 98,409,192 | $ | 47,412 | — | $ | — | $ | 443,478 | $ | 1,552,767 | $ | 49,496 | $ | 2,093,153 | $ | 111,879 | $ | 2,205,032 | ||||||||||||||||||||||
| ||||||||||||||||||||||||||||||||||||||||
| Net income (loss) | — | — | — | — | — | (7,450 | ) | — | (7,450 | ) | 4,299 | (3,151 | ) | |||||||||||||||||||||||||||
| Change in cumulative translation adjustment | — | — | — | — | — | — | (91,591 | ) | (91,591 | ) | (2,115 | ) | (93,706 | ) | ||||||||||||||||||||||||||
| Amortization of pension and other post-retirement prior service cost, net of $7 tax | — | — | — | — | — | — | (11 | ) | (11 | ) | — | (11 | ) | |||||||||||||||||||||||||||
| Changes in market value of derivative financial instruments, net of $2,884 tax | — | — | — | — | — | — | 4,375 | 4,375 | — | 4,375 | ||||||||||||||||||||||||||||||
| Tax benefit of share-based compensation | — | — | — | — | 3,868 | — | — | 3,868 | — | 3,868 | ||||||||||||||||||||||||||||||
| Dividends declared | — | — | — | — | — | (79,537 | ) | — | (79,537 | ) | — | (79,537 | ) | |||||||||||||||||||||||||||
| Share repurchase | (397,126 | ) | (211 | ) | — | — | (12,574 | ) | — | — | (12,785 | ) | — | (12,785 | ) | |||||||||||||||||||||||||
| Exercise of options, net of 182,270 shares tendered for payment | 657,616 | 350 | — | — | 14,358 | — | — | 14,708 | — | 14,708 | ||||||||||||||||||||||||||||||
| Issuance of restricted shares, net of cancellations | 28,603 | 15 | — | — | 1,460 | — | — | 1,475 | — | 1,475 | ||||||||||||||||||||||||||||||
| Amortization of restricted shares | — | — | — | — | 1,006 | — | — | 1,006 | — | 1,006 | ||||||||||||||||||||||||||||||
| Shares surrendered by employees to pay taxes | (75,721 | ) | (40 | ) | — | — | (2,758 | ) | — | — | (2,798 | ) | — | (2,798 | ) | |||||||||||||||||||||||||
| Share-based compensation | — | — | — | — | 8,916 | — | — | 8,916 | — | 8,916 | ||||||||||||||||||||||||||||||
| ||||||||||||||||||||||||||||||||||||||||
Balance - December 31, 2011 | 98,622,564 | $ | 47,526 | — | $ | — | $ | 457,754 | $ | 1,465,780 | $ | (37,731 | ) | $ | 1,933,329 | $ | 114,063 | $ | 2,047,392 | |||||||||||||||||||||
| ||||||||||||||||||||||||||||||||||||||||
61
In thousands, except share | Common shares | Treasury shares | Capital | Retained | Accumulated | Total | Non- | |||||||||||||||||||||||||||||||||
| and per-share data | Number | Amount | Number | Amount | reserve | earnings | income (loss) | Pentair Ltd. | interest | Total | ||||||||||||||||||||||||||||||
| Net income (loss) | — | — | — | — | — | (107,186 | ) | — | (107,186 | ) | 2,574 | (104,612 | ) | |||||||||||||||||||||||||||
| Change in cumulative translation adjustment | — | — | — | — | — | — | 34,416 | 34,416 | 1,414 | 35,830 | ||||||||||||||||||||||||||||||
| Amortization of pension and other post-retirement prior service cost, net of $161 tax | — | — | — | — | — | — | (253 | ) | (253 | ) | — | (253 | ) | |||||||||||||||||||||||||||
| Changes in market value of derivative financial instruments, net of $3,661 tax | — | — | — | — | — | — | (3,630 | ) | (3,630 | ) | — | (3,630 | ) | |||||||||||||||||||||||||||
| Tax benefit of share-based compensation | — | — | — | — | 5,555 | — | 5,555 | — | 5,555 | |||||||||||||||||||||||||||||||
| Dividends declared | — | — | — | — | (141,058 | ) | (66,306 | ) | — | (207,364 | ) | — | (207,364 | ) | ||||||||||||||||||||||||||
| Distribution to noncontrolling interest | — | — | — | — | — | — | — | — | (1,554 | ) | (1,554 | ) | ||||||||||||||||||||||||||||
| Issuance of shares related to the Merger | 113,611,537 | 65,521 | (2,712,603 | ) | (119,626 | ) | 4,977,249 | — | — | 4,923,144 | — | 4,923,144 | ||||||||||||||||||||||||||||
| Share repurchase | — | — | (7,291,078 | ) | (334,159 | ) | — | — | — | (334,159 | ) | — | (334,159 | ) | ||||||||||||||||||||||||||
| Exercise of options, net of 45,123 shares tendered for payment | 669,361 | 356 | 2,319,367 | 97,549 | (7,833 | ) | — | — | 90,072 | — | 90,072 | |||||||||||||||||||||||||||||
| Issuance of restricted shares, net of cancellations | 168,936 | 90 | 1,254,449 | 59,798 | (40,904 | ) | — | — | 18,984 | — | 18,984 | |||||||||||||||||||||||||||||
| Amortization of restricted shares | — | — | — | — | 24,209 | — | — | 24,209 | — | 24,209 | ||||||||||||||||||||||||||||||
| Shares surrendered by employees to pay taxes | (72,398 | ) | (39 | ) | (432,675 | ) | (19,081 | ) | (2,775 | ) | — | — | (21,895 | ) | — | (21,895 | ) | |||||||||||||||||||||||
| Share-based compensation | — | — | — | — | 11,638 | — | — | 11,638 | — | 11,638 | ||||||||||||||||||||||||||||||
| ||||||||||||||||||||||||||||||||||||||||
Balance - December 31, 2012 | 213,000,000 | $ | 113,454 | (6,862,540 | ) | $ | (315,519 | ) | $ | 5,283,835 | $ | 1,292,288 | $ | (7,198 | ) | $ | 6,366,860 | $ | 116,497 | $ | 6,483,357 | |||||||||||||||||||
| ||||||||||||||||||||||||||||||||||||||||
See accompanying notes to consolidated financial statements.
Pentair Inc.Ltd. and Subsidiaries
Notes to consolidated financial statements
| 1. | Background and Nature of Operations |
Pentair Ltd., formerly known as Tyco Flow Control International Ltd. (as used prior to the Merger (as defined below), “Flow Control”), is a company organized under the laws of Significant Accounting PoliciesSwitzerland. In these notes, the terms “the Company,” “Pentair,” “us,” “we” or “our” refer to Pentair Ltd. and its consolidated subsidiaries. Our business took its current form on September 28, 2012 as a result of a spin-off of Flow Control from its parent, Tyco International Ltd. (“Tyco”), and a reverse acquisition involving Pentair, Inc.
Prior to the spin-off, Tyco engaged in an internal restructuring whereby it transferred to Flow Control certain assets related to the flow control business of Tyco, and Flow Control assumed from Tyco certain liabilities related to the flow control business of Tyco. On September 28, 2012 prior to the Merger (as defined below), Tyco effected a spin-off of Flow Control through the pro-rata distribution of 100% of the outstanding common shares of Flow Control to Tyco’s shareholders (the “Distribution”), resulting in the distribution of 110,898,934 of our common shares to Tyco’s shareholders. Immediately following the Distribution, an indirect, wholly-owned subsidiary of ours merged with and into Pentair, Inc., with Pentair, Inc. surviving as an indirect, wholly-owned subsidiary of ours (the “Merger”). At the effective time of the Merger, each Pentair, Inc. common share was converted into the right to receive one of our common shares, resulting in 99,388,463 of our common shares being issued to Pentair, Inc. shareholders. The Merger is intended to be tax-free for U.S. federal income tax purposes. After the Merger, our common shares are traded on the New York Stock Exchange under the symbol PNR. Tyco equity-based awards held by Flow Control employees and certain Tyco employees and directors outstanding prior to the completion of the Distribution were converted in connection with the Distribution into equity-based awards with respect to our common shares and were assumed by us. Pentair, Inc. equity-based awards outstanding prior to the completion of the Merger were converted upon completion of the Merger into equity-based awards with respect to our common shares and were assumed by us.
The Merger was accounted for as a reverse acquisition under the purchase method of accounting with Pentair, Inc. treated as the acquirer, reflecting the control maintained by the executive management and board of directors of Pentair, Inc. after the Merger. As such, on the acquisition date of September 28, 2012, the assets and liabilities of Flow Control have been assessed at fair value and the assets and liabilities of Pentair, Inc. are carried over at historical cost. For periods prior to September 28, 2012, the Consolidated Statements of Operations and Comprehensive Income (Loss) and Consolidated Statements of Cash Flows include the historical results of Pentair, Inc. The consolidated financial statements include the results of Flow Control from the date of the Merger. Flow Control’s net sales and net loss from continuing operations for the period from the acquisition date to December 31, 2012 were $886.5 million and $117.0 million, respectively.
Our common share balances prior to the Merger have been adjusted to reflect the one-for-one conversion of the Pentair, Inc. shares to Pentair Ltd. shares, with the difference in par value recorded inCapital contribution reserve.
Based on the price of Pentair, Inc. common stock and our common shares issued on the date of the Merger, the purchase price was composed of the following:
| In thousands | ||||
Value of common shares issued to Tyco shareholders(1) | $ | 4,811,363 | ||
Cash paid to Tyco shareholders in lieu of fractional common shares(2) | 542 | |||
Value of replacement equity-based awards to holders of Tyco equity-based awards(3) | 111,239 | |||
Total purchase price | $ | 4,923,144 | ||
| (1) | Equals 110,886,444 Pentair Ltd. shares distributed to Tyco shareholders multiplied by the Merger date share price of $43.39. |
63
Fiscal yearPentair Ltd. and Subsidiaries
Our fiscal year endsNotes to consolidated financial statements
| (2) | Equals cash paid to Tyco shareholders in lieu of 12,490 Pentair Ltd. fractional shares multiplied by the Merger date share price of $43.39. |
| (3) | In accordance with applicable accounting guidance, the fair value of replacement equity-based awards attributable to pre-combination service is recorded as part of the consideration transferred in the Merger, while the fair value of replacement equity-based awards attributable to post-combination service is recorded separately from the business combination and recognized as compensation cost in the post-acquisition period over the remaining service period. The fair value of our equivalent stock options was estimated using the Black-Scholes valuation model utilizing various assumptions. |
During the fourth quarter of 2012, we recorded fair value adjustments to our preliminary purchase price allocation, which resulted in an increase to goodwill of $32.6 million.
The purchase price has been preliminarily allocated based on December 31.the estimated fair value of net assets acquired and liabilities assumed at the date of the Merger. The preliminary purchase price allocation is subject to further refinement and may require significant adjustments to arrive at the final purchase price allocation. These adjustments will primarily relate to accounts receivable, inventories, property, plant and equipment, certain contingent liabilities and income tax-related items. We reportexpect the purchase price allocation to be completed in the second quarter of 2013. There can be no assurance that such finalization will not result in material changes from the preliminary purchase price allocation. The purchase price is subject to a working capital and net indebtedness adjustment.
The following table summarizes our interim quarterly periodspreliminary fair values of the assets acquired and liabilities assumed in the Merger:
| In thousands | ||||
Cash and cash equivalents | $ | 691,702 | ||
Accounts and notes receivable | 771,576 | |||
Inventories | 1,046,165 | |||
Other current assets | 98,212 | |||
Property, plant and equipment | 822,001 | |||
Goodwill | 2,520,110 | |||
Intangibles | 1,425,072 | |||
Other non-current assets | 275,103 | |||
Current liabilities | (856,341 | ) | ||
Long-term debt | (914,530 | ) | ||
Income taxes, including current and deferred | (364,573 | ) | ||
Other liabilities and redeemable noncontrolling interest | (591,353 | ) | ||
Total purchase price | $ | 4,923,144 | ||
The excess of purchase price over tangible net assets and identified intangible assets acquired was allocated to goodwill in the amount of $2.5 billion. Goodwill has been preliminarily allocated to our reporting segments as follows: $321.4 million to Water & Fluid Solutions, $1,342.6 million to Valves & Controls and $856.1 million to Technical Solutions. None of the goodwill recognized from the Merger is expected to be deductible for income tax purposes. Goodwill recognized from the Merger reflects the value of future income resulting from synergies of our combined operations. Identifiable intangible assets acquired as part of the Merger were $1.4 billion and include $362.3 million of indefinite life trade name intangibles and the following definite-lived intangibles: $905.7 million of customer relationships with a weighted average useful life of 14.2 years, $115.9 million of proprietary technology with weighted average useful life of 13.7 years and $41.2 million of customer backlog with a weighted average useful life of less than one year.
64
Pentair Ltd. and Subsidiaries
Notes to consolidated financial statements
Flow Control is a global leader in the industrial flow control market, specializing in the design, manufacture and servicing of highly engineered valves, actuation & controls, electric heat management solutions and water transmission and distribution products. Flow Control’s broad portfolio of products and services serves flow control needs primarily across the general process, oil & gas, water, power generation and mining industries. Sales are conducted through multiple channels based on local market conditions and demand. A global customer base is served through major manufacturing and after-market service centers around the world. Flow Control, through its valves & controls business, is one of the world’s largest manufacturers of valves, actuators and controls, with leading products, services and solutions to address many of the most challenging flow applications in the general process, oil & gas, power generation and mining industries. Through its thermal management business, Flow Control is a 13-week basis ending onleading provider of complete electric heat management solutions, primarily for the oil & gas, general process and power generation industries. Additionally, Flow Control’s water & environmental systems business is a Saturday.
We believe the Merger combines two complementary leaders in water and fluid solutions, valves and controls and technical solutions, providing us with the ability to achieve operational and tax synergies and increase global revenue. Following the Merger, we are a diversified industrial manufacturing company comprising three reporting segments: Water & Fluid Solutions, Valves & Controls and Technical Solutions. Water & Fluid Solutions designs, manufactures, markets and services innovative water management and fluid processing products and solutions. Valves & Controls designs, manufactures, markets and services valves, fittings, automation and controls and actuators. Technical Solutions designs, manufactures and markets products that guard and protect some of the world’s most sensitive electronics and electronic equipment, as well as heat management solutions designed to provide thermal protection to temperature sensitive fluid applications.
| 2. | Basis of Presentation and Summary of Significant Accounting Policies |
PrinciplesBasis of consolidationpresentation
The accompanying consolidated financial statements include the accounts of Pentair and all subsidiaries, both the U.S. andnon-U.S., that non-U.S, which we control. Intercompany accounts and transactions have been eliminated. Investments in companies of which we own 20% to 50% of the voting stock or have the ability to exercise significant influence over operating and financial policies of the investee are accounted for using the equity method of accounting and as a result, our share of the earnings or losses of such equity affiliates is included in the Consolidated Statements of Income.
The preparation of our consolidated financial statements have been prepared in conformityUnited States dollars (“USD”) and in accordance with accounting principles generally accepted in the United States of America (“GAAP”). Certain information described under Article 663-663h of the Swiss Code of Obligations has been presented in the Company’s Swiss statutory financial statements for the year ended December 31, 2012.
Fiscal year
Our fiscal year ends on December 31. We report our interim quarterly periods on a 13-week basis ending on a Saturday.
Use of estimates
The preparation of our consolidated financial statements in conformity with GAAP requires us to make estimates and assumptions that affect the amounts reported in these consolidated financial statements and accompanying notes. Duenotes of assets and liabilities, disclosures of contingent assets and liabilities at the date of the financial statements, and the reported amounts of revenues and expenses during the reporting period. These estimates include our accounting for valuation of long-lived assets, including goodwill and indefinite lived intangible
65
Pentair Ltd. and Subsidiaries
Notes to consolidated financial statements
assets, percentage of completion revenue recognition, assets acquired and liabilities assumed in acquisitions and the inherent uncertainty involved in making estimates, actualMerger, contingent liabilities, income taxes, and pension and other post-retirement benefits. Actual results reported in future periods may be based upon amounts that could differ from thoseour estimates. The critical accounting policies that require our most significant estimates and judgments include:
Revenue recognition
Generally, we recognize revenue when it is realized or realizable and has been earned. Revenue is recognized when persuasive evidence of an arrangement exists; shipment or delivery has occurred (depending on the terms of the sale); the seller’sour price to the buyer is fixed or determinable; and collectability is reasonably assured.
Generally, there is no post-shipment obligation on product sold other than warranty obligations in the normal and ordinary course of business. In the event significant post-shipment obligations were to exist, revenue recognition would be deferred until substantially all obligations were satisfied.
Percentage of completion
Revenue from certain long-term contracts is recognized over the contractual period under the percentage of completion method of accounting. Under this method, sales and gross profit are recognized as work is performed either based on the relationship between the actual costs incurred and the total estimated costs at completion (“the cost-to-cost method”) or based on efforts for measuring progress towards completion in situations in which this approach is more representative of the progress on the contract than the cost-to-cost method. Changes to the original estimates may be required during the life of the contract and such estimates are reviewed on a regular basis. Sales and gross profit are adjusted using the cumulative catch-up method for revisions in estimated total contract costs. These reviews have not resulted in adjustments that were significant to our results of operations. Estimated losses are recorded when identified. Claims against customers are recognized as revenue upon settlement.
We record costs and earnings in excess of billings on uncompleted contracts withinOther current assetsand billings in excess of costs and earnings on uncompleted contracts withinOther current liabilities in the Consolidated Balance Sheets. Amounts included inOther current assetsrelated to these contracts were $124.4 million and $54.7 million at December 31, 2012 and 2011, respectively. Amounts included inOther current liabilities related to these contracts were $61.1 million and $17.7 million at December 31, 2012 and 2011, respectively.
Sales returns
The right of return may exist explicitly or implicitly with our customers. OurGenerally, our return policy allows for customer returns only upon our authorization. Goods returned must be product we continue to market and must be in salable condition. Returns of custom or modified goods are normally not allowed. At the time of sale, we reduce revenue for the estimated effect of returns. Estimated sales returns include consideration of historical sales levels, the timing and magnitude of historical sales return levels as a percent of sales, type of product, type of customer and a projection of this experience into the future.
Pricing and sales incentives
We record estimated reductions to revenue for customer programs and incentive offerings including pricing arrangements, promotions and other volume-based incentives at the later of the date revenue is recognized or the incentive is offered. Sales incentives given to our customers are recorded as a reduction of revenue unless we (1) receive an identifiable benefit for the goods or services in exchange for the consideration and (2) we
44
66
Pentair Ltd. and Subsidiaries
Notes to consolidated financial statements
The following represents a description of our pricing arrangements, promotions and other volume-based incentives:
Pricing is established up front with our customers and we record sales at theagreed-upon net selling price. However, one of our businesses allows customers to apply for a refund of a percentage of the original purchase price if they can demonstrate sales to a qualifying OEMoriginal equipment manufacturer customer. At the time of sale, we estimate the anticipated refund to be paid based on historical experience and reduce sales for the probable cost of the discount. The cost of these refunds is recorded as a reduction in gross sales.
Our primary promotional activity is what we refer to as cooperative advertising. Under our cooperative advertising programs, we agree to pay the customer a fixed percentage of sales as an allowance that may be used to advertise and promote our products. The customer is generally not required to provide evidence of the advertisement or promotion. We recognize the cost of this cooperative advertising at the time of sale. The cost of this program is recorded as a reduction in gross sales.
Volume-based incentives
Shipping and handling costs
Amounts billed to customers for shipping and handling are recorded inNet salesin the accompanying Consolidated Statements of Income.Operations and Comprehensive Income (Loss). Shipping and handling costs incurred by Pentair for the delivery of goods to customers are included inCost of goods soldin the accompanying Consolidated Statements of Income.
Research and development
We conduct research and development (“R&D”) activities in our own facilities, which consist primarily of the development of new products, product applications and manufacturing processes. We expense R&D costs as incurred. R&D expenditures during 2012, 2011 2010 2009were $93.6 million, $78.2 million and 2008 were $67.2 million, $57.9 million and $62.5 million, respectively.
Cash equivalents
We consider highly liquid investments with original maturities of three months or less to be cash equivalents.
Trade receivables and concentration of credit risk
We record an allowance for doubtful accounts;accounts, reducing our receivables balance to an amount we estimate is collectible from our customers. Estimates used in determining the allowance for doubtful accounts are based on historical collection experience, current trends, aging of accounts receivable, and periodic credit evaluations of our customers’ financial condition.condition, and historical collection experience. We generally do not require collateral. No customer receivable balances exceeded 10% of total net receivable balances as of December 31, 2010. One customer had a receivable balance of approximately 10% of the total net receivable balance as of2012 and December 31, 2009.
45
Inventories
67
Pentair Ltd. and Subsidiaries
Notes to consolidated financial statements
Property, plant and equipment, net
Property, plant and equipment is stated at historical cost. We compute depreciation by the straight-line method based on the following estimated useful lives:
| Years | ||||
Land improvements | 5 to 20 | |||
Buildings and leasehold improvements | 5 to 50 | |||
Machinery and equipment | 3 to 15 | |||
Significant improvements that add to productive capacity or extend the lives of properties are capitalized. Costs for repairs and maintenance are charged to expense as incurred. When property is retired or otherwise disposed of, the recorded cost of the assets and their related accumulated depreciation are removed from the accountsConsolidated Balance Sheets and any related gains or losses are included in income.
We review the recoverability of long-lived assets to be held and used, such as property, plant and equipment, when events or changes in circumstances occur that indicate the carrying value of the asset or asset group may not be recoverable. The assessment of possible impairment is based on our ability to recover the carrying value of the asset or asset group from the expected future pre-tax cash flows (undiscounted and without interest charges) of the related operations. If these cash flows are less than the carrying value of such asset or asset group, an impairment loss is recognized for the difference between estimated fair value and carrying value. Impairment losses on long-lived assets held for sale are determined in a similar manner, except that fair values are reduced for the cost to dispose of the assets. The measurement of impairment requires us to estimate future cash flows and the fair value of long-lived assets.
Goodwill and identifiable intangible assets
Goodwill
Goodwill represents the excess of the cost of acquired businesses over the net of the fair value of identifiable tangible net assets and identifiable intangible assets purchased.
Goodwill is tested at least annually for impairment and is tested for impairment more frequently if events or changes in circumstances indicate that the asset might be impaired. The impairment test is performed using a two-step process. In the first step, the fair value of each reporting unit is compared with the carrying amount of the reporting unit, including goodwill. If the estimated fair value is less than the carrying amount of the reporting unit there is an indication that goodwill impairment exists and a second step must be completed in order to determine the amount of the goodwill impairment, if any that should be recorded. In the second step, an impairment loss is recognized for any excess of the carrying amount of the reporting unit’s goodwill over the implied fair value of that goodwill. The implied fair value of goodwill is determined by allocating the fair value of the reporting unit in a manner similar to a purchase price allocation.
The fair value of each reporting unit is determined using a discounted cash flow analysis and market approach. Projecting discounted future cash flows requires us to make significant estimates regarding future revenues and
46
In developing our discounted cash flow analysis, assumptions about future revenues and expenses, capital expenditures and changes in working capital, are based on our annual operating plan and long-term business plan
68
Pentair Ltd. and Subsidiaries
Notes to consolidated financial statements
for each of our reporting units. These plans take into consideration numerous factors including historical experience, anticipated future economic conditions, changes in raw material prices and growth expectations for the industries and end markets we participate in. These assumptions are determined over a five year long-term planning period. The five year growth rates for revenues and operating profits vary for each reporting unit being evaluated. Revenues and operating profit beyond 20172019 are projected to grow at a 3% perpetual growth rate for all reporting units.
Discount rate assumptions for each reporting unit take into consideration our assessment of risks inherent in the future cash flows of the respective reporting unit and our weighted-average cost of capital. We utilized discount rates ranging from 13%12.0% to 15%13.0% in determining the discounted cash flows in our fair value analysis.
In estimating fair value using the market approach, we identify a group of comparable publicly-traded companies for each operatingreporting segment that are similar in terms of size and product offering. These groups of comparable companies are used to develop multiples based on total market-based invested capital as a multiple of earnings before interest, taxes, depreciation and amortization (EBITDA). We determine our estimated values by applying these comparable EBITDA multiples to the operating results of our reporting units. The ultimate fair value of each reporting unit is determined considering the results of both valuation methods.
Impairment charge
We completed step one of our annual goodwill impairment evaluation during the fourth quarter for 2012 with each reporting unit’s fair value exceeding its carrying value. Accordingly, step two of the impairment analysis was not required for 2012.
For the year ended December 31, 2011, we recorded a pre-tax non-cash impairment charge of $200.5 million in Water & Fluid Solutions as a result of our annual goodwill impairment test. The impairment charge resulted from changes in our forecasts in light of economic conditions and continued softness in the end-markets served by residential water treatment components.
Identifiable intangible assets
Our primary identifiable intangible assets include trade marks andinclude: customer relationships, trade names patents, non-compete agreements,and trademarks, proprietary technology, backlog and customer relationships.patents. Identifiable intangibles with finite lives are amortized and those identifiable intangibles with indefinite lives are not amortized. Identifiable intangible assets that are subject to amortization are evaluated for impairment whenever events or changes in circumstances indicate that the carrying amount may not be recoverable. Identifiable intangible assets not subject to amortization are tested for impairment annually or more frequently if events warrant. During the fourth quarter of 2010 and 2009, weWe completed our annual impairment test during the fourth quarter for those identifiable assets not subject to amortization andamortization. As a result, an impairment charge of $60.7 million was recorded impairment charges in 2009 of $11.3 million,2012, related to trade names. These charges were recorded inSelling, generalImpairment of trade names and administrativegoodwillin our Consolidated Statements of Income.Operations and Comprehensive Income (Loss). There was no impairment charge requiredrecorded in 2010.
The impairment test consists of a comparison of the fair value of the trade name with its carrying value. Fair value is measured using the relief-from-royalty method. This method assumes the trade name has value to the extent that theirthe owner is relieved of the obligation to pay royalties for the benefits received from them. This method requires us to estimate the future revenue for the related brands, the appropriate royalty rate and the weighted average cost of capital. ThisThe non-recurring fair value measurement is a “Level 3” measurement under the fair value hierarchy described below. The impairment charge recorded in 2012 was the result of significant declinesa rebranding strategy implemented in sales volume. These charges were recorded inSelling, general and administrativein our Consolidated Statementsthe fourth quarter of Income.
At December 31, 20102012 our goodwill and intangible assets were approximately $2,519.6$6,804.2 million and represented approximately 63.4%58% of our total assets. If we experience furtherfuture declines in sales and operating profit or do not meet our operating forecasts, we
69
Pentair Ltd. and Subsidiaries
Notes to consolidated financial statements
may be subject to future impairments. Additionally, changes in assumptions regarding the future performance of our businesses, increases in the discount rate used to determine the discounted cash flows of our businesses or significant declines in our stockshare price or the market as a whole could result in additional impairment indicators. Because of the significance of our goodwill and
47
Equity and cost method investments
We have investments that are accounted for using the equity method. Our proportionate share of income or losses from investments accounted for under the equity method is recorded in the Consolidated Statements of Income.Operations and Comprehensive Income (Loss). We write down or write off an investment and recognize a loss when events or circumstances indicate there is impairment in the investment that isother-than-temporary. This requires significant judgment, including assessment of the investees’ financial condition and in certain cases the possibility of subsequent rounds of financing, as well as the investees’ historical and projected results of operations and cash flows. If the actual outcomes for the investees are significantly different from projections, we may incur future charges for the impairment of these investments.
Investments for which we do not have significant influence are accounted for under the cost method. The aggregate balance of these investments was $6.9 million at December 31, 2012 and December 31, 2011.
Income taxes
We use the asset and liability approach to account for income taxes. Under this method, deferred tax assets and liabilities are recognized for the expected future tax consequences of differences between the carrying amounts of assets and liabilities and their respective tax basisbases using enacted tax rates in effect for the year in which the differences are expected to reverse. The effect on deferred tax assets and liabilities of a change in tax rates is recognized in income in the period when the change is enacted. Deferred tax assets are reduced by a valuation allowance when, in the opinion of management, it is more likely than not that some portion or all of the deferred tax assets will not be realized. Changes in valuation allowances from period to period are included in our tax provision in the period of change. We recognize the effect of income tax positions only if those positions are more likely than not of being sustained. Recognized income tax positions are measured at the largest amount that is greater than 50% likely of being realized. Changes in recognition or measurement are reflected in the period in which the change in judgment occurs.
Environmental
We recognize environmentalclean-up liabilities on an undiscounted basis when a loss is probable and can be reasonably estimated. Such liabilities generally are not subject to insurance coverage. The cost of each environmentalclean-up is estimated by engineering, financial and legal specialists based on current law. Such estimates are based primarily upon the estimated cost of investigation and remediation required and the likelihood that, where applicable, other potentially responsible parties (“PRPs”) will be able to fulfill their commitments at the sites where Pentair may be jointly and severally liable. The process of estimating environmentalclean-up liabilities is complex and dependent primarily on the nature and extent of historical information and physical data relating to a contaminated site, the complexity of the site, the uncertainty as to what remedy and technology will be required and the outcome of discussions with regulatory agencies and other PRPs at multi-party sites. In future periods, new laws or regulations, advances inclean-up technologies and additional information about the ultimateclean-up remedy that is used could significantly change our estimates. Accruals for environmental liabilities are included inOther current liabilitiesandOther non-current liabilitiesin the Consolidated Balance Sheets.
48
70
Notes to consolidated financial statements — (continued)
Asbestos Matters
We recognize asbestos-related liabilities on an undiscounted basis when a loss is probable and can be reasonably estimated. Certain of these liabilities are subject to insurance coverage. Our subsidiaries and numerous other companies are named as defendants in personal injury lawsuits based on alleged exposure to asbestos-containing materials. These cases typically involve product liability claims based primarily on allegations of manufacture, sale or distribution of industrial products that either contained asbestos or were attached to or used with asbestos-containing components manufactured by third-parties. The process of estimating asbestos-related liabilities and the corresponding insurance recoveries receivable is complex and dependent primarily on our historical claim experience, estimates of potential future claims, our legal strategy for resolving these claims, the availability of insurance coverage, and the solvency and creditworthiness of insurers. Accruals for asbestos-related liabilities are included inOther non-current liabilitiesand the estimated receivable for insurance recoveries are recorded inOther non-current assetsin the Consolidated Balance Sheets.
Insurance subsidiary
We insure certain general and product liability, property, workers’ compensation and automobile liability risks through our regulated wholly-owned captive insurance subsidiary, Penwald Insurance Company (“Penwald”). Reserves for policy claims are established based on actuarial projections of ultimate losses. As of December 31, 20102012 and 2009,2011, reserves for policy claims were $49.0$42.9 million ($12.013.3 million included inAccrued product claims and warrantiesOther current liabilitiesand $37.0$29.6 million included inOther non-current liabilities) and $56.3$44.3 million ($10.013.3 million included inAccrued product claims and warrantiesOther current liabilitiesand $46.3$31.0 million included inOther non-current liabilities), respectively.
Stock-based compensation
We account for stock-basedshare-based compensation awards on a fair value basis. The estimated grant date fair value of each option award is recognized in income on an accelerated basis over the requisite service period (generally the vesting period). The estimated fair value of each option award is calculated using the Black-Scholes option-pricing model. From time to time, we have elected to modify the terms of the original grant. These modified grants are accounted for as a new award and measured using the fair value method, resulting in the inclusion of additional compensation expense in our Consolidated Statements of Income.Operations and Comprehensive Income (Loss). Restricted share awards and units are recorded as compensation cost on a straight-line basis over the requisite service periods based on the market value on the date of grant.
Earnings (loss) per common share
Basic earnings (loss) per share are computed by dividing net income (loss) attributable to Pentair Ltd. by the weighted-average number of common shares outstanding. Diluted earnings (loss) per share are computed by dividing net income (loss) attributable to Pentair Ltd. by the weighted-average number of common shares outstanding including the dilutive effects of common stockshare equivalents. The dilutive effects of stock options and restricted stock awards and units increased weighted average common shares outstanding by 1,257 thousand, 1,107 thousand and 1,181 thousand in 2010, 2009 and 2008, respectively.
Derivative financial instruments
We recognize all derivatives, including those embedded in other contracts, as either assets or liabilities at fair value in our Consolidated Balance Sheets. If the derivative is designated as a fair-value hedge, the changes in the fair value of the derivative and the hedged item are recognized in earnings. If the derivative is designated and is effective as a cash-flow hedge, changes in the fair value of the derivative are recorded inAccumulated other comprehensive income (loss)(“OCI”AOCI”) as a separate component of equity in the Consolidated Balance Sheets and are recognized in the Consolidated Statements of Operations and Comprehensive Income (Loss) when the hedged item affects earnings. If the underlying hedged transaction ceases to exist or if the hedge becomes ineffective, all changes in fair value of the related derivatives that have not been settled are recognized in current earnings. For a derivative that is not designated as or does not qualify as a hedge, changes in fair value are reported in earnings immediately.
We use derivative instruments for the purpose of hedging interest rate and currency exposures, which exist as part of ongoing business operations. We do not hold or issue derivative financial instruments for trading or
71
Pentair Ltd. and Subsidiaries
Notes to consolidated financial statements
speculative purposes. All other contracts that contain provisions meeting the definition of a derivative also meet the requirements of and have been designated as, normal purchases or sales. Our policy is not to enter into contracts with terms that cannot be designated as normal purchases or sales. From time to time, we may enter in to short duration foreign currency contracts to hedge foreign currency risks on intercompany transactions.
49
Fair value is defined as the price that would be received to sell an asset or paid to transfer a liability in an orderly transaction between market participants at the measurement date. Assets and liabilities measured at fair value are classified using the following hierarchy, which is based upon the transparency of inputs to the valuation as of the measurement date:
Level 1: Valuation is based on observable inputs such as quoted market prices (unadjusted) for identical assets or liabilities in active markets.
Level 2: Valuation is based on inputs such as quoted market prices for similar assets or liabilities in active markets or other inputs that are observable for the asset or liability, either directly or indirectly, for substantially the full term of the financial instrument.
Level 3: Valuation is based upon other unobservable inputs that are significant to the fair value measurement.
In making fair value measurements, observable market data must be used when available. When inputs used to measure fair value fall within different levels of the hierarchy, the level within which the fair value measurement is categorized is based on the lowest level input that is significant to the fair value measurement.
Foreign currency translation
The financial statements of subsidiaries located outside of the U.S. are measured using the local currency as the functional currency.currency, except for certain corporate entities outside of the U.S. which are measured using USD. Assets and liabilities of these subsidiaries are translated at the rates of exchange at the balance sheet date. Income and expense items are translated at average monthly rates of exchange. The resultant translation adjustments are included inAccumulated other comprehensive income (loss)(“AOCI”), AOCI, a separate component of shareholders’ equity.
Discontinued Operations
In 2010, we were notified of a product recall required by our former Tools Group (which was sold to Black and Decker Corporation in 2004 and treated as a discontinued operation). Under the terms of the sale agreement we are liable for a portion of the product recall costs. We recorded a liability of $3.2 million ($2.0 million net of tax) in 2010 representing our estimate of the potential cost for products sold prior to the date of sale of the Tools Group associated with this recall. In addition, we received the remaining escrow balances from our sale of Lincoln Industrial of $0.5 million, and we reversed tax reserves of $1.0 million due to the expiration of various statues of limitations.
New accounting standards
In May 2011, the Financial Accounting Standards Board (“FASB”) issued authoritative guidance to improve the consistency of fair value measurement and disclosure requirements between GAAP and International Financial Reporting Standards. The provisions of this guidance change certain of the fair value principles related to the highest and best use premise, the consideration of blockage factors and other premiums and discounts, and the measurement of financial instruments held in a portfolio and instruments classified within equity. Further, the guidance provides additional disclosure requirements surrounding Level 3 fair value measurements, the uses of nonfinancial assets in certain circumstances and identification of the level in the fair value hierarchy used for
72
Pentair Ltd. and Subsidiaries
Notes to consolidated financial statements
assets and liabilities which are not recorded at fair value, but where fair value is disclosed. This guidance was effective for fiscal years and interim periods beginning after December 15, 2011. The adoption of this guidance did not have a material impact on our financial condition or results of operations.
In June 2011, the FASB issued authoritative guidance surrounding the presentation of comprehensive income, with an objective of increasing the prominence of items reported in Other Comprehensive Income (“OCI”). This guidance provides entities with the option to present the total of comprehensive income, the components of net income and the components of OCI in either a single continuous statement of comprehensive income or in two separate but consecutive statements. This guidance, other than certain provisions pertaining to the reclassification of items out of OCI that were deferred, was effective for fiscal years and interim periods beginning after December 15, 2011. We adopted this guidance as of January 1, 2009, we adopted new2012, and have presented total comprehensive income (loss) in our Consolidated Statements of Operations and Comprehensive Income (Loss).
In September 2011, the FASB issued an amendment to an existing accounting guidance that changesstandard, which provides entities an option to perform a qualitative assessment to determine whether further impairment testing on goodwill is necessary. Specifically, an entity has the accounting and reporting for minority interests. Minority interests have been recharacterized as noncontrolling interests and are reportedoption to first assess qualitative factors to determine whether it is necessary to perform the current two-step test. If an entity believes, as a componentresult of equity separateits qualitative assessment, that it is more-likely-than-not that the fair value of a reporting unit is less than its carrying amount, the quantitative impairment test is required. Otherwise, no further testing is required. The adoption of this guidance did not impact our financial condition or results of operations.
In September 2011, the FASB issued authoritative guidance which expanded and enhanced the existing disclosure requirements related to multi-employer pension and other postretirement benefit plans. The amendments require additional quantitative and qualitative disclosures to provide more detailed information regarding these plans including: the significant multi-employer plans in which we participate, the level of our participation and contributions with respect to such plans, the financial health of such plans and an indication of funded status. These disclosures are intended to provide users of financial statements with a better understanding of the employer’s involvement in multi-employer benefit plans. The disclosure provisions of the guidance were adopted concurrent with the pension disclosures associated with our annual valuation process during the fourth quarter of 2012. We concluded that our participation in any individual multi-employer plan was not significant.
In July 2012, the FASB issued an amendment to an existing accounting standard, which provides entities an option to perform a qualitative assessment to determine whether further impairment testing on indefinite-lived intangible assets is necessary. Specifically, an entity has the option to first assess qualitative factors to determine whether it is necessary to perform a quantitative impairment test. If an entity believes, as a result of its qualitative assessment, that it is more-likely-than-not that the fair value of an indefinite-lived intangible asset is less than its carrying amount, the quantitative impairment test is required. Otherwise, no further testing is required. This guidance is effective for annual and interim indefinite-lived intangible asset impairment tests performed for fiscal years beginning after September 15, 2012, and early adoption is permitted. We believe that the adoption of this guidance will not have a material impact on our financial condition or results of operations.
In February 2013, the FASB issued authoritative guidance surrounding the presentation of items reclassified from OCI to net income. This guidance requires entities to disclose, either in the parent’s equity. Purchases or sales of equity interests that do not result in a change in control will be accounted for as equity transactions. In addition, net income attributablenotes to the noncontrolling interest will be included in consolidated net incomefinancial statements or parenthetically on the face of the Consolidated Income Statementsstatement that reports comprehensive income, items reclassified out of AOCI and uponinto net income in their entirety and the effect of the reclassification on each affected net income line item. In addition, for AOCI reclassification items that are not reclassified in their entirety into net income, a loss of control, the interest sold, as well as any interest retained, will be recorded at fair value with any gain or loss recognized in earnings. We have classified noncontrolling interest (previously minority interest) as a component of equity for all periods presented.
73
Pentair Ltd. and Subsidiaries
Notes to consolidated financial statements
| 3. | Change in Accounting Principle |
During the fourth quarter of 2012, we changed our method of recognizing actuarial gains and losses for all of our pension and other post-retirement plans. Historically, we recognized actuarial gains and losses as a component of AOCI in our Consolidated Balance Sheets and amortized them into our Consolidated Statements of Operations and Comprehensive Income (Loss) over the average future service period of the active employees of these plans to the extent such gains and losses were outside of a corridor. We elected to immediately recognize actuarial gains and losses in our Consolidated Statements of Operations and Comprehensive Income (Loss) on the basis that it is preferable to accelerate the recognition of such gains and losses into income rather than to delay such recognition. Additionally, for purposes of calculating the expected return on plan assets, we will no longer use a calculated value for the market-related valuation of plan assets, but instead will use the actual fair value of our plan assets. These changes will improve transparency in our operating results by more quickly recognizing the effects of external conditions on our plan obligations, investments and assumptions. We applied these changes retrospectively to all periods presented. The cumulative effect of the change on retained earnings as of January 1, 2010 whichwas a reduction of $58.9 million, with an offset to AOCI. The annual recognition of actuarial losses totaled $146.6 million, $65.7 million and $13.6 million for the years ended December 31, 2012, 2011 and 2010, respectively. This change did not have an impact on cash provided by operating activities for any effect onperiod presented.
The following table presents our consolidated financial statements.
| In thousands, except per-share data | Computed under previous method | Recognized under new method | Effect of Change | |||||||||
As of and for the year ended December 31, 2012 | ||||||||||||
Statement of Operations and Comprehensive Income (Loss) | ||||||||||||
Selling, general and administrative | $ | 1,016,698 | $ | 1,158,436 | $ | 141,738 | ||||||
Provision (benefit) for income taxes | (24,076 | ) | (79,353 | ) | (55,277 | ) | ||||||
Income (loss) from continuing operations | (18,151 | ) | (104,612 | ) | (86,461 | ) | ||||||
Net income (loss) attributable to Pentair Ltd. | (20,725 | ) | (107,186 | ) | (86,461 | ) | ||||||
| Amortization of pension and other post-retirement prior service cost and transition obligation | (86,714 | ) | (253 | ) | 86,461 | |||||||
Basic earnings (loss) per share attributable to Pentair Ltd. | $ | (0.16 | ) | $ | (0.84 | ) | $ | (0.68 | ) | |||
Diluted earnings (loss) per share attributable to Pentair Ltd. | (0.16 | ) | (0.84 | ) | (0.68 | ) | ||||||
Balance Sheet | ||||||||||||
Retained earnings | $ | 1,492,258 | $ | 1,292,288 | $ | (199,970 | ) | |||||
Accumulated other comprehensive income (loss) | (207,168 | ) | (7,198 | ) | 199,970 | |||||||
Statement of Cash Flows | ||||||||||||
Net income (loss) before noncontrolling interest | $ | (18,151 | ) | $ | (104,612 | ) | $ | (86,461 | ) | |||
Pension and other post-retirement expense | 25,798 | 167,536 | 141,738 | |||||||||
Other current liabilities | 82,455 | 27,178 | (55,277 | ) | ||||||||
74
Pentair Ltd. and disclosure through the date of this filing.
50
| Previously Reported | Adjusted | Effect of Change | ||||||||||
As of and for the year ended December 31, 2011 | ||||||||||||
Statement of Operations and Comprehensive Income (Loss) | ||||||||||||
Selling, general and administrative | $ | 626,527 | $ | 694,841 | $ | 68,314 | ||||||
Provision for income taxes | 73,059 | 46,417 | (26,642 | ) | ||||||||
Income (loss) from continuing operations | 38,521 | (3,151 | ) | (41,672 | ) | |||||||
Net income (loss) attributable to Pentair Ltd. | 34,222 | (7,450 | ) | (41,672 | ) | |||||||
| Amortization of pension and other post-retirement prior service cost and transition obligation | (41,683 | ) | (11 | ) | 41,672 | |||||||
Basic earnings (loss) per share attributable to Pentair Ltd. | $ | 0.35 | $ | (0.08 | ) | $ | (0.43 | ) | ||||
Diluted earnings (loss) per share attributable to Pentair Ltd. | 0.34 | (0.08 | ) | (0.42 | ) | |||||||
Balance Sheet | ||||||||||||
Retained earnings | $ | 1,579,290 | $ | 1,465,780 | $ | (113,510 | ) | |||||
Accumulated other comprehensive income (loss) | (151,241 | ) | (37,731 | ) | 113,510 | |||||||
Statement of Cash Flows | ||||||||||||
Net income (loss) before noncontrolling interest | $ | 38,521 | $ | (3,151 | ) | $ | (41,672 | ) | ||||
Pension and other post-retirement expense | 16,031 | 84,345 | 68,314 | |||||||||
Other current liabilities | 18,688 | (7,954 | ) | (26,642 | ) | |||||||
| Previously Reported | Adjusted | Effect of Change | ||||||||||
For the year ended December 31, 2010 | ||||||||||||
Statement of Operations and Comprehensive Income (Loss) | ||||||||||||
Selling, general and administrative | $ | 529,329 | $ | 550,501 | $ | 21,172 | ||||||
Provision for income taxes | 97,200 | 88,943 | (8,257 | ) | ||||||||
Income from continuing operations | 202,947 | 190,032 | (12,915 | ) | ||||||||
Net income attributable to Pentair Ltd. | 197,828 | 184,913 | (12,915 | ) | ||||||||
| Amortization of pension and other post-retirement prior service cost and transition obligation | (12,762 | ) | 153 | 12,915 | ||||||||
Basic earnings per share attributable to Pentair Ltd. | $ | 2.01 | $ | 1.88 | $ | (0.13 | ) | |||||
Diluted earnings per share attributable to Pentair Ltd. | 1.99 | 1.86 | (0.13 | ) | ||||||||
Statement of Cash Flows | ||||||||||||
Net income (loss) before noncontrolling interest | $ | 202,321 | $ | 189,406 | $ | (12,915 | ) | |||||
Pension and other post-retirement expense | 12,926 | 34,098 | 21,172 | |||||||||
Other current liabilities | 7,462 | (795 | ) | (8,257 | ) | |||||||
75
Pentair Ltd. and Subsidiaries
Notes to consolidated financial statements
| 4. | Other Acquisitions |
Other material acquisitions
In May 2011, we acquired, as part of Water & Fluid Solutions, the Clean Process Technologies (“CPT”) division of privately held Norit Holding B.V. for $715.3 million (€502.7 million translated at the May 12, 2011 exchange rate). CPT’s results of operations have been included in our global water softener and residential water filtration business. The acquisition was effected throughconsolidated financial statements since the formationdate of two new entities (collectively, “Pentair Residential Filtration” or “PRF”), a U.S. entity and an international entity, into which we and GE contributed certain assets, properties, liabilities and operations representing our respective global water softener and residential water filtration businesses. We are an 80.1 percent owner of PRF and GEacquisition. CPT is a 19.9 percent owner. The fair value of the acquisition was $229.2 million, which includes approximately $3.3 million of acquisition related costs. The acquisitionglobal leader in membrane solutions and related sale of our 19.9 percent interest resulted in a gain of $109.6 million ($85.8 million after tax), representing the difference between the carrying amount and the fair value of the 19.9 percent interest sold.
The fair value of the business acquired was allocated to the assets acquired and liabilities assumed based on their estimated fair values. The excess of the fair value acquired over the identifiable assets acquired and liabilities assumed is reflected as goodwill. Goodwill recorded as part of the purchase price allocation was approximately $137.9$451.8 million, none of which is tax deductible. Identifiable intangible assets acquired as part of the acquisition were $66.5$197.2 million, including definite-lived intangibles, such as customer relationships and proprietary technology and trade names with a weighted average amortization period of approximately 1510 years.
Pro forma results of material acquisitions
The following unaudited pro forma consolidated condensed financial results of operations for the year ended December 31, 2008 isare presented as if the Merger described in Note 1 and the CPT acquisition had beendescribed above were completed at the beginning of the comparable annual reporting period presented:
| In thousands, except share and per-share data | ||||
| Pro forma net sales from continuing operations | $ | 3,406,449 | ||
| Pro forma net income from continuing operations | 256,363 | |||
| Pro forma net income | 228,734 | |||
Pro forma earnings per common share — continuing operations | ||||
| Basic | $ | 2.62 | ||
| Diluted | $ | 2.59 | ||
Weighted average common shares outstanding | ||||
| Basic | 97,887 | |||
| Diluted | 99,068 | |||
| Years ended December 31 | ||||||||
| In thousands, except per-share data | 2012 | 2011 | ||||||
Pro forma net sales | $ | 7,409,917 | $ | 7,326,432 | ||||
Pro forma net income (loss) from continuing operations attributable to Pentair Ltd. | 157,471 | (47,373 | ) | |||||
Diluted earnings (loss) per common share attributable to Pentair Ltd. | 0.75 | (0.23 | ) | |||||
The 2011 unaudited pro forma net income includes the impact of $262.0 million in non-recurring items related to acquisition date fair value adjustments to inventory and customer backlog, $21.8 million of change of control costs and $8.7 million of transaction costs associated with the Merger. The 2011 unaudited pro forma net income excludes the impact of $12.9 million in non-recurring items related to acquisition date fair value adjustments to inventory and customer backlog and $8.0 million, respectively, of transaction costs associated with the CPT acquisition.
The 2012 unaudited pro forma net income excludes the impact $57.3 million of transaction related costs, $21.8 million of change of control costs and $178.1 million of non-recurring items related to acquisition date fair value adjustments to inventory and customer backlog associated with the Merger.
The pro forma consolidated condensed financial results have beeninformation was prepared for comparative purposes only and includeincludes certain adjustments.adjustments, as noted above. The adjustments are estimates based on currently available information and actual amounts may have differed materially from these estimates. They do not reflect the effect of costs or synergies that would have been expected to result from the integration of this acquisition.the acquisitions. The pro forma
76
Pentair Ltd. and Subsidiaries
Notes to consolidated financial statements
information does not purport to be indicative of the results of operations that actually would have resulted had the combinationcombinations occurred on January 1,at the beginning of each period presented or of future results of the consolidated entities.
51Other acquisitions
On October 4, 2012, we acquired, as part of Valves & Controls, the remaining 25% equity interest in Pentair Middle East Holding S.a.R.L. (“KEF”), a privately held company, for $100 million in cash. Prior to the acquisition, we held a 75% equity interest in KEF, a vertically integrated valve manufacturer in the Middle East. There was no pro forma impact from this acquisition as the results of KEF were consolidated into Flow Control’s financial statements prior to acquiring the remaining 25% interest in KEF.
Additionally, during 2012, we completed other small acquisitions as part of Water & Fluid Solutions with purchase prices totaling $121.2 million in cash, net of cash acquired. Total goodwill recorded as part of the purchase price allocations was $80.9 million, none of which is tax deductible. During 2011, we completed other small acquisitions as part of Water & Fluid Solutions with purchase prices totaling $21.6 million, consisting of $17.8 million in cash and $3.8 million as notes payable. Total goodwill recorded as part of the purchase price allocations was $14.4 million, none of which is tax deductible. The pro forma impact of these acquisitions was not material.
Total transaction costs related to acquisition activities for the year ended December 31, 2012 and December 31, 2011 were $57.3 million and $8.2 million, respectively, and were expensed as incurred and recorded inSelling, general and administrative in our Consolidated Statements of Operations and Comprehensive Income (Loss).
| 5. | Earnings (Loss) Per Share |
Basic and diluted earnings (loss) per share were calculated as follows:
| Years ended December 31 | ||||||||||||
| In thousands, except per share data | 2012 | 2011 | 2010 | |||||||||
Net income (loss) attributable to Pentair Ltd. | $ | (107,186 | ) | $ | (7,450 | ) | $ | 184,913 | ||||
| ||||||||||||
Net income (loss) from continuing operations attributable to Pentair Ltd. | $ | (107,186 | ) | $ | (7,450 | ) | $ | 185,539 | ||||
| ||||||||||||
Weighted average common shares outstanding | ||||||||||||
Basic | 127,368 | 98,233 | 98,037 | |||||||||
Dilutive impact of stock options and restricted stock awards(1) | — | — | 1,257 | |||||||||
| ||||||||||||
Diluted | 127,368 | 98,233 | 99,294 | |||||||||
| ||||||||||||
Earnings (loss) per common share attributable to Pentair Ltd. | ||||||||||||
Basic | ||||||||||||
Continuing operations | $ | (0.84 | ) | $ | (0.08 | ) | $ | 1.89 | ||||
Discontinued operations | — | — | (0.01 | ) | ||||||||
| ||||||||||||
Basic earnings (loss) per common share | $ | (0.84 | ) | $ | (0.08 | ) | $ | 1.88 | ||||
| ||||||||||||
Diluted | ||||||||||||
Continuing operations | $ | (0.84 | ) | $ | (0.08 | ) | $ | 1.87 | ||||
Discontinued operations | — | — | (0.01 | ) | ||||||||
| ||||||||||||
Diluted earnings (loss) per common share | $ | (0.84 | ) | $ | (0.08 | ) | $ | 1.86 | ||||
| ||||||||||||
Anti-dilutive stock options and restricted stock awards(2) | 16,007 | 8,357 | 3,711 | |||||||||
| ||||||||||||
77
Notes to consolidated financial statements — (continued)
| (1) | The incremental share impact from stock options and restricted stock awards was computed using the treasury stock method. |
| (2) | Stock options and restricted stock awards that were not dilutive were excluded from our calculation of diluted weighted average shares. |
| 6. | Restructuring |
During 2012 and Decker Corporation in 2004 and treated as a discontinued operation). Under the terms of the sale agreement2011, we are liable for a portion of the product recall costs for products sold prior to the date of sale of the Tools Group. We recorded a liability of $3.2 million ($2.0 million net of tax) in 2010 representing our estimate of the potential cost associated with this recall. In addition, we received the remaining escrow balances from our sale of Lincoln Industrial of approximately $0.5 million, and we reversed tax reserves of approximately $1.0 million due to the expiration of various statues of limitations.
| In thousands | 2010 | 2009 | 2008 | |||||||||
| Net Sales | $ | — | $ | — | $ | 43,346 | ||||||
| Loss from discontinued operations before income taxes | — | — | (9,392 | ) | ||||||||
| Income tax benefit on operations | — | — | 3,609 | |||||||||
| Loss from discontinued operations, net of tax | — | — | (5,783 | ) | ||||||||
| Gain (loss) on disposal of discontinued operations, before taxes | (2,743 | ) | 221 | (28,692 | ) | |||||||
| Income tax (expense) benefit on (loss) | 2,117 | (240 | ) | 6,846 | ||||||||
| Loss on disposal of discontinued operations, net of tax | $ | (626 | ) | $ | (19 | ) | $ | (21,846 | ) | |||
Restructuring related costs included inSelling, general and administrativeexpenses onin the Consolidated Statements of Operations and Comprehensive Income include(Loss) included costs for severance and related benefits, asset impairment charges and other restructuring costs as follows:
| Years Ended December 31 | ||||||||
| In thousands | 2009 | 2008 | ||||||
| Severance and related costs | $ | 11,160 | $ | 34,615 | ||||
| Asset impairment | 4,050 | 5,282 | ||||||
| Contract termination costs | 2,030 | 5,309 | ||||||
| Total restructuring costs | $ | 17,240 | $ | 45,206 | ||||
52
| Years ended December 31 | ||||||||||||
| In thousands | 2012 | 2011 | 2010 | |||||||||
Severance and related costs | $ | 61,560 | $ | 11,500 | $ | — | ||||||
Other | 5,340 | 1,500 | — | |||||||||
| ||||||||||||
Total restructuring costs | $ | 66,900 | $ | 13,000 | $ | — | ||||||
| ||||||||||||
We assumed $17.1 million of restructuring accruals from actions initiated by Flow Control prior to the Merger relating to employee severance, facility exit and other restructuring costs. Activity in the restructuring accrual activity recorded oninOther current liabilitiesandEmployee compensation and benefitsin the Consolidated Balance Sheets is summarized as follows:
| Years Ended December 31 | ||||||||
| In thousands | 2010 | 2009 | ||||||
| Beginning balance | $ | 14,509 | $ | 34,174 | ||||
| Costs incurred | — | 13,190 | ||||||
| Cash payments and other | (10,515 | ) | (32,855 | ) | ||||
| Ending balance | $ | 3,994 | $ | 14,509 | ||||
| Years ended December 31 | ||||||||
| In thousands | 2012 | 2011 | ||||||
Beginning balance | $ | 12,805 | $ | 3,994 | ||||
Acquired | 17,062 | — | ||||||
Costs incurred | 61,560 | 11,500 | ||||||
Cash payments and other | (34,868 | ) | (2,689 | ) | ||||
| ||||||||
Ending balance | $ | 56,559 | $ | 12,805 | ||||
| ||||||||
78
Pentair Ltd. and Subsidiaries
Notes to consolidated financial statements
| 7. | |
| Goodwill and Other Identifiable Intangible Assets |
The changes in the carrying amount of goodwill for the year ended December 31, 20102012 and December 31, 20092011 by reportable segment were as follows:
| Acquisitions/ | Foreign Currency | |||||||||||||||
| In thousands | December 31, 2009 | Divestitures | Translation/Other | December 31, 2010 | ||||||||||||
| Water Group | $ | 1,802,913 | $ | — | $ | (18,813 | ) | $ | 1,784,100 | |||||||
| Technical Products Group | 285,884 | — | (3,940 | ) | 281,944 | |||||||||||
| Consolidated Total | $ | 2,088,797 | $ | — | $ | (22,753 | ) | $ | 2,066,044 | |||||||
| Acquisitions/ | Foreign Currency | |||||||||||||||
| In thousands | December 31, 2008 | Divestitures | Translation/Other | December 31, 2009 | ||||||||||||
| Water Group | $ | 1,818,470 | $ | 895 | $ | (16,452 | ) | $ | 1,802,913 | |||||||
| Technical Products Group | 283,381 | — | 2,503 | 285,884 | ||||||||||||
| Consolidated Total | $ | 2,101,851 | $ | 895 | $ | (13,949 | ) | $ | 2,088,797 | |||||||
| In thousands | December 31, 2011 | Acquisitions | Foreign currency translation/other | December 31, 2012 | ||||||||||||
Water & Fluid Solutions | $ | 1,994,781 | $ | 402,254 | $ | 18,684 | $ | 2,415,719 | ||||||||
Valves & Controls | — | 1,342,621 | — | 1,342,621 | ||||||||||||
Technical Solutions | 279,137 | 856,111 | 924 | 1,136,172 | ||||||||||||
| ||||||||||||||||
Total goodwill | $ | 2,273,918 | $ | 2,600,986 | $ | 19,608 | $ | 4,894,512 | ||||||||
| ||||||||||||||||
| In thousands | December 31, 2010 | Acquisitions | Foreign currency translation/other | December 31, 2011 | ||||||||||||
Water & Fluid Solutions | $ | 1,784,100 | $ | 466,182 | $ | (255,501 | ) | $ | 1,994,781 | |||||||
Valves & Controls | — | — | — | — | ||||||||||||
Technical Solutions | 281,944 | — | (2,807 | ) | 279,137 | |||||||||||
| ||||||||||||||||
Total goodwill | $ | 2,066,044 | $ | 466,182 | $ | (258,308 | ) | $ | 2,273,918 | |||||||
| ||||||||||||||||
In 2011, we recorded an impairment charge of $200.5 million in Water & Fluid Solutions which is included in “Foreign Currency Translation/Other” in 2009 is the effectcurrency translation/other” above. Accumulated goodwill impairment losses were $200.5 million as of an immaterial error corrected in 2009 related to the previous accounting treatment for certain acquisitions. The correction resulted in a decrease in goodwillDecember 31, 2012 and a decrease of deferred tax liabilities of $28.5 million ($27.5 million in the Water Group and $1.0 million in the Technical Products Group).
53
| 2010 | 2009 | |||||||||||||||||||||||
| Gross | Gross | |||||||||||||||||||||||
| Carrying | Accumulated | Carrying | Accumulated | |||||||||||||||||||||
| In thousands | Amount | Amortization | Net | Amount | Amortization | Net | ||||||||||||||||||
Finite-life intangibles | ||||||||||||||||||||||||
| Patents | $ | 15,469 | $ | (12,695 | ) | $ | 2,774 | $ | 15,458 | $ | (11,502 | ) | $ | 3,956 | ||||||||||
| Non-compete agreements | — | — | — | 4,522 | (4,522 | ) | — | |||||||||||||||||
| Proprietary technology | 74,176 | (29,862 | ) | 44,314 | 73,244 | (23,855 | ) | 49,389 | ||||||||||||||||
| Customer relationships | 282,479 | (82,901 | ) | 199,578 | 288,122 | (66,091 | ) | 222,031 | ||||||||||||||||
| Trade names | 1,532 | (383 | ) | 1,149 | 1,562 | (235 | ) | 1,327 | ||||||||||||||||
| Total finite-life intangibles | $ | 373,656 | $ | (125,841 | ) | $ | 247,815 | $ | 382,908 | $ | (106,205 | ) | $ | 276,703 | ||||||||||
Indefinite-life intangibles | ||||||||||||||||||||||||
| Trade names | 205,755 | — | 205,755 | 209,704 | — | 209,704 | ||||||||||||||||||
| Total intangibles, net | $ | 579,411 | $ | (125,841 | ) | $ | 453,570 | $ | 592,612 | $ | (106,205 | ) | $ | 486,407 | ||||||||||
| 2012 | 2011 | |||||||||||||||||||||||
| In thousands | Cost | Accumulated amortization | Net | Cost | Accumulated amortization | Net | ||||||||||||||||||
Finite-life intangibles | ||||||||||||||||||||||||
Customer relationships | $ | 1,276,793 | $ | (152,769 | ) | $ | 1,124,024 | $ | 358,410 | $ | (109,887 | ) | $ | 248,523 | ||||||||||
Trade names | 1,525 | (686 | ) | 839 | 1,515 | (530 | ) | 985 | ||||||||||||||||
Proprietary technology | 263,647 | (57,711 | ) | 205,936 | 134,737 | (43,994 | ) | 90,743 | ||||||||||||||||
Backlog | 41,240 | (18,278 | ) | 22,962 | — | — | — | |||||||||||||||||
| ||||||||||||||||||||||||
| Total finite-life intangibles | 1,583,205 | (229,444 | ) | 1,353,761 | 494,662 | (154,411 | ) | 340,251 | ||||||||||||||||
| Indefinite-life intangibles | ||||||||||||||||||||||||
Trade names | 555,895 | — | 555,895 | 252,034 | — | 252,034 | ||||||||||||||||||
| ||||||||||||||||||||||||
Total intangibles, net | $ | 2,139,100 | $ | (229,444 | ) | $ | 1,909,656 | $ | 746,696 | $ | (154,411 | ) | $ | 592,285 | ||||||||||
| ||||||||||||||||||||||||
Identifiable intangible asset amortization expense in 2012, 2011 and 2010 2009was $76.0 million, $41.9 million and 2008 was approximately $24.5 million, $27.3 million and $24.0 million, respectively.
In 20092012 we recorded an impairment charge to write downfor trade name intangible assets of $11.3$49.1 million and $11.6 million in the Water Group. Additionally, in 2008 we recorded an impairment charge to write-off a trade name intangible asset of $1.0 million in the& Fluid Solutions and Technical Products Group.
Estimated future amortization expense for identifiable intangible assets during the next five years is as follows:
| In thousands | 2011 | 2012 | 2013 | 2014 | 2015 | |||||||||||||||
| Estimated amortization expense | $ | 25,140 | $ | 24,405 | $ | 23,956 | $ | 23,631 | $ | 23,333 | ||||||||||
| In thousands | 2013 | 2014 | 2015 | 2016 | 2017 | |||||||||||||||
Estimated amortization expense | $ | 135,308 | $ | 113,848 | $ | 113,559 | $ | 112,770 | $ | 111,625 | ||||||||||
79
Pentair Ltd. and Subsidiaries
Notes to consolidated financial statements
| 8. | |
| Supplemental Balance Sheet Information |
| In thousands | 2010 | 2009 | ||||||
Inventories | ||||||||
| Raw materials and supplies | $ | 223,482 | $ | 200,931 | ||||
| Work-in-process | 37,748 | 38,338 | ||||||
| Finished goods | 144,126 | 121,358 | ||||||
| Total inventories | $ | 405,356 | $ | 360,627 | ||||
Property, plant and equipment | ||||||||
| Land and land improvements | $ | 36,484 | $ | 36,635 | ||||
| Buildings and leasehold improvements | 212,168 | 213,453 | ||||||
| Machinery and equipment | 598,554 | 586,764 | ||||||
| Construction in progress | 33,841 | 28,408 | ||||||
| Total property, plant and equipment | 881,047 | 865,260 | ||||||
| Less accumulated depreciation and amortization | 551,612 | 531,572 | ||||||
| Property, plant and equipment, net | $ | 329,435 | $ | 333,688 | ||||
54
| December 31 | ||||||||
| In thousands | 2012 | 2011 | ||||||
Inventories | ||||||||
Raw materials and supplies | $ | 615,809 | $ | 219,487 | ||||
Work-in-process | 207,794 | 47,707 | ||||||
Finished goods | 556,668 | 182,669 | ||||||
| ||||||||
Total inventories | $ | 1,380,271 | $ | 449,863 | ||||
| ||||||||
Other current assets | ||||||||
Cost in excess of billings | $ | 124,447 | $ | 54,701 | ||||
Prepaid expenses | 94,950 | 42,831 | ||||||
Deferred income taxes | 68,277 | 60,899 | ||||||
Other current assets | 38,434 | 10,260 | ||||||
| ||||||||
Total other current assets | $ | 326,108 | $ | 168,691 | ||||
| ||||||||
Property, plant and equipment, net | ||||||||
Land and land improvements | $ | 247,868 | $ | 41,111 | ||||
Buildings and leasehold improvements | 482,106 | 244,246 | ||||||
Machinery and equipment | 1,096,469 | 692,930 | ||||||
Construction in progress | 114,309 | 40,251 | ||||||
| ||||||||
Total property, plant and equipment | 1,940,752 | 1,018,538 | ||||||
Accumulated depreciation and amortization | 716,264 | 631,013 | ||||||
| ||||||||
Total property, plant and equipment, net | $ | 1,224,488 | $ | 387,525 | ||||
| ||||||||
Other non-current assets | ||||||||
Asbestos-related insurance receivable | $ | 157,394 | $ | — | ||||
Deferred income taxes | 89,040 | — | ||||||
Other non-current assets | 259,853 | 94,750 | ||||||
| ||||||||
Total other non-current assets | $ | 506,287 | $ | 94,750 | ||||
| ||||||||
Other current liabilities | ||||||||
Deferred revenue and customer deposits | $ | 127,149 | $ | 10,151 | ||||
Dividends payable | 94,967 | — | ||||||
Billings in excess of cost | 61,126 | 17,732 | ||||||
Accrued warranty | 53,696 | 29,355 | ||||||
Other current liabilities | 333,224 | 166,470 | ||||||
| ||||||||
Total other current liabilities | $ | 670,162 | $ | 223,708 | ||||
| ||||||||
Other non-current liabilities | ||||||||
Asbestos-related liabilities | $ | 234,567 | $ | 630 | ||||
Deferred revenue | 73,397 | — | ||||||
Taxes payable | 49,324 | 26,470 | ||||||
Other non-current liabilities | 96,299 | 96,409 | ||||||
| ||||||||
Total other non-current liabilities | $ | 453,587 | $ | 123,509 | ||||
| ||||||||
80
Notes to consolidated financial statements — (continued)
| 9. | |
| Supplemental Cash Flow Information |
The following table summarizes supplemental cash flow information:
| In thousands | 2010 | 2009 | 2008 | |||||||||
| Interest payments | $ | 37,083 | $ | 43,010 | $ | 63,851 | ||||||
| Income tax payments | 55,991 | 8,719 | 80,765 | |||||||||
| Years ended December 31 | ||||||||||||
| In thousands | 2012 | 2011 | 2010 | |||||||||
Cash paid for interest, net | $ | 66,683 | $ | 54,516 | $ | 37,083 | ||||||
Cash paid for income taxes, net | 82,235 | 64,389 | 55,991 | |||||||||
| 10. | |
| Accumulated Other Comprehensive Income (Loss) |
Components of accumulated other comprehensive income (loss) consistsAOCI consist of the following:
| In thousands | 2010 | 2009 | ||||||
| Retirement liability adjustments, net of tax | $ | (71,210 | ) | $ | (58,448 | ) | ||
| Cumulative translation adjustments | 58,184 | 88,671 | ||||||
| Market value of derivative financial instruments, net of tax | (9,316 | ) | (9,626 | ) | ||||
| Accumulated other comprehensive income (loss) | $ | (22,342 | ) | $ | 20,597 | |||
| December 31 | ||||||||
| In thousands | 2012 | 2011 | ||||||
Unrecognized pension and other post-retirement benefit costs, net of tax | $ | 364 | $ | 617 | ||||
Cumulative translation adjustments | 1,009 | (33,407 | ) | |||||
Market value of derivative financial instruments, net of tax | (8,571 | ) | (4,941 | ) | ||||
| ||||||||
Accumulated other comprehensive income (loss) | $ | (7,198 | ) | $ | (37,731 | ) | ||
| ||||||||
| 11. | |
| Debt |
Debt and the average interest rates on debt outstanding are summarizedwere as follows:
| Average | ||||||||||||||||
| interest rate | ||||||||||||||||
| December 31, | Maturity | December 31, | December 31, | |||||||||||||
| In thousands | 2010 | (Year) | 2010 | 2009 | ||||||||||||
| Revolving credit facilities | 0.89 | % | 2012 | $ | 97,500 | $ | 198,300 | |||||||||
| Private placement — fixed rate | 5.65 | % | 2013-2017 | 400,000 | 400,000 | |||||||||||
| Private placement — floating rate | 0.84 | % | 2012-2013 | 205,000 | 205,000 | |||||||||||
| Other | 4.36 | % | 2012-2016 | 4,972 | 2,337 | |||||||||||
| Total debt, including current portion per balance sheet | 707,472 | 805,637 | ||||||||||||||
| Less: Current maturities | (18 | ) | (81 | ) | ||||||||||||
| Short-term borrowings | (4,933 | ) | (2,205 | ) | ||||||||||||
| Long-term debt | $ | 702,521 | $ | 803,351 | ||||||||||||
In thousands | Average December 31, 2012 | Maturity year | December 31 | |||||||||
| 2012 | 2011 | |||||||||||
Commercial paper | 0.664% | 2017 | $ | 424,684 | $ | 3,497 | ||||||
Revolving credit facilities | — | 2017 | — | 168,500 | ||||||||
Senior notes - fixed rate | 1.350% | 2015 | 350,000 | — | ||||||||
Senior notes - fixed rate | 1.875% | 2017 | 350,000 | — | ||||||||
Senior notes - fixed rate | 2.650% | 2019 | 250,000 | — | ||||||||
Senior notes - fixed rate | 5.000% | 2021 | 500,000 | 500,000 | ||||||||
Senior notes - fixed rate | 3.150% | 2022 | 550,000 | — | ||||||||
Senior notes - fixed rate | — | — | — | 400,000 | ||||||||
Senior notes - floating rate | — | — | — | 205,000 | ||||||||
Other | 0.562% | 2014-2030 | 8,880 | 16,302 | ||||||||
Capital lease obligations | 4.313% | 2015-2025 | 23,810 | 15,788 | ||||||||
| ||||||||||||
Total debt | 2,457,374 | 1,309,087 | ||||||||||
| Less: Current maturities and short-term borrowings | (3,096 | ) | (4,862 | ) | ||||||||
| ||||||||||||
Long-term debt | $ | 2,454,278 | $ | 1,304,225 | ||||||||
| ||||||||||||
In December 2012, our wholly-owned subsidiary, Pentair Finance S.A. (“PFSA”), completed an exchange offer (the “Exchange Offer”) pursuant to which it exchanged $373 million in aggregate principal amount of 5.00% Senior Notes due 2021 of Pentair, Inc., a wholly-owned, indirect subsidiary of the Company (the “2021 Notes”) for a like amount of new 5.00% Senior Notes due 2021 of PFSA (the “New 2021 Notes”) plus $5.6 million in
81
Pentair Ltd. and Subsidiaries
Notes to consolidated financial statements
transaction-related costs. Upon completion of the Exchange Offer, $127 million in aggregate principal amount of 2021 Notes remained outstanding. The remaining 2021 Notes and New 2021 Notes are guaranteed as to payment by Pentair Ltd.
In November 2012, PFSA completed a private offering of $350 million aggregate principal amount of 1.35% Senior Notes due 2015 (the “2015 Notes”) and $250 million aggregate principal amount of 2.65% Senior Notes due 2019 (the “2019 Notes” and, collectively, the “2015/2019 Notes”), which are guaranteed as to payment by Pentair Ltd. In certain circumstances, PFSA may be required to pay additional interest on the 2015/2019 Notes. We have a multi-currency revolving Credit Facility (“Credit Facility”used the net proceeds from the sale of the 2015/2019 Notes to repay commercial paper and for general corporate purposes.
In October 2012, we redeemed the remaining outstanding aggregate principal of our 5.65% fixed rate senior notes due 2013-2017 totaling $400 million and our 1.05% floating rate senior notes due 2013 totaling $100 million (the “Fixed/Floating Rate Notes”). The Credit Facility createsredemptions included make-whole premiums of $65.8 million. Concurrent with the redemption of the Fixed/Floating Rate Notes, we terminated a related interest rate swap that was designated as a cash flow hedge, which resulted in the reclassification of $3.4 million of previously unrecognized variable to fixed swap losses from AOCI to earnings in October 2012. All costs associated with the redemption were recorded as aLoss on the early extinguishment of debt including $0.6 million of unamortized deferred financing costs.
In September 2012, PFSA, completed a private offering of $550 million aggregate principal amount of 3.15% Senior Notes due 2022 (the “2022 Notes”) and $350 million aggregate principal amount of 1.875% Senior Notes due 2017 (the “2017 Notes” and, collectively, the “2017/2022 Notes”), which are guaranteed as to payment by Pentair Ltd. In certain circumstances, PFSA may be required to pay additional interest on the 2017/2022 Notes. The 2017/2022 Notes remained outstanding after the Merger. A portion of the net proceeds from the 2017/2022 Notes offering were used to repay $435 million to Tyco in conjunction with the Distribution and the Merger.
In September 2012, Pentair, Inc. entered into a credit agreement providing for an unsecured, committed revolving credit facility (the “Credit Facility”) with initial maximum aggregate availability of up to $800$1,450 million. The Credit Facility replaced Pentair, Inc.’s $700 million Former Credit Facility (as defined below). The Credit Facility matures in September 2017. Upon the completion of the Merger, Pentair Ltd. became the guarantor under the Credit Facility and PFSA and certain other of our subsidiaries became affiliate borrowers under the Credit Facility. Borrowings under the Credit Facility generally bear interest at a variable rate equal to the London Interbank Offered Rate (“LIBOR”) plus a specified margin based upon PFSA’s credit ratings. PFSA must also pay a facility fee ranging from 10.0 to 30.0 basis points per annum (based upon PFSA’s credit ratings) on the amount of each lender’s commitment.
In May 2011, Pentair, Inc. completed a public offering of $500 million aggregate principal amount of the 2021 Notes. Pentair, Inc. used the net proceeds from the offering of the 2021 Notes to finance in part the CPT acquisition in 2011. The 2021 Notes which remain outstanding subsequent to the Exchange Offer are guaranteed as to payment by Pentair Ltd.
In April 2011, Pentair, Inc. entered into a Fourth Amended and Restated Credit Agreement that provided for an unsecured, committed revolving credit facility (the “Former Credit Facility”) of up to $700 million, with multi-currency sub facilitiessub-facilities to support investments outside the U.S. The Credit Facility expires on June 4, 2012. Borrowings under the Former Credit Facility bearbore interest at the rate of LIBOR plus 0.625%1.75%. Interest ratesWe used borrowings under the Former Credit Facility to fund a portion of the CPT acquisition in 2011 and fees onto repay $105 million of matured senior notes in May 2012. The Former Credit Facility was terminated in September 2012 in connection with the Merger and replaced by the Credit Facility, vary based on our credit ratings.
82
Pentair Ltd. and Subsidiaries
Notes to consolidated financial statements
PFSA is authorized to sell short-term commercial paper notes to the extent availability exists under the Credit Facility. We usePFSA uses the Credit Facility asback-up liquidity to support 100% of commercial paper outstanding. Our use of commercial paper as a funding vehicle depends upon the relative interest rates for our paper compared to the cost of borrowing under our Credit Facility. As of December 31, 20102012 and December 31, 20092011, we had no$424.7 million and $3.5 million, respectively, of commercial paper outstanding, commercial paper.
55
Our debt agreements contain certain financial covenants, the most restrictive of which is a leverage ratio (total consolidated indebtedness, as defined, over consolidated EBITDA, as defined)are in the Credit Facility, including that we may not permit (i) the ratio of our consolidated debt plus synthetic lease obligations to our consolidated net income (excluding, among other things, non-cash gains and losses) before interest, taxes, depreciation, amortization, non-cash share-based compensation expense, and up to $40 million of costs and expenses incurred in connection with the Merger (EBITDA) for the four consecutive fiscal quarters then ended (the “Leverage Ratio”) to exceed 3.53.50 to 1.0. We1.00 on the last day of each fiscal quarter, and (ii) the ratio of our EBITDA for the four consecutive fiscal quarters then ended to our consolidated interest expense, including consolidated yield or discount accrued as to outstanding securitization obligations (if any), for the same period to be less than 3.00 to 1.00 as of the end of each fiscal quarter. For purposes of the Leverage Ratio, the Credit Facility provides for the calculation of EBITDA giving pro forma effect to the Merger and certain acquisitions, divestitures and liquidations during the period to which such calculation relates. As of December 31, 2012, we were in compliance with all financial covenants in our debt agreements asagreements.
In addition to the Credit Facility, we have various other credit facilities with an aggregate availability of $89.0 million, of which $3.0 million was outstanding at December 31, 2010.
Debt outstanding at December 31, 20102012 matures on a calendar year basis as follows:
| In thousands | 2011 | 2012 | 2013 | 2014 | 2015 | Thereafter | Total | |||||||||||||||||||||
| Contractual debt obligation maturities | $ | 4,951 | $ | 202,517 | $ | 200,003 | $ | 1 | $ | — | $ | 300,000 | $ | 707,472 | ||||||||||||||
| In thousands | 2013 | 2014 | 2015 | 2016 | 2017 | Thereafter | Total | |||||||||||||||||||||
Contractual debt obligation maturities | $ | — | $ | 65 | $ | 350,000 | $ | — | $ | 777,706 | $ | 1,305,793 | $ | 2,433,564 | ||||||||||||||
Capital lease obligations | 3,096 | 3,171 | 6,036 | 1,236 | 1,236 | 9,035 | 23,810 | |||||||||||||||||||||
| ||||||||||||||||||||||||||||
Total maturities | $ | 3,096 | $ | 3,236 | $ | 356,036 | $ | 1,236 | $ | 778,942 | $ | 1,314,828 | $ | 2,457,374 | ||||||||||||||
| ||||||||||||||||||||||||||||
As part of the Merger and CPT acquisition, we assumed capital lease obligations related primarily to land and buildings. As of December 31, 2012 and December 31, 2011, the recorded values of the assets acquired under those capital leases were $35.5 million and $22.7 million, respectively, less accumulated amortization of $6.0 million and $5.1 million, respectively, all of which were included inProperty, plant and equipment, net on the Consolidated Balance Sheets.
Capital lease obligations consist of total future minimum lease payments of $26.1 million less the imputed interest of $2.3 as of December 31, 2012.
83
Pentair Ltd. and Subsidiaries
Notes to consolidated financial statements
| 12. | |
| Derivatives and Financial Instruments |
Cash-flow HedgesDerivative financial instruments
We are exposed to market risk related to changes in foreign currency exchange rates and interest rates on our floating rate indebtedness. To manage the volatility related to these exposures, we periodically enter into a variety of derivative financial instruments. Our objective is to reduce, where it is deemed appropriate to do so, fluctuations in earnings and cash flows associated with changes in foreign currency rates and interest rates. The derivative contracts contain credit risk to the extent that our bank counterparties may be unable to meet the terms of the agreements. The amount of such credit risk is generally limited to the unrealized gains, if any, in such contracts. Such risk is minimized by limiting those counterparties to major financial institutions of high credit quality.
Interest rate swaps
During 2012 and 2011, we used floating to fixed rate interest rate swaps to mitigate our exposure to future changes in interest rates related to our floating rate indebtedness. We designated these interest rate swap arrangements as cash flow hedges. As a result, changes in the fair value of the interest rate swaps were recorded inAOCI on the Consolidated Balance Sheets throughout the contractual term of each of the interest rate swap arrangements.
During the year ended December 31, 2012, all of our interest rate swaps expired or were terminated and, as a result, we had no outstanding interest rate swap arrangements at December 31, 2012.
In August 2007, we entered into a $105 million interest rate swap agreement with a major financial institution to exchange variable rate interest payment obligations for a fixed rate obligation without the exchange of the underlying principal amounts in order to manage interest rate exposures. The effective date of the swap was August 30, 2007. The swap agreement hashad a fixed interest rate of 4.89% and expiresexpired in May 2012. The fixed interest rate of 4.89% plus the .50% interest rate spread over LIBOR resultsresulted in an effective fixed interest rate of 5.39%. The fair value of the swap was a liability of $6.4 million and $8.1$1.7 million at December 31, 2010 and December 31, 2009, respectively2011 and was recorded in AOCI onOther current liabilities in the Consolidated Balance Sheets.
In September 2005, we entered into a $100 million interest rate swap agreement with several major financial institutions to exchange variable-ratevariable rate interest payment obligations for fixed-ratefixed rate obligations without the exchange of the underlying principal amounts in order to manage interest rate exposures. The effective date of the fixed-ratefixed rate swap was April 25, 2006. The swap agreement has a fixed interest rate of 4.68% and expireswas set to expire in July 2013. The fixed interest rate of 4.68% plus the .60% interest rate spread over LIBOR results in an effective fixed interest rate of 5.28%. This swap was terminated in October 2012. The fair value of the swap was a liability of $9.4 million and $8.3$6.3 million at December 31, 2010 and December 31, 2009, respectively2011 and was recorded in AOCI onOther current liabilities in the Consolidated Balance Sheets.
56
Derivative gains and losses included in OCI areAOCI were reclassified into earnings at the time the related interest expense iswas recognized or the settlement of the related commitment occurs.
In April 2011, as part of our planned debt issuance to fund the CPT acquisition, we entered into interest rate swap counterparties would resultcontracts to hedge movement in interest rates through the expected date of closing for a portion of the expected fixed rate debt offering. The swaps had a notional amount of $400 million with an average interest rate of 3.65%. In May 2011, upon the sale of the 2021 Notes, the swaps were terminated at a cost of $11.0 million. Because we
84
Pentair Ltd. and Subsidiaries
Notes to consolidated financial statements
used the contracts to hedge future interest payments, this was recorded inAOCI in the loss of any benefit to usConsolidated Balance Sheets and will be amortized as interest expense over the 10 year life of the swap agreement. In this case, we would continue2021 Notes. The ending unrealized net loss inAOCI at December 31, 2012 was $9.2 million.
Foreign currency contracts
We conduct business in various locations throughout the world and are subject to be obligatedmarket risk due to paychanges in the variable interest payments pervalue of foreign currencies in relation to our reporting currency, the underlying debt agreements which are at variable interest ratesU.S. dollar. We manage our economic and transaction exposure to certain market-based risks through the use of 3 month LIBOR plus .50% for $105 millionforeign currency derivative financial instruments. Our objective in holding these derivatives is to reduce the volatility of debtnet earnings and 3 month LIBOR plus .60% for $100 million of debt. Additionally, failure of one or allcash flows associated with changes in foreign currency exchange rates. The majority of our swap counterparties would not eliminate our obligation to continue to make payments under our existing swap agreements if we continue to be in a net pay position.
In March 2011, we entered into a foreign currency option contract to reduce our interest rate swaps are carriedexposure to fluctuations in the euro related to the planned CPT acquisition. The contract had a notional amount of €286.0 million, a strike price of 1.4375 and a maturity date of May 13, 2011. In May 2011, we sold the foreign currency option contract for $1.0 million. The net cost of $2.1 million was recorded inSelling, general and administrativeon the Consolidated Statements of Operations and Comprehensive Income (Loss).
Fair value of financial instruments
The recorded amounts and estimated fair values of total debt at December 31, excluding the effects of derivative financial instruments, were as follows:
| 2012 | 2011 | |||||||||||||||
| In thousands | Recorded Amount | Fair Value | Recorded Amount | Fair Value | ||||||||||||
Variable rate debt | $ | 427,706 | $ | 427,706 | $ | 406,978 | $ | 406,978 | ||||||||
Fixed rate debt | 2,029,669 | 2,081,264 | 902,109 | 954,053 | ||||||||||||
| ||||||||||||||||
Total debt | $ | 2,457,375 | $ | 2,508,970 | $ | 1,309,087 | $ | 1,361,031 | ||||||||
| ||||||||||||||||
The following methods were used to estimate the fair valuevalues of each class of financial instrument measured on a recurring basis. Fairbasis:
short-term financial instruments (cash and cash equivalents, accounts and notes receivable, accounts and notes payable and variable-rate debt) — recorded amount approximates fair value because of the short maturity period;
long-term fixed-rate debt, including current maturities — fair value is based on market quotes available for issuance of debt with similar terms, which are inputs that are classified as Level 2 in the valuation hierarchy defined by the accounting guidance; and
interest rate swaps and foreign currency contract agreements — fair values are determined through the use of models that consider various assumptions, including time value, yield curves, as well as other relevant economic measures, which are inputs that are classified as Level 2 in the valuation hierarchy.
| 2010 | 2009 | |||||||||||||||
| Recorded | Fair | Recorded | Fair | |||||||||||||
| In thousands | amount | value | amount | value | ||||||||||||
Total debt, including current portion | ||||||||||||||||
| Variable rate | $ | 307,433 | $ | 307,433 | $ | 405,505 | $ | 405,505 | ||||||||
| Fixed rate | 400,039 | 438,492 | 400,132 | 390,930 | ||||||||||||
| Total | $ | 707,472 | $ | 745,925 | $ | 805,637 | $ | 796,435 | ||||||||
Derivative financial instruments | ||||||||||||||||
| Market value of interest rate swaps and foreign currency contracts, net | $ | (14,585 | ) | $ | (14,585 | ) | $ | (16,354 | ) | $ | (16,354 | ) | ||||
57accounting guidance.
85
Notes to consolidated financial statements — (continued)
Financial assets and liabilities measured at fair value on a recurring basis were as follows:
| Recurring fair value measurements | December 31, 2012 | |||||||||||||||
| In thousands | Level 1 | Level 2 | Level 3 | Total | ||||||||||||
Foreign currency contract assets | $ | — | $ | 2,924 | $ | — | $ | 2,924 | ||||||||
Foreign currency contract liabilities | — | (551 | ) | — | (551 | ) | ||||||||||
Deferred compensation plan assets (1) | 22,394 | — | — | 22,394 | ||||||||||||
| ||||||||||||||||
Total recurring fair value measurements | $ | 22,394 | $ | 2,373 | $ | — | $ | 24,767 | ||||||||
| ||||||||||||||||
Nonrecurring fair value measurements | ||||||||||||||||
Trade name intangibles(2) | $ | — | $ | — | $ | 63,700 | $ | 63,700 | ||||||||
| ||||||||||||||||
| Recurring fair value measurements | December 31, 2011 | |||||||||||||||
| In thousands | Level 1 | Level 2 | Level 3 | Total | ||||||||||||
Foreign currency contract assets | $ | — | $ | 242 | $ | — | $ | 242 | ||||||||
Foreign currency contract liabilities | — | (341 | ) | — | (341 | ) | ||||||||||
Interest rate swap liabilities | — | (8,034 | ) | — | (8,034 | ) | ||||||||||
Deferred compensation plan assets (1) | 22,987 | — | — | 22,987 | ||||||||||||
| ||||||||||||||||
Total recurring fair value measurements | $ | 22,987 | $ | (8,133 | ) | $ | — | $ | 14,854 | |||||||
| ||||||||||||||||
Nonrecurring fair value measurements | ||||||||||||||||
Goodwill (3) | $ | — | $ | — | $ | 242,800 | $ | 242,800 | ||||||||
| ||||||||||||||||
| (1) | Deferred compensation plan assets include mutual funds and cash equivalents for payment of certain non-qualified benefits for retired, terminated and active employees. The fair value of these assets was based on quoted market prices in active markets. |
| In the fourth quarter of 2012, we completed our annual intangible assets impairment review. As a result, we recorded a pre-tax non-cash impairment charge of $60.7 million for trade names intangibles. The fair value of trade names is measured using the relief-from-royalty method. This method assumes the trade name has value to the extent that the owner is relieved of the obligation to pay royalties for the benefits received from them. This method requires us to estimate the future revenue for the related brands, the appropriate royalty rate |
| (3) | In the fourth quarter of 2011, we completed our annual goodwill impairment review. As a result, we recorded a pre-tax non-cash impairment charge of $200.5 million in a reporting unit part of Water & Fluid Solutions. The fair |
86
Pentair Ltd. and Subsidiaries
Notes to consolidated financial statements
| 13. | |
| Income Taxes |
Income from continuing operations before income taxes and noncontrolling interest consisted of the following:
| In thousands | 2010 | 2009 | 2008 | |||||||||
| U.S. | $ | 217,213 | $ | 111,530 | $ | 220,294 | ||||||
| International | 82,934 | 61,117 | 146,846 | |||||||||
| Income from continuing operations before taxes and noncontrolling interest | $ | 300,147 | $ | 172,647 | $ | 367,140 | ||||||
| Years ended December 31 | |||||||||||||||
| In thousands | 2012 | 2011 | 2010 | ||||||||||||
Federal(1) | $ | 39,177 | $ | (31,471 | ) | $ | 196,101 | ||||||||
International | (223,142 | ) | 74,737 | 82,874 | |||||||||||
| |||||||||||||||
| Income (loss) from continuing operations before income taxes and noncontrolling interest | $ | (183,965 | ) | $ | 43,266 | $ | 278,975 | ||||||||
| |||||||||||||||
(1) As a result of the Merger, “Federal” reflects income (loss) from continuing operations before income taxes and noncontrolling interest for Switzerland in 2012 and U.S. for 2011 and 2010.
The provision (benefit) for income taxes for continuing operations consisted of the following:
| In thousands | 2010 | 2009 | 2008 | |||||||||
Currently payable | ||||||||||||
| Federal | $ | 44,766 | $ | 10,502 | $ | 41,985 | ||||||
| State | 6,591 | 2,456 | 5,140 | |||||||||
| International | 17,877 | 13,947 | 25,735 | |||||||||
| Total current taxes | 69,234 | 26,905 | 72,860 | |||||||||
Deferred | ||||||||||||
| Federal and state | 26,445 | 26,733 | 35,535 | |||||||||
| International | 1,521 | 2,790 | (51 | ) | ||||||||
| Total deferred taxes | 27,966 | 29,523 | 35,484 | |||||||||
| Total provision for income taxes | $ | 97,200 | $ | 56,428 | $ | 108,344 | ||||||
| Years ended December 31 | ||||||||||||
| In thousands | 2012 | 2011 | 2010 | |||||||||
Currently payable | ||||||||||||
Federal | $ | 6,490 | $ | 51,158 | $ | 44,766 | ||||||
State | — | 6,980 | 6,591 | |||||||||
International | 61,053 | 24,005 | 17,877 | |||||||||
| ||||||||||||
Total current taxes | 67,543 | 82,143 | 69,234 | |||||||||
Deferred | ||||||||||||
Federal | 1,270 | (26,223 | ) | 18,188 | ||||||||
International | (148,166 | ) | (9,503 | ) | 1,521 | |||||||
| ||||||||||||
Total deferred taxes | (146,896 | ) | (35,726 | ) | 19,709 | |||||||
| ||||||||||||
Total provision (benefit) for income taxes | $ | (79,353 | ) | $ | 46,417 | $ | 88,943 | |||||
| ||||||||||||
Reconciliations of the U.S.federal statutory income tax rate to our effective tax rate for continuing operationswere as follows:
| Percentages | 2010 | 2009 | 2008 | |||||||||
| U.S. statutory income tax rate | 35.0 | 35.0 | 35.0 | |||||||||
| State income taxes, net of federal tax benefit | 2.1 | 2.6 | 1.6 | |||||||||
| Tax effect of stock-based compensation | 0.2 | 0.2 | 0.2 | |||||||||
| Tax effect of international operations | (3.8 | ) | (3.5 | ) | (6.1 | ) | ||||||
| Tax credits | (0.3 | ) | (1.4 | ) | (1.0 | ) | ||||||
| Domestic manufacturing deduction | (1.4 | ) | (0.4 | ) | (0.7 | ) | ||||||
| ESOP dividend benefit | (0.2 | ) | (0.4 | ) | (0.2 | ) | ||||||
| All other, net | 0.8 | 0.6 | 0.7 | |||||||||
| Effective tax rate on continuing operations | 32.4 | 32.7 | 29.5 | |||||||||
58
| Years ended December 31 | ||||||||||||
| Percentages | 2012 | 2011 | 2010 | |||||||||
Federal statutory income tax rate(1) | 7.8 | 35.0 | 35.0 | |||||||||
Tax effect of international operations(2) | 23.6 | (25.3 | ) | (4.1 | ) | |||||||
Non-deductible transaction costs | (4.7 | ) | — | — | ||||||||
Impact of debt-financing | 10.8 | — | — | |||||||||
Resolution of tax audits | 5.6 | — | — | |||||||||
Goodwill | — | 104.4 | — | |||||||||
Domestic manufacturing deduction | — | (8.4 | ) | (1.5 | ) | |||||||
State income taxes, net of federal tax benefit | — | 4.3 | 2.0 | |||||||||
All other, net | — | (2.7 | ) | 0.5 | ||||||||
| ||||||||||||
Effective tax rate | 43.1 | 107.3 | 31.9 | |||||||||
| ||||||||||||
87
Notes to consolidated financial statements — (continued)
(1) As a result of the Merger, the statutory rate for 2012 reflects the Swiss statutory rate of 7.83 percent. For 2011 and 2010, the statutory rate reflects the U.S. statutory rate of 35 percent.
(2) As a result of the Merger, the tax effect of international operations for 2012 consists of non-Swiss jurisdictions. For 2011 and 2010, the tax effect of international operations consists of non-U.S. jurisdictions.
Reconciliations of the beginning and ending gross unrecognized tax benefits were as follows:
| In thousands | 2010 | 2009 | 2008 | |||||||||
| Gross unrecognized tax benefits — beginning balance | $ | 29,962 | $ | 28,139 | $ | 23,879 | ||||||
| Gross increases for tax positions in prior periods | 286 | 3,191 | 3,526 | |||||||||
| Gross decreases for tax positions in prior periods | (2,490 | ) | (2,433 | ) | (411 | ) | ||||||
| Gross increases based on tax positions related to the current year | 1,431 | 1,789 | 2,666 | |||||||||
| Gross decreases related to settlements with taxing authorities | (4,182 | ) | (209 | ) | — | |||||||
| Reductions due to statute expiration | (747 | ) | (515 | ) | (1,521 | ) | ||||||
| Gross unrecognized tax benefits at December 31 | $ | 24,260 | $ | 29,962 | $ | 28,139 | ||||||
| Years ended December 31 | ||||||||||||
| In thousands | 2012 | 2011 | 2010 | |||||||||
Beginning balance | $ | 26,469 | $ | 24,260 | $ | 29,962 | ||||||
Gross increases for tax positions in prior periods | 2,198 | 2,042 | 286 | |||||||||
Gross decreases for tax positions in prior periods | (641 | ) | (192 | ) | (2,490 | ) | ||||||
Gross increases based on tax positions related to the current year | 13,641 | 3,201 | 1,431 | |||||||||
Gross decreases related to settlements with taxing authorities | (13,202 | ) | (2,465 | ) | (4,182 | ) | ||||||
Reductions due to statute expiration | (370 | ) | (377 | ) | (747 | ) | ||||||
Gross increases due to acquisitions | 25,938 | — | — | |||||||||
Gross increases due to currency fluctuations | 438 | — | — | |||||||||
| ||||||||||||
Ending balance | $ | 54,471 | $ | 26,469 | $ | 24,260 | ||||||
| ||||||||||||
Included in the $24.3$54.5 million of total gross unrecognized tax benefits as of December 31, 20102012 was $22.4$38.6 million of tax benefits that, if recognized, would impact the effective tax rate. It is reasonably possible that the gross unrecognized tax benefits as of December 31, 20102012 may decrease by a range of $0 to $17.5$36.9 million during the next twelve months2013, primarily as a result of the resolution of non-Swiss examinations, including U.S. federal state and foreignstate examinations, and the expiration of various statutes of limitations.
The determination of annual income tax expense takes into consideration amounts which may be needed to cover exposures for open tax years. The Internal Revenue Service (“IRS”) has examined ourthe Pentair, Inc. U.S. federal income tax returns through 20032009 with no material adjustments. The IRS hasA number of tax periods from 2004 to present are under audit by tax authorities in various jurisdictions, including Germany and Italy. We anticipate that several of these audits may be concluded in the foreseeable future. We are also completed a survey of our 2004 U.S. federal incomesubject to the 2012 Tax Sharing Agreement, discussed below, which generally applies to pre-Distribution Tyco tax return with no material findings. The IRS is currently examining our federal tax returns for years 2005 through 2009. No material adjustments have been proposed, however, actual settlements may differ from amounts accrued.
We record penalties and interest related to unrecognized tax benefits inProvision (benefit) for income taxes andInterest expense, respectively, which is consistent with our past practices.respectively. As of December 31, 2010,2012 and 2011, we had recorded approximately $0.8accrued $3.1 million and $0.9 million, respectively, for the possible payment of penalties and $4.8$19.5 million related toand $5.9 million, respectively, for the possible payment of interest expense.
Deferred taxes in the amount of $21.0 million have been provided on undistributed earnings of certain subsidiaries. Taxes have not been provided on undistributed earnings of international subsidiaries. Itsubsidiaries where it is our intention to reinvest these earnings permanently or to repatriate the earnings only when it is tax effective to do so. As of December 31, 2010, approximately $223.7 million of unremitted earnings attributable to international subsidiaries were considered to be indefinitely invested. It is not practicable to estimate the amount of tax that might be payable if such earnings were to be remitted.
Deferred taxes arise because of different treatment between financial statement accounting and tax accounting, known as “temporary differences.” We record the tax effect of these temporary differences as “deferred tax
88
Pentair Ltd. and Subsidiaries
Notes to consolidated financial statements
assets” (generally items that can be used as a tax deduction or credit in future periods) and “deferred tax liabilities” (generally items for which we received a tax deduction but the tax impact has not yet been recorded in the Consolidated Statements of Income)Operations and Comprehensive Income (Loss)).
Deferred taxes were classifiedrecorded in the Consolidated Balance Sheets as follows:
| In thousands | 2010 | 2009 | ||||||
| Deferred tax assets | $ | 56,349 | $ | 49,609 | ||||
| Other noncurrent assets | 1,647 | 5,132 | ||||||
| Other current liabilities | (547 | ) | (149 | ) | ||||
| Deferred tax liabilities | (169,198 | ) | (146,630 | ) | ||||
| Net deferred tax liability | $ | (111,749 | ) | $ | (92,038 | ) | ||
59
| December 31 | ||||||||
| In thousands | 2012 | 2011 | ||||||
Other current assets | $ | 68,277 | $ | 60,899 | ||||
Other non-current assets | 89,040 | — | ||||||
Deferred tax liabilities | 488,102 | 188,957 | ||||||
| ||||||||
Net deferred tax liabilities | $ | 330,785 | $ | 128,058 | ||||
| ||||||||
| 2010 | 2009 | |||||||||||||||
| Deferred tax | Deferred tax | |||||||||||||||
| In thousands | Assets | Liabilities | Assets | Liabilities | ||||||||||||
| Accounts receivable allowances | $ | 4,490 | $ | — | $ | 4,073 | $ | — | ||||||||
| Inventory valuation | 17,381 | — | 11,005 | — | ||||||||||||
| Accelerated depreciation/amortization | — | 11,436 | — | 12,893 | ||||||||||||
| Accrued product claims and warranties | 25,753 | — | 24,558 | — | ||||||||||||
| Employee benefit accruals | 110,547 | — | 119,357 | — | ||||||||||||
| Goodwill and other intangibles | — | 187,103 | — | 172,675 | ||||||||||||
| Other, net | — | 71,381 | — | 65,463 | ||||||||||||
| Total deferred taxes | $ | 158,171 | $ | 269,920 | $ | 158,993 | $ | 251,031 | ||||||||
| Net deferred tax liability | $ | (111,749 | ) | $ | (92,038 | ) | ||||||||||
| December 31 | ||||||||
| In thousands | 2012 | 2011 | ||||||
Deferred tax assets | ||||||||
Accrued liabilities and reserves | $ | 86,714 | $ | 58,420 | ||||
Postretirement benefits | 79,065 | 82,823 | ||||||
Employee compensation & benefits | 95,170 | 49,404 | ||||||
Tax loss and credit carryforwards | 398,921 | 24,350 | ||||||
Other | 53,531 | 4,698 | ||||||
| ||||||||
Total deferred tax assets | 713,401 | 219,695 | ||||||
Valuation allowance(1) | 167,640 | 13,242 | ||||||
| ||||||||
Deferred tax assets, net of valuation allowance | 545,761 | 206,453 | ||||||
Deferred tax liabilities | ||||||||
Property, plant and equipment | 97,370 | 43,572 | ||||||
Goodwill and other intangibles | 779,176 | 290,939 | ||||||
| ||||||||
Total deferred tax liabilities | 876,546 | 334,511 | ||||||
| ||||||||
Net deferred tax liabilities | $ | 330,785 | $ | 128,058 | ||||
| ||||||||
| (1) | The increase in valuation allowance from 2011 to 2012 was primarily related to balances acquired in the Merger. |
As of December 31, 2010 and 2009, respectively, related to a foreign2012, tax credit carryover from the tax period ended December 31, 2006 and related to state net operating losses. The foreign tax credit is eligible for carryforward until the tax period ending December 31, 2016.
Tax sharing agreement and other income tax matters
In connection with the Distribution, we entered into a tax sharing agreement (the “2012 Tax Sharing Agreement”) with Tyco and The ADT Corporation (“ADT”), which governs the rights and obligations of Tyco,
89
Pentair Ltd. and Subsidiaries
Notes to consolidated financial statements
ADT and us for certain pre-Distribution tax liabilities, including Tyco’s obligations under a separate tax sharing agreement (the “2007 Tax Sharing Agreement”) that Tyco, Covidien Ltd. (“Covidien”) and TE Connectivity Ltd. (“TE Connectivity”) entered into in 2007. The 2012 Tax Sharing Agreement provides that we, Tyco and ADT will share (i) certain pre-Distribution income tax liabilities that arise from adjustments made by tax authorities to our, Tyco’s and ADT’s U.S. income tax returns, and (ii) payments required to be made by Tyco in respect to the 2007 Tax Sharing Agreement (collectively, “Shared Tax Liabilities”). Tyco is responsible for the first $500 million of Shared Tax Liabilities. We and ADT will share 42% and 58%, respectively, of the next $225 million of Shared Tax Liabilities. We, ADT and Tyco will share 20%, 27.5% and 52.5%, respectively, of Shared Tax Liabilities above $725 million.
In the event the Distribution, the spin-off of ADT, or certain internal transactions undertaken in connection therewith were determined to be taxable as a result of actions taken after the Distribution by us, ADT or Tyco, the party responsible for such failure would be responsible for all taxes imposed on us, ADT or Tyco as a result thereof. Taxes resulting from the determination that the Distribution, the spin-off of ADT, or any internal transaction is taxable are referred to herein as “Distribution Taxes.” If such failure is not the result of actions taken after the Distribution by us, ADT or Tyco, then we, ADT and Tyco would be responsible for any Distribution Taxes imposed on us, ADT or Tyco as a result of such determination in the same manner and in the same proportions as the Shared Tax Liabilities. ADT will have sole responsibility for any income tax liability arising as a result of Tyco’s acquisition of Brink’s Home Security Holdings, Inc. (“BHS”) in May 2010, including any liability of BHS under the tax sharing agreement between BHS and The Brink’s Company dated October 31, 2008 (collectively, the “BHS Tax Liabilities”). Costs and expenses associated with the management of Shared Tax Liabilities, Distribution Taxes and BHS Tax Liabilities will generally be shared 20% by us, 27.5% by ADT and 52.5% by Tyco. We are responsible for all of our own taxes that are not shared pursuant to the 2012 Tax Sharing Agreement’s sharing formulae. In addition, Tyco and ADT are responsible for their tax liabilities that are not subject to carryforward periodsthe 2012 Tax Sharing Agreement’s sharing formulae.
The 2012 Tax Sharing Agreement also provides that, if any party were to default in its obligation to another party to pay its share of upthe distribution taxes that arise as a result of no party’s fault, each non-defaulting party would be required to twentypay, equally with any other non-defaulting party, the amounts in default. In addition, if another party to the 2012 Tax Sharing Agreement that is responsible for all or a portion of an income tax liability were to default in its payment of such liability to a taxing authority, we could be legally liable under applicable tax law for such liabilities and required to make additional tax payments. Accordingly, under certain circumstances, we may be obligated to pay amounts in excess of our agreed-upon share of our, Tyco’s and ADT’s tax liabilities.
With respect to years prior to and including the 2007 separation of Covidien and TE Connectivity by Tyco, tax authorities have raised issues and proposed tax adjustments that are generally subject to the sharing provisions of the 2007 Tax Sharing Agreement and which may require Tyco to make a payment to a taxing authority, Covidien or TE Connectivity. With respect to adjustments raised by the IRS, although Tyco has resolved a substantial number of these adjustments, a few significant items remain open with respect to the audit of the 1997 through 2004 years.
90
Pentair Ltd. and Subsidiaries
Notes to consolidated financial statements
| 14. | |
| Benefit Plans |
Pension and other post-retirement benefitsplans
We sponsor domestic and foreign defined-benefit pension and other post-retirement plans. Pension benefits are based principally on an employee’s years of serviceand/or compensation levels near retirement. In addition, we also provide certain post-retirement health care and life insurance benefits. Generally, the post-retirement health care and life insurance plans require contributions from retirees. We use a December 31 measurement date each year. In December 2007, we announced that we will be freezing certain U.S. pension plans as of December 31, 2017. Since the announcement, we have pursued a strategy of gradually shifting our U.S. pension asset allocations towards liability hedging assets such as fixed income instruments and away from equity securities. During the last quarter of 2012 we made significant progress in reducing the risk and volatility of our U.S. pension plans by taking the following steps:
We paid $331 million to settle pension obligations through a combination of lump sum payments to deferred vested participants and through the purchase of an annuity contract to settle obligations to plan participants in retiree status.
60
We made a special contribution of $190 million to fund our U.S. pension plans.
We accelerated our transition to increase the allocations of investments to liability hedging assets.
During the fourth quarter of 2012, we changed our method of recognizing actuarial gains and losses for all of our pension and other post-retirement plans. Historically, we recognized actuarial gains and losses as a component of AOCI in our Consolidated Balance Sheets and amortized them into our Consolidated Statements of Operations and Comprehensive Income (Loss) over the average future service period of the active employees of these plans to the extent such gains and losses were outside of a corridor. We elected to immediately recognize actuarial gains and losses in our Consolidated Statements of Operations and Comprehensive Income (Loss) on the basis that it is preferable to accelerate the recognition of such gains and losses into income rather than to delay such recognition. Additionally, for purposes of calculating the expected return on plan assets, we will no longer use a calculated value for the market-related valuation of plan assets, but instead will use the actual fair value of our plan assets. These changes will improve transparency in our operating results by more quickly recognizing the effects of external conditions on our plan obligations, investments and assumptions. Generally, these gains and losses are measured annually as of December 31 and accordingly will be recorded during the fourth quarter. We have applied these changes retrospectively, adjusting all prior periods (see Note 3).
91
Notes to consolidated financial statements — (continued)
Obligations and Funded Statusfunded status
The following tables present reconciliations of theplan benefit obligationobligations, fair value of the plans, the plan assets of the pension plans and the funded status of the plans:
| Pension benefits | Post-retirement | |||||||||||||||
| In thousands | 2010 | 2009 | 2010 | 2009 | ||||||||||||
Change in benefit obligation | ||||||||||||||||
| Benefit obligation beginning of year | $ | 552,309 | $ | 521,698 | $ | 35,301 | $ | 38,417 | ||||||||
| Service cost | 11,588 | 12,334 | 200 | 214 | ||||||||||||
| Interest cost | 31,671 | 32,612 | 2,013 | 2,377 | ||||||||||||
| Amendments | (281 | ) | 3 | — | (1,303 | ) | ||||||||||
| Settlements | (104 | ) | — | — | — | |||||||||||
| Actuarial (gain) loss | 24,677 | 13,309 | (647 | ) | (1,517 | ) | ||||||||||
| Translation (gain) loss | (4,208 | ) | 2,469 | — | — | |||||||||||
| Benefits paid | (28,844 | ) | (30,116 | ) | (3,152 | ) | (2,887 | ) | ||||||||
| Benefit obligation end of year | $ | 586,808 | $ | 552,309 | $ | 33,715 | $ | 35,301 | ||||||||
Change in plan assets | ||||||||||||||||
| Fair value of plan assets beginning of year | $ | 329,188 | $ | 265,112 | $ | — | $ | — | ||||||||
| Actual gain (loss) return on plan assets | 35,495 | 44,521 | — | — | ||||||||||||
| Company contributions | 49,840 | 49,044 | 3,152 | 2,887 | ||||||||||||
| Settlements | (104 | ) | — | — | — | |||||||||||
| Translation gain (loss) | (92 | ) | 627 | — | — | |||||||||||
| Benefits paid | (28,844 | ) | (30,116 | ) | (3,152 | ) | (2,887 | ) | ||||||||
| Fair value of plan assets end of year | $ | 385,483 | $ | 329,188 | $ | — | $ | — | ||||||||
Funded status | ||||||||||||||||
| Plan assets less than benefit obligation | $ | (201,325 | ) | $ | (223,121 | ) | $ | (33,715 | ) | $ | (35,301 | ) | ||||
| Net amount recognized | $ | (201,325 | ) | $ | (223,121 | ) | $ | (33,715 | ) | $ | (35,301 | ) | ||||
| U.S. pension plans | Non-U.S. pension plans | Other post-retirement plans | ||||||||||||||||||||||
| In thousands | 2012 | 2011 | 2012 | 2011 | 2012 | 2011 | ||||||||||||||||||
Change in benefit obligations | ||||||||||||||||||||||||
| Benefit obligation beginning of year | $ | 572,068 | $ | 502,657 | $ | 89,503 | $ | 84,151 | $ | 35,081 | $ | 33,715 | ||||||||||||
| Service cost | 12,867 | 10,270 | 3,295 | 2,196 | 219 | 180 | ||||||||||||||||||
| Interest cost | 28,208 | 28,647 | 7,545 | 4,121 | 1,860 | 1,889 | ||||||||||||||||||
| Amendments | 372 | — | — | — | — | — | ||||||||||||||||||
| Benefit obligations assumed in Merger | 10,821 | — | 338,532 | — | 16,815 | — | ||||||||||||||||||
| Settlements | — | — | — | (257 | ) | — | — | |||||||||||||||||
| Actuarial loss | 128,817 | 58,672 | 26,647 | 4,079 | 8,159 | 2,494 | ||||||||||||||||||
| Translation (gain) loss | — | — | 1,502 | (2,477 | ) | — | — | |||||||||||||||||
| Benefits paid | (358,854 | ) | (28,178 | ) | (6,175 | ) | (2,310 | ) | (2,837 | ) | (3,197 | ) | ||||||||||||
| ||||||||||||||||||||||||
| Benefit obligation end of year | 394,299 | 572,068 | 460,849 | 89,503 | 59,297 | 35,081 | ||||||||||||||||||
| ||||||||||||||||||||||||
| Change in plan assets | ||||||||||||||||||||||||
| Fair value of plan assets beginning of year | 408,837 | 374,934 | 10,934 | 10,549 | — | — | ||||||||||||||||||
| Actual return on plan assets | 43,944 | 27,628 | 6,413 | 343 | — | — | ||||||||||||||||||
| Plan assets acquired in Merger | 7,482 | — | 227,253 | — | — | — | ||||||||||||||||||
| Company contributions | 224,786 | 34,453 | 10,391 | 2,644 | 2,837 | 3,197 | ||||||||||||||||||
| Settlements | — | — | — | (257 | ) | — | — | |||||||||||||||||
| Translation gain (loss) | — | — | 166 | (35 | ) | — | — | |||||||||||||||||
| Benefits paid | (358,854 | ) | (28,178 | ) | (6,175 | ) | (2,310 | ) | (2,837 | ) | (3,197 | ) | ||||||||||||
| ||||||||||||||||||||||||
| Fair value of plan assets end of year | 326,195 | 408,837 | 248,982 | 10,934 | — | — | ||||||||||||||||||
| ||||||||||||||||||||||||
| Funded status | ||||||||||||||||||||||||
| Benefit obligations in excess of the fair value of plan assets | $ | (68,104 | ) | $ | (163,231 | ) | $ | (211,867 | ) | $ | (78,569 | ) | $ | (59,297 | ) | $ | (35,081 | ) | ||||||
| ||||||||||||||||||||||||
Amounts recognizedrecorded in the Consolidated Balance Sheets arewere as follows:
| Pension benefits | Post-retirement | |||||||||||||||
| In thousands | 2010 | 2009 | 2010 | 2009 | ||||||||||||
| Current liabilities | $ | (5,343 | ) | $ | (5,437 | ) | $ | (3,390 | ) | $ | (3,511 | ) | ||||
| Noncurrent liabilities | (195,982 | ) | (217,684 | ) | (30,325 | ) | (31,790 | ) | ||||||||
| Net amount recognized | $ | (201,325 | ) | $ | (223,121 | ) | $ | (33,715 | ) | $ | (35,301 | ) | ||||
| U.S. pension plans | Non-U.S. pension plans | Other post- retirement plans | ||||||||||||||||||||||
| In thousands | 2012 | 2011 | 2012 | 2011 | 2012 | 2011 | ||||||||||||||||||
| Current liabilities | $ | (3,490 | ) | $ | (3,303 | ) | $ | (4,925 | ) | $ | (2,442 | ) | $ | (4,520 | ) | $ | (3,307 | ) | ||||||
| Non-current liabilities | (64,614 | ) | (159,928 | ) | (206,942 | ) | (76,127 | ) | (54,777 | ) | (31,774 | ) | ||||||||||||
| ||||||||||||||||||||||||
| Benefit obligations in excess of the fair value of plan assets | $ | (68,104 | ) | $ | (163,231 | ) | $ | (211,867 | ) | $ | (78,569 | ) | $ | (59,297 | ) | $ | (35,081 | ) | ||||||
| ||||||||||||||||||||||||
The accumulated benefit obligation for all defined benefit plans was $557.7$804.2 million and $534.9$625.9 million at December 31, 20102012 and 2009,2011, respectively.
61
92
Notes to consolidated financial statements — (continued)
Information for pension plans with an accumulated benefit obligation or projected benefit obligation in excess of plan assets as of December 31 are as follows:
| In thousands | 2010 | 2009 | ||||||
| Pension plans with an accumulated benefit obligation in excess of plan assets: | ||||||||
| Fair value of plan assets | $ | 385,483 | $ | 329,188 | ||||
| Accumulated benefit obligation | 557,712 | 534,936 | ||||||
| Pension plans with a projected benefit obligation in excess of plan assets: | ||||||||
| Fair value of plan assets | $ | 385,483 | $ | 329,188 | ||||
| Accumulated benefit obligation | 586,808 | 552,309 | ||||||
| Projected benefit obligation exceeds the fair value of plan assets | Accumulated benefit obligation exceeds the fair value of plan assets | |||||||||||||||
| In thousands | 2012 | 2011 | 2012 | 2011 | ||||||||||||
U.S. pension plans | ||||||||||||||||
Projected benefit obligation | $ | 158,063 | $ | 572,068 | $ | 87,147 | $ | 572,068 | ||||||||
Fair value of plan assets | 85,332 | 408,837 | 15,499 | 408,837 | ||||||||||||
Accumulated benefit obligation | — | — | 77,165 | 539,453 | ||||||||||||
Non-U.S. pension plans | ||||||||||||||||
Projected benefit obligation | $ | 436,652 | $ | 89,503 | $ | 431,271 | $ | 89,503 | ||||||||
Fair value of plan assets | 222,387 | 10,934 | 217,174 | 10,934 | ||||||||||||
Accumulated benefit obligation | — | — | 420,044 | 86,431 | ||||||||||||
Components of net periodic benefit cost arefor our pension plans for the years ended December 31 were as follows:
| Pension benefits | Post-retirement | |||||||||||||||||||||||
| In thousands | 2010 | 2009 | 2008 | 2010 | 2009 | 2008 | ||||||||||||||||||
| Service cost | $ | 11,588 | $ | 12,334 | $ | 14,104 | $ | 200 | $ | 214 | $ | 263 | ||||||||||||
| Interest cost | 31,671 | 32,612 | 32,383 | 2,013 | 2,377 | 2,534 | ||||||||||||||||||
| Expected return on plan assets | (30,910 | ) | (30,286 | ) | (29,762 | ) | — | — | — | |||||||||||||||
| Amortization of transition | ||||||||||||||||||||||||
| obligation | 13 | 25 | 25 | — | — | — | ||||||||||||||||||
| Amortization of prior year | ||||||||||||||||||||||||
| service cost (benefit) | 7 | 23 | 179 | (27 | ) | (41 | ) | (136 | ) | |||||||||||||||
| Recognized net actuarial (gain) loss | 1,674 | 82 | 121 | (3,295 | ) | (3,326 | ) | (3,301 | ) | |||||||||||||||
| Settlement gain | (8 | ) | (9 | ) | — | — | — | — | ||||||||||||||||
| Net periodic benefit cost | $ | 14,035 | $ | 14,781 | $ | 17,050 | $ | (1,109 | ) | $ | (776 | ) | $ | (640 | ) | |||||||||
| U. S. pension plans | Non-U.S. pension plans | |||||||||||||||||||||||
| In thousands | 2012 | 2011 | 2010 | 2012 | 2011 | 2010 | ||||||||||||||||||
| Service cost | $ | 12,867 | $ | 10,270 | $ | 9,743 | $ | 3,295 | $ | 2,196 | $ | 1,845 | ||||||||||||
| Interest cost | 28,208 | 28,647 | 27,518 | 7,545 | 4,121 | 4,153 | ||||||||||||||||||
| Expected return on plan assets | (29,400 | ) | (27,952 | ) | (24,679 | ) | (3,928 | ) | (461 | ) | (433 | ) | ||||||||||||
| Amortization of transition obligation | — | — | — | — | — | 13 | ||||||||||||||||||
| Amortization of prior year service cost (benefit) | 17 | 17 | 17 | (15 | ) | (17 | ) | (10 | ) | |||||||||||||||
| Actuarial loss | 114,272 | 58,995 | 6,990 | 24,162 | 4,196 | 7,305 | ||||||||||||||||||
| ||||||||||||||||||||||||
| Net periodic benefit cost | $ | 125,964 | $ | 69,977 | $ | 19,589 | $ | 31,059 | $ | 10,035 | $ | 12,873 | ||||||||||||
| ||||||||||||||||||||||||
Components of net periodic benefit cost for our other post-retirement plans for the years ended December 31 were as follows:
| Other post-retirement plans | ||||||||||||
| In thousands | 2012 | 2011 | 2010 | |||||||||
Service cost | $ | 219 | $ | 180 | $ | 200 | ||||||
Interest cost | 1,860 | 1,889 | 2,013 | |||||||||
Amortization of prior year service benefit | (24 | ) | (27 | ) | (27 | ) | ||||||
Actuarial (gain) loss | 8,159 | 2,494 | (647 | ) | ||||||||
| ||||||||||||
Net periodic benefit cost | $ | 10,214 | $ | 4,536 | $ | 1,539 | ||||||
| ||||||||||||
The components of comprehensive income (loss) for our pension and other post-retirement plans for the years ended December 31, 2012, 2011 and 2010 are not material.
93
Pentair Ltd. and Subsidiaries
Notes to consolidated financial statements
The amounts in AOCI at December 31, 2012 and 2011 that have not yet been recognized inas components of net periodic benefit cost and includedthe amounts in accumulated other comprehensive income (pre-tax):
| Pension benefits | Post-retirement | |||||||||||||||
| In thousands | 2010 | 2009 | 2010 | 2009 | ||||||||||||
| Net transition obligation | $ | — | $ | 11 | $ | — | $ | — | ||||||||
| Prior service cost (benefit) | (162 | ) | 118 | (878 | ) | (905 | ) | |||||||||
| Net actuarial (gain) loss | 138,558 | 120,022 | (20,781 | ) | (23,429 | ) | ||||||||||
| Accumulated other comprehensive (income) loss | $ | 138,396 | $ | 120,151 | $ | (21,659 | ) | $ | (24,334 | ) | ||||||
| Pension | Post- | |||||||
| In thousands | benefits | retirement | ||||||
| Prior service cost (benefit) | $ | 1 | $ | (27 | ) | |||
| Net actuarial (gain) loss | 3,898 | (3,306 | ) | |||||
| Total estimated 2011 amortization | $ | 3,899 | $ | (3,333 | ) | |||
62
Assumptions
| In thousands | 2010 | 2009 | ||||||
| Beginning of the year | $ | (58,448 | ) | $ | (58,704 | ) | ||
| Additional prior service cost incurred during the year | 171 | 794 | ||||||
| Actuarial gains (losses) incurred during the year | (11,861 | ) | 1,500 | |||||
| Translation gains (losses) incurred during the year | (75 | ) | (63 | ) | ||||
| Amortization during the year: | ||||||||
| Transition obligation | 8 | 15 | ||||||
| Unrecognized prior service cost (benefit) | (12 | ) | (11 | ) | ||||
| Actuarial gains | (993 | ) | (1,979 | ) | ||||
| End of the year | $ | (71,210 | ) | $ | (58,448 | ) | ||
| Pension benefits | Post-retirement | |||||||||||||||||||||||
| Percentages | 2010 | 2009 | 2008 | 2010 | 2009 | 2008 | ||||||||||||||||||
| Discount rate | 5.90 | 6.00 | 6.50 | 5.90 | 6.00 | 6.50 | ||||||||||||||||||
| Rate of compensation increase | 4.00 | 4.00 | 4.00 | |||||||||||||||||||||
| U.S. pension plans | Non-U.S. pension plans | Other post-retirement plans | ||||||||||||||||
| Percentages | 2012 | 2011 | 2010 | 2012 | 2011 | 2010 | 2012 | 2011 | 2010 | |||||||||
Discount rate | 3.67 | 5.05 | 5.90 | 3.85 | 4.82 | 5.10 | 3.40 | 5.05 | 5.90 | |||||||||
Rate of compensation increase | 4.37 | 4.00 | 4.00 | 3.02 | 2.98 | 3.00 | — | — | — | |||||||||
| Weighted-average assumptions used to determine net periodic benefit cost for years ended December 31 were as follows: | ||||||||||||||||||
| U.S. pension plans | Non-U.S. pension plans | Other post- retirement plans | ||||||||||||||||
| Percentages | 2012 | 2011 | 2010 | 2012 | 2011 | 2010 | 2012 | 2011 | 2010 | |||||||||
Discount rate | 5.05 | 5.90 | 6.00 | 4.82 | 5.13 | 5.50 | 5.05 | 5.90 | 6.00 | |||||||||
Expected long-term return on plan assets | 7.50 | 8.00 | 8.50 | 4.09 | 4.50 | 4.50 | — | — | — | |||||||||
Rate of compensation increase | 4.21 | 4.00 | 4.00 | 2.98 | 2.98 | 3.00 | — | — | — | |||||||||
Uncertainty in the securities markets and U.S. economy could result in investment returns less than those assumed. Should the securities markets decline or medical and prescription drug costs increase at a rate greater than assumed, we would expect increasing annual combined net pension and other post-retirement costs for the next several years. Should actual experience differ from actuarial assumptions, used to determine the domesticprojected pension benefit obligation and net periodicpension cost and accumulated other post-retirement benefit obligation and other post-retirement benefit cost for years ending December 31 are as follows:
| Pension benefits | Post-retirement | |||||||||||||||||||||||
| Percentages | 2010 | 2009 | 2008 | 2010 | 2009 | 2008 | ||||||||||||||||||
| Discount rate | 6.00 | 6.50 | 6.50 | 6.00 | 6.50 | 6.50 | ||||||||||||||||||
| Expected long-term return on plan assets | 8.50 | 8.50 | 8.50 | |||||||||||||||||||||
| Rate of compensation increase | 4.00 | 4.00 | 5.00 | |||||||||||||||||||||
Discount raterates
The discount rate reflects the current rate at which the pension liabilities could be effectively settled at the end of the year based on our December 31 measurement date. The discount rate was determined by matching our expected benefit payments to payments from a stream of bonds rated AA or higher bonds available in the marketplace, adjusted to eliminate the effects of call provisions. This produced a discount rate for our U.S. pension plans of 3.67%, 5.05% and 5.90% in 2012, 2011 and 2010, 6.00% in 2009 and 6.50% in 2008.respectively. The discount rates on our foreignnon-U.S. pension plans ranged from 0.50 % to 4.50%, 0.75% to 5.00% and 0.75% to 5.40% in 2012, 2011 and 2010, 2.00% to 6.00% in 2009 and 2.00% to 6.25% in 2008.respectively. There are no other known or anticipated changes in our discount rate assumptionassumptions that will impact our pension expense in 2011.
Expected raterates of return
Our expected raterates of return on U.S. pension plan assets waswere 7.5%, 8.0% and 8.5% for 2012, 2011 and 2010, 2009 and 2008.respectively. The expected rate of return is designed to be a long-term assumption that may be subject to considerableyear-to-year variance from actual returns. In developing the expected long-term rate of return, we considered our historical returns, with consideration given to forecasted economic conditions, our asset allocations, input from external consultants and broader longer-term market indices. In 2010, theU.S. pension plan assets yielded returns of 10.8%, 7.8% and 11.2% in 2012, 2011 and returns2010, respectively. As a result of 19.5% in 2009our de-risking
94
Pentair Ltd. and a loss of 28.8% in 2008. OurSubsidiaries
Notes to consolidated financial statements
strategy to reduce U.S. pension plan, our expected rate of return on plan assets assumption is 8.0%3.75% for 2011.
63
Healthcare cost trend rates
The assumed health carehealthcare cost trend rates atfor other post-retirement plans as of December 31 arewere as follows:
| 2010 | 2009 | |||||||
| Health care cost trend rate assumed for next year | 7.50 | % | 7.70 | % | ||||
| Rate to which the cost trend rate is assumed to decline (the ultimate trend rate) | 4.50 | % | 4.50 | % | ||||
| Year that the rate reaches the ultimate trend rate | 2027 | 2027 | ||||||
| 2012 | 2011 | |||||||
Healthcare cost trend rate assumed for following year | 7.4 | % | 7.5 | % | ||||
Rate to which the cost trend rate is assumed to decline (the ultimate trend rate) | 4.5 | % | 4.5 | % | ||||
Year the cost trend rate reaches the ultimate trend rate | 2027 | 2027 | ||||||
The assumed health carehealthcare cost trend rates can have a significant effect on the amounts reported for health carehealthcare plans. A one-percentage-point change in the assumed health carehealthcare cost trend rates would have the following effects:
| 1-Percentage-Point | 1-Percentage-Point | |||||||
| In thousands | Increase | Decrease | ||||||
| Effect on total annual service and interest cost | $ | 51 | $ | (45 | ) | |||
| Effect on post-retirement benefit obligation | 750 | (667 | ) | |||||
| One Percentage Point | ||||||||
| In thousands | Increase | Decrease | ||||||
Increase (decrease) in annual service and interest cost | $ | 59 | $ | (52 | ) | |||
Increase (decrease) in other post-retirement benefit obligations | 2,748 | (2,390 | ) | |||||
Plan AssetsPension plans assets
Objective
The primary objective of our investment strategy is to meet the pension obligation to our employees at a reasonable cost to us. This is primarily accomplished through growth of capital and safety of the funds invested. The
During 2012, we adopted an investment strategy for our U.S. pension plans with a primary objective of preserving the funded status of the U.S. plans. This is achieved through investments in fixed interest instruments with interest rate sensitivity characteristics closely reflecting the interest rate sensitivity of our benefit obligations. Shifting of allocations away from equities to liability hedging fixed income investments is currently in progress. As equity investments are redeemed, proceeds are reinvested in fixed income instruments. After we have completed the transition, the U.S. pension plans will therefore be actively investedhave in excess of 90 percent allocation to achieve real growth of capital over inflation through appreciation of securities held and through the accumulation and reinvestment of dividend and interest income.
Asset allocation
Our actual overall asset allocation for theour U.S. and non-U.S. pension plans as compared to our investment policy goals isas of December 31 was as follows:
| Plan Assets | Target Allocation | |||||||||||||||
| Asset Class | 2010 | 2009 | 2010 | 2009 | ||||||||||||
| Equity Securities | 47 | % | 53 | % | 50 | % | 60 | % | ||||||||
| Fixed Income Investments | 37 | % | 22 | % | 40 | % | 30 | % | ||||||||
| Alternative Investments | 12 | % | 14 | % | 10 | % | 10 | % | ||||||||
| Cash | 4 | % | 11 | % | 0 | % | 0 | % | ||||||||
| U.S. pension plans | ||||||||||||||||
| Actual | Target | |||||||||||||||
| Percentages | 2012 | 2011 | 2012 | 2011 | ||||||||||||
Equity securities | 32% | 41% | — | 50% | ||||||||||||
Fixed income | 56% | 50% | 100% | 40% | ||||||||||||
Alternative | 7% | 6% | — | 10% | ||||||||||||
Cash | 5% | 3% | — | — | ||||||||||||
95
Pentair Ltd. and Subsidiaries
Notes to consolidated financial statements
| Non-U.S. pension plans | ||||||||||||||||
| Actual | Target | |||||||||||||||
| Percentages | 2012 | 2011 | 2012 | 2011 | ||||||||||||
Equity securities | 51 | % | 66 | % | 55 | % | 75 | % | ||||||||
Fixed income | 42 | % | 20 | % | 45 | % | 25 | % | ||||||||
Alternative | 3 | % | — | — | — | |||||||||||
Cash | 4 | % | 14 | % | — | — | ||||||||||
While the target allocations do not have a percentage allocated to cash, the plan assets will always include some cash due to cash flow requirements. In 2009, as a result
Fair value measurement
The fair values of our year end decision to make a $25 million
64
| Quoted Prices in | Significant | |||||||||||||||||||
| Active Markets for | Significant Other | Unobservable | ||||||||||||||||||
| Identical Assets | Observable Inputs | Inputs | ||||||||||||||||||
| In thousands | (Level 1) | (Level 2) | (Level 3) | Total | ||||||||||||||||
| Cash Equivalents | $ | — | $ | 13,803 | $ | — | $ | 13,803 | ||||||||||||
| Fixed Income: | ||||||||||||||||||||
| Corporate and Non U.S. Government | — | 42,544 | 284 | 42,828 | ||||||||||||||||
| U.S. Treasuries | — | 60,710 | — | 60,710 | ||||||||||||||||
| Mortgage-Backed Securities | — | 30,052 | 1,368 | 31,420 | ||||||||||||||||
| Other | — | 6,818 | 125 | 6,943 | ||||||||||||||||
| Global Equity Securities: | ||||||||||||||||||||
| Small Cap Equity | 7,982 | — | — | 7,982 | ||||||||||||||||
| Mid Cap Equity | 8,811 | — | — | 8,811 | ||||||||||||||||
| Large Cap Equity | — | 45,700 | — | 45,700 | ||||||||||||||||
| International Equity | 23,964 | 21,895 | — | 45,859 | ||||||||||||||||
| Long/short Equity | — | 56,639 | — | 56,639 | ||||||||||||||||
| Pentair Company Stock | 18,255 | — | — | 18,255 | ||||||||||||||||
| Other Investments | — | 33,542 | 12,991 | 46,533 | ||||||||||||||||
| Total as of December 31, 2010 | $ | 59,012 | $ | 311,703 | $ | 14,768 | $ | 385,483 | ||||||||||||
65
| December 31, 2012 | ||||||||||||||||
| In thousands | Level 1 | Level 2 | Level 3 | Total | ||||||||||||
Cash and cash equivalents | $ | 6,238 | $ | 21,235 | $ | — | $ | 27,473 | ||||||||
Fixed income: | ||||||||||||||||
Corporate and non U.S. government | — | 164,255 | — | 164,255 | ||||||||||||
U.S. treasuries | — | 69,375 | — | 69,375 | ||||||||||||
Mortgage-backed securities | — | 23,382 | — | 23,382 | ||||||||||||
Other | — | 28,111 | — | 28,111 | ||||||||||||
Global equity securities: | ||||||||||||||||
Mid cap equity | — | 6,726 | — | 6,726 | ||||||||||||
Large cap equity | — | 88,985 | — | 88,985 | ||||||||||||
International equity | — | 89,768 | — | 89,768 | ||||||||||||
Long/short equity | — | 47,597 | — | 47,597 | ||||||||||||
Other investments | — | 11,215 | 18,290 | 29,505 | ||||||||||||
| ||||||||||||||||
Total fair value of plan assets | $ | 6,238 | $ | 550,649 | $ | 18,290 | $ | 575,177 | ||||||||
| ||||||||||||||||
| December 31, 2011 | ||||||||||||||||
| In thousands | Level 1 | Level 2 | Level 3 | Total | ||||||||||||
Cash equivalents | $ | — | $ | 13,084 | $ | — | $ | 13,084 | ||||||||
Fixed income: | ||||||||||||||||
Corporate and non U.S. government | — | 76,046 | 150 | 76,196 | ||||||||||||
U.S. treasuries | — | 82,989 | — | 82,989 | ||||||||||||
Mortgage-backed securities | — | 40,286 | 629 | 40,915 | ||||||||||||
Other | — | 7,958 | 219 | 8,177 | ||||||||||||
Global equity securities: | ||||||||||||||||
Small cap equity | 7,094 | — | — | 7,094 | ||||||||||||
Mid cap equity | 7,528 | 4 | — | 7,532 | ||||||||||||
Large cap equity | — | 47,398 | — | 47,398 | ||||||||||||
International equity | 19,942 | 19,652 | — | 39,594 | ||||||||||||
Long/short equity | — | 56,575 | — | 56,575 | ||||||||||||
Pentair Ltd. common shares | 16,645 | — | — | 16,645 | ||||||||||||
Other investments | — | 4,563 | 19,009 | 23,572 | ||||||||||||
| ||||||||||||||||
Total fair value of plan assets | $ | 51,209 | $ | 348,555 | $ | 20,007 | $ | 419,771 | ||||||||
| ||||||||||||||||
96
Notes to consolidated financial statements — (continued)
| Quoted Prices in | Significant | |||||||||||||||||||
| Active Markets for | Significant Other | Unobservable | ||||||||||||||||||
| Identical Assets | Observable Inputs | Inputs | ||||||||||||||||||
| In thousands | (Level 1) | (Level 2) | (Level 3) | Total | ||||||||||||||||
| Cash Equivalents | $ | — | $ | 35,575 | $ | — | $ | 35,575 | ||||||||||||
| Fixed Income: | ||||||||||||||||||||
| Corporate and Non U.S. Government | — | 16,682 | 438 | 17,120 | ||||||||||||||||
| U.S. Treasuries | — | 28,675 | — | 28,675 | ||||||||||||||||
| Mortgage-Backed Securities | — | 21,636 | 2,109 | 23,745 | ||||||||||||||||
| Other | — | 3,952 | 192 | 4,144 | ||||||||||||||||
| Global Equity Securities: | ||||||||||||||||||||
| Small Cap Equity | 7,227 | — | — | 7,227 | ||||||||||||||||
| Mid Cap Equity | 8,389 | — | — | 8,389 | ||||||||||||||||
| Large Cap Equity | — | 39,569 | — | 39,569 | ||||||||||||||||
| International Equity | 21,665 | 19,955 | — | 41,620 | ||||||||||||||||
| Long/short Equity | — | 54,082 | — | 54,082 | ||||||||||||||||
| Pentair Company Stock | 21,742 | — | — | 21,742 | ||||||||||||||||
| Other Investments | — | 32,873 | 14,427 | 47,300 | ||||||||||||||||
| Total as of December 31, 2009 | $ | 59,023 | $ | 252,999 | $ | 17,166 | $ | 329,188 | ||||||||||||
Valuation methodologies used for investments measured at fair value arewere as follows:
| • | Cash |
| • | Fixed |
| • | Global |
| • | Other |
66
| Net realized | Net purchases, | Net | ||||||||||||||||||
| Balance | and unrealized | issuances and | transfers into | Balance | ||||||||||||||||
| January 1, 2010 | gains (losses) | settlements | (out of) level 3 | December 31, 2010 | ||||||||||||||||
| Other Investments | $ | 14,427 | $ | 678 | $ | (2,113 | ) | $ | — | $ | 12,992 | |||||||||
| Fixed Income Investments | 2,739 | 334 | (1,296 | ) | — | 1,777 | ||||||||||||||
| $ | 17,166 | $ | 1,012 | $ | (3,409 | ) | $ | — | $ | 14,769 | ||||||||||
| Net realized | Net purchases, | Net | ||||||||||||||||||
| Balance | and unrealized | issuances and | transfers into | Balance | ||||||||||||||||
| January 1, 2009 | gains (losses) | settlements | (out of) level 3 | December 31, 2009 | ||||||||||||||||
| Other Investments | $ | 32,083 | $ | (774 | ) | $ | — | $ | (16,882 | ) | $ | 14,427 | ||||||||
| Fixed Income Investments | 25,640 | 1,027 | — | (23,928 | ) | 2,739 | ||||||||||||||
| $ | 57,723 | $ | 253 | $ | — | $ | (40,810 | ) | $ | 17,166 | ||||||||||
| In thousands | January 1, 2012 | Net realized and unrealized gains (losses) | Net issuances and settlements | Net transfers into (out of) level 3 | December 31, 2012 | |||||||||||||||
Other investments | $ | 19,009 | $ | 1,051 | $ | (1,770 | ) | $ | — | $ | 18,290 | |||||||||
Fixed income investments | 998 | 22 | (1,020 | ) | — | — | ||||||||||||||
| ||||||||||||||||||||
Total | $ | 20,007 | $ | 1,073 | $ | (2,790 | ) | $ | — | $ | 18,290 | |||||||||
| ||||||||||||||||||||
| In thousands | January 1, 2011 | Net realized and unrealized gains (losses) | Net issuances and settlements | Net transfers into (out of) level 3 | December 31, 2011 | |||||||||||||||
Other investments | $ | 12,991 | $ | 251 | $ | 5,767 | $ | — | $ | 19,009 | ||||||||||
Fixed income investments | 1,777 | 87 | (866 | ) | — | 998 | ||||||||||||||
| ||||||||||||||||||||
Total | $ | 14,768 | $ | 338 | $ | 4,901 | $ | — | $ | 20,007 | ||||||||||
| ||||||||||||||||||||
Cash Flowsflows
Contributions
Pension contributions totaled $49.8$235.2 million and $49.0$37.1 million in 20102012 and 2009,2011, respectively. Our 20112013 required pension contributions are expected to be in the range of $25approximately $30 million to $30$35 million. The decrease in the 2011 expected contribution is primarily a result of the December 2010 accelerated contribution of $25 million to our defined benefit pension plan. The 20112013 expected contributions will equal or exceed our minimum funding requirements.
97
Pentair Ltd. and Subsidiaries
Notes to consolidated financial statements
Estimated Future Benefit Paymentsfuture benefit payments
The following benefit payments, which reflect expected future service, as appropriate, are expected to be paid by the plans for the years ended December 31 as follows:
| In millions | Pension benefits | Post-retirement | ||||||
| 2011 | $ | 34.2 | $ | 3.4 | ||||
| 2012 | 31.8 | 3.3 | ||||||
| 2013 | 32.8 | 3.2 | ||||||
| 2014 | 33.7 | 3.1 | ||||||
| 2015 | 35.8 | 3.0 | ||||||
| 2016-2020 | 212.7 | 13.4 | ||||||
| In millions | U.S. pension plans | Non-U.S. pension plans | Other post- retirement plans | |||||||||
2013 | $ | 7.5 | $ | 16.7 | $ | 4.5 | ||||||
2014 | 8.6 | 17.8 | 4.5 | |||||||||
2015 | 10.2 | 18.5 | 4.4 | |||||||||
2016 | 12.9 | 17.5 | 4.3 | |||||||||
2017 | 14.8 | 18.3 | 4.2 | |||||||||
2018-2022 | 103.3 | 105.7 | 19.6 | |||||||||
Savings plan
We have a 401(k) plan (“the 401(k) plan”) with an employee stockshare ownership (“ESOP”) bonus component, which covers certain union and nearly all non-union U.S. employees who meet certain age requirements. Under the 401(k) plan, eligible U.S. employees may voluntarily contribute a percentage of their eligible compensation. We match contributions made by employees who meet certain eligibility and service requirements. Our matching contribution is 100% of eligible employee contributions for the first 1% of eligible compensation and 50% of the next 5% of eligible compensation. In June 2009, we temporarily suspended the company match of the plan and ESOP. We reinstated the company match in 2010.
In addition to the matching contribution, all employees who meet certain service requirements receive a discretionary ESOP contribution equal to 1.5% of annual eligible compensation.
67
Additionally, we have a 401(k) plan acquired as part of the Merger (“the Flow 401(k) plan”) which covers certain union and all non-union U.S. employees who meet certain age requirements. Under the Flow 401(k) plan, eligible U.S. employees may voluntarily contribute a percentage of their eligible compensation. We match contributions made by employees who meet certain eligibility and service requirements. Our matching contribution is 500% of eligible employee contributions for the first 1% of eligible compensation. Additional company match is based on years of service, as follows: an additional 1% match at 10 – 19 years of service, an additional 2% match at 20 – 24 years, an additional 3% match at 25 – 29 years and an additional 4% match at 30+ years. Participants are 100% vested in the employer match after 3 years of service.
Other retirement compensation
Total other accrued retirement compensation, primarily related to deferred compensation and supplemental retirement plans, was $13.9$52.6 million and $17.3$12.6 million in 2010as of December 31, 2012 and 2009,2011, respectively, and is included in the pensionPension and other retirementpost-retirement compensation line of ourand benefits in the Consolidated Balance Sheet.
Multi-employer defined benefit plans
We participate in a number of multi-employer defined benefit plans on behalf of certain employees. Pension expense related to multi-employer plans was not material in 2012, 2011 and 2010.
98
Pentair Ltd. and Subsidiaries
Notes to consolidated financial statements
| 15. | |
| Shareholders’ Equity |
Authorized shares
Our authorized share capital consists of 213.0 million common shares with a par value of 0.50 Swiss francs per share. The board of directors is authorized to increase the total share capital until September 14, 2014 by a maximum amount of 106.5 million shares. In addition, our share capital may issue up to 250be increased by:
a maximum of 81.5 million shares upon the exercise of common stock. Our Boardconversion, option, exchange, warrant or similar rights for the subscription of Directors may designate upshares granted to 15 millionthird parties or shareholders in connection with bonds, notes, options, warrants or other securities issued by us in national or international capital markets or pursuant to our existing and future contractual obligations (“Rights Bearing Obligations”); and/or
a maximum of those shares as preferred stock. On December 10, 2004, the Board of Directors designated a new series of preferred stock with authorization to issue up to 2.525.0 million shares Series A Junior Participating Preferred Stock, par value $0.10 per share. No shares of preferred stock were issued or outstanding as of December 31, 2010 or December 31, 2009.
Share repurchases
In December 2007, the Board of Directors authorized the repurchase of shares of our common stock during 2008 up to a maximum dollar limit of $50 million. As of December 31, 2008, we had purchased 1,549,893 shares for $50.0 million pursuant to this authorization. This authorization expired on December 31, 2008. There were no share repurchase authorizations for 2009. On July 27, 2010, the Board of Directors authorized the repurchase of shares of our common stock up to a maximum dollar limit of $25 million. As of December 31, 20102011, we had repurchased 734,603389,300 shares for $25$12.5 million pursuant to this plan.authorization, which expired in December 2011. In December 2010,2011, the Board of Directors authorized the repurchase of shares of our common stock during 2011shares up to a maximum dollar limit of $25 million. No purchases were made under this authorization in 2012, and the authorization expired on September 28, 2012 in connection with the closing of the Merger.
Prior to the closing of the Merger, our board of directors, and Tyco as our sole shareholder, authorized the repurchase of our common shares with a maximum aggregate value of $400.0 million following the closing of the Merger. This authorization does not have an expiration date. On October 1, 2012, our board of directors authorized the repurchase of our common shares with a maximum aggregate value of $800.0 million. This authorization expires on December 31, 2015 and is in addition to the $400.0 million share repurchase authorization. As of December 31, 2012, we had repurchased 7,291,078 of our common shares for $334.2 million pursuant to these authorizations.
Dividends payable
Prior to the consummation of the Merger, our board of directors proposed, and Tyco as our then sole shareholder, authorized us to pay quarterly cash dividends through the first annual general meeting of our shareholders in 2013. The authorization expiresprovided that dividends of $0.68 per share will be made out of ourCapital contribution reserve equity position in our statutory accounts to our shareholders in quarterly installments of $0.22 for the fourth quarter of 2012 and $0.23 for each of the first and second quarters of 2013. The deduction from ourCapital contribution reserve in our statutory accounts, which is required to be made in Swiss francs, was determined based on the aggregate amount of the dividend and was calculated based on the U.S. dollar/Swiss franc exchange rate in effect on September 14, 2012 and subsequently adjusted for the actual shares outstanding and exchange rate in effect at the time of our fourth quarter dividend payment and again at December 2011.
68On February 26, 2013, our board of directors recommended that our shareholders approve at our 2013 annual meeting of shareholders a proposal to pay quarterly cash dividends through the second quarter of 2014. The proposal provides that dividends of $1.00 per share will be made out of ourCapital contribution reserve equity position in our statutory accounts to our shareholders in quarterly installments of $0.25 for each of the third and fourth quarters of 2013 and first and second quarters of 2014.
99
Notes to consolidated financial statements — (continued)
| 16. | |
Share-based compensation expense
Total stock-basedshare-based compensation expense infor 2012, 2011 and 2010 2009was $35.8 million, $19.5 million and 2008 was $21.5 million, $17.3respectively. The expense for 2012 included $13.5 million of expense due to the Merger triggering change of control provisions of Pentair, Inc. share-based compensation plans resulting in immediate vesting of certain outstanding awards.
Share Incentive Plans
Prior to the Merger, our board of directors approved, and $20.6 million, respectively.
The 2012 Plan is administered by our Compensation Committeecompensation committee (the “Committee”), which is made up of independent members of our Boardboard of Directors.directors. Employees eligible to receive awards under the 2012 Plan are managerial, administrative or other key employees who are in a position to make a material contribution to the continued profitable growth and long-term success of Pentair.our company. The Committee has the authority to select the recipients of awards, determine the type and size of awards, establish certain terms and conditions of award grants and take certain other actions as permitted under the 2012 Plan. The 2012 Plan restrictsprohibits the Committee’s authority to repriceCommittee from re-pricing awards or to cancelcancelling and reissuereissuing awards at lower prices.
In connection with the Distribution, we issued a total of $108.9 million like-kind equity-based awards under the 2012 Plan to former Tyco equity-based award holders in replacement of a portion of their Tyco equity-based awards. Such awards do not deplete the 9,000,000 of our common shares reserved for issuance under the 2012 Plan. Of the total issued, $37.8 million in like-kind equity-based awards were issued to former holders who are active employees of our company, and $71.1 million like-kind equity-based awards were issued to former holders who are not employees of our company. As no change of control provisions related to Tyco equity-based awards were triggered by the Distribution or the Merger, the original vesting and exercise term provisions remain in effect for all such replacement equity-based awards.
The 2008 Omnibus Stock Incentive Plan approved byas Amended and Restated (the “2008 Plan”) terminated upon the shareholders in 2004 (the “2004 Plan”) expired upon approvalcompletion of the 2008 Plan by shareholders.Merger. Prior grants of restricted stock units and stock options made under the 20042008 Plan and earlier stock incentive plans remained outstanding at completion of the Merger were converted into equity-based awards with respect to our common shares and were assumed by us on the terms in effect at the time of grant.
Non-qualified and incentive stock options
Under the 2012 Plan, we may grant stock options to any eligible employee with an exercise price equal to the market value of the shares on the dates the options were granted. Options generally vest over a three-year period commencing on the grant date and expire ten years after the grant date. Prior to 2006, option grants typically had a reload feature when shares are retired to pay the exercise price, allowing individuals to receive additional options upon exercise equal to the number of shares retired. Option awards granted after 2005 under the 2004 Plan and under the 2008 Plan do not have a reload feature attached to the option. Annual expense for the fair value of stock options was $11.6 million 2012, $8.9 million in 2011 and $10.7 million in 2010, $7.1 million in 2009 and $10.5 million in 2008.
Restricted shares and restricted stock units
Under the 2012 Plan, eligible employees aremay be awarded restricted shares or restricted stock units (awards) of our common stock. Share awardsRestricted shares and restricted stock units generally vest from two to five years after issuance, subject
100
Pentair Ltd. and Subsidiaries
Notes to consolidated financial statements
to continuous employment and certain other conditions. Restricted share awardsshares and restricted stock units are valued at market value on the date of grant and are expensed over the vesting period. Annual expense for the fair value of restricted shares and restricted stock units was $24.2 million in 2012, $10.6 million in 2011 and $10.8 million in 2010, $10.2 million in 2009 and $10.1 million in 2008.
69
Under the 2012 Plan, the Committee is permitted to issue these awards; however, there have been no issuances of these awards.
Stock options
The following table summarizes stock option activity under all plans:
| Weighted Average | ||||||||||||||||
| Weighted Average | Remaining | Aggregate | ||||||||||||||
| Options Outstanding | Shares | Exercise Price | Contractual Life | Intrinsic Value | ||||||||||||
Balance January 1, 2010 | 7,962,519 | $ | 30.70 | |||||||||||||
| Granted | 1,478,660 | 33.54 | ||||||||||||||
| Exercised | (678,627 | ) | 23.32 | |||||||||||||
| Forfeited | (112,528 | ) | 28.38 | |||||||||||||
| Expired | (682,608 | ) | 37.08 | |||||||||||||
Balance December 31, 2010 | 7,967,416 | $ | 31.34 | 6.0 | $ | 46,776,147 | ||||||||||
Options exercisable as of December 31, 2010 | 5,313,225 | $ | 31.80 | 4.6 | $ | 30,599,073 | ||||||||||
Options expected to vest as of December 31, 2010 | 2,608,273 | $ | 30.42 | 8.3 | $ | 16,177,074 | ||||||||||
Shares available for grant as of December 31, 2010 | 5,773,901 | |||||||||||||||
| Options outstanding | Shares | Weighted- average exercise price | Weighted- average remaining contractual life | Aggregate intrinsic value | ||||||||||||
Beginning balance | 7,837,696 | $ | 32.50 | |||||||||||||
Grants assumed in Merger | 2,791,678 | 28.04 | ||||||||||||||
Granted | 834,918 | 36.05 | ||||||||||||||
Exercised | (2,740,778 | ) | 29.60 | |||||||||||||
Forfeited | (83,994 | ) | 32.64 | |||||||||||||
Expired | (234,774 | ) | 38.88 | |||||||||||||
| ||||||||||||||||
Ending balance | 8,404,746 | $ | 32.13 | 5.3 | $ | 128,370,687 | ||||||||||
| ||||||||||||||||
Options exercisable as of December 31, 2012 | 6,931,146 | $ | 31.99 | 4.7 | $ | 105,758,171 | ||||||||||
| Options expected to vest as of December 31, 2012 | 1,422,898 | $ | 32.92 | 8.1 | $ | 21,763,738 | ||||||||||
Fair value of options granted
The weighted average grant date fair value of options granted under Pentair plans in 2012, 2011 and 2010 was estimated to be $9.63, $9.98 and $9.47 per share, respectively. The weighted-average grant date fair value of options grantedassumed in 2010, 2009 and 2008the Merger was estimated to be $9.47, $5.09 and $7.41 per share, respectively.$11.76. The total intrinsic value of options that were exercised during 2012, 2011 and 2010 2009 and 2008 was $7.4$41.6 million, $5.2$10.9 million and $6.3$7.4 million, respectively. At December 31, 2010,2012, the total unrecognized compensation cost related to stock options was $6.5$4.0 million. This cost is expected to be recognized over a weighted average period of 1.5 years.
We estimated the fair valuesvalue of each stock option award on the date of grant using thea Black-Scholes option-pricingoption pricing model, modified for dividends and using the following weighted average assumptions:
| 2010 | 2009 | 2008 | ||||||||||
| Risk-free interest rate | 2.45 | % | 1.77 | % | 2.78 | % | ||||||
| Expected dividend yield | 2.30 | % | 3.20 | % | 2.12 | % | ||||||
| Expected stock price volatility | 35.00 | % | 32.50 | % | 27.00 | % | ||||||
| Expected lives | 5.5 yrs | 5.2 yrs | 4.8 yrs | |||||||||
| December 31 | ||||||||||||||||
| 2012 | 2011 | 2010 | ||||||||||||||
| Assumed in Merger | Granted by Pentair plans | Granted by Pentair plans | Granted by Pentair plans | |||||||||||||
Risk-free interest rate | 0.02 - 0.68% | 0.96% | 1.51% | 2.45% | ||||||||||||
Expected dividend yield | 2.12% | 2.48% | 2.32% | 2.30% | ||||||||||||
Expected share price volatility | 33.00% | 36.50% | 35.50% | 35.00% | ||||||||||||
Expected term (years) | 0.1 - 5.1 | 5.7 | 5.5 | 5.5 | ||||||||||||
101
Pentair Ltd. and Subsidiaries
Notes to consolidated financial statements
These estimates require us to make assumptions based on historical results, observance of trends in our share price, changes in option exercise behavior, future expectations and other relevant factors. If other assumptions had been used, share-based compensation expense, as calculated and recorded under the accounting guidance, could have been affected.
We based the expected life assumption on historical experience as well as the terms and vesting periods of the options granted. For purposes of determining expected volatility, we considered a rolling average of historical volatility measured over a period approximately equal to the expected option term. The risk-free rate for periods that coincide with the expected life of the options is based on the U.S. Treasury Department yield curve in effect at the time of grant.
Cash received from option exercises for the years ended December 31, 2012, 2011 and 2010 2009 and 2008 was $14.9$91.6 million, $8.2$14.7 million and $5.6$14.9 million, respectively. The actual tax benefit realized for the tax deductions from option exercises totaled $2.8$12.2 million, $1.9$4.1 million and $2.0$2.8 million for the years ended December 31, 2012, 2011 and 2010, 2009respectively.
Restricted shares and 2008, respectively.
70
| Weighted Average | ||||||||
| Grant Date | ||||||||
| Restricted Shares Outstanding | Shares | Fair Value | ||||||
Balance January 1, 2010 | 1,278,054 | $ | 28.81 | |||||
| Granted | 476,840 | 33.66 | ||||||
| Vested | (376,219 | ) | 33.39 | |||||
| Forfeited | (69,272 | ) | 27.49 | |||||
Balance December 31, 2010 | 1,309,403 | $ | 29.33 | |||||
| Restricted shares and restricted stock units outstanding | Shares | Weighted average grant date fair value | ||||||
Beginning balance | 1,250,082 | $ | 30.49 | |||||
Grants assumed in Merger | 978,756 | 38.85 | ||||||
Granted | 863,310 | 41.56 | ||||||
Vested | (1,420,511 | ) | 33.17 | |||||
Forfeited | (78,359 | ) | 37.22 | |||||
| ||||||||
Ending balance | 1,593,278 | $ | 38.97 | |||||
| ||||||||
As of December 31, 2010,2012, there was $17.1$31.6 million of unrecognized compensation cost related to restricted share compensation arrangements granted under the 20042012 Plan and the 2008 Plan.previous plans. That cost is expected to be recognized over a weighted-average period of 2.32.5 years. The total fair value of shares vested during the years ended December 31, 2012, 2011 and 2010, 2009 and 2008, was $12.7$58.0 million, $5.5$10.2 million and $7.7$12.7 million, respectively. The actual tax benefitbenefits realized for the tax deductions fromrelated to restricted share compensation arrangements totaled $3.4$18.8 million, $2.2$3.6 million and $3.0$3.4 million for the years ended December 31, 2012, 2011 and 2010, 2009 and 2008, respectively.
| 17. | |
We classify our continuing operations into the following business segments based primarily on types of products offered and markets served:
| • | Water & Fluid Solutions— The Water & Fluid Solutions segment designs, manufactures, markets and |
| • | Valves & Controls— The Valves & Controls segment designs, manufactures, markets and services valves, fittings, automation and controls and actuators and operates as a stand-alone GBU. |
102
Pentair Ltd. and Subsidiaries
Notes to consolidated financial statements
| • | Technical |
| • | Other— Other is primarily composed of unallocated corporate expenses, our captive insurance subsidiary, intermediate finance companies, merger-related costs and divested operations. |
The accounting policies of our operatingreporting segments are the same as those described in the summary of significant accounting policies. We evaluate performance based on the sales and operating income of the segments and use a variety of ratios to measure performance. These results are not necessarily indicative of the results of operations that would have occurred had each segment been an independent, stand-alone entity during the periods presented.
71
| In thousands | 2010 | 2009 | 2008 | 2010 | 2009 | 2008 | ||||||||||||||||||
| Net sales to external customers | Operating income (loss) | |||||||||||||||||||||||
| Water Group | $ | 2,041,281 | $ | 1,847,764 | $ | 2,206,142 | $ | 231,588 | $ | 163,745 | $ | 206,357 | ||||||||||||
| Technical Products Group | 989,492 | 844,704 | 1,145,834 | 151,533 | 100,355 | 169,315 | ||||||||||||||||||
| Other | — | — | — | (48,966 | ) | (44,152 | ) | (50,987 | ) | |||||||||||||||
| Consolidated | $ | 3,030,773 | $ | 2,692,468 | $ | 3,351,976 | $ | 334,155 | $ | 219,948 | $ | 324,685 | ||||||||||||
| Identifiable assets(1) | Depreciation | |||||||||||||||||||||||
| Water Group | $ | 3,409,556 | $ | 3,205,774 | $ | 3,271,039 | $ | 37,449 | $ | 44,063 | $ | 39,237 | ||||||||||||
| Technical Products Group | 728,969 | 716,092 | 697,577 | 17,544 | 19,035 | 19,131 | ||||||||||||||||||
Other(1) | (164,992 | ) | (10,532 | ) | 84,597 | 3,002 | 1,725 | 1,305 | ||||||||||||||||
| Consolidated | $ | 3,973,533 | $ | 3,911,334 | $ | 4,053,213 | $ | 57,995 | $ | 64,823 | $ | 59,673 | ||||||||||||
| Amortization | Capital expenditures | |||||||||||||||||||||||
| Water Group | $ | 22,981 | $ | 34,919 | $ | 22,062 | $ | 39,631 | $ | 36,513 | $ | 32,916 | ||||||||||||
| Technical Products Group | 2,610 | 2,687 | 2,980 | 8,336 | 15,388 | 15,995 | ||||||||||||||||||
| Other | 593 | 3,051 | 2,566 | 11,556 | 2,236 | 4,178 | ||||||||||||||||||
| Consolidated | $ | 26,184 | $ | 40,657 | $ | 27,608 | $ | 59,523 | $ | 54,137 | $ | 53,089 | ||||||||||||
| In thousands | 2010 | 2009 | 2008 | 2010 | 2009 | 2008 | ||||||||||||||||||
| Net sales to external customers | Long-lived assets | |||||||||||||||||||||||
| U.S. | $ | 2,222,856 | $ | 1,964,138 | $ | 2,467,698 | $ | 196,440 | $ | 203,206 | $ | 219,013 | ||||||||||||
| Europe | 470,879 | 439,312 | 571,164 | 77,000 | 87,880 | 89,300 | ||||||||||||||||||
| Asia and other | 337,038 | 289,018 | 313,114 | 55,995 | 42,602 | 35,568 | ||||||||||||||||||
| Consolidated | $ | 3,030,773 | $ | 2,692,468 | $ | 3,351,976 | $ | 329,435 | $ | 333,688 | $ | 343,881 | ||||||||||||
| In thousands | 2012 | 2011 | 2010 | 2012 | 2011 | 2010 | ||||||||||||||||||
| Net sales to external customers | Operating income (loss) | |||||||||||||||||||||||
Water & Fluid Solutions | $ | 2,638,403 | $ | 2,369,804 | $ | 2,041,281 | $ | 168,043 | $ | 58,311 | $ | 231,588 | ||||||||||||
Valves & Controls | 546,707 | — | — | (76,843 | ) | — | — | |||||||||||||||||
Technical Solutions | 1,231,036 | 1,086,882 | 989,492 | 165,017 | 185,240 | 151,533 | ||||||||||||||||||
Other | — | — | — | (299,336 | ) | (143,348 | ) | (70,138 | ) | |||||||||||||||
| ||||||||||||||||||||||||
Consolidated | $ | 4,416,146 | $ | 3,456,686 | $ | 3,030,773 | $ | (43,119 | ) | $ | 100,203 | $ | 312,983 | |||||||||||
| ||||||||||||||||||||||||
| Identifiable assets(1) | Depreciation | |||||||||||||||||||||||
Water & Fluid Solutions | $ | 4,734,992 | $ | 3,792,188 | $ | 3,409,556 | $ | 45,736 | $ | 42,419 | $ | 37,449 | ||||||||||||
Valves & Controls | 4,283,521 | — | — | 15,119 | — | — | ||||||||||||||||||
Technical Solutions | 2,128,375 | 651,693 | 728,969 | 18,950 | 17,826 | 17,544 | ||||||||||||||||||
Other | 648,423 | 142,432 | (164,992 | ) | 8,030 | 5,990 | 3,002 | |||||||||||||||||
| ||||||||||||||||||||||||
Consolidated | $ | 11,795,311 | $ | 4,586,313 | $ | 3,973,533 | $ | 87,835 | $ | 66,235 | $ | 57,995 | ||||||||||||
| ||||||||||||||||||||||||
| Amortization | Capital expenditures | |||||||||||||||||||||||
Water & Fluid Solutions | $ | 38,159 | $ | 39,451 | $ | 22,981 | $ | 49,890 | $ | 49,241 | $ | 39,631 | ||||||||||||
Valves & Controls | 21,696 | — | — | 21,992 | — | — | ||||||||||||||||||
Technical Solutions | 16,102 | 2,446 | 2,610 | 13,565 | 15,806 | 8,336 | ||||||||||||||||||
Other | — | — | 593 | 9,085 | 8,301 | 11,556 | ||||||||||||||||||
| ||||||||||||||||||||||||
Consolidated | $ | 75,957 | $ | 41,897 | $ | 26,184 | $ | 94,532 | $ | 73,348 | $ | 59,523 | ||||||||||||
| ||||||||||||||||||||||||
| (1) | All cash and cash equivalents are included in |
103
Pentair Ltd. and Subsidiaries
Notes to consolidated financial statements
The following tables present certain geographic information:
| In thousands | 2012 | 2011 | 2010 | |||||||||
| Net sales to external customers | ||||||||||||
U.S. | $ | 2,624,338 | $ | 2,336,845 | $ | 2,222,856 | ||||||
Europe | 912,642 | 701,865 | 470,879 | |||||||||
Asia and other | 879,166 | 417,976 | 337,038 | |||||||||
| ||||||||||||
Consolidated | $ | 4,416,146 | $ | 3,456,686 | $ | 3,030,773 | ||||||
| ||||||||||||
| Long-lived assets | ||||||||||||
U.S. | $ | 389,463 | $ | 195,631 | $ | 196,440 | ||||||
Europe | 403,156 | 140,290 | 77,000 | |||||||||
Australia | 170,714 | 461 | 772 | |||||||||
Asia and other | 261,155 | 51,143 | 55,223 | |||||||||
| ||||||||||||
Consolidated | $ | 1,224,488 | $ | 387,525 | $ | 329,435 | ||||||
| ||||||||||||
Net sales are based on the location in which the sale originated. Long-lived assets represent property, plant and equipment, net of related depreciation.
We offer a broad array of products and systems to multiple markets and customers for which we do not have the information systems to track revenues by primary product category. However, our net sales by segment are representative of our sales by major product category.
We sell our products through various distribution channels including wholesale and retail distributors, original equipment manufacturers and home centers. In our Water segment, one customer accounted for approximately 10% of segment sales in 2010,& Fluid Solutions, no single customer accounted for more than 10% of segment sales in 20092012 and one customer accounted for just over 10% of segment sales in 2008.201l and 2010. In our Technical Products segment,Solutions and Valves & Controls, no single customer accounted for more than 10% of segment sales in 2010, 20092012, 2011 or 2008.
72
| 18. | |
| Commitments and Contingencies |
Operating lease commitments
Net rental expense under operating leases for the years ended December 31 was as follows:
| In thousands | 2010 | 2009 | 2008 | |||||||||
| Gross rental expense | $ | 32,662 | $ | 32,799 | $ | 37,519 | ||||||
| Sublease rental income | (225 | ) | (74 | ) | (172 | ) | ||||||
| Net rental expense | $ | 32,437 | $ | 32,725 | $ | 37,347 | ||||||
| In thousands | 2012 | 2011 | 2010 | |||||||||
Gross rental expense | $ | 45,327 | $ | 39,808 | $ | 32,662 | ||||||
Sublease rental income | (499 | ) | (455 | ) | (225 | ) | ||||||
| ||||||||||||
Net rental expense | $ | 44,828 | $ | 39,353 | $ | 32,437 | ||||||
| ||||||||||||
Future minimum lease commitments under non-cancelable operating leases, principally related to facilities, machinery, equipment and vehicles and machinery and equipment areas of December 31, 2012 were as follows:
| In thousands | 2011 | 2012 | 2013 | 2014 | 2015 | Thereafter | Total | |||||||||||||||||||||
| Minimum lease payments | $ | 21,697 | $ | 17,673 | $ | 12,404 | $ | 9,421 | $ | 7,465 | $ | 11,865 | $ | 80,525 | ||||||||||||||
| Minimum sublease rentals | (609 | ) | (152 | ) | (154 | ) | �� | (84 | ) | (7 | ) | — | (1,006 | ) | ||||||||||||||
| Net future minimum lease commitments | $ | 21,088 | $ | 17,521 | $ | 12,250 | $ | 9,337 | $ | 7,458 | $ | 11,865 | $ | 79,519 | ||||||||||||||
| In thousands | 2013 | 2014 | 2015 | 2016 | 2017 | Thereafter | Total | |||||||||||||||||||||
Minimum lease payments | $ | 52,566 | $ | 40,454 | $ | 28,883 | $ | 20,800 | $ | 16,409 | $ | 31,831 | $ | 190,943 | ||||||||||||||
Minimum sublease rentals | (260 | ) | (264 | ) | (98 | ) | (85 | ) | (87 | ) | - | (794 | ) | |||||||||||||||
| ||||||||||||||||||||||||||||
Net future minimum lease commitments | $ | 52,306 | $ | 40,190 | $ | 28,785 | $ | 20,715 | $ | 16,322 | $ | 31,831 | $ | 190,149 | ||||||||||||||
| ||||||||||||||||||||||||||||
104
EnvironmentalPentair Ltd. and Subsidiaries
Notes to consolidated financial statements
Asbestos Matters
Our subsidiaries and numerous other companies are named as defendants targets,in personal injury lawsuits based on alleged exposure to asbestos-containing materials. These cases typically involve product liability claims based primarily on allegations of manufacture, sale or PRPsdistribution of industrial products that either contained asbestos or were attached to or used with asbestos-containing components manufactured by third-parties. Each case typically names between dozens to hundreds of corporate defendants. While we have observed an increase in a smallthe number of environmentalclean-ups,these lawsuits over the past several years, including lawsuits by plaintiffs with mesothelioma-related claims, a large percentage of these suits have not presented viable legal claims and, as a result, have been dismissed by the courts. Our historical strategy has been to mount a vigorous defense aimed at having unsubstantiated suits dismissed, and, where appropriate, settling suits before trial. Although a large percentage of litigated suits have been dismissed, we cannot predict the extent to which we will be successful in resolving lawsuits in the future.
As of December 31, 2012, there were approximately 1,900 lawsuits pending against our subsidiaries. A lawsuit might include several claims, and we have approximately 2,300 claims outstanding as of December 31, 2012. This amount is not adjusted for claims that are not actively being prosecuted, identified incorrect defendants, or duplicated other actions, which would ultimately reflect our current estimate of the number of viable claims made against us, our affiliates, or former business unitsentities for which we assumed responsibility in connection with acquisitions or divestitures. In addition, the amount does not include certain claims pending against third parties for which we have generally been givende minimisstatus. To date, noneprovided an indemnification.
Periodically, we perform an analysis with the assistance of outside counsel and other experts to update our estimated asbestos-related assets and liabilities. Our estimate of the liability and corresponding insurance recovery for pending and future claims and defense costs is based on our historical claim experience and estimates of the number and resolution cost of potential future claims that may be filed. Our legal strategy for resolving claims also impacts these estimates.
Our estimate of asbestos-related insurance recoveries represents estimated amounts due to us for previously paid and settled claims have resulted inclean-up costs, fines, penalties, or damages in an amount materialand the probable reimbursements relating to our financial position or resultsestimated liability for pending and future claims. In determining the amount of operations. We have disposed ofinsurance recoverable, we consider a number of businessesfactors, including available insurance, allocation methodologies and the solvency and creditworthiness of insurers.
Our estimated liability for asbestos-related claims was $234.6 million and $0.6 million as of December 31, 2012 and 2011, respectively, and was recorded inOther non-current liabilities in the pastConsolidated Balance Sheets for pending and future claims and related defense costs. Our estimated receivable for insurance recoveries was $157.4 million at December 31, 2012, all of which was acquired in certain cases, suchthe Merger, and was recorded inOther non-current assets in the Consolidated Balance Sheets. We had no estimated receivable for insurance recoveries as of December 31, 2011.
The amounts recorded by us for asbestos-related liabilities and insurance-related assets are based on our strategies for resolving our asbestos claims and currently available information as well as estimates and assumptions. Key variables and assumptions include the dispositionnumber and type of new claims filed each year, the average cost of resolution of claims, the resolution of coverage issues with insurance carriers, the amounts of insurance and the related solvency risk with respect to our insurance carriers, and the indemnifications we have provided to third parties. Furthermore, predictions with respect to these variables are subject to greater uncertainty in the latter portion of the Cross Pointe Paper Corporation uncoated paper business in 1995,projection period. Other factors that may affect our liability and cash payments for asbestos-related matters include uncertainties surrounding the dispositionlitigation process from jurisdiction to jurisdiction and from case to case, reforms of the Federal Cartridge Company ammunition business in 1997, the disposition of Lincoln Industrial in 2001state or federal tort legislation and the dispositionapplicability of the Tools Groupinsurance policies among subsidiaries. As a result, actual liabilities or insurance recoveries could be significantly higher or lower than those recorded if assumptions used in 2004, weour calculations vary significantly from actual results.
105
Pentair Ltd. and Subsidiaries
Notes to consolidated financial statements
Environmental Matters
We are involved in or have retained responsibility and potential liability for environmental obligations and legal proceedings related to our current business and, including pursuant to certain indemnification obligations, related to certain formerly owned businesses. We are responsible, or alleged to be responsible, for ongoing environmental obligations.investigation and/or remediation of sites in several countries. These sites are in various stages of investigation and/or remediation and at some of these sites our liability is considered de minimis. We received notification from the U.S. Environmental Protection Agency and from similar state and non-U.S. environmental agencies, that several sites formerly or currently owned and/or operated by us, and other properties or water supplies that may be or may have been impacted from those operations, contain disposed or recycled materials or waste and require environmental investigation and/or remediation. Those sites include instances where we have been identified as a potentially responsible party under U.S. federal, state and/or non-U.S. environmental laws and regulations. For several formerly owned businesses, we have also received claims for indemnification from purchasers of these businesses and have established what we believe to be adequatebusinesses.
Our accruals for potential liabilities arising out of retained responsibilities. We settled some of the claims in prior years; to date our recorded accruals have been adequate.
73
Compliance Matters
Prior to the Merger, the Flow Control business was subject to investigations by the U.S. Department of Justice (“DOJ”) and the SEC related to allegations that improper payments were made by the Flow Control business and other Tyco subsidiaries and third-party intermediaries in recent years in violation of the Tools GroupForeign Corrupt Practices Act. Tyco reported to the DOJ and we retained responsibility for certain product claims. We have not experienced significant unfavorable trendsthe SEC the remedial measures that it had taken in eitherresponse to the severity or frequency of product liability lawsuits or personal injury claims.
Other Matters
In addition to the matters described above, from time to time, we recordedare subject to disputes, administrative proceedings and other claims arising out of the normal conduct of our business. These matters generally relate to disputes arising out of the use or installation of our products, product liability litigation, personal injury claims, commercial and contract disputes and employment related matters. On the basis of information currently available to it, management does not believe that existing proceedings and claims will have a charge of $20.4 million in 2008 whichmaterial impact on our Consolidated Financial Statements. However, litigation is shown on the lineLegal settlementin the Consolidated Statements of Income.
Warranties and guarantees
In connection with the disposition of our businesses or product lines, we may agree to indemnify purchasers for various potential liabilities relating to the sold business, such as pre-closing tax, product liability, warranty, environmental, or other obligations. The subject matter, amounts and duration of any such indemnification obligations vary for each type of liability indemnified and may vary widely from transaction to transaction.
106
Pentair Ltd. and Subsidiaries
Notes to consolidated financial statements
Generally, the maximum obligation under such indemnifications is not explicitly stated and as a result, the overall amount of these obligations cannot be reasonably estimated. Historically, we have not made significant payments for these indemnifications. We believe that if we were to incur a loss in any of these matters, the loss would not have a material effect on our financial condition or results of operations.
We recognize, at the inception of a guarantee, a liability for the fair value of the obligation undertaken in issuing the guarantee.
We provide service and warranty policies on our products. Liability under service and warranty policies is based upon a review of historical warranty and service claim experience. Adjustments are made to accruals as claim data and historical experience warrant.
74
| In thousands | 2010 | 2009 | ||||||
| Balance at beginning of the year | $ | 24,288 | $ | 31,559 | ||||
| Service and product warranty provision | 56,553 | 55,232 | ||||||
| Payments | (50,729 | ) | (62,672 | ) | ||||
| Acquired | — | 23 | ||||||
| Translation | (62 | ) | 146 | |||||
| Balance at end of the period | $ | 30,050 | $ | 24,288 | ||||
| Years ended December 31 | ||||||||
| In thousands | 2012 | 2011 | ||||||
Beginning balance | $ | 29,355 | $ | 30,050 | ||||
Service and product warranty provision | 55,710 | 50,096 | ||||||
Payments | (53,328 | ) | (53,937 | ) | ||||
Acquired | 21,529 | 3,575 | ||||||
Translation | 430 | (429 | ) | |||||
| ||||||||
Ending balance | $ | 53,696 | $ | 29,355 | ||||
| ||||||||
Stand-by lettersLetters of creditCredit, Bank Guarantees and bondsBonds
In certain situations, Tyco guaranteed Flow Control’s performance to third parties or provided financial guarantees for financial commitments of Flow Control. In situations where Flow Control and Tyco were unable to obtain a release from these guarantees in connection with the spin-off, we will indemnify Tyco for any losses it suffers as a result of such guarantees.
In disposing of assets or businesses, we often provide representations, warranties and indemnities to cover various risks including unknown damage to the assets, environmental risks involved in the sale of real estate, liability to investigate and remediate environmental contamination at waste disposal sites and manufacturing facilities and unidentified tax liabilities and legal fees related to periods prior to disposition. We do not have the ability to reasonably estimate the potential liability due to the inchoate and unknown nature of these potential liabilities. However, we have no reason to believe that these uncertainties would have a material adverse effect on our financial position, results of operations or cash flows.
In the ordinary course of business, we are required to commit to bonds, letters of credit and bank guarantees that require payments to our customers for any non-performance. The outstanding face value of the bondsthese instruments fluctuates with the value of our projects in process and in our backlog. In addition, we issue financial stand-by letters of credit primarily to secure our performance to third parties under self-insurance programs.
As of December 31, 20102012 and December 31, 2009,2011, the outstanding value of these instrumentsbonds, letters of credit and bank guarantees totaled $116.5$493.2 million and $51.2$136.2 million, respectively.
107
Pentair Ltd. and Subsidiaries
Notes to consolidated financial statements
| 19. | |
| Selected Quarterly |
2012 and 2011 quarterly financial information:
| 2010 | ||||||||||||||||||||
| In thousands, except per-share data | First | Second | Third | Fourth | Year | |||||||||||||||
| Net sales | $ | 707,013 | $ | 796,167 | $ | 773,735 | $ | 753,858 | $ | 3,030,773 | ||||||||||
| Gross profit | 213,702 | 248,168 | 236,542 | 232,228 | 930,640 | |||||||||||||||
| Operating income | 63,601 | 100,126 | 90,823 | 79,605 | 334,155 | |||||||||||||||
| Income from continuing operations | 36,029 | 61,612 | 55,729 | 49,577 | 202,947 | |||||||||||||||
| Gain (loss) on disposal of discontinued operations, net of tax | 524 | 593 | 549 | (2,292 | ) | (626 | ) | |||||||||||||
| Net income from continuing operations attributable to Pentair, Inc. | 34,797 | 60,488 | 54,501 | 48,668 | 198,454 | |||||||||||||||
Earnings per common share attributable to Pentair, Inc.(1) | ||||||||||||||||||||
Basic | ||||||||||||||||||||
| Continuing operations | $ | 0.35 | $ | 0.61 | $ | 0.55 | $ | 0.50 | $ | 2.02 | ||||||||||
| Discontinued operations | 0.01 | 0.01 | 0.01 | (0.02 | ) | (0.01 | ) | |||||||||||||
| Basic earnings per common share | $ | 0.36 | $ | 0.62 | $ | 0.56 | $ | 0.48 | $ | 2.01 | ||||||||||
Diluted | ||||||||||||||||||||
| Continuing operations | $ | 0.35 | $ | 0.61 | $ | 0.55 | $ | 0.49 | $ | 2.00 | ||||||||||
| Discontinued operations | 0.01 | — | — | (0.02 | ) | (0.01 | ) | |||||||||||||
| Diluted earnings per common share | $ | 0.36 | $ | 0.61 | $ | 0.55 | $ | 0.47 | $ | 1.99 | ||||||||||
| 2012 | ||||||||||||||||||||
| In thousands, except per-share data | First | Second | Third | Fourth | Year | |||||||||||||||
Net sales | $ | 858,177 | $ | 941,525 | $ | 865,512 | $ | 1,750,932 | $ | 4,416,146 | ||||||||||
Gross profit | 280,719 | 312,128 | 278,077 | 398,668 | 1,269,592 | |||||||||||||||
| Operating income (loss) | 86,474 | 119,314 | 55,199 | (304,106 | ) | (43,119 | ) | |||||||||||||
| Net income (loss) before noncontrolling interest | 63,099 | 74,430 | 32,595 | (274,736 | ) | (104,612 | ) | |||||||||||||
| Net income (loss) attributable to Pentair Ltd. | 61,759 | 72,775 | 31,363 | (273,083 | ) | (107,186 | ) | |||||||||||||
| Earnings (loss) per common share attributable to Pentair Ltd. (1) | ||||||||||||||||||||
| Basic | $ | 0.63 | $ | 0.73 | $ | 0.31 | $ | (1.31 | ) | $ | (0.84 | ) | ||||||||
| Diluted | 0.62 | 0.72 | 0.31 | (1.31 | ) | (0.84 | ) | |||||||||||||
| 2011 | ||||||||||||||||||||
| In thousands, except per-share data | First | Second | Third | Fourth | Year | |||||||||||||||
| Net sales | $ | 790,273 | $ | 910,175 | $ | 890,546 | $ | 865,692 | $ | 3,456,686 | ||||||||||
| Gross profit | 249,059 | 287,736 | 272,062 | 264,865 | 1,073,722 | |||||||||||||||
| Operating income (loss) | 85,469 | 108,714 | 92,195 | (186,175 | ) | 100,203 | ||||||||||||||
| Net income (loss) before noncontrolling interest | 51,602 | 67,705 | 51,610 | (174,068 | ) | (3,151 | ) | |||||||||||||
| Net income (loss) attributable to Pentair Ltd. | 50,109 | 66,280 | 50,648 | (174,487 | ) | (7,450 | ) | |||||||||||||
| Earnings (loss) per common share attributable to Pentair Ltd. (1) | ||||||||||||||||||||
| Basic | $ | 0.51 | $ | 0.67 | $ | 0.51 | $ | (1.77 | ) | $ | (0.08 | ) | ||||||||
Diluted | 0.50 | 0.66 | 0.50 | (1.77 | ) | (0.08 | ) | |||||||||||||
| (1) | Amounts may not total to annual earnings because each quarter and year are calculated separately based on basic and diluted weighted-average common shares outstanding during that period. |
75Third quarter 2012 includes a decrease in operating income of $52.7 million due to costs and expenses related to the Merger.
Fourth quarter 2012 includes the results of the operations acquired in the Merger. Flow Control’s net sales and net loss from continuing operations for the period from the acquisition date to December 31, 2012 were $886.5 million and $117.0 million, respectively. Fourth quarter 2012 also includes decreases in operating income related to the changes in accounting for pension and post-retirement benefit plans of $146.3 million, inventory step-up and customer backlog related to the Merger of $179.6 million, loss on early extinguishment of debt of $75.4 million, a pre-tax non-cash impairment charge of $60.7 million related to trade name intangibles, restructuring costs of $55.3 million and acquisition costs and expenses of $12.0 million.
Fourth quarter 2011 includes decreases in operating income related to the changes in accounting for our pension and post-retirement benefit plans of $66.2 million and a pre-tax non-cash impairment charge of $200.5 million related to goodwill.
108
Notes to consolidated financial statements — (continued)
Our operating income (loss), net income (loss) before noncontrolling interest, net income (loss) attributable to Pentair Ltd., and earnings (loss) per share have all been revised for the retrospective application of our changes in accounting policy for recognizing the expense associated with our pension and other post-retirement benefit plans. See Note 3 for additional information. The following table representsimpact of these accounting policy changes revised our previously reported information by the 2009following:
Increase (reduction) to previously reported quarterly financial information:
| 2009 | ||||||||||||||||||||
| In thousands, except per-share data | First | Second | Third | Fourth | Year | |||||||||||||||
| Net sales | $ | 633,840 | $ | 693,712 | $ | 662,665 | $ | 702,251 | $ | 2,692,468 | ||||||||||
| Gross profit | 169,232 | 196,479 | 206,967 | 212,457 | 785,135 | |||||||||||||||
| Operating income | 37,214 | 63,560 | 66,682 | 52,492 | 219,948 | |||||||||||||||
| Income from continuing operations | 17,721 | 32,427 | 38,677 | 27,394 | 116,219 | |||||||||||||||
| Gain (loss) on disposal of discontinued operations, net of tax | 10 | (78 | ) | (85 | ) | 134 | (19 | ) | ||||||||||||
| Net income from continuing operations attributable to to Pentair, Inc. | 17,255 | 32,006 | 37,033 | 29,218 | 115,512 | |||||||||||||||
Earnings per common share attributable to Pentair, Inc.(1) | ||||||||||||||||||||
Basic | ||||||||||||||||||||
| Continuing operations | $ | 0.18 | $ | 0.33 | $ | 0.38 | $ | 0.30 | $ | 1.19 | ||||||||||
| Discontinued operations | — | — | — | — | — | |||||||||||||||
| Basic earnings per common share | $ | 0.18 | $ | 0.33 | $ | 0.38 | $ | 0.30 | $ | 1.19 | ||||||||||
Diluted | ||||||||||||||||||||
| Continuing operations | $ | 0.18 | $ | 0.33 | $ | 0.38 | $ | 0.29 | $ | 1.17 | ||||||||||
| Discontinued operations | — | — | — | — | — | |||||||||||||||
| Diluted earnings per common share | $ | 0.18 | $ | 0.33 | $ | 0.38 | $ | 0.29 | $ | 1.17 | ||||||||||
| 2012 | ||||||||||||||||||||
| In thousands, except per-share data | First | Second | Third | Fourth | Year | |||||||||||||||
| Operating income (loss) | $ | 1,522 | $ | 1,522 | $ | 1,522 | $ | (146,304 | ) | $ | (141,738 | ) | ||||||||
| Net income (loss) before noncontrolling interest | 945 | 945 | 945 | (89,296 | ) | (86,461 | ) | |||||||||||||
| Net income (loss) attributable to Pentair Ltd. | 945 | 945 | 945 | (89,296 | ) | (86,461 | ) | |||||||||||||
| Earnings (loss) per common share attributable to Pentair Ltd. (1) | ||||||||||||||||||||
| Basic | $ | 0.01 | $ | 0.01 | $ | 0.01 | $ | (0.43 | ) | $ | (0.68 | ) | ||||||||
| Diluted | 0.01 | 0.01 | 0.01 | (0.43 | ) | (0.68 | ) | |||||||||||||
| 2011 | ||||||||||||||||||||
| In thousands, except per-share data | First | Second | Third | Fourth | Year | |||||||||||||||
| Operating income (loss) | $ | (708 | ) | $ | (708 | ) | $ | (708 | ) | $ | (66,190 | ) | $ | (68,314 | ) | |||||
| Net income (loss) before noncontrolling interest | (432 | ) | (432 | ) | (432 | ) | (40,376 | ) | (41,672 | ) | ||||||||||
| Net income (loss) attributable to Pentair Ltd. | (432 | ) | (432 | ) | (432 | ) | (40,376 | ) | (41,672 | ) | ||||||||||
| Earnings (loss) per common share attributable to Pentair Ltd. (1) | ||||||||||||||||||||
Basic | $ | (0.01 | ) | $ | (0.01 | ) | $ | (0.01 | ) | $ | (0.41 | ) | $ | (0.42 | ) | |||||
Diluted | (0.01 | ) | (0.01 | ) | (0.01 | ) | (0.41 | ) | (0.42 | ) | ||||||||||
| (1) | Amounts may not total to annual earnings because each quarter and year are calculated separately based on basic and diluted weighted-average common shares outstanding during that period. |
76
| 20. | Financial Statements of Parent Company Guarantor |
Pentair Ltd. (the “Parent Company Guarantor”), fully and unconditionally, guarantees the 1.35% Senior Notes due 2015, 1.875% Senior Notes due 2017, 2.65% Senior Notes due 2019, 5.00% Senior Notes due 2021 and 3.15% Senior Notes due 2022 (collectively, the “Notes”) of Pentair Finance S.A. (the “Subsidiary Issuer”). The Subsidiary Issuer is a Luxembourg public limited liability company formed in January 2012 and 100 percent-owned subsidiary of the Parent Company Guarantor.
The following supplemental financial information sets forth the financial information of:
Parent Company Guarantor;
Subsidiary Issuer;
Non-guarantor Subsidiaries of Pentair Ltd. on a combined basis;
109
Pentair Ltd. and Subsidiaries
Notes to consolidated financial statements
Consolidating entries and eliminations representing adjustments to:
| a. | eliminate intercompany transactions between or among the Parent Company Guarantor, the Subsidiary Issuer and the non-guarantor subsidiaries; |
| b. | eliminate the investments in subsidiaries; and |
| c. | record consolidating entries. |
Pentair Ltd. and subsidiaries on a consolidated basis.
Each entity in the consolidating financial information follows the same accounting policies as described in Note 2.
The following present the Company’s Condensed Consolidating Statement of Operations and Comprehensive Income (Loss), Condensed Consolidating Balance Sheet and Condensed Consolidating Statement of Cash Flows as of and for the year ended December 31, 2012. Since the Parent Company Guarantor and the Subsidiary Issuer were acquired in the Merger, there was no guarantee of the Notes in effect in prior periods. The historical consolidated financial statements of Pentair Ltd. prior to the Merger include all non-guarantor subsidiaries. Consequently, no consolidating financial information for the years ended December 31, 2011 and 2010 is presented.
110
Pentair Ltd. and Subsidiaries
Notes to consolidated financial statements
Pentair Ltd. and Subsidiaries
Condensed Consolidating Statement of Operations and Comprehensive Income (Loss)
Year ended December 31, 2012
| In thousands | Parent Company Guarantor | Subsidiary Issuer | Non-guarantor Subsidiaries | Eliminations | Pentair Ltd. and Subsidiaries Consolidated | |||||||||||||||
| Net sales | $ | — | $ | — | $ | 4,416,146 | $ | — | $ | 4,416,146 | ||||||||||
| Cost of goods sold | — | — | 3,146,554 | — | 3,146,554 | |||||||||||||||
| ||||||||||||||||||||
| Gross profit | — | — | 1,269,592 | — | 1,269,592 | |||||||||||||||
| Selling, general and administrative | 5,017 | (3,792 | ) | 1,157,211 | — | 1,158,436 | ||||||||||||||
| Research and development | — | — | 93,557 | — | 93,557 | |||||||||||||||
| Impairment of trade names and goodwill | — | — | 60,718 | — | 60,718 | |||||||||||||||
| ||||||||||||||||||||
| Operating (loss) income | (5,017 | ) | 3,792 | (41,894 | ) | — | (43,119 | ) | ||||||||||||
| Loss (earnings) from investment in subsidiaries | 101,400 | 102,344 | — | (203,744 | ) | — | ||||||||||||||
Other (income) expense: | ||||||||||||||||||||
| Loss on early extinguishment of debt | — | — | 75,367 | — | 75,367 | |||||||||||||||
| Equity income of unconsolidated subsidiaries | — | — | (2,156 | ) | — | (2,156 | ) | |||||||||||||
| Net interest (income) expense | 81 | 971 | 66,583 | — | 67,635 | |||||||||||||||
| ||||||||||||||||||||
| Income (loss) from continuing operations before income taxes and noncontrolling interest | (106,498 | ) | (99,523 | ) | (181,688 | ) | 203,744 | (183,965 | ) | |||||||||||
| Provision (benefit) for income taxes | 688 | 1,101 | (81,142 | ) | — | (79,353 | ) | |||||||||||||
| ||||||||||||||||||||
| Net income (loss) before noncontrolling interest | (107,186 | ) | (100,624 | ) | (100,546 | ) | 203,744 | (104,612 | ) | |||||||||||
| Noncontrolling interest | — | — | 2,574 | — | 2,574 | |||||||||||||||
| ||||||||||||||||||||
| Net income (loss) attributable to Pentair Ltd. | $ | (107,186 | ) | $ | (100,624 | ) | $ | (103,120 | ) | $ | 203,744 | $ | (107,186 | ) | ||||||
| ||||||||||||||||||||
| Comprehensive income (loss), net of tax | ||||||||||||||||||||
| Net income (loss) before noncontrolling interest | $ | (107,186 | ) | $ | (100,624 | ) | $ | (100,546 | ) | $ | 203,744 | $ | (104,612 | ) | ||||||
| Changes in cumulative translation adjustment | 34,416 | 34,416 | 35,830 | 68,832 | 35,830 | |||||||||||||||
| Amortization of pension and other post-retirement prior service cost | (253 | ) | (253 | ) | (253 | ) | 506 | (253 | ) | |||||||||||
| Changes in market value of derivative financial instruments | (3,630 | ) | (3,630 | ) | (3,630 | ) | 7,260 | (3,630 | ) | |||||||||||
| ||||||||||||||||||||
| Total comprehensive income (loss) | (76,653 | ) | (70,091 | ) | (68,599 | ) | 142,678 | (72,665 | ) | |||||||||||
| Less: Comprehensive income (loss) attributable to noncontrolling interest | — | — | 3,988 | — | 3,988 | |||||||||||||||
| ||||||||||||||||||||
| Comprehensive income (loss) attributable to Pentair Ltd. | $ | (76,653 | ) | $ | (70,091 | ) | $ | (72,587 | ) | $ | 142,678 | $ | (76,653 | ) | ||||||
| ||||||||||||||||||||
111
Pentair Ltd. and Subsidiaries
Notes to consolidated financial statements
Pentair Ltd. and Subsidiaries
Condensed Consolidating Balance Sheet
December 31, 2012
| In thousands | Parent Company Guarantor | Subsidiary Issuer | Non-guarantor Subsidiaries | Eliminations | Pentair Ltd. and Subsidiaries Consolidated | |||||||||||||||
| Assets | ||||||||||||||||||||
Current assets | ||||||||||||||||||||
Cash and cash equivalents | $ | — | $ | 30 | $ | 261,311 | $ | — | $ | 261,341 | ||||||||||
| Accounts and notes receivable, net | 20,197 | 1,458,341 | 1,348,698 | (1,534,588 | ) | 1,292,648 | ||||||||||||||
Inventories | — | — | 1,380,271 | — | 1,380,271 | |||||||||||||||
Other current assets | 1,425 | — | 324,683 | — | 326,108 | |||||||||||||||
| ||||||||||||||||||||
Total current assets | 21,622 | 1,458,371 | 3,314,963 | (1,534,588 | ) | 3,260,368 | ||||||||||||||
Property, plant and equipment, net | — | — | 1,224,488 | — | 1,224,488 | |||||||||||||||
Other assets | ||||||||||||||||||||
Investments in subsidiaries | 6,496,081 | 7,471,843 | — | (13,967,924 | ) | — | ||||||||||||||
Goodwill | — | — | 4,894,512 | — | 4,894,512 | |||||||||||||||
Intangibles, net | — | — | 1,909,656 | — | 1,909,656 | |||||||||||||||
Other non-current assets | 13,300 | 8,988 | 497,299 | (13,300 | ) | 506,287 | ||||||||||||||
| ||||||||||||||||||||
Total other assets | 6,509,381 | 7,480,831 | 7,301,467 | (13,981,224 | ) | 7,310,455 | ||||||||||||||
| ||||||||||||||||||||
Total assets | $ | 6,531,003 | $ | 8,939,202 | $ | 11,840,918 | $ | (15,515,812 | ) | $ | 11,795,311 | |||||||||
| ||||||||||||||||||||
| Liabilities and Equity | ||||||||||||||||||||
Current liabilities | ||||||||||||||||||||
| Current maturities of long-term debt and short-term borrowings | $ | — | $ | — | $ | 3,096 | $ | — | $ | 3,096 | ||||||||||
Accounts payable | 54,263 | 1,787 | 589,793 | (76,247 | ) | 569,596 | ||||||||||||||
| Employee compensation and benefits | — | — | 295,067 | — | 295,067 | |||||||||||||||
Other current liabilities | 96,580 | 11,297 | 562,285 | — | 670,162 | |||||||||||||||
| ||||||||||||||||||||
Total current liabilities | 150,843 | 13,084 | 1,450,241 | (76,247 | ) | 1,537,921 | ||||||||||||||
Other liabilities | ||||||||||||||||||||
Long-term debt | — | 2,297,710 | 1,614,909 | (1,458,341 | ) | 2,454,278 | ||||||||||||||
| Pension and other post-retirement compensation and benefits | — | — | 378,066 | — | 378,066 | |||||||||||||||
Deferred tax liabilities | — | — | 488,102 | — | 488,102 | |||||||||||||||
Other non-current liabilities | 13,300 | — | 453,587 | (13,300 | ) | 453,587 | ||||||||||||||
| ||||||||||||||||||||
Total liabilities | 164,143 | 2,310,794 | 4,384,905 | (1,547,888 | ) | 5,311,954 | ||||||||||||||
Equity | ||||||||||||||||||||
| Shareholders’ equity attributable to Pentair Ltd. and subsidiaries | 6,366,860 | 6,628,408 | 7,339,516 | (13,967,924 | ) | 6,366,860 | ||||||||||||||
Noncontrolling interest | — | — | 116,497 | — | 116,497 | |||||||||||||||
| ||||||||||||||||||||
Total equity | 6,366,860 | 6,628,408 | 7,456,013 | (13,967,924 | ) | 6,483,357 | ||||||||||||||
| ||||||||||||||||||||
Total liabilities and equity | $ | 6,531,003 | $ | 8,939,202 | $ | 11,840,918 | $ | (15,515,812 | ) | $ | 11,795,311 | |||||||||
| ||||||||||||||||||||
112
Pentair Ltd. and Subsidiaries
Notes to consolidated financial statements
Pentair Ltd. and Subsidiaries
Condensed Consolidating Statement of Cash Flows
Year ended December 31, 2012
| In thousands | Parent Company Guarantor | Subsidiary Issuer | Non-guarantor Subsidiaries | Eliminations | Pentair Ltd. and Subsidiaries Consolidated | |||||||||||||||
Operating activities |
| |||||||||||||||||||
Net cash provided by (used for) operating activities | $ | (108,944 | ) | $ | (88,253 | ) | $ | 61,413 | $ | 203,744 | $ | 67,960 | ||||||||
Investing activities | ||||||||||||||||||||
Capital expenditures | — | — | (94,532 | ) | — | (94,532 | ) | |||||||||||||
| Proceeds from sale of property and equipment | — | — | 5,508 | — | 5,508 | |||||||||||||||
Acquisitions, net of cash acquired | — | 300,061 | 170,398 | — | 470,459 | |||||||||||||||
Other | — | — | (5,858 | ) | — | (5,858 | ) | |||||||||||||
| ||||||||||||||||||||
Net cash provided by (used for) investing activities | — | 300,061 | 75,516 | — | 375,577 | |||||||||||||||
Financing activities | ||||||||||||||||||||
Net short-term borrowings | — | — | (3,700 | ) | — | (3,700 | ) | |||||||||||||
Proceeds from long-term debt | — | 1,397,710 | 138,436 | — | 1,536,146 | |||||||||||||||
Repayment of long-term debt | — | — | (1,305,339 | ) | — | (1,305,339 | ) | |||||||||||||
Debt issuance costs | — | (8,722 | ) | (982 | ) | — | (9,704 | ) | ||||||||||||
Debt extinguishment costs | — | — | (74,752 | ) | — | (74,752 | ) | |||||||||||||
| Net change in advances to subsidiaries | 156,977 | (1,600,766 | ) | 1,647,533 | (203,744 | ) | — | |||||||||||||
| Excess tax benefits from share-based compensation | — | — | 4,976 | — | 4,976 | |||||||||||||||
| Shares issued to employees, net of shares withheld | — | — | 68,177 | — | 68,177 | |||||||||||||||
Repurchases of common shares | — | — | (334,159 | ) | — | (334,159 | ) | |||||||||||||
Dividends paid | (48,033 | ) | — | (64,364 | ) | — | (112,397 | ) | ||||||||||||
| Distributions to noncontrolling interest | — | — | (1,554 | ) | — | (1,554 | ) | |||||||||||||
| ||||||||||||||||||||
Net cash provided by (used for) financing activities | 108,944 | (211,778 | ) | 74,272 | (203,744 | ) | (232,306 | ) | ||||||||||||
| Effect of exchange rate changes on cash and cash equivalents | — | — | 33 | — | 33 | |||||||||||||||
| ||||||||||||||||||||
| Change in cash and cash equivalents | — | 30 | 211,234 | — | 211,264 | |||||||||||||||
| Cash and cash equivalents, beginning of year | — | — | 50,077 | — | 50,077 | |||||||||||||||
| ||||||||||||||||||||
| Cash and cash equivalents, end of year | $ | — | $ | 30 | $ | 261,311 | $ | — | $ | 261,341 | ||||||||||
| ||||||||||||||||||||
113
Pentair Ltd. and Subsidiaries
Notes to consolidated financial statements
| 21. | Disclosures Required by Swiss Law |
We are subject to statutory reporting requirements in Switzerland. The following disclosures are presented in accordance with, and are based on definitions contained in, the Swiss Code of Obligations.
Personnel expenses
Total personnel expenses were $1,233.7 million and $941.4 million in 2012 and 2011, respectively.
Fire insurance value
The fire insurance values of property, plant, and equipment was $4,684.1 million at December 31, 2012.
Risk assessment
Our board of directors is responsible for assessing our major risks and overseeing that appropriate risk management and control procedures are in place. The audit committee of the board meets to review and discuss, as determined to be appropriate, our major financial and accounting risk exposures and related policies and practices with management, the internal auditors and the independent registered public accountants to assess and control such exposures and assist the board in fulfilling its oversight responsibilities regarding our policies and guidelines with respect to risk assessment and risk management. Our risk assessment process was in place during fiscal 2012 and 2011 and followed by the board of directors.
114
| ITEM 9. | CHANGES IN AND DISAGREEMENTS WITH ACCOUNTANTS ON ACCOUNTING AND FINANCIAL DISCLOSURE |
None.
| ITEM 9A. CONTROLS |
Our management, with the participation of our Chief Executive Officer and our Chief Financial Officer, evaluated the effectiveness of the design and operation of our disclosure controls and procedures as of the end of the year ended December 31, 2010,2012, pursuant toRule 13a-15(b) of the Securities Exchange Act of 1934 (“the Exchange Act”). Based upon their evaluation, our Chief Executive Officer and our Chief Financial Officer concluded that our disclosure controls and procedures were effective as of the year ended December 31, 20102012 to ensure that information required to be disclosed by us in the reports we file or submit under the Exchange Act is recorded, processed, summarized and reported, within the time periods specified in the Securities and Exchange Commission’s rules and forms and to ensure that information required to be disclosed by us in the reports we file or submit under the Exchange Act is accumulated and communicated to our management, including our principal executive and principal financial officers, as appropriate to allow timely decisions regarding required disclosures.
Management’s Annual Report on Internal Control Over Financial Reporting
The report of management required under this ITEM 9A is contained in ITEM 8 of this Annual Report onForm 10-K under the caption “Management’s Report on Internal Control Over Financial Reporting.”
Attestation Report of Independent Registered Public Accounting Firm
The attestation report required under this ITEM 9A is contained in ITEM 8 of this Annual Report onForm 10-K under the caption “Report of Independent Registered Public Accounting Firm.”
Changes in Internal Control over Financial Reporting
On September 28, 2012, we completed the Merger. As part of our ongoing integration activities after the Merger, we are continuing to incorporate our controls and procedures into the Flow Control business and to augment our company-wide controls to reflect the risks inherent in an acquisition of this magnitude and complexity. There was no other change in our internal control over financial reporting that occurred during the quarter ended December 31, 20102012 that has materially affected, or is reasonably likely to materially affect, our internal control over financial reporting.
| ITEM 9B. OTHER |
None.
77
115
| ITEM | |
| DIRECTORS, EXECUTIVE OFFICERS AND CORPORATE GOVERNANCE |
Information required under this item with respect to directors is contained in our Proxy Statement for our 20112013 annual general meeting of shareholders under the captions “Corporate Governance Matters”,Matters,” “Proposal 1 ElectionRe-election of Certain Directors”Three Directors with Terms Expiring at the 2016 Annual General Meeting of Shareholders” and “Section 16(a) Beneficial Ownership Reporting Compliance” and is incorporated herein by reference.
Information required under this item with respect to executive officers is contained in Part I of thisForm 10-K under the caption “Executive Officers of the Registrant.”
Our Board of Directors has adopted Pentair’s Code of Business Conduct and Ethics and designated it as the code of ethics for the Company’s Chief Executive Officer and senior financial officers. The Code of Business Conduct and Ethics also applies to all employees and directors in accordance with New York Stock Exchange Listing Standards. We have posted a copy of Pentair’s Code of Business Conduct and Ethics on our website atwww.pentair.com/code.htmlhttp://pentair.com/about-us/our-approach/code-of-conduct.html. We intend to satisfy the disclosure requirements under Item 5.05 ofForm 8-K regarding amendments to or waivers from, Pentair’s Code of Business Conduct and Ethics by posting such information on our website atwww.pentair.com/code.htmlhttp://pentair.com/about-us/our-approach/code-of-conduct.html.
We are not including the information contained on our website as part of, or incorporating it by reference into, this report.
| ITEM | |
| EXECUTIVE COMPENSATION |
Information required under this item is contained in our Proxy Statement for our 20112013 annual general meeting of shareholders under the captions “Corporate Governance Matters — Committees of the Board — Compensation Committee,” “Corporate Governance Matters — Compensation Committee Interlocks and Insider Participation,” “Compensation Discussion and Analysis,” “Compensation Committee Report,” “Executive Compensation” and “Director Compensation” and is incorporated herein by reference.
| ITEM 12. | SECURITY OWNERSHIP OF CERTAIN BENEFICIAL OWNERS AND MANAGEMENT AND RELATED STOCKHOLDER MATTERS |
Information required under this item with respect to security ownership is contained in our Proxy Statement for our 20112013 annual general meeting of shareholders under the captionscaption “Security Ownership” and is incorporated herein by reference.
116
The following table summarizes, as of December 31, 2010,2012, information about compensation plans under which our equity securities are authorized for issuance:
| Number of | ||||||||||||
| Securities to be | Number of Securities | |||||||||||
| Issued Upon | Weighted-average | Remaining Available for | ||||||||||
| Exercise of | Exercise Price | Future Issuance Under | ||||||||||
| Outstanding | of Outstanding | Equity Compensation Plans | ||||||||||
| Options, Warrants | Options, Warrants | (Excluding Securities | ||||||||||
| and Rights | and Rights | Reflected in Column (a)) | ||||||||||
| Plan category | (a) | (b) | (c) | |||||||||
| Equity compensation plans approved by security holders: | ||||||||||||
| 2008 Omnibus Stock Incentive Plan | 2,654,797 | $ | 29.00 | 5,773,901 | (1) | |||||||
| 2004 Omnibus Stock Incentive Plan | 4,804,131 | $ | 32.46 | — | (2) | |||||||
| Outside Directors Non-qualified Stock Option Plan | 508,488 | $ | 33.01 | — | (2) | |||||||
| Total | 7,967,416 | $ | 31.34 | 5,773,901 | ||||||||
| Plan category | Number of securities to (a) | Weighted-average (b) | Number of securities (c) | |||||||||
| Equity compensation plans approved by security holders: | ||||||||||||
2012 Stock and Incentive Plan (1) | 3,916,474 (1) | $ | 34.22 (2) | 8,490,872 (3) | ||||||||
2008 Omnibus Stock Incentive Plan (2) | 7,232,714 (4) | 32.50 (2) | — (5) | |||||||||
2004 Omnibus Stock Incentive Plan (2) | 2,758,387 | 34.53 | — (5) | |||||||||
| Outside Directors Non-qualified Stock Option Plan (2) | 282,259 | 35.43 | — (5) | |||||||||
| Total | 14,189,834 | $ | 33.43 (2) | 8,490,872 | ||||||||
| (1) | Consists of 2,403,609 shares subject to stock options and 922,302 shares subject to restricted stock units that were assumed in connection with the Merger and 3,151 shares subject to other stock options and 587,412 shares subject to other restricted stock units. |
| (2) | Represents the weighted average exercise price of outstanding stock options and does not take into account outstanding restricted stock units. |
| (3) | Represents securities remaining available for issuance under the 2012 Stock and Incentive Plan. |
| (4) | Consists of 3,322,651 shares subject to stock options and 3,910,063 shares subject to restricted stock units. |
| (5) | The 2008 Omnibus | |
| Stock Incentive Plan was terminated in connection with the Merger. The 2004 Omnibus Plan and the Directors Plan were terminated in 2008. Options previously granted |
78
ITEM 14. PRINCIPAL ACCOUNTING FEES AND SERVICES
Information required under this item is contained in our Proxy Statement for our 20112013 annual general meeting of shareholders under the caption “Audit Committee Disclosure”“Proposal 4 Election of Auditors – Service Fees Paid to the Independent Registered Public Accounting Firm” and is incorporated herein by reference.
79
117
|
| (1) Financial | Statements |
Consolidated Statements of Operations and Comprehensive Income (Loss) for the Years Endedyears ended December 31, 2010, 20092012, 2011 and 2008
Consolidated Balance Sheets as of December 31, 20102012 and 2009
Consolidated Statements of Cash Flows for the Years Endedyears ended December 31, 2010, 20092012, 2011 and 2008
Consolidated Statements of Changes in Shareholders’ Equity for the Years Endedyears ended December 31, 2010, 20092012, 2011 and 2008
Notes to Consolidated Financial Statements
| (2) Financial | Statement Schedule |
Schedule II — Valuation and Qualifying Accounts
All other schedules for which provision is made in the applicable accounting regulations of the Securities and Exchange Commission have been omitted because they are not applicable or the required information is shown in the financial statements or notes thereto.
| (3) Exhibits |
The exhibits of this Annual Report onForm 10-K included herein are set forth on the attached Exhibit Index.
80
118
| PENTAIR LTD. | ||
| By | /s/ John L. Stauch | |
John L. Stauch Executive Vice President and Chief Financial Officer | ||
Pursuant to the requirements of the Securities Exchange Act of 1934, this report has been signed below by the following persons on behalf of the Registrant and in the capacities indicated, on February 22, 2011.
Signature | Title | |||
/s/ Randall J. Hogan | Chairman and Chief Executive Officer | |||
| Randall J. Hogan | ||||
/s/ John L. Stauch | Executive Vice President and Chief Financial Officer | |||
| John L. Stauch | ||||
/s/ Mark C. Borin | Corporate Controller and Chief Accounting Officer | |||
| Mark C. Borin | ||||
* | Director | |||
| Leslie Abi-Karam | ||||
* | Director | |||
| Glynis A. Bryan | ||||
* | Director | |||
Jerry W. Burris | ||||
* | Director | |||
| Carol Anthony (John) Davidson | ||||
* | Director | |||
| T. Michael Glenn | ||||
* | Director | |||
Charles A. Haggerty | ||||
* | Director | |||
David H. Y. Ho | ||||
* | Director | |||
David A. Jones | ||||
* | Director | |||
Ronald L. Merriman | ||||
* | Director | |||
William T. Monahan | ||||
| *By | /s/ Angela D. Lageson | |||
| Angela D. Lageson | ||||
| Attorney-in-fact |
81
119
Pentair IncLtd. and subsidiariesSubsidiaries
| Additions | ||||||||||||||||||||
| Balance | Charged to | Other | Balance | |||||||||||||||||
| Beginning | Costs and | Changes | End | |||||||||||||||||
| in thousands | in Period | Expenses | Deductions | Add (deduct) | of Period | |||||||||||||||
Allowances for doubtful accounts | ||||||||||||||||||||
| Year ended December 31, 2010 | $ | 14,154 | $ | 4,300 | $ | 1,152 | (1) | $ | (183 | )(2) | $ | 17,119 | ||||||||
| Year ended December 31, 2009 | $ | 8,925 | $ | 6,832 | $ | 2,449 | (1) | $ | 846 | (2) | $ | 14,154 | ||||||||
| Year ended December 31, 2008 | $ | 8,073 | $ | 3,044 | $ | 1,629 | (1) | $ | (563 | )(2) | $ | 8,925 | ||||||||
| In thousands | Beginning balance | Additions charged to costs and expenses | Deductions (1) | Other changes (2) | Ending balance | |||||||||||||||
Allowances for doubtful accounts |
| |||||||||||||||||||
Year ended December 31, 2012 | $ 16,000 | $ 1,615 | $ 4,040 | $ 420 | $ 13,995 | |||||||||||||||
Year ended December 31, 2011 | $ 17,119 | $ 4,447 | $ 4,724 | $ (842) | $ 16,000 | |||||||||||||||
Year ended December 31, 2010 | $ 14,154 | $ 4,300 | $ 1,152 | $ (183) | $ 17,119 | |||||||||||||||
| (1) | Uncollectible accounts written off, net of |
| (2) | Result of |
82
120
EXHIBIT INDEX
| Exhibit | ||||
Number | Exhibit | |||
| 3 | .1 | Third Restated Articles of Incorporation as amended through May 3, 2007 (Incorporated by reference to Exhibit 3.1 contained in Pentair’s Quarterly Report onForm 10-Q for the quarterly period ended March 31, 2007). | ||
| 3 | .2 | Fourth Amended and Superseding By-Laws as amended through May 3, 2007 (Incorporated by reference to Exhibit 3.2 contained in Pentair’s Quarterly Report onForm 10-Q for the quarterly period ended March 31, 2007). | ||
| 3 | .3 | Statement of Resolution of the Board of Directors Establishing the Series and Fixing the Relative Rights and Preferences of Series A Junior Participating Preferred Stock (Incorporated by reference to Exhibit 3.1 contained in Pentair’s Current Report onForm 8-K dated December 10, 2004). | ||
| 4 | .1 | Rights Agreement dated as of December 10, 2004 between Pentair, Inc. and Wells Fargo Bank, N.A. (Incorporated by reference to Exhibit 4.1 contained in Pentair’s Registration Statement onForm 8-A, dated as of December 31, 2004). | ||
| 4 | .2 | Note Purchase Agreement dated as of July 25, 2003 for $50,000,000 4.93% Senior Notes, Series A, due July 25, 2013, $100,000,000 Floating Rate Senior Notes, Series B, due July 25, 2013 and $50,000,000 5.03% Senior Notes, Series C, due October 15, 2013 (Incorporated by reference to Exhibit 10.22 contained in Pentair’s Current Report onForm 8-K dated July 25, 2003). | ||
| 4 | .3 | Third Amended and Restated Credit Agreement dated June 4, 2007 by and among Pentair, Inc. and a consortium of financial institutions including Bank of America, N.A., as Administrative Agent and Issuing Bank, JPMorgan Chase Bank, N.A., as Syndication Agent and The Bank of Tokyo-Mitsubishi UFJ, Ltd., U.S. Bank N.A. and Wells Fargo Bank, N.A., as Co-Documentation Agents (Incorporated by reference to Exhibit 4.1 contained in Pentair’s Current Report onForm 8-K dated June 4, 2007). | ||
| 4 | .4 | First Amendment to Note Purchase agreement dated July 19, 2005 by and among Pentair, Inc. and the undersigned holders (Incorporated by reference to Exhibit 4 contained in Pentair’s Quarterly Report onForm 10-Q for the quarterly period ended July 2, 2005). | ||
| 4 | .5 | Form of Note Purchase Agreement, dated May 17, 2007, by and among Pentair, Inc. and various institutional investors, for the sale of $300 million aggregate principal amount of Pentair’s 5.87% Senior Notes, Series D, due May 17, 2017 and $105 million aggregate principal amount of Pentair’s Floating Rate Senior Notes, Series E, due May 17, 2012 (Incorporated by reference to Exhibit 4.1 contained in Pentair’s Current Report onForm 8-K dated May 17, 2007). | ||
| 10 | .1 | Pentair’s 1999 Supplemental Executive Retirement Plan as Amended and Restated effective August 23, 2000 (Incorporated by reference to Exhibit 10.2 contained in Pentair’s Current Report onForm 8-K filed September 21, 2000).* | ||
| 10 | .2 | Pentair’s 1999 Supplemental Executive Retirement Plan as Amended and Restated effective January 1, 2009 (Incorporated by reference to Exhibit 10.2 contained in Pentair’s Annual Report onForm 10-K for the year ended December 31, 2008).* | ||
| 10 | .3 | Pentair’s Restoration Plan as Amended and Restated effective August 23, 2000 (Incorporated by reference to Exhibit 10.3 contained in Pentair’s Current Report onForm 8-K filed September 21, 2000).* | ||
| 10 | .4 | Pentair’s Restoration Plan as Amended and Restated effective January 1, 2009 (Incorporated by reference to Exhibit 10.4 contained in Pentair’s Annual Report onForm 10-K for the year ended December 31, 2008).* | ||
| 10 | .5 | Pentair, Inc. Non-Qualified Deferred Compensation Plan effective January 1, 1996 (Incorporated by reference to Exhibit 10.17 contained in Pentair’s Annual Report onForm 10-K for the year ended December 31, 2005).* | ||
| 10 | .6 | Trust Agreement for Pentair, Inc. Non-Qualified Deferred Compensation Plan between Pentair, Inc. and Fidelity Management Trust Company (Incorporated by reference to Exhibit 10.18 contained in Pentair’s Annual Report onForm 10-K for the year ended December 31, 1995).* | ||
| 10 | .7 | Amendment effective August 23, 2000 to Pentair’s Non-Qualified Deferred Compensation Plan effective January 1, 1996 (Incorporated by reference to Exhibit 10.8 contained in Pentair’s Current Report onForm 8-K filed September 21, 2000).* | ||
| 10 | .8 | Pentair, Inc. Non-Qualified Deferred Compensation Plan effective January 1, 2009, as Amended and Restated Through July 29, 2009 (Incorporated by reference to Exhibit 10.2 contained in Pentair’s Quarterly Report onForm 10-Q for the year ended September 26, 2009).* | ||
83
| Exhibit | ||||
Number | Exhibit | |||
| 10 | .9 | Pentair, Inc. Executive Officer Performance Plan as Amended and Restated, effective January 1, 2009 (Incorporated by reference to Appendix B contained in Pentair’s Proxy Statement for its 2009 annual meeting of shareholders).* | ||
| 10 | .10 | Form of Key Executive Employment and Severance Agreement for Randall J. Hogan (Incorporated by reference to Exhibit 10.10 contained in Pentair’s Annual Report onForm 10-K for the year ended December 31, 2008).* | ||
| 10 | .11 | Form of Key Executive Employment and Severance Agreement for Michael V. Schrock, Frederick S. Koury and Michael G. Meyer (Incorporated by reference to Exhibit 10.11 contained in Pentair’s Annual Report onForm 10-K for the year ended December 31, 2008).* | ||
| 10 | .12 | Form of Key Executive Employment and Severance Agreement for John L. Stauch, Mark C. Borin and Angela D. Lageson (Incorporated by reference to Exhibit 10.12 contained in Pentair’s Annual Report onForm 10-K for the year ended December 31, 2008).* | ||
| 10 | .13 | Pentair, Inc. International Stock Purchase and Bonus Plan, as Amended and Restated, effective May 1, 2004 (Incorporated by reference to Appendix I contained in Pentair’s Proxy Statement for its 2004 annual meeting of shareholders).* | ||
| 10 | .14 | Pentair, Inc. Compensation Plan for Non-Employee Directors, as Amended and Restated Through December 16, 2009 (Incorporated by reference to Exhibit 10.14 contained in Pentair’s Annual Report onForm 10-K for the year ended December 31, 2009).* | ||
| 10 | .15 | Pentair, Inc. Omnibus Stock Incentive Plan, as Amended and Restated, effective December 12, 2007 (Incorporated by reference to Exhibit 10.14 contained in Pentair’s Annual Report onForm 10-K for the year ended December 31, 2007).* | ||
| 10 | .16 | Pentair, Inc. Employee Stock Purchase and Bonus Plan, as Amended and Restated, effective May 1, 2004 (Incorporated by reference to Appendix H contained in Pentair’s Proxy Statement for its 2004 annual meeting of shareholders).* | ||
| 10 | .17 | Letter Agreement, dated January 6, 2005, between Pentair, Inc. and Michael Schrock (Incorporated by reference to Exhibit 10.1 contained in Pentair’s Current Report onForm 8-K dated January 6, 2005).* | ||
| 10 | .18 | Confidentiality and Non-Competition Agreement, dated January 6, 2005, between Pentair, Inc. and Michael Schrock (Incorporated by reference to Exhibit 10.2 contained in Pentair’s Current Report onForm 8-K dated January 6, 2005).* | ||
| 10 | .19 | Pentair, Inc. 2008 Omnibus Stock Incentive Plan, as Amended and Restated (Incorporated by reference to Appendix A contained in Pentair’s Proxy Statement for its 2010 annual meeting of shareholders filed on March 18, 2010).* | ||
| 10 | .20 | Form of award letter for executive officers under the Pentair, Inc. 2008 Omnibus Stock Incentive Plan, as amended (Incorporated by reference to Exhibit 10.1 contained in Pentair’s Current Report onForm 8-K filed January 8, 2009).* | ||
| 10 | .21 | Form of award letter for directors under the Pentair, Inc. 2008 Omnibus Stock Incentive Plan, as amended (Incorporated by reference to Exhibit 10.21 contained in Pentair’s Annual Report onForm 10-K for the year ended December 31, 2009).* | ||
| 10 | .22 | Amended and Restated Pentair, Inc. Outside Directors Nonqualified Stock Option Plan as amended through February 27, 2002 (Incorporated by reference to Exhibit 10.7 contained in Pentair’s Annual Report onForm 10-K for the year ended December 31, 2001).* | ||
| 21 | List of Pentair subsidiaries. | |||
| 23 | Consent of Independent Registered Public Accounting Firm — Deloitte & Touche LLP. | |||
| 24 | Power of Attorney. | |||
| 31 | .1 | Certification of Chief Executive Officer required byRule 13a-14(a) of the Securities Exchange Act of 1934, as amended. | ||
| 31 | .2 | Certification of Chief Financial Officer required byRule 13a-14(a) of the Securities Exchange Act of 1934, as amended. | ||
| 32 | .1 | Certification of Chief Executive Officer, Pursuant to 18 U.S.C. Section 1350, As Adopted Pursuant to Section 906 of the Sarbanes-Oxley Act of 2002. | ||
84
| Exhibit | ||||
Number | Exhibit | |||
| 32 | .2 | Certification of Chief Financial Officer, Pursuant to 18 U.S.C. Section 1350, As Adopted Pursuant to Section 906 of the Sarbanes-Oxley Act of 2002. | ||
| 101 | The following materials from Pentair, Inc.’s Annual Report onForm 10-K for the year ended December 31, 2010 are furnished herewith, formatted in XBRL (Extensible Business Reporting Language): (i) the Consolidated Statements of Income for the three years ended December 31, 2010, 2009 and 2008, (ii) the Consolidated Balance Sheets as of December 31, 2010 and December 31, 2009, (iii) the Consolidated Statements of Cash Flows for the years ended December 31, 2010, 2009 and 2008, (iv) the Consolidated Statements of Changes in Shareholders’ Equity for the years ended December 31, 2010, 2009 and 2008 and (v) the Notes to the Consolidated Financial Statements. | |||
| Merger Agreement, dated as of March 27, 2012, among Tyco International Ltd., Pentair Ltd. (formerly Tyco Flow Control International Ltd.), Panthro Acquisition Co., Panthro Merger Sub, Inc. and Pentair, Inc. (Incorporated by reference to Exhibit 2.1 in the Current Report on Form 8-K of Pentair, Inc. filed with the Commission on March 30, 2012 (File No. 000-04689)). | ||
| 2.2 | Amendment No. 1, dated as of July 25, 2012, to the Merger Agreement, dated as of March 27, 2012, among Tyco International Ltd., Pentair Ltd. (formerly Tyco Flow Control International Ltd.), Panthro Acquisition Co., Panthro Merger Sub, Inc. and Pentair, Inc. (Incorporated by reference to Exhibit 2.1 in the Current Report on Form 8-K of Pentair, Inc. filed with the Commission on July 31, 2012 (File No. 000-04689)). | |
| 2.3 | Amended and Restated Separation and Distribution Agreement, dated September 27, 2012 among Tyco International Ltd., Pentair Ltd. and The ADT Corporation (Incorporated by reference to Exhibit 2.3 in the Current Report on Form 8-K of Pentair Ltd. filed with the Commission on September 28, 2012 (File No. 001-11625)). | |
| 3.1 | Amended and Restated Articles of Association of Pentair Ltd. (Incorporated by reference to Exhibit 3.1 in the Current Report on Form 8-K of Pentair Ltd. filed with the Commission on September 28, 2012 (File No. 001-11625)). | |
| 3.2 | Organizational Regulations of Pentair Ltd. (Incorporated by reference to Exhibit 3.2 in the Current Report on Form 8-K of Pentair Ltd. filed with the Commission on September 28, 2012 (File No. 001-11625)). | |
| 4.1 | Indenture, dated as of September 24, 2012, among Pentair Finance S.A. (formerly Tyco Flow Control International Finance S.A.) (as Issuer), Pentair Ltd. (as Guarantor) and Wells Fargo Bank, National Association (as Trustee) (Incorporated by reference to Exhibit 4.1 in the Current Report on Form 8-K of Pentair Ltd. filed with the Commission on September 28, 2012 (File No. 001-11625)). | |
| 4.2 | First Supplemental Indenture, dated as of September 24, 2012, among Pentair Finance S.A. (formerly Tyco Flow Control International Finance S.A.) (as Issuer), Pentair Ltd. (as Guarantor), Pentair, Inc. and Wells Fargo Bank, National Association (as Trustee) (Incorporated by reference to Exhibit 4.2 in the Current Report on Form 8-K of Pentair Ltd. filed with the Commission on September 28, 2012 (File No. 001-11625)). | |
| 4.3 | Second Supplemental Indenture, dated as of September 24, 2012, among Pentair Finance S.A. (formerly Tyco Flow Control International Finance S.A.) (as Issuer), Pentair Ltd. (as Guarantor), Pentair, Inc. and Wells Fargo Bank, National Association (as Trustee) (Incorporated by reference to Exhibit 4.3 in the Current Report on Form 8-K of Pentair Ltd. filed with the Commission on September 28, 2012 (File No. 001-11625)). | |
| 4.4 | Third Supplemental Indenture, dated as of November 26, 2012, among Pentair Finance S.A. (as Issuer), Pentair Ltd. (as Guarantor) and Wells Fargo Bank, National Association (as Trustee) (Incorporated by reference to Exhibit 4.1 in the Current Report on Form 8-K of Pentair Ltd. filed with the Commission on November 28, 2012 (File No. 001-11625)). | |
| 4.5 | Fourth Supplemental Indenture, dated as of November 26, 2012, among Pentair Finance S.A. (as Issuer), Pentair Ltd. (as Guarantor) and Wells Fargo Bank, National Association (as Trustee) (Incorporated by reference to Exhibit 4.2 in the Current Report on Form 8-K of Pentair Ltd. filed with the Commission on November 28, 2012 (File No. 001-11625)). | |
121
| 4.6 | Fifth Supplemental Indenture, dated as of December 18, 2012, among Pentair Finance S.A. (as Issuer), Pentair Ltd. (as Guarantor) and Wells Fargo Bank, National Association (as Trustee) (Incorporated by reference to Exhibit 4.1 in the Current Report on Form 8-K of Pentair Ltd. filed with the Commission on December 18, 2012 (File No. 001-11625)). | |
| 4.7 | Exchange and Registration Rights Agreement, among Pentair Finance S.A. (formerly Tyco Flow Control International Finance S.A.), Pentair Ltd., J.P. Morgan Securities LLC, Merrill Lynch, Pierce, Fenner & Smith Incorporated and U.S. Bancorp Investments, Inc. (as representatives of the several Purchasers), dated as of September 24, 2012 (Incorporated by reference to Exhibit 4.4 in the Current Report on Form 8-K of Pentair Ltd. filed with the Commission on September 28, 2012 (File No. 001-11625)). | |
| 4.8 | Exchange and Registration Rights Agreement among Pentair Finance S.A., Pentair Ltd. and J.P. Morgan Securities LLC, Merrill Lynch, Pierce, Fenner & Smith Incorporated and U.S. Bancorp Investments, Inc. (as representatives of the several Purchasers), dated as of November 26, 2012 (Incorporated by reference to Exhibit 4.3 in the Current Report on Form 8-K of Pentair Ltd. filed with the Commission on November 28, 2012 (File No. 001-11625)). | |
| 4.9 | Exchange and Registration Rights Agreement among Pentair Finance S.A., Pentair Ltd. and the dealer managers named therein, dated as of December 18, 2012 (Incorporated by reference to Exhibit 4.3 in the Current Report on Form 8-K of Pentair Ltd. filed with the Commission on December 18, 2012 (File No. 001-11625)). | |
| 4.10 | Senior Indenture, dated May 2, 2011 by and among Pentair, Inc. and Wells Fargo Bank, National Association (Incorporated by reference to Exhibit 4.5 to Pentair, Inc.’s Registration Statement on Form S-3 (Registration 333-173829)). | |
| 4.11 | First Supplemental Indenture, dated as of May 9, 2011, among Pentair, Inc., the guarantors named therein and Wells Fargo Bank, National Association (Incorporated by reference to Exhibit 4.2 in the Current Report on Form 8-K of Pentair, Inc. filed with the Commission on May 9, 2011 (File No. 000-04689)). | |
| 4.12 | Third Supplemental Indenture, dated October 1, 2012, among Pentair Ltd., Pentair, Inc. and Wells Fargo Bank, National Association, as trustee (Incorporated by reference to Exhibit 4.1 in the Current Report on Form 8-K of Pentair Ltd. filed with the Commission on October 1, 2012 (File No. 001-11625)). | |
| 4.13 | Fourth Supplemental Indenture, dated as of December 17, 2012, among Pentair, Inc. (as Issuer), Pentair Ltd. (as Guarantor) and Wells Fargo Bank, National Association (as Trustee) (Incorporated by reference to Exhibit 4.2 in the Current Report on Form 8-K of Pentair Ltd. filed with the Commission on December 18, 2012 (File No. 001-11625)). | |
| 4.14 | Credit Agreement, dated as of September 21, 2012 among Pentair, Inc., certain of its affiliates and the lenders and agents party thereto (Incorporated by reference to Exhibit 4.1 in the Current Report on Form 8-K of Pentair, Inc. filed with the Commission on September 24, 2012 (File No. 000-04689)). | |
| 10.1 | Tax Sharing Agreement, dated September 28, 2012 by and among Pentair Ltd., Tyco International Ltd. and The ADT Corporation (Incorporated by reference to Exhibit 10.1 in the Current Report on Form 8-K of Pentair Ltd. filed with the Commission on September 28, 2012 (File No. 001-11625)). | |
| 10.2 | Form of Indemnification Agreement for directors and executive officers of Pentair Ltd. (Incorporated by reference to Exhibit 10.1 in the Current Report on Form 8-K of Pentair Ltd. filed with the Commission on October 1, 2012 (File No. 001-11625)). | |
122
| 10.3 | Pentair Ltd. 2012 Stock and Incentive Plan (Incorporated by reference to Exhibit 4.3 in the Registration Statement on Form S-3 of Pentair Ltd. filed with the Commission on September 28, 2012 (Reg. No. 333-184149)).* | |
| 10.4 | Form of Executive Officer Stock Option Grant Agreement (Incorporated by reference to Exhibit 10.4 in the Current Report on Form 8-K of Pentair Ltd. filed with the Commission on October 1, 2012 (File No. 001-11625)).* | |
| 10.5 | Form of Executive Officer Restricted Stock Unit Grant Agreement (Incorporated by reference to Exhibit 10.5 in the Current Report on Form 8-K of Pentair Ltd. filed with the Commission on October 1, 2012 (File No. 001-11625)).* | |
| 10.6 | Form of Executive Officer Performance Unit Grant Agreement (Incorporated by reference to Exhibit 10.6 in the Current Report on Form 8-K of Pentair Ltd. filed with the Commission on October 1, 2012 (File No. 001-11625)).* | |
| 10.7 | Form of Non-Employee Director Stock Option Grant Agreement (Incorporated by reference to Exhibit 10.7 in the Current Report on Form 8-K of Pentair Ltd. filed with the Commission on October 1, 2012 (File No. 001-11625)).* | |
| 10.8 | Form of Non-Employee Director Restricted Stock Unit Grant Agreement (Incorporated by reference to Exhibit 10.8 in the Current Report on Form 8-K of Pentair Ltd. filed with the Commission on October 1, 2012 (File No. 001-11625)).* | |
| 10.9 | Pentair Ltd. 2008 Omnibus Stock Incentive Plan, as amended (Incorporated by reference to Exhibit 10.9 in the Current Report on Form 8-K of Pentair Ltd. filed with the Commission on October 1, 2012 (File No. 001-11625)).* | |
| 10.10 | Pentair Ltd. Omnibus Stock Incentive Plan, as amended (Incorporated by reference to Exhibit 10.10 in the Current Report on Form 8-K of Pentair Ltd. filed with the Commission on October 1, 2012 (File No. 001-11625)).* | |
| 10.11 | Pentair Ltd. Outside Directors Nonqualified Stock Option Plan, as amended (Incorporated by reference to Exhibit 10.11 in the Current Report on Form 8-K of Pentair Ltd. filed with the Commission on October 1, 2012 (File No. 001-11625)).* | |
| 10.12 | Form of Assignment and Assumption Agreement, among Pentair, Inc., Pentair Ltd. and the executive officers of Pentair Ltd. relating to Key Executive Employment and Severance Agreement (Incorporated by reference to Exhibit 10.12 in the Current Report on Form 8-K of Pentair Ltd. filed with the Commission on October 1, 2012 (File No. 001-11625)).* | |
| 10.13 | Form of Key Executive Employment and Severance Agreement for Randall J. Hogan (Incorporated by reference to Exhibit 10.10 in the Annual Report on Form 10-K of Pentair, Inc. for the year ended December 31, 2008 (File No. 000-04689)).* | |
| 10.14 | Form of Key Executive Employment and Severance Agreement for Michael V. Schrock, Frederick S. Koury and Michael G. Meyer (Incorporated by reference to Exhibit 10.11 in the Annual Report on Form 10-K of Pentair, Inc. for the year ended December 31, 2008 (File No. 000-04689)).* | |
| 10.15 | Form of Key Executive Employment and Severance Agreement for John L. Stauch, Mark C. Borin and Angela D. Lageson (Incorporated by reference to Exhibit 10.12 in the Annual Report on Form 10-K of Pentair, Inc. for the year ended December 31, 2008 (File No. 000-04689)).* | |
123
| 10.16 | Form of Letter regarding RSU Grants and Waiver of Certain KEESA Rights, between Pentair, Inc. and certain executives of Pentair, Inc., dated March 27, 2012 (Incorporated by reference to Exhibit 10.1 in the Current Report on Form 8-K of Pentair, Inc. filed with the Commission on March 30, 2012 (File No. 000-04689)).* | |
| 10.17 | Form of Restricted Stock Unit Grant Agreement (Incorporated by reference to Exhibit 10.2 in the Current Report on Form 8-K of Pentair Ltd. filed with the Commission on October 1, 2012 (File No. 001-11625)).* | |
| 10.18 | Pentair Ltd. Compensation Plan for Non-Employee Directors, as amended (Incorporated by reference to Exhibit 10.13 in the Current Report on Form 8-K of Pentair Ltd. filed with the Commission on October 1, 2012 (File No. 001-11625)).* | |
| 10.19 | Pentair Ltd. Employee Stock Purchase and Bonus Plan (Incorporated by reference to Exhibit 10.14 in the Current Report on Form 8-K of Pentair Ltd. filed with the Commission on October 1, 2012 (File No. 001-11625)).* | |
| 10.20 | Pentair, Inc. Non-Qualified Deferred Compensation Plan effective January 1, 1996 (Incorporated by reference to Exhibit 10.17 in the Annual Report on Form 10-K of Pentair, Inc. for the year ended December 31, 2005 (File No. 000-04689)).* | |
| 10.21 | Trust Agreement for Pentair, Inc. Non-Qualified Deferred Compensation Plan between Pentair, Inc. and Fidelity Management Trust Company (Incorporated by reference to Exhibit 10.18 contained in the Annual Report on Form 10-K of Pentair, Inc. for the year ended December 31, 1995 (File No. 000-04689)).* | |
| 10.22 | Amendment effective August 23, 2000 to Pentair, Inc. Non-Qualified Deferred Compensation Plan effective January 1, 1996 (Incorporated by reference to Exhibit 10.8 in the Current Report on Form 8-K of Pentair, Inc. filed with the Commission on September 21, 2000 (File No. 000-04689)).* | |
| 10.23 | Pentair, Inc. Non-Qualified Deferred Compensation Plan effective January 1, 2009, as amended and restated as of September 28, 2012 (Incorporated by reference to Exhibit 10.15 in the Current Report on Form 8-K of Pentair Ltd. filed with the Commission on October 1, 2012 (File No. 001-11625)).* | |
| 10.24 | Pentair, Inc. 1999 Supplemental Executive Retirement Plan as Amended and Restated effective August 23, 2000 (Incorporated by reference to Exhibit 10.2 in the Current Report on Form 8-K of Pentair, Inc. filed with the Commission on September 21, 2000 (File No. 000-04689)).* | |
| 10.25 | Pentair, Inc. Supplemental Executive Retirement Plan effective January 1, 2009, as amended and restated as of September 28, 2012 (Incorporated by reference to Exhibit 10.16 in the Current Report on Form 8-K of Pentair Ltd. filed with the Commission on October 1, 2012 (File No. 001-11625)).* | |
| 10.26 | Pentair, Inc. Restoration Plan as Amended and Restated effective August 23, 2000 (Incorporated by reference to Exhibit 10.3 in the Current Report on Form 8-K of Pentair, Inc. filed with the Commission on September 21, 2000 (File No. 000-04689)).* | |
| 10.27 | Pentair, Inc. Restoration Plan effective January 1, 2009, as amended and restated as of September 28, 2012 (Incorporated by reference to Exhibit 10.17 in the Current Report on Form 8-K of Pentair Ltd. filed with the Commission on October 1, 2012 (File No. 001-11625)).* | |
| 10.28 | Confidentiality and Non-Competition Agreement, dated January 6, 2005, between Pentair, Inc. and Michael Schrock (Incorporated by reference to Exhibit 10.2 in the Current Report on Form 8-K of Pentair, Inc. filed with the Commission on January 10, 2005 (File No. 000-04689)).* | |
124
| 18 | Letter on Change in Accounting Principles. | |
| 21 | List of Pentair Ltd. subsidiaries. | |
| 23 | Consent of Independent Registered Public Accounting Firm — Deloitte & Touche LLP. | |
| 24 | Power of attorney. | |
| 31.1 | Certification of Chief Executive Officer. | |
| 31.2 | Certification of Chief Financial Officer. | |
| 32.1 | Certification of Chief Executive Officer, Pursuant to 18 U.S.C. Section 1350, as Adopted Pursuant to Section 906 of the Sarbanes-Oxley Act of 2002. | |
| 32.2 | Certification of Chief Financial Officer, Pursuant to 18 U.S.C. Section 1350, as Adopted Pursuant to Section 906 of the Sarbanes-Oxley Act of 2002. | |
| 101 | The following materials from Pentair Ltd.’s Annual Report on Form 10-K for the year ended December 31, 2012 are filed herewith, formatted in XBRL (Extensible Business Reporting Language): (i) the Consolidated Statements of Operations and Comprehensive Income (Loss) for the years ended December 31, 2012, 2011 and 2010, (ii) the Consolidated Balance Sheets as of December 31, 2012 and 2011, (iii) the Consolidated Statements of Cash Flows for the years ended December 31, 2012, 2011 and 2010, (iv) the Consolidated Statements of Changes in Equity for the years ended December 31, 2012, 2011 and 2010 and (v) the Notes to the Consolidated Financial Statements. | |
| * | Denotes a management contract or compensatory |
85
125