UNITED STATES
SECURITIES AND EXCHANGE COMMISSION
Washington, D.C. 20549
FORM 10-K
(Mark One)
| þ | ANNUAL REPORT PURSUANT TO SECTION 13 OR 15(d) OF THE SECURITIES EXCHANGE ACT OF 1934 |
For the fiscal year ended December 31, 20102013
OR
| TRANSITION REPORT PURSUANT TO SECTION 13 OR 15(d) OF THE SECURITIES EXCHANGE ACT OF 1934 | |
Commission file number 1-12387
TENNECO INC.
(Exact name of registrant as specified in its charter)
| Delaware | 76-0515284 | |
(State or other jurisdiction of incorporation or organization) | (I.R.S. Employer Identification No.) | |
| 500 North Field Drive Lake Forest, IL (Address of principal executive offices) | 60045 (Zip Code) | |
Registrant’s telephone number, including areacode: (847) 482-5000
Securities registered pursuant to Section 12(b) of the Act:
| Title of each class | ||
Name of each Exchange | ||
on which registered | ||
| Common Stock, par value $.01 per share | New York and Chicago Stock Exchanges | |
Securities registered pursuant to Section 12(g) of the Act: None
Indicate by check mark if the registrant is a well-known seasoned issuer, as defined in Rule 405 of the Securities Act. Yes þ No ü¨
Indicate by check mark if the registrant is not required to file reports pursuant to Section 13 or Section 15(d) of the Act. Yes ¨ No üþ
Note — Checking the box above will not relieve any registrant required to file reports pursuant to Section 13 or 15(d) of the Exchange Act from their obligations under those Sections.
Indicate by check mark whether the registrant (1) has filed all reports required to be filed by Section 13 or 15(d) of the Securities Exchange Act of 1934 during the preceding 12 months (or for such shorter period that the registrant was required to file such reports), and (2) has been subject to such filing requirements for the past 90 days. Yes üþ No ¨
Indicate by check mark whether the registrant has submitted electronically and posted on its corporate Web site, if any, every Interactive Data File required to be submitted and posted pursuant to Rule 405 ofRegulation S-T during the preceding 12 months (or for such shorter period that the registrant was required to submit and post such files). Yes þ No ¨
Indicate by check mark if disclosure of delinquent filers pursuant to Item 405 of Regulation S-K is not contained herein, and will not be contained, to the best of registrant’s knowledge, in definitive proxy or information statements incorporated by reference in Part III of this Form 10-K or any amendment to this Form 10-K. þ
Indicate by check mark whether the registrant is a large accelerated filer, an accelerated filer, a non-accelerated filer, or a smaller reporting company. See the definitions of “large accelerated filer,” “accelerated filer” and “smaller reporting company” in Rule12b-2 of the Exchange Act. (Check one):
Large accelerated filer | Accelerated filer ¨ | Non-accelerated filer ¨ | Smaller reporting company ¨ |
| (Do not check if a smaller reporting company) | |||
Indicate by check mark whether the registrant is a shell company (as defined inRule 12b-2 of the Exchange Act). Yes ¨ No üþ
Documents Incorporated by Reference:
| Document | ||
Part of the Form 10-K | ||
| into which incorporated | ||
| Portions of Tenneco Inc.’s Definitive Proxy Statement for the Annual Meeting of Stockholders to be held May | Part III | |
CAUTIONARY STATEMENT FOR PURPOSES OF THE “SAFE HARBOR” PROVISIONS OF THE PRIVATE SECURITIES LITIGATION REFORM ACT OF 1995
This Annual Report contains forward-looking statements within the meaning of the Private Securities Litigation Reform Act of 1995 concerning, among other things, our prospects and business strategies. These forward-looking statements are included in various sections of this report, including the section entitled “Outlook” appearing in Item 7 of this report. The words “may,” “will,” “believe,” “should,” “could,” “plan,” “expect,” “anticipate,” “estimate,” and similar expressions (and variations thereof), identify these forward-looking statements. Although we believe that the expectations reflected in these forward-looking statements are based on reasonable assumptions, these expectations may not prove to be correct. Because these forward-looking statements are also subject to risks and uncertainties, actual results may differ materially from the expectations expressed in the forward-looking statements. Important factors that could cause actual results to differ materially from the expectations reflected in the forward-looking statements include:
general economic, business and market conditions;
our ability to source and procure needed materials, components and other products and services in accordance with customer demand and at competitive prices;
changes in capital availability or costs, including increases in our cost of borrowing (i.e., interest rate increases), the amount of our debt, our ability to access capital markets at favorable rates, and the credit ratings of our debt;
changes in consumer demand, prices and our ability to have our products included on top selling vehicles, including any shifts in consumer preferences away from light trucks, which tend to be higher margin products for our customers and us, to other lower margin vehicles, for which we may or may not have supply arrangements;
changes in consumer demand for our automotive, commercial or aftermarket products, or changes in automotive and commercial vehicle manufacturers’ production rates and their actual and forecasted requirements for our products, due to difficult economic conditions, such as the prolonged recession in Europe;
the overall highly competitive nature of the automobile and commercial vehicle parts industries, and any resultant inability to realize the sales represented by our awarded book of business (which is based on anticipated pricing and volumes over the life of the applicable program);
the loss of any of our large original equipment manufacturer (“OEM”) customers (on whom we depend for a substantial portion of our revenues), or the loss of market shares by these customers if we are unable to achieve increased sales to other OEMs or any change in customer demand due to delays in the adoption or enforcement of worldwide emissions regulations;
our ability to successfully execute cash management and other cost reduction plans, including our current European cost reduction initiatives, and to realize anticipated benefits from these plans;
industrywide strikes, labor disruptions at our facilities or any labor or other economic disruptions at any of our significant customers or suppliers or any of our customers’ other suppliers;
increases in the costs of raw materials, including our ability to successfully reduce the impact of any such cost increases through materials substitutions, cost reduction initiatives, customer recovery and other methods;
the negative impact of higher fuel prices on transportation and logistics costs, raw material costs and discretionary purchases of vehicles or aftermarket products;
the cyclical nature of the global vehicle industry, including the performance of the global aftermarket sector and the impact of vehicle parts’ longer product lives;
costs related to product warranties and other customer satisfaction actions;
the cost and outcome of existing and any future claims, legal proceedings or investigations, including, but not limited to, claims or proceedings against us or our customers relating to product performance, product safety or intellectual property rights;
the failure or breach of our information technology systems, including the consequences of any misappropriation, exposure or corruption of sensitive information stored on such systems and the interruption to our business that such failure or breach may cause;
the impact of consolidation among vehicle parts suppliers and customers on our ability to compete;
changes in distribution channels or competitive conditions in the markets and countries where we operate, including the impact of changes in distribution channels for aftermarket products on our ability to increase or maintain aftermarket sales;
economic, exchange rate and political conditions in the countries where we operate or sell our products;
customer acceptance of new products;
new technologies that reduce the demand for certain of our products or otherwise render them obsolete;
our ability to introduce new products and technologies that satisfy customers' needs in a timely fashion;
3
The risks included here are not exhaustive. Refer to “Part I, Item 1A — Risk Factors” of this report for further discussion regarding our exposure to risks. Additionally, new risk factors emerge from time to time and it is not possible for us to predict all such risk factors, nor to assess the impact such risk factors might have on our business or the extent to which any factor or combination of factors may cause actual results to differ materially from those contained in any forward-looking statements. Given these risks and uncertainties, investors should not place undue reliance on forward-looking statements as a prediction of actual results.
ii
4
TABLE OF CONTENTS
iii
5
PART I
ITEM 1.BUSINESS.
TENNECO INC.
General
Our company, Tenneco Inc., is one of the world’s largest producers of emission controlclean air and ride controlperformance products and systems for light vehicle, commercial truck, off-highway and specialtyother vehicle applications. Our company serves both original equipment vehicle manufacturers (“OEMs”) and the repair and replacement markets, or aftermarket, worldwide. As used herein, the term “Tenneco,” “we,” “us,” “our,” or the “Company” refers to Tenneco Inc. and its consolidated subsidiaries.
We were incorporated in Delaware in 1996. In 2005, we changed our name from Tenneco Automotive Inc. to Tenneco Inc. The name Tenneco better represents the expanding number of markets we serve through our commercial truck and specialty vehicleoff-highway businesses. Building a stronger presence in these markets complements our core businesses of supplying ride controlperformance and emission controlclean air products and systems for light vehicles to automotive original equipment and aftermarket customers worldwide. Our common stock is traded on the New York Stock Exchange (“NYSE”) and the Chicago Stock Exchange under the symbol “TEN.”
Corporate Governance and Available Information
We have established a comprehensive approach to corporate governance plan for the purpose of defining responsibilities, setting high standards of professional and personal conduct and assuring compliance with such responsibilities and standards. As part of its annual review process, the Board of Directors monitors developments in the area of corporate governance. Listed below are some of the key elements of our corporate governance plan.
policies.
For more information about these matters, see our definitive Proxy Statement for the Annual Meeting of Stockholders to be held on May 18, 2011.14, 2014.
Independence of Directors
Independent directors are scheduled to meet separately in executive session after every regularly scheduled Board of Directors meeting.
We have a lead independent director, Mr. Paul T. Stecko.
Audit Committee
| All members meet the independence standards for audit committee membership under the NYSE listing standards and applicable Securities and Exchange Commission (“SEC”) rules. | ||
1
Two members of the Audit Committee, Mr. Dennis J. Letham and Mr. Thomas C. Freyman, have been designated by the Board as “audit committee financial experts,” as defined in the SEC rules, and all members of the Audit Committee satisfy the NYSE’s financial literacy requirements.
The Audit Committee operates under a written charter which governs its duties and responsibilities, including its sole authority to appoint, review, evaluate and replace our independent auditors.
The Audit Committee has adopted policies and procedures governing the pre-approval of all audit, audit-related, tax and other services provided by our independent auditors.
Compensation/Nominating/Governance Committee
| All members meet the independence standards for compensation and nominating committee membership under the NYSE listing standards. | ||
The Compensation/Nominating/Governance Committee operates under a written charter that governs its duties and responsibilities, including the responsibility for executive compensation.
We have an Executive Compensation Subcommittee which has the responsibility to consider and approve compensation for our executive officers which is intended to qualify as “performance based compensation” under Section 162(m) of the Internal Revenue Code.
Corporate Governance Principles
| We have adopted Corporate Governance Principles, including qualification and independence standards for directors. |
Stock Ownership Guidelines
6
We have adopted Stock Ownership Guidelines to align the interests of our executives with the interests of stockholders and promote our commitment to sound corporate governance.
| The Stock Ownership Guidelines apply to the independent directors, the Chairman and Chief Executive Officer, and all other officers with a rank of |
Communication with Directors
| The Audit Committee has established a process for confidential and anonymous submission by our employees, as well as submissions by other interested parties, regarding questionable accounting or auditing matters. | ||
Additionally, the Board of Directors has established a process for stockholders to communicate with the Board of Directors, as a whole, or any independent director.
Codes of Business Conduct and Ethics
| We have adopted a Code of Ethical Conduct for Financial Managers, which applies to our Chief Executive Officer, Chief Operating Officer, Chief Financial Officer, Controller and other key financial managers. This code is filed as Exhibit 14 to this report. | ||
We also operate under a Code of Conduct that applies to all directors, officers and employees and includes provisions ranging from restrictions on gifts to conflicts of interests. All salaried employees are required to affirm annually their acceptance of, and compliance with, the Code of Conduct.
Related Party Transactions Policy
| We have adopted a Policy and Procedure for Transactions With Related Persons, under which our Board of Directors must generally pre-approve transactions involving more than $120,000 with our directors, executive officers, five percent or greater stockholders and their immediate family members. |
Equity Award Policy
| We have adopted a written policy for all issuances by our company of compensatory awards in the form of our common stock or any derivative of the common stock. |
2
Personal Loans to Executive Officers and Directors
| We comply with and operate in a manner consistent with the legislation outlawing extensions of credit in the form of a personal loan to or for our directors or executive officers. |
Our Internet address ishttp://www.tenneco.comwww.tenneco.com.. We make our proxy statements, annual report to stockholders, annual report onForm 10-K, quarterly reports onForm 10-Q, current reports onForm 8-K and amendments to those reports, as filed with or furnished to the SEC, available free of charge on our Internet website as soon as reasonably practicable after submission to the SEC. Securities ownership reports on Forms 3, 4 and 5 are also available free of charge on our website as soon as reasonably practicable after submission to the SEC. The contents of our website are not, however, a part of this report. All such statements and reports can also be found at the Internetinternet site maintained by the SEC athttp://www.sec.gov.
Our Audit Committee, Compensation/Nominating/Governance Committee and Executive Compensation Subcommittee Charters, Corporate Governance Principles, Stock Ownership Guidelines, Audit Committee policy regarding accounting complaints, Code of Ethical Conduct for Financial Managers, StatementCode of Business Principles,Conduct, Policy and Procedures for Transactions with Related Persons, Equity Award Policy, policy for communicating with the Board of Directors and Audit Committee policy regarding the pre-approval of audit, non-audit, tax and other services are available free of charge on our website atwww.tenneco.com.In addition, we will make a copy of any of these documents available to any person, without charge, upon written request to Tenneco Inc., 500 North Field Drive, Lake Forest, Illinois 60045, Attn: General Counsel. We intend to satisfy the disclosure requirements under Item 5.05 ofForm 8-K and applicable NYSE rules regarding amendments to, or waivers of, our Code of Ethical Conduct for Financial Managers and StatementCode of Business PrinciplesConduct by posting this information on our website atwww.tenneco.com.
3
7
CONTRIBUTIONS OF MAJOR BUSINESSES
For information concerning our operating segments, geographic areas and major products or groups of products, see Note 11 to the consolidated financial statements of Tenneco Inc. included in Item 8. The following tables summarize for each of our reportable segments for the periods indicated: (i) net sales and operating revenues; (ii) earnings before interest expense, income taxes and noncontrolling interests (“EBIT”); and (iii) expenditures for plant, property and equipment. You shouldSee also read “Management’s Discussion and Analysis of Financial Condition and Results of Operations” included in Item 7 for information about certain costs and charges included in our results.results; and management’s announced organizational changes on February 14, 2013 that aligned our business along product lines, effective with the first quarter of 2013, such that our three prior geographic reportable segments have each been split into two product segments (clean air and ride performance) and three geographic areas (North America; Europe, South America and India; and Asia Pacific), resulting in six operating segments (North America Clean Air, North America Ride Performance, Europe, South America and India Clean Air, Europe, South America and India Ride Performance, Asia Pacific Clean Air and Asia Pacific Ride Performance). The Clean Air division includes the company's emissions control businesses and the Ride Performance division is comprised of its ride control businesses. Costs related to other business activities, primarily corporate headquarter functions, are disclosed separately from the six operating segments as "Other". Prior period segment information has been revised to reflect our new reporting segments.
Net Sales and Operating Revenues:
| 2010 | 2009 | 2008 | ||||||||||||||||||||||
| (Dollar Amounts in Millions) | ||||||||||||||||||||||||
| North America | $ | 2,832 | 48 | % | $ | 2,099 | 45 | % | $ | 2,641 | 45 | % | ||||||||||||
| Europe, South America and India | 2,594 | 44 | 2,209 | 48 | 2,983 | 50 | ||||||||||||||||||
| Asia Pacific | 698 | 12 | 525 | 11 | 543 | 9 | ||||||||||||||||||
| Intergroup sales | (187 | ) | (4 | ) | (184 | ) | (4 | ) | (251 | ) | (4 | ) | ||||||||||||
| Total | $ | 5,937 | 100 | % | $ | 4,649 | 100 | % | $ | 5,916 | 100 | % | ||||||||||||
| 2013 | 2012 | 2011 | ||||||||||||||||||
| (Dollar Amounts in Millions) | ||||||||||||||||||||
| Clean Air Division | ||||||||||||||||||||
| North America | $ | 2,666 | 33 | % | $ | 2,512 | 34 | % | $ | 2,291 | 32 | % | ||||||||
| Europe, South America & India | 2,045 | 26 | % | 1,827 | 25 | % | 1,952 | 27 | % | |||||||||||
| Asia Pacific | 853 | 11 | % | 695 | 9 | % | 625 | 9 | % | |||||||||||
| Intergroup sales | (120 | ) | (2 | )% | (108 | ) | (1 | )% | (107 | ) | (2 | )% | ||||||||
| Total Clean Air Division | 5,444 | 68 | % | 4,926 | 67 | % | 4,761 | 66 | % | |||||||||||
| Ride Performance Division | ||||||||||||||||||||
| North America | 1,265 | 16 | % | 1,223 | 16 | % | 1,135 | 16 | % | |||||||||||
| Europe, South America & India | 1,087 | 14 | % | 1,094 | 15 | % | 1,217 | 17 | % | |||||||||||
| Asia Pacific | 251 | 3 | % | 213 | 3 | % | 179 | 2 | % | |||||||||||
| Intergroup sales | (83 | ) | (1 | )% | (93 | ) | (1 | )% | (87 | ) | (1 | )% | ||||||||
| Total Ride Performance Division | 2,520 | 32 | % | 2,437 | 33 | % | 2,444 | 34 | % | |||||||||||
| Total Tenneco Inc. | $ | 7,964 | 100 | % | $ | 7,363 | 100 | % | $ | 7,205 | 100 | % | ||||||||
| 2010 | 2009 | 2008 | ||||||||||||||||||||||
| (Dollar Amounts in Millions) | ||||||||||||||||||||||||
| North America | $ | 155 | 55 | % | $ | 42 | 45 | % | $ | (107 | ) | NM | ||||||||||||
| Europe, South America and India | 76 | 27 | 20 | 22 | 85 | NM | ||||||||||||||||||
| Asia Pacific | 50 | 18 | 30 | 33 | 19 | NM | ||||||||||||||||||
| Total | $ | 281 | 100 | % | $ | 92 | 100 | % | $ | (3 | ) | NM | ||||||||||||
EBIT:
| 2013 | 2012 | 2011 | ||||||||||||||||||
| (Dollar Amounts in Millions) | ||||||||||||||||||||
| Clean Air Division | ||||||||||||||||||||
| North America | $ | 229 | 54 | % | $ | 202 | 47 | % | $ | 172 | 45 | % | ||||||||
| Europe, South America & India | 57 | 13 | % | 54 | 13 | % | 79 | 21 | % | |||||||||||
| Asia Pacific | 84 | 20 | % | 71 | 17 | % | 47 | 12 | % | |||||||||||
| Total Clean Air Division | 370 | 87 | % | 327 | 76 | % | 298 | 79 | % | |||||||||||
| Ride Performance Division | ||||||||||||||||||||
| North America | 124 | 29 | % | 122 | 29 | % | 76 | 20 | % | |||||||||||
| Europe, South America & India | (7 | ) | (2 | )% | 41 | 10 | % | 69 | 18 | % | ||||||||||
| Asia Pacific | 22 | 5 | % | 5 | 1 | % | (6 | ) | (2 | )% | ||||||||||
| Total Ride Performance Division | 139 | 33 | % | 168 | 39 | % | 139 | 37 | % | |||||||||||
| Other | (85 | ) | (20 | )% | (67 | ) | (16 | )% | (58 | ) | (15 | )% | ||||||||
| Total Tenneco Inc. | $ | 424 | 100 | % | $ | 428 | 100 | % | $ | 379 | 100 | % | ||||||||
8
Expenditures for plant, propertyPlant, Property and equipment:Equipment:
| 2010 | 2009 | 2008 | ||||||||||||||||||||||
| (Dollar Amounts in Millions) | ||||||||||||||||||||||||
| North America | $ | 59 | 38 | % | $ | 45 | 38 | % | $ | 108 | 49 | % | ||||||||||||
| Europe, South America and India | 66 | 43 | 58 | 49 | 89 | 40 | ||||||||||||||||||
| Asia Pacific | 29 | 19 | 15 | 13 | 24 | 11 | ||||||||||||||||||
| Total | $ | 154 | 100 | % | $ | 118 | 100 | % | $ | 221 | 100 | % | ||||||||||||
| 2013 | 2012 | 2011 | ||||||||||||||||||
| (Dollar Amounts in Millions) | ||||||||||||||||||||
| Clean Air Division | ||||||||||||||||||||
| North America | $ | 77 | 30 | % | $ | 76 | 29 | % | $ | 49 | 22 | % | ||||||||
| Europe, South America & India | 61 | 24 | % | 56 | 21 | % | 55 | 25 | % | |||||||||||
| Asia Pacific | 44 | 17 | % | 40 | 15 | % | 24 | 11 | % | |||||||||||
| Total Clean Air Division | 182 | 72 | % | 172 | 65 | % | 128 | 59 | % | |||||||||||
| Ride Performance Division | ||||||||||||||||||||
| North America | 32 | 13 | % | 46 | 17 | % | 39 | 18 | % | |||||||||||
| Europe, South America & India | 34 | 13 | % | 32 | 12 | % | 40 | 18 | % | |||||||||||
| Asia Pacific | 6 | 2 | % | 13 | 5 | % | 11 | 5 | % | |||||||||||
| Total Ride Performance Division | 72 | 28 | % | 91 | 35 | % | 90 | 41 | % | |||||||||||
| Total Tenneco Inc. | $ | 254 | 100 | % | $ | 263 | 100 | % | $ | 218 | 100 | % | ||||||||
Interest expense, income taxes, and noncontrolling interests that were not allocated to our operating segments are:
| 2010 | 2009 | 2008 | ||||||||||
| (Millions) | ||||||||||||
| Interest expense (net of interest capitalized) | $ | 149 | $ | 133 | $ | 113 | ||||||
| Income tax expense | 69 | 13 | 289 | |||||||||
| Noncontrolling interests | 24 | 19 | 10 | |||||||||
| 2013 | 2012 | 2011 | |||||||||
| (Millions) | |||||||||||
| Interest expense (net of interest capitalized) | $ | 80 | $ | 105 | $ | 108 | |||||
| Income tax expense | 122 | 19 | 88 | ||||||||
| Noncontrolling interests | 39 | 29 | 26 | ||||||||
9
DESCRIPTION OF OUR BUSINESS
We design, manufacture and sell emission controlclean air and ride controlperformance systems and products for light vehicle, commercial truck, off-highway and specialty vehicleother applications, and generated revenues of $5.9$8.0 billion in 2010.2013. We serve both original equipment manufacturers (OEMs) and replacement markets worldwide through leading brands, including Monroe®, Rancho®, Clevite® Elastomers, Marzocchi®, Axios™, Kinetic™, and Fric RotFric-Rot™tm ride controlperformance products and Walker®, XNOx™, Fonos™tm, DynoMax®, Thrush™, and GilletLukey™tm clean air products. emission control products.
As a parts supplier, we produce individual component parts for vehicles as well as groups of components that are combined as modules or systems within vehicles. These parts, modules and systems are sold globally to most leading OEMs, commercial truck and throughout alloff-highway engine manufacturers, and aftermarket distribution channels.
Overview of AutomotiveVehicle Parts Industry and Adjacent Markets
The automotivevehicle parts industry is generally separated into two categories: (1) “original equipment” or “OE” in which parts are sold in large quantities directly for use by OEMs;OEMs and commercial truck and off-highway engine manufacturers; and (2) “aftermarket” in which replacement parts are sold in varying quantities to a wide range of wholesalers, retailers and installers. In the OE market,category, parts suppliers are generally divided into tiers — “Tier 1” suppliers that provide their products directly to OEMs, and “Tier 2” or “Tier 3” suppliers that sell their products principally to other suppliers for combination into the other supplier’ssuppliers’ own product offerings.
“Light vehicles” are comprised of: (1) passenger cars and (2) light trucks which include sport-utility vehicles (SUVs), crossover vehicles (CUVs), pick-up trucks, vans and multi-purpose passenger vehicles. Demand for OE light vehicle automotive parts in the OE market is generally a function of the number of new vehicles produced, which in turn is a function ofdepends on prevailing economic conditions and consumer preferences. In 2010,2013, the number of light vehicles produced by region was 11.916.2 million in North America, 28.927.5 million in Europe, South America and India and 33.421.0 million in Asia Pacific. The term “light vehicles” is comprised of two groups: (1) passenger cars and (2) light trucks. When we refer to “light trucks,” we are including sport-utility vehicles (SUV), crossover vehicles (CUV),pick-up trucks, vans and multi-purpose passenger vehicles. Worldwide light vehicle production is forecasted to increase to 78.087.4 million units in 20112014 from approximately 74.284.5 million units in 2010.2013, according to IHS Automotive. Although OE demand is tied to planned vehicle production, parts suppliers also have the opportunity to grow throughrevenues by increasing their product content per vehicle, by further expanding business with existing customers and by serving new customers in existing or new markets. Companies with a global presence and advanced technology, engineering, manufacturing and support capabilities, such as our company,Company, are better positioned to take advantage of these opportunities.
Demand for aftermarket products is driven by general economic conditions, the number of vehicles in operation, the age and distance driven of the vehicle fleet, and the average useful life and quality of vehicle parts. Although more vehicles are on the road than ever before, the aftermarket has experienced longer replacement cycles due to the improved quality of OE parts and increases in theincreased average useful life of automotivevehicle parts that has come to pass as a result of technological innovation. SuppliersParts suppliers are increasingly being required to deliver innovative aftermarket products to drive increased aftermarket demand. Global economic downturns generally impact aftermarket sales less adversely than OE sales, as customers forego new vehicle purchases and keep their vehicles longer, thereby increasing demand for repair and maintenance parts and services.
Industry Trends
5
the roles, responsibilities and relationships of the participants. Key trends that we believe are affecting parts suppliers include:
General Economic Factors and Production Levels
As a result of the lack of consumer confidence caused by the global economic downturn and credit market crisis, the industry experienced a rapid decline in light vehicle purchases in 2008 and the first half of 2009. The industry began to recover during the second half of 2009 when OE light vehicle production began to stabilize and then strengthen, as inventory levels began to be replenished, tracking more closely to vehicle sales, and inventory levels began to be replenished.sales. In 2010, annual light vehicle production grew 39 percent in North America, 30 percent in Asia Pacific and 16 percent in Europe. Production volumes continued to strengthen evidenced byin 2011 in most geographic regions in which we operate. For example, production volumes in North America, Asia PacificEurope and EuropeChina increased 10 percent, five percent and five percent, respectively, in 2011. In 2012, light vehicle production volumes increasing 39improved further in some regions, but declined markedly in Europe. Light vehicle production was up 17 percent 30in North America, though not to levels seen in recent history, and six percent in China. European light vehicle production was down five percent from 2011 levels. In 2013, light vehicle production improved further in some regions, but declined in India and 15 Australia. Light vehicle production was up five
10
percent respectively in 2010 asNorth America, six percent in South America, and 14 percent in China. European light vehicle production was about even with 2012 levels. Light vehicle production was down six percent when compared to 2009.2012 in both India and Australia.
Increasing Environmental Standards
OE manufacturers and their parts suppliers are designing and developing products to respond to increasingly stringent environmental requirements, growth in theengines using diesel marketsand alternative fuels and increased demandsdemand for better fuel economy. Government regulations adopted over the past decade require substantial reductions in vehicle tailpipe criteria pollutant emissions, longer warranties on parts ofwarranty periods for a vehicle’s pollution control equipment and additional equipment to control fuel vapor emissions. In addition, new regulations have been adopted to regulate greenhouse gas emissions of carbon dioxide and improved combustion efficiency and reduction of vehicle mass have become priorities. Manufacturers are responding with new technologies for gasoline- and diesel-fueled vehicles that minimize pollution and improve fuel economy.
As a leading supplier of emission controlclean air systems with strong technical capabilities, we believe we are well positioned to benefit from the more rigorous environmental standards being adopted around the world. We continue to expand our investment in regions such as China, India, Thailand and Japan to capitalize on the growing demand for environmentally friendly solutions for light vehicle, commercial truck and off-highway applications driven by environmental regulations in these regions.
To meet stricter air quality regulations, we have developed and sold diesel particulate filters (DPFs) in Europe, for example, for the Mercedes Benz Sprinter andAudi A4, BMW 1 and 3 series passenger cars and Scania trucks and in Europe andNorth America for the GM Duramax engine applications, the Ford Super Duty, the DodgeChrysler Ram, and International Truckoff-highway applications for Caterpillar and Engine Corporation’s medium-duty trucksJohn Deere in North America.America and Europe, and Kubota in Japan. These particulate filters, coupled with converters, reduce emissions of particulate matter by up to 90 percent and of nitrogen oxide by up to 85 percent. In addition, we have development and production contracts for our selective catalytic reduction (SCR) systems with light, medium and medium-dutyheavy-duty truck manufacturers in North America,manufacturers. These SCR systems reduce emissions of nitrogen oxides by up to 95 percent. In China, South America, Europe, and Asia. In China,Japan, we have development and production contracts for complete turnkey SCR systems includingthat include the ELIM-NOx® urea dosing technology acquired in 2007 and now sold globally under the name XNOx™tm. Customers have also purchased prototypes ofNew regulations in the U.S. and European markets, which require reductions in carbon dioxide emissions and improvements in fuel economy, are creating increased demand for our hydrocarbon injector, a product acquired alongside the XNOxtm technology, which is used to inject hydrocarbon directly into thefabricated manifolds, maniverters, integrated turbocharger/manifold modules, electronic exhaust system to regenerate diesel particulate filtersvalves, and Lean NOx Traps.lightweight components. Lastly, for various non-roadoff-highway customers, we are developingoffer emission aftertreatment systems designed to meet Tier 4A4 interim and Tier 4 Finalfinal environmental regulations. Both commercial truck and off-highway customers are embracing the concept of turnkey aftertreatment systems which require aftertreatment electronic control units (ECUs) as well as related control software which we have developed and sold to several customers.
Increasing Technologically Sophisticated Content
As end users and consumers continue to demand vehicles with improved performance, safety and functionality at competitive prices, the components and systems in these vehicles becomeare becoming technologically more advanced and sophisticated. Mechanical functions are being replaced with electronics; and mechanical and electronic devices are being integrated into single systems. More stringent emission and other regulatory standards increaseare increasing the complexity of the systems as well.
6
To remain competitive as a parts and systems supplier, we invest in engineering, research and development, spending $117$144 million in 2010, $972013, $126 million in 2009,2012, and $127$133 million in 2008,2011, net of customer reimbursements. In addition, we build prototypes and incur other costs on behalf of our customers to further our technological capabilities. Such expenses reimbursed by our customers totaled $109$169 million in 2010, $1042013, $159 million in 2009,2012, and $120$119 million in 2008.2011, including building prototypes and incurring other costs on behalf of our customers. We also fund and sponsor university and other independent research to advance our emission controlclean air and ride controlperformance development.
By investing in technology, we canhave been able to expand our product offerings and penetrate new markets. WeFor example, we developed DPFs which were first sold in Europe and then offered in North America. Since these original innovations, we have developed T.R.U.E-Clean® with our partners, a product used to regenerate DPFs. We have also built prototypes of urea SCR systems for locomotive and marine engines. We expanded our suite of NOx-reduction technologies, developing prototypes of SCR systems using gaseous ammonia, absorbed on a solid salt, as the reductant or a hydrocarbon lean NOx catalyst (HC-LNC for NOx reduction) that relies on hydrocarbons, ethanol, or other reductants instead of urea. For example, during our period of exclusive development with General Electric (GE), we developed a commercially viable hydrocarbon lean NOx catalyst system which utilizes GE’s proprietary silver based catalyst formulation and attracted multiple customers in Brazil that are testing this system using ethanol as the reductant. We successfully developed and sold fabricated manifolds, previously used only on gasoline engines, into the passenger car diesel segment. Recently, we developed our first prototype aftertreatment system for large engines, up to 4500 horsepower, used as line haul locomotives. Tenneco, through an exclusive partnership with Jiangsu Lvyuan in China, has become the first company to obtain China Classification Society (CCS) approval to sell marine selective catalytic reduction systems for China flagged vessels, as required by the International Maritime Organization. On the ride performance side of our business, we co-developed with Öhlins Racing AB a continuously controlled electronic suspension system (CES) now offered by OEMs such as Volvo, Audi, Ford, VW, and Mercedes Benz in their vehicles.and BMW.
Enhanced Vehicle Safety
11
To serve the needs of their customers and meet government mandates, OEMs are seeking parts suppliers that invest in new technologies, capabilities and products that advance vehicle safety, such as roll-over protection systems, smart airbags, braking electronics, computerized electronic suspension, and safer, more durable materials. Those suppliers able to offer such innovative products and technologies have a distinct competitive advantage.
Tenneco offers semi-active suspension systems named CES which was co-developed CESwith Öhlins Racing AB, and offers Kinetic® ride control technology to improvethat improves vehicle stability and handling. We are also developingdevelop other advanced suspension systems like Actively Controlled Car (ACOCAR) that are being designed™ to provide improved vehicle safety and control. Further, we supply premium Monroe® branded brakes to complement our product offerings in the aftermarket space. In addition to these efforts, we continue to promote the “Safety Triangle”Safety Triangle™ of Steering-Stopping-Stability to educate consumers about the detrimental effect of worn shock absorbers on vehicle steering and stopping distances. Further, we introduced premium Monroe® branded brakes to the aftermarket to further complement our product offerings in the aftermarket space.
Outsourcing and Demand for Systems and Modules
OEMs have steadily outsourced more of the design and manufacturing of vehicle parts and systems to simplify the assembly process, lower costs and reduce development times. Furthermore, they have demanded fully integrated, functional systems made possible with the development of advanced electronics in addition to innovative, individual vehicle components and parts that may not readily interface together. As a result, successful parts suppliers offer a variety of component products individually as well as integrated modules and systems:
“Modules” are groups of component parts arranged in close physical proximity to each other within a vehicle. Modules are often assembled by the supplier and shipped to the OEM for installation in a vehicle as a unit. Integrated shock and spring units, seats, instrument panels, axles and door panels are examples.
“Systems” are groups of component parts located throughout a vehicle which operate together to provide a specific vehicle functionality. Emission control systems, anti-lock braking systems, safety restraint systems, roll control systems and powertrain systems are examples. |
This shift towards fully integrated systems created the role of the Tier 1 systems integrator, a supplier responsible for executing a broad array of activities, including design, development, engineering, and testing of component parts, systems and modules. With more than a decade of experience asAs an established Tier 1 supplier, we have produced modules and systems for various vehicle platforms produced worldwide, supplying ride controlperformance modules for the GM ChevyChevrolet Silverado, GMGMC Sierra, and the GMChevrolet Malibu, Chevrolet Impala and Chevrolet Cruze and emission control systems for the Ford Super Duty, Ford Focus, GM ChevyChevrolet Silverado, GMGMC Sierra, SmartForTwo,Chevrolet Malibu, Opel Astra, and VW Passat and Golf. In addition, we continue to design other modules and systems for platforms yet to be introduced to the global marketplace.
7
Global Reach of OE Customers
Changing market dynamics are driving OE manufacturers and their parts suppliers to expand their global reach:
Growing Importance of Growth Markets: Because the North American and Western European automotive regions are mature, OEMs are increasingly focusing on other markets for growth opportunities, particularly Brazil, Russia, India and China, collectively known as the BRIC economies, as well as Thailand. As OEMs have penetrated new regions, growth opportunities for suppliers have emerged.
Governmental Tariffs and Local Parts Requirements: Many governments around the world require vehicles sold within their country to contain specified percentages of locally produced parts. Additionally, some governments place high tariffs on imported parts.
Location of Production Closer to End Markets: As OE manufacturers and parts suppliers have shifted production globally to be closer to their end markets, suppliers have expanded their reach, capturing sales in other markets and taking advantage where possible of relatively low labor costs.
Because of these trends, OE manufacturers are increasingly seeking suppliers capable of supporting vehicle platforms being introduced globally.on a global basis. They want suppliers like Tenneco with design, production, engineering and logistics capabilities that can be accessed not just in North America and Europe but also inmany regions around the developing markets.world.
Global Rationalization of OE Vehicle Platforms
OE manufacturers continue to standardize on “global platforms,” designing basic mechanical structures that are each suitedsuitable for a number of similar vehicle models and able to accommodate different features for more than one region. Light vehicle platforms of over one million units are expected to grow from 4248 percent to 5055 percent of global OE production from 20102013 to 2015.
2018.
With such global platforms, OE manufacturers realize significant economies of scale by limiting variations in items such as steering columns, brake systems, transmissions, axles, exhaust systems, support structures and power window and door lock mechanisms. The shift towards standardization can also benefit automotive parts suppliers. They can experience greater economies of scale, lower material costs, and reduced investment expenses for molds, dies and prototype development.development costs.
12
Extended Product Life of Automotive Parts
The average useful life of automotive parts, both OE and replacement, has been steadily increasingincreased in recent years due to technological innovations.innovations including longer-lasting materials. As a result, although there are more vehicles on the road than ever before, the global aftermarket has not kept pace with that growth. Accordingly, aftermarket suppliers have focused on reducing costs and providing product differentiation through advanced technology and recognized brand names. With our long history of technological innovation, brand awarenessstrong brands and operational effectiveness, we believe we are well positioned to leverage our products and technology.
Changing Aftermarket Distribution Channels
From 20002003 to 2010,2013, the number of retail outlets supplying aftermarket parts increased significantly while the number of jobber stores declined 12nearly seven percent in the U.S. Major aftermarket retailers, such as AutoZone and Advance Auto Parts, attempted to expand their commercial sales by selling directly to parts installers, which had historically purchased from their local warehouse distributors and jobbers, as they continued to market to individual retail consumers. Retailers now have the option to offer premium brands which are often preferred by their commercial customers in addition to standard products which are often selected by their individual store buyers. We believe we are well positioned to respond to this trend because we continue to produce high-quality, premium brands and products. As distribution channels continue to consolidate, both wholesalers and
8
retailers can realize the benefits of sourcing products from a supplier like Tenneco with our breadth of suspension and emissions control products.
Analysis of Revenues
The table below provides, for each of the years 20082011 through 2010,2013, information relating to our net sales and operating revenues, by primary product lines and customer categories.
| Net Sales | ||||||||||||
| Year Ended December 31, | ||||||||||||
| 2010 | 2009 | 2008 | ||||||||||
| (Millions) | ||||||||||||
Emission Control Systems & Products | ||||||||||||
| Aftermarket | $ | 318 | $ | 315 | $ | 358 | ||||||
| Original Equipment | ||||||||||||
| OE Value-add | 2,223 | 1,638 | 2,128 | |||||||||
| OE Substrate(1) | 1,284 | 966 | 1,492 | |||||||||
| 3,507 | 2,604 | 3,620 | ||||||||||
| 3,825 | 2,919 | 3,978 | ||||||||||
Ride Control Systems & Products | ||||||||||||
| Aftermarket | 851 | 721 | 761 | |||||||||
| Original Equipment | 1,261 | 1,009 | 1,177 | |||||||||
| 2,112 | 1,730 | 1,938 | ||||||||||
| Total Revenues | $ | 5,937 | $ | 4,649 | $ | 5,916 | ||||||
Net Sales Year Ended December 31, | |||||||||||
| 2013 | 2012 | 2011 | |||||||||
| (Millions) | |||||||||||
| Clean Air Products & Systems | |||||||||||
| Aftermarket | $ | 327 | $ | 318 | $ | 351 | |||||
| Original Equipment | |||||||||||
| OE Value-add | 3,282 | 2,948 | 2,732 | ||||||||
| OE Substrate(1) | 1,835 | 1,660 | 1,678 | ||||||||
| 5,117 | 4,608 | 4,410 | |||||||||
| 5,444 | 4,926 | 4,761 | |||||||||
| Ride Performance Products & Systems | |||||||||||
| Aftermarket | 953 | 944 | 944 | ||||||||
| Original Equipment | 1,567 | 1,493 | 1,500 | ||||||||
| 2,520 | 2,437 | 2,444 | |||||||||
| Total Revenues | $ | 7,964 | $ | 7,363 | $ | 7,205 | |||||
| (1) | See “Management’s Discussion and Analysis of Financial Condition and Results of Operations” included in Item 7 for a discussion of substrate sales. |
Brands
In each of our operating segments, we manufacture and market products with leading brand names. Monroe® ride control products and Walker® exhaust products are two of the most recognized brands in the industry. We emphasize product value differentiation with brands such as Monroe Sensa-Trac®, Kinetic™ and ReflexFric-Rot™ (ride performance products), Walker® (shock absorbers, XNOx™ (clean air products), DynoMax®, Thrush™ and struts), Quiet-FlowLukey®™ (mufflers), DynoMax® (performance exhaustclean air products), Rancho® (ride controlperformance products for the high performance light truck market)trucks), Clevite® Elastomers (elastomericand Axios™ (noise, vibration and harshness control components), and Marzocchi® (forks and suspensions for the two-wheeler market) and Lukeytmtwo-wheelers). (performance exhaust and filters). In Europe, our Gillettm brand is recognized as a leader in highly engineered exhaust systems for OE customers.
9
Customers
We have developedstrive to develop long-standing business relationships with our customers around the world. In each of our operating segments, we work togethercollaboratively with our customers in all stages of production, including design, development, component sourcing, quality assurance, manufacturing and delivery. With a diverse mix of OE and aftermarket products and facilities in major markets worldwide, we believe we are well positioned to meet customer needs. We believe we have a strong, established
13
reputation with customers for providing high-quality products at competitive prices, as well as for timely delivery and customer service.
During 2010,2013, our OEM and commercial truck and off-highway engine manufacturer customers included:
| North America | Europe | |||
| Asia | ||||
| AM General | AvtoVAZ | Beijing Automotive | ||
| Caterpillar | BMW | BMW | ||
| Brilliance Automobile | ||||
| Changan Automotive | ||||
| Daimler AG | China National Heavy-Duty Truck Group | |||
| E-Z Go | Deutz AG | Daimler AG | ||
| Fiat | Dongfeng Motor | |||
| Ford Motor | Ducati Motor | |||
| General Motors | Ford Motor | First Auto Works | ||
| Harley-Davidson | Ford Motor | |||
| Honda | Geely Automobile | |||
| General Motors | ||||
| Great Wall Motor | ||||
| Navistar International | ||||
| Nissan Motor | ||||
| Oshkosh Truck | McLaren Automotive | Jiangling Motors | ||
| Paccar | Nissan Motor | Kubota | ||
| Toyota Motor | Paccar | Nissan Motor | ||
| Volkswagen Group | PSA Peugeot Citroen | SAIC Motor | ||
| Volvo Global Truck | Renault | |||
| Scania | Toyota Motor | |||
| Suzuki Motor | ||||
| Tata Motors | Weichai Power | |||
| Toyota Motor | Yuchai Group | |||
| Volkswagen Group | ||||
| Volvo Global Truck | ||||
14
| Australia | South America | India | ||
| Club Car | CNH Industrial (Iveco) | Club Car | ||
| CNH Industrial (Iveco) | Daimler AG | Daimler AG | ||
| Ford Motor | Fiat Chrysler Automobile | E-Z Go | ||
| General Motors | Ford Motor | Ford Motor | ||
| Toyota Motor | ||||
| MAN SE | Isuzu Motor | |||
| Navistar International | Mahindra & Mahindra | |||
| Nissan Motor | Nissan Motor | |||
| PSA Peugeot Citroen | Suzuki Motor | |||
| Renault | Tata Motors | |||
| Scania | Toyota Motor | |||
| Toyota Motor | Volkswagen Group | |||
| Volkswagen Group | ||||
The following customers accounted for 10 percent or more of our net sales in any of the last three years.
Customer | 2010 | 2009 | 2008 | |||||||||
| General Motors | 19 | % | 16 | % | 20 | % | ||||||
| Ford | 13 | % | 14 | % | 11 | % | ||||||
| Customer | 2013 | 2012 | 2011 | |||||
| General Motors | 15 | % | 17 | % | 19 | % | ||
| Ford Motor | 14 | % | 15 | % | 15 | % | ||
During 2010,2013, our aftermarket customers were comprised of full-line and specialty warehouse distributors, retailers, jobbers, installer chains and car dealers. These customers included National Auto Parts Association (NAPA), Advance Auto Parts, Uni-Select, Pep BoysO’Reilly Automotive, Aftermarket Auto Parts Alliance, and O’Reilly AutomotiveAutoZone in North America, Temot
10
Autoteile GmbH, Autodistribution International, Group Auto Union, and Auto Teile Ring and AP United in Europe and Rede Presidente in South America. We believe our revenue mix is balanced, with our top 10 aftermarket customers accounting for 4655 percent of our net aftermarket sales and our aftermarket sales representing 2016 percent of our total net sales in 2010.2013.
Competition
We operate in highly competitive markets. Customer loyalty is a key element of competition in these markets and is developed through long-standing relationships, customer service, high quality value-added products and timely delivery. Product pricing and services provided are other important competitive factors.
Seasonality
Our OE and aftermarket businesses are somewhat seasonal. OE production is historically higher in the first half of the year compared to the second half. It decreases in the third quarter due to OE plant shutdowns;shutdowns for model changeovers and European holidays, and softens further in the fourth quarter due to reduced consumer demand for new vehiclesproduction during the holiday season and the winter months in North America and Europe generally. Our aftermarket operations, also affected by seasonality, experience relatively higher demand during the Spring as vehicle owners prepare for the Summer driving season.
While seasonality does impact our business, actual results may vary from the above trends due to global and local economic dynamics as well as industry-specific platform launches and other production-related events. During periods of economic recession, OE sales traditionally decline due to reduced consumer demand for automobiles and other capital goods. Aftermarket sales tend not to be as adversely affected during periods of economic downturn, as consumers forego new vehicle purchases and keep their vehicles longer, thereby increasing demand for repair and maintenance services. By participating in both the OE and aftermarket segments, we generally see a smaller revenue decline during economic downturns than the overall change in OE production.
Clean Air Systems
15
Vehicle emission control products and systems play a critical role in safely conveying noxious exhaust gases away from the passenger compartment and reducing the level of pollutants and engine exhaust noise emitted to acceptable levels. Precise engineering of the exhaust system — extendingwhich extends from the manifold that connects an engine’s exhaust ports to an exhaust pipe, to the catalytic converter that eliminates pollutants from the exhaust, and to the muffler that modulates noise and emissions — leads to a pleasant, tuned engine sound, reduced pollutants and optimized engine performance.
We design, manufacture and distribute a variety of products and systems designed to reduce pollution and optimize engine performance, acoustic tuning and weight, including the following:
Catalytic converters and diesel oxidation catalysts — Devices consisting of a substrate coated with precious metals enclosed in a steel casing used to reduce harmful gaseous emissions such as carbon monoxide;
Diesel Particulate Filters (DPFs) — Devices to capture and regenerate particulate matter emitted from diesel engines;
Burner systems — Devices which actively combust fuel and air inside the exhaust system to create extra heat for DPF regeneration, or to improve the efficiency of SCR systems;
Lean NOx traps — Devices which reduce nitrogen oxide (NOx) emissions from diesel powertrains using capture and store technology;
Hydrocarbon vaporizers and injectors — Devices to add fuel to a diesel exhaust system in order to regenerate diesel particulate filters or Lean NOx traps;
| • |
11
Selective Catalytic Reduction (SCR) systems — Devices which reduce NOx emissions from diesel powertrains using injected reductants such as | ||
Alternative NOx reduction technologies — Devices which reduce NOx emissions from diesel powertrains, by using alternative reductants such as diesel fuel, E85 (85% ethanol, 15% gasoline), or solid forms of ammonia;
Mufflers and resonators — Devices to provide noise elimination and acoustic tuning;
Fabricated Exhaust manifolds — Components that collect gases from individual cylinders of a vehicle’s engine and direct them into a single exhaust pipe; fabricated manifolds can form the core of an emissions module that includes an integrated catalytic converter (maniverter) and/or turbocharger;
Pipes — Utilized to connect various parts of both the hot and cold ends of an exhaust system;
Hydroformed assemblies — Forms in various geometric shapes, such as Y-pipes or T-pipes, which provide optimization in both design and installation as compared to conventional pipes;
Hangers and isolators — Used for system installation and elimination of noise and vibration, and for the improvement of useful life; and
Aftertreatment control units — Computerized electronic devices that utilize embedded software to regulate the performance of active aftertreatment systems, including the control of sensors, injectors, vaporizers, pumps, heaters, valves, actuators, wiring harnesses, relays and other mechatronic components.
For the catalytic converters we sell, we either buy completed catalytic convertersconverter systems themselves or procure substrates coated with precious metals which we incorporate into entirefull systems. We obtain these components and systems from third parties or directly from OE manufacturers, these components and systems, often at the OEM’s discretion.direction. See Item 7, “Management’s Discussion and Analysis of Financial Condition and Results of Operations” for more information on our sales of these products.
We supply our emission controlclean air offerings to 4128 light vehicle makersmanufacturers for use on over 200225 light vehicle models, including fiveseven of the top 10 passenger carscar models produced in Europe and seven of the top 10 light truck models produced in North America for 2010.2013. We also delivered emission controlsupply clean air products to heavy-duty25 manufacturers of commercial truck, off-highway and specialty vehicle manufacturersother vehicles including Harley-Davidson, BMW Motorcycle, Scania, Daimler Trucks, and InternationalCaterpillar, John Deere, Deutz, Kubota, CNHTC, FAW Truck, and Engine Corporation (Navistar).
Weichai Power.
We entered the emission controlclean air market in 1967 with the acquisition of Walker Manufacturing Company, which was founded in 1888, and became one of Europe’s leading OE emission controlclean air systems suppliers with the acquisition of Heinrich Gillet GmbH & Co. in 1994. Throughout this document, the term “Walker” refers to our subsidiaries and affiliates that produce emission controlclean air products and systems.
In the aftermarket, we manufacture, market and distribute replacement mufflers for virtually all North American, European, and Asian makes of light vehiclesvehicle models under brand names including Quiet-Flow®, Tru_Fit and Tru-Fit® and Aluminox Protm, in addition to offering a variety of other related products such as pipes and catalytic converters (Walker® Perfection). We also serve the specialty exhaust aftermarket with offerings that include Mega-Flow® exhaust products for heavy-duty vehicle applications and DynoMax® high performance exhaust
12
products. We continue to emphasize product-value differentiation with other aftermarket brands such as ThrushWalker®, Thrush® and Fonos™tm ..
Ride Performance Systems
16
| Percentage of Net Sales | ||||||||||||
| Year Ended December 31, | ||||||||||||
| 2010 | 2009 | 2008 | ||||||||||
United States | ||||||||||||
| Aftermarket | 11 | % | 17 | % | 12 | % | ||||||
| OE market | 89 | 83 | 88 | |||||||||
| 100 | % | 100 | % | 100 | % | |||||||
Foreign Sales | ||||||||||||
| Aftermarket | 7 | % | 8 | % | 8 | % | ||||||
| OE market | 93 | 92 | 92 | |||||||||
| 100 | % | 100 | % | 100 | % | |||||||
Total Sales by Geographic Area | ||||||||||||
| United States | 39 | % | 31 | % | 32 | % | ||||||
| Foreign | 61 | 69 | 68 | |||||||||
| 100 | % | 100 | % | 100 | % | |||||||
Superior ride control is governed by a vehicle’s suspension system, including its shock absorbers and struts. Shock absorbers and struts serve to maintain the vertical loads placed on the vehicle’svehicle tires, and thus, helphelping keep the tires in contact with the road. A vehicle’s ability to steer, brake, accelerateVehicle steering, braking, acceleration and operate safely dependssafety depend on themaintaining contact between the vehicle’s tires and the road. Worn shocks and struts can allow excess transfer of the vehicle’s weight — either from side to side which is called “roll;” from front to rear which is called “pitch;” or up and down, which is called “bounce.” Shock absorbers and struts are designed to control the vertical loads placed on tires and thereby provide resistance to vehicle roll, pitch and bounce. They not only function as safety components but alsoand provide a comfortable ride.
We design, manufacture and distribute a variety of ride controlperformance products and systems. Our ride control offerings include:systems including:
Shock absorbers — A broad range of mechanical shock absorbers and related components for light- and heavy-duty vehicles, including twin-tube and monotube shock absorbers;
Struts — A complete line of struts and strut assemblies for light vehicles;
| • | ||
Vibration control components (Clevite® |
| • | Kinetic® | |
13
Advanced suspension systems — Shock absorbers and suspension systems that electronically adjust a vehicle’s performance based on inputs such as steering and braking;
Kinetic H2/CES Semi-Active Suspension system — In 2011 we won the Supplier of the Year award from Vehicle Dynamics International Magazine, which recognizes outstanding achievement in global automotive suspension and chassis engineering, for the Kinetic H2/CES Semi-Active Suspension system installed on the McLaren MP4-12C; and
Other — We also offer other ride performance products such as load assist products, springs, steering stabilizers, adjustable suspension systems, suspension kits and modular assemblies.
We supply our ride controlperformance offerings to over 62 vehicle-makers21 light vehicle manufacturers for use on over 220150 light vehicle models, including fiveseven of the top 10 passenger carscar models produced in Europe and eight of the top 10 light truck models produced in North America for 2010.2013. We also supply OE ride controlperformance products and systems to a range of heavy-duty and specialty vehicleover 40 commercial truck manufacturers including Volvo Truck, Scania, International Truck and Engine Corporation (Navistar),Navistar, Daimler Trucks and PACCAR.
In the ride controlperformance aftermarket, we manufacture, market and distribute replacement shock absorbers for virtually all North American, European and Asian makes of light vehiclesvehicle models under several brand names including Gas MaticGas-Matic®, Sensa-Trac®, Monroe Reflex® Reflex® and Monroe® Adventure™tm, Quick-Strut®, as well as Clevite® Elastomers for elastomeric vibration control components. We also sell ride controlperformance offerings for the heavy-duty, non-roadcommercial truck and specialtyother aftermarket segments, such as our Gas-Magnum® shock absorbers for the North American heavy-dutycommercial category and Marzocchi® front forks for two-wheelers.
We entered the ride controlperformance product line in 1977 with the acquisition of Monroe Auto Equipment Company, which was founded in 1916, and introduced the world’s first modern tubular shock absorber in 1930. When the term “Monroe” is used in this document it refers to our subsidiaries and affiliates that produce ride controlperformance products and systems.
| Percentage of Net Sales | ||||||||||||
| Year Ended December 31, | ||||||||||||
| 2010 | 2009 | 2008 | ||||||||||
United States | ||||||||||||
| Aftermarket | 59 | % | 60 | % | 53 | % | ||||||
| OE market | 41 | 40 | 47 | |||||||||
| 100 | % | 100 | % | 100 | % | |||||||
Foreign Sales | ||||||||||||
| Aftermarket | 30 | % | 32 | % | 32 | % | ||||||
| OE market | 70 | 68 | 68 | |||||||||
| 100 | % | 100 | % | 100 | % | |||||||
Total Sales by Geographic Area | ||||||||||||
| United States | 35 | % | 36 | % | 34 | % | ||||||
| Foreign | 65 | 64 | 66 | |||||||||
| 100 | % | 100 | % | 100 | % | |||||||
Financial Information About Geographic Areas
Refer to Note 11 of the consolidated financial statements of Tenneco Inc. included in Item 8 of this report for financial information about geographic areas.
Sales, Marketing and Distribution
We have separate and distinct sales and marketing efforts for our OE and aftermarket businesses.
For OE sales, our sales and marketing team is an integrated group of professionals, including skilled engineers and program managers, who are organized by customer and product type (e.g., ride controlperformance and emission control)clean air). Our sales and marketing team provides the appropriate mix of operational and technical expertise needed to interface successfully with the OEMs. Our new business “capture process” involves working closely with the OEM platform engineering and purchasing teams. Bidding on OE automotive platforms typically encompasses many months of engineering and business development activity. Throughout
14
the process, our sales team, program managers and product engineers assist the OE customer in defining the project’s technical and business requirements. A normal part of the process includes our engineering and sales personnel working on customers’ integrated product teams, and assisting with the development ofdeveloping component/system specifications and test procedures. Given that the OE business involves long-term production contracts awarded on aplatform-by-platform basis, our strategy is to leverage our engineering expertise and strong customer relationships to obtain platform awardstarget and win new business and increase operating margins.
17
For aftermarket sales and marketing, our sales force is generally organized by customer and region and covers multiple product lines. We sell aftermarket products through four primary channels of distribution: (1) the traditional three-step distribution system of full-line warehouse distributors, jobbers and installers; (2) the specialty two-step distribution system of specialty warehouse distributors that carry only specified automotive product groups and installers; (3) direct sales to retailers; and (4) direct sales to installer chains. Our aftermarket sales and marketing representatives cover all levels of the distribution channel, stimulating interest in our products and helping our products move through the distribution system. Also, to generate demand for our products from end-users, we run print, online and televisionoutdoor advertisements and offer pricing promotions. We were one of the first parts manufacturers to offerbusiness-to-business services to customers with TA-Direct, an on-line order entry and customer service tool. In addition, we maintain detailed web sites for each of Walker®, Monroe®, Rancho®, DynoMax®, Monroe® brake brands and our heavy-duty products.
Manufacturing and Engineering
We focus on achieving superior product quality at the lowest operating costs possible using productive, reliable and generally usestate-of-the-artsafe manufacturing processes to achieve that goal. Our manufacturing strategy centers on a lean production system called the Tenneco Manufacturing System (TMS), that is designed to eliminate waste, develop skills, share best practices and lead our manufacturing enterprise to reduce overall costs, while maintaining quality standards and reducing manufacturing cycle time. In addition,As part of TMS, we have implementeduse Six Sigma techniques both in our processesmanufacturing and design to minimize product defects and improve operational efficiencies. We deploy new technology to differentiate our products from our competitors’ and to achieve higher quality and productivity. We continue to adapt our capacity to customer demand, both expanding capabilities in growth areas as well as reallocating capacity away from demand segments in decline.
Clean Air
Our consolidated businesses operate 62 clean air manufacturing facilities worldwide, of which 14 facilities are located in North America, 24 in Europe, South America and India, and 24 in Asia Pacific. We operate 11 emission controlof the manufacturing facilities in the U.S. and 45 emission control manufacturing facilities outside of the U.S. We operate 16 of these international manufacturing facilitiesAsia Pacific through joint ventures in which we hold a controlling interest. We operate five emission controlfour clean air engineering and technical facilities worldwide and share twothree other such facilities with our ride controlperformance operations. Of the four clean air engineering and technical facilities, one is located in North America, two in Europe, and one in Asia Pacific. In addition, threetwo joint ventures in which we hold a noncontrolling interest operate a total of threetwo manufacturing facilities outside the U.S.
in Europe.
Within each of our emission controlclean air manufacturing facilities, operations are organized by component (e.g., muffler, catalytic converter, pipe, resonator and manifold). Our manufacturing systems incorporate cell-based designs, allowingwork-in-process to move through the operation with greater speed and flexibility. We continue to invest in plant and equipment to stay competitive in the industry. For instance, in our Smithville, Tennessee, OE manufacturing facility, we have developed a muffler assembly cell that utilizes laser welding. This allows for quicker change-over times in the process as well as less material used and less weight for the product. There is also a reduced cycle time compared to traditional joining and increased manufacturing precision for superior durability and performance. In 2007, we introduced the Measured and Matched Converter technique in North America. This allows us to maintain the optimum GBD (Gap Bulk Density) in our converter manufacturing operations with Tenneco proprietary processing. This process, coupled with cold spinning of the converter body, versus traditional cone to can welding, allows for more effective use of material through reduced welding, lower cost, and better performance of the product.
In 2009, we introduced low-cost fabricated diesel manifolds in Europe which utilize advanced manufacturing processes such as deep drawing, laser welding, and furnace brazing.
To strengthen our position as a Tier 1 OE systems supplier, we have developed some of our emission controlclean air manufacturing operations into“just-in-time” “just-in-time” or “JIT” systems. In this system, a JIT facility located close to our OE customer’s manufacturing plant receives product components from both our manufacturing
15
operations and independent suppliers, and then assembles and ships products to the OEMs on an as-needed basis. To manage the JIT functions and material flow, we have advanced computerized material requirements planning systems linked with our customers’ and supplier partners’ resource management systems. We have three emission control26 clean air JIT assembly facilities worldwide, of which three facilities are located in the United StatesNorth America, ten in Europe and 22 throughout the rest of the world.13 in Asia Pacific.
Our engineering capabilities include advanced predictive design tools, advanced prototyping processes andstate-of-the-art testing equipment. These technological capabilities make us a “full system” integrator to the OEMs, supplying complete emission control systems from the manifold to the tailpipe, to provide full emission and noise control. We have expanded our engineering capabilities with the 2007 acquisition of Combustion Component Associates’ ELIM-NOx®, mobile emission technology, now sold globally under the XNOx™tm name, thatwhich includes urea and hydrocarbon injection, and electronic controls and software for selective catalytic reduction. We also offer a complete suite of alternative full system NOx aftertreatment technologies, including the Hydrocarbon Lean NOx Catalyst (HC-LNC) technology under joint development with General Electric, and SOLID-SCRSOLID SCR™tm technology licensed from FEV, a Powertrain developmentAmminex, an engineering and engineeringmanufacturing company basedlocated in Germany.Denmark. We have also developed advanced predictive engineering tools, including KBM&E (Knowledge Based Manufacturing & Engineering). The innovation of our KBM&E (which we call TEN-KBM&E) is a modular toolbox set of CAD embedded applications for manufacturing and engineering compliant design. The encapsulated TEN-KBM&E content is driven by an analytical method which continuously
18
captures and updates the knowledge of our main manufacturing and engineering processes. Our global engineering capabilities are standardized through the use of the ATLAS Global PDM (Product data management)Data Management) system, enabling a more efficient transfer of knowledge around the world.
Ride Control
Performance
Our consolidated businesses operate seven27 ride controlperformance manufacturing facilities worldwide, of which nine facilities are located in the U.S.North America, 13 in Europe, South America and 23 ride control manufacturing facilities outside the U.S.India, and five in Asia Pacific. We operate two of these internationalthe facilities through joint ventures in which we hold a controlling interest.interest, one in Europe and another one in Asia. We operate seven engineering and technical facilities worldwide and share twothree other such facilities with our emission controlclean air operations.
Of the seven ride performance engineering and technical facilities, two are located in North America, four in Europe, South America and India, and one in Asia Pacific.
Within each of our ride controlperformance manufacturing facilities, operations are organized by product (e.g., shocks, struts and vibration control products) and include computer numerically controlled and conventional machine centers; tube milling anddrawn-over-mandrel manufacturing equipment; metal inert gas and resistance welding; powdered metal pressing and sintering; chrome plating; stamping; and assembly/test capabilities. Our manufacturing systems incorporate cell-based designs, allowingwork-in-process to move through the operation with greater speed and flexibility.
To strengthen our position as a Tier 1 OE module supplier, we have developed someone of our ride performance manufacturing operations into a JIT systems. We have three JIT ride control facilities outside the U.S.
assembly operation in Europe.
In designing our shock absorbers and struts, we use advanced engineering and test capabilities to provide product reliability, endurance and performance. Our engineering capabilities feature advanced computer-aided design equipment and testing facilities. Our dedication to innovative solutions has led to such technological advances as:
| Adaptive damping systems — adapt to the vehicle’s motion to better control undesirable vehicle motions; | ||
Electronically adjustable suspensions — change suspension performance based on a variety of inputs such as steering, braking, vehicle height, and velocity; and
Air leveling systems — manually or automatically adjust the height of the vehicle.
Conventional shock absorbers and struts generally develop an appropriate compromise eitherbetween ride comfort or vehicle control.and handling. Our innovative grooved-tube, gas-charged shock absorbers and struts provide both ride comfort and vehicle control, resulting in improved handling, reduced vibration and a wider range of vehicle control. This technology can be found in our premium quality Sensa-Trac® shock absorbers. We further enhanced this technology by adding the SafeTech™tm fluon banded piston, which improves shock absorber performance and durability. We
16
introduced the Monroe Reflex® Reflex® shock absorber, which incorporates our Impact Sensor™tm device. This technology permits the shock absorber to automatically switch in a matter of milliseconds between firm and soft compression damping when the vehicle encounters rough road conditions, and thus maintaining bettertire-to-road contact and improving handling and safety. We developed the Quick-Strut® which simplifies and shortens the installation of aftermarket struts. This technology combines the spring and upper mount into a single, complete module, eliminating the need for special tools and skills required previously. We have also developed an innovative computerized electronic suspension system, which features dampers developed by Tenneco and electronic valves designed by Öhlins Racing AB. The continuously controlled electronic suspension (“CES”) ride controlperformance system is featured on Audi, Volvo, Ford, VWVolkswagen, BMW, and Mercedes Benz vehicles.
Quality Control
Quality control is an important part of our production process. Our quality engineers establish performance and reliability standards in the product’s design stage, and use prototypes to confirm that the component/system can be manufactured to specifications. Quality control is also integrated into the manufacturing process, with shop operators being responsible for quality control of their specific work product. In addition, our inspectors testwork-in-progress at various stages to ensure components are being fabricated to meet customers’ requirements.
We believe our commitment to quality control and sound management practices and policies is demonstrated by our successful participation in the International Standards Organization/Technical Specifications certification process (“ISO/TS”). ISO/TS certifications are semi-annual or annual audits that certify that a company’s facilities meet stringent quality and business systems requirements. Without ISO or TS certification, we would not be able to supply our products for the aftermarket or theto our OE market, respectively,customers, either locally or globally. All of our manufacturing facilities where we have determined that TS certification is required to serve our customers or would provide us with an advantage in securing additional business, have achieved ISO/TS 16949 certification.
Global Procurement Management
19
Our direct and indirect material costs represent a significant component of our cost structure. To ensure that our material acquisition process provides both a local and global competitive advantage, in addition to meeting regional legislative requirements, we have designed globally integrated standard processes which are managed by global teams of commodity specialists. Each global commodity strategy is tailored to regional requirements while leveraging our global scale to deliver the most cost effective solutions at a local level.
Business Strategy
We strive to strengthen our global market position by designing, manufacturing, delivering and marketing technologically innovative emission controlclean air and ride controlperformance products and systems for OEMs and the aftermarket. We work toward achieving a balanced mix of products, markets and customers by capitalizing on emerging trends, specific regional preferences and changing customer requirements. We target both mature and developing markets for not just light vehicles, but also forvehicle, commercial truck, off-highway and specialty vehicles.other vehicle business. We further enhance our operations by focusing on operational excellence in all functional areas.
The key components of our business strategy are described below:
Develop and Commercialize Advanced Technologies
We develop and commercialize technologies that allow us to expand into new, fast-growing markets and serve our existing customers. By anticipating customer needs and preferences, we design advanced technologies that meet global market needs. For example, to meet the increasingly stringent emissions regulations being introduced around the world, we offer several technologies designed to reduce NOx emissions onfrom passenger, commercial truck and commercialoff-highway vehicles. This includesThese technologies include an integrated Selective Catalytic Reduction (SCR) system that incorporates our ELIM-NOxXNOx®™ technology, now sold globally under the name XNOxtm.electrical valves for diesel-powered vehicles with low-pressure exhaust gas recirculation systems, and diesel and gasoline particulate filters. We also offer a NOx absorber and are developing a hydrocarbon lean NOx catalyst system and a solid urea SCR system to address NOx emissions.system. Additionally, we offer thermal management solutions, includingsuch as our T.R.U.E.-Clean® active diesel particulate filter system.system and through a consortium thermoelectric generators that convert waste exhaust heat into electrical energy.
We expect available content per vehicle to continue to rise over the next several years. Advanced aftertreatment exhaust systems will beare required to comply with emissions regulations that affect light, commercial truck and commercialoff-highway vehicles as well as non-road, locomotive, marine and stationary engines. In addition, vehicle manufacturers, we believe, will offer greater comfort, handling and safety features by offering products such as electronic suspension and adjustable dampers. Our Continuously Controlled Electronic Suspension (CES) shock absorbers, which we co-developed with Öhlins Racing AB, are now sold to Volvo, Audi, Mercedes, VW, BMW, and Ford, among others, and our engineered elastomers to manufacturers with unique requirements. Our newest electronic suspension product DRiV™tm, licensed fromusing digital-valve technology developed by Sturman Industries, is the first industry example of using digital valves for ride controlperformance products thereby offering faster response, lighter weight, and reduced power consumption compared to existing analog products.
17
We continue to focus on developingintroducing highly engineered systems and complex assemblies and modules designed to provide value-added solutions to customers and increase vehicle content generally. Having many of our engineering and manufacturing facilities integrated electronically, we believe, has helped our products continue to be selected for inclusion in top-selling vehicles. In addition, ourjust-in-time and in-line sequencing manufacturing processes and distribution capabilities have enabled us to be more responsive to our customers’ needs.
Penetrate Adjacent Markets
We seek to penetrate a variety of adjacent marketssales opportunities and achieve growth in higher-margin businesses by applying our existing design, engineering and manufacturing capabilities. For example, we are aggressively leveragingleverage our technology and engineering leadership in emissionclean air and ride controlperformance into adjacent marketssales opportunities for two wheelers, heavy-duty trucks, buses, agricultural equipment, construction machinery and other commercialvehicles. In line with regulations set and specialty vehicles. We are launching programs with 13 commercial vehicle customers for on- and non-road equipmentenforced in China, North America, Europe, China, Japan, South America and South America. TheseIndia, we launch clean air products for commercial truck and off-highway customers. Such customers include Caterpillar, for whom we are their global diesel emission controlclean air system integrator, as well as John Deere, Navistar, Deutz, Daimler Trucks, MAN SE, Scania, China National Heavy Duty Truck Company, Shanghai Diesel Engine Company, Weichai Power, FAW Group, and Guangxi Yuchai Machinery Company. We planYuchai. In addition, we continue to announce four additionalexpand into new markets with new customers, when we get approval to do so. Three of theseincluding with clean air products for customers, aresuch as Kubota in South America where Brazil regulations changeJapan, and Mahindra in 2012,India. Our 2013 and one is in China. Our 20102012 revenue generated by our commercial truck, off-highway and specialty vehicleother business was 914 percent and 13 percent, of our total OE revenue. In 2008, we added the ride control products and technologies of Gruppo Marzocchi to our existing exhaust systems business for two-wheelers. In addition, we are evaluating and selectively pursuing retrofit opportunities which will allow us to penetrate new markets or expand our products in existing markets.revenue, respectively.
Expand in Developing Economies
Geographically
We continue to expand our global footprint into growth regions around the world. Recently,In 2010, we opened wholly-owned emission controlclean air manufacturing facilities in Chennai, India and Guangzhou, China, and a ride controlperformance facility in Chonburi, Thailand. In addition, we opened new emission controlclean air facilities in Changchun, China and in Beijing, China as a result of our new joint venture agreements with FAW Sihuan and Beijing Hainachuan Automotive Part Company Limited, respectively. In 2011 we relocated and expanded two plants in China and during the third quarter, increased our investment in Thailand by acquiring the remaining interest in our
20
clean air joint venture. We continue to develop our Thailand footprint with the goal of using it as a base for our future operations in that region. In 2012, we opened our first manufacturing plant in Japan, a clean air facility located in Osaka, which will support further growth in the region. In 2013, we opened our new clean air manufacturing facility in Chakan, India which is located close to key customers in the Pune region. As OEMs have enteredexpanded in the fast-growing economiesregions of Brazil, Russia, India, China, and Thailand, we have followed, building our capabilities to engineer and produce locally cost-competitive and cutting-edge products, and capturingenabling us to capture new business.
Maintain Our Aftermarket Leadership
We manufacture and market leading, brand-name products to a diversified and global aftermarket customer base. Two of the most recognized brand-name products in the automotive parts industry are our Monroe® ride controlperformance products and Walker® emission control clean air products, which have been offered to consumers since the 1930s. We believe our brand equity in the aftermarket is a key asset especially as customers consolidate and distribution channels of distribution converge.
We provide value differentiation by creating product extensions bearing our various brands. For example, we offer Monroe Reflex® Reflex® and Monroe Sensa-Trac® Sensa-Trac® shock absorbers, Walker Quiet-Flow® Quiet-Flow® mufflers, Rancho® ride controlperformance products, DynoMax® exhaust products and Walker Ultra® catalytic converters, and in European markets,Europe, Walker and Aluminox Pro™tm mufflers. Further, we introduced Monroe® Springstm and Monroe MagnumMonro-Magnum®tm (bus and truck shock line) in Europe and Monroe Dynamics® Dynamics® and Monroe Ceramics® Ceramics® brake pads in the United States. We continue to explore other opportunities for developing new product lines that bearwill be marketed under our existing, well-known brands.
We strive to gain market share in the aftermarket business by adding new product offerings and increasing our market coverage of existing brands and products. To this end, we offer an innovative, ride controlperformance product, the Quick-Strut®, that combines the spring and the upper mount into a single, complete module and simplifies and shortens the installation process, eliminating the need for the special tools and skills required previously. We plan on adaptingadapt our products further for use in foreign nameplate vehicles, withfor example, by introducing the introductionOESpectrum® line of
18
Our success in the aftermarket business strengthens our competitive position with OEMs. We gain timely market and product knowledge that can be used to modify and enhance our original equipment offerings for greater customer acceptance. For our clean air product line, we continue to enhance our converter coverage, adding for example to our suite of manifold converter part numbers. In addition, we also offer aftermarket diesel particulate filters.
Execute Focused Transactions
We have successfully identified and capitalized on strategic acquisitions and alliances to achieve growth. Through these acquisitions and alliances, we have (1) expanded our product portfolio with complementary technologies; (2) realized incremental business from existing customers; (3) gained access to new customers; and (4) achieved leadership positions in geographic marketsregions outside North America.
We positioned ourselves as a leading exhaust supplier in the rapidly growing Chinese marketAsian region through majority-owned joint ventureour operations in DalianChina, India and Shanghai.Thailand. In June 2009, we formed a joint venture with Beijing Hainachuan Automotive Parts Company Limited in Beijing that will produce emission-controlproduces clean air exhaust systems for Hyundai. In addition, we continue to serve North American and European OEMs located in China; we supply parts and systems for luxury cars produced by BMW and Audi through our joint venture with Eberspächer International GmbH, and we supply parts and systems for various Ford platforms through our joint venture with Chengdu Lingchuan Mechanical Plant. We established a local engineering center in Shanghai to develop automotive exhaustclean air products when our joint venture with Shanghai Tractor and Engine Company, a subsidiary of Shanghai Automotive Industry Corp., was expanded. Also, we increased our stakeinvestment from 6080 percent to 80100 percent in Tenneco Tongtai Exhaust Company Limited (TTEC) located in Dalian in January 2010the fourth quarter of 2013 and from 75 percent to 100 percent in our Thailand clean air company, Walker Exhaust Co. Limited in August 2011. Further, we formed a new joint venture in March 2010 with FAW Sihuan to supply emission controlclean air components and systems for passenger and commercial vehicles.
In February 2009, we signed a joint development agreement with GE Transportation, a unit of General Electric Company, to develop a proprietary SCR anddiesel aftertreatment technology designed to reduce and control diesel engine emissions for various transportation and other applications. We are collaborating with GE Transportation on the development and production of GE’s Hydrocarbon Lean NOx catalyst technology, (LNC), a diesel aftertreatment innovation aimed at reducing harmful nitrogen oxide (NOx) emissions as effectively as urea-based SCR systems.
In late 2012, we signed an exclusive joint development agreement with Cormetech Inc., a joint equity company of Corning Inc. and Mitsubishi Heavy Industries Ltd, to design ultra-large diameter SCR catalysts for marine, locomotive and certain stationary applications. Also in late 2012, we signed a nonexclusive Joint Development and Licensing Agreement with Amminex for the design and development of SOLID-SCR™ systems.
21
We are working with others on alternative urea SCR technologies, such as solid ammonium carbamate SCR.
manufacturers.
We intend to continue to pursue strategic alliances, joint ventures, acquisitions and other transactions that complement or enhance our existing products, technology, systems development efforts, customer baseand/or global presence. We will align with companies that have proven products, proprietary technology, advanced research capabilities, broad geographic reach,and/or strong market positions to further strengthen our product leadership, technological edge, internationaltechnology position, global reach and customer relationships.
Adapt Cost Structure to Economic Realities
We aggressively respond to difficult economic environments, aligning our operations to any resulting reductions in production levels and replacement demand and executing comprehensive restructuring and cost-reduction initiatives. InOn September 22, 2009, we announced that we were closing our original equipment ride performance plant in Cozad, Nebraska. The closure of the Cozad plant eliminated approximately 500 positions. We hired at other facilities as we moved production from Cozad to those facilities, which resulted in a net decrease of approximately 60 positions. Much of the production was shifted from Cozad to our plant in Hartwell, Georgia. The closure of the Cozad plant was completed in August 2012 at a total cost of $23 million. Annualized cost savings as a result of these actions total $8 million.
We have continued to implement cost reduction initiatives where appropriate and in the third quarter of 2011, we completed a restructuring action that permanently eliminated 53 positions, or seven percent of our total workforce in Australia. This restructuring is part of a continuing broader plan for the Asia Pacific region where we are positioning Tenneco for growth by re-deploying assets to maximize utilization while at the same time addressing the industry environment in the region.
On January 31, 2013, we announced our intent to reduce structural costs in Europe by approximately $60 million annually, and anticipate related costs of approximately $120 million, which includes the closing of the Vittaryd facility in Sweden that we announced in September 2012 and a $7 million charge recorded in the fourth quarter of 2008, we launched a global restructuring program that is
19
Strengthen Operational Excellence
We will continue to focus on operational excellence by optimizing our manufacturing footprint, enhancing our Six Sigma processes and Lean productivity tools, developing further our engineering capabilities, managing the complexities of our global supply chain to realize purchasing economies of scale while satisfying diverse and global requirements, and supporting our businesses with robust information technology systems. We will make investments in our operations and infrastructure as required to achieve our strategic goals. We will be mindful of the changing market conditions that might necessitate adjustments to our resources and manufacturing capacity around the world. We will remain committed to protecting the environment as well as the health and safety of our employees.
Environmental Matters
We estimate that we and our subsidiaries will make expenditures for plant, property and equipment for environmental matters of approximately $7$8 million in 20112014 and $3$5 million in 2012.
2015.
For additional information regarding environmental matters, see Item 3, “Legal Proceedings,” Item 7, “Management’s Discussion and Analysis of Financial Condition and Results of Operations — Environmental and Other Matters,” Item 7, “Management’s Discussion and Analysis of Financial Condition and Results of Operations — Liquidity and Capital Resources” and Note 12 to the consolidated financial statements of Tenneco Inc. included in Item 8.
Employees
As of December 31, 2010,2013, we had approximately 22,00026,000 employees of whichwhom approximately 5043 percent were covered by collective bargaining agreements. European works councils cover 2018 percent of our total employees, a majority of whom are also included under collective bargaining agreements. Several of our
20
existing labor agreements in Mexico and the United States and MexicoU.S. are scheduled for renegotiation in 2011.2014. In addition, agreements covering plants in France, Germany, and Argentina are expiring in 2011 in Europe and South America covering plants in Spain, Poland, Portugal and Argentina.2014. We regard our employee relations as satisfactory.
Other
The principal raw material that we use is steel. We obtain steel from a number of sources pursuant to various contractual and other arrangements. We believe that an adequate supply of steel can presently be obtained from a number of different domestic and foreign suppliers. From 2004 through 2008, we experienced higherIn general, steel prices which we addressedhave been increasing since 2004 with the exception of a temporary but
22
significant decline in prices as a result of the economic turmoil in 2008 and 2009. We address such price increases by evaluating alternative materials and processes, reviewing material substitution opportunities, increasing component and assembly outsourcing to lowbest cost countries, as well as strategically pursuing regional and global purchasing strategies for specific commodities, and aggressively negotiating with our customers to allow us to recover these higher costs from them. As global economies continue to recover, we expect increasing price pressure on key commodities, including rubber, oil and steel.
We hold a number of domestic and foreign patents and trademarks relating to our products and businesses. We manufacture and distribute our aftermarket products primarily under the Walker® and Monroe® brand names, which are well-recognized in the marketplace and are registered trademarks. We also sellmarket certain of our emission controlclean air products to OE manufacturers under the names SOLID-SCRSOLID SCR™tm and XNOx™tm. The patents, trademarks and other intellectual property owned by or licensed to us are important in the manufacturing, marketing and distribution of our products.
21
23
ITEM 1A. | RISK FACTORS. |
Future deterioration or prolonged difficulty in economic conditions could have a material adverse impact on our business, financial position and liquidity.
The economic crisis in 2008 and 2009 and the related worldwide financial industry turmoil resulted in a severe and global tightening of credit and liquidity. These conditions led to low consumer confidence, which resulted in delayed and reduced purchases of durable consumer goods such as automobiles. As a result, our OEM customers significantly reduced their production schedules. WhileIn general, light vehicle production has been increasingincreased since the second half of 2009, although there was weakness in Europe and is forecasted to increase globallySouth America in 20112012 and in Europe and India in 2013. Additionally, production of commercial truck and off-highway vehicles with our content on them has been weaker than historical production levels in certain product applications, such as compared to 2010, production is still at low levels, particularlyconstruction equipment in the United States and Western Europe.North America. We cannot assure you that production levels will continue to increase or that they may not decline. Future deterioration or prolonged difficulty in economic conditions could have a material adverse effect on our business, financial position and liquidity.
For example, as we saw in 2008 and 2009, disruptions in the financial markets may adversely impact the availability and cost of credit which could materially and negatively affect our company.Company. Future disruptions in the capital and credit markets could adversely affect our customers’ and our ability to access the liquidity that is necessary to fund operations on terms that are acceptable to us or at all.
In addition, financial or other difficulties at any of our major customers could have a material adverse impact on us, including as a result of lost revenues, significant write offsdowns of accounts receivable, significant impairment charges or additional restructurings beyond our current global plans. Severe financial or other difficulties at any of our major suppliers could have a material adverse effect on us if we are unable to obtain on a timely basis on similar economic terms the quantity and quality of components we require to produce our products.
Moreover, severe financial or operating difficulties at any automotive, commercial truck and off-highway vehicle manufacturer or other supplier could have a significant disruptive effect on the entire automotive industry, leading to supply chain disruptions and labor unrest, among other things. These disruptions could force automotiveoriginal equipment manufacturers and, in turn, other suppliers, including us, to shut down production at plants. While the difficulties facing our customers and suppliers over the last several years have been primarily financial in nature, other difficulties, such as an inability to meet increased demand as the economy recovers, could also result in supply chain and other disruptions.
Factors that reduce demand for our products or reduce prices could materially and adversely impact our financial condition and results of operations.
Demand for and pricing of our products are subject to economic conditions and other factors present in the various domestic and international markets where the products are sold. Demand for our OE products is subject to the level of consumer demand for new vehicles that are equipped with our parts. The level of new light vehicle, commercial truck and off-highway vehicle purchases is cyclical, affected by such factors as general economic conditions, interest rates and availability of credit, consumer confidence, patterns of consumer spending, industrial construction levels, fuel costcosts, government incentives and the automobilevehicle replacement cycle.cycles. Consumer preferences also impact the demand for new light vehicle purchases. For example, if consumers increasingly prefer electric vehicles, demand for the vehicles equipped with our emission controlclean air products would decrease.
Demand for our aftermarket, or replacement, products varies based upon such factors as general economic conditions; the level of new vehicle purchases, which initially displaces demand for aftermarket products; the severity of winter weather, which increases the demand for certain aftermarket products; and other factors, including the average useful life of parts and number of miles driven.
The highly cyclical nature of the automotive and commercial vehicle industry presents a risk that is outside our control and that cannot be accurately predicted. Decreases in demand for automobiles and automotive productscommercial vehicles and vehicle parts generally, or in the demand for our products in particular, could materially and adversely impact our financial condition and results of operations.
In addition, we believe that increasingly stringent environmental standards for emissions have presented and will continue to present an important opportunity for us to grow our clean air business. We cannot assure you, however, that environmental standards for emissions will continue to become more stringent or that the adoption of any new standards will not be delayed beyond our expectations.
We are dependent on large customers for future revenue. The loss of all or a substantial portion of our sales to any of these customers or the loss of market share by these customers could have a material adverse impact on us.
We depend on major vehicle manufacturers for a substantial portion of our net sales. For example, during fiscal year ended December 31, 2010,2013, GM and Ford accounted for 1915 percent and 1314 percent of our net sales, respectively. The loss of all
24
or a substantial portion of our sales to any of our large-volume customers could have a material adverse effect on our financial condition and results of operations by reducing cash flows and our ability to spread costs over a larger revenue base. We may make fewer sales to these customers for a variety of reasons, including but not limited to: (1) loss of awarded business; (2) reduced or delayed customer requirements; (3) strikes or other work stoppages affecting production by the customers; or (4) reduced demand for our customers’ products.
In addition, our OE customers compete intensively against each other and other OE manufacturers. The loss of market share by any of our significant OE customers could have a material adverse effect on our business unless we are able to achieve increased sales to other OE manufacturers.
We may be unable to realize sales represented by our awarded business, which could materially and adversely impact our financial condition and results of operations.
The realization of future sales from awarded business is inherently subject to a number of important risks and uncertainties, including the number of vehicles that our OE customers will actually produce, the timing of that production and the mix of options that our OE customers and consumers may choose. For several years prior to 2008, substantially all of our North American vehicle manufacturing customers had slowed or maintained at relatively flat levels new vehicle production. In 2009, new vehicle production decreased dramatically in many geographic regions as a result of the global economic crisis. During the second half of 2009 and in 2010, new vehicle production stabilized and began to strengthen from these low production levels,levels. For 2011 through 2013, light vehicle production continued to improve in most geographic regions in which we operate, though still not to the levels seen in recent history.history in many of those regions. However, European production declined in 2012 and was weak in 2013, production in South America declined in 2012 and production in India declined in 2013. Additionally, production of commercial truck and off-highway vehicles with our content on them has been weaker than historical production levels in certain product applications, such as construction equipment in North America. In addition to the risks inherent in the cyclicality of vehicle production, our customers generally have the right to replace us with another supplier at any time for a variety of reasons and have demanded price decreases over the life of awarded business. Accordingly, we cannot assure you that we will in fact realize any or all of the future sales represented by our awarded business. Any failure to realize these sales could have a material adverse effect on our financial condition, results of operations, and liquidity.
In many cases, we must commit substantial resources in preparation for production under awarded OE business well in advance of the customer’s production start date. In certain instances, the terms of our OE customer arrangements permit us to recover these pre-production costs if the customer cancels the business through no fault of our company. Although we have been successful in recovering these costs under appropriate circumstances in the past, we can give no assurance that our results of operations will not be materially impacted in the future if we are unable to recover these types of pre-production costs related toin the event of an OE customer’s cancellation of awarded business.
Our level of debt makes us more sensitive to the effects of economic downturns; our level of debt and provisions in our debt agreements could limit our ability to react to changes in the economy or our industry.
Our level of debt makes us more vulnerable to changes in our results of operations because a substantialsignificant portion of our cash flow from operations is dedicated to servicing our debt and is not available for other purposes. Ourpurposes and our level of debt could have other negative consequencesimpair our ability to us, including the following:
23
raise additional capital if necessary.
Our ability to make payments on our indebtedness depends on our ability to generate cash in the future. If we do not generate sufficient cash flow to meet our debt service and working capital requirements, we may need to seek additional financing or sell assets. This may make it more difficult for us to obtain financing on terms that are acceptable to us, or at all. Without any such financing, we could be forced to sell assets to make up for any shortfall in our payment obligations under unfavorable circumstances. If necessary,circumstances and we may not be able to sell assets quickly enough or for sufficient amounts to enable us to meet our obligations.
In addition, our senior credit facility and our other debt agreements contain covenants that limit our flexibility in planning for or reacting to changes in our business and our industry, including limitations on incurring additional indebtedness, making investments, granting liens and merging or consolidating with other companies. Complying with these covenants may impair our ability to finance our future operations orand capital needs or to engage in other favorable business activities.
Our failure to comply with the covenants contained in our senior credit facility or the indentures for our other debt instruments, including as a result of events beyond our control, could result in an event of default, which could materially and adversely affect our operating results and our financial condition.
Our senior credit facility and receivables securitization program in the U.S. require us to maintain certain financial ratios. Our senior credit facility and our other debt instruments require us to comply with various operational and other covenants. If there were an event of default under any of our debt instruments that was not cured or waived, the holders of the defaulted debt could cause all amounts outstanding with respect to that debt to be due and payable immediately.immediately (which, in turn, could also result in an event of default under one or more of our other financing arrangements). If such event occurs, the lenders under our
25
senior credit facility could elect to terminate their commitments, cease making further loans and institute foreclosure proceedings against our assets and we could lose access to our securitization program. We cannot assure you that our assets or cash flow would be sufficient to fully repay borrowings under our outstanding debt instruments, either upon maturity or if accelerated, upon an event of default, or that we would be able to refinance or restructure the payments on those debt instruments.
Our working capital requirements may negatively affect our liquidity and capital resources.
Our working capital requirements can vary significantly, depending in part on the level, variability and timing of our customers’ worldwide vehicle production and the payment terms with our customers and suppliers. If our working capital needs exceed our cash flows from operations, we would look to our cash balances and availability for borrowings under our borrowing arrangements to satisfy those needs, as well as potential sources of additional capital, which may not be available on satisfactory terms and in adequate amounts, if at all.
We may be unable to realize our business strategy of improving operating performance and generating savings and improvements.
We regularly implement strategic and other initiatives designed to improve our operating performance. For example, in 2013 we announced a cost reduction initiative in Europe to significantly reduce our annual structural costs in the region. Our inability to implement these initiatives in accordance with our plans or our failure to achieve the goals of these initiatives could have a material adverse effect on our business, particularly since we rely on these initiatives to offset pricing pressures from our suppliers and our customers, as described above, as well as to manage the impacts of production cuts, such as the significant production decreases we experienced during 2008 and 2009 as a result of the global economic crisis, and the lingering effects this crisis had in Europe in particular, where light vehicle production declined in 2012 and remained at weak production levels in 2013. Our implementation of announced initiatives is from time to time subject to legal challenge in certain non-U.S. jurisdictions (where applicable employment laws differ from those in the United States). Furthermore, the terms of our senior credit facility and the indentures governing our notes may restrict the types of initiatives we undertake. In the past we have been successful in obtaining the consent of our senior lenders where appropriate in connection with our initiatives. We cannot assure you, however, that we will be able to pursue, successfully implement or realize the expected benefits of any initiative or that we will be able to sustain improvements made to date.
The hourly workforce in the automotive industryindustries in which we participate is highly unionized and our business could be adversely affected by labor disruptions.
A portion of our hourly workforce in North America and the majority of our hourly workforce in Europe isother regions are unionized. Although we consider our current relations with our employees to be satisfactory, if major work
24
disruptions were to occur, our business could be adversely affected by, for instance, a loss of revenues, increased costs or reduced profitability. We have not experienced a material labor disruption in our recent history, but there can be no assurance that we will not experience a material labor disruption at one of our facilities in the future in the course of renegotiation of our labor arrangements or otherwise.
In addition, substantially all of the hourly employees of General Motors, Ford and Chrysler in North America and many of their other suppliers are represented by the United Automobile, Aerospace and Agricultural Implement Workers of America under collective bargaining agreements. Vehicle manufacturers, and suchtheir suppliers and their respective employees in other countries are also subject to labor agreements. A work stoppage or strike at one of our production facilities, at those of a customer, or at or impacting a supplier of ours or any of our customers, such as the 2008 strike at American Axle which resulted in 30 GM facilities in North America being idled for several months, could have an adverse impact on us by disrupting demand for our productsand/or our ability to manufacture our products.
In the past, we have experienced significant increases and fluctuations in raw materials pricing; and future changes in the prices of raw materials or utilitiesutility services could have a material adverse impact on us.
us without proportionate recovery from our customers.
Significant increases in the cost of certain raw materials used in our products or the cost of utilitiesutility services required to produce our products, to the extent they are not timely reflected in the price we charge our customers or are otherwise mitigated, could materially and adversely impact our results. For example, fromIn general, commodity prices including steel, oil and rubber, have been increasing since 2004 throughwith the exception of a temporary but significant decline in prices as a result of the economic turmoil in 2008 we experienced significant increases in processed metal and steel prices.2009. Notwithstanding this temporary decline, the trend of increasing commodity prices has continued. We addressedmitigated these increaseschallenges by evaluating alternative materials and processes, reviewing material substitution opportunities, increasing component sourcing and parts assembly outsourcing to lowin best cost countries as well as strategically pursuing regional and global
26
purchasing strategies for specific commodities, and aggressively negotiating with our customers to allow us to recover these higher costs from them. In addition to these actions, weour customers. We also continue to pursue productivity initiatives and reviewother opportunities to reduce costs through restructuring activities. During periods of economic recovery, the cost of raw materials and utilitiesutility services generally rise. Accordingly, we cannot assure youensure that we will not face increased prices in the future or, if we do, whether these actions will be effective in containing margin pressures from any further raw material or utility price increases.them.
We may incur material costs related to product warranties, environmental and regulatory matters, legal proceedings and other claims, which could have a material adverse impact on our financial condition and results of operations.
From time to time, we receive product warranty claims from our customers, pursuant to which we may be required to bear costs of repair or replacement of certain of our products. Vehicle manufacturers are increasingly requiringrequire their outside suppliers to guarantee or warrant their products and to be responsible for
25
the operation of these component products in new vehicles sold to consumers. Warranty claims may range from individual customer claims to full recalls of all products in the field. We cannot assure you that costs associated with providing product warranties will not be material, or that those costs will not exceed any amounts reserved in our consolidated financial statements. For a description of our accounting policies regarding warranty reserves, see “Management’s Discussion and Analysis of Financial Condition and Results of Operations — Critical Accounting Policies” included in Item 7.
We are subject to extensive government regulations worldwide. Foreign, Federal,federal, state and local laws and regulations may change from time to time and our compliance with new or amended laws and regulations in the future may require a materialmaterially increase in our costs and could adversely affect our results of operations and competitive position. For example, we are subject to a variety of environmental and pollution control laws and regulations in all jurisdictions in which we operate. Soil and groundwater remediation activities are being conducted at certain of our current and former real properties. We record liabilities for these activities when environmental assessments indicate that the remedial efforts are probable and the costs can be reasonably estimated. On this basis, we have established reserves that we believe are adequate for the remediation activities at our current and former real properties for which we could be held responsible. Although we believe our estimates of remediation costs are reasonable and are based on the latest available information, the cleanup costs are estimates and are subject to revision as more information becomes available about the extent of remediation required. In future periods, we could be subject toincur cash costs or charges to earnings if we are required to undertake material additional remediation efforts based onas the resultsresult of our ongoing analysesanalysis of the environmental status of our properties,properties. In addition, violations of the laws and regulations we are subject to could result in civil and criminal fines, penalties and sanctions against us, our officers or our employees, as more information becomes available to us.
well as prohibitions on the conduct of our business, and could also materially affect our reputation, business and results of operations.
We also from time to time are involved in a variety of legal proceedings, claims or investigations thatinvestigations. These matters typically are incidental to the conduct of our business. Some of these proceedings allegematters involve allegations of damages against us relating to environmental liabilities, intellectual property matters, personal injury claims, taxes, employment matters or commercial or contractual disputes.disputes or allegations relating to legal compliance by us or our employees. For example, we are subject to a number of lawsuits initiated by a significant number of claimants alleging health problems as a result of exposure to asbestos. Many of these cases involve significant numbers of individual claimants. Many of these cases also involve numerous defendants, with the number of defendants in some cases exceeding 100 defendants from a variety of industries. As major asbestos manufacturers or other companies that used asbestos in their manufacturing processes continue to go out of business, we may experience an increased number of these claims.
We vigorously defend ourselves in connection with all of the matters described above. We cannot, however, assure you that the costs, charges and liabilities associated with these matters will not be material, or that those costs, charges and liabilities will not exceed any amounts reserved for them in our consolidated financial statements. In future periods, we could be subject to cash costs or charges to earnings if any of these matters are resolved unfavorably to us. See “Management’s Discussion and Analysis of Financial Condition and Results of Operations — Environmental and Other Matters”Legal Contingencies” included in Item 7.
Developments relating to our intellectual property could materially impact our business.
We and others in our industry hold a number of patents and other intellectual property rights, including licenses, that are critical to our respective businesses and competitive positions. Notwithstanding our intellectual property portfolio, our competitors may develop similar or superior proprietary technologies. Further, as we expand into regions where the protection of intellectual property rights is less robust, the risk of others replicating our proprietary technologies increases, which could result in a deterioration of our competitive position. On occasion, we may assert claims against third parties who are taking actions that we believe are infringing on our intellectual property rights. Similarly, third parties may assert claims against us and our customers and distributors alleging our products infringe upon third party intellectual property rights. These claims,
27
regardless of their merit or resolution, are frequently costly to prosecute, defend or settle and divert the efforts and attention of our management and employees. Claims of this sort also could harm our relationships with our customers and might deter future customers from doing business with us. If any such claim were to result in an adverse outcome, we could be required to take actions which may include: expending significant resources to develop or license non-infringing products; paying substantial damages to third parties, including to customers to compensate them for their discontinued use or replacing infringing technology with non-infringing technology; or cessation of the manufacture, use or sale of the infringing products. Any of the foregoing results could have a material adverse effect on our business, financial condition, results of operations or our competitive position.
We are increasingly dependent on information technology, and if we are unable to protect against service interruptions or security breaches, our business could be adversely affected.
Our operations rely on a number of information technologies to manage, store, and support business activities. We have put in place a number of systems, processes, and practices designed to protect against the failure of our systems, as well as the misappropriation, exposure or corruption of the information stored thereon. Unintentional service disruptions or intentional actions such as intellectual property theft, cyber-attacks, unauthorized access or malicious software, may lead to such misappropriation, exposure or corruption if our protective measures prove to be inadequate. Further, these events may cause operational impediments or otherwise adversely affect our product sales, financial condition and/or results of operations. We could also encounter violations of applicable law or reputational damage from the disclosure of confidential information belonging to us or our employees, customers or suppliers. In addition, the disclosure of non-public information could lead to the loss of our intellectual property and/or diminished competitive advantages. Should any of the foregoing events occur, we may be required to incur significant costs to protect against damage caused by these disruptions or security breaches in the future.
We may have difficulty competing favorably in the highly competitive automotive parts industry.
The automotive parts industry is highly competitive. Although the overall number of competitors has decreased due to ongoing industry consolidation, we face significant competition within each of our major product areas, including from new competitors entering the markets which we serve. The principal competitive factors include price, quality, service, product performance, design and engineering capabilities, new product innovation, global presence and timely delivery. As a result, many suppliers have established or are establishing themselves in emerging, low-cost markets to reduce their costs of production and be more conveniently located for customers. Although we are also pursuing a low-costbest-cost country production strategy and otherwise continue to seek process improvements to reduce costs, we cannot assure you that we will be able to continue to compete favorably in this competitive market or that increased competition will not have a material adverse effect on our business by reducing our ability to increase or maintain sales or profit margins.
26
The decreasing number of automotive parts customers and suppliers could make it more difficult for us to compete favorably.
We may not be able to successfully respond to the changing distribution channels for aftermarket products.
Major automotive aftermarket retailers, such as AutoZone and Advance Auto Parts, are attempting to increase their commercial sales by selling directly to automotive parts installers in addition to individual consumers. These installers have historically purchased from their local warehouse distributors and jobbers, who are our more traditional customers. We cannot assure you that we will be able to maintain or increase aftermarket sales through increasing our sales to retailers. Furthermore, because of the cost focus of major retailers, we have occasionally been requested to offer price concessions to them. Our failure to maintain or increase aftermarket sales, or to offset the impact of any reduced sales or pricing through cost improvements, could have an adverse impact on our business and operating results.
Longer product lives of automotive parts are adversely affecting aftermarket demand for some of our products.
28
The average useful life of automotive parts has steadily increased in recent years due to innovations in products and technologies. The longer product lives allow vehicle owners to replace parts of their vehicles less often. As a result, a portion of sales in the aftermarket has been displaced. This has adversely impacted, and could continue to adversely impact, our aftermarket sales. Also, any additional increases in the average useful lives of automotive parts would further adversely affect the demand for our aftermarket products. Aftermarket sales represented approximately 2016 percent and 2217 percent of our net sales in the fiscal years ended December 31, 20102013 and 2009,2012, respectively.
27
Any acquisitions we make could disrupt our business and seriously harm our financial condition.
We may, from time to time, consider acquisitions of complementary companies, products or technologies. Acquisitions involve numerous risks, including difficulties in the assimilation of the acquired businesses, the diversion of our management’s attention from other business concerns and potential adverse effects on existing business relationships with current customers and suppliers. In addition, any acquisitions could involve the incurrence of substantial additional indebtedness. We cannot assure you that we will be able to successfully integrate any acquisitions that we pursue or that such acquisitions will perform as planned or prove to be beneficial to our operations and cash flow. Any such failure could seriously harm our business, financial condition and results of operations.
We are subject to risks related to our international operations.
We have manufacturing and distribution facilities in many regions and countries, including Australia, Asia, North America, Europe, South Africa and South America, and sell our products worldwide. For the fiscal year ended December 31, 2010,2013, approximately 5251 percent of our net sales were derived from operations outside North America. International operations are subject to various risks which could have a material adverse effect on those operations or our business as a whole, including:
exposure to local economic conditions and labor issues;
exposure to local political conditions, including the risk of seizure of assets by a foreign government;
exposure to local social unrest, including any resultant acts of war, terrorism or similar events;
exposure to local public health issues and the resultant impact on economic and political conditions;
currency exchange rate fluctuations;
hyperinflation in certain foreign countries;
controls on the repatriation of cash, including imposition or increase of withholding and other taxes on remittances and other payments by foreign subsidiaries;
export and import restrictions; and
requirements for manufacturers to use locally produced goods.
New regulations related to conflict-free minerals may force us to incur additional expenses and otherwise adversely impact our business.
In August 2012, as mandated by the Dodd-Frank Wall Street Reform and Consumer Protection Act, the SEC adopted final rules regarding disclosure of the use of certain minerals, known as conflict minerals, originating from the Democratic Republic of Congo (DRC) or adjoining countries. These new requirements will require ongoing due diligence efforts, with initial disclosure requirements beginning in May 2014. Our supply chain is complex and we may incur significant costs to determine the source of any such minerals used in our products. We may also incur costs with respect to potential changes to products, processes or sources of supply as a consequence of our diligence activities. Further, the implementation of these rules and their effect on customer, supplier and/or consumer behavior could adversely affect the sourcing, supply and pricing of materials used in our products. As there may be only a limited number of suppliers offering conflict-free minerals, we cannot be sure that we will be able to obtain necessary minerals from such suppliers in sufficient quantities or at competitive prices. We may face reputational challenges if we determine that certain of our products contain minerals not determined to be conflict-free or if we are unable to sufficiently verify the origins for all conflict minerals used in our products through the procedures we implement. Accordingly, the implementation of these rules could have a material adverse effect on our business, results of operations and/or financial condition.
Exchange rate fluctuations could cause a decline in our financial condition and results of operations.
As a result of our international operations, we are subject to increased risk because we generate a significant portion of our net sales and incur a significant portion of our expenses in currencies other than the U.S. dollar. For example, where we have a greater portion of costs than revenues generated in a foreign currency, we are subject to risk if the foreign currency in which our costs are paid appreciates against the currency in which we generate revenue because the appreciation effectively increases our cost in that country.
29
The financial condition and results of operations of some of our operating entities are reported in foreign currencies and then translated into U.S. dollars at the applicable exchange rate for inclusion in our consolidated financial statements. As a result, appreciation of the U.S. dollar against these foreign currencies generally will have a negative impact on our reported revenues and operating profit while depreciation of the U.S. dollar against these foreign currencies will generally have a positive effect on reported revenues and operating profit. For example, our Europeanconsolidated results of operations were negatively impacted in 2013 primarily due to the weakening of the Canadian dollar, Argentine Peso and Indian Rupee against the U.S. dollar and in 2012 due to the weakening of the Euro against the U.S. dollar. Our consolidated results of operations were positively impacted in 20072011 due to the strengthening of the Euro against the U.S. dollar. However, in 2008 through 2010, the dollar strengthened against the Euro which had negative effects on our results of operations. Our South American operations were negatively impacted by the devaluation in 2000 of the Brazilian currency as well as by the devaluation of the Argentine currency in 2002. We do not generally seek to mitigate this translation effect through the use of derivative financial instruments. To the extent we are unable to match revenues received in foreign currencies with costs paid in the same currency, exchange rate fluctuations in that currency could have a material adverse effect on our business.
28
Entering new markets poses new competitive threats and commercial risks.
As we have expanded into markets beyond light vehicles, we expect to diversify our product sales by leveraging technologies being developed for the light vehicle segment. Such diversification requires investments and resources which may not be available as needed. We cannot guarantee that we will be successful in leveraging our capabilities into new markets and thus, in meeting the needs of these new customers and competing favorably in these new markets. Further, a significant portion of our growth potential is dependent on our ability to increase sales to commercial truck and off-highway vehicle customers. While we believe that we can achieve our growth targets with the production contracts that have been or will be awarded to us, our future prospects will be negatively affected if those customers underlying these contracts experience reduced demand for their productionproducts, or financial difficulties.
Impairment in the carrying value of long-lived assets and goodwill could negatively affect our operating results.
We have a significant amount of long-lived assets and goodwill on our consolidated balance sheet. Under generally accepted accounting principles, long-lived assets are required to be reviewed for impairment whenever adverse events or changes in circumstances indicate a possible impairment. If business conditions or other factors cause profitability and cash flows to decline, we may be required to record non-cash impairment charges. Goodwill must be evaluated for impairment annually or more frequently if events indicate it is warranted. If the carrying value of our reporting units exceeds their current fair value as determined based on the discounted future cash flows of the related business, the goodwill is considered impaired and is reduced to fair value by a non-cash charge to earnings. Events and conditions that could result in impairment in the value of our long-lived assets and goodwill include changes in the industries in which we operate, particularly the impact of a downturn in the global economy, as well as competition and advances in technology, adverse changes in the regulatory environment, or other factors leading to reduction in expected long-term sales or profitability. For example, during the fiscal year ended December 31, 2008,2011, we were requiredrecorded a $11 million goodwill impairment charge relating to recordour Australian reporting unit and during the fiscal year ended December 31, 2012, we recorded non-cash asset impairment charges of $4 million related to the announced closing of our aftermarket clean air plant in Vittaryd, Sweden, and a $114$7 million asset impairment charge to write-off the remaining goodwill related to certain assets of our 1996 acquisition of Clevite Industries.European ride performance business.
The value of our deferred tax assets could become impaired, which could materially and adversely affect our operating results.
As of December 31, 2010,2013, we had approximately $67$165 million in net deferred tax assets. These deferred tax assets include net operating loss carryovers and tax credits that can be used to offset taxable income in future periods and reduce income taxes payable in those future periods. Each quarter, we determine the probability of the realization of deferred tax assets, using significant judgments and estimates with respect to, among other things, historical operating results and expectations of future earnings and tax planning strategies. For example, we were required to record charges during the fiscal year ended December 31, 2008 for a valuation allowance against our U.S. deferred tax assets. These charges were attributable to the significant decline in production which resulted from the global economic crisis which began in 2008, and the accounting requirement to project that the negative operating environment will continue through the expiration of the net operating loss carry-forward periods. If we determine in the future that there is not sufficient positive evidence to support the valuation of these assets, due to the risk factors described herein or other factors, we may be required to further adjust the valuation allowance to reduce our deferred tax assets. Such a reduction could result in material non-cash expenses in the period in which the valuation allowance is adjusted and could have a material adverse effect on our results of operations.
Our expected annual effective tax rate could be volatile and materially change as a result of changes in mix of earnings and other factors.
Our overall effective tax rate is equal to our total tax expense as a percentage of our total profit or loss before tax. However, tax expenses and benefits are determined separately for each tax paying entity or group of entities that is consolidated for tax purposes in each jurisdiction. Losses in certain jurisdictions may provide no current financial statement tax benefit. As a result, changes in the mix of profits and losses between jurisdictions, among other factors, could have a significant impact on our overall effective tax rate.
29
30 ITEM 1B. | UNRESOLVED STAFF COMMENTS. |
None.
ITEM 2. | PROPERTIES. |
We lease our principal executive offices, which are located at 500 North Field Drive, Lake Forest, Illinois, 60045.
facility and is located in Europe.
The above-described manufacturing locations outside of the U.S. are located in Argentina, Austria, Australia, Belgium, Brazil, Canada, China, the Czech Republic, Denmark, France, Germany, Hungary, India, Italy, Japan, Korea, Mexico, New Zealand, Poland, Portugal, Russia, Spain, South Africa, Sweden, Thailand, the United Kingdom and the United Kingdom.States. We also have sales offices located in Japan, Singapore, Taiwan and Taiwan.
United Arab Emirates.
We own 5245 and lease 57 of the properties described above and lease 60.above. We hold 1613 of the above-described international manufacturing facilities through sevensix joint ventures in which we own a controlling interest. In addition, threetwo joint ventures in which we hold a noncontrolling interest operate a total of threetwo manufacturing facilities outside the U.S.in Europe. We also have distribution facilities at our manufacturing sites and at a few offsiteoff-site locations, substantially all of which we lease.
We believe that substantially all of our plants and equipment are, in general, well maintained and in good operating condition. They are considered adequate for present needs and, as supplemented by planned construction, are expected to remain adequate for the near future.
We also believe that we have generally satisfactory title to the properties owned and used in our respective businesses.
ITEM 3. | LEGAL PROCEEDINGS. |
We are involved in environmental remediation matters, legal proceedings, claims, investigations and warranty obligations. These matters are typically incidental to the conduct of our business and create the potential for contingent losses. We accrue for potential contingent losses when our review of available facts indicates that it is probable a loss has been incurred and the amount of the loss is reasonably estimable. Each quarter we assess our loss contingencies based upon currently available facts, existing technology, and presently enacted laws and regulations taking into consideration the likely effects of inflation and other societal and economic factors and record adjustments to these reserves as required. As an example, we consider all available evidence including prior experience in remediation of contaminated sites, other companies’ cleanup experiences and data released by the United States Environmental Protection Agency or other organizations when we evaluate our environmental remediation contingencies. Further, all of our loss contingency estimates are subject to revision in future periods based on actual costs or new information. With respect to our environmental liabilities, where future cash flows are fixed or reliably determinable, we have discounted those liabilities. All other environmental liabilities are recorded at their undiscounted amounts. We evaluate recoveries separately from the liability and, when they are assured, recoveries are recorded and reported separately from the associated liability in our consolidated financial statements.
We are subject to a variety of environmental and pollution control laws and regulations in all jurisdictions in which we operate. We expense or capitalize, as appropriate, expenditures for ongoing compliance with environmental regulations that relate to current operations. We expense costs related to an existing condition caused by past operations that do not contribute to current or future revenue generation. We record liabilities when environmental assessments indicate that required remedial efforts are probable and the costs can be reasonably estimated. Estimates of the liability are based upon currently available facts, existing technology, and presently enacted laws and regulations taking into consideration the likely effects of inflation and other societal and economic factors. We consider all available evidence including prior experience in remediation of contaminated sites, other companies’ cleanup experiences and data released by the United States Environmental Protection Agency or other organizations. These estimated liabilities are subject to revision in future periods based on actual costs or new information. Where future cash flows are fixed or reliably determinable, we have discounted the liabilities, as discussed in Footnote 12 — Commitments and Contingency — Litigation, of our notes to consolidated financial statements. All other environmental liabilities are recorded at their undiscounted amounts. We evaluate recoveries separately from the liability and, when they are assured, recoveries are recorded and reported separately from the associated liability in our consolidated financial statements.
30
As of December 31, 2010,2013, we have the obligation to remediate or contribute towards the remediation of certain sites, including two existingone Federal Superfund sites.site. At December 31, 2010,2013, our aggregated estimated share of environmental remediation costs for all these sites on a discounted basis was approximately $16$15 million, of which $5$3 million is recorded in other current liabilities and $11$12 million is recorded in deferred credits and other liabilities in our consolidated balance sheet. For those locations in whichwhere the liability was discounted, the weighted average discount rate used was 3.22.8 percent. The undiscounted value of the estimated remediation costs was $21$19 million. Our expected payments of environmental remediation costs are estimated to be approximately $5$3 million in 2011,2014, $1 million in each year beginning 20122015 through 20152018 and $12 million in aggregate thereafter. Based on information known to us, we have established reserves that we believe are adequate for these costs. Although we believe these estimates of remediation costs are reasonable and are based on the latest available information, the costs are estimates and are subject to revision as more information becomes available about the extent of remediation required. At some sites, we expect that other parties will contribute towards the remediation costs. In
31
addition, certain environmental statutes provide that our liability could be joint and several, meaning that we could be required to pay in excess of our share of remediation costs. Our understanding of the financial strength of other potentially responsible parties at these sites has been considered, where appropriate, in our determination of our estimated liability.
We do not believe that any potential costs associated with our current status as a potentially responsible party in the Federal Superfund sites,site, or as a liable party at the other locations referenced herein, will be material to our consolidated results of operations, financial position or cash flows.
We also from time to time are involved in legal proceedings, claims or investigations that are incidental to the conduct of our business.investigations. Some of these proceedings allegematters involve allegations of damages against us relating to environmental liabilities (including, toxic tort, property damage and remediation), intellectual property matters (including patent, trademark and copyright infringement, and licensing disputes), personal injury claims (including injuries due to product failure, design or warning issues, and other product liability related matters), taxes, employment matters, and commercial or contractual disputes, sometimes related to acquisitions or divestitures. Some of these matters involve allegations relating to legal compliance. For example, one of our Argentine subsidiaries is currently defending against a criminal complaint alleging the failure to comply with laws requiring the proceeds of export transactions to be collected, reportedand/or converted to local currency within specified time periods. As another example, in the U.S. we are subject to an audit in 11 states of our practices with respect to the payment of unclaimed property to those states. We are in the early stages of this audit, which could coverstates, spanning a period as far back as over 30 years. We now have practices in place whichWhile we believe ensure that we pay unclaimed property as required. We vigorously defend ourselves against all of these claims. Inclaims in future periods we could be subject to cash costs or charges to earnings if any of these matters are resolved on unfavorable terms. However, althoughAlthough the ultimate outcome of any legal matter cannot be predicted with certainty, based on current information, including our assessment of the merits of the particular claim, we do not expect that thesethe legal proceedings or claims currently pending against us will have any material adverse impact on our future consolidated financial position, results of operations or cash flows.
In addition, we are subject to a number of lawsuits initiated by a significant number of claimants alleging health problems as a result of exposure to asbestos. In the early 2000’s we were named in nearly 20,000 complaints, most of which were filed in Mississippi state court and the vast majority of which made no allegations of exposure to asbestos from our product categories. Most of these claims have been dismissed and our current docket of active and inactive cases is less than 500 cases nationwide. A small number of claims have been asserted by railroad workers alleging exposure to asbestos products in railroad cars manufactured by
31
The Pullman Company, one of our subsidiaries. The balancesubstantial majority of the remaining claims isare related to alleged exposure to asbestos in our automotive emission control products. Only a small percentage of the claimants allege that they were automobile mechanics and a significant number appear to involve workers in other industries or otherwise do not include sufficient information to determine whether there is any basis for a claim against us. We believe, based on scientific and other evidence, it is unlikely that mechanics were exposed to asbestos by our former muffler products and that, in any event, they would not be at increased risk of asbestos-related disease based on their work with these products. Further, many of these cases involve numerous defendants, with the number of each in some cases exceeding 100 defendants from a variety of industries. Additionally, the plaintiffs either do not specify any, or specify the jurisdictional minimum, dollar amount for damages. As major asbestos manufacturers and/or users continue to go out of business or file for bankruptcy, we may experience an increased number of these claims. We vigorously defend ourselves against these claims as part of our ordinary course of business. In future periods, we could be subject to cash costs or charges to earnings if any of these matters are resolved unfavorably to us. To date, with respect to claims that have proceeded sufficiently through the judicial process, we have regularly achieved favorable resolutions. Accordingly, we presently believe that these asbestos-related claims will not have a material adverse impact on our future consolidated financial condition, results of operations or cash flows.
ITEM 4.MINE SAFETY DISCLOSURES. Not applicable. 32 ITEM 4.1. |
| EXECUTIVE OFFICERS OF THE REGISTRANT. |
The following provides information concerning the persons who serve as our executive officers as of February 25, 2011.28, 2014.
| Name and Age | Offices Held | |||
| Gregg M. Sherrill | Chairman and Chief Executive Officer | |||
| Hari N. Nair | Chief Operating Officer | |||
| Josep Fornos (61) | Executive Vice President, Ride Performance Division | |||
| Timothy E. Jackson (57) | Executive Vice President Technology, Strategy and Business Development | |||
| Kenneth R. Trammell | Executive Vice President and Chief Financial Officer | |||
| Neal A. Yanos | Executive Vice President, | |||
| Brent J. Bauer | Senior Vice President and General Manager — North | |||
| Senior Vice President, Global | ||||
| Michael J. Charlton (55) | Senior Vice President, Global Manufacturing Development and European Cost Reduction Initiatives | |||
| James D. Harrington | Senior Vice President, General Counsel and Corporate Secretary | |||
| Paul D. Novas | Vice President and Controller | |||
Gregg M. Sherrill — Mr. Sherrill was named the Chairman and Chief Executive Officer of Tenneco in January 2007. Mr. Sherrill joined us from Johnson Controls Inc., where he served since 1998, most recently as President, Power Solutions. From 2002 to 2003, Mr. Sherrill served as the Vice President and Managing Director of Europe, South Africa and South America for Johnson Controls’ Automotive Systems Group. Prior to joining Johnson Controls, Mr. Sherrill held various engineering and manufacturing assignments over a22-year span at Ford Motor Company, including Plant Manager of Ford’s Dearborn, Michigan engine plant, Chief Engineer, Steering Systems and Director of Supplier Technical Assistance. Mr. Sherrill became a director of our company in January 2007.
Hari N. Nair — Mr. Nair was named Chief Operating Officer in July 2010. Prior to that, he served as our Executive Vice President and President — International since March 2007. Previously, Mr. Nair served as Executive Vice President and Managing Director of our business in Europe, South America and India. Before that, he was Senior Vice President and Managing Director — International. Prior to December 2000, Mr. Nair was the Vice President and Managing Director — Emerging Markets. Previously, Mr. Nair was the Managing Director for Tenneco Automotive Asia, based in Singapore and responsible for all operations and development
32
projects in Asia. He began his career with the former Tenneco Inc. in 1987, holding various positions in strategic planning, marketing, business development, quality systems and finance. Prior to joining Tenneco, Mr. Nair was a senior financial analyst at General Motors Corporation focusing on European operations. Mr. Nair became a director of our company in March 2009.
33
Kenneth R. Trammell — Mr. Trammell has served as our Executive Vice President and Chief Financial Officer since January 2006. Mr. Trammell was named our Senior Vice President and Chief Financial Officer in September 2003, having served as our Vice President and Controller since September 1999. From April 1997 to November 1999, he served as Corporate Controller of Tenneco Inc. He joined Tenneco Inc. in May 1996 as Assistant Controller. Before joining Tenneco Inc., Mr. Trammell spent 12 years with the international public accounting firm of Arthur Andersen LLP, last serving as a senior manager.
Neal A. Yanos — Mr. Yanos was named Executive Vice President, Clean Air Division in February 2013. He served as Executive Vice President, North America from July 2008 to February 2013. Prior to that, he served as our Senior Vice President and General Manager — North American Original Equipment Ride Control and North American Aftermarket since May 2003. He joined our Monroe® ride control division as a process engineer in 1988 and since that time has served in a broad range of assignments including product engineering, strategic planning, business development, finance, program management and marketing, including Director of our North American Original Equipment GM/VW business unit and most recently as our Vice President and General Manager — North American Original Equipment Ride Control from December 2000. Before joining our company, Mr. Yanos was employed in various engineering positions by Sheller Globe Inc. from 1985 to 1988.
Brent J. Bauer — Mr. Bauer has served as our Senior Vice President and General Manager — North American Original Equipment Clean Air (f/k/a Emission ControlControl) since May 2002. Prior to this appointment, Mr. Bauer was named Vice President and General Manager — European and North American Original Equipment Emission Control in July 2001. Mr. Bauer joined Tenneco Automotive in August 1996 as a Plant Manager and was named Vice President and General Manager — European Original Equipment Emission Control in September 1999. Prior to joining Tenneco, he was employed at AeroquipVickers Corporation for 20 years in positions of increasing responsibility serving most recently as Director of Operations.
Gregg Bolt — Mr. Bolt was named our Senior Vice President, Global Human Resources and Administration in February 2013. Prior to joining Tenneco, Mr. Bolt worked for Quad/Graphics, Inc. as Executive Vice President, Human Resources and Administration from March 2009 to January 2013. Previously, he was with Johnson Controls Inc. for more than 10 years, serving most recently as Vice President, Human Resources for JCI’s Building Efficiency division.
Michael J. Charlton — Mr. Charlton haswas named Senior Vice President, Global Manufacturing Development and European Cost Reduction Initiatives in February 2013. He served as our Senior Vice President, Global Supply Chain Management and Manufacturing sincefrom January 2010.2010 to February 2013. Mr. Charlton served as our Vice President, Global Supply Chain Management and Manufacturing from November 2008 through December 2009. Mr. Charlton served as Tenneco’s Managing Director for India from January 2008 until November 2008. Prior to that, he served as the operations director for the Company’s emission control business in Europe since 2005. Prior to joining Tenneco in 2005, Mr. Charlton held a variety of positions of increasing responsibility at TRW Automotive, the most recent being Lead Director, European Purchasing and Operations for the United Kingdom.
James D. Harrington — Mr. Harrington has served as our Senior Vice President, General Counsel and Corporate Secretary since June 2009 and is responsible for managing our worldwide legal affairs including corporate governance and compliance. Mr. Harrington joined us in January 2005 as Corporate Counsel and was named Vice President — Law in July 2007. Prior to joining Tenneco, he worked at Mayer Brown LLP in the firm’s corporate and securities practice.
33
Paul D. Novas — Mr. Novas was namedhas served as our Vice President and Controller insince July 2006. Mr. Novas served as Vice President, Finance and Administration for Tenneco Europe from January 2004 until July 2006 and as Vice President and Treasurer of Tenneco from November 1999 until January 2004. Mr. Novas joined Tenneco in 1996 as assistant treasurer responsible for corporate finance and North American treasury operations. Prior to joining Tenneco, Mr. Novas worked in the treasurer’s office of General Motors Corporation for ten years.
PART II
| ITEM 5. | MARKET FOR REGISTRANT’S COMMON EQUITY, RELATED STOCKHOLDER MATTERS, AND ISSUER PURCHASES OF EQUITY SECURITIES. |
Our outstanding shares of common stock, par value $.01 per share, are listed on the New York and Chicago Stock Exchanges. The following table sets forth, for the periods indicated, the high and low sales prices of our common stock on the New York Stock Exchange Composite Transactions Tape.
34
| Sales Prices | ||||||||
Quarter | High | Low | ||||||
| 2010 | ||||||||
| 1st | $ | 25.00 | $ | 17.17 | ||||
| 2nd | 27.50 | 19.06 | ||||||
| 3rd | 31.46 | 19.29 | ||||||
| 4th | 43.71 | 28.47 | ||||||
| 2009 | ||||||||
| 1st | $ | 4.14 | $ | 0.67 | ||||
| 2nd | 11.19 | 1.56 | ||||||
| 3rd | 18.11 | 8.14 | ||||||
| 4th | 19.78 | 11.35 | ||||||
| Sales Prices | |||||||
| Quarter | High | Low | |||||
| 2013 | |||||||
| 1st | $ | 39.50 | $ | 34.55 | |||
| 2nd | 47.83 | 34.26 | |||||
| 3rd | 52.01 | 45.30 | |||||
| 4th | 57.85 | 48.60 | |||||
| 2012 | |||||||
| 1st | $ | 40.69 | $ | 29.45 | |||
| 2nd | 39.28 | 24.35 | |||||
| 3rd | 32.81 | 24.43 | |||||
| 4th | 35.25 | 26.72 | |||||
As of February 21, 2011,2014, there were approximately 19,69117,016 holders of record of our common stock, including brokers and other nominees.
The declaration of dividends on our common stock is at the discretion of our Board of Directors. The Board has not adopted a dividend policy as such; subject to legal and contractual restrictions, its decisions regarding dividends are based on all considerations that in its business judgment are relevant at the time. These considerations may include past and projected earnings, cash flows, economic, business and securities market conditions and anticipated developments concerning our business and operations.
We are highly leveraged and restricted with respect to the payment of dividends under the terms of our financing arrangements. On January 10, 2001, we announced that our Board of Directors eliminated the regular quarterly dividend on the Company’s common stock. The Board took this action in response to then-
34
then current industry conditions, primarily greater than anticipated production volume reductions by OEMs in North America and continued softness in the global aftermarket. We have not paid dividends on our common stock since the fourth quarter of 2000. There are no current plans to reinstate a dividend on our common stock, as the Board of Directors intends to retain any earnings for use in our business for the foreseeable future.stock. For additional information concerning our payment of dividends, see “Management’s Discussion and Analysis of Financial Condition and Results of Operations” included in Item 7.
See “Security Ownership of Certain Beneficial Owners and Management and Related Stockholder Matters” included in Item 12 for information regarding securities authorized for issuance under our equity compensation plans.
Purchase of equity securities by the issuer and affiliated purchasers
The following table provides information relating to our purchase of shares of our common stock in the fourth quarter of 2010. All these2013. These purchases reflectinclude shares withheld upon vesting of restricted stock for minimum tax withholding obligations.
| Total Number of | Average Price | |||||||
Period | Shares Purchased | Paid | ||||||
| October 2010 | — | $ | — | |||||
| November 2010 | 8,067 | 36.34 | ||||||
| December 2010 | 3,279 | 21.68 | ||||||
| Total | 11,346 | $ | 32.10 | |||||
We presently have no publicly announced repurchase plan or program, but intend to continue to allow participants to satisfy statutory minimum tax withholding obligations in connection with the vesting of outstanding restricted stock through the withholding of shares.
| Period | Total Number of Shares Purchased | Average Price Paid | Total Number of Shares Purchased as Part of Publicly Announced Plans or Programs | Maximum Number of Shares That May Yet be Purchased Under These Plans or Programs | ||||||||
| October 2013 | 116,732 | $ | 52.02 | 114,646 | 15,454 | |||||||
| November 2013 | 15,463 | $ | 53.68 | 15,454 | — | |||||||
| December 2013 | — | $ | — | — | — | |||||||
| Total | 132,195 | $ | 52.21 | 130,100 | — | |||||||
In January 2014, our Board of Directors approved a share repurchase program, authorizing our company to repurchase up to 400,000 shares of the Company’s outstanding common stock over a 12 month period. This share repurchase program is intended to offset dilution from shares of restricted stock and stock options issued in 2014 to employees.
Recent Sales of Unregistered Securities
None.
Share Performance
35
The following graph shows a five year comparison of the cumulative total stockholder return on Tenneco’s common stock as compared to the cumulative total return of two other indexes: a custom composite index (“Peer Group”) and the Standard & Poor’s 500 Composite Stock Price Index. The companies included in the Peer Group are: ArvinMeritorMeritor, Inc., American Axle & Manufacturing Co., Borg Warner Inc., Cummins Inc., Johnson Controls Inc., Lear Corp., Magna International Inc. and TRW Automotive Holdings Corp. These comparisons assume an initial investment of $100 and the reinvestment of dividends.
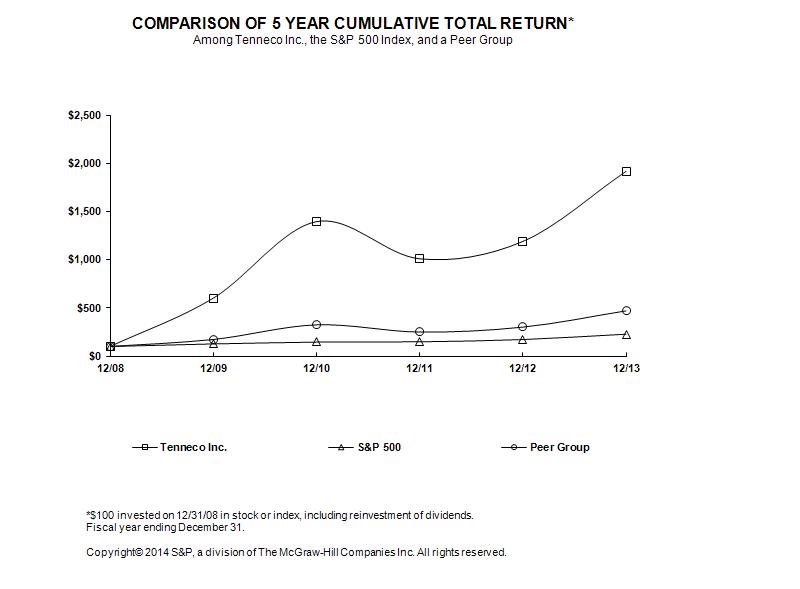

| 12/31/05 | 12/31/06 | 12/31/07 | 12/31/08 | 12/31/09 | 12/31/10 | |||||||||||||||||||||||||
| Tenneco Inc. | 100.00 | 126.06 | 132.94 | 15.04 | 90.41 | 209.89 | ||||||||||||||||||||||||
| S&P 500 | 100.00 | 115.80 | 122.16 | 76.96 | 97.33 | 111.99 | ||||||||||||||||||||||||
| Peer Group | 100.00 | 116.24 | 154.85 | 67.91 | 117.41 | 220.13 | ||||||||||||||||||||||||
| 12/31/2008 | 12/31/2009 | 12/31/2010 | 12/31/2011 | 12/31/2012 | 12/31/2013 | |||||||
| Tenneco Inc. | 100.00 | 601.02 | 1,395.25 | 1,009.49 | 1,190.17 | 1,917.63 | ||||||
| S&P 500 | 100.00 | 126.46 | 145.51 | 148.59 | 172.37 | 228.19 | ||||||
| Peer Group | 100.00 | 172.90 | 324.17 | 249.91 | 300.97 | 469.40 | ||||||
The graph and other information furnished in the section titled “Share Performance” under this Part II, Item 5 of thisForm 10-K shall not be deemed to be “soliciting” material or to be “filed” with the Securities and Exchange Commission or subject to Regulation 14A or 14C, or to the liabilities of Section 18 of the Securities Exchange Act of 1934, as amended.
36
ITEM 6. | SELECTED FINANCIAL DATA. |
The following data should be read in conjunction with Item 7 — “Management’s Discussion and Analysis of Financial Condition and Operations” and our consolidated financial statements in Item 8 — “Financial Statements and Supplementary Data.” These items include discussions of factors affecting comparability of the information shown below.
In connection with the organizational changes announced on February 14, 2013 that aligned our businesses along product lines, effective with 2013, our three prior geographic reportable segments have each been split into two product segments. Beginning with 2013, we are managed and organized along our two major product lines (clean air and ride performance) and three geographic areas (North America; Europe, South America and India; and Asia Pacific), resulting in six operating segments (North America Clean Air, North America Ride Performance, Europe, South America and India Clean Air, Europe, South America and India Ride Performance, Asia Pacific Clean Air and Asia Pacific Ride Performance). Within each geographical area, each operating segment manufactures and distributes either clean air or ride performance products primarily for the original equipment and aftermarket industries. Each of the six operating segments constitutes a reportable segment. Costs related to other business activities, primarily corporate headquarter functions, are disclosed separately from the six operating segments as "Other." Prior period segment information has been revised to reflect our new reporting segments.
37
TENNECO INC. AND CONSOLIDATED SUBSIDIARIES
SELECTED CONSOLIDATED FINANCIAL DATA
| Year Ended December 31, | ||||||||||||||||||||
| 2010 | 2009(a) | 2008(b) | 2007 | 2006 | ||||||||||||||||
| (Millions Except Share and Per Share Amounts) | ||||||||||||||||||||
Statements of Income (Loss) Data: | ||||||||||||||||||||
| Net sales and operating revenues — | ||||||||||||||||||||
| North America | $ | 2,832 | $ | 2,099 | $ | 2,641 | $ | 2,910 | $ | 1,963 | ||||||||||
| Europe, South America and India | 2,594 | 2,209 | 2,983 | 3,135 | 2,387 | |||||||||||||||
| Asia Pacific | 698 | 525 | 543 | 560 | 436 | |||||||||||||||
| Intergroup sales | (187 | ) | (184 | ) | (251 | ) | (421 | ) | (104 | ) | ||||||||||
| $ | 5,937 | $ | 4,649 | $ | 5,916 | $ | 6,184 | $ | 4,682 | |||||||||||
| Earnings (loss) before interest expense, income taxes, and noncontrolling interests | ||||||||||||||||||||
| North America | $ | 155 | $ | 42 | $ | (107 | ) | $ | 120 | $ | 103 | |||||||||
| Europe, South America and India | 76 | 20 | 85 | 99 | 81 | |||||||||||||||
| Asia Pacific | 50 | 30 | 19 | 33 | 12 | |||||||||||||||
| Total | 281 | 92 | (3 | ) | 252 | 196 | ||||||||||||||
| Interest expense (net of interest capitalized) | 149 | 133 | 113 | 164 | 136 | |||||||||||||||
| Income tax expense | 69 | 13 | 289 | 83 | 5 | |||||||||||||||
| Net income (loss) | 63 | (54 | ) | (405 | ) | 5 | 55 | |||||||||||||
| Less: Net income attributable to noncontrolling interests | 24 | 19 | 10 | 10 | 6 | |||||||||||||||
| Net income (loss) attributable to Tenneco Inc. | $ | 39 | $ | (73 | ) | $ | (415 | ) | $ | (5 | ) | $ | 49 | |||||||
| Weighted average shares of common stock outstanding — | ||||||||||||||||||||
| Basic | 59,208,103 | 48,572,463 | 46,406,095 | 45,809,730 | 44,625,220 | |||||||||||||||
| Diluted | 60,998,694 | 48,572,463 | 46,406,095 | 45,809,730 | 46,755,573 | |||||||||||||||
| Basic earnings (loss) per share of common stock | $ | 0.65 | $ | (1.50 | ) | $ | (8.95 | ) | $ | (0.11 | ) | $ | 1.11 | |||||||
| Diluted earnings (loss) per share of common stock | $ | 0.63 | $ | (1.50 | ) | $ | (8.95 | ) | $ | (0.11 | ) | $ | 1.05 | |||||||
37
| Years Ended December 31, | ||||||||||||||||||||
| 2010 | 2009 | 2008 | 2007 | 2006 | ||||||||||||||||
| (Millions Except Ratio and Percent Amounts) | ||||||||||||||||||||
Balance Sheet Data (at year end): | ||||||||||||||||||||
| Total assets | $ | 3,167 | $ | 2,841 | $ | 2,828 | $ | 3,590 | $ | 3,274 | ||||||||||
| Short-term debt | 63 | 75 | 49 | 46 | 28 | |||||||||||||||
| Long-term debt | 1,160 | 1,145 | 1,402 | 1,328 | 1,357 | |||||||||||||||
| Redeemable noncontrolling interests | 12 | 7 | 7 | 6 | 4 | |||||||||||||||
| Total Tenneco Inc. shareholders’ equity | (4 | ) | (21 | ) | (251 | ) | 400 | 226 | ||||||||||||
| Noncontrolling interests | 39 | 32 | 24 | 25 | 24 | |||||||||||||||
| Total equity | 35 | 11 | (227 | ) | 425 | 250 | ||||||||||||||
Statement of Cash Flows Data: | ||||||||||||||||||||
| Net cash provided by operating activities | $ | 244 | $ | 241 | $ | 160 | $ | 158 | $ | 203 | ||||||||||
| Net cash used by investing activities | (157 | ) | (119 | ) | (261 | ) | (202 | ) | (172 | ) | ||||||||||
| Net cash provided (used) by financing activities | (30 | ) | 87 | 58 | (10 | ) | 12 | |||||||||||||
| Cash payments for plant, property and equipment | (151 | ) | (120 | ) | (233 | ) | (177 | ) | (177 | ) | ||||||||||
Other Data: | ||||||||||||||||||||
| EBITDA including noncontrolling interests(c) | $ | 497 | $ | 313 | $ | 219 | $ | 457 | $ | 380 | ||||||||||
| Ratio of EBITDA including noncontrolling interests to interest expense | 3.34 | 2.35 | 1.94 | 2.79 | 2.79 | |||||||||||||||
| Ratio of net debt (total debt less cash and cash equivalents) to EBITDA including noncontrolling interests(d) | 1.99 | 3.36 | 6.05 | 2.60 | 3.11 | |||||||||||||||
| Ratio of earnings to fixed charges(e) | 1.79 | — | — | 1.46 | 1.35 | |||||||||||||||
| Year Ended December 31, | |||||||||||||||||||
| 2013(a) | 2012(b) | 2011(c) | 2010 | 2009(d) | |||||||||||||||
| (Millions Except Share and Per Share Amounts) | |||||||||||||||||||
| Statements of Income (Loss) Data: | |||||||||||||||||||
| Net sales and operating revenues — | |||||||||||||||||||
| Clean Air Division | |||||||||||||||||||
| North America | $ | 2,666 | $ | 2,512 | $ | 2,291 | $ | 1,813 | $ | 1,305 | |||||||||
| Europe, South America & India | 2,045 | 1,827 | 1,952 | $ | 1,562 | $ | 1,330 | ||||||||||||
| Asia Pacific | 853 | 695 | 625 | $ | 543 | $ | 405 | ||||||||||||
| Intergroup sales | (120 | ) | (108 | ) | (107 | ) | $ | (93 | ) | $ | (121 | ) | |||||||
| Total Clean Air Division | 5,444 | 4,926 | 4,761 | $ | 3,825 | $ | 2,919 | ||||||||||||
| Ride Performance Division | |||||||||||||||||||
| North America | 1,265 | 1,223 | 1,135 | $ | 1,019 | $ | 799 | ||||||||||||
| Europe, South America & India | 1,087 | 1,094 | 1,217 | $ | 1,032 | $ | 880 | ||||||||||||
| Asia Pacific | 251 | 213 | 179 | $ | 155 | $ | 121 | ||||||||||||
| Intergroup sales | (83 | ) | (93 | ) | (87 | ) | $ | (94 | ) | $ | (70 | ) | |||||||
| Total Ride Performance Division | 2,520 | 2,437 | 2,444 | $ | 2,112 | $ | 1,730 | ||||||||||||
| Total Tenneco Inc. | $ | 7,964 | $ | 7,363 | $ | 7,205 | $ | 5,937 | $ | 4,649 | |||||||||
| Earnings (loss) before interest expense, income taxes, and noncontrolling interests — | |||||||||||||||||||
| Clean Air Division | |||||||||||||||||||
| North America | $ | 229 | $ | 202 | $ | 172 | $ | 114 | $ | 52 | |||||||||
| Europe, South America & India | 57 | 54 | 79 | $ | 50 | $ | 7 | ||||||||||||
| Asia Pacific | 84 | 71 | 47 | $ | 53 | $ | 25 | ||||||||||||
| Total Clean Air Division | 370 | 327 | 298 | $ | 217 | $ | 84 | ||||||||||||
| Ride Performance Division | |||||||||||||||||||
| North America | 124 | 122 | 76 | $ | 87 | $ | 26 | ||||||||||||
| Europe, South America & India | (7 | ) | 41 | 69 | $ | 55 | $ | 27 | |||||||||||
| Asia Pacific | 22 | 5 | (6 | ) | $ | 3 | $ | 4 | |||||||||||
| Total Ride Performance Division | 139 | 168 | 139 | $ | 145 | $ | 57 | ||||||||||||
| Other | (85 | ) | (67 | ) | (58 | ) | (81 | ) | (49 | ) | |||||||||
| Total Tenneco Inc. | $ | 424 | $ | 428 | $ | 379 | 281 | 92 | |||||||||||
| Interest expense (net of interest capitalized) | 80 | 105 | 108 | 149 | 133 | ||||||||||||||
| Income tax expense | 122 | 19 | 88 | 69 | 13 | ||||||||||||||
| Net income (loss) | 222 | 304 | 183 | 63 | (54 | ) | |||||||||||||
| Less: Net income attributable to noncontrolling interests | 39 | 29 | 26 | 24 | 19 | ||||||||||||||
| Net income (loss) attributable to Tenneco Inc. | $ | 183 | $ | 275 | $ | 157 | $ | 39 | $ | (73 | ) | ||||||||
| Weighted average shares of common stock outstanding — | |||||||||||||||||||
| Basic | 60,474,492 | 59,985,677 | 59,884,139 | 59,208,103 | 48,572,463 | ||||||||||||||
| Diluted | 61,594,062 | 61,083,510 | 61,520,160 | 60,998,694 | 48,572,463 | ||||||||||||||
| Basic earnings (loss) per share of common stock | $ | 3.03 | $ | 4.58 | $ | 2.62 | $ | 0.65 | $ | (1.50 | ) | ||||||||
| Diluted earnings (loss) per share of common stock | $ | 2.97 | $ | 4.50 | $ | 2.55 | $ | 0.63 | $ | (1.50 | ) | ||||||||
38
| Years Ended December 31, | |||||||||||||||||||
| 2013 | 2012 | 2011 | 2010 | 2009 | |||||||||||||||
| (Millions Except Ratio and Percent Amounts) | |||||||||||||||||||
| Balance Sheet Data (at year end): | |||||||||||||||||||
| Total assets | $ | 3,830 | $ | 3,608 | $ | 3,337 | $ | 3,167 | $ | 2,841 | |||||||||
| Short-term debt | 83 | 113 | 66 | 63 | 75 | ||||||||||||||
| Long-term debt | 1,019 | 1,067 | 1,158 | 1,160 | 1,145 | ||||||||||||||
| Redeemable noncontrolling interests | 20 | 15 | 12 | 12 | 7 | ||||||||||||||
| Total Tenneco Inc. shareholders’ equity | 433 | 246 | — | (4 | ) | (21 | ) | ||||||||||||
| Noncontrolling interests | 39 | 45 | 43 | 39 | 32 | ||||||||||||||
| Total equity | 472 | 291 | 43 | 35 | 11 | ||||||||||||||
| Statement of Cash Flows Data: | |||||||||||||||||||
| Net cash provided by operating activities | $ | 503 | $ | 365 | $ | 245 | $ | 244 | $ | 241 | |||||||||
| Net cash used by investing activities | (266 | ) | (273 | ) | (224 | ) | (157 | ) | (119 | ) | |||||||||
| Net cash used by financing activities | (175 | ) | (89 | ) | (26 | ) | (30 | ) | (87 | ) | |||||||||
| Cash payments for plant, property and equipment | (244 | ) | (256 | ) | (213 | ) | (151 | ) | (120 | ) | |||||||||
| Other Data: | |||||||||||||||||||
| EBITDA including noncontrolling interests(e) | $ | 629 | $ | 633 | $ | 586 | $ | 497 | $ | 313 | |||||||||
| Ratio of EBITDA including noncontrolling interests to interest expense | 7.86 | 6.03 | 5.43 | 3.34 | 2.35 | ||||||||||||||
| Ratio of net debt (total debt less cash and cash equivalents) to EBITDA including noncontrolling interests(f) | 1.31 | 1.51 | 1.72 | 1.99 | 3.36 | ||||||||||||||
| Ratio of earnings to fixed charges(g) | 4.34 | 3.55 | 3.10 | 1.79 | — | ||||||||||||||
NOTE: Our consolidated financial statements for the three years ended December 31, 2010,2013, which are discussed in the following notes, are included in thisForm 10-K under Item 8.
| (a) | 2013 includes $78 million of restructuring and related costs primarily related to European cost reduction efforts including the closing of the ride performance plant in Gijon, Spain and intended reductions to the workforce at our ride performance plant in Sint-Truiden, our exit from the distribution of aftermarket exhaust products and ending production of leaf springs in Australia, headcount reductions in various regions, and the net impact of freezing our defined benefit plans in the United Kingdom. Of the total $78 million we incurred in restructuring and related costs, $3 million was related to non-cash asset write downs. |
| (b) | 2012 includes a $7 million asset impairment charge related to certain assets of our European Ride Performance business and a benefit of $5 million from property recoveries related to transactions originated by The Pullman Company before being acquired by Tenneco in 1996. |
| (c) | During the third quarter of 2011, we recorded a goodwill impairment charge of $11 million related to our Australian reporting unit within the Asia Pacific segment. |
| (d) | We incurred no direct economic loss from the bankruptcy filing of Chrysler and General Motors plants in North America during the second and third quarters of 2009. In this regard, we collected substantially all of our pre-petition receivables from Chrysler Group LLC and Chrysler Group LLC has assumed substantially all of the contracts which we had with Chrysler LLC. We collected substantially all of our pre-petition receivables from General Motors Company and General Motors Company has assumed substantially all of the contracts which we had with General Motors Corporation. However, the vehicle production shutdowns at Chrysler and significant reductions in vehicle production volumes at General Motors plants in North America during the second quarter of 2009 that coincided with their bankruptcies did cause Tenneco’s revenue from those two customers in North America to decline to $123 million in the second quarter of 2009, down from $242 million in the second quarter of 2008. We believe that General Motors and Chrysler were able to meet any unmet demand for their vehicles resulting from their production volume reductions in the second quarter of 2009 during the second half of 2009 after they exited their respective bankruptcy proceedings. Accordingly, for the entire 2009 calendar year, we consider the vehicle production volume reductions at Chrysler and General Motors to have been primarily driven by the same severe deterioration in overall economic |
39
conditions that caused substantially all of our original equipment customers in North America to significantly reduce production volumes in response to lower purchases of new vehicles.
| (e) | EBITDA including noncontrolling interests is a non-GAAP measure defined as net income before extraordinary items, cumulative effect of changes in accounting principle, interest expense, income taxes, depreciation and amortization and noncontrolling interests. We use EBITDA including noncontrolling interests, together with GAAP measures, to evaluate and compare our operating performance on a consistent basis between time periods and with other companies that compete in our markets but which may have different capital structures and tax positions, which can have an impact on the comparability of interest expense, noncontrolling interests and tax expense. We also believe that using this measure allows us to understand and compare operating performance both with and without depreciation expense, which can vary based on several factors. We believe EBITDA including noncontrolling interests is useful to our investors and other parties for these same reasons. |
38
EBITDA including noncontrolling interests should not be used as a substitute for net income or for net cash provided by operating activities prepared in accordance with GAAP. It should also be noted that EBITDA including noncontrolling interests may not be comparable to similarly titled measures used by other companies and, furthermore, that it excludes expenditures for debt financing, taxes and future capital requirements that are essential to our ongoing business operations. For these reasons, EBITDA including noncontrolling interests is of value to management and investors only as a supplement to, and not in lieu of, GAAP results. EBITDA including noncontrolling interests are derived from the statements of income (loss) as follows:
| Year Ended December 31, | |||||||||||||||||||
| 2013 | 2012 | 2011 | 2010 | 2009 | |||||||||||||||
| (Millions) | |||||||||||||||||||
| Net income (loss) | $ | 183 | $ | 275 | $ | 157 | $ | 39 | $ | (73 | ) | ||||||||
| Noncontrolling interests | 39 | 29 | 26 | 24 | 19 | ||||||||||||||
| Income tax expense | 122 | 19 | 88 | 69 | 13 | ||||||||||||||
| Interest expense, net of interest capitalized | 80 | 105 | 108 | 149 | 133 | ||||||||||||||
| Depreciation and amortization of other intangibles | 205 | 205 | 207 | 216 | 221 | ||||||||||||||
| Total EBITDA including noncontrolling interests | $ | 629 | $ | 633 | $ | 586 | $ | 497 | $ | 313 | |||||||||
| Year Ended December 31, | ||||||||||||||||||||
| 2010 | 2009 | 2008 | 2007 | 2006 | ||||||||||||||||
| (Millions) | ||||||||||||||||||||
| Net income (loss) | $ | 39 | $ | (73 | ) | $ | (415 | ) | $ | (5 | ) | $ | 49 | |||||||
| Noncontrolling interests | 24 | 19 | 10 | 10 | 6 | |||||||||||||||
| Income tax expense | 69 | 13 | 289 | 83 | 5 | |||||||||||||||
| Interest expense, net of interest capitalized | 149 | 133 | 113 | 164 | 136 | |||||||||||||||
| Depreciation and amortization of other intangibles | 216 | 221 | 222 | 205 | 184 | |||||||||||||||
| Total EBITDA including noncontrolling interests | $ | 497 | $ | 313 | $ | 219 | $ | 457 | $ | 380 | ||||||||||
| (f) | We present the ratio of net debt (total debt less cash and cash equivalents) to EBITDA including noncontrolling interests because management believes it is a useful measure of Tenneco’s credit position and progress toward reducing leverage. The calculation is limited in that we may not always be able to use cash to repay debt on a dollar-for-dollar basis. |
| For purposes of computing this ratio, earnings generally consist of income before income taxes and fixed charges excluding capitalized interest. Fixed charges consist of interest expense, the portion of rental expense considered representative of the interest factor and capitalized interest. Earnings were insufficient to cover fixed charges by $39 million |
| ITEM 7. | MANAGEMENT’S DISCUSSION AND ANALYSIS OF FINANCIAL CONDITION AND RESULTS OF OPERATIONS. |
As you read the following review of our financial condition and results of operations, you should also read our consolidated financial statements and related notes beginning on page 74.in Item 8.
Executive Summary
We are one of the world’s leading manufacturers of automotive emission controlclean air and ride controlperformance products and systems for light vehicle, commercial truck and specialty vehicleoff-highway applications. We serve both original equipment (OE) vehicle designers and manufacturers and the repair and replacement markets, or aftermarket, globally through leading brands, including Monroe®, Rancho®, Clevite® Elastomers, Marzocchi®, Axios™, Kinetic™ and Fric RotFric-Rot™tm ride controlperformance products and Walker®, XNOx™, Fonos™tm, DynoMax®, Thrush™and GilletLukey™tm emission control clean air products. We serve more than 6465 different original equipment manufacturers and commercial truck and off-highway engine manufacturers, and our products or systems are included on nine of the top 10 passengercar models produced for sale in Europe and nineeight of the top 10 light truck models produced for sale in North America for 2010.2013. Our aftermarket customers are comprised of full-line and specialty warehouse distributors, retailers, jobbers, installer chains and car dealers. As of December 31, 2010,2013, we operated 8889 manufacturing facilities worldwide and employed approximately 22,00026,000 people to service our customers’ demands.
Factors that continue to be critical to our success include winning new business awards, managing our overall global manufacturing footprint to ensure proper placement and workforce levels in line with business needs, maintaining competitive
40
wages and benefits, maximizing efficiencies in manufacturing processes and reducing overall costs. In addition, our ability to adapt to key industry trends, such as a shift in consumer preferences to other vehicles in response to higher fuel costs and other economic and social factors, increasing technologically sophisticated content, changing aftermarket distribution channels, increasing environmental standards and extended product life of automotive parts, also play a critical role in our success. Other factors that are critical to our success include adjusting to economic challenges such as increases in the cost of raw materials and our ability to successfully reduce the impact of any such cost increases through material substitutions, cost reduction initiatives and other methods.
In connection with the organizational changes announced on February 14, 2013 that aligned our businesses along product lines, effective with 2013, our three prior geographic reportable segments have each been split into two product segments. Beginning with 2013, we are managed and organized along our two major product lines (clean air and ride performance) and three geographic areas (North America; Europe, South America and India; and Asia Pacific), resulting in 2010 was up 15 percentyear-over-year.
new reporting segments.
Total revenuesrevenue for 2010 were $5.9 billion, a 282013 was $7,964 million, an eight percent increase from $4.6 billion$7,363 million in 2009.2012. Excluding the impact of currency and substrate sales, revenue was up $955$481 million, or 26 percent,from $5,703 million to $6,184 million, driven primarily by higher OE production in all geographic regions, stronger global light vehicle volumes, launching new light vehicle platforms and growing commercial truck and off-highway and aftermarket sales, particularly in North and South America, and new launches of light and commercial vehicle programs.
40
businesses.
Cost of sales: Cost of sales for 20102013 was $4,900$6,734 million, or 82.584.6 percent of sales, compared to $3,875$6,170 million, or 83.483.8 percent of sales in 2009.2012. The following table lists the primary drivers behind the change in cost of sales ($ millions).
| Year ended December 31, 2009 | $ | 3,875 | ||
| Volume and mix | 976 | |||
| Material | 23 | |||
| Currency | 8 | |||
| Restructuring | (6 | ) | ||
| Other Costs | 24 | |||
| Year ended December 31, 2010 | $ | 4,900 | ||
| Year ended December 31, 2012 | $ | 6,170 | |
| Volume and mix | 571 | ||
| Material | (59 | ) | |
| Currency exchange rates | (37 | ) | |
| Restructuring | 57 | ||
| Other Costs | 32 | ||
| Year ended December 31, 2013 | $ | 6,734 | |
The increase in cost of sales was due primarily to theyear-over-year increase in production volumes, higher materialrestructuring and other costs, mainly manufacturing.
manufacturing, partially offset by lower net material costs and the impact of foreign currency exchange rates.
Gross margin: Gross marginRevenue less cost of sales for 20102013 was 17.5$1,230 million, or 15.4 percent up 0.9 percentage points from 16.6of sales, versus $1,193 million, or 16.2 percent of sales in 2009.2012. The effects on gross margin improvement was drivenresulting from higher restructuring expenses, higher manufacturing costs and negative currency were partially offset by manufacturing efficiencies due to higheryear-over-year OE production volumes lower restructuring and related expenses,better material cost management and higher aftermarket revenues. A higher mix of OE revenues which included a higher mix of substrate sales, pricing, primarily related to contractual price reductions, and unfavorable currency partially offset these improvements.
management.
Engineering, research and development: Engineering, research and development expense was $117$144 million and $97$126 million in 20102013 and 2009,2012, respectively. Increased spending related to diesel aftertreatment technology development, higher performance-based compensation costssupport customer programs, growth in emerging markets and the elimination of temporarydecreased engineering cost reduction efforts which were in effect during 2009, including employee furloughs and salary and benefit cuts,recoveries drove the increase in expenseyear-over-year.
year-over-year increase.
Selling, general and administrative: Selling, general and administrative expense was up $73$26 million in 2010,2013, at $417$453 million, compared to $344$427 million in 2009. Higher performance-based and stock indexed compensation costs, the temporary cost reduction efforts of 2009, which included employee furloughs and salary and benefit cuts that were subsequently restored by the beginning of 2010, charges related to an actuarial loss for lump-sum pension payments and increased changeover costs2012. The year-over-year increase is due to new aftermarket businesshigher compensation related accruals, growth in North America, drove the increase in expensesyear-over-year. These pension charges relate to a non-qualified pension plan in which one current and three former employees were participants. Lump-sum pension payments are required when participants retire or when they turn 55. Two former employees turned 55 in 2010. Included in 2009 was $1 million ofemerging markets, higher restructuring and related expenses.
expenses, and a benefit of $5 million in 2012 from property recoveries related to transactions originated by The Pullman Company before being acquired by Tenneco in 1996.
Depreciation and amortization: Depreciation and amortization expense was $205 million for 2013 and 2012, respectively. The expense in 2010 was $2162012 included a $7 million comparedasset impairment charge related to $221 million in 2009.
the European ride performance business.
Earnings before interest expense, taxes and noncontrolling interests (“EBIT”) was $281$424 million for 2010, an improvement2013, a decrease of $189$4 million, when compared to $92$428 million in 2009.the prior year. Higher OE production volumes globally and the related manufacturing efficiencies, materials cost management, higher aftermarket sales, decreased restructuring and related costs and $1expenses, higher engineering expense, $14 million of positivenegative currency drove theyear-over-year increase. Partially offsetting the increase was higher selling, general, administrative and engineering spending, which included higher performance-based and stock indexed compensation costs and the pension chargesa benefit of $5 million in 2012 from property recoveries related to an actuarial loss for lump-sum pension payments, increased changeover coststransactions originated by The Pullman Company before being acquired by Tenneco in 1996 were partially offset by operational cost
41
improvements, higher light vehicle volumes globally, commercial truck and unfavorable pricing, primarily related to contractual price reductions. Included in 2009 EBIT was a $5 million charge related to an environmental reserve.off-highway revenue growth and higher aftermarket sales.
Results from Operations
Net Sales and Operating Revenues for Years 20102013 and 2009
2012
The following tables below reflect our revenues for 20102013 and 2009.2012. We present these reconciliations of revenues in order to reflect the trend in our sales in various product lines and geographic regions separately from the
41
Our value-add content in an emission control system includes designing the system to meet environmental regulations through integration of the substrates into the system, maximizing use of thermal energy to heat up the catalyst quickly, efficiently managing airflow to reduce back pressure as the exhaust stream moves past the catalyst, managing the expansion and contraction of the emission control system components due to temperature extremes experienced by an emission control system, using advanced acoustic engineering tools to design the desired exhaust sound, minimizing the opportunity for the fragile components of the substrate to be damaged when we integrate it into the emission control system and reducing unwanted noise, vibration and harshness transmitted through the emission control system.
We present these substrate sales separately in the following table because we believe investors utilize this information to understand the impact of this portion of our revenues on our overall business and because it removes the impact of potentially volatile precious metals pricing from our revenues. While our original
42
equipment customers generally assume the risk of precious metals pricing volatility, it impacts our reported revenues. Excluding “substrate”Presenting revenues that exclude “substrates” used in catalytic converterconverters and diesel particulate filter salesfilters removes this impact.
Additionally, we present these reconciliations of revenues in order to reflect value-add revenues without the effect of changes in foreign currency rates. We have not reflected any currency impact in the 2012 table since this is the base period for measuring the effects of currency during 2013 on our operations. We believe investors find this information useful in understanding period-to-period comparisons in our revenues.
| Year Ended December 31, 2010 | ||||||||||||||||||||
| Revenues | ||||||||||||||||||||
| Substrate | Excluding | |||||||||||||||||||
| Revenues | Sales | Currency and | ||||||||||||||||||
| Currency | Excluding | Excluding | Substrate | |||||||||||||||||
| Revenues | Impact | Currency | Currency | Sales | ||||||||||||||||
| (Millions) | ||||||||||||||||||||
| North America Original Equipment | ||||||||||||||||||||
| Ride Control | $ | 527 | $ | 11 | $ | 516 | $ | — | $ | 516 | ||||||||||
| Emission Control | 1,642 | 7 | 1,635 | 739 | 896 | |||||||||||||||
| Total North America Original Equipment | 2,169 | 18 | 2,151 | 739 | 1,412 | |||||||||||||||
| North America Aftermarket | ||||||||||||||||||||
| Ride Control | 484 | 4 | 480 | — | 480 | |||||||||||||||
| Emission Control | 168 | 2 | 166 | — | 166 | |||||||||||||||
| Total North America Aftermarket | 652 | 6 | 646 | — | 646 | |||||||||||||||
| Total North America | 2,821 | 24 | 2,797 | 739 | 2,058 | |||||||||||||||
| Europe Original Equipment | ||||||||||||||||||||
| Ride Control | 462 | (26 | ) | 488 | — | 488 | ||||||||||||||
| Emission Control | 1,121 | (40 | ) | 1,161 | 369 | 792 | ||||||||||||||
| Total Europe Original Equipment | 1,583 | (66 | ) | 1,649 | 369 | 1,280 | ||||||||||||||
| Europe Aftermarket | ||||||||||||||||||||
| Ride Control | 190 | (8 | ) | 198 | — | 198 | ||||||||||||||
| Emission Control | 141 | (7 | ) | 148 | — | 148 | ||||||||||||||
| Total Europe Aftermarket | 331 | (15 | ) | 346 | — | 346 | ||||||||||||||
| South America & India | 532 | 33 | 499 | 74 | 425 | |||||||||||||||
| Total Europe, South America & India | 2,446 | (48 | ) | 2,494 | 443 | 2,051 | ||||||||||||||
| Asia | 517 | 8 | 509 | 106 | 403 | |||||||||||||||
| Australia | 153 | 18 | 135 | 9 | 126 | |||||||||||||||
| Total Asia Pacific | 670 | 26 | 644 | 115 | 529 | |||||||||||||||
| Total Tenneco | $ | 5,937 | $ | 2 | $ | 5,935 | $ | 1,297 | $ | 4,638 | ||||||||||
| Year Ended December 31, 2013 | |||||||||||||||||||
| Revenues | Substrate Sales | Value-add Revenues | Currency Impact on Value-add Revenues | Value-add Revenues excluding Currency | |||||||||||||||
| (Millions) | |||||||||||||||||||
| Clean Air Division | |||||||||||||||||||
| North America | $ | 2,658 | $ | 1,030 | $ | 1,628 | $ | (1 | ) | $ | 1,629 | ||||||||
| Europe, South America & India | 1,934 | 663 | 1,271 | (18 | ) | 1,289 | |||||||||||||
| Asia Pacific | 852 | 142 | 710 | 9 | 701 | ||||||||||||||
| Total Clean Air Division | 5,444 | 1,835 | 3,609 | (10 | ) | 3,619 | |||||||||||||
| Ride Performance Division | |||||||||||||||||||
| North America | 1,255 | — | 1,255 | (6 | ) | 1,261 | |||||||||||||
| Europe, South America & India | 1,046 | — | 1,046 | (36 | ) | 1,082 | |||||||||||||
| Asia Pacific | 219 | — | 219 | (3 | ) | 222 | |||||||||||||
| Total Ride Performance Division | 2,520 | — | 2,520 | (45 | ) | 2,565 | |||||||||||||
| Total Tenneco Inc. | $ | 7,964 | $ | 1,835 | $ | 6,129 | $ | (55 | ) | $ | 6,184 | ||||||||
43
42
| Year Ended December 31, 2009 | ||||||||||||||||||||
| Revenues | ||||||||||||||||||||
| Substrate | Excluding | |||||||||||||||||||
| Revenues | Sales | Currency and | ||||||||||||||||||
| Currency | Excluding | Excluding | Substrate | |||||||||||||||||
| Revenues | Impact | Currency | Currency | Sales | ||||||||||||||||
| (Millions) | ||||||||||||||||||||
| North America Original Equipment | ||||||||||||||||||||
| Ride Control | $ | 382 | $ | — | $ | 382 | $ | — | $ | 382 | ||||||||||
| Emission Control | 1,154 | — | 1,154 | 530 | 624 | |||||||||||||||
| Total North America Original Equipment | 1,536 | — | 1,536 | 530 | 1,006 | |||||||||||||||
| North America Aftermarket | ||||||||||||||||||||
| Ride Control | 406 | — | 406 | — | 406 | |||||||||||||||
| Emission Control | 150 | — | 150 | — | 150 | |||||||||||||||
| Total North America Aftermarket | 556 | — | 556 | — | 556 | |||||||||||||||
| Total North America | 2,092 | — | 2,092 | 530 | 1,562 | |||||||||||||||
| Europe Original Equipment | ||||||||||||||||||||
| Ride Control | 421 | — | 421 | — | 421 | |||||||||||||||
| Emission Control | 917 | — | 917 | 296 | 621 | |||||||||||||||
| Total Europe Original Equipment | 1,338 | — | 1,338 | 296 | 1,042 | |||||||||||||||
| Europe Aftermarket | ||||||||||||||||||||
| Ride Control | 181 | — | 181 | — | 181 | |||||||||||||||
| Emission Control | 154 | — | 154 | — | 154 | |||||||||||||||
| Total Europe Aftermarket | 335 | — | 335 | — | 335 | |||||||||||||||
| South America & India | 374 | — | 374 | 45 | 329 | |||||||||||||||
| Total Europe, South America & India | 2,047 | — | 2,047 | 341 | 1,706 | |||||||||||||||
| Asia | 380 | — | 380 | 85 | 295 | |||||||||||||||
| Australia | 130 | — | 130 | 10 | 120 | |||||||||||||||
| Total Asia Pacific | 510 | — | 510 | 95 | 415 | |||||||||||||||
| Total Tenneco | $ | 4,649 | $ | — | $ | 4,649 | $ | 966 | $ | 3,683 | ||||||||||
| Year Ended December 31, 2012 | |||||||||||||||||||
| Revenues | Substrate Sales | Value-add Revenues | Currency Impact on Value-add Revenues | Value-add Revenues excluding Currency | |||||||||||||||
| (Millions) | |||||||||||||||||||
| Clean Air Division | |||||||||||||||||||
| North America | $ | 2,506 | $ | 997 | $ | 1,509 | $ | — | $ | 1,509 | |||||||||
| Europe, South America & India | 1,726 | 570 | 1,156 | — | 1,156 | ||||||||||||||
| Asia Pacific | 694 | 93 | 601 | — | 601 | ||||||||||||||
| Total Clean Air Division | 4,926 | 1,660 | 3,266 | — | 3,266 | ||||||||||||||
| Ride Performance Division | |||||||||||||||||||
| North America | 1,213 | — | 1,213 | — | 1,213 | ||||||||||||||
| Europe, South America & India | 1,041 | — | 1,041 | — | 1,041 | ||||||||||||||
| Asia Pacific | 183 | — | 183 | — | 183 | ||||||||||||||
| Total Ride Performance Division | 2,437 | — | 2,437 | — | 2,437 | ||||||||||||||
| Total Tenneco Inc. | $ | 7,363 | $ | 1,660 | $ | 5,703 | $ | — | $ | 5,703 | |||||||||
44
| Year Ended December 31, 2010 | ||||||||||||||||
| Versus Year Ended December 31, 2009 | ||||||||||||||||
| Dollar and Percent Increase (Decrease) | ||||||||||||||||
| Revenues | ||||||||||||||||
| Excluding | ||||||||||||||||
| Currency and | ||||||||||||||||
| Substrate | ||||||||||||||||
| Revenues | Percent | Sales | Percent | |||||||||||||
| (Millions Except Percent Amounts) | ||||||||||||||||
| North America Original Equipment | ||||||||||||||||
| Ride Control | $ | 145 | 38 | % | $ | 134 | 35 | % | ||||||||
| Emission Control | 488 | 42 | % | 272 | 44 | % | ||||||||||
| Total North America Original Equipment | 633 | 41 | % | 406 | 40 | % | ||||||||||
| North America Aftermarket | ||||||||||||||||
| Ride Control | 78 | 19 | % | 74 | 18 | % | ||||||||||
| Emission Control | 18 | 12 | % | 16 | 10 | % | ||||||||||
| Total North America Aftermarket | 96 | 17 | % | 90 | 16 | % | ||||||||||
| Total North America | 729 | 35 | % | 496 | 32 | % | ||||||||||
| Europe Original Equipment | ||||||||||||||||
| Ride Control | 41 | 10 | % | 67 | 16 | % | ||||||||||
| Emission Control | 204 | 22 | % | 171 | 28 | % | ||||||||||
| Total Europe Original Equipment | 245 | 18 | % | 238 | 23 | % | ||||||||||
| Europe Aftermarket | ||||||||||||||||
| Ride Control | 9 | 6 | % | 17 | 10 | % | ||||||||||
| Emission Control | (13 | ) | (9 | )% | (6 | ) | (4 | )% | ||||||||
| Total Europe Aftermarket | (4 | ) | (1 | )% | 11 | 3 | % | |||||||||
| South America & India | 158 | 42 | % | 96 | 29 | % | ||||||||||
| Total Europe, South America & India | 399 | 20 | % | 345 | 20 | % | ||||||||||
| Asia | 137 | 36 | % | 108 | 37 | % | ||||||||||
| Australia | 23 | 18 | % | 6 | 4 | % | ||||||||||
| Total Asia Pacific | 160 | 31 | % | 114 | 27 | % | ||||||||||
| Total Tenneco | $ | 1,288 | 28 | % | $ | 955 | 26 | % | ||||||||
| Year Ended December 31, 2013 Versus Year Ended December 31, 2012 Dollar and Percent Increase (Decrease) | |||||||||||||
| Revenues | Percent | Value-add Revenues excluding Currency | Percent | ||||||||||
| (Millions Except Percent Amounts) | |||||||||||||
| Clean Air Division | |||||||||||||
| North America | $ | 152 | 6 | % | $ | 120 | 8 | % | |||||
| Europe, South America & India | 208 | 12 | % | 133 | 12 | % | |||||||
| Asia Pacific | 158 | 23 | % | 100 | 17 | % | |||||||
| Total Clean Air Division | 518 | 11 | % | 353 | 11 | % | |||||||
| Ride Performance Division | |||||||||||||
| North America | 42 | 3 | % | 48 | 4 | % | |||||||
| Europe, South America & India | 5 | — | % | 41 | 4 | % | |||||||
| Asia Pacific | 36 | 20 | % | 39 | 21 | % | |||||||
| Total Ride Performance Division | 83 | 3 | % | 128 | 5 | % | |||||||
| Total Tenneco Inc. | $ | 601 | 8 | % | $ | 481 | 8 | % | |||||
Light Vehicle Industry Production by Region for Years Ended December 31, 20102013 and 20092012 (According to IHS Automotive, January 2011)2014)
| Year Ended | ||||||||||||||||
| December 31, | Increase | |||||||||||||||
| 2010 | 2009 | (Decrease) | % Increase | |||||||||||||
| (Number of Vehicles in Thousands) | ||||||||||||||||
| North America | 11,912 | 8,566 | 3,346 | 39 | % | |||||||||||
| Europe | 19,290 | 16,844 | 2,446 | 15 | % | |||||||||||
| South America | 4,014 | 3,697 | 317 | 9 | % | |||||||||||
| India | 3,242 | 2,402 | 840 | 35 | % | |||||||||||
| Total Europe, South America & India | 26,546 | 22,943 | 3,603 | 16 | % | |||||||||||
| China | 16,786 | 12,886 | 3,900 | 30 | % | |||||||||||
| Australia | 239 | 222 | 17 | 8 | % | |||||||||||
45
| Year Ended December 31, | |||||||||||
| 2013 | 2012 | Increase (Decrease) | % Increase (Decrease) | ||||||||
| (Number of Vehicles in Thousands) | |||||||||||
| North America | 16,184 | 15,434 | 750 | 5 | % | ||||||
| Europe | 19,331 | 19,298 | 33 | — | % | ||||||
| South America | 4,536 | 4,291 | 245 | 6 | % | ||||||
| India | 3,648 | 3,802 | (154 | ) | (4 | )% | |||||
| Total Europe, South America & India | 27,515 | 27,391 | 124 | — | % | ||||||
| China | 20,818 | 18,235 | 2,583 | 14 | % | ||||||
| Australia | 208 | 221 | (13 | ) | (6 | )% | |||||
Clean Air revenue was up 25 percent and industryClass 4-7 commercial vehicle production was flat$518 million in 2010 when2013 compared to 2009. Revenues from our North American operations increased2012, driven by higher sales in 2010 compared to last year due to higher OE and aftermarket sales of both product lines.all the regions. The increase in North American revenues was driven by higher volumes, which accounted for $156 million of the year-over-year change in revenues. Currency had a $1 million unfavorable impact on North American revenues. The increase in European, South American and Indian revenues was mostly driven by higher volumes of $231 million, mainly due to higher year-over-year OE light vehicle and commercial truck and off-highway revenues. Currency had a $15 million unfavorable impact on European, South American and Indian revenues. The increase in Asia Pacific revenues was primarily driven by improved productionhigher volumes of Tenneco-supplied vehicles such as the Ford F-150$166 million, mostly due to higher light vehicle and Super-Dutypick-ups, GM’s crossover models and the GMT900 platform which accounted for $655commercial truck volumes in China. Currency had an $11 million favorable impact on Asia Pacific revenues.
Ride Performance revenue was up $83 million in revenues. Partially offsetting2013 compared to 2012, primarily driven by higher sales in all the increase was unfavorable platform mix which impacted revenue by $31 millionyear-over-year.regions. The increase in aftermarketNorth American revenues for North America was primarily due todriven by higher customer demand for both product lines which resulted involumes of $43 million. Currency had a combined$6 million unfavorable impact on North American revenues. The increase in revenue of $101 million.
Net Sales and Operating Revenues for Years 20092012 and 2008
2011
The following tables reflect our revenues for the years of 20092012 and 2008.2011. See “Net Sales and Operating Revenues for Years 20102013 and 2009”2012” for a description of why we present these reconciliations of revenue.
| Year Ended December 31, 2009 | ||||||||||||||||||||
| Revenues | ||||||||||||||||||||
| Substrate | Excluding | |||||||||||||||||||
| Revenues | Sales | Currency and | ||||||||||||||||||
| Currency | Excluding | Excluding | Substrate | |||||||||||||||||
| Revenues | Impact | Currency | Currency | Sales | ||||||||||||||||
| (Millions) | ||||||||||||||||||||
| North America Original Equipment | ||||||||||||||||||||
| Ride Control | $ | 382 | $ | (4 | ) | $ | 386 | $ | — | $ | 386 | |||||||||
| Emission Control | 1,154 | (2 | ) | 1,156 | 530 | 626 | ||||||||||||||
| Total North America Original Equipment | 1,536 | (6 | ) | 1,542 | 530 | 1,012 | ||||||||||||||
| North America Aftermarket | ||||||||||||||||||||
| Ride Control | 406 | (4 | ) | 410 | — | 410 | ||||||||||||||
| Emission Control | 150 | (2 | ) | 152 | — | 152 | ||||||||||||||
| Total North America Aftermarket | 556 | (6 | ) | 562 | — | 562 | ||||||||||||||
| Total North America | 2,092 | (12 | ) | 2,104 | 530 | 1,574 | ||||||||||||||
| Europe Original Equipment | ||||||||||||||||||||
| Ride Control | 421 | (25 | ) | 446 | — | 446 | ||||||||||||||
| Emission Control | 917 | (178 | ) | 1,095 | 305 | 790 | ||||||||||||||
| Total Europe Original Equipment | 1,338 | (203 | ) | 1,541 | 305 | 1,236 | ||||||||||||||
| Europe Aftermarket | ||||||||||||||||||||
| Ride Control | 181 | (14 | ) | 195 | — | 195 | ||||||||||||||
| Emission Control | 154 | (16 | ) | 170 | — | 170 | ||||||||||||||
| Total Europe Aftermarket | 335 | (30 | ) | 365 | — | 365 | ||||||||||||||
| South America & India | 374 | (40 | ) | 414 | 50 | 364 | ||||||||||||||
| Total Europe, South America & India | 2,047 | (273 | ) | 2,320 | 355 | 1,965 | ||||||||||||||
| Asia | 380 | 6 | 374 | 84 | 290 | |||||||||||||||
| Australia | 130 | (20 | ) | 150 | 11 | 139 | ||||||||||||||
| Total Asia Pacific | 510 | (14 | ) | 524 | 95 | 429 | ||||||||||||||
| Total Tenneco | $ | 4,649 | $ | (299 | ) | $ | 4,948 | $ | 980 | $ | 3.968 | |||||||||
| Year Ended December 31, 2012 | |||||||||||||||||||
| Revenues | Substrate Sales | Value-add Revenues | Currency Impact on Value-add Revenues | Value-add Revenues excluding Currency | |||||||||||||||
| (Millions) | |||||||||||||||||||
| Clean Air Division | |||||||||||||||||||
| North America | $ | 2,506 | $ | 997 | $ | 1,509 | $ | — | $ | 1,509 | |||||||||
| Europe, South America & India | 1,726 | 570 | 1,156 | (113 | ) | 1,269 | |||||||||||||
| Asia Pacific | 694 | 93 | 601 | — | 601 | ||||||||||||||
| Total Clean Air Division | 4,926 | 1,660 | 3,266 | (113 | ) | 3,379 | |||||||||||||
| Ride Performance Division | |||||||||||||||||||
| North America | 1,213 | — | 1,213 | — | 1,213 | ||||||||||||||
| Europe, South America & India | 1,041 | — | 1,041 | (120 | ) | 1,161 | |||||||||||||
| Asia Pacific | 183 | — | 183 | (2 | ) | 185 | |||||||||||||
| Total Ride Performance Division | 2,437 | — | 2,437 | (122 | ) | 2,559 | |||||||||||||
| Total Tenneco Inc. | $ | 7,363 | $ | 1,660 | $ | 5,703 | $ | (235 | ) | $ | 5,938 | ||||||||
47
44
| Year Ended December 31, 2008 | ||||||||||||||||||||
| Revenues | ||||||||||||||||||||
| Substrate | Excluding | |||||||||||||||||||
| Revenues | Sales | Currency and | ||||||||||||||||||
| Currency | Excluding | Excluding | Substrate | |||||||||||||||||
| Revenues | Impact | Currency | Currency | Sales | ||||||||||||||||
| (Millions) | ||||||||||||||||||||
| North America Original Equipment | ||||||||||||||||||||
| Ride Control | $ | 493 | $ | — | $ | 493 | $ | — | $ | 493 | ||||||||||
| Emission Control | 1,591 | — | 1,591 | 773 | 818 | |||||||||||||||
| Total North America Original Equipment | 2,084 | — | 2,084 | 773 | 1,311 | |||||||||||||||
| North America Aftermarket | ||||||||||||||||||||
| Ride Control | 390 | — | 390 | — | 390 | |||||||||||||||
| Emission Control | 156 | — | 156 | — | 156 | |||||||||||||||
| Total North America Aftermarket | 546 | — | 546 | — | 546 | |||||||||||||||
| Total North America | 2,630 | — | 2,630 | 773 | 1,857 | |||||||||||||||
| Europe Original Equipment | ||||||||||||||||||||
| Ride Control | 479 | — | 479 | — | 479 | |||||||||||||||
| Emission Control | 1,487 | — | 1,487 | 539 | 948 | |||||||||||||||
| Total Europe Original Equipment | 1,966 | — | 1,966 | 539 | 1,427 | |||||||||||||||
| Europe Aftermarket | ||||||||||||||||||||
| Ride Control | 213 | — | 213 | — | 213 | |||||||||||||||
| Emission Control | 190 | — | 190 | — | 190 | |||||||||||||||
| Total Europe Aftermarket | 403 | — | 403 | — | 403 | |||||||||||||||
| South America & India | 389 | — | 389 | 55 | 334 | |||||||||||||||
| Total Europe, South America and India | 2,758 | — | 2,758 | 594 | 2,164 | |||||||||||||||
| Asia | 342 | — | 342 | 109 | 233 | |||||||||||||||
| Australia | 186 | — | 186 | 16 | 170 | |||||||||||||||
| Total Asia Pacific | 528 | — | 528 | 125 | 403 | |||||||||||||||
| Total Tenneco | $ | 5,916 | $ | — | $ | 5,916 | $ | 1,492 | $ | 4,424 | ||||||||||
| Year Ended December 31, 2011 | |||||||||||||||||||
| Revenues | Substrate Sales | Value-add Revenues | Currency Impact on Value-add Revenues | Value-add Revenues excluding Currency | |||||||||||||||
| (Millions) | |||||||||||||||||||
| Clean Air Division | |||||||||||||||||||
| North America | $ | 2,288 | $ | 971 | $ | 1,317 | $ | — | $ | 1,317 | |||||||||
| Europe, South America & India | 1,849 | 597 | 1,252 | — | 1,252 | ||||||||||||||
| Asia Pacific | 624 | 110 | 514 | — | 514 | ||||||||||||||
| Total Clean Air Division | 4,761 | 1,678 | 3,083 | — | 3,083 | ||||||||||||||
| Ride Performance Division | |||||||||||||||||||
| North America | 1,126 | — | 1,126 | — | 1,126 | ||||||||||||||
| Europe, South America & India | 1,164 | — | 1,164 | — | 1,164 | ||||||||||||||
| Asia Pacific | 154 | — | 154 | — | 154 | ||||||||||||||
| Total Ride Performance Division | 2,444 | — | 2,444 | — | 2,444 | ||||||||||||||
| Total Tenneco Inc. | $ | 7,205 | $ | 1,678 | $ | 5,527 | $ | — | $ | 5,527 | |||||||||
48
| Year Ended December 31, 2009 | ||||||||||||||||
| Versus Year Ended December 31, 2008 | ||||||||||||||||
| Dollar and Percent Increase (Decrease) | ||||||||||||||||
| Revenues | ||||||||||||||||
| Excluding | ||||||||||||||||
| Currency and | ||||||||||||||||
| Substrate | ||||||||||||||||
| Revenues | Percent | Sales | Percent | |||||||||||||
| (Millions Except Percent Amounts) | ||||||||||||||||
| North America Original Equipment | ||||||||||||||||
| Ride Control | $ | (111 | ) | (23 | )% | $ | (107 | ) | (22 | )% | ||||||
| Emission Control | (437 | ) | (27 | )% | (192 | ) | (23 | )% | ||||||||
| Total North America Original Equipment | (548 | ) | (26 | )% | (299 | ) | (23 | )% | ||||||||
| North America Aftermarket | ||||||||||||||||
| Ride Control | 16 | 4 | % | 20 | 5 | % | ||||||||||
| Emission Control | (6 | ) | (4 | )% | (4 | ) | (3 | )% | ||||||||
| Total North America Aftermarket | 10 | 2 | % | 16 | 3 | % | ||||||||||
| Total North America | (538 | ) | (20 | )% | (283 | ) | (15 | )% | ||||||||
| Europe Original Equipment | ||||||||||||||||
| Ride Control | (58 | ) | (12 | )% | (33 | ) | (7 | )% | ||||||||
| Emission Control | (570 | ) | (38 | )% | (158 | ) | (17 | )% | ||||||||
| Total Europe Original Equipment | (628 | ) | (32 | )% | (191 | ) | (13 | )% | ||||||||
| Europe Aftermarket | ||||||||||||||||
| Ride Control | (32 | ) | (15 | )% | (18 | ) | (8 | )% | ||||||||
| Emission Control | (36 | ) | (19 | )% | (20 | ) | (11 | )% | ||||||||
| Total Europe Aftermarket | (68 | ) | (17 | )% | (38 | ) | (9 | )% | ||||||||
| South America & India | (15 | ) | (4 | )% | 30 | 9 | % | |||||||||
| Total Europe, South America & India | (711 | ) | (26 | )% | (199 | ) | (9 | )% | ||||||||
| Asia | 38 | 11 | % | 57 | 25 | % | ||||||||||
| Australia | (56 | ) | (30 | )% | (31 | ) | (18 | )% | ||||||||
| Total Asia Pacific | (18 | ) | (3 | )% | 26 | 6 | % | |||||||||
| Total Tenneco | $ | (1,267 | ) | (21 | )% | $ | (456 | ) | (10 | )% | ||||||
| Year Ended December 31, 2012 Versus Year Ended December 31, 2011 Dollar and Percent Increase (Decrease) | |||||||||||
| Revenues | Percent | Value-add Revenues excluding Currency | Percent | ||||||||
| (Millions Except Percent Amounts) | |||||||||||
| Clean Air Division | |||||||||||
| North America | 218 | 10 | % | 192 | 15 | % | |||||
| Europe, South America & India | (123 | ) | (7 | )% | 17 | 1 | % | ||||
| Asia Pacific | 70 | 11 | % | 87 | 17 | % | |||||
| Total Clean Air Division | 165 | 3 | % | 296 | 10 | % | |||||
| Ride Performance Division | |||||||||||
| North America | 87 | 8 | % | 87 | 8 | % | |||||
| Europe, South America & India | (123 | ) | (11 | )% | (3 | ) | — | % | |||
| Asia Pacific | 29 | 19 | % | 31 | 20 | % | |||||
| Total Ride Performance Division | (7 | ) | — | % | 115 | 5 | % | ||||
| Total Tenneco Inc. | 158 | 2 | % | 411 | 7 | % | |||||
Light Vehicle Industry Production by Region for Years Ended December 31, 20092012 and 2008 (According2011 (Updated according to IHS Automotive, January 2011)2014)
| Year Ended | ||||||||||||||||
| December 31, | Increase | |||||||||||||||
| 2009 | 2008 | (Decrease) | % Increase | |||||||||||||
| (Number of Vehicles in Thousands) | ||||||||||||||||
| North America | 8,566 | 12,592 | (4,026 | ) | (32 | )% | ||||||||||
| Europe | 16,844 | 21,204 | (4,360 | ) | (21 | )% | ||||||||||
| South America | 3,697 | 3,765 | (68 | ) | (2 | )% | ||||||||||
| India | 2,402 | 2,045 | 357 | 17 | % | |||||||||||
| Total Europe, South America & India | 22,943 | 27,014 | (4,071 | ) | (15 | )% | ||||||||||
| China | 12,886 | 8,483 | 4,403 | 52 | % | |||||||||||
| Australia | 222 | 323 | (101 | ) | (31 | )% | ||||||||||
49
| Year Ended December 31, | |||||||||||
| 2012 | 2011 | Increase (Decrease) | % Increase (Decrease) | ||||||||
| (Number of Vehicles in Thousands) | |||||||||||
| North America | 15,434 | 13,126 | 2,308 | 18 | % | ||||||
| Europe | 19,298 | 20,159 | (861 | ) | (4 | )% | |||||
| South America | 4,291 | 4,312 | (21 | ) | — | % | |||||
| India | 3,802 | 3,600 | 202 | 6 | % | ||||||
| Total Europe, South America & India | 27,391 | 28,071 | (680 | ) | (2 | )% | |||||
| China | 18,235 | 17,276 | 959 | 6 | % | ||||||
| Australia | 221 | 222 | (1 | ) | — | % | |||||
Clean Air revenue was up $165 million in 2009 as2012 compared to 2008. Industry Class 8 commercial vehicle production was down 38 percent and industryClass 4-7 commercial vehicle production was down 39 percent in 2009 compared to 2008. Revenues from our North American operations decreased for 2009 compared to 2008; lower sales from both North American OE business units were partially offset2011, primarily driven by higher aftermarket revenues.volumes in North American OE revenues were down mainly due to lower OE production volumesyear-over-yearAmerica and lower pricing, mainly a decrease in steel recovery due to lower steel costs, which had a combined impact on OE revenues of $552 million. Excluding unfavorable currency, aftermarket revenues were up driven by stronger ride control volumes and favorable pricing in both product lines, which impacted revenue in total by $32 millionAsia Pacific, partially offset by lower emission control volumes in Europe, South America and India. The increase in North American revenues was driven by higher volumes, which accounted for $214 million of $15 million.
Ride Performance revenue was down $7 million in 2012 compared to 2008 due to unfavorable currency of $30 million. The overall market declined but particularly heavy duty ride control products and the ride control market2011, primarily driven by lower volumes in Eastern Europe, where economies were more severely impacted by the economic crisis. Light vehicle production decreased 2 percent in South America and increased 17 percentIndia, partially offset by higher volumes in Indiathe North American and Asia Pacific regions. The increase in North America was driven by higher volumes which accounted for 2009 when compared to 2008.$72 million of the year-over-year change in revenues. The decrease in European, South American and Indian revenues were down during 2009 compared to 2008 due mainly towas primarily driven by an unfavorable currency impact of $40$120 million and lower volumes of $26 million. When unfavorable currency and substrates were excluded, revenueThe increase in Asia Pacific revenues was up compared to 2008. Our South American and Indian operations benefited from improved OE productiondriven by higher volumes in India and favorable pricing in both regions.
Earnings before Interest Expense, Income Taxes and Noncontrolling Interests (“EBIT”) for Years 20102013 and 20092012
| Year Ended December 31, | ||||||||||||
| 2010 | 2009 | Change | ||||||||||
| (Millions) | ||||||||||||
| North America | $ | 155 | $ | 42 | $ | 113 | ||||||
| Europe, South America and India | 76 | 20 | 56 | |||||||||
| Asia Pacific | 50 | 30 | 20 | |||||||||
| $ | 281 | $ | 92 | $ | 189 | |||||||
50
| Year Ended | ||||||||
| December 31, | ||||||||
| 2010 | 2009 | |||||||
| (Millions) | ||||||||
| North America | ||||||||
| Restructuring and related expenses | $ | 14 | $ | 17 | ||||
| Pension Charges(1) | 6 | — | ||||||
| Environmental reserve(2) | — | 5 | ||||||
| Europe, South America and India | ||||||||
| Restructuring and related expenses | 3 | 4 | ||||||
| Asia Pacific | ||||||||
| Restructuring and related expenses | 2 | — | ||||||
51
| Year Ended | ||||||||||||
| December 31, | ||||||||||||
| 2009 | 2008 | Change | ||||||||||
| (Millions) | ||||||||||||
| North America | $ | 42 | $ | (107 | ) | $ | 149 | |||||
| Europe, South America and India | 20 | 85 | (65 | ) | ||||||||
| Asia Pacific | 30 | 19 | 11 | |||||||||
| $ | 92 | $ | (3 | ) | $ | 95 | ||||||
| Year Ended December 31, | Change | ||||||||||
| 2013 | 2012 | ||||||||||
| (Millions) | |||||||||||
| Clean Air Division | |||||||||||
| North America | $ | 229 | $ | 202 | $ | 27 | |||||
| Europe, South America & India | 57 | 54 | 3 | ||||||||
| Asia Pacific | 84 | 71 | 13 | ||||||||
| Total Clean Air Division | 370 | 327 | 43 | ||||||||
| Ride Performance Division | |||||||||||
| North America | 124 | 122 | 2 | ||||||||
| Europe, South America & India | (7 | ) | 41 | (48 | ) | ||||||
| Asia Pacific | 22 | 5 | 17 | ||||||||
| Total Ride Performance Division | 139 | 168 | (29 | ) | |||||||
| Other | (85 | ) | $ | (67 | ) | $ | (18 | ) | |||
| Total Tenneco Inc. | $ | 424 | $ | 428 | $ | (4 | ) | ||||
The EBIT results shown in the preceding table include the following items, certain of which are discussed below under “Restructuring and Other Charges” and “Liquidity and Capital Resources — Capitalization”,Charges,” which have an effect on the comparability of EBIT results between periods:
46
| �� | ||||||||
| Year Ended | ||||||||
| December 31, | ||||||||
| 2009 | 2008 | |||||||
| (Millions) | ||||||||
| North America | ||||||||
| Restructuring and related expenses | $ | 17 | $ | 16 | ||||
| Environmental reserve(1) | 5 | — | ||||||
| New aftermarket customer changeover costs(2) | — | 7 | ||||||
| Goodwill impairment charge(3) | — | 114 | ||||||
| Europe, South America and India | ||||||||
| Restructuring and related expenses | 4 | 22 | ||||||
| Asia Pacific | ||||||||
| Restructuring and related expenses | — | 2 | ||||||
| Year Ended December 31, | |||||||
| 2013 | 2012 | ||||||
| (Millions) | |||||||
| Clean Air Division | |||||||
| Europe, South America & India | |||||||
| Restructuring and related expenses | $ | 8 | $ | 7 | |||
| Asia Pacific | |||||||
| Restructuring and related expenses | 3 | — | |||||
| Total Clean Air Division | $ | 11 | $ | 7 | |||
| Ride Performance Division | |||||||
| North America | |||||||
| Restructuring and related expenses | $ | 1 | $ | 1 | |||
| Pullman property recoveries (1) | — | (5 | ) | ||||
| Europe, South America & India | |||||||
| Restructuring and related expenses | 62 | 5 | |||||
| Asset impairment charge (2) | — | 7 | |||||
| Asia Pacific | |||||||
| Restructuring and related expenses | 2 | — | |||||
| Total Ride Performance Division | $ | 65 | $ | 8 | |||
| Other | |||||||
| Restructuring and related expenses | $ | 2 | $ | — | |||
| (1) |
| (2) |
EBIT for the Clean Air division was $370 million in 2013 compared to $327 million in 2012. EBIT for North America increased $27 million to $229 million in 2013 versus 2012. The benefits to EBIT from higher volumes, the ramp-up on new platforms and operational cost improvements were partially offset by higher engineering investments for customer programs and negative currency. Europe, South America and India's EBIT increased $3 million in 2013 to $57 million from $54 million in 2012. The increase was driven by higher OE revenues partially offset by higher restructuring and related expenses and negative currency. EBIT for Asia Pacific increased $13 million to $84 million in 2013 from $71 million in 2012. The benefits to EBIT from launches of new platforms and higher production volumes, operational cost management and positive currency were partially offset by increased restructuring and related expenses. For the Clean Air division, EBIT included restructuring and related expenses of $11 million in 2013 and $7 million in 2012. Currency had no impact on EBIT of the Clean Air division for 2013 when compared to last year.
EBIT for the Ride Performance division was $139 million in 2013 compared to $168 million in 2012. EBIT for North America increased $2 million in 2013 to $124 million from $122 million in 2012. The increase was driven by higher OE light vehicle volumes and the ramp-up on new OE platforms, which was partially offset by lower OE commercial truck and off-highway revenues and aftermarket sales, negative currency and costs related to the resolution of an issue related to struts supplied to one particular OE platform. We also recorded a benefit of $5 million in 2012 from property recoveries related to transactions originated by The Pullman Company before being acquired by Tenneco in 1996. Europe, South America and India's EBIT was $(7) million in 2013, compared to $41 million a year ago. The decrease was driven by higher restructuring costs, lower OE light vehicle volumes and negative currency, which was partially offset by new OE platform launches and higher aftermarket volumes. EBIT from Asia Pacific increased $17 million in 2013 to $22 million from 2012. EBIT benefited from higher light vehicle production volumes and operational cost improvements, offset partially by higher restructuring costs. For the Ride Performance division, EBIT included restructuring and related expenses of $65 million in 2013 and $6 million in 2012. We also recorded an asset impairment charge of $7 million in 2012 related to certain assets of our European ride performance business. Currency had a $14 million unfavorable impact on EBIT of the Ride Performance division for 2013 when compared to last year.
Currency had a $14 million unfavorable impact on overall company EBIT in 2013 as compared to the prior year.
47
EBIT for Years 2012 and 2011
| Year Ended December 31, | Change | ||||||||||
| 2012 | 2011 | ||||||||||
| (Millions) | |||||||||||
| Clean Air Division | |||||||||||
| North America | $ | 202 | $ | 172 | $ | 30 | |||||
| Europe, South America & India | 54 | 79 | (25 | ) | |||||||
| Asia Pacific | 71 | 47 | 24 | ||||||||
| Total Clean Air Division | 327 | 298 | 29 | ||||||||
| Ride Performance Division | |||||||||||
| North America | 122 | 76 | 46 | ||||||||
| Europe, South America & India | 41 | 69 | (28 | ) | |||||||
| Asia Pacific | 5 | (6 | ) | 11 | |||||||
| Total Ride Performance Division | 168 | 139 | 29 | ||||||||
| Other | (67 | ) | $ | (58 | ) | $ | (9 | ) | |||
| Total Tenneco Inc. | $ | 428 | $ | 379 | $ | 49 | |||||
The EBIT results shown in the preceding table include the following items, certain of which are discussed below under “Restructuring and Other Charges,” which have an effect on the comparability of EBIT results between periods:
| Year Ended December 31, | |||||||
| 2012 | 2011 | ||||||
| (Millions) | |||||||
| Clean Air Division | |||||||
| Europe, South America & India | |||||||
| Restructuring and related expenses | $ | 7 | $ | 3 | |||
| Asia Pacific | |||||||
| Restructuring and related expenses | — | 2 | |||||
| Goodwill impairment charge (3) | — | 1 | |||||
| Total Clean Air Division | $ | 7 | $ | 6 | |||
| Ride Performance Division | |||||||
| North America | |||||||
| Restructuring and related expenses | $ | 1 | $ | 2 | |||
| Pullman property recoveries (1) | (5 | ) | — | ||||
| Europe, South America & India | |||||||
| Restructuring and related expenses | 5 | — | |||||
| Asset impairment charge (2) | 7 | — | |||||
| Asia Pacific | |||||||
| Restructuring and related expenses | — | 1 | |||||
| Goodwill impairment charge (3) | — | 10 | |||||
| Total Ride Performance Division | $ | 8 | $ | 13 | |||
| (1) | Benefit from property recoveries related to transactions originated by The Pullman Company before being acquired by Tenneco in 1996. |
| (2) | Non-cash asset impairment charge related to certain assets of our European ride performance business. |
| (3) | Non-cash asset impairment charge related to goodwill for Tenneco’s |
EBIT for North American operationsthe Clean Air division was $42$327 million in 2009, an increase of $149 million from a loss of $1072012 compared to $298 million in 2008. The benefits to EBIT from new platform launches, manufacturing efficiencies, reduced selling, general, administrative and engineering spending, lower customer changeover costs, restructuring savings, impairment charge and customer recoveries were only partially offset by lower OE production volumes and the related manufacturing fixed cost absorption and increased restructuring and related expenses. Currency had a $10 million favorable impact on North American EBIT. Restructuring and related expenses of $17 million and an environmental charge of $5 million were included in 2009. Restructuring and related costs of $16 million, a goodwill impairment charge of $114 million and changeover costs for new aftermarket customers of $7 million were included in 2008 EBIT.
52
| Year Ended | ||||||||||||
| December 31, | ||||||||||||
| 2010 | 2009 | 2008 | ||||||||||
| North America | 6 | % | 2 | % | (4 | )% | ||||||
| Europe, South America and India | 3 | % | 1 | % | 3 | % | ||||||
| Asia Pacific | 7 | % | 6 | % | 4 | % | ||||||
| Total Tenneco | 5 | % | 2 | % | — | |||||||
48
and related expenses and operational cost management drove the improvement. For the Clean Air division, EBIT included restructuring and related expenses of $7 million in 2012 and $5 million in 2011. We also recorded a goodwill impairment charge of $1 million in 2011. Currency had a $9 million unfavorable impact on EBIT of the Clean Air division for 2012 when compared to 2011.
EBIT for Ride Performance division was $168 million in 2012 compared to $139 million in 2011. EBIT for North America increased $46 million in 2012 to $122 million verses 2011, primarily driven by higher OE production volumes, increased aftermarket salesrevenues, the related manufacturing efficiencies, operational cost management, lower restructuring and favorablerelated expenses and a benefit of $5 million from property recoveries related to transactions originated by The Pullman Company before being acquired by Tenneco in 1996. Europe, South America and India segment’s EBIT decreased $28 million to $41 million in 2012 from 2011. The decrease in EBIT was driven by unfavorable currency, higher restructuring and related costs, lower volumes in Europe, the Company’s decision to relinquish a platform due to pricing and profitability in South America, and increased operational costs. EBIT for our Asia Pacific segment in 2012 was $5 million compared to a loss of $6 million in 2011. Higher volumes and lower restructuring and related costs drove EBIT improvement, but was partially offset as a percentage of revenue by higherincreased selling, general, administrative, and engineering costs to support new plants and new customers in Asia. For Ride Performance division, EBIT included restructuring and related expenses includingof $6 million in 2012 and $3 million in 2011. We also recorded an asset impairment charge of $7 million in 2012 related to certain asset of our European Ride Performance business. The expense in 2011 included a goodwill impairment charge of $10 million. Currency had a $14 million unfavorable impact on EBIT of the Ride Performance division for 2012 when compared to 2011.
Currency had a $23 million unfavorable impact on overall company EBIT for 2012 as compared to 2011.
EBIT as a Percentage of Revenue for Years 2013, 2012 and 2011
| Year Ended December 31, | |||||
| 2013 | 2012 | 2011 | |||
| Clean Air Division | |||||
| North America | 9% | 8% | 8% | ||
| Europe, South America & India | 3% | 3% | 4% | ||
| Asia Pacific | 10% | 10% | 8% | ||
| Total Clean Air Division | 7% | 7% | 6% | ||
| Ride Performance Division | |||||
| North America | 10% | 10% | 7% | ||
| Europe, South America & India | (1)% | 4% | 6% | ||
| Asia Pacific | 10% | 3% | (4)% | ||
| Total Ride Performance Division | 6% | 7% | 6% | ||
| Total Tenneco Inc. | 5% | 6% | 5% | ||
In the Clean Air division, EBIT as a percentage of revenues in 2013 was even compared to last year. In North America, EBIT as a percentage of revenues in 2013 was up one percentage point from last year. The benefits from higher volumes, the ramp-up on new platforms and operational cost improvements were partially offset by higher engineering investments for customer programs and negative currency. Europe, South America and India's EBIT as a percentage of revenues in 2013 was even compared to prior year. The benefit from higher OE revenues was offset by higher restructuring and related expenses and negative currency. EBIT as a percentage of revenues for Asia Pacific was even in 2013 when compared to 2012. The benefits from launches of new platforms and higher production volumes, operational cost management and positive currency were offset by increased restructuring and related expenses.
In the Ride Performance division, EBIT as a percentage of revenues in 2013 was down one percentage points compared to the prior year. In 2013, EBIT as a percentage of revenues for North America was even compared to 2012. The benefits from higher OE light vehicle volumes and the ramp-up on new OE platforms were offset by lower OE commercial truck and off-highway revenues and aftermarket changeoversales, negative currency and costs higher performance-based compensation costs and charges forrelated to the resolution of an actuarial loss for lump-sum pension payments. Inissue related to struts supplied to one particular OE platform. We also recorded a benefit of $5 million in 2012 from property recoveries related to transactions originated by The Pullman Company before being acquired by Tenneco in 1996. EBIT as a percentage of revenues in Europe, South America and India was down five percentage points in 2013 when compared to the prior year. The decrease was driven by higher restructuring costs, lower OE light vehicle volumes and negative currency, which was partially offset by new OE platform launches and higher aftermarket volumes. In Asia Pacific, EBIT marginas a percentage of revenues in 2013 was up seven percentage points from last year, driven by higher light vehicle production volumes and operational cost improvements, which were offset partially by higher restructuring costs.
49
In the Clean Air division, EBIT as a percentage of revenues in 2012 was up one percentage point compared to 2011. In North America, EBIT as a percentage of revenues in 2012 was even compared to 2011. The benefits from higher OE production volumes and the related manufacturing efficiencies were offset by increased operational costs. Europe, South America and India's EBIT as a percentage of revenues in 2012 decreased by one percentage point compared to 2011, driven by unfavorable currency, lower volumes, increased operational costs and higher restructuring and related expenses. EBIT as a percentage of revenues for 2010 wasAsia Pacific increased by two percentage points higher than prior year duewhen compared to improved2011. Higher volumes, mostly in China, the related manufacturing efficiencies, lower restructuring and related expenses, favorable platform mix and materialoperational cost management actions, partially offset by unfavorable currency and increased selling, general, administrative and engineering expenses.drove the improvement.
In the Ride Performance division, EBIT as a percentage of revenue for our Asia Pacific segment increasedrevenues was up one percentage point in 2010 versus the prior year2012 compared to 2011. EBIT as a percentage of revenues for North America increased three percentage points in 2012 when compared to 2011, primarily driven by higher OE production volumes, andincreased aftermarket revenues, the related manufacturing efficiencies, wereoperational cost management, lower restructuring and related expenses and a benefit of $5 million from property recoveries related to transactions originated by The Pullman Company before being acquired by Tenneco in 1996. EBIT as a percentage of revenues in Europe, South America and India was down two percentage points in 2012 when compared to 2011. The decrease was driven by unfavorable currency, higher restructuring and related costs, lower volumes in Europe, the Company’s decision to relinquish a platform due to pricing and profitability in South America, and increased operational costs. In Asia Pacific, EBIT as a percentage of revenues in 2012 was up seven percentage points from 2011. Higher volumes, mostly in China on current and new platforms, and lower restructuring and related costs drove the improvement, but was partially offset by increased selling, general, administrative, and engineering expenses.costs to support new plants and new customers in Asia.
53
Interest Expense, Net of Interest Capitalized
We reported interest expense in 20102013 of $149$80 million net of interest capitalized of $4 million ($146 million in our U.S. operations and $3 million in our foreign operations), up from $133 million net of interest capitalized of $4 million ($13077 million in our U.S. operations and $3 million in our foreign operations) in 2009. Included in 2010 was $27 million of expense related to our refinancing activities and $4 million of expense related to an accounting change impacting our factored receivables. See “Liquidity and Capital Resources” below for further discussion of the accounting change. Excluding the refinancing expenses, interest expense decreased in 2010 compared to the prior year as a result of our lower average borrowings due to our operating cash performance and last year’s equity offering.
We reported interest expense in 2012 of $105 million ($111102 million in our U.S. operations and $2$3 million in our foreign operations) net of interest capitalized of $4 million, down from $108 million ($105 million in 2008 primarilyour U.S. operations and $3 million in our foreign operations) net of interest capitalized of $4 million in 2011. Included in 2012 was $18 million of expense related to higherour refinancing activities. Included in 2011 was $1 million of expense related to our refinancing activities. Excluding the refinancing expenses, interest expense decreased in 2012 compared to 2011 as a result of lower rates due to the amendmentdebt refinancing transactions from the first quarter of the senior credit facility in February 2009. In addition, the requirement to mark to market our interest rate swaps decreased interest expense by $7 million in 2008.
2012.
On December 31, 2010,2013, we had $1,011$733 million in long-term debt obligations that have fixed interest rates. $20 million was fixed through November 2014, $250Of that amount, $500 million is fixed through November 2015,December 2020, $225 million is fixed through August 2018 $500 million is fixed through December 2020 and the remainder is fixed from 20112014 through 2025. On January 7, 2011, we redeemed the remaining outstanding $20 million principal amount of our 85/8 percent senior subordinated notes plus accrued and unpaid interest. We also have $152$288 million in long-term debt obligations that are subject to variable interest rates. For more detailed explanations on our debt structure and senior credit facility refer to “Liquidity and Capital Resources — Capitalization” later in this Management’s Discussion and Analysis.
Income Taxes
We reported an income tax expense of $122 million for 2013. The tax expense recorded in 2013 includes a net tax benefit of $25 million primarily for tax adjustments primarily related to recognizing a U.S. tax benefit for foreign taxes and changes to prior year estimates. The U.S. tax benefit for foreign taxes is driven by our ability to claim a U.S. foreign tax credit beginning in 2013. The U.S. foreign tax credit regime provides for a credit against U.S. taxes otherwise payable for foreign taxes paid with regard to dividends, interest and royalties paid to us in the U.S. We reported an income tax expense of $19 million for 2012. The tax expense recorded in 2012 included the impact of the U.S. 2012 valuation allowance release and income generated in lower tax rate jurisdictions, partially offset by the impact of recording a valuation allowance against the tax benefit for tax credits and losses in certain foreign jurisdictions. Income tax expense was $69$88 million for 2010.2011. The tax expense recorded for 2010 differs from2011 included a statutory ratenet tax benefit of 35 percent due to tax charges of $23$7 million primarily related to U.S. taxable income with no associated tax expense due to our net operating loss carryforward and income generated in lower tax rate jurisdictions, partially offset by the impact of recording a valuation allowance against the tax benefit for losses in the U.S. and certain foreign jurisdictions and charges related to adjustments to prior year income taxes andon repatriation of foreign earnings.
In 2012, we reversed the tax contingencies, partially offset by income generated in lower tax rate jurisdictions. In 2009,valuation allowance that we recorded incomein 2008 against our net deferred tax expense of $13 million. Computed usingassets in the U.S. Federal statutorybased on operating improvements we had made, the outlook for light and commercial truck, off-highway and other vehicle production in the U.S. and the positive impact this should have on our U.S. operations. The net income impact of the tax rate of 35 percent, incomevaluation allowance release in the U.S. was a tax would be a benefit of $14approximately $81 million. Our federal net operating loss ("NOL") at December 31, 2013 totaled $37 million and expires in 2030. The differencestate NOLs expire in various tax years through 2032.
50
Valuation allowances have been established in certain foreign jurisdictions for deferred tax assets based on a “more likely than not” threshold. The ability to realize deferred tax assets depends on our ability to generate sufficient taxable income within the carryforward periods provided for in the tax law for each tax jurisdiction. We have considered the following possible sources of taxable income when assessing the realization of our deferred tax assets:
Future reversals of existing taxable temporary differences;
Taxable income or loss, based on recent results, exclusive of reversing temporary differences and carryforwards;
Tax-planning strategies; and
Taxable income in prior carryback years if carryback is due primarily topermitted under the relevant tax law.
The valuation allowances recorded against deferred tax assets generated by 2009taxable losses in the U.S. and in certain foreign countries which we cannot benefit, partially offset by adjustments to pastjurisdictions will impact our provision for income taxes until the valuation allowances are released. Our provision for deferredincome taxes will include no tax assets including a reversal of $20 million of U.S.benefit for losses incurred and no tax expense with respect to income generated in these jurisdictions until the respective valuation allowance based on the change in the fair value of a tax planning strategy. We reported income tax expense of $289 million in 2008 which included $244 million in tax charges primarily related to recording a valuation allowance against our U.S. deferred tax assets, repatriating cash from Brazil as a result of strong performance in South America over the past several years and changes in foreign tax rates.is eliminated.
Restructuring and Other Charges
Over the past several years, we have adopted plans to restructure portions of our operations. These plans were approved by our Board of Directors and were designed to reduce operational and administrative overhead costs throughout the business. Our Board of Directors approved a restructuring project in 2001, known as Project Genesis, which was designed to lower our fixed costs, relocate capacity, reduce our work force, improve efficiency and utilization, and better optimize our global footprint. We have subsequently engaged in various other restructuring projects related to Project Genesis. WeIn 2011, we incurred $40$8 million in restructuring and related costs, during 2008,primarily related to headcount reductions in Europe and Australia and the closure of our ride performance plant in Cozad, Nebraska, all of which $17was recorded in cost of sales. In 2012, we incurred $13 million in restructuring and related costs, primarily related to headcount reductions in South America and non-cash asset write downs of $4 million in Europe, of which $10 million was recorded in cost of sales and $23$3 million was recorded in selling, general, administrative and engineering expense.SG&A. In 2009,2013, we have incurred $21$78 million in restructuring and related costs, primarily related to European cost reduction efforts including non-cash asset write downs of $3 million, our exit from the distribution of aftermarket exhaust products and ending production of leaf springs in Australia, headcount reductions in various regions, and the net impact of freezing our defined benefit plans in the United Kingdom, of which $16$70 million was recorded in cost of sales, $6 million in SG&A, $1 million was recorded in selling, general, administrative and engineering expense and $4 million was recorded in depreciation and amortization expense.
54
Amounts related to activities that are part of our restructuring plans are as follows:
| December 31, | December 31, | |||||||||||||||||||
| 2009 | 2010 | Impact of | 2010 | |||||||||||||||||
| Restructuring | Cash | Exchange | Reserve | Restructuring | ||||||||||||||||
| Reserve | Payments | Rates | Adjustments | Reserve | ||||||||||||||||
| (Millions) | ||||||||||||||||||||
| Severance | $ | 15 | (7 | ) | — | (1 | ) | $ | 7 | |||||||||||
December 31, 2012 Restructuring Reserve | 2013 Expenses | 2013 Cash Payments | Impact of Exchange Rates | December 31, 2013 Restructuring Reserve | ||||||||||||
| (Millions) | ||||||||||||||||
| Employee Severance, Termination Benefits and Other Related Costs | $ | — | 75 | (32 | ) | 1 | $ | 44 | ||||||||
Under the terms of our amended and extended senior credit agreement, that took effect on June 3, 2010, we are allowed to exclude $60$80 million of cash charges and expenses, before taxes, related to cost reduction initiatives incurred after June 3, 2010March 22, 2012 from the calculation of the financial covenant ratios required under our senior credit facility. As of December 31, 2010,2013, we have excluded $9 million in cumulativeall allowable charges relating to restructuring initiatives against the $60$80 million available under the terms of the senior credit facility.
On September 22, 2009,January 31, 2013, we announced our intent to reduce structural costs in Europe by approximately $60 million annually, and anticipate related costs of approximately $120 million, which includes the closing of the Vittaryd facility in Sweden that we will be closing our original equipment ride control plantannounced in Cozad, Nebraska. We estimate this closing will generate $8September 2012 and a $7 million charge recorded in annualized cost savings once completed, incrementalthe fourth quarter of 2012 related to the $58impairment of certain assets in the European ride performance business. The $120 million of savingsanticipated costs includes approximately $20 million of non-cash asset write downs, the cost of relocating tooling, equipment and production to other facilities, severance and retention payments to employees and other costs related to these actions. Any plans affecting our October 2008 restructuring announcement.European hourly and salaried workforce would be subject to consultation with the relevant employee representatives. We expect the elimination of 500 positions at the Cozad plant and expect to record up to $21incurred $78 million in restructuring and related expenses,costs in 2013, of which $69 million was related to this initiative including $3 million for non-cash asset write downs. We expect that most of the remaining expense will be recorded in 2014, and that the Company will reach a full savings run rate in 2016. On September 5, 2013, we announced our intent to close our ride performance plant in Gijon, Spain and reduce the workforce at our ride performance plant in Sint-Truiden, Belgium. The actions are subject to consultation with the relevant employee representatives and in total would eliminate approximately $16 million represents cash expenditures.480 jobs in Western Europe while allowing the most efficient use of our capital assets and production capacity across the region. The actions in Sint-Truiden would transfer higher labor assemblies to other ride performance operations while focusing the Sint-Truiden plant on more highly automated, advanced component production and final assembly. We originally planned to haveconcluded the consultation period with employee representatives at Gijon without having reached agreement and on December 17, 2013 notified the Gijon workers' council that the Company is proceeding with the plant closure. Employee terminations at Gijon were completed the closing of this facility by the end of 2010, however, as a result2013. The workers' council filed suit challenging the decision to close the Gijon plant and the
51
local High Court of Justice of Asturias ruled in favor of the faster than expected increase in light vehicle production in North America and to better optimizeworkers' council. On February 25, 2014, we announced the transfer of someintention of the manufacturing activities, we planCompany to continue certainappeal that decision to the Supreme Court of Spain in Madrid. Negotiations with employee representatives at Sint-Truiden are continuing. Our estimate of total charges related to the actions at the Gijon and Sint-Truiden plants remains unchanged from what was announced previously. We expect to record charges of $63 million related to these actions, of which $60 million was recorded in 2013. The charges comprise $57 million of cash expenditures (which consist of severance and related payments to employees, the cost of relocating tooling, equipment and production lines through the first half of 2011. We plan to hire at other facilities as we move the production from Cozadand other costs related to those facilities, resulting in a net decrease of approximately 60 positions. During 2009 we recorded $11these actions) and $6 million of restructuring and related expenses related to this initiative. For the twelve months ended December 31, 2010 we recorded $10 million of restructuring and related expenses related to this initiative.non-cash asset write downs.
Earnings (Loss) Per Share
We reported net income attributable to Tenneco Inc. of $39$183 million or $0.63$2.97 per diluted common share for 2010.2013. Included in the results for 20102013 were negative impacts from expenses related to our restructuring activities, pension charges,which were partially offset by net tax benefits. The net impact of these items decreased earnings per diluted share by $0.81. We reported net income attributable to Tenneco Inc. of $275 million or $4.50 per diluted common share for 2012. Included in the results for 2012 were negative impacts from expenses related to our restructuring activities, an asset impairment charge and costs related to our refinancing activities, which were more than offset by the benefit from The Pullman Company property recoveries and net tax benefits which included the net impact of approximately $81 million or $1.33 per diluted common share related to the reversal of the tax valuation allowance on the Company’s U.S. net operating loss position in the third quarter. The net impact of these items increased earnings per diluted common share by $1.18. We reported net income attributable to Tenneco Inc. of $157 million or $2.55 per diluted common share for 2011. Included in the results for 2011 were negative impacts from expenses related to our restructuring activities, a goodwill impairment charge, costs related to our refinancing activities and tax adjustments. The net impact of these items decreased earnings per diluted share by $0.94. We reported a net loss of $73 million or $1.50 per diluted common share for 2009. Included in the results for 2009 were negative impacts from expenses related to our restructuring activities, an environmental reserve and tax adjustments. The net impact of these items decreased earnings per diluted share by $0.91. We reported a net loss of $415 million or $8.95 per diluted common share for 2008. Included in the results for 2008 were negative impacts from expenses related to our restructuring activities, new aftermarket customer changeover costs, a goodwill impairment charge and tax adjustments. The net impact of these items decreased earnings per diluted share by $9.37.$0.11.
Dividends on Common Stock
On January 10, 2001, our Board of Directors eliminated the quarterly dividend on our common stock. There are no current plans to reinstate a dividend on our common stock.
Cash Flows for 20102013 and 20092012
| Year Ended | ||||||||
| December 31, | ||||||||
| 2010 | 2009 | |||||||
| (Millions) | ||||||||
| Cash provided (used) by: | ||||||||
| Operating activities | $ | 244 | $ | 241 | ||||
| Investing activities | $ | (157 | ) | (119 | ) | |||
| Financing activities | $ | (30 | ) | (87 | ) | |||
Year Ended December 31, | |||||||
| 2013 | 2012 | ||||||
| (Millions) | |||||||
| Cash provided (used) by: | |||||||
| Operating activities | $ | 503 | $ | 365 | |||
| Investing activities | (266 | ) | (273 | ) | |||
| Financing activities | (175 | ) | (89 | ) | |||
Operating Activities
For 2010,2013, operating activities provided $244$503 million in cash compared to $241$365 million in cash provided during the same period last year. The increase was mainly from working capital improvement. For 2010,2013, cash provided from working capital was $77 million versus $76 million of cash used for working capital was $71 million versus $65 million of cash provided from working capital in 2009.2012. Receivables were a use of cash of $231$88 million in 2013 compared to a cash use of $8$9 million in the prior year. The change in cash flow from receivables was partially due to higheryear-over-year sales and a change in accounting in the first quarter of 2010. This accounting change requires that North America accounts receivable securitization programs be accounted for as secured borrowings rather than as a sale of accounts receivables. As a result, funding from the North America accounts receivable securitization program is included in net cash provided by financing activities on the statement of cash flows and was previously reflected in net cash used by operating activities. See “Liquidity and Capital Resources” below for further discussion of the accounting change. Inventory represented a cash outflowinflow of $122$3 million during 2010,2013, compared to a cash inflowoutflow of $101$72 million infor the prior year. Theyear-over-year changeAccounts payable provided cash of $161 million for the year ended December 31, 2013, compared to cash flow from inventory was primarily a resultprovided of higher OE production levels. The higher production environment also led to accounts payable providing cash of $238$12 million in 2010, compared to a use of cash of $2 million infor the prior year.year ended December 31, 2012. Cash taxes were $53$109 million for 20102013 compared to $38$80 million in the prior year.
56
Investing Activities
Cash used for investing activities was $38$7 million higherlower in 20102013 compared to the same period a year ago. Cash payments for plant, property and equipment were $151$244 million in 20102013 versus payments of $120$256 million in 2009, an increase2012, a decrease of $31$12 million. This increaseThe majority of spending was due to deferring discretionary projectssupport continued growth in 2009, the investmentsClean Air business. In 2012, cash of $7 million was used to acquire certain rights from Combustion Components Associates, Inc. primarily pertaining to clean air technology for new business launches, technology development and future growth opportunities.stationary reciprocating engine applications. Cash payments for software-related intangible assets were $12$25 million in 20102013 compared to $6$13 million in 2009.2012. Changes in restricted cash were a use of cash of $5 million in 2013.
Financing Activities
Cash flow from financing activities was an outflow of $30$175 million in 2010for the year ending December 31, 2013 compared to an outflow of $87$89 million for the year ending December 31, 2012. During 2013, we completed a previously announced stock buyback plan, repurchasing 550,000 shares of our outstanding common stock for $27 million, at an average price of $49.33 per
52
share. During 2012, we completed a previously announced stock buyback plan, repurchasing 600,000 shares of our outstanding common stock for $18 million, at an average price of $29.22 per share. In 2013, we paid $69 million to acquire the remaining 20 percent equity interest in Tenneco Tongtai (Dalian) Exhaust System Co. Ltd. ("TTEC"), our joint venture in Dalian, China, and an additional $9 million to the partner in lieu of receiving its pro-rata share of dividends owed from the joint venture. As a result of this purchase, TTEC is now a wholly owned indirectly subsidiary of Tenneco. Borrowings under our revolving credit facility were $58 million at December 31, 2013 versus $92 million at December 31, 2012. In 2012, refinancing activities included retiring certain of our 8 1/8 percent senior notes due in 2015 and the $148 million Tranche B Term Facility, adding a new $250 million Tranche A Term Facility and increasing the amount and extending the maturity date of our revolving credit facility. At December 31, 2013, there was $10 million borrowed under the North American accounts receivable securitization programs, whereas at December 31, 2012, there was $50 million outstanding.
Cash Flows for 2012 and 2011
Year Ended December 31, | |||||||
| 2012 | 2011 | ||||||
| (Millions) | |||||||
| Cash provided (used) by: | |||||||
| Operating activities | $ | 365 | $ | 245 | |||
| Investing activities | (273 | ) | (224 | ) | |||
| Financing activities | (89 | ) | (26 | ) | |||
Operating Activities
For 2012, operating activities provided $365 million in 2009.cash compared to $245 million in cash provided during 2011. For 2012, cash used for working capital was $76 million versus $130 million of cash used for working capital in 2011. Receivables were a use of cash of $9 million in 2012 compared to a cash use of $183 million in 2011. Inventory represented a cash outflow of $72 million during 2012, compared to a cash outflow of $64 million for 2011. Accounts payable provided cash of $12 million for the year ended December 31, 2012, compared to cash provided of $144 million for the year ended December 31, 2011. Cash taxes were $80 million for 2012 compared to $85 million in 2011.
Investing Activities
Cash used for investing activities was $49 million higher in 2012 compared to 2011. Cash payments for plant, property and equipment were $256 million in 2012 versus payments of $213 million in 2011, an increase of $43 million. The 2010 outflow was primarily due to debt issuance costs relatedmajority of the spending went to our refinancing activities. WeEurope and North America OE businesses to support new light vehicle, commercial truck, and off-highway program launches, and in China to accommodate new programs and new customers. In 2012, cash of $7 million was used $188to acquire certain rights from Combustion Components Associates, Inc. primarily pertaining to clean air technology for stationary reciprocating engine applications. Cash payments for software-related intangible assets were $13 million in net proceeds2012 compared to $15 million in 2011.
Financing Activities
Cash flow from financing activities was an outflow of $89 million for the year ending December 31, 2012 compared to an outflow of $26 million for the year ending December 31, 2011. During 2012, we completed a previously announced stock buyback plan, repurchasing 600,000 shares of our outstanding common stock offeringfor $18 million, at an average price of $29.22 per share. In 2011, we completed a previously announced stock buyback plan, repurchasing 400,000 shares of our outstanding common stock for $16 million, at an average price of $39.84 per share. In 2012, refinancing activities included retiring certain of our 8 1/8 percent senior notes due in 2009 to pay down debt, primarily borrowings against2015 and the $148 million Tranche B Term Facility, adding a new $250 million Tranche A Term Facility and increasing the amount and extending the maturity date of our revolving credit facility. We also paid $4 million to secure the remaining 25 percent interest in our clean air joint venture in Thailand, now wholly-owned, during 2011. We ended 20102012 and 2011 with no$92 million and $24 million, respectively, in borrowings under our revolving credit facility. As mentioned above in the “Operating Activities” section of this cash flow discussion, cash flow from financing activities was impacted by the accounting change for the way we account for our North American accounts receivable securitization programs. At December 31, 2010,2011, there were no borrowings outstanding under the North American accounts receivable securitization programs.
| Year Ended | ||||||||
| December 31, | ||||||||
| 2009 | 2008 | |||||||
| (Millions) | ||||||||
| Cash provided (used) by: | ||||||||
| Operating activities | $ | 241 | $ | 160 | ||||
| Investing activities | (119 | ) | (261 | ) | ||||
| Financing activities | (87 | ) | (58 | ) | ||||
Outlook
First Quarter 2014
In certain instances severalthe first quarter of our Chinese subsidiaries receive payment from OE customers and satisfy vendor payments through the receipt and delivery of negotiable financial instruments. Financial instruments used to satisfy vendor payables and not redeemed totaled $15 million and $6 million at December 31, 2009 and 2008, respectively, and were classified as notes payable. Financial instruments received from OE
57
53
We used the $188 million in net proceedsexpect revenue from our common stock offeringcommercial truck and off-highway customers in the fourthfirst quarter of 2009 to pay down debt, primarily borrowings against our revolving credit facility. We ended 2009 with no borrowings under our revolving credit facility.
We expect our global original equipmentaftermarket revenue in the first quarter to remain at the strong levels achieved in the first quarter of 2013.
Full Year 2014
In 2014, we expect our total OE revenue will increase between seven percent and 11 percent including both light vehicle, and commercial truck and off-highway revenue growth.
Our 2014 OE light vehicle revenue is expected to grow at a slightly higher rate than overall global industry production, which according to IHS Automotive is forecasted to increase 5% in the regions where we operate. This includes IHS estimates of year-over-year increases in North America (four percent), Europe (one percent), China (10 percent), South America (two percent) and India (six percent). Our light vehicle OE revenue growth will be driven by leveraging higher industry production volumes with a strong position on top-selling platforms and with customers globally; light vehicle program launches including new technology content; and the ramp-up of volumes on platforms launched in 2013.
We anticipate our 2014 commercial truck and off-highway revenue will increase in the range of 20 percent to between $9.5 billion30 percent despite the expectation that overall, our commercial truck and $11 billionoff-highway markets will see relatively flat volumes in 2014. Our revenue growth will be driven primarily by 2015, with substrate sales comprising 32 percent of total OE revenue.
We expect our global aftermarket business to help customers meet newcontinue to be a stable contributor to our revenue performance in 2014.
Looking forward, we expect significant revenue growth over the next five years, largely driven by increasingly stringent global emissions regulations for on-roadlight vehicles and non-road commercial vehicles. We beganmarkets. Our OE light vehicle revenue is expected to launch some of these programs in China at the end of 2009 with China National Heavy Truck Company, Shanghai Diesel Engine Company and Weichai Power. Programs in North America, Europe and South America primarily began to launch in the second half of 2010. Our commercial vehicle emission control customers also include Caterpillar, John Deere, Navistar, FAW, Deutz and Guangxi Yuchai Machinery Company as well as four customers who will be announced as programs launch. We will also be supplying diesel aftertreatment systems, including selective catalytic reduction, for next generation heavy-dutypick-up trucks in North America. Based on the current commercialoutpace global industry light vehicle production forecasts mentioned above,as we project thatleverage our strong position on platforms, across geographic regions and with leading customers worldwide. In addition, we anticipate our strong book of business with commercial truck and specialty vehicleoff-highway manufacturers will support further revenue to be
58
10 percent.
The revenue estimates presented in this “Outlook” are based on volume projections summarized in the following chartprojected customer production schedules, IHS Automotive and onPower Systems Research forecasts as of January 2014; original equipment manufacturers’ programs that have been formally awarded to the company;us; programs where the company iswe are highly confident that itwe will be awarded business based on informal customer indications consistent with past practices; our status as supplier for the existing programs and our relationships and experience with the customer;our customers; and the actual original equipment revenues achieved by the companyus for each of the last several years compared to the amount of those revenues that the companywe estimated itwe would generate at the beginning of each year. OurThe revenue estimates are subject to increase or decrease due to changes in customer requirements, customeralso based on anticipated vehicle production levels and consumer preferences,pricing, including precious metals pricing and the numberimpact of vehicles actually produced by our customers. We update these estimates annually. In the interim we do not intend to otherwise update the estimates to reflect future changes in these assumptions. In addition, our revenue estimate is based on our anticipated pricing for each applicable program over its life. However, we are under continuing pricing pressures from our OE customers. We do not intend to update the amounts shown above for any pricematerial cost changes. Finally, for our foreign operations, our revenue estimate assumes fixed foreign currency values relative to the U.S. dollar. These values are used to translate foreign revenues to the U.S. dollar. Although such currency values are subject to fluctuations based on the economic conditions in each of our foreign operations, we do not intend to update the annual revenue estimates shown above due to these fluctuations. For example, currency is assumed to be constant at $1.33 per Euro throughout our projection. We plan to update our revenue guidance during the first quarter of 2015. See “Cautionary Statement for Purposes of the ‘Safe Harbor’ Provisions of the Private Securities Litigation Reform Act of 1995” and Item 1A, “Risk Factors”.
| 2010A | 2011 | 2012 | 2015 | |||||||||||||
| (Number of Vehicles in Millions) | ||||||||||||||||
| North America | 11.9 | 12.7 | 13.9 | 16.6 | ||||||||||||
| Europe | 19.3 | 19.8 | 20.6 | 23.2 | ||||||||||||
| China | 16.8 | 18.0 | 19.9 | 24.3 | ||||||||||||
| South America | 4.0 | 4.5 | 4.6 | 5.4 | ||||||||||||
| 2010A | 2011 | 2012 | 2015 | |||||||||||||
| (Number of Vehicles in Thousands) | ||||||||||||||||
| North America | 270 | 360 | 468 | 439 | ||||||||||||
| Europe | 387 | 499 | 643 | 708 | ||||||||||||
| China | 1,116 | 1,002 | 1,029 | 1,077 | ||||||||||||
| Brazil | 176 | 188 | 161 | 185 | ||||||||||||
| 2010A | 2011 | 2012 | 2015 | |||||||||||||
| (Number of Vehicles in Thousands) | ||||||||||||||||
U.S. (³25hp) | 198 | 210 | 229 | 266 | ||||||||||||
Europe (³50hp) | 369 | 390 | 421 | 470 | ||||||||||||
We expect our capital expenditures for 20112014 to be approximately $190between $275 million to $210 million. We expectand $300 million, our 20112014 interest expense to be about $105$80 million, our 2014 cash taxes to be between $190 million and $210 million and our 2011 cash taxes2014 tax rate to rangebe between $75 million36 percent and $90 million.38 percent.
Liquidity and Capital Resources
Capitalization
54
Year Ended December 31, | % Change | |||||||||
| 2013 | 2012 | |||||||||
| (Millions) | ||||||||||
| Short-term debt and maturities classified as current | $ | 83 | $ | 113 | (27 | )% | ||||
| Long-term debt | 1,019 | 1,067 | (4 | ) | ||||||
| Total debt | 1,102 | 1,180 | (7 | ) | ||||||
| Total redeemable noncontrolling interests | 20 | 15 | 33 | |||||||
| Total noncontrolling interests | 39 | 45 | (13 | ) | ||||||
| Tenneco Inc. shareholders’ equity | 433 | 246 | 76 | |||||||
| Total equity | 472 | 291 | 62 | |||||||
| Total capitalization | $ | 1,594 | $ | 1,486 | 7 | % | ||||
| Year Ended | ||||||||||||
| December 31, | ||||||||||||
| 2010 | 2009 | % Change | ||||||||||
| (Millions) | ||||||||||||
| Short-term debt and maturities classified as current | $ | 63 | $ | 75 | (16 | )% | ||||||
| Long-term debt | 1,160 | 1,145 | 1 | |||||||||
| Total debt | 1,223 | 1,220 | — | |||||||||
| Total redeemable noncontrolling interests | 12 | 7 | 71 | |||||||||
| Total noncontrolling interests | 39 | 32 | 22 | |||||||||
| Tenneco Inc. shareholders’ equity | (4 | ) | (21 | ) | 81 | |||||||
| Total equity | 35 | 11 | 218 | |||||||||
| Total capitalization | $ | 1,270 | $ | 1,238 | (3 | ) | ||||||
General. Short-term debt, which includes maturities classified as current, borrowings by parent company and foreign subsidiaries, and borrowings by foreign subsidiaries, was $63under our North American accounts receivable securitization program, were $83 million and $75$113 million as of December 31, 20102013 and 2009,December 31, 2012, respectively. We had no borrowings outstandingBorrowings under our revolving credit facilities, which would otherwise beare classified as long-term debt, as ofwere $58 million and $92 million at December 31, 20102013 and 2009,December 31, 2012, respectively.
The2010 2013 year-to-date increase in totalTenneco Inc. shareholders' equity primarily resulted from net income attributable to Tenneco Inc. of $39$183 million, a $14$85 million increase related to pension and postretirement benefits, a $51 million increase in premium on common stock and other capital surplus relating to common stock issued pursuant to benefit plans, partially offset by a $24 $27 million increase in treasury stock as a result of purchases of common stock under our share purchase program, a $68 million decrease in premium on common stock and other capital surplus relating to purchase of noncontrolling equity interest in the Tenneco Tongtai (Dalian) Exhaust System Co., Ltd. (TTEC) joint venture investment in China and a $37 million decrease caused by the impact of changes in foreign exchange rates on the translation of financial statements of our foreign subsidiaries into U.S. dollars, a net decrease in premium on common stock and other capital surplus relating to a $11 million purchase of an additional 20 percent of equity interest from a Chinese noncontrolling joint venture partner and a $1 million decrease in additional liability for pension and postretirement benefits.dollars.
Overview. Our financing arrangements are primarily provided by a committed senior secured financing arrangement with a syndicate of banks and other financial institutions. The arrangement is secured by substantially all our domestic assets and pledges of up to 66 percent of the stock of certain first-tier foreign subsidiaries, as well as guarantees by our material domestic subsidiaries.
On June 3, 2010March 22, 2012, we completed an amendment and extensionrestatement of our senior secured credit facility by increasing the amount and extending the termmaturity date of our revolving credit facility and replacingadding a new Tranche A Term Facility. The amended and restated facility replaces our $128former $556 million termrevolving credit facility, $148 million Tranche B Term Facility and $130 million Tranche B-1 letter of credit/revolving loan A with a largerfacility. The proceeds from this refinancing transaction were used to repay our $148 million Tranche B Term Facility and longer maturity term loan B facility.to fund the purchase and redemption of our $250 million 8 1/8 percent senior notes due in 2015. As a result of the amendment and extension, as of December 31, 2010,2013, the senior credit facility provides us with a total revolving credit facility size of $622$850 million until March 16, 2012, when commitmentsand a $228 million Tranche A Term Facility, both of $66 million will expire. After March 16, 2012, the extended revolving credit facility will provide $556 million of revolving credit andwhich will mature on May 31, 2014. The extended facility will mature earlier on December 15, 2013, if our $130 milliontranche B-1 letter of credit/revolving loan facility is not refinanced by that date. Prior to maturity, fundsMarch 22, 2017. Funds may be borrowed, repaid and re-borrowed under the two revolving credit facilitiesfacility without premium or penalty. The leverage ratio (consolidated indebtedness net of cash divided by consolidated EBITDA as defined in the seniorrevolving credit facility agreement) was decreased from 5.00 to 4.50 for the second quarter of 2010; from 4.75 to 4.25 for the third quarter of 2010; and from 4.50 to 4.25 for the fourth quarter of 2010 as a result of the June 3, 2010 amendment.
60
On March 8, 2012, we announced a cash tender offer to purchase our outstanding $250 million 8 1/8 percent senior notes due in 2015 and a solicitation of consents to certain proposed amendments to the indenture governing these notes. We received tenders and consents representing $232 million aggregate principal amount of the notes and, on March 22, 2012, we purchased the tendered notes at a price of 104.44 percent of the principal amount (which includes a consent payment of three percent of the principal amount), plus accrued and unpaid interest, and amended the related indenture. On April 6, 2012, we redeemed the remaining outstanding $18 million aggregate principal amount of senior notes that were not purchased pursuant to the tender offer at a price of 104.06 percent of the principal amount, plus accrued and unpaid interest. The additional liquidity provided by the lendersnew $850 million revolving credit facility and not borrowed by the Company earn interest atnew $250 million Tranche A Term Facility was used to fund the total cost of the tender offer and redemption, including all related fees and expenses.
55
We recorded $17 million of pre-tax charges in March 2012 related to the refinancing of our senior credit facility, the repurchase and redemption of $232 million aggregate principal amount of our 8 1/8 percent senior notes due in 2015 and the write-off of deferred debt issuance costs relating to these senior notes. We recorded an annual rate approximately equaladditional $1 million of pre-tax charges during the second quarter of 2012 relating to LIBOR less 25 basis points.the redemption of the remaining $18 million aggregate principal amount of our 8 1/8 percent senior notes which occurred in April 2012.
At December 31, 2013, of the $850 million available under the revolving credit facility, we had unused borrowing capacity of $755 million with $58 million in outstanding borrowings and $37 million in outstanding letters of credit. As of December 31, 2013, our outstanding debt also included $228 million related to our Tranche A Term Facility due March 22, 2017, $225 million of 7 3/4 percent senior notes due August 15, 2018, $500 million of 6 7/8 percent senior notes due December 15, 2020, and $91 million of other debt.
Senior Credit Facility — Interest Rates and Fees.Beginning June 3, 2010March 22, 2012, our term loan BTranche A Term Facility and revolving credit facility bear interest at an annual rate equal to, at our option, either (i) the London Interbank Offered Rate (“LIBOR”) plus a margin of 475 and 450 basis points, respectively, or (ii) a rate consisting of the greater of (a) the JPMorgan Chase prime rate plus a margin of 375 and 350 basis points, respectively, (b) the Federal Funds rate plus 50 basis points plus a margin of 375 and 350 basis points, respectively, and (c) the Eurodollar Rate plus 100 basis points plus a margin of 375 and 350 basis points, respectively. The margin we pay on these borrowings will be reduced by 25 basis points following each fiscal quarter for which our consolidated net leverage ratio is less than 2.25 for extending lenders and for the term loan B and will be further reduced by an additional 25 basis points following each fiscal quarter for which the consolidated net leverage ratio is less than 2.0 for extending lenders. The margin we pay on these borrowings for extending lenders will increase by 50 basis points following each fiscal quarter for which our consolidated net leverage ratio is greater than or equal to 4.0 and will be further increased by an additional 50 basis points following each fiscal quarter for which the consolidated net leverage ratio is greater than or equal to 5.0. Our consolidated net leverage ratio was 2.24 as of December 31, 2010. Accordingly, in March of 2011 the margin we pay on these borrowings will be reduced by 25 basis points for extending lenders and will remain at such level for so long as our consolidated net leverage ratio remains below 2.25 and greater than or equal to 2.0.
61
| 12/24/2008 | 2/23/2009 | 3/2/2009 | 5/15/2009 | 8/14/2009 | 3/1/2010 | |||||||||||||||||||||||
| thru | thru | thru | thru | thru | thru | Beginning | ||||||||||||||||||||||
| 2/22/2009 | 3/1/2009 | 5/14/2009 | 8/13/2009 | 2/28/2010 | 6/2/2010 | 6/3/2010 | ||||||||||||||||||||||
| Applicable Margin over LIBOR for Revolving Loans | 3.00 | % | 5.50 | % | 4.50 | % | 5.00 | % | 5.50 | % | 4.50 | % | 4.50 | % | ||||||||||||||
| Applicable Margin over LIBOR for Term Loan B Loans | — | — | — | — | — | — | 4.75 | % | ||||||||||||||||||||
| Applicable Margin over LIBOR for Term Loan A Loans | 3.00 | % | 5.50 | % | 4.50 | % | 5.00 | % | 5.50 | % | 4.50 | % | — | |||||||||||||||
Applicable Margin over LIBOR forTranche B-1 Loans | 3.00 | % | 5.50 | % | 5.00 | % | 5.00 | % | 5.50 | % | 5.00 | % | 5.00 | % | ||||||||||||||
| Applicable Margin over Prime-based Loans | 2.00 | % | 4.50 | % | 3.50 | % | 4.00 | % | 4.50 | % | 3.50 | % | — | |||||||||||||||
| Applicable Margin over Prime for Revolving Loans | — | — | — | — | — | — | 3.50 | % | ||||||||||||||||||||
| Applicable Margin over Prime for Term Loan B Loans | — | — | — | — | — | — | 3.75 | % | ||||||||||||||||||||
Applicable Margin over Prime forTranche B-1 Loans | — | — | — | — | — | — | 4.00 | % | ||||||||||||||||||||
| Applicable Margin over Federal Funds for Revolving Loans | — | — | — | — | — | — | 3.50 | % | ||||||||||||||||||||
| Applicable Margin over Federal Funds for Term Loan B Loans | — | — | — | — | — | — | 3.75 | % | ||||||||||||||||||||
Applicable Margin over Federal Funds forTranche B-1 Loans | 2.50 | % | 5.00 | % | 4.00 | % | 4.50 | % | 5.00 | % | 4.00 | % | 4.00 | % | ||||||||||||||
| Commitment Fee | 0.50 | % | 0.75 | % | 0.50 | % | 0.50 | % | 0.75 | % | 0.50 | % | 0.75 | % | ||||||||||||||
Senior Credit Facility — Other Terms and Conditions. Our senior credit facility requires that we maintain financial ratios equal to or better than the following consolidated net leverage ratio (consolidated indebtedness net of cash divided by consolidated EBITDA, as defined in the senior credit facility agreement), and consolidated interest coverage ratio (consolidated EBITDA divided by consolidated interest expense, as
62
defined under the senior credit facility agreement) at the end of each period indicated. Failure to maintain these ratios will result in a default under our senior credit facility. The financial ratios required under the amended and restated senior credit facility and the actual ratios we achieved for the four quarters of 2010,2013, are as follows:
| Quarter Ended | ||||||||||||||||||||||||||||||||
| March 31, | June 30, | September 30, | December 31, | |||||||||||||||||||||||||||||
| 2010 | 2010 | 2010 | 2010 | |||||||||||||||||||||||||||||
| Req. | Act. | Req. | Act. | Req. | Act. | Req. | Act. | |||||||||||||||||||||||||
| Leverage Ratio (maximum) | 5.50 | 2.77 | 4.50 | 2.42 | 4.25 | 2.41 | 4.25 | 2.24 | ||||||||||||||||||||||||
| Interest Coverage Ratio (minimum) | 2.00 | 3.04 | 2.25 | 3.70 | 2.30 | 3.97 | 2.35 | 3.99 | ||||||||||||||||||||||||
| Quarter Ended | |||||||||||||||||||||||
March 31, 2013 | June 30, 2013 | September 30, 2013 | December 31, 2013 | ||||||||||||||||||||
| Req. | Act. | Req. | Act. | Req. | Act. | Req. | Act. | ||||||||||||||||
| Leverage Ratio (maximum) | 3.50 | 1.98 | 3.50 | 1.79 | 3.50 | 1.86 | 3.50 | 1.39 | |||||||||||||||
| Interest Coverage Ratio (minimum) | 2.55 | 8.39 | 2.55 | 8.74 | 2.55 | 9.09 | 2.55 | 9.89 | |||||||||||||||
The financial ratios required under the senior credit facility for 2011includes a maximum leverage ratio covenant of 3.50 through March 22, 2017 and beyond are set forth below.
| Interest | ||||||||
| Leverage | Coverage | |||||||
Period Ending | Ratio | Ratio | ||||||
| March 31, 2011 | 4.00 | 2.55 | ||||||
| June 30, 2011 | 3.75 | 2.55 | ||||||
| September 30, 2011 | 3.50 | 2.55 | ||||||
| December 31, 2011 | 3.50 | 2.55 | ||||||
| Each quarter thereafter | 3.50 | 2.75 | ||||||
a minimum interest coverage ratio of 2.55 through December 31, 2013 and 2.75 thereafter, through March 22, 2017.
The covenants in our senior credit facility agreement generally prohibit us from repaying or refinancing our senior notes. So long as no default existed, we would, however, under our senior credit facility agreement, be permitted to repay or refinance our senior notes:notes (i) with the net cash proceeds of incremental facilities and permitted refinancing indebtedness (as defined in the senior credit facility agreement)agreement or with the net cash proceeds of our common stock); (ii) with the net cash proceeds fromof the saleincremental facilities (as defined in the senior credit facility agreement); (iii) with the net cash proceeds of sharesthe revolving loans (as defined in the senior credit facility agreement); (iv) with the cash generated by our operations; (v) in an amount equal to the net cash proceeds of our common stock; (iii)qualified capital stock (as defined in the senior credit facility agreement) issued by us after March 22, 2012; and (vi) in exchange for permitted refinancing indebtedness or in exchange for shares of our common stock; (iv) with the net cash proceeds of any new senior or subordinated unsecured indebtedness; (v) with the proceeds of revolving credit loans (as defined in the senior credit facility agreement); (vi) with the cash generated by the operations of the company; and (vii) in an amount equal to the sum of (A) the net cash proceeds of qualified stock issued by the Company after March 16, 2007, plus (B) the portion of annual excess cash flow (beginning with excess cash flow for fiscal year 2010) not required to be applied to payment of the credit facilities and which is not used for other purposes, provided that the aggregate principal amount of senior notes purchased and cancelled or redeemed pursuant to clauses (v), (vi) and (vii), issuch purchases are capped as follows based(with respect to clauses (iii), (iv) and (v) on thea pro forma consolidated leverage ratio after giving effect to such purchase, cancellation or redemption:redemption):
| Aggregate Senior | ||||
| Note Maximum | ||||
Proforma Consolidated Leverage Ratio | Amount | |||
| (Millions) | ||||
| Greater than or equal to 3.0x | $ | 20 | ||
| Greater than or equal to 2.5x | $ | 100 | ||
| Less than 2.5x | $ | 125 | ||
| Pro forma Consolidated Leverage Ratio | Aggregate Senior Note Maximum Amount | ||
| (Millions) | |||
| Greater than or equal to 3.0x | $ | 20 | |
| Greater than or equal to 2.5x | $ | 100 | |
| Greater than or equal to 2.0x | $ | 200 | |
| Less than 2.0x | no limit | ||
56
Although the senior credit facility agreement would permit us to repay or refinance our senior notes under the conditions described above, any repayment or refinancing of our outstanding notes would be subject to market conditions and either the voluntary participation of noteholdersnote holders or our ability to redeem the notes under the terms of the applicable note indenture. For example, while the senior credit agreement would allow us to repay our outstanding notes via a direct exchange of the notes for either permitted refinancing indebtedness or for shares of our common stock, we do not, under the terms of the agreements governing our outstanding notes, have the right to refinance the notes via any type of direct exchange.
The senior credit facility agreement also contains other restrictions on our operations that are customary for similar facilities, including limitations on: (i) incurring additional liens; (ii) sale and leaseback transactions (except for the permitted transactions as described in the senior credit facility agreement); (iii) liquidations and dissolutions; (iv) incurring additional indebtedness or guarantees; (v) investments and acquisitions;
63
(vi) dividends and share repurchases; (vii) mergers and consolidations; and (viii) refinancing of the senior notes. Compliance with these requirements and restrictions is a condition for any incremental borrowings under the senior credit facility agreement and failure to meet these requirements enables the lenders to require repayment of any outstanding loans.
As of December 31, 2010,2013, we were in compliance with all the financial covenants and operational restrictions of the senior credit facility. Our senior credit facility does not contain any terms that could accelerate payment of the facility or affect pricing under the facility as a result of a credit rating agency downgrade.
Senior and Subordinated Notes.As of December 31, 2010,2013, our outstanding debt also includes $20 million of 85/8 percent senior subordindated notes due January 7, 2011, $250 million of 81/8 percent senior notes due November 15, 2015,included $225 million of 73/4 percent senior notes due August 15, 2018 and $500 million of 67/8 percent senior notes due December 15, 2020. Under the indentures governing the notes, we are permitted to redeem some or all of the remaining senior notes at specified prices that decline to par over a specified period at any time on and after NovemberAugust 15, 2011 in the case of the senior notes due 2015, August 14, 2014 in the case of the senior notes due 2018, and December 15, 2015 in the case of the senior notes due 2020. On January 7, 2011, weIn addition, prior to such dates the notes may also be redeemed all remaining senior subordinated notes at a price of 102.875generally equal to 100 percent of the principal amount thereof plus accrued and unpaid interest.a premium based on the present values of the remaining payments due to the note holders. If we sell certain of our assets or experience specified kinds of changes in control, we must offer to repurchase the notes. Under the indentures governing the notes we are permitted to redeem up to 35due 2018 and 2020 at 101 percent of the senior notes due 2018, with the proceeds of certain equity offerings completed before August 13, 2013principal amount thereof plus accrued and up to 35 percent of the senior notes due 2020, with the proceeds of certain equity offerings completed before December 15, 2013.
unpaid interest.
Our senior notes require that, as a condition precedent to incurring certain types of indebtedness not otherwise permitted, our consolidated fixed charge coverage ratio, as calculated on a pro forma basis, be greater than 2.00. The indentures also contain restrictions on our operations, including limitations on: (i) incurring additional indebtedness or liens; (ii) dividends; (iii) distributions and stock repurchases; (iv) investments; (v) asset sales and (vi) mergers and consolidations. Subject to limited exceptions, all of our existing and future material domestic wholly owned subsidiaries fully and unconditionally guarantee these notes on a joint and several basis. There are no significant restrictions on the ability of the subsidiaries that have guaranteed these notes to make distributions to us. As of December 31, 2010,2013, we were in compliance with the covenants and restrictions of these indentures.
Accounts Receivable Securitization. We also securitize some of our accounts receivable on a limited recourse basis in North America and Europe. As servicer under these accounts receivable securitization programs, we are responsible for performing all accounts receivable administration functions for these securitized financial assets including collections and processing of customer invoice adjustments. In North America, we have an accounts receivable securitization program with three commercial banks.banks comprised of a first priority facility and a second priority facility. We securitize original equipment and aftermarket receivables on a daily basis under the bank program. We had no outstanding third party investments in our securitized accounts receivable bank program as of December 31, 2010 and $62 million at December 31, 2009. In February 2010,March 2013, the North American program was amended and extended to February 18, 2011, at a maximumMarch 21, 2014. The first priority facility sizecontinues to provide financing of $100 million. As part of this renewal,up to $110 million and the margin we pay to our banks decreased. In March 2010, the North American program was further amended to extend the revolving terms of the program to March 25, 2011, add an additional bank and increase the available financing under the facility by $10 million to a new maximum of $110 million. In addition, we added a second priority facility, which is subordinated to the North American program, which providesfirst priority facility, continues to provide up to an additional $40 million of financing againstfinancing. Both facilities monetize accounts receivable generated in the U.S. and Canada that meet certain eligibility requirements. The second priority facility also monetizes certain accounts receivable generated in the U.S. or Canada that would otherwise be ineligible under the existingfirst priority securitization facility. This new second priority facility also expires on March 25, 2011,The amount of outstanding third-party investments in our securitized accounts receivable under the North American program was $10 million at December 31, 2013 and is subordinated to the existing securitization facility.
$50 million at December 31, 2012.
Each facility contains customary covenants for financings of this type, including restrictions related to liens, payments, mergers or consolidationconsolidations and amendments to the agreements underlying the receivables pool. Further, each facility may be terminated upon the occurrence of customary events (with customary grace periods, if applicable), including breaches of covenants, failure to maintain certain financial ratios, inaccuracies of representations and warranties, bankruptcy and insolvency events, certain changes in the rate of default or delinquency of the receivables, a change of control and the entry or other enforcement of material judgments. In addition, each facility contains cross-default provisions, where the facility could be terminated in the event
64
of non-payment of other material indebtedness when due and any other event which permits the acceleration of the maturity of material indebtedness.
We also securitize receivables in our European operations with regional banks in Europe. The amount of outstanding third party investments in our securitized accounts receivable in Europe was $91 million and $75 million at December 31, 2010 and December 31, 2009, respectively. The arrangements to securitize receivables in Europe are provided under sevensix separate facilities provided by various financial institutions in each of the foreign
57
jurisdictions. The commitments for these arrangements are generally for one year, but some may be cancelled with notice 90 days prior to renewal. In some instances, the arrangement provides for cancellation by the applicable financial institution at any time upon 15 days, or less, notification.
The amount of outstanding third-party investments in our securitized accounts receivable in Europe was $134 million and $94 million at December 31, 2013 and December 31, 2012, respectively.
If we were not able to securitize receivables under either the North American or European securitization programs, our borrowings under our revolving credit agreementsagreement might increase. These accounts receivable securitization programs provide us with access to cash at costs that are generally favorable to alternative sources of financing, and allow us to reduce borrowings under our revolving credit agreements.agreement.
Negotiable Financial Instruments. One of our European subsidiaries receives payment from one of its customers whereby the accounts receivable are satisfied through the delivery of negotiable financial instruments. We may collect these financial instruments before their maturity date by either selling them at a discount or using them to satisfy accounts receivable that have previously been sold to a European bank. Any of these financial instruments which are not sold are classified as other current assets. The impactamount of the new accounting rules on our consolidatedthese financial statements includes an increase of $4instruments that was collected before their maturity date and sold at a discount totaled $5 million in interest expense and a corresponding decrease in loss on sale of receivables on our income statement in 2010. In 2010, there was no cash flow impact as a result of the new accounting rules. Funding levels provided$6 million at December 31, 2013 and December 31, 2012, respectively. No negotiable financial instruments were held by our European securitization programs continue to be reflected as a change in receivables and included in net cash provided (used) by operating activities as under the previous accounting rules. Had the new accounting rules been in effect prior to 2010, reported receivables and short-term debt would both have been $62 million highersubsidiary as of December 31, 2009. The loss on sale2013 and December 31, 2012, respectively.
In certain instances, several of receivables would have been $5our Chinese subsidiaries receive payment from customers and satisfy vendor payments through the receipt and delivery of negotiable financial instruments. Financial instruments issued to satisfy vendor payables and not redeemed totaled $13 million lower, offset and $12 million at December 31, 2013 and December 31, 2012, respectively, and were classified as notes payable. Financial instruments received from OE customers and not redeemed totaled $12 million and $8 million at December 31, 2013 and December 31, 2012, respectively. We classify financial instruments received from our customers as other current assets if issued by a corresponding $5financial institution of our customers or as customer notes and accounts if issued by our customer. We classified $12 million increase and $8 million in other current assets at December 31, 2013 and December 31, 2012, respectively. Some of our Chinese subsidiaries that issue their own negotiable financial instruments to interest expensepay vendors are required to maintain a cash balance if they exceed certain credit limits with the financial institution that guarantees those financial instruments. A restricted cash balance was not required at those Chinese subsidiaries at December 31, 2013 and December 31, 2012.
The negotiable financial instruments received by one of our European subsidiaries and some of our Chinese subsidiaries are checks drawn by our customers and guaranteed by their banks that are payable at a future date. The use of these instruments for 2009. The loss on salespayment follows local commercial practice. Because negotiable financial instruments are financial obligations of receivables would have been $4 millionour customers and are guaranteed by our customers’ banks, we believe they represent a lower offsetfinancial risk than the outstanding accounts receivable that they satisfy which are not guaranteed by a corresponding $4bank.
Supply Chain Financing. Near the end of the second quarter of 2013 certain of our suppliers in the U.S. extended their payment terms to Tenneco. The liquidity benefit to Tenneco from the extended payment terms totaled $10 million increaseat December 31, 2013. These suppliers also began participating in a supply chain financing program under which they securitize their accounts receivables from Tenneco with two financial institutions. The financial institutions participate in the supply chain financing program on an uncommitted basis and can cease purchasing receivables from Tenneco's suppliers at any time. If the financial institutions did not continue to interest expense for 2008. Additionally,purchase receivables from Tenneco's suppliers under this program, the participating vendors could reduce their payment terms to Tenneco which in turn would cause our cash provided (used) by operations would have decreased by $62 million with a corresponding increase in cash provided by financing activities for the same amount for 2009.borrowings under our revolving credit facility to increase.
Capital Requirements. We believe that cash flows from operations, combined with our cash on hand, subject to any applicable withholding taxes upon repatriation of cash balances from our foreign operations, and available borrowing capacity described above, assuming that we maintain compliance with the financial covenants and other requirements of our loan agreement, will be sufficient to meet our future capital requirements, including debt amortization, capital expenditures, pension contributions, and other operational
65
requirements, for the following year. Our ability to meet the financial covenants depends
58
upon a number of operational and economic factors, many of which are beyond our control. In the event that we are unable to meet these financial covenants, we would consider several options to meet our cash flow needs. Such actions include additional restructuring initiatives and other cost reductions, sales of assets, reductions to working capital and capital spending, issuance of equity and other alternatives to enhance our financial and operating position. Should we be required to implement any of these actions to meet our cash flow needs, we believe we can do so in a reasonable time frame.
Contractual Obligations.
Our remaining required debt principal amortization and payment obligations under lease and certain other financial commitments as of December 31, 20102013 are shown in the following table:
| Payments due in: | ||||||||||||||||||||||||||||
| Beyond | ||||||||||||||||||||||||||||
| 2011(a) | 2012 | 2013 | 2014 | 2015 | 2015 | Total | ||||||||||||||||||||||
| (Millions) | ||||||||||||||||||||||||||||
| Obligations: | ||||||||||||||||||||||||||||
| Revolver borrowings | $ | — | $ | — | $ | — | $ | — | $ | — | $ | — | $ | — | ||||||||||||||
| Senior term loans | 2 | 2 | 2 | 2 | 2 | 139 | 149 | |||||||||||||||||||||
| Senior subordinated notes | 20 | — | — | — | — | — | 20 | |||||||||||||||||||||
| Senior notes | — | — | — | — | 250 | 725 | 975 | |||||||||||||||||||||
| Customer notes | 1 | 1 | 2 | — | — | — | 4 | |||||||||||||||||||||
| Capital leases | 1 | — | — | — | — | — | 1 | |||||||||||||||||||||
| Other subsidiary debt | 1 | 1 | 1 | 1 | 1 | 7 | 12 | |||||||||||||||||||||
| Short-term debt | 61 | — | — | — | — | — | 61 | |||||||||||||||||||||
| Debt and capital lease obligations | 86 | 4 | 5 | 3 | 253 | 871 | 1,222 | |||||||||||||||||||||
| Operating leases | 26 | 19 | 13 | 8 | 5 | 17 | 88 | |||||||||||||||||||||
| Interest payments | 104 | 97 | 84 | 60 | 73 | 366 | 784 | |||||||||||||||||||||
| Capital commitments | 48 | — | — | — | — | — | 48 | |||||||||||||||||||||
| Total Payments | $ | 264 | $ | 120 | $ | 102 | $ | 71 | $ | 331 | $ | 1,254 | $ | 2,142 | ||||||||||||||
| Payments due in: | |||||||||||||||||||||||||||
| 2014 | 2015 | 2016 | 2017 | 2018 | Beyond 2018 | Total | |||||||||||||||||||||
| (Millions) | |||||||||||||||||||||||||||
| Obligations: | |||||||||||||||||||||||||||
| Revolver borrowings | $ | — | $ | — | $ | — | $ | 58 | $ | — | $ | — | $ | 58 | |||||||||||||
| Senior term loans | 22 | 34 | 47 | 125 | — | — | 228 | ||||||||||||||||||||
| Senior notes | — | — | — | — | 225 | 500 | 725 | ||||||||||||||||||||
| Debentures | — | — | — | — | — | 1 | 1 | ||||||||||||||||||||
| Other subsidiary debt and capital lease obligations | 1 | 1 | 1 | 1 | 1 | 4 | 9 | ||||||||||||||||||||
| Short-term debt | 81 | — | — | — | — | — | 81 | ||||||||||||||||||||
| Debt and capital lease obligations | 104 | 35 | 48 | 184 | 226 | 505 | 1,102 | ||||||||||||||||||||
| Operating leases | 40 | 30 | 21 | 15 | 11 | 25 | 142 | ||||||||||||||||||||
| Interest payments | 85 | 81 | 63 | 52 | 52 | 68 | 401 | ||||||||||||||||||||
| Capital commitments | 100 | — | — | — | — | — | 100 | ||||||||||||||||||||
| Total payments | $ | 329 | $ | 146 | $ | 132 | $ | 251 | $ | 63 | $ | 598 | $ | 1,745 | |||||||||||||
If we do not maintain compliance with the terms of our senior credit facility or senior notes indentures described above, all amounts under those arrangements could, automatically or at the option of the lenders or other debt holders, become due. Additionally, each of those facilities contains provisions that certain events of default under one facility will constitute a default under the other facility, allowing the acceleration of all amounts due. We currently expect to maintain compliance with the terms of all of our various credit agreements for the foreseeable future.
Included in our contractual obligations is the amount of interest to be paid on our long-term debt. As our debt structure contains both fixed and variable rate obligations, we have made assumptions in calculating the amount of future interest payments. Interest on our senior subordinated notes and senior notes is calculated using the fixed rates of 73/4 percent, 67/8 percent and 861 7/8 percent, respectively. Interest on our variable rate debt is calculated as LIBOR plus the applicable margin in effect at December 31, 20102013 for the Eurodollar, term loan B andtranche Tranche B-1 loans and prime plus the applicable margin in effect on December 31, 20102013 on the prime-based loans. We have assumed that both LIBOR and the prime rate will remain unchanged for the outlying years. See “— Capitalization.”
We have also included an estimate of expenditures required after December 31, 20102013 to complete the projects authorized at December 31, 2010,2013, in which we have made substantial commitments in connection
66
with purchasing plant, property and equipment for our operations. For 2011,2014, we expect our capital expenditures to be about $190between $275 million to $210and $300 million.
We have not included purchase obligations as part of our contractual obligations as we generally do not enter into long-term agreements with our suppliers. In addition, the agreements we currently have do not specify the volumes we are required to purchase. If any commitment is provided, in many cases the agreements state only the minimum percentage of our purchase requirements we must buy from the supplier. As a result, these purchase obligations fluctuate fromyear-to-year and we are not able to quantify the amount of our future obligations.
We have not included material cash requirements for unrecognized tax benefits or taxes as we are a taxpayer in certain foreign jurisdictions, but generally not in the U.S. Additionally, it is difficult to estimate taxes to be paid as changes in where we generate income can have a significant impact on future tax payments. We have also not included cash requirements for funding pension and postretirement benefit costs. Based upon current estimates, we believe we will be required to make contributions of approximately $54$47 million to those plans in 2011.2014. Pension and postretirement contributions beyond 20112014 will be required but those amounts will vary based upon many factors, including the performance of our pension fund investments during 2011.2014 and future discount rate changes. For additional information relating to the funding of our pension and other
59
postretirement plans, refer to footnoteNote 10 of our notes to consolidated financial statements. In addition, we have not included cash requirements for environmental remediation. Based upon current estimates we believe we will be required to spend approximately $21$19 million over the next 30 years. However, due to possible modifications in remediation processes and other factors, it is difficult to determine the actual timing of the payments. See “— Environmental and Other Matters.”
We occasionally provide guarantees that could require us to make future payments in the event that the third party primary obligor does not make its required payments. We haveare not recordedrequired to record a liability for any of these guarantees.
Additionally, we have from time to time issued guarantees for the performance of obligations by some of our subsidiaries, and some of our subsidiaries have guaranteed our debt. All of our existing and future material domestic wholly-owned subsidiaries fully and unconditionally guarantee our senior credit facility and our senior notes on a joint and several basis. The arrangement for the senior credit facility is also secured by first-priority liens on substantially all our domestic assets and pledges of up to 66 percent of the stock of certain first-tier foreign subsidiaries. No assets or capital stock secure our senior notes. You should also read Note 13 of the consolidated financial statements of Tenneco Inc., where we present the Supplemental Guarantor Condensed Consolidating Financial Statements.
We have two performance guarantee agreements in the U.K. between Tenneco Management Europe Limited (“TMEL”) and the two Walker Group Retirement Plans, the Walker Group Employee Benefit Plan and the Walker Group Executive Retirement Benefit Plan (the “Walker Plans”), whereby TMEL will guarantee the payment of all current and future pension contributions in event of a payment default by the sponsoring or participating employers of the Walker Plans. As a result of our decision to enter into these performance guarantee agreements, the levy due to the U.K. Pension Protection Fund was reduced. The Walker Plans are comprised of employees from Tenneco Walker (U.K.) Limited and our Futaba-Tenneco U.K. joint venture. Employer contributions are funded by both Tenneco Walker (U.K.) Limited, as the sponsoring employer, and Futaba-Tenneco U.K., as a participating employer. The performance guarantee agreements are expected to remain in effect until all pension obligations for the Walker Plans’ sponsoring and participating employers have been satisfied. The maximum amount payable for these pension performance guarantees, relating to other participating employers, is approximately $27 million as of December 31, 2013 which is determined by taking 105 percent of the liability of the Walker Plans calculated under section 179 of the U.K. Pension Act of 2004 offset by plan assets. We did not record an additional liability for this performance guarantee since Tenneco Walker (U.K.) Limited, as the sponsoring employer of the Walker Plans, already recognizes 100 percent of the pension obligation calculated based on U.S. GAAP, for all of the Walker Plans’ participating employers on its balance sheet, which was $10 million and $7 million at December 31, 2013 and December 31, 2012, respectively. At December 31, 2013, all pension contributions under the Walker Plans were current for all of the Walker Plans’ sponsoring and participating employers.
In June 2011, we entered into an indemnity agreement between TMEL and Futaba Industrial Co. Ltd. which requires Futaba to indemnify TMEL for any cost, loss or liability which TMEL may incur under the performance guarantee agreements relating to the Futaba-Tenneco U.K. joint venture. The maximum amount reimbursable by Futaba to TMEL under this indemnity agreement is equal to the amount incurred by TMEL under the performance guarantee agreements multiplied by Futaba’s shareholder ownership percentage of the Futaba-Tenneco U.K. joint venture. At December 31, 2013 the maximum amount reimbursable by Futaba to TMEL is approximately $5 million.
We have issued guarantees through letters of credit in connection with some obligations of our affiliates. As of December 31, 2010,2013, we have $53$38 million in letters of credit to support some of our subsidiaries’ insurance arrangements, foreign employee benefit programs, environmental remediation activities and cash management and capital requirements.
Critical Accounting Policies
and Estimates
We prepare our consolidated financial statements in accordance with accounting principles generally accepted in the United States of America. Preparing our consolidated financial statements in accordance with generally accepted accounting principles requires us to make estimates and assumptions that affect the reported amounts of assets and liabilities and disclosure of contingent assets and liabilities at the date of the consolidated financial statements and the reported amounts of revenues and expenses during the reporting period. The following paragraphs include a discussion of some critical areas where estimates are required.
Revenue Recognition
We recognize revenue for sales to our original equipment and aftermarket customers when title and risk of loss passes to the customers under the terms of our arrangements with those customers, which is usually at the time of shipment from our plants or distribution centers. Generally, in connection with the sale of exhaust systems to certain original equipment manufacturers, we purchase catalytic converters and diesel particulate
67
filters or components thereof including precious metals (“substrates”) on behalf of our customers which are used in the assembled system. These substrates are included in our inventory and “passed through” to the customer at our cost, plus a small margin, since we take title to the inventory and are responsible for both the delivery and quality of the finished product. Revenues recognized for substrate sales were $1,297
60
$1,835 million, $966$1,660 million and $1,492$1,678 million for 2010, 2009in 2013, 2012 and 2008,2011, respectively. For our aftermarket customers, we provide for promotional incentives and returns at the time of sale. Estimates are based upon the terms of the incentives and historical experience with returns. Certain taxes assessed by governmental authorities on revenue producing transactions, such as value added taxes, are excluded from revenue and recorded on a net basis. Shipping and handling costs billed to customers are included in revenues and the related costs are included in cost of sales in our Statements of Income (Loss).Income.
Warranty Reserves
Where we have offered product warranty, we also provide for warranty costs. Provisions for estimated expenses related to product warranty are made at the time products are sold or when specific warranty issues are identified on OE products. These estimates are established using historical information about the nature, frequency, and average cost of warranty claims and upon specific warranty issues as they arise. The warranty terms vary but range from one year up to limited lifetime warranties on some of our premium aftermarket products. We actively study trends of our warranty claims and take action to improve product quality and minimize warranty claims. While we have not experienced any material differences between these estimates and our actual costs, it is reasonably possible that future warranty issues could arise that could have a significant impact on our consolidated financial statements.
Engineering, Research and Development
We expense engineering, research, and development costs as they are incurred. Engineering, research, and development expenses were $117$144 million for 2010, $972013, $126 million for 20092012 and $127$133 million for 2008,2011, net of reimbursements from our customers. Of these amounts, $19 million in 2013, $13 million in 2010, $102012 and $16 million in 2009 and $18 million in 20082011 relate to research and development, which includes the research, design, and development of a new unproven product or process. Additionally, $80$101 million, $61$92 million and $80$92 million of engineering, research, and development expense for 2010, 20092013, 2012 and 2008,2011, respectively, relates to engineering costs we incurred for application of existing products and processes to vehicle platforms. The remainder of the expenses in each year relate to improvements and enhancements to existing products and processes. Further, our customers reimburse us for engineering, research, and development costs on some platforms when we prepare prototypes and incur costs before platform awards. Our engineering, research, and development expense for 2010, 20092013, 2012 and 20082011 has been reduced by $110$169 million, $104$159 million and $120$119 million, respectively, for these reimbursements.
Pre-production Design and Development and Tooling Assets
We expense pre-production design and development costs as incurred unless we have a contractual guarantee for reimbursement from the original equipment customer. Unbilled pre-production design and development costs recorded in prepayments and other and long-term receivables was $15were $30 million and $14$25 million on December 31, 20102013 and 2009,2012, respectively. In addition, plant, property and equipment included $38$59 million and $49$50 million at December 31, 20102013 and 2009,2012, respectively, for original equipment tools and dies that we own, and prepayments and other included $46$86 million and $50$66 million at December 31, 20102013 and 2009,2012, respectively, for in-process tools and dies that we are building for our original equipment customers.
Income Taxes
We recognize deferred tax assets and liabilities on the basis of the future tax consequences attributable to temporary differences that exist between the financial statement carrying value of assets and liabilities and their respective tax values, and net operating losses (“NOL”) and tax credit carryforwards on a taxing jurisdiction basis. We measure deferred tax assets and liabilities using enacted tax rates that will apply in the years in which we expect the temporary differences to be recovered or paid.
We evaluate our deferred income taxes quarterly to determine if valuation allowances are required or should be adjusted. U.S. GAAP requires that companies assess whether valuation allowances should be established against their deferred tax assets based on consideration of all available evidence, both positive and negative, using a “more likely than not” standard. This assessment considers, among other matters, the nature,
68
frequency and amount of recent losses, the duration of statutory carryforward periods, and tax planning strategies. In making such judgments, significant weight is given to evidence that can be objectively verified.
Valuation allowances have beenare established for deferred tax assets based on a “more likely than not” threshold. The ability to realize deferred tax assets depends on our ability to generate sufficient taxable income within the carryforward periods provided for in the tax law for each tax jurisdiction. We have consideredconsider the following possible sources of taxable income when assessing the realization of our deferred tax assets:
Future reversals of existing taxable temporary differences;
Taxable income or loss, based on recent results, exclusive of reversing temporary differences and carryforwards;
Tax-planning strategies; and
61
Taxable income in prior carryback years if carryback is permitted under the U.S. or new business we have won. Consequently, beginning inrelevant tax law.
In 2008, given our historical losses in the U.S., we concluded that our ability to fully utilize our NOLsfederal and state NOL was limited due to projecting the continuation of the negative economic environment and the impact of the negative operating environment on our tax planning strategies.limited. As a result, we recorded a valuation allowance against all of our U.S. deferred tax assets except for our tax planning strategies which havehad not yet been implemented and which dodid not depend upon generating future taxable income,income. Prior to the reversal of the valuation allowance in the third quarter of 2012, we carrycarried a deferred tax assetsasset in the U.S. of $90 million relating to the expected utilization of those NOLs. Thethe federal NOLs expire beginning inand state NOL.
In 2012, we reversed the tax years ending in 2020 through 2029. The state NOLs expire in various tax years through 2029.
In 2012, after considering all available evidence and all possible sources of thetaxable income, we recorded a $19 million tax valuation allowance in the future. Spain for tax credits that may not be utilized due to tax losses in Spain.
The charge to establish the U.S. valuation allowance also includes items related to the losses allocable to certain state jurisdictions where it was determined that tax attributes related to those jurisdictions were potentially not realizable.
Goodwill, net
We evaluate goodwill for impairment in the fourth quarter of each year, or more frequently if events indicate it is warranted. The goodwill impairment test consists of a two-step process. In step one, we compare the estimated fair value of our reporting units with goodwill to the carrying value of the unit’s assets and liabilities to determine if impairment exists within the recorded balance of goodwill. We estimate the fair value of each reporting unit using the income approach which is based on the present value of estimated future cash flows. The income approach is dependent on a number of factors, including estimates of market trends, forecasted revenues and expenses, capital expenditures, weighted average cost of capital and other variables. A separate discount rate derived by a combination of published sources, internal estimates and weighted based on our debt andto equity structure,ratio, was used to calculate the discounted cash flows for each of our reporting units. These estimates are based on assumptions that we believe to be reasonable, but which are inherently uncertain and outside of the control of management. If the carrying value of the reporting unit is higher than its fair value, there is an indication that impairment may exist which requires step two to be performed to
69
measure the amount of the impairment loss. The amount of impairment is determined by comparing the implied fair value of a reporting unit’s goodwill to its carrying value.
During the third quarter of 2011, we performed an impairment evaluation of our Australian reporting unit’s goodwill balance as a result of the continued deterioration of that reporting unit’s financial performance driven by significant declines in industry production volumes in that region. As a result of performing steps one and two of the goodwill impairment test, we concluded that the remaining amount of goodwill related to our Australian reporting unit was impaired and accordingly, we recorded a goodwill impairment charge of $11 million during the third quarter of 2011.
In the fourth quarter of 2009,2013 and 2012, as a result of our annual goodwill impairment testing, the estimated fair value of each of our reporting units significantly exceeded the carrying value of itstheir assets and liabilities. In the fourth quarter of 2010, the estimated fair value of all of our reporting units, except for our Australian reporting unit, significantly exceeded the carrying value of its assets and liabilities. Our Australian reporting unit had a goodwill balance of $11 million with an estimated fair value in excess of its net carrying value of one percentliabilities as of the testing date. Although our Australian operations support the value of goodwill reported as tested in the fourth quarter of 2010, it is possible that assumptions and estimates could change in future periods and result in a future impairment of our Australian reporting unit.
Pension and Other Postretirement Benefits
We have various defined benefit pension plans that cover some of our employees. We also have postretirement health care and life insurance plans that cover some of our domestic employees. Our pension and postretirement health care and life insurance expenses and valuations are dependent on assumptions used by our actuaries in calculating those amounts. These assumptions include discount rates, health care cost trend rates, long-term return on plan assets, retirement rates, mortality rates and other factors. Health care cost trend rate assumptions are developed based on historical cost data and an assessment of likely long-term trends. Retirement rates are based primarily on actual plan experience while mortality rates are based upon the general population experience which is not expected to differ materially from our experience.
Our approach to establishing the discount rate assumption for both our domestic and foreign plans is generally based on the yield on high-quality corporate fixed-income investments. At the end of each year, the discount rate is determined using the results of bond yield curve models based on a portfolio of high quality bonds matching the notional cash inflows with the expected benefit payments for each significant benefit plan. Based on this approach, for 2010 we loweredraised the weighted average discount rate for all our pension plans to 5.54.6 percent in 20102013 from 6.04.1 percent in 2009.2012. The discount rate for postretirement benefits was loweredraised to 5.64.8 percent in 20102013 from 6.14.1 percent in 2009.
2012.
Our approach to determining expected return on plan asset assumptions evaluates both historical returns as well as estimates of future returns, and is adjusted for any expected changes in the long-term outlook for the equity and fixed income
62
markets. As a result, our estimate of the weighted average long-term rate of return on plan assets for all of our pension plans was lowered from 7.6 percent in 2009 to 7.2remained unchanged at 6.9 percent for 2010.both 2013 and 2012.
Refer to FootnoteNote 10 of our notes to consolidated financial statements for more information regarding our pension and other postretirement employee benefit costs and assumptions.
Derivative Financial Instruments
Foreign Currency Exchange Rate Risk
We use derivative financial instruments, principally foreign currency forward purchase and sale contracts with terms of less than one year, to hedge our exposure to changes in foreign currency exchange rates. Our primary exposure to changes in foreign currency rates results from intercompany loans made between affiliates to minimize the need for borrowings from third parties. Additionally, we enter into foreign currency forward purchase and sale contracts to mitigate our exposure to changes in exchange rates on certain intercompany and third-party trade receivables and payables. We manage counter-party credit risk by entering into derivative financial instruments with major financial institutions that can be expected to fully perform under the terms of such agreements. We do not enter into derivative financial instruments for speculative purposes.
In managing our foreign currency exposures, we identify and aggregate existing offsetting positions and then hedge residual exposures through third-party derivative contracts. The fair value of our foreign currency forward contracts was $2a net liability position of less than $1 million at December 31, 20102013 and is based on an internally developed model which incorporates observable inputs including quoted spot rates, forward exchange rates and discounted future expected cash flows utilizing market interest rates with similar quality and maturity characteristics. The following table summarizes by major currency the notional amounts for our foreign currency forward purchase and sale contracts as of December 31, 2010.2013. All contracts in the following table mature no later than March 31, 2011.in 2014.
Notional Amount | ||||||||
in Foreign Currency | ||||||||
| (Millions) | ||||||||
| Australian dollars | —Purchase | 3 | ||||||
| British pounds | —Purchase | 4 | ||||||
| European euro | —Sell | (16 | ) | |||||
| Japanese yen | —Purchase | 135 | ||||||
| —Sell | (842 | ) | ||||||
| Polish zloty | —Purchase | 33 | ||||||
| South African rand | —Purchase | 144 | ||||||
| U.S. dollars | —Purchase | 15 | ||||||
| —Sell | (15 | ) | ||||||
| Other | —Sell | ( | ||||||
| 2 | ||||||||
| ) | ||||||||
Interest Rate Risk
Our financial instruments that are sensitive to market risk for changes in interest rates are primarily our debt securities. We use our revolving credit facilities to finance our short-term and long-term capital requirements. We pay a current market rate of interest on these borrowings. Our long-term capital requirements have been financed with long-term debt with original maturity dates ranging from four to ten years. On December 31, 2010,2013, we had $1,011$733 million in long-term debt obligations that have fixed interest rates. Of that amount, $500 million is fixed through December 2020, $250 million is fixed through November 2015, $225 million is fixed through August 2018 $20 million was fixed through November 2014 and the remainder is fixed from 20112013 through 2025. On January 7, 2011, we redeemed the remaining outstanding $20 million of the 85/8 percent senior subordinated notes at a price of 102.875 percent of principal amount plus accrued and unpaid interest. We also have $152$288 million in long-term debt obligations that are subject to variable interest rates. For more detailed explanations on our debt structure and senior credit facility refer to “Liquidity and Capital Resources — Capitalization” earlier in this Management’s Discussion and Analysis.
63
We estimate that the fair value of our long-term debt at December 31, 20102013 was about 103107 percent of its book value. A one percentage point increase or decrease in interest rates would increase or decrease the annual
71
interest expense we recognize in the income statement and the cash we pay for interest expense by about $2$4 million.
Environmental Matters, Litigation and Product Warranties
We are involved in environmental remediation matters, legal proceedings, claims, investigations and warranty obligations. These matters are typically incidental to the conduct of our business and create the potential for contingent losses. We accrue for potential contingent losses when our review of available facts indicates that it is probable a loss has been incurred and the amount of the loss is reasonably estimable. Each quarter we assess our loss contingencies based upon currently available facts, existing technology, and presently enacted laws and regulations taking into consideration the likely effects of inflation and other societal and economic factors and record adjustments to these reserves as required. As an example, we consider all available evidence including prior experience in remediation of contaminated sites, other companies’ cleanup experiences and data released by the United States Environmental Protection Agency or other organizations when we evaluate our environmental remediation contingencies. Further, all of our loss contingency estimates are subject to revision in future periods based on actual costs or new information. With respect to our environmental liabilities, where future cash flows are fixed or reliably determinable, we have discounted those liabilities. All other environmental liabilities are recorded at their undiscounted amounts. We evaluate recoveries separately from the liability and, Other Matters
when they are assured, recoveries are recorded and reported separately from the associated liability in our consolidated financial statements.
We are subject to a variety of environmental and pollution control laws and regulations in all jurisdictions in which we operate. We expense or capitalize, as appropriate, expenditures for ongoing compliance with environmental regulations that relate to current operations. We expense costs related to an existing condition caused by past operations that do not contribute to current or future revenue generation. We record liabilities when environmental assessments indicate that required remedial efforts are probable and the costs can be reasonably estimated. Estimates of the liability are based upon currently available facts, existing technology, and presently enacted laws and regulations taking into consideration the likely effects of inflation and other societal and economic factors. We consider all available evidence including prior experience in remediation of contaminated sites, other companies’ cleanup experiences and data released by the United States Environmental Protection Agency or other organizations. These estimated liabilities are subject to revision in future periods based on actual costs or new information. Where future cash flows are fixed or reliably determinable, we have discounted the liabilities, as discussed in Footnote 12 — Commitments and Contingency — Litigation, of our notes to consolidated financial statements. All other environmental liabilities are recorded at their undiscounted amounts. We evaluate recoveries separately from the liability and, when they are assured, recoveries are recorded and reported separately from the associated liability in our consolidated financial statements.
As of December 31, 2010,2013, we have the obligation to remediate or contribute towards the remediation of certain sites, including two existingone Federal Superfund sites.site. At December 31, 2010,2013, our aggregated estimated share of environmental remediation costs for all these sites on a discounted basis was approximately $16$15 million, of which $5$3 million is recorded in other current liabilities and $11$12 million is recorded in deferred credits and other liabilities in our consolidated balance sheet. For those locations in whichwhere the liability was discounted, the weighted average discount rate used was 3.22.8 percent. The undiscounted value of the estimated remediation costs was $21$19 million. Our expected payments of environmental remediation costs are estimated to be approximately $5$3 million in 2011,2014, $1 million in each year beginning 20122015 through 20152018 and $12 million in aggregate thereafter. Based on information known to us, we have established reserves that we believe are adequate for these costs. Although we believe these estimates of remediation costs are reasonable and are based on the latest available information, the costs are estimates and are subject to revision as more information becomes available about the extent of remediation required. At some sites, we expect that other parties will contribute towards the remediation costs. In addition, certain environmental statutes provide that our liability could be joint and several, meaning that we could be required to pay in excess of our share of remediation costs. Our understanding of the financial strength of other potentially responsible parties at these sites has been considered, where appropriate, in our determination of our estimated liability.
We do not believe that any potential costs associated with our current status as a potentially responsible party in the Federal Superfund sites,site, or as a liable party at the other locations referenced herein, will be material to our consolidated results of operations, financial position or cash flows.
We also from time to time are involved in legal proceedings, claims or investigations that are incidental to the conduct of our business.investigations. Some of these proceedings allegematters involve allegations of damages against us relating to environmental liabilities (including toxic tort, property damage and remediation), intellectual property matters (including patent, trademark and copyright infringement, and licensing disputes), personal injury claims (including
72
injuries due to product failure, design or warning issues, and other product liability related matters), taxes, employment matters, and commercial or contractual disputes, sometimes related to acquisitions or divestitures. Some of these matters involve allegations relating to legal compliance. For example, one of our Argentine subsidiaries is currently defending against a criminal complaint alleging the failure to comply with laws requiring the proceeds of export transactions to be collected, reportedand/or converted to local currency within specified time periods. As another example, in the U.S. we are subject to an audit in 11 states of our practices with respect to the payment of unclaimed property to those states. We are in the early stages of this audit, which could coverstates, spanning a period as far back as over 30 years andyears. While we now have practices in place which we believe ensure that we pay unclaimed property as required. We vigorously defend ourselves against all of these claims. Inclaims, in future periods we could be subject to cash costs or charges to earnings if any of these matters are resolved on unfavorable terms. However, althoughAlthough the ultimate outcome of any legal matter cannot be predicted with certainty, based on current information, including our assessment of the merits of the particular claim, we do not expect that thesethe legal proceedings or claims currently pending against us will have any material adverse impact on our future consolidated financial position, results of operations or cash flows.
In addition, we are subject to a number of lawsuits initiated by a significant number of claimants alleging health problems as a result of exposure to asbestos. In the early 2000’s we were named in nearly 20,000 complaints, most of which were filed in Mississippi state court and the vast majority of which made no allegations of exposure to asbestos from our product categories. Most of these claims have been dismissed and our current docket of active and inactive cases is less than 500 cases nationwide. A small number of claims have been asserted by railroad workers alleging exposure to asbestos products in railroad cars
64
manufactured by The Pullman Company, one of our subsidiaries. The balancesubstantial majority of the remaining claims isare related to alleged exposure to asbestos in our automotive emission control products. Only a small percentage of thesethe claimants allege that they were automobile mechanics and a significant number appear to involve workers in other industries or otherwise do not include sufficient information to determine whether there is any basis for a claim against us. We believe, based on scientific and other evidence, it is unlikely that mechanics were exposed to asbestos by our former muffler products and that, in any event, they would not be at increased risk of asbestos-related disease based on their work with these products. Further, many of these cases involve numerous defendants, with the number of each in some cases exceeding 100 defendants from a variety of industries. Additionally, the plaintiffs either do not specify any, or specify the jurisdictional minimum, dollar amount for damages. As major asbestos manufacturers and/or users continue to go out of business or file for bankruptcy, we may experience an increased number of these claims. We vigorously defend ourselves against these claims as part of our ordinary course of business. In future periods, we could be subject to cash costs or charges to earnings if any of these matters are resolved unfavorably to us. To date, with respect to claims that have proceeded sufficiently through the judicial process, we have regularly achieved favorable resolutions. Accordingly, we presently believe that these asbestos-related claims will not have a material adverse impact on our future consolidated financial condition, results of operations or cash flows.
We provide warranties on some of our products. The warranty terms vary but range from one year up to limited lifetime warranties on some of our premium aftermarket products. Provisions for estimated expenses related to product warranty are made at the time products are sold or when specific warranty issues are identified on OE products. These estimates are established using historical information about the nature, frequency, and average cost of warranty claims. We actively study trends of our warranty claims and take action to improve product quality and minimize warranty claims. We believe that the warranty reserve is appropriate; however, actual claims incurred could differ from the original estimates, requiring adjustments to the reserve. The reserve is included in both current and long-term liabilities on the balance sheet.
Below is a table that shows the activity in the warranty accrual accounts:
| Year Ended December 31, | |||||||||||
| 2013 | 2012 | 2011 | |||||||||
| (Millions) | |||||||||||
| Beginning Balance | $ | 23 | $ | 26 | $ | 33 | |||||
| Accruals related to product warranties | 20 | 15 | 11 | ||||||||
| Reductions for payments made | (19 | ) | (18 | ) | (18 | ) | |||||
| Ending Balance | $ | 24 | $ | 23 | $ | 26 | |||||
In the fourth quarter of 2011, we encountered an issue in our North America OE ride performance business involving struts supplied on one particular OE platform. As a result, we directly incurred approximately $2 million in premium freight and overtime costs in the fourth quarter of 2011 and $3 million in 2012. In the first quarter of 2013 we incurred a charge of $2 million in connection with the resolution of all existing claims pertaining to this matter. We paid the customer the $2 million in the second quarter of 2013.
Tenneco 401(k) Retirement Savings Plans
Effective January 1, 2012, the Tenneco Employee Stock Ownership Plans
ITEM 7A. | QUANTITATIVE AND QUALITATIVE DISCLOSURES ABOUT MARKET RISK. |
The section entitled “Derivative Financial Instruments” in Item 7, “Management’s Discussion and Analysis of Financial Condition and Results of Operations” is incorporated herein by reference.
73
65
ITEM 8. | FINANCIAL STATEMENTS AND SUPPLEMENTARY DATA. |
INDEX TO FINANCIAL STATEMENTS OF TENNECO INC.
AND CONSOLIDATED SUBSIDIARIES
| Page | ||||
66
74
MANAGEMENT’S REPORT ON INTERNAL CONTROL OVER FINANCIAL REPORTING
Management of Tenneco Inc. is responsible for establishing and maintaining adequate internal control over financial reporting (as defined inRule 13a-15(f) and15d-15(f) under the Securities Exchange Act of 1934). Management’s internal control system is designed to provide reasonable assurance regarding the preparation and fair presentation of published financial statements. All internal control systems, no matter how well designed, have inherent limitations, including the possibility of human error or circumvention or overriding of controls. Therefore, even those systems determined to be effective can provide only reasonable assurance with respect to financial statement preparation and presentation and may not prevent or detect misstatements in financial reporting. Further, due to changing conditions and adherence to established policies and controls, internal control effectiveness may vary over time.
Management assessed the company’s effectiveness of internal controls over financial reporting. In making this assessment, it used the criteria set forth by the Committee of Sponsoring Organizations of the Treadway Commission (“COSO”) inInternal Control-Integrated Framework.
Framework (1992).
Based on our assessment we have concluded that the company’s internal control over financial reporting was effective as of December 31, 2010.
2013.
Our internal control over financial reporting as of December 31, 20102013 has been audited by PricewaterhouseCoopers LLP, our independent registered public accounting firm, as stated in their report, which is included herein.
February 25, 201128, 2014
75
67
REPORT OF INDEPENDENT REGISTERED PUBLIC ACCOUNTING FIRM
To the Board of Directors and Shareholders of Tenneco Inc.:
In our opinion, the accompanying consolidated balance sheets and the related consolidated statements of income, (loss),comprehensive income, cash flows, and changes in shareholders’ equity and comprehensive income (loss) present fairly, in all material respects, the financial position of Tenneco Inc. and its subsidiaries at December 31, 20102013, and 2012 and the results of their operations and their cash flows for each of the yearthree years in the period ended December 31, 20102013 in conformity with accounting principles generally accepted in the United States of America. In addition, in our opinion, the financial statement schedule forlisted in the year ended December 31, 2010 in Item 8accompanying index presents fairly, in all material respects, the information set forth therein when read in conjunction with the related consolidated financial statements. Also in our opinion, the Company maintained, in all material respects, effective internal control over financial reporting as of December 31, 2010,2013, based on criteria established inInternal Control — Integrated Framework (1992) issued by the Committee of Sponsoring Organizations of the Treadway Commission (COSO). The Company’s management is responsible for these financial statements and financial statement schedule, for maintaining effective internal control over financial reporting and for its assessment of the effectiveness of internal control over financial reporting, included in the accompanying ManagementManagement’s Report on Internal Control over Financial Reporting. Our responsibility is to express opinions on these financial statements, on the financial statement schedule, and on the Company’s internal control over financial reporting based on our integrated audit.audits. We conducted our auditaudits in accordance with the standards of the Public Company Accounting Oversight Board (United States). Those standards require that we plan and perform the auditaudits to obtain reasonable assurance about whether the financial statements are free of material misstatement and whether effective internal control over financial reporting was maintained in all material respects. Our auditaudits of the financial statements included examining, on a test basis, evidence supporting the amounts and disclosures in the financial statements, assessing the accounting principles used and significant estimates made by management, and evaluating the overall financial statement presentation. Our audit of internal control over financial reporting included obtaining an understanding of internal control over financial reporting, assessing the risk that a material weakness exists, and testing and evaluating the design and operating effectiveness of internal control based on the assessed risk. Our auditaudits also included performing such other procedures as we considered necessary in the circumstances. We believe that our audit providesaudits provide a reasonable basis for our opinions.
A company’s internal control over financial reporting is a process designed to provide reasonable assurance regarding the reliability of financial reporting and the preparation of financial statements for external purposes in accordance with generally accepted accounting principles. A company’s internal control over financial reporting includes those policies and procedures that (i) pertain to the maintenance of records that, in reasonable detail, accurately and fairly reflect the transactions and dispositions of the assets of the company; (ii) provide reasonable assurance that transactions are recorded as necessary to permit preparation of financial statements in accordance with generally accepted accounting principles, and that receipts and expenditures of the company are being made only in accordance with authorizations of management and directors of the company; and (iii) provide reasonable assurance regarding prevention or timely detection of unauthorized acquisition, use, or disposition of the company’s assets that could have a material effect on the financial statements.
Because of its inherent limitations, internal control over financial reporting may not prevent or detect misstatements. Also, projections of any evaluation of effectiveness to future periods are subject to the risk that controls may become inadequate because of changes in conditions, or that the degree of compliance with the policies or procedures may deteriorate.
/S/ PRICEWATERHOUSECOOPERS LLP
February 25, 201127, 2014
76
77
TENNECO INC.
| Year Ended December 31, | ||||||||||||
| 2010 | 2009 | 2008 | ||||||||||
| (Millions Except Share and Per Share Amounts) | ||||||||||||
Revenues | ||||||||||||
| Net sales and operating revenues | $ | 5,937 | $ | 4,649 | $ | 5,916 | ||||||
Costs and expenses | ||||||||||||
| Cost of sales (exclusive of depreciation and amortization shown below) | 4,900 | 3,875 | 5,063 | |||||||||
| Goodwill impairment charge | — | — | 114 | |||||||||
| Engineering, research, and development | 117 | 97 | 127 | |||||||||
| Selling, general, and administrative | 417 | 344 | 392 | |||||||||
| Depreciation and amortization of other intangibles | 216 | 221 | 222 | |||||||||
| 5,650 | 4,537 | 5,918 | ||||||||||
Other income (expense) | ||||||||||||
| Loss on sale of receivables | (3 | ) | (9 | ) | (10 | ) | ||||||
| Other income (expense) | (3 | ) | (11 | ) | 9 | |||||||
| (6 | ) | (20 | ) | (1 | ) | |||||||
Earnings (loss) before interest expense, income taxes, and noncontrolling interests | 281 | 92 | (3 | ) | ||||||||
| Interest expense (net of interest capitalized of $4 million, $4 million and $6 million, respectively) | 149 | 133 | 113 | |||||||||
| Income tax expense | 69 | 13 | 289 | |||||||||
| Net income (loss) | 63 | (54 | ) | (405 | ) | |||||||
| Less: Net income attributable to noncontrolling interests | 24 | 19 | 10 | |||||||||
Net income (loss) attributable to Tenneco Inc. | $ | 39 | $ | (73 | ) | $ | (415 | ) | ||||
Earnings (loss) per share | ||||||||||||
| Weighted average shares of common stock outstanding — | ||||||||||||
| Basic | 59,208,103 | 48,572,463 | 46,406,095 | |||||||||
| Diluted | 60,998,694 | 48,572,463 | 46,406,095 | |||||||||
| Basic earnings (loss) per share of common stock | $ | 0.65 | $ | (1.50 | ) | $ | (8.95 | ) | ||||
| Diluted earnings (loss) per share of common stock | $ | 0.63 | $ | (1.50 | ) | $ | (8.95 | ) | ||||
| Year Ended December 31, | |||||||||||
| 2013 | 2012 | 2011 | |||||||||
| (Millions Except Share and Per Share Amounts) | |||||||||||
| Revenues | |||||||||||
| Net sales and operating revenues | $ | 7,964 | $ | 7,363 | $ | 7,205 | |||||
| Costs and expenses | |||||||||||
| Cost of sales (exclusive of depreciation and amortization shown below) | 6,734 | 6,170 | 6,037 | ||||||||
| Goodwill impairment charge | — | — | 11 | ||||||||
| Engineering, research, and development | 144 | 126 | 133 | ||||||||
| Selling, general, and administrative | 453 | 427 | 428 | ||||||||
| Depreciation and amortization of other intangibles | 205 | 205 | 207 | ||||||||
| 7,536 | 6,928 | 6,816 | |||||||||
| Other income (expense) | |||||||||||
| Loss on sale of receivables | (4 | ) | (4 | ) | (5 | ) | |||||
| Other expense | — | (3 | ) | (5 | ) | ||||||
| (4 | ) | (7 | ) | (10 | ) | ||||||
| Earnings before interest expense, income taxes, and noncontrolling interests | 424 | 428 | 379 | ||||||||
| Interest expense (net of interest capitalized of $4 million each for 2013, 2012 and 2011, respectively) | 80 | 105 | 108 | ||||||||
| Earnings before income taxes and noncontrolling interests | 344 | 323 | 271 | ||||||||
| Income tax expense | 122 | 19 | 88 | ||||||||
| Net income | 222 | 304 | 183 | ||||||||
| Less: Net income attributable to noncontrolling interests | 39 | 29 | 26 | ||||||||
| Net income attributable to Tenneco Inc. | $ | 183 | $ | 275 | $ | 157 | |||||
| Earnings per share | |||||||||||
| Weighted average shares of common stock outstanding — | |||||||||||
| Basic | 60,474,492 | 59,985,677 | 59,884,139 | ||||||||
| Diluted | 61,594,062 | 61,083,510 | 61,520,160 | ||||||||
| Basic earnings per share of common stock | $ | 3.03 | $ | 4.58 | $ | 2.62 | |||||
| Diluted earnings per share of common stock | $ | 2.97 | $ | 4.50 | $ | 2.55 | |||||
The accompanying notes to consolidated financial statements are an integral
part of these statements of income (loss).income.
78
69
TENNECO INC.
CONSOLIDATED STATEMENTS OF COMPREHENSIVE INCOME
| December 31, | ||||||||
| 2010 | 2009 | |||||||
| (Millions) | ||||||||
ASSETS | ||||||||
| Current assets: | ||||||||
| Cash and cash equivalents | $ | 233 | $ | 167 | ||||
| Receivables — | ||||||||
| Customer notes and accounts, net | 796 | 572 | ||||||
| Other | 30 | 24 | ||||||
| Inventories | 547 | 428 | ||||||
| Deferred income taxes | 38 | 35 | ||||||
| Prepayments and other | 146 | 167 | ||||||
| Total current assets | 1,790 | 1,393 | ||||||
| Other assets: | ||||||||
| Long-term receivables, net | 9 | 8 | ||||||
| Goodwill | 89 | 89 | ||||||
| Intangibles, net | 32 | 30 | ||||||
| Deferred income taxes | 92 | 100 | ||||||
| Other | 105 | 111 | ||||||
| 327 | 338 | |||||||
| Plant, property, and equipment, at cost | 3,109 | 3,099 | ||||||
| Less — Accumulated depreciation and amortization | (2,059 | ) | (1,989 | ) | ||||
| 1,050 | 1,110 | |||||||
| $ | 3,167 | $ | 2,841 | |||||
| LIABILITIES AND SHAREHOLDERS’ EQUITY | ||||||||
| Current liabilities: | ||||||||
| Short-term debt (including current maturities of long-term debt) | $ | 63 | $ | 75 | ||||
| Trade payables | 1,048 | 766 | ||||||
| Accrued taxes | 51 | 36 | ||||||
| Accrued interest | 13 | 22 | ||||||
| Accrued liabilities | 227 | 257 | ||||||
| Other | 66 | 45 | ||||||
| Total current liabilities | 1,468 | 1,201 | ||||||
| Long-term debt | 1,160 | 1,145 | ||||||
| Deferred income taxes | 56 | 66 | ||||||
| Postretirement benefits | 311 | 331 | ||||||
| Deferred credits and other liabilities | 125 | 80 | ||||||
| Commitments and contingencies | ||||||||
| Total liabilities | 3,120 | 2,823 | ||||||
| Redeemable noncontrolling interests | 12 | 7 | ||||||
| Tenneco Inc. Shareholders’ equity: | ||||||||
| Common stock | 1 | 1 | ||||||
| Premium on common stock and other capital surplus | 3,008 | 3,005 | ||||||
| Accumulated other comprehensive loss | (237 | ) | (212 | ) | ||||
| Retained earnings (accumulated deficit) | (2,536 | ) | (2,575 | ) | ||||
| 236 | 219 | |||||||
| Less — Shares held as treasury stock, at cost | 240 | 240 | ||||||
| Total Tenneco Inc. shareholders’ equity | (4 | ) | (21 | ) | ||||
| Noncontrolling interests | 39 | 32 | ||||||
| Total equity | 35 | 11 | ||||||
| Total liabilities, redeemable noncontrolling interests and equity | $ | 3,167 | $ | 2,841 | ||||
| Year Ended December 31, 2013 | |||||||||||||||||||||||
| Tenneco Inc. | Noncontrolling interests | Total | |||||||||||||||||||||
Accumulated Other Comprehensive Income (Loss) | Comprehensive Income (Loss) | Accumulated Other Comprehensive Income (Loss) | Comprehensive Income (Loss) | Accumulated Other Comprehensive Income (Loss) | Comprehensive Income (Loss) | ||||||||||||||||||
| (Millions) | |||||||||||||||||||||||
| Net Income | $ | 183 | $ | 39 | $ | 222 | |||||||||||||||||
| Accumulated Other Comprehensive Income (Loss) | |||||||||||||||||||||||
| Cumulative Translation Adjustment | |||||||||||||||||||||||
| Balance January 1 | $ | (24 | ) | $ | 5 | $ | (19 | ) | |||||||||||||||
| Translation of foreign currency statements | (37 | ) | (37 | ) | — | — | (37 | ) | (37 | ) | |||||||||||||
| Balance December 31 | (61 | ) | 5 | (56 | ) | ||||||||||||||||||
| Adjustment to the Liability for Pension and Postretirement Benefits | |||||||||||||||||||||||
| Balance January 1 | (384 | ) | — | (384 | ) | ||||||||||||||||||
| Adjustment to the Liability for Pension and Postretirement benefits, net of tax | 85 | 85 | 85 | 85 | |||||||||||||||||||
| Balance December 31 | (299 | ) | (299 | ) | |||||||||||||||||||
| Balance December 31 | $ | (360 | ) | $ | 5 | $ | (355 | ) | |||||||||||||||
| Other comprehensive income | 48 | — | 48 | ||||||||||||||||||||
| Comprehensive Income | $ | 231 | $ | 39 | $ | 270 | |||||||||||||||||
The accompanying notes to consolidated financial statements are an integral
part of these statements of comprehensive income.
70
TENNECO INC.
CONSOLIDATED STATEMENTS OF COMPREHENSIVE INCOME
| Year Ended December 31, 2012 | |||||||||||||||||||||||
| Tenneco Inc. | Noncontrolling interests | Total | |||||||||||||||||||||
Accumulated Other Comprehensive Income (Loss) | Comprehensive Income (Loss) | Accumulated Other Comprehensive Income (Loss) | Comprehensive Income (Loss) | Accumulated Other Comprehensive Income (Loss) | Comprehensive Income (Loss) | ||||||||||||||||||
| (Millions) | |||||||||||||||||||||||
| Net Income | $ | 275 | $ | 29 | $ | 304 | |||||||||||||||||
| Accumulated Other Comprehensive Income (Loss) | |||||||||||||||||||||||
| Cumulative Translation Adjustment | |||||||||||||||||||||||
| Balance January 1 | $ | (30 | ) | $ | 4 | $ | (26 | ) | |||||||||||||||
| Translation of foreign currency statements | 6 | 6 | 1 | 1 | 7 | 7 | |||||||||||||||||
| Balance December 31 | (24 | ) | 5 | (19 | ) | ||||||||||||||||||
| Adjustment to the Liability for Pension and Postretirement Benefits | |||||||||||||||||||||||
| Balance January 1 | (352 | ) | — | (352 | ) | ||||||||||||||||||
| Adjustment to the Liability for Pension and Postretirement benefits, net of tax | (32 | ) | (32 | ) | (32 | ) | (32 | ) | |||||||||||||||
| Balance December 31 | (384 | ) | (384 | ) | |||||||||||||||||||
| Balance December 31 | $ | (408 | ) | $ | 5 | $ | (403 | ) | |||||||||||||||
| Other comprehensive income (loss) | (26 | ) | 1 | (25 | ) | ||||||||||||||||||
| Comprehensive Income | $ | 249 | $ | 30 | $ | 279 | |||||||||||||||||
The accompanying notes to consolidated financial statements are an integral
part of these statements of comprehensive income.
71
TENNECO INC.
CONSOLIDATED STATEMENTS OF COMPREHENSIVE INCOME
| Year Ended December 31, 2011 | |||||||||||||||||||||||
| Tenneco Inc. | Noncontrolling interests | Total | |||||||||||||||||||||
Accumulated Other Comprehensive Income (Loss) | Comprehensive Income (Loss) | Accumulated Other Comprehensive Income (Loss) | Comprehensive Income (Loss) | Accumulated Other Comprehensive Income (Loss) | Comprehensive Income (Loss) | ||||||||||||||||||
| (Millions) | |||||||||||||||||||||||
| Net Income | $ | 157 | $ | 26 | $ | 183 | |||||||||||||||||
| Accumulated Other Comprehensive Income (Loss) | |||||||||||||||||||||||
| Cumulative Translation Adjustment | |||||||||||||||||||||||
| Balance January 1 | $ | 8 | $ | 5 | $ | 13 | |||||||||||||||||
| Translation of foreign currency statements | (38 | ) | (38 | ) | (1 | ) | (1 | ) | (39 | ) | (39 | ) | |||||||||||
| Balance December 31 | (30 | ) | 4 | (26 | ) | ||||||||||||||||||
| Adjustment to the Liability for Pension and Postretirement Benefits | |||||||||||||||||||||||
| Balance January 1 | (250 | ) | — | (250 | ) | ||||||||||||||||||
| Adjustment to the Liability for Pension and Postretirement benefits, net of tax | (102 | ) | (102 | ) | (102 | ) | (102 | ) | |||||||||||||||
| Balance December 31 | (352 | ) | (352 | ) | |||||||||||||||||||
| Balance December 31 | $ | (382 | ) | $ | 4 | $ | (378 | ) | |||||||||||||||
| Other comprehensive loss | (140 | ) | (1 | ) | (141 | ) | |||||||||||||||||
| Comprehensive Income | $ | 17 | $ | 25 | $ | 42 | |||||||||||||||||
The accompanying notes to consolidated financial statements are an integral
part of these statements of comprehensive income.
72
TENNECO INC.
CONSOLIDATED BALANCE SHEETS
| December 31, | |||||||
| 2013 | 2012 | ||||||
| (Millions) | |||||||
| ASSETS | |||||||
| Current assets: | |||||||
| Cash and cash equivalents | $ | 275 | $ | 223 | |||
| Restricted cash | 5 | — | |||||
| Receivables — | |||||||
| Customer notes and accounts, net | 1,041 | 966 | |||||
| Other | 19 | 20 | |||||
| Inventories | 656 | 667 | |||||
| Deferred income taxes | 71 | 72 | |||||
| Prepayments and other | 223 | 176 | |||||
| Total current assets | 2,290 | 2,124 | |||||
| Other assets: | |||||||
| Long-term receivables, net | 14 | 4 | |||||
| Goodwill | 69 | 72 | |||||
| Intangibles, net | 30 | 35 | |||||
| Deferred income taxes | 125 | 116 | |||||
| Other | 127 | 135 | |||||
| 365 | 362 | ||||||
| Plant, property, and equipment, at cost | 3,498 | 3,365 | |||||
| Less — Accumulated depreciation and amortization | (2,323 | ) | (2,243 | ) | |||
| 1,175 | 1,122 | ||||||
| Total Assets | $ | 3,830 | $ | 3,608 | |||
| LIABILITIES AND SHAREHOLDERS’ EQUITY | |||||||
| Current liabilities: | |||||||
| Short-term debt (including current maturities of long-term debt) | $ | 83 | $ | 113 | |||
| Accounts payable | 1,359 | 1,186 | |||||
| Accrued taxes | 40 | 50 | |||||
| Accrued interest | 10 | 10 | |||||
| Accrued liabilities | 252 | 239 | |||||
| Other | 94 | 51 | |||||
| Total current liabilities | 1,838 | 1,649 | |||||
| Long-term debt | 1,019 | 1,067 | |||||
| Deferred income taxes | 28 | 27 | |||||
| Postretirement benefits | 249 | 407 | |||||
| Deferred credits and other liabilities | 204 | 152 | |||||
| Commitments and contingencies | |||||||
| Total liabilities | 3,338 | 3,302 | |||||
| Redeemable noncontrolling interests | 20 | 15 | |||||
| Tenneco Inc. Shareholders’ equity: | |||||||
| Common stock | 1 | 1 | |||||
| Premium on common stock and other capital surplus | 3,014 | 3,031 | |||||
| Accumulated other comprehensive loss | (360 | ) | (408 | ) | |||
| Retained earnings (accumulated deficit) | (1,921 | ) | (2,104 | ) | |||
| 734 | 520 | ||||||
| Less — Shares held as treasury stock, at cost | 301 | 274 | |||||
| Total Tenneco Inc. shareholders’ equity | 433 | 246 | |||||
| Noncontrolling interests | 39 | 45 | |||||
| Total equity | 472 | 291 | |||||
| Total liabilities, redeemable noncontrolling interests and equity | $ | 3,830 | $ | 3,608 | |||
The accompanying notes to consolidated financial statements are an integral
part of these balance sheets.
79
73
TENNECO INC.
| Year Ended December 31, | |||||||||||
| 2013 | 2012 | 2011 | |||||||||
| (Millions) | |||||||||||
| Operating Activities | |||||||||||
| Net income | $ | 222 | $ | 304 | $ | 183 | |||||
| Adjustments to reconcile net income to cash provided by operating activities — | |||||||||||
| Goodwill impairment charge | — | — | 11 | ||||||||
| Depreciation and amortization of other intangibles | 205 | 205 | 207 | ||||||||
| Deferred income taxes | 5 | (65 | ) | (5 | ) | ||||||
| Stock-based compensation | 13 | 11 | 8 | ||||||||
| Loss on sale of assets | 1 | 4 | 4 | ||||||||
| Changes in components of working capital — | |||||||||||
| (Increase) decrease in receivables | (88 | ) | (9 | ) | (183 | ) | |||||
| (Increase) decrease in inventories | 3 | (72 | ) | (64 | ) | ||||||
| (Increase) decrease in prepayments and other current assets | (53 | ) | (21 | ) | (13 | ) | |||||
| Increase (decrease) in payables | 161 | 12 | 144 | ||||||||
| Increase (decrease) in accrued taxes | (10 | ) | 7 | (7 | ) | ||||||
| Increase (decrease) in accrued interest | — | (3 | ) | — | |||||||
| Increase (decrease) in other current liabilities | 64 | 10 | (7 | ) | |||||||
| Change in long-term assets | 7 | 14 | 1 | ||||||||
| Change in long-term liabilities | (32 | ) | (37 | ) | (41 | ) | |||||
| Other | 5 | 5 | 7 | ||||||||
| Net cash provided by operating activities | 503 | 365 | 245 | ||||||||
| Investing Activities | |||||||||||
| Proceeds from sale of assets | 8 | 3 | 4 | ||||||||
| Cash payments for plant, property, and equipment | (244 | ) | (256 | ) | (213 | ) | |||||
| Cash payments for software related intangible assets | (25 | ) | (13 | ) | (15 | ) | |||||
| Cash payments for net assets purchased | — | (7 | ) | — | |||||||
| Change in restricted cash | (5 | ) | — | — | |||||||
| Net cash used by investing activities | (266 | ) | (273 | ) | (224 | ) | |||||
| Financing Activities | |||||||||||
| Retirement of long-term debt | (16 | ) | (411 | ) | (24 | ) | |||||
| Issuance of long-term debt | — | 250 | 5 | ||||||||
| Debt issuance costs of long-term debt | — | (13 | ) | (1 | ) | ||||||
| Purchase of common stock under the share repurchase program | (27 | ) | (18 | ) | (16 | ) | |||||
| Issuance of common stock | 20 | 5 | — | ||||||||
| Tax benefit from stock-based compensation | 24 | — | — | ||||||||
| Increase (decrease) in bank overdrafts | (6 | ) | 5 | 3 | |||||||
| Net increase (decrease) in revolver borrowings and short-term debt excluding current maturities of long-term debt and short-term borrowings secured by accounts receivable | (22 | ) | 67 | 30 | |||||||
| Net increase (decrease) in short-term borrowings secured by accounts receivable | (40 | ) | 50 | — | |||||||
| Capital contribution from noncontrolling interest partner | — | 5 | 1 | ||||||||
| Purchase of noncontrolling equity interest | (69 | ) | — | (4 | ) | ||||||
| Distribution to noncontrolling interest partners | (39 | ) | (29 | ) | (20 | ) | |||||
| Net cash used by financing activities | (175 | ) | (89 | ) | (26 | ) | |||||
| Effect of foreign exchange rate changes on cash and cash equivalents | (10 | ) | 6 | (14 | ) | ||||||
| Increase (decrease) in cash and cash equivalents | 52 | 9 | (19 | ) | |||||||
| Cash and cash equivalents, January 1 | 223 | 214 | 233 | ||||||||
| Cash and cash equivalents, December 31 (Note) | $ | 275 | $ | 223 | $ | 214 | |||||
74
| Year Ended December 31, | ||||||||||||
| 2010 | 2009 | 2008 | ||||||||||
| (Millions) | ||||||||||||
Operating Activities | ||||||||||||
| Net income (loss) | $ | 63 | $ | (54 | ) | $ | (405 | ) | ||||
| Adjustments to reconcile net income (loss) to cash provided by operating activities — | ||||||||||||
| Depreciation and amortization of other intangibles | 216 | 221 | 222 | |||||||||
| Goodwill impairment charge | — | — | 114 | |||||||||
| Deferred income taxes | 4 | (24 | ) | 204 | ||||||||
| Stock-based compensation | 9 | 7 | 10 | |||||||||
| Loss on sale of assets | 3 | 9 | 10 | |||||||||
| Changes in components of working capital — | ||||||||||||
| (Increase) decrease in receivables | (231 | ) | (8 | ) | 126 | |||||||
| (Increase) decrease in inventories | (122 | ) | 101 | 19 | ||||||||
| (Increase) decrease in prepayments and other current assets | 20 | (55 | ) | 1 | ||||||||
| Increase (decrease) in payables | 238 | (2 | ) | (181 | ) | |||||||
| Increase (decrease) in accrued taxes | 12 | 10 | 4 | |||||||||
| Increase (decrease) in accrued interest | (8 | ) | (1 | ) | — | |||||||
| Increase (decrease) in other current liabilities | 20 | 20 | — | |||||||||
| Change in long-term assets | 12 | 10 | 16 | |||||||||
| Change in long-term liabilities | 6 | 2 | 19 | |||||||||
| Other | 2 | 5 | 1 | |||||||||
| Net cash provided by operating activities | 244 | 241 | 160 | |||||||||
Investing Activities | ||||||||||||
| Proceeds from sale of assets | 3 | 5 | 3 | |||||||||
| Cash payments for plant, property, and equipment | (151 | ) | (120 | ) | (233 | ) | ||||||
| Cash payments for software related intangible assets | (12 | ) | (6 | ) | (15 | ) | ||||||
| Acquisition of businesses, net of cash acquired | — | 1 | (16 | ) | ||||||||
| Other | 3 | 1 | — | |||||||||
| Net cash used by investing activities | (157 | ) | (119 | ) | (261 | ) | ||||||
Financing Activities | ||||||||||||
| Issuance of common shares | — | 188 | 2 | |||||||||
| Issuance of long-term debt | 880 | 6 | 1 | |||||||||
| Debt issuance costs on long-term debt | (24 | ) | (8 | ) | (2 | ) | ||||||
| Increase (decrease) in bank overdrafts | 2 | (23 | ) | (1 | ) | |||||||
| Retirement of long-term debt | (864 | ) | (22 | ) | (6 | ) | ||||||
| Net increase (decrease) in revolver borrowings and short-term debt excluding current maturities of long-term debt | (10 | ) | (218 | ) | 77 | |||||||
| Distribution to noncontrolling interests partners | (14 | ) | (10 | ) | (13 | ) | ||||||
| Net cash provided (used) by financing activities | (30 | ) | (87 | ) | 58 | |||||||
| Effect of foreign exchange rate changes on cash and cash equivalents | 9 | 6 | (19 | ) | ||||||||
| Increase (decrease) in cash and cash equivalents | 66 | 41 | (62 | ) | ||||||||
| Cash and cash equivalents, January 1 | 167 | 126 | 188 | |||||||||
| Cash and cash equivalents, December 31 (Note) | $ | 233 | $ | 167 | $ | 126 | ||||||
Supplemental Cash Flow Information | ||||||||||||
| Cash paid during the year for interest | $ | 149 | $ | 131 | $ | 117 | ||||||
| Cash paid during the year for income taxes (net of refunds) | 53 | 38 | 62 | |||||||||
Non-cash Investing and Financing Activities | ||||||||||||
| Period ended balance of payables for plant, property, and equipment | $ | 29 | $ | 26 | $ | 28 | ||||||
| Assumption of debt from business acquisition | — | — | 10 | |||||||||
| Supplemental Cash Flow Information | |||||||||||
| Cash paid during the year for interest | $ | 79 | $ | 100 | $ | 106 | |||||
| Cash paid during the year for income taxes (net of refunds) | 109 | 80 | 85 | ||||||||
| Non-cash Investing and Financing Activities | |||||||||||
| Period end balance of trade payables for plant, property, and equipment | $ | 52 | $ | 42 | $ | 35 | |||||
| Note: | Cash and cash equivalents include highly liquid investments with a maturity of three months or less at the date of purchase. |
80
| Year Ended December 31, | ||||||||||||||||||||||||
| 2010 | 2009 | 2008 | ||||||||||||||||||||||
| Shares | Amount | Shares | Amount | Shares | Amount | |||||||||||||||||||
| (Millions Except Share Amounts) | ||||||||||||||||||||||||
Common Stock | ||||||||||||||||||||||||
| Balance January 1 | 60,789,739 | $ | 1 | 48,314,490 | $ | — | 47,892,532 | $ | — | |||||||||||||||
| Issued | — | — | 12,000,000 | 1 | — | — | ||||||||||||||||||
| Issued pursuant to benefit plans | 142,643 | — | 283,195 | — | 238,982 | — | ||||||||||||||||||
| Stock options exercised | 609,378 | — | 192,054 | — | 182,976 | — | ||||||||||||||||||
| Balance December 31 | 61,541,760 | 1 | 60,789,739 | 1 | 48,314,490 | — | ||||||||||||||||||
Premium on Common Stock and Other Capital Surplus | ||||||||||||||||||||||||
| Balance January 1 | 3,005 | 2,809 | 2,800 | |||||||||||||||||||||
| Purchase of additional noncontrolling equity interest | (11 | ) | — | — | ||||||||||||||||||||
| Premium on common stock issued | — | 188 | — | |||||||||||||||||||||
| Premium on common stock issued pursuant to benefit plans | 14 | 8 | 9 | |||||||||||||||||||||
| Balance December 31 | 3,008 | 3,005 | 2,809 | |||||||||||||||||||||
Accumulated Other Comprehensive Loss | ||||||||||||||||||||||||
| Balance January 1 | (212 | ) | (318 | ) | (73 | ) | ||||||||||||||||||
| Other comprehensive income (loss) | (25 | ) | 106 | (245 | ) | |||||||||||||||||||
| Balance December 31 | (237 | ) | (212 | ) | (318 | ) | ||||||||||||||||||
Retained Earnings (Accumulated Deficit) | ||||||||||||||||||||||||
| Balance January 1 | (2,575 | ) | (2,502 | ) | (2,087 | ) | ||||||||||||||||||
| Net income (loss) attributable to Tenneco Inc. | 39 | (73 | ) | (415 | ) | |||||||||||||||||||
| Balance December 31 | (2,536 | ) | (2,575 | ) | (2,502 | ) | ||||||||||||||||||
Less — Common Stock Held as Treasury Stock, at Cost | ||||||||||||||||||||||||
| Balance January 1 and December 31 | 1,294,692 | 240 | 1,294,692 | 240 | 1,294,692 | 240 | ||||||||||||||||||
| Total Tenneco Inc. shareholders’ equity | $ | (4 | ) | $ | (21 | ) | $ | (251 | ) | |||||||||||||||
Noncontrolling interests: | ||||||||||||||||||||||||
| Balance January 1 | 32 | 24 | 25 | |||||||||||||||||||||
| Net income attributable to noncontrolling interests | 16 | 13 | 6 | |||||||||||||||||||||
| Sale of twenty percent equity interest to Tenneco Inc. | (4 | ) | — | — | ||||||||||||||||||||
| Other comprehensive income (loss) | 3 | — | — | |||||||||||||||||||||
| Dividends declared | (8 | ) | (5 | ) | (7 | ) | ||||||||||||||||||
| Balance December 31 | $ | 39 | $ | 32 | $ | 24 | ||||||||||||||||||
Total equity | $ | 35 | $ | 11 | $ | (227 | ) | |||||||||||||||||
81
| Year Ended December 31, 2010 | ||||||||||||||||||||||||
| Tenneco Inc. | Noncontrolling interests | Total | ||||||||||||||||||||||
| Accumulated | Accumulated | Accumulated | ||||||||||||||||||||||
| Other | Other | Other | ||||||||||||||||||||||
| Comprehensive | Comprehensive | Comprehensive | Comprehensive | Comprehensive | Comprehensive | |||||||||||||||||||
| Income | Income | Income | Income | Income | Income | |||||||||||||||||||
| (Loss) | (Loss) | (Loss) | (Loss) | (Loss) | (Loss) | |||||||||||||||||||
| (Millions) | ||||||||||||||||||||||||
Net Income | $ | 39 | $ | 24 | $ | 63 | ||||||||||||||||||
Accumulated Other Comprehensive Income (Loss) | ||||||||||||||||||||||||
Cumulative Translation Adjustment | ||||||||||||||||||||||||
| Balance January 1 | $ | 37 | $ | — | $ | 37 | ||||||||||||||||||
| Translation of foreign currency statements | (29 | ) | (29 | ) | 5 | 5 | (24 | ) | (24 | ) | ||||||||||||||
| Balance December 31 | 8 | 5 | 13 | |||||||||||||||||||||
Additional Liability for Pension and Postretirement Benefits | ||||||||||||||||||||||||
| Balance January 1 | (249 | ) | — | (249 | ) | |||||||||||||||||||
| Additional Liability for Pension and Postretirement benefits, net of tax | (1 | ) | (1 | ) | (1 | ) | (1 | ) | ||||||||||||||||
| Balance December 31 | (250 | ) | (250 | ) | ||||||||||||||||||||
| Balance December 31 | $ | (242 | ) | $ | 5 | $ | (237 | ) | ||||||||||||||||
| Other comprehensive income (loss) | (30 | ) | 5 | (25 | ) | |||||||||||||||||||
Comprehensive Income | $ | 9 | $ | 29 | $ | 38 | ||||||||||||||||||
82
| Year Ended December 31, 2009 | ||||||||||||||||||||||||
| Tenneco Inc. | Noncontrolling interests | Total | ||||||||||||||||||||||
| Accumulated | Accumulated | Accumulated | ||||||||||||||||||||||
| Other | Other | Other | ||||||||||||||||||||||
| Comprehensive | Comprehensive | Comprehensive | Comprehensive | Comprehensive | Comprehensive | |||||||||||||||||||
| Income | Income | Income | Income | Income | Income | |||||||||||||||||||
| (Loss) | (Loss) | (Loss) | (Loss) | (Loss) | (Loss) | |||||||||||||||||||
| (Millions) | ||||||||||||||||||||||||
Net Income (Loss) | $ | (73 | ) | $ | 19 | $ | (54 | ) | ||||||||||||||||
Accumulated Other Comprehensive Income (Loss) | ||||||||||||||||||||||||
Cumulative Translation Adjustment | ||||||||||||||||||||||||
| Balance January 1 | $ | (42 | ) | $ | — | $ | (42 | ) | ||||||||||||||||
| Translation of foreign currency statements | 79 | 79 | — | — | 79 | 79 | ||||||||||||||||||
| Balance December 31 | 37 | — | 37 | |||||||||||||||||||||
Additional Liability for Pension and Postretirement Benefits | ||||||||||||||||||||||||
| Balance January 1 | (276 | ) | — | (276 | ) | |||||||||||||||||||
| Additional liability for pension and postretirement benefits, net of tax of $1 million | 27 | 27 | 27 | 27 | ||||||||||||||||||||
| Balance December 31 | (249 | ) | (249 | ) | ||||||||||||||||||||
| Balance December 31 | $ | (212 | ) | $ | — | $ | (212 | ) | ||||||||||||||||
| Other comprehensive income (loss) | 106 | — | 106 | |||||||||||||||||||||
Comprehensive Income (Loss) | $ | 33 | $ | 19 | $ | 52 | ||||||||||||||||||
The accompanying notes to consolidated financial statements are an integral
part of these statements of comprehensive income (loss).cash flows.
83
75
TENNECO INC.
CONSOLIDATED STATEMENTS OF COMPREHENSIVE INCOME (LOSS)CHANGES IN SHAREHOLDERS’ EQUITY
| Year Ended December 31, 2008 | ||||||||||||||||||||||||
| Tenneco Inc. | Noncontrolling interests | Total | ||||||||||||||||||||||
| Accumulated | Accumulated | Accumulated | ||||||||||||||||||||||
| Other | Other | Other | ||||||||||||||||||||||
| Comprehensive | Comprehensive | Comprehensive | Comprehensive | Comprehensive | Comprehensive | |||||||||||||||||||
| Income | Income | Income | Income | Income | Income | |||||||||||||||||||
| (Loss) | (Loss) | (Loss) | (Loss) | (Loss) | (Loss) | |||||||||||||||||||
| (Millions) | ||||||||||||||||||||||||
Net Income (Loss) | $ | (415 | ) | $ | 10 | $ | (405 | ) | ||||||||||||||||
Accumulated Other Comprehensive Income (Loss) | ||||||||||||||||||||||||
Cumulative Translation Adjustment | ||||||||||||||||||||||||
| Balance January 1 | $ | 85 | $ | — | $ | 85 | ||||||||||||||||||
| Translation of foreign currency statements | (127 | ) | (127 | ) | — | — | (127 | ) | (127 | ) | ||||||||||||||
| Balance December 31 | (42 | ) | — | (42 | ) | |||||||||||||||||||
Additional Liability for Pension and Postretirement Benefits | ||||||||||||||||||||||||
| Balance January 1 | (158 | ) | — | (158 | ) | |||||||||||||||||||
| Additional liability for pension and postretirement benefits, net of tax of $9 million | (118 | ) | (118 | ) | (118 | ) | (118 | ) | ||||||||||||||||
| Balance December 31 | (276 | ) | (276 | ) | ||||||||||||||||||||
| Balance December 31 | $ | (318 | ) | $ | — | $ | (318 | ) | ||||||||||||||||
| Other comprehensive income (loss) | (245 | ) | — | (245 | ) | |||||||||||||||||||
Comprehensive Income (Loss) | $ | (660 | ) | $ | 10 | $ | (650 | ) | ||||||||||||||||
| Year Ended December 31, | ||||||||||||||||||||
| 2013 | 2012 | 2011 | ||||||||||||||||||
| Shares | Amount | Shares | Amount | Shares | Amount | |||||||||||||||
| (Millions Except Share Amounts) | ||||||||||||||||||||
| Common Stock | ||||||||||||||||||||
| Balance January 1 | 62,789,382 | $ | 1 | 62,101,335 | $ | 1 | 61,541,760 | $ | 1 | |||||||||||
| Issued | — | — | — | — | — | — | ||||||||||||||
| Issued pursuant to benefit plans | 156,213 | — | 149,398 | — | 49,871 | — | ||||||||||||||
| Stock options exercised | 769,133 | — | 538,649 | — | 509,704 | — | ||||||||||||||
| Balance December 31 | 63,714,728 | 1 | 62,789,382 | 1 | 62,101,335 | 1 | ||||||||||||||
| Premium on Common Stock and Other Capital Surplus | ||||||||||||||||||||
| Balance January 1 | 3,031 | 3,016 | 3,008 | |||||||||||||||||
| Purchase of noncontrolling equity interest | (68 | ) | — | (2 | ) | |||||||||||||||
| Premium on common stock issued pursuant to benefit plans | 51 | 15 | 10 | |||||||||||||||||
| Balance December 31 | 3,014 | 3,031 | 3,016 | |||||||||||||||||
| Accumulated Other Comprehensive Loss | ||||||||||||||||||||
| Balance January 1 | (408 | ) | (382 | ) | (237 | ) | ||||||||||||||
| Other comprehensive loss | 48 | (26 | ) | (145 | ) | |||||||||||||||
| Balance December 31 | (360 | ) | (408 | ) | (382 | ) | ||||||||||||||
| Retained Earnings (Accumulated Deficit) | ||||||||||||||||||||
| Balance January 1 | (2,104 | ) | (2,379 | ) | (2,536 | ) | ||||||||||||||
| Net income attributable to Tenneco Inc. | 183 | 275 | 157 | |||||||||||||||||
| Balance December 31 | (1,921 | ) | (2,104 | ) | (2,379 | ) | ||||||||||||||
| Less — Common Stock Held as Treasury Stock, at Cost | ||||||||||||||||||||
| Balance January 1 | 2,294,692 | 274 | 1,694,692 | 256 | 1,294,692 | 240 | ||||||||||||||
| Purchase of common stock through stock repurchase program | 550,000 | 27 | 600,000 | 18 | 400,000 | 16 | ||||||||||||||
| Balance December 31 | 2,844,692 | 301 | 2,294,692 | 274 | 1,694,692 | 256 | ||||||||||||||
| Total Tenneco Inc. shareholders’ equity | $ | 433 | $ | 246 | $ | — | ||||||||||||||
| Noncontrolling interests: | ||||||||||||||||||||
| Balance January 1 | 45 | 43 | 39 | |||||||||||||||||
| Net income | 24 | 20 | 19 | |||||||||||||||||
| Capital contribution | — | 3 | — | |||||||||||||||||
| Sale of noncontrolling equity interest | (1 | ) | — | — | ||||||||||||||||
| Other comprehensive income (loss) | — | 1 | (1 | ) | ||||||||||||||||
| Dividends declared | (29 | ) | (22 | ) | (14 | ) | ||||||||||||||
| Balance December 31 | $ | 39 | $ | 45 | $ | 43 | ||||||||||||||
| Total equity | $ | 472 | $ | 291 | $ | 43 | ||||||||||||||
The accompanying notes to consolidated financial statements are an integral
part of these statements of comprehensive income (loss).changes in shareholders’ equity.
84
76
TENNECO INC.
1. | Summary of Accounting Policies |
Consolidation and Presentation
Our consolidated financial statements include all majority-owned subsidiaries. We carry investments in 20 percent to 50 percent owned companies in which the Company does not have a controlling interest, as equity method investments, at cost plus equity in undistributed earnings since the date of acquisition and cumulative translation adjustments. We have eliminated intercompany transactions. We have evaluated all subsequent events through the date our financial statements were issued.
Use of Estimates
The preparation of financial statements in conformity with accounting principles generally accepted in the United States of America requires us to make estimates and assumptions that affect the reported amounts of assets and liabilities and disclosure of contingent assets and liabilities at the date of the consolidated financial statements and the reported amounts of revenues and expenses during the reporting period. These estimates include, among others allowances for doubtful receivables, promotional and product returns, pension and post-retirementpostretirement benefit plans, income taxes, and contingencies. These items are covered in more detail elsewhere in Note 1, Note 7, Note 10, and Note 12 of the consolidated financial statements of Tenneco Inc. Actual results could differ from those estimates.
Redeemable Noncontrolling Interests
In August 2011, we purchased the remaining 25 percent equity interest in our financial statement presentation and disclosureclean air joint venture in Thailand for $4 million in cash. As a result of noncontrollingthis purchase, our equity ownership interests on ourof this joint venture investment changed to 100 percent from 75 percent. Refer to Note 3 of the consolidated financial statements of income (loss), consolidated statements of comprehensive income (loss) and consolidated statements of changes in shareholders’ equity in accordance with these new disclosure requirements.
Tenneco Inc. for additional details.
The following is a rollforward of activity in our redeemable noncontrolling interests for the years ending December 31, 2010, 20092013, 2012 and 2008,2011, respectively:
| 2010 | 2009 | 2008 | ||||||||||
| (Millions) | ||||||||||||
| Balance January 1 | $ | 7 | $ | 7 | $ | 6 | ||||||
| Net income attributable to redeemable noncontrolling interests | 8 | 5 | 4 | |||||||||
| Other comprehensive income (loss) | 2 | — | — | |||||||||
| Dividends declared | (5 | ) | (5 | ) | (3 | ) | ||||||
| Balance December 31 | $ | 12 | $ | 7 | $ | 7 | ||||||
85
| 2013 | 2012 | 2011 | |||||||||
| (Millions) | |||||||||||
| Balance January 1 | $ | 15 | $ | 12 | $ | 12 | |||||
| Net income attributable to redeemable noncontrolling interests | 14 | 9 | 7 | ||||||||
| Sale of 25 percent equity interest to Tenneco Inc | — | — | (2 | ) | |||||||
| Capital Contributions | — | 2 | 1 | ||||||||
| Dividends declared | (9 | ) | (8 | ) | (6 | ) | |||||
| Balance December 31 | $ | 20 | $ | 15 | $ | 12 | |||||
Inventories
At December 31, 20102013 and 2009,2012, inventory by major classification was as follows:
| 2010 | 2009 | |||||||
| (Millions) | ||||||||
| Finished goods | $ | 222 | $ | 175 | ||||
| Work in process | 164 | 116 | ||||||
| Raw materials | 118 | 95 | ||||||
| Materials and supplies | 43 | 42 | ||||||
| $ | 547 | $ | 428 | |||||
| 2013 | 2012 | ||||||
| (Millions) | |||||||
| Finished goods | $ | 267 | $ | 273 | |||
| Work in process | 202 | 207 | |||||
| Raw materials | 130 | 133 | |||||
| Materials and supplies | 57 | 54 | |||||
| $ | 656 | $ | 667 | ||||
Our inventories are stated at the lower of cost or market value using thefirst-in, first-out (“FIFO”) or average cost methods.
Goodwill and Intangibles, net
77
We evaluate goodwill for impairment in the fourth quarter of each year, or more frequently if events indicate it is warranted. The goodwill impairment test consists of a two-step process. In step one, we compare the estimated fair value of our reporting units with goodwill to the carrying value of the unit’s assets and liabilities to determine if impairment exists within the recorded balance of goodwill. We estimate the fair value of each reporting unit using the income approach which is based on the present value of estimated future cash flows. The income approach is dependent on a number of factors, including estimates of market trends, forecasted revenues and expenses, capital expenditures, weighted average cost of capital and other variables. A separate discount rate derived by a combination of published sources, internal estimates and weighted based on our debt andto equity structure,ratio, was used to calculate the discounted cash flows for each of our reporting units. These estimates are based on assumptions that we believe to be reasonable, but which are inherently uncertain and outside of the control of management. If the carrying value of the reporting unit is higher than its fair value, there is an indication that impairment may exist which requires step two to be performed to measure the amount of the impairment loss. The amount of impairment is determined by comparing the implied fair value of a reporting unit’s goodwill to its carrying value.
During the third quarter of 2011, we performed an impairment evaluation of our Australian reporting unit’s goodwill balance as a result of continued deterioration of that reporting unit’s financial performance driven primarily by significant declines in industry production volumes in that region. As a result of performing steps one and two of the goodwill impairment test, we concluded that the remaining amount of goodwill related to our Australian reporting unit was impaired and accordingly, we recorded a goodwill impairment charge of $11 million during the third quarter of 2011.
In the fourth quarter of 2009,2013 and 2012, as a result of our annual goodwill impairment testing, the estimated fair value of each of our reporting units significantly exceeded the carrying value of itstheir assets and liabilities. In the fourth quarter of 2010, the estimated fair value of all of our reporting units, except for our Australian reporting unit, significantly exceeded the carrying value of its assets and liabilities. Our Australian reporting unit had a goodwill balance of $11 million with an estimated fair value in excess of its net carrying value of one percentliabilities as of the testing date. Although our Australian operations support the value of goodwill reported as tested in the fourth quarter of 2010, it is possible that assumptions and estimates could change in future periods and result in a future impairment of our Australian reporting unit.
86
The changes in the net carrying amount of goodwill for the years ended December 31, 20102013 and 20092012 were as follows:
| Year Ended December 31, 2010 | ||||||||||||||||
| Europe, | ||||||||||||||||
| South | ||||||||||||||||
| North | America | Asia | ||||||||||||||
| America | and India | Pacific | Total | |||||||||||||
| (Millions) | ||||||||||||||||
| Balance as January 1 | ||||||||||||||||
| Goodwill | $ | 330 | $ | 87 | $ | 10 | $ | 427 | ||||||||
| Accumulated impairment losses | (306 | ) | (32 | ) | — | (338 | ) | |||||||||
| 24 | 55 | 10 | 89 | |||||||||||||
| Translation adjustments | — | (1 | ) | 1 | — | |||||||||||
| Balance at December 31 | ||||||||||||||||
| Goodwill | 330 | 85 | 12 | 427 | ||||||||||||
| Accumulated impairment losses | (306 | ) | (31 | ) | (1 | ) | (338 | ) | ||||||||
| $ | 24 | $ | 54 | $ | 11 | $ | 89 | |||||||||
| Year Ended December 31, 2009 | ||||||||||||||||
| Europe, | ||||||||||||||||
| South | ||||||||||||||||
| North | America | Asia | ||||||||||||||
| America | and India | Pacific | Total | |||||||||||||
| (Millions) | ||||||||||||||||
| Balance as January 1 | ||||||||||||||||
| Goodwill | $ | 330 | $ | 95 | $ | 8 | $ | 433 | ||||||||
| Accumulated impairment losses | (306 | ) | (32 | ) | — | (338 | ) | |||||||||
| 24 | 63 | 8 | 95 | |||||||||||||
| Acquisition of business opening balance sheet adjustments | — | (10 | ) | — | (10 | ) | ||||||||||
| Translation adjustments | — | 2 | 2 | 4 | ||||||||||||
| Balance at December 31 | ||||||||||||||||
| Goodwill | 330 | 87 | 10 | 427 | ||||||||||||
| Accumulated impairment losses | (306 | ) | (32 | ) | — | (338 | ) | |||||||||
| $ | 24 | $ | 55 | $ | 10 | $ | 89 | |||||||||
| Clean Air Division | Ride Performance Division | ||||||||||||||||||||||||||
| North America | Europe, South America & India | Asia Pacific | North America | Europe, South America & India | Asia Pacific | Total | |||||||||||||||||||||
| (Millions) | |||||||||||||||||||||||||||
| Balance at December 31, 2011 | $ | 15 | $ | 13 | $ | — | $ | 10 | $ | 36 | $ | — | $ | 74 | |||||||||||||
| Translation Adjustment | (1 | ) | — | — | — | (1 | ) | — | (2 | ) | |||||||||||||||||
| Balance at December 31, 2012 | 14 | 14 | — | 10 | 34 | — | 72 | ||||||||||||||||||||
| Translation Adjustment | — | — | — | — | (3 | ) | — | (3 | ) | ||||||||||||||||||
| Balance at December 31, 2013 | 14 | 14 | — | 10 | 31 | — | 69 | ||||||||||||||||||||
We have capitalized certain intangible assets, primarily technology rights, trademarks and patents, based on their estimated fair value at the date we acquired them. We amortize our finite useful life intangible assets on a straight-line basis over periods ranging from 5 to 50 years. Amortization of intangibles amounted to $2$5 million in each of 20102013 and 20092012, and $3$2 million in 2008,2011, and isare included in the statements of income
87
caption “Depreciation and amortization of intangibles.” The carrying amount and accumulated amortization of our finite useful life intangible assets were as follows:
| December 31, 2010 | December 31, 2009 | |||||||||||||||
| Gross Carrying | Accumulated | Gross Carrying | Accumulated | |||||||||||||
| Value | Amortization | Value | Amortization | |||||||||||||
| (Millions) | (Millions) | |||||||||||||||
| Customer contract | $ | 8 | $ | (2 | ) | $ | 8 | $ | (2 | ) | ||||||
| Patents | 5 | (4 | ) | 4 | (3 | ) | ||||||||||
| Technology rights | 21 | (5 | ) | 22 | (5 | ) | ||||||||||
| Other | 6 | (1 | ) | 2 | — | |||||||||||
| Total | $ | 40 | $ | (12 | ) | $ | 36 | $ | (10 | ) | ||||||
| December 31, 2013 | December 31, 2012 | ||||||||||||||
| Gross Carrying Value | Accumulated Amortization | Gross Carrying Value | Accumulated Amortization | ||||||||||||
| (Millions) | (Millions) | ||||||||||||||
| Customer contract | $ | 8 | $ | (4 | ) | $ | 8 | $ | (3 | ) | |||||
| Patents | 3 | (2 | ) | 3 | (1 | ) | |||||||||
| Technology rights | 26 | (12 | ) | 26 | (7 | ) | |||||||||
| Other | 11 | (1 | ) | 11 | (1 | ) | |||||||||
| Total | $ | 48 | $ | (19 | ) | $ | 48 | $ | (12 | ) | |||||
Estimated amortization of intangible assets over the next five years is expected to be $2$3 million in 2011 and 2012,2014, $5 million in 2015, $4 million in 20132016, $3 million in 2017 and 2014 and $3$2 million in 2015.2018. We have capitalized indefinite life intangibles of $4$1 million relating to purchased trademarks from our Marzocchi® acquisition in 2007.2008.
Plant, Property, and Equipment, at Cost
78
At December 31, 20102013 and 2009,2012, plant, property, and equipment, at cost, by major category were as follows:
| 2010 | 2009 | |||||||
| (Millions) | ||||||||
| Land, buildings, and improvements | $ | 524 | $ | 516 | ||||
| Machinery and equipment | 2,406 | 2,431 | ||||||
| Other, including construction in progress | 179 | 152 | ||||||
| $ | 3,109 | $ | 3,099 | |||||
| 2013 | 2012 | ||||||
| (Millions) | |||||||
| Land, buildings, and improvements | $ | 579 | $ | 563 | |||
| Machinery and equipment | 2,673 | 2,574 | |||||
| Other, including construction in progress | 246 | 228 | |||||
| $ | 3,498 | $ | 3,365 | ||||
We depreciate these properties excluding land on a straight-line basis over the estimated useful lives of the assets. Useful lives range from 10 to 50 years for buildings and improvements and from three3 to 25 years for machinery and equipment.
Notes and Accounts Receivable and Allowance for Doubtful Accounts
Receivables consist of amounts billed and currently due from customers and unbilled pre-production design and development costs. Short and long-term accounts receivable outstanding were $823$1,065 million and $602$980 million at December 31, 20102013 and 2009,2012, respectively. The allowance for doubtful accounts on short-term and long-term accounts receivable was $20$14 million and $22 million at both December 31, 20102013 and 2009,2012, respectively. Short and long-term notes receivable outstanding were $2$5 million and $3$3 million at December 31, 20102013 and 2009,2012, respectively. The allowance for doubtful accounts on short-term and long-term notes receivable was zero and $3 million at both December 31, 20102013 and 2009, respectively.2012.
Pre-production Design and Development and Tooling Assets
We expense pre-production design and development costs as incurred unless we have a contractual guarantee for reimbursement from the original equipment customer. Unbilled pre-production design and development costs recorded in prepayments and other and long-term receivables was $15were $30 million and $14$25 million on at December 31, 20102013 and 2009,2012, respectively. In addition, plant, property and equipment included $38$59 million and $49$50 million at both December 31, 20102013 and 2009,2012, respectively, for original equipment tools and
88
dies that we own, and prepayments and other included $46$86 million and $50$66 million at December 31, 20102013 and 2009,2012, respectively, for in-process tools and dies that we are building for our original equipment customers.
Internal Use Software Assets
We capitalize certain costs related to the purchase and development of software that we use in our business operations. We amortize the costs attributable to these software systems over their estimated useful lives, ranging from 3 to 12 years, based on various factors such as the effects of obsolescence, technology, and other economic factors. Capitalized software development costs, net of amortization, were $53$55 million and $60$58 million at December 31, 20102013 and 2009,2012, respectively, and are recorded in other long-term assets. Amortization of software development costs was approximately $18$15 million $22, $15 million and $24$18 million for the years ended December 31, 2010, 20092013, 2012 and 2008,2011, respectively, and is included in the statements of income (loss) caption “Depreciation and amortization of intangibles.” Additions to capitalized software development costs, including payroll and payroll-related costs for those employees directly associated with developing and obtaining the internal use software, are classified as investing activities in the statements of cash flows.
Income Taxes
We reported income tax expenses of $122 million, $19 million and $88 million in the years ended 2013, 2012 and 2011, respectively. The tax expense recorded in 2013 includes a net tax benefit of $25 million primarily for tax adjustments related to recognizing a U.S. tax benefit for foreign taxes and changes to prior year estimates.
We evaluate our deferred income taxes quarterly to determine if valuation allowances are required or should be adjusted. U.S. GAAP requires that companies assess whether valuation allowances should be established against their deferred tax assets based on consideration of all available evidence, both positive and negative, using a “more likely than not” standard. This assessment considers, among other matters, the nature, frequency and amount of recent losses, the duration of statutory carryforward periods, and tax planning strategies. In making such judgments, significant weight is given to evidence that can be objectively verified.
In 2012, we reversed the tax valuation allowance that we recorded in 2008 against our net deferred tax assets in the U.S. based on operating improvements we had made, the outlook for light and commercial vehicle production in the U.S. and the positive impact this should have on our U.S. operations. The net income impact of the tax valuation allowance release in the U.S. was a tax benefit of approximately $81 million.
Valuation allowances have been established in certain foreign jurisdictions for deferred tax assets based on a “more likely than not” threshold. The ability to realize deferred tax assets depends on our ability to generate sufficient taxable income within
79
the carryforward periods provided for in the tax law for each tax jurisdiction. We have considered the following possible sources of taxable income when assessing the realization of our deferred tax assets:
| Future reversals of existing taxable temporary differences; | ||
Tax-planning strategies; and
Taxable income in prior carryback years if carryback is permitted under the relevant tax expense of $69 million. law.
The tax expensevaluation allowances recorded differs from the expense that would be recorded using a U.S. Federal statutory rate of 35 percent due to the impact of not benefiting tax losses in the U.S. and certain foreign jurisdictions, and charges primarily related to adjustments to prior year income taxes and tax contingencies which more than offset a favorable mix of tax rates in the jurisdictions we pay taxes. During 2010, we recorded a $52 million reduction in our valuation allowance related to the utilization of U.S. NOLs resulting from a reorganization of our European operations. In evaluating the requirements to record a valuation allowance, accounting standards do not permit us to consider an economic recovery in the U.S. or new business we have won. Consequently, beginning in 2008, given our historical losses, we concluded that our ability to fully utilize our NOLs was limited due to projecting the continuation of the negative economic environment and the impact of the negative operating environment on our tax planning strategies. As a result of our tax planning strategies which have not yet been implemented and which do not depend upon generating future taxable income, we carry deferred tax assets in the U.S. of $90 million relating to the expected utilization of those NOLs. The federal NOLs expire beginning in tax years ending in 2020 through 2029. The state NOLs expire in various tax years through 2029.
89
Revenue Recognition
We recognize revenue for sales to our original equipment and aftermarket customers when title and risk of loss passes to the customers under the terms of our arrangements with those customers, which is usually at the time of shipment from our plants or distribution centers. Generally, in connection with the sale of exhaust systems to certain original equipment manufacturers, we purchase catalytic converters and diesel particulate filters or components thereof including precious metals (“substrates”) on behalf of our customers which are used in the assembled system. These substrates are included in our inventory and “passed through” to the customer at our cost, plus a small margin, since we take title to the inventory and are responsible for both the delivery and quality of the finished product. Revenues recognized for substrate sales were $1,297$1,835 million $966, $1,660 million and $1,492$1,678 million in 2010, 20092013, 2012 and 2008,2011, respectively. For our aftermarket customers, we provide for promotional incentives and returns at the time of sale. Estimates are based upon the terms of the incentives and historical experience with returns. Certain taxes assessed by governmental authorities on revenue producing transactions, such as value added taxes, are excluded from revenue and recorded on a net basis. Shipping and handling costs billed to customers are included in revenues and the related costs are included in cost of sales in our Statementsconsolidated statements of Income (Loss)income (loss).
Warranty Reserves
Where we have offered product warranty, we also provide for warranty costs. Provisions for estimated expenses related to product warranty are made at the time products are sold or when specific warranty issues are identified on OE products. These estimates are established using historical information about the nature, frequency, and average cost of warranty claims and upon specific warranty issues as they arise. The warranty terms vary but range from one year up to limited lifetime warranties on some of our premium aftermarket products. We actively study trends of our warranty claims and take action to improve product quality and minimize warranty claims. While we have not experienced any material differences between these estimates and our actual costs, it is reasonably possible that future warranty issues could arise that could have a significant impact on our consolidated financial statements.
Earnings Per Share
We compute basic earnings per share by dividing income available to common shareholders by the weighted-average number of common shares outstanding. The computation of diluted earnings per share is similar to the computation of basic earnings per share, except that we adjust the weighted-average number of shares outstanding to include estimates of additional shares that would be issued if potentially dilutive common shares had been issued. In addition, we adjust income available to common shareholders to include any changes in income or loss that would result from the assumed issuance of the dilutive common shares. Due to the net losses for the years ended December 31, 2009 and 2008, respectively, the calculation of diluted
90
Engineering, Research and Development
We expense engineering, research, and development costs as they are incurred. Engineering, research, and development expenses were $117$144 million for 2010, $972013, $126 million for 20092012, and $127$133 million for 2008,2011, net of reimbursements from our customers. Our customers reimburse us for engineering, research, and development costs on some platforms when we prepare prototypes and incur costs before platform awards. Our engineering, research, and development expense for 2010, 2009,2013, 2012 and 20082011 has been reduced by $110$169 million $104, $159 million and $120$119 million, respectively, for these reimbursements.
Advertising and Promotion Expenses
We expense advertising and promotion expenses as they are incurred. Advertising and promotion expenses were $59$53 million $50, $54 million, and $49$61 million for the years ended December 31, 2010, 2009,2013, 2012, and 2008,2011, respectively.
Foreign Currency Translation
80
We translate the consolidated financial statements of foreign subsidiaries into U.S. dollars using the exchange rate at each balance sheet date for assets and liabilities and a weighted-average exchange rate for revenues and expenses in each period. We record translation adjustments for those subsidiaries whose local currency is their functional currency as a component of accumulated other comprehensive lossincome (loss) in shareholders’ equity. We recognize transaction gains and losses arising from fluctuations in currency exchange rates on transactions denominated in currencies other than the functional currency in earnings as incurred, except for those transactions which hedge purchase commitments and for those intercompany balances which are designated as long-term investments. Our results include foreign currency transaction losses of less than $1$13 million in 2013, of $8 million in 2012 and $3 million in 2010, $4 million2011. The amounts are recorded in 2009, and $11 million in 2008, respectively.cost of sales.
Risk Management Activities
We use derivative financial instruments, principally foreign currency forward purchase and sales contracts with terms of less than one year, to hedge our exposure to changes in foreign currency exchange rates. Our primary exposure to changes in foreign currency rates results from intercompany loans made between affiliates to minimize the need for borrowings from third parties. Additionally, we enter into foreign currency forward purchase and sale contracts to mitigate our exposure to changes in exchange rates on certain intercompany and third-party trade receivables and payables. We manage counter-party credit risk by entering into derivative financial instruments with major financial institutions that can be expected to fully perform under the terms of such agreements. We do not enter into derivative financial instruments for speculative purposes. In managing our foreign currency exposures, we identify and aggregate existing offsetting positions and then hedge residual exposures through third-party derivative contracts. The fair value of our foreign currency forward contracts was a net liability position of less than $1 million at December 31, 2013 and is based on an internally developed model which incorporates observable inputs including quoted spot rates, forward exchange rates and discounted future expected cash flows utilizing market interest rates with similar quality and maturity characteristics. We record the change in fair value of these foreign exchange forward contracts as part of currency gains (losses) within cost of sales in the consolidated statements of income (loss). The fair value of foreign exchange forward contracts are recorded in prepayments and other current assets or other current liabilities in the consolidated balance sheet.
In July 2010,2013, the Financial Accounting StandardStandards Board (FASB)(“FASB”) issued new accountingan amendment to provide explicit guidance on the disclosurefinancial statement presentation of an unrecognized tax benefit when a company’snet operating loss carryforward, similar tax loss, or tax credit quality of financing receivables and the allowance for credit losses. Additional disclosure is required for financing receivables on a disaggregated basis including a rollforward
91
In June 2009,April 2013, the FASB issued new accounting guidance which changesan amendment to clarify when an entity should apply the accounting for transfersliquidation basis of financial assets, by eliminating the concept of a qualifying special purpose entity (QSPE), clarifying and amending the derecognition criteria for a transfer to be accounted for as a sale, amending and clarifying the unit of account eligible for sale accounting and requiring that a transferor initially measure at fair value and recognize allto provide principles for the measurement of assets obtained and liabilities incurredunder the liquidation basis of accounting, as a result of a transfer of a financial asset or group of financial assets accounted forwell as a sale. Additionally,any required disclosures. The amendment applies to all existing QSPE’s must be evaluated for consolidation by reporting entities in accordance with the applicable consolidation guidance. The new accounting guidance requires additional disclosures about a transferor’s continuing involvement with transfers of financial assets accounted for as a sale, the risks inherent in the transferred financial assets that have been retained, and the nature and financial effect of restrictions on the transferor’s assets that continue to be reported in the statement of financial position. The new accounting guidance was effective for a reporting entity’s first annual reporting period that begins after November 15, 2009, and for interim and annual reporting periods thereafter. We have adopted this new accounting guidance on January 1, 2010. Prior to the adoption of this new accounting guidance, our securitized accounts receivable programs qualified for sales accounting treatment. The discount fees charged by the factor banks were recorded as a loss on sale of receivables in our consolidated statements of income (loss). Based on the new accounting rules, effective January 1, 2010, we account for our North American securitization programs as a secured borrowing as we no longer meet the conditions required for sales accounting treatment. Our European securitization programs continue to qualify for sales accounting treatment under these new accounting rules. We have disclosed the impact of this accounting rule change on our consolidatedissue financial statements and added additional disclosures as requiredthat are presented in conformity with U.S. GAAP except investment companies that are regulated under this new accounting guidance in Footnote 5the Investment Company Act of our notes to consolidated financial statements.
In February 2013, the FASB issued an amendment to resolve the diversity in practice about whether Subtopic 810-10, Consolidation-Overall, or Subtopic 830-30, Foreign Currency Matters-Translation of Financial Statements, applies to the release of the cumulative translation adjustment into net income when a parent either sells a part of all of its investment in a foreign entity or no longer holds a controlling financial interest in a subsidiary or group of assets that is a nonprofit activity or a business (other than a sale of in substance real state or conveyance of oil and gas mineral rights) within a foreign entity. In addition, the amendments resolve the diversity in practice for the treatment of business combinations achieved in stages (sometimes also referred to as step acquisitions) involving a foreign entity. This amendment is effective for reporting periods beginning after December 15, 2013. Adoption of the amendment will not have any impact on our consolidated financial statements.
In February 2013, the FASB issued an amendment to the accounting guidance for the recognition, measurement, and disclosure of obligations resulting from joint and several liability arrangements for which the total amount of the obligation is fixed at the reporting date, except for obligations addressed within existing guidance in U.S. GAAP. The guidance requires an entity to measure those obligations as the sum of the amount the reporting entity agreed to pay on the basis of its arrangement amount its co-obligors and any additional amount the reporting entity expects to pay on behalf of its co-obligors. The guidance in this amendment also requires an entity to disclose the nature and amount of the obligation as well as other information about those obligations. This amendment is effective for reporting periods beginning after December 15, 2013. Adoption of the amendment will not have any impact on our consolidated financial statements.
81
In February 2013, the FASB issued an amendment to the accounting guidance to improve the transparency of reporting amounts reclassified out of other comprehensive income. Other comprehensive income (loss) includes gains and losses that are initially excluded from net income for an accounting period. Those gains and losses are later reclassified out of accumulated other comprehensive income into net income. This amendment does not change the current requirements for reporting net income or other comprehensive income in the financial statements. All of the information that this amendment requires already is required to be disclosed elsewhere in the financial statements under U.S. GAAP. This new amendment requires presentation either on the face of the statement where net income is presented or in the notes, the effects of significant amounts reclassified out of accumulated other comprehensive income, and that the reclassified amounts be cross-referenced to the other disclosures required under U.S. GAAP. This amendment was effective for reporting periods beginning after December 15, 2012. This amendment has not had a material impact on our condensed consolidated financial statements.
In December 2011, the FASB issued an amendment relating to the disclosure about offsetting assets and liabilities. This amendment requires disclosure to provide information to help reconcile differences in the offsetting requirements under U.S. GAAP and International Financial Reporting Standards ("IFRS"). A reporting entity will be required to disclose (1) the gross amount of recognized assets and liabilities, (2) the amounts offset to determine the net amounts presented in the statement of financial position, (3) the net amounts presented in the statement of financial position, (4) the amounts subject to an enforceable master netting arrangement or similar agreement not otherwise included in (2), and (5) the net amount after deducting the amounts in (4) and (3). This amendment was effective for a reporting entity’s interim and annual periods beginning on or after January 1, 2013. Following issuance of this amendment, considerable concerns were raised regarding the broad scope of this amendment. In response to the concerns, in January, 2013, the FASB issued a new amendment revising the scope of the disclosure requirements to apply only to derivatives, repurchase agreements and reverse repurchase agreements, and security borrowing and lending transactions subject to a master netting arrangement or similar agreement. As a result of this new amendment the disclosure about offsetting assets and liabilities did not have any impact to our consolidated financial statements.
Restricted Net Assets
In certain countries where we operate, transfers of funds out of such countries by way of dividends, loans or advances are subject to certain central bank restrictions which require approval from the central bank authorities prior to transferring funds out of these countries. The countries in which we operate that have such restrictions include Argentina, China, South Africa, and Thailand. The net asset balance of our subsidiaries in the countries in which we operate that have such restrictions was $177 million and $183 million as of December 31, 2013 and 2012, respectively. These central banking restrictions do not have a significant effect on our ability to manage liquidity on a global basis.
2. | Earnings |
Earnings (loss) per share of common stock outstanding were computed as follows:
| Year Ended December 31, | ||||||||||||
| 2010 | 2009 | 2008 | ||||||||||
| (Millions Except Share and Per Share Amounts) | ||||||||||||
| Basic earnings (loss) per share — | ||||||||||||
| Net earnings (loss) attributable to Tenneco Inc. | $ | 39 | $ | (73 | ) | $ | (415 | ) | ||||
| Weighted average shares of common stock outstanding | 59,208,103 | 48,572,463 | 46,406,095 | |||||||||
| Earnings (loss) per average share of common stock | $ | 0.65 | $ | (1.50 | ) | $ | (8.95 | ) | ||||
| Diluted earnings (loss) per share — | ||||||||||||
| Net earnings (loss) attributable to Tenneco Inc. | $ | 39 | $ | (73 | ) | $ | (415 | ) | ||||
| Weighted average shares of common stock outstanding | 59,208,103 | 48,572,463 | 46,406,095 | |||||||||
| Effect of dilutive securities: | ||||||||||||
| Restricted stock | 441,561 | — | — | |||||||||
| Stock options | 1,349,030 | — | — | |||||||||
| Weighted average shares of common stock outstanding including dilutive securities | 60,998,694 | 48,572,463 | 46,406,095 | |||||||||
| Earnings (loss) per average share of common stock | $ | 0.63 | $ | (1.50 | ) | $ | (8.95 | ) | ||||
| Year Ended December 31, | |||||||||||
| 2013 | 2012 | 2011 | |||||||||
| (Millions Except Share and Per Share Amounts) | |||||||||||
| Basic earnings per share — | |||||||||||
| Net income attributable to Tenneco Inc. | $ | 183 | $ | 275 | $ | 157 | |||||
| Average shares of common stock outstanding | 60,474,492 | 59,985,677 | 59,884,139 | ||||||||
| Earnings per average share of common stock | $ | 3.03 | $ | 4.58 | $ | 2.62 | |||||
| Diluted earnings per share — | |||||||||||
| Net income attributable to Tenneco Inc. | $ | 183 | $ | 275 | $ | 157 | |||||
| Average shares of common stock outstanding | 60,474,492 | 59,985,677 | 59,884,139 | ||||||||
| Effect of dilutive securities: | |||||||||||
| Restricted stock | 205,020 | 140,609 | 168,539 | ||||||||
| Stock options | 914,550 | 957,224 | 1,467,482 | ||||||||
| Average shares of common stock outstanding including dilutive securities | 61,594,062 | 61,083,510 | 61,520,160 | ||||||||
| Earnings per average share of common stock | $ | 2.97 | $ | 4.50 | $ | 2.55 | |||||
Options to purchase 612,832205,104, 521,249 and 202,009 shares of common stock were outstanding as of December 31, 2010,2013, 2012 and 2011, respectively, but not included in the computation of diluted earnings per share, because the options were anti-dilutive. As a result
82
3. | Acquisitions |
In January 2010,August 2011, we purchased an additional 20the remaining 25 percent equity interest in our Tenneco Tongtai (Dalian) Exhaust System Co., Ltd.clean air joint venture investment in ChinaThailand for $15$4 million in cash. As a result of this purchase, our equity ownership percentage of this joint venture investment increasedchanged to 80100 percent from 6075 percent.
In September 2012, we purchased certain rights from Combustion Components Associates, Inc. primarily pertaining to emission control technology for stationary reciprocating engine applications for $7 million in cash.
In the fourth quarter of 2013, we purchased an additional 20 percent equity interest in Tenneco Tongtai (Dalian) Exhaust System Co., Ltd. (TTEC) joint venture investment in China for $69 million in cash through two transactions. The joint venture partner also received an additional amount of $9 million in lieu of receiving its pro-rata share of dividends owed from the joint venture. As a result of the purchase, TTEC became a wholly owned indirect subsidiary of Tenneco.
The table below summaries the net income attributable to Tenneco Inc. and transfers to the noncontrolling interest:
| Year Ended December 31, | |||||||||||
| 2013 | 2012 | 2011 | |||||||||
| (Millions) | |||||||||||
| Net income attributable to Tenneco Inc. | $ | 183 | $ | 275 | $ | 157 | |||||
| Decrease in equity for purchase of noncontrolling equity interest | (68 | ) | — | (2 | ) | ||||||
| Net income attributable to Tenneco Inc. shareholders less purchase of noncontrolling equity interest | 115 | 275 | 155 | ||||||||
4.Restructuring and Other Charges
Over the past several years, we have adopted plans to restructure portions of our operations. These plans were approved by our Board of Directors and were designed to reduce operational and administrative overhead costs throughout the business. Our BoardIn 2011, we incurred $8 million in restructuring and related costs, primarily related to headcount reductions in Europe and Australia and the closure of Directors approved a restructuring projectour ride performance plant in 2001, known as Project Genesis,Cozad, Nebraska, all of which was designed to lower our fixedrecorded in cost of sales. In 2012, we incurred $13 million in restructuring and related costs, relocate capacity, reduce our work force, improve efficiency and utilization, and better optimize our global footprint. We have subsequently engaged in various other restructuring projectsprimarily related to Project Genesis. Weheadcount reductions in South America and non-cash asset write downs of $4 million in Europe, of which $10 million was recorded in cost of sales and $3 million was recorded in SG&A. In 2013, we incurred $40$78 million in restructuring and related costs, during 2008,primarily related to European cost reduction efforts including non-cash asset write downs of $3 million, our exit from the distribution of aftermarket exhaust products and ending production of leaf springs in Australia, headcount reductions in various regions, and the net impact of freezing our defined benefit plans in the United Kingdom, of which $17$70 million was recorded in cost of sales, and $23 million was recorded in selling, general, administrative and engineering expense. In 2009, we incurred $21$6 million in restructuring and related costs, of which $16 million was recorded in cost of sales,SG&A, $1 million was recorded in selling, general, administrative and engineering expense and $4 million was recorded in depreciation and amortization expense. In 2010, we incurred $19$1 million in restructuring and related costs, of which $14 million was recorded in cost of sales and $5 million was recorded in depreciation and amortizationother expense.
93
Amounts related to activities that are part of our restructuring plans are as follows:
| December 31, | December 31, | |||||||||||||||||||
| 2009 | 2010 | Impact of | 2010 | |||||||||||||||||
| Restructuring | Cash | Exchange | Reserve | Restructuring | ||||||||||||||||
| Reserve | Payments | Rates | Adjustments | Reserve | ||||||||||||||||
| (Millions) | ||||||||||||||||||||
| Severance | $ | 15 | (7 | ) | — | (1 | ) | $ | 7 | |||||||||||
| December 31, 2012 Restructuring Reserve | 2013 Expenses | 2013 Cash Payments | Impact of Exchange Rates | December 31, 2013 Restructuring Reserve | ||||||||||||
| (Millions) | ||||||||||||||||
| Employee Severance, Termination Benefits and Other Related Costs | $ | — | 75 | (32 | ) | 1 | $ | 44 | ||||||||
Under the terms of our amended and extendedrestated senior credit agreement that took effect on June 3, 2010,March 22, 2012, we are allowed to exclude $60$80 million of cash charges and expenses, before taxes, related to cost reduction initiatives incurred after June 3, 2010March 22, 2012 from the calculation of the financial covenant ratios required under our senior credit facility. As of December 31, 2010,2013, we have excluded $9 million in cumulativeall allowable charges relating to restructuring initiatives against the $60$80 million available under the terms of the senior credit facility.
On September 22, 2009,January 31, 2013, we announced thatour intent to reduce structural costs in Europe. This initiative includes the non-cash charges of $4 million we will beincurred in 2012 in connection with the announced closing of the Vittaryd facility in Sweden and a $7 million charge recorded in the fourth quarter of 2012 related to the impairment of certain assets in the European ride
83
performance business. In August 2013, we completed the closure of the Vittaryd facility. On September 5, 2013, we announced our original equipmentintent to close our ride controlperformance plant in Cozad, Nebraska.Gijon, Spain and reduce the workforce at our ride performance plant in Sint-Truiden, Belgium. The workers' council filed suit challenging the decision to close the Gijon plant and the local High Court of Justice of Asturias ruled in favor of the workers' council. On February 25, 2014, we announced the intention of the Company to appeal that decision to the Supreme Court of Spain in Madrid. We estimate this closing will generate $8recorded $60 million in annualized cost savings once completed, incremental to the $58 million of savingscharges related to our October 2008 restructuring announcement.these actions in 2013. We originally planned to have completed the closing of this facility by the end of 2010, however, as a result of the faster than expected increaseincurred $78 million in light vehicle production in North America and to better optimize the transfer of some of the manufacturing activities, we plan to continue certain production lines through the first half of 2011. We plan to hire at other facilities as we move the production from Cozad to those facilities, resulting in a net decrease of approximately 60 positions. During 2009 we recorded $11 million of restructuring and related expensescosts in 2013, of which $69 million was related to this initiative. Forinitiative including $3 million for non-cash asset write downs. These charges included non-cash asset impairments, the twelve months ended December 31, 2010 we recorded $10 millioncost of restructuringrelocating tooling, equipment and related expensesproduction to other facilities, severance and retention payments to employees and other costs related to this initiative.these actions.
94
5.
Long-Term Debt, Short-Term Debt, and Financing Arrangements
Long-Term Debt
A summary of our long-term debt obligations at December 31, 20102013 and 2009,2012, is set forth in the following table:
| 2010 | 2009 | |||||||
| (Millions) | ||||||||
| Tenneco Inc. — | ||||||||
| Revolver borrowings due 2014, average effective interest rate 5.4% in 2010 and 5.6% in 2009 | $ | — | $ | — | ||||
| Senior Term Loans due 2012 and 2016, average effective interest rate 5.1% in 2010 and 5.7% in 2009 | 149 | 133 | ||||||
73/4% Senior Notes due 2018 | 225 | — | ||||||
101/4% Senior Secured Notes due 2013, including unamortized premium | — | 249 | ||||||
67/8% Senior Notes due 2020 | 500 | — | ||||||
85/8% Senior Subordinated Notes due 2014(a) | 20 | 500 | ||||||
81/8% Senior Notes due 2015 | 250 | 250 | ||||||
| Debentures due 2012 through 2025, average effective interest rate 8.4% in 2010 and 2009 | 1 | 1 | ||||||
| Customer Notes due 2013, average effective interest rate 8.0% in 2010 and 2009 | 4 | 6 | ||||||
| Other subsidiaries — | ||||||||
| Notes due 2011 through 2025, average effective interest rate 3.0% in 2010 and 4.0% in 2009 | 13 | 12 | ||||||
| 1,162 | 1,151 | |||||||
| Less — maturities classified as current | 2 | 6 | ||||||
| Total long-term debt | $ | 1,160 | $ | 1,145 | ||||
| 2013 | 2012 | ||||||
| (Millions) | |||||||
| Tenneco Inc. — | |||||||
| Revolver borrowings due 2017, average effective interest rate 2.7% in 2013 and 1.2% in 2012 | $ | 58 | $ | 92 | |||
| Senior Term Loan due 2014 through 2017, average effective interest rate 2.7% in 2013 and 3.0% in 2012 | 228 | 241 | |||||
| 7 3/4% Senior Notes due 2018 | 225 | 225 | |||||
| 6 7/8% Senior Notes due 2020 | 500 | 500 | |||||
| Debentures due 2014 through 2026, average effective interest rate 7.5 in 2013 and 8.4% in 2012 | 1 | 1 | |||||
| Customer Notes due 2013, average effective interest rate 8.0% in 2013 and 2012 | — | 1 | |||||
| Other subsidiaries — | |||||||
| Notes due 2014 through 2026, average effective interest rate 1.3% in both 2013 and 2012 | 9 | 10 | |||||
| 1,021 | 1,070 | ||||||
| Less — maturities classified as current | 2 | 3 | |||||
| Total long-term debt | $ | 1,019 | $ | 1,067 | |||
The aggregate maturities and sinking fund requirements applicable to the long-term debt outstanding at December 31, 2010,2013, are $24$23 million $5, $35 million $4, $48 million $2, $184 million and $252$226 million for 2011, 2012, 2013, 2014, 2015, 2016, 2017 and 2015,2018, respectively.
We have included inexcluded the 2011required payments, within the redemptionnext twelve months, under the Tranche A Term Facility totaling $22 million from current liabilities as of all ofDecember 31, 2013, because we have the outstanding 85/8 percent senior subordinated notes that were not previously tendered.
95
intent and ability to refinance the obligations on a long-term basis by using our revolving credit facility.
Short-Term Debt
Our short-term debt includes the current portion of long-term obligations and borrowings by parent company and foreign subsidiaries. Information regarding our short-term debt as of and for the years ended December 31, 20102013 and 20092012 is as follows:
| 2010 | 2009 | |||||||
| (Millions) | ||||||||
| Maturities classified as current | $ | 2 | $ | 6 | ||||
| Notes payable | 61 | 69 | ||||||
| Total short-term debt | $ | 63 | $ | 75 | ||||
| 2013 | 2012 | ||||||
| (Millions) | |||||||
| Maturities classified as current | $ | 2 | $ | 3 | |||
| Short-term borrowings | 81 | 110 | |||||
| Total short-term debt | $ | 83 | $ | 113 | |||
| 2010 | 2009 | |||||||
| Notes Payable(a) | Notes Payable(a) | |||||||
| (Dollars in Millions) | ||||||||
| Outstanding borrowings at end of year | $ | 61 | $ | 69 | ||||
| Weighted average interest rate on outstanding borrowings at end of year(b) | 7.8 | % | 6.9 | % | ||||
| Approximate maximum month-end outstanding borrowings during year | $ | 201 | $ | 71 | ||||
| Approximate average month-end outstanding borrowings during year | $ | 109 | $ | 60 | ||||
| Weighted average interest rate on approximate average month-end outstanding borrowings during year(b) | 5.5 | % | 7.8 | % | ||||
84
| Notes Payable(a) | |||||||
| 2013 | 2012 | ||||||
| (Dollars in Millions) | |||||||
| Outstanding borrowings at end of year | $ | 81 | $ | 110 | |||
| Weighted average interest rate on outstanding borrowings at end of year(b) | 4.4 | % | 5.3 | % | |||
| Approximate maximum month-end outstanding borrowings during year | $ | 177 | $ | 156 | |||
| Approximate average month-end outstanding borrowings during year | $ | 116 | $ | 123 | |||
| Weighted average interest rate on approximate average month-end outstanding borrowings during year(b) | 4.7 | % | 5.5 | % | |||
| (a) | Includes borrowings under both committed credit facilities and uncommitted lines of credit and similar arrangements. |
| (b) | This calculation does not include the commitment fees to be paid on the unused revolving credit facility balances which are recorded as interest expense for accounting purposes. |
Financing Arrangements
| Committed Credit Facilities(a) as of December 31, 2010 | ||||||||||||||||||||
| Letters of | ||||||||||||||||||||
| Term | Commitments | Borrowings | Credit(b) | Available | ||||||||||||||||
| (Millions) | ||||||||||||||||||||
| Tenneco Inc. revolving credit agreement | 2014 | 622 | — | — | 622 | |||||||||||||||
Tenneco Inc.tranche B-1 letter of credit/revolving loan agreement | 2014 | 130 | — | 53 | 77 | |||||||||||||||
| Tenneco Inc. Senior Term Loans | 2016 | 149 | 149 | — | — | |||||||||||||||
| Subsidiaries’ credit agreements | 2011-2030 | 84 | 72 | — | 12 | |||||||||||||||
| $ | 985 | $ | 221 | $ | 53 | $ | 711 | |||||||||||||
| Committed Credit Facilities(a) as of December 31, 2013 | |||||||||||||||||
| Term | Commitments | Borrowings | Letters of Credit(b) | Available | |||||||||||||
| (Millions) | |||||||||||||||||
| Tenneco Inc. revolving credit agreement | 2017 | 850 | 58 | 37 | 755 | ||||||||||||
| Tenneco Inc. tranche A term facility | 2017 | 228 | 228 | — | — | ||||||||||||
| Subsidiaries’ credit agreements | 2014-2026 | 110 | 90 | — | 20 | ||||||||||||
| $ | 1,188 | $ | 376 | $ | 37 | $ | 775 | ||||||||||
| (a) | We generally are required to pay commitment fees on the unused portion of the total commitment. |
| (b) | Letters of credit reduce the available borrowings under the |
Overview. Our financing arrangements are primarily provided by a committed senior secured financing arrangement with a syndicate of banks and other financial institutions. The arrangement is secured by
96
substantially all our domestic assets and pledges of up to 66 percent of the stock of certain first-tier foreign subsidiaries, as well as guarantees by our material domestic subsidiaries.
On June 3, 2010March 22, 2012, we completed an amendment and extensionrestatement of our senior secured credit facility by increasing the amount and extending the termmaturity date of our revolving credit facility and replacingadding a new Tranche A Term Facility. The amended and restated facility replaces our $128former $556 million term revolving credit facility, $148 million Tranche B Term Facility and $130 million Tranche B-1 letter of credit/revolving loan A with a largerfacility. The proceeds from this refinancing transaction were used to repay our $148 million Tranche B Term Facility and longer maturity term loan B facility.to fund the purchase and redemption of our $250 million 8 1/8 percent senior notes due in 2015. As a result of the amendment and extension, as of December 31, 2010,2013, the senior credit facility provides us with a total revolving credit facility size of $622$850 million until March 16, 2012, when commitments and a $228 million Tranche A Term Facility, both of $66 million will expire. After March 16, 2012, the extended revolving credit facility will provide $556 million of revolving credit andwhich will mature on May 31, 2014. The extended facility will mature earlier on December 15, 2013, if our $130 milliontranche B-1 letter of credit/revolving loan facility is not refinanced by that date. Prior to maturity, fundsMarch 22, 2017. Funds may be borrowed, repaid and re-borrowed under the two revolving credit facilitiesfacility without premium or penalty. The leverage ratio (consolidated indebtedness net of cash divided by consolidated EBITDA as defined in the seniorrevolving credit facility agreement) was decreased from 5.00 to 4.50 for the second quarter of 2010; from 4.75 to 4.25 for the third quarter of 2010; and from 4.50 to 4.25 for the fourth quarter of 2010 as a result of the June 3, 2010 amendment.
On March 8, 2012, we announced a cash tender offer to purchase our outstanding $250 million 8 1/8 percent senior notes due in 2015 and a solicitation of consents to certain proposed amendments to the indenture governing these notes. We received tenders and consents representing $232 million aggregate principal amount of the notes and, on March 22, 2012, we purchased the tendered notes at a price of 104.44 percent of the principal amount (which includes a consent payment of three percent of the principal amount), plus accrued and unpaid interest, and amended the related indenture. On April 6, 2012, we redeemed the remaining outstanding $18 million aggregate principal amount of senior notes that were not purchased pursuant to the tender offer at a price of 104.06 percent of the principal amount, plus accrued and unpaid interest. The additional liquidity provided by the lendersnew $850 million revolving credit facility and not borrowed by the Company earn interest atnew $250 million Tranche A Term Facility was used to fund the total cost of the tender offer and redemption, including all related fees and expenses.
85
We recorded $17 million of pre-tax charges in March 2012 related to the refinancing of our senior credit facility, the repurchase and redemption of $232 million aggregate principal amount of our 8 1/8 percent senior notes due in 2015 and the write-off of deferred debt issuance costs relating to these senior notes. We recorded an annual rate approximately equaladditional $1 million of pre-tax charges during the second quarter of 2012 relating to LIBOR less 25 basis points.the redemption of the remaining $18 million aggregate principal amount of our 8 1/8 percent senior notes which occurred in April 2012.
At December 31, 2013, of the $850 million available under the revolving credit facility, we had unused borrowing capacity of $755 million with $58 million in outstanding borrowings and $37 million in outstanding letters of credit. As of December 31, 2013, our outstanding debt also included $228 million related to our Tranche A Term Facility due March 22, 2017, $225 million of 7 3/4 percent senior notes due August 15, 2018, $500 million of 6 7/8 percent senior notes due December 15, 2020, and $91 million of other debt.
Senior Credit Facility — Interest Rates and Fees.Beginning June 3, 2010March 22, 2012, our term loan BTranche A Term Facility and revolving credit facility bear interest at an annual rate equal to, at our option, either (i) the London Interbank Offered Rate (“LIBOR”) plus a margin of 475 and 450 basis points, respectively, or (ii) a rate consisting of the greater of (a) the JPMorgan Chase prime rate plus a margin of 375 and 350 basis points, respectively, (b) the Federal Funds rate plus 50 basis points plus a margin of 375 and 350 basis points, respectively, and (c) the Eurodollar Rate plus 100 basis points plus a margin of 375 and 350 basis points, respectively. The margin we pay on these borrowings will be reduced by 25 basis points following each fiscal quarter for which our consolidated net leverage ratio is less than 2.25 for extending lenders and for the term loan B and will be further reduced by an additional 25 basis points following each fiscal quarter for which the consolidated net leverage ratio is less than 2.0 for extending lenders. The margin we pay on these borrowings for extending lenders will increase by 50 basis points following each fiscal quarter for which our consolidated net leverage ratio is greater than or equal to 4.0 and will be further increased by an additional 50 basis points following each fiscal quarter for which the consolidated net leverage ratio is greater than or equal to 5.0. Our consolidated net leverage ratio was 2.24 as of December 31, 2010. Accordingly, in March of 2011 the margin we pay on these borrowings will be reduced by 25 basis points for extending lenders and will remain at such level for so long as our consolidated net leverage ratio remains below 2.25 and greater than or equal to 2.0.
97
100 basis points plus a margin of 400150 basis points. The ratemargin we pay on these borrowings will increasebe reduced by 50a total of 25 basis points below the original margin following each fiscal quarter for which our consolidated net leverage ratio is less than 1.50 or will be increased by a total of 25 basis points above the original margin if our consolidated net leverage ratio is greater than or equal to 5.0.
98
| 12/24/2008 | 2/23/2009 | 3/2/2009 | 5/15/2009 | 8/14/2009 | 3/1/2010 | |||||||||||||||||||||||
| thru | thru | thru | thru | thru | thru | Beginning | ||||||||||||||||||||||
| 2/22/2009 | 3/1/2009 | 5/14/2009 | 8/13/2009 | 2/28/2010 | 6/2/2010 | 6/3/2010 | ||||||||||||||||||||||
| Applicable Margin over LIBOR for Revolving Loans | 3.00 | % | 5.50 | % | 4.50 | % | 5.00 | % | 5.50 | % | 4.50 | % | 4.50 | % | ||||||||||||||
| Applicable Margin over LIBOR for Term Loan B Loans | — | — | — | — | — | — | 4.75 | % | ||||||||||||||||||||
| Applicable Margin over LIBOR for Term Loan A Loans | 3.00 | % | 5.50 | % | 4.50 | % | 5.00 | % | 5.50 | % | 4.50 | % | — | |||||||||||||||
Applicable Margin over LIBOR forTranche B-1 Loans | 3.00 | % | 5.50 | % | 5.00 | % | 5.00 | % | 5.50 | % | 5.00 | % | 5.00 | % | ||||||||||||||
| Applicable Margin over Prime-based Loans | 2.00 | % | 4.50 | % | 3.50 | % | 4.00 | % | 4.50 | % | 3.50 | % | — | |||||||||||||||
| Applicable Margin over Prime for Revolving Loans | — | — | — | — | — | — | 3.50 | % | ||||||||||||||||||||
| Applicable Margin over Prime for Term Loan B Loans | — | — | — | — | — | — | 3.75 | % | ||||||||||||||||||||
Applicable Margin over Prime forTranche B-1 Loans | — | — | — | — | — | — | 4.00 | % | ||||||||||||||||||||
| Applicable Margin over Federal Funds for Revolving Loans | — | — | — | — | — | — | 3.50 | % | ||||||||||||||||||||
| Applicable Margin over Federal Funds for Term Loan B Loans | — | — | — | — | — | — | 3.75 | % | ||||||||||||||||||||
Applicable Margin over Federal Funds forTranche B-1 Loans | 2.50 | % | 5.00 | % | 4.00 | % | 4.50 | % | 5.00 | % | 4.00 | % | 4.00 | % | ||||||||||||||
| Commitment Fee | 0.50 | % | 0.75 | % | 0.50 | % | 0.50 | % | 0.75 | % | 0.50 | % | 0.75 | % | ||||||||||||||
Senior Credit Facility — Other Terms and Conditions. Our senior credit facility requires that we maintain financial ratios equal to or better than the following consolidated net leverage ratio (consolidated indebtedness net of cash divided by consolidated EBITDA, as defined in the senior credit facility agreement), and consolidated interest coverage ratio (consolidated EBITDA divided by consolidated interest expense, as defined under the senior credit facility agreement) at the end of each period indicated. Failure to maintain these ratios will result in a default under our senior credit facility. The financial ratios required under the amended and restated senior credit facility and, the actual ratios we achieved for the four quarters of 2010,2013, are as follows:
| Quarter Ended | ||||||||||||||||||||||||||||||||
| March 31, | June 30, | September 30, | December 31, | |||||||||||||||||||||||||||||
| 2010 | 2010 | 2010 | 2010 | |||||||||||||||||||||||||||||
| Req. | Act. | Req. | Act. | Req. | Act. | Req. | Act. | |||||||||||||||||||||||||
| Leverage Ratio (maximum) | 5.50 | 2.77 | 4.50 | 2.42 | 4.25 | 2.41 | 4.25 | 2.24 | ||||||||||||||||||||||||
| Interest Coverage Ratio (minimum) | 2.00 | 3.04 | 2.25 | 3.70 | 2.30 | 3.97 | 2.35 | 3.99 | ||||||||||||||||||||||||
99
| Quarter Ended | |||||||||||||||||||||||
March 31, 2013 | June 30, 2013 | September 30, 2013 | December 31, 2013 | ||||||||||||||||||||
| Req. | Act. | Req. | Act. | Req. | Act. | Req. | Act. | ||||||||||||||||
| Leverage Ratio (maximum) | 3.50 | 1.98 | 3.50 | 1.79 | 3.50 | 1.86 | 3.50 | 1.39 | |||||||||||||||
| Interest Coverage Ratio (minimum) | 2.55 | 8.39 | 2.55 | 8.74 | 2.55 | 9.09 | 2.55 | 9.89 | |||||||||||||||
The financial ratios required under the senior credit facility for 2011includes a maximum leverage ratio covenant of 3.50 through March 22, 2017 and beyond are set forth below.
| Interest | ||||||||
| Leverage | Coverage | |||||||
Period Ending | Ratio | Ratio | ||||||
| March 31, 2011 | 4.00 | 2.55 | ||||||
| June 30, 2011 | 3.75 | 2.55 | ||||||
| September 30, 2011 | 3.50 | 2.55 | ||||||
| December 31, 2011 | 3.50 | 2.55 | ||||||
| Each quarter thereafter | 3.50 | 2.75 | ||||||
a minimum interest coverage ratio of 2.55 through December 31, 2013 and 2.75 thereafter, through March 22, 2017.
The covenants in our senior credit facility agreement generally prohibit us from repaying or refinancing our senior notes. So long as no default existed, we would, however, under our senior credit facility agreement, be permitted to repay or refinance our senior notes:notes (i) with the net cash proceeds of incremental facilities and permitted refinancing indebtedness (as defined in the senior credit facility agreement)agreement or with the net cash proceeds of our common stock); (ii) with the net cash proceeds fromof the saleincremental facilities (as defined in the senior credit facility agreement); (iii) with the net cash proceeds of sharesthe revolving loans (as defined in the senior credit facility agreement); (iv) with the cash generated by our operations; (v) in an amount equal to the net cash proceeds of our common stock; (iii)qualified capital stock (as defined in the senior credit facility agreement) issued by us after March 22, 2012; and (vi) in exchange for permitted refinancing indebtedness or in exchange for shares of our common stock; (iv) with the net cash proceeds of any new senior or subordinated unsecured indebtedness; (v) with the proceeds of revolving credit loans (as defined in the senior credit facility agreement); (vi) with the cash generated by the operations of the company; and (vii) in an amount equal to the sum of (A) the net cash proceeds of qualified stock issued by the Company after March 16, 2007, plus (B) the portion of annual excess cash flow (beginning with excess cash flow for fiscal year 2010) not required to be applied to payment of the credit facilities and which is not used for other purposes, provided that the aggregate principal amount of senior notes purchased and cancelled or redeemed pursuant to clauses (v), (vi) and (vii), issuch purchases are capped as follows based(with respect to clauses (iii), (iv) and (v) on thea pro forma consolidated leverage ratio after giving effect to such purchase, cancellation or redemption:redemption):
| Proforma Consolidated | Aggregate Senior Note | |||
Leverage Ratio | Maximum Amount | |||
| (Millions) | ||||
| Greater than or equal to 3.0x | $ | 20 | ||
| Greater than or equal to 2.5x | $ | 100 | ||
| Less than 2.5x | $ | 125 | ||
| Pro forma Consolidated Leverage Ratio | Aggregate Senior Note Maximum Amount | ||
| (Millions) | |||
| Greater than or equal to 3.0x | $ | 20 | |
| Greater than or equal to 2.5x | $ | 100 | |
| Greater than or equal to 2.0x | $ | 200 | |
| Less than 2.0x | no limit | ||
86
Although the senior credit facility agreement would permit us to repay or refinance our senior notes under the conditions described above, any repayment or refinancing of our outstanding notes would be subject to market conditions and either the voluntary participation of noteholdersnote holders or our ability to redeem the notes under the terms of the applicable note indenture. For example, while the senior credit agreement would allow us to repay our outstanding notes via a direct exchange of the notes for either permitted refinancing indebtedness or for shares of our common stock, we do not, under the terms of the agreements governing our outstanding notes, have the right to refinance the notes via any type of direct exchange.
The senior credit facility agreement also contains other restrictions on our operations that are customary for similar facilities, including limitations on: (i) incurring additional liens; (ii) sale and leaseback transactions (except for the permitted transactions as described in the senior credit facility agreement); (iii) liquidations and dissolutions; (iv) incurring additional indebtedness or guarantees; (v) investments and acquisitions; (vi) dividends and share repurchases; (vii) mergers and consolidations; and (viii) refinancing of the senior notes. Compliance with these requirements and restrictions is a condition for any incremental borrowings under the senior credit facility agreement and failure to meet these requirements enables the lenders to require repayment of any outstanding loans.
As of December 31, 2010,2013, we were in compliance with all the financial covenants and operational restrictions of the senior credit facility. Our senior credit facility does not contain any terms that could accelerate payment of the facility or affect pricing under the facility as a result of a credit rating agency downgrade.
100
Senior and Subordinated Notes.As of December 31, 2010,2013, our outstanding debt also includes $20 million of 85/8 percent senior subordindated notes due January 7, 2011, $250 million of 81/8 percent senior notes due November 15, 2015, $225included $225 million of 73/4 percent senior notes due August 15, 2018 and $500$500 million of 67/8 percent senior notes due December 15, 2020. Under the indentures governing the notes, we are permitted to redeem some or all of the remaining senior notes at specified prices that decline to par over a specified period at any time on and after NovemberAugust 15, 2011 in the case of the senior notes due 2015, August 14, 2014 in the case of the senior notes due 2018, and December 15, 2015 in the case of the senior notes due 2020. On January 7, 2011, weIn addition, prior to such dates the notes may also be redeemed all remaining senior subordinated notes at a price of 102.875generally equal to 100 percent of the principal amount thereof plus accrued and unpaid interest.a premium based on the present values of the remaining payments due to the noteholders. If we sell certain of our assets or experience specified kinds of changes in control, we must offer to repurchase the notes. Under the indentures governing the notes, we are permitted to redeem up to 35 percent of the senior notes due 2018 with the proceeds of certain equity offerings completed before August 13, 2013 and up to 352020 at 101 percent of the senior notes due 2020, with the proceeds of certain equity offerings completed before December 15, 2013.principal amount thereof plus accrued and unpaid interest.
Our senior notes require that, as a condition precedent to incurring certain types of indebtedness not otherwise permitted, our consolidated fixed charge coverage ratio, as calculated on a pro forma basis, be greater than 2.00.2.00. The indentures also contain restrictions on our operations, including limitations on: (i) incurring additional indebtedness or liens; (ii) dividends; (iii) distributions and stock repurchases; (iv) investments; (v) asset sales and (vi) mergers and consolidations. Subject to limited exceptions, all of our existing and future material domestic wholly owned subsidiaries fully and unconditionally guarantee these notes on a joint and several basis. There are no significant restrictions on the ability of the subsidiaries that have guaranteed these notes to make distributions to us. As of December 31, 2010,2013, we were in compliance with the covenants and restrictions of these indentures.
Accounts Receivable Securitization. We also securitize some of our accounts receivable on a limited recourse basis in North America and Europe. As servicer under these accounts receivable securitization programs, we are responsible for performing all accounts receivable administration functions for these securitized financial assets including collections and processing of customer invoice adjustments. In North America, we have an accounts receivable securitization program with three commercial banks.banks comprised of a first priority facility and a second priority facility. We securitize original equipment and aftermarket receivables on a daily basis under the bank program. We had no outstanding third party investments in our securitized accounts receivable bank program as of December 31, 2010 and $62 million at December 31, 2009. In February 2010,March 2013, the North American program was amended and extended to February 18, 2011, at a maximumMarch 21, 2014. The first priority facility sizecontinues to provide financing of $100 million. As part of this renewal,up to $110 million and the margin we pay to our banks decreased. In March 2010, the North American program was further amended to extend the revolving terms of the program to March 25, 2011, add an additional bank and increase the available financing under the facility by $10 million to a new maximum of $110 million. In addition, we added a second priority facility, which is subordinated to the North American program, which providesfirst priority facility, continues to provide up to an additional $40$40 million of financing againstfinancing. Both facilities monetize accounts receivable generated in the U.S. and Canada that meet certain eligibility requirements. The second priority facility also monetizes certain accounts receivable generated in the U.S. or Canada that would otherwise be ineligible under the existingfirst priority securitization facility. This new second priority facility also expires on March 25, 2011,The amount of outstanding third-party investments in our securitized accounts receivable under the North American program was $10 million at December 31, 2013 and is subordinated to the existing securitization facility.
$50 million at December 31, 2012.
Each facility contains customary covenants for financings of this type, including restrictions related to liens, payments, mergers or consolidationconsolidations and amendments to the agreements underlying the receivables pool. Further, each facility may be terminated upon the occurrence of customary events (with customary grace periods, if applicable), including breaches of covenants, failure to maintain certain financial ratios, inaccuracies of representations and warranties, bankruptcy and insolvency events, certain changes in the rate of default or delinquency of the receivables, a change of control and the entry or other enforcement of material judgments. In addition, each facility contains cross-default provisions, where the facility could be terminated in the event of non-payment of other material indebtedness when due and any other event which permits the acceleration of the maturity of material indebtedness.
101
We also securitize receivables in our European operations with regional banks in Europe. The amount of outstanding third party investments in our securitized accounts receivable in Europe was $91 million and $75 million at December 31, 2010 and December 31, 2009, respectively. The arrangements to securitize receivables in Europe are provided under sevensix separate facilities provided by various financial institutions in each of the foreign
87
jurisdictions. The commitments for these arrangements are generally for one year, but some may be cancelled with notice 90 days prior to renewal. In some instances, the arrangement provides for cancellation by the applicable financial institution at any time upon 15 days, or less, notification. The amount of outstanding third-party investments in our securitized accounts receivable in Europe was $134 million and $94 million at December 31, 2013 and December 31, 2012, respectively.
If we were not able to securitize receivables under either the North American or European securitization programs, our borrowings under our revolving credit agreementsagreement might increase. These accounts receivable securitization programs provide us with access to cash at costs that are generally favorable to alternative sources of financing, and allow us to reduce borrowings under our revolving credit agreements.agreement.
102
6.
| Financial Instruments |
The carrying and estimated fair values of our financial instruments by class at December 31, 20102013 and 20092012 were as follows:
| December 31, 2010 | December 31, 2009 | |||||||||||||||
| Carrying | Carrying | |||||||||||||||
| Amount | Fair Value | Amount | Fair Value | |||||||||||||
| (Millions) | ||||||||||||||||
| Long-term debt (including current maturities) | $ | 1,162 | $ | 1,201 | $ | 1,151 | $ | 1,168 | ||||||||
| Instruments with off-balance sheet risk: | ||||||||||||||||
| Foreign exchange forward contracts | 2 | 2 | 2 | 2 | ||||||||||||
| December 31, 2013 | December 31, 2012 | ||||||||||||||
| Carrying Amount | Fair Value | Carrying Amount | Fair Value | ||||||||||||
| (Millions) | |||||||||||||||
| Long-term debt (including current maturities) | $ | 1,021 | $ | 1,089 | $ | 1,070 | $ | 1,136 | |||||||
| Instruments with off-balance sheet risk: | |||||||||||||||
| Foreign exchange forward contracts: | |||||||||||||||
| Asset derivative contracts | — | — | 1 | 1 | |||||||||||
Asset and Liability Instruments — The fair value of cash and cash equivalents, short and long-term receivables, accounts payable, and short-term debt was considered to be the same as or was not determined to be materially different from theirthe carrying amount.
Long-term Debt — The fair value of our public fixed rate senior and senior subordinated notes ($20 million remaining principal balance was redeemed on January 7, 2011) is based on quoted market prices. The fair value of our private borrowings under our senior credit facility and other long-term debt instruments is based on the market value of debt with similar maturities, interest rates and risk characteristics. The fair value of our level 1 debt, as classified in the fair value hierarchy, was $792 million and $790 million at December 31, 2013 and December 31, 2012, respectively. We have classified the $287 million and $334 million as level 2 in the fair value hierarchy at December 31, 2013 and December 31, 2012, respectively, since we utilize valuation inputs that are observable both directly and indirectly. We classified the remaining $10 million and $12 million, consisting of foreign subsidiary debt, as level 3 in the fair value hierarchy at December 31, 2013 , and December 31, 2012 , respectively.
Foreign Exchange Forward Contractsexchange forward contracts — We use derivative financial instruments, principally foreign currency forward purchase and sales contracts with terms of less than one year, to hedge our exposure to changes in foreign currency exchange rates. Our primary exposure to changes in foreign currency rates results from intercompany loans made between affiliates to minimize the need for borrowings from third parties. Additionally, we enter into foreign currency forward purchase and sale contracts to mitigate our exposure to changes in exchange rates on certain intercompany and third-party trade receivables and payables. We manage counter-party credit risk by entering into derivative financial instruments with major financial institutions that can be expected to fully perform under the terms of such agreements. We do not enter into derivative financial instruments for speculative purposes. The fair value of our foreign currency forward contracts is based on an internally developed model which incorporates observable inputs including quoted spot rates, forward exchange rates and discounted future expected cash flows utilizing market interest rates with similar quality and maturity characteristics. We record the change in fair value of these foreign exchange forward contracts as part of currency gains (losses) within cost of sales in the consolidated statements of income (loss).
88
income. The fair value of foreign exchange forward contracts are recorded in prepayments and other current assets or other current liabilities in the consolidated balance sheet. The fair value of our foreign exchange forward contracts, presented on a gross basis by derivative contract at December 31, 20102013 and 2009,2012, respectively, was as follows:
| Fair Value of Derivative Instruments | ||||||||||||||||||||||||
| December 31, 2010 | December 31, 2009 | |||||||||||||||||||||||
| Asset | Liability | Asset | Liability | |||||||||||||||||||||
| Derivatives | Derivatives | Total | Derivatives | Derivatives | Total | |||||||||||||||||||
| Foreign exchange forward contracts | $ | 2 | $ | — | $ | 2 | $ | 3 | $ | 1 | $ | 2 | ||||||||||||
103
| Fair Value of Derivative Instruments | |||||||||||||||||||||||
| December 31, 2013 | December 31, 2012 | ||||||||||||||||||||||
| Asset Derivatives | Liability Derivatives | Total | Asset Derivatives | Liability Derivatives | Total | ||||||||||||||||||
| (Millions) | |||||||||||||||||||||||
| Foreign exchange forward contracts | $ | — | $ | — | $ | — | $ | 1 | $ | — | $ | 1 | |||||||||||
The fair value of our recurring financial assets and liabilities at December 31, 20102013 and 2009,2012, respectively, are as follows:
| December 31, 2010 | December 31, 2009 | |||||||||||||||||||||||
| Level 1 | Level 2 | Level 3 | Level 1 | Level 2 | Level 3 | |||||||||||||||||||
| (Millions) | ||||||||||||||||||||||||
Financial Assets: | ||||||||||||||||||||||||
| Foreign exchange forward contracts | n/a | $2 | n/a | n/a | $2 | n/a | ||||||||||||||||||
Financial Liabilities: | ||||||||||||||||||||||||
| Foreign exchange forward contracts | n/a | $ | — | n/a | n/a | $ | — | n/a | ||||||||||||||||
| December 31, 2013 | December 31, 2012 | ||||||||||||||||||
| Level 1 | Level 2 | Level 3 | Level 1 | Level 2 | Level 3 | ||||||||||||||
| (Millions) | |||||||||||||||||||
| Financial Assets: | |||||||||||||||||||
| Foreign exchange contracts | $ | — | $ | — | $ | — | n/a | $ | 1 | n/a | |||||||||
The fair value hierarchy definition prioritizes the inputs used in measuring fair value into the following levels:
| Level 1 | Quoted prices in active markets for identical assets or liabilities. | |
| Level 2 | Inputs, other than quoted prices in active markets, that are observable either directly or indirectly. | |
| Level 3 | Unobservable inputs based on our own assumptions. | |
The following table summarizes by major currency the notional amounts for foreign currency forward purchase and sale contracts as of December 31, 20102013 (all of which mature no later than March 31, 2011)in 2014):
| Notional Amount | |||||||
| (Millions) | |||||||
| Australian dollars | —Purchase | 3 | |||||
| British pounds | —Purchase | 4 | |||||
| European euro | —Sell | (16 | ) | ||||
| Japanese yen | —Purchase | 135 | |||||
| —Sell | (842 | ) | |||||
| Polish zloty | —Purchase | 33 | |||||
| South African rand | —Purchase | 144 | |||||
| U.S. dollars | —Purchase | 15 | |||||
| —Sell | (15 | ) | |||||
| Other | —Sell | ( | |||||
| 2 | |||||||
| ) | |||||||
In March 2011, we entered into two performance guarantee agreements in the U.K. between Tenneco Management (Europe) Limited (“TMEL”) and the two Walker Group Retirement Plans, the Walker Group Employee Benefit Plan and the Walker Group Executive Retirement Benefit Plan (the “Walker Plans”), whereby TMEL will guarantee the payment of all current and future pension contributions in event of a payment default by the sponsoring or participating employers of the Walker Plans. As a result of our decision to enter into these performance guarantee agreements, the levy due to the U.K. Pension Protection Fund was reduced. The Walker Plans are comprised of employees from Tenneco Walker (U.K.) Limited and our Futaba-Tenneco U.K. joint venture. Employer contributions are funded by both Tenneco Walker (U.K.) Limited, as the sponsoring employer and Futaba-Tenneco U.K., as a participating employer. The performance guarantee agreements are expected to remain in effect until all pension obligations for the Walker Plans’ sponsoring and participating employers have
89
been satisfied. The maximum amount payable for these pension performance guarantees, related to other participating employers, is approximately $27 million as of December 31, 2013 which is determined by taking 105 percent of the liability of the Walker Plans calculated under section 179 of the U.K. Pension Act of 2004 offset by plan assets. We did not record an additional liability in March 2011 for this performance guarantee since Tenneco Walker (U.K.) Limited, as the sponsoring employer of the Walker Plans, already recognizes 100 percent of the pension obligation calculated based on U.S. GAAP, for all of the Walker Plans’ participating employers on its balance sheet, which was $10 million and $7 million at December 31, 2013 and December 31, 2012, respectively. At December 31, 2013, all pension contributions under the Walker Plans were current for all of the Walker Plans’ sponsoring and participating employers.
In June 2011, we entered into an indemnity agreement between TMEL and Futaba Industrial Co. Ltd. which requires Futaba to indemnify TMEL for any cost, loss or liability which TMEL may incur under the performance guarantee agreements relating to the Futaba-Tenneco U.K. joint venture. The maximum amount reimbursable by Futaba to TMEL under this indemnity agreement is equal to the amount incurred by TMEL under the performance guarantee agreements multiplied by Futaba’s shareholder ownership percentage of the Futaba-Tenneco U.K. joint venture. At December 31, 2013, the maximum amount reimbursable by Futaba to TMEL is approximately $5 million.
We have issued guarantees through letters of credit in connection with some obligations of our affiliates. As of December 31, 2010,2013, we have guaranteed $53$38 million in letters of credit to support some of our subsidiaries’ insurance arrangements, foreign employee benefit programs, environmental remediation activities and cash management and capital requirements.
104
Negotiable Financial Instruments — One of our European subsidiaries receives payment from one of its OE customers whereby the accounts receivable are satisfied through the delivery of negotiable financial instruments. We may collect these financial instruments before their maturity date by either selling them at a discount or using them to satisfy accounts receivable that have previously been sold to a European bank. Any of these financial instruments which are not sold are classified as other current assets as they do not meet our definition of cash equivalents.assets. The amount of these financial instruments that was collected before their maturity date and sold at a discount totaled $6$5 million as of and $6 million at December 31, 2010,2013 and $5 million as of December 31, 2009,2012, respectively. No negotiable financial instruments were held by our European subsidiary as of December 31, 2010 or 2009,2013 and December 31, 2012, respectively.
In certain instances, several of our Chinese subsidiaries receive payment from OE customers and satisfy vendor payments through the receipt and delivery of negotiable financial instruments. Financial instruments usedissued to satisfy vendor payables and not redeemed totaled $8$13 million and $15$12 million at December 31, 20102013 and 2009,December 31, 2012, respectively, and were classified as notes payable. Financial instruments received from OE customers and not redeemed totaled $11$12 million and $15$8 million at December 31, 20102013 and 2009,December 31, 2012, respectively. We classify financial instruments received from our OE customers as other current assets if issued by a financial institution of our customers or as customer notes and accounts net if issued by our customer. We classified $11$12 million and $15$8 million in other current assets at December 31, 20102013 and 2009,December 31, 2012, respectively. Some of our Chinese subsidiaries that issue their own negotiable financial instruments to pay vendors are required to maintain a cash balance if they exceed certain credit limits with the financial institution that guarantees those financial instruments. A restricted cash balance was not required at those Chinese subsidiaries at December 31, 2010 and 2009, respectively.
2013 or December 31, 2012.
The negotiable financial instruments received by one of our European subsidiaries and some of our Chinese subsidiaries are checks drawn by our OE customers and guaranteed by their banks that are payable at a future date. The use of these instruments for payment follows local commercial practice. Because negotiable financial instruments are financial obligations of our customers and are guaranteed by our customers’ banks, we believe they represent a lower financial risk than the outstanding accounts receivable that they satisfy which are not guaranteed by a bank.
Supply Chain Financing. Near the end of the second quarter of 2013 certain of our suppliers in the U.S. extended their payment terms to Tenneco. The liquidity benefit to Tenneco from the extended payment terms totaled $10 million at December 31, 2013. These suppliers also began participating in a supply chain financing program under which they securitize their accounts receivables from Tenneco with two financial institutions. The financial institutions participate in the supply chain financing program on an uncommitted basis and can cease purchasing receivables from Tenneco's suppliers at any time. If the financial institutions did not continue to purchase receivables from Tenneco's suppliers under this program, the participating vendors could reduce their payment terms to Tenneco which in turn would cause our borrowings under our revolving credit facility to increase.
The domestic and foreign components of our income before income taxes and noncontrolling interests are as follows:
| Year Ended | ||||||||||||
| December 31, | ||||||||||||
| 2010 | 2009 | 2008 | ||||||||||
| (Millions) | ||||||||||||
| U.S. income (loss) before income taxes | $ | (45 | ) | $ | (118 | ) | $ | (257 | ) | |||
| Foreign income before income taxes | 177 | 77 | 141 | |||||||||
| Income (loss) before income taxes and noncontrolling interests | $ | 132 | $ | (41 | ) | $ | (116 | ) | ||||
105
| Year Ended December 31, | |||||||||||
| 2013 | 2012 | 2011 | |||||||||
| (Millions) | |||||||||||
| U.S. income before income taxes | $ | 150 | $ | 166 | $ | 55 | |||||
| Foreign income before income taxes | 194 | 157 | 216 | ||||||||
| Income before income taxes and noncontrolling interests | $ | 344 | $ | 323 | $ | 271 | |||||
Following is a comparative analysis of the components of income tax expense:
| Year Ended December 31, | ||||||||||||
| 2010 | 2009 | 2008 | ||||||||||
| (Millions) | ||||||||||||
| Current — | ||||||||||||
| U.S. | $ | — | $ | (2 | ) | $ | 42 | |||||
| State and local | 1 | 4 | — | |||||||||
| Foreign | 64 | 35 | 12 | |||||||||
| 65 | 37 | 54 | ||||||||||
| Deferred — | ||||||||||||
| U.S. | — | (18 | ) | 190 | ||||||||
| State and local | — | (3 | ) | 45 | ||||||||
| Foreign | 4 | (3 | ) | — | ||||||||
| 4 | (24 | ) | 235 | |||||||||
| Income tax expense | $ | 69 | $ | 13 | $ | 289 | ||||||
| Year Ended December 31, | |||||||||||
| 2013 | 2012 | 2011 | |||||||||
| (Millions) | |||||||||||
| Current — | |||||||||||
| U.S. federal | $ | 25 | $ | — | $ | — | |||||
| State and local | 4 | 4 | 2 | ||||||||
| Foreign | 81 | 89 | 91 | ||||||||
| 110 | 93 | 93 | |||||||||
| Deferred — | |||||||||||
| U.S. federal | (4 | ) | (25 | ) | — | ||||||
| State and local | 2 | (20 | ) | — | |||||||
| Foreign | 14 | (29 | ) | (5 | ) | ||||||
| 12 | (74 | ) | (5 | ) | |||||||
| Income tax expense | $ | 122 | $ | 19 | $ | 88 | |||||
Following is a reconciliation of income taxes computed at the statutory U.S. federal income tax rate (35(35 percent for all years presented) to the income tax expense reflected in the statements of income (loss):income:
| Year Ended December 31, | ||||||||||||
| 2010 | 2009 | 2008 | ||||||||||
| (Millions) | ||||||||||||
| Income tax expense (benefit) computed at the statutory U.S. federal income tax rate | $ | 46 | $ | (14 | ) | $ | (41 | ) | ||||
| Increases (reductions) in income tax expense resulting from: | ||||||||||||
| Foreign income taxed at different rates and foreign losses with no tax benefit | (16 | ) | 14 | (6 | ) | |||||||
| Taxes on repatriation of dividends | 4 | 4 | 15 | |||||||||
| State and local taxes on income, net of U.S. federal income tax benefit | 2 | 2 | 2 | |||||||||
| Changes in valuation allowance for tax loss carryforwards and credits | 16 | 5 | 233 | |||||||||
| Amortization of tax goodwill | — | — | (6 | ) | ||||||||
| Foreign tax holidays | (5 | ) | (3 | ) | — | |||||||
| Investment and R&D tax credits | (2 | ) | (5 | ) | (1 | ) | ||||||
| Foreign earnings subject to U.S. federal income tax | 5 | 3 | 3 | |||||||||
| Adjustment of prior years taxes | 4 | — | (2 | ) | ||||||||
| Impact of foreign tax law changes | (1 | ) | 2 | 10 | ||||||||
| Tax contingencies | 12 | 6 | 40 | |||||||||
| Goodwill impairment | — | — | 40 | |||||||||
| Other | 4 | (1 | ) | 2 | ||||||||
| Income tax expense | $ | 69 | $ | 13 | $ | 289 | ||||||
106
| Year Ended December 31, | |||||||||||
| 2013 | 2012 | 2011 | |||||||||
| (Millions) | |||||||||||
| Income tax expense computed at the statutory U.S. federal income tax rate | $ | 120 | $ | 113 | $ | 95 | |||||
| Increases (reductions) in income tax expense resulting from: | |||||||||||
| Foreign income taxed at different rates | (21 | ) | (21 | ) | (14 | ) | |||||
| Taxes on repatriation of dividends | 9 | 8 | 6 | ||||||||
| Remeasurement of estimated tax on unremitted earnings | (17 | ) | — | — | |||||||
| State and local taxes on income, net of U.S. federal income tax benefit | 6 | 4 | 2 | ||||||||
| Changes in valuation allowance for tax loss carryforwards and credits | 27 | (91 | ) | (11 | ) | ||||||
| Foreign tax holidays | (5 | ) | (5 | ) | (4 | ) | |||||
| Investment and R&D tax credits | (8 | ) | (1 | ) | (4 | ) | |||||
| Foreign earnings subject to U.S. federal income tax | 5 | 23 | 6 | ||||||||
| Adjustment of prior years taxes | (1 | ) | (5 | ) | — | ||||||
| Impact of tax law changes | (3 | ) | (1 | ) | — | ||||||
| Tax contingencies | 6 | (6 | ) | 3 | |||||||
| Goodwill impairment | — | — | 3 | ||||||||
| Other | 4 | 1 | 6 | ||||||||
| Income tax expense | $ | 122 | $ | 19 | $ | 88 | |||||
The components of our net deferred tax assets were as follows:
91
| Year Ended December 31, | |||||||
| 2013 | 2012 | ||||||
| (Millions) | |||||||
| Deferred tax assets — | |||||||
| Tax loss carryforwards: | |||||||
| U.S. federal | $ | — | $ | — | |||
| State | 23 | 23 | |||||
| Foreign | 78 | 63 | |||||
| Tax credit benefits | 88 | 51 | |||||
| Postretirement benefits other than pensions | 43 | 50 | |||||
| Pensions | 36 | 87 | |||||
| Bad debts | 1 | 1 | |||||
| Sales allowances | 6 | 6 | |||||
| Payroll and other accruals | 132 | 119 | |||||
| Valuation allowance | (135 | ) | (118 | ) | |||
| Total deferred tax assets | 272 | 282 | |||||
| Deferred tax liabilities — | |||||||
| Tax over book depreciation | 56 | 57 | |||||
| Other | 51 | 70 | |||||
| Total deferred tax liabilities | 107 | 127 | |||||
| Net deferred tax assets | $ | 165 | $ | 155 | |||
| December 31, | ||||||||
| 2010 | 2009 | |||||||
| (Millions) | ||||||||
| Deferred tax assets — | ||||||||
| Tax loss carryforwards: | ||||||||
| U.S. | $ | 157 | $ | 218 | ||||
| State | 53 | 61 | ||||||
| Foreign | 56 | 55 | ||||||
| Investment tax credit benefits | 46 | 44 | ||||||
| Postretirement benefits other than pensions | 52 | 54 | ||||||
| Pensions | 55 | 69 | ||||||
| Bad debts | 3 | 3 | ||||||
| Sales allowances | 6 | 5 | ||||||
| Payroll and other accruals | 93 | 91 | ||||||
| Valuation allowance | (318 | ) | (378 | ) | ||||
| Total deferred tax assets | 203 | 222 | ||||||
| Deferred tax liabilities — | ||||||||
| Tax over book depreciation | 82 | 89 | ||||||
| Other | 54 | 70 | ||||||
| Total deferred tax liabilities | 136 | 159 | ||||||
| Net deferred tax assets | $ | 67 | $ | 63 | ||||
U.S. and state tax loss carryforwards have been presented net of uncertain tax positions that if realized, would reduce tax loss carryforwards in 2013 and 2012 by $4 million and $47 million, respectively.
Following is a reconciliation of deferred taxes to the deferred taxes shown in the balance sheet:
| December 31, | ||||||||
| 2010 | 2009 | |||||||
| (Millions) | ||||||||
| Balance Sheet: | ||||||||
| Current portion — deferred tax asset | $ | 38 | $ | 35 | ||||
| Non-current portion — deferred tax asset | 92 | 100 | ||||||
| Current portion — deferred tax liability shown in other current liabilities | (7 | ) | (6 | ) | ||||
| Non-current portion — deferred tax liability | (56 | ) | (66 | ) | ||||
| Net deferred tax assets | $ | 67 | $ | 63 | ||||
| Year Ended December 31, | |||||||
| 2013 | 2012 | ||||||
| (Millions) | |||||||
| Balance Sheet: | |||||||
| Current portion — deferred tax asset | $ | 71 | $ | 72 | |||
| Non-current portion — deferred tax asset | 125 | 116 | |||||
| Current portion — deferred tax liability shown in other current liabilities | (3 | ) | (6 | ) | |||
| Non-current portion — deferred tax liability | (28 | ) | (27 | ) | |||
| Net deferred tax assets | $ | 165 | $ | 155 | |||
As a result of the valuation allowances recorded for $135 million and $118 million at December 31, 2013 and 2012, respectively, we have potential tax assets of $318 million and $378 million at December 31, 2010 and 2009, respectively, that were not recognized on our balance sheet as a result of the valuation allowance recorded.sheet. These unrecognized tax assets resulted primarily from U.S. tax loss carryforwards, foreign tax loss carryforwards, foreign investment tax credits and U.S. state net operating losses that are available to reduce future U.S., U.S. state and foreign tax liabilities.
We reported income tax expense of $122 million, $19 million and $88 million in the years ended 2013, 2012 and 2011, respectively. The tax expense recorded in 2013 differs from the expense that would be recorded using a U.S. Federal statutory rate of 35 percent primarily due to the impact of recording a valuation allowance against a tax benefit for restructuring activities in Spain and Belgium and U.S. taxes on repatriation of dividends, partially offset by tax adjustments related to recognizing a U.S. tax benefit for foreign taxes and a favorable mix of income generated in low tax rate jurisdictions.
We evaluate our deferred income taxes quarterly to determine if valuation allowances are required or should be adjusted. U.S. GAAP requires that companies assess whether valuation allowances should be established against their deferred tax assets based on consideration of all available evidence, both positive and negative, using a “more likely than not” standard. This assessment considers, among other matters, the nature,
107
frequency and amount of recent losses, the duration of statutory carryforward periods, and tax planning strategies. In making such judgments, significant weight is given to evidence that can be objectively verified.
92
In 2012, we reversed the tax valuation allowance that we recorded in 2008 against our net deferred tax assets in the U.S. based on operating improvements we had made, the outlook for light and commercial vehicle production in the U.S. and the positive impact this should have on our U.S. operations. The net income impact of the tax valuation allowance release in the U.S was a tax benefit of approximately $81 million. We now have a federal net operating loss ("NOL") at December 31, 2013 of $37 million, which expires in 2030. The state NOLs expire in various tax years through 2032.
Valuation allowances have been established in certain foreign jurisdictions for deferred tax assets based on a “more likely than not” threshold. The ability to realize deferred tax assets depends on our ability to generate sufficient taxable income within the carryforward periods provided for in the tax law for each tax jurisdiction. We have considered the following possible sources of taxable income when assessing the realization of our deferred tax assets:
| Future reversals of existing taxable temporary differences; | ||
Taxable income or loss, based on recent results, exclusive of reversing temporary differences and carryforwards;
Tax-planning strategies; and
Taxable income in prior carryback years if carryback is permitted under the relevant tax law.
In 2010,2012, after considering all available evidence and all possible sources of taxable income, we reported incomerecorded a $19 million tax expense of $69 million. Thevaluation allowance in Spain for tax expense recorded differs from the expensecredits that wouldmay not be recorded using a U.S. Federal statutory rate of 35 percentutilized due to the impact of not benefiting tax losses in the U.S. and certain foreign jurisdictions, and charges primarily related to adjustments to prior year income taxes and tax contingencies which more than offset a favorable mix of tax rates in the jurisdictions we pay taxes. During 2010, weSpain.
The valuation allowances recorded a $52 million reduction in our valuation allowance related to the utilization of U.S. NOLs resulting from a reorganization of our European operations. In evaluating the requirements to record a valuation allowance, accounting standards do not permit us to consider an economic recovery in the U.S. or new business we have won. Consequently, beginning in 2008, given our historical losses, we concluded that our ability to fully utilize our NOLs was limited due to projecting the continuation of the negative economic environment and the impact of the negative operating environment on our tax planning strategies. As a result of our tax planning strategies which have not yet been implemented and which do not depend upon generating future taxable income, we carry deferred tax assets in the U.S. of $90 million relating to the expected utilization of those NOLs. The federal NOLs expire beginning in tax years ending in 2020 through 2029. The state NOLs expire in various tax years through 2029.
We do not provide for U.S. income taxes on unremitted earnings of foreign subsidiaries, except for the earnings of certain of our China operations, as our present intention is to reinvest the unremitted earnings in our foreign operations. Unremitted earnings of foreign subsidiaries were approximately $683$858 million at December 31, 2010.2013. We estimated that the amount of U.S. and foreign income taxes that would be accrued or paid upon remittance of the assets that represent those unremitted earnings was $203 million.
$159 million. The estimated U.S. and foreign income taxes on unremitted earnings may be impacted in the future if we are unable to claim a U.S. foreign tax credit.
We have tax sharing agreements with our former affiliates that allocate tax liabilities for periods prior periodsto year 2000 and establish indemnity rights on certain tax issues.
U.S. GAAP provides that a tax benefit from an uncertain tax position may be recognized when it is “more likely than not” that the position will be sustained upon examination, including resolutions of any related appeals or litigation processes, based on the technical merits.
108
A reconciliation of our uncertain tax positions is as follows:
| 2010 | 2009 | 2008 | ||||||||||
| Uncertain tax positions — | ||||||||||||
| Balance January 1 | $ | 96 | $ | 83 | $ | 44 | ||||||
| Gross increases in tax positions in current period | 23 | 17 | 16 | |||||||||
| Gross increases in tax positions in prior period | 4 | 16 | 56 | |||||||||
| Gross decreases in tax positions in prior period | (6 | ) | — | (12 | ) | |||||||
| Gross decreases — settlements | (2 | ) | (17 | ) | (8 | ) | ||||||
| Gross decreases — statute of limitations expired | (4 | ) | (3 | ) | (13 | ) | ||||||
| Balance December 31 | $ | 111 | $ | 96 | $ | 83 | ||||||
| 2013 | 2012 | 2011 | |||||||||
| (Millions) | |||||||||||
| Uncertain tax positions — | |||||||||||
| Balance January 1 | $ | 107 | $ | 119 | $ | 111 | |||||
| Gross increases in tax positions in current period | 15 | 13 | 19 | ||||||||
| Gross increases in tax positions in prior period | — | 1 | 3 | ||||||||
| Gross decreases in tax positions in prior period | (1 | ) | (12 | ) | (10 | ) | |||||
| Gross decreases — settlements | — | (5 | ) | — | |||||||
| Gross decreases — statute of limitations expired | (6 | ) | (9 | ) | (4 | ) | |||||
| Balance December 31 | $ | 115 | $ | 107 | $ | 119 | |||||
Included in the balance of uncertain tax positions were $107 million in 2013, $101 million in 2012, $36 million at December 31, 2010, 2009 and 2008 were $36 million, $28 million and $75 million, respectively,2011, of tax benefits, that if recognized, would affect the effective tax rate. We recognize accrued interest and penalties related to unrecognized tax benefits as income tax expense. Related to the uncertain tax positions noted above, we accrued penaltiesPenalties of $2less than $1 million in 2009. No penalties were accrued in 20102013, 2012 and 2008.2011. Additionally, interest of less than one million waswe accrued related to uncertain tax positions in 2010. No interest was accrued in 2009 and $2 million of interest related to uncertain tax positions was accruedof less than $2 million in 2008.2013, less than $1 million in 2012, and $2 million in 2011. Our liability for penalties was $3$2 million at both December 31, 2010 and 2009 respectively and $12013, $3 million at December 31, 2008,2012 and $2 million at December 31, 2011, respectively, and our liability for interest was $5$7 million $4, $5 million, and $7$7 million at December 31, 2010, 20092013, 2012 and 2008,2011, respectively.
Our uncertain tax position at December 31, 20102013 and 20092012 included foreign exposures relating to the disallowance of deductions, global transfer pricing and various other issues. We believe it is reasonably possible that a decrease of up to $1$4 million in
93
unrecognized tax benefits related to the expiration of foreign statute of limitations and the conclusion of foreign income tax examinations may occur within the coming year.
We are subject to taxation in the U.S. and various state and foreign jurisdictions. As of December 31, 2010,2013, our tax years open to examination in primary jurisdictions are as follows:
| Open To Tax | ||||
| Year | ||||
| United States | 2000 | |||
| China | 2003 | |||
| Spain | ||||
| Canada | 2007 | |||
| Brazil | 2008 | |||
| Mexico | 2008 | |||
| Belgium | 2011 | |||
| Germany | ||||
| 2011 | ||||
| United Kingdom | ||||
| 2012 | ||||
8. | Common Stock |
We have authorized 135 million shares ($($0.01 par value) of common stock, of which 61,541,76063,714,728 shares and 60,789,73962,789,382 shares were issued at December 31, 20102013 and 2009,2012, respectively. We held 1,294,6922,844,692 and 2,294,692 shares of treasury stock at both December 31, 20102013 and 2009.2012, respectively.
Equity Plans — In December 1996, we adopted the 1996 Stock Ownership Plan, which permitted the granting of a variety of awards, including common stock, restricted stock, performance units, stock equivalent units, stock appreciation rights (“SARs”) and stock options to our directors, officers, employees and consultants. The 1996 plan, which terminated as to new awards on December 31, 2001, was renamed the
109
We have granted restricted common stock and stock options to our directors and certain key employees and restricted stock units, payable in cash, to certain key employees. These awards generally require, among other things, that the award holder remain in service to our company during the restriction period, which is currently 3three years, with a portion of the award vesting equally each year. We also have granted stock equivalent units and long-term performance units to certain key employees that are payable in cash. At December 31, 2010,2013, the long-term performance units outstanding included a three-year grant for2008-2010 (“the 2008 Grant”) 2011-2013 payable in the first quarter of 2011 and2014, a three-year grant for2010-2012 (“the 2010 Grant”) 2012-2014 payable in the first quarter of 2013.2015, and a three-year grant for 2013-2015 payable in the first quarter of 2016. Payment is based on the attainment of specified performance goals. The 2008 Grant value is indexed to the stock price. The 2010 Grant value is based on stock price, cumulative EBITDA and free cashflowcash flow metrics. In addition, we have granted SARs to certain key employees in our Asian and Indian operations that are payable in cash after a three-year service period. The grant value is indexed to the stock price.
94
$0.09 decrease in basic and a $0.08 decrease in diluted earnings per share in 2012, and a $0.05 decrease in both basic and diluted earnings per share in 2011.
For employees eligible to retire at the table below.
| Year Ended December 31, | ||||||||||||
| 2010 | 2009 | 2008 | ||||||||||
| (Millions) | ||||||||||||
| Selling, general and administrative | $ | 3 | $ | 3 | $ | 4 | ||||||
| Loss before interest expense, income taxes and noncontrolling interests | (3 | ) | (3 | ) | (4 | ) | ||||||
| Net loss | $ | (3 | ) | $ | (3 | ) | $ | (4 | ) | |||
| Decrease in basic earnings per share | $ | (0.05 | ) | $ | (0.06 | ) | $ | (0.09 | ) | |||
| Decrease in diluted earnings per share | $ | (0.05 | ) | $ | (0.06 | ) | $ | (0.09 | ) | |||
110
As of December 31, 2010,2013, there was approximately $4$6 million of unrecognized compensation costs related to our stock optionoptions awards that we expect to recognize over a weighted average period of 0.71.2 years.
Compensation expense for restricted stock, restricted stock units, long-term performance units and SARs was $14$17 million for the year ended December 31, 2010, $16 million, and $5$11 million for each of the years ended December 31, 20092013, 2012 and 20082011, respectively, and was recorded in selling, general, and administrative expense on the statementconsolidated statements of income (loss).income.
Cash received from stock option exercises for the year ended December 31, 2010, 2009,was $15 million in 2013, $7 million in 2012, and 2008 was $6$6 million $1 million, and $2 million, respectively. in 2011. Stock option exercises in 2010 and 2009 would have generated an excess tax benefit of $4$6 million in 2013 and $1$10 million in each period, respectively. We did not record the excessboth 2012 and 2011. This tax benefit aswas not recorded because we still have federal net operating losses that have not been utilized.
In 2013 we recorded a tax benefit of $24 million related to the historic tax benefit on stock options from 2006 through 2011 because we began utilizing some of our federal and state net operating losses which are not currently being utilized.losses.
Assumptions — We calculated the fair values of stock option awards using the Black-Scholes option pricing model with the weighted average assumptions listed below. The fair value of share-based awards is determined at the time the awards are granted which is generally in January of each year, and requires judgment in estimating employee and market behavior.
| Year Ended December 31, | ||||||||||||
| 2010 | 2009 | 2008 | ||||||||||
| Stock Options Granted | ||||||||||||
| Weighted average grant date fair value, per share | $ | 11.76 | $ | 1.34 | $ | 8.03 | ||||||
| Weighted average assumptions used: | ||||||||||||
| Expected volatility | 75.4 | % | 82.6 | % | 37.7 | % | ||||||
| Expected lives | 4.6 | 4.5 | 4.1 | |||||||||
| Risk-free interest rates | 2.2 | % | 1.48 | % | 2.8 | % | ||||||
| Dividends yields | 0.0 | % | 0.00 | % | 0.0 | % | ||||||
| 2013 | 2012 | 2011 | |||||||||
| Stock Options Granted: | |||||||||||
| Weighted average grant date fair value, per share | $ | 19.84 | $ | 17.35 | $ | 26.13 | |||||
| Weighted average assumptions used: | |||||||||||
| Expected volatility | 66.4 | % | 73.5 | % | 70.1 | % | |||||
| Expected lives | 4.9 | 4.7 | 4.8 | ||||||||
| Risk-free interest rates | 0.7 | % | 0.8 | % | 1.8 | % | |||||
| Dividends yields | — | % | — | % | — | % | |||||
Expected volatility is calculated based on current implied volatility and historical realized volatility for the Company.
Expected lives of options are based upon the historical and expected time to post-vesting forfeiture and exercise. We believe this method is the best estimate of the future exercise patterns currently available.
The risk-free interest rates are based upon the Constant Maturity Rates provided by the U.S. Treasury. For our valuations, we used the continuous rate with a term equal to the expected life of the options.
111
Stock Options — The following table reflects the status and activity for all options to purchase common stock for the period indicated:
95
| Year Ended December 31, 2010 | ||||||||||||||||
| Weighted Avg. | ||||||||||||||||
| Shares | Weighted Avg. | Remaining | Aggregate | |||||||||||||
| Under | Exercise | Life in | Intrinsic | |||||||||||||
| Option | Prices | Years | Value | |||||||||||||
| (Millions) | ||||||||||||||||
| Outstanding Stock Options | ||||||||||||||||
| Outstanding, January 1, 2010 | 3,425,457 | $ | 13.21 | 4.6 | $ | 20 | ||||||||||
| Granted | 346,774 | 19.48 | ||||||||||||||
| Canceled | (15,000 | ) | 10.66 | |||||||||||||
| Forfeited | (16,471 | ) | 19.72 | |||||||||||||
| Exercised | (55,375 | ) | 6.06 | 1 | ||||||||||||
| Outstanding, March 31, 2010 | 3,685,385 | $ | 13.89 | 4.7 | $ | 30 | ||||||||||
| Granted | 6,398 | 24.27 | ||||||||||||||
| Canceled | — | — | ||||||||||||||
| Forfeited | (1,350 | ) | 25.09 | |||||||||||||
| Exercised | (32,546 | ) | 11.30 | — | ||||||||||||
| Outstanding, June 30, 2010 | 3,657,887 | $ | 13.93 | 4.6 | $ | 37 | ||||||||||
| Granted | 4,540 | 22.58 | ||||||||||||||
| Canceled | — | — | ||||||||||||||
| Forfeited | (13,891 | ) | 6.58 | |||||||||||||
| Exercised | (208,108 | ) | 6.56 | 4 | ||||||||||||
| Outstanding, September 30, 2010 | 3,440,428 | $ | 14.38 | 4.3 | $ | 39 | ||||||||||
| Granted | 127 | 33.34 | ||||||||||||||
| Canceled | — | — | ||||||||||||||
| Forfeited | (2,965 | ) | 20.33 | |||||||||||||
| Exercised | (308,349 | ) | 14.19 | 7 | ||||||||||||
| Outstanding, December 31, 2010 | 3,129,241 | $ | 14.43 | 4.3 | $ | 68 | ||||||||||
| Vested and Expected to Vest, December 31, 2010 | 3,051,525 | 14.50 | 4.3 | $ | 66 | |||||||||||
| Exercisable, December 31, 2010 | 2,242,478 | $ | 15.23 | 4.1 | $ | 47 | ||||||||||
112
TENNECO INC.
NOTES TO CONSOLIDATED FINANCIAL STATEMENTS — (Continued)
| Year Ended December 31, 2013 | ||||||||||||
| Shares Under Option | Weighted Avg. Exercise Prices | Weighted Avg. Remaining Life in Years | Aggregate Intrinsic Value | |||||||||
| (Millions) | ||||||||||||
| Outstanding Stock Options: | ||||||||||||
| Outstanding, January 1, 2013 | 2,447,475 | $ | 20.14 | 4.1 | $ | 29 | ||||||
| Granted | 311,539 | 36.29 | ||||||||||
| Canceled | (7,225 | ) | 11.73 | |||||||||
| Forfeited | (14,920 | ) | 14.59 | |||||||||
| Exercised | (82,622 | ) | 19.96 | 1 | ||||||||
| Outstanding, March 31, 2013 | 2,654,247 | $ | 22.12 | 4.3 | $ | 41 | ||||||
| Granted | 388 | 38.90 | ||||||||||
| Forfeited | (450 | ) | 21.81 | |||||||||
| Exercised | (393,442 | ) | 22.53 | 7 | ||||||||
| Outstanding, June 30, 2013 | 2,260,743 | $ | 22.06 | 4.7 | $ | 44 | ||||||
| Granted | 1,182 | 35.41 | ||||||||||
| Forfeited | (283 | ) | 8.68 | |||||||||
| Exercised | (147,753 | ) | 15.42 | — | ||||||||
| Outstanding, September 30, 2013 | 2,113,889 | $ | 22.52 | 4.6 | $ | 56 | ||||||
| Granted | — | — | ||||||||||
| Canceled | — | — | ||||||||||
| Forfeited | — | — | ||||||||||
| Exercised | (130,316 | ) | 16.23 | 5 | ||||||||
| Outstanding, December 31, 2013 | 1,983,573 | $ | 22.93 | 4.5 | $ | 62 | ||||||
Of the outstanding 1,983,573 options, 1,397,102 are currently exercisable and have an intrinsic value of $51, a weighted average exercise price of 17.82 and a weighted average remaining life of 4.7 years.
The weighted average grant-date fair value of options granted during the years 2013, 2012 and 2011 was $19.86, $17.49 and $26.11, respectively. The total intrinsic value of options exercised during the years ended December 31, 2013, 2012, and 2011 was $19 million, $10 million and $13 million, respectively. The total fair value of shares vested was $5 million, $4 million, and $3 million in 2013, 2012 and 2011.
Restricted Stock — The following table reflects the status for all nonvested restricted shares for the period indicated:
96
TENNECO INC.
| Year Ended | ||||||||
| December 31, 2010 | ||||||||
| Weighted Avg. | ||||||||
| Grant Date | ||||||||
| Shares | Fair Value | |||||||
| Nonvested Restricted Shares | ||||||||
| Nonvested balance at January 1, 2010 | 644,052 | $ | 9.85 | |||||
| Granted | 240,555 | 19.48 | ||||||
| Vested | (307,981 | ) | 13.82 | |||||
| Forfeited | (3,064 | ) | 4.10 | |||||
| Nonvested balance at March 31, 2010 | 573,562 | $ | 11.50 | |||||
| Granted | 4,099 | 24.27 | ||||||
| Vested | (2,913 | ) | 13.54 | |||||
| Forfeited | (160 | ) | 1.85 | |||||
| Nonvested balance at June 30, 2010 | 574,588 | $ | 11.59 | |||||
| Granted | 2,909 | 22.58 | ||||||
| Vested | (3,338 | ) | 18.46 | |||||
| Forfeited | (436 | ) | 1.85 | |||||
| Nonvested balance at September 30, 2010 | 573,723 | $ | 11.61 | |||||
| Granted | 81 | 33.34 | ||||||
| Vested | (14,094 | ) | 13.39 | |||||
| Forfeited | (1,512 | ) | 7.45 | |||||
| Nonvested balance at December 31, 2010 | 558,198 | $ | 11.58 | |||||
NOTES TO CONSOLIDATED FINANCIAL STATEMENTS — (Continued)
| Year Ended December 31, 2013 | ||||||
| Shares | Weighted Avg. Grant Date Fair Value | |||||
| Nonvested Restricted Shares | ||||||
| Nonvested balance at January 1, 2013 | 348,918 | $ | 31.69 | |||
| Granted | 204,731 | 36.28 | ||||
| Vested | (154,160 | ) | 29.54 | |||
| Forfeited | — | — | ||||
| Nonvested balance at March 31, 2013 | 399,489 | $ | 34.88 | |||
| Granted | 226 | 38.90 | ||||
| Vested | (15,289 | ) | 35.40 | |||
| Forfeited | — | — | ||||
| Nonvested balance at June 30, 2013 | 384,426 | $ | 34.86 | |||
| Granted | 2,223 | 46.91 | ||||
| Vested | (16,255 | ) | 35.58 | |||
| Forfeited | — | — | ||||
| Nonvested balance at September 30, 2013 | 370,394 | $ | 34.90 | |||
| Granted | — | — | ||||
| Vested | (2,126 | ) | 34.93 | |||
| Forfeited | — | — | ||||
| Nonvested balance at December 31, 2012 | 368,268 | $ | 34.90 | |||
The fair value of restricted stock grants is equal to the average market price of our stock at the date of grant. As of December 31, 2010,2013, approximately $3$6 million of total unrecognized compensation costs related to restricted stock awards is expected to be recognized over a weighted-average period of approximately 2.11.7 years.
The weighted average grant-date fair value of restricted stock granted during the years 2013, 2012 and 2011 was $36.40, $30.06, and $45.38, respectively. The total fair value of restricted shares vested was $6 million in 2013, $5 million in 2012 and $3 million in 2011.
Share Repurchase Program — In January 2012, our Board of Directors approved a share repurchase program, authorizing us to repurchase up to 600,000 shares of our outstanding common stock over a 12 months period. This share repurchase program was intended to offset dilution from shares of restricted stock and stock options issued in 2012 to employees. We purchased all of the 600,000 shares during the second quarter of 2012 through open market purchases, which were funded through cash from operations, at a total cost of $18 million, at an average price of $29.22 per share. These repurchased shares are held as part of our treasury stock which increased to 2,294,692 shares at December 31, 2012 from 1,694,692 shares at December 31, 2011.
In January 2013, our Board of Directors approved a share repurchase program, authorizing our company to repurchase up to 550,000 shares of our outstanding common stock over a 12 month period. This share repurchase program is intended to offset dilution from shares of restricted stock and stock options issued in 2013 to employees. We purchased 450,000 shares through open market purchases and 100,000 shares from the Tenneco Retirement Plan for Salaried Employees, both of which were funded through cash from operations, at a total cost of $27 million, at an average price of 49.33 per share. These repurchased shares are held as part of our treasury stock which increased to 2,844,692 shares at December 31, 2013 from 2,294,692 shares at December 31, 2012 .
In January 2014, our Board of Directors approved a share repurchase program, authorizing our company to repurchase up to 400,000 shares of our outstanding common stock over a 12 month period. This share repurchase program is intended to offset dilution from shares of restricted stock and stock options issued in 2014 to employees.
Long-Term Performance Units, Restricted Stock Units and SARs — Long-term performance units, restricted stock units, and SARs are paid in cash and recognized as a liability based upon their fair value. As of December 31, 2010, $72013, $13 million of total unrecognized compensation costs is expected to be recognized over a weighted-average period of approximately 2.01.2 years.
97 9. | Preferred Stock |
We had 50 million shares of preferred stock ($($0.01 par value) authorized at December 31, 20102013 and 2009,2012, respectively. No shares of preferred stock were outstanding at those dates.
10. | Pension Plans, Postretirement and Other Employee Benefits |
Pension benefits are based on years of service and, for most salaried employees, on average compensation. Our funding policy is to contribute to the plans amounts necessary to satisfy the funding requirement of applicable federal or foreign laws and regulations. Of our $715$863 million benefit obligation at December 31, 2010,2013, approximately $650$779 million required funding under applicable federal and foreign laws. At December 31,
113
| Percentage of Fair Market Value | ||||||||||||||||
| December 31, | December 31, | |||||||||||||||
| 2010 | 2009 | |||||||||||||||
| US | Foreign | US | Foreign | |||||||||||||
| Equity Securities | 71 | % | 57 | % | 71 | % | 55 | % | ||||||||
| Debt Securities | 28 | % | 36 | % | 29 | % | 38 | % | ||||||||
| Real Estate | — | 2 | % | — | 2 | % | ||||||||||
| Other | 1 | % | 5 | % | — | 5 | % | |||||||||
| Percentage of Fair Market Value | |||||||||||
| December 31, 2013 | December 31, 2012 | ||||||||||
| US | Foreign | US | Foreign | ||||||||
| Equity Securities | 71 | % | 62 | % | 70 | % | 59 | % | |||
| Debt Securities | 29 | % | 31 | % | 30 | % | 33 | % | |||
| Real Estate | — | 2 | % | — | 2 | % | |||||
| Other | — | 5 | % | — | % | 6 | % | ||||
The assets of some of our pension plans are invested in trusts that permit commingling of the assets of more than one employee benefit plan for investment and administrative purposes. Each of the plans participating in the trust has interests in the net assets of the underlying investment pools of the trusts. The investments for all our pension plans are recorded at estimated fair value, in compliance with the recent accounting guidance on fair value measurement.
114
The following table presents our plan assets using the fair value hierarchy as of December 31, 20102013 and December 31, 2009.2012, respectively. The fair value hierarchy has three levels based on the methods used to determine the fair value. Level 1 assets refer to those asset values based on quoted market prices in active markets for identical assets at the measurement date. Level 2 assets refer to assets with values determined using significant other observable inputs, and Level 3 assets include values determined with non-observable inputs.
98
| Fair Value Level as of December 31, 2010 | ||||||||||||||||||||||||
| US | Foreign | |||||||||||||||||||||||
Asset Category | Level 1 | Level 2 | Level 3 | Level 1 | Level 2 | Level 3 | ||||||||||||||||||
| (Millions) | ||||||||||||||||||||||||
| Equity securities: | ||||||||||||||||||||||||
| U.S. large cap | $ | 33 | $ | 96 | $ | — | $ | 25 | $ | 7 | $ | — | ||||||||||||
| U.S. mid cap | — | — | — | — | 1 | — | ||||||||||||||||||
| U.S. Small Cap | — | 18 | — | — | 1 | — | ||||||||||||||||||
Non-U.S. large cap | — | 18 | — | 36 | 65 | — | ||||||||||||||||||
Non-U.S. mid cap | — | — | — | — | 19 | — | ||||||||||||||||||
Non-U.S. small cap | — | — | — | — | 8 | — | ||||||||||||||||||
| Emerging markets | — | 6 | — | 1 | — | — | ||||||||||||||||||
| Debt securities: | ||||||||||||||||||||||||
| U.S. treasuries/government bonds | 20 | — | — | — | — | — | ||||||||||||||||||
| U.S. corporate bonds | — | 20 | — | — | — | — | ||||||||||||||||||
| U.S. mortgage backed securities | — | 24 | — | — | — | — | ||||||||||||||||||
| U.S. asset backed securities | — | 1 | — | — | — | — | ||||||||||||||||||
| U.S. other fixed income | — | 4 | — | — | — | — | ||||||||||||||||||
Non-U.S. treasuries /government bonds | — | 1 | — | 59 | 5 | — | ||||||||||||||||||
Non-U.S. corporate bonds | — | 1 | — | 15 | 21 | — | ||||||||||||||||||
Non-U.S. other fixed income | — | — | — | — | — | 6 | ||||||||||||||||||
| Real Estate: | ||||||||||||||||||||||||
Non-U.S. real estate | — | — | — | — | 5 | — | ||||||||||||||||||
| Other: | ||||||||||||||||||||||||
| Insurance contracts | — | — | — | — | 7 | — | ||||||||||||||||||
| Cash held in bank accounts | — | — | — | 6 | — | — | ||||||||||||||||||
| Total | $ | 53 | $ | 189 | $ | — | $ | 142 | $ | 139 | $ | 6 | ||||||||||||
TENNECO INC.
NOTES TO CONSOLIDATED FINANCIAL STATEMENTS — (Continued)
| Fair Value Level as of December 31, 2013 | |||||||||||||||||||||||
| US | Foreign | ||||||||||||||||||||||
| Asset Category | Level 1 | Level 2 | Level 3 | Level 1 | Level 2 | Level 3 | |||||||||||||||||
| (Millions) | |||||||||||||||||||||||
| Equity securities: | |||||||||||||||||||||||
| U.S. large cap | $ | 41 | $ | 143 | $ | — | $ | 31 | $ | 21 | $ | — | |||||||||||
| U.S. mid cap | — | — | — | 4 | 4 | — | |||||||||||||||||
| U.S. Small Cap | — | 27 | — | — | — | — | |||||||||||||||||
| Non-U.S. large cap | — | — | — | 57 | 71 | — | |||||||||||||||||
| Non-U.S. mid cap | — | 27 | — | 20 | 19 | — | |||||||||||||||||
| Non-U.S. small cap | — | — | — | 1 | 7 | — | |||||||||||||||||
| Emerging markets | — | 8 | — | — | 4 | — | |||||||||||||||||
| Debt securities: | |||||||||||||||||||||||
| U.S. corporate bonds | — | 5 | — | — | 4 | — | |||||||||||||||||
| U.S. other fixed income | — | 96 | — | — | — | — | |||||||||||||||||
| Non-U.S. treasuries/government bonds | — | — | — | 35 | 25 | — | |||||||||||||||||
| Non-U.S. corporate bonds | — | — | — | 18 | 18 | — | |||||||||||||||||
| Non-U.S. mortgage backed securities | — | — | — | — | 4 | — | |||||||||||||||||
| Non-U.S. municipal obligations | — | — | — | 1 | — | — | |||||||||||||||||
| Non-U.S. asset backed securities | — | — | — | — | 3 | — | |||||||||||||||||
| Non-U.S. other fixed income | — | — | — | 1 | 2 | — | |||||||||||||||||
| Real Estate: | |||||||||||||||||||||||
| Non-U.S. real estate | — | — | — | 1 | 5 | — | |||||||||||||||||
| Other: | |||||||||||||||||||||||
| Insurance contracts | — | — | — | — | 9 | 8 | |||||||||||||||||
| Cash held in bank accounts | — | — | — | 6 | — | — | |||||||||||||||||
| Total | $ | 41 | $ | 306 | $ | — | $ | 175 | $ | 196 | $ | 8 | |||||||||||
| Fair Value Level as of December 31, 2009 | ||||||||||||||||||||||||
| US | Foreign | |||||||||||||||||||||||
Asset Category | Level 1 | Level 2 | Level 3 | Level 1 | Level 2 | Level 3 | ||||||||||||||||||
| (Millions) | ||||||||||||||||||||||||
| Equity securities: | ||||||||||||||||||||||||
| U.S. large cap | $ | 14 | $ | 89 | $ | — | $ | 4 | $ | 24 | $ | — | ||||||||||||
| U.S. mid cap | — | 3 | — | — | — | — | ||||||||||||||||||
| U.S. Small Cap | — | 16 | — | — | — | — | ||||||||||||||||||
Non-U.S. large cap | — | 15 | — | 35 | 60 | — | ||||||||||||||||||
Non-U.S. mid cap | — | — | — | — | 17 | — | ||||||||||||||||||
| Emerging markets | 5 | — | — | — | 6 | — | ||||||||||||||||||
| Debt securities: | ||||||||||||||||||||||||
| U.S. treasuries/government bonds | 13 | 3 | — | — | — | — | ||||||||||||||||||
| U.S. corporate bonds | — | 14 | — | — | — | — | ||||||||||||||||||
| U.S. mortgage backed securities | — | 20 | — | — | — | — | ||||||||||||||||||
| U.S. asset backed securities | — | 3 | — | — | — | — | ||||||||||||||||||
| U.S. other fixed income | — | 4 | — | — | — | — | ||||||||||||||||||
Non-U.S. treasuries /government bonds | — | — | — | 33 | 22 | — | ||||||||||||||||||
Non-U.S. corporate bonds | — | — | — | 7 | 31 | — | ||||||||||||||||||
Non-U.S. municipal obligations | — | — | — | — | 1 | — | ||||||||||||||||||
Non-U.S. other fixed income | — | — | — | — | — | 6 | ||||||||||||||||||
| Real Estate: | ||||||||||||||||||||||||
Non-U.S. real estate | — | — | — | — | 5 | — | ||||||||||||||||||
| Other: | ||||||||||||||||||||||||
| Insurance contracts | — | — | — | — | 7 | — | ||||||||||||||||||
| Cash held in bank accounts | — | — | — | 4 | — | — | ||||||||||||||||||
| Total | $ | 32 | $ | 167 | $ | — | $ | 83 | $ | 173 | $ | 6 | ||||||||||||
99
| Fair Value Level as of December 31, 2012 | |||||||||||||||||||||||
| US | Foreign | ||||||||||||||||||||||
| Asset Category | Level 1 | Level 2 | Level 3 | Level 1 | Level 2 | Level 3 | |||||||||||||||||
| (Millions) | |||||||||||||||||||||||
| Equity securities: | |||||||||||||||||||||||
| U.S. large cap | $ | 29 | $ | 117 | $ | — | $ | 26 | $ | 15 | $ | — | |||||||||||
| U.S. mid cap | — | — | — | 2 | 5 | — | |||||||||||||||||
| U.S. Small Cap | — | 20 | — | — | — | — | |||||||||||||||||
| Non-U.S. large cap | — | — | — | 48 | 63 | — | |||||||||||||||||
| Non-U.S. mid cap | — | 20 | — | 13 | 16 | — | |||||||||||||||||
| Non-U.S. small cap | — | — | — | 1 | 4 | — | |||||||||||||||||
| Emerging markets | — | 7 | — | 2 | 1 | — | |||||||||||||||||
| Debt securities: | |||||||||||||||||||||||
| U.S. treasuries/government bonds | — | — | — | — | — | — | |||||||||||||||||
| U.S. corporate bonds | — | 4 | — | — | — | — | |||||||||||||||||
| U.S. mortgage backed securities | — | — | — | — | — | — | |||||||||||||||||
| U.S. asset backed securities | — | — | — | — | — | — | |||||||||||||||||
| U.S. other fixed income | — | 78 | — | — | — | — | |||||||||||||||||
| Non-U.S. treasuries/government bonds | — | — | — | 36 | 24 | — | |||||||||||||||||
| Non-U.S. corporate bonds | — | — | — | 18 | 24 | — | |||||||||||||||||
| Non-U.S. mortgage backed securities | — | — | — | — | 3 | — | |||||||||||||||||
| Non-U.S. municipal obligations | — | — | — | 1 | — | — | |||||||||||||||||
| Non-U.S. asset backed securities | — | — | — | — | 3 | — | |||||||||||||||||
| Non-U.S. other fixed income | — | — | — | 1 | — | — | |||||||||||||||||
| Real Estate: | |||||||||||||||||||||||
| Non-U.S. real estate | — | — | — | 1 | 5 | — | |||||||||||||||||
| Other: | |||||||||||||||||||||||
| Insurance contracts | — | — | — | — | 8 | 8 | |||||||||||||||||
| Cash held in bank accounts | — | — | — | 4 | — | — | |||||||||||||||||
| Total | $ | 29 | $ | 246 | $ | — | $ | 153 | $ | 171 | $ | 8 | |||||||||||
Level 1 assets were valued using market prices based on daily net asset value (NAV) or prices available daily through a public stock exchange. Level 2 assets were valued primarily using market prices, sometimes net of estimated realization expenses, and based on broker/dealer markets or in commingled funds where NAV is not available daily or publicly. For insurance contracts, the estimated surrender value of the policy was used to estimate fair market value. Level 3 assets in the Netherlands were valued using an industry standard model based on certain assumptions such as the U-return and estimated technical reserve.
The table below summarizes the changes in the fair value of the Level 3 assets:
| December 31, | ||||||||||||||||
| 2010 | December 31, 2009 | |||||||||||||||
| Level 3 Assets | Level 3 Assets | |||||||||||||||
| US | Foreign | US | Foreign | |||||||||||||
| (Millions) | (Millions) | |||||||||||||||
| Balance at December 31 of the previous year | $ | — | $ | 6 | $ | — | $ | 4 | ||||||||
| Actual return on plan assets: | ||||||||||||||||
| Relating to assets still held at the reporting date | — | — | — | 2 | ||||||||||||
| Ending Balance at December 31 | $ | — | $ | 6 | $ | — | $ | 6 | ||||||||
116
| December 31, 2013 | December 31, 2012 | ||||||||||||||
| Level 3 Assets | Level 3 Assets | ||||||||||||||
| US | Foreign | US | Foreign | ||||||||||||
| (Millions) | (Millions) | ||||||||||||||
| Balance at December 31 of the previous year | $ | — | $ | 8 | $ | — | $ | 6 | |||||||
| Actual return on plan assets: | |||||||||||||||
| Relating to assets still held at the reporting date | — | — | — | 2 | |||||||||||
| Ending Balance at December 31 | $ | — | $ | 8 | $ | — | $ | 8 | |||||||
The following table contains information about significant concentrations of risk, including all individual assets that make up more than 5%5 percent of the total assets and any direct investments in Tenneco stock:
100
TENNECO INC.
| Percentage of | ||||||||||||
Asset Category | Fair Value Level | Value | Total Assets | |||||||||
| (Millions) | ||||||||||||
| 2010: | ||||||||||||
| Tenneco Stock | 1 | $ | 34 | 14.0 | % | |||||||
| 2009: | ||||||||||||
| Tenneco Stock | 1 | $ | 14 | 7.3 | % | |||||||
NOTES TO CONSOLIDATED FINANCIAL STATEMENTS — (Continued)
| Asset Category | Fair Value Level | Value | Percentage of Total Assets | ||||||
| (Millions) | |||||||||
| 2013: | |||||||||
| Tenneco Stock | 1 | $ | 41 | 5.6 | % | ||||
| 2012: | |||||||||
| Tenneco Stock | 1 | $ | 29 | 4.7 | % | ||||
Our investment policy for both our domestic and foreign plans is to invest more heavily in equity securities than debt securities. Targeted pension plan allocations are 70 percent in equity securities and 30 percent in debt securities, with acceptable tolerance levels of plus or minus five percent within each category for our domestic plans. Our foreign plans are individually managed to different target levels depending on the investing environment in each country.
Our approach to determining expected return on plan asset assumptions evaluates both historical returns as well as estimates of future returns, and adjusts for any expected changes in the long-term outlook for the equity and fixed income markets for both our domestic and foreign plans.
117
A summary of the change in benefit obligation, the change in plan assets, the development of net amount recognized, and the amounts recognized in the balance sheets for the pension plans and postretirement benefit plan follows:
| Pension | Postretirement | |||||||||||||||||||||||
| 2010 | 2009 | 2010 | 2009 | |||||||||||||||||||||
| US | Foreign | US | Foreign | US | US | |||||||||||||||||||
| (Millions) | ||||||||||||||||||||||||
| Change in benefit obligation: | ||||||||||||||||||||||||
| Benefit obligation at December 31 of the previous year | $ | 341 | $ | 333 | $ | 334 | $ | 276 | $ | 142 | $ | 143 | ||||||||||||
| Currency rate conversion | — | (3 | ) | — | 31 | — | — | |||||||||||||||||
| Settlement | — | (2 | ) | — | (1 | ) | — | — | ||||||||||||||||
| Service cost | 1 | 4 | 1 | 3 | 1 | 1 | ||||||||||||||||||
| Interest cost | 20 | 19 | 20 | 18 | 8 | 8 | ||||||||||||||||||
| Plan amendments | — | 1 | — | — | — | — | ||||||||||||||||||
| Actuarial (gain)/loss | 22 | 21 | 4 | 17 | (7 | ) | (2 | ) | ||||||||||||||||
| Benefits paid | (30 | ) | (15 | ) | (18 | ) | (13 | ) | (9 | ) | (9 | ) | ||||||||||||
| Participants’ contributions | — | 3 | — | 2 | — | — | ||||||||||||||||||
| Benefit obligation at December 31 | $ | 354 | $ | 361 | $ | 341 | $ | 333 | $ | 135 | $ | 141 | ||||||||||||
| Change in plan assets: | ||||||||||||||||||||||||
| Fair value at December 31 of the previous year | $ | 199 | $ | 262 | $ | 165 | $ | 196 | $ | — | $ | — | ||||||||||||
| Currency rate conversion | — | (1 | ) | — | 25 | — | — | |||||||||||||||||
| Settlement | — | (2 | ) | — | (1 | ) | — | — | ||||||||||||||||
| Actual return on plan assets | 40 | 20 | 43 | 35 | — | — | ||||||||||||||||||
| Employer contributions | 33 | 20 | 9 | 18 | 9 | 9 | ||||||||||||||||||
| Participants’ contributions | — | 3 | — | 2 | — | — | ||||||||||||||||||
| Benefits paid | (30 | ) | (15 | ) | (18 | ) | (13 | ) | (9 | ) | (9 | ) | ||||||||||||
| Fair value at December 31 | $ | 242 | $ | 287 | $ | 199 | $ | 262 | $ | — | $ | — | ||||||||||||
| Development of net amount recognized: | ||||||||||||||||||||||||
| Unfunded status at December 31 | $ | (112 | ) | $ | (74 | ) | $ | (142 | ) | $ | (71 | ) | $ | (135 | ) | $ | (141 | ) | ||||||
| Unrecognized cost: | ||||||||||||||||||||||||
| Actuarial loss | 165 | 120 | 171 | 104 | 63 | 74 | ||||||||||||||||||
| Prior service cost/ (credit) | 2 | 11 | 2 | 11 | (35 | ) | (41 | ) | ||||||||||||||||
| Net amount recognized at December 31 | $ | 55 | $ | 57 | $ | 31 | $ | 44 | $ | (107 | ) | $ | (108 | ) | ||||||||||
| Amounts recognized in the balance sheets as of December 31 | ||||||||||||||||||||||||
| Noncurrent assets | $ | — | $ | 1 | $ | — | $ | 2 | $ | — | $ | — | ||||||||||||
| Current liabilities | (3 | ) | (3 | ) | (17 | ) | (2 | ) | (10 | ) | (10 | ) | ||||||||||||
| Noncurrent liabilities | (109 | ) | (72 | ) | (125 | ) | (71 | ) | (125 | ) | (131 | ) | ||||||||||||
| Net amount recognized | $ | (112 | ) | $ | (74 | ) | $ | (142 | ) | $ | (71 | ) | $ | (135 | ) | $ | (141 | ) | ||||||
118
101
| Pension | Postretirement | ||||||||||||||||||||||
| 2013 | 2012 | 2013 | 2012 | ||||||||||||||||||||
| US | Foreign | US | Foreign | US | US | ||||||||||||||||||
| (Millions) | |||||||||||||||||||||||
| Change in benefit obligation: | |||||||||||||||||||||||
| Benefit obligation at December 31 of the previous year | $ | 461 | $ | 431 | $ | 414 | $ | 370 | $ | 131 | $ | 140 | |||||||||||
| Currency rate conversion | — | (2 | ) | — | 13 | — | — | ||||||||||||||||
| Settlement | — | (1 | ) | — | (4 | ) | — | — | |||||||||||||||
| Curtailment | — | (1 | ) | ||||||||||||||||||||
| Service cost | 1 | 9 | 1 | 7 | — | — | |||||||||||||||||
| Interest cost | 19 | 17 | 20 | 18 | 5 | 6 | |||||||||||||||||
| Administrative expenses/taxes paid | — | (2 | ) | — | (1 | ) | — | — | |||||||||||||||
| Plan amendments | — | 1 | — | — | — | — | |||||||||||||||||
| Actuarial (gain)/loss | (41 | ) | 6 | 44 | 42 | (16 | ) | (6 | ) | ||||||||||||||
| Benefits paid | (19 | ) | (18 | ) | (18 | ) | (16 | ) | (8 | ) | (9 | ) | |||||||||||
| Participants’ contributions | — | 2 | — | 2 | — | — | |||||||||||||||||
| Benefit obligation at December 31 | $ | 421 | $ | 442 | $ | 461 | $ | 431 | $ | 112 | $ | 131 | |||||||||||
| Change in plan assets: | |||||||||||||||||||||||
| Fair value at December 31 of the previous year | $ | 275 | $ | 332 | $ | 239 | $ | 290 | $ | — | $ | — | |||||||||||
| Currency rate conversion | — | (3 | ) | — | 11 | — | — | ||||||||||||||||
| Settlement | — | (1 | ) | — | (4 | ) | — | — | |||||||||||||||
| Actual return on plan assets | 60 | 43 | 28 | 27 | — | — | |||||||||||||||||
| Administrative expenses/taxes paid | — | (2 | ) | — | — | — | — | ||||||||||||||||
| Employer contributions | 31 | 26 | 26 | 22 | 8 | 10 | |||||||||||||||||
| Prescription drug subsidy received | — | — | — | — | — | (1 | ) | ||||||||||||||||
| Participants’ contributions | — | 2 | — | 2 | — | — | |||||||||||||||||
| Benefits paid | (19 | ) | (18 | ) | (18 | ) | (16 | ) | (8 | ) | (9 | ) | |||||||||||
| Fair value at December 31 | $ | 347 | $ | 379 | $ | 275 | $ | 332 | $ | — | $ | — | |||||||||||
| Development of net amount recognized: | |||||||||||||||||||||||
| Unfunded status at December 31 | $ | (74 | ) | $ | (62 | ) | $ | (186 | ) | $ | (99 | ) | $ | (112 | ) | $ | (131 | ) | |||||
| Unrecognized cost: | |||||||||||||||||||||||
| Actuarial loss | 190 | 137 | 278 | 168 | 32 | 52 | |||||||||||||||||
| Prior service cost/(credit) | 1 | 7 | 1 | 8 | (16 | ) | (22 | ) | |||||||||||||||
| Net amount recognized at December 31 | $ | 117 | $ | 82 | $ | 93 | $ | 77 | $ | (96 | ) | $ | (101 | ) | |||||||||
| Amounts recognized in the balance sheets as of December 31 | |||||||||||||||||||||||
| Noncurrent assets | — | 11 | — | — | — | — | |||||||||||||||||
| Current liabilities | (6 | ) | (2 | ) | (3 | ) | (2 | ) | (8 | ) | (8 | ) | |||||||||||
| Noncurrent liabilities | (68 | ) | (71 | ) | (183 | ) | (97 | ) | (104 | ) | (123 | ) | |||||||||||
| Net amount recognized | $ | (74 | ) | $ | (62 | ) | $ | (186 | ) | $ | (99 | ) | $ | (112 | ) | $ | (131 | ) | |||||
Assets of one plan may not be utilized to pay benefits of other plans. Additionally, the prepaid (accrued) pension cost has been recorded based upon certain actuarial estimates as described below. Those estimates are subject to revision in future periods given new facts or circumstances.
Net periodic pension costs (income) for the years 2010, 2009,2013, 2012 and 2008,2011, consist of the following components:
102
| 2010 | 2009 | 2008 | ||||||||||||||||||||||
| US | Foreign | US | Foreign | US | Foreign | |||||||||||||||||||
| (Millions) | ||||||||||||||||||||||||
| Service cost — benefits earned during the year | $ | 1 | $ | 5 | $ | 1 | $ | 4 | $ | 1 | $ | 5 | ||||||||||||
| Interest cost | 20 | 19 | 20 | 18 | 20 | 20 | ||||||||||||||||||
| Expected return on plan assets | (21 | ) | (19 | ) | (22 | ) | (19 | ) | (23 | ) | (21 | ) | ||||||||||||
| Curtailment loss | — | — | 1 | — | — | — | ||||||||||||||||||
| Settlement loss | 6 | — | 2 | — | — | 1 | ||||||||||||||||||
| Net amortization: | ||||||||||||||||||||||||
| Actuarial loss | 3 | 3 | 2 | 2 | 3 | 4 | ||||||||||||||||||
| Prior service cost | — | 2 | 1 | 2 | 1 | 1 | ||||||||||||||||||
| Net pension costs | $ | 9 | $ | 10 | $ | 5 | $ | 7 | $ | 2 | $ | 10 | ||||||||||||
| 2013 | 2012 | 2011 | |||||||||||||||||||||
| US | Foreign | US | Foreign | US | Foreign | ||||||||||||||||||
| (Millions) | |||||||||||||||||||||||
| Service cost — benefits earned during the year | $ | 1 | $ | 9 | $ | 1 | $ | 7 | $ | 1 | $ | 6 | |||||||||||
| Interest cost | 19 | 17 | 20 | 18 | 20 | 19 | |||||||||||||||||
| Expected return on plan assets | (22 | ) | (20 | ) | (22 | ) | (20 | ) | (23 | ) | (20 | ) | |||||||||||
| Curtailment loss | — | — | — | — | — | — | |||||||||||||||||
| Settlement loss | — | 1 | — | 1 | — | 1 | |||||||||||||||||
| Net amortization: | |||||||||||||||||||||||
| Actuarial loss | 9 | 10 | 7 | 7 | 4 | 5 | |||||||||||||||||
| Prior service cost | — | 1 | — | 2 | — | 2 | |||||||||||||||||
| Net pension costs | $ | 7 | $ | 18 | $ | 6 | $ | 15 | $ | 2 | $ | 13 | |||||||||||
Amounts recognized in accumulated other comprehensive loss for pension benefits consist of the following components:
| 2010 | 2009 | |||||||||||||||
| US | Foreign | US | Foreign | |||||||||||||
| (Millions) | ||||||||||||||||
| Net actuarial loss | $ | 165 | $ | 120 | $ | 171 | $ | 104 | ||||||||
| Prior service cost | 2 | 11 | 2 | 11 | ||||||||||||
| $ | 167 | $ | 131 | $ | 173 | $ | 115 | |||||||||
| 2013 | 2012 | ||||||||||||||
| US | Foreign | �� | US | Foreign | |||||||||||
| (Millions) | |||||||||||||||
| Net actuarial loss | $ | 190 | $ | 137 | $ | 278 | $ | 168 | |||||||
| Prior service cost | 1 | 7 | 1 | 8 | |||||||||||
| $ | 191 | $ | 144 | $ | 279 | $ | 176 | ||||||||
Amounts recognized for pension and postretirement benefits in other comprehensive income for the year ended December 31, 2013 and 2012 include the following components:
| Year Ended December 31, | |||||||||||||||||||||||
| 2013 | 2012 | ||||||||||||||||||||||
| Before-Tax Amount | Tax Benefit | Net-of-Tax Amount | Before-Tax Amount | Tax Benefit | Net-of-Tax Amount | ||||||||||||||||||
| (Millions) | |||||||||||||||||||||||
| Defined benefit pension and postretirement plans: | |||||||||||||||||||||||
| Change in total actuarial loss | $ | 113 | $ | (41 | ) | $ | 72 | $ | (66 | ) | $ | 22 | $ | (44 | ) | ||||||||
| Amortization of prior service cost included in net periodic pension and postretirement cost | (5 | ) | 2 | (3 | ) | (4 | ) | 2 | (2 | ) | |||||||||||||
| Amortization of actuarial loss included in net periodic pension and postretirement cost | 23 | (7 | ) | 16 | 20 | (6 | ) | 14 | |||||||||||||||
| Other comprehensive income — pension benefits | $ | 131 | $ | (46 | ) | $ | 85 | $ | (50 | ) | $ | 18 | $ | (32 | ) | ||||||||
In 2011,2014, we expect to recognize the following amounts, which are currently reflected in accumulated other comprehensive income,loss, as components of net periodic benefit cost:
| 2011 | ||||||||
| US | Foreign | |||||||
| (Millions) | ||||||||
| Net actuarial loss | $ | 4 | $ | 5 | ||||
| Prior service cost | — | 2 | ||||||
| $ | 4 | $ | 7 | |||||
119
| 2014 | |||||||
| US | Foreign | ||||||
| (Millions) | |||||||
| Net actuarial loss | $ | 7 | $ | 7 | |||
| Prior service cost | — | 1 | |||||
| $ | 7 | $ | 8 | ||||
The projected benefit obligation, accumulated benefit obligation and fair value of plan assets for all pension plans with accumulated benefit obligations in excess of plan assets at December 31, 20102013 and 20092012 were as follows:
103
| December 31, | December 31, | |||||||||||||||
| 2010 | 2009 | |||||||||||||||
| US | Foreign | US | Foreign | |||||||||||||
| (Millions) | ||||||||||||||||
| Projected Benefit Obligation | $ | 354 | $ | 332 | $ | 341 | $ | 302 | ||||||||
| Accumulated Benefit Obligation | 352 | 328 | 339 | 297 | ||||||||||||
| Fair Value of Plan Assets | 242 | 257 | 199 | 229 | ||||||||||||
| December 31, 2013 | December 31, 2012 | ||||||||||||||
| US | Foreign | US | Foreign | ||||||||||||
| (Millions) | |||||||||||||||
| Projected benefit obligation | $ | 421 | $ | 289 | $ | 461 | $ | 400 | |||||||
| Accumulated benefit obligation | 421 | 286 | 461 | 389 | |||||||||||
| Fair value of plan assets | 347 | 218 | 275 | 301 | |||||||||||
The following estimated benefit payments are payable from the pension plans to participants:
Year | US | Foreign | ||||||
| (Millions) | ||||||||
| 2011 | 18 | 17 | ||||||
| 2012 | 18 | 15 | ||||||
| 2013 | 18 | 16 | ||||||
| 2014 | 20 | 17 | ||||||
| 2015 | 21 | 17 | ||||||
| 2016-2019 | 123 | 100 | ||||||
| Year | US | Foreign | |||||
| (Millions) | |||||||
| 2014 | $ | 24 | $ | 17 | |||
| 2015 | 21 | 17 | |||||
| 2016 | 21 | 19 | |||||
| 2017 | 28 | 18 | |||||
| 2018 | 22 | 19 | |||||
| 2019-2022 | 131 | 140 | |||||
The following assumptions were used in the accounting for the pension plans for the years of 2010, 2009,2013, 2012, and 2008:2011:
| 2010 | 2009 | |||||||||||||||
| US | Foreign | US | Foreign | |||||||||||||
Weighted-average assumptions used to determine benefit obligations | ||||||||||||||||
| Discount rate | 5.6 | % | 5.4 | % | 6.1 | % | 6.0 | % | ||||||||
| Rate of compensation increase | N/A | 3.5 | % | N/A | 3.5 | % | ||||||||||
| 2010 | 2009 | 2008 | |||||||||||||||||||||||||||||||||
| US | Foreign | US | Foreign | US | Foreign | 2013 | 2012 | ||||||||||||||||||||||||||||
| US | Foreign | US | Foreign | ||||||||||||||||||||||||||||||||
Weighted-average assumptions used to determine net periodic benefit cost | |||||||||||||||||||||||||||||||||||
| Weighted-average assumptions used to determine benefit obligations | |||||||||||||||||||||||||||||||||||
| Discount rate | 6.1 | % | 6.0 | % | 6.2 | % | 6.3 | % | 6.2 | % | 5.6 | % | 4.8 | % | 4.3 | % | 4.1 | % | 4.2 | % | |||||||||||||||
| Expected long-term return on plan assets | 8.3 | % | 6.9 | % | 8.8 | % | 7.3 | % | 8.8 | % | 7.7 | % | |||||||||||||||||||||||
| Rate of compensation increase | N/A | 3.5 | % | N/A | 3.1 | % | N/A | 4.4 | % | N/A | 3.3 | % | N/A | 3.4 | % | ||||||||||||||||||||
| 2013 | 2012 | 2011 | |||||||||||||||
| US | Foreign | US | Foreign | US | Foreign | ||||||||||||
| Weighted-average assumptions used to determine net periodic benefit cost | |||||||||||||||||
| Discount rate | 4.1 | % | 4.2 | % | 4.8 | % | 4.9 | % | 5.6 | % | 5.4 | % | |||||
| Expected long-term return on plan assets | 7.8 | % | 6.2 | % | 8.3 | % | 6.3 | % | 8.3 | % | 6.4 | % | |||||
| Rate of compensation increase | N/A | 3.4 | % | N/A | 3.5 | % | N/A | 3.5 | % | ||||||||
We made contributions of $53$57 million to our pension plans during 2010.2013. Based on current actuarial estimates, we believe we will be required to make contributions of $44$47 million to those plans during 2011.2014. Pension contributions beyond 20112014 will be required, but those amounts will vary based upon many factors, including the performance of our pension fund investments during 2011.2014 and future discount rate changes.
120
We have life insurance plans which provided benefit to a majority of our U.S. employees. We also have postretirement plans for our U.S. employees hired before January 1, 2001. The plans cover salaried employees retiring on or after attaining age 55 who have at least 10 years of service with us after attaining age 45.us. For hourly employees, the postretirement benefit plans generally cover employees who retire according to one of our hourly employee retirement plans. All of these benefits may be subject to deductibles, co-payment provisions and other limitations, and we have reserved the right to change these benefits. For those employees hired after January 1, 2001, we do not provide any postretirement benefits. Our postretirement healthcare and life insurance plans are not funded. The measurement date used to determine postretirement benefit obligations is December 31.
Net periodic postretirement benefit cost for the years 2010, 2009,2013, 2012, and 2008,2011, consists of the following components:
104
| 2010 | 2009 | 2008 | ||||||||||
| (Millions) | ||||||||||||
| Service cost — benefits earned during the year | $ | 1 | $ | 1 | $ | 2 | ||||||
| Interest on accumulated postretirement benefit obligation | 8 | 8 | 8 | |||||||||
| Net amortization: | ||||||||||||
| Actuarial loss | 4 | 5 | 5 | |||||||||
| Prior service credit | (6 | ) | (6 | ) | (5 | ) | ||||||
| Net periodic postretirement benefit cost | $ | 7 | $ | 8 | $ | 10 | ||||||
| 2013 | 2012 | 2011 | |||||||||
| (Millions) | |||||||||||
| Service cost — benefits earned during the year | $ | — | $ | 1 | $ | 1 | |||||
| Interest on accumulated postretirement benefit obligation | 5 | 6 | 7 | ||||||||
| Net amortization: | |||||||||||
| Actuarial loss | 4 | 5 | 4 | ||||||||
| Prior service credit | (6 | ) | (6 | ) | (6 | ) | |||||
| Net periodic postretirement benefit cost | $ | 3 | $ | 6 | $ | 6 | |||||
In 2011,2014, we expect to recognize the following amounts, which are currently reflected in accumulated other comprehensive income,loss, as components of net periodic benefit cost:
| 2011 | ||||
| Net actuarial loss | $ | 4 | ||
| Prior service credit | (6 | ) | ||
| $ | (2 | ) | ||
| 2014 | |||
| (Millions) | |||
| Net actuarial loss | $ | 2 | |
| Prior service credit | (6 | ) | |
| $ | (4 | ) | |
The following estimated postretirement benefit payments are payable from the plan to participants:
| Postretirement | ||||
Year | Benefits | |||
| (Millions) | ||||
| 2011 | 10 | |||
| 2012 | 10 | |||
| 2013 | 10 | |||
| 2014 | 10 | |||
| 2015 | 10 | |||
| 2016-2019 | 49 | |||
121