| ¨ | TRANSITION REPORT PURSUANT TO SECTION 13 OR 15(d) OF THE SECURITIES EXCHANGE ACT OF 1934 | ||
For the transition period from to
Commission file number001-34480
VERISK ANALYTICS, INC.
(Exact name of registrant as specified in its charter)
| Delaware | 26-2994223 | |
| (State or other jurisdiction of incorporation or organization) | (I.R.S. Employer Identification No.) | |
| 545 Washington Boulevard Jersey City, NJ | 07310-1686 | |
| (Address of principal executive offices) | (Zip Code) | |
(201) 469-2000
(Registrant’s telephone number, including area code)
Securities registered pursuant to Section 12(b) of the Act:
| Title of each class | ||
Name of | ||
| which registered | ||
| Class A common stock $.001 par value | NASDAQ Global Select Market | |
Securities registered pursuant to Section 12(g) of the Act: None
Indicate by check mark if the registrant is a well-known seasoned issuer, as defined in Rule 405 of the Securities Act. Yes þ Yes ¨ Noo
Indicate by check mark if the registrant is not required to file reports pursuant to Section 13 or Section 15(d) of the Act. ¨Yes o No þ No
Indicate by check mark whether the registrant (1) has filed all reports required to be filed by Section 13 or 15(d) of the Securities Exchange Act of 1934 during the preceding 12 months (or for such shorter period that the registrant was required to file such reports), and (2) has been subject to such filing requirements for the past 90 days. Yes þ Yes ¨ Noo
Indicate by check mark whether the registrant has submitted electronically and posted on its corporate Web site, if any, every Interactive Data File required to be submitted and posted pursuant to Rule 405 ofRegulation S-T (§ 232.405 of this chapter) during the preceding 12 months (or for such shorter period that the registrant was required to submit and post such files). þYes o¨ Noo
Indicate by check mark if disclosure of delinquent filers pursuant to Item 405 ofRegulation S-K (§ 229.405 of this chapter) is not contained herein, and will not be contained, to the best of registrant’s knowledge, in definitive proxy or information statements incorporated by reference in Part III of thisForm 10-K or any amendment to thisForm 10-K. o¨
Indicate by check mark whether the registrant is a large accelerated filer, an accelerated filer, a non-accelerated filer, or a smaller reporting company. See the definitions of “large accelerated filer,” “accelerated filer” and “smaller reporting company” inRule 12b-2 of the Exchange Act. (Check One):
þLarge accelerated filer | oAccelerated filer | oNon-accelerated filer | oSmaller reporting company | |||||||||
| (Do not check if a smaller reporting company) | ||||||||||||
Indicate by check mark whether the registrant is a shell company (as defined inRule 12b-2 of the Act). ¨Yes o No þ
No
As of June 30, 2010,28, 2013, the last business day of the registrant’s most recently completed second fiscal quarter, the aggregate market value of the registrant’s common stock held by non-affiliates of the registrant was $4,604,935,568$8,981,907,417 based on the closing price reported on the NASDAQ Global Select Market on such date.
The number of shares outstanding of each of the registrant’s classes of common stock, as of February 25, 201121, 2014 was:
| Class | Shares Outstanding | |||
| Class A common stock $.001 par value | 166,835,574 | |||
DOCUMENTS INCORPORATED BY REFERENCE
Certain information required by Part III of this annual report onForm 10-K is incorporated by reference to our definitive Proxy Statement for our 20112013 Annual Meeting of Stockholders, which will be filed with the Securities and Exchange Commission not later than 120 days after December 31, 2010.
2013.
1
INDEX
| Page | ||||||||
| PART I | ||||||||
| Item 1. | ||||||||
| Item 1A. | ||||||||
| Item 1B. | ||||||||
| Item 2. | ||||||||
| Item 3. | ||||||||
| Item 4. | ||||||||
| PART II | ||||||||
| Item 5. | ||||||||
| Item 6. | ||||||||
| Item 7. | ||||||||
| Item 7A. | ||||||||
| Item 8. | ||||||||
| Item 9. | ||||||||
| Item 9A. | ||||||||
| Item 9B. | ||||||||
| PART III | ||||||||
| Item 10. | ||||||||
| Item 11. | ||||||||
| Item 12. | ||||||||
| Item 13. | ||||||||
| Item 14. | ||||||||
| Item 15. | ||||||||
| Exhibit 10.12 | ||||||||
| Exhibit 10.13 | ||||||||
| Exhibit 21.1 | ||||||||
| Exhibit 23.1 | ||||||||
| Exhibit 31.1 | ||||||||
| Exhibit 31.2 | ||||||||
| Exhibit 32.1 | ||||||||
2
2
Unless the context otherwise indicates or requires, as used in this annual report onForm 10-K, references to “we,” “us,” “our” or the “Company” refer to Verisk Analytics, Inc. and its subsidiaries.
In this annual report onForm 10-K, all dollar amounts are expressed in thousands, unless indicated otherwise.
SPECIAL NOTE REGARDING FORWARD-LOOKING STATEMENTS
Verisk Analytics, Inc., or Verisk, has made statements under the captions “Business,” “Risk Factors,” “Management’s Discussion and Analysis of Financial Condition and Results of Operations,” and in other sections of this annual report onForm 10-K that are forward-looking statements. In some cases, you can identify these statements by forward-looking words such as “may,” “might,” “will,” “should,” “expects,” “plans,” “anticipates,” “believes,” “estimates,” “predicts,” “potential,” or “continue,” the negative of these terms and other comparable terminology. These forward-looking statements, which are subject to risks, uncertainties and assumptions about us, may include projections of our future financial performance, our anticipated growth strategies and anticipated trends in our business. These statements are only predictions based on our current expectations and projections about future events. There are important factors that could cause our actual results, level of activity, performance or achievements to differ materially from the results, level of activity, performance or achievements expressed or implied by the forward-looking statements, including those factors discussed under the caption entitled “Risk Factors.” You should specifically consider the numerous risks outlined under “Risk Factors.”
Although we believe the expectations reflected in the forward-looking statements are reasonable, we cannot guarantee future results, level of activity, performance or achievements. Moreover, neither we nor any other person assumes responsibility for the accuracy and completeness of any of these forward-looking statements. We are under no duty to update any of these forward-looking statements after the date of this annual report onForm 10-K to conform our prior statements to actual results or revised expectations.
3
PART I
| Item 1. | Business |
Our Company
Verisk Analytics, Inc. enables risk-bearing businessesis a leading provider of information about risk to better understandprofessionals in insurance, healthcare, financial services, government, supply chain, and manage their risks. We provide valuerisk management. Using advanced technologies to our customers by supplyingcollect and analyze billions of records, we draw on industry expertise and unique proprietary data that, combined with our analytic methods, creates embedded decision support solutions. We aresets to provide predictive analytics and decision-support solutions in fraud prevention, actuarial science, insurance coverages, fire protection, catastrophe and weather risk, profitability optimization, data management, and many other fields. In the largest aggregator and provider of detailed actuarial and underwriting data pertaining to United States or U.S.,and around the world, we help customers protect people, property, and casualty, or P&C, insurance risks. We offer solutions for detecting fraud in the U.S. P&C insurance, healthcare and mortgage industries, and sophisticated methods to predict and quantify loss in diverse contexts ranging from natural catastrophes to health insurance.
financial assets.
Our customers use our solutions to make better decisions about risk decisionsand opportunities with greater efficiency and discipline. We refer to these products and services as ‘solutions’ due to the integration among our services and the flexibility that enables our customers to purchase components or the comprehensive package. These ‘solutions’ take various forms, including data, statistical models or tailored analytics, all designed to allow our clients to make more logical decisions. We believe our solutions for analyzing risk positively impact our customers’ revenues and help them better manage their costs. In 2010,2013, for the lines of P&C services we offer, our U.S. customers included all of the top 100 P&C insurance providers numerous health plans and third-party administrators, five ofin the six leading mortgage insurers, and 16U.S., 24 of the top 20 mortgage lenders.25 credit card issuers in North America and United Kingdom, as well as 9 of the top 10 health plan providers in the U.S. We believe that our commitment to our customers and the embedded nature of our solutions serve to strengthen and extend our relationships.
3
We help those businesses address what we believe are the four primary decision making processes essential for managing risk as set forth below in the Verisk Risk Analysis Framework:
The Verisk Risk Analysis Framework

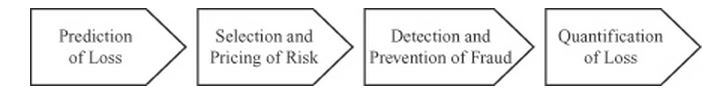
These four processes correspond to various functional areas inside our customers’ operations:
our loss predictions are typically used by P&C insurance and healthcare actuaries, advanced analytics groups and loss control groups to help drive their own assessments of future losses
our risk selection and pricing solutions are typically used by underwriters as they manage their books of business and by financial institutions as they manage the profitability of their credit and debit card portfolios our fraud detection and prevention tools are used by P&C insurance and healthcare underwriters to root out fraud prospectively and by claims departments to speed claims and find fraud retroactively; and our tools to quantify loss are primarily used by claims departments, independent adjustors and contractors. |
We add value by linking our solutions across these four key processes; for example, we use the same modeling methods to support the pricing of homeowner’s insurance policies and to quantify the actual losses when damage occurs to insured homes.
We offer our solutions and services primarily through annual subscriptions or long-term agreements, which are typically pre-paid and represented approximately 70.0%73.6% of our revenues in 2010.2013. For the year ended December 31, 2010,2013, we had revenues of $1,138.3$1,595.7 million and net income of $242.6$348.4 million. For the five year period ended December 31, 2010,2013, our revenues and net income grew at a Compound Annual Growth Rate,compound annual growth rate, or CAGR, of 11.7%15.1% and 14.9%28.8%, respectively.
As further described below, results of operations for the mortgage services business are reported as a discontinued operation for the year ended December 31, 2013 and for all prior periods presented. As necessary, the amounts have been retroactively adjusted in all periods presented to give recognition to the discontinued operations.
4
Our History
We trace our history to 1971, when Insurance Services Office, Inc., or ISO, started operations as anot-for-profit advisory and rating organization providing services for the U.S. P&C insurance industry. ISO was formed as an association of insurance companies to gather statistical data and other information from insurers and report to regulators, as required by law. ISO’s original functions also included developing programs to help insurers define and manage insurance products and providing information to help insurers determine their own independent premium rates. Insurers used and continue to use our offerings primarily in their product development, underwriting and rating functions. Today, those businesses form the core of our Risk Assessment segment.
Over the past decade, we have transformed our business beyond its original functions by deepening and broadening our data assets, developing a set of integrated risk management solutions and services and addressing new markets through our Decision Analytics segment.
Our expansion into analytics began when we acquired the American Insurance Services Group, or AISG, and certain operations and assets of the National Insurance Crime Bureau in 1997 and 1998, respectively. Those organizations brought to the company large databases of insurance claims, as well as expertise in detecting and preventing claims fraud. To further expand our Decision Analytics segment, we acquired AIR Worldwide, or AIR, in 2002, the technological leader in catastrophe modeling. In 2004, we entered the healthcare space by acquiring several businesses that now offer web-based analytical and reporting systems for health insurers, provider organizations and self-insured employers. In 2005, we entered the mortgage sector, acquiring the first of several businesses that now provide automated fraud detection,
4
compliance and decision support solutions for the U.S. mortgage industry. In 2006, to bolster our position in the insurance claims field we acquired Xactware, a leading supplier of estimating software for professionals involved in building repair and reconstruction. In 2010, we acquired 3E Company, creating a scale presence in supply chain and environmental health and safety.
In 2011 and 2012, we further bolstered our healthcare solutions by acquiring Health Risk Partners, LLC, or HRP, which provides solutions to optimize revenue, improve compliance and improve quality of care for Medicare Advantage health plans and MediConnect Global, Inc. or MediConnect, which provides medical record retrieval, digitization, coding, extraction, and analysis to the healthcare and property casualty industry. Also in 2012, we acquired Argus Information & Advisory Services, LLC, or Argus, to expand our presence in providing information, competitive benchmarking, analytics, and customized services to financial institutions in the payments space globally.
These acquisitions have added scale, geographic reach, highly skilled workforces, and a wide array of new capabilities to our Decision Analytics segment. They have helped to make us a leading provider of information and decision analytics for customers involved in the business of risk in the U.S. and selectively around the world.
In January 2014, we entered into an agreement to acquire 100% of the stock of Eagleview Technology Corporation, or EVT, the parent company of Pictometry International Corp., and Eagle View Technologies, Inc. for a net cash purchase price of $650 million, which will be funded by the Company's operating cash and borrowings from our credit facility. EVT is a provider of geo-referenced aerial image capture and visual-centric data analytics and solutions to insurers, contractors, government, and commercial customers in the United States. This acquisition is expected to advance our position in the imagery analytics market, adding new municipal and commercial customers. The transaction is expected to support the aerial imagery solution development in our Decision Analytics segment. The parties expect the transaction to close by July 2014, subject to the completion of customary closing conditions, including receipt of regulatory and shareholder approvals. Once the acquisition is completed, we plan to include EVT in the insurance vertical of our Decision Analytics segment.
In February 2014, we entered into an agreement to sell our mortgage services business, Interthinx, Inc., or Interthinx. The transaction is subject to regulatory approval and other customary closing conditions and is expected to close by March 31, 2014. Results of operations for the mortgage services business are reported as a discontinued operation for the year ended December 31, 2013 and for all prior periods presented. As necessary, the amounts have been retroactively adjusted in all periods presented to give recognition to the discontinued operations.
Our senior management operating team, which includes our president and chief executive officer, chief financial officer, chief operating officer, general counsel, and threefive senior officers who lead our business and operational units, have been with us for an average of almost twentyover 18 years. This team has led our transformation to a successful for-profit entity, focused on growth with our U.S. P&C insurer customers and expansion into a variety of new markets.
vertical markets, including healthcare, financial services, and supply chain.
On May 23, 2008, in contemplation of our initial public offering, or IPO, ISO formed Verisk Analytics, Inc., or Verisk, a Delaware corporation, to be the holding company for our business. Verisk was initially formed as a wholly-owned subsidiary of ISO. On October 6, 2009, in connection with our IPO, the companyCompany effected a reorganization whereby ISO became a wholly-owned subsidiary of Verisk. Verisk Class A common stock began trading on the NASDAQ Global Select Market on October 7, 2009 under the symbol “VRSK.”
5
Segments
We organize our business in two segments: Risk Assessment and Decision Analytics. See “Management’s Discussion and Analysis of Financial Condition and Results of Operations” in Part II of this annual report for additional information regarding our segments.
Risk Assessment Segment
Our Risk Assessment segment serves our P&C insurance customers and focuses on the first two decision making processes in our Risk Analysis Framework: prediction of loss prediction and selection and pricing of risk. Within this segment, we also provide solutions to help our insurance customers comply with their reporting requirements in each U.S. state in which they operate. Our customers include most of the P&C insurance providers in the U.S.
Industry-Standard Insurance Programs
We are the recognized leader in the U.S. for industry-standard insurance programs that help P&C insurers define coverages and issue policies. Our policy language, prospective loss cost information and policy writing rules can serve as integrated turnkey insurance programs for our customers. Insurance companies need to ensure that their policy language, rules, and rates comply with all applicable legal and regulatory requirements. Insurers must also make sure their policies remain competitive by promptly changing coverages in response to changes in statutes or case law. To meet their needs, we process and interface with state regulators on average over 4,000in all 50 states plus the District of Columbia, Guam, Puerto Rico and the Virgin Islands in excess of 3,000 filings each year ensuring smooth implementation of our rules and forms. When insurers choose to develop their own alternative programs, our industry-standard insurance programs also help regulators make sure that such insurers’ policies meet basic coverage requirements.
Standardized coverage language, which has been tested in litigation and tailored to reflect judicial interpretation, helps to ensure consistent treatment of claimants. As a result, our industry-standard language also simplifies claim settlements and can reduce the occurrence of costly litigation, because our language causes the meaning of coverage terminology to become established and known. Our policy language includes standard coverage language, endorsements and policy writing support language that assist our customers in understanding the risks they assume and the coverages they are offering. With these policy programs, insurers also benefit from economies of scale. We have over 200 specialized lawyers and insurance experts reviewing changes in each state’s insurance rules and regulations, including on average over 11,20014,000 legislative bills,
5
To cover the wide variety of risks in the marketplace, we offer a broad range of policy programs. For example, in the homeowner’s line of insurance, we maintain policy language and rules for six6 basic coverages, 178250 national endorsements, and 495548 state-specific endorsements. Overall, we provide policy language, prospective loss costs, policy writing rules, and a variety of other solutions for 2526 lines of insurance.
The P&C insurance industry is heavily regulated in the U.S. P&C insurers are required to collect statistical data about their premiums and losses and to report that data to regulators in every state in which they operate. Our statistical agent services have enabled P&C insurers to meet these regulatory requirements for over 40 years. We aggregate the data and, as a licensed or appointed “statistical agent” in all 50 states, Puerto Rico, and the District of Columbia, we report these statistics to insurance regulators. We are able to capture significant economies of scale given the level of penetration of this service within the U.S. P&C insurance industry.
To provide our customers and the regulators the information they require, we maintain one of the largest private databases in the world. Over the past four decades, we have developed core expertise in acquiring, processing, managing, and operating large and comprehensive databases that are the foundation of our Risk Assessment segment. We use our proprietary technology to assemble, organize and update vast amounts of detailed information submitted by our customers. We supplement this data with publicly available information.
Each year, P&C insurers send us approximately 2.9 billion detailed individual records of insurance transactions, such as insurance premiums collected or losses incurred. We maintain a database of over 17.3 billion statistical records, including approximately 7.0 billion commercial lines records and approximately 10.3 billion personal lines records. We collect unit-transaction detail of each premium and loss record, which enhances the validity, reliability and accuracy of our data sets and our actuarial analyses. Our proprietary quality process includes almost 2,500 separate checks to ensure that data meet our high standards of quality.
We provide actuarial services to help our customers analyze and price their risks. Using our large database of premium and loss data, our actuaries are able to perform sophisticated analyses using our predictive models and analytic methods to help our P&C insurance customers with pricing, loss reserving, and marketing. We distribute a number of actuarial solutions and offer
6
flexible services to meet our customers’ needs. In addition, our actuarial consultants provide customized services for our clients that include assisting them with the development of independent insurance programs, analysis of their own underwriting experience, development of classification systems and rating plans, and a wide variety of other business decisions. We also supply information to a wide variety of customers in other markets including reinsurance and government agencies.
We project future losses and loss expenses utilizing a broad set of data. These projections tend to be more reliable than if our customers used solely their own data. We make a number of actuarial adjustments before the data is used to estimate future costs. Our customers can use our estimates of future costs in making independent decisions about the prices charged for their policies. For most P&C insurers, in most lines of business, we believe our estimates of future costs are an essential input to rating decisions. Our actuarial products and services are also used to create the analytics underlying our industry-standard insurance programs described above.
Property-Specific Rating and Underwriting Information
We gather information on individual properties and communities so that insurers can use our information to evaluate and price personal and commercial property insurance, as well as commercial liability insurance. Our property-specific rating and underwriting information allow our customers to understand, quantify, underwrite, mitigate, and avoid potential loss for residential and commercial properties. Our database contains loss costs and other vital information on approximately 3.0more than 3.5 million commercial buildings in the United States and also holds information on approximately 5.8more than 6.2 million individual businesses occupying those buildings. We have a staff of approximatelymore than 600 field representatives strategically located around the United States who observe and report on conditions at commercial and residential properties, evaluate community fire-protection capabilities and assess the effectiveness of municipal building-code enforcement. Each year, our field staff visits more than over 350,000325,000 commercial properties to collect information on new buildings and verify building attributes.
We also provide proprietary analytic measures of the ability of individual communities to mitigate losses from important perils. Nearly every property insurer in the U.S. uses our evaluations of community firefighting capabilities to help determine premiums for fire insurance throughout the country. We provide field-verified and validated data on the fire protection services for more than 46,00047,000 fire response jurisdictions. We also offer services to evaluate the effectiveness of community enforcement of building codes and the efforts of communities to mitigate damage from flooding. Further, we provide information on the insurance rating territories, premium taxes, crime risk, and hazards of windstorm, earthquake, wildfire, and other perils. To supplement our data on specific commercial properties and individual communities, we have assembled, from a variety of internal and third-party sources, information on hazards related to geographic locations representing every postal address in the U.S. Insurers use this information not only for policy quoting but also for analyzing risk concentration in geographical areas.
6
Decision Analytics Segment
In the Decision Analytics segment, we support all four phases of our Risk Analysis Framework. We develop predictive models to forecast scenarios and produce both standard and customized analytics that help our customers better predict loss, select and price risk, detect fraud before and after a loss event, and quantify losses. The businesses are categorized by the primary end market for their services.

7
As we develop our models to quantify loss and detect fraud, we improve our ability to predict the loss and prevent the fraud from happening. We believe this provides us with a significant competitive advantage over firms that do not offer solutions which operate both before and after loss events.
We are a leading provider of fraud-detection tools for the P&C insurance industry. Our fraud solutions improve our customers’ profitability by both predicting the likelihood that fraud is occurring and detecting suspicious activity after it has occurred. When a claim is submitted, our system searches our database and returns information about other claims filed by the same individuals or businesses (either as
7
claimants or insurers) that helpwhich helps our customers determine if fraud has occurred. The system searches for matches in identifying information fields, such as name, address, Social Security number, vehicle identification number, driver’s license number, tax identification number, or other parties to the loss. Our system also includes advanced name and address searching to perform intelligent searches and improve the overall quality of the matches. Information from match reports speeds payment of meritorious claims while providing a defense against fraud and can lead to denial of a claim, negotiation of a reduced award or further investigation by the insurer or law enforcement.
We have a comprehensive system used by claims adjusters and investigations professionals to process claims and fight fraud. Claims databases are one of the key tools in the fight against insurance fraud. The benefits of a single all-claims database include improved efficiency in reporting data and searching for information, enhanced capabilities for detecting suspicious claims and superior information for investigating fraudulent claims, suspicious individuals and possible fraud rings. Our database contains information on more than 700approximately 921 million claims and is the world’s largest database of P&C claims information.information used for claims and investigations. Insurers and other participants submit new claim reports,claims , more than 239,000210,000 a day on average, across all categories of the U.S. P&C insurance industry.
We also provide a service allowing insurers to report thefts of automobiles and property, improving the chances of recovering those items; a service that helps owners and insurers recover stolen heavy construction and agricultural equipment; an expert scoring system that helps distinguish between suspicious and meritorious claims; and products that use link-analysis technology to help visualize and fight insurance fraud.
We pioneered the field of probabilistic catastrophe modeling used by insurers, reinsurers and financial institutions to manage their catastrophe risk. Our models of global natural hazards, which form the basis of our solutions, enable companies to identify, quantify and plan for the financial consequences of catastrophic events. We have developed models, covering natural hazards, including hurricanes, earthquakes, winter storms, tornadoes, hailstorms, and flood, for potential loss events in more than 90 countries. We have also developed and introduced a probabilistic terrorism model capable of quantifying the risk in the U.S. from this emerging threat, which supports pricing and underwriting decisions down to the level of an individual policy.
We are a leading provideralso provide data, analytic and networking products for professionals involved in estimating all phases of automated fraud detection, compliancebuilding repair and decision-support tools for the mortgage industry. Utilizing our own loan level application database combined with actual mortgage loan performance data, we have established a risk scoring system which increases our customers’ ability to detect fraud.reconstruction. We provide solutions for every phase of a building’s life, including:
quantifying the ultimate cost of repair or reconstruction of damaged or destroyed buildings;
aiding in the settlement of insurance claims; and
tracking the process of repair or reconstruction and facilitating communication among insurers, adjusters, contractors and policyholders.
To help our customers estimate repair costs, we provide a solution that detect fraud through each stepassists contractors and insurance adjusters to estimate repairs using a patented plan-sketching program. The program allows our customers to sketch floor plans, roof plans and wall-framing plans and automatically calculates material and labor quantities for the construction of walls, floors, footings and roofs.
We also offer our customers access to wholesale and retail price lists, which include structural repair and restoration pricing for 467 separate economic areas in North America. We revise this information monthly and, in the mortgage lifecycleaftermath of a major disaster, we can update the price lists as often as weekly to reflect rapid price changes. Our structural repair and provide regulatory compliance solutions that perform instant compliance reviews of each mortgage application. Our fraud solutions can improve our customers’ profitability by predicting the likelihood that a customer account is experiencing fraud. Our solution analyzes customer transactions in real time and generates recommendations for immediate action which are critical to stopping fraud and abuse. These applications can also detect some organized fraud schemes that are too complex and well-hidden to be identified by other methods.
8
Our estimates allow our customers to set loss reserves, deploy field adjusters and verify internal company estimates. Our estimates also keep insurers, their customers, regulators, and other interested parties informed about the likelihoodtotal costs of both foreclosure and early payment default on loans. We believe our solution is based upon a more comprehensive set of loan level information than any other provider in the mortgage industry.
disasters. We also provide forensic auditour customers access to daily reports on severe weather and catastrophes and we maintain a database of information on catastrophe losses in the U.S. since 1950.
Financial Services
We focus on providing competitive benchmarking, scoring solutions, analytics, and customized services to financial services institutions in North and South America and Europe. We maintain the most comprehensive de-personalized direct observation consortia data sets for the mortgage originationpayments industry. We leverage this consortia data and mortgageprovide proprietary solutions and information that enable clients to achieve higher profitability and growth through enhanced marketing and risk management decisions. We have deployed unique technology to manage vast data sets efficiently and manage vast amount of payments data. We offer services and a suite of solutions to a client base that includes credit and debit card issuers, retail banks and other consumer financial services providers, payment processors, insurance industries. companies, and other industry stakeholders.
Our predictive screening tools predict which defaulted loansprofessionals have substantial industry knowledge in providing solutions to the financial services sector. We are known for our unique ability to blend the most likely candidateshighly technical, data-centered aspects of our projects with expert communication and business knowledge. Our solutions enhance our clients’ ability to manage their businesses profitably and position them better to handle present day challenges (competitive, regulatory, and economic). Specifically, we use comprehensive transaction, risk, behavioral, and bureau-sourced account data to assist clients in making better business decisions through analysis and analytical solutions. We maintain a comprehensive and granular direct observation database for full audits for the purpose of detecting fraud. We then generate detailed audit reports on defaulted mortgage loans. Those reports serve as a key component of the loss mitigation strategies of mortgage loan insurers. The recent turmoilcredit card, debit card, and deposit transactions in the mortgage industry has created an opportunity for growth in demand for our services, as we believe most mortgage insurers do not have the in-house capacity to respond to and properly review all of their defaulted loans for evidence of fraud.
8
Healthcare
We offerpayment accuracy solutions that help healthcare claims payors detect fraud, abuse and overpayment. Our approach combines computer-based modeling and profiling of claims with analysis performed by clinical experts. We run our customers’ claims through our proprietary analytic system to identify potential fraud, abuse and overpayment, and then a registered nurse, physician or other clinical specialist skilled in coding and reimbursement decisions reviews all suspect claims and billing patterns. This combination of system and human review is unique in the industry and we believe offers improved accuracy for paying claims.
We analyze the patterns of claims produced by individual physicians, physicians’ practices, hospitals, dentists, and pharmacies to locate the sources of fraud. After a suspicious source of claims is identified, our real-time analytic solutions investigate each claim individually for particular violations, including upcoding, multiple billings, services claimed but not rendered, and billing by unlicensed providers. By finding the individual claims with the most cost-recovery potential and also minimizing the number of false-positive indications of fraud, we enable the special investigation units of healthcare payors to efficiently control their claims costs while maintaining high levels of customer service to their insurers.
insureds. We also offer web-based reporting tools that let payors take definitive action to prevent overpayments or payment of fraudulent claims. The tools provide the documentation that helps to identify, investigate and prevent abusive and fraudulent activity by providers.
For example, our solutions allow our customers to predict medical costs and improve the financing and organization of health services. Our predictive models help our customers identify high-cost cases for care- andcare-and disease-management intervention, compare providers adjusting for differences in health, predict resource use for individuals and populations, establish health-based and performance-based payments, negotiate payments and incentives, negotiate premium rates, and measure return on investment.
We also provide our customers healthcare consulting services using complex clinical analyses to uncover reasons behind cost and utilization increases. Physicians and hospitals are adopting and acquiring new technologies, drugs and devices more rapidly than ever before. We provide financial and actuarial consulting,analyses, clinical, consulting, technical and implementation services and training services to help our customers manage costs and risks to their practices.
We are a provider of solutions for revenue & quality intelligence and compliance for certain aspects of the healthcare industry. We have systems, including our revenue integrity business, which analyze Medicare data for compliance with CMS (Centers for Medicare & Medicaid Services) guidelines, assist payers in payment integrity, data collection, and encounter data submission. By using our ReconEdge™, a web-based risk adjustment reconciliation system, healthcare payers can assess their organizations’ opportunities and compliance in payments. In addition, we offer proprietary systems and services that facilitate the aggregation, retrieval, coding, and analysis of medical records. We have a repository of medical records that are digitized, indexed, and securely hosted online. We use custom-built, proprietary technology to deliver medical records from facilities and provider locations. Our clients can access the clinical data through a cloud-based workflow management system. We are also a provider of HEDIS® (Healthcare Effectiveness Data and Information Set) software solutions. Our solution suite allows managed care
organizations to calculate and submit HEDIS results to NCQA (National Committee for Quality Assurance), improve quality in covered populations, and reduce administrative overhead associated with quality reporting.
Specialized Markets
We provide data, analytichelp businesses and networking productsgovernments better anticipate and manage climate-and weather-related risks. We prepare certain agencies and companies to anticipate, manage, react to and profit from weather and climate related risk. We serve our clients by providing state-of-the-art research, development and analysis delivered in reports, databases and software solutions. We are dedicated to the advancement of scientific understanding of the atmospheric, climate and weather, ocean, and planetary sciences. Through research conducted by our in-house scientific staff, and often in collaboration with world-renowned scientists at academic and other research institutions, we have developed analytical tools to help measure and observe the properties of the environment and to translate these measurements into useful information to take action. In 2013, we formed the Verisk Climate division in response to customers' needs for professionals involved in estimating all phases of building repairnew solutions to manage enterprise climate and reconstruction. We provide solutions for every phase of a building’s life, including:
environmental risks.
We also offer our customers accessa comprehensive suite of data and information services that enables improved compliance with global Environmental Health & Safety, or EH&S requirements related to wholesalethe safe manufacturing, distribution, transportation, usage and retail price lists, which include structural repairdisposal of chemicals and restoration pricing for 467 separate economic areas in North America. We revise thisproducts. From the supply chain or solutions lifecycle, we deliver a program specific to the EH&S compliance information monthly and in the aftermath of a major disaster, we can update the price lists as often as weekly to reflect rapid price changes. Our structural repair and cleaning database contains more than 13,000 unit-cost line items. For each line item such as smoke cleaning, water extraction and hazardous cleanup, we provide time and material pricing, including labor, labor productivity rates (for new construction and restoration), labor burden and overhead, material costs, and equipment costs. We improve our pricing data by analyzing the actual claims experiencemanagement needs of our customers to verify our estimates.customers. We estimatehave a full solutions lifecycle and cross-supply chain approach that more than 75.0% of all homeowners’ claims settledprovide a single, integrated solution for managing EH&S capabilities, resulting in the U.S. annually use our solution. Such a large percentage of the industry’s claims leads to accurate pricing information, which we believe is unmatched in the industry.reduced cost, risk and liability while improving process.
Our Growth Strategy
Over the past five years, we have grown our revenues at a CAGR of 11.7%15.1% through the successful execution of our business plan. These results reflect strong organic revenue growth, new product development and selected acquisitions. We have made, and continue to make, investments in people, data sets, analytic solutions, technology, and complementary businesses. The key components of our strategy include:
Increase Sales to InsuranceSolution Penetration with Customers. We expect to expand the application of our solutions in insurance customers’ internal risk and underwriting processes. Building on our deep knowledge of, and embedded position in, the insurance industry, we expect to sell more solutions to existing customers tailored to individual insurance segments. By increasing the breadth and relevance of our offerings, we believe we can strengthen our relationships with customers and increase our value to their decision making in critical ways. We also have opportunities to expand solution penetration in our health and financial services customers.
Develop New, Proprietary Data Sets and Predictive Analytics. We work with our customers to understand their evolving needs. We plan to create new solutions by enriching our mix of proprietary data sets, analytic solutions and effective decision support across the markets we serve. We constantly seek to add new data sets that can further leverage our analytic methods, technology platforms and intellectual capital.
10
Leverage Our Intellectual Capital to Expand into Adjacent Markets and New Customer Sectors. Our organization is built on nearlyover four decades of intellectual property in risk management. We believe we can continue to profitably expand the use of our intellectual capital and apply our analytic methods in new markets, where significant opportunities for long-term growth exist. We also continue to pursue growth through targeted international expansion. We have already demonstrated the effectiveness of this strategy with our expansion into healthcare and non-insurance financial services. We also continue to pursue growth through targeted international expansion.
Pursue Strategic Acquisitions that Complement Our Leadership Positions. We will continue to expand our data and analytics capabilities across industries. While we expect this will occur primarily through organic growth, we have and will continue to acquire assets and businesses that strengthen our value proposition to customers. We have developed an internal capability to source, evaluate and integrate acquisitions that have created value for shareholders.
10
Our Customers
Risk Assessment Customers
The customers in our Risk Assessment segment for the lines of P&C services we offer include the top 100 P&C insurance providers in the United States.States, as well as insurers in international markets. Our statistical agent services are used by a substantial majority of P&C insurance providers in the U.S. to report to regulators. Our actuarial services and industry-standard insurance programs are used by the majority of insurers and reinsurers in the U.S. In addition, certain agencies of the federal government, as well as county and state governmental agencies and organizations, use our solutions to help satisfy government needs for risk assessment and emergency response information. In 2010 our largest Risk Assessment customer accounted for 4.8% of segment revenues and our top ten customers accounted for 26.9% of segment revenues. See Item 13. “Certain Relationships and Related Transactions, and Director Independence — Customer Relationships” for more information on our relationship with our principal stockholders.
Decision Analytics Customers
In the Decision Analytics segment, we provide our P&C insurance solutions to the majority of the P&C insurers in the U.S. Specifically, our claims database serves thousands of customers, representing nearly 93.0%over 90% of the P&C insurance industry by premium volume, 2627 state workers’ compensation insurance funds, 607531 self-insurers, 455425 third-party administrators, several state fraud bureaus, and many law-enforcement agencies involved in investigation and prosecution of insurance fraud. Also, P&C insurance companies using our building and repair solutions represent over 75.0% of the property market in the U.S. We estimate that more than 80.0%about 80% of insurance repair contractors and service providers in the U.S. and Canada with computerized estimating systems use our building and repair pricing data.
In the U.S. healthcare industry, our customers include numerous health plans and third party administrators. In the U.S. mortgage industry, we have more than 900 customers. We provide our solutions to 169 of the top 20 mortgage lenders and five10 health plan providers. Our customers included 24 of the top six mortgage insurers. We have been providing services to mortgage insurers for over 20 years. In 2010, our largest customer25 credit card issuers in the Decision Analytics segment accounted for 9.0% of segment revenuesNorth America and our top ten Decision Analytics customers accounted for 29.6% of segment revenues.United Kingdom.
Our Competitors
We believe no single competitor currently offers the same scope of services and market coverage we provide. The breadth of markets we serve exposes us to a broad range of competitors as described below. Businesses that we acquire may introduce us to additional competitors.
Risk Assessment Competitors
Our Risk Assessment segment operates primarily in the U.S. P&C insurance industry, where we enjoy a leading market presence. We have a number of competitors in specific lines or services.
11
We encounter competition from a number of sources, including insurers who develop internal technology and actuarial methods for proprietary insurance programs. Competitors also include other statistical agents, including the National Independent Statistical Service, the Independent Statistical Service and other advisory organizations, providing underwriting rules, prospective loss costs and coverage language such as the American Association of Insurance Services and Mutual Services Organization, although we believe none of our competitors has the breadth or depth of data we have.
Competitors for our property-specific rating and underwriting information are primarily limited to a number of regional providers of commercial property inspections and surveys, including Overland Solutions, Inc. and Regional Reporting, Inc. We also compete with a variety of organizations that offer consulting services, primarily specialty technology and consulting firms. In addition, a customer may use its own internal resources rather than engage an outside firm for these services. Our competitors also include information technology product and services vendors, including CDS, Inc., management and strategy consulting firms including Deloitte Consulting LLP, and smaller specialized information technology firms and analytical services firms including Pinnacle Consulting and EMB.EMB, a unit of Towers Watson.
Decision Analytics Competitors
In the P&C insurance claims market and catastrophe modeling market, certain products are offered by a number of companies, including Risk Management Solutions (catastrophe modeling), LexisNexis/ChoicePoint and CoreLogic, LexisNexis Risk Solutions (loss histories and motor vehicle records for personal lines underwriting), Decision Insight or MSB (property value and claims estimator), and Explore Information ServicesSolera (personal automobile underwriting). We believe that our P&C insurance industry expertise, combined with our ability to offer multiple applications, services and integrated solutions to individual customers, enhances our competitiveness against these competitors with more limited offerings. In the healthcare market, certain products are offered by a number of companies, including Computer Sciences Corporation (evaluation of bodily injury and workers’ compensation claims), Fair Isaac Corporation (workers’ compensation and healthcare claims cost containment) and Ingenix,OptumInsight, McKesson, Truven Health Analytics, Inovalon, and MedstatiHealth (healthcare predictive modeling and business intelligence). Competitive factors include application features and functions, ease of delivery and integration, ability of the provider to maintain, enhance and support the applications or services and price. In the mortgage analytics solutions market, our competitors include CoreLogic and DataVerify Corporation (mortgage lending fraud identification). We believe that none
11
Development of New Solutions
We take a market-focused team approach to developing our solutions. Our operating units are responsible for developing, reviewing and enhancing our various products and services. Our data management and production team designs and manages our processes and systems for market data procurement, proprietary data production and quality control. Our Joint Development Environment, or JDE, and Enterprise Data Management, or EDM, team supportsteams support our efforts to create new information and products from available data and explores new methods of collecting data. EDM is focused on understanding and documentingbusiness-unit and corporate data assets and data issues; sharing and combining data assets across the enterprise; creating an enterprise data strategy; facilitating research and product development; and promoting cross-enterprise communication. Our ISOVerisk Innovative Analytics, or IIA,VIA, team is a corporate center of excellence inside the corporation for developing analytical methods in applying modeling techniques to predict risk outcomes.
Our software development team buildsteams build the technology used in many of our solutions. As part of our product-development process, we continually solicit feedback from our customers on the value of our products and services and the market’s needs. We have established an extensive system of customer advisory panels, which meet regularly throughout the year to help us respond effectively to the needs of our markets. In addition, we use frequent sales calls, executive visits, user group meetings, and other industry forums to gather information to match the needs of the market with our product development efforts. We also use a variety of market research techniques to enhance our understanding of our clients and the markets in which they operate.
12
We also add to our offerings through an active acquisition program. Since 2006,2009, we have acquired 15twelve businesses, which have allowed us to enter new markets, offer new productssolutions and enhance the value of existing productsservices with additional proprietary sources of data.
When we find it advantageous, we augment our proprietary data sources and systems by forming alliances with other leading information providers and technology companies and integrating their product offerings into our offerings. This approach gives our customers the opportunity to obtain the information they need from a single source and more easily integrate the information into their workflows.
Sales, Marketing and Customer Support
We sell our products and services primarily through direct interaction with our clients. We employ a three-tier sales structure that includes salespeople, product specialists and sales support. As of December 31, 2010,2013, we had a sales force of 268285 people. Within the company, several areas have sales teams that specialize in specific products and services. These specialized sales teams sell specific, highly technical product sets to targeted markets.
markets in coordination with account management.
To provide account management to our largest customers, we segment the insurance carrier market into three groups. Tier One or “National” Accounts constitutes our largest customers, Tier Two or “Strategic” Accounts represents both larger carrier groups and middle-market carriers. Tier Three are the small insurance companies that may represent one line of businessand/or be one-state or regional writers for a few states.writers. A Sales Generalist is assigned to every insurer account and is responsible for our overall relationship with these insurance companies. Our senior executives are also involved with the senior management of our customers.
Sources of our Data
The data we use to perform our analytics and power our solutions are sourced through sixseven different kinds of data arrangements. First, we gather data from our customers within agreements that also permit our customers to use the solutions created upon their data. These agreements remain in effect unless the data contributor chooses to opt out and represent our primary method of data gathering. It is very rare that contributors elect not to continue providing us data. Second, we have agreements with data contributors in which we specify the particular uses of their data and provide to the data contributors their required levels of privacy, protection of data and where necessary de-identification of data. These agreements represent no cost to us and generally feature a specified period of time for the data contributions and require renewal. Third, we “mine” data found inside the transactions supported by our solutions; as an example, we utilize the claims settlement data generated inside our repair cost estimating solution to improve the cost factors used in our models. Again, these arrangements represent no cost to us and we obtain the consent of our customers to make use of their data in this way. Fourth, we source data generally at no cost from public sources including federal,
12
state and local governments. Fifth, we gather data about the physical characteristics of commercial properties through the direct observation of our field staff that also perform property surveys at the request of, and facilitated by, property insurers. Lastly,Sixth, we purchase data from data aggregators under contracts that reflect prevailing market pricing for the data elements purchased, including county tax assessor records, descriptions of hazards such as flood plains and professional licenses. Lastly, we retrieve medical records from facilities and provider locations at prevailing market prices under agreements between our insurer customers and their provider networks. In all our modes of data collection, we are the owners of whatever derivative solutions we create using the data. Our costs offor data received from our customers were 1.7%1.3% and 1.9%1.4% of revenues for the years ended December 31, 20102013 and 2009,2012, respectively.
13
Information Technology
Technology
Our information technology systems are fundamental to our success. They are used for the storage, processing, access and delivery of the data which forms the foundation of our business and the development and delivery of our solutions provided to our clients. Much of the technology we use and provide to our customers is developed, maintained and supported by approximately 1,0501,289 employees. We generally own or have secured ongoing rights to use for the purposes of our business all the customer-facing applications which are material to our operations. We support and implement a mix of technologies, focused on implementing the most efficient technology for any given business requirement or task.
Data Centers
We have two primary data centers in Jersey City, New Jersey and Orem, Utah.Utah creating redundancy and back-up capabilities. In addition, we have data centers dedicated to certain business units, including AIR and Verisk Health in Boston and AISG Claimsearch in Israel. In addition to these key data centers, we also have a number of smaller data centers located in other states.
Disaster Recovery
We are committed to a framework for business continuity management and carry out annual reviews of the state of preparedness of each business unit. All of our critical databases, systems and contracted client services are also regularly recovered. We also have documented disaster recovery plans in place for each of our major data centers and each of our solutions. Our primary data center recovery site is in New York State, approximately 50 miles northwest of Jersey City, New Jersey.
Security
We have adopted a wide range of measures to ensure the security of our IT infrastructure and data. Security measures generally cover the following key areas: physical security; logical security of the perimeter; network security such as firewalls; logical access to the operating systems; deployment of virus detection software; and appropriate policies and procedures relating to removable media such as laptops. All laptops are encrypted and media leaving our premises that is sent to a third-party storage facility is also encrypted. This commitment has led us to achieve certification from CyberTrust (an industry leader in information security certification) since 2002.
Intellectual Property
We own a significant number of intellectual property rights, including copyrights, trademarks, trade secrets and patents. Specifically, our policy language, insurance manuals, software and databases are protected by both registered and common law copyrights, and the licensing of those materials to our customers for their use represents a large portion of our revenue. We also own in excess of 500 trademarks in the U.S. and foreign countries, including the names of our products and services and our logos and tag lines, many of which are registered. We believe many of our trademarks, trade names, service marks and logos to be of material importance to our business as they assist our customers in identifying our products and services and the quality that stands behind them. We consider our intellectual property to be proprietary, and we rely on a combination of statutory (e.g., copyright, trademark, trade secret and patent) and contractual safeguards in a comprehensive intellectual property enforcement program to protect them wherever they are used.
We also own several software method and processing patents and have several pending patent applications in the U.S. that complement our products. The patents and patent applications include claims which pertain to technology, including a patent for our Claims Outcome Advisor software, and for our Xactware Sketch product. We believe the protection of our proprietary technology is important to our success and we will continue to seek to protect those intellectual property assets for which we have expended substantial research and development capital and which are material to our business.
14
In order to maintain control of our intellectual property, we enter into license agreements with our customers, granting each customer a license to use our products and services, including our software and databases. This helps to maintain the integrity of our proprietary intellectual property and to protect the embedded information and technology contained in our solutions. As a
13
general practice, employees, contractors and other parties with access to our proprietary information sign agreements that prohibit the unauthorized use or disclosure of our proprietary rights, information and technology.
Employees
As of December 31, 2010,2013, we employed 4,7066,368 full-time and 184727 part-time employees. None of our employees are represented by unions. We consider our relationship with our employees to be good and have not experienced interruptions of operations due to labor disagreements.
Our employees include over 200190 actuarial professionals, including 4349 Fellows and 2725 Associates of the Casualty Actuarial Society, as well as 143158 Chartered Property Casualty Underwriters, 1718 Certified and 2223 Associate Insurance Data Managers, and over 565530 professionals with advanced degrees, including PhDs in mathematics and statistical modeling who review both the data and the models.
Regulation
Because our business involves the distribution of certain personal, public and non-public data to businesses and governmental entities that make eligibility, service and marketing decisions based on such data, certain of our solutions and services are subject to regulation under federal, state and local laws in the United States and, to a lesser extent, foreign countries. Examples of such regulation include the Fair Credit Reporting Act, which regulates the use of consumer credit report information; the Gramm-Leach-Bliley Act, which regulates the use of non-public personal financial information held by financial institutions and applies indirectly to companies that provide services to financial institutions; the Health Insurance Portability and Accountability Act, which restricts the public disclosure of patient information and applies indirectly to companies that provide services to healthcare businesses; the Drivers Privacy Protection Act, which prohibits the public disclosure, use or resale by any state’s department of motor vehicles of personal information about an individual that was obtained by the department in connection with a motor vehicle record, except for a “permissible purpose” and various other federal, state and local laws and regulations.
These laws generally restrict the use and disclosure of personal information and provide consumers certain rights to know the manner in which their personal information is being used, to challenge the accuracy of such informationand/or to prevent the use and disclosure of such information. In certain instances, these laws also impose requirements for safeguarding personal information through the issuance of data security standards or guidelines. Certain state laws impose similar privacy obligations, as well as obligations to provide notification of security breaches in certain circumstances.
We are also licensed as a rating, rate service, advisory or statistical organization under state insurance codes in all fifty states, Puerto Rico, Guam, the Virgin Islands and the District of Columbia. As such an advisory organization, we provide statistical, actuarial, policy language development and related products and services to property/casualty insurers, including advisory prospective loss costs, other prospective cost information, manual rules and policy language. We also serve as an officially designated statistical agent of state insurance regulators to collect policy-writing and loss statistics of individual insurers and compile that information into reports used by the regulators.
Many of our products, services and operations as well as insurer use of our services are subject to state rather than federal regulation by virtue of the McCarran-Ferguson Act. As a result, many of our operations and products are subject to reviewand/or approval by state regulators. Furthermore, our operations involving licensed advisory organization activities are subject to periodic examinations conducted by state regulators and our operations and products are subject to state antitrust and trade practice statutes within or outside state insurance codes, which are typically enforced by state attorneys generaland/or insurance regulators.
15
Available Information
We maintain an Investor Relations website on the Internet atinvestor.verisk.com. investor.verisk.com. We make available free of charge, on or through this website, our annual, quarterly, and current reports and any amendments to those reports as soon as reasonably practicable following the time they are electronically filed with or furnished to the SEC. To access these, click on the “Financial Information” — “SEC Filings”“SEC" link found on our Investor Relations homepage. Verisk trades on the NASDAQ Global Select Market under the ticker symbol “VRSK.” Our stock was first publicly traded on October 7, 2009.
The public may read and copy any materials filed by Verisk with the SEC at the SEC’s Public Reference Room at 100 F Street, NE, Room 1580, Washington, DC 20549. The public may obtain information on the operation of the Public Reference Room by calling the SEC at 1-800-SEC-0330. The SEC maintains an Internet site that contains reports, proxy and information statements and other information regarding issuers that file electronically with the SEC at www.sec.gov.
14
| Item 1A. | Risk Factors |
You should carefully consider the following risks and all of the other information set forth in this annual report onForm 10-K before deciding to invest in sharesany of our Class A common stock.securities. If any of the following risks actually occurs, our business, financial condition or results of operations would likely suffer. In such case, the trading price of our securities including our Class A common stock could decline due to any of these risks, and you may lose all or part of your investment.
We could lose our access to data from external sources which could prevent us from providing our solutions.
We depend upon data from external sources, including data received from customers and various government and public record services, for information used in our databases. In general, we do not own the information in these databases, and the participating organizations could discontinue contributing information to the databases. Our data sources could withdraw or increase the price for their data for a variety of reasons, and we could also become subject to legislative, judicial, or judicialcontractual restrictions on the use of such data, in particular if such data is not collected by the third parties in a way which allows us to legally useand/or process the data. In addition, some of our customers are significant stockholders of our company. Specifically, alla portion of our outstanding Class BA common stock is owned by insurers who are also our customers and provide us with a significant percentage of our data.customers. If our customers’ percentage of ownership of our common stock decreases in the future, there can be no assurance that our customers will continue to provide data to the same extent or on the same terms. If a substantial number of data sources, or certain key sources, were to withdraw or be unable to provide their data, or if we were to lose access to data due to government regulation or if the collection of data became uneconomical, our ability to provide solutions to our customers could be impacted, which could materially adversely affect our business, reputation, financial condition, operating results and cash flows.
Agreements with our data suppliers are short-term agreements. Some suppliers are also competitors, which may make us vulnerable to unpredictable price increases and may cause some suppliers not to renew certain agreements. Our competitors could also enter into exclusive contracts with our data sources. If our competitors enter into such exclusive contracts, we may be precluded from receiving certain data from these suppliers or restricted in our use of such data, which would give our competitors an advantage. Such a termination or exclusive contracts could have a material adverse effect on our business, financial position, and operating results if we were unable to arrange for substitute sources.
We derive a substantial portion of our revenues from U.S. P&C primary insurers. If thethere is a downturn in the U.S. insurance industry continues or that industry does not continue to accept our solutions, our revenues will decline.
Revenues derived from solutions we provide to U.S. P&C primary insurers account for a substantial portion of our total revenues. During the year ended December 31, 2010,2013, approximately 57%47.4% of our revenue was derived from solutions provided to U.S. P&C primary insurers. Also, sales ofinvoices for certain of our solutions are tiedlinked in part to premiums in the U.S. P&C insurance market, which may rise or fall in any given year due to loss experience and capital capacity and other factors in the insurance industry beyond our control. In addition, our
16
revenues will decline if the insurance industry does not continue to accept our solutions.
Factors that might affect the acceptance of these solutions by P&C primary insurers include the following:
changes in the business analytics industry;
changes in technology; our inability to obtain or use state fee schedule or claims data in our insurance solutions; saturation of market demand; loss of key customers; industry consolidation; and failure to execute our customer-focused selling approach. |
A continued downturn in the insurance industry, filing pressure or lower acceptance of our solutions by the insurance industry could result in a decline in revenues from that industry and have a material adverse effect on our financial condition, results of operations and cash flows.
Acquisitions could result in operating difficulties, dilution and other harmful consequences, and we may not be successful in achieving growth through acquisitions.
Our revenuelong-term business strategy includes growth through acquisitions. Future acquisitions may not be completed on acceptable terms and acquired assets, data or businesses may not be successfully integrated into our operations, and we may ultimately divest unsuccessful acquirees. Any acquisitions or investments will be accompanied by the risks commonly encountered in acquisitions of businesses. Such risks include, among other things:
15
failing to implement or remediate controls, procedures and policies appropriate for a larger public company at acquired companies that prior to the acquisition lacked such controls, procedures and policies;
paying more than fair market value for an acquired company or assets;
failing to integrate the operations and personnel of the acquired businesses in an efficient, timely manner;
assuming potential liabilities of an acquired company;
managing the potential disruption to our ongoing business;
distracting management focus from our core businesses;
failing to retain management at acquired company;
difficulty in acquiring suitable businesses, including challenges in predicting the value an acquisition will ultimately contribute to our business;
possibility of overpaying for acquisitions, particularly those with significant intangible and those that assets derive value using novel tools and/or are involved in niche markets;
impairing relationships with employees, customers, and strategic partners;
incurring expenses associated with the amortization of intangible assets particularly for intellectual property and other intangible assets;
incurring expenses associated with an impairment of all or a portion of goodwill and other intangible assets due to changes in market conditions, weak economies in certain competitive markets, or the failure of certain acquisitions to realize expected benefits; and
diluting the share value and voting power of existing stockholders.
The anticipated benefits of many of our acquisitions may not materialize. Future acquisitions or dispositions could result in the mortgage vertical is largely transactionalincurrence of debt, contingent liabilities or amortization expenses, or write-offs of goodwill and subjectother intangible assets, any of which could harm our financial condition.
We typically fund our acquisitions through our debt facilities. Although we have capacity under committed facilities, those may not be sufficient. Therefore, future acquisitions may require us to changing conditions ofobtain additional financing through debt or equity, which may not be available on favorable terms or at all.
In addition, to the U.S. mortgage market.
There may be consolidation in our end customer market, which would reduce the use of our services.
Mergers or consolidations among our customers could reduce the number of our customers and potential customers. This could adversely affect our revenues even if these events do not reduce the aggregate number of customers or the activities of the consolidated entities. If our customers merge with or are acquired by other entities that are not our customers, or that use fewer of our services, they may discontinue or reduce their use of our services. The adverse effects of consolidation will be greater in sectors that we are particularly dependent upon, for example, in the P&C insurance and healthcare services sector. Any of these developments could materially and adversely affect our business, financial condition, operating results and cash flows.
If we are unable to develop successful new solutions or if we experience defects, failures and delays associated with the introduction of new solutions, our business could suffer serious harm.
Our growth and success depends upon our ability to develop and sell new solutions. If we are unable to develop new solutions, or if we are not successful in introducingand/or obtaining regulatory approval or acceptance for new solutions, or products we develop face sufficient pricing pressure to make them unattractive to pursue,we may not be able to grow our business, or growth may occur more slowly
17
than we anticipate. In addition, significant undetected errors or delays in new solutions may affect market acceptance of our solutions and could harm our business, financial condition or results of operations. In the past, we have experienced delays while developing and introducing new solutions, primarily due to difficulties in developing models, acquiring data and adapting to particular operating environments. Errors or defects in our solutions that are significant, or are perceived to be significant, could result in rejection of our solutions, damage to our reputation, loss of revenues, diversion of development resources, an increase in product liability claims, and increases in service and support costs and warranty claims.
We will continue to rely upon proprietary technology rights, and if we are unable to protect them, our business could be harmed.
Our success depends, in part, upon our intellectual property rights. To date, we have relied primarily on a combination of copyright, patent, trade secret, and trademark laws and nondisclosure and other contractual restrictions on copying and
16
distribution to protect our proprietary technology. This protection of our proprietary technology is limited, and our proprietary technology could be used by others without our consent. In addition, patents may not be issued with respect to our pending or future patent applications, and our patents may not be upheld as valid or may not prevent the development of competitive products. Business we acquire also often involve intellectual property portfolios, which increase the challenges we face in protecting our strategic advantage. Any disclosure, loss, invalidity of, or failure to protect our intellectual property could negatively impact our competitive position, and ultimately, our business. Our protection of our intellectual property rights in the United States or abroad may not be adequate and others, including our competitors, may use our proprietary technology without our consent. Furthermore, litigation may be necessary to enforce our intellectual property rights, to protect our trade secrets, or to determine the validity and scope of the proprietary rights of others. Such litigation could result in substantial costs and diversion of resources and could harm our business, financial condition, results of operations and cash flows.
We could face claims for intellectual property infringement, which if successful could restrict us from using and providing our technologies and solutions to our customers.
There has been substantial litigation and other proceedings, particularly in the United States, regarding patent and other intellectual property rights in the information technology industry. There is a risk that we are infringing, or may in the future infringe, the intellectual property rights of third parties. We monitor third-party patents and patent applications that may be relevant to our technologies and solutions and we carry out freedom to operate analysis where we deem appropriate. However, such monitoring and analysis has not been, and is unlikely in the future to be, comprehensive, and it may not be possible to detect all potentially relevant patents and patent applications. Since the patent application process can take several years to complete, there may be currently pending applications, unknown to us, that may later result in issued patents that cover our products and technologies. As a result, we may infringe existing and future third-party patents of which we are not aware. As we expand our operations there is a higher risk that such activity could infringe the intellectual property rights of third parties.
Third-party intellectual property infringement claims and any resultant litigation against us or our technology partners or providers, could subject us to liability for damages, restrict us from using and providing our technologies and solutions or operating our business generally, or require changes to be made to our technologies and solutions. Even if we prevail, litigation is time consuming and expensive to defend and would result in the diversion of management’s time and attention.
If a successful claim of infringement is brought against us and we fail to develop non-infringing technologies and solutions or to obtain licenses on a timely and cost effective basis this could materially and adversely affect our business, reputation, financial condition, operating results and cash flows.
Regulatory developments could negatively impact our business.
Because personal, public and non-public information is stored in some of our databases, we are vulnerable to government regulation and adverse publicity concerning the use of our data. We provide many types of data and services that already are subject to regulation under the Fair Credit Reporting Act, Gramm-Leach-Bliley Act, Driver’s Privacy Protection Act, Health Insurance Portability and Accountability Act, the
18
European Union’s Data Protection Directive, the Dodd Frank Wall Street Reform and Consumer Protection Act and to a lesser extent, various other federal, state, and local laws and regulations. These laws and regulations are designed to protect the privacy of the public and to prevent the misuse of personal information in the marketplace. However, many consumer advocates, privacy advocates, and government regulators believe that the existing laws and regulations do not adequately protect privacy. They have become increasingly concerned with the use of personal information, particularly social security numbers, department of motor vehicle data and dates of birth. As a result, they are lobbying for further restrictions on the dissemination or commercial use of personal information to the public and private sectors. Similar initiatives are under way in other countries in which we do business or from which we source data. The following legal and regulatory developments also could have a material adverse affecteffect on our business, financial position, results of operations or cash flows:
| amendment, enactment, or interpretation of laws and regulations which restrict the access and use of personal information and reduce the supply of data available to customers; | ||
changes in cultural and consumer attitudes to favor further restrictions on information collection and sharing, which may lead to regulations that prevent full utilization of our solutions;
failure of our solutions to comply with current laws and regulations; and
failure of our solutions to adapt to changes in the regulatory environment in an efficient, cost-effective manner.
Fraudulent or unpermitted data access and other security or privacy breaches may negatively impact our business and harm our reputation.
Security breaches in our facilities, computer networks, and databases may cause harm to our business and reputation and result in a loss of customers. Our systems may be vulnerable to physical break-ins, computer viruses, attacks by hackers and similar disruptive problems. Third-party contractors also may experience security breaches involving the storage and transmission of
17
proprietary information. If users gain improper access to our databases, they may be able to steal, publish, delete or modify confidential third-party information that is stored or transmitted on our networks.
In addition, customers’, employees’ or other’s misuse of and/or gaining unpermitted access to or failure to properly secure our information or services could cause harm to our business and reputation and result in loss of customers. Any such misappropriationand/or misuse of or failure to properly secure our information could result in us, among other things, being in breach of certain data protection and related legislation.
A security or privacy breach may affect us in the following ways:
| deterring customers from using our solutions; | ||
harming our reputation;
exposing us to liability;
increasing operating expenses to correct problems caused by the breach;
affecting our ability to meet customers’ expectations; and/or
causing inquiry from governmental authorities.
Incidents in which consumer data has been fraudulently or improperly acquired.acquired or viewed, or any other security or privacy breaches, may occur and could go undetected. The number of potentially affected consumers identified by any future incidents is obviously unknown. Any such incident could materially and adversely affect our business, reputation, financial condition, operating results and cash flows.
19
We typically face a long selling cycle to secure new contracts that requires significant resource commitments, which result in a long lead time before we receive revenues from new relationships.
We typically face a long selling cycle to secure a new contract and there is generally a long preparation period in order to commence providing the services. We typically incur significant business development expenses during the selling cycle and we may not succeed in winning a new customer’s business, in which case we receive no revenues and may receive no reimbursement for such expenses. Even if we succeed in developing a relationship with a potential new customer, we may not be successful in obtaining contractual commitments after the selling cycle or in maintaining contractual commitments after the implementation cycle, which may have a material adverse effect on our business, results of operations and financial condition.
We may lose key business assets, including loss of data center capacity or the interruption of telecommunications links, the internet, or power sources, which could significantly impede our ability to do business.
Our operations depend on our ability, as well as that of third-party service providers to whom we have outsourced several critical functions, to protect data centers and related technology against damage from hardware failure, fire, flood, power loss, telecommunications failure, impacts of terrorism, breaches in security (such as the actions of computer hackers), natural disasters, or other disasters. Certain of our facilities are located in areas that could be impacted by coastal flooding, earthquakes or other disasters. The on-line services we provide are dependent on links to telecommunications providers. In addition, we generate a significant amount of our revenues through telesales centers and websites that we utilize in the acquisition of new customers, fulfillment of solutions and services and responding to customer inquiries. We may not have sufficient redundant operations to cover a loss or failure in all of these areas in a timely manner. Certain of our customer contracts provide that our on-line servers may not be unavailable for specified periods of time. Any damage to our data centers, failure of our telecommunications links or inability to access these telesales centers or websites could cause interruptions in operations that materially adversely affect our ability to meet customers’ requirements, resulting in decreased revenue, operating income and earnings per share.
We are subject to competition in many of the markets in which we operate and we may not be able to compete effectively.
Some markets in which we operate or which we believe may provide growth opportunities for us are highly competitive, and are expected to remain highly competitive. We compete on the basis of quality, customer service, product and service selection and price. Our competitive position in various market segments depends upon the relative strength of competitors in the segment and the resources devoted to competing in that segment. Due to their size, certain competitors may be able to allocate greater resources to a particular market segment than we can. As a result, these competitors may be in a better position to anticipate and respond to changing customer preferences, emerging technologies and market trends. In addition, new competitors and alliances may emerge to take market share away.away, and as we enter into new lines of business, due to acquisition or otherwise, we face competition from new players with different competitive dynamics. We may be unable to maintain our competitive position in our market segments, especially against larger competitors. We may also invest further to upgrade our systems in order to compete. If we fail to successfully compete, our business, financial position and results of operations may be adversely affected.
18
Our contemplated acquisition of Eagleview Technology Corporation will increase our leverage; in operating difficulties, dilution and other harmful consequences.
20
On January 14, 2014, we announced the signing of our acquisitions may not materialize. Future acquisitions or dispositions could result inan agreement to acquire Eagleview Technology Corporation ('EVT'), the incurrence of debt, contingent liabilities or amortization expenses, or write-offs of goodwill and other intangible assets, anyclosing of which could harm our financial condition.
To the extent the availability of free or relatively inexpensive information increases, the demand for some of our solutions may decrease.
Public sources of free or relatively inexpensive information have become increasingly available recently, particularly through the internet,Internet, and this trend is expected to continue. Governmental agencies in particular have increased the amount of information to which they provide free public access. Public sources of free or relatively inexpensive information may reduce demand for our solutions. To the extent that customers choose not to obtain solutions from us and instead rely on information obtained at little or no cost from these public sources, our business and results of operations may be adversely affected.
Our senior leadership team is critical to our continued success and the loss of such personnel could harm our business.
Our future success substantially depends on the continued service and performance of the members of our senior leadership team. These personnel possess business and technical capabilities that are difficult to replace. Members of our senior management operating team have been with us for an average of almost twentyover 18 years.
However, with the exception of Frank J. Coyne, our Chairman and Chief Executive Officer, we do not have employee contracts with the members of our senior management operating team. If we lose key members of our senior management operating team, we may not be able to effectively manage our current operations or meet ongoing and future business challenges, and this may have a material adverse effect on our business, results of operations and financial condition.
We may fail to attract and retain enough qualified employees to support our operations, which could have an adverse effect on our ability to expand our business and service our customers.
Our business relies on large numbers of skilled employees and our success depends on our ability to attract, train and retain a sufficient number of qualified employees. If our attrition rate increases, our operating efficiency and productivity may decrease. We compete for employees not only with other companies in our industry but also with companies in other industries, such as software services, engineering services and
21
financial services companies, and there is a limited pool of employees who have the skills and training needed to do our work.
If our business continues to grow, the number of people we will need to hire will increase. We will also need to increase our hiring if we are not able to maintain our attrition rate through our current recruiting and retention policies. Increased competition for employees could have an adverse effect on our ability to expand our business and service our customers, as well as cause us to incur greater personnel expenses and training costs.
We are subject to antitrust, consumer protection and other litigation, and may in the future become subject to further such litigation; an adverse outcome in such litigation could have a material adverse effect on our financial condition, revenues and profitability.
We participate in businesses (particularly insurance-related businesses and services) that are subject to substantial litigation, including antitrust and consumer protection litigation. In addition our insurance specialists are in the business of providing advice on standard contract terms, which if challenged could expose us to substantial reputational harm and possible liability. We are subject to the provisions of a 1995 settlement agreement in an antitrust lawsuit brought by various state Attorneys General and private plaintiffs which imposes certain constraints with respect to insurer involvement in our governance and business. We currently are defending against putative class action lawsuits in which it is alleged that certain of our subsidiaries unlawfully have conspiredfailed to comply with insurers with respect to their payment of insurance claims.the Fair Credit Reporting Act and related obligations. See “Item 3. Legal Proceedings.” Our failure to successfully defend or settle such litigation could result in liability that, to the extent not covered by our insurance, could have a material adverse effect on our financial condition, revenues and profitability. Given the nature of our business, we may be subject to similar litigation in the future. Even if the direct financial impact of such litigation is not material, settlements or judgments arising out of such litigation
19
could include further restrictions on our ability to conduct business, including potentially the elimination of entire lines of business, which could increase our cost of doing business and limit our prospects for future growth.
General economic, political and market forces and dislocations beyond our control could reduce demand for our solutions and harm our business.
The demand for our solutions may be impacted by domestic and international factors that are beyond our control, including macroeconomic, political and market conditions, the availability of short-term and long-term funding and capital, the level and volatility of interest rates, currency exchange rates and inflation. The United States economy recently experienced periods of contraction and both the future domestic and global economic environments may continue to be less favorable than those of prior years. Any one or more of these factors may contribute to reduced activity and prices in the securities markets generally and could result in a reduction in demand for our solutions, which could have an adverse effect on our results of operations and financial condition. A significant additional decline in the value of assets for which risk is transferred in market transactions could have an adverse impact on the demand for our solutions. In addition, the decline of the credit markets has reduced the number of mortgage originators, and therefore, the immediate demand for our related mortgage solutions. Specifically, certain of our fraud identificationdetection and detectionprevention solutions are directed at the mortgage market. This decline in asset value and originations and an increase in foreclosure
22
levels has also created greater regulatory scrutiny of mortgage originations and securitizations. Any new regulatory regime may change the utility of our solutions for mortgage lenders and other participants in the mortgage lending industry and related derivative markets or increase our costs as we adapt our solutions to new regulation.
If there are substantial sales of our common stock, our stock price could decline.
The market price of our common stock could decline as a result of sales of a large number of shares of common stock in the market, or the perception that these sales could occur. These sales, or the possibility that these sales may occur, also might make it more difficult for us to sell equity securities in the future at a time and at a price that we deem attractive.
As of December 31, 2010,2013, our stockholders, whoten largest shareholders owned our shares prior to the IPO and follow-on offering, continue to beneficially own in the aggregate approximately 24,577,690 shares46.4% of our Class A common stock primarilyincluding 8.9% of our Class A common stock owned by our ESOP, 12,225,480 shares of our Class B (Series 1),Employee Stock Ownership Plan orClass B-1, common stock and 14,771,340 shares of our Class B (Series 2), orClass B-2, common stock, representing in aggregate approximately 30.33% of our outstanding common stock. ESOP. Such stockholders will beare able to sell their common stock in the public market from time to time without registration, and subject to limitations on the timing, amount and method of those sales imposed by securities laws. If any of these stockholders were to sell a large number of their common stock, the market price of our common stock could decline significantly. In addition, the perception in the public markets that sales by them might occur could also adversely affect the market price of our common stock.
Pursuant to our equity incentive plans, options to purchase approximately 23,018,7458,947,727 shares of Class A common stock were outstanding as of February 25, 2011.21, 2014. We filed a registration statement under the Securities Act, which covers the shares available for issuance under our equity incentive plans (including for such outstanding options) as well as shares held for resale by our existing stockholders that were previously issued under our equity incentive plans. Such further issuance and resale of our common stock could cause the price of our common stock to decline.
Also, in the future, we may issue our securities in connection with investments and acquisitions. The amount of our common stock issued in connection with an investment or acquisition could constitute a material portion of our then outstanding common stock.
23
Our capital structure, level of indebtedness and the terms of anti-takeover provisions under Delaware law and in our amended and restated certificate of incorporation and bylaws could diminish the value of our common stock and could make a merger, tender offer or proxy contest difficult or could impede an attempt to replace or remove our directors.
We are a Delaware corporation and the anti-takeover provisions of the Delaware General Corporation Law may discourage, delay or prevent a change in control by prohibiting us from engaging in a business combination with an interested stockholder for a period of three years after the person becomes an interested stockholder, even if a change of control would be beneficial to our existing stockholders. In addition, our certificate of incorporation and bylaws may discourage, delay or prevent a change in our management or control over us that stockholders may consider favorable or make it more difficult for stockholders to replace directors even if stockholders consider it beneficial to do so. Our certificate of incorporation and bylaws:
authorize the issuance of “blank check” preferred stock that could be issued by our board of directors to increase the number of outstanding shares to thwart a takeover attempt;
In addition, Section 203 of the Delaware General Corporation Law may inhibit potential acquisition bids for us. As a public company, we are subject to Section 203, which regulates corporate acquisitions and limits the ability of a holder of 15.0% or more of our stock from acquiring the rest of our stock. Under Delaware law a corporation may opt out of the anti-takeover provisions, but we do not intend to do so.
These provisions may prevent a stockholder from receiving the benefit from any premium over the market price of our common stock offered by a bidder in a potential takeover. Even in the absence of an attempt to effect a change in management or a takeover attempt, these provisions may adversely affect the prevailing market price of our common stock if they are viewed as discouraging takeover attempts in the future.
21
| Item 1B. | Unresolved Staff Comments |
Not Applicable.
24
| Item 2. | Properties |
Our headquarters are in Jersey City, New Jersey. As of December 31, 2010,2013, our principal offices consisted of the following properties:
| Location | Square Feet | Lease Expiration Date | |||||||
| Jersey City, New Jersey | 390,991 | May | |||||||
| South Jordan, Utah | 105,926 | August 31, 2015 | |||||||
| Orem, Utah | 89,172 | December 31, 2017 | |||||||
| Boston, Massachusetts | 69,806 | November 30, 2020 | |||||||
| North Reading, Massachusetts | 41,200 | June 30, 2015 | |||||||
We also lease offices in 2221 states in the United States, and the District of Columbia, and offices outside the United States to support our international operations in Brazil, Canada, China, Denmark, England, Germany, India, Israel, Japan, Nepal, and Nepal.
Singapore.
We believe that our properties are in good operating condition and adequately serve our current business operations. We also anticipate that suitable additional or alternative space, including those under lease options, will be available at commercially reasonable terms for future expansion.
| Item 3. | Legal Proceedings |
We are party to legal proceedings with respect to a variety of matters in the ordinary course of business, including those matters described below. WeWith respect to the ongoing matters, we are unable, at the present time, to determine the ultimate resolution of or provide a reasonable estimate of the range of possible loss attributable to these matters or the impact they may have on our results of operations, financial position or cash flows. This is primarily because many of these cases remainthe matters are generally in their early stages and only limited discovery has taken place.either not commenced or been completed. Although we believe we have strong defenses and intend to vigorously defend the litigation proceedings described below,these matters, we could in the future incur judgments or enter into settlements of claims that could have a material adverse effect on our results of operations, financial position or cash flows.
Intellicorp Records, Inc. Litigation and iiX Litigation
25
22
(felony or misdemeanor) for one or more criminal charges than the Single County search (misdemeanor or infraction.) This amendment reduces the size of the potential class, but does not alter the time period for which will proceed to the discovery phase along with the remaining claims against State Farm. Judge Duval denied plaintiffs’ motionplaintiffs seek to certify a class with respect toor the fraud and breach of contract claims on August 3, 2009 and the time to appeal that decision has expired. The matter now a single action was reassigned to Judge Africk. The plaintiffs agreed to settle the matter with the Company and State Farm and a Settlement Agreement and a Release was executed by all parties in June 2010.
On January 3, 2013, we received service of Missouri were served with a summons and class action complaint filed in the United States District Court for the WesternSouthern District of Missouri alleging violations of the DPPA entitledJanice Cook, et al.Ohio naming our subsidiary Insurance Information Exchange (“iiX”) titled Mark A. Johnson v. ACS State & Local Solutions, et al.Plaintiffs brought theInsurance Information Exchange, LLC (the “Johnson Complaint”). The Johnson Complaint alleges a nationwide putative class action on their own behalf and on behalf of all similarly situated
26
On October 18, 2013, the parties filed a Stipulation of their personal information for purposes not enumerated bySettlement resolving the DPPARoe, Thomas and whose personal information has been knowingly obtained and used by the defendants.Johnson matters which Judge Gwin approved on October 29, 2013 subject to a hearing on Final Approval. The class complaint alleges that the defendants knowingly obtained personal informationStipulation of Settlement provides for a purpose not authorizedpayment of $18.6 million all of which is to be provided by insurance. Accordingly, if the DPPA and seeks liquidated damages inStipulation of Settlement is approved at the amounthearing on Final Approval, the settlement of two thousand five hundred dollars for each instance of a violation of the DDPA, punitive damages and the destruction of any illegally obtained personal information. The court granted iiX’s motion to dismiss the complaint based on a failure to state a claim on November 19, 2010. Plaintiffs filed a notice of appeal on December 17, 2010. At this time, itthese matters is not possibleexpected to determine the ultimate resolution of or estimate the liability related to these matters.have a material adverse effect on us.
On May 13, 2013, we were served with a putative class action entitledRenata Gluzmantitled Celeste Shaw v. Interthinx, Inc.The plaintiff, a former Interthinx employee,, Verisk Analytics, Inc. and Jeffery Moyer filed the class action on August 13, 2009 in the SuperiorUnited States District Court for the District of the State of California, County of Los AngelesColorado on behalf of all fraud detection employees who have worked for Interthinx information technology employees for unpaid overtimethe last three years in Colorado and missed mealsnationwide and rest breaks,who were classified as well as various relatedexempt employees. On September 12, 2013 the plaintiffs filed a First Amended Complaint titled Celeste Shaw and Judith Verheecke v. Interthinx, Inc.,Verisk Analytics, Inc. and Jeffery Moyer (the “Amended Complaint”). The Amended Complaint adds a Missouri class representative and similarly claims claiming that the information technologyfraud detection employees were misclassified as exempt employees and, as a result, were denied certain wages and benefits that would have been received if they were properly classified as non-exempt employees. The pleadings include, among other things, a violationIt pleads four causes of Businessaction against defendants: (1) Collective Action under section 216(b) of the Fair Labor Standards Act for unpaid overtime (nationwide class); (2) Fed. R. Civ. P. 23 class action under the Colorado Wage Act and Professions Code 17200Wage Order for unfair business practices, which allows plaintiffs to include asunpaid overtime (Colorado class); (3) Fed. R. Civ. P. 23 class members all information technology employees employed at Interthinxaction under the Missouri Ann. Stat. section 290.500 et seq. for four years prior to the dateunpaid overtime (Missouri class) and (4) Fed. R. Civ. P. 23 class action under Colorado Wage Act for unpaid commissions/
23
nondiscretionary bonuses (Colorado class). The complaint seeks compensatory damages, penalties that are associated with the various statutes, restitution,declaratory and injunctive relief, interest, costs and attorneyattorneys’ fees.
On July 2, 2013, we were served with a putative class action titled Shabnam Shelia Dehdashtian v. Interthinx, Inc. and Verisk Analytics, Inc. in the United States District Court for the Central District of California. The plaintiff, Shabnam Shelia Dehdashtian, a former mortgage auditor at our subsidiary Interthinx, Inc. in California, filed the class action on behalf of all persons who have been employed by Interthinx as auditors, mortgage compliance underwriters and mortgage auditors nationwide claiming that the defendants failed to pay overtime compensation, to provide rest and meal periods, waiting time penalties and to provide accurate wage statements to the plaintiffs as required by federal and California law. On August 30, 2013 plaintiff filed her First Amended Complaint (the “Amended Complaint”) adding Medhat Gareeb, a former mortgage auditor, as a plaintiff, limiting the alleged FLSA violations to individual claims and proceeding with the California class action on behalf of all persons who have been employed by defendants as auditors, mortgage compliance underwriters and mortgage auditors in California at any time starting 4 years prior to filing of the initial complaint until trial. The Amended Complaint pleads seven causes of action against defendants: (1) Failure to pay overtime compensation in violation of the FLSA for the individual named plaintiffs only; (2) Failure to pay overtime compensation in violation of Cal. Lab. Code sections 510, 1194 and 1198 and IWC Wage Order No. 4; (3) Failure to pay waiting time penalties in violation of Cal. Lab. Code sections 201-203; (4) Failure to provide itemized wage statements in violation of Cal. Lab. Code section 226 and IWC Order No. 4; (5) Failure to provide and or authorize meal and rest periods in violation of Cal. Lab. Code section 226.7 and IWC Order No. 4; (6) Violation of California Business and Professions Code sections 17200, et seq; and (7) a Labor Code Private Attorney General Act (PAGA) Public enforcement claim, Cal. Lab. Code section 2699 (California class). The complaint seeks compensatory damages, penalties that are associated with the various statutes, equitable and injunctive relief, interest, costs and attorneys’ fees.
On October 14, 2013, we received notice of a claim titled Dejan Nagl v. Interthinx Services, Inc. filed in the California Labor and Workforce Development Agency. The claimant, Dejan Nagl, a former mortgage auditor at our subsidiary Interthinx, Inc. in California, filed the claim on behalf of himself and all current and former individuals employed in California as auditors by Interthinx, Inc. for violations of the California Labor Code and Wage Order. This administrative action was later dismissed by the California Labor and Workforce Development Agency without any further investigation or findings. On November 7, 2013 Dejan Nagl filed a class action complaint in the California Superior Court in Los Angeles County in an action titled Dejan Nagl v. Interthinx, Inc. in which he alleges on behalf of himself and other auditors the following causes of action: (1) Failure to provide rest breaks and meal periods in violation of Lab. Code sections 226.7, 514 and 1198; (2) Failure to pay overtime wages in violation of Lab. Code sections 510 and 1194; (3) Violation of California Business and Professions Code sections 17200, et seq; (4) Failure to provide accurate wage statements in violation of Lab. Code section 226; (5) Failure to timely pay wages for violations of Lab. Code sections 201- 203. The claim seeks compensatory damages and penalties that are associated with the various statutes, costs and attorneys’ fees.
At this time, it is not possible to determine the ultimate resolution of, or estimate the liability related to, these matters.
Mariah Re Litigation
On July 8, 2013, we were served with a summons and complaint filed in the United States District Court for the Southern District of New York in an action titled Mariah Re LTD. v. American Family Mutual Insurance Company, ISO Services, Inc. and AIR Worldwide Corporation, which was amended by the plaintiff on October 18, 2013 (the “Amended Complaint”). Plaintiff Mariah is a special purpose vehicle established to provide reinsurance to defendant American Family Insurance. Mariah entered into contracts with our ISO Services, Inc. and AIR Worldwide Corporation subsidiaries, pursuant to which, among other things, Mariah (i) licensed the right to utilize information published in Catastrophe Bulletins issued by the Property Claims Services division of ISO Services, Inc. and (ii) engaged AIR Worldwide Corporation as Calculation Agent to compute certain reinsured losses. The Amended Complaint alleges the following causes of action: (1) breach of contract against ISO Services, Inc. and AIR Worldwide Corporation; (2) unjust enrichment against American Family; (3) conversion against American Family; (4) tortious interference with contract against American Family; (5) declaratory judgment against all defendants and (6) specific performance against all defendants. The Amended Complaint seeks declaratory relief, specific performance, restitution, monetary damages and attorneys’ fees.
At this time, it is not possible to determine the ultimate resolution of, or estimate the liability related to, this matter.
MediConnect Global, Inc. Litigation
On October 11, 2013, we were served with a summons and complaint in an action titled Naveen Trehan v. MediConnect Global, Inc., Amy Anderson and Verisk Health, Inc. filed on October 9, 2013 in the United States District Court for the District of Utah. The complaint, brought by a former minority shareholder of our subsidiary, MediConnect Global, Inc., alleges four causes of action: (1) breach of fiduciary duty against MediConnect and Amy Anderson for failure to disclose our interest in acquiring, merging with or investing in MediConnect prior to the buyout of his shares; (2) fraud against Amy Anderson and MediConnect
24
for intentionally providing false information to plaintiff with the purpose of inducing him to agree to sell his shares at an artificially low price; (3) negligent misrepresentation against Amy Anderson and MediConnect for their negligent failure to discover and disclose our interest in acquiring MediConnect prior to the buyout of plaintiff’s shares and (4) a violation of SEC Rule 10b-5 against Amy Anderson and MediConnect for defrauding plaintiff and failing to disclose material information in connection with the sale of securities. The complaint seeks joint and several recovery from Amy Anderson and MediConnect for compensatory damages, punitive damages, and disgorgement of all profits earned through the investment of plaintiff’s funds, attorneys’ fees, interest and an order from the court that plaintiff’s funds be held in a constructive trust.
At this time, it is not possible to determine the ultimate resolution of, or estimate the liability related to, this matter.
Insurance Services Office, Inc. Litigation
In October 2013, we were served with a summons and complaint filed in the United States District Court for the Southern District of New York in an action titled Laurence J. Skelly and Ellen Burke v. Insurance Services Office, Inc. and the Pension Plan for Insurance Organizations. The plaintiffs, former employees of our subsidiary Insurance Services Office, Inc., or ISO, bring the action on their own behalf as participants in the Pension Plan for Insurance Organizations and on the behalf of similarly situated participants of the pension plan and ask the court to declare that a certain amendment to the pension plan as of December 31, 2001, which terminated their right to calculate and define the value of their retirement benefit under the pension plan based on their compensation levels as of immediately prior to their “retirement” (the “Unlawful Amendment”), violated the anti-cutback provisions and equitable principles of ERISA. The First Amended Class Action Complaint ( the “ Amended Complaint”) alleges that (1) the Unlawful Amendment of the pension plan violated Section 502(a)(1)(B) of ERISA as well as the anti-cutback rules of ERISA Section 204(g) and Section 411(d)(6) of the Internal Revenue Code; (2) ISO’s failure to provide an ERISA 204(h) notice in a manner calculated to be understood by the average pension plan participant was a violation of Sections 204(h) and 102(a) of ERISA and (3) the Living Pension Right was a contract right under ERISA common law and that by terminating that right through the Unlawful Amendment ISO violated plaintiffs’ common law contract rights under ERISA. The Amended Complaint seeks declaratory, equitable and injunctive relief enjoining the enforcement of the Unlawful Amendment and ordering the pension plan and ISO retroactive to the date of the Unlawful Amendment to recalculate the accrued benefits of all class members, indemnification from ISO to the pension plan for costs and contribution requirements related to voiding the Unlawful Amendment, bonuses to the class representatives, costs and attorney’s fees.
At this time, it is not possible to determine the ultimate resolution of, or estimate the liability related to, this matter.
On April 9, 2013 our subsidiary ISO was served with a First Amended Petition and Request for Disclosure filed in the District Court of Dallas County, Texas in an action titled Sidah Garner v. Nationwide Mutual Insurance Company, Carfax, Inc., General and Import Motors, Porschea Nicole Kendall, Daniel Scott Hayward and Insurance Services Office, Inc. Thereafter, on June 2, 2010, plaintiffs agreed5, 2013 and August 16, 2013 plaintiff served its Second Amended Petition and Third Amended Petition (“the Amended Petition”) on defendants. This action arises from a car accident on June 6, 2011 in which the plaintiff was critically injured. At the time of the accident the plaintiff was in the passenger seat of a 2004 Mazda, which the plaintiff alleges was previously involved in a total loss rollover collision on April 25, 2006. The Amended Petition alleges that at the time of the April 2006 accident the Mazda was insured by Nationwide which failed to settle theirissue a Texas Salvage Title and that ISO was to provide the crash information to vehicle reporting services, including the defendant Carfax. It further alleges that the Mazda was rebuilt and auctioned through a multi-state salvage reseller and sold to defendant Kendall (the driver) and that prior to purchase Kendall consulted Carfax’s Vehicle History Report which guaranteed no problem with the Mazda’s title and that it was not “junk,” neither “salvage nor rebuilt.” As a result, the Amended Petition alleges that Carfax’s report was in error and it sets forth a claim for negligence, negligent misrepresentation, gross negligence, strict liability, breach of contract and fraud against defendants Nationwide Insurance, Carfax and ISO in addition to the negligence claims with Interthinx.against defendants General and Import Motors and Kendall and Hayward. It seeks actual damages, pain and suffering, loss of past and future earnings, past and future impairment and disfigurement, costs and interest from all defendants and exemplary damages from Nationwide, ISO and Carfax. The court denied the summary judgment motions of ISO and Nationwide on December 19, 2013 and January 6, 2014, respectively and granted preliminary approvalthe summary judgment motion of Carfax on January 27, 2014. Trial is scheduled to the settlementcommence on November 10, 2010 and scheduled the final approval hearing for February 23, 2011. Although no assurance can be given concerning the outcome ofMarch 3, 2014.
At this matter, in the opinion of management the lawsuittime, it is not expectedpossible to have a material adverse effect on our financial conditiondetermine the ultimate resolution of, or results of operations.estimate the liability related to, this matter.
| Item 4. | |
Not Applicable.
25
PART II
| Item 5. | Market for Registrant’s Common Equity, Related Stockholder Matters and Issuer Purchases of Equity Securities |
Market Information
Verisk trades under the ticker symbol “VRSK” on the NASDAQ Global Select Market. Our common stock was first publicly traded on October 7, 2009. As of February 25, 2011,21, 2014, the closing price of our Class A common stock was $32.49$65.53 per share, as reported by the NASDAQ Global Select Market. There is no established public trading market for our Class B common stock. As of February 25, 201121, 2014, there were approximately 1728 Class A and 39 Class B stockholders of record. We believe the number of beneficial owners is substantially greater than the number of record holders for Class A, common stock, because a large portion of Class A common stock is held in “street name” by brokers.
We converted all Class B shares to Class A shares in 2011 and currently have no outstanding Class B shares.
We have not paid or declared any cash dividends on our Class AClass B-1, orClass B-2 common stock during the two most recent fiscal years and we currently do not intend to pay dividends on our Class AClass B-1, orClass B-2 common stock. We do have a publicly announced share repurchase plan and have repurchased 15,069,45234,420,219 shares since our IPO. As of December 31, 2010,2013, we had 372,107,352376,545,111 shares of treasury stock.
27
The following table shows the quarterly range of the closing high and low per share sales prices for our common stock as reported by the NASDAQ Global Select Market for the periods indicated.years ending December 31:
Year Ending December 31, 2010 | High | Low | ||||||
| Fourth Quarter | $ | 34.60 | $ | 27.64 | ||||
| Third Quarter | $ | 30.20 | $ | 27.25 | ||||
| Second Quarter | $ | 30.93 | $ | 27.65 | ||||
| First Quarter | $ | 30.44 | $ | 27.24 | ||||
Year Ending December 31, 2009 | High | Low | ||||||
| Fourth Quarter | $ | 31.00 | $ | 26.25 | ||||
| 2013 | 2012 | |||||||||||
| High | Low | High | Low | |||||||||
| Fourth Quarter | $ | 68.74 | $ | 61.27 | $ | 51.35 | $ | 45.95 | ||||
| Third Quarter | $ | 66.53 | $ | 60.47 | $ | 50.94 | $ | 46.39 | ||||
| Second Quarter | $ | 61.29 | $ | 57.70 | $ | 49.43 | $ | 46.34 | ||||
| First Quarter | $ | 61.62 | $ | 52.98 | $ | 47.33 | $ | 38.98 | ||||
Performance Graph
The graph below compares the cumulative total stockholder return on $100 invested in our Class A common stock, with the cumulative total return (assuming reinvestment of dividends) on $100 invested in each of the NASDAQ Composite Index, S&P 500 Index and an aggregate of peer issuers in the information industry since October 7, 2009, the date our Class A common stock was first publicly traded. The peer issuers used for this graph are Dun & Bradstreet Corporation, Equifax Inc., Factset Research Systems Inc., Fair Isaac Corporation, IHS Inc, Morningstar, Inc., MSCI Inc., and Solera Holdings, Inc. Each peer issuer was weighted according to its respective market capitalization on October 7, 2009.
COMPARISON OF CUMULATIVE TOTAL RETURN
Assumes $100 Invested on Oct.October 07, 2009
Assumes Dividend Reinvested
Fiscal Year Ending Dec.Ended December 31, 20102013
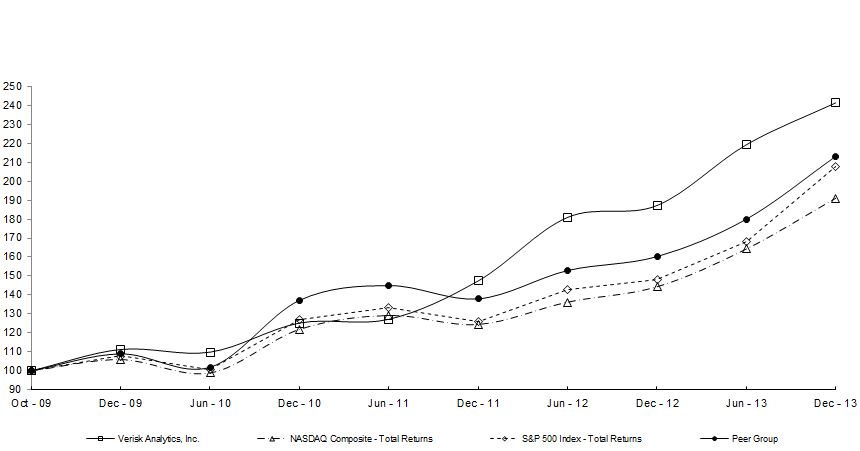
26
Recent Sales of Unregistered Securities
There were no unregistered sales of equity securities by the Company during the period covered by this report.2013.
Issuer Purchases of Equity Securities
28
| Total Number of | Maximum Dollar | |||||||||||||||
| Shares Purchased | Value of Shares that | |||||||||||||||
| Total Number | Average | as Part of Publicly | May Yet Be | |||||||||||||
| of Shares | Price Paid | Announced Plans | Purchased Under the | |||||||||||||
Period | Purchased(1) | per Share(2) | or Programs | Plans or Programs | ||||||||||||
| (In thousands) | ||||||||||||||||
| October 1, 2010 through October 31, 2010 | 7,714,700 | $ | 28.16 | 414,700 | $ | 152,753 | ||||||||||
| November 1, 2010 through November 30, 2010 | 1,041,507 | $ | 30.45 | 1,041,507 | $ | 121,039 | ||||||||||
| December 1, 2010 through December 31, 2010 | 1,668,839 | $ | 33.20 | 1,010,589 | $ | 87,488 | ||||||||||
| 10,425,046 | $ | 31.19 | 2,466,796 | |||||||||||||
| Period | Total Number of Shares Purchased | Average Price Paid per Share | Total Number of Shares Purchased as Part of Publicly Announced Plans or Programs | Approximate Dollar Value of Shares that May Yet Be Purchased Under the Plans or Programs | |||||||||
| (in thousands) | |||||||||||||
| October 1, 2013 through October 31, 2013 | 253,676 | $ | 65.33 | 253,676 | $ | 265,539 | |||||||
| November 1, 2013 through November 30, 2013 | 1,144,344 | $ | 63.13 | 1,144,344 | $ | 193,296 | |||||||
| December 1, 2013 through December 31, 2013 | 426,970 | $ | 65.68 | 426,970 | $ | 165,253 | |||||||
| 1,824,990 | 1,824,990 | ||||||||||||
| Item 6. | Selected Financial Data |
The following selected historical financial data should be read in conjunction with, and are qualified by reference to, Item 7. “Management’s Discussion and Analysis of Financial Condition and Results of Operations” and the consolidated financial statements and notes thereto included elsewhere in this annual report onForm 10-K. The consolidated statement of operations data for the years ended December 31, 2010, 20092013, 2012 and 20082011 and the consolidated balance sheet data as of December 31, 20102013 and 20092012 are derived from the audited consolidated financial statements included elsewhere in this annual report onForm 10-K. The consolidated statement of operations data for the years ended December 31, 20072010 and 20062009 and the consolidated balance sheet data as of December 31, 20082011, 2010 and 20072009 are derived from audited consolidated financial statements that are not included in this annual report onForm 10-K. The consolidated balance sheet data as of December 31, 2006 is derived from unaudited consolidated financial statements that are not included in this annual report onForm 10-K. Results for the year ended December 31, 20102013 are not necessarily indicative of results that may be expected in any other future period.
Between January 1, 20062009 and December 31, 20102013 we acquired 1512 businesses, which may affect the comparability of our consolidated financial statements. The amounts have been retroactively adjusted in all periods presented to give recognition to the discontinued operations of our mortgage services business. The following table sets forth our statement of operations for the years ended December 31:
27
| 2013 | 2012 | 2011 | 2010 | 2009 | |||||||||||||||
| (In thousands, except for share and per share data) | |||||||||||||||||||
| Revenues: | |||||||||||||||||||
| Decision Analytics | $ | 977,427 | $ | 828,342 | $ | 639,100 | $ | 461,743 | $ | 397,501 | |||||||||
| Risk Assessment | 618,276 | 579,506 | 552,293 | 530,542 | 512,672 | ||||||||||||||
| Revenues | 1,595,703 | 1,407,848 | 1,191,393 | 992,285 | 910,173 | ||||||||||||||
| Expenses: | |||||||||||||||||||
| Cost of revenues | 622,523 | 516,708 | 440,979 | 376,270 | 413,800 | ||||||||||||||
| Selling, general and administrative | 228,982 | 220,068 | 199,495 | 157,596 | 154,746 | ||||||||||||||
| Depreciation and amortization of fixed assets | 66,190 | 46,637 | 40,135 | 35,835 | 34,292 | ||||||||||||||
| Amortization of intangible assets | 63,741 | 52,207 | 32,985 | 25,202 | 28,402 | ||||||||||||||
| Acquisition related liabilities adjustment (1) | — | — | (3,364 | ) | (544 | ) | — | ||||||||||||
| Total expenses | 981,436 | 835,620 | 710,230 | 594,359 | 631,240 | ||||||||||||||
| Operating income | 614,267 | 572,228 | 481,163 | 397,926 | 278,933 | ||||||||||||||
| Other income (expense): | |||||||||||||||||||
| Investment income | 701 | 438 | 193 | 279 | 186 | ||||||||||||||
| Realized (loss) gain on available-for-sale securities, net | (92 | ) | (332 | ) | 686 | 95 | (2,332 | ) | |||||||||||
| Interest expense | (76,136 | ) | (72,508 | ) | (53,847 | ) | (34,664 | ) | (35,265 | ) | |||||||||
| Total other expense, net | (75,527 | ) | (72,402 | ) | (52,968 | ) | (34,290 | ) | (37,411 | ) | |||||||||
| Income before income taxes from continuing operations | 538,740 | 499,826 | 428,195 | 363,636 | 241,522 | ||||||||||||||
| Provision for income taxes | (196,426 | ) | (182,363 | ) | (165,739 | ) | (148,235 | ) | (129,029 | ) | |||||||||
| Income from continuing operations | 342,314 | 317,463 | 262,456 | 215,401 | 112,493 | ||||||||||||||
| Income from discontinued operations, net of tax (2) | 6,066 | 11,679 | 20,302 | 27,151 | 14,121 | ||||||||||||||
| Net income | $ | 348,380 | $ | 329,142 | $ | 282,758 | $ | 242,552 | $ | 126,614 | |||||||||
| Basic net income per share | |||||||||||||||||||
| Income from continuing operations | $ | 2.04 | $ | 1.91 | $ | 1.58 | $ | 1.21 | $ | 0.64 | |||||||||
| Income from discontinued operations | 0.03 | 0.07 | 0.12 | 0.15 | 0.08 | ||||||||||||||
| Basic net income per share | $ | 2.07 | $ | 1.98 | $ | 1.70 | $ | 1.36 | $ | 0.72 | |||||||||
| Diluted net income per share | |||||||||||||||||||
| Income from continuing operations | $ | 1.99 | $ | 1.85 | $ | 1.51 | $ | 1.16 | $ | 0.62 | |||||||||
| Income from discontinued operations | 0.03 | 0.07 | 0.12 | 0.14 | 0.08 | ||||||||||||||
| Diluted net income per share | $ | 2.02 | $ | 1.92 | $ | 1.63 | $ | 1.30 | $ | 0.70 | |||||||||
| Weighted average shares outstanding: | |||||||||||||||||||
| Basic | 168,031,412 | 165,890,258 | 166,015,238 | 177,733,503 | 174,767,795 | ||||||||||||||
| Diluted | 172,276,360 | 171,709,518 | 173,325,110 | 186,394,962 | 182,165,661 | ||||||||||||||
| Year Ended December 31, | ||||||||||||||||||||
| 2010 | 2009 | 2008 | 2007 | 2006 | ||||||||||||||||
| (In thousands, except for share and per share data) | ||||||||||||||||||||
Statement of income data: | ||||||||||||||||||||
| Revenues: | ||||||||||||||||||||
| Risk Assessment revenues | $ | 542,138 | $ | 523,976 | $ | 504,391 | $ | 485,160 | $ | 472,634 | ||||||||||
| Decision Analytics revenues | 596,205 | 503,128 | 389,159 | 317,035 | 257,499 | |||||||||||||||
| Revenues | 1,138,343 | 1,027,104 | 893,550 | 802,195 | 730,133 | |||||||||||||||
| Expenses: | ||||||||||||||||||||
| Cost of revenues | 463,473 | 491,294 | 386,897 | 357,191 | 331,804 | |||||||||||||||
| Selling, general and administrative | 166,374 | 162,604 | 131,239 | 107,576 | 100,124 | |||||||||||||||
| Year Ended December 31, | ||||||||||||||||||||
| 2010 | 2009 | 2008 | 2007 | 2006 | ||||||||||||||||
| (In thousands, except for share and per share data) | ||||||||||||||||||||
| Depreciation and amortization of fixed assets | 40,728 | 38,578 | 35,317 | 31,745 | 28,007 | |||||||||||||||
| Amortization of intangible assets | 27,398 | 32,621 | 29,555 | 33,916 | 26,854 | |||||||||||||||
| Acquisition related liabilties adjustment(1) | (544 | ) | — | — | — | — | ||||||||||||||
| Total expenses | 697,429 | 725,097 | 583,008 | 530,428 | 486,789 | |||||||||||||||
| Operating income | 440,914 | 302,007 | 310,542 | 271,767 | 243,344 | |||||||||||||||
| Other income/(expense): | ||||||||||||||||||||
| Investment income | 305 | 195 | 2,184 | 8,451 | 6,476 | |||||||||||||||
| Realized gains/(losses) on securities, net | 95 | (2,332 | ) | (2,511 | ) | 857 | (375 | ) | ||||||||||||
| Interest expense | (34,664 | ) | (35,265 | ) | (31,316 | ) | (22,928 | ) | (16,668 | ) | ||||||||||
| Total other expense, net | (34,264 | ) | (37,402 | ) | (31,643 | ) | (13,620 | ) | (10,567 | ) | ||||||||||
| Income from continuing operations before income taxes | 406,650 | 264,605 | 278,899 | 258,147 | 232,777 | |||||||||||||||
| Provision for income taxes | (164,098 | ) | (137,991 | ) | (120,671 | ) | (103,184 | ) | (91,992 | ) | ||||||||||
| Income from continuing operations | 242,552 | 126,614 | 158,228 | 154,963 | 140,785 | |||||||||||||||
| Loss from discontinued operations, net of tax(2) | — | — | — | (4,589 | ) | (1,805 | ) | |||||||||||||
| Net income | $ | 242,552 | $ | 126,614 | $ | 158,228 | $ | 150,374 | $ | 138,980 | ||||||||||
Basic net income/(loss) per share(3): | ||||||||||||||||||||
| Income from continuing operations | $ | 1.36 | $ | 0.72 | $ | 0.87 | $ | 0.77 | $ | 0.68 | ||||||||||
| Loss from discontinued operations | — | — | — | (0.02 | ) | (0.01 | ) | |||||||||||||
| Basic net income per share | $ | 1.36 | $ | 0.72 | $ | 0.87 | $ | 0.75 | $ | 0.67 | ||||||||||
Diluted net income/(loss) per share(3): | ||||||||||||||||||||
| Income from continuing operations | $ | 1.30 | $ | 0.70 | $ | 0.83 | $ | 0.74 | $ | 0.65 | ||||||||||
| Loss from discontinued operations | — | — | — | (0.02 | ) | (0.01 | ) | |||||||||||||
| Diluted net income per share | $ | 1.30 | $ | 0.70 | $ | 0.83 | $ | 0.72 | $ | 0.64 | ||||||||||
Weighted average shares outstanding(3): | ||||||||||||||||||||
| Basic | 177,733,503 | 174,767,795 | 182,885,700 | 200,846,400 | 206,548,100 | |||||||||||||||
| Diluted | 186,394,962 | 182,165,661 | 190,231,700 | 209,257,550 | 215,143,350 | |||||||||||||||
30
28
The financial operating data below sets forth the information we believe is useful for investors in evaluating our overall financial performance:performance for the years ended December 31:
| Year Ended December 31, | ||||||||||||||||||||
| 2010 | 2009 | 2008 | 2007 | 2006 | ||||||||||||||||
| (In thousands, except for share and per share data) | ||||||||||||||||||||
Other data: | ||||||||||||||||||||
| EBITDA(4): | ||||||||||||||||||||
| Risk Assessment EBITDA | $ | 268,417 | $ | 210,928 | $ | 222,706 | $ | 212,780 | $ | 202,872 | ||||||||||
| Decision Analytics EBITDA | 240,079 | 162,278 | 152,708 | 124,648 | 95,333 | |||||||||||||||
| EBITDA | $ | 508,496 | $ | 373,206 | $ | 375,414 | $ | 337,428 | $ | 298,205 | ||||||||||
The following is a reconciliation of income from continuing operations to EBITDA: | ||||||||||||||||||||
| Income from continuing operations | $ | 242,552 | $ | 126,614 | $ | 158,228 | $ | 154,963 | $ | 140,785 | ||||||||||
| Depreciation and amortization of fixed and intangible assets | 68,126 | 71,199 | 64,872 | 65,661 | 54,861 | |||||||||||||||
| Acquisition related liabilities adjustment(1) | (544 | ) | — | — | — | — | ||||||||||||||
| Investment income and realized (gains)/losses on securities, net | (400 | ) | 2,137 | 327 | (9,308 | ) | (6,101 | ) | ||||||||||||
| Interest expense | 34,664 | 35,265 | 31,316 | 22,928 | 16,668 | |||||||||||||||
| Provision for income taxes | 164,098 | 137,991 | 120,671 | 103,184 | 91,992 | |||||||||||||||
| EBITDA | $ | 508,496 | $ | 373,206 | $ | 375,414 | $ | 337,428 | $ | 298,205 | ||||||||||
| 2013 | 2012 | 2011 | 2010 | 2009 | |||||||||||||||
| (In thousands) | |||||||||||||||||||
| Other data: | |||||||||||||||||||
| EBITDA (3): | |||||||||||||||||||
| Decision Analytics EBITDA | $ | 413,342 | $ | 379,655 | $ | 305,837 | $ | 240,623 | $ | 162,278 | |||||||||
| Risk Assessment EBITDA | 346,931 | 316,260 | 287,050 | 268,817 | 208,791 | ||||||||||||||
| EBITDA | $ | 760,273 | $ | 695,915 | $ | 592,887 | $ | 509,440 | $ | 371,069 | |||||||||
| The following is a reconciliation of net income to EBITDA: | |||||||||||||||||||
| Net income | $ | 348,380 | $ | 329,142 | $ | 282,758 | $ | 242,552 | $ | 126,614 | |||||||||
| Depreciation and amortization of fixed and intangible assets from continuing operations | 129,931 | 98,844 | 73,120 | 61,037 | 62,694 | ||||||||||||||
| Interest expense from continuing operations | 76,136 | 72,508 | 53,847 | 34,664 | 35,265 | ||||||||||||||
| Provision for income taxes from continuing operations | 196,426 | 182,363 | 165,739 | 148,235 | 129,029 | ||||||||||||||
| Depreciation, amortization, interest and provision for income taxes from discontinued operations | 9,400 | 13,058 | 17,423 | 22,952 | 17,467 | ||||||||||||||
| EBITDA | $ | 760,273 | $ | 695,915 | $ | 592,887 | $ | 509,440 | $ | 371,069 | |||||||||
The following table sets forth our consolidated balance sheet data as of the years ended December 31:
| 2010 | 2009 | 2008 | 2007 | 2006 | ||||||||||||||||
Balance Sheet Data: | ||||||||||||||||||||
| Cash and cash equivalents | $ | 54,974 | $ | 71,527 | $ | 33,185 | $ | 24,049 | $ | 99,152 | ||||||||||
| Total assets | $ | 1,217,090 | $ | 996,953 | $ | 928,877 | $ | 830,041 | $ | 739,282 | ||||||||||
| Total debt(5) | $ | 839,543 | $ | 594,169 | $ | 669,754 | $ | 438,330 | $ | 448,698 | ||||||||||
| Redeemable common stock(6) | $ | — | $ | — | $ | 749,539 | $ | 1,171,188 | $ | 1,125,933 | ||||||||||
| Stockholders’ deficit(7) | $ | (114,442 | ) | $ | (34,949 | ) | $ | (1,009,823 | ) | $ | (1,203,348 | ) | $ | (1,123,977 | ) | |||||
| 2013 | 2012 | 2011 | 2010 | 2009 | |||||||||||||||
| (In thousands) | |||||||||||||||||||
| Balance Sheet Data: | |||||||||||||||||||
| Cash and cash equivalents | $ | 165,801 | $ | 89,819 | $ | 191,603 | $ | 54,974 | $ | 71,527 | |||||||||
| Total assets | $ | 2,504,451 | $ | 2,360,336 | $ | 1,541,106 | $ | 1,217,090 | $ | 996,953 | |||||||||
| Total debt (4) | $ | 1,275,887 | $ | 1,461,425 | $ | 1,105,886 | $ | 839,543 | $ | 594,169 | |||||||||
| Stockholders’ equity (deficit) (5) | $ | 547,589 | $ | 255,591 | $ | (98,490 | ) | $ | (114,442 | ) | $ | (34,949 | ) | ||||||
| (1) | During the second quarter of 2011, we reevaluated the probability of D2Hawkeye and Strategic Analytics achieving the specified predetermined EBITDA and revenue targets for exceptional performance in fiscal year 2011 and reversed the contingent consideration related to these acquisitions. During the third quarter of 2010, we reevaluated the probability of TierMed achieving the specified predetermined EBITDA and revenue targets and reversed its contingent consideration related to this acquisition. |
| (2) | As of December 31, |
| (3) | ||
29
Although EBITDA is a non-GAAP financial measure, EBITDA is frequently used by securities analysts, lenders and others in their evaluation of companies, EBITDA has limitations as an analytical tool, and should not be considered in isolation, or as a substitute for an analysis of our results of operations or cash flow from operating activities reported under GAAP. Management uses EBITDA in conjunction with traditional GAAP operating performance measures as part of its overall assessment of company performance. Some of these limitations are:
EBITDA does not reflect our cash expenditures, or future requirements for capital expenditures or contractual commitments;
31
| ▪ | ||
| Although depreciation and amortization are non-cash charges, the assets being depreciated and amortized often will have to be replaced in the future and EBITDA does not reflect any cash requirements for such replacements; and | |
| Other companies in our industry may calculate EBITDA differently than we do, limiting its usefulness as a comparative measure. Please note because EBITDA is calculated from net income, this presentation includes EBITDA from discontinued operations of our mortgage services business. |
| (4) | Includes capital lease obligations. |
| (5) | Subsequent to our corporate reorganization on October 6, 2009, share repurchases are recorded as treasury stock within stockholders’ |
| Item 7. | Management’s Discussion and Analysis of Financial Condition and Results of Operations |
The following discussion should be read in conjunction with our historical financial statements and the related notes included elsewhere in this annual report onForm 10-K, as well as the discussion under “Selected Consolidated Financial Data.” This discussion contains forward-looking statements that involve risks and uncertainties. Our actual results may differ materially from those discussed in or implied by any of the forward-looking statements as a result of various factors, including but not limited to those listed under “Risk Factors” and “Special Note Regarding Forward-Looking Statements.”
We enable risk-bearing businesses to better understand and manage their risks and opportunities associated with those risks. We provide value to our customers by supplying proprietary data that, combined with our analytic methods, creates embedded decision support solutions. We are the largest aggregator and provider of data pertaining to U.S. property and casualty, or P&C, insurance risks. We offer solutions for detecting fraud in the U.S. P&C insurance, mortgagefinancial services and healthcare industries and sophisticated methods to predict and quantify loss in diverse contexts ranging from natural catastrophes to supply chain to health insurance.
Our customers use our solutions to make better risk decisions with greater efficiency and discipline. We refer to these products and services as ‘solutions’“solutions” due to the integration among our products and the flexibility that enables our customers to purchase components or the comprehensive package of products. These solutions take various forms, including data, statistical models or tailored analytics, all designed to allow our clients to make more logical decisions. We believe our solutions for analyzing risk positively impact our customers’ revenues and help them better manage their costs.
On May 23, 2008, in contemplation of our IPO, Insurance Service Office, Inc., or ISO, formed Verisk Analytics, Inc., or Verisk, a Delaware corporation, to be the holding company for our business. Verisk was initially formed as a wholly-owned subsidiary of ISO. On October 6, 2009 in connection with our IPO, we effected a reorganization whereby ISO became a wholly-owned subsidiary of Verisk. We did not receive any proceeds from the sale of common stock in the offering.
On October 1, 2010, we completed a follow-on public offering of 21,885,092 shares of Class A common stock sold by selling stockholders.offering. We did not receive any proceeds from the sale of common stock in the offering. The primary purpose of the offering was to manage and organize the sale by Class B insurance company shareholders while providing incremental public float. Concurrently with the closing of the follow-on public offering, we repurchased 7.3 million shares of Class B common stock, for an aggregate purchase price of $192.5 million.
million, directly from selling shareholders owning Class B common stock. We converted all Class B shares to Class A shares in 2011 and currently have no outstanding Class B shares.
We organize our business in two segments: Risk Assessment and Decision Analytics. Our Risk Assessment segment provides statistical, actuarial and underwriting data for the U.S. P&C insurance industry.
32
Our Risk Assessment segment revenues represented approximately 47.6%38.7% and 51.0%41.2% of our revenues for the years ended December 31, 20102013 and 2009,2012, respectively. Effective December 31, 2012, we combined the statistical agency and data services and actuarial services into industry-standard insurance programs within our Risk Assessment segment. Our Decision Analytics segment provides solutions our customers use
30
to analyze the processes of the Verisk Risk Analysis Framework: Loss Prediction Fraud Identification andof Loss, Detection and Loss Quantification.Prevention of Fraud, and Quantification of Loss. Effective December 31, 2011, we realigned the revenue categories within our Decision Analytics segment, including fraud identification and detection solutions, loss prediction solutions and loss quantification solutions, into four vertical market-related groupings of insurance, financial services, healthcare, and specialized markets. We believe that this enhances financial reporting transparency and helps investors better understand the themes within the Decision Analytics segment. Our Decision Analytics segment revenues represented approximately 52.4%61.3% and 49.0%58.8% of our revenues for the years ended December 31, 20102013 and 2009,2012, respectively.
In January 2014, we entered into an agreement to acquire 100% of the stock of Eagleview Technology Corporation (“EVT”), the parent company of Pictometry International Corp., and Eagle View Technologies, Inc. for a net cash purchase price of $650 million, which will be funded by the Company's operating cash and borrowings from our credit facility. EVT is a provider of geo-referenced aerial image capture and visual-centric data analytics and solutions to insurers, contractors, government, and commercial customers in the United States. This acquisition is expected to advance our position in the imagery analytics market, adding new municipal and commercial customers. The transaction is expected to support the aerial imagery solution development in our Decision Analytics segment. The parties expect the transaction to close by July 2014, subject to the completion of customary closing conditions, including receipt of regulatory and shareholder approvals. Once the acquisition is completed, we plan to include EVT in the insurance vertical of our Decision Analytics segment.
In February 2014, we entered into an agreement to sell our mortgage services business. The transaction is subject to regulatory approval and other customary closing conditions and is expected to close by March 31, 2014. From 2009 to 2011, the mortgage services business was in both Risk Assessment segment within the insurance services revenue category and Decision Analytics segment in the financial services revenue category. In 2012, we reclassified the appraisal mortgage tools from Risk Assessment to our Decision Analytics segment in the financial services revenue category. Therefore, in 2012 and 2013, the mortgage services business is within Decision Analytics segment. Results of operations for the mortgage services business are reported as a discontinued operation for the year ended December 31, 2013 and for all prior periods presented. See Note 10 of our consolidated financial statements included in this Annual Report Form 10-K. As necessary, all amounts have been retroactively adjusted in all periods presented to give recognition to this discontinued operations.
Executive Summary
Key Performance Metrics
We believe our business’s ability to generate recurring revenue and positive cash flow is the key indicator of the successful execution of our business strategy. We use year over year revenue growth and EBITDA margin as metrics to measure our performance. EBITDA and EBITDA margin are non-GAAP financial measures see(see Note 43. within Item 6. Selected Financial Data included in this annual report onForm 10-K.section of Management’s Discussion and Analysis of Financial Condition and Results of Operations).
Revenue growth. We use year over year revenue growth as a key performance metric. We assess revenue growth based on our ability to generate increased revenue through increased sales to existing customers, sales to new customers, sales of new or expanded solutions to existing and new customers and strategic acquisitions of new businesses.
EBITDA margin. We use EBITDA margin as a metric to assess segment performance and scalability of our business. We assess EBITDA margin based on our ability to increase revenues while controlling expense growth.
Revenues
We earn revenues through subscriptions, long-term agreements and on a transactional basis. Subscriptions for our solutions are generally paid in advance of rendering services either quarterly or in full upon commencement of the subscription period, which is usually for one year and automatically renewed each year. As a result, the timing of our cash flows generally precedes our recognition of revenues and income and our cash flow from operations tends to be higher in the first quarter as we receive subscription payments. Examples of these arrangements include subscriptions that allow our customers to access our standardized coverage language, our claims fraud solutiondatabase or our actuarial services throughout the subscription period. In general, we experience minimal revenue seasonality within the business. Our long-term agreements are generally for periods of three to sevenfive years. We recognize revenue from subscriptions ratably over the term of the subscription and most long-term agreements are recognized ratably over the term of the agreement.
Certain of our solutions are also paid for by our customers on a transactional basis. For example, we have solutions that allow our customers to access fraud detection tools in the context of an individual mortgage application or loan, obtain property-specific rating and underwriting information to price a policy on a commercial building, or compare a P&C insurance, medical or workers’ compensation claim with information in our databases. For the years ended December 31, 20102013 and 2009, 30.2%2012, 26.4% and 29.0%27.6% of our revenues, respectively, were derived from providing transactional solutions.
31
We earn transactional revenues as our solutions are delivered or services performed. In general, transactions are billed monthly at the end of each month.
Approximately 84.0%88.2% and 83.8%87.1% of the revenues in our Risk Assessment segment for the years ended December 31, 20102013 and 2009,2012, respectively, were derived from subscriptions and long-term agreements for our solutions. Our customers in this segment include most of the P&C insurance providers in the United States. Approximately 56.8%64.4% and 57.7%62.1% of the revenues in our Decision Analytics segment, for the years ended December 31, 20102013 and 2009,2012, respectively, were derived from subscriptions and long-term agreements for our solutions.
33
Principal Operating Costs and Expenses
Personnel expenses are the major component of both our cost of revenues and selling, general and administrative expenses. Personnel expenses, which represented 59.7% and 62.6% of our total expenses for the years ended December 31, 2013 and 2012, respectively include salaries, benefits, incentive compensation, equity compensation costs, (described under “Equity Compensation Costs” below), sales commissions, employment taxes, recruiting costs, and outsourced temporary agency costs, which represented 65.4% and 67.6% of our total expenses for the years ended December 31, 2010 and 2009, respectively. The higher percentage of personnel expenses in 2009 is primarily related to the accelerated ESOP allocation that occurred prior to our initial IPO. The accelerated ESOP allocation resulted in a one time, non-cash charge of $57.7 million. Excluding this accelerated ESOP allocation, personnel expenses represented 64.8% of our total expenses for the year ended December 31, 2009.
costs.
We allocate personnel expenses between two categories, cost of revenues and selling, general and administrative costs, based on the actual costs associated with each employee. We categorize employees who maintain our solutions as cost of revenues, and all other personnel, including executive managers, sales people, marketing, business development, finance, legal, human resources, and administrative services, as selling, general and administrative expenses. A significant portion of our other operating costs, such as facilities and communications, are also either captured within cost of revenues or selling, general and administrative expense based on the nature of the work being performed.
While we expect to grow our headcount over time to take advantage of our market opportunities, we believe that the economies of scale in our operating model will allow us to grow our personnel expenses at a lower rate than revenues. Historically, our EBITDA margin has improved because we have been able to increase revenues without a proportionate corresponding increase in expenses. However, part of our corporate strategy is to invest in new solutions which may offset margin expansion.
Cost of Revenues. Our cost of revenues consists primarily of personnel expenses. Cost of revenues also includes the expenses associated with the acquisition and verification of data, the maintenance of our existing solutions and the development and enhancement of our next-generation solutions. Our cost of revenues excludes depreciation and amortization.
Selling, General and Administrative Expense. Our selling, general and administrative expense also consists primarily of personnel costs. A portion of the other operating costs such as facilities, insurance and communications are also allocated to selling, general and administrative costs based on the nature of the work being performed by the employee. Our selling, general and administrative expenses excludes depreciation and amortization.
Trends Affecting Our Business
We serve customers in three primary vertical markets: property/casualty insurance, healthcare, and financial services. The industry trends in each of those markets can affect our business.
Growth in property/casualty insurers’ direct written premiums is cyclical, with total industry premium growth receding from a peak of 14.7% in 2002 to a trough of negative 3.1% in 2009 and subsequently recovering to 4.4% in 2012 and 4.1% through nine-months 2013. Based on reports of firming in insurance markets, and assuming modest growth in the economy, we expect premium growth near recent rates through 2014. Growth or decline in premiums for the lines of insurance for which we perform services could positively or negatively affect our revenues, because premium growth can affect the volume of solutions as well as the number and types of solutions our customers buy. Also, we link the invoices of certain solutions in part to an individual customer’s premiums from prior years for a portion of our customers. The pricing for those solutions is fixed at the beginning of each calendar year. We have also signed multiyear contracts with certain customers, and for those customers, pricing is fixed at the beginning of each multiyear period.
Trends in catastrophe and noncatastrophe weather losses can have an effect on our customers’ profitability and therefore their appetite for buying analytics to help them manage their risks. The apparent increase in the frequency and severity of weather events that cause losses for insurers could lead to increased demand for our catastrophe modeling, catastrophe loss information, and repair cost solutions. A significant decrease in the number or severity of catastrophes could negatively affect our revenues. We also have a portion of our revenue related to the number of claims processed due to losses which can be impacted by seasonal storm activity.
The need by our customers to fight insurance fraud — both in claims and at policy inception — could lead to increased demand for our underwriting and claims solutions. Additionally, a significant change in insurers’ profitability could positively or negatively affect demand for our solutions.
32
Trends in the U.S. healthcare market can affect a portion of our revenues in the Decision Analytics segment. That market is undergoing significant change as the result of healthcare reform legislation. The specific trends we see affecting our current healthcare business include payment reform, expansion of insurance coverage, and efforts at cost containment. Payment reform will likely drive the market to value-based reimbursement and require healthcare providers to bear increased financial risk and responsibility for quality outcomes. The expansion of insurance eligibility will increase Medicaid rolls and promote participation in statewide health exchanges. And as the government seeks to control fraud, waste, and abuse, efforts to contain costs will likely become more prevalent. Although such changes have the potential to disrupt the healthcare marketplace, we believe the requirements for reform could increase demand for our analytic solutions in the areas of population management, quality measurement, Medicare Advantage revenue management and compliance, risk adjustment, and detection of prepayment fraud and abuse. We experience seasonality in our Medicare Advantage business tied to third and fourth quarters of our fiscal year, related to CMS deadlines.
Description of Acquisitions
We have acquired six businesses since January 1, 2009.2011. As a result of these acquisitions, our consolidated results of operations may not be comparable between periods. The acquisitions noted below are all integrated within our Decision Analytics segment.
On December 16, 2010,20, 2012, we acquired 100%the net assets of Insurance Risk Management Solutions, or IRMS. IRMS provided integrated property risk assessment technology underlying one of our GIS (geographic information system) underwriting solutions. At the end of 2012, this long-term contract (since 1992) with IRMS was expiring and precipitated a change in our business relationship. Instead of continuing forward with a new services agreement, we acquired the technology and service assets of IRMS as this will enable us to better manage, enhance and continue to use the solutions as part of our Risk Assessment segment. This acquisition had minimal revenue and operating expense impact for the year ending December 31, 2012, given the timing of the common stock of 3E Company, or 3E, a global source for a comprehensive suite of environmental health and safety compliance solutions for a net cash purchase price of approximately $107.3 million, of which $7.7 million was used to fund indemnity escrows. We are still evaluating the allocation of purchase price. Within our Decision Analytics segment, 3E overlaps the customer sets served by our other supply chain risk management solutions and helps our customers across a variety of vertical markets address their environmental health and safety issues.acquisition. See Note 109. to our consolidated financial statements included in this annual report onForm 10-K for the preliminary purchase allocation.
On December 14, 2010,August 31, 2012, we acquired 100% of the common stock of Crowe ParadisArgus Information & Advisory Services, Corporation,LLC, or CP,Argus, a leading provider of claims analysisinformation, competitive benchmarking, scoring solutions, analytics, and compliancecustomized services to financial institutions and regulators in North America, Latin America, and Europe. Argus leverages its comprehensive payment data sets and provides proprietary solutions for the property/casualtyto a client base that includes credit and debit card issuers, retail banks and other consumer financial services providers, payment processors, insurance companies, and other industry for a net cash purchase price of approximately $90.3 million, of which $6.8 million was used to fund indemnity escrows. We are still evaluating the allocation of purchase price.stakeholders. Within our Decision Analytics segment, CP offersthis acquisition enhances our position as a provider of data, analytics, and decision-support solutions for complying with the Medicare Secondary Payer (MSP) Act, provides services to many of the largest worker’s compensation insurers, third-party administrators (TPAs),
34
On February 26, 2010,July 2, 2012, we acquired 100%the net assets of the common stock of Strategic Analytics, Inc.,Aspect Loss Prevention, LLC, or SA,ALP, a privately owned provider of credit riskloss prevention and capital managementanalytic solutions to consumerthe retail, entertainment, and mortgage lenders, for a net cash purchase price of $7.9 million of which $1.5 million was used to fund indemnity escrows.food industries. Within our Decision Analytics segment, SA’s solutionsthis acquisition further advances our position as a provider of data, crime analytics, and application set will allow our customers to take advantage ofstate-of-the-art loss forecasting, stress testing, and economic capital requirement tools to better understand and forecast the risk associated within their credit portfolios.decision-support solutions. See Note 109. to our consolidated financial statements included in this annual report onForm 10-K for the preliminary purchase allocation.
On OctoberMarch 30, 2009, we acquired the net assets of Enabl-u Technology Corporation, Inc, or Enabl-u, a privately owned provider of data management, training and communication solutions to companies with regional, national or global work forces. We believe this acquisition will enhance our ability to provide solutions for customers to measure loss prevention and improve asset management through the use of software and software services.
35
| Year Ended December 31, | ||||||||||||
| 2010 | 2009 | 2008 | ||||||||||
| (In thousands) | ||||||||||||
ESOP costs by contribution type: | ||||||||||||
| 401(k) matching contribution expense | $ | 9,932 | $ | 7,604 | $ | 8,570 | ||||||
| Profit sharing contribution expense | 1,641 | 1,139 | 1,141 | |||||||||
| ESOP allocation expense | — | 67,322 | 12,563 | |||||||||
| Total ESOP cost | $ | 11,573 | $ | 76,065 | $ | 22,274 | ||||||
ESOP costs by segment: | ||||||||||||
| Risk Assessment ESOP costs | $ | 6,861 | $ | 43,641 | $ | 14,055 | ||||||
| Decision Analytics ESOP costs | 4,712 | 32,424 | 8,219 | |||||||||
| Total ESOP cost | $ | 11,573 | $ | 76,065 | $ | 22,274 | ||||||
On June 17, 2011, we acquired the net assets of Health Risk Partners, LLC, or HRP, a provider of solutions to optimize revenue, improve compliance and improve quality of care for Medicare Advantage health plans. Within our Decision Analytics segment, this acquisition further advances our position as a major provider of data, analytics, and decision-support solutions to the healthcare industry.
Description of Discontinued Operations
In February 2014, we entered into an agreement to sell our mortgage services business, Interthinx, for a price of $155.0 million. The transaction is subject to regulatory approval and other customary closing conditions and is expected to close by March 31, 2014. Results of operations for the elimination of accumulated deficit of $440.6 million, an increase of $0.1 million to Class A common stock at par value, an increase of $624.3 million to additionalpaid-in-capital,mortgage services business are reported as a discontinued operation for the year ended December 31, 2013 and a reclassification of the ISO Class A unearned common stock shares balance within the ISO 401(k) Savings and Employee Stock Ownership Plan, or KSOP, of $1.3 million to unearned KSOP contributions.for all prior periods presented. See Note 14 in10. of our consolidated financial statements included in this annual report onAnnual Report Form 10-K.
33
Year Ended December 31, 20102013 Compared to Year Ended December 31, 20092012
Consolidated Results of Continuing Operations
Revenues
Revenues were $1,138.3$1,595.7 million for the year ended December 31, 20102013 compared to $1,027.1$1,407.8 million for the year ended December 31, 2009,2012, an increase of $111.2$187.9 million or 10.8%13.3%. In 2010 and the latter half of 2009,2012, we acquired five companies, TierMed, Enabl-u, Strategic Analytics, CP,MediConnect, ALP, and 3E,Argus, collectively referred to as recent acquisitions, which we define as acquisitions not owned for a significant portion of both the current periodand/or prior period and would therefore impact the comparability of the financial results. RecentMediConnect was included as a recent acquisition only for the first quarter of 2013; ALP was included as a recent acquisition in the first and second quarters of 2013; Argus was included as a recent acquisition in the first, second and third quarters of 2013 as full quarter comparable revenues did not exist until certain quarters of 2012 due to the timing of the acquisitions.
These recent acquisitions were within our Decision Analytics segment and provided an increase of $10.5$68.1 million in revenues for the year ended December 31, 2010.2013. Excluding recent acquisitions, revenues increased $100.7$119.8 million or 8.5%, which included an increase in our Decision Analytics segment of $81.0 million or 9.8% and an increase in our Risk Assessment segment of $18.1$38.8 million and an increaseor 6.7%. Revenue growth within Decision Analytics was primarily driven by increases in our Decision Analytics segment of $82.6 million.healthcare revenue category and contributions from our insurance revenue category. Both categories, industry-standard insurance programs and property-specific rating and underwriting information, within Risk Assessment contributed to its revenue growth. Refer to the Results of Continuing Operations by Segment within this section for further information regarding our revenues.
Cost of Revenues
Cost of revenues was $463.5$622.5 million for the year ended December 31, 20102013 compared to $491.3$516.7 million for the year ended December 31, 2009, a decrease2012, an increase of $27.8$105.8 million or 5.7%20.5% . This decrease was primarily due toRecent acquisitions all within the accelerated ESOP allocation that occurredDecision Analytics segment, accounted for an increase of $36.8 million in 2009, which resulted in the elimination of substantially all future ESOP allocation expense. In 2010 and 2009, our ESOP allocation expense for the year was $0.0 million and $51.9 million, respectively. The reduction in our cost of revenues was offset by recent acquisitions, which provided an increase of $6.4 million in cost for the year ended December 31, 2010.2013 which were primarily related to salaries and employee benefits. Excluding the impact of the accelerated ESOP allocation in 2009 and the cost associated with our recent acquisitions, our cost of revenues increased $17.7$69.0 million or 4.0%13.4%. The increase was primarily due to increases in salaries and employee benefits cost of $16.9 million; $4.1$36.6 million. Other increases include data costs and data processing fees of $17.7 million, information technology expense of data$7.4 million, travel and consultantstravel related costs incurred in connection with the growth in ourproperty-specific rating and underwriting information, and fraud identification and detection solutions;of $3.2 million and other general expensesoperating costs of $0.3$4.1 million. These increases in costs were partially offset by a $2.7 million increase in state employment tax credit and a reduction in office maintenance expense of $0.9 million.
Selling, General and Administrative Expenses
Selling, general and administrative expenses, or SGA, were $166.4$229.0 million for the year ended December 31, 20102013 compared to $162.6$220.1 million for the year ended December 31, 2009,2012, an increase of $8.9 million or 4.1%. Recent acquisitions accounted for an increase of $3.8 million, or 2.3%.which was primarily related to professional fees. Excluding the impact of the accelerated ESOP allocation in 2009 of $15.4 million and costs associated with our recent acquisitions, of $4.8 million, SGA increased $14.4$5.1 million or 9.8%2.3%. The increase was primarily due to an increase in professional fees of $3.0 million, travel and travel related items of $0.8 million, salaries and employee benefits of $14.4 million, which includes annual salary increases, medical costs, commissions, and long-term incentive plan. Other increases were costs related to advertising and marketing of $2.5$0.7 million, and other general and administrative expenses of $2.1$0.6 million. These
The increase in salaries and benefits of $0.7 million includes an increase of $5.1 million in annual salaries increases, were partiallymedical costs and commissions, offset by a decrease in legal costsour stock option expense of $4.1 million. Our stock option expense decreased as a result of lower accelerated vesting of equity awards granted to employees at age 62. Other decreases include a decrease in pension expense of $0.3 million, primarily relateddue to our IPO in 2009 of $2.8 million and a reduction in pension cost of $1.8 million.plan freeze.
37
Depreciation and Amortization of Fixed Assets
Depreciation and amortization of fixed assets was $40.7$66.2 million for the year ended December 31, 20102013 compared to $38.6$46.6 million for the year ended December 31, 2009,2012, an increase of $2.1$19.6 million or 5.6%41.9%. Depreciation and amortization of fixed assets includes depreciation of furniture and equipment, software, computer hardware, and related equipment. The majority of the increase relates to software and hardware costs to support data capacity expansion and revenue growth.
34
Amortization of Intangible Assets
Amortization of intangible assets was $27.4$63.7 million for the year ended December 31, 20102013 compared to $32.6$52.2 million for the year ended December 31, 2009, a decrease2012, an increase of $5.2$11.5 million or 16.0%22.1%. This decreaseThe increase was primarily related to a decreaseamortization of $6.3intangible assets associated with recent acquisitions of $16.0 million, partially offset by $4.5 million of amortization of intangible assets associated with prior acquisitions that have been fully amortized;amortized.
Investment Income and Realized (Loss) Gain on Securities, Net
Investment income and realized gain on securities, net, was a gain of $0.6 million for the year ended December 31, 2013 as compared to a gain of $0.1 million for the year ended December 31, 2012, an increase of $0.5 million.
Interest Expense
Interest expense was $76.1 million for the year ended December 31, 2013 compared to $72.5 million for the year ended December 31, 2012, an increase of $3.6 million or 5.0%. This increase is primarily due to the issuance of our senior notes in September 2012 with an aggregate principal balance of $350.0 million, partially offset by $1.1the repayment of $180.0 million of amortizationprivate placement debt during the year.
Provision for Income Taxes
The provision for income taxes was $196.4 million for the year ended December 31, 2013 compared to $182.4 million for the year ended December 31, 2012, an increase of intangible assets associated with$14.0 million or 7.7%. The effective tax rate was 36.5% for the year ended December 31, 2013 compared to 36.5% for the year ended December 31, 2012.
EBITDA Margin
The EBITDA margin for our consolidated results including discontinued operations, was 44.6% for the year ended December 31, 2013 compared to 45.4% for the year ended December 31, 2012. For the year ended December 31, 2013, the recent acquisitions.acquisitions mitigated our margin expansion by 0.2%.
Results of Continuing Operations by Segment
Decision Analytics
Our revenue by category for the periods presented is set forth below for the years ended December 31:
| 2013 | 2012 | Percentage Change | ||||||||
| (In thousands) | ||||||||||
| Insurance | $ | 539,150 | $ | 493,456 | 9.3 | % | ||||
| Financial services | 81,113 | 26,567 | 205.3 | % | ||||||
| Healthcare | 271,538 | 222,955 | 21.8 | % | ||||||
| Specialized markets | 85,626 | 85,364 | 0.3 | % | ||||||
| Total Decision Analytics | $ | 977,427 | $ | 828,342 | 18.0 | % | ||||
Our insurance revenue increased $45.7 million or 9.3%, and excluding recent acquisitions (ALP) revenue of $1.2 million for the first and second quarters within this category, our insurance revenue increased $44.5 million or 9.0%, primarily due to an increase within our underwriting solutions, an increase in catastrophe modeling services for existing customers, as comparedwell an increase in insurance fraud solutions revenue, and an increase in loss quantification solutions.
35
Our financial services revenue increased $54.5 million or 205.3%, and excluding recent acquisitions (Argus) revenue of $50.1 million for the first, second and third quarters within this category, our financial services revenue increased $4.4 million or 20.2%. This financial services revenue reflects Argus' increased solutions which became part of organic revenue in the fourth quarter.
Our healthcare revenue increased $48.6 million or 21.8%, and excluding the recent acquisitions ( MediConnect) revenue for the first quarter of $16.8 million within this category, our healthcare revenue increased $31.8 million or 14.3% primarily due to an increase in transactions within our revenue and quality intelligence solutions and due to an increase in payment accuracy solutions as customer contracts were implemented.
Our specialized markets revenue increased $0.3 million or 0.3% as a lossresult of $2.1modest increase in our supply chain services, offset by a decrease in weather and climate risk solutions.
Cost of Revenues
Cost of revenues for our Decision Analytics segment was $428.0 million for the year ended December 31, 2009, an increase of $2.5 million.
Selling, General and Administrative Expenses
Selling, general and administrative expenses for our Decision Analytics segment were $151.6 million for the year ended December 31, 2009, a decrease of $0.6 million or 1.7%. This decrease was primarily due to reduced interest costs as a result of a decrease in average debt outstanding of approximately $605 million in 20102013 compared to approximately $650 million in 2009, coupled with a decrease in our interest rate on borrowings from our syndicated revolving credit facility from LIBOR plus 2.50% to LIBOR plus 1.75%. The decrease in borrowing rate was the result of an amendment to the facility on September 10, 2010. These reductions were partially offset by an increase in the amortization of debt issuance costs related to the syndicated credit facility, which had been entered into in July of 2009.
EBITDA Margin
The EBITDA margin for our Decision Analytics segment including our discontinued operations, was 38.0% for the year ended December 31, 2009, an increase of $26.1 million or 18.9%. The effective tax rate was 40.4%2013 and 39.8% for the year ended December 31, 2010 compared to 52.2% for2012. For the year ended December 31, 2009. The effective rate for2013, the year ended December 31, 2010 was lower due to a decrease in nondeductible expenses in 2010 versus 2009 related to the KSOP.recent acquisitions mitigated our margin expansion by 0.2%.
Risk Assessment
38
Risk Assessment
Our revenue by category for the periods presented is set forth below:below for the years ended December 31:
| Year Ended | ||||||||||||
| December 31, | Percentage | |||||||||||
| 2010 | 2009 | Change | ||||||||||
| (In thousands) | ||||||||||||
| Industry-standard insurance programs | $ | 353,501 | $ | 341,079 | 3.6 | % | ||||||
| Property-specific rating and underwriting information | 137,071 | 132,027 | 3.8 | % | ||||||||
| Statistical agency and data services | 29,357 | 28,619 | 2.6 | % | ||||||||
| Actuarial services | 22,209 | 22,251 | (0.2 | )% | ||||||||
| Total Risk Assessment | $ | 542,138 | $ | 523,976 | 3.5 | % | ||||||
| 2013 | 2012 | Percentage Change | ||||||||
| (In thousands) | ||||||||||
| Industry-standard insurance programs | $ | 471,130 | $ | 450,646 | 4.5 | % | ||||
| Property-specific rating and underwriting information | 147,146 | 128,860 | 14.2 | % | ||||||
| Total Risk Assessment | $ | 618,276 | $ | 579,506 | 6.7 | % | ||||
36
Cost of Revenues
Cost of revenues for our Risk Assessment segment was $194.7$194.5 million for the year ended December 31, 20102013 compared to $230.5$182.4 million for the year ended December 31, 2009, a decrease of $35.8 million or 15.5%. Excluding the impact of the accelerated ESOP allocation in 2009 of $29.7 million, our cost of revenues decreased by $6.1 million or 3.0%. This decrease was primarily due to decrease in salaries and employee benefits costs of $3.1 million, a $2.2 million increase in state employment tax credit, office maintenance expense of $1.1 million and $0.7 million of other general expenses. These decreases were partially offset by an increase in data and consultant costs of $1.0 million incurred primarily in connection with the revenues from our property-specific rating and underwriting information solutions.
39
| Year Ended | ||||||||||||
| December 31, | Percentage | |||||||||||
| 2010 | 2009 | Change | ||||||||||
| (In thousands) | ||||||||||||
| Fraud identification and detection solutions | $ | 320,781 | $ | 273,103 | 17.5 | % | ||||||
| Loss prediction solutions | 158,406 | 137,328 | 15.4 | % | ||||||||
| Loss quantification solutions | 117,018 | 92,697 | 26.2 | % | ||||||||
| Total Decision Analytics | $ | 596,205 | $ | 503,128 | 18.5 | % | ||||||
40
41
Selling, General and Administrative Expenses
Selling, general and administrative expenses for our Risk Assessment segment were $77.4 million for the year ended December 31, 2013 compared to $80.9 million for the year ended December 31, 2012, a decrease of $3.5 million or 4.4%. The decrease was primarily due to a decrease in salaries and employee benefits of $6.2 million, primarily related our stock option expense. Our stock option expense decreased as a result of lower accelerated vesting of equity awards granted to employees at age 62. There was also a decrease in other general expenses of $0.2 million. These decreases were offset by an increase in professional consulting fees of $2.5 million and travel costs of $0.4 million.
EBITDA Margin
The EBITDA margin for our Risk Assessment segment was 56.1% for the year ended December 31, 2013 compared to 54.6% for the year ended December 31, 2012. The increase in margin is primarily attributed to operating leverage in the segment as well as cost efficiencies.
Year Ended December 31, 2012 Compared to Year Ended December 31, 2011
Consolidated Results of Continuing Operations
Revenues
Revenues were $1,407.8 million for the year ended December 31, 2012 compared to $1,191.4 million for the year ended December 31, 2011, an increase of $216.4 million or 18.2%. In 2011 and 2012, we acquired the following companies Bloodhound, HRP, MediConnect, ALP, and Argus, collectively referred to as recent acquisitions, which we define as acquisitions not owned for a significant portion of both the current period and/or prior period and would therefore impact the comparability of the financial results. Bloodhound and HRP were included as recent acquisitions only for the first and second quarters of 2012 and 2011 as full quarter comparable revenues did not exist until the third quarter of 2012 due to the timing of the acquisitions.
These recent acquisitions were within our Decision Analytics segment and provided an increase of $105.1 million in revenues for the year ended December 31, 2012. Excluding recent acquisitions, revenues increased $111.3 million or 9.3%, which included an increase in our Decision Analytics segment of $84.1 million or 13.2% and an increase in our Risk Assessment segment of $27.2 million or 4.9%. Revenue growth within Decision Analytics was primarily driven by strong increases in our healthcare revenue category and contributions from our insurance revenue category. Revenue growth within Risk Assessment was primarily driven by our industry-standard insurance programs. Refer to the Results of Continuing Operations by Segment within this section for further information regarding our revenues.
Cost of Revenues
Cost of revenues was $516.7 million for the year ended December 31, 2012 compared to $441.0 million for the year ended December 31, 2011, an increase of $75.7 million or 17.2%. Recent acquisitions, all within the Decision Analytics segment, accounted for an increase of $51.5 million in cost of revenues for the year ended December 31, 2012, which were primarily related to salaries and employee benefits. Excluding the impact of our recent acquisitions, our cost of revenues increased $24.2 million or 5.5%. The increase was primarily due to increases in salaries and employee benefits cost of $16.8 million. Other increases include information technology expense of $3.3 million, data costs of $3.0 million, travel and travel related costs of $0.4 million, rent expense of $0.4 million and other operating costs of $0.3 million.
The increase in salaries and employee benefits of $16.8 million includes an increase of $27.1 million in annual salaries and employee benefits such as medical costs and equity incentive plans, and was partially offset by a decrease of $10.3 million in pension costs. The pension cost decreased primarily due to our pension plan freeze in 2012, which includeeliminated all future compensation and services credits to participants of our pension plan.
37
Selling, General and Administrative Expenses
Selling, general and administrative expenses, or SGA, were $220.1 million for the year ended December 31, 2012 compared to $199.5 million for the year ended December 31, 2011, an increase of $20.6 million or 10.3%. Recent acquisitions accounted for an increase of $11.1 million, which was primarily related to salaries and employee benefits. Excluding costs associated with our recent acquisitions, SGA increased $9.5 million or 4.8%. The increase was primarily due to an increase in salaries and employee benefits of $7.3 million, cost related to travel and travel related items of $0.4 million, professional fees of $0.4 million and other general expenses of $1.4 million.
The increase in salaries and benefits of $7.3 million includes an increase of $10.0 million in annual salarysalaries increases, medical costs, commissions, and pension costs across a relatively constant employee headcount. Pension costs represent $3.1 million of the increases in salaries and employee benefit costs due to the decline in the market values of pension investments as a result of the global economic downturn in 2008. Other increases were attributed to other general expenses of $0.9 million. These increases were partiallylong term equity compensation plan costs. This was offset by a decrease of $2.7 million in legal costs of $3.8 million and an insurancepension cost, recovery of $2.0 million.primarily due to our pension plan freeze.
Depreciation and Amortization of Fixed Assets
Depreciation and amortization of fixed assets was $38.6$46.6 million for the year ended December 31, 20092012 compared to $35.3$40.1 million for the year ended December 31, 2008,2011, an increase of $3.3$6.5 million or 9.2%16.2%. Depreciation and amortization of fixed assets includes depreciation of furniture and equipment, software, computer hardware, and related equipment. The majority of the increase relates to software and hardware costs to support data capacity expansion and revenue growth.
Amortization of Intangible Assets
Amortization of intangible assets was $32.6$52.2 million for the year ended December 31, 2012 compared to $33.0 million for the year ended December 31, 20111, an increase of $19.2 million or 58.2%. The increase was primarily related to amortization of intangible assets associated with recent acquisitions of $22.1 million, partially offset by $2.9 million of amortization of intangible assets associated with prior acquisitions that have been fully amortized.
Acquisition Related Liabilities Adjustment
There was no acquisition related liabilities adjustment for the year ended December 31, 2012 compared to $3.4 million for the year ended December 31, 2011. This benefit was a result of a reduction of $3.4 million to contingent consideration due to the reduced probability of the D2 and SA acquisitions achieving the EBITDA and revenue earnout targets for exceptional performance in fiscal year 2011 established at the time of acquisition.
Investment Income and Realized (Loss) Gain on Securities, Net
Investment income and realized gain on securities, net, was a gain of $0.1 million for the year ended December 31, 2012 as compared to a gain of $0.9 million for the year ended December 31, 2011, a decrease of $0.8 million.
Interest Expense
Interest expense was $72.5 million for the year ended December 31, 2012 compared to $53.8 million for the year ended December 31, 2009 compared to $29.6 million for the year ended December 31, 2008,2011, an increase of $3.0$18.7 million or 10.4%. The increase is the result of the amortization of intangibles from our new acquisitions, partially offset by certain intangible assets having been fully amortized in 2008. We amortize intangible assets obtained through acquisitions over the periods that we expect to derive benefit from such assets.
Provision for Income Taxes
The provision for income taxes was $138.0$182.4 million for the year ended December 31, 2012 compared to $165.7 million for the year ended December 31, 2011, an increase of $16.7 million or 10.0%. The effective tax rate was 36.5% for the year ended December 31, 2012 compared to 38.7% for the year ended December 31, 2011. The effective rate for the year ended December 31, 2009 compared to $120.7 million for the year ended December 31, 2008, an increase of $17.3 million or 14.4%. The effective tax rate2012 was 52.2% for the year ended December 31, 2009 compared to 43.3% for the year ended December 31, 2008. The 2009 rate is higherlower due to benefits resulting from the successful execution of tax planning strategies, in which a portion was a non-recurring non-cash costs associated with the accelerated ESOP allocation and certain IPO related costs that are not tax deductible.benefit.
EBITDA Margin
The EBITDA margin for our consolidated results including discontinued operations, was 36.3%45.4% for the year ended December 31, 2012 compared to 44.5% for the year ended December 31, 2009 compared2011. For the year ended December 31, 2012, the recent acquisitions mitigated our margin expansion by 0.5%. The increase in margin is primarily attributed to 42.0% foroperating leverage as well as cost efficiencies achieved in 2012. For the year ended December 31, 2008. Included in2011, the calculation ofacquisition related liability adjustment positively impacted our EBITDA margin for the year ended December 31, 2009 are non-recurring, non-cash costsby 0.2%.
38
Results of $57.7 million associated with the
42
Decision Analytics
Revenues for our Risk AssessmentDecision Analytics segment were $524.0$828.3 million for the year ended December 31, 20092012 compared to $504.4$639.1 million for the year ended December 31, 2008,2011, an increase of $19.6$189.2 million or 3.9%29.6%. Recent acquisitions accounted for an increase of $105.1 million in revenues for the year ended December 31, 2012. Excluding recent acquisitions, our Decision Analytics revenue increased $84.1 million or 13.2%.
| 2012 | 2011 | Percentage Change | ||||||||
| (In thousands) | ||||||||||
| Insurance | $ | 493,456 | $ | 451,216 | 9.4 | % | ||||
| Financial services | 26,567 | 5,323 | 399.1 | % | ||||||
| Healthcare | 222,955 | 103,722 | 115.0 | % | ||||||
| Specialized markets | 85,364 | 78,839 | 8.3 | % | ||||||
| Total Decision Analytics | $ | 828,342 | $ | 639,100 | 29.6 | % | ||||
Our insurance revenue increased $42.2 million or 9.4%, and excluding recent acquisitions (ALP) revenue of $0.8 million within this category, our insurance revenue increased $41.4 million or 9.2%, primarily due to an increase within our loss quantification solutions as a result of new customers and an increase in our catastrophe modeling services for existing customers, as well an increase in insurance fraud solutions revenue.
Our financial services revenue increased $21.3 million or 399.1%, and excluding recent acquisitions (Argus) revenue of $21.5 million within this category, our financial services revenue decreased $0.2 million or 3.8%.
Our healthcare revenue increased $119.2 million or 115.0%, and excluding recent acquisitions (Bloodhound, HRP and MediConnect) revenue of $82.8 million within this category, our healthcare revenue increased $36.4 million or 36.2% primarily due to an increase in transactions within our revenue integrity solutions and due to increase fraud services as customer contracts were implemented.
Our specialized markets revenue increased $6.5 million or 8.3% as a result of continued penetration of existing customers within our supply chain services and weather and climate risk solutions.
Cost of Revenues
Cost of revenues for our Decision Analytics segment was $334.3 million for the year ended December 31, 2012 compared to $254.0 million for the year ended December 31, 2011, an increase of $80.3 million or 31.6%. Excluding the impact of recent acquisitions of $51.5 million, our cost of revenues increased by $28.8 million or 11.4%. This increase is primarily due to a net increase in salary and employee benefits of $20.3 million. Other increases include information data costs of $4.1 million, information technology expenses of $3.2 million, travel and travel related costs of $0.7 million, rent expenses of $0.4 million and other general expenses of $0.1 million.
The increase in salaries and employee benefits of $20.3 million includes an increase of $21.9 million in annual salaries and employee benefits, medical costs, and long term equity compensation plan costs, and due to the reallocation of certain resources from Risk Assessment relating to property appraisal tools that began January 2012. These increases were partially offset by a decrease of $1.6 million in pension cost primarily because of our pension plan freeze.
Selling, General and Administrative Expenses
Selling, general and administrative expenses for our Decision Analytics segment were $139.2 million for the year ended December 31, 2012 compared to $117.2 million for the year ended December 31, 2011, an increase of $22.0 million or 18.7%. Excluding the impact of recent acquisitions of $11.1 million, SGA increased $10.9 million or 9.5%. The increase was primarily due to an increase in the salessalaries and employee benefits of our industry-standard insurance programs$9.3 million, costs related to travel expenses of $0.4 million, and property-specific rating and underwriting information. professional fees of $1.8 million. These increases were offset by a decrease in other general expenses of $0.6 million.
39
The increase in salaries and employee benefits of $9.3 million includes an increase of $10.0 million in annual salaries and employee benefits, medical costs, commissions, and long term equity compensation plan costs, and was partially offset by a decrease of $0.7 million in pension cost, primarily due to our industry-standard insurance programspension plan freeze.
EBITDA Margin
The EBITDA margin for our Decision Analytics segment including our discontinued operations, was 39.8% for the years ended December 31, 2012 and 2011. For the year ended December 31, 2012, the recent acquisitions mitigated our margin expansion by 0.1%. For the year ended December 31, 2011, the acquisition related liability adjustment positively impacted our EBITDA margin by 0.4%.
Risk Assessment
Revenues
Revenues for our Risk Assessment segment were $579.5 million for the year ended December 31, 2012 as compared to $552.3 million for the year ended December 31, 2011, an increase of $27.2 million or 4.9%. The overall increase within this segment primarily resulted from an increase in prices derived from continued enhancements to the content of our industry-standard insurance programs’ solutions and the addition of newas well as selling expanded solutions to existing customers. The increase in our property-specific rating and underwriting information is particularly due to sales of our rate making and policy administration solutions.
Our revenue by category for the periods presented is set forth below:below for the years ended December 31:
| Year Ended | ||||||||||||
| December 31, | Percentage | |||||||||||
| 2009 | 2008 | Change | ||||||||||
| (In thousands) | ||||||||||||
Industry-standard insurance programs | $ | 341,079 | $ | 329,858 | 3.4 | % | ||||||
| Property-specific rating and underwriting information | 132,027 | 125,835 | 4.9 | % | ||||||||
| Statistical agency and data services | 28,619 | 27,451 | 4.3 | % | ||||||||
| Actuarial services | 22,251 | 21,247 | 4.7 | % | ||||||||
| Total Risk Assessment | $ | 523,976 | $ | 504,391 | 3.9 | % | ||||||
| 2012 | 2011 | Percentage Change | ||||||||
| (In thousands) | ||||||||||
| Industry-standard insurance programs | $ | 450,646 | $ | 426,228 | 5.7 | % | ||||
| Property-specific rating and underwriting information | 128,860 | 126,065 | 2.2 | % | ||||||
| Total Risk Assessment | $ | 579,506 | $ | 552,293 | 4.9 | % | ||||
Cost of Revenues
Cost of revenues for our Risk Assessment segment was $230.5$182.4 million for the year ended December 31, 20092012 compared to $199.9$187.0 million for the year ended December 31, 2008, an increase2011, a decrease of $30.6$4.6 million or 15.3%2.5%. The increasedecrease was primarily due to the accelerated ESOP allocation, which resulted in a non-recurring non-cash charge of $25.4 million prior to our IPO. Excluding the accelerated ESOP allocation, our cost of revenues increased $5.2 million or 2.6%. The increase was primarily due to an increasedecrease in salaries and employee benefits costs of $10.1$3.5 million, primarily related to lower pension cost of $8.7 million, and a reallocation of certain resources to our Decision Analytics segment relating to property appraisal tools that occurred in 2012. Other decreases were related to data and consulting costs of $12.7$1.1 million, resulting from the global economic downturn experienced in 2008, partiallytravel and travel related expenses of $0.3 million. These decreases were offset by a decrease in salaries due to a slight reduction in headcount. There was also an increase in office maintenance fees of $0.3 million. The increase was partially offset by a decrease in other operatinggeneral expenses of $3.8$0.2 million which include decreases in travel and auto related costs, and a decrease in data and consultant costsinformation technology expenses of $1.4$0.1 million.
Selling, General and Administrative Expenses
Selling, general and administrative expenses for our Risk Assessment segment were $82.5$80.9 million for the year ended December 31, 20092012 compared to $81.8$82.3 million for the year ended December 31, 2008, an increase2011, a decrease of $0.7$1.4 million or 0.9%. Included within the increase in SGA is the accelerated ESOP allocation, which resulted in a non-recurring non-cash charge of $7.5 million. Excluding this accelerated ESOP charge, our SGA decreased $6.8 million or 8.2%1.7%. The decrease was primarily due to lower legal costsa decrease in salaries and employee benefits of $4.1$2.0 million, primarily associated with the preparation for our IPO in 2008, an insurance cost recovery of $1.7 million and other general expensesrelated to lower pension cost. Other decreases included professional fees of $1.4 million. These decreases was partiallywere offset by an increase in salaries and employee benefit costsother general expenses of $0.4 million, which include increased pension costs of $2.4 million offset by a decrease in salaries and other employee benefits.$2.0 million.
43
EBITDA Margin
The EBITDA margin for our Risk Assessment segment was 40.3%54.6% for the year ended December 31, 20092012 compared to 44.2%51.0% for the year ended December 31, 2008. Included in the calculation of our EBITDA margin for the year ended December 31, 2009, are non-recurring, non-cash costs of $32.9 million associated with the accelerated ESOP allocation prior to our IPO, representing a 6.3% negative impact in EBITDA margin, and increased pension costs of $15.1 million, representing a 2.8% negative impact on our EBITDA margin. Also included in the calculation of our EBITDA margin are costs of $4.1 and $5.8 million associated with the preparation for our IPO for the year ended December 31, 2009 and December 31, 2008, respectively, representing a 0.8% and 1.1% negative impact, respectively, in EBITDA margin for each period.
2011Decision Analytics
| Year Ended | ||||||||||||
| December 31, | Percentage | |||||||||||
| 2009 | 2008 | Change | ||||||||||
| (In thousands) | ||||||||||||
| Fraud identification and detection solutions | $ | 273,103 | $ | 213,994 | 27.6 | % | ||||||
| Loss prediction solutions | 137,328 | 95,128 | 44.4 | % | ||||||||
| Loss quantification solutions | 92,697 | 80,037 | 15.8 | % | ||||||||
| Total Decision Analytics | $ | 503,128 | $ | 389,159 | 29.3 | % | ||||||
44
Quarterly Results of Operations
The following table sets forth our quarterly unaudited consolidated statement of operations data for each of the eight quarters in the period ended December 31, 2010.2013. In management’s opinion, the quarterly data has been prepared on the same basis as the audited consolidated financial statements included in this annual report onForm 10-K, and reflects all necessary adjustments
40
for a fair presentation of this data. The results of historical periods are not necessarily indicative of the results of operations for a full year or any future period.
| For the Quarter Ended | For the Quarter Ended | |||||||||||||||||||||||||||||||||||||||
| March 31, | June 30, | September 30, | December 31, | Full Year | March 31, | June 30, | September 30, | December 31, | Full Year | |||||||||||||||||||||||||||||||
| 2010 | 2010 | 2009 | 2009 | |||||||||||||||||||||||||||||||||||||
Statement of income data: | ||||||||||||||||||||||||||||||||||||||||
| Revenues | $ | 276,154 | $ | 281,677 | $ | 287,354 | $ | 293,158 | $ | 1,138,343 | $ | 245,751 | $ | 257,916 | $ | 258,311 | $ | 265,126 | $ | 1,027,104 | ||||||||||||||||||||
| Operating income | $ | 106,414 | $ | 107,075 | $ | 113,718 | $ | 113,707 | $ | 440,914 | $ | 87,203 | $ | 87,851 | $ | 84,795 | $ | 42,158 | $ | 302,007 | ||||||||||||||||||||
| Net income/(loss) | $ | 55,375 | $ | 58,404 | $ | 62,880 | $ | 65,893 | $ | 242,552 | $ | 44,915 | $ | 45,939 | $ | 42,205 | $ | (6,445 | ) | $ | 126,614 | |||||||||||||||||||
| Basic net income/(loss) per share: | $ | 0.31 | $ | 0.32 | $ | 0.35 | $ | 0.38 | $ | 1.36 | $ | 0.26 | $ | 0.27 | $ | 0.24 | $ | (0.04 | ) | $ | 0.72 | |||||||||||||||||||
| Diluted net income/(loss) per share: | $ | 0.29 | $ | 0.31 | $ | 0.34 | $ | 0.37 | $ | 1.30 | $ | 0.25 | $ | 0.26 | $ | 0.23 | $ | (0.03 | ) | $ | 0.70 | |||||||||||||||||||
| For the Quarters Ended | |||||||||||||||
| March 31, | June 30, | September 30, | December 31, | Full Year | |||||||||||
| 2013 | 2013 | ||||||||||||||
| (in thousands, except for per share data) | |||||||||||||||
| Statement of operations data: | |||||||||||||||
| Revenues | $ | 376,697 | $ | 390,356 | $ | 411,927 | $ | 416,723 | $ | 1,595,703 | |||||
| Operating income | $ | 145,528 | $ | 146,857 | $ | 166,835 | $ | 155,047 | $ | 614,267 | |||||
| Income from continuing operations | $ | 79,445 | $ | 81,600 | $ | 94,894 | $ | 86,375 | $ | 342,314 | |||||
| Income from discontinued operations | $ | 1,066 | $ | 2,605 | $ | 1,547 | $ | 848 | $ | 6,066 | |||||
| Net income | $ | 80,511 | $ | 84,205 | $ | 96,441 | $ | 87,223 | $ | 348,380 | |||||
| Basic net income per share: | $ | 0.48 | $ | 0.50 | $ | 0.57 | $ | 0.52 | $ | 2.07 | |||||
| Diluted net income per share: | $ | 0.47 | $ | 0.49 | $ | 0.56 | $ | 0.51 | $ | 2.02 | |||||
| For the Quarters Ended | |||||||||||||||
| March 31, | June 30, | September 30, | December 31, | Full Year | |||||||||||
| 2012 | 2012 | ||||||||||||||
| (in thousands, except for per share data) | |||||||||||||||
| Statement of operations data: | |||||||||||||||
| Revenues | $ | 313,451 | $ | 339,128 | $ | 366,788 | $ | 388,481 | $ | 1,407,848 | |||||
| Operating income | $ | 132,416 | $ | 132,141 | $ | 150,314 | $ | 157,357 | $ | 572,228 | |||||
| Income from continuing operations | $ | 70,650 | $ | 69,556 | $ | 79,932 | $ | 97,325 | $ | 317,463 | |||||
| Income from discontinued operations | $ | 3,951 | $ | 3,775 | $ | 2,979 | $ | 974 | $ | 11,679 | |||||
| Net income | $ | 74,601 | $ | 73,331 | $ | 82,911 | $ | 98,299 | $ | 329,142 | |||||
| Basic net income per share: | $ | 0.45 | $ | 0.44 | $ | 0.50 | $ | 0.59 | $ | 1.98 | |||||
| Diluted net income per share: | $ | 0.44 | $ | 0.43 | $ | 0.48 | $ | 0.57 | $ | 1.92 | |||||
41
Liquidity and Capital Resources
As of December 31, 20102013 and 20092012, we had cash and cash equivalents andavailable-for-sale securities of $60.6$169.7 million and $77.0$94.7 million, respectively. Subscriptions for our solutions are billed and generally paid in advance of rendering services either quarterly or in full upon commencement of the subscription period, which is usually for one year. Subscriptions are automatically renewed at the beginning of each calendar year. We have historically generated significant cash flows from operations. As a result of this factor, as well as the availability of funds under our syndicated revolving credit facility, we believe we will have sufficient cash to meet our working capital and capital expenditure needs, including acquisition contingent payments, and to fuel our future growth plans.
We have historically managed the business with a working capital deficit due to the fact that, as described above, we offer our solutions and services primarily through annual subscriptions or long-term contracts, which are generally prepaid quarterly or annually in advance of the services being rendered. When cash is received for prepayment of invoices, we record an asset (cash and cash equivalents) on our balance
45
sheet with the offset recorded as a current liability (fees received in advance). This current liability is deferred revenue that does not require a direct cash outflow since our customers have prepaid and are obligated to purchase the services. In most businesses, growth in revenue typically leads to an increase in the accounts receivable balance causing a use of cash as a company grows. Unlike these businesses, our cash position is favorably affected by revenue growth, which results in a source of cash due to our customers prepaying for most of our services.
Our capital expenditures, which include non-cash purchases of fixed assets and capital lease obligations, as a percentage of revenues for the years ended December 31, 2010, 2009,2013 and 20082012, were 3.6%, 4.3%,9.2% and 3.7%5.2%, respectively. We estimate our capital expenditures for 20112014 will be approximately $60.0$147.0 million, which primarily include expenditures on our technology infrastructure and our continuing investments in developing and enhancing our solutions. Expenditures related to developing and enhancing our solutions are predominately related to internal use software and are capitalized in accordance withASC 350-40, ““Accounting for Costs of Computer Software Developed or Obtained for Internal Use.”The We also capitalize amounts capitalized in accordance withASC 985-20, “ “Software to be Sold, Leased or Otherwise Marketed,.” are not significant to the financial statements.
We have also historically used a portion of our cash for repurchases of our common stock from our stockholders. For the years ended December 31, 2010, 2009,2013, 2012 and 20082011, we repurchased and redeemed $422.3$278.9 million, $46.7$162.6 million and $392.6$380.7 million, respectively, of our common stock. Included in the 2010 share repurchases are repurchases of $209.8 million of Class B, including $199.9 million and $9.9 million of VeriskClass B-1 andClass B-2, respectively, which were not a part of the Repurchase Program. A substantial portion of the share redemption included in the total above was completed pursuant to the terms of the Insurance Service Office, Inc. 1996 Incentive Plan, or the Option Plan.
Financing and Financing Capacity
We had total debt, excluding capital lease and other obligations, of $835.0$1,265.1 million and $585.0$1,454.4 million at December 31, 20102013 and 2009,2012, respectively. The debt at December 31, 20102013 was heldprimarily issued under senior notes and long-term private placement loan facilities drawn to finance our stock repurchases and acquisitions.
On April 6, 2011, we completed an issuance of senior notes in the aggregate principal amount of $450.0 million. These senior notes are due on May 1, 2021 and accrue interest at a rate of 5.800% per annum. Interest is payable semi-annually on May 1st and November 1st of each year.
On December 8, 2011, we completed a second issuance of senior notes in the aggregate principal of $250.0 million. These senior notes are due on January 15, 2019 and accrue interest at a rate of 4.875% per annum. Interest is payable semi-annually on January 15th and July 15th of each year.
On September 12, 2012, we completed a third issuance of senior notes in the aggregate principal amount of $350.0 million. These senior notes are due on September 12, 2022 and accrue interest at a rate of 4.125% per annum. Interest is payable semi-annually on March 12th and September 12th of each year.
The senior notes are fully and unconditionally guaranteed, jointly and severally, on an unsecured and unsubordinated basis by ISO and certain subsidiaries that guarantee our syndicated revolving credit facility, (“credit facility”), or any amendment,
42
refinancing or replacement thereof. We expect to redraw from our credit facility over time as needed for our corporate strategy, including for general corporate purposes and acquisitions. The indenture governing the senior notes restricts our ability and our subsidiaries’ ability to, among other things, create certain liens, enter into sale/leaseback transactions and consolidate with, sell, lease, convey or otherwise transfer all or substantially all of our assets, or merge with or into, any other person or entity.
On October 25, 2013, we amended our committed senior unsecured credit facility with a syndicate of banks to increase the borrowing capacity under the credit facility from $850.0 million to $975.0 million and extend the maturity date from October 24, 2017 to October 24, 2018. We amortize all one-time fees and third party costs associated with the execution and amendment of this credit facility through the maturity date. Interest is payable at a maturity rate of LIBOR plus 1.125% to 1.875%, depending on the result of certain ratios defined in the credit agreement. Verisk and ISO are co-borrowers under the credit facility. Borrowings may be used for general corporate purposes, including working capital and capital expenditures, acquisitions and share repurchase programs. As of December 31, 2010, our $575 million Syndicated Revolving Credit Facility due September 2014, or2013, we had no borrowings outstanding under the credit facility, is a committed facility, where as all of our long-term loan facilities are uncommitted facilities. We have financed and expectcompared to finance our short-term working capital needs, stock repurchases and acquisition contingent payments through cash from operations and borrowings from a combination of our long-term facilities and our credit facility.
46
facility. EVT is expected to close by July 2014.
The $575 million credit facility contains certain customary financial and other covenants that, among other things, impose certain restrictions on indebtedness, liens, investments, and capital expenditures. These covenants also place restrictions on mergers, asset sales, sale and sale/leaseback transactions, payments between us and our subsidiaries, cross defaults, and certain transactions with affiliates. The financial covenants require that, at the end of any fiscal quarter, we have a consolidated interest coverage ratio of at least 3.0 to 1.0 and that during any period of four fiscal quarters, we maintain a consolidated funded debt leverage ratio of below 3.03.5 to 1.0. We were in compliance with all debt covenants under the credit facility as of December 31, 2010.
2013.
We also havehad long-term private placement loan facilities under uncommitted master shelf agreements with Aviva Investors North America, or Aviva, New York Life and Prudential Capital Group or Prudential, with capacities atthat expired during 2013. We did not renew these agreements and no longer have financing capacity thereunder. During the year ended December 31, 2010 in the amounts2013, we repaid $180.0 million of $20.0 million, $30.0 million and $115.0 million, respectively. We can borrowoutstanding borrowings under the Aviva Master Shelf Agreement until December 10, 2011. On March 16, 2010, we amendedprivate placement facilities that matured during the New York Life Master Shelf Agreement to increase the authorization of additional senior promissory notesyear with cash from $100.0 million to $115.0 million, and to extend the maturity of the agreement through March 16, 2013. On August 30, 2010, we amended the Prudential Master Shelf Agreement to extend the maturity of the agreement through August 30, 2013.
operations. The notes outstanding under these long-term private placement loan facilities mature over the next six years. Individual borrowings are made at a fixed rate of interest determined at the time of the borrowing and interest is payable quarterly. Thethree years.The weighted average rate of interest with respect to our outstanding borrowings under these facilities was 6.07%6.36% and 6.11%6.26% for the years ended December 31, 20102013 and 2009,2012 and amounts outstanding were $1.9 million and $3.6 million, respectively. The uncommitted master shelf agreementsThese notes contain certain covenants that limit our ability to create liens, enter into sale and sale/leaseback transactions and consolidate, merge or sell assets to another company. The Aviva and New York Life Master Shelf AgreementsThese notes also contain financial covenants that require us to maintain a fixed charge coverage ratio of no less than 275% during any period of four fiscal quarters and a leverage ratio of no more than 300% at the end of any fiscal quarter. The Prudential Master Shelf Agreement also contains financial covenants that require that, at the end of any fiscal quarter, we have a consolidated interest coverage ratio of at least 3.0 to 1.0 and a leverage ratio of no more than 300%below 3.0 to 1.0 at the end of any fiscal quarter. We were in compliance with all debt covenants under our master shelf agreements as of December 31, 2010.2013.
Cash Flow
The following table summarizes our cash flow data for the years ended December 31, 2010, 2009 and 2008:31:
| For the Year Ended December 31, | ||||||||||||
| 2010 | 2009 | 2008 | ||||||||||
| (In thousands) | ||||||||||||
| Net cash provided by operating activities | $ | 336,032 | $ | 326,401 | $ | 247,906 | ||||||
| Net cash used in investing activities | $ | (243,689 | ) | $ | (185,340 | ) | $ | (130,466 | ) | |||
| Net cash used in financing activities | $ | (108,787 | ) | $ | (102,809 | ) | $ | (107,376 | ) | |||
47
| 2013 | 2012 | 2011 | |||||||||
| (In thousands) | |||||||||||
| Net cash provided by operating activities | $ | 506,920 | $ | 468,229 | $ | 375,721 | |||||
| Net cash used in investing activities | $ | (145,626 | ) | $ | (883,583 | ) | $ | (204,129 | ) | ||
| Net cash (used in) provided by financing activities | $ | (284,472 | ) | $ | 313,555 | $ | (34,780 | ) | |||
Operating Activities
Net cash provided by operating activities increased to $506.9 million for the year ended December 31, 2013 compared to $468.2 million for the year ended December 31, 2012. The increase in cash provided by operating activities was primarily due to an increase in cash receipts from customers, partially offset by an increase in interest payments related to our bond offerings. In the second quarter of 2012, we pre-funded $72.0 million to our pension plan. This prefunding was partially offset by the tax benefit associated with those deductible contributions and the deferral of our fourth quarter 2012 tax payment to 2013 as a result of a temporary federal tax relief program related to Hurricane Sandy. This tax payment would have typically been paid in the fourth quarter of 2012, but due to this relief, the payment was made in the first quarter of 2013.
Net cash provided by operating activities increased to $336.0$468.2 million for the year ended December 31, 20102012 compared to $326.4$375.7 million for the year ended December 31, 2009.2011. The increase in operating activities was primarily due to an increase in cash receipts from customers and the deferral of our fourth quarter 2012 federal tax payment to 2013 as a reduction in interest payments, partially offset by an increase in operating expense andresult of a temporary
43
federal tax payments during the year ended December 31, 2010. Increased pension contributions of $15.0 million in 2010, as well as the timing of certain annual bonus payments, mitigated the growth in our operating cash flow during the year ended December 31, 2010.
Investing Activities
Net cash used in investing activities was $243.7$145.6 million for the year ended December 31, 20102013 and $185.3$883.6 million for the year ended December 31, 2009.2012. The increasedecrease in net cash used in investing activities was primarily due to an increasethe fact that we had acquisitions in acquisitions, including escrow funding,2012 with a combined net cash purchase price of $136.6$808.3 million partially offset by a decreaseversus minor acquisition activity in earnout payments of $78.1 million.
2013.
Net cash used in investing activities was $185.3$883.6 million for the year ended December 31, 20092012 and $130.5$204.1 million for the year ended December 31, 2008.2011. The increase in net cash used in investing activities was principally due to increased cash paid foran increase in acquisition payments of $647.8 million, primarily related to the acquisitions includingof MediConnect and Argus in the first and third quarters of 2012, respectively, an increase in escrow funding associated with these acquisitions of $48.5$19.2 million and an increase in purchases of fixed assets of $8.0 million.$14.5 million during the year ended December 31, 2012 .
Financing Activities
Net cash used in financing activities was $108.8$284.5 million for the year ended December 31, 2013 and net cash provided by financing was $313.6 million for the year ended December 31, 2012. Net cash used in financing activities for the year ended December 31, 2013 was primarily related the repurchase of common stock of $277.4 million and debt repayments of $190.0 million, partially offset by proceeds from stock option exercises and the related excess tax benefit of $190.3 million.
Net cash provided by financing activities was $313.6 million for the year ended December 31, 20102012 and $102.8net cash used in by financing was $34.8 million for the year ended December 31, 2011. Net cash used in financing activities for the year ended December 31, 2009. The increase in net cash used in financing activities can be attributed2012, was primarily related to an increase in share repurchases of $388.4 million primarily through our Repurchase Program and the shares repurchased as part of our follow-on public offering on October 1, 2010. The increase was partially offset bytotal net debt receipts of $325.6$357.2 million, and cash inflows from stock option exercises and the related tax benefit associated with these exercises of $56.8 million.
48
Contractual Obligations
The following table summarizes our contractual obligations and commercial commitments at December 31, 20102013 and the future periods in which such obligations are expected to be settled in cash:
| Payments Due by Period | ||||||||||||||||||||
| Less than | More than | |||||||||||||||||||
| Total | 1 Year | 1-3 years | 3-5 years | 5 Years | ||||||||||||||||
| (In thousands) | ||||||||||||||||||||
Contractual obligations | ||||||||||||||||||||
| Debt | $ | 934,461 | $ | 465,464 | $ | 225,611 | $ | 191,838 | $ | 51,548 | ||||||||||
| Capital lease obligations | 4,162 | 2,511 | 1,547 | 104 | — | |||||||||||||||
| Operating leases | 207,009 | 26,226 | 49,459 | 41,780 | 89,544 | |||||||||||||||
| Earnout and contingent payments | 7,893 | 3,500 | 4,393 | — | — | |||||||||||||||
| Pension and postretirement plans(1) | 204,179 | 30,392 | 67,949 | 64,496 | 41,342 | |||||||||||||||
| Other long-term liabilities(2) | 12,843 | 740 | 748 | 8,086 | 3,269 | |||||||||||||||
| Total(3) | $ | 1,370,547 | $ | 528,833 | $ | 349,707 | $ | 306,304 | $ | 185,703 | ||||||||||
| Payments Due by Period | |||||||||||||||||||
| Total | Less than 1 year | 2-3 years | 4-5 years | More than 5 years | |||||||||||||||
| (In thousands) | |||||||||||||||||||
| Contractual obligations | |||||||||||||||||||
| Long-term debt and interest | $ | 1,671,933 | $ | 66,712 | $ | 334,944 | $ | 105,450 | $ | 1,164,827 | |||||||||
| Operating leases | 235,281 | 34,590 | 69,128 | 58,544 | 73,019 | ||||||||||||||
| Pension and postretirement plans (1) | 22,498 | 1,901 | 4,048 | 3,995 | 12,554 | ||||||||||||||
| Capital lease obligations | 11,366 | 4,750 | 6,093 | 329 | 194 | ||||||||||||||
| Other long-term liabilities (2) | 21,852 | 452 | 19,020 | 169 | 2,211 | ||||||||||||||
| Total (3) | $ | 1,962,930 | $ | 108,405 | $ | 433,233 | $ | 168,487 | $ | 1,252,805 | |||||||||
| (1) | Our funding policy is to contribute at least equal to the minimum legal funding requirement. |
| (2) | Other long-term liabilities consist of our ESOP contributions and employee-related deferred compensation plan. We also have a deferred compensation plan for our Board of Directors; however, based on past performance and the uncertainty of the dollar amounts to be paid, if any, we have excluded such amounts from the above table. |
| (3) | Unrecognized tax benefits of approximately |
Off-Balance Sheet Arrangements
We have no off-balance sheet arrangements.
44
Critical Accounting Policies and Estimates
Our management’s discussion and analysis of financial condition and results of operations are based on our consolidated financial statements, which have been prepared in accordance with accounting principles generally accepted in the United States. The preparation of these financial statements require management to make estimates and judgments that affect reported amounts of assets and liabilities and related disclosures of contingent assets and liabilities at the dates of the financial statements and revenue and expenses during the reporting periods. These estimates are based on historical experience and on other assumptions that are believed to be reasonable under the circumstances. On an ongoing basis, management evaluates its estimates, including those related to revenue recognition, goodwill and intangible assets, pension and other post retirement benefits, stock-basedstock based compensation, and income taxes. Actual results may differ from these assumptions or conditions.
Revenue Recognition
The Company’s revenues are primarily derived from sales of services and revenue is recognized as services are performed and information is delivered to our customers. Revenue is recognized when persuasive evidence of an arrangement exists, delivery has occurred or services have been rendered, feesand/or price are fixed or determinable and collectability is reasonably assured. Revenues for subscription services are recognized ratably over the subscription term, usually one year. Revenues from transaction-based fees are recognized as information is delivered to customers, assuming all other revenue recognition criteria are met.
49
The Company also has term based software licenses where the only remaining undelivered element is post-contract customer support or PCS, including unspecified upgrade rights on a when and if available basis. The Company recognizes revenue for these licenses ratably over the duration of the license term. The PCS associated with these arrangements is coterminous with the duration of the license term. The Company also provides hosting or software solutions that provide continuous access to information and include PCS and recognizes revenue ratably over the duration of the license term. In addition, the determination of certain of our services revenues requires the use of estimates, principally related to transaction volumes in instances where these volumes are reported to us by our clients on a monthly basis in arrears. In these instances, we estimate transaction volumes based on average actual volumes reported by our customers in the past. Differences between our estimates and actual final volumes reported are recorded in the period in which actual volumes are reported. We have not experienced significant variances between our estimates of these services revenues reported to us by our customers and actual reported volumes in the past.
We invoice our customers in annual, quarterly, or monthly installments. Amounts billed and collected in advance are recorded as fees received in advance on the balance sheet and are recognized as the services are performed and revenue recognition criteria are met.
| Year Ended December 31, | ||||||||||||
| 2010 | 2009 | 2008 | ||||||||||
| (In thousands) | ||||||||||||
| 2005 grants | $ | — | $ | 757 | $ | 2,209 | ||||||
| 2006 grants | 395 | 1,730 | 1,870 | |||||||||
| 2007 grants | 2,300 | 2,056 | 2,561 | |||||||||
| 2008 grants | 2,542 | 2,669 | 3,241 | |||||||||
| 2009 grants | 9,131 | 5,532 | — | |||||||||
| 2010 grants | 6,930 | — | — | |||||||||
| Total stock-based compensation | $ | 21,298 | $ | 12,744 | $ | 9,881 | ||||||
The fair value of equity awards is measured on the date of grant using a Black-Scholes option-pricing model, which requires the use of several estimates, including expected term, expected risk-free interest rate, expected volatility and expected dividend yield.
We estimate expected forfeitures of equity awards at the date of grant and recognize compensation expense only for those awards expected to vest. The forfeiture assumption is ultimately adjusted to the actual forfeiture rate.
50
Goodwill and Intangibles
Goodwill represents the excess of acquisition costs over the fair value of tangible net assets and identifiable intangible assets of the businesses acquired. Goodwill and intangible assets deemed to have indefinite lives are not amortized. Intangible assets determined to have definite lives are amortized over their useful lives. Goodwill and intangible assets with indefinite lives are subject to impairment testing annually as of June 30, or whenever events or changes in circumstances indicate that the carrying amount may not be fully recoverable, using the guidance and criteria described in the accounting standard forGoodwill and Other Intangible Assets. This testing compares carrying values to fair values and, when appropriate, the carrying value of these assets is reduced to fair value.
As of December 31, 2010,2013, we had goodwill and net intangible assets of $832.9$1,629.3 million, which represents 68.4%65.1% of our total assets. During fiscal year 2010,2013, we performed an impairment test as of June 30, 20102013 and confirmed that no impairment charge was
45
necessary. There are many assumptions and estimates used that directly impact the results of impairment testing, including an estimate of future expected revenues, earnings and cash flows, useful lives and discount rates applied to such expected cash flows in order to estimate fair value. We have the ability to influence the outcome and ultimate results based on the assumptions and estimates we choose for determining the fair value of our reporting units. To mitigate undue influence, we set criteria and benchmarks that are reviewed and approved by various levels of management and reviewed by other independent parties. The determination of whether or not goodwill or indefinite-lived acquired intangible assets have become impaired involves a significant level of judgment in the assumptions and estimates underlying the approach used to determine the value of our reporting units. Changes in our strategy or market conditions could significantly impact these judgments and require adjustmentsan impairment to be recorded amounts ofto intangible assets and goodwill. Neither our initialOur valuation nor our subsequent analysis havehas not indicated any impairment of our goodwill asset of $632.7$1,181.7 million as of December 31, 2010.2013. For the year ended December 31, 2013, there were no impairment indicators related to our intangible assets.
Pension and Postretirement
On February 29, 2012, we instituted a hard freeze, which will eliminate all future compensation and service credits, to all participants in the pension plans. See Note 17. to our consolidated financial statements included in this Annual Report on Form 10-K. We account for our pension and postretirement benefit plans in accordance with the accounting standard forEmployers’ Accounting for Defined Benefit Pension and Other Postretirement Plans.Plans. This standard requires that employers recognize on a prospective basis the funded status of their defined benefit pension and other postretirement benefit plans on their consolidated balance sheets and recognize as a component of other comprehensive income/income (loss), net of tax, the gains or losses and prior service costs or credits that arise during the period but are not recognized as components of net periodic benefit cost.
51
Additional minimum pension liabilities and related intangible assets are also derecognized upon adoption of the new standard.
Certain assumptions are used in the determination of our annual net period benefit cost and the disclosure of the funded status of these plans. The principal assumptions concern the discount rate used to measure the projected benefit obligation and the expected return on plan assets and the expected rate of future compensation increases.assets. We revise these assumptions based on an annual evaluation of long-term trends and market conditions that may have an impact on the cost of providing retirement benefits.
In determining the discount rate, we utilize quoted rates from long-term bond indices, and changes in long-term bond rates over the past year, cash flow models and other data sources we consider reasonable based upon the profile of the remaining service life expectancy and mortality rate of eligible employees. As part of our evaluation, we calculate the approximate average yields on securities that were selected to match our separate projected cash flows for both the pension and postretirement plans. Our separate benefit plan cash flows are input into actuarial models that include data for corporate bonds rated AA or better at the measurement date. The output from the actuarial models are assessed against the prior year’s discount rate and quoted rates for long-term bond indices. For our pension planplans at December 31, 2010,2013, we determined this rate to be 5.49%4.74%, a decreasean increase of 0.25%0.76% from the 5.74%3.98% rate used at December 31, 2009.2012. Our postretirement rate is 4.00%3.45% at December 31, 2010, a decrease2013, an increase of 0.50%0.70% from the 4.50%2.75% used at December 31, 2009.
2012.
The expected return on plan assets of 8.25% as of December 31, 2010 is determined by taking into consideration our analysis of our actual historical investment returns to a broader long-term forecast adjusted based on our target investment allocation, and the current economic environment. Our pension asset investment guidelines target an investment portfolio allocation of 40.0%40.00% debt securities and 60.0%60.00% equity securities. As of December 31, 2010,2013, the pension plan assets were allocated 42.0%33.20% debt 56.0%and 66.80% equity securities, and 2.0% to other investments.securities. The VEBA Plan target allocation is 100% debt. We have used our target investment allocation to derive the expected return as we believe this allocation will be retained on an ongoing basis that will be commensurate with the projected cash flows of the plan. The expected return for each investment category within our target investment allocation is developed using average historical rates of return for each targeted investment category, considering the projected cash flow of the qualified pension plan. The difference between this expected return and the actual return on plan assets is generally deferred and recognized over subsequent periods through future net periodic benefit costs. We believe these considerations provide the basis for reasonable assumptions with respect to the expected long-term rate of return on plan assets.
52
A one percent change in discount rate and future rate of return on plan assets and the rate of future compensation would have the following effects:
46
| Pension | Postretirement | |||||||||||||||||||||||||||||||
| 1% Decrease | 1% Increase | 1% Decrease | 1% Increase | |||||||||||||||||||||||||||||
| Projected | Projected | Projected | Projected | |||||||||||||||||||||||||||||
| Benefit | Benefit | Benefit | Benefit | Benefit | Benefit | Benefit | Benefit | |||||||||||||||||||||||||
| Cost | Obligation | Cost | Obligation | Cost | Obligation | Cost | Obligation | |||||||||||||||||||||||||
| (In thousands) | ||||||||||||||||||||||||||||||||
| Discount rate | $ | 2,410 | $ | 42,580 | $ | (1,913 | ) | $ | (34,026 | ) | $ | (106 | ) | $ | 1,465 | $ | 95 | $ | (1,327 | ) | ||||||||||||
| Expected return on asset | $ | 2,745 | $ | — | $ | (2,745 | ) | $ | — | $ | — | $ | — | $ | — | $ | — | |||||||||||||||
| Rate of compensation | $ | (455 | ) | $ | (2,226 | ) | $ | 503 | $ | 2,440 | $ | — | $ | — | $ | — | $ | — | ||||||||||||||
| Pension | Postretirement | ||||||||||||||||||||||||||||||
| 1% Decrease | 1% Increase | 1% Decrease | 1% Increase | ||||||||||||||||||||||||||||
| Benefit (Credit) Cost | Projected Benefit Obligation | Benefit (Credit) Cost | Projected Benefit Obligation | Benefit (Credit) Cost | Projected Benefit Obligation | Benefit (Credit) Cost | Projected Benefit Obligation | ||||||||||||||||||||||||
| (In thousands) | |||||||||||||||||||||||||||||||
| Discount Rate | $ | (652 | ) | $ | 45,160 | $ | 292 | $ | (35,224 | ) | $ | (86 | ) | $ | 1,324 | $ | 68 | $ | (1,253 | ) | |||||||||||
| Expected Rate of Return on Assets | $ | 4,064 | $ | — | $ | (4,064 | ) | $ | — | $ | 184 | $ | — | $ | (184 | ) | $ | — | |||||||||||||
Income Taxes
In projecting future taxable income, we develop assumptions including the amount of future state, federal and foreign pretax operating income, the reversal of temporary differences, and the implementation of feasible and prudent tax planning strategies. These assumptions require significant judgment about the forecasts of future taxable income and are consistent with the plans and estimates we use to manage the underlying businesses. The calculation of our tax liabilities also involves dealing with uncertainties in the application and evolution of complex tax laws and regulations in other jurisdictions.
We followaccount for uncertain tax positions in accordance with Accounting for Uncertainty in Income Taxes — an interpretation of ASC 740-10740 guidance for accounting for income taxes,, which addresses the determination of whether tax benefits claimed or expected to be claimed on a tax return should be recorded in the financial statements. Under this interpretation, we may recognize the tax benefit from an uncertain tax position only if it is more likely than not that the tax position will be sustained upon examination by the taxing authorities, based on the technical merits of the position. As a result of the implementation of this interpretation, we recognized an increase in the liability for unrecognized tax benefits of approximately $10.3 million, which was accounted for as an increase to the January 1, 2007 balance of retained earnings/(accumulated deficit).
We recognize and adjust our liabilities when our judgment changes as a result of the evaluation of new information not previously available. Due to the complexity of some of these uncertainties, the ultimate resolution may result in a payment that is materially different from our current estimate of the tax liabilities. These differences will be reflected as increases or decreases to income tax expense in the period in which they are determined.
| (In thousands) | ||||
| 2011 - 2018 | $ | 44,973 | ||
| 2019 - 2023 | 436 | |||
| 2024 - 2030 | 15,396 | |||
| $ | 60,805 | |||
We estimate unrecognized tax positions of $4.9$3.9 million that may be recognized by December 31, 2011,2014, due to expiration of statutes of limitations and resolution of audits with taxing authorities, net of additional uncertain tax positions.
53
As of December 31, 2013, we have gross federal, state, and foreign income tax net operating loss carryforwards of $79.7 million, which will expire at various dates from 2014 through 2033. Such net operating loss carryforwards expire as follows:
| (In thousands) | |||
| 2014 - 2021 | $ | 12,916 | |
| 2022 - 2026 | 14,345 | ||
| 2027 - 2033 | 52,478 | ||
| $ | 79,739 | ||
As of December 31, 2013, deferred tax liabilities of $70.2 were recorded primarily attributable to timing differences involving pensions, depreciation and amortization. As of December 31, 2012, deferred tax liabilities in the amount of $40.8 million and $40.2 million were recorded in connection with the acquisitions of MediConnect and Argus, respectively. Other increases in deferred tax liabilities in 2012 of $56.7 million were primarily due to increased contributions to the pension and postretirement plans in the current period as well as the other timing differences attributable to depreciation and amortization.
Recent Accounting Pronouncements
For a discussion of recent accounting pronouncements, refer to Note 2(r)2(t) to the audited consolidated financial statements included elsewhere in this annual report onForm 10-K.
47
| Item 7A. | Quantitative and Qualitative Disclosures about Market Risk |
Interest Rate Risk
We are exposed to market risk from fluctuations in interest rates. At December 31, 2010,2013, we haddid not have any borrowings outstanding under our syndicated revolving credit facility. Any future borrowing under this facility of $310.0 million, whichwould bear interest at variable rates based on LIBOR plus 1.75%.1.125% to 1.875%, depending on certain ratios defined in the credit agreement. A change in interest rates on this variable rate debt impacts our pre-tax income and cash flows, but does not impact the fair value of the instruments. Based on our overall interest rate exposure atAs of December 31, 2010, a one percent change in interest rates would result in a change in annual pretax interest expense2013, all of approximately $3.1 million based on our current leveldebt is at fixed rates.
48
| Item 8. | Financial Statements and Supplementary Data |
The information required by this Item is set forth on pages 5653 through 110113 of this annual report onForm 10-K.
49
| Item 9. | Changes in and Disagreements with Accountants on Accounting and Financial Disclosure |
None.
| Item 9A. | Controls and Procedures |
Evaluation of Disclosure Controls and Procedures
We are required to maintain disclosure controls and procedures (as that term is defined inRules 13a-15(e) under the Securities Exchange Act of 1934, as amended (the “Exchange Act”)) that are designed to ensure that information required to be disclosed in our reports under the Exchange Act is recorded, processed, summarized, and reported within the time periods specified in the Securities and Exchange Commission’s rules and forms, and that such information is accumulated and communicated to our management, including our Chief Executive Officer and Chief Financial Officer, as appropriate, to allow timely decisions regarding required disclosures. Any controls and procedures, no matter how well designed and operated, can provide only reasonable assurance of achieving the desired control objectives.
objectives at the reasonable assurance level.
Our management, with the participation of the Chief Executive Officer and Chief Financial Officer, has evaluated the effectiveness of the Company’s disclosure controls and procedures (as defined in Exchange ActRules 13a-15(e) and15d-15(e)) as of the end of the period covered by this annual report onForm 10-K. Based upon the foregoing assessments, our Chief Executive Officer and Chief Financial Officer have concluded that, as of December 31, 2010,2013, our disclosure controls and procedures were effective.effective at the reasonable assurance level.
Management’s Report on Internal Control Over Financial Reporting.
Reporting
Management’s Report on Internal Control Over Financial Reporting as of December 31, 20102013 is set forth in Item 8. Financial StatementsStatement and Supplementary Data.
Attestation Report of the Registered Public Accounting Firm.
Firm
The Report of Independent Registered Public Accounting Firm on Internal Control Over Financial
Reporting as of December 31,20102013 is set forth in Item 8. Financial StatementsStatement and Supplementary
Data.
Reporting as of December 31,
Data.
54
Changes in Internal Control Over Financial Reporting
There have been no changes in our internal control over financial reporting identified in connection with the evaluation of such internal control that occurred during the fourth quarter of fiscal year 20102013 that have materially affected, or are reasonably likely to materially affect, our internal control over financial reporting.
| Item 9B. | Other Information |
None.
50
PART III
| Item 10. | Directors, Executive Officers and Corporate Governance |
The information required to be furnished by this Item 10. is incorporated herein by reference to our Notice of Annual Meeting of Stockholders and Proxy Statement to be filed within 120 days of December 31, 20102013 (the “Proxy Statement”).
| Item 11. | Executive Compensation |
The information required to be furnished by this Item 11. is incorporated herein by reference tofrom our Proxy Statement.
| Item 12. | Security Ownership of Certain Beneficial Owners and Management and Related Stockholder Matters |
The information required to be furnished by this Item 12. is incorporated herein by reference to our Proxy Statement.
| Item 13. | Certain Relationships and Related Transactions and Director Independence |
The information required to be furnished by this Item 13. is incorporated herein by reference to our Proxy Statement.
| Item 14. | Principal Accounting Fees and Services |
The information required to be furnished by this Item 14. is incorporated herein by reference to our Proxy Statement.
51
PART IV
| Item 15. | Exhibits and Financial Statement Schedules |
(a) The following documents are filed as part of this report.
| (1) | Financial Statements. See Index to Financial Statements and Schedules in Part II, Item 8. on thisForm 10-K. |
| (2) | Financial Statement Schedules. See Schedule II. Valuation and Qualifying Accounts and Reserves. |
| Exhibits. See Index to Exhibits in this annual report onForm 10-K. |
55
52
Item 8. | Consolidated Financial Statements and Supplementary Data |
Index to Consolidated Financial Statements and Schedules
Verisk Analytics, Inc. Consolidated Financial Statements as of December 31, | 2011. | |||
| Financial Statements Schedule | ||||
53
54
MANAGEMENT’S REPORT ON INTERNAL CONTROLS OVER FINANCIAL REPORTING
Our management is responsible for establishing and maintaining adequate internal control over financial reporting as defined inRules 13a-15(f) and15d-15(f) under the Exchange Act. Our internal control over financial reporting is a process designed to provide reasonable assurance regarding the reliability of financial reporting and the preparation of the financial statements for external purposes in accordance with U.S. generally accepted accounting principles. Because of its inherent limitations, a system of internal control over financial reporting can provide only reasonable assurance and may not prevent or detect misstatements. Also, projections of any evaluation of effectiveness to future periods are subject to the risk that internal controls may become inadequate because of changes in conditions, or that the degree of compliance with the policies or procedures may deteriorate.
Under the supervision and with the participation of our management, including our principal executive officer and principal financial officer, we conducted an evaluation of the effectiveness of our internal control over financial reporting based on the framework set forth inInternal Control — Integrated Frameworkissued by the Committee of Sponsoring Organizations of the Treadway Commission.
Commission in 1992.
Based on this assessment, management concluded that our internal control over financial reporting was effective at December 31, 2010.
2013.
Deloitte & Touche LLP, the independent registered public accounting firm that audited the consolidated financial statements included in this annual report onForm 10-K has also audited the effectiveness of our internal control over financial reporting as of December 31, 2010,2013, as stated in their report which is included herein.
57
55
REPORT OF INDEPENDENT REGISTERED PUBLIC ACCOUNTING FIRM
To the Board of Directors and Stockholders of
Verisk Analytics, Inc.
Jersey City, New Jersey
We have audited the accompanying consolidated balance sheets of Verisk Analytics, Inc. and subsidiaries (the “Company”"Company") as of December 31, 20102013 and 2009,2012, and the related consolidated statements of operations, comprehensive income, changes in stockholders’ deficit,equity (deficit), and cash flows for each of the three years in the period ended December 31, 2010.2013. Our audits also included the financial statement schedule listed in the Index at Item 15. These financial statements and financial statement schedule are the responsibility of the Company’sCompany's management. Our responsibility is to express an opinion on the financial statements and financial statement schedule based on our audits.
We conducted our audits in accordance with the standards of the Public Company Accounting Oversight Board (United States). Those standards require that we plan and perform the audit to obtain reasonable assurance about whether the financial statements are free of material misstatement. An audit includes examining, on a test basis, evidence supporting the amounts and disclosures in the financial statements. An audit also includes assessing the accounting principles used and significant estimates made by management, as well as evaluating the overall financial statement presentation. We believe that our audits provide a reasonable basis for our opinion.
In our opinion, such consolidated financial statements present fairly, in all material respects, the financial position of Verisk Analytics, Inc. and subsidiaries as of December 31, 20102013 and 2009,2012, and the results of their operations and their cash flows for each of the three years in the period ended December 31, 2010,2013, in conformity with accounting principles generally accepted in the United States of America. Also, in our opinion, such financial statement schedule, when considered in relation to the basic consolidated financial statements taken as a whole, presentspresent fairly, in all material respects,aspects, the information set forth therein.
We have also audited, in accordance with the standards of the Public Company Accounting Oversight Board (United States), the Company’s internal control over financial reporting as of December 31, 2010,2013, based on the criteria established inInternal Control —- Integrated Framework (1992) issued by the Committee of Sponsoring Organizations of the Treadway Commission and our report dated February 28, 201125, 2014 expressed an unqualified opinion on the Company’s internal control over financial reporting.
/s/ Deloitte & Touche LLP
Parsippany, New Jersey
February 28, 201125, 2014
58
56
REPORT OF INDEPENDENT REGISTERED PUBLIC ACCOUNTING FIRM ON INTERNAL CONTROLS OVER FINANCIAL REPORTING
To the Board of Directors and Stockholders of
Verisk Analytics, Inc.
Jersey City, New Jersey
We have audited the internal control over financial reporting of Verisk Analytics, Inc. and subsidiaries (the “Company”) as of December 31, 2010,2013, based on the criteria established inInternal Control —---- Integrated Framework (1992) issued by the Committee of Sponsoring Organizations of the Treadway Commission. As described in Management’s Report on Internal Control over Financial Reporting, management excluded from its assessment the internal control over financial reporting at Crowe Paradis Services Corporation (“CP”) and 3E Company (“3E”), which were acquired on December 14, 2010 and December 16, 2010, respectively, and whose combined financial statements constitute approximately 1.5% of total assets, less than 1.0% of total revenues and less than 1.0% of net income of the consolidated financial statement amounts as of and for the year ended December 31, 2010. Accordingly, our audit did not include the internal control over financial reporting at CP and 3E. The Company’s management is responsible for maintaining effective internal control over financial reporting and for its assessment of the effectiveness of internal control over financial reporting, included in the accompanying Management’s Report on Internal ControlControls over Financial Reporting. Our responsibility is to express an opinion on the Company’s internal control over financial reporting based on our audit.
We conducted our audit in accordance with the standards of the Public Company Accounting Oversight Board (United States). Those standards require that we plan and perform the audit to obtain reasonable assurance about whether effective internal control over financial reporting was maintained in all material respects. Our audit included obtaining an understanding of internal control over financial reporting, assessing the risk that a material weakness exists, testing and evaluating the design and operating effectiveness of internal control based on the assessed risk, and performing such other procedures as we considered necessary in the circumstances. We believe that our audit provides a reasonable basis for our opinion.
A company’s internal control over financial reporting is a process designed by, or under the supervision of, the company’s principal executive and principal financial officers, or persons performing similar functions, and effected by the company’s board of directors, management, and other personnel to provide reasonable assurance regarding the reliability of financial reporting and the preparation of financial statements for external purposes in accordance with generally accepted accounting principles. A company’s internal control over financial reporting includes those policies and procedures that (1) pertain to the maintenance of records that, in reasonable detail, accurately and fairly reflect the transactions and dispositions of the assets of the company; (2) provide reasonable assurance that transactions are recorded as necessary to permit preparation of financial statements in accordance with generally accepted accounting principles, and that receipts and expenditures of the company are being made only in accordance with authorizations of management and directors of the company; and (3) provide reasonable assurance regarding prevention or timely detection of unauthorized acquisition, use, or disposition of the company’s assets that could have a material effect on the financial statements.
Because of the inherent limitations of internal control over financial reporting, including the possibility of collusion or improper management override of controls, material misstatements due to error or fraud may not be prevented or detected on a timely basis. Also, projections of any evaluation of the effectiveness of the internal control over financial reporting to future periods are subject to the risk that the controls may become inadequate because of changes in conditions, or that the degree of compliance with the policies or procedures may deteriorate.
In our opinion, the Company maintained, in all material respects, effective internal control over financial reporting as of December 31, 2010,2013, based on the criteria established inInternal Control — - Integrated Framework (1992) issued by the Committee of Sponsoring Organizations of the Treadway Commission.
We have also audited, in accordance with the standards of the Public Company Accounting Oversight Board (United States), the consolidated financial statements and financial statement schedule as of and for the year ended December 31, 20102013 of the Company and our report dated February 28, 201125, 2014 expressed an unqualified opinion on those consolidated financial statements and financial statementstatements schedule.
/s/ Deloitte & Touche LLP
Parsippany, New Jersey
February 28, 201125, 2014
57
VERISK ANALYTICS, INC.
INC
INC
As of December 31, 20102013 and 20092012
| 2010 | 2009 | |||||||
| (In thousands, except for share and per share data) | ||||||||
ASSETS | ||||||||
| Current assets: | ||||||||
| Cash and cash equivalents | $ | 54,974 | $ | 71,527 | ||||
Available-for-sale securities | 5,653 | 5,445 | ||||||
| Accounts receivable, net of allowance for doubtful accounts of $4,028 and $3,844, respectively (including amounts from related parties of $515 and $1,353) in 2010 and 2009, respectively(1) | 126,564 | 89,436 | ||||||
| Prepaid expenses | 17,791 | 16,155 | ||||||
| Deferred income taxes, net | 3,681 | 4,405 | ||||||
| Federal and foreign income taxes receivable | 15,783 | 16,721 | ||||||
| State and local income taxes receivable | 8,923 | — | ||||||
| Other current assets | 7,066 | 21,656 | ||||||
| Total current assets | 240,435 | 225,345 | ||||||
| Noncurrent assets: | ||||||||
| Fixed assets, net | 93,409 | 89,165 | ||||||
| Intangible assets, net | 200,229 | 108,526 | ||||||
| Goodwill | 632,668 | 490,829 | ||||||
| Deferred income taxes, net | 21,879 | 66,257 | ||||||
| State income taxes receivable | 1,773 | 6,536 | ||||||
| Other assets | 26,697 | 10,295 | ||||||
| Total assets | $ | 1,217,090 | $ | 996,953 | ||||
| LIABILITIES AND STOCKHOLDERS’ DEFICIT | ||||||||
| Current liabilities: | ||||||||
| Accounts payable and accrued liabilities | $ | 111,995 | $ | 101,401 | ||||
| Acquisition related liabilities | 3,500 | — | ||||||
| Short-term debt and current portion of long-term debt | 437,717 | 66,660 | ||||||
| Pension and postretirement benefits, current | 4,663 | 5,284 | ||||||
| Fees received in advance (including amounts from related parties of $1,231 and $439, respectively)(1) | 163,007 | 125,520 | ||||||
| State and local income taxes payable | — | 1,414 | ||||||
| Total current liabilities | 720,882 | 300,279 | ||||||
| Noncurrent liabilities: | ||||||||
| Long-term debt | 401,826 | 527,509 | ||||||
| Pension benefits | 95,528 | 102,046 | ||||||
| Postretirement benefits | 23,083 | 25,108 | ||||||
| Other liabilities | 90,213 | 76,960 | ||||||
| Total liabilities | 1,331,532 | 1,031,902 | ||||||
| Commitments and contingencies | ||||||||
| Stockholders’ equity/(deficit): | ||||||||
| Verisk Class A common stock, $.001 par value; 1,200,000,000 shares authorized; 150,179,126 and 125,815,600 shares issued and 143,067,924 and 125,815,600 outstanding as of December 31, 2010 and 2009, respectively | 39 | 30 | ||||||
| Verisk Class B (Series 1) common stock, $.001 par value; 400,000,000 shares authorized; 198,327,962 and 205,637,925 shares issued and 12,225,480 and 27,118,975 outstanding as of December 31, 2010 and 2009, respectively | 47 | 50 | ||||||
| Verisk Class B (Series 2) common stock, $.001 par value; 400,000,000 shares authorized; 193,665,008 and 205,637,925 shares issued and 14,771,340 and 27,118,975 outstanding as of December 31, 2010 and 2009, respectively | 49 | 50 | ||||||
| Unearned KSOP contributions | (988 | ) | (1,305 | ) | ||||
| Additional paid-in capital | 754,708 | 652,573 | ||||||
| Treasury stock, at cost, 372,107,352 and 357,037,900 shares as of December 31, 2010 and 2009, respectively | (1,106,321 | ) | (683,994 | ) | ||||
| Retained earnings | 293,827 | 51,275 | ||||||
| Accumulated other comprehensive loss | (55,803 | ) | (53,628 | ) | ||||
| Total stockholders’ deficit | (114,442 | ) | (34,949 | ) | ||||
| Total liabilities and stockholders’ deficit | $ | 1,217,090 | $ | 996,953 | ||||
60
| 2010 | 2009 | 2008 | ||||||||||
| (In thousands, except for share and per share data) | ||||||||||||
| Revenues (including amounts from related parties of $49,788, $60,192 and $90,227 for the years ended December 31, 2010, 2009 and 2008, respectively)(1) | $ | 1,138,343 | $ | 1,027,104 | $ | 893,550 | ||||||
| Expenses: | ||||||||||||
| Cost of revenues (exclusive of items shown separately below) | 463,473 | 491,294 | 386,897 | |||||||||
| Selling, general and administrative | 166,374 | 162,604 | 131,239 | |||||||||
| Depreciation and amortization of fixed assets | 40,728 | 38,578 | 35,317 | |||||||||
| Amortization of intangible assets | 27,398 | 32,621 | 29,555 | |||||||||
| Acquisition related liabilities adjustment | (544 | ) | — | — | ||||||||
| Total expenses | 697,429 | 725,097 | 583,008 | |||||||||
| Operating income | 440,914 | 302,007 | 310,542 | |||||||||
| Other income/(expense): | ||||||||||||
| Investment income | 305 | 195 | 2,184 | |||||||||
| Realized gains/(losses) on securities, net | 95 | (2,332 | ) | (2,511 | ) | |||||||
| Interest expense | (34,664 | ) | (35,265 | ) | (31,316 | ) | ||||||
| Total other expense, net | (34,264 | ) | (37,402 | ) | (31,643 | ) | ||||||
| Income before income taxes | 406,650 | 264,605 | 278,899 | |||||||||
| Provision for income taxes | (164,098 | ) | (137,991 | ) | (120,671 | ) | ||||||
| Net income | 242,552 | 126,614 | 158,228 | |||||||||
| Basic net income per share of Class A and Class B(2): | $ | 1.36 | $ | 0.72 | $ | 0.87 | ||||||
| Diluted net income per share of Class A and Class B(2): | $ | 1.30 | $ | 0.70 | $ | 0.83 | ||||||
| Weighted average shares outstanding: | ||||||||||||
| Basic(2) | 177,733,503 | 174,767,795 | 182,885,700 | |||||||||
| Diluted(2) | 186,394,962 | 182,165,661 | 190,231,700 | |||||||||
61
| Common Stock Issued | (Accumulated | Accumulated | Total | |||||||||||||||||||||||||||||||||||||||||
| Verisk | Verisk | Unearned | Additional | Deficit)/ | Other | Stockholders’ | ||||||||||||||||||||||||||||||||||||||
| Verisk | ISO | Class B | Class B | Par | KSOP | Paid-in | Treasury | Retained | Comprehensive | (Deficit)/ | ||||||||||||||||||||||||||||||||||
| Class A | Class B | (Series 1) | (Series 2) | Value | Contributions | Capital | Stock | Earnings | Loss | Equity | ||||||||||||||||||||||||||||||||||
| (In thousands, except for share data) | ||||||||||||||||||||||||||||||||||||||||||||
| Balance, January 1, 2008 | — | 500,225,000 | — | — | $ | 100 | $ | — | $ | — | $ | (678,993 | ) | $ | (515,756 | ) | $ | (8,699 | ) | $ | (1,203,348 | ) | ||||||||||||||||||||||
| Comprehensive income: | ||||||||||||||||||||||||||||||||||||||||||||
| Net income | — | — | — | — | — | — | — | — | 158,228 | — | 158,228 | |||||||||||||||||||||||||||||||||
| Other comprehensive loss | — | — | — | — | — | — | — | — | — | (73,735 | ) | (73,735 | ) | |||||||||||||||||||||||||||||||
| Comprehensive income | — | — | — | — | — | — | — | — | — | — | 84,493 | |||||||||||||||||||||||||||||||||
| Treasury stock acquired - ISO Class B common stock | — | — | — | — | — | — | — | (5,001 | ) | — | — | (5,001 | ) | |||||||||||||||||||||||||||||||
| Decrease in redemption value of ISO Class A common stock | — | — | — | — | — | — | — | — | 114,033 | — | 114,033 | |||||||||||||||||||||||||||||||||
| Balance, December 31, 2008 | — | 500,225,000 | — | — | $ | 100 | $ | — | $ | — | $ | (683,994 | ) | $ | (243,495 | ) | $ | (82,434 | ) | $ | (1,009,823 | ) | ||||||||||||||||||||||
| Comprehensive income: | ||||||||||||||||||||||||||||||||||||||||||||
| Net income | — | — | — | — | — | — | — | — | 126,614 | — | 126,614 | |||||||||||||||||||||||||||||||||
| Other comprehensive income | — | — | — | — | — | — | — | — | — | 28,806 | 28,806 | |||||||||||||||||||||||||||||||||
| Comprehensive income | — | — | — | — | — | — | — | — | — | — | 155,420 | |||||||||||||||||||||||||||||||||
| Increase in redemption value of ISO Class A common stock | — | — | — | — | — | — | — | — | (272,428 | ) | — | (272,428 | ) | |||||||||||||||||||||||||||||||
| Conversion of ISO Class B common stock upon corporate reorganization (Note 14) | 88,949,150 | (500,225,000 | ) | 205,637,925 | 205,637,925 | — | — | — | — | — | — | — | ||||||||||||||||||||||||||||||||
| Conversion of ISO Class A redeemable common stock upon corporate reorganization (Note 14) | 34,768,750 | — | — | — | 30 | (1,305 | ) | 624,282 | — | 440,584 | — | 1,063,591 | ||||||||||||||||||||||||||||||||
| KSOP shares earned | — | — | — | — | — | — | 725 | — | — | — | 725 | |||||||||||||||||||||||||||||||||
| Stock options exercised (including tax benefit of $18,253) | 2,097,700 | — | — | — | — | — | 23,348 | — | — | — | 23,348 | |||||||||||||||||||||||||||||||||
| Stock based compensation | — | — | — | — | — | — | 4,218 | — | — | — | 4,218 | |||||||||||||||||||||||||||||||||
| Balance, December 31, 2009 | 125,815,600 | — | 205,637,925 | 205,637,925 | $ | 130 | $ | (1,305 | ) | $ | 652,573 | $ | (683,994 | ) | $ | 51,275 | $ | (53,628 | ) | $ | (34,949 | ) | ||||||||||||||||||||||
| Comprehensive income: | ||||||||||||||||||||||||||||||||||||||||||||
| Net income | — | — | — | — | — | — | — | — | 242,552 | — | 242,552 | |||||||||||||||||||||||||||||||||
| Other comprehensive loss | — | — | — | — | — | — | — | — | — | (2,175 | ) | (2,175 | ) | |||||||||||||||||||||||||||||||
| Comprehensive income | — | — | — | — | — | — | — | — | — | — | 240,377 | |||||||||||||||||||||||||||||||||
Conversion ofClass B-1 common stock upon follow-on public offering (Note 1) | 7,309,963 | — | (7,309,963 | ) | — | — | — | — | — | — | — | — | ||||||||||||||||||||||||||||||||
Conversion ofClass B-2 common stock upon follow-on public offering (Note 1) | 11,972,917 | — | — | (11,972,917 | ) | — | — | — | — | — | — | — | ||||||||||||||||||||||||||||||||
| Treasury stock acquired - Class A (7,111,202 shares) | — | — | — | — | — | — | — | (212,512 | ) | — | — | (212,512 | ) | |||||||||||||||||||||||||||||||
Treasury stock acquired -Class B-1 (7,583,532 shares) | — | — | — | — | — | — | — | (199,936 | ) | — | — | (199,936 | ) | |||||||||||||||||||||||||||||||
Treasury stock acquired -Class B-2 (374,718 shares) | — | — | — | — | — | — | — | (9,879 | ) | — | — | (9,879 | ) | |||||||||||||||||||||||||||||||
| KSOP shares earned | — | — | — | — | — | 317 | 11,256 | — | — | — | 11,573 | |||||||||||||||||||||||||||||||||
| Stock options exercised (including tax benefit of $49,015) | 5,579,135 | — | — | — | 5 | — | 84,492 | — | — | — | 84,497 | |||||||||||||||||||||||||||||||||
| Net share settlement of taxes upon exercise of stock options | (503,043 | ) | — | — | — | — | — | (15,051 | ) | — | — | — | (15,051 | ) | ||||||||||||||||||||||||||||||
| Stock based compensation | — | — | — | — | — | — | 21,298 | — | — | — | 21,298 | |||||||||||||||||||||||||||||||||
| Other stock issuances | 4,554 | — | — | — | — | — | 140 | — | — | — | 140 | |||||||||||||||||||||||||||||||||
| Balance, December 31, 2010 | 150,179,126 | — | 198,327,962 | 193,665,008 | $ | 135 | $ | (988 | ) | $ | 754,708 | $ | (1,106,321 | ) | $ | 293,827 | $ | (55,803 | ) | $ | (114,442 | ) | ||||||||||||||||||||||
62
| 2013 | 2012 | ||||||
| (In thousands, except for share and per share data) | |||||||
| ASSETS | |||||||
| Current assets: | |||||||
| Cash and cash equivalents | $ | 165,801 | $ | 89,819 | |||
| Available-for-sale securities | 3,911 | 4,883 | |||||
| Accounts receivable, net | 158,547 | 178,430 | |||||
| Prepaid expenses | 25,657 | 21,946 | |||||
| Deferred income taxes, net | 5,077 | 10,397 | |||||
| Income taxes receivable | 67,346 | 45,975 | |||||
| Other current assets | 34,681 | 39,109 | |||||
| Current assets held-for-sale | 13,825 | — | |||||
| Total current assets | 474,845 | 390,559 | |||||
| Noncurrent assets: | |||||||
| Fixed assets, net | 233,373 | 154,084 | |||||
| Intangible assets, net | 447,618 | 520,935 | |||||
| Goodwill | 1,181,681 | 1,247,459 | |||||
| Pension assets | 60,955 | — | |||||
| Other assets | 20,034 | 47,299 | |||||
| Noncurrent assets held-for-sale | 85,945 | — | |||||
| Total assets | $ | 2,504,451 | $ | 2,360,336 | |||
| LIABILITIES AND STOCKHOLDERS’ EQUITY | |||||||
| Current liabilities: | |||||||
| Accounts payable and accrued liabilities | $ | 188,264 | $ | 187,648 | |||
| Short-term debt and current portion of long-term debt | 4,448 | 195,263 | |||||
| Pension and postretirement benefits, current | 2,437 | 1,734 | |||||
| Fees received in advance | 226,581 | 200,705 | |||||
| Current liabilities held-for-sale | 9,449 | — | |||||
| Total current liabilities | 431,179 | 585,350 | |||||
| Noncurrent liabilities: | |||||||
| Long-term debt | 1,271,439 | 1,266,162 | |||||
| Pension benefits | 13,007 | 38,655 | |||||
| Postretirement benefits | 2,061 | 2,627 | |||||
| Deferred income taxes, net | 198,604 | 133,761 | |||||
| Other liabilities | 36,043 | 78,190 | |||||
| Noncurrent liabilities held-for-sale | 4,529 | — | |||||
| Total liabilities | 1,956,862 | 2,104,745 | |||||
| Commitments and contingencies | |||||||
| Stockholders’ equity: | |||||||
| Verisk Class A common stock, $.001 par value; 1,200,000,000 shares authorized; 544,003,038 shares issued and 167,457,927 and 167,727,073 outstanding, respectively | 137 | 137 | |||||
| Unearned KSOP contributions | (306 | ) | (483 | ) | |||
| Additional paid-in capital | 1,202,106 | 1,044,746 | |||||
| Treasury stock, at cost, 376,545,111 and 376,275,965 shares, respectively | (1,864,967 | ) | (1,605,376 | ) | |||
| Retained earnings | 1,254,107 | 905,727 | |||||
| Accumulated other comprehensive losses | (43,488 | ) | (89,160 | ) | |||
| Total stockholders’ equity | 547,589 | 255,591 | |||||
| Total liabilities and stockholders’ equity | $ | 2,504,451 | $ | 2,360,336 | |||
| 2010 | 2009 | 2008 | ||||||||||
| (In thousands) | ||||||||||||
| Cash flows from operating activities: | ||||||||||||
| Net income | $ | 242,552 | $ | 126,614 | $ | 158,228 | ||||||
| Adjustments to reconcile net income to net cash provided by operating activities: | ||||||||||||
| Depreciation and amortization of fixed assets | 40,728 | 38,578 | 35,317 | |||||||||
| Amortization of intangible assets | 27,398 | 32,621 | 29,555 | |||||||||
| Amortization of debt issuance costs | 1,463 | 785 | — | |||||||||
| Allowance for doubtful accounts | 648 | 916 | 1,536 | |||||||||
| KSOP compensation expense | 11,573 | 76,065 | 22,274 | |||||||||
| Acquisition related compensation expense | — | — | 300 | |||||||||
| Stock-based compensation | 21,298 | 12,744 | 9,881 | |||||||||
| Non-cash charges/(credits) associated with performance based appreciation awards | 789 | 4,039 | (91 | ) | ||||||||
| Interest income on notes receivable from stockholders | — | — | (1,050 | ) | ||||||||
| Proceeds from repayment of interest on notes receivable from stockholders | — | — | 2,318 | |||||||||
| Acquisition related liabilities adjustment | (544 | ) | — | — | ||||||||
| Realized (gains)/losses on securities, net | (95 | ) | 2,332 | 2,511 | ||||||||
| Deferred income taxes | 10,294 | 12,190 | 19,895 | |||||||||
| Other operating | 198 | 222 | 284 | |||||||||
| Loss on disposal of assets | 239 | 810 | 1,082 | |||||||||
| Non-cash charges associated with lease termination | — | 196 | — | |||||||||
| Excess tax benefits from exercised stock options | (49,015 | ) | (19,976 | ) | (26,099 | ) | ||||||
| Changes in assets and liabilities, net of effects from acquisitions: | ||||||||||||
| Accounts receivable | (24,559 | ) | (1,990 | ) | 3,609 | |||||||
| Prepaid expenses and other assets | 899 | (1,839 | ) | (6,486 | ) | |||||||
| Federal and foreign income taxes | 50,232 | 13,662 | 5,969 | |||||||||
| State and local income taxes | (5,679 | ) | 5,710 | (5,977 | ) | |||||||
| Accounts payable and accrued liabilities | 4,340 | 2,986 | 3,075 | |||||||||
| Acquisition related liabilities | — | (300 | ) | (2,200 | ) | |||||||
| Fees received in advance | 20,984 | 10,460 | (1,042 | ) | ||||||||
| Other liabilities | (17,711 | ) | 9,576 | (4,983 | ) | |||||||
| Net cash provided by operating activities | 336,032 | 326,401 | 247,906 | |||||||||
| Cash flows from investing activities: | ||||||||||||
| Acquisitions, net of cash acquired of $10,524, $9,477 and $365, respectively | (189,578 | ) | (61,350 | ) | (18,951 | ) | ||||||
| Purchase of noncontrolling interest in non-public companies | — | — | (5,800 | ) | ||||||||
| Earnout payments | — | (78,100 | ) | (98,100 | ) | |||||||
| Proceeds from release of acquisition related escrows | 283 | 129 | 558 | |||||||||
| Escrow funding associated with acquisitions | (15,980 | ) | (7,636 | ) | (1,500 | ) | ||||||
Purchases ofavailable-for-sale securities | (516 | ) | (575 | ) | (361 | ) | ||||||
Proceeds from sales and maturities ofavailable-for-sale securities | 743 | 886 | 21,724 | |||||||||
| Purchases of fixed assets | (38,641 | ) | (38,694 | ) | (30,652 | ) | ||||||
| Proceeds from repayment of notes receivable from stockholders | — | — | 3,863 | |||||||||
| Issuance of notes receivable from stockholders | — | — | (1,247 | ) | ||||||||
| Net cash used in investing activities | (243,689 | ) | (185,340 | ) | (130,466 | ) | ||||||
The accompanying notes are an integral part of these consolidated financial statements.
63
VERISK ANALYTICS, INC.
CONSOLIDATED STATEMENTS OF CASH FLOWS (Continued)
OPERATIONS
OPERATIONS
For The Years Ended December 31, 2010, 20092013, 2012 and 20082011
| 2010 | 2009 | 2008 | ||||||||||
| (In thousands) | ||||||||||||
| Cash flows from financing activities: | ||||||||||||
| Proceeds from issuance of long-term debt | — | 80,000 | 150,000 | |||||||||
| Proceeds from issuance of short-term debt with original maturities of three months or greater | 215,000 | — | 114,000 | |||||||||
| Proceeds/(repayments) of short-term debt, net | 35,000 | (59,244 | ) | (35,287 | ) | |||||||
| Redemption of ISO Class A common stock | — | (46,740 | ) | (387,561 | ) | |||||||
| Repurchase of ISO Class B common stock | — | — | (5,001 | ) | ||||||||
| Repurchase of Verisk Class A common stock | (210,246 | ) | — | — | ||||||||
Repurchase of VeriskClass B-1 common stock | (199,936 | ) | — | — | ||||||||
Repurchase of VeriskClass B-2 common stock | (9,879 | ) | — | — | ||||||||
| Net share settlement of taxes upon exercise of stock options | (15,051 | ) | — | — | ||||||||
| Repayment of current portion of long-term debt | — | (100,000 | ) | — | ||||||||
| Payment of debt issuance cost | (1,781 | ) | (4,510 | ) | — | |||||||
| Excess tax benefits from exercised stock options | 49,015 | 19,976 | 26,099 | |||||||||
| Proceeds from repayment of exercise price loans classified as a component of redeemable common stock | — | — | 29,482 | |||||||||
| Proceeds from stock options exercised | 35,482 | 7,709 | 892 | |||||||||
| Other financing | (6,391 | ) | — | — | ||||||||
| Net cash used in financing activities | (108,787 | ) | (102,809 | ) | (107,376 | ) | ||||||
| Effect of exchange rate changes | (109 | ) | 90 | (928 | ) | |||||||
| (Decrease)/increase in cash and cash equivalents | (16,553 | ) | 38,342 | 9,136 | ||||||||
| Cash and cash equivalents, beginning of period | 71,527 | 33,185 | 24,049 | |||||||||
| Cash and cash equivalents, end of period | $ | 54,974 | $ | 71,527 | $ | 33,185 | ||||||
| Supplemental disclosures: | ||||||||||||
| Taxes paid | $ | 113,609 | $ | 111,458 | $ | 99,323 | ||||||
| Interest paid | $ | 32,989 | $ | 34,201 | $ | 28,976 | ||||||
| Non-cash investing and financing activities: | ||||||||||||
| Loans made to directors and officers in connection with the exercise of stock options | $ | — | $ | — | $ | (20,148 | ) | |||||
| Repurchase of Verisk Class A common stock included in accounts payable and accrued liabilities | $ | 2,266 | $ | — | $ | — | ||||||
| Redemption of ISO Class A common stock used to repay maturities of notes receivable from stockholders | $ | — | $ | — | $ | 42,202 | ||||||
| Redemption of ISO Class A common stock used to fund the exercise of stock options | $ | — | $ | 2,326 | $ | 4,281 | ||||||
| Deferred tax liabilities established as a result of acquisitions | $ | (36,537 | ) | $ | (5,728 | ) | $ | (2,963 | ) | |||
| Capital lease obligations | $ | 1,554 | $ | 3,659 | $ | 2,610 | ||||||
| Capital expenditures included in accounts payable and accrued liabilities | $ | 2,138 | $ | 1,388 | $ | — | ||||||
| Decrease in goodwill due to finalization of acquisition related liabilities | $ | — | $ | (4,300 | ) | $ | — | |||||
| Increase in goodwill due to acquisition related escrow distributions | $ | 6,996 | $ | 181 | $ | 4,388 | ||||||
| Increase in goodwill due to accrual of acquisition related liabilities | $ | 3,500 | $ | — | $ | 82,400 | ||||||
| 2013 | 2012 | 2011 | |||||||||
| (In thousands, except for share and per share data) | |||||||||||
| Revenues (including amounts from related parties of $13,882, in 2011, Note 19) | $ | 1,595,703 | $ | 1,407,848 | $ | 1,191,393 | |||||
| Expenses: | |||||||||||
| Cost of revenues (exclusive of items shown separately below) | 622,523 | 516,708 | 440,979 | ||||||||
| Selling, general and administrative | 228,982 | 220,068 | 199,495 | ||||||||
| Depreciation and amortization of fixed assets | 66,190 | 46,637 | 40,135 | ||||||||
| Amortization of intangible assets | 63,741 | 52,207 | 32,985 | ||||||||
| Acquisition related liabilities adjustment | — | — | (3,364 | ) | |||||||
| Total expenses | 981,436 | 835,620 | 710,230 | ||||||||
| Operating income | 614,267 | 572,228 | 481,163 | ||||||||
| Other income (expense): | |||||||||||
| Investment income | 701 | 438 | 193 | ||||||||
| Realized (loss) gain on available-for-sale securities, net | (92 | ) | (332 | ) | 686 | ||||||
| Interest expense | (76,136 | ) | (72,508 | ) | (53,847 | ) | |||||
| Total other expense, net | (75,527 | ) | (72,402 | ) | (52,968 | ) | |||||
| Income before income taxes | 538,740 | 499,826 | 428,195 | ||||||||
| Provision for income taxes | (196,426 | ) | (182,363 | ) | (165,739 | ) | |||||
| Income from continuing operations | 342,314 | 317,463 | 262,456 | ||||||||
| Income from discontinued operations, net of tax of $4,753, $7,703 and $11,924, respectively (Note 10) | 6,066 | 11,679 | 20,302 | ||||||||
| Net income | $ | 348,380 | $ | 329,142 | $ | 282,758 | |||||
| Basic net income per share: | |||||||||||
| Income from continuing operations | $ | 2.04 | $ | 1.91 | $ | 1.58 | |||||
| Income from discontinued operations | 0.03 | 0.07 | 0.12 | ||||||||
| Basic net income per share | $ | 2.07 | $ | 1.98 | $ | 1.70 | |||||
| Diluted net income per share: | |||||||||||
| Income from continuing operations | $ | 1.99 | $ | 1.85 | $ | 1.51 | |||||
| Income from discontinued operations | 0.03 | 0.07 | 0.12 | ||||||||
| Diluted net income per share | $ | 2.02 | $ | 1.92 | $ | 1.63 | |||||
| Weighted average shares outstanding: | |||||||||||
| Basic | 168,031,412 | 165,890,258 | 166,015,238 | ||||||||
| Diluted | 172,276,360 | 171,709,518 | 173,325,110 | ||||||||
The accompanying notes are an integral part of these consolidated financial statements.
64
59
VERISK ANALYTICS, INC.
CONSOLIDATED STATEMENTS OF COMPREHENSIVE INCOME
For The Years Ended December 31, 2013, 2012 and 2011
| 2013 | 2012 | 2011 | |||||||||
| (In thousands) | |||||||||||
| Net income | $ | 348,380 | $ | 329,142 | $ | 282,758 | |||||
| Other comprehensive income (loss), net of tax: | |||||||||||
| Unrealized foreign currency (loss) gain | (840 | ) | 15 | (183 | ) | ||||||
| Unrealized holding loss on available-for-sale securities | (147 | ) | (197 | ) | (456 | ) | |||||
| Pension and postretirement adjustment | 46,659 | (10,691 | ) | (21,845 | ) | ||||||
| Total other comprehensive income (loss) | 45,672 | (10,873 | ) | (22,484 | ) | ||||||
| Comprehensive income | $ | 394,052 | $ | 318,269 | $ | 260,274 | |||||
The accompanying notes are an integral part of these consolidated financial statements.
60
VERISK ANALYTICS, INC.
CONSOLIDATED STATEMENTS OF CHANGES IN STOCKHOLDERS’ EQUITY (DEFICIT)
For The Years Ended December 31, 2013, 2012 and 2011
| Common Stock Issued | Unearned KSOP Contributions | Additional Paid-in Capital | Treasury Stock | Retained Earnings | Accumulated Other Comprehensive Losses | Total Stockholders’ Equity (Deficit) | ||||||||||||||||||||||||||||||
| Verisk Class A | Class B (Series 1) | Class B (Series 2) | Par Value | |||||||||||||||||||||||||||||||||
| (In thousands, except for share data) | ||||||||||||||||||||||||||||||||||||
| Balance, January 1, 2011 | 150,179,126 | 198,327,962 | 193,665,008 | $ | 135 | $ | (988 | ) | $ | 754,708 | $ | (1,106,321 | ) | $ | 293,827 | $ | (55,803 | ) | $ | (114,442 | ) | |||||||||||||||
| Net income | — | — | — | — | — | — | — | 282,758 | — | 282,758 | ||||||||||||||||||||||||||
| Other comprehensive loss | — | — | — | — | — | — | — | — | (22,484 | ) | (22,484 | ) | ||||||||||||||||||||||||
| Conversion of Class B-1 common stock (Note 15) | 198,327,962 | (198,327,962 | ) | — | — | — | — | — | — | — | ||||||||||||||||||||||||||
| Conversion of Class B-2 common stock (Note 15) | 193,665,008 | — | (193,665,008 | ) | — | — | — | — | — | — | — | |||||||||||||||||||||||||
| Treasury stock acquired - Class A (11,326,624 shares) | — | — | — | — | — | — | (380,710 | ) | — | — | (380,710 | ) | ||||||||||||||||||||||||
| KSOP shares earned | — | — | — | — | 297 | 12,318 | — | — | — | 12,615 | ||||||||||||||||||||||||||
| Stock options exercised, including tax benefit of $57,684 (3,716,165 shares reissued from treasury stock) | 1,830,942 | — | — | 2 | — | 85,051 | 15,978 | — | — | 101,031 | ||||||||||||||||||||||||||
| Stock based compensation | — | — | — | — | — | 22,656 | — | — | — | 22,656 | ||||||||||||||||||||||||||
| Other stock issuances | — | — | — | — | — | 75 | 11 | — | — | 86 | ||||||||||||||||||||||||||
| Balance, December 31, 2011 | 544,003,038 | — | — | 137 | (691 | ) | 874,808 | (1,471,042 | ) | 576,585 | (78,287 | ) | (98,490 | ) | ||||||||||||||||||||||
| Net income | — | — | — | — | — | — | — | 329,142 | — | 329,142 | ||||||||||||||||||||||||||
| Other comprehensive loss | — | — | — | — | — | — | — | — | (10,873 | ) | (10,873 | ) | ||||||||||||||||||||||||
| Treasury stock acquired - Class A (3,491,591 shares) | — | — | — | — | — | — | (162,586 | ) | — | — | (162,586 | ) | ||||||||||||||||||||||||
| KSOP shares earned | — | — | — | — | 208 | 12,903 | — | — | — | 13,111 | ||||||||||||||||||||||||||
| Stock options exercised, including tax benefit of $88,185 (6,880,678 shares reissued from treasury stock) | — | — | — | — | — | 131,824 | 28,039 | — | — | 159,863 | ||||||||||||||||||||||||||
| Restricted stock lapsed, including tax benefit of $202 (41,908 shares reissued from treasury stock) | — | — | — | — | — | 34 | 167 | — | — | 201 | ||||||||||||||||||||||||||
| Employee stock purchase plan (6,074 shares reissued from treasury stock) | — | — | — | — | — | 268 | 26 | — | — | 294 | ||||||||||||||||||||||||||
| Stock based compensation | — | — | — | — | — | 24,696 | — | — | — | 24,696 | ||||||||||||||||||||||||||
| Other stock issuances (4,777 shares reissued from treasury stock) | — | — | — | — | — | 213 | 20 | — | — | 233 | ||||||||||||||||||||||||||
| Balance, December 31, 2012 | 544,003,038 | — | — | 137 | (483 | ) | 1,044,746 | (1,605,376 | ) | 905,727 | (89,160 | ) | 255,591 | |||||||||||||||||||||||
| Net income | — | — | — | — | — | — | — | 348,380 | — | 348,380 | ||||||||||||||||||||||||||
| Other comprehensive income | — | — | — | — | — | — | — | — | 45,672 | 45,672 | ||||||||||||||||||||||||||
| Treasury stock acquired - Class A (4,532,552 shares) | — | — | — | — | — | — | (278,938 | ) | — | — | (278,938 | ) | ||||||||||||||||||||||||
| KSOP shares earned | — | — | — | — | 177 | 14,753 | — | — | — | 14,930 | ||||||||||||||||||||||||||
| Stock options exercised, including tax benefit of $57,065 (4,076,750 shares reissued from treasury stock) | — | — | — | — | — | 119,236 | 18,523 | — | — | 137,759 | ||||||||||||||||||||||||||
| Restricted stock lapsed, including tax benefit of $991 (150,668 shares reissued from treasury stock) | — | — | — | — | — | 333 | 658 | — | — | 991 | ||||||||||||||||||||||||||
| Employee stock purchase plan (27,879 shares reissued from treasury stock) | — | — | — | — | — | 1,533 | 129 | — | — | 1,662 | ||||||||||||||||||||||||||
| Stock based compensation | — | — | — | — | — | 21,087 | — | — | — | 21,087 | ||||||||||||||||||||||||||
| Other stock issuances (8,109 shares reissued from treasury stock) | — | — | — | — | — | 418 | 37 | — | — | 455 | ||||||||||||||||||||||||||
| Balance, December 31, 2013 | 544,003,038 | — | — | $ | 137 | $ | (306 | ) | $ | 1,202,106 | $ | (1,864,967 | ) | $ | 1,254,107 | $ | (43,488 | ) | $ | 547,589 | ||||||||||||||||
The accompanying notes are an integral part of these consolidated financial statements.
61
VERISK ANALYTICS, INC.
CONSOLIDATED STATEMENTS OF CASH FLOWS
For The Years Ended December 31, 2013, 2012 and 2011
| 2013 | 2012 | 2011 | |||||||||
| (In thousands) | |||||||||||
| Cash flows from operating activities: | |||||||||||
| Net income | $ | 348,380 | $ | 329,142 | $ | 282,758 | |||||
| Adjustments to reconcile net income to net cash provided by operating activities: | |||||||||||
| Depreciation and amortization of fixed assets | 70,279 | 50,624 | 43,827 | ||||||||
| Amortization of intangible assets | 64,299 | 53,575 | 34,792 | ||||||||
| Amortization of debt issuance costs and original issue discount | 2,713 | 2,337 | 1,655 | ||||||||
| Allowance for doubtful accounts | 2,482 | 1,065 | 1,278 | ||||||||
| KSOP compensation expense | 14,930 | 13,111 | 12,615 | ||||||||
| Stock based compensation | 21,087 | 24,696 | 22,656 | ||||||||
| Noncash charges associated with performance based appreciation awards | — | — | 585 | ||||||||
| Acquisition related liabilities adjustment | — | — | (3,364 | ) | |||||||
| Realized loss (gain) on securities, net | 92 | 332 | (686 | ) | |||||||
| Deferred income taxes | 44,140 | 63,261 | 21,321 | ||||||||
| Loss on disposal of fixed assets | 628 | 597 | 868 | ||||||||
| Excess tax benefits from exercised stock options | (109,946 | ) | (60,672 | ) | (53,195 | ) | |||||
| Other operating activities, net | 448 | 265 | 132 | ||||||||
| Changes in assets and liabilities, net of effects from acquisitions: | |||||||||||
| Accounts receivable | 2,106 | (6,425 | ) | (25,926 | ) | ||||||
| Prepaid expenses and other assets | (2,386 | ) | 550 | (2,720 | ) | ||||||
| Income taxes | 39,661 | 83,711 | 46,959 | ||||||||
| Accounts payable and accrued liabilities | 34,022 | 11,256 | 15,468 | ||||||||
| Fees received in advance | 26,970 | 20,493 | 12,373 | ||||||||
| Pension and postretirement benefits | (11,392 | ) | (105,829 | ) | (13,599 | ) | |||||
| Other liabilities | (41,593 | ) | (13,860 | ) | (22,076 | ) | |||||
| Net cash provided by operating activities | 506,920 | 468,229 | 375,721 | ||||||||
| Cash flows from investing activities: | |||||||||||
| Acquisitions, net of cash acquired of $0, $36,113 and $590, respectively | (983 | ) | (769,513 | ) | (121,721 | ) | |||||
| Purchase of non-controlling interest in non-public companies | ��� | (2,250 | ) | — | |||||||
| Earnout payments | — | (250 | ) | (3,500 | ) | ||||||
| Escrow funding associated with acquisitions | — | (38,800 | ) | (19,560 | ) | ||||||
| Proceeds from release of acquisition related escrows | 280 | 1,455 | — | ||||||||
| Purchases of fixed assets | (145,976 | ) | (74,373 | ) | (59,829 | ) | |||||
| Purchases of available-for-sale securities | (5,870 | ) | (1,784 | ) | (1,549 | ) | |||||
| Proceeds from sales and maturities of available-for-sale securities | 7,484 | 1,932 | 1,730 | ||||||||
| Other investing activities, net | (561 | ) | — | 300 | |||||||
| Net cash used in investing activities | (145,626 | ) | (883,583 | ) | (204,129 | ) | |||||
The accompanying notes are an integral part of these consolidated financial statements.
62
VERISK ANALYTICS, INC.
CONSOLIDATED STATEMENTS OF CASH FLOWS (Continued)
For The Years Ended December 31, 2013, 2012 and 2011
| 2013 | 2012 | 2011 | |||||||||
| (In thousands) | |||||||||||
| Cash flows from financing activities: | |||||||||||
| Proceeds from issuance of long-term debt, net of original issue discount | — | 347,224 | 696,559 | ||||||||
| Repayment of current portion of long-term debt | (180,000 | ) | — | (125,000 | ) | ||||||
| Repayment of short-term debt refinanced on a long-term basis | — | (347,224 | ) | (440,000 | ) | ||||||
| Proceeds from issuance of short-term debt with original maturities greater than three months | — | — | 120,000 | ||||||||
| (Repayment) proceeds from short-term debt, net | (10,000 | ) | 357,224 | 10,000 | |||||||
| Payment of debt issuance costs | (605 | ) | (3,905 | ) | (7,835 | ) | |||||
| Repurchases of Class A common stock | (277,411 | ) | (162,275 | ) | (381,776 | ) | |||||
| Excess tax benefits from exercised stock options | 109,946 | 60,672 | 53,195 | ||||||||
| Proceeds from stock options exercised | 80,368 | 68,388 | 43,345 | ||||||||
| Other financing activities, net | (6,770 | ) | (6,549 | ) | (3,268 | ) | |||||
| Net cash (used in) provided by financing activities | (284,472 | ) | 313,555 | (34,780 | ) | ||||||
| Effect of exchange rate changes | (840 | ) | 15 | (183 | ) | ||||||
| Increase (decrease) in cash and cash equivalents | 75,982 | (101,784 | ) | 136,629 | |||||||
| Cash and cash equivalents, beginning of period | 89,819 | 191,603 | 54,974 | ||||||||
| Cash and cash equivalents, end of period | $ | 165,801 | $ | 89,819 | $ | 191,603 | |||||
| Supplemental disclosures: | |||||||||||
| Taxes paid | $ | 126,846 | $ | 47,516 | $ | 117,717 | |||||
| Interest paid | $ | 75,084 | $ | 60,977 | $ | 48,158 | |||||
| Non-cash investing and financing activities: | |||||||||||
| Repurchases of Class A common stock included in accounts payable and accrued liabilities | $ | 3,038 | $ | 1,511 | $ | 1,200 | |||||
| Deferred tax (liability) asset established on the date of acquisitions | $ | (1,187 | ) | $ | (80,979 | ) | $ | 1,324 | |||
| Capital lease obligations | $ | 10,512 | $ | 3,869 | $ | 7,248 | |||||
| Capital expenditures included in accounts payable and accrued liabilities | $ | 5,960 | $ | 4,946 | $ | 3,437 | |||||
| Increase in goodwill due to acquisition related escrow distributions | $ | — | $ | 5,934 | $ | — | |||||
| Increase in goodwill due to accrual of acquisition related liabilities | $ | — | $ | — | $ | 250 | |||||
The accompanying notes are an integral part of these consolidated financial statements.
63
VERISK ANALYTICS, INC.
NOTES TO CONSOLIDATED FINANCIAL STATEMENTS
(Amounts in thousands, except for share and per share data, unless otherwise stated)
| 1. | Organization: |
Verisk Analytics, Inc. and its consolidated subsidiaries (“Verisk” or the “Company”) enable risk-bearing businesses to better understand and manage their risks. The Company provides its customers proprietary data that, combined with analytic methods, create embedded decision support solutions. The Company is one of the largest aggregators and providers of data pertaining to property and casualty (“P&C”) insurance risks in the United States of America (“U.S.”). The Company offers solutions for detecting fraud in the U.S. P&C insurance, mortgagefinancial and healthcare industries and sophisticated methods to predict and quantify loss in diverse contexts ranging from natural catastrophes to supply chain to health insurance. The Company provides solutions, including data, statistical models or tailored analytics, all designed to allow clients to make more logical decisions.
Verisk was established on May 23, 2008 to serve as the parent holding company of Insurance Services Office, Inc. (“ISO”) upon completion of the initial public offering (“IPO”)., which occurred on October 9, 2009. ISO was formed in 1971 as an advisory and rating organization for the P&C insurance industry to provide statistical and actuarial services, to develop insurance programs and to assist insurance companies in meeting state regulatory requirements. OverFor over the past decade, the Company has broadened its data assets, entered new markets, placed a greater emphasis on analytics, and pursued strategic acquisitions. On October 6, 2009, ISO effected a corporate reorganization whereby the Class A and Class B common stock of ISO were exchanged by the current stockholders for the common stock of Verisk on aone-for-one basis. Verisk immediately thereafter effected afifty-for-one stock split of its Class A and Class B common stock and equallysub-divided the Class B common stock into two new series of stock, Verisk Class B (Series 1)(“Class B-1”) and Verisk Class B (Series 2)(“Class B-2”). All share and per share information in the consolidated financial statements gives effect to thefifty-for-one stock split that occurred immediately after the reorganization.
| 2. | Basis of Presentation and Summary of Significant Accounting Policies: |
The accompanying consolidated financial statements have been prepared on the basis of accounting principles generally accepted in the United States of America (“U.S. GAAP”). The preparation of financial statements in conformity with these accounting principles requires management to make estimates and assumptions that affect the reported amounts of assets and liabilities and disclosure of contingent assets and liabilities at the date of the financial statements and the reported amounts of revenues and expenses during the reporting periods. Significant estimates include acquisition purchase price allocations, the fair value of goodwill, the realization of deferred tax assets, acquisition related liabilities, fair value of stock based
65
compensation, assets and liabilities for pension and postretirement benefits, fair value of the Company’s redeemable common stock, and the estimate for the allowance for doubtful accounts. Actual results may ultimately differ from those estimates. As of December 31, 2013, the Company's mortgage services business qualified as assets held-for-sale. Accordingly, the respective assets and liabilities have been classified as held-for-sale in the consolidated balance sheet at December 31, 2013. In addition, the results of operations for the Company's mortgage services business are reported as a discontinued operation for the years presented herein (See Note 10).
Significant accounting policies include the following:
(a) Intercompany Accounts and Transactions
The consolidated financial statements include the accounts of Verisk. All intercompany accounts and transactions have been eliminated.
(b) Revenue Recognition
The following describes the Company’s primary types of revenues and the applicable revenue recognition policies. The Company’s revenues are primarily derived from sales of services and revenue is recognized as services are performed and information is delivered to our customers. Revenue is recognized when persuasive evidence of an arrangement exists, delivery has occurred or services have been rendered, feesand/or price is fixed or determinable, and collectability is reasonably assured. Revenue is recognized net of applicable sales tax withholdings.
Industry-Standard Insurance Programs Statistical Agent and Data Services and Actuarial Services
Industry-standard insurance programs, statistical agent and data services and actuarial services are sold to participating insurance company customers under annual agreements covering a calendar year where the price is determined at the inception of the agreement. In accordance with Accounting Standards Codification (“ASC”) 605,Revenue Recognition,the Company recognizes revenue ratably over the term of these annual agreements, as services are performed and continuous access to information is provided over the entire term of the agreements.
64
Property-Specific Rating and Underwriting Information
The Company provides property-specific rating information through reports issued for specific commercial properties, for which revenue is recognized when the report is delivered to the customer, provided that all other revenue recognition criteria are met.
In addition, the Company provides hosting or software solutions that provide continuous access to information about the properties being insured and underwriting information in the form of standard policy forms to be used by customers. As the customer has a contractual right to take possession of the software without significant penalty, revenues from these arrangements are recognized ratably over the contract period from the time when the customer had access to the solution in accordance withASC 985-605,Software Revenue Recognition(“ (“ASC985-605”). The Company recognizes software license revenue when the arrangement does not require significant production, customization or modification of the software and the following criteria are met: persuasive evidence of an agreement exists, delivery has occurred, fees are fixed or determinable, and collections are probable. These software arrangements include post-contract customer support (“PCS”). The Company recognizes software license revenue ratably over the duration of the annual license term as vendor specific objective evidence (“VSOE”) of PCS, the only remaining undelivered element, cannot be established in accordance withASC 985-605. The PCS associated with these arrangements is coterminous with the duration of the license term.
Insurance
66
The Company recognizes software license revenue ratably over the duration of the annual license term as VSOE of PCS, the only remaining undelivered element, cannot be established in accordance withASC 985-605. The PCS associated with these arrangements is coterminous with the duration of the license term. In certain instances, the customers are billed for access on a monthly basis for the term-based software licenses and the Company recognizes revenue accordingly.
There are also services within insurance, which are comprised of transaction-based fees recognized as information is delivered to customers, provided that all other revenue recognition criteria have been met.
Financial Services
Financial services include various types of services to customers. The Company alsoprimarily recognizes revenue ratably for these services over the term of the agreements, as services are performed and continuous service is provided over the entire term of the agreements. In addition, there are certain services which are comprised of transaction-based fees; in these instances, revenue is recognized as information is delivered to customers, provided that all other revenue recognition criteria have been met.
Healthcare
The Company provides software hosting arrangements to customers whereby the customer does not have the right to take possession of the software. As these arrangements include PCS throughout the hosting term, revenues from these multiple element arrangements are recognized in accordance withASC 605-25,Revenue Recognition — Multiple Element Arrangements(“ (“ASC605-25”). The Company recognizes revenue ratably over the duration of the license term, which ranges from one to five years, since the contractual elements do not have stand alone value.
There are also services within healthcare, which are comprised of transaction-based fees recognized as information is delivered to customers, provided that all other revenue recognition criteria have been met.
Specialized Markets
Specialized markets consist of term-based software licenses. These software arrangements include PCS, which includes unspecified upgrades on a when-and-if available basis. The Company recognizes software license revenue ratably over the duration of the annual license term as VSOE of PCS, the only remaining undelivered element, cannot be established in accordance with ASC 985-605. The PCS associated with these arrangements is coterminous with the duration of the license term. In certain instances, the customers are billed for access on a monthly basis for the term-based software licenses and the Company recognizes revenue accordingly. In addition, specialized markets are comprised of transaction-based fees recognized as information is delivered to customers, provided that all other revenue recognition criteria have been met.
65
The Company services long-term contract arrangements with certain customers. For these arrangements, revenue is recognized in accordance withASC 605-35,Revenue Recognition Construction Type— Construction-Type and Certain Production-Type Contracts(“ (“ASC605-35”), using thepercentage-of-completion method, which requires the use of estimates. In such instances, management is required to estimate the input measures, based on hours incurred to date compared to total estimated hours of the project, with consideration also given to output measures, such as contract milestones, when applicable. Adjustments to estimates are made in the period in which the facts requiring such revisions become known. Accordingly, recognized revenues and profits are subject to revisions as the contract progresses to completion. The Company considers the contract substantially complete when there is compliance with all performance specifications and there are no remaining costs or potential risk.
The Company invoices its customers in annual, quarterly, monthly or milestone installments. Amounts billed and collected in advance of contract terms are recorded as “Fees received in advance” in the accompanying consolidated balance sheets and are recognized as the services are performed and the applicable revenue recognition criteria are met.
(d) Fixed Assets and Finite-lived Intangible Assets
Property and equipment, internal-use software and finite-lived intangibles are stated at cost less accumulated depreciation and amortization, which are computed on a straight-line basis over their estimated useful lives. Leasehold improvements are amortized over the shorter of the useful life of the asset or the lease term.
The Company’s internal software development costs primarily relate to internal-use software. Such costs are capitalized in the application development stage in accordance withASC 350-40,Internal-use Software. The Company also capitalizes software development costs upon the establishment of technological feasibility for a product in accordance with ASC 985-20, Software to be Sold, Leased, or Marketed (“ASC 985-20”). Software development costs are amortized on a straight-line basis over a three year-year period, which management believes represents the useful life of these capitalized costs.
67
In accordance with ASC 360,Property, Plant & Equipment, whenever events or changes in circumstances indicate that the carrying amount of long-lived assets and finite-lived intangible assets may not be recoverable, the Company reviews its long-lived assets and finite-lived intangible assets for impairment by first comparing the carrying value of the assets to the sum of the undiscounted cash flows expected to result from the use and eventual disposition of the assets. If the carrying value exceeds the sum of the assets’ undiscounted cash flows, the Company estimates and recognizes an impairment loss by taking the difference between the carrying value and fair value of the assets.
(e) Assets Held-for-Sale
The Company classifies its long-lived assets as held-for-sale when management commits to a plan to sell the assets, the assets are ready for immediate sale in their present condition, an active program to locate buyers has been initiated, the sale of the assets is probable and expected to be completed within one year, the assets are marketed at reasonable prices in relation to their fair value and it is unlikely that significant changes will be made to the plan to sell the assets. The Company measures the value of long-lived assets held for sale at the lower of the carrying amount or fair value, less cost to sell.
(f) Capital and Operating Leases
The Company leases various property, plant and equipment. Leased property is accounted for under ASC 840,Leases(“ (“ASC 840”). Accordingly, leased property that meets certain criteria is capitalized and the present value of the related lease payments is recorded as a liability. Amortization of assets accounted for as capital leases is computed utilizing the straight-line method over the shorter of the remaining lease term or the estimated useful life (principally 3 to 4 years for computer equipment and automobiles).
All other leases are accounted for as operating leases. Rent expense for operating leases, which may have rent escalation provisions or rent holidays, areis recorded on a straight-line basis over the non-cancelable bases lease period in accordance with ASC 840. The initial lease term generally includes the build-out period, where no rent payments are typically due under the terms of the lease. The difference between rent expenseexpensed and rent paid is recorded as deferred rent. Construction allowances received from landlords are recorded as a deferred rent credit and amortized to rent expense over the term of the lease.
66
(g) Investments
The Company’s investments at December 31, 20102013 and 2009 includes2012 included registered investment companies and equity investments in non-public companies. The Company accounts for short-term investments in accordance with ASC 320,Investments-Debt and Equity Securities(“ (“ASC 320”).
There are were no investments classified as trading securities at December 31, 20102013 or 2009.2012. All investments with readily determinable market values are classified asavailable-for-sale. While these investments are not held with the specific intention to sell them, they may be sold to support the Company’s investment strategies. Allavailable-for-sale investments are carried at fair value. The cost of allavailable-for-sale investments sold is based on the specific identification method, with the exception of mutual fund-based investments, which is based on the weighted average cost method. Dividend income is accrued on the ex-dividend date.
The Company performs periodic reviews of its investment portfolio when individual holdings have experienced a decline in fair value below their respective cost. The Company considers a number of factors in the evaluation of whether a decline in value isother-than-temporary including: (a) the financial condition and near term prospects of the issuer; (b) the Company’s ability and intent to retain the investment for a period of time sufficient to allow for an anticipated recovery in value; and (c) the period and degree to which the market value has been below cost. Where the decline is deemed to beother-than-temporary, a charge is recorded to “Realized gains/(losses)(loss) gain on available-for-sale securities, net” in the accompanying consolidated statements of operations, and a new cost basis is established for the investment.
The Company’s equity investments in non-public companies are included in “Other assets” in the accompanying consolidated balance sheets. Those securities are carried at cost, as the Company owns less than 20% of the stock and does not otherwise have the ability to exercise significant influence. These securities are written down to their estimated realizable value when
68
management considers there is another-than-temporary decline in value based on financial information received and the business prospects of the entity.
(h) Fair Value of Financial Instruments
The Company follows the provisions ofASC 820-10,Fair Value Measurements(“ (“ASC820-10”), which defines fair value, establishes a framework for measuring fair value under U.S. GAAP and expands fair value measurement disclosures. The Company follows the provisions ofASC 820-10 for its financial assets and liabilities recognized or disclosed at fair value on a recurring basis. The Company follows the provisions ofASC 820-10 for its non-financial assets and liabilities recognized or disclosed at fair value.
(i) Accounts Receivable and Allowance for Doubtful Accounts
Accounts receivable is generally recorded at the invoiced amount. The allowance for doubtful accounts is estimated based on an analysis of the aging of the accounts receivable, historical write-offs, customer payment patterns, individual customer creditworthiness, current economic trends,and/or establishment of specific reserves for customers in adverse financial condition. The Company reassessesassesses the adequacy of the allowance for doubtful accounts on a quarterly basis.
(j) Foreign Currency
The Company has determined local currencies are the functional currencies of the foreign operations. The assets and liabilities of foreign subsidiaries are translated at the period-end rate of exchange and statement of operations items are translated at the average rates prevailing during the year. The resulting translation adjustment is recorded as a component of “Accumulated other comprehensive loss”losses” in the accompanying consolidated statements of changes in stockholders’ deficit.equity (deficit).
(k) Stock Based Compensation
The Company follows ASC 718,Stock Compensation(“ (“ASC 718”). Under ASC 718, stock-basedstock based compensation cost is measured at the grant date, based on the fair value of the optionsawards granted, and is recognized as expense over the requisite service period. On January 1, 2005,
Other equity awards, including restricted stock, are valued at the Company adopted ASC 718 using a prospective approach, as required under ASC 718. Under this application, the Company is required to record compensation expense for all awards granted after the date of adoption.
67
VERISK ANALYTICS, INC.
NOTES TO CONSOLIDATED FINANCIAL STATEMENTS — (Continued)
The Company estimates expected forfeitures of equity awards at the date of grant and recognizes compensation expense only for those awards expected to vest. The forfeiture assumption is ultimately adjusted to the actual forfeiture rate. Changes in the forfeiture assumptions may impact the total amount of expense ultimately recognized, over the requisite service period, and may impactas well as the timing of expense recognized over the requisite service period.
(l) Research and Development Costs
Research and development costs, which are primarily relaterelated to the personnel and related overhead costs incurred in developing new services for our customers, are expensed as incurred. Such costs were $14,870, $14,109$21,426, $18,386 and $11,054$15,393 for the years ended December 31, 2010, 20092013, 2012 and 2008,2011, respectively, and were included in “Selling, general and administrative” expenses in the accompanying consolidated statements of operations.
(m) Advertising Costs
Advertising costs, which are primarily associated with promoting the Company’s brand, names and solutions provided, are expensed as incurred. Such costs were $8,457, $6,166 and $5,777 for the years ended December 31, 2013, 2012 and 2011, respectively.
(n) Income Taxes
The Company accounts for income taxes under the asset and liability method under ASC 740,Income Taxes(“ (“ASC 740”), which requires the recognition of deferred tax assets and liabilities for the expected future tax consequences of events that have been included in the financial statements. Under this method, deferred tax assets and liabilities are determined based on the differences between the financial statements and tax basis of assets and liabilities using enacted tax rates in effect for the year in which the differences are expected to reverse. The effect of a change in tax rates on deferred tax assets and liabilities is recognized in income in the period that includes the enactment date.
Deferred tax assets are recorded to the extent these assets are more likely than not to be realized. In making such determination, the Company considers all available positive and negative evidence, including future reversals of existing taxable temporary differences, projected future taxable income, tax planning strategies and recent financial operations. Valuation allowances are recognized to reduce deferred tax assets if it is determined to be more likely than not that all or some of the potential deferred tax assets will not be realized.
The Company followsASC 740-10,Income Taxes(“ (“ASC740-10”),which clarifies the accounting for uncertainty in income taxes recognized in the financial statements.ASC 740-10 provides that a tax benefit from an uncertain tax position may be recognized based on the technical merits when it is more likely than not that the position will be sustained upon examination, including resolutions of any related appeals or litigation processes. Income tax positions must meet a more likely than not recognition threshold at the effective date to be recognized upon the adoption ofASC 740-10 and in subsequent periods. This interpretationstandard also provides guidance on measurement, derecognition, classification, interest and penalties, accounting in interim periods, disclosure and transition.
The Company recognizes interest and penalties related to unrecognized tax benefits within the income tax expense line in the accompanying consolidated statements of operations. Accrued interest and penalties are included within “Other liabilities” on the accompanying consolidated balance sheets.
(o) Earnings Per Share
Basic and diluted earnings per share (“EPS”) are determined in accordance with ASC 260,Earnings per Share, which specifies the computation, presentation and disclosure requirements for EPS. Basic EPS excludes all dilutive common stock equivalents. It is based upon the weighted average number of common shares outstanding during the period. Diluted EPS, as calculated using the treasury stock method, reflects the potential dilution that would occur if the Company’s dilutive
70
outstanding stock options and stock awards were exercised. For purposes of calculating EPS, Class A,Class B-1issued. andClass B-2 common shares are combined since all classes have identical rights to earnings.
(p) Pension and Postretirement Benefits
The Company accounts for its pension and postretirement benefits under ASC 715,Compensation — Retirement Benefits(“ (“ASC 715”). ASC 715 requires the recognition of the funded status of a benefit plan in the balance sheet, the recognition in other comprehensive income of gains or losses and prior service costs or credits arising during the period, but which are not included as components of periodic benefit cost, and the measurement of defined benefit plan assets and obligations as of the balance sheet date. The Company utilizes a valuation date of December 31.
68
VERISK ANALYTICS, INC.
NOTES TO CONSOLIDATED FINANCIAL STATEMENTS — (Continued)
(q) Product Warranty Obligations
The Company provides warranty coverage for certain of its products.solutions. The Company recognizes a product warranty obligation when claims are probable and can be reasonably estimated. As of December 31, 20102013 and 2009,2012, product warranty obligations were not significant.
material.
In the ordinary course of business, the Company enters into numerous agreements that contain standard indemnities whereby the Company indemnifies another party for breaches of confidentiality, infringement of intellectual property or gross negligence. Such indemnifications are primarily granted under licensing of computer software. Most agreements contain provisions to limit the maximum potential amount of future payments that the Company could be required to make under these indemnifications,indemnifications; however, the Company is not able to develop an estimate of the maximum potential amount of future payments to be made under these indemnifications as the triggering events are not subject to predictability.
(r) Loss Contingencies
The Company accrues for costs relating to litigation, claims and other contingent matters when such liabilities become probable and reasonably estimable. Such estimates are based on management’s judgment. Actual amounts paid may differ from amounts estimated, and such differences will be charged to operations in the period in which the final determination of the liability is made.
(s) Goodwill
Goodwill represents the excess of acquisition costs over the fair value of tangible net assets and identifiable intangible assets of the businesses acquired. Goodwill and intangible assets deemed to have indefinite lives are not amortized. Intangible assets determined to have finite lives are amortized over their useful lives. Goodwill and intangible assets with indefinite lives are subject to impairment testing annually as of June 30 or whenever events or changes in circumstances indicate that the carrying amount may not be fully recoverable. The Company completed the required annual impairment test as of June 30, 2010,2013, which resulted in no impairment of goodwill in 2010.2013. This test compares the carrying value of each reporting unit to its fair value. If the fair value of the reporting unit exceeds the carrying value of the net assets, including goodwill assigned to that reporting unit, goodwill is not impaired. If the carrying value of the reporting unit’s net assets, including goodwill, exceeds the fair value of the reporting unit, then the Company will determine the implied fair value of the reporting unit’s goodwill. If the carrying value of a reporting unit’s goodwill exceeds its implied fair value, then an impairment loss is recorded for the difference between the carrying amount and the implied fair value of the goodwill.
(t) Recent Accounting Pronouncements
In December 2010,February 2013, the Financial Accounting Standards Board (“FASB”) issued Accounting Standards Update (“ASU”)No. 2010-28,2013-02, When to Perform Step 2Reporting of the Goodwill Impairment Test for
71
Amounts Reclassified Out of Accumulated Other Comprehensive Income VERISK ANALYTICS, INC.
In determining whether it is more likely than not that a goodwill impairment exists,February 2013, the FASB issued ASU No. 2013-04, Obligations Resulting from Joint and Several Liability Arrangements for Which the Total Amount of the Obligation Is Fixed at the Reporting Date (“ASU No. 2013-04”). Under ASU No. 2013-04, an entity should consider whether there are any adverse qualitative factors indicating that an impairment may exist.is required to measure and disclose the amounts and nature of obligations resulting from joint and several liability arrangements for which the total amount of the obligation is fixed at the reporting date. ASUNo. 2010-282013-04 is effective for fiscal years, and interim reporting periods within those years, beginning after December 15, 2010.2013. Early adoption is permitted. The Company has elected not permitted.to early adopt this standard. The adoption of ASUNo. 2010-28 will not have any impact on the Company’s consolidated financial statements, and the Company will incorporate the provisions of this guidance as part of their Step 1 testing for goodwill impairment in 2011.
In January 2010,March 2013, the FASB issued ASUNo. 2010-06,2013-05, Fair Value Measurements and DisclosuresParent’s Accounting for the Cumulative Translation Adjustment upon Derecognition of Certain Subsidiaries or Groups of Assets within a Foreign Entity or of an Investment
69
in a Foreign Entity (“ASUNo. 2010-06”2013-05”). Under ASUNo. 2010-06 provides guidance on improving disclosures on fair value measurements, such as the transfers between Level 1, Level 2 and Level 3 inputs and the disaggregated activity2013-05, an entity is required to release any related cumulative translation adjustment into net income upon cessation to have a controlling financial interest in the rollforward for Level 3 fair value measurements.a subsidiary or group of assets within a foreign entity. ASUNo. 2010-06 2013-05 is effective prospectively for interimfiscal years, and annualinterim reporting periods beginning after December 15, 2009, except for the disclosures about the disaggregated activity in the rollforward for Level 3 fair value measurements. Those disclosures are effective for fiscalwithin those years, beginning after December 15, 2010 and for interim periods within those fiscal periods. The adoption of the portion of ASUNo. 2010-06 that discusses the transfers between Level 1, Level 2 and Level 3 inputs, effective January 1, 2010, did not have a material impact on the Company’s consolidated financial statements. As the Company currently disaggregates the activity in the rollforward for Level 3 fair value measurements, they do not expect ASUNo. 2010-06 to have any impact on its consolidated financial statements.
In July 2013, the FASB issued ASU No. 2013-11, Presentation of an Unrecognized Tax Benefit When a Net Operating Loss Carryforward, a Similar Tax Loss, or a Tax Credit Carryforward Exists (“ASU No. 2013-11”). Under ASU No. 2013-11, an unrecognized tax benefit should be presented as our Company’s multiple deliverables arrangementsa reduction to a deferred tax asset for a net operating loss carryforward, a similar tax loss, or a tax credit carryforward, with the exception that these unrecognized tax benefits are comprised primarilynot available at the reporting date to settle any additional income taxes that would result from the disallowance of software licensesa tax position or the tax law. An additional exception applies when the tax law does not require the entity to use, and services, rather than hardware. Currently,the entity does not intend to use, the deferred tax asset for such purpose, then the unrecognized tax benefit should be presented as a majorityliability and should not be combined with deferred tax assets. ASU No. 2013-11 is effective for fiscal years, and interim reporting periods within those years, beginning after December 15, 2013. Early adoption is permitted. The Company has elected not to early adopt this standard. The adoption of our deliverables doASU No. 2013-11 is not expected to have stand alone value, which would precludea material impact on the separation and allocationCompany's consolidated financial statements.
3. Concentration of the arrangement. Therefore, the Company will continue to recognize revenue over the duration of the license term.
72
Credit Risk:
Financial instruments that potentially expose the Company to credit risk consist primarily of cash and cash equivalents, available for sale securities and accounts receivable, which are generally not collateralized. The Company maintains, in cash and cash equivalents, higher credit quality financial institutions in order to limit the amount of credit exposure. The total cash balances are insured by the Federal Deposit Insurance Corporation (“FDIC”) to a maximum amount of $250$250 per bank at December 31, 20102013 and 2009.2012. At December 31, 20102013 and 2009,2012, the Company had cash balances on deposit that exceeded the balance insured by the FDIC limit by approximately $35,514$138,028 and $54,339$63,495 with six and five banks, respectively. At December 31, 20102013 and 2009,2012, the Company also had cash on deposit with foreign banks of approximately $18,198$26,228 and $16,130,$25,015, respectively.
The Company considers the concentration of credit risk associated with its trade accounts receivable to be commercially reasonable and believes that such concentration does not result in the significant risk of near-term severe adverse impacts. The Company’s top fifty customers represent approximately 45%38% of revenues for all periods presented,2013, 38% for 2012 and 40% for 2011 with no individual customer accounting for more than 5%, 4% and 4%3% of revenues during the years ended December 31, 2010, 20092013, 2012 and 2008, respectively.2011. No individual customer comprised more than 10%5% of accounts receivable at December 31, 2010 or 2009.2013 and 4% at December 31, 2012.
| 4. | Cash and Cash Equivalents: |
Cash and cash equivalents consist of cash in banks, commercial paper, money-market funds, and other liquid instruments with original maturities of 90 days or less at the time of purchase.
| 5. | Accounts Receivable: |
Accounts Receivable consistsreceivable consisted of the following at December 31:
| 2010 | 2009 | |||||||
| Billed receivables | $ | 122,874 | $ | 88,048 | ||||
| Unbilled receivables | 7,718 | 5,232 | ||||||
| Total receivables | 130,592 | 93,280 | ||||||
| Less allowance for doubtful accounts | (4,028 | ) | (3,844 | ) | ||||
| Accounts receivable, net | $ | 126,564 | $ | 89,436 | ||||
| 2013 | 2012 | ||||||
| Billed receivables | $ | 143,059 | $ | 165,174 | |||
| Unbilled receivables | 19,903 | 18,009 | |||||
| Total receivables | 162,962 | 183,183 | |||||
| Less allowance for doubtful accounts | (4,415 | ) | (4,753 | ) | |||
| Accounts receivable, net | $ | 158,547 | $ | 178,430 | |||
70
| Gross | Gross | |||||||||||||||
| Adjusted | Unrealized | Unrealized | ||||||||||||||
| Cost | Gains | Losses | Fair Value | |||||||||||||
December 31, 2010 | ||||||||||||||||
| Registered investment companies | $ | 4,398 | $ | 1,248 | $ | — | $ | 5,646 | ||||||||
| Equity securities | 14 | — | (7 | ) | 7 | |||||||||||
Totalavailable-for-sale securities | $ | 4,412 | $ | 1,248 | $ | (7 | ) | $ | 5,653 | |||||||
December 31, 2009 | ||||||||||||||||
| Registered investment companies | $ | 4,530 | $ | 905 | $ | — | $ | 5,435 | ||||||||
| Equity securities | 14 | — | (4 | ) | 10 | |||||||||||
Totalavailable-for-sale securities | $ | 4,544 | $ | 905 | $ | (4 | ) | $ | 5,445 | |||||||
73
VERISK ANALYTICS, INC.
NOTES TO CONSOLIDATED FINANCIAL STATEMENTS — (Continued)
6. Investments:
Available-for-sale securities consisted of the following:
Adjusted Cost | Gross Unrealized Gain | Gross Unrealized Loss | Fair Value | ||||||||||||
| December 31, 2013 | |||||||||||||||
| Registered investment companies | $ | 4,098 | $ | — | $ | (187 | ) | $ | 3,911 | ||||||
| December 31, 2012 | |||||||||||||||
| Registered investment companies | $ | 4,830 | $ | 53 | $ | — | $ | 4,883 | |||||||
In addition to theavailable-for-sale securities above, the Company has equity investments in non-public companies in which the Company acquired non-controlling interests and for which no readily determinable market value exists. These securities were accounted for under the cost method in accordance withASC 323-10-25,The Equity Method of Accounting for Investments in Common Stock(“ASC323-10-25”). At December 31, 20102013 and 2009,2012, the carrying value of such securities was $3,642$3,602 and $3,841 for each period$5,015, respectively, and has been included in “Other assets” in the accompanying consolidated balance sheets.
Realized gains/(losses)(loss) gain on securities, net, including write downs related toother-than-temporary impairments ofavailable-for-sale securities and other assets, werewas as follows for the years ended December 31, 2010, 2009 and 2008:31:
| 2010 | 2009 | 2008 | ||||||||||
| Gross realized gains/(losses) on sale of registered investment securities | $ | 95 | $ | 66 | $ | (1,306 | ) | |||||
Other-than-temporary impairment of registered investment securities | — | (386 | ) | (1,205 | ) | |||||||
Other-than-temporary impairment of noncontrolling interest in non-public companies | — | (2,012 | ) | — | ||||||||
| Realized gains/(losses) on securities, net | $ | 95 | $ | (2,332 | ) | $ | (2,511 | ) | ||||
| 2013 | 2012 | 2011 | |||||||||
| Gross realized gain on sale of registered investment securities | $ | 966 | $ | 420 | $ | 803 | |||||
| Other-than-temporary impairment of registered investment securities | (84 | ) | (74 | ) | (117 | ) | |||||
| Other-than-temporary impairment of non-controlling interest in non-public companies | (974 | ) | (678 | ) | — | ||||||
| Realized (loss) gain on securities, net | $ | (92 | ) | $ | (332 | ) | $ | 686 | |||
7. Fair Value Measurements:
Certain assets and liabilities of the Company are reported at fair value in the accompanying consolidated balance sheets. Such assets and liabilities include amounts for both financial and non-financial instruments. To increase consistency and comparability of assets and liabilities recorded at fair value,ASC 820-10 establishes a three-level fair value hierarchy to prioritize the inputs to valuation techniques used to measure fair value.ASC 820-10 requires disclosures detailing the extent to which companies’ measure assets and liabilities at fair value, the methods and assumptions used to measure fair value and the effect of fair value measurements on earnings. In accordance withASC 820-10, the Company applied the following fair value hierarchy:
| Level 1 — Assets or liabilities for which the identical item is traded on an active exchange, such as publicly-traded instruments. | ||
Level 2 — Assets and liabilities valued based on observable market data for similar instruments.
Level 3 — Assets or liabilities for which significant valuation assumptions are not readily observable in the market; instruments valued based on the best available data, some of which is internally-developed, and considers risk premiums that a market participant would require.
The following tables providetable provides information for such assets and liabilities as of December 31, 20102013 and 2009.2012. The fair values of cash and cash equivalents (other than money-market funds which are recorded on a reported net asset value basis disclosed below), accounts receivable, accounts payable and accrued liabilities, acquisition related liabilities prior to the adoption of ASC 805,Business Combinations(“ (“ASC 805”), short-term debt, and short-term debt expected to be refinanced approximate their carrying amounts because of the short-term nature of these instruments.
The following table summarizes fair value measurements by level for cash equivalents and registered investment companies that were measured at fair value on a recurring basis:
71
| Total | Quoted Prices in Active Markets for Identical Assets (Level 1) | Significant Other Observable Inputs (Level 2) | |||||||||
| December 31, 2013 | |||||||||||
| Cash equivalents – money-market funds | $ | 889 | $ | — | $ | 889 | |||||
| Registered investment companies(1) | $ | 3,911 | $ | 3,911 | $ | — | |||||
| December 31, 2012 | |||||||||||
| Cash equivalents – money-market funds | $ | 760 | $ | — | $ | 760 | |||||
| Registered investment companies(1) | $ | 4,883 | $ | 4,883 | $ | — | |||||
| (1) | Registered investment companies are classified as available-for-sale securities and are valued using quoted prices in active markets multiplied by the number of shares owned. |
The Company has not elected to carry its long-term debt at fair value. The carrying value of the long-term debt represents amortized cost. The Company assesses the fair value of the Company’sits long-term debt was estimated at $584,361based on quoted market prices if available, and $578,804 as of December 31, 2010 and 2009, respectively, and is based onif not, an estimate of interest rates available to the Company for debt with similar features, the Company’s current credit
74
rating and spreads applicable to the Company. These assets and liabilities are not presented in the following table.
The following table summarizes fair value measurements by level at December 31, 2010 and 2009 for assets and other balancesof the long-term debt would be a Level 2 liability if the long-term debt was measured at fair value on a recurring basis:
| Quoted Prices | Significant | |||||||||||||||
| in Active Markets | Other | Significant | ||||||||||||||
| for Identical | Observable | Unobservable | ||||||||||||||
| Total | Assets (Level 1) | Inputs (Level 2) | Inputs (Level 3) | |||||||||||||
December 31, 2010 | ||||||||||||||||
| Cash equivalents – money-market funds | $ | 2,273 | $ | — | $ | 2,273 | $ | — | ||||||||
| Registered investment companies(1) | $ | 5,646 | $ | 5,646 | $ | — | $ | — | ||||||||
| Equity securities(1) | $ | 7 | $ | 7 | $ | — | $ | — | ||||||||
| Contingent consideration under ASC 805(2) | $ | (3,337 | ) | $ | — | $ | — | $ | (3,337 | ) | ||||||
December 31, 2009 | ||||||||||||||||
| Registered investment companies(1) | $ | 5,435 | $ | 5,435 | $ | — | $ | — | ||||||||
| Equity securities(1) | $ | 10 | $ | 10 | $ | — | $ | — | ||||||||
| Cost-based investment recorded at fair value on a non-recurring basis(3) | $ | 1,809 | $ | — | $ | — | $ | 1,809 | ||||||||
| Contingent consideration under ASC 805(2) | $ | (3,344 | ) | $ | — | $ | — | $ | (3,344 | ) | ||||||
| 2010 | 2009 | |||||||
| Beginning balance | $ | 3,344 | $ | — | ||||
| Acquisitions(1) | 491 | 3,344 | ||||||
| Acquisition related liabilities adjustment(1) | (544 | ) | — | |||||
| Accretion on acquisition related liabilities | 46 | — | ||||||
| Ending balance | $ | 3,337 | $ | 3,344 | ||||
| 2013 | 2012 | ||||||||||||||
| Carrying Value | Estimated Fair Value | Carrying Value | Estimated Fair Value | ||||||||||||
| Financial instrument not carried at fair value: | |||||||||||||||
| Long-term debt excluding capitalized leases | $ | 1,265,129 | $ | 1,335,844 | $ | 1,454,409 | $ | 1,575,950 | |||||||
72
| 8. | Fixed Assets |
The following is a summary of fixed assets as of December 31:assets:
| Accumulated | ||||||||||||||||
| Depreciation and | ||||||||||||||||
| Useful Life | Cost | Amortization | Net | |||||||||||||
2010 | ||||||||||||||||
| Furniture and office equipment | 3-10 years | $ | 116,228 | $ | (84,465 | ) | $ | 31,763 | ||||||||
| Leasehold improvements | Lease term | 31,420 | (14,653 | ) | 16,767 | |||||||||||
| Purchased software | 3 years | 52,115 | (40,216 | ) | 11,899 | |||||||||||
| Software development costs | 3 years | 100,376 | (69,773 | ) | 30,603 | |||||||||||
| Leased equipment | 3-4 years | 18,362 | (15,985 | ) | 2,377 | |||||||||||
| Total fixed assets | $ | 318,501 | $ | (225,092 | ) | $ | 93,409 | |||||||||
2009 | ||||||||||||||||
| Furniture and office equipment | 3-10 years | $ | 101,067 | $ | (72,434 | ) | $ | 28,633 | ||||||||
| Leasehold improvements | Lease term | 28,065 | (12,019 | ) | 16,046 | |||||||||||
| Purchased software | 3 years | 45,214 | (33,306 | ) | 11,908 | |||||||||||
| Software development costs | 3 years | 86,324 | (59,018 | ) | 27,306 | |||||||||||
| Leased equipment | 3-4 years | 18,370 | (13,098 | ) | 5,272 | |||||||||||
| Total fixed assets | $ | 279,040 | $ | (189,875 | ) | $ | 89,165 | |||||||||
| Useful Life | Cost | Accumulated Depreciation and Amortization | Net | ||||||||||
| December 31, 2013 | |||||||||||||
| Furniture and office equipment | 3-10 years | $ | 179,564 | $ | (105,262 | ) | $ | 74,302 | |||||
| Leasehold improvements | Lease term | 38,796 | (22,022 | ) | 16,774 | ||||||||
| Purchased software | 3 years | 89,064 | (65,753 | ) | 23,311 | ||||||||
| Software development costs | 3 years | 201,192 | (91,656 | ) | 109,536 | ||||||||
| Leased equipment | 3-4 years | 33,956 | (24,506 | ) | 9,450 | ||||||||
| Total fixed assets | $ | 542,572 | $ | (309,199 | ) | $ | 233,373 | ||||||
| December 31, 2012 | |||||||||||||
| Furniture and office equipment | 3-10 years | $ | 137,578 | $ | (89,153 | ) | $ | 48,425 | |||||
| Leasehold improvements | Lease term | 34,844 | (20,198 | ) | 14,646 | ||||||||
| Purchased software | 3 years | 70,155 | (53,575 | ) | 16,580 | ||||||||
| Software development costs | 3 years | 161,338 | (90,840 | ) | 70,498 | ||||||||
| Leased equipment | 3-4 years | 26,150 | (22,215 | ) | 3,935 | ||||||||
| Total fixed assets | $ | 430,065 | $ | (275,981 | ) | $ | 154,084 | ||||||
Depreciation and amortization of fixed assets for the years ended December 31, 2010, 20092013, 2012 and 2008,2011 were $40,728, $38,578$66,190, $46,637 and $35,317,$40,135, of which $10,755, $9,394$12,806, $8,935 and $10,091 were$7,940 related to amortization of internal-use software development costs, respectively. Amortization expense related to development of software for sale in accordance with ASC 985-20 was $3,623 for the year ended December 31, 2013. There was no amortization expense related to development of software for sale during the years ended December 31, 2012 and 2011 as these projects were in process. The Company had unamortized software development costs that had been capitalized in accordance with ASC 985-20 of $29,149 and $24,004 as of December 31, 2013 and 2012, respectively. Leased equipment includes amounts held under capital leases for automobiles, computer software and computer equipment.
9. Acquisitions:
2012 Acquisitions
Goodwill represents the excess of acquisition costs over the fair value of tangible net assets and identifiable intangible assets of the businesses acquired. Goodwill and intangible assets deemed to have indefinite lives are not amortized. Intangible assets determined to have finite lives are amortized over their useful lives. The Company completed the required annual impairment test as of June 30, 2010, 20092013, 2012 and 2008,2011, which resulted in no impairment of goodwill.
76
Based on the results of the impairment assessment as of June 30, 2013, the Company determined that the fair value of its reporting units exceeded their respective carrying value. There were no goodwill impairment indicators after the date of the last annual impairment test.
The following is a summary of the change in goodwill from December 31, 20082011 through December 31, 2010,2013, both in total and as allocated to the Company’s operating segments:
| Risk | Decision | |||||||||||
| Assessment | Analytics | Total | ||||||||||
| Goodwill at December 31, 2008(1) | $ | 27,908 | $ | 419,464 | $ | 447,372 | ||||||
| Current year acquisitions | — | 49,776 | 49,776 | |||||||||
| Finalization of acquisition related liabilities | — | (4,300 | ) | (4,300 | ) | |||||||
| Purchase accounting reclassifications | — | (2,600 | ) | (2,600 | ) | |||||||
| Acquisition related escrow funding | — | 400 | 400 | |||||||||
| Finalization of acquisition related escrows | 181 | 181 | ||||||||||
| Goodwill at December 31, 2009(1) | $ | 27,908 | $ | 462,921 | $ | 490,829 | ||||||
| Current year acquisitions | — | 115,414 | 115,414 | |||||||||
| Accrual of acquisition related liabilities | — | 3,500 | 3,500 | |||||||||
| Purchase accounting reclassifications | — | (51 | ) | (51 | ) | |||||||
| Acquisition related escrow funding | — | 15,980 | 15,980 | |||||||||
| Finalization of acquisition related escrows | — | 6,996 | 6,996 | |||||||||
| Goodwill at December 31, 2010(1) | $ | 27,908 | $ | 604,760 | $ | 632,668 | ||||||
| Risk Assessment | Decision Analytics | Total | |||||||||
| Goodwill at December 31, 2011 (1) | $ | 27,908 | $ | 682,036 | $ | 709,944 | |||||
| Current year acquisitions | 26,647 | 465,261 | 491,908 | ||||||||
| Purchase accounting reclassifications | — | 873 | 873 | ||||||||
| Acquisition related escrow funding | 1,000 | 37,800 | 38,800 | ||||||||
| Finalization of acquisition related escrows | — | 5,934 | 5,934 | ||||||||
| Goodwill at December 31, 2012 (1) | 55,555 | 1,191,904 | 1,247,459 | ||||||||
| Current year acquisitions | — | 705 | 705 | ||||||||
| Purchase accounting reclassifications | — | 2,724 | 2,724 | ||||||||
| Discontinued operations (Note 10) | — | (69,207 | ) | (69,207 | ) | ||||||
| Goodwill at December 31, 2013 (1) | $ | 55,555 | $ | 1,126,126 | $ | 1,181,681 | |||||
| (1) | These balances are net of accumulated impairment charges of |
During the year ended December 31, 2012, the Company finalized the purchase accounting for the acquisitions of HRP and Bloodhound. The Company’s purchase accounting reclassifications primarily related to the finalization of HRP and Bloodhound, which resulted in an increase in goodwill of $836, and an increase in liabilities of $1,233, an increase in other assets of $882, and a decrease in fixed assets of $226. The impact of these adjustments on the consolidated statementstatements of operations is immaterial.
77
VERISK ANALYTICS, INC.
NOTES TO CONSOLIDATED FINANCIAL STATEMENTS — (Continued)
The Company’s intangible assets and related accumulated amortization consisted of the following:
| Weighted | ||||||||||||||||
| Average | Accumulated | |||||||||||||||
| Useful Life | Cost | Amortization | Net | |||||||||||||
December 31, 2010 | ||||||||||||||||
| Technology-based | 7 years | $ | 210,212 | $ | (136,616 | ) | $ | 73,596 | ||||||||
| Marketing-related | 5 years | 40,882 | (28,870 | ) | 12,012 | |||||||||||
| Contract-based | 6 years | 6,555 | (6,287 | ) | 268 | |||||||||||
| Customer-related | 13 years | 145,567 | (31,214 | ) | 114,353 | |||||||||||
| Total intangible assets | $ | 403,216 | $ | (202,987 | ) | $ | 200,229 | |||||||||
December 31, 2009 | ||||||||||||||||
| Technology-based | 6 years | $ | 174,973 | $ | (117,986 | ) | $ | 56,987 | ||||||||
| Marketing-related | 4 years | 35,104 | (24,690 | ) | 10,414 | |||||||||||
| Contract-based | 6 years | 6,555 | (6,092 | ) | 463 | |||||||||||
| Customer-related | 12 years | 67,534 | (26,872 | ) | 40,662 | |||||||||||
| Total intangible assets | $ | 284,166 | $ | (175,640 | ) | $ | 108,526 | |||||||||
| Weighted Average Useful Life | Cost | Accumulated Amortization | Net | ||||||||||
| December 31, 2013 | |||||||||||||
| Technology-based | 8 years | $ | 294,940 | $ | (180,581 | ) | $ | 114,359 | |||||
| Marketing-related | 5 years | 71,047 | (44,274 | ) | 26,773 | ||||||||
| Contract-based | 6 years | 6,555 | (6,555 | ) | — | ||||||||
| Customer-related | 13 years | 388,505 | (82,019 | ) | 306,486 | ||||||||
| Total intangible assets | $ | 761,047 | $ | (313,429 | ) | $ | 447,618 | ||||||
| Weighted Average Useful Life | Cost | Accumulated Amortization | Net | ||||||||||
| December 31, 2012 | |||||||||||||
| Technology-based | 8 years | $ | 313,590 | $ | (177,929 | ) | $ | 135,661 | |||||
| Marketing-related | 5 years | 79,101 | (41,079 | ) | 38,022 | ||||||||
| Contract-based | 6 years | 6,555 | (6,555 | ) | — | ||||||||
| Customer-related | 13 years | 413,043 | (65,791 | ) | 347,252 | ||||||||
| Total intangible assets | $ | 812,289 | $ | (291,354 | ) | $ | 520,935 | ||||||
Amortization expense related to intangible assets for the years ended December 31, 2010, 20092013, 2012 and 2008,2011, was approximately $27,398, $32,621$63,741, $52,207, and $29,555,$32,985, respectively. Estimated amortization expense in future periods through 20162019 and thereafter for intangible assets subject to amortization is as follows:
Year | Amount | |||
| 2011 | $ | 30,896 | ||
| 2012 | 27,551 | |||
| 2013 | 22,038 | |||
| 2014 | 14,911 | |||
| 2015 | 14,724 | |||
| 2016 and Thereafter | 90,109 | |||
| Total | $ | 200,229 | ||
| Year | Amount | ||
| 2014 | $ | 56,630 | |
| 2015 | 50,714 | ||
| 2016 | 48,883 | ||
| 2017 | 47,980 | ||
| 2018 | 47,234 | ||
| 2019 and thereafter | 196,177 | ||
| Total | $ | 447,618 | |
78
| SA | CP | 3E | Total | |||||||||||||
| Accounts receivable | $ | 832 | $ | 2,694 | $ | 9,691 | $ | 13,217 | ||||||||
| Current assets | 55 | 517 | 1,820 | 2,392 | ||||||||||||
| Fixed assets | 159 | 1,962 | 2,123 | 4,244 | ||||||||||||
| Intangible assets | 4,993 | 57,194 | 55,838 | 118,025 | ||||||||||||
| Goodwill | 4,006 | 51,727 | 75,661 | 131,394 | ||||||||||||
| Other assets | 1,500 | 6,750 | 7,963 | 16,213 | ||||||||||||
| Total assets acquired | 11,545 | 120,844 | 153,096 | 285,485 | ||||||||||||
| Deferred income taxes | 810 | 20,257 | 15,470 | 36,537 | ||||||||||||
| Current liabilities | 853 | 2,165 | 22,163 | 25,181 | ||||||||||||
| Other liabilities | 1,996 | 8,083 | 8,130 | 18,209 | ||||||||||||
| Total liabilities assumed | 3,659 | 30,505 | 45,763 | 79,927 | ||||||||||||
| Net assets acquired | $ | 7,886 | $ | 90,339 | $ | 107,333 | $ | 205,558 | ||||||||
79
| Weighted | ||||||||||||||||||||
| Average | ||||||||||||||||||||
| Useful Life | SA | CP | 3E | Total | ||||||||||||||||
| Technology-based | 10 years | $ | 2,143 | $ | 19,489 | $ | 13,541 | $ | 35,173 | |||||||||||
| Marketing-related | 10 years | 678 | 2,634 | 1,934 | 5,246 | |||||||||||||||
| Customer-related | 15 years | 2,172 | 35,071 | 40,363 | 77,606 | |||||||||||||||
| Total intangible assets | 13 years | $ | 4,993 | $ | 57,194 | $ | 55,838 | $ | 118,025 | |||||||||||
80
| Weighted Average | ||||||||
| Useful Life | Total | |||||||
| Technology-based | 12 years | $ | 9,282 | |||||
| Marketing-related | 5 years | 4,698 | ||||||
| Customer-related | 8 years | 11,285 | ||||||
| Total intangible assets | 9 years | $ | 25,265 | |||||
81
| 12. Income Taxes: |
The components of the provision for income taxes from continuing operations for the years ended December 31 iswere as follows:
| 2010 | 2009 | 2008 | ||||||||||
| Current: | ||||||||||||
| Federal and foreign | $ | 126,075 | $ | 98,886 | $ | 93,522 | ||||||
| State and local | 24,651 | 26,603 | 12,358 | |||||||||
| $ | 150,726 | $ | 125,489 | $ | 105,880 | |||||||
| Deferred: | ||||||||||||
| Federal and foreign | $ | 7,933 | $ | 11,603 | $ | 9,789 | ||||||
| State and local | 5,439 | 899 | 5,002 | |||||||||
| $ | 13,372 | $ | 12,502 | $ | 14,791 | |||||||
| Provision for income taxes | $ | 164,098 | $ | 137,991 | $ | 120,671 | ||||||
| 2013 | 2012 | 2011 | |||||||||
| Current: | |||||||||||
| Federal and foreign | $ | 135,215 | $ | 111,713 | $ | 122,872 | |||||
| State and local | 18,764 | 8,442 | 20,523 | ||||||||
| 153,979 | 120,155 | 143,395 | |||||||||
| Deferred: | |||||||||||
| Federal and foreign | 38,160 | 56,036 | 14,027 | ||||||||
| State and local | 4,287 | 6,172 | 8,317 | ||||||||
| 42,447 | 62,208 | 22,344 | |||||||||
| Provision for income taxes | $ | 196,426 | $ | 182,363 | $ | 165,739 | |||||
78
The reconciliation between the Company’s effective tax rate on income from continuing operations and the statutory tax rate is as follows for the years ended December 31:
| 2010 | 2009 | 2008 | ||||||||||
| Federal statutory rate | 35.0 | % | 35.0 | % | 35.0 | % | ||||||
| State and local taxes, net of federal tax benefit | 4.8 | % | 6.9 | % | 5.0 | % | ||||||
| Non-deductible KSOP expenses | 1.0 | % | 9.8 | % | 2.7 | % | ||||||
| Other | (0.4 | )% | 0.5 | % | 0.6 | % | ||||||
| Effective tax rate for continuing operations | 40.4 | % | 52.2 | % | 43.3 | % | ||||||
| 2013 | 2012 | 2011 | ||||||
| Federal statutory rate | 35.0 | % | 35.0 | % | 35.0 | % | ||
| State and local taxes, net of federal tax benefit | 2.6 | % | 1.7 | % | 4.0 | % | ||
| Non-deductible KSOP expenses | 0.9 | % | 0.9 | % | 1.0 | % | ||
| Other | (2.0 | )% | (1.1 | )% | (1.3 | )% | ||
| Effective tax rate for continuing operations | 36.5 | % | 36.5 | % | 38.7 | % | ||
The decrease in the effective tax rate in 20102012 compared to 20092011 was due to benefits resulting from the non-recurring, non-cash costs associated with the accelerated ESOP allocation and certain IPO related costs that are not deductible.
successful execution of tax planning strategies.
The tax effects of significant items comprising the Company’s deferred tax assets as of December 31 isare as follows:
| 2010 | 2009 | |||||||
| Deferred income tax asset: | ||||||||
| Employee wages, pensions and other benefits | $ | 75,064 | $ | 74,986 | ||||
| Deferred revenue adjustment | 3,505 | 3,243 | ||||||
| Deferred rent adjustment | 5,324 | 4,481 | ||||||
| Net operating loss carryover | 2,573 | 3,085 | ||||||
| State tax adjustments | 7,722 | 7,134 | ||||||
| Capital and other unrealized losses | 4,437 | 4,611 | ||||||
| Other | 5,047 | 4,877 | ||||||
| Total | 103,672 | 102,417 | ||||||
| Less valuation allowance | (1,485 | ) | (2,110 | ) | ||||
| Deferred income tax asset | 102,187 | 100,307 | ||||||
| Deferred income tax liability: | ||||||||
| Depreciation and amortization | (73,105 | ) | (28,558 | ) | ||||
| Other | (3,522 | ) | (1,087 | ) | ||||
| Deferred income tax liability | (76,627 | ) | (29,645 | ) | ||||
| Deferred income taxes, net | $ | 25,560 | $ | 70,662 | ||||
| 2013 | 2012 | ||||||
| Deferred income tax asset: | |||||||
| Employee wages and other benefits | $ | 26,113 | $ | 50,133 | |||
| Deferred revenue | 1,835 | 2,705 | |||||
| Deferred rent | 4,342 | 4,944 | |||||
| Net operating loss carryover | 8,247 | 17,088 | |||||
| State tax adjustments | 1,639 | 3,626 | |||||
| Capital and other unrealized losses | 3,301 | 3,240 | |||||
| Other | 6,720 | 6,279 | |||||
| Total | 52,197 | 88,015 | |||||
| Less valuation allowance | (741 | ) | (595 | ) | |||
| Deferred income tax asset | 51,456 | 87,420 | |||||
| Deferred income tax liability: | |||||||
| Fixed assets and intangible assets | (223,639 | ) | (206,553 | ) | |||
| Pension, postretirement and other | (21,344 | ) | (4,231 | ) | |||
| Deferred income tax liability | (244,983 | ) | (210,784 | ) | |||
| Deferred income tax liability, net | $ | (193,527 | ) | $ | (123,364 | ) | |
The deferred income tax asset and liability has been classified in “Deferred income taxes, net” in the accompanying consolidated balance sheets as of December 31, as follows:
| 2013 | 2012 | ||||||
| Current deferred income tax asset, net | $ | 5,077 | $ | 10,397 | |||
| Non-current deferred income tax liability, net | (198,604 | ) | (133,761 | ) | |||
| Deferred income tax liability, net | $ | (193,527 | ) | $ | (123,364 | ) | |
| 2010 | 2009 | |||||||
| Current deferred income tax asset, net | $ | 3,681 | $ | 4,405 | ||||
| Non-current deferred income tax asset, net | 21,879 | 66,257 | ||||||
| Deferred income taxes, net | $ | 25,560 | $ | 70,662 | ||||
As a result of certain realization requirements of ASC 718, the table of net deferred tax assets shown above does not include certain deferred tax assets that arose directly from tax deductions related to equity compensation in excess of compensation recognized for financial reporting. Equity will increase by $3,846$1,854 if
83
and when such deferred tax assets are ultimately realized. The Company uses tax law ordering for purposes of determining when excess tax benefits have been realized.
79
to the pension and post retirement plans in the amount of $5,728 was recorded in connection withcurrent period as well as the acquisition of D2. Excluding the final resolution of indemnity escrowsother timing differences attributable to depreciation and contingent considerations, the Company finalized the purchase accounting for D2 during the first quarter of 2010, with no changes to deferred taxes since December 31, 2009.
amortization.
The ultimate realization of the deferred tax assets depends on the Company’s ability to generate sufficient taxable income in the future.
The Company has provided for a valuation allowance against the deferred tax assetassets associated with the capital loss carryforwards expiring in 2012 and the net operating losses of certain foreign subsidiaries in Germany and Israel.subsidiaries. The Company’s net operating loss carryforwards expire as follows:
Years | Amount | |||
| 2011-2018 | $ | 44,973 | ||
| 2019-2023 | 436 | |||
| 2024-2030 | 15,396 | |||
| $ | 60,805 | |||
| Years | Amount | ||
| 2014-2021 | $ | 12,916 | |
| 2022-2026 | 14,345 | ||
| 2027-2033 | 52,478 | ||
| $ | 79,739 | ||
A valuation allowance has been established based on management’sthe Company’s evaluation of the likelihood of utilizing the capital loss carryforwards and foreign net operating lossesthese benefits before they expire. ManagementThe Company has determined that the generation of future German and Israeli taxable income from certain subsidiaries to fully realize the deferred tax assets is uncertain. Therefore, a full valuation allowance for Israel and a partial valuation allowance for Germany have been established. Other than these items, managementthe Company has determined, based on the Company’s historical operating performance, that taxable income of the Company will more likely than not be sufficient to fully realize the deferred tax assets.
earnings.
The Company followsASC 740-10, which prescribes a comprehensive model for the financial statement recognition, measurement, presentation and disclosure of uncertain tax positions taken or expected to be taken in income tax returns. For each tax position, the Company must determine whether it is more likely than not that the position will be sustained upon examination based on the technical merits of the position, including resolution of any related appeals or litigation. A tax position that meets the more likely than not recognition threshold is then measured to determine the amount of benefit to recognize within the
84
financial statements. No benefits may be recognized for tax positions that do not meet the more likely than not threshold. A reconciliation of the beginning and ending amount of unrecognized tax benefit is as follows:
| 2010 | 2009 | 2008 | ||||||||||
| Unrecognized tax benefit at January 1 | $ | 27,322 | $ | 31,659 | $ | 32,030 | ||||||
| Gross increase in tax positions in prior period | 492 | 1,317 | 5,958 | |||||||||
| Gross decrease in tax positions in prior period | (2,547 | ) | (3,508 | ) | (3,548 | ) | ||||||
| Gross increase in tax positions in current period | 1,773 | 2,052 | 4,454 | |||||||||
| Gross increase in tax positions from stock acquisitions | 392 | — | — | |||||||||
| Settlements | (536 | ) | (2,143 | ) | (3,240 | ) | ||||||
| Lapse of statute of limitations | (3,816 | ) | (2,055 | ) | (3,995 | ) | ||||||
| Unrecognized tax benefit at December 31 | $ | 23,080 | $ | 27,322 | $ | 31,659 | ||||||
| 2013 | 2012 | 2011 | |||||||||
| Unrecognized tax benefit at January 1 | $ | 17,883 | $ | 17,877 | $ | 23,080 | |||||
| Gross increase in tax positions in prior period | 541 | 911 | 3,684 | ||||||||
| Gross decrease in tax positions in prior period | (4,241 | ) | (1,494 | ) | (1,753 | ) | |||||
| Gross increase in tax positions in current period | — | — | 281 | ||||||||
| Gross increase in tax positions from stock acquisitions | — | 3,304 | 97 | ||||||||
| Gross decrease in tax positions from stock acquisitions | — | — | (20 | ) | |||||||
| Settlements | (390 | ) | (1,770 | ) | (1,477 | ) | |||||
| Lapse of statute of limitations | (4,269 | ) | (945 | ) | (6,015 | ) | |||||
| Unrecognized tax benefit at December 31 | $ | 9,524 | $ | 17,883 | $ | 17,877 | |||||
Of the total unrecognized tax benefits at December 31, 2010, 20092013, 2012 and 2008, $14,770, $15,6442011, $4,658, $10,103 and $18,575,$9,939, respectively, represent the amountamounts that, if recognized, would have a favorable effect on the Company’s effective tax rate in any future periods.
The total gross amount of accrued interest and penalties at December 31, 2010, 20092013, 2012 and 20082011 was $7,753, $7,384$2,619, $3,728 and $8,116,$4,690, respectively. The Company’s practice is to recognize interest and penalties associated with income taxes as a component of “Provision for income taxes” in the accompanying consolidated statements of operations.
The Company does not expect a significant increase in unrecognized benefits related to federal, foreign, or state tax exposures within the coming year. In addition, the Company believes that it is reasonably possible that approximately $4,934$3,862 of
80
its currently remaining unrecognized tax positions, each of which is individually insignificant, may be recognized by the end of 20112014 as a result of a combination of audit settlements and lapses of statute of limitations, net of additional uncertain tax positions.
The Company is subject to tax in the U.S. and in various state and foreign jurisdictions. The Company joined by its domestic subsidiaries, files a consolidated income tax return for the Federal income tax purposes. With few exceptions, the Company is no longer subject to U.S. federal, state and local ornon-U.S. income tax examinations by tax authorities for tax years before 2007. In Massachusetts, the Company is being audited for the years 2003 through 2008 with a statute extension to June 30, 2011. In New York, the Company is being audited for the years 2003 through 2006 with a statute extension to June 17, 2011.2010. The Internal Revenue Service completed an audit for the 2009 period 2006 through 2007 and have commenced an audit for the 2008 period. The Company does not expect that the results of these examinations will have a material effect on its financial position or results of operations.with no changes.
85
| 13. Composition of Certain Financial Statement Captions: |
The following tables presenttable presents the components of “Other current assets,”assets”, “Accounts payable and accrued liabilities” and “Other liabilities” atas of December 31:
| 2010 | 2009 | |||||||
| Other current assets: | ||||||||
| Acquisition related escrows | $ | 6,167 | $ | 20,142 | ||||
| Other current assets | 899 | 1,514 | ||||||
| Total other current assets | $ | 7,066 | $ | 21,656 | ||||
| Accounts payable and accrued liabilities: | ||||||||
| Accrued salaries, benefits and other related costs | $ | 60,013 | $ | 56,114 | ||||
| Other current liabilities | 51,982 | 45,287 | ||||||
| Total accounts payable and accrued liabilities | $ | 111,995 | $ | 101,401 | ||||
| Other liabilities: | ||||||||
| Unrecognized tax benefits | $ | 30,833 | $ | 34,706 | ||||
| Deferred rent | 14,292 | 12,244 | ||||||
| Other liabilities | 45,088 | 30,010 | ||||||
| Total other liabilities | $ | 90,213 | $ | 76,960 | ||||
| 2013 | 2012 | ||||||
| Other current assets: | |||||||
| Acquisition related escrows | $ | 27,967 | $ | 29,277 | |||
| Other current assets | 6,714 | 9,832 | |||||
| Total other current assets | $ | 34,681 | $ | 39,109 | |||
| Accounts payable and accrued liabilities: | |||||||
| Accrued salaries, benefits and other related costs | $ | 79,372 | $ | 78,979 | |||
| Escrow liabilities | 27,918 | 28,954 | |||||
| Other current liabilities | 80,974 | 79,715 | |||||
| Total accounts payable and accrued liabilities | $ | 188,264 | $ | 187,648 | |||
| Other liabilities: | |||||||
| Unrecognized tax benefits, including interest and penalty | $ | 12,143 | $ | 21,611 | |||
| Deferred rent | 12,219 | 12,919 | |||||
| Other liabilities | 11,681 | 43,660 | |||||
| Total other liabilities | $ | 36,043 | $ | 78,190 | |||
81 14. Debt: |
The following table presents short-term and long-term debt by issuance:issuance as of December 31:
Issuance Date | Maturity Date | 2013 | 2012 | ||||||||
| Short-term debt and current portion of long-term debt: | |||||||||||
| Syndicated revolving credit facility | Various | Various | $ | — | $ | 10,000 | |||||
| Prudential shelf notes: | |||||||||||
| 6.13% Series G shelf notes | 8/8/2006 | 8/8/2013 | — | 75,000 | |||||||
| 5.84% Series H shelf notes | 10/26/2007 | 10/26/2013 | — | 17,500 | |||||||
| 6.28% Series I shelf notes | 4/29/2008 | 4/29/2013 | — | 15,000 | |||||||
| Principal shelf notes: | |||||||||||
| 6.16% Series B shelf notes | 8/8/2006 | 8/8/2013 | — | 25,000 | |||||||
| New York Life shelf notes: | |||||||||||
| 5.87% Series A shelf notes | 10/26/2007 | 10/26/2013 | — | 17,500 | |||||||
| Aviva Investors shelf notes: | |||||||||||
| 6.46% Series A shelf notes | 4/27/2009 | 4/27/2013 | — | 30,000 | |||||||
| Capital lease obligations | Various | Various | 4,448 | 5,263 | |||||||
| Short-term debt and current portion of long-term debt | 4,448 | 195,263 | |||||||||
| Long-term debt: | |||||||||||
| Senior notes: | |||||||||||
| 4.125% senior notes, less unamortized discount of $2,415 and $2,692 as of December 31, 2013 and 2012, respectively | 9/12/2012 | 9/12/2022 | 347,585 | 347,308 | |||||||
| 4.875% senior notes, less unamortized discount of $1,699, and $2,037 as of December 31, 2013 and 2012, respectively | 12/8/2011 | 1/15/2019 | 248,301 | 247,963 | |||||||
| 5.80% senior notes, less unamortized discount of $757 and $862 as of December 31, 2013 and 2012, respectively | 4/6/2011 | 5/1/2021 | 449,243 | 449,138 | |||||||
| Prudential shelf notes: | |||||||||||
| 5.84% Series H shelf notes | 10/26/2007 | 10/26/2015 | 17,500 | 17,500 | |||||||
| 6.28% Series I shelf notes | 4/29/2008 | 4/29/2015 | 85,000 | 85,000 | |||||||
| 6.85% Series J shelf notes | 6/15/2009 | 6/15/2016 | 50,000 | 50,000 | |||||||
| New York Life shelf notes: | |||||||||||
| 5.87% Series A shelf notes | 10/26/2007 | 10/26/2015 | 17,500 | 17,500 | |||||||
| 6.35% Series B shelf notes | 4/29/2008 | 4/29/2015 | 50,000 | 50,000 | |||||||
| Capital lease obligations | Various | Various | 6,310 | 1,753 | |||||||
| Long-term debt | 1,271,439 | 1,266,162 | |||||||||
| Total debt | $ | 1,275,887 | $ | 1,461,425 | |||||||
| Issuance | Maturity | December 31, | December 31, | |||||||||||||
| Date | Date | 2010 | 2009 | |||||||||||||
| Short-term debt and current portion of long-term debt: | ||||||||||||||||
| Syndicated revolving credit facility | 12/29/2010 | 1/31/2011 | $ | 40,000 | $ | — | ||||||||||
| Syndicated revolving credit facility | 12/29/2010 | 1/31/2011 | 15,000 | — | ||||||||||||
| Syndicated revolving credit facility | 12/13/2010 | 2/14/2011 | 40,000 | — | ||||||||||||
| Syndicated revolving credit facility | 12/13/2010 | 3/14/2011 | 30,000 | — | ||||||||||||
| Syndicated revolving credit facility | 12/15/2010 | 3/15/2011 | 130,000 | — | ||||||||||||
| Syndicated revolving credit facility | 12/13/2010 | 6/13/2011 | 55,000 | — | ||||||||||||
| Syndicated revolving credit facility | 12/16/2009 | 1/19/2010 | — | 10,000 | ||||||||||||
| Syndicated revolving credit facility | 12/23/2009 | 1/25/2010 | — | 50,000 | ||||||||||||
| Prudential senior notes: | ||||||||||||||||
| 4.60% Series E senior notes | 6/14/2005 | 6/13/2011 | 50,000 | — | ||||||||||||
| 6.00% Series F senior notes | 8/8/2006 | 8/8/2011 | 25,000 | — | ||||||||||||
| Principal senior notes: | ||||||||||||||||
| 6.03% Series A senior notes | 8/8/2006 | 8/8/2011 | 50,000 | — | ||||||||||||
| Capital lease obligations | Various | Various | 2,429 | 5,488 | ||||||||||||
| Other | Various | Various | 288 | 1,172 | ||||||||||||
| Short-term debt and current portion of long-term debt | $ | 437,717 | $ | 66,660 | ||||||||||||
86
| Issuance | Maturity | December 31, | December 31, | |||||||||||||
| Date | Date | 2010 | 2009 | |||||||||||||
| Long-term debt: | ||||||||||||||||
| Prudential senior notes: | ||||||||||||||||
| 4.60% Series E senior notes | 6/14/2005 | 6/13/2011 | $ | — | $ | 50,000 | ||||||||||
| 6.00% Series F senior notes | 8/8/2006 | 8/8/2011 | — | 25,000 | ||||||||||||
| 6.13% Series G senior notes | 8/8/2006 | 8/8/2013 | 75,000 | 75,000 | ||||||||||||
| 5.84% Series H senior notes | 10/26/2007 | 10/26/2013 | 17,500 | 17,500 | ||||||||||||
| 5.84% Series H senior notes | 10/26/2007 | 10/26/2015 | 17,500 | 17,500 | ||||||||||||
| 6.28% Series I senior notes | 4/29/2008 | 4/29/2013 | 15,000 | 15,000 | ||||||||||||
| 6.28% Series I senior notes | 4/29/2008 | 4/29/2015 | 85,000 | 85,000 | ||||||||||||
| 6.85% Series J senior notes | 6/15/2009 | 6/15/2016 | 50,000 | 50,000 | ||||||||||||
| Principal senior notes: | ||||||||||||||||
| 6.03% Series A senior notes | 8/8/2006 | 8/8/2011 | — | 50,000 | ||||||||||||
| 6.16% Series B senior notes | 8/8/2006 | 8/8/2013 | 25,000 | 25,000 | ||||||||||||
| New York Life senior notes: | ||||||||||||||||
| 5.87% Series A senior notes | 10/26/2007 | 10/26/2013 | 17,500 | 17,500 | ||||||||||||
| 5.87% Series A senior notes | 10/26/2007 | 10/26/2015 | 17,500 | 17,500 | ||||||||||||
| 6.35% Series B senior notes | 4/29/2008 | 4/29/2015 | 50,000 | 50,000 | ||||||||||||
| Aviva Investors North America: | ||||||||||||||||
| 6.46% Series A senior notes | 4/27/2009 | 4/27/2013 | 30,000 | 30,000 | ||||||||||||
| Other obligations: | ||||||||||||||||
| Capital lease obligations | Various | Various | 1,628 | 2,094 | ||||||||||||
| Other | Various | Various | 198 | 415 | ||||||||||||
| Long-term debt | $ | 401,826 | $ | 527,509 | ||||||||||||
| Total debt | $ | 839,543 | $ | 594,169 | ||||||||||||
Accrued interest associated with the Company’s outstanding debt obligations was $4,583$16,150 and $4,371$17,811 as of December 31, 20102013 and 2009,2012, respectively, and included in “Accounts payable and accrued liabilities” within the accompanying consolidated balance sheets. Consolidated interestInterest expense associated with the Company’s outstanding debt obligations was $33,045, $35,021$73,068, $69,892 and $30,863$51,915 for the years ended December 31, 2010, 20092013, 2012 and 2008,2011, respectively.
82
Senior Notes
On September 12, 2012, the Company completed an issuance of senior notes in the aggregate principal amount of $350,000. These senior notes are due on September 12, 2022 and accrue interest at a rate of 4.125% per annum. Interest is payable semi-annually on March 12 and September 12 of each year.
On December 8, 2011, the Company completed an issuance of senior notes in the aggregate principal amount of $250,000. These senior notes are due on January 15, 2019 and accrue interest at a rate of 4.875% per annum. Interest is payable semi-annually on January 15th and July 15th of each year.
On April 6, 2011, the Company completed an issuance of senior notes in the aggregate principal amount of $450,000. These senior notes are due on May 1, 2021 and accrue interest at a rate of 5.80% per annum. Interest is payable semi-annually on May 1st and November 1st of each year.
Verisk Analytics, Inc. (the "Parent Company") issued senior notes that are fully and unconditionally guaranteed, jointly and severally, on an unsecured and unsubordinated basis by ISO, the principal operating subsidiary and certain subsidiaries that guarantee the syndicated revolving credit facility or any amendment, refinancing or replacement thereof (See Note 21. Condensed Consolidated Financial Information for Guarantor Subsidiaries and Non-Guarantor Subsidiaries for further information). The debt issuance costs are amortized from the date of issuance to the maturity date. The senior notes rank equally with all of the Company’s existing and future senior unsecured and unsubordinated indebtedness. However, the senior notes are subordinated to the indebtedness of any of the subsidiaries that do not guarantee the senior notes and are effectively subordinated to any future secured indebtedness to the extent of the value of the assets securing such indebtedness. The guarantees of the senior notes rank equally and ratably in right of payment with all other existing and future unsecured and unsubordinated indebtedness of the guarantors, and senior in right of payment to all future subordinated indebtedness of the guarantors. Because the guarantees of the senior notes are not secured, such guarantees are effectively subordinated to any existing and future secured indebtedness of the applicable guarantor to the extent of the value of the collateral securing that indebtedness. Upon a change of control event, the holders of the senior notes have the right to require the Company to repurchase all or any part of such holder’s senior notes at a purchase price in cash equal to 101% of the principal amount of the senior notes plus accrued and unpaid interest, if any, to the date of repurchase. The indenture governing the senior notes restricts the Company’s ability and its subsidiaries’ ability to, among other things, create certain liens, enter into sale/leaseback transactions and consolidate with, sell, lease, convey or otherwise transfer all or substantially all of the Company's assets, or merge with or into, any other person or entity.
Prudential Master Shelf Agreement
87
this agreement. As of December 31, 20102013 and 2009,2012, $152,500 and $260,000 was outstanding under this agreement, respectively. During the year ended December 31, 2013, the Company had long-term debtrepaid $107,500 of its outstanding of $335,000borrowings under this agreement. Theagreement that had matured during the year. Prudential Shelf Notes contain covenants that, among other things, require the Company to maintain certain leverage and interest coverage ratios.
Principal Master Shelf Agreement
New York Life Master Shelf Agreement
this agreement. As of December 31, 20102013 and 2009,2012, $67,500 and $85,000 was outstanding under this agreement. Theagreement, respectively. During the year ended December 31, 2013, the Company repaid $17,500 of its outstanding borrowings under this agreement that matured in October 2013. New York Life Shelf Notes contain covenants that, among other things, require the Company to maintain certain leverage and fixed chargeinterest coverage ratios.
Aviva Master Shelf Agreement
83
Syndicated Revolving Credit Facility
The Company has a committed senior promissory notes underunsecured Syndicated Revolving Credit Facility (the “Credit Facility”) with Bank of America N.A., JPMorgan Chase Bank N.A., Wells Fargo Bank N.A., SunTrust Bank, RBS Citizens N.A., Morgan Stanley Bank N.A., TD Bank N.A., Royal Bank of Canada, The Northern Trust Company, and HSBC Bank USA, N.A. On October 25, 2013, the uncommitted master shelf agreementCompany amended its Credit Facility to increase the borrowing capacity from $850,000 to $975,000 and extend the maturity date from October 24, 2017 to October 24, 2018. The Company amortizes all one-time fees and third party costs associated with Aviva in the aggregate principal amountexecution and amendment of $30,000 due April 27, 2013.this Credit Facility though the maturity date. Interest is payable quarterlyat maturity at a fixed rate of 6.46%.
88
Verisk and ISO are co-borrowers under the Credit Facility.
Debt Maturities
The following table reflects the Company’s debt maturities:
Year | Amount | |||
| 2011 | $ | 437,717 | ||
| 2012 | $ | 1,211 | ||
| 2013 | $ | 180,511 | ||
| 2014 | $ | 103 | ||
| 2015 | $ | 170,001 | ||
| 2016 and thereafter | $ | 50,000 | ||
| Year | Amount | ||
| 2014 | $ | 4,448 | |
| 2015 | 173,896 | ||
| 2016 | 51,996 | ||
| 2017 | 238 | ||
| 2018 | 53 | ||
| 2019 and thereafter | 1,050,127 | ||
| $ | 1,280,758 | ||
15. Stockholders’ Equity (Deficit):
89
90
| Notes | Total | |||||||||||||||||||||||
| ISO Class A Common Stock | Receivable | Redeemable | ||||||||||||||||||||||
| Shares | Redemption | Unearned | Additional | from | Common | |||||||||||||||||||
| Issued | Value | KSOP | Paid-in-Capital | Stockholders’ | Stock | |||||||||||||||||||
| Balance, January 1, 2008 | 58,153,300 | $ | 1,217,942 | $ | (4,129 | ) | $ | — | $ | (42,625 | ) | $ | 1,171,188 | |||||||||||
| Redemption of ISO Class A common stock | (25,121,750 | ) | (434,044 | ) | — | — | 62,773 | (371,271 | ) | |||||||||||||||
| KSOP shares earned | — | — | 756 | 21,518 | — | 22,274 | ||||||||||||||||||
| Stock based compensation | — | — | — | 9,881 | — | 9,881 | ||||||||||||||||||
| Stock options exercised (including tax benefit of $26,099) | 4,262,800 | 25,324 | — | 26,099 | (20,148 | ) | 31,275 | |||||||||||||||||
| Other stock issuances | 12,600 | 225 | — | — | — | 225 | ||||||||||||||||||
| Decrease in redemption value of ISO Class A common stock | — | (56,535 | ) | — | (57,498 | ) | — | (114,033 | ) | |||||||||||||||
| Balance, December 31, 2008 | 37,306,950 | $ | 752,912 | $ | (3,373 | ) | $ | — | $ | — | $ | 749,539 | ||||||||||||
| Redemption of ISO Class A common stock | (3,032,850 | ) | (49,066 | ) | — | — | — | (49,066 | ) | |||||||||||||||
| KSOP shares earned | — | — | 2,068 | 73,272 | — | 75,340 | ||||||||||||||||||
| Stock based compensation | — | — | — | 8,526 | — | 8,526 | ||||||||||||||||||
| Stock options exercised (including tax benefit of $1,723) | 485,550 | 4,939 | — | 1,723 | — | 6,662 | ||||||||||||||||||
| Other stock transactions | 9,100 | 162 | — | — | — | 162 | ||||||||||||||||||
| Increase in redemption value of ISO Class A common stock | — | 355,949 | — | (83,521 | ) | — | 272,428 | |||||||||||||||||
| Conversion of redeemable common stock upon corporate reorganization | (34,768,750 | ) | (1,064,896 | ) | 1,305 | — | — | (1,063,591 | ) | |||||||||||||||
| Balance, December 31, 2009 | — | $ | — | $ | — | $ | — | $ | — | $ | — | |||||||||||||
On November 18, 1996, the Company authorized 1,000,000,000 ISO Class B shares and issued 500,225,000 shares. On October 6, 2009, the Company completed a corporate reorganization whereby the ISO Class B common stock and treasury stock was converted to Verisk Class B common stock on aone-for-one
91
The Company did not repurchase any Class B shares during the year ended December 31, 2009. The Company repurchased 483,500 ISO Class B shares at an average price of $10.34 during the year ended December 31, 2008.
Share Repurchase Program
84
suspended, or terminated at any time. Repurchased shares will be recorded as treasury stock and will be available for future issuance as part of the Repurchase Program.
During the yearyears ended December 31, 2010, 7,111,2022013 and 2012, 4,532,552 and 3,491,591 shares of Verisk Class A common stock were repurchased by the Company as part of this program at a weighted average price of $29.88$61.54 and $46.57 per share.share, respectively. The Company utilized borrowingscash from operations and the proceeds from its syndicated revolving credit facilitysenior notes to fund these repurchases. As treasury stock purchases are recorded based on trade date, the Company has included $2,266$3,038 and $1,511 in “Accounts payable and accrued liabilities” in the accompanying consolidated balance sheets for those purchases that have not settled as of December 31, 2010. The Company had $87,488 available to repurchase shares under the Repurchase Program as2013 and 2012, respectively.
Treasury Stock
As of December 31, 2010.
Earnings Per Share
92
Basic earnings per common share is computed by dividing income available to common stockholders by the weighted average number of common shares outstanding during the period less the weighted average Employee Stock Ownership Plan (“ESOP”) shares of common stock that have not been committed to be released.period. The computation of diluted EPS is similar to the computation of basic EPS except that the denominator is increased to include the number of additional common shares that would have been outstanding, using the treasury stock method, if the dilutive potential common shares, such as stock awards andincluding stock options and nonvested restricted stock, had been issued.
The following is a reconciliation of the numerators and denominators of the basic and diluted EPS computations for the years ended December 31, 2010, 2009 and 2008:31:
| For the Year Ended | ||||||||||||
| December 31, | December 31, | December 31, | ||||||||||
| 2010 | 2009 | 2008 | ||||||||||
| Numerator used in basic and diluted EPS: | ||||||||||||
| Net income | $ | 242,552 | $ | 126,614 | $ | 158,228 | ||||||
| Denominator: | ||||||||||||
| Weighted average number of common shares used in basic EPS | 177,733,503 | 174,767,795 | 182,885,700 | |||||||||
| Effect of dilutive shares: | ||||||||||||
| Potential Class A redeemable common stock issuable upon the exercise of stock options | 8,661,459 | 7,397,866 | 7,346,000 | |||||||||
| Weighted average number of common shares and dilutive potential common shares used in diluted EPS | 186,394,962 | 182,165,661 | 190,231,700 | |||||||||
| Basic EPS of Class A and Class B | $ | 1.36 | $ | 0.72 | $ | 0.87 | ||||||
| Diluted EPS of Class A and Class B | $ | 1.30 | $ | 0.70 | $ | 0.83 | ||||||
| 2013 | 2012 | 2011 | |||||||||
| (In thousands, except for share and per share data) | |||||||||||
| Numerator used in basic and diluted EPS: | |||||||||||
| Net income | $ | 348,380 | $ | 329,142 | $ | 282,758 | |||||
| Denominator: | |||||||||||
| Weighted average number of common shares used in basic EPS | 168,031,412 | 165,890,258 | 166,015,238 | ||||||||
| Effect of dilutive shares: | |||||||||||
| Potential Class A common stock issuable from stock options and stock awards | 4,244,948 | 5,819,260 | 7,309,872 | ||||||||
| Weighted average number of common shares and dilutive potential common shares used in diluted EPS | 172,276,360 | 171,709,518 | 173,325,110 | ||||||||
| Basic net income per share: | |||||||||||
| Income from continuing operations | $ | 2.04 | $ | 1.91 | $ | 1.58 | |||||
| Income from discontinued operations | 0.03 | 0.07 | 0.12 | ||||||||
| Basic net income per share | $ | 2.07 | $ | 1.98 | $ | 1.70 | |||||
| Diluted net income per share: | |||||||||||
| Income from continuing operations | $ | 1.99 | $ | 1.85 | $ | 1.51 | |||||
| Income from discontinued operations | 0.03 | 0.07 | 0.12 | ||||||||
| Diluted net income per share | $ | 2.02 | $ | 1.92 | $ | 1.63 | |||||
The potential shares of common stock that were excluded from diluted EPS were 2,095,140, 9,054,022822,410, 919,816 and 5,091,350 for the years ended1,506,440 at December 31, 2010, 20092013, 2012 and 2008,2011, respectively, because the effect of including thesethose potential shares was antidilutive.anti-dilutive.
85
Accumulated Other Comprehensive Loss
Losses
The following is a summary of accumulated other comprehensive loss:losses as of December 31:
| December 31, | December 31, | |||||||
| 2010 | 2009 | |||||||
| Unrealized gains on investments | $ | 725 | $ | 526 | ||||
| Unrealized foreign currency losses | (792 | ) | (683 | ) | ||||
| Pension and postretirement unfunded liability adjustment | (55,736 | ) | (53,471 | ) | ||||
| Accumulated other comprehensive loss | $ | (55,803 | ) | $ | (53,628 | ) | ||
| 2013 | 2012 | ||||||
| Unrealized foreign currency losses | $ | (1,800 | ) | $ | (960 | ) | |
| Unrealized (losses) gains on available-for-sale securities, net of tax | (75 | ) | 72 | ||||
| Pension and postretirement adjustment, net of tax | (41,613 | ) | (88,272 | ) | |||
| Accumulated other comprehensive losses | $ | (43,488 | ) | $ | (89,160 | ) | |
86
The before tax and after tax amounts for these categories, and the related tax benefit/(expense) included inof other comprehensive gain/(loss)income for the years ended December 31, 2013, 2012 and 2011 are summarized below:
| Tax Benefit/ | ||||||||||||
| For the Year Ended December 31, 2010 | Before Tax | (Expense) | After Tax | |||||||||
| Unrealized holding gains on investments arising during the year | $ | 340 | $ | (141 | ) | $ | 199 | |||||
| Unrealized foreign currency loss | (109 | ) | — | (109 | ) | |||||||
| Pension and postretirement unfunded liability adjustment | (4,135 | ) | 1,870 | (2,265 | ) | |||||||
| Total other comprehensive loss | $ | (3,904 | ) | $ | 1,729 | $ | (2,175 | ) | ||||
For the Year Ended December 31, 2009 | ||||||||||||
| Unrealized holding gains on investments arising during the year | $ | 563 | $ | (231 | ) | $ | 332 | |||||
| Reclassification adjustment for amounts included in net income | 386 | (161 | ) | 225 | ||||||||
| Unrealized foreign currency gain | 90 | — | 90 | |||||||||
| Pension and postretirement unfunded liability adjustment | 43,050 | (14,891 | ) | 28,159 | ||||||||
| Total other comprehensive gain | $ | 44,089 | $ | (15,283 | ) | $ | 28,806 | |||||
For the Year Ended December 31, 2008 | ||||||||||||
| Unrealized holding losses on investments arising during the year | $ | (1,687 | ) | $ | 666 | $ | (1,021 | ) | ||||
| Reclassification adjustment for amounts included in net income | 2,325 | (923 | ) | 1,402 | ||||||||
| Unrealized foreign currency loss | (927 | ) | — | (927 | ) | |||||||
| Pension and postretirement unfunded liability adjustment | (122,714 | ) | 49,525 | (73,189 | ) | |||||||
| Total other comprehensive loss | $ | (123,003 | ) | $ | 49,268 | $ | (73,735 | ) | ||||
| Before Tax | Tax Benefit (Expense) | After Tax | |||||||||
| December 31, 2013 | |||||||||||
| Unrealized foreign currency loss | $ | (840 | ) | $ | — | $ | (840 | ) | |||
| Unrealized loss on available-for-sale securities before reclassifications | (1,122 | ) | 433 | (689 | ) | ||||||
| Amount reclassified from accumulated other comprehensive loss (1) | 882 | (340 | ) | 542 | |||||||
| Unrealized loss on available-for-sale securities | (240 | ) | 93 | (147 | ) | ||||||
| Pension and postretirement adjustment before reclassifications | 80,773 | (30,611 | ) | 50,162 | |||||||
| Amortization of net actuarial loss and prior service benefit reclassified from accumulated other comprehensive losses (2) | (5,699 | ) | 2,196 | (3,503 | ) | ||||||
| Pension and postretirement adjustment | 75,074 | (28,415 | ) | 46,659 | |||||||
| Total other comprehensive income | $ | 73,994 | $ | (28,322 | ) | $ | 45,672 | ||||
| December 31, 2012 | |||||||||||
| Unrealized foreign currency gain | $ | 15 | $ | — | $ | 15 | |||||
| Unrealized loss on available-for-sale securities before reclassifications | (727 | ) | 316 | (411 | ) | ||||||
| Amount reclassified from accumulated other comprehensive loss (1) | 346 | (132 | ) | 214 | |||||||
| Unrealized loss on available-for-sale securities | (381 | ) | 184 | (197 | ) | ||||||
| Pension and postretirement adjustment before reclassifications | (13,082 | ) | 4,865 | (8,217 | ) | ||||||
| Amortization of net actuarial loss and prior service benefit reclassified from accumulated other comprehensive losses (2) | (4,001 | ) | 1,527 | (2,474 | ) | ||||||
| Pension and postretirement adjustment | (17,083 | ) | 6,392 | (10,691 | ) | ||||||
| Total other comprehensive loss | $ | (17,449 | ) | $ | 6,576 | $ | (10,873 | ) | |||
| December 31, 2011 | |||||||||||
| Unrealized foreign currency loss | $ | (183 | ) | $ | — | $ | (183 | ) | |||
| Unrealized loss on available-for-sale securities before reclassifications | (1,493 | ) | 614 | (879 | ) | ||||||
| Amount reclassified from accumulated other comprehensive loss (1) | 686 | (263 | ) | 423 | |||||||
| Unrealized loss on available-for-sale securities | (807 | ) | 351 | (456 | ) | ||||||
| Pension and postretirement adjustment before reclassifications | (25,346 | ) | 6,631 | (18,715 | ) | ||||||
| Amortization of net actuarial loss and prior service benefit reclassified from accumulated other comprehensive losses (2) | (5,071 | ) | 1,941 | (3,130 | ) | ||||||
| Pension and postretirement adjustment | (30,417 | ) | 8,572 | (21,845 | ) | ||||||
| Total other comprehensive loss | $ | (31,407 | ) | $ | 8,923 | $ | (22,484 | ) | |||
(1) This accumulated other comprehensive income (loss) component, before tax, is included under “Realized (loss) gain on available-for-sale securities, net” in the accompanying consolidated statements of operations.
(2) These accumulated other comprehensive loss components, before tax, are included under “Cost of revenues” and “Selling, general and administrative” in the accompanying consolidated statements of operations. These components are also included in the computation of net periodic (benefit) cost (see Note 17. Pension and Postretirement Benefits for additional details).
87
16. Compensation Plans:
KSOP
The Company has established the KSOP for the benefit of eligible employees in the U.S. and Puerto Rico. The KSOP includes both an employee savings component and an employee stock ownership component. The purpose of the combined plan is to enable the Company’s employees to participate in a tax-deferred savings arrangement under Internal Revenue Service Code Sections 401(a) and 401(k) (the “Code”), and to provide employee equity participation in the Company through the ESOPemployee stock ownership plan (“ESOP”) accounts.
Under the KSOP, eligible employees may make pre-tax and after-tax cash contributions as a percentage of their compensation, subject to certain limitations under the applicable provisions of the Code. The maximum pre-tax contribution that can be made to the 401(k) account as determined under the provisions of Code Section 401(g) is $17,$18, $17 and $16$17 for 2010, 20092013, 2012 and 2008,2011, respectively. Certain eligible participants (age 50 and older) may contribute an additional $6, $6 and $5$6 on a pre-tax basis for 2010, 20092013, 2012 and 2008, respectively.2011. After-tax contributions are limited to 10% of a participant’s compensation. The Company provides quarterly matching contributions in Verisk Class A common stock. The quarterly matching contributions are primarily equal to 75% of the first 6% of the participant’s contribution.
The Company established the ESOP component as a funding vehicle for the KSOP. This leveraged ESOP acquired 57,190,000 shares of the Company’s Class A common stock at a cost of approximately $33,170 ($$33,170 ($0.58 per share) in January 1997. The ESOP borrowed $33,170$33,170 from an unrelated third party to finance the purchase of the KSOP shares. The common shares were pledged as collateral for its debt. The Company made annual cash contributions to the KSOP equal to the ESOP’s debt service. As the debt was repaid, shares were released from collateral and were allocated to active employees in proportion to their annual salaries in relation to total participant salaries. The Company accounts for its ESOP in accordance withASC 718-40,Employee Stock Ownership Plans(“ (“ASC718-40”) andASC 480-10,Distinguishing Liabilities
94
from Equity(“ (“ASC480-10”). As shares were committed to be released from collateral, the Company reported compensation expense at the then-current fair value of the shares, and the shares became outstanding for EPS computations.
In 2005, the Company established the ISO Profit Sharing Plan (the “Profit Sharing Plan”), a defined contribution plan, to replace the qualified pension plan for all eligible employees hired on or after March 1, 2005. The Profit Sharing Plan is a component of the KSOP. Eligible employees will participateparticipated in the Profit Sharing Plan if they complete completed 1,000 hours of service each plan year and arewere employed on December 31 of that year. The Company willcan make an annuala discretionary contribution to the Profit Sharing Plan based on the Company’s performance.annual performance of the Company. Participants vest once they have completed four years and 1,000 hours of service. For all periods presented,fiscal years 2013 and 2012, there were no profit sharing contributions allocated. In 2011, the profit sharing contribution was funded using Class A common stock.
88
VERISK ANALYTICS, INC.
Equity Compensation Plans
All of the Company’s outstanding stock options and restricted stock are covered under the 2013 Incentive Plan, 2009 Incentive Plan or the Option1996 Incentive Plan. Awards under the 2013 Incentive Plan may include one or more of the following types: (i) stock options (both nonqualified and incentive stock options), (ii) stock appreciation rights, (iii) restricted stock, (iv) restricted stock units, (v) performance awards, (vi) other share-based awards, and (vii) cash. Employees, directors and consultants are eligible for awards under the 2013 Incentive Plan. The Company issued common stock under these plans from the Company's treasury shares. On May 15, 2013, the Company’s shareholders approved the 2013 Incentive Plan. The number of shares of Class A common stock available for issuance under the 2013 Incentive Plan is 15,700,000 and such amount shall be reduced on a 1-for-1 basis for every share issued that is subject to an option or stock appreciation right and on a 2.5-for-1 basis for every share issued that is subject to an award other than an option or stock appreciation right. Shares that were subject to an award under the 2013 Incentive Plan that become forfeited, expired or otherwise terminated shall again be available for issuance under the 2013 Incentive Plan on a 1-for-1 basis if the shares were subject to options or stock appreciation rights, and on an 2.5-for-1 basis if the shares were subject to awards other than options or stock appreciation rights. As of December 31, 2013, there were 14,365,793 shares of Class A common stock reserved and available for future issuance. Cash received from stock option exercises for the years ended December 31, 2010, 20092013, 2012 and 20082011 was $35,482, $7,709$80,368, $68,388 and $892,$43,345, respectively. On April 1, 2010 and June 1, 2010,
In 2013, the Company granted 2,011,390 and 5,000, respectively, of806,512 nonqualified stock options
95
to key employees withemployees. The nonqualified stock options have an exercise price equal to the closing price of the Company’s Class A common stock on March 31, 2010 and May 28, 2010,the grant date, with a ten-yearten-year contractual term and a service vesting period of four years. On July 1, 2010,In addition, the Company granted 31,906209,292 shares of restricted stock and 574 shares of Class A common stock to key employees. The restricted stock is valued at the closing price of the Company’s Class A common stock on the date of grant and has a service vesting period of four years. The Company recognizes the expense of the restricted stock ratably over the periods in which the restrictions lapse. The restricted stock is not assignable or transferrable until it becomes vested. Also in 2013, the Company granted 27,494 nonqualified stock options that were immediately vested, 138,12054,032 nonqualified stock options with a one-yearone-year service vesting period, and 4,5547,535 shares of Class A common stock, and 32,382 deferred stock units to the directors of the Company. The nonqualified stock options have an exercise price equal to the closing price of the Company’s Class A common stock on the grant date and a ten-year contractual term. As of December 31, 2010, there are 8,683,159 shares of Class A common stock reserved and available for future issuance.
The fair value of the stock options granted during the years ended December 31, 2010, 2009 and 2008 werewas estimated on the date of grant using a Black-Scholes option valuation model that uses the weighted-average assumptions noted in the following table.table during the years ended December 31:
| December 31, | December 31, | December 31, | ||||||||||
| 2010 | 2009 | 2008 | ||||||||||
| Option pricing model | Black-Scholes | Black-Scholes | Black-Scholes | |||||||||
| Expected volatility | 31.08 | % | 31.81 | % | 28.02 | % | ||||||
| Risk-free interest rate | 2.39 | % | 2.16 | % | 2.58 | % | ||||||
| Expected term in years | 4.8 | 5.5 | 5.0 | |||||||||
| Dividend yield | 0.00 | % | 0.51 | % | 1.81 | % | ||||||
| Weighted average grant date fair value per stock option | $ | 8.73 | $ | 5.96 | $ | 4.13 | ||||||
| 2013 | 2012 | 2011 | |||||||||
| Option pricing model | Black-Scholes | Black-Scholes | Black-Scholes | ||||||||
| Expected volatility | 29.27 | % | 32.22 | % | 30.44 | % | |||||
| Risk-free interest rate | 0.70 | % | 0.90 | % | 2.21 | % | |||||
| Expected term in years | 4.5 | 4.7 | 5.1 | ||||||||
| Dividend yield | — | % | — | % | — | % | |||||
| Weighted average grant date fair value per stock option | $ | 15.58 | $ | 13.59 | $ | 10.42 | |||||
The expected term for a majority of the awards granted was estimated based on studies of historical experience and projected exercise behavior. However, for certain awards granted, for which no historical exercise pattern exist,exists, the expected term was estimated using the simplified method. The risk-free interest rate is based on the yield of U.S. Treasury zero coupon securities with a maturity equal to the expected term of the equity award. The volatility factor was based on the average volatility of the Company’s peers, calculated using historical daily closing prices over the most recent period that commensuratesis commensurate with the expected term of the stock option award.awards. The expected dividend yield was based on the Company’s expected annual dividend rate on the date of grant.
89
| Options Outstanding | Options Exercisable | |||||||||||||||||||||||||
| Weighted | Weighted | Weighted | ||||||||||||||||||||||||
| Average | Stock | Weighted | Average | Stock | Average | |||||||||||||||||||||
| Range of | Remaining | Options | Average | Remaining | Options | Exercise | ||||||||||||||||||||
Exercise Prices | Contractual Life | Outstanding | Exercise Price | Contractual Life | Exercisable | Price | ||||||||||||||||||||
| $ | 1.84 to $2.20 | 0.9 | 88,750 | $ | 2.16 | 0.9 | 88,750 | $ | 2.16 | |||||||||||||||||
| $ | 2.21 to $2.96 | 2.1 | 1,694,100 | $ | 2.83 | 2.1 | 1,694,100 | $ | 2.83 | |||||||||||||||||
| $ | 2.97 to $4.62 | 2.4 | 3,810,100 | $ | 3.66 | 2.4 | 3,810,100 | $ | 3.66 | |||||||||||||||||
| $ | 4.63 to $8.90 | 4.3 | 3,985,804 | $ | 8.29 | 4.3 | 3,985,804 | $ | 8.29 | |||||||||||||||||
| $ | 8.91 to $13.62 | 5.3 | 1,320,600 | $ | 11.83 | 5.3 | 1,320,600 | $ | 11.83 | |||||||||||||||||
| $ | 13.63 to $15.10 | 6.2 | 1,493,475 | $ | 15.10 | 6.2 | 1,005,100 | $ | 15.10 | |||||||||||||||||
| $ | 15.11 to $17.78 | 7.8 | 5,522,370 | $ | 16.64 | 7.6 | 1,909,305 | $ | 16.91 | |||||||||||||||||
| $ | 17.79 to $22.00 | 8.8 | 3,015,612 | $ | 21.69 | 8.6 | 974,782 | $ | 21.11 | |||||||||||||||||
| $ | 22.01 to $30.25 | 9.5 | 2,127,046 | $ | 28.36 | 9.5 | 31,906 | $ | 30.20 | |||||||||||||||||
| 23,057,857 | 14,820,447 | |||||||||||||||||||||||||
96
VERISK ANALYTICS, INC.
NOTES TO CONSOLIDATED FINANCIAL STATEMENTS — (Continued)
A summary of options outstanding under the Incentive Plan and the Option Plan as of December 31, 2010 and changes during the three years then ended areis presented below:
| Weighted | Aggregate | |||||||||||
| Number | Average | Intrinsic | ||||||||||
| of Options | Exercise Price | Value | ||||||||||
| Outstanding at January 1, 2008 | 24,837,650 | $ | 6.41 | $ | 269,012 | |||||||
| Granted | 3,147,350 | $ | 17.30 | |||||||||
| Exercised | (4,262,800 | ) | $ | 5.94 | $ | 48,399 | ||||||
| Cancelled or expired | (564,950 | ) | $ | 14.08 | ||||||||
| Outstanding at December 31, 2008 | 23,157,250 | $ | 7.79 | $ | 179,981 | |||||||
| Granted | 6,451,521 | $ | 18.80 | |||||||||
| Exercised | (2,583,250 | ) | $ | 3.89 | $ | 44,569 | ||||||
| Cancelled or expired | (264,300 | ) | $ | 15.79 | ||||||||
| Outstanding at December 31, 2009 | 26,761,221 | $ | 10.74 | $ | 522,914 | |||||||
| Granted | 2,186,416 | $ | 28.36 | |||||||||
| Exercised | (5,579,135 | ) | $ | 6.36 | $ | 154,653 | ||||||
| Cancelled or expired | (310,645 | ) | $ | 19.77 | ||||||||
| Outstanding at December 31, 2010 | 23,057,857 | $ | 13.35 | $ | 478,014 | |||||||
| Options exercisable at December 31, 2010 | 14,820,447 | $ | 9.22 | $ | 368,466 | |||||||
| Options exercisable at December 31, 2009 | 16,890,225 | $ | 6.64 | $ | 399,281 | |||||||
| Number of Options | Weighted Average Exercise Price Per Share | Aggregate Intrinsic Value | |||||||||
| (In thousands, except for share and per share data) | |||||||||||
| Outstanding at January 1, 2011 | 23,057,857 | $ | 13.35 | $ | 478,014 | ||||||
| Granted | 1,574,705 | $ | 33.46 | ||||||||
| Exercised | (5,543,866 | ) | $ | 7.82 | $ | 149,613 | |||||
| Cancelled or expired | (192,291 | ) | $ | 22.58 | |||||||
| Outstanding at December 31, 2011 | 18,896,405 | $ | 16.55 | $ | 445,510 | ||||||
| Granted | 973,124 | $ | 47.38 | ||||||||
| Exercised | (6,880,678 | ) | $ | 9.09 | $ | 257,391 | |||||
| Cancelled or expired | (415,553 | ) | $ | 19.30 | |||||||
| Outstanding at December 31, 2012 | 12,573,298 | $ | 22.21 | $ | 361,653 | ||||||
| Granted | 888,038 | $ | 61.10 | ||||||||
| Exercised | (4,076,750 | ) | $ | 19.79 | $ | 168,056 | |||||
| Cancelled or expired | (149,266 | ) | $ | 43.14 | |||||||
| Outstanding at December 31, 2013 | 9,235,320 | $ | 26.67 | $ | 360,611 | ||||||
| Options exercisable at December 31, 2013 | 7,169,089 | $ | 20.98 | $ | 320,766 | ||||||
| Options exercisable at December 31, 2012 | 8,796,996 | $ | 18.37 | $ | 286,806 | ||||||
A summary of the status of the Company’s nonvested options as of December 31, 2010, 2009 and 2008 and changes during the three years then ended areis presented below:
| Number of Options | Weighted Average Grant-Date Fair Value Per Share | ||||||
| Nonvested balance at January 1, 2011 | 8,237,410 | $ | 6.27 | ||||
| Granted | 1,574,705 | $ | 10.42 | ||||
| Vested | (2,876,730 | ) | $ | 5.56 | |||
| Cancelled or expired | (192,291 | ) | $ | 6.82 | |||
| Nonvested balance at December 31, 2011 | 6,743,094 | $ | 7.52 | ||||
| Granted | 973,124 | $ | 13.59 | ||||
| Vested | (3,524,363 | ) | $ | 7.38 | |||
| Cancelled or expired | (415,553 | ) | $ | 5.62 | |||
| Nonvested balance at December 31, 2012 | 3,776,302 | $ | 9.43 | ||||
| Granted | 888,038 | $ | 15.58 | ||||
| Vested | (2,448,843 | ) | $ | 8.81 | |||
| Cancelled or expired | (149,266 | ) | $ | 12.18 | |||
| Nonvested balance at December 31, 2013 | 2,066,231 | $ | 12.61 | ||||
| Weighted | ||||||||
| Average | ||||||||
| Number | Grant-Date | |||||||
| of Options | Fair Value | |||||||
| Nonvested balance at January 1, 2008 | 8,362,500 | $ | 2.86 | |||||
| Granted | 3,147,350 | $ | 4.13 | |||||
| Vested | (4,237,350 | ) | $ | 2.48 | ||||
| Cancelled or expired | (564,950 | ) | $ | 3.70 | ||||
| Nonvested balance at December 31, 2008 | 6,707,550 | $ | 4.41 | |||||
| Granted | 6,451,521 | $ | 5.96 | |||||
| Vested | (3,023,775 | ) | $ | 3.28 | ||||
| Cancelled or expired | (264,300 | ) | $ | 4.06 | ||||
| Nonvested balance at December 31, 2009 | 9,870,996 | $ | 5.27 | |||||
| Granted | 2,186,416 | $ | 8.73 | |||||
| Vested | (3,509,357 | ) | $ | 5.04 | ||||
| Cancelled or expired | (310,645 | ) | $ | 5.84 | ||||
| Nonvested balance at December 31, 2010 | 8,237,410 | $ | 6.27 | |||||
97
Intrinsic value for stock options is calculated based on the exercise price of the underlying awards and the quoted price of Verisk’s common stock as of the reporting date. The aggregate intrinsic value of stock options outstanding and exercisable at December 31, 20102013 was $478,014$360,611 and $368,466,$320,766, respectively. In accordance with ASC 718, excess tax benefit from exercised stock options is recorded as an increase to additional-paid-in capital and a corresponding reduction in taxes payable. This tax benefit is calculated as the excess of the intrinsic value of options exercised in excess of compensation recognized for financial reporting purposes. The amount of the tax benefit that has been realized, as a result of those excess tax benefits, is presented in the statement of cash flows as a financing cash inflow.
90
2012 and 2011, the Company recorded excess tax benefit from exercised stock options of $58,056, $88,387 and $57,684, respectively. The Company realized $109,946, $60,672 and $53,195 of tax benefit within the Company’s tax payments through December 31, 2013, 2012 and 2011, respectively.The Company estimates expected forfeitures of equity awards at the date of grant and recognizes compensation expense only for those awards that the Company expects to vest. The forfeiture assumption is ultimately adjusted to the actual forfeiture rate. Changes in the forfeiture assumptions may impact the total amount of expense ultimately recognized over the requisite service period and may impact the timing of expense recognized over the requisite service period. Stock-basedStock based compensation expense for 2010, 20092013, 2012 and 20082011 was $21,298, $12,744$21,087, $24,696 and $9,881,$22,656, respectively.
A summary of the status of the restricted stock awarded under the 2013 Incentive Plan and changes is presented below:
| Number of Shares | Weighted Average Grant Date Fair Value Per Share | ||||||
| Outstanding at December 31, 2010 | — | $ | — | ||||
| Granted | 150,187 | $ | 33.27 | ||||
| Vested | (1,523 | ) | $ | 33.30 | |||
| Forfeited | (3,030 | ) | $ | 33.30 | |||
| Outstanding at December 31, 2011 | 145,634 | $ | 33.32 | ||||
| Granted | 244,397 | $ | 47.10 | ||||
| Vested | (41,120 | ) | $ | 34.51 | |||
| Forfeited | (17,898 | ) | $ | 43.27 | |||
| Outstanding at December 31, 2012 | 331,013 | $ | 42.78 | ||||
| Granted | 241,674 | $ | 61.12 | ||||
| Vested | (150,668 | ) | $ | 37.82 | |||
| Forfeited | (25,270 | ) | $ | 53.00 | |||
| Outstanding at December 31, 2013 | 396,749 | $ | 52.82 | ||||
As of December 31, 2010,2013, there was $39,920$39,086 of total unrecognized compensation cost related to nonvested share-based compensation arrangements granted under the 2013 Incentive Plan and the Option2009 Incentive Plan. That cost is expected to be recognized over a weighted-average period of 3.02.51 years. As of December 31, 2010,2013, there were 8,237,4102,066,231 and 396,749 nonvested stock options and restricted stock, respectively, of which 7,094,8401,581,125 and 287,897 are expected to vest. The total grant date fair value of options vested during the years ended December 31, 2010, 20092013, 2012 and 20082011 was $17,677, $9,918$16,468, $19,834 and $11,803,$20,554, respectively. The total grant date fair value of restricted stock vested during the year ended December 31, 2013, 2012 and 2011 was $7,153, $3,206 and $908, respectively.
On May 16, 2012, the Company’s stockholders approved the implementation of an employee stock purchase plan (“ESPP”). The ESPP commenced on October 1, 2012 and offers eligible employees the opportunity to authorize payroll deductions of up to 20.0% of their regular base salary and up to 50.0% of their short-term incentive compensation, both of which in total may not exceed $25 in any calendar year, to purchase shares of the Company’s Class A common stock at a 5.0% discount of its fair market value at the time of purchase. In accordance with ASC 718, the ESPP is noncompensatory as the purchase discount is 5.0% or less from the fair market value, substantially all employees that meet limited employment qualifications may participate, and it incorporates no option features. During the year ended December 31, 2013, the Company issued 27,879 shares of Verisk Class A common stock at a weighted average discounted price of $59.62.
17. | Pension and Postretirement Benefits: |
91
pension liability by approximately $10,200 and the Company realized a curtailment gain of $780 in “Cost of revenues” and “Selling, general and administrative” expenses in the accompanying consolidated statements of operations.
The Pension Plan’s funding policy is to contribute annually at an amount between the minimum funding requirements set forth in the Employee Retirement Income Security Act of 1974 and the maximum amount that can be deducted for federal income tax purposes. In April 2012, the Company completed a voluntary prefunding to the Pension Plan of $72,000, which resulted in a total contribution of $78,837 for the year, of which $28,206 was the minimum contribution requirement for 2012. Due to the prefunding, the minimum contribution requirement was and is expected to be $0 in 2013 and 2014, respectively. The Company contributed $313, $292$3,911 and $542$839 to the SERP in 2010, 20092013 and 2008,2012, respectively, and expects to contribute $533$715 in 2011. 2014.
The minimum required fundingCompany also provides certain healthcare and life insurance benefits for both active and retired employees. The Postretirement Health and Life Insurance Plan (the “Postretirement Plan”), which has been frozen, is contributory, requiring participants to pay a stated percentage of the premium for coverage. The Company expects to contribute $1,767 to the Postretirement Plan in 2014. In March 2012, the Company established a voluntary employees beneficiary association plan (the “VEBA Plan”) under Section 501(c)(9) of the Internal Revenue Code to fund the Postretirement Plan. The Company contributed $20,000 to the VEBA Plan for the year ended December 31, 2012, and did not make further contributions thereafter. The asset allocation for the VEBA Plan at December 31, 2013 and target allocation for 2014 are 100% in debt securities.
92
The following table sets forth the changes in the benefit obligations and the plan assets, the (funded) unfunded status of the Pension Plan, SERP and Postretirement Plan, and the amounts recognized in the Company’s consolidated balance sheets at December 31:
| Pension Plan and SERP | Postretirement Plan | ||||||||||||||
| 2013 | 2012 | 2013 | 2012 | ||||||||||||
| Change in benefit obligation: | |||||||||||||||
| Benefit obligation at January 1 | $ | 460,482 | $ | 434,689 | $ | 22,434 | $ | 21,935 | |||||||
| Service cost | — | 282 | — | — | |||||||||||
| Interest cost | 17,860 | 19,888 | 608 | 779 | |||||||||||
| Actuarial (gain) loss | (31,962 | ) | 39,466 | (426 | ) | 2,328 | |||||||||
| Curtailments | — | (8,255 | ) | — | — | ||||||||||
| Plan participants’ contributions | — | — | 1,748 | 2,505 | |||||||||||
| Benefits paid | (25,716 | ) | (25,588 | ) | (4,225 | ) | (5,411 | ) | |||||||
| Federal subsidy on benefits paid | — | — | 260 | 298 | |||||||||||
| Benefit obligation at December 31 | $ | 420,664 | $ | 460,482 | $ | 20,399 | $ | 22,434 | |||||||
| Accumulated benefit obligation at December 31 | $ | 420,664 | $ | 460,482 | |||||||||||
| Weighted-average assumptions as of December 31 used to determine benefit obligation: | |||||||||||||||
| Discount rate | 4.74 | % | 3.98 | % | 3.45 | % | 2.75 | % | |||||||
| Change in plan assets: | |||||||||||||||
| Fair value of plan assets at January 1 | $ | 421,134 | $ | 324,864 | $ | 18,766 | $ | — | |||||||
| Actual return on plan assets, net of expenses | 68,583 | 42,182 | (198 | ) | 206 | ||||||||||
| Employer contributions | 3,911 | 79,676 | 250 | 21,168 | |||||||||||
| Plan participants’ contributions | — | — | 1,748 | 2,505 | |||||||||||
| Benefits paid | (25,716 | ) | (25,588 | ) | (4,225 | ) | (5,411 | ) | |||||||
| Subsidies received | — | — | 260 | 298 | |||||||||||
| Fair value of plan assets at December 31 | $ | 467,912 | $ | 421,134 | $ | 16,601 | $ | 18,766 | |||||||
| (Funded) unfunded status at December 31 | $ | (47,248 | ) | $ | 39,348 | $ | 3,798 | $ | 3,668 | ||||||
The pre-tax components included within accumulated other comprehensive losses as of December 31 are summarized below:
| Pension Plan and SERP | Postretirement Plan | ||||||||||||||
| 2013 | 2012 | 2013 | 2012 | ||||||||||||
| Prior service benefit | $ | — | $ | — | $ | (1,147 | ) | $ | (1,293 | ) | |||||
| Actuarial losses | 62,226 | 137,369 | 9,208 | 9,285 | |||||||||||
| Accumulated other comprehensive losses, pretax | $ | 62,226 | $ | 137,369 | $ | 8,061 | $ | 7,992 | |||||||
The pre-tax components of net periodic benefit cost and the amounts recognized in other comprehensive loss are summarized below for the years ended December 31:
93
| Pension Plan and SERP | Postretirement Plan | ||||||||||||||||||||||
| 2013 | 2012 | 2011 | 2013 | 2012 | 2011 | ||||||||||||||||||
| Service cost | $ | — | $ | 282 | $ | 6,361 | $ | — | $ | — | $ | — | |||||||||||
| Interest cost | 17,860 | 19,888 | 21,707 | 608 | 779 | 878 | |||||||||||||||||
| Curtailment gain | — | (780 | ) | — | — | — | — | ||||||||||||||||
| Expected return on plan assets | (30,480 | ) | (28,899 | ) | (25,797 | ) | (919 | ) | (255 | ) | — | ||||||||||||
| Amortization of prior service benefit | — | (133 | ) | (801 | ) | (146 | ) | (146 | ) | (146 | ) | ||||||||||||
| Amortization of net actuarial loss | 5,078 | 3,646 | 5,598 | 767 | 634 | 420 | |||||||||||||||||
| Net periodic benefit (credit) cost | (7,542 | ) | (5,996 | ) | 7,068 | 310 | 1,012 | 1,152 | |||||||||||||||
| Amortization of actuarial loss reclassified from accumulated other comprehensive losses | (1,320 | ) | (279 | ) | (656 | ) | — | — | — | ||||||||||||||
| Amortization of prior service benefit reclassified from accumulated other comprehensive losses | — | 133 | 801 | 146 | 146 | 146 | |||||||||||||||||
| Prior service benefit | — | (7,475 | ) | — | — | — | — | ||||||||||||||||
| Net loss recognized reclassified from accumulated other comprehensive losses | (3,758 | ) | (3,368 | ) | (4,942 | ) | — | — | — | ||||||||||||||
| Actuarial (loss) gain | (70,065 | ) | 26,184 | 38,220 | (77 | ) | 1,742 | (3,152 | ) | ||||||||||||||
| Total recognized in other comprehensive (income) loss | (75,143 | ) | 15,195 | 33,423 | 69 | 1,888 | (3,006 | ) | |||||||||||||||
| Total recognized in net periodic benefit (credit) cost and other comprehensive (income) loss | $ | (82,685 | ) | $ | 9,199 | $ | 40,491 | $ | 379 | $ | 2,900 | $ | (1,854 | ) | |||||||||
The estimated amounts in accumulated other comprehensive losses that are expected to be recognized as components of net periodic benefit cost during 2014 are summarized below:
| Pension Plan And SERP | Postretirement Plan | Total | |||||||||
| Amortization of prior service benefit | $ | — | $ | (146 | ) | $ | (146 | ) | |||
| Amortization of net actuarial loss | 605 | 673 | 1,278 | ||||||||
| Total | $ | 605 | $ | 527 | $ | 1,132 | |||||
The weighted-average assumptions as of January 1 used to determine net periodic benefit (credit) cost and the amount recognized in the accompanying consolidated balance sheets are provided below:
94
| Pension Plan and SERP | Postretirement Plan | ||||||||||||||||||||||
| 2013 | 2012 | 2011 | 2013 | 2012 | 2011 | ||||||||||||||||||
| Weighted-average assumptions as of January 1, used to determine net benefit cost: | |||||||||||||||||||||||
| Discount rate | 3.98 | % | 4.98 | % | 5.49 | % | 2.75 | % | 3.50 | % | 4.00 | % | |||||||||||
| Expected return on plan assets | 7.50 | % | 7.50 | % | 8.25 | % | 5.00 | % | N/A | N/A | |||||||||||||
| Rate of compensation increase | N/A | 4.00 | % | 4.00 | % | N/A | N/A | N/A | |||||||||||||||
| Amounts recognized in the consolidated balance sheets consist of: | |||||||||||||||||||||||
| Pension assets, noncurrent | $ | (60,955 | ) | $ | — | $ | — | $ | — | $ | — | $ | — | ||||||||||
| Pension, SERP and postretirement benefits, current | 700 | 693 | 664 | 1,737 | 1,041 | 3,348 | |||||||||||||||||
| Pension, SERP and postretirement benefits, noncurrent | 13,007 | 38,655 | 109,161 | 2,061 | 2,627 | 18,587 | |||||||||||||||||
| Total Pension, SERP and Postretirement benefits | $ | (47,248 | ) | $ | 39,348 | $ | 109,825 | $ | 3,798 | $ | 3,668 | $ | 21,935 | ||||||||||
The following table presents the estimated future benefit payments for the respective plans. The future benefit payments for the Postretirement Plan are net of the federal Medicare subsidy.
| Pension Plan and SERP | Postretirement Plan | ||||||||||||||
| Gross Benefit Amount | Gross Benefit Amount | Medicare Subsidy Payments | Net Benefit Amount | ||||||||||||
| 2014 | $ | 28,391 | $ | 3,408 | $ | (455 | ) | $ | 2,953 | ||||||
| 2015 | $ | 28,743 | $ | 3,156 | $ | (448 | ) | $ | 2,708 | ||||||
| 2016 | $ | 29,460 | $ | 2,886 | $ | (435 | ) | $ | 2,451 | ||||||
| 2017 | $ | 29,958 | $ | 2,611 | $ | (421 | ) | $ | 2,190 | ||||||
| 2018 | $ | 29,692 | $ | 2,334 | $ | (405 | ) | $ | 1,929 | ||||||
| 2019-2023 | $ | 148,179 | $ | 7,970 | $ | (944 | ) | $ | 7,026 | ||||||
The healthcare cost trend rate for 2013 was 8.00% gradually decreasing to 5.00% in 2020. Assumed healthcare cost trend rates have a significant effect on the amounts reported for the healthcare plan. A 1.00% change in assumed healthcare cost trend rates would have the following effects:
| 1% Increase | 1% Decrease | ||||||
| Effect of total service and interest cost components of net periodic postretirement healthcare benefit cost | $ | 15 | $ | (14 | ) | ||
| Effect on the healthcare component of the accumulated postretirement benefit obligation | $ | 549 | $ | (511 | ) | ||
The expected subsidy from the Medicare Prescription Drug, Improvement and Modernization Act of 2003 reduced the Company’s accumulated postretirement benefit obligation by approximately $2,868 and $4,089 as of December 31, 2010, 20092013 and 2008 was $20,444, $5,4712012, and $5,029,the net periodic benefit cost by approximately $19, $114 and $499 in fiscal 2013, 2012 and 2011, respectively. The Company expects to contribute $25,312 to the Pension Plan in 2011.
The expected return on the planPension Plan assets for 20102013 and 2009 is 8.25%2012 was 7.50%, which iswas determined by taking into consideration the Company’s analysis of its actual historical investment returns to a broader long-term
98
forecast adjusted based on the its target investment allocation, and the current economic environment. The Company’s investment guidelines target investment
95
allocation of 60% equity securities and 40% debt securities. The Pension Plan assets consist primarily of investments in various fixed income and equity funds. Investment guidelines are established with each investment manager. These guidelines provide the parameters within which the investment managers agree to operate, including criteria that determine eligible and ineligible securities, diversification requirements and credit quality standards, where applicable. Investment managers are prohibited from entering into any speculative hedging transactions. The investment objective is to achieve a maximum total return with strong emphasis on preservation of capital in real terms. The domestic equity portion of the total portfolio should range between 40% and 60%. The international equity portion of the total portfolio should range between 10% and 20%. The fixed income portion of the total portfolio should range between 20% and 40%. The asset allocation at December 31, 20102013 and 2009,2012, and target allocation for 20112014 by asset category are as follows:
| Asset Category | Target Allocation | Percentage of Plan Assets | ||||||
| 2013 | 2012 | |||||||
| Equity securities | 60.00 | % | 66.80 | % | 57.90 | % | ||
| Debt securities | 40.00 | % | 33.20 | % | 41.00 | % | ||
| Other | — | % | — | % | 1.10 | % | ||
| Total | 100.00 | % | 100.00 | % | 100.00 | % | ||
| Target | Percentage of Plan Assets | |||||||||||
Asset Category | Allocation | 2010 | 2009 | |||||||||
| Equity securities | 60 | % | 56 | % | 58 | % | ||||||
| Debt securities | 40 | % | 42 | % | 39 | % | ||||||
| Other | 0 | % | 2 | % | 3 | % | ||||||
| Total | 100 | % | 100 | % | 100 | % | ||||||
The Company has used the target investment allocation to derive the expected return as the Company believes this allocation will be retained on an ongoing basis that will commensurate with the projected cash flows of the plan. The expected return for each investment category within the target investment allocation is developed using average historical rates of return for each targeted investment category, considering the projected cash flow of the pension plan.Pension Plan. The difference between this expected return and the actual return on plan assets is generally deferred and recognized over subsequent periods through future net periodic benefit costs. The Company believes that the use of the average historical rates of returns is consistent with the timing and amounts of expected contributions to the plans and benefit payments to plan participants. The Company believes that theseThese considerations provide the basis for reasonable assumptions with respect to the expected long-term rate of return on plan assets.
96
99
VERISK ANALYTICS, INC.
NOTES TO CONSOLIDATED FINANCIAL STATEMENTS — (Continued)
| Pension Plan | Postretirement Plan | |||||||||||||||
| 2010 | 2009 | 2010 | 2009 | |||||||||||||
| Change in benefit obligation: | ||||||||||||||||
| Benefit obligation at beginning of year | $ | 378,189 | $ | 366,921 | $ | 29,911 | $ | 28,640 | ||||||||
| Service cost | 6,412 | 7,375 | — | — | ||||||||||||
| Interest cost | 21,364 | 21,196 | 1,211 | 1,728 | ||||||||||||
| Actuarial loss | 26,039 | 7,407 | 689 | 3,534 | ||||||||||||
| Plan participants’ contributions | — | — | 2,676 | 2,732 | ||||||||||||
| Benefits paid | (22,534 | ) | (24,710 | ) | (7,685 | ) | (7,532 | ) | ||||||||
| Federal subsidy on benefits paid | — | — | 425 | 809 | ||||||||||||
| Benefit obligation at end of year | $ | 409,470 | $ | 378,189 | $ | 27,227 | $ | 29,911 | ||||||||
| Accumulated benefit obligation at end of year | $ | 398,936 | $ | 368,229 | ||||||||||||
| Weighted-average assumptions as of December 31, | ||||||||||||||||
| used to determine benefit obligation: | ||||||||||||||||
| Discount rate | 5.49 | % | 5.74 | % | 4.00 | % | 4.50 | % | ||||||||
| Rate of compensation increase | 4.00 | % | 4.00 | % | N/A | N/A | ||||||||||
| Change in plan assets: | ||||||||||||||||
| Fair value of plan assets at beginning of year | $ | 275,662 | $ | 232,452 | $ | — | $ | — | ||||||||
| Actual return on plan assets, net of expenses | 39,538 | 62,157 | — | — | ||||||||||||
| Employer contributions | 20,757 | 5,763 | 4,584 | 3,991 | ||||||||||||
| Plan participants’ contributions | — | — | 2,676 | 2,732 | ||||||||||||
| Benefits paid | (22,534 | ) | (24,710 | ) | (7,685 | ) | (7,532 | ) | ||||||||
| Subsidies received | — | — | 425 | 809 | ||||||||||||
| Fair value of plan assets at end of year | $ | 313,423 | $ | 275,662 | $ | — | $ | — | ||||||||
| Unfunded status at end of year | $ | 96,047 | $ | 102,527 | $ | 27,227 | $ | 29,911 | ||||||||
| Pension Plan | Postretirement Plan | |||||||||||||||
| 2010 | 2009 | 2010 | 2009 | |||||||||||||
| Transition obligation | $ | — | $ | — | $ | — | $ | 499 | ||||||||
| Prior service benefit | (1,714 | ) | (2,515 | ) | (1,586 | ) | — | |||||||||
| Actuarial losses | 90,465 | 87,381 | 10,696 | 8,361 | ||||||||||||
| Accumulated other comprehensive losses, pretax | $ | 88,751 | $ | 84,866 | $ | 9,110 | $ | 8,860 | ||||||||
100
| Pension Plan | Postretirement Plan | |||||||||||||||||||||||
| 2010 | 2009 | 2008 | 2010 | 2009 | 2008 | |||||||||||||||||||
| Service cost | $ | 6,412 | $ | 7,375 | $ | 7,789 | $ | — | $ | — | $ | — | ||||||||||||
| Interest cost | 21,364 | 21,196 | 21,698 | 1,211 | 1,729 | 1,689 | ||||||||||||||||||
| Amortization of transition obligation | — | — | — | — | 166 | 166 | ||||||||||||||||||
| Recognized net actuarial loss | — | — | — | — | 417 | 241 | ||||||||||||||||||
| Expected return on plan assets | (22,648 | ) | (18,327 | ) | (27,441 | ) | — | — | — | |||||||||||||||
| Amortization of prior service cost | (801 | ) | (801 | ) | (801 | ) | (146 | ) | — | — | ||||||||||||||
| Amortization of net actuarial loss | 6,067 | 10,380 | 499 | 584 | — | — | ||||||||||||||||||
| Net periodic benefit cost | $ | 10,394 | $ | 19,823 | $ | 1,744 | $ | 1,649 | $ | 2,312 | $ | 2,096 | ||||||||||||
| Transition obligation | $ | — | $ | — | $ | — | $ | — | $ | (166 | ) | $ | (166 | ) | ||||||||||
| Amortization of actuarial gains | (496 | ) | (501 | ) | (499 | ) | — | — | — | |||||||||||||||
| Amortization of prior service benefit | 801 | 801 | 801 | 146 | — | — | ||||||||||||||||||
| Net loss recognized | (5,571 | ) | (9,879 | ) | — | — | — | — | ||||||||||||||||
| Actuarial loss/(gain) | 9,151 | (36,422 | ) | 120,167 | 104 | 3,117 | 2,411 | |||||||||||||||||
| Total recognized in other comprehensive loss/(income) | 3,885 | (46,001 | ) | 120,469 | 250 | 2,951 | 2,245 | |||||||||||||||||
| Total recognized in net periodic cost and other comprehensive loss/(income) | $ | 14,279 | $ | (26,178 | ) | $ | 122,213 | $ | 1,899 | $ | 5,263 | $ | 4,341 | |||||||||||
| Pension | Postretirement | |||||||||||
| Plan | Plan | Total | ||||||||||
| Transaction obligation | $ | — | $ | — | $ | — | ||||||
| Prior service benefit | (801 | ) | (146 | ) | (947 | ) | ||||||
| Actuarial losses | 5,639 | 654 | 6,293 | |||||||||
| Total | $ | 4,838 | $ | 508 | $ | 5,346 | ||||||
101
| Pension Plan | Postretirement Plan | |||||||||||||||||||||||
| 2010 | 2009 | 2008 | 2010 | 2009 | 2008 | |||||||||||||||||||
| Weighted-average assumptions as of January 1, used to determine net benefit cost: | ||||||||||||||||||||||||
| Discount rate | 5.74 | % | 6.00 | % | 6.25 | % | 4.50 | % | 6.00 | % | 5.75 | % | ||||||||||||
| Expected return on plan assets | 8.25 | % | 8.25 | % | 8.25 | % | N/A | N/A | N/A | |||||||||||||||
| Rate of compensation increase | 4.00 | % | 4.00 | % | 4.25 | % | N/A | N/A | N/A | |||||||||||||||
| Amounts recognized in the consolidated | ||||||||||||||||||||||||
| balance sheets consist of: | ||||||||||||||||||||||||
| Pension and postretirement benefits, current | $ | 519 | $ | 481 | $ | 555 | $ | 4,144 | $ | 4,803 | $ | 4,842 | ||||||||||||
| Pension and postretirement benefits, noncurrent | 95,528 | 102,046 | 133,914 | 23,083 | 25,108 | 23,798 | ||||||||||||||||||
| Total pension and postretirement benefits | $ | 96,047 | $ | 102,527 | $ | 134,469 | $ | 27,227 | $ | 29,911 | $ | 28,640 | ||||||||||||
| Pension | Postretirement | |||||||
| Plan | Plan | |||||||
| 2011 | $ | 26,204 | $ | 4,227 | ||||
| 2012 | $ | 27,182 | $ | 3,911 | ||||
| 2013 | $ | 28,030 | $ | 3,576 | ||||
| 2014 | $ | 31,778 | $ | 3,251 | ||||
| 2015 | $ | 30,104 | $ | 2,875 | ||||
| 2016-2020 | $ | 168,295 | $ | 9,901 | ||||
| 1% | 1% | |||||||
| Increase | Decrease | |||||||
| Effect of total service and interest cost components of net periodic postretirement healthcare benefit cost | $ | 9 | $ | (11 | ) | |||
| Effect on the healthcare component of the accumulated postretirement benefit obligation | $ | 209 | $ | (245 | ) | |||
102
The following table summarizes the fair value measurements by level of the Pension Plan assets at December 31, 2010:and Postretirement Plan assets:
| Quoted Prices | ||||||||||||||||
| in Active Markets | Significant Other | Significant | ||||||||||||||
| for Identical | Observable | Unobservable | ||||||||||||||
| Total | Assets (Level 1) | Inputs (Level 2) | Inputs (Level 3) | |||||||||||||
December 31, 2010 | ||||||||||||||||
| Equity | ||||||||||||||||
| Managed equity accounts(1) | $ | 64,364 | $ | 64,364 | $ | — | $ | — | ||||||||
| Equity — pooled separate account(2) | 108,775 | — | 108,775 | — | ||||||||||||
| Equity — partnerships(3) | 1,121 | — | — | 1,121 | ||||||||||||
| Debt | ||||||||||||||||
| Fixed income manager — pooled separate account(2) | 133,315 | — | 133,315 | — | ||||||||||||
| Other | ||||||||||||||||
| Cash — pooled separate account(2) | 5,848 | — | 5,848 | — | ||||||||||||
| Total | $ | 313,423 | $ | 64,364 | $ | 247,938 | $ | 1,121 | ||||||||
December 31, 2009 | ||||||||||||||||
| Equity | ||||||||||||||||
| Managed equity accounts(1) | $ | 123,871 | $ | 123,871 | $ | — | $ | — | ||||||||
| Equity — pooled separate account(2) | 31,304 | — | 31,304 | — | ||||||||||||
| Equity — partnerships(3) | 4,939 | — | — | 4,939 | ||||||||||||
| Debt | ||||||||||||||||
| Fixed income manager — managed account(2) | 76,900 | — | 76,900 | — | ||||||||||||
| Fixed income manager — pooled separate account(2) | 30,728 | — | 30,728 | — | ||||||||||||
| Other | ||||||||||||||||
| Cash — pooled separate account(2) | 7,920 | — | 7,920 | — | ||||||||||||
| Total | $ | 275,662 | $ | 123,871 | $ | 146,852 | $ | 4,939 | ||||||||
| Total | Quoted Prices in Active Markets for Identical Assets (Level 1) | Significant Other Observable Inputs (Level 2) | Significant Unobservable Inputs (Level 3) | ||||||||||||
| December 31, 2013 | |||||||||||||||
| Equity | |||||||||||||||
| Managed equity accounts (1) | $ | 110,852 | $ | 110,852 | $ | — | $ | — | |||||||
| Equity — pooled separate account (2) | 200,947 | — | 200,947 | — | |||||||||||
| Equity — partnerships (3) | 635 | — | — | 635 | |||||||||||
| Debt | |||||||||||||||
| Fixed income manager — pooled separate account (2) | 165,157 | — | 165,157 | — | |||||||||||
| Fixed income manager — government securities (4) | 16,601 | 16,601 | — | — | |||||||||||
| Other | |||||||||||||||
| Cash deficit — pooled separate account (2) | (9,679 | ) | — | (9,679 | ) | — | |||||||||
| Total | $ | 484,513 | $ | 127,453 | $ | 356,425 | $ | 635 | |||||||
| December 31, 2012 | |||||||||||||||
| Equity | |||||||||||||||
| Managed equity accounts (1) | $ | 74,815 | $ | 74,815 | $ | — | $ | — | |||||||
| Equity — pooled separate account (2) | 168,232 | — | 168,232 | — | |||||||||||
| Equity — partnerships (3) | 1,022 | — | — | 1,022 | |||||||||||
| Debt | |||||||||||||||
| Fixed income manager — pooled separate account (2) | 172,547 | — | 172,547 | — | |||||||||||
| Fixed income manager — government securities (4) | 18,766 | 18,766 | — | — | |||||||||||
| Other | |||||||||||||||
| Cash — pooled separate account (2) | 4,518 | — | 4,518 | — | |||||||||||
| Total | $ | 439,900 | $ | 93,581 | $ | 345,297 | $ | 1,022 | |||||||
| (1) | Valued at the closing price of shares for domestic stocks within the managed equity accounts, and valued at the net asset value (“NAV”) of shares for mutual funds at either the closing price reported in the active market or based on yields currently available on comparable securities of issuers with similar credit ratings for corporate bonds held by the Pension Plan in these managed accounts. |
| (2) | The pooled separate accounts invest in domestic and foreign stocks, bonds and mutual funds. The fair values of these stocks, bonds and mutual funds are publicly quoted and are used in determining the NAV of the pooled separate account, which is not publicly quoted. |
| (3) | Investments for which readily determinable prices do not exist are valued by the General Partner using either the market or income approach. In establishing the estimated fair value of investments, including those without readily determinable values, the General Partner assumes a reasonable period of time for liquidation of the investment, and takes into consideration the financial condition and operating results of |
103
| the underlying portfolio company, nature of investment, restrictions on marketability, holding period, market conditions, foreign currency exposures, and other factors the General Partner deems appropriate. |
| (4) | The fund invested in the U.S. government, its agencies or instrumentalities or securities that are rated AAA by S&P, AAA by Fitch, or Aaa by Moody’s, including but not limited to mortgage securities such as agency and non-agency collateralized |
97
mortgage obligations, and other obligations that are secured by mortgages or mortgage backed securities, and valued at the closing price reported in the active market.
The following table sets forth a summary of changes in the fair value of the Pension Plan’s Level 3 assets for the years ended December 31:
| Equity-partnerships | ||||||||
| 2010 | 2009 | |||||||
| Beginning balance | $ | 4,939 | $ | 2,146 | ||||
| Actual return on plan assets: | ||||||||
| Investment loss, net | — | (31 | ) | |||||
| Realized and unrealized (loss)/gain, net | (133 | ) | 3,123 | |||||
| Fees | — | (366 | ) | |||||
| Purchase, sales, issuances, and settlements, net | (3,685 | ) | 67 | |||||
| Ending balance | $ | 1,121 | $ | 4,939 | ||||
| Equity-partnerships | |||||||
| 2013 | 2012 | ||||||
| Balance at January 1 | $ | 1,022 | $ | 1,067 | |||
| Realized and unrealized loss on plan assets, net | (387 | ) | (45 | ) | |||
| Balance at December 31 | $ | 635 | $ | 1,022 | |||
18. Segment Reporting
ASC 280-10, 280-10,Disclosures About Segments of an Enterprise and Related Information(“ (“ASC280-10”), establishes standards for reporting information about operating segments.ASC 280-10 requires that a public business enterprise reportreports financial and descriptive information about its reportable operating segments. Operating segments are components of an enterprise for which separate financial information is available that is evaluated regularly by the chief operating decision maker (“CODM”) in deciding how to allocate resources and in assessing performance. The Company’s CEOPresident and Chairman of the BoardCEO is identified as the CODM as defined byASC 280-10. To align with the internal management of the Company’s business operations based on service offerings, the Company is organized into the following two operating segments, which are also the Company’s reportable segments:
Decision Analytics: The Company develops solutions that its customers use to analyze key processes in managing risk. The Company’s combination of algorithms and analytic methods incorporates its proprietary data to generate solutions. In most cases, the Company’s customers integrate the solutions into their models, formulas or underwriting criteria in order to predict potential loss events, ranging from hurricanes and earthquakes to unanticipated healthcare claims. The Company develops catastrophe and extreme event models and offers solutions covering natural and man-made risks, including acts of terrorism. The Company also develops solutions that allow customers to quantify costs after loss events occur. Fraud solutions include data on claim histories, analysis of claims to find emerging patterns of fraud, and identification of suspicious claims in the insurance, and healthcare sectors. Effective December 31, 2011, the Company provided additional disclosure about its revenue within Decision Analytics segment based on the industry vertical groupings of insurance, financial services, healthcare and specialized markets. Previously, the Company disclosed revenue based on the classification of its solution as fraud identification and detection solutions, loss prediction solutions and loss quantification solutions. There have been no changes in reportable segments in accordance with ASC 280-10 for the year ended December 31, 2011.
Risk Assessment: The Company is the leading provider of statistical, actuarial and underwriting data for the U.S. P&C insurance industry. The Company’s databases include cleansed and standardized records describing premiums and losses in insurance transactions, casualty and property risk attributes for commercial buildings and their occupants and fire suppression capabilities of municipalities. The Company uses this data to create policy language and proprietary risk classifications that are industry standards and to generate prospective loss cost estimates used to price insurance policies. Effective December 31, 2012, the Company combined the statistical agency and data services and actuarial services into industry-standard insurance programs within the Risk Assessment segment. There have been no changes in reportable segments in accordance with ASC 280-10 for the years ended December 31, 2012 and 2011.
Discontinued Operations: During February 2014, the Company entered into an agreement to sell the Company's mortgage services business, Interthinx. Results of operations for the mortgage services business are reported as a discontinued operation for the year ended December 31, 2013 and for all prior periods presented. Refer to Note 10 for more information. From 2009 to 2011, the mortgage services business was in both Risk Assessment segment within the insurance services revenue category and Decision Analytics: The Company develops solutions that its customers use to analyze the three key processes in managing risk: ‘loss prediction,’ ‘fraud identification and detection’ and ‘loss quantification.’ The Company’s combination of algorithms and analytic methods incorporates its proprietary data to generate solutions in each of these three categories. In most cases, the Company’s customers integrate the solutions into their models, formulas or underwriting criteria in order to predict potential loss events, ranging from hurricanes and earthquakes to unanticipated healthcare claims. The Company develops catastrophe and extreme event models and offers solutions covering natural and man-made risks, including acts of terrorism. The Company also develops solutions that allow customers to quantify costs after loss events occur. Fraud solutions include data on claim histories, analysis of mortgage applications to identify misinformation, analysis of claims to find emerging patterns of fraud, and identification of suspicious claimsAnalytics segment in the insurance,financial services revenue category. In 2012, the Company reclassified the appraisal mortgage tools from Risk Assessment to our Decision Analytics segment in the financial services revenue category. Therefore, in 2012 and healthcare sectors.
2013, the mortgage services business is within Decision Analytics segment.
The two aforementioned operating segments represent the segments for which separate discrete financial information is available and upon which operating results are regularly evaluated by the CODM in order to assess performance and allocate resources. The Company uses segment EBITDA as the profitability measure for making decisions regarding ongoing operations. Segment EBITDA is net income from continuing operations before investment income and interest expense, provision for income taxes, depreciation and amortization of fixed and intangible assets. In the second quarter of 2012, the Company changed its definition of EBITDA such that it only reflects the definition noted and no longer excludes investment income and realized (loss) gain on securities, net, for all periods presented. Operating expenses consist
104
98
2012.
The following tables providetable provides the Company’s revenue and operating income performance by reportable segment for the yearyears ended December 31, 2010, 2009 and 2008, as well as a reconciliation to income before income taxes for all periods presented in the accompanying consolidated statements of operations:
| 2013 | 2012 | 2011 | |||||||||||||||||||||||||||||||||
Decision Analytics | Risk Assessment | Total | Decision Analytics | Risk Assessment | Total | Decision Analytics | Risk Assessment | Total | |||||||||||||||||||||||||||
| Revenues | $ | 977,427 | $ | 618,276 | $ | 1,595,703 | $ | 828,342 | $ | 579,506 | $ | 1,407,848 | $ | 639,100 | $ | 552,293 | $ | 1,191,393 | |||||||||||||||||
| Expenses: | |||||||||||||||||||||||||||||||||||
| Cost of revenues (exclusive of items shown separately below) | 427,978 | 194,545 | 622,523 | 334,280 | 182,428 | 516,708 | 253,970 | 187,009 | 440,979 | ||||||||||||||||||||||||||
| Selling, general and administrative | 151,557 | 77,425 | 228,982 | 139,122 | 80,946 | 220,068 | 117,188 | 82,307 | 199,495 | ||||||||||||||||||||||||||
| Acquisition related liabilities adjustment | — | — | — | — | — | — | (3,364 | ) | — | (3,364 | ) | ||||||||||||||||||||||||
| Investment (income) and realized (gain) loss on available-for-sale securities, net | 16 | (625 | ) | (609 | ) | 22 | (128 | ) | (106 | ) | 8 | (887 | ) | (879 | ) | ||||||||||||||||||||
| EBITDA from discontinued operations | (15,466 | ) | — | (15,466 | ) | (24,737 | ) | — | (24,737 | ) | (34,539 | ) | (3,186 | ) | (37,725 | ) | |||||||||||||||||||
| EBITDA | 413,342 | 346,931 | 760,273 | 379,655 | 316,260 | 695,915 | 305,837 | 287,050 | 592,887 | ||||||||||||||||||||||||||
| Depreciation and amortization of fixed assets | 51,739 | 14,451 | 66,190 | 33,106 | 13,531 | 46,637 | 26,369 | 13,766 | 40,135 | ||||||||||||||||||||||||||
| Amortization of intangible assets | 63,388 | 353 | 63,741 | 52,207 | — | 52,207 | 32,985 | — | 32,985 | ||||||||||||||||||||||||||
| Investment income and realized gain (loss) on available-for-sale securities, net | (16 | ) | 625 | 609 | (22 | ) | 128 | 106 | (8 | ) | 887 | 879 | |||||||||||||||||||||||
| EBITDA from discontinued operations | 15,466 | — | 15,466 | 24,737 | — | 24,737 | 34,539 | 3,186 | 37,725 | ||||||||||||||||||||||||||
| Operating income | $ | 282,765 | $ | 331,502 | $ | 614,267 | $ | 269,627 | $ | 302,601 | $ | 572,228 | $ | 211,952 | $ | 269,211 | $ | 481,163 | |||||||||||||||||
| Capital expenditures, including non-cash purchases of fixed assets and capital lease obligations | $ | 123,927 | $ | 33,575 | $ | 157,502 | $ | 64,747 | $ | 15,004 | $ | 79,751 | $ | 56,486 | $ | 11,890 | $ | 68,376 | |||||||||||||||||
| December 31, 2010 | December 31, 2009 | December 31, 2008 | ||||||||||||||||||||||||||||||||||
| Risk | Decision | Risk | Decision | Risk | Decision | |||||||||||||||||||||||||||||||
| Assessment | Analytics | Total | Assessment | Analytics | Total | Assessment | Analytics | Total | ||||||||||||||||||||||||||||
| Revenues | $ | 542,138 | $ | 596,205 | $ | 1,138,343 | $ | 523,976 | $ | 503,128 | $ | 1,027,104 | $ | 504,391 | $ | 389,159 | $ | 893,550 | ||||||||||||||||||
| Expenses: | ||||||||||||||||||||||||||||||||||||
| Cost of revenues (exclusive of items shown separately below) | 194,731 | 268,742 | 463,473 | 230,494 | 260,800 | 491,294 | 199,872 | 187,025 | 386,897 | |||||||||||||||||||||||||||
| Selling, general and administrative | 78,990 | 87,384 | 166,374 | 82,554 | 80,050 | 162,604 | 81,813 | 49,426 | 131,239 | |||||||||||||||||||||||||||
| Segment EBITDA | 268,417 | 240,079 | 508,496 | 210,928 | 162,278 | 373,206 | 222,706 | 152,708 | 375,414 | |||||||||||||||||||||||||||
| Depreciation and amortization of fixed assets | 16,772 | 23,956 | 40,728 | 18,690 | 19,888 | 38,578 | 19,447 | 15,870 | 35,317 | |||||||||||||||||||||||||||
| Amortization of intangible assets | 145 | 27,253 | 27,398 | 503 | 32,118 | 32,621 | 806 | 28,749 | 29,555 | |||||||||||||||||||||||||||
| Acquisition related liabilities adjustment | — | (544 | ) | (544 | ) | — | — | — | — | — | — | |||||||||||||||||||||||||
| Operating income | 251,500 | 189,414 | 440,914 | 191,735 | 110,272 | 302,007 | 202,453 | 108,089 | 310,542 | |||||||||||||||||||||||||||
| Unallocated expenses: | ||||||||||||||||||||||||||||||||||||
| Investment income | 305 | 195 | 2,184 | |||||||||||||||||||||||||||||||||
| Realized gains/(losses) on securities, net | 95 | (2,332 | ) | (2,511 | ) | |||||||||||||||||||||||||||||||
| Interest expense | (34,664 | ) | (35,265 | ) | (31,316 | ) | ||||||||||||||||||||||||||||||
| Consolidated income before income taxes | $ | 406,650 | $ | 264,605 | $ | 278,899 | ||||||||||||||||||||||||||||||
| Capital expenditures, including non-cash purchases of fixed assets and capital lease obligations | $ | 8,323 | $ | 32,622 | $ | 40,945 | $ | 8,373 | $ | 35,368 | $ | 43,741 | $ | 12,598 | $ | 20,664 | $ | 33,262 | ||||||||||||||||||
105
99
Operating segment revenue by type of service is provided below:below for the years ended December 31:
| 2013 | 2012 | 2011 | |||||||||
| Decision Analytics | |||||||||||
| Insurance | $ | 539,150 | $ | 493,456 | $ | 451,216 | |||||
| Financial services | 81,113 | 26,567 | 5,323 | ||||||||
| Healthcare | 271,538 | 222,955 | 103,722 | ||||||||
| Specialized markets | 85,626 | 85,364 | 78,839 | ||||||||
| Total Decision Analytics | 977,427 | 828,342 | 639,100 | ||||||||
| Risk Assessment | |||||||||||
| Industry-standard insurance programs | 471,130 | 450,646 | 426,228 | ||||||||
| Property-specific rating and underwriting information | 147,146 | 128,860 | 126,065 | ||||||||
| Total Risk Assessment | 618,276 | 579,506 | 552,293 | ||||||||
| Total consolidated revenues | $ | 1,595,703 | $ | 1,407,848 | $ | 1,191,393 | |||||
| December 31, | December 31, | December 31, | ||||||||||
| 2010 | 2009 | 2008 | ||||||||||
| Risk Assessment | ||||||||||||
| Industry-standard insurance programs | $ | 353,501 | $ | 341,079 | $ | 329,858 | ||||||
| Property-specific rating and underwriting information | 137,071 | 132,027 | 125,835 | |||||||||
| Statistical agency and data services | 29,357 | 28,619 | 27,451 | |||||||||
| Actuarial services | 22,209 | 22,251 | 21,247 | |||||||||
| Total Risk Assessment | 542,138 | 523,976 | 504,391 | |||||||||
| Decision Analytics | ||||||||||||
| Fraud identification and detection solutions | 320,781 | 273,103 | 213,994 | |||||||||
| Loss prediction solutions | 158,406 | 137,328 | 95,128 | |||||||||
| Loss quantification solutions | 117,018 | 92,697 | 80,037 | |||||||||
| Total Decision Analytics | 596,205 | 503,128 | 389,159 | |||||||||
| Total consolidated revenues | $ | 1,138,343 | $ | 1,027,104 | $ | 893,550 | ||||||
19. Related Parties:
The Company considers its Verisk Class A and Class B stockholders that own more than 5% of the outstanding stock within the respective class to be related parties as defined within ASC 850,Related Party Disclosures. At December 31, 2010, theThe Company had no related parties were four Class B stockholders each owning more than 5% of the outstanding Class B shares compared to six Class B stockholders at December 31, 2009. At December 31, 2010, there were four Class A stockholders owning more than 5%entire class of the outstanding Class A shares. The Company’s related parties had accounts receivable, net of $515 and $1,353 and fees received in advance of $1,231 and $439stock as of December 31, 20102013 and 2009, respectively. 2012.
In addition, the Company had revenues from related parties for the years ended December 31, 2010, 20092013, 2012 and 20082011 of $49,788, $60,192$0, $0 and $90,227,$13,882, respectively.
106
| 20. | Commitments and Contingencies: |
The Company’s operations are conducted on leased premises. Approximate minimum rentals under long-term noncancelable leases for all leased premises, computer equipment and automobiles are as follows:
| Years Ending | Operating Leases | Capital Leases | |||||
| 2014 | $ | 34,590 | $ | 4,750 | |||
| 2015 | 35,957 | 4,059 | |||||
| 2016 | 33,171 | 2,034 | |||||
| 2017 | 31,362 | 256 | |||||
| 2018 | 27,182 | 73 | |||||
| 2019-2024 | 73,019 | 194 | |||||
| Net minimum lease payments | $ | 235,281 | 11,366 | ||||
| Less amount representing interest | 608 | ||||||
| Present value of net minimum lease capital payments | $ | 10,758 | |||||
| Operating | Capital | |||||||
Years Ending | Leases | Leases | ||||||
| 2011 | $ | 26,226 | $ | 2,511 | ||||
| 2012 | 24,827 | 1,030 | ||||||
| 2013 | 24,632 | 517 | ||||||
| 2014 | 22,268 | 103 | ||||||
| 2015 | 19,512 | 1 | ||||||
| 2016-2020 | 84,159 | — | ||||||
| 2021-2025 | 5,385 | — | ||||||
| Net minimum lease payments | $ | 207,009 | $ | 4,162 | ||||
| Less amount representing interest | 105 | |||||||
| Present value of net minimum lease capital payments | $ | 4,057 | ||||||
Most of the leases require payment of property taxes and utilities and, in certain cases, contain renewal options. Operating leases consist of office space. Capital leases consist of computer equipment, office equipment, and leased automobiles. Rent expense on operating leases approximated $23,898, $22,985$32,186, $29,618 and $21,261$27,902 in 2010, 20092013, 2012 and 2008,2011, respectively.
In addition, the Company is a party to legal proceedings with respect to a variety of matters in the ordinary course of business, including thosethe matters described below. TheWith respect to ongoing matters, the Company is unable, at the present time, to determine the ultimate resolution of or provide a reasonable estimate of the range of possible loss attributable to these matters or the impact they may have on the Company’s results of operations, financial position or cash flows. This is primarily because many of these cases remainthe matters are generally in their early stages and only limited discovery has taken place.either not commenced or been completed. Although the Company believes it has strong defenses for the litigation proceedings described below,and intends to vigorously defend these matters, the Company could in the future incur judgments or enter into settlements of claims that could have a material adverse effect on its results of operations, financial position or cash flows.
100
107
VERISK ANALYTICS, INC.
NOTES TO CONSOLIDATED FINANCIAL STATEMENTS — (Continued)
Intellicorp Records, Inc. Litigation and iiX Litigation
On November 1, 2012, the Company and State Farm and a Settlement Agreement and Release was executed by all parties in June 2010.
108
On January 3, 2013, the Company received service of Missouri were served with a summons and class action complaint filed in the United States District Court for the WesternSouthern District of Missouri alleging violations ofOhio naming the Driver Privacy Protection Act, or the DPPA, entitledJanice Cook, et al.Company’s subsidiary Insurance Information Exchange (“iiX”) titled Mark A. Johnson v. ACS State & Local Solutions, et al.Plaintiffs brought theInsurance Information Exchange, LLC (the “Johnson Complaint”). The Johnson Complaint alleges a nationwide putative class action on their own behalf and on behalf of all similarly situated individuals whose personal“[a]ll natural persons residing in the United States who were the subject of a consumer report prepared by iiX for employment purposes within five (5) years prior to the filing of this Complaint and to whom iiX did not provide notice of the fact that public record information which is likely to have an adverse effect upon the consumer’s ability to obtain employment, is being reported by iiX, together with the name and address of the person to whom such information is contained in any motor vehiclebeing reported at the time such
101
public record maintained by the State of Missouri and who have not provided express consentinformation is reported to the Stateuser of Missourisuch consumer report.” Similar to the Thomas matter, the Johnson Complaint alleges violations of section 1681k(a) of the FCRA claiming that iiX failed to notify customers contemporaneously that criminal record information was provided to a prospective employer and failed to maintain strict procedures to ensure that the information reported is complete and up to date. The Johnson Complaint seeks statutory damages for the distributionclass in an amount not less than one hundred dollars and not more than one thousand dollars per violation, punitive damages, costs and attorneys’ fees.
On October 18, 2013, the parties filed a Stipulation of their personal information for purposes not enumerated bySettlement resolving the DPPARoe, Thomas and whose personal information has been knowingly obtained and used by the defendants.Johnson matters which Judge Gwin approved on October 29, 2013 subject to a hearing on Final Approval. The class complaint alleges that the defendants knowingly obtained personal informationStipulation of Settlement provides for a purpose not authorizedpayment of $18,600 all of which is to be provided by insurance. Accordingly, if the DPPA and seeks liquidated damages inStipulation of Settlement is approved at the amounthearing on Final Approval, the settlement of two thousand five hundred dollars for each instance of a violation of the DDPA, punitive damages and the destruction of any illegally obtained personal information. The court granted iiX’s motion to dismiss the complaint based on a failure to state a claim on November 19, 2010. Plaintiffs filed a notice of appeal on December 17, 2010.
Interthinx, Inc. Litigation
On May 13, 2013, the liability related to these matters.
On July 2, 2013, the Company was served with a putative class action titled Shabnam Shelia Dehdashtian v. Interthinx, Inc. and Verisk Analytics, Inc. in the United States District Court for the Central District of California. The plaintiff, Shabnam Shelia Dehdashtian, a former mortgage auditor at the Company’s subsidiary Interthinx, Inc. in California, filed the class action on behalf of all persons who have been employed by Interthinx as auditors, mortgage compliance underwriters and mortgage auditors nationwide claiming that the defendants failed to pay overtime compensation, to provide rest and meal periods, waiting time penalties and to provide accurate wage statements to the plaintiffs as required by federal and California law. On August 30, 2013 plaintiff filed her First Amended Complaint (the “Amended Complaint”) adding Medhat Gareeb, a former mortgage auditor, as a plaintiff, limiting the alleged FLSA violations to individual claims and proceeding with the California class action on behalf of all persons who have been employed by defendants as auditors, mortgage compliance underwriters and mortgage auditors in California at any time starting 4 years prior to filing of the initial complaint until trial. The Amended Complaint pleads seven causes of action against defendants: (1) Failure to pay overtime compensation in violation of the FLSA for the individual named plaintiffs only; (2) Failure to pay overtime compensation in violation of Cal. Lab. Code sections 510, 1194 and 1198 and IWC Wage Order No. 4; (3) Failure to pay waiting time penalties in violation of Cal. Lab. Code sections 201-203; (4) Failure to provide itemized wage statements in violation of Cal. Lab. Code section 226 and IWC Order No. 4; (5) Failure to provide and or authorize meal and rest periods in violation of Cal. Lab. Code section 226.7 and IWC Order No. 4; (6) Violation of California Business and Professions Code sections 17200, et seq; and (7) a Labor Code Private Attorney General Act (PAGA) Public enforcement claim, Cal. Lab. Code section 2699 (California class). The complaint seeks compensatory damages, penalties that are associated with the various statutes, equitable and injunctive relief, interest, costs and attorneys’ fees.
On October 14, 2013, the Company received notice of a claim titled Dejan Nagl v. Interthinx Services, Inc. filed in the California Labor and Workforce Development Agency. The claimant, Dejan Nagl, a former mortgage auditor at the Company’s subsidiary Interthinx, Inc. in California, filed the claim on behalf of himself and all current and former individuals employed in California as auditors by Interthinx, Inc. for violations of the California Labor Code and Wage Order. This administrative action was later dismissed by the California Labor and Workforce Development Agency without any further investigation or findings. On November 7, 2013 Dejan Nagl filed a class action complaint in the California Superior Court in Los Angeles County in an action titled Dejan Nagl v. Interthinx, Inc. in which he alleges on behalf of himself and other auditors the following causes of action: (1) Failure to provide rest breaks and meal periods in violation of Lab. Code sections 226.7, 514 and 1198; (2) Failure to pay overtime wages in violation of Lab. Code sections 510 and 1194; (3) Violation of California Business and Professions Code sections 17200, et seq; (4) Failure to provide accurate wage statements in violation of Lab. Code section 226; (5) Failure to timely pay wages for violations of Lab. Code sections 201- 203. The claim seeks compensatory damages and penalties that are associated with the various statutes, costs and attorneys’ fees.
102
At this time, it is not possible to determine the ultimate resolution of, or estimate the liability related to, these matters.
Mariah Re Litigation
On July 8, 2013, the Company was served with a summons and complaint filed in the United States District Court for the Southern District of New York in an action titled Mariah Re LTD. v. American Family Mutual Insurance Company, ISO Services, Inc. and AIR Worldwide Corporation, which was amended by the plaintiff on October 18, 2013 (the “Amended Complaint”). Plaintiff Mariah is a special purpose vehicle established to provide reinsurance to defendant American Family Insurance. Mariah entered into contracts with the Company’s ISO Services, Inc. and AIR Worldwide Corporation subsidiaries, pursuant to which, among other things, Mariah (i) licensed the right to utilize information published in Catastrophe Bulletins issued by the Property Claims Services division of ISO Services, Inc. and (ii) engaged AIR Worldwide Corporation as Calculation Agent to compute certain reinsured losses. The Amended Complaint alleges the following causes of action: (1) breach of contract against ISO Services, Inc. and AIR Worldwide Corporation; (2) unjust enrichment against American Family; (3) conversion against American Family; (4) tortious interference with contract against American Family; (5) declaratory judgment against all defendants and (6) specific performance against all defendants. The Amended Complaint seeks declaratory relief, specific performance, restitution, monetary damages and attorneys’ fees.
At this time, it is not possible to determine the ultimate resolution of, or estimate the liability related to, this matter.
MediConnect Global, Inc. Litigation
On October 11, 2013, the Company was served with a summons and complaint in an action titled Naveen Trehan v. MediConnect Global, Inc., Amy Anderson and Verisk Health, Inc. filed on October 9, 2013 in the United States District Court for the District of Utah. The complaint, brought by a former minority shareholder of the Company’s subsidiary, MediConnect Global, Inc., alleges four causes of action: (1) breach of fiduciary duty against MediConnect and Amy Anderson for failure to disclose the Company's interest in acquiring, merging with or investing in MediConnect prior to the buyout of his shares; (2) fraud against Amy Anderson and MediConnect for intentionally providing false information to plaintiff with the purpose of inducing him to agree to sell his shares at an artificially low price; (3) negligent misrepresentation against Amy Anderson and MediConnect for their negligent failure to discover and disclose the Company's interest in acquiring MediConnect prior to the buyout of plaintiff’s shares and (4) a violation of SEC Rule 10b-5 against Amy Anderson and MediConnect for defrauding plaintiff and failing to disclose material information in connection with the sale of securities. The complaint seeks joint and several recovery from Amy Anderson and MediConnect for compensatory damages, punitive damages, and disgorgement of all profits earned through the investment of plaintiff’s funds, attorneys’ fees, interest and an order from the court that plaintiff’s funds be held in a constructive trust.
At this time, it is not possible to determine the ultimate resolution of, or estimate the liability related to, this matter.
Insurance Services Office, Inc. Litigation
In October 2013, the Company was served with a summons and complaint filed in the United States District Court for the Southern District of New York in an action titled Laurence J. Skelly and Ellen Burke v. Insurance Services Office, Inc. and the Pension Plan for Insurance Organizations. The plaintiffs, former employees of the Company’s subsidiary Insurance Services Office, Inc., bring the action on their own behalf as participants in the Pension Plan for Insurance Organizations and on the behalf of similarly situated participants of the Pension Plan and ask the court to declare that a certain amendment to the Pension Plan as of December 31, 2001, which terminated their right to calculate and define the value of their retirement benefit under the Pension Plan based on their compensation levels as of immediately prior to their “retirement” (the “Unlawful Amendment”), violated the anti-cutback provisions and equitable principles of ERISA. The First Amended Class Action Complaint (the “Amended Complaint”) alleges that (1) the Unlawful Amendment of the Pension Plan violated Section 502(a)(1)(B) of ERISA as well as the anti-cutback rules of ERISA Section 204(g) and Section 411(d)(6) of the Internal Revenue Code; (2) ISO’s failure to provide an ERISA 204(h) notice in a manner calculated to be understood by the average Pension Plan participant was a violation of Sections 204(h) and 102(a) of ERISA and (3) the Living Pension Right was a contract right under ERISA common law and that by terminating that right through the Unlawful Amendment ISO violated plaintiffs’ common law contract rights under ERISA. The Amended Complaint seeks declaratory, equitable and injunctive relief enjoining the enforcement of the Unlawful Amendment and ordering the Pension Plan and ISO retroactive to the date of the Unlawful Amendment to recalculate the accrued benefits of all class members, indemnification from ISO to the Pension Plan for costs and contribution requirements related to voiding the Unlawful Amendment, bonuses to the class representatives, costs and attorney’s fees.
At this time, it is not possible to determine the ultimate resolution of, or estimate the liability related to, this matter.
103
On April 9, 2013, the Company’s subsidiary ISO was served with a First Amended Petition and Request for Disclosure filed in the District Court of Dallas County, Texas in an action titled Sidah Garner v. Nationwide Mutual Insurance Company, Carfax, Inc., General and Import Motors, Porschea Nicole Kendall, Daniel Scott Hayward and Insurance Services Office, Inc. Thereafter, on June 2, 2010, Plaintiffs agreed5, 2013 and August 16, 2013 plaintiff served its Second Amended Petition and Third Amended Petition (“the Amended Petition”) on defendants. This action arises from a car accident on June 6, 2011 in which the plaintiff was critically injured. At the time of the accident the plaintiff was in the passenger seat of a 2004 Mazda, which the plaintiff alleges was previously involved in a total loss rollover collision on April 25, 2006. The Amended Petition alleges that at the time of the April 2006 accident the Mazda was insured by Nationwide which failed to settle theirissue a Texas Salvage Title and that ISO was to provide the crash information to vehicle reporting services, including the defendant Carfax. It further alleges that the Mazda was rebuilt and auctioned through a multi-state salvage reseller and sold to defendant Kendall (the driver) and that prior to purchase Kendall consulted Carfax’s Vehicle History Report which guaranteed no problem with the Mazda’s title and that it was not “junk,” neither “salvage nor rebuilt.” As a result, the Amended Petition alleges that Carfax’s report was in error and it sets forth a claim for negligence, negligent misrepresentation, gross negligence, strict liability, breach of contract and fraud against defendants Nationwide Insurance, Carfax and ISO in addition to the negligence claims with Interthinx.against defendants General and Import Motors and Kendall and Hayward. It seeks actual damages, pain and suffering, loss of past and future earnings, past and future impairment and disfigurement, costs and interest from all defendants and exemplary damages from Nationwide, ISO and Carfax. The court denied the summary judgment motions of ISO and Nationwide on December 19, 2013 and January 6, 2014, respectively and granted preliminary approvalthe summary judgment motion of Carfax on January 27, 2014. Trial is scheduled to commence on March 3, 2014.
At this time, it is not possible to determine the ultimate resolution of, or estimate the liability related to, this matter.
21. Condensed Consolidated Financial Information for Guarantor Subsidiaries and Non-Guarantor Subsidiaries
In 2012 and 2011, the Parent Company registered senior notes with full and unconditional and joint and several guarantees by certain of its 100 percent wholly-owned subsidiaries and issued certain other debt securities with full and unconditional and joint and several guarantees by certain of its subsidiaries. Accordingly, presented below is condensed consolidating financial information for (i) the Parent Company, (ii) the guarantor subsidiaries of the Parent Company on a combined basis, and (iii) all other non-guarantor subsidiaries of the Parent Company on a combined basis, as of December 31, 2013 and 2012 and for the years ended December 31, 2013, 2012 and 2011. The condensed consolidating financial information has been presented using the equity method of accounting, to show the nature of assets held, results of operations, comprehensive income and cash flows of the Parent Company, the guarantor subsidiaries and the non-guarantor subsidiaries assuming all guarantor subsidiaries provide both full and unconditional, and joint and several, guarantees to the settlement on November 10, 2010Parent Company at the beginning of the periods presented. Effective as of December 31, 2013, Verisk Health, Inc. and scheduledVerisk Health Solutions, Inc., guarantors of the final approval hearing for February 23, 2011.senior notes, merged with and into Bloodhound Technologies, Inc. ("Bloodhound"), a non-guarantor of the senior notes, pursuant to which Verisk Health, Inc. (formerly Bloodhound) was the surviving corporation. By virtue of the merger, the surviving corporation of Verisk Health, Inc. expressly assumed all of the obligations of the former Verisk Health, Inc. and Verisk Health Solutions, Inc., including the guarantee by them of the senior notes. As a result, the condensed consolidated balance sheet of the former Bloodhound subsidiary at December 31, 2013 was reclassified from the financial information of the non-guarantor subsidiaries to that of the guarantor subsidiaries.
104
CONDENSED CONSOLIDATING BALANCE SHEET
As of December 31, 2013
| Verisk Analytics, Inc. | Guarantor Subsidiaries | Non-Guarantor Subsidiaries | Eliminating Entries | Consolidated | |||||||||||||||
| (In thousands) | |||||||||||||||||||
| ASSETS | |||||||||||||||||||
| Current assets: | |||||||||||||||||||
| Cash and cash equivalents | $ | 20,226 | $ | 81,095 | $ | 64,480 | $ | — | $ | 165,801 | |||||||||
| Available-for-sale securities | — | 3,911 | — | — | 3,911 | ||||||||||||||
| Accounts receivable, net | — | 99,578 | 58,969 | — | 158,547 | ||||||||||||||
| Prepaid expenses | — | 22,582 | 3,075 | — | 25,657 | ||||||||||||||
| Deferred income taxes, net | — | — | 5,086 | (9 | ) | 5,077 | |||||||||||||
| Income taxes receivable | 20,045 | 66,274 | — | (18,973 | ) | 67,346 | |||||||||||||
| Intercompany receivables | 633,128 | 525,286 | 202,018 | (1,360,432 | ) | — | |||||||||||||
| Other current assets | 5,144 | 26,835 | 2,702 | — | 34,681 | ||||||||||||||
| Current assets held-for-sale | — | 12,421 | 883 | 521 | 13,825 | ||||||||||||||
| Total current assets | 678,543 | 837,982 | 337,213 | (1,378,893 | ) | 474,845 | |||||||||||||
| Noncurrent assets: | |||||||||||||||||||
| Fixed assets, net | — | 198,112 | 35,261 | — | 233,373 | ||||||||||||||
| Intangible assets, net | — | 67,407 | 380,211 | — | 447,618 | ||||||||||||||
| Goodwill | — | 493,053 | 688,628 | — | 1,181,681 | ||||||||||||||
| Investment in subsidiaries | 1,375,128 | 848,124 | — | (2,223,252 | ) | — | |||||||||||||
| Pension assets | — | 60,955 | — | — | 60,955 | ||||||||||||||
| Other assets | 7,789 | 11,356 | 889 | — | 20,034 | ||||||||||||||
| Noncurrent assets held-for-sale | — | 85,945 | — | — | 85,945 | ||||||||||||||
| Total assets | $ | 2,061,460 | $ | 2,602,934 | $ | 1,442,202 | $ | (3,602,145 | ) | $ | 2,504,451 | ||||||||
| LIABILITIES AND STOCKHOLDERS’ EQUITY | |||||||||||||||||||
| Current liabilities: | |||||||||||||||||||
| Accounts payable and accrued liabilities | $ | 22,233 | $ | 102,477 | $ | 63,554 | $ | — | $ | 188,264 | |||||||||
| Short-term debt and current portion of long-term debt | — | 4,341 | 107 | — | 4,448 | ||||||||||||||
| Pension and postretirement benefits, current | — | 2,437 | — | — | 2,437 | ||||||||||||||
| Fees received in advance | — | 192,524 | 34,057 | — | 226,581 | ||||||||||||||
| Intercompany payables | 446,509 | 793,517 | 120,406 | (1,360,432 | ) | — | |||||||||||||
| Deferred income taxes, net | — | 9 | — | (9 | ) | — | |||||||||||||
| Income taxes payable | — | — | 18,973 | (18,973 | ) | — | |||||||||||||
| Current liabilities held-for-sale | — | 8,928 | — | 521 | 9,449 | ||||||||||||||
| Total current liabilities | 468,742 | 1,104,233 | 237,097 | (1,378,893 | ) | 431,179 | |||||||||||||
| Noncurrent liabilities: | |||||||||||||||||||
| Long-term debt | 1,045,129 | 225,950 | 360 | — | 1,271,439 | ||||||||||||||
| Pension and postretirement benefits | — | 15,068 | — | — | 15,068 | ||||||||||||||
| Deferred income taxes, net | — | 70,897 | 127,707 | — | 198,604 | ||||||||||||||
| Other liabilities | — | 31,809 | 4,234 | — | 36,043 | ||||||||||||||
| Noncurrent liabilities held-for-sale | — | 4,529 | — | — | 4,529 | ||||||||||||||
| Total liabilities | 1,513,871 | 1,452,486 | 369,398 | (1,378,893 | ) | 1,956,862 | |||||||||||||
| Total stockholders’ equity | 547,589 | 1,150,448 | 1,072,804 | (2,223,252 | ) | 547,589 | |||||||||||||
| Total liabilities and stockholders’ equity | $ | 2,061,460 | $ | 2,602,934 | $ | 1,442,202 | $ | (3,602,145 | ) | $ | 2,504,451 | ||||||||
105
CONDENSED CONSOLIDATING BALANCE SHEET
As of December 31, 2012
Verisk Analytics, Inc. | Guarantor Subsidiaries | Non-Guarantor Subsidiaries | Eliminating Entries | Consolidated | |||||||||||||||
| (In thousands) | |||||||||||||||||||
| ASSETS | |||||||||||||||||||
| Current assets: | |||||||||||||||||||
| Cash and cash equivalents | $ | 128 | $ | 35,571 | $ | 54,120 | $ | — | $ | 89,819 | |||||||||
| Available-for-sale securities | — | 4,883 | — | — | 4,883 | ||||||||||||||
| Accounts receivable, net | — | 124,212 | 54,218 | — | 178,430 | ||||||||||||||
| Prepaid expenses | — | 19,340 | 2,606 | — | 21,946 | ||||||||||||||
| Deferred income taxes, net | — | 375 | 10,022 | — | 10,397 | ||||||||||||||
| Income taxes receivable | 15,834 | 37,180 | — | (7,039 | ) | 45,975 | |||||||||||||
| Intercompany receivables | 424,927 | 206,165 | 211,792 | (842,884 | ) | — | |||||||||||||
| Other current assets | 12,008 | 19,124 | 7,977 | — | 39,109 | ||||||||||||||
| Total current assets | 452,897 | 446,850 | 340,735 | (849,923 | ) | 390,559 | |||||||||||||
| Noncurrent assets: | |||||||||||||||||||
| Fixed assets, net | — | 126,481 | 27,603 | — | 154,084 | ||||||||||||||
| Intangible assets, net | — | 66,045 | 454,890 | — | 520,935 | ||||||||||||||
| Goodwill | — | 515,705 | 731,754 | — | 1,247,459 | ||||||||||||||
| Deferred income taxes, net | — | 2,584 | — | (2,584 | ) | — | |||||||||||||
| Investment in subsidiaries | 946,612 | 904,198 | — | (1,850,810 | ) | — | |||||||||||||
| Other assets | 13,896 | 31,801 | 1,602 | — | 47,299 | ||||||||||||||
| Total assets | $ | 1,413,405 | $ | 2,093,664 | $ | 1,556,584 | $ | (2,703,317 | ) | $ | 2,360,336 | ||||||||
| LIABILITIES AND STOCKHOLDERS’ EQUITY | |||||||||||||||||||
| Current liabilities: | |||||||||||||||||||
| Accounts payable and accrued liabilities | $ | 14,638 | $ | 113,512 | $ | 59,498 | $ | — | $ | 187,648 | |||||||||
| Short-term debt and current portion of long-term debt | — | 194,980 | 283 | — | 195,263 | ||||||||||||||
| Pension and postretirement benefits, current | — | 1,734 | — | — | 1,734 | ||||||||||||||
| Fees received in advance | — | 167,962 | 32,743 | — | 200,705 | ||||||||||||||
| Intercompany payables | 98,768 | 575,907 | 168,209 | (842,884 | ) | — | |||||||||||||
| Income taxes payable | — | — | 7,039 | (7,039 | ) | — | |||||||||||||
| Total current liabilities | 113,406 | 1,054,095 | 267,772 | (849,923 | ) | 585,350 | |||||||||||||
| Noncurrent liabilities: | |||||||||||||||||||
| Long-term debt | 1,044,408 | 221,706 | 48 | — | 1,266,162 | ||||||||||||||
| Pension and postretirement benefits | — | 41,282 | — | — | 41,282 | ||||||||||||||
| Deferred income taxes, net | — | — | 136,345 | (2,584 | ) | 133,761 | |||||||||||||
| Other liabilities | — | 46,892 | 31,298 | — | 78,190 | ||||||||||||||
| Total liabilities | 1,157,814 | 1,363,975 | 435,463 | (852,507 | ) | 2,104,745 | |||||||||||||
| Total stockholders’ equity | 255,591 | 729,689 | 1,121,121 | (1,850,810 | ) | 255,591 | |||||||||||||
| Total liabilities and stockholders’ equity | $ | 1,413,405 | $ | 2,093,664 | $ | 1,556,584 | $ | (2,703,317 | ) | $ | 2,360,336 | ||||||||
106
CONDENSED CONSOLIDATING STATEMENT OF OPERATIONS
For The Year Ended December 31, 2013
| Verisk Analytics, Inc. | Guarantor Subsidiaries | Non-Guarantor Subsidiaries | Eliminating Entries | Consolidated | |||||||||||||||
| (In thousands) | |||||||||||||||||||
| Revenues | $ | — | $ | 1,259,884 | $ | 355,165 | $ | (19,346 | ) | $ | 1,595,703 | ||||||||
| Expenses: | |||||||||||||||||||
| Cost of revenues (exclusive of items shown separately below) | — | 451,393 | 179,196 | (8,066 | ) | 622,523 | |||||||||||||
| Selling, general and administrative | 1 | 183,717 | 56,544 | (11,280 | ) | 228,982 | |||||||||||||
| Depreciation and amortization of fixed assets | — | 52,248 | 13,942 | — | 66,190 | ||||||||||||||
| Amortization of intangible assets | — | 13,593 | 50,148 | — | 63,741 | ||||||||||||||
| Total expenses | 1 | 700,951 | 299,830 | (19,346 | ) | 981,436 | |||||||||||||
| Operating (loss) income | (1 | ) | 558,933 | 55,335 | — | 614,267 | |||||||||||||
| Other income (expense): | |||||||||||||||||||
| Investment income (loss) | 43 | 728 | (70 | ) | — | 701 | |||||||||||||
| Realized loss on available-for-sale securities, net | — | (92 | ) | — | — | (92 | ) | ||||||||||||
| Interest expense | (54,551 | ) | (21,571 | ) | (14 | ) | — | (76,136 | ) | ||||||||||
| Total other expense, net | (54,508 | ) | (20,935 | ) | (84 | ) | — | (75,527 | ) | ||||||||||
| (Loss) income from continuing operations before equity in net income of subsidiaries and income taxes | (54,509 | ) | 537,998 | 55,251 | — | 538,740 | |||||||||||||
| Provision for income taxes | 20,045 | (198,464 | ) | (18,007 | ) | — | (196,426 | ) | |||||||||||
| Net (loss) income from continuing operations before equity in net income of subsidiaries | (34,464 | ) | 339,534 | 37,244 | — | 342,314 | |||||||||||||
| Income (loss) from discontinued operations, net of tax | — | 6,230 | (164 | ) | — | 6,066 | |||||||||||||
| Equity in net income of subsidiaries | 382,844 | 29,262 | — | (412,106 | ) | — | |||||||||||||
| Net income | $ | 348,380 | $ | 375,026 | $ | 37,080 | $ | (412,106 | ) | $ | 348,380 | ||||||||
107
CONDENSED CONSOLIDATING STATEMENT OF OPERATIONS
For The Year Ended December 31, 2012
| Verisk Analytics, Inc. | Guarantor Subsidiaries | Non-Guarantor Subsidiaries | Eliminating Entries | Consolidated | |||||||||||||||
| (In thousands) | |||||||||||||||||||
| Revenues | $ | — | $ | 1,162,134 | $ | 266,427 | $ | (20,713 | ) | $ | 1,407,848 | ||||||||
| Expenses: | |||||||||||||||||||
| Cost of revenues (exclusive of items shown separately below) | — | 401,724 | 125,111 | (10,127 | ) | 516,708 | |||||||||||||
| Selling, general and administrative | — | 174,324 | 56,330 | (10,586 | ) | 220,068 | |||||||||||||
| Depreciation and amortization of fixed assets | — | 36,898 | 9,739 | — | 46,637 | ||||||||||||||
| Amortization of intangible assets | — | 17,943 | 34,264 | — | 52,207 | ||||||||||||||
| Total expenses | — | 630,889 | 225,444 | (20,713 | ) | 835,620 | |||||||||||||
| Operating income | — | 531,245 | 40,983 | — | 572,228 | ||||||||||||||
| Other income (expense): | |||||||||||||||||||
| Investment income | 44 | 202 | 192 | — | 438 | ||||||||||||||
| Realized loss on available-for-sale securities, net | — | (332 | ) | — | — | (332 | ) | ||||||||||||
| Interest expense | (42,848 | ) | (29,619 | ) | (41 | ) | — | (72,508 | ) | ||||||||||
| Total other (expense) income, net | (42,804 | ) | (29,749 | ) | 151 | — | (72,402 | ) | |||||||||||
| (Loss) income from continuing operations before equity in net income of subsidiaries and income taxes | (42,804 | ) | 501,496 | 41,134 | — | 499,826 | |||||||||||||
| Provision for income taxes | 15,833 | (183,025 | ) | (15,171 | ) | — | (182,363 | ) | |||||||||||
| Net (loss) income from continuing operations before equity in net income of subsidiaries | (26,971 | ) | 318,471 | 25,963 | — | 317,463 | |||||||||||||
| Income from discontinued operations, net of tax | — | 11,679 | — | — | 11,679 | ||||||||||||||
| Equity in net income of subsidiaries | 356,113 | 19,159 | — | (375,272 | ) | — | |||||||||||||
| Net income | $ | 329,142 | $ | 349,309 | $ | 25,963 | $ | (375,272 | ) | $ | 329,142 | ||||||||
108
CONDENSED CONSOLIDATING STATEMENT OF OPERATIONS
For The Year Ended December 31, 2011
| Verisk Analytics, Inc. | Guarantor Subsidiaries | Non-Guarantor Subsidiaries | Eliminating Entries | Consolidated | |||||||||||||||
| (In thousands) | |||||||||||||||||||
| Revenues | $ | — | $ | 1,040,949 | $ | 167,044 | $ | (16,600 | ) | $ | 1,191,393 | ||||||||
| Expenses: | |||||||||||||||||||
| Cost of revenues (exclusive of items shown separately below) | — | 373,689 | 75,603 | (8,313 | ) | 440,979 | |||||||||||||
| Selling, general and administrative | — | 155,117 | 52,665 | (8,287 | ) | 199,495 | |||||||||||||
| Depreciation and amortization of fixed assets | — | 32,315 | 7,820 | — | 40,135 | ||||||||||||||
| Amortization of intangible assets | — | 18,544 | 14,441 | — | 32,985 | ||||||||||||||
| Acquisition related liabilities adjustment | — | (2,800 | ) | (564 | ) | — | (3,364 | ) | |||||||||||
| Total expenses | — | 576,865 | 149,965 | (16,600 | ) | 710,230 | |||||||||||||
| Operating income | — | 464,084 | 17,079 | — | 481,163 | ||||||||||||||
| Other income (expense): | |||||||||||||||||||
| Investment income | 36 | 3,017 | 22 | (2,882 | ) | 193 | |||||||||||||
| Realized gain on available-for-sale securities, net | — | 686 | — | — | 686 | ||||||||||||||
| Interest expense | (23,239 | ) | (33,319 | ) | (171 | ) | 2,882 | (53,847 | ) | ||||||||||
| Total other expense, net | (23,203 | ) | (29,616 | ) | (149 | ) | — | (52,968 | ) | ||||||||||
| (Loss) income from continuing operations before equity in net income of subsidiaries and income taxes | (23,203 | ) | 434,468 | 16,930 | — | 428,195 | |||||||||||||
| Provision for income taxes | 8,522 | (168,654 | ) | (5,607 | ) | — | (165,739 | ) | |||||||||||
| Net (loss) income from continuing operations before equity in net income of subsidiaries | (14,681 | ) | 265,814 | 11,323 | — | 262,456 | |||||||||||||
| Income from discontinued operations, net of tax | — | 20,302 | — | — | 20,302 | ||||||||||||||
| Equity in net income of subsidiaries | 297,439 | 6,891 | — | (304,330 | ) | — | |||||||||||||
| Net income | $ | 282,758 | $ | 293,007 | $ | 11,323 | $ | (304,330 | ) | $ | 282,758 | ||||||||
109
CONDENSED CONSOLIDATING STATEMENT OF COMPREHENSIVE INCOME
For The Year Ended December 31, 2013
| Verisk Analytics, Inc. | Guarantor Subsidiaries | Non-Guarantor Subsidiaries | Eliminating Entries | Consolidated | |||||||||||||||
| (In thousands) | |||||||||||||||||||
| Net income | $ | 348,380 | $ | 375,026 | $ | 37,080 | $ | (412,106 | ) | $ | 348,380 | ||||||||
| Other comprehensive income (loss), net of tax: | |||||||||||||||||||
| Unrealized foreign currency loss | (840 | ) | (778 | ) | (99 | ) | 877 | (840 | ) | ||||||||||
| Unrealized holding loss on available-for-sale securities | (147 | ) | (147 | ) | — | 147 | (147 | ) | |||||||||||
| Pension and postretirement adjustment | 46,659 | 46,659 | — | (46,659 | ) | 46,659 | |||||||||||||
| Total other comprehensive income (loss) | 45,672 | 45,734 | (99 | ) | (45,635 | ) | 45,672 | ||||||||||||
| Comprehensive income | $ | 394,052 | $ | 420,760 | $ | 36,981 | $ | (457,741 | ) | $ | 394,052 | ||||||||
CONDENSED CONSOLIDATING STATEMENT OF COMPREHENSIVE INCOME
For The Year Ended December 31, 2012
| Verisk Analytics, Inc. | Guarantor Subsidiaries | Non-Guarantor Subsidiaries | Eliminating Entries | Consolidated | |||||||||||||||
| (In thousands) | |||||||||||||||||||
| Net income | $ | 329,142 | $ | 349,309 | $ | 25,963 | $ | (375,272 | ) | $ | 329,142 | ||||||||
| Other comprehensive income (loss), net of tax: | |||||||||||||||||||
| Unrealized foreign currency gain | 15 | 172 | 46 | (218 | ) | 15 | |||||||||||||
| Unrealized holding loss on available-for-sale securities | (197 | ) | (197 | ) | — | 197 | (197 | ) | |||||||||||
| Pension and postretirement adjustment | (10,691 | ) | (10,691 | ) | — | 10,691 | (10,691 | ) | |||||||||||
| Total other comprehensive (loss) income | (10,873 | ) | (10,716 | ) | 46 | 10,670 | (10,873 | ) | |||||||||||
| Comprehensive income | $ | 318,269 | $ | 338,593 | $ | 26,009 | $ | (364,602 | ) | $ | 318,269 | ||||||||
CONDENSED CONSOLIDATING STATEMENT OF COMPREHENSIVE INCOME
For The Year Ended December 31, 2011
| Verisk Analytics, Inc. | Guarantor Subsidiaries | Non-Guarantor Subsidiaries | Eliminating Entries | Consolidated | |||||||||||||||
| (In thousands) | |||||||||||||||||||
| Net income | $ | 282,758 | $ | 293,007 | $ | 11,323 | $ | (304,330 | ) | $ | 282,758 | ||||||||
| Other comprehensive income (loss), net of tax: | |||||||||||||||||||
| Unrealized foreign currency (loss) gain | (183 | ) | 55 | (231 | ) | 176 | (183 | ) | |||||||||||
| Unrealized holding loss on available-for-sale securities | (456 | ) | (456 | ) | — | 456 | (456 | ) | |||||||||||
| Pension and postretirement adjustment | (21,845 | ) | (21,845 | ) | — | 21,845 | (21,845 | ) | |||||||||||
| Total other comprehensive loss | (22,484 | ) | (22,246 | ) | (231 | ) | 22,477 | (22,484 | ) | ||||||||||
| Comprehensive income | $ | 260,274 | $ | 270,761 | $ | 11,092 | $ | (281,853 | ) | $ | 260,274 | ||||||||
110
CONDENSED CONSOLIDATING STATEMENT OF CASH FLOWS
For The Year Ended December 31, 2013
| Verisk Analytics, Inc. | Guarantor Subsidiaries | Non-Guarantor Subsidiaries | Eliminating Entries | Consolidated | |||||||||||||||
| (In thousands) | |||||||||||||||||||
| Net cash provided by operating activities | $ | 42 | $ | 287,956 | $ | 218,922 | $ | — | $ | 506,920 | |||||||||
| Cash flows from investing activities: | |||||||||||||||||||
| Acquisitions | — | (983 | ) | — | — | (983 | ) | ||||||||||||
| Investment in subsidiaries | — | (350 | ) | — | 350 | — | |||||||||||||
| Proceeds from release of acquisition related escrows | 66 | 214 | — | — | 280 | ||||||||||||||
| Repayments received from other subsidiaries | — | 206,282 | 9,605 | (215,887 | ) | — | |||||||||||||
| Advances provided to other subsidiaries | (30,000 | ) | (68,692 | ) | — | 98,692 | — | ||||||||||||
| Purchases of fixed assets | — | (118,307 | ) | (27,669 | ) | — | (145,976 | ) | |||||||||||
| Purchases of available-for-sale securities | — | (5,870 | ) | — | — | (5,870 | ) | ||||||||||||
| Proceeds from sales and maturities of available-for-sale securities | — | 7,484 | — | — | 7,484 | ||||||||||||||
| Other investing, net | — | (561 | ) | — | — | (561 | ) | ||||||||||||
| Net cash (used in) provided by investing activities | (29,934 | ) | 19,217 | (18,064 | ) | (116,845 | ) | (145,626 | ) | ||||||||||
| Cash flows from financing activities: | |||||||||||||||||||
| Repayment of current portion of long-term debt | — | (180,000 | ) | — | — | (180,000 | ) | ||||||||||||
| Repayment of short-term debt, net | — | (10,000 | ) | — | — | (10,000 | ) | ||||||||||||
| Proceeds from issuance of common stock | — | — | 350 | (350 | ) | — | |||||||||||||
| Repurchases of Class A common stock | — | (277,411 | ) | — | — | (277,411 | ) | ||||||||||||
| Transfer of cash due to the Verisk Health, Inc. merger | — | 2,877 | (2,877 | ) | — | — | |||||||||||||
| Repayments of advances to other subsidiaries | (10,010 | ) | (9,605 | ) | (196,272 | ) | 215,887 | — | |||||||||||
| Advances received from other subsidiaries | 60,000 | 30,000 | 8,692 | (98,692 | ) | — | |||||||||||||
| Payment of debt issuance costs | — | (605 | ) | — | — | (605 | ) | ||||||||||||
| Excess tax benefits from exercised stock options | — | 109,946 | — | — | 109,946 | ||||||||||||||
| Proceeds from stock options exercised | — | 80,368 | — | — | 80,368 | ||||||||||||||
| Other financing activities, net | — | (6,478 | ) | (292 | ) | — | (6,770 | ) | |||||||||||
| Net cash provided by (used in) financing activities | 49,990 | (260,908 | ) | (190,399 | ) | 116,845 | (284,472 | ) | |||||||||||
| Effect of exchange rate changes | — | (741 | ) | (99 | ) | — | (840 | ) | |||||||||||
| Increase in cash and cash equivalents | 20,098 | 45,524 | 10,360 | — | 75,982 | ||||||||||||||
| Cash and cash equivalents, beginning of period | 128 | 35,571 | 54,120 | — | 89,819 | ||||||||||||||
| Cash and cash equivalents, end of period | $ | 20,226 | $ | 81,095 | $ | 64,480 | $ | — | $ | 165,801 | |||||||||
| Supplemental disclosures: | |||||||||||||||||||
| Increase in intercompany balances from the purchase of treasury stock by Verisk funded directly by ISO | $ | 277,411 | $ | 277,411 | $ | — | $ | — | $ | — | |||||||||
| Increase in intercompany balances from proceeds received by ISO related to issuance of Verisk common stock from options exercised | $ | 80,368 | $ | 80,368 | $ | — | $ | — | $ | — | |||||||||
| Increase (decrease) in intercompany balances due to the merger of Verisk Health, Inc. | $ | — | $ | 85,953 | $ | (85,953 | ) | $ | — | $ | — | ||||||||
111
CONDENSED CONSOLIDATING STATEMENT OF CASH FLOWS
For The Year Ended December 31, 2012
Verisk Analytics, Inc. | Guarantor Subsidiaries | Non-Guarantor Subsidiaries | Eliminating Entries | Consolidated | |||||||||||||||
| (In thousands) | |||||||||||||||||||
| Net cash (used in) provided by operating activities | $ | (20,115 | ) | $ | 329,845 | $ | 158,499 | $ | — | $ | 468,229 | ||||||||
| Cash flows from investing activities: | |||||||||||||||||||
| Acquisitions, net of cash acquired of $36,113 | — | (762,596 | ) | (6,917 | ) | — | (769,513 | ) | |||||||||||
| Purchase of non-controlling equity investments in non-public companies | (250 | ) | (2,000 | ) | — | — | (2,250 | ) | |||||||||||
| Earnout payments | — | — | (250 | ) | — | (250 | ) | ||||||||||||
| Escrow funding associated with acquisitions | — | (38,000 | ) | (800 | ) | — | (38,800 | ) | |||||||||||
| Proceeds from release of acquisition related escrows | — | 1,455 | — | — | 1,455 | ||||||||||||||
| Repayments received from other subsidiaries | 19,400 | 592,356 | — | (611,756 | ) | — | |||||||||||||
| Advances provided to other subsidiaries | — | (52,000 | ) | — | 52,000 | — | |||||||||||||
| Purchases of fixed assets | — | (60,525 | ) | (13,848 | ) | — | (74,373 | ) | |||||||||||
| Purchases of available-for-sale securities | — | (1,784 | ) | — | — | (1,784 | ) | ||||||||||||
| Proceeds from sales and maturities of available-for-sale securities | — | 1,932 | — | — | 1,932 | ||||||||||||||
| Net cash provided by (used in) investing activities | 19,150 | (321,162 | ) | (21,815 | ) | (559,756 | ) | (883,583 | ) | ||||||||||
| Cash flows from financing activities: | |||||||||||||||||||
| Proceeds from issuance of long-term debt, net of original issue discount | 347,224 | — | — | — | 347,224 | ||||||||||||||
| Repayment of short-term debt refinanced on a long-term basis | — | (347,224 | ) | — | — | (347,224 | ) | ||||||||||||
| Proceeds from short-term debt, net | — | 357,224 | — | — | 357,224 | ||||||||||||||
| Payment of debt issuance costs | (2,557 | ) | (1,348 | ) | — | — | (3,905 | ) | |||||||||||
| Repurchases of Class A common stock | — | (162,275 | ) | — | — | (162,275 | ) | ||||||||||||
| Repayments of advances to other subsidiaries | (419,812 | ) | (19,400 | ) | (172,544 | ) | 611,756 | — | |||||||||||
| Advances received from other subsidiaries | — | — | 52,000 | (52,000 | ) | — | |||||||||||||
| Excess tax benefits from exercised stock options | — | 60,672 | — | — | 60,672 | ||||||||||||||
| Proceeds from stock options exercised | — | 68,388 | — | — | 68,388 | ||||||||||||||
| Other financing activities, net | — | (5,931 | ) | (618 | ) | — | (6,549 | ) | |||||||||||
| Net cash (used in) provided by financing activities | (75,145 | ) | (49,894 | ) | (121,162 | ) | 559,756 | 313,555 | |||||||||||
| Effect of exchange rate changes | — | (31 | ) | 46 | — | 15 | |||||||||||||
| (Decrease) increase in cash and cash equivalents | (76,110 | ) | (41,242 | ) | 15,568 | — | (101,784 | ) | |||||||||||
| Cash and cash equivalents, beginning of period | 76,238 | 76,813 | 38,552 | — | 191,603 | ||||||||||||||
| Cash and cash equivalents, end of period | $ | 128 | $ | 35,571 | $ | 54,120 | $ | — | $ | 89,819 | |||||||||
| Supplemental disclosures: | |||||||||||||||||||
| Increase in intercompany balances from the purchase of MediConnect and Argus by ISO | $ | 17,000 | $ | 790,174 | $ | 773,174 | $ | — | $ | — | |||||||||
| Increase in intercompany balances from the purchase of treasury stock by Verisk funded directly by ISO | $ | 162,275 | $ | 162,275 | $ | — | $ | — | $ | — | |||||||||
| Increase in intercompany balances from proceeds received by ISO related to issuance of Verisk common stock from options exercised | $ | 68,388 | $ | 68,388 | $ | — | $ | — | $ | — | |||||||||
112
CONDENSED CONSOLIDATING STATEMENT OF CASH FLOWS
For The Year Ended December 31, 2011
| Verisk Analytics, Inc. | Guarantor Subsidiaries | Non-Guarantor Subsidiaries | Eliminating Entries | Consolidated | |||||||||||||||
| (In thousands) | |||||||||||||||||||
| Net cash (used in) provided by operating activities | $ | (14,821 | ) | $ | 346,820 | $ | 43,722 | $ | — | $ | 375,721 | ||||||||
| Cash flows from investing activities: | |||||||||||||||||||
| Acquisitions, net of cash acquired of $590 | — | (121,721 | ) | — | — | (121,721 | ) | ||||||||||||
| Earnout payments | — | — | (3,500 | ) | — | (3,500 | ) | ||||||||||||
| Escrow funding associated with acquisitions | — | (19,560 | ) | — | — | (19,560 | ) | ||||||||||||
| Repayments received from other subsidiaries | — | 9,714 | — | (9,714 | ) | — | |||||||||||||
| Advances provided to other subsidiaries | (10,052 | ) | (54,701 | ) | (81,824 | ) | 146,577 | — | |||||||||||
| Proceeds from repayment of intercompany note receivable | — | 617,796 | — | (617,796 | ) | — | |||||||||||||
| Purchases of fixed assets | — | (50,813 | ) | (9,016 | ) | — | (59,829 | ) | |||||||||||
| Purchases of available-for-sale securities | — | (1,549 | ) | — | — | (1,549 | ) | ||||||||||||
| Proceeds from sales and maturities of available-for-sale securities | — | 1,730 | — | — | 1,730 | ||||||||||||||
| Other investing activities, net | — | 300 | — | — | 300 | ||||||||||||||
| Net cash (used in) provided by investing activities | (10,052 | ) | 381,196 | (94,340 | ) | (480,933 | ) | (204,129 | ) | ||||||||||
| Cash flows from financing activities: | |||||||||||||||||||
| Proceeds from issuance of long-term debt, net of original issue discount | 696,559 | — | — | — | 696,559 | ||||||||||||||
| Repayment of current portion of long-term debt | — | (125,000 | ) | — | — | (125,000 | ) | ||||||||||||
| Repayment of short-term debt refinanced on a long-term basis | — | (440,000 | ) | — | — | (440,000 | ) | ||||||||||||
| Proceeds from issuance of short-term debt with original maturities greater than three months | — | 120,000 | — | — | 120,000 | ||||||||||||||
| Proceeds from short-term debt, net | — | 10,000 | — | — | 10,000 | ||||||||||||||
| Payment of debt issuance costs | (4,487 | ) | (3,348 | ) | — | — | (7,835 | ) | |||||||||||
| Repurchases of Class A common stock | — | (381,776 | ) | — | — | (381,776 | ) | ||||||||||||
| Repayments of advances provided to other subsidiaries | (7,204 | ) | (2,510 | ) | — | 9,714 | — | ||||||||||||
| Repayment of intercompany note payable | (617,796 | ) | — | — | 617,796 | — | |||||||||||||
| Advances received from other subsidiaries | 34,038 | 46,013 | 66,526 | (146,577 | ) | — | |||||||||||||
| Excess tax benefits from exercised stock options | — | 53,195 | — | — | 53,195 | ||||||||||||||
| Proceeds from stock options exercised | — | 43,345 | — | — | 43,345 | ||||||||||||||
| Other financing activities, net | — | (2,746 | ) | (522 | ) | — | (3,268 | ) | |||||||||||
| Net cash provided by (used in) financing activities | 101,110 | (682,827 | ) | 66,004 | 480,933 | (34,780 | ) | ||||||||||||
| Effect of exchange rate changes | — | 48 | (231 | ) | — | (183 | ) | ||||||||||||
| Increase in cash and cash equivalents | 76,237 | 45,237 | 15,155 | — | 136,629 | ||||||||||||||
| Cash and cash equivalents, beginning of period | 1 | 31,576 | 23,397 | — | 54,974 | ||||||||||||||
| Cash and cash equivalents, end of period | $ | 76,238 | $ | 76,813 | $ | 38,552 | $ | — | $ | 191,603 | |||||||||
| Supplemental disclosures: | |||||||||||||||||||
| Increase in intercompany balances from the purchase of treasury stock by Verisk funded directly by ISO | $ | 381,776 | $ | 381,776 | $ | — | $ | — | $ | — | |||||||||
| Increase in intercompany balances from proceeds received by ISO related to issuance of Verisk common stock from options exercised | $ | 43,345 | $ | 43,345 | $ | — | $ | — | $ | — | |||||||||
| Issuance of intercompany note payable (receivable) from amounts previously recorded as intercompany payables (receivables) | $ | 615,000 | $ | (615,000 | ) | $ | — | $ | — | $ | — | ||||||||
113
22. Subsequent Events
In January 2014, the Company entered into an agreement to acquire 100% of the stock of Eagle View Technology Corporation (“EVT”), the parent company of Pictometry International Corp. and Eagle View Technologies, Inc., for a net cash purchase price of $650,000, which will be funded by the Company's operating cash and borrowings from the credit facility. EVT is a provider of geo-referenced aerial image capture and visual-centric data analytics and solutions to insurers, contractors, government, and commercial customers in the United States. This acquisition is expected to advance the Company's position in the imagery analytics market, adding new municipal and commercial customers. The transaction is expected to support the aerial imagery solution development in the Company's Decision Analytics segment. The cash paid will be adjusted subsequent to close to reflect final balances of certain working capital accounts and other closing adjustments. The parties expect the transaction to close by July 2014, subject to the completion of customary closing conditions, including receipt of regulatory and shareholder approvals.
In February 2014, the Company entered into an agreement for the sale of 100% of the stock of the Company’s mortgage services business, Interthinx. Refer to Note 10. Discontinued Operations for further discussion.
**************
Schedule II
Valuation and Qualifying Accounts and Reserves
For the Years Ended December 31, 2010, 20092013, 2012 and 2008
2011
2011
(In thousands)
| Description | Balance at Beginning of Year | Charged to Costs and Expenses(1) | Deductions— Write-offs(2) | Adjustment (3) | Balance at End of Year | ||||||||||||||
| Year ended December 31, 2013 | |||||||||||||||||||
| Allowance for doubtful accounts | $ | 4,753 | $ | 2,468 | $ | (2,284 | ) | $ | (522 | ) | $ | 4,415 | |||||||
| Valuation allowance for income taxes | $ | 595 | $ | 673 | $ | (527 | ) | $ | — | $ | 741 | ||||||||
| Year ended December 31, 2012 | |||||||||||||||||||
| Allowance for doubtful accounts | $ | 4,158 | $ | 1,065 | $ | (470 | ) | $ | — | $ | 4,753 | ||||||||
| Valuation allowance for income taxes | $ | 1,615 | $ | 73 | $ | (1,093 | ) | $ | — | $ | 595 | ||||||||
| Year Ended December 31, 2011 | |||||||||||||||||||
| Allowance for doubtful accounts | $ | 4,028 | $ | 1,278 | $ | (1,148 | ) | $ | — | $ | 4,158 | ||||||||
| Valuation allowance for income taxes | $ | 1,485 | $ | 130 | $ | — | $ | — | $ | 1,615 | |||||||||
| Balance at | Charged to | Deductions — | ||||||||||||||
| Beginning | Costs and | Write-offs | Balance at | |||||||||||||
Description | of Year | Expenses(1) | (2) | End of Year | ||||||||||||
| Year ended December 31, 2010: | ||||||||||||||||
| Allowance for doubtful accounts | $ | 3,844 | $ | 648 | $ | (464 | ) | $ | 4,028 | |||||||
| Valuation allowance for income taxes | $ | 2,110 | $ | 352 | $ | (977 | ) | $ | 1,485 | |||||||
| Year ended December 31, 2009: | ||||||||||||||||
| Allowance for doubtful accounts | $ | 6,397 | $ | 916 | $ | (3,469 | ) | $ | 3,844 | |||||||
| Valuation allowance for income taxes | $ | 2,098 | $ | 12 | $ | — | $ | 2,110 | ||||||||
| Year ended December 31, 2008: | ||||||||||||||||
| Allowance for doubtful accounts | $ | 8,247 | $ | 1,536 | $ | (3,386 | ) | $ | 6,397 | |||||||
| Valuation allowance for income taxes | $ | 1,534 | $ | 564 | $ | — | $ | 2,098 | ||||||||
| (1) | Primarily additional reserves for bad debts. |
| (2) | Primarily accounts receivable balances written off, net of recoveries, and the expiration of loss carryforwards. |
| (3) | Related to discontinued operations |
114
SIGNATURES
Pursuant to the requirements of Section 13 or 15(d) of the Securities Exchange Act of 1934, the registrant has duly caused this report to be signed on its behalf by the undersigned, thereunto duly authorized, on February 28, 2011.25, 2014.
VERISK ANALYTICS, INC. (Registrant) | |
/ | |
| Scott G. Stephenson | |
| President and Chief Executive Officer | |
Pursuant to the requirements of the Securities Exchange Act of 1934, this report has been signed below by the following persons on behalf of the registrant and in the capacities indicated on February 28, 2011.25, 2014.
| Signature | Capacity | |||
| Scott G. Stephenson | ||||
/ | ||||
| Mark V. Anquillare | ||||
/ | ||||
| Frank J. Coyne | ||||
/ | Director | |||
| J. Hyatt Brown | ||||
/ | Director | |||
| Glen A. Dell | ||||
/ | Director | |||
| Christopher M. Foskett | ||||
/ | Director | |||
| Constantine P. Iordanou | ||||
/ | Director | |||
| John F. Lehman, Jr. | ||||
/ | Director | |||
| Samuel G. Liss | ||||
/ | Director | |||
| Andrew G. Mills | ||||
/ | Director | |||
| Thomas F. Motamed | ||||
/ | Director | |||
| Therese M. Vaughan | ||||
| /S/ DAVID B. WRIGHT | Director | |||
| David B. Wright | ||||
111
115
EXHIBIT INDEX
| Exhibit | ||||
Number | Description | |||
| 3 | .1 | Amended and Restated Certificate of Incorporation, incorporated herein by reference to Exhibit 3.1 to Amendment No. 6 to the Company’s Registration Statement on Form S-1, dated September 21, 2009. | ||
| 3 | .2 | Amended and Restated By-Laws, incorporated herein by reference to Exhibit 3.2 to Amendment No. 6 to the Company’s Registration Statement on Form S-1, dated September 21, 2009. | ||
| 4 | .1 | Form of Common Stock Certificate, incorporated herein by reference to Exhibit 4.1 to Amendment No. 6 to the Company’s Registration Statement on Form S-1, dated September 21, 2009. | ||
| 4 | .2 | Prudential Uncommitted Master Shelf Agreement, dated as of June 13, 2003, among Insurance Services Office, Inc., The Prudential Insurance Company of America, U.S. Private Placement Fund, Baystate Investments, LLC, United of Omaha Life Insurance Company and Prudential Investment Management, Inc., incorporated herein by reference to Exhibit 4.2 to Amendment No. 2 to the Company’s Registration Statement on Form S-1, dated November 20, 2008. | ||
| 4 | .3 | Amendment No. 1 to the Prudential Uncommitted Master Shelf Agreement, dated February 1, 2005, among Insurance Services Office, Inc., The Prudential Insurance Company of America, Prudential Investment Management, Inc. and the other purchasers party thereto, incorporated herein by reference to Exhibit 4.3 to Amendment No. 2 to the Company’s Registration Statement on Form S-1, dated November 20, 2008. | ||
| 4 | .4 | Amendment No. 2 to the Prudential Uncommitted Master Shelf Agreement, dated June 1, 2005, among Insurance Services Office, Inc., The Prudential Insurance Company of America, Prudential Investment Management, Inc. and the other purchasers party thereto, incorporated herein by reference to Exhibit 4.4 to Amendment No. 2 to the Company’s Registration Statement on Form S-1, dated November 20, 2008. | ||
| 4 | .5 | Amendment No. 3 to the Prudential Uncommitted Master Shelf Agreement, dated January 23, 2006, among Insurance Services Office, Inc., The Prudential Insurance Company of America, Prudential Investment Management, Inc. and the other purchasers party thereto, incorporated herein by reference to Exhibit 4.5 to Amendment No. 2 to the Company’s Registration Statement on Form S-1, dated November 20, 2008. | ||
| 4 | .6 | Waiver and Amendment No. 4 to the Prudential Uncommitted Master Shelf Agreement, dated February 28, 2007, among Insurance Services Office, Inc., The Prudential Insurance Company of America, Prudential Investment Management, Inc. and the other purchasers party thereto, incorporated herein by reference to Exhibit 4.6 to Amendment No. 2 to the Company’s Registration Statement on Form S-1, dated November 20, 2008. | ||
| 4 | .7 | Amendment No. 5 to the Prudential Uncommitted Master Shelf Agreement, dated August 30, 2010, among Insurance Services Office, Inc., The Prudential Insurance Company of America, Prudential Investment Management, Inc. and the other purchasers party thereto, incorporated herein by reference to Exhibit 4.8 to the Company’s Registration Statement on Form S-1, dated September 15, 2010. | ||
| 4 | .8 | New York Life Uncommitted Master Shelf Agreement, dated as of March 16, 2007, among Insurance Services Office, Inc., New York Life Insurance Company and the other purchasers party thereto, incorporated herein by reference to Exhibit 4.7 to Amendment No. 2 to the Company’s Registration Statement on Form S-1, dated November 20, 2008. | ||
| 10 | .1 | 401(k) Savings Plan and Employee Stock Ownership Plan, incorporated herein by reference to Exhibit 10.1 to the Company’s Registration Statement on Form S-1, dated August 12, 2008. | ||
| 10 | .2 | Verisk Analytics, Inc. 2009 Equity Incentive Plan, incorporated herein by reference to Exhibit 10.2 to Amendment No. 6 to the Company’s Registration Statement on Form S-1, dated September 21, 2009. | ||
| 10 | .3 | Form of Letter Agreement, incorporated herein by reference to Exhibit 10.3 to Amendment No. 1 to the Company’s Registration Statement on Form S-1, dated October 7, 2008. | ||
112
| Exhibit | ||||
Number | Description | |||
| 10 | .4 | Form of Master License Agreement and Participation Supplement, incorporated herein by reference to Exhibit 10.4 to Amendment No. 1 to the Company’s Registration Statement on Form S-1, dated October 7, 2008. | ||
| 10 | .5 | Schedule of Master License Agreements Substantially Identical in All Material Respects to the Form of Master License Agreement and Participation Supplement, incorporated herein by reference to Exhibit 10.5 to Amendment No. 2 to the Company’s Registration Statement on Form S-1, dated November 20, 2008. | ||
| 10 | .6 | Credit Agreement, dated as of July 2, 2009, between Insurance Services Office, Inc. and Bank of America, N.A., as Administrative Agent, and the lenders party thereto, incorporated herein by reference to Exhibit 10.6 to Amendment No. 5 to the Company’s Registration Statement onForm S-1, dated August 21, 2009. | ||
| 10 | .7 | Letter Agreement dated August 21, 2009 between Insurance Services Office, Inc. and Bank of America, N.A., as administrative agent, incorporated herein by reference to Exhibit 10.1 to the Company’s Current Report on Form 8-K, dated September 13, 2010. | ||
| 10 | .8 | Second Amendment and Modification Agreement dated April 19, 2010 among Insurance Services Office, Inc., the Company, as a guarantor, the other guarantors party thereto, Bank of America, N.A., as a lender and the administrative agent, and the other lenders party thereto, incorporated herein by reference to Exhibit 10.2 to the Company’s Current Report on Form 8-K, dated September 13, 2010. | ||
| 10 | .9 | Third Amendment and Modification Agreement dated September 10, 2010 among the Insurance Services Office, Inc., the Company, as guarantor, the other guarantors party thereto, Bank of America, N.A., and the other lenders party thereto, incorporated herein by reference to Exhibit 10.3 to the Company’s Current Report on Form 8-K, dated September 13, 2010. | ||
| 10 | .10 | Employment Agreement with Frank J. Coyne, incorporated herein by reference to Exhibit 10.7 to Amendment No. 6 to the Company’s Registration Statement on Form S-1, dated September 21, 2009. | ||
| 10 | .11 | Form of Change of Control Severance Agreement, incorporated herein by reference to Exhibit 10.8 to Amendment No. 6 to the Company’s Registration Statement on Form S-1, dated September 21, 2009. | ||
| 10 | .12 | Insurance Services Office, Inc. 1996 Incentive Plan and Form of Stock Option Agreement thereunder, incorporated herein by reference to Exhibit 10.9 to Amendment No. 7 to the Company’s Registration Statement on Form S-1, dated September 29, 2009. | ||
| 10 | .13 | Form of Stock Option Award Agreement, incorporated herein by reference to Exhibit 10.2 to the Company’s Quarterly Report on Form 10-Q, dated November 16, 2009. | ||
| 21 | .1 | Subsidiaries of the Registrant, incorporated herein by reference to Exhibit 21.1 to Amendment No. 6 to the Company’s Registration Statement on Form S-1, dated September 29, 2009. | ||
| 23 | .1 | Consent of Deloitte & Touche LLP.* | ||
| 31 | .1 | Certification of the Chief Executive Officer of Verisk Analytics, Inc. pursuant to Rule 13a-14 under the Securities Exchange Act of 1934.* | ||
| 31 | .2 | Certification of the Chief Financial Officer of Verisk Analytics, Inc. pursuant to Rule 13a-14 under the Securities Exchange Act of 1934.* | ||
| 32 | .1 | Certification of the Chief Executive Officer and Chief Financial Officer of Verisk Analytics, Inc. pursuant to 18 U.S.C. Section 1350 as Adopted Pursuant to Section 906 of the Sarbanes-Oxley Act of 2002.* | ||
Exhibit Number | Description |
| 3.1 | Amended and Restated Certificate of Incorporation, incorporated herein by reference to Exhibit 3.1 to Amendment No. 6 to the Company’s Registration Statement on Form S-1, dated September 21, 2009. |
| 3.2 | Amended and Restated By-Laws, incorporated herein by reference to Exhibit 3.2 to Amendment No. 6 to the Company’s Registration Statement on Form S-1, dated September 21, 2009. |
| 4.1 | Form of Common Stock Certificate, incorporated herein by reference to Exhibit 4.1 to Amendment No. 6 to the Company’s Registration Statement on Form S-1, dated September 21, 2009. |
| 4.2 | Prudential Uncommitted Master Shelf Agreement, dated as of June 13, 2003, among Insurance Services Office, Inc., The Prudential Insurance Company of America, U.S. Private Placement Fund, Baystate Investments, LLC, United of Omaha Life Insurance Company and Prudential Investment Management, Inc., incorporated herein by reference to Exhibit 4.2 to Amendment No. 2 to the Company’s Registration Statement on Form S-1, dated November 20, 2008. |
| 4.3 | Amendment No. 1 to the Prudential Uncommitted Master Shelf Agreement, dated February 1, 2005, among Insurance Services Office, Inc., The Prudential Insurance Company of America, Prudential Investment Management, Inc. and the other purchasers party thereto, incorporated herein by reference to Exhibit 4.3 to Amendment No. 2 to the Company’s Registration Statement on Form S-1, dated November 20, 2008. |
| 4.4 | Amendment No. 2 to the Prudential Uncommitted Master Shelf Agreement, dated June 1, 2005, among Insurance Services Office, Inc., The Prudential Insurance Company of America, Prudential Investment Management, Inc. and the other purchasers party thereto, incorporated herein by reference to Exhibit 4.4 to Amendment No. 2 to the Company’s Registration Statement on Form S-1, dated November 20, 2008. |
| 4.5 | Amendment No. 3 to the Prudential Uncommitted Master Shelf Agreement, dated January 23, 2006, among Insurance Services Office, Inc., The Prudential Insurance Company of America, Prudential Investment Management, Inc. and the other purchasers party thereto, incorporated herein by reference to Exhibit 4.5 to Amendment No. 2 to the Company’s Registration Statement on Form S-1, dated November 20, 2008. |
| 4.6 | Waiver and Amendment No. 4 to the Prudential Uncommitted Master Shelf Agreement, dated February 28, 2007, among Insurance Services Office, Inc., The Prudential Insurance Company of America, Prudential Investment Management, Inc. and the other purchasers party thereto, incorporated herein by reference to Exhibit 4.6 to Amendment No. 2 to the Company’s Registration Statement on Form S-1, dated November 20, 2008. |
| 4.7 | Amendment No. 5 to the Prudential Uncommitted Master Shelf Agreement, dated August 30, 2010, among Insurance Services Office, Inc., The Prudential Insurance Company of America, Prudential Investment Management, Inc. and the other purchasers party thereto, incorporated by reference to Exhibit 4.8 to the Company’s Registration Statement on Form S-1, dated September 16, 2010. |
| 4.8 | Waiver, Consent and Amendment No. 6 to the Prudential Uncommitted Master Shelf Agreement, dated March 28, 2011, among Verisk Analytics, Inc., Insurance Services Office, Inc., The Prudential Insurance Company of America, Prudential Investment Management, Inc. and the other purchasers party thereto, incorporated by reference to Exhibit 4.10 to the Company’s Registration Statement on Form S-3, dated March 29, 2011. |
116
Exhibit Number | Description |
| 4.9 | New York Life Uncommitted Master Shelf Agreement, dated as of March 16, 2007, among Insurance Services Office, Inc., New York Life Insurance Company and the other purchasers party thereto, incorporated herein by reference to Exhibit 4.7 to Amendment No. 2 to the Company’s Registration Statement on Form S-1, dated November 20, 2008. |
| 4.10 | Waiver, Consent and Amendment No. 2 to the New York Life Uncommitted Master Shelf Agreement, dated March 28, 2011, among Verisk Analytics, Inc., Insurance Services Office, Inc., New York Life Insurance Company and the other purchasers party thereto, incorporated by reference to Exhibit 4.11 to the Company’s Registration Statement on Form S-3, dated March 29, 2011. |
| 4.11 | Third Amended and Restated Sharing Agreement, dated as of March 28, 2011, among Bank of America, N.A., as administrative agent, and the other Lenders party thereto, incorporated by reference to Exhibit 4.12 to the Company’s Registration Statement on Form S-3, dated March 29, 2011. |
| 4.12 | Senior Notes Indenture, dated as of April 6, 2011, among Verisk Analytics, Inc., the guarantors named therein and Wells Fargo Bank, National Association, as Trustee, incorporated herein by reference to Exhibit 4.1 to the Company’s Current Report on Form 8-K, dated April 6, 2011. |
| 4.13 | First Supplemental Indenture, dated as of April 6, 2011, among Verisk Analytics, Inc., the guarantors named therein and Wells Fargo Bank, National Association, as Trustee, incorporated herein by reference to Exhibit 4.2 to the Company’s Current Report on Form 8-K, dated April 6, 2011. |
| 4.14 | Second Supplemental Indenture, dated as of December 8, 2011, among Verisk Analytics, Inc., the guarantors named therein and Wells Fargo Bank, National Association, as Trustee, incorporated herein by reference to Exhibit 4.2 to the Company’s Current Report on Form 8-K, dated December 8, 2011. |
| 4.15 | Third Supplemental Indenture, dated as of September 12, 2012, among Verisk Analytics, Inc., the guarantors named therein and Wells Fargo Bank, National Association, as Trustee, incorporated herein by reference to Exhibit 4.2 to the Company’s Current Report on Form 8-K, dated September 12, 2012. |
| 10.1 | 401(k) Savings Plan and Employee Stock Ownership Plan, incorporated herein by reference to Exhibit 10.1 to the Company’s Registration Statement on Form S-1, dated August 12, 2008. |
| 10.2 | Verisk Analytics, Inc. 2009 Equity Incentive Plan, incorporated herein by reference to Exhibit 10.2 to Amendment No. 6 to the Company’s Registration Statement on Form S-1, dated September 21, 2009. |
| 10.3 | Form of Letter Agreement, incorporated herein by reference to Exhibit 10.3 to Amendment No. 1 to the Company’s Registration Statement on Form S-1, dated October 7, 2008. |
| 10.4 | Form of Master License Agreement and Participation Supplement, incorporated herein by reference to Exhibit 10.4 to Amendment No. 1 to the Company’s Registration Statement on Form S-1, dated October 7, 2008. |
| 10.5 | Schedule of Master License Agreements Substantially Identical in All Material Respects to the Form of Master License Agreement and Participation Supplement, incorporated herein by reference to Exhibit 10.5 to Amendment No. 2 to the Company’s Registration Statement on Form S-1, dated November 20, 2008. |
| 10.6 | Amended and Restated Credit Agreement dated October 25, 2011 among Verisk Analytics, Inc., as co-borrower, Insurance Services Office, Inc., as co-borrower, the guarantors party thereto, and the lenders party thereto, incorporated herein by reference to Exhibit 10.1 to the Company’s Current Report on Form 8-K dated October 26, 2011. |
117
Exhibit Number | Description |
| 10.7 | Form of Change of Control Severance Agreement, incorporated herein by reference to Exhibit 10.8 to Amendment No. 6 to the Company’s Registration Statement on Form S-1, dated September 21, 2009. |
| 10.8 | Insurance Services Office, Inc. 1996 Incentive Plan and Form of Stock Option Agreement thereunder, incorporated herein by reference to Exhibit 10.9 to Amendment No. 7 to the Company’s Registration Statement on Form S-1, dated September 29, 2009. |
| 10.9 | Form of Stock Option Award Agreement under the Verisk Analytics, Inc. 2009 Equity Incentive Plan, incorporated herein by reference to Exhibit 10.2 to the Company’s Quarterly Report on Form 10-Q, dated November 16, 2009. |
| 10.10 | First Amendment dated September 28, 2012 to the Amended and Restated Credit Agreement dated October 25, 2011 among Verisk Analytics, Inc., as co-borrower, Insurance Services Office, Inc., as co-borrower, the guarantors party thereto, and the lenders and agents party thereto, incorporated herein by reference to Exhibit 10.1 to the Company’s Current Report on Form 8-K, dated September 28, 2012. |
| 10.11 | Second Amendment dated October 25, 2013 to the Amended and Restated Credit Agreement dated October 25, 2011 among Verisk Analytics, Inc., as co-borrower, Insurance Services Office. Inc, as co-borrowers, the guarantors party thereto, and the lenders and agents party thereto, incorporated by reference to Exhibit 10.1 to the Company's Current Report on Form 8-K, dated October 28, 2013. |
| 10.12 | Insurance Services Office, Inc. Supplemental Cash Balance Plan dated January 1, 2009 as amended by the Amendment to the Insurance Services Office, Inc. Supplemental Cash Balance Plan dated February 10, 2012.* |
| 10.13 | Insurance Services Office, Inc. Supplemental Executive Retirement Savings Plan dated January 1, 2009.* |
| 10.14 | Verisk Analytics, Inc. 2013 Equity Incentive Plan, incorporated herein by reference to Appendix A to the Company's Proxy Statement on Schedule 14A, dated April 1, 2013. |
| 10.15 | Form of Stock Option Award Agreement under Verisk Analytics, Inc. 2013 Equity Incentive Plan, incorporated herein by reference to Exhibit 99.2 to Company’s Registration Statement on Form S-8 dated May 15, 2013. |
| 10.16 | Form of Restricted Stock Award Agreement under Verisk Analytics, Inc. 2013 Equity Incentive Plan, incorporated herein by reference to Exhibit 99.3 to Company’s Registration Statement on Form S-8 dated May 15, 2013. |
| 10.17 | Agreement and Plan of Merger dated January 14, 2014 among Verisk Analytics, Inc., Insurance Services Office, Inc., ISO Merger Sub I, Inc., Eagleview Technology Corporation and Fortis Advisors LLC, as the stockholders’ representative, incorporated herein by reference to Exhibit 10.1 to the Company’s Current Report on Form 8-K, dated January 14, 2014. |
| 21.1 | Subsidiaries of the Registrant.* |
| 23.1 | Consent of Deloitte & Touche LLP.* |
| 31.1 | Certification of the Chief Executive Officer of Verisk Analytics, Inc. pursuant to Rule 13a-14 under the Securities Exchange Act of 1934.* |
| 31.2 | Certification of the Chief Financial Officer of Verisk Analytics, Inc. pursuant to Rule 13a-14 under the Securities Exchange Act of 1934.* |
| 32.1 | Certification of the Chief Executive Officer and Chief Financial Officer of Verisk Analytics, Inc. pursuant to 18 U.S.C. Section 1350 as Adopted Pursuant to Section 906 of the Sarbanes-Oxley Act of 2002.* |
118
| Exhibit Number | Description |
| 101.INS | XBRL Instance Document.* |
| 101.SCH | XBRL Taxonomy Extension Schema.* |
| 101.CAL | XBRL Taxonomy Extension Calculation Linkbase.* |
| 101.DEF | XBRL Taxonomy Definition Linkbase.* |
| 101.LAB | XBRL Taxonomy Extension Label Linkbase.* |
| 101.PRE | XBRL Taxonomy Extension Presentation Linkbase.* |
| * | Filed herewith. | |
113
119