FORWARD LOOKING INFORMATION
Statements in this Annual Report on Form 10-K that are based on other than historical data are forward-looking within the meaning of the Private Securities Litigation Reform Act of 1995. Forward-looking statements provide current expectations or forecasts of future events and include, among others:
These forward-looking statements are not guarantees of future performance, nor should they be relied upon as representing management’s views as of any subsequent date. Forward-looking statements involve significant risks and uncertainties and actual results may differ materially from those presented, either expressed or implied, in this Annual Report on Form 10-K, including, but not limited to, those presented in the Management’s Discussion and Analysis of Financial Condition and Results of Operation.Operations. Factors that might cause such differences include, but are not limited to:
- 3 -
We caution readers not to place undue reliance on any forward-looking statements, which speak only as of the date made, and advisesadvise readers that various factors, including those described above, could affect our financial performance and could cause our actual results or circumstances for future periods to differ materially from those anticipated or projected. See also Item 1A, Risk Factors, in this Form 10-K.
- 34 -
GENERAL
Financial Institutions, Inc. is a financial holding company organized in 1931 under the laws of New York State (“New York” or “NYS”). Through its subsidiaries, including its wholly-owned, New York State chartered banking subsidiary, Five Star Bank, Financial Institutions, Inc. provides a broad array of deposit, lending and other financial services to retail, commercial, and municipal customers in Western and Central New York. All references in this Annual Report on Form 10-K to the parent company are to Financial Institutions, Inc. (“FII”). Unless otherwise indicated, or unless the context requires otherwise, all references in this Annual Report on Form 10-K to “the Company,” “we,” “our” or “us” means Financial Institutions, Inc. and its subsidiaries on a consolidated basis. Five Star Bank is referred to as Five Star Bank, “FSB” or “the Bank”. The parent companyFII is a legal entity separate and distinct from its subsidiaries, assisting those subsidiaries by providing financial resources and management.oversight. Our executive offices are located at 220 Liberty Street, Warsaw, New York.
We conduct business primarily through our banking subsidiary, Five Star Bank, which adopted its current name in 2005 when we merged three of our bank subsidiaries, Wyoming County Bank, National Bank of Geneva and Bath National Bank into our New York chartered bank subsidiary, First Tier Bank & Trust, which was renamed Five Star Bank. In addition, our business operations include a wholly-owned broker-dealer and investment adviser subsidiary, Five Star Investment Services, Inc. (“FSIS”).
Our Business Strategy
Our business strategy has been to maintain a community bank philosophy, which consists of focusing on Form 10-K, includingand understanding the exhibitsindividualized banking needs of the businesses, professionals and schedules filedother residents of the local communities surrounding our banking centers. We believe this focus allows us to be more responsive to our customers’ needs and provide a high level of personal service that differentiates us from larger competitors, resulting in long-standing and broad based banking relationships. Our core customers are primarily comprised of small- to medium-sized businesses, individuals and community organizations who prefer to build a banking relationship with a community bank that offers and combines high quality, competitively-priced banking products and services with personalized service. Because of our identity and origin as a locally operated bank, we believe that our level of personal service provides a competitive advantage over larger banks, which tend to consolidate decision-making authority outside local communities.
A key aspect of our current business strategy is to foster a community-oriented culture where our customers and employees establish long-standing and mutually beneficial relationships. We believe that we are well-positioned to be a strong competitor within our market area because of our focus on community banking needs and customer service, our comprehensive suite of deposit and loan products typically found at larger banks, our highly experienced management team and our strategically located banking centers. A central part of the Annual Report on Form 10-K, may be inspected at the public reference facility maintained by the SEC at its public reference room at 100 F. Street, N.E., Room 1580, Washington, DC 20549 and copies of all or any part thereof may be obtained from that office upon payment of the prescribed fees. You may call the SEC at 1-800-SEC-0330 for further information on the operation of the public reference room and you can request copies of the documents upon paymentour strategy is generating core deposits to support growth of a duplicating fee, by writing to the SEC. In addition, the SEC maintains a website that contains reports, proxydiversified and information statements and other information regarding registrants, including us, that file electronically with the SEC which can be accessed at www.sec.gov.
MARKET AREAS AND COMPETITION
We provide a wide range of consumer and commercial banking and financial services to individuals, municipalities and businesses through a network of over 50 offices and more than 70 ATMsan extensive ATM network in fourteenfifteen contiguous counties of Western and Central New York: Allegany, Cattaraugus, Cayuga, Chautauqua, Chemung, Erie, Genesee, Livingston, Monroe, Ontario, Orleans, Seneca, Steuben, Wyoming and Yates Counties.
Our market area is economically diversified in that we serve both rural markets and the larger more affluent markets of suburban Rochester and suburban Buffalo. Rochester and Buffalo are the two largest metropolitan areas in New York outside of New York City, with a combined metropolitan area populations of over two million people. We anticipate increasingcontinuing to increase our presence in and around these metropolitan statistical areas in the coming years.
We face significant competition in both making loans and attracting deposits, as both Western and Central New York have a high density of financial institutions. Our competition for loans comes principally from commercial banks, savings banks, savings and loan associations, mortgage banking companies, credit unions, insurance companies and other financial service companies. Our most direct competition for deposits has historically come from commercial banks, savings banks and credit unions. We face additional competition for deposits from non-depository competitors such as the mutual fund industry, securities and brokerage firms and insurance companies. We generally compete with other financial service providers on factors such as;as: level of customer service, responsiveness to customer needs, availability and pricing of products, and geographic location.
- 45 -
The following table presents the Bank’s market share percentage for total deposits as of June 30, 2012, in each county where we have operations. The table also indicates the ranking by deposit size in each market. All information in the table was obtained from SNL Financial of Charlottesville, Virginia, which compiles deposit data published by the FDIC as of June 30, 2012 and updates the information for any bank mergers and acquisitions completed subsequent to the reporting date.
County | Market Share | Market Rank | Number of Branches | |||||||||
Allegany | 6.6 | % | 4 | 1 | ||||||||
Cattaraugus | 24.0 | % | 2 | 5 | ||||||||
Cayuga | 3.6 | % | 11 | 1 | ||||||||
Chautauqua | 1.2 | % | 9 | 1 | ||||||||
Chemung | 17.1 | % | 3 | 3 | ||||||||
Erie | 0.4 | % | 12 | 3 | ||||||||
Genesee | 20.4 | % | 3 | 5 | ||||||||
Livingston | 30.7 | % | 1 | 5 | ||||||||
Monroe | 1.6 | % | 9 | 5 | ||||||||
Ontario | 13.9 | % | 3 | 5 | ||||||||
Orleans | 23.7 | % | 2 | 2 | ||||||||
Seneca | 20.7 | % | 2 | 2 | ||||||||
Steuben | 28.6 | % | 1 | 7 | ||||||||
Wyoming | 46.8 | % | 1 | 5 | ||||||||
Yates | 38.6 | % | 1 | 2 | ||||||||
INVESTMENT ACTIVITIES
Our investment policy is contained within our overall Asset-Liability Management and Investment Policy. This policy dictates that investment decisions will be made based on the safety of the investment, liquidity requirements, potential returns, cash flow targets, need for collateral and desired risk parameters. In pursuing these objectives, we consider the ability of an investment to provide earnings consistent with factors of quality, maturity, marketability, pledgeable nature and risk diversification. Our Treasurer, guided by our Asset-Liability Committee (“ALCO”), is responsible for investment portfolio decisions within the established policies.
Our investment securities strategy centers on providing liquidity to meet loan demand and redeeming liabilities, meeting pledging requirements, managing credit risks, managing overall interest rate risks and maximizing portfolio yield. Our current policy generally limits security purchases to the following:
- 6 -
LENDING ACTIVITIES
General
We offer a broad range of loans including commercial business and revolving lines of credit, commercial mortgages, equipment loans, residential mortgage loans and home equity loans and lines of credit, home improvement loans, automobile loans and personal loans. Newly originated and refinanced fixed rate residential mortgage loans are either retained in our portfolio or sold to the secondary market with servicing rights retained.
We continually evaluate and update our lending policy. The key elements of our lending philosophy include the following:
Commercial Business and Commercial Mortgage Lending
We originate commercial business loans in our primary market areas and underwrite them based on the borrower’s ability to service the loan from operating income. We offer a broad range of commercial lending products, including term loans and lines of credit. Short and medium-term commercial loans, primarily collateralized, are made available to businesses for working capital (including inventory and receivables), business expansion (including acquisition of real estate, expansion and improvements) and the purchase of equipment. Commercial business loans are offered to the agricultural industry for short-term crop production, farm equipment and livestock financing. As a general practice, where possible, a collateral lien is placed on any available real estate, equipment or other assets owned by the borrower and a personal guarantee of the owner is obtained. As of December 31, 2010, $70.02012, $84.3 million, or 33%, of theour aggregate commercial business loan portfolio were at fixed rates, while $141.0$174.4 million, or 67%, were at variable rates.
We also offer commercial mortgage loans to finance the purchase of real property, which generally consists of real estate with completed structures and, to a smaller extent, agricultural real estate financing. Commercial mortgage loans are secured by first liens on the real estate and are typically amortized over a 10 to 20 year period. The underwriting analysis includes credit verification, appraisals and a review of the borrower’s financial condition and repayment capacity. As of December 31, 2010, $100.02012, $142.4 million, or 28%34%, of theour aggregate commercial mortgage portfolio were at fixed rates, while $252.9$270.9 million, or 72%66%, were at variable rates.
We utilize government loan guarantee programs where available and appropriate. See “Government Guarantee Programs” below.
Government Guarantee Programs
We participate in government loan guarantee programs offered by the Small Business Administration (“SBA”),SBA, U.S. Department of Agriculture, Rural Economic and Community Development and Farm Service Agency, among others. As of December 31, 2010,2012, we had loans with an aggregate principal balance of $55.1$62.8 million that were covered by guarantees under these programs. The guarantees typically only cover a certain percentage of these loans. By participating in these programs, we are able to broaden our base of borrowers while minimizing credit risk.
Residential Mortgage Lending
We originate fixed and variable rate one-to-four family residential mortgages collateralized by owner-occupied properties located in our market areas. We offer a variety of real estate loan products, which are generally amortized over periods of up to 30 years. Loans collateralized by one-to-four family residential real estate generally have been originated in amounts of no more than 80% of appraised value or have mortgage insurance. Mortgage title insurance and hazard insurance are normally required. We sell certain one-to-four family residential mortgages to the secondary mortgage market and typically retain the right to service the mortgages. To assure maximum salability of the residential loan products for possible resale, we have formally adopted the underwriting, appraisal, and servicing guidelines of the Federal Home Loan Mortgage Corporation (“FHLMC”)FHLMC as part of our standard loan policy. As of December 31, 2010, the2012, our residential mortgage servicing portfolio totaled $328.9$273.3 million, the majority of which havehas been sold to FHLMC. As of December 31, 2010,2012, our residential mortgage loan portfolio totaled $129.6$133.5 million, or 10%8% of our total loan portfolio. We do not engage in sub-prime or other high-risk residential mortgage lending as a line-of-business.
- 57 -
We offer a variety of loan products to our consumer customers, including home equity loans and lines of credit, automobile loans, secured installment loans and various other types of secured and unsecured personal loans. At December 31, 2010,2012, outstanding consumer loan balances were concentrated in indirect automobile loans and home equity products.
We indirectly originate indirect consumer loans for a mix of new and used vehicles through franchised new car dealers, indirect consumer loans.dealers. The consumer indirect loan portfolio is primarily comprised of new and used automobile loans with terms that typically range from 36 to 84 months. We have expanded our relationships with franchised new car dealers in Western, Central and most recently, into the Capital District of New York, and have selectively originated a mix of new and used automobile loans from those dealers. In the latter part of 2010, we began efforts to expand our dealer network into Northern Pennsylvania and anticipate indirectly originating loans there in the first half of 2011.Pennsylvania. As of December 31, 2010, the2012, our consumer indirect portfolio totaled $418.0$586.8 million, or 31%34% of our total loan portfolio.
We also originate, independently of the indirect loans described above, consumer automobile loans, recreational vehicle loans, boat loans, home improvement loans, closed-end home equity loans, home equity lines of credit, personal loans (collateralized and uncollateralized) and deposit account collateralized loans. The terms of these loans typically range from 12 to 180 months and vary based upon the nature of the collateral and the size of loan. The majority of the consumer lending program is underwritten on a secured basis using the customer’s home or the financed automobile, mobile home, boat or recreational vehicle as collateral. As of December 31, 2010, $97.22012, $152.9 million, or 47%53%, of theour home equity portfolio was at fixed rates, while $111.2$133.7 million, or 53%47%, was at variable rates. Approximately 69% of the loans in our home equity portfolio are first lien positions at December 31, 2012. The other consumer portfolio totaled $26.1$26.8 million as of December 31, 2010,2012, all but $1.3 million of which were fixed rate loans.
Credit Administration
Our loan policy establishes standardized underwriting guidelines, as well as the loan approval process and the committee structures necessary to facilitate and ensure the highest possible loan quality decision-making in a timely and businesslike manner. The policy establishes requirements for extending credit based on the size, risk rating and type of credit involved. The policy also sets limits on individual loan officer lending authority and various forms of joint lending authority, while designating which loans are required to be approved at the committee level.
Our credit objectives are as follows:
Our policy includes loan reviews, under the supervision of the Audit and Risk Oversight committees of the Board of Directors and directed by theour Chief Risk Officer, in order to render an independent and objective evaluation of our asset quality and credit administration process.
Risk ratings are assigned to loans in the commercial business and commercial mortgage portfolios. The risk ratings are specifically used as follows:
Through the loan approval process, loan administration and loan review program, management seeks to continuously monitor our credit risk profile and assesses the overall quality of the loan portfolio and adequacy of the allowance for loan losses.
We have several procedures in place to assist in maintaining the overall quality of our loan portfolio. Delinquent loan reports are monitored by credit administration to identify adverse levels and trends. Loans, including impaired loans, are generally classified as non-accruing if they are past due as to maturity or payment of principal or interest for a period of more than 90 days, unless such loans are well-collateralized and in the process of collection. Loans that are on a current payment status or past due less than 90 days may also be classified as non-accruing if repayment in full of principal and/or interest is uncertain.
- 68 -
The allowance for loan losses is established through charges to earnings in the form of a provision for loan losses. The allowance reflects management’s estimate of the amount of probable loan losses in the portfolio, based on factors such as:
Our methodology in the estimation of the allowance for loan losses includes the following broad areas:
| 1. | Impaired commercial business and commercial mortgage loans, generally in excess of $50 thousand are reviewed individually and assigned a specific loss allowance, if considered necessary, in accordance with U.S. generally accepted accounting principles (“GAAP”). |
| 2. | The remaining portfolios of commercial business and commercial mortgage loans are segmented by risk rating into the following loan classification categories: uncriticized or pass, special mention, substandard and doubtful. Uncriticized loans, special mention loans, substandard loans and all doubtful loans not assigned a specific loss allowance are assigned allowance allocations based on historical net loan charge-off experience for each of the respective loan categories, supplemented with additional reserve amounts, if considered necessary, based upon qualitative factors. These qualitative factors include the levels and trends in |
| 3. | The retail loan portfolio is segmented into the following types of loans: residential real estate, home equity (home equity loans and lines of credit), consumer indirect and other consumer. Allowance allocations for the real estate related loan portfolios (residential and home equity) are based on the average loss experience for the previous eight quarters, supplemented with qualitative factors similar to the elements described above. Allowance allocations for the consumer indirect and other consumer portfolios are based on vintage analyses performed with historical loss experience at 36 months and 24 months aging, respectively. The allocations on these portfolios are also supplemented with qualitative factors. |
Management presents a quarterly review of the adequacy of the allowance for loan losses to our Board of Directors based on the methodology described above. See also the section titled “Allowance for Loan Losses” Part II, Item 7, “Management’s Discussion and Analysis of Financial Condition and Results of Operations.”
- 7 -
- 9 -
SOURCES OF FUNDS
Our primary sources of funds are deposits, borrowed funds, and repurchase agreements, scheduled amortization and prepayments of principal from loans and mortgage-backed securities, maturities and calls of investment securities and funds provided by operations.
Deposits
We offermaintain a varietyfull range of deposit products and accounts to meet the needs of the residents and businesses in our primary service area. Products include an array of checking and savings account products with a range of interest ratesprograms for individuals and terms. The deposit accounts consist of noninterest-bearing demand, interest-bearing demand, savings,businesses, including money market club accounts, and certificates of deposit. We also offer certificates of deposit, with balances in excess of $100,000 to local municipalities, businesses, and individualssweep investment capabilities as well as Individual Retirement Accounts and other qualified plan accounts. The flow of deposits is influenced significantly by general economic conditions, prevailing interest rates and competition. Our deposits are obtained predominantly from the areas in which our branch offices are located. We rely primarily on competitive pricing of our deposit products, customer service and long-standing relationships with customers to attract and retain these deposits.deposits and seek to make our services convenient to the community by offering 24-hour ATM access at some of our facilities, access to other ATM networks available at other local financial institutions and retail establishments, and telephone banking services including account inquiry and balance transfers. We have also utilized certificatetake advantage of deposit sales in the national brokered market (“brokered deposits”) as a wholesale funding source; however, weuse of technology by allowing our customers banking access via the Internet and various advanced systems for cash management for our business customers.
We had no traditional brokered deposits at December 31, 2010. Our2012; however, we do participate in the Certificate of Deposit Account Registry Service (“CDARS”) and Insured Cash Sweep (“ICS”) programs, which enable depositors to receive FDIC insurance coverage for deposits otherwise exceeding the maximum insurable amount. Through these programs, deposits in excess of the maximum insurable amount are placed with multiple participating financial institutions. Reciprocal CDARS deposits and ICS deposits totaled $61.0 million and $18.1 million, respectively, at December 31, 2012.
Borrowings
We have access to a variety of borrowing sources and use both short-term and long-term borrowings consist mainly of advances entered into with the FHLB,to support our asset base. Borrowings from time-to-time include federal funds purchased, and securities sold under agreements to repurchase and FHLB advances. We also offer customers a deposit account that sweeps balances in excess of an agreed upon target amount into overnight repurchase agreements.
OPERATING SEGMENTS
Our primary operating segment is our subsidiary bank, FSB. Our brokerage subsidiary, FSIS, is also deemed an operating segment; however, it does not meet the applicable thresholds for separation.
OTHER INFORMATION
All of the reports we file with the SEC, including this Annual Report on Form 10-K, Quarterly Reports on Form 10-Q and Current Reports on Form 8-K, as well as any amendments thereto may be read at the public reference facility maintained by the SEC at its public reference room at 100 F. Street, N.E., Room 1580, Washington, DC 20549 and copies of all or any part thereof may be obtained from that office upon payment of the prescribed fees. You may call the SEC at 1-800-SEC-0330 for further information on the operation of the public reference room and you can request copies of the documents upon payment of a duplicating fee, by writing to the SEC. In addition, the SEC maintains a website that contains reports, proxy and information statements and other information regarding registrants, including us, that file electronically with the SEC which can be accessed at www.sec.gov.
We also make available, free of charge, through our website, all reports filed with the SEC, including our Annual Reports on Form 10-K, Quarterly Reports on Form 10-Q and Current Reports on Form 8-K, as well as any amendments to those reports, as soon as reasonably practicable after those documents are filed with, or furnished to, the SEC. These filings may be viewed by accessing theCompany Filingssubsection of theSEC Filings section under theInvestor Relations tab on our website (www.fiiwarsaw.com). Information available on our website is not a part of, and is not incorporated into, this Annual Report on Form 10-K.
- 810 -
The Company and our subsidiaries are subject to an extensive system of laws and regulations that are intended primarily for the protection of customers and depositors and not for the protection of our security holders. These laws and regulations govern such areas as capital, permissible activities, allowance for loan losses, loans and investments, and rates of interest that can be charged on loans. Described below are elements of selected laws and regulations. The descriptions are not intended to be complete and are qualified in their entirety by reference to the full text of the statutes and regulations described.
Holding Company Regulation. As a bank holding company and financial holding company, we are subject to comprehensive regulation by the Board of Governors of the Federal Reserve System, frequently referred to as the Federal Reserve Board (“FRB”), under the Bank Holding Company Act, as amended by, among other laws, the Gramm-Leach-Bliley Act of 1999 (the “Gramm-Leach-Bliley Act”), and by the Dodd-Frank Wall Street Reform and Consumer Protection Act (the “Dodd-Frank Act”), enacted on July 21,in 2010. We must file reports with the FRB and such additional information as the FRB may require, and our holding company and non-banking affiliates are subject to examination by the FRB. Under FRB policy, a bank holding company must serve as a source of strength for its subsidiary banks. Under this policy, the FRB may require, and has required in the past, a holding company to contribute additional capital to an undercapitalized subsidiary bank. The Bank Holding Company Act provides that a bank holding company must obtain FRB approval before:
The Bank Holding Company Act generally prohibits a bank holding company from acquiring direct or indirect ownership or control of more than 5% of the voting shares of any company which is not a bank or bank holding company, or from engaging directly or indirectly in activities other than those of banking, managing or controlling banks, or providing services for its subsidiaries. The principal exceptions to these prohibitions involve certain non-bank activities which, by statute or by FRB regulation or order, have been identified as activities closely related to the business of banking or managing or controlling banks. The list of activities permitted by the FRB includes, among other things: lending; operating a savings institution, mortgage company, finance company, credit card company or factoring company; performing certain data processing operations; providing certain investment and financial advice; underwriting and acting as an insurance agent for certain types of credit related insurance; leasing property on a full-payout, non-operating basis; selling money orders, travelers’ checks and United States Savings Bonds; real estate and personal property appraising; providing tax planning and preparation services; and, subject to certain limitations, providing securities brokerage services for customers. These activities may also be affected by federal legislation.
The Gramm-Leach-Bliley Act amended portions of the Bank Holding Company Act to authorize bank holding companies, such as us, directly or through non-bank subsidiaries to engage in securities, insurance and other activities that are financial in nature or incidental to a financial activity. In order to undertake these activities, a bank holding company must become a “financial holding company” by submitting to the appropriate Federal Reserve Bank a declaration that the company elects to be a financial holding company and a certification that all of the depository institutions controlled by the company are well capitalized and well managed. During
Broker-Dealer and Related Regulatory Supervision. FSIS is a member of, and is subject to the second quarterregulatory supervision of, 2008, we received FRB approvalthe Financial Industry Regulatory Authority. Areas subject to this regulatory review include compliance with trading rules, financial reporting, investment suitability for an electionclients, and compliance with stock exchange rules and regulations. FSIS is also subject to reinstate our status as a financial holding company under the Gramm-Leach-Bliley Act.
Depository Institution Regulation.Our bank subsidiary is subject to regulation by the Federal Deposit Insurance Corporation (“FDIC”). This regulatory structure includes:
- 911 -
The Dodd-Frank Act.The Dodd-Frank Act, enacted in July 2010, significantly changed the bank regulatory structure and affected the lending, investment, trading and operating activities of financial institutions and their holding companies. The Dodd-Frank Act (as amended) implements far-reaching changes across the financial regulatory landscape, including provisions that, among other things, has or will:
Centralized responsibility for consumer financial protection by creating a new agency, the Bureau of Consumer Financial Protection, with broad rulemaking, supervision and enforcement authority for a wide range of consumer protection laws that apply to all banks and certain others, including the examination and enforcement powers with respect to any bank with more than $10 billion in assets.
Require new capital rules and apply the same leverage and risk-based capital requirements that apply to insured depository institutions to most bank holding companies.
Changed the assessment base for federal deposit insurance from the amount of insured deposits to consolidated average assets less tangible capital. As a result, this change generally imposes more deposit insurance cost on institutions with assets of $10 billion or more.
Increase the minimum ratio of net worth to insured deposits of the Deposit Insurance Fund from 1.15% to 1.35% and require the FDIC, in setting assessments, to offset the effect of the increase on institutions with assets of less than $10 billion.
Provide for new disclosure and other requirements relating to executive compensation and corporate governance, including guidelines or regulations on incentive-based compensation and a prohibition on compensation arrangements that encourage inappropriate risks or that could provide excessive compensation.
Repealed the federal prohibitions on the payment of interest on commercial demand deposits, thereby permitting depository institutions to pay interest on business transaction and other accounts.
Allow de novo interstate branching by banks.
Increased the authority of the FRB to examine us and our non-bank subsidiary.
Required all bank holding companies to serve as a source of financial strength to their depository institution subsidiaries in the event such subsidiaries suffer from financial distress.
Many aspects of the Dodd-Frank Act are subject to rulemaking and will take effect over several years, making it difficult to anticipate the overall financial impact on us and the financial services industry more generally. Provisions in the legislation may require us to maintain higher capital levels and/or increase our cost of operations and limit certain activities or lines of business.
The FRB’s risk-based guidelines establish a two-tier capital framework. Tier 1 capital generally consists of common shareholders’ equity, retained earnings, a limited amount of qualifying perpetual preferred stock, qualifying trust preferred securities and non-controlling interests in the equity accounts of consolidated subsidiaries, less goodwill and certain intangibles. Tier 2 capital generally consists of certain hybrid capital instruments and perpetual debt, mandatory convertible debt securities and a limited amount of subordinated debt, qualifying preferred stock, loan loss allowance, and unrealized holding gains on certain equity securities. The sum of Tier 1 and Tier 2 capital represents qualifying total capital, at least 50% of which must consist of Tier 1 capital.
Risk-based capital ratios are calculated by dividing Tier 1 and total capital by risk-weighted assets. Assets and off-balance sheet exposures are assigned to one of four categories of risk-weights, based primarily on relative credit risk. For bank holding companies, generally the minimum Tier 1 risk-based capital ratio is 4% and the minimum total risk-based capital ratio is 8%. Our Tier 1 and total risk-based capital ratios under these guidelines at December 31, 20102012 were 12.34%10.70% and 13.60%11.96%, respectively.
The FRB’s leverage capital guidelines establish a minimum leverage ratio determined by dividing Tier 1 capital by adjusted average total assets. The minimum leverage ratio is 3% for bank holding companies that meet certain specified criteria, including having the highest regulatory rating. All other bank holding companies generally are required to maintain a leverage ratio of at least 4%. At December 31, 2010,2012, we had a leverage ratio of 8.31%7.70%. See also the section titled “Capital Resources” in Part II, Item 7, “Management’s Discussion and Analysis of Financial Condition and Results of Operations” and Note 10,11, Regulatory Matters, of the notes to consolidated financial statements.
- 12 -
In June 2012, the U.S. federal banking agencies issued three notices of proposed rulemaking that would revise and replace the current regulatory capital rules. The federal regulatory authorities’ risk-basedproposals were initially intended to be effective on January 1, 2013, but the agencies have deferred implementation due to the volume of comments related to the proposed rules. In the Basel III notice of proposed rulemaking, the agencies proposal included the implementation of a new common equity Tier 1 minimum capital guidelines are based uponrequirement and a higher minimum Tier 1 capital requirement. Common equity is the 1988highest quality equity and most loss absorbing form of capital accord (“and establishes the base of Tier 1 common equity as adjusted for minority interests and various deductions. The minimum Tier 1 common equity ratio under Basel I”)III is 4.5%. Depending on the final form of the Basel Committee on Banking Supervision (the “Basel Committee”). The Basel Committee is a committee of central banks and bank supervisors/regulators from the major industrialized countries that develops broad policy guidelines for use by each country’s supervisors in determining the supervisory policies and regulations to which they apply. Actions of the Committee have no direct effect on banks in participating countries. In 2004, the Basel Committee published a new capital accord (“Basel II”) to replace Basel I. Basel II provides two approaches for settingIII capital standards, for credit risk — an internal ratings-based approach tailored to individual institutions’ circumstancesthe outcome will likely result in a higher capital requirement, greater volatility in regulatory capital and a standardized approachthe elimination of trust preferred instruments in regulatory capital. It is expected that bases risk weightingsfinal rules will be issued in 2013.
Future rulemaking and regulatory changes on external credit assessments to a much greater extent than permitted in existing risk-based capital guidelines. Basel II also would set capital requirements for operational riskmay impact the Company as it continues to grow and refine the existing capital requirements for market risk exposures.
evaluate M&A activity.
- 10 -
- 11 -
As of December 31, 2010,2012, our subsidiary bank met the requirements to be classified as “well-capitalized.”
Dividends.The FRB policy is that a bank holding company should pay cash dividends only to the extent that its net income for the past year is sufficient to cover both the cash dividends and a rate of earnings retention that is consistent with the holding company’s capital needs, asset quality and overall financial condition, and that it is inappropriate for a bank holding company experiencing serious financial problems to borrow funds to pay dividends. Furthermore, a bank that is classified under the prompt corrective action regulations as “undercapitalized” will be prohibited from paying any dividends.
Our primary source for cash dividends is the dividends we receive from our subsidiary bank. Our bank is subject to various regulatory policies and requirements relating to the payment of dividends, including requirements to maintain capital above regulatory minimums. Approval of the New York State Banking Department of Financial Services is required prior to paying a dividend if the dividendsdividend declared by the Bank exceedexceeds the sum of the Bank’s net profits for that year and its retained net profits for the preceding two calendar years.
Federal Deposit Insurance Assessments.The Bank’sBank is a member of the FDIC and pays an insurance premium to the FDIC based upon its assessable deposits on a quarterly basis. Deposits are insured up to the maximum extent permittedapplicable limits by the FDIC and such insurance is backed by the full faith and credit of the United States Government.
Under the Dodd-Frank Act, a permanent increase in deposit insurance was authorized to $250,000. The coverage limit is per depositor, per insured depository institution for each account ownership category.
- 13 -
The Dodd-Frank Act also set a new minimum Deposit Insurance Fund (“DIF”). Upon enactment reserve ratio at 1.35% of the Emergency Economic Stabilization Act of 2008 on October 3, 2008, federal deposit insurance coverage levels under the DIF temporarily increased from $100,000estimated insured deposits. The FDIC is required to $250,000 per deposit category, per depositor, per institution, through December 31, 2009. On May 20, 2009, the Helping Families Save Their Homes Act extended the temporary increase through December 31, 2013.attain this ratio by September 30, 2020. The Dodd-Frank Act permanently increasesalso required the maximum amount ofFDIC to define the deposit insurance assessment base for an insured depository institution as an amount equal to $250,000 per deposit category, per depositor, per institution retroactivethe institution’s average consolidated total assets during the assessment period minus average tangible equity. Premiums for the Bank are now calculated based upon the average balance of total assets minus average tangible equity as of the close of business for each day during the calendar quarter.
The FDIC has the flexibility to January 1, 2008,adopt actual rates that are higher or lower than the total base assessment rates adopted without notice and noninterest-bearing transaction accounts have unlimited deposit insurance through December 31, 2013.
DIF-insured institutions pay a Financing Corporation (“FICO”) assessment in order to fund the insurer,interest on bonds issued in the 1980s in connection with the failures in the thrift industry. For the fourth quarter of 2012, the FICO assessment was equal to 0.64 basis points computed on assets as required by the Dodd-Frank Act. These assessments will continue until the bonds mature in 2019.
The FDIC is authorized to conduct examinations of and to require reporting by FDIC-insured institutions. The FDICIt is also may prohibit any FDIC-insured institution from engaging in any activity the FDIC determines by regulation or orderauthorized to poseterminate a serious threat to the DIF. The FDIC also has the authority to initiate enforcement actions against banks. Insurance of deposits may be terminateddepository bank’s deposit insurance upon a finding by the FDIC upon a findingthat the bank’s financial condition is unsafe or unsound or that the institution has engaged or is engaging in unsafe and unsound practices, is in an unsafe or unsound condition to continue operationspractices or has violated any applicable law,rule, regulation, rule, order or condition enacted or imposed by the FDIC or written agreement entered into with the FDIC.bank’s regulatory agency. The management of the Bank does not know of any practice, condition or violation that might lead to termination of deposit insurance.
- 12 -
Transactions with Affiliates.FII and FSB are affiliates within the meaning of the Federal Reserve Act. The Federal Reserve Act imposes limitations on a bank with respect to extensions of credit to, investments in, and certain other transactions with, its parent bank holding company and the holding company’s other subsidiaries. Furthermore, bank loans and extensions of credit to affiliates also are subject to various collateral requirements.
Community Reinvestment Act.Under the Community Reinvestment Act, every FDIC-insured institution is obligated, consistent with safe and sound banking practices, to help meet the credit needs of its entire community, including low and moderate income neighborhoods. The Community Reinvestment Act requires the appropriate federal banking regulator, in connection with the examination of an insured institution, to assess the institution’s record of meeting the credit needs of its community and to consider this record in its evaluation of certain applications, such as a merger or the establishment of a branch. An unsatisfactory rating may be used as the basis for the denial of an application and will prevent a bank holding company of the institution from making an election to become a financial holding company.
As of its last Community Reinvestment Act examination, Five Starthe Bank received a rating of “outstanding.”
Interstate BankingBranching.Pursuant to the Dodd-Frank Act, national and Branching.The FRBstate-chartered banks may approveopen an application of a bank holding company to acquire control of, or acquire all or substantially all of the assets of, a bank locatedinitial branch in a state other than the bank holding company’sits home state without regard to whether the transaction is prohibited(e.g., a host state) by the laws ofestablishing a de novo branch at any state. The FRB may not approve the acquisition oflocation in such host state at which a bank that has not beenchartered in existence for the minimum time period (not exceeding five years) specified by the law of the target bank’s home state. The FRB also may not approve an application if the bank holding company (and its bank affiliates) controls or would control more than ten percent of the insured deposits in the U.S. or, generally, 30% or more of the deposits in the target bank’s homesuch host state or in any state in which the target bank maintainscould establish a branch. Individual states may waiveApplications to establish such branches must still be filed with the 30% statewide concentration limit. Each state may limit the percentage of total insured deposits in the state that may be held or controlled by a bank or bank holding company to the extent the limitation does not discriminate against out-of-state banks or bank holding companies.
appropriate primary federal regulator.
- 13 -
International Money Laundering AbatementAnti-Terrorism Legislation.The Uniting and Financial Anti-TerrorismStrengthening America by Providing Appropriate Tools Required to Intercept and Obstruct Terrorism Act of 2001.(“USA Patriot Act”), enacted in 2001:
The President signed the USA Patriot Act of 2001 into law in October 2001. This act contains the International Money Laundering Abatement and Financial Anti-Terrorism Act of 2001 (the “IMLAFA”).also increases governmental powers to investigate terrorism, including expanded government access to account records. The IMLAFA substantially broadens existing anti-money laundering legislation and the extraterritorial jurisdictionDepartment of the U.S., imposes newTreasury is empowered to administer and make rules to implement the Act, which to some degree, affects our record-keeping and reporting expenses. Should the Bank’s AML compliance and due diligence obligations, creates new crimes and penalties, compels the production of documents located both inside and outside the U.S., including those of foreignprogram be deemed insufficient by federal regulators, we would not be able to grow through acquiring other institutions that have a correspondent relationship in the U.S., and clarifies the safe harbor from civil liability to customers. The Treasury Department has issued a number of regulations implementing the USA Patriot Act that apply certain of its requirements to financial institutions such as our banking and broker-dealer subsidiaries. The regulations impose obligations on financial institutions to maintain appropriate policies, procedures and controls to detect, prevent and report money laundering and terrorist financing. The increased obligations of financial institutions, including us, to identify their customers, watch for and report suspicious transactions, respond to requests for information by regulatory authorities and law enforcement agencies, and share information with other financial institutions, requires the implementation and maintenance of internal procedures, practices and controls which have increased, and may continue to increase, our costs and may subject us to liability.
- 14 -
Ability-to-Repay and the financial services industry more generally. Provisions in the legislation that affect deposit insurance assessments, and payment of interest on demand deposits could increase the costs associated with deposits. Provisions in the legislation that require revisionsQualified Mortgage Rule.Pursuant to the capital requirements ofDodd Frank Act, the Company and Five Star Bank could require the Company and the Bank to seek additional sources of capital in the future.
Incentive Compensation Policies and Restrictions. In July 2010, the federal banking agencies issued guidance that applies to all banking organizations supervised by the agencies (thereby including both the Parent Company to our senior executive officers (“SEOs”) and next five most highly compensated employees; (iii) a requirement to make subject to clawback any bonus, retention award, or incentive compensation paid to any of the SEOs and any of the next twenty most highly compensated employees if such compensation was based on materially inaccurate financial statements or any other materially inaccurate performance metric criteria; (iv) a requirement to establish a policy on luxury or excessive expenditures; (v) a requirement to annually provide shareholders with a non-binding advisory “say on pay” vote on executive compensation; (vi) a prohibition on deducting more than $500,000 in annual compensation, including performance-based compensation,Bank). Pursuant to the executives covered under Internal Revenue Code Section 162(m); (vii) a requirement that the compensation committee of the board of directors evaluate and review on a semi-annual basis the risks involved in employee compensation plans; and (viii) a prohibition on providing tax “gross-ups”guidance, to our SEOs and the next 20 most highly compensated employees. These requirements and restrictions will remain applicable to us until we have redeemed the Series A preferred stock in full.
In addition, in March 2011, the federal banking agencies, along with the Federal Housing Finance Agency, and the prevalence of incentive compensation arrangements. The findings of the supervisory initiatives will be included in reports of examination. Deficiencies will be incorporated into the organization’s supervisory ratings, which can affect the organization’s abilitySEC, released a proposed rule intended to make acquisitions and take other actions. Enforcement actions may be taken against a banking organization if itsensure that regulated financial institutions design their incentive compensation arrangements to account for risk. Specifically, the proposed rule would require compensation practices at the Parent Company and at the Bank to be consistent with the following principles: (1) compensation arrangements appropriately balance risk and financial reward; (2) such arrangements are compatible with effective controls and risk management; and (3) such arrangements are supported by strong corporate governance. In addition, financial institutions with $1 billion or related risk-management control or governance processes, pose a riskmore in assets would be required to the organization’s safetyhave policies and soundness and the organization is not taking prompt and effective measuresprocedures to correct the deficiencies.
- 15 -
Sarbanes-Oxley Act of 2002.The Sarbanes-Oxley Act of 2002 implemented a broad range of corporate governance, accounting and reporting measures for companies that have securities registered under the Exchange Act, including publicly-held bank holding companies such as Financial Institutions. Specifically, the Sarbanes-Oxley Act of 2002 and the various regulations promulgated thereunder, established, among other things: (i) requirements for audit committees, including independence, expertise, and responsibilities; (ii) responsibilities regarding financial statements for the Chief Executive Officer and Chief Financial Officer of the reporting company; (iii) the forfeiture of bonuses or other incentive-based compensation and profits from the sale of the reporting company’s securities by the Chief Executive Officer and Chief Financial Officer in the twelve-month period following the initial publication of any financial statements that later require restatement; (iv) the creation of an independent accounting oversight board; (v) standards for auditors and regulation of audits, including independence provisions that restrict non-audit services that accountants may provide to their audit clients; (vi) disclosure and reporting obligations for the reporting company and their directors and executive officers, including accelerated reporting of stock transactions and a prohibition on trading during pension blackout periods; (vii) a prohibition on personal loans to directors and officers, except certain loans made by insured financial institutions on non-preferential terms and in compliance with other bank regulatory requirements; and (viii) a range of civil and criminal penalties for fraud and other violations of the securities laws.
- 15 -
Consumer Laws and Regulations.In addition to the laws and regulations discussed herein, the Bank is also subject to certain consumer laws and regulations that are designed to protect consumers in transactions with banks. While the list set forth herein is not exhaustive, these laws and regulations include, among others, the Truth in Lending Act, the Truth in Savings Act, the Electronic Funds Transfer Act, the Expedited Funds Availability Act, the Equal Credit Opportunity Act, the Fair Housing Act, the Home Mortgage Disclosure Act and the Real Estate Settlement Procedures Act. These laws and regulations mandate certain disclosure requirements and regulate the manner in which financial institutions must deal with customers when taking deposits or making loans to such customers. The Bank must comply with the applicable provisions of these consumer protection laws and regulations as part of its ongoing customer relations. The Check Clearing for the 21st Century Act (the “Check 21 Act”), which became effective on October 28, 2004, creates a new negotiable instrument, called a “substitute check”, which banks are required to accept as the legal equivalent of a paper check if it meets the requirements of the Check 21 Act. The Check 21 Act is designed to facilitate check truncation, to foster innovation in the check payment system, and to improve the payment system by shortening processing times and reducing the volume of paper checks.
Other Future Legislation and Changes in Regulations.In addition to the specific proposals described above, from time to time, various legislative and regulatory initiatives are introduced in Congress and state legislatures, as well as by regulatory agencies. Such initiatives may include proposals to expand or contract the powers of bank holding companies and depository institutions or proposals to substantially change the financial institution regulatory system. Such legislation could change banking statutes and theour operating environment of the Company in substantial and unpredictable ways. If enacted, such legislation could increase or decrease the cost of doing business, limit or expand permissible activities or affect the competitive balance among banks, savings associations, credit unions, and other financial institutions. We cannot predict whether any such legislation will be enacted, and, if enacted, the effect that it, or any implementing regulations, would have on theour financial condition or results of operations of the Company.operations. A change in statutes, regulations or regulatory policies applicable to the Companyus or any itsour subsidiaries could have a material effect on our business.
Impact of Inflation and Changing Prices
Our financial statements included herein have been prepared in accordance with GAAP, which requires us to measure financial position and operating results principally using historic dollars. Changes in the relative value of money due to inflation or recession are generally not considered. The primary effect of inflation on our operations is reflected in increased operating costs. In our view, changes in interest rates affect the financial condition of a financial institution to a far greater degree than changes in the inflation rate. While interest rates are generally influenced by changes in the inflation rate, they do not necessarily change at the same rate or in the same magnitude. Interest rates are sensitive to many factors that are beyond our control, including changes in the expected rate of inflation, general and local economic conditions and the monetary and fiscal policies of the United States government, its agencies and various other governmental regulatory authorities.
Regulatory and Economic Policies
Our business and earnings are affected by general and local economic conditions and by the monetary and fiscal policies of the U.S. government, its agencies and various other governmental regulatory authorities. The FRB regulates the supply of money in order to influence general economic conditions. Among the instruments of monetary policy available to the FRB are (i) conducting open market operations in U.S. government obligations, (ii) changing the discount rate on financial institution borrowings, (iii) imposing or changing reserve requirements against financial institution deposits, and (iv) restricting certain borrowings and imposing or changing reserve requirements against certain borrowings by financial institutions and their affiliates. These methods are used in varying degrees and combinations to directly affect the availability of bank loans and deposits, as well as the interest rates charged on loans and paid on deposits. For that reason, the policies of the FRB could have a material effect on our earnings.
- 16 -
- 16 -
EXECUTIVE OFFICERS OF REGISTRANT
The following table sets forth current information regarding our executive officers and certain other significant employees (ages are as of May 4, 2011,8, 2013, the date of the 20112013 Annual Meeting of Shareholders).
| Started | ||||||||||
| Name | Age | In | Positions/Offices | |||||||
| Peter G. Humphrey | 56 | 1977 | President and Chief Executive Officer of the Company and the Bank since 1994. | |||||||
| Karl F. Krebs | 55 | 2009 | Executive Vice President and Chief Financial Officer of the Company and the Bank since 2009. Senior Financial Specialist at West Valley Environmental Services, LLC prior to joining FII in 2009. President of Robar General Funding Corp. from 2006 to 2008. Senior Vice President and Line-of-Business Finance Director at Five Star Bank from 2005 to 2006 and Senior Vice President at Wyoming County Bank from 2004 to 2005. | |||||||
| Rita M. Bartol | 50 | 2010 | Senior Vice President and Director of Human Resources of the Company and the Bank since late 2010. Senior Vice President and Director of Human Resources at Cardinal Financial Corporation in 2010 and Vice President and Director of Human Resources at Union Bankshares Corporation from 2006 to 2010. Vice President and Human Resources and Organizational Development Manager at M & T Bank Corporation from 1998 to 2005. | |||||||
| Martin K. Birmingham | 44 | 2005 | Executive Vice President and Regional President / Commercial Banking Executive Officer of the Bank since 2009. Senior Vice President and Regional President of the Bank since 2005. Senior Team Leader and Regional President of the Rochester Market at Bank of America (formally Fleet Boston Financial) from 2000 to 2005. | |||||||
| George D. Hagi | 58 | 2006 | Executive Vice President and Chief Risk Officer of the Company and the Bank since 2006. Senior Vice President and Director of Risk Management at First National Bankshares of Florida and FNB Corp. from 1997 to 2005. | |||||||
| Richard J. Harrison | 65 | 2003 | Executive Vice President and Senior Retail Lending Administrator of the Bank since 2009. Senior Vice President and Senior Retail Lending Administrator of the Bank since 2003. Executive Vice President and Chief Credit Officer at Savings Bank of the Finger Lakes from 2000 to 2003. | |||||||
| Kevin B. Klotzbach | 58 | 2001 | Senior Vice President and Treasurer of the Bank since 2001. | |||||||
| R. Mitchell McLaughlin | 53 | 1981 | Executive Vice President and Chief Information Officer of the Bank since 2009. Senior Vice President and Chief Information Officer of the Bank since 2006. | |||||||
| John L. Rizzo | 61 | 2010 | Senior Vice President and Corporate Secretary of the Company and the Bank since 2010. Counsel (in-house) for the Company and the Bank since 2007. Genesee County (New York) Attorney from 1976 to 2010. | |||||||
| John J. Witkowski | 48 | 2005 | Executive Vice President and Regional President / Retail Banking Executive Officer of the Bank since 2009. Senior Vice President and Regional President of the Bank since 2005. Senior Vice President and Director of Sales for Business Banking / Client Development Group at Bank of America from 1993 to 2005. | |||||||
Name | Age | Started In | Positions/Offices | |||
| Martin K. Birmingham | 46 | 2005 | President and Chief Executive Officer since March 2013. Previously, President and Chief of Community Banking of the Company and the Bank from August 2012. Executive Vice President and Regional President/ Commercial Banking Executive Officer of the Bank since 2009. Senior Vice President and Regional President of the Bank since 2005. Senior Team Leader and Regional President of the Rochester Market at Bank of America (formally Fleet Boston Financial) from 2000 to 2005. | |||
| Richard J. Harrison | 67 | 2003 | Executive Vice President and Chief Operating Officer of the Company and the Bank since August 2012. Executive Vice President and Senior Retail Lending Administrator of the Bank since 2009. Senior Vice President and Senior Retail Lending Administrator of the Bank since 2005. | |||
| Kevin B. Klotzbach | 60 | 2001 | Senior Vice President and Treasurer of the Bank since 2005. | |||
| Karl F. Krebs | 57 | 2009 | Executive Vice President and Chief Financial Officer of the Company and the Bank since 2009. Senior Financial Specialist at West Valley Environmental Services, LLC, an environmental remediation services firm, prior to joining the Company in 2009. President of Robar General Funding Corp., a mortgage and construction loan broker, from 2006 to 2008. Senior Vice President and Line-of-Business Finance Director at Five Star Bank from 2005 to 2006. | |||
| R. Mitchell McLaughlin | 55 | 1981 | Executive Vice President and Chief Information Officer of the Bank since 2009. Senior Vice President and Chief Information Officer of the Bank since 2006. | |||
| John L. Rizzo | 63 | 2007 | Senior Vice President and Corporate Secretary of the Company and the Bank since 2010. General counsel for the Company and the Bank since 2007. Genesee County (New York) Attorney from 1976 to 2010. | |||
| Kenneth V. Winn | 55 | 2004 | Executive Vice President and Chief Risk Officer of the Company and the Bank since July 2012. Senior Vice President and Senior Credit Compliance Administrator since 2006. |
- 17 -
An investment in our common stock is subject to risks inherent to our business. The material risks and uncertainties that management believes affect us are described below. Before making an investment decision, you should carefully consider the risks and uncertainties described below, together with all of the other information included or incorporated by reference herein. The risks and uncertainties described below are not the only ones facing us. Additional risks and uncertainties that management is not aware of or focused on or that management currently deems immaterial may also impair our business operations. This Annual Report on Form 10-K is qualified in its entirety by these risk factors. Further, to the extent that any of the information contained in this Annual Report on Form 10-K constitutes forward-looking statements, the risk factors set forth below also are cautionary statements identifying important factors that could cause our actual results to differ materially from those expressed in any forward-looking statements made by or on behalf of us.
If any of the following risks actually occur, our financial condition and results of operations could be materially and adversely affected. If this were to happen, the value of our common stock could decline significantly, and you could lose all or part of your investment.
CREDIT RISKS
If we experience greater credit losses than anticipated, earnings may be adversely impacted.
As a lender, we are exposed to the risk that customers will be unable to repay their loans according to their terms and that any collateral securing the payment of their loans may not be sufficient to assure repayment. Credit losses are inherent in the business of making loans and could have a material adverse impact on our results of operations.
We make various assumptions and judgments about the collectability of our loan portfolio, including the creditworthiness of our borrowers and the value of the real estate and other assets serving as collateral, and we provide an allowance for estimated loan losses based on a number of factors. We believe that the allowance for loan losses is adequate. However, if our assumptions or judgments are wrong, the allowance for loan losses may not be sufficient to cover the actual credit losses. We may have to increase the allowance in the future in response to the request of one of our primary banking regulators, to adjust for changing conditions and assumptions, or as a result of any deterioration in the quality of our loan portfolio. The actual amount of future provisions for credit losses may vary from the amount of past provisions.
Geographic concentration may unfavorably impact our operations.
Substantially all of our business and operations are concentrated in the Western and Central New York region. As a result of this geographic concentration, our results depend largely on economic conditions in these and surrounding areas. Deterioration in economic conditions in our market could:
Generally, we make loans to small to mid-sized businesses whose success depends on the regional economy. These businesses generally have fewer financial resources in terms of capital or borrowing capacity than larger entities. Adverse economic and business conditions in our market areas could reduce our growth rate, affect our borrowers’ ability to repay their loans and, consequently, adversely affect our business, financial condition and performance. For example, we place substantial reliance on real estate as collateral for our loan portfolio. A sharp downturn in real estate values in our market area could leave many of these loans inadequately collateralized. If we are required to liquidate the collateral securing a loan to satisfy the debt during a period of reduced real estate values, the impact on our results of operations could be materially adverse.
We depend on the accuracy and completeness of information about or from customers and counterparties.
In deciding whether to extend credit or enter into other transactions, we may rely on information furnished by or on behalf of customers and counterparties, including financial statements, credit reports, and other financial information. We may also rely on representations of those customers, counterparties, or other third parties, such as independent auditors, as to the accuracy and completeness of that information. Reliance on inaccurate or misleading financial statements, credit reports, or other financial information could cause us to enter into unfavorable transactions, which could have a material adverse effect on our financial condition and results of operations.
- 18 -
A significant portion of our loan portfolio is secured by real property. During the ordinary course of business, we may foreclose on and take title to properties securing certain loans. In doing so, there is a risk that hazardous or toxic substances could be found on these properties. If hazardous or toxic substances are found, we may be liable for remediation costs, as well as for personal injury and property damage.damage regardless of whether we knew, had reason to know of, or caused the release of such substance. Environmental laws may require us to incur substantial expenses and may materially reduce the affected property’s value or limit our ability to use or sell the affected property. In addition, future laws or more stringent interpretations or enforcement policies with respect to existing laws may increase our exposure to environmental liability. Although we have policies and procedures to perform an environmental review before initiating any foreclosure action on real property, these reviews may not be sufficient to detect all potential environmental hazards. The remediation costs and any other financial liabilities associated with an environmental hazard could have a material adverse effect on our financial condition and results of operations.
Our indirect lending involves risk elements in addition to normal credit risk.
A portion of our current lending involves the purchase of consumer automobile installment sales contracts from automobile dealers located in Western, Central and the Capital District of New York, and Northern Pennsylvania. These loans are for the purchase of new or used automobiles. We serve customers that cover a range of creditworthiness, and the required terms and rates are reflective of those risk profiles. While these loans have higher yields than many of our other loans, such loans involve risks elements in addition to normal credit risk. Potential risk elements associated with indirect lending include the limited personal contact with the borrower as a result of indirect lending through dealers, the absence of assured continued employment of the borrower, the varying general creditworthiness of the borrower, changes in the local economy, and difficulty in monitoring collateral. While indirect automobile loans are secured, such loans are secured by depreciating assets and characterized by LTV ratios that could result in us not recovering the full value of an outstanding loan upon default by the borrower. If the economic environment in our primary market area contracts, we may experience higher levels of delinquencies, charge-offs and repossessions.
REGULATORY/LEGAL/COMPLIANCE RISKS
We are highly regulated and may be adversely affected by changes in banking laws, regulations and regulatory practices.
We are subject to extensive supervision, regulation and examination. This regulatory structure gives the regulatory authorities extensive discretion in connection with their supervisory and enforcement activities and examination policies to address not only compliance with applicable laws and regulations (including laws and regulations governing consumer credit, and anti-money laundering and anti-terrorism laws), but also capital adequacy, asset quality and risk, management ability and performance, earnings, liquidity, and various other factors. As part of this regulatory structure, we are subject to policies and other guidance developed by the regulatory agencies with respect to capital levels, the timing and amount of dividend payments, the classification of assets and the establishment of adequate loan loss reserves for regulatory purposes. Under this structure the regulatory agencies have broad discretion to impose restrictions and limitations on our operations if they determine, among other things, that our operations are unsafe or unsound, fail to comply with applicable law or are otherwise inconsistent with laws and regulations or with the supervisory policies of these agencies.
This supervisory framework could materially impact the conduct, growth and profitability of our operations. Any failure on our part to comply with current laws, regulations, other regulatory requirements or safe and sound banking practices or concerns about our financial condition, or any related regulatory sanctions or adverse actions against us, could increase our costs or restrict our ability to expand our business and result in damage to our reputation.
Ongoing financial reform legislation will, among other things, tighten capital standards, create a new Consumer Financial Protection Bureau andmay result in new regulations that are expectedcould require us to maintain higher capital levels and/or increase our costs of operations.
The Dodd-Frank Act into law. This new law willhas significantly changechanged the current bank regulatory structure and affectaffects the lending, deposit, investment, trading and operating activities of financial institutions and their holding companies. The Dodd-Frank Act requires various federal agencies to adopt a broad range of new implementing rules and regulations, and to prepare numerous studies and reports for Congress. The federal agencies are given significant discretion in drafting the implementing rules and regulations, and consequently, many of the details and much of the impactrulemaking of the Dodd-Frank Act maywill not be known for many months or years.
The federal banking agencies have proposed rules that would substantially amend the regulatory risk-based capital rules. The proposed rules implement the Basel III regulatory capital reforms and changes required by the Dodd-Frank Act. The proposed rules include new minimum risk-based capital and leverage ratios, which would be phased in over the next several years and would refine the definition of what constitutes “capital” for purposes of calculating those ratios. While the proposed Basel III changes and other regulatory capital requirements will likely result in generally higher regulatory capital standards, it is difficult at this time to predict when or how any new standards will ultimately be applied to the Company and the Bank.
- 19 -
The financial services industry is extensively regulated. Federal and state banking regulations are designed primarily to protect the deposit insurance funds and consumers, not to benefit a company’s stockholders. These regulations may sometimes impose significant limitations on operations. The significant federal and state banking regulations that affect us are described in the section captioned “Supervision and Regulation” included in Part I, Item 1, “Business”. These regulations, along with the currently existing tax, accounting, securities, insurance, and monetary laws, regulations, rules, standards, policies, and interpretations control the methods by which financial institutions conduct business, implement strategic initiatives and tax compliance, and govern financial reporting and disclosures. These laws, regulations, rules, standards, policies, and interpretations are constantly evolving and may change significantly over time.
OPERATIONAL RISKS
If our security systems, or those of merchants, merchant acquirers or other third parties containing information about customers, are compromised, we may be subject to liability and damage to our reputation.
As part of our business, we collect, process and retain sensitive and confidential client and customer information on our behalf and on behalf of other third parties. Customer data also may be stored on systems of third-party service providers and merchants that may have inadequate security systems. Third-party carriers regularly transport customer data, and may lose sensitive customer information. Unauthorized access to our networks or any of our other information systems potentially could jeopardize the security of confidential information stored in our computer systems or transmitted by our customers or others. If our security systems or those of merchants, processors or other third-party service providers are compromised such that this confidential information is disclosed to unauthorized parties, we may be subject to liability. For example, in the event of a security breach, we may incur losses related to fraudulent use of debit cards issued by us as well as the operational costs associated with reissuing cards. Although we take preventive measures to address these factors, such measures are costly and may become more costly in the future. Moreover, these measures may not protect us from liability, which may not be adequately covered by insurance, or from damage to our reputation.
We could be subject to losses if we fail to properly safeguard sensitive and confidential information.
As part of our normal operations, we maintain and transmit confidential information about our clients as well as proprietary information relating to our business operations. We maintain a system of internal controls designed to provide reasonable assurance that fraudulent activity, including misappropriation of assets, fraudulent financial reporting, and unauthorized access to sensitive or confidential data is either prevented or timely detected. Our systems or our third-party service providers’ systems could be victimized by unauthorized users or corrupted by computer viruses or other malicious software code, or authorized persons could inadvertently or intentionally release confidential or proprietary information. Such disclosure could, among other things:
Our information systems may experience an interruption or breach in security.
We rely heavily on communications and information systems to conduct our business. Any failure, interruption or breach in security of these systems could result in failures or disruptions in our customer relationship management, general ledger, deposit, loan and other systems. While we have policies and procedures designed to prevent or limit the effect of the failure, interruption or security breach of our information systems, there can be no assurance that any such failures, interruptions or security breaches will not occur or, if they do occur, that they will be adequately addressed. The occurrence of any failures, interruptions or security breaches of our information systems could damage our reputation, result in a loss of customer business, subject us to additional regulatory scrutiny, or expose us to civil litigation and possible financial liability, any of which could have a material adverse effect on our financial condition and results of operations.
- 20 -
We rely on other companies to provide key components of our business infrastructure.
Third party vendors provide key components of our business infrastructure such as internet connections, network access and core application processing. While we have selected these third party vendors carefully, we do not control their actions. Any problems caused by these third parties, including as a result of their not providing us their services for any reason or their performing their services poorly, could adversely affect our ability to deliver products and services to our customers or otherwise conduct our business efficiently and effectively. Replacing these third party vendors could also entail significant delay and expense.
- 20 -
Our success depends, in large part, on our ability to attract and retain skilled people. Competition for the best people in most activities engaged in by us can be intense, and we may not be able to hire sufficiently skilled people or to retain them. Further, the rural location of our principal executive offices and many of our bank branches make it difficult for us to attract skilled people to such locations. The unexpected loss of services of one or more of our key personnel could have a material adverse impact on our business because of their skills, knowledge of our markets, years of industry experience, and the difficulty of promptly finding qualified replacement personnel.
On January 30, 2012, we eliminated the position of Retail Banking Executive previously held by John J. Witkowski, our former Executive Vice President and on June 30, 2012, George D. Hagi, our Executive Vice President and Chief Risk Officer retired and was replaced by Kenneth V. Winn. In August 2012, Peter G. Humphrey retired as our President and Chief Executive Officer. Following Mr. Humphrey’s retirement, our Board of Directors appointed John E. Benjamin to serve as Interim Chief Executive Officer in August 2012. At the same time, we also announced the promotion of Richard Harrison as Chief Operating Officer and Martin Birmingham as President and Chief of Community Banking. In March 2013, Mr. Birmingham was appointed to the position of President and Chief Executive Officer. These changes in key management could create uncertainty among our employees, customers, and other third parties with whom we do business and could result in changes to the strategic direction of our business, which could negatively affect our business, financial condition and results of operations. Any failure of our management to work together to effectively manage our operations, our inability to hire other key management, and any failure to effectively integrate new management into our controls, systems and procedures could adversely affect our business, financial condition and results of operations.
The potential for business interruption exists throughout our organization.
Integral to our performance is the continued efficacy of our technical systems, operational infrastructure, relationships with third parties and the vast array of associates and key executives in our day-to-day and ongoing operations. Failure by any or all of these resources subjects us to risks that may vary in size, scale and scope. This includes, but is not limited to, operational or technical failures, ineffectiveness or exposure due to interruption in third party support as expected, as well as the loss of key individuals or failure on the part of key individuals to perform properly. Although management has established policies and procedures, including implementation and testing of a comprehensive contingency plan, to address such failures, the occurrence of any such event could have a material adverse effect on our business, which, in turn, could have a material adverse effect on our financial condition and results of operations.
Acquisitions may disrupt our business and dilute shareholder value.
A key component of our strategy to grow and improve profitability is to expand our branch network into communities within or adjacent to markets where we currently conduct business. We intend to continue to pursue a growth strategy for our business. As a result, negotiations may take place and future mergers or acquisitions involving cash, debt, or equity securities may occur at any time. We seek merger or acquisition partners that are culturally similar, have experienced management, and possess either significant market presence or have potential for improved profitability through financial management, economies of scale, or expanded services.
Acquiring other banks, businesses, or branches involves potential adverse impact to our financial results and various other risks commonly associated with acquisitions, including, among other things:
- 21 -
EXTERNAL RISKS
We are subject to interest rate risk.
Our earnings and cash flows are largely dependent upon our net interest income. Interest rates are highly sensitive to many factors that are beyond our control, including general economic conditions and policies of various governmental and regulatory agencies and, in particular, the Federal Reserve. Changes in monetary policy, including changes in interest rates, could influence not only the interest we receive on loans and investments and the amount of interest we pay on deposits and borrowings, but such changes could also affect (i) our ability to originate loans and obtain deposits; (ii) the fair value of our financial assets and liabilities; and (iii) the average duration of our mortgage-backed securities portfolio and other interest-earning assets. If the interest rates paid on deposits and other borrowings increase at a faster rate than the interest rates received on loans and other investments, our net interest income, and therefore earnings, could be adversely affected. Earnings could also be adversely affected if the interest rates received on loans and other investments fall more quickly than the interest rates paid on deposits and other borrowings.
Although management believes it has implemented effective asset and liability management strategies to reduce the potential effects of changes in interest rates on our results of operations, any substantial, unexpected or prolonged change in market interest rates could have a material adverse effect on our financial condition and results of operations. Also, our interest rate risk modeling techniques and assumptions likely may not fully predict or capture the impact of actual interest rate changes on our balance sheet.
Our business may be adversely affected by conditions in the financial markets and economic conditions generally.
From December 2007 through June 2009, the U.S. economy was in recession. Business activity across a wide range of industries and regions in the U. S.U.S. was greatly reduced. Although economic conditions have begun to improve, certain sectors, such as real estate, remain weak and unemployment remains high. Local governments and many businesses are still in serious difficulty due to lower consumer spending and reduced tax collections.
Market conditions also led to the failure or merger of several prominent financial institutions and numerous regional and community-based financial institutions. These failures as well as projected future failures, have had a significant negative impact on the capitalization level of the deposit insurance fund of the FDIC, which, in turn, has led to past increases in deposit insurance premiums paid by financial institutions.
Our financial performance generally, and in particular the ability of borrowers to pay interest on and repay principal of outstanding loans and the value of collateral securing those loans, as well as demand for loans and other products and services we offer, is highly dependent on the business environment in the markets where we operate, in the State of New York and in the United States as a whole. A favorable business environment is generally characterized by, among other factors, economic growth, efficient capital markets, low inflation, low unemployment, high business and investor confidence, and strong business earnings. Unfavorable or uncertain economic and market conditions can be caused by declines in economic growth, business activity or investor or business confidence; limitations on the availability or increases in the cost of credit and capital; increases in inflation or interest rates; high unemployment, natural disasters; or a combination of these or other factors.
- 21 -
The policies of the Federal Reserve impact us significantly. The Federal Reserve regulates the supply of money and credit in the United States. Its policies directly and indirectly influence the rate of interest earned on loans and paid on borrowings and interest-bearing deposits and can also affect the value of financial instruments we hold. Those policies determine to a significant extent our cost of funds for lending and investing. Changes in those policies are beyond our control and are difficult to predict. Federal Reserve policies can also affect our borrowers, potentially increasing the risk that they may fail to repay their loans. For example, a tightening of the money supply by the Federal Reserve could reduce the demand for a borrower’s products and services. This could adversely affect the borrower’s earnings and ability to repay its loan, which could have a material adverse effect on our financial condition and results of operation.
The soundness of other financial institutions could adversely affect us.
Financial services institutions are interrelated as a result of trading, clearing, counterparty, or other relationships. We have exposure to many different industries and counterparties, and we routinely execute transactions with counterparties in the financial services industry, including commercial banks, brokers and dealers, investment banks, and other institutional clients. Many of these transactions expose us to credit risk in the event of a default by our counterparty or client. In addition, our credit risk may be exacerbated when the collateral held by us cannot be realized or is liquidated at prices not sufficient to recover the full amount of the credit or derivative exposure due us. Any such losses could have a material adverse effect on our financial condition and results of operations.
- 22 -
We may be required to recognize an impairment of goodwill.
Under current accounting standards, goodwill is not amortized but, instead, is subject to impairment tests on at least an annual basis or more frequently if an event occurs or circumstances change that reduce the fair value of a reporting unit below its carrying amount. Significant and sustained declines in our stock price and market capitalization, significant declines in our expected future cash flows, significant adverse changes in the business climate or slower growth rates could result in impairment of goodwill. During 2012, the annual impairment test performed as of September 30 indicated that the fair value of our single reporting unit exceeded the fair value of its assets and liabilities. In the event that we conclude that all or a portion of our goodwill may be impaired, a non-cash charge for the amount of such impairment would be recorded to earnings, which could have a material adverse impact on our results of operations or financial condition. Such a charge would have no impact on tangible capital. At December 31, 2012, we had goodwill of $49.0 million, representing approximately 19% of shareholders’ equity. For further discussion, see Note 1, Summary of Significant Accounting Policies, and Note 7, Goodwill and Other Intangible Assets, to the Consolidated Financial Statements included in Item 8 of this Annual Report on Form 10-K.
We operate in a highly competitive industry and market area.
We face substantial competition in all areas of our operations from a variety of different competitors, many of which are larger and may have more financial resources. Such competitors primarily include national, regional and internet banks within the various markets in which we operate. We also face competition from many other types of financial institutions, including, without limitation, savings and loans,loan associations, credit unions, finance companies, brokerage firms, insurance companies and other financial intermediaries. The financial services industry could become even more competitive as a result of legislative, regulatory and technological changes and continued consolidation. Banks, securities firms and insurance companies can merge under the umbrella of a financial holding company, which can offer virtually any type of financial service, including banking, securities underwriting, insurance (both agency and underwriting), and merchant banking. Also, technology has lowered barriers to entry and made it possible for nonbanks to offer products and services traditionally provided by banks, such as automatic transfer and automatic payment systems. Many of our competitors have fewer regulatory constraints and may have lower cost structures. Additionally, due to their size, many competitors may be able to achieve economies of scale and, as a result, may offer a broader range of products and services as well as better pricing for those products and services than we can.
Our ability to compete successfully depends on a number of factors, including, among other things:
the ability to develop, maintain and build upon long-term customer relationships based on top quality service, high ethical standards and safe, sound assets;
the ability to expand our market position;
the scope, relevance and pricing of products and services offered to meet customer needs and demands;
the rate at which we introduce new products and services relative to our competitors;
customer satisfaction with our level of service; and
industry and general economic trends.
Failure to perform in any of these areas could significantly weaken our competitive position, which could adversely affect our growth and profitability, which, in turn, could have a material adverse effect on our financial condition and results of operations.
Severe weather, natural disasters, acts of war or terrorism, and other external events could significantly impact our business.
Severe weather, natural disasters, acts of war or terrorism, and other adverse external events could have a significant impact on our ability to conduct business. Such events could affect the stability of our deposit base, impair the ability of borrowers to repay outstanding loans, impair the value couldof collateral securing loans, cause significant property damage, result in an impairmentloss of goodwill.
operations.
- 22 -
Liquidity is essential to our businesses.
Our liquidity could be impaired by an inability to access the capital markets or unforeseen outflows of cash. This situation may arise due to circumstances that we may be unable to control, such as a general market disruption or an operational problem that affects third parties or us. Our efforts to monitor and manage liquidity risk may not be successful or sufficient to deal with dramatic or unanticipated reductions in our liquidity. In such events, our cost of funds may increase, thereby reducing our net interest revenue,income, or we may need to sell a portion of our investment and/or loan portfolio, which, depending upon market conditions, could result in ourus realizing a loss.
- 23 -
We may need to raise additional capital in the future and such capital may not be available when neededon acceptable terms or at all.
We may need to raise additional capital in the future to provide sufficient capital resources and liquidity to meet our commitments and business needs. Our ability to raise additional capital, if needed, will depend on, among other things, conditions in the capital markets at that time, which are outside of our control, and our financial performance.
In addition, we are highly regulated, and our regulators could require us to raise additional common equity in the future. Both weWe and our regulators perform a variety of analyses of our assets, including the preparation of stress case scenarios, and as a result of those assessments we could determine, or our regulators could require us, to raise additional capital.
We cannot assure that such capital will be available on acceptable terms or at all. Any occurrence that may limit our access to the capital markets, such as a decline in the confidence of debt purchasers, depositors of the Bank or counterparties participating in the capital markets, or a downgrade of our debt rating, may adversely affect our capital costs and ability to raise capital and, in turn, our liquidity. An inability to raise additional capital on acceptable terms when needed could have a material adverse impact on our business, financial condition, results of operations or liquidity.
We rely on dividends from our subsidiaries for most of our revenue.
We are a separate and distinct legal entity from our subsidiaries. A substantial portion of our revenue comes from dividends from our Bank subsidiary. These dividends are the principal source of funds we use to pay dividends on our common and preferred stock, and to pay interest and principal on our debt. Various federal and/or state laws and regulations limit the amount of dividends that our Bank subsidiary and nonbank subsidiary may pay to us. Also, our right to participate in a distribution of assets upon a subsidiary’s liquidation or reorganization is subject to the prior claims of the subsidiary’s creditors. In the event our bank subsidiary is unable to pay dividends to us, we may not be able to service debt, pay obligations, or pay dividends on our common and preferred stock. The inability to receive dividends from our bank subsidiary could have a material adverse effect on our business, financial condition, and results of operations.
RISKS RELATED TO AN INVESTMENT IN OUR COMMON STOCK
The market price for our common stock varies, and you should purchase common stock for long-term investment only.
Although our common stock is currently traded on the NASDAQ Global Select Market, we cannot assure you that there will, at any time in the future, be an active trading market for our common stock. Even if there is an active trading market for our common stock, we cannot assure you that you will be able to sell all of your shares of common stock at one time or at a favorable price, if at all. As a result, you should purchase shares of common stock described herein only if you are capable of, and seeking, to make a long-term investment in our common stock.
- 23 -
In the future, we may attempt to increase our capital resources by entering into debt or debt-like financing that is unsecured or secured by all or up to all of our assets, or by issuing additional sharesdebt or equity securities, which could include issuances of commonsecured or unsecured commercial paper, medium-term notes, senior notes, subordinated notes, preferred stock including anyor securities that are convertible into or exchangeable for or that representequity securities. In the right to receive, common stock. We are currently authorized to issue up to 50,000,000 shares of common stock and up to 210,000 shares of preferred stock, par value $100 per share, which is designated into two classes, Class A of which 10,000 shares are authorized, and Class B of which 200,000 shares are authorized.
We may not pay dividends on our common stock.
Holders of our common stock are only entitled to receive such dividends as our Board of Directors may declare out of funds legally available for such payments. Although we have historically declared cash dividends on our common stock, we are not required to do so and may reduce or eliminate our common stock dividend in the future. This could adversely affect the market price of our common stock. Also, participation in TARP limits our ability to increase our dividend or to repurchase our common stock, for so long as any securities issued under such program remain outstanding, as discussed in greater detail below.
Our certificate of incorporation, our bylaws, and certain banking laws may have an anti-takeover effect.
Provisions of our certificate of incorporation, our bylaws, and federal and state banking laws, including regulatory approval requirements, could make it more difficult for a third party to acquire us, even if doing so would be perceived to be beneficial to our shareholders. The combination of these provisions may discourage others from initiating a potential merger, takeover or other change of control transaction, which, in turn, could adversely affect the market price of our common stock.
- 24 -
We own a 27,400 square foot building in Warsaw, New York that serves as our headquarters, and principal executive and administrative offices. Additionally, we are obligated under a lease commitment through 2017 for a 17,750 square foot regional administrative facility in Pittsford, New York.
We are engaged in the banking business through 5052 branch offices, of which 3436 are owned and 16 are leased, in fourteenfifteen contiguous counties of Western and Central New York: Allegany, Cattaraugus, Cayuga, Chautauqua, Chemung, Erie, Genesee, Livingston, Monroe, Ontario, Orleans, Seneca, Steuben, Wyoming and Yates Counties. The operating leases for our branch offices expire at various dates through the year 20232036 and generally include options to renew.
We believe that our properties have been adequately maintained, are in good operating condition and are suitable for our business as presently conducted, including meeting the prescribed security requirements. For additional information, see Note 5,6, Premises and Equipment, Net, and Note 9,10, Commitments and Contingencies, in the accompanying financial statements included in Part II, Item 8, “Financial Statements and Supplementary Data”, all of which are included elsewhere in this report and incorporated herein by reference thereto.
From time to time we are a party to or otherwise involved in legal proceedings arising in the normal course of business. Management does not believe that there is any pending or threatened proceeding against us, which, if determined adversely, would have a material adverse effect on our business, results of operations or financial condition.
Not applicable.
- 25 -
| ITEM 5. | MARKET FOR REGISTRANT’S COMMON EQUITY, RELATED SHAREHOLDER MATTERS AND ISSUER PURCHASES OF EQUITY SECURITIES |
Our common stock is traded on the NASDAQ Global Select Market under the ticker symbol “FISI.” At December 31, 2010, 10,937,5062012, 13,787,709 shares of our common stock were outstanding and held by approximately 1,3001,400 shareholders of record. During 2010,2012, the high sales price of our common stock was $20.74$19.52 and the low sales price was $10.91.$15.22. The closing price per share of common stock on December 31, 2010,2012, the last trading day of the Company’sour fiscal year, was $18.97.$18.63. We declared dividends of $0.40$0.57 per common share during the year ended December 31, 2010.2012. See additional information regarding the market price and dividends paid in Part II, Item 6, “Selected Financial Data.”
We have paid regular quarterly cash dividends on our common stock and our Board of Directors presently intends to continue this practice, subject to our results of operations and the need for those funds for debt service and other purposes. However, the payment of dividends is subject to continued compliance with minimum regulatory capital requirements and TARP restrictions. See the discussions in the section captioned “Supervision and Regulation” included in Part I, Item 1, “Business”, in the section captioned “Liquidity and Capital Resources” included in Part II, Item 7, in “Management’s Discussion and Analysis of Financial Condition and Results of Operations” and in Note 10,11, Regulatory Matters, in the accompanying financial statements included in Part II, Item 8, “Financial Statements and Supplementary Data”, all of which are included elsewhere in this report and incorporated herein by reference thereto.
Equity Compensation Plan Information
The following table sets forth, as of December 31, 2010,2012, information about our equity compensation plans that have been approved by our shareholders, including the number of shares of our common stock exercisable under all outstanding options, warrants and rights, the weighted average exercise price of all outstanding options, warrants and rights and the number of shares available for future issuance under our equity compensation plans. We have no equity compensation plans that have not been approved by our shareholders.
| Number of securities | ||||||||||||
| Weighted average | remaining for future | |||||||||||
| Number of securities to | exercise price | issuance under equity | ||||||||||
| be issued upon exercise | of outstanding | compensation plans | ||||||||||
| of outstanding options, | options, warrants | (excluding securities | ||||||||||
| warrants and rights | and rights | reflected in column (a)) | ||||||||||
| Plan Category | (a) | (b) | (c) | |||||||||
| Equity compensation plans approved by shareholders | 560,689 | (1) | $ | 20.64 | (1) | 748,101 | (2) | |||||
| Equity compensation plans not approved by shareholders | — | $ | — | — | ||||||||
| Number of securities | ||||||||||||
| Weighted average | remaining for future | |||||||||||
| Number of securities to | exercise price | issuance under equity | ||||||||||
| be issued upon exercise | of outstanding | compensation plans | ||||||||||
| of outstanding options, | options, warrants | (excluding securities | ||||||||||
| warrants and rights | and rights | reflected in column (a)) | ||||||||||
Plan Category | (a) | (b) | (c) | |||||||||
Equity compensation plans | 398,855 | (1) | $ | 20.22 | (1) | 651,464 | (2) | |||||
Equity compensation plans | — | $ | — | — | ||||||||
| (1) | Includes |
| (2) | Represents the 940,000 aggregate shares approved for issuance under our two active equity compensation plans, reduced by |
| Number of | ||||||||
| Number of | individuals | |||||||
| shares | receiving | |||||||
| Date | issued | awards | ||||||
| October 1, 2009 | 1,972 | 1 | ||||||
| January 13, 2010 | 40,188 | 5 | ||||||
| February 23, 2010 | 59,152 | 23 | ||||||
| December 15, 2010 | 500 | 1 | ||||||
- 26 -
The stock performance graph below compares (a) the cumulative total return on our common stock for the period beginning December 31, 20052007 as reported by the NASDAQ Global Select Market, through December 31, 2010,2012, (b) the cumulative total return on stocks included in the NASDAQ Composite Index over the same period, and (c) the cumulative total return, as compiled by SNL Financial L.C., of Major Exchange (NYSE, AMEX and NASDAQ) Banks with $1 billion to $5 billion in assets over the same period. Cumulative return assumes the reinvestment of dividends. The graph was prepared by SNL Financial, LC and is expressed in dollars based on an assumed investment of $100.

| Period Ending | ||||||||||||||||||||||||
| Index | 12/31/05 | 12/31/06 | 12/31/07 | 12/31/08 | 12/31/09 | 12/31/10 | ||||||||||||||||||
| Financial Institutions, Inc. | 100.00 | 119.37 | 94.50 | 78.59 | 67.41 | 111.16 | ||||||||||||||||||
| NASDAQ Composite | 100.00 | 110.39 | 122.15 | 73.32 | 106.57 | 125.91 | ||||||||||||||||||
| SNL Bank $1B-$5B Index | 100.00 | 115.72 | 84.29 | 69.91 | 50.11 | 56.81 | ||||||||||||||||||
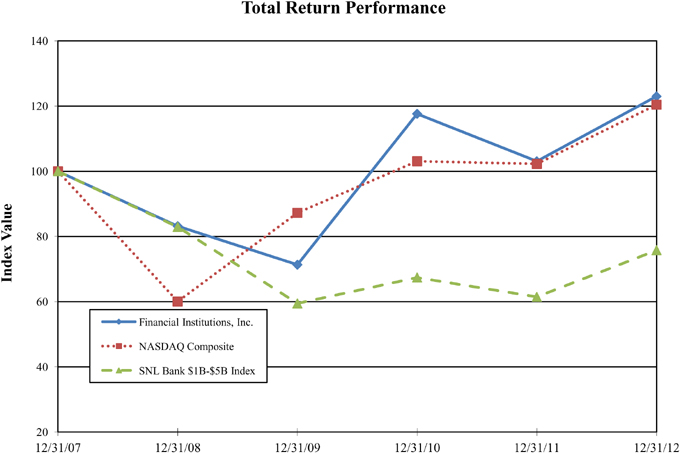
| Period Ending | ||||||||||||||||||||||||
Index | 12/31/07 | 12/31/08 | 12/31/09 | 12/31/10 | 12/31/11 | 12/31/12 | ||||||||||||||||||
Financial Institutions, Inc. | 100.00 | 83.16 | 71.33 | 117.63 | 103.06 | 122.99 | ||||||||||||||||||
NASDAQ Composite | 100.00 | 60.02 | 87.24 | 103.08 | 102.26 | 120.42 | ||||||||||||||||||
SNL Bank $1B-$5B Index | 100.00 | 82.94 | 59.45 | 67.39 | 61.46 | 75.75 | ||||||||||||||||||
- 27 -
| At or for the year ended December 31, | ||||||||||||||||||||
| (Dollars in thousands, except selected ratios and per share data) | 2010 | 2009 | 2008 | 2007 | 2006 | |||||||||||||||
Selected financial condition data: | ||||||||||||||||||||
| Total assets | $ | 2,214,307 | $ | 2,062,389 | $ | 1,916,919 | $ | 1,857,876 | $ | 1,907,552 | ||||||||||
| Loans, net | 1,325,524 | 1,243,265 | 1,102,330 | 948,652 | 909,434 | |||||||||||||||
| Investment securities | 694,530 | 620,074 | 606,038 | 754,720 | 775,536 | |||||||||||||||
| Deposits | 1,882,890 | 1,742,955 | 1,633,263 | 1,575,971 | 1,617,695 | |||||||||||||||
| Borrowings | 103,877 | 106,390 | 70,820 | 68,210 | 87,199 | |||||||||||||||
| Shareholders’ equity | 212,144 | 198,294 | 190,300 | 195,322 | 182,388 | |||||||||||||||
Common shareholders’ equity(1) | 158,359 | 144,876 | 137,226 | 177,741 | 164,765 | |||||||||||||||
Tangible common shareholders’ equity(2) | 120,990 | 107,507 | 99,577 | 139,786 | 126,502 | |||||||||||||||
Selected operations data: | ||||||||||||||||||||
| Interest income | $ | 96,509 | $ | 94,482 | $ | 98,948 | $ | 105,212 | $ | 103,070 | ||||||||||
| Interest expense | 17,720 | 22,217 | 33,617 | 47,139 | 43,604 | |||||||||||||||
| Net interest income | 78,789 | 72,265 | 65,331 | 58,073 | 59,466 | |||||||||||||||
| Provision (credit) for loan losses | 6,687 | 7,702 | 6,551 | 116 | (1,842 | ) | ||||||||||||||
| Net interest income after provision (credit) for loan losses | 72,102 | 64,563 | 58,780 | 57,957 | 61,308 | |||||||||||||||
Noninterest income (loss)(3) | 19,454 | 18,795 | (48,778 | ) | 20,680 | 21,911 | ||||||||||||||
| Noninterest expense | 60,917 | 62,777 | 57,461 | 57,428 | 59,612 | |||||||||||||||
| Income (loss) before income taxes | 30,639 | 20,581 | (47,459 | ) | 21,209 | 23,607 | ||||||||||||||
| Income tax expense (benefit) | 9,352 | 6,140 | (21,301 | ) | 4,800 | 6,245 | ||||||||||||||
| Net income (loss) | $ | 21,287 | $ | 14,441 | $ | (26,158 | ) | $ | 16,409 | $ | 17,362 | |||||||||
| Preferred stock dividends and accretion | 3,725 | 3,697 | 1,538 | 1,483 | 1,486 | |||||||||||||||
| Net income (loss) applicable to common shareholders | $ | 17,562 | $ | 10,744 | $ | (27,696 | ) | $ | 14,926 | $ | 15,876 | |||||||||
Stock and related per share data: | ||||||||||||||||||||
| Earnings (loss) per common share: | ||||||||||||||||||||
| Basic | $ | 1.62 | $ | 0.99 | $ | (2.54 | ) | $ | 1.34 | $ | 1.40 | |||||||||
| Diluted | 1.61 | 0.99 | (2.54 | ) | 1.33 | 1.40 | ||||||||||||||
| Cash dividends declared on common stock | 0.40 | 0.40 | 0.54 | 0.46 | 0.34 | |||||||||||||||
Common book value per share(1) | 14.48 | 13.39 | 12.71 | 16.14 | 14.53 | |||||||||||||||
Tangible common book value per share(2) | 11.06 | 9.94 | 9.22 | 12.69 | 11.15 | |||||||||||||||
| Market price (NASDAQ: FISI): | ||||||||||||||||||||
| High | 20.74 | 15.99 | 22.50 | 23.71 | 25.38 | |||||||||||||||
| Low | 10.91 | 3.27 | 10.06 | 16.18 | 17.43 | |||||||||||||||
| Close | 18.97 | 11.78 | 14.35 | 17.82 | 23.05 | |||||||||||||||
| At or for the year ended December 31, | ||||||||||||||||||||
| (Dollars in thousands, except selected ratios and per share data) | 2012 | 2011 | 2010 | 2009 | 2008 | |||||||||||||||
Selected financial condition data: | ||||||||||||||||||||
Total assets | $ | 2,764,034 | $ | 2,336,353 | $ | 2,214,307 | $ | 2,062,389 | $ | 1,916,919 | ||||||||||
Loans, net | 1,681,012 | 1,461,516 | 1,325,524 | 1,243,265 | 1,102,330 | |||||||||||||||
Investment securities | 841,701 | 650,815 | 694,530 | 620,074 | 606,038 | |||||||||||||||
Deposits | 2,261,794 | 1,931,599 | 1,882,890 | 1,742,955 | 1,633,263 | |||||||||||||||
Borrowings | 179,806 | 150,698 | 103,877 | 106,390 | 70,820 | |||||||||||||||
Shareholders’ equity | 253,897 | 237,194 | 212,144 | 198,294 | 190,300 | |||||||||||||||
Common shareholders’ equity(1) | 236,426 | 219,721 | 158,359 | 144,876 | 137,226 | |||||||||||||||
Tangible common shareholders’ equity(2) | 185,606 | 182,352 | 120,990 | 107,507 | 99,577 | |||||||||||||||
Selected operations data: | ||||||||||||||||||||
Interest income | $ | 97,567 | $ | 95,118 | $ | 96,509 | $ | 94,482 | $ | 98,948 | ||||||||||
Interest expense | 9,051 | 13,255 | 17,720 | 22,217 | 33,617 | |||||||||||||||
|
|
|
|
|
|
|
|
|
| |||||||||||
Net interest income | 88,516 | 81,863 | 78,789 | 72,265 | 65,331 | |||||||||||||||
Provision for loan losses | 7,128 | 7,780 | 6,687 | 7,702 | 6,551 | |||||||||||||||
|
|
|
|
|
|
|
|
|
| |||||||||||
Net interest income after provision for loan losses | 81,388 | 74,083 | 72,102 | 64,563 | 58,780 | |||||||||||||||
Noninterest income (loss)(3) | 24,777 | 23,925 | 19,454 | 18,795 | (48,778 | ) | ||||||||||||||
Noninterest expense | 71,397 | 63,794 | 60,917 | 62,777 | 57,461 | |||||||||||||||
|
|
|
|
|
|
|
|
|
| |||||||||||
Income (loss) before income taxes | 34,768 | 34,214 | 30,639 | 20,581 | (47,459 | ) | ||||||||||||||
Income tax expense (benefit) | 11,319 | 11,415 | 9,352 | 6,140 | (21,301 | ) | ||||||||||||||
|
|
|
|
|
|
|
|
|
| |||||||||||
Net income (loss) | $ | 23,449 | $ | 22,799 | $ | 21,287 | $ | 14,441 | $ | (26,158 | ) | |||||||||
|
|
|
|
|
|
|
|
|
| |||||||||||
Preferred stock dividends and accretion | 1,474 | 3,182 | 3,725 | 3,697 | 1,538 | |||||||||||||||
|
|
|
|
|
|
|
|
|
| |||||||||||
Net income (loss) applicable to common shareholders | $ | 21,975 | $ | 19,617 | $ | 17,562 | $ | 10,744 | $ | (27,696 | ) | |||||||||
|
|
|
|
|
|
|
|
|
| |||||||||||
Stock and related per share data: | ||||||||||||||||||||
Earnings (loss) per common share: | ||||||||||||||||||||
Basic | $ | 1.60 | $ | 1.50 | $ | 1.62 | $ | 0.99 | $ | (2.54 | ) | |||||||||
Diluted | 1.60 | 1.49 | 1.61 | 0.99 | (2.54 | ) | ||||||||||||||
Cash dividends declared on common stock | 0.57 | 0.47 | 0.40 | 0.40 | 0.54 | |||||||||||||||
Common book value per share(1) | 17.15 | 15.92 | 14.48 | 13.39 | 12.71 | |||||||||||||||
Tangible common book value per share(2) | 13.46 | 13.21 | 11.06 | 9.94 | 9.22 | |||||||||||||||
Market price (NASDAQ: FISI): | ||||||||||||||||||||
High | 19.52 | 20.36 | 20.74 | 15.99 | 22.50 | |||||||||||||||
Low | 15.22 | 12.18 | 10.91 | 3.27 | 10.06 | |||||||||||||||
Close | 18.63 | 16.14 | 18.97 | 11.78 | 14.35 | |||||||||||||||
Performance ratios: | ||||||||||||||||||||
Net income (loss), returns on: | ||||||||||||||||||||
Average assets | 0.93 | % | 1.00 | % | 0.98 | % | 0.71 | % | -1.37 | % | ||||||||||
Average equity | 9.46 | 9.82 | 10.07 | 7.43 | -14.30 | |||||||||||||||
Average common equity(1) | 9.53 | 9.47 | 11.14 | 7.61 | -16.84 | |||||||||||||||
Average tangible common equity(2) | 11.74 | 11.55 | 14.59 | 10.37 | -21.87 | |||||||||||||||
Common dividend payout ratio(4) | 35.63 | 31.33 | 24.69 | 40.40 | NA | |||||||||||||||
Net interest margin (fully tax-equivalent) | 3.95 | 4.04 | 4.07 | 4.04 | 3.93 | |||||||||||||||
Efficiency ratio(5) | 62.87 | % | 60.55 | % | 60.36 | % | 65.52 | % | 64.07 | % | ||||||||||
| (1) | Excludes preferred shareholders’ equity. |
| (2) | Excludes preferred shareholders’ equity, goodwill and other intangible assets. |
| (3) | The 2012, 2011, 2010, 2009 and 2008 figures include other-than-temporary impairment (“OTTI”) charges of $91 thousand, $18 thousand, $594 thousand, $4.7 million and $68.2 million, respectively. |
- 28 -
| At or for the year ended December 31, | ||||||||||||||||||||
| (Dollars in thousands, except per share data) | 2010 | 2009 | 2008 | 2007 | 2006 | |||||||||||||||
Selected financial ratios and other data: | ||||||||||||||||||||
Performance ratios: | ||||||||||||||||||||
| Net income (loss), returns on: | ||||||||||||||||||||
| Average assets | 0.98 | % | 0.71 | % | -1.37 | % | 0.86 | % | 0.90 | % | ||||||||||
| Average equity | 10.07 | 7.43 | -14.30 | 8.84 | 9.86 | |||||||||||||||
Average common equity(1) | 11.14 | 7.61 | -16.84 | 8.89 | 10.02 | |||||||||||||||
Average tangible common equity(2) | 14.59 | 10.37 | -21.87 | 11.50 | 13.23 | |||||||||||||||
Common dividend payout ratio(3) | 24.69 | 40.40 | NA | 34.33 | 24.29 | |||||||||||||||
| Net interest margin (fully tax-equivalent) | 4.07 | 4.04 | 3.93 | 3.53 | 3.55 | |||||||||||||||
Efficiency ratio(4) | 60.36 | % | 65.52 | % | 64.07 | % | 68.77 | % | 69.78 | % | ||||||||||
Capital ratios: | ||||||||||||||||||||
| Leverage ratio | 8.31 | % | 7.96 | % | 8.05 | % | 9.35 | % | 8.91 | % | ||||||||||
| Tier 1 risk-based capital | 12.34 | 11.95 | 11.83 | 15.74 | 15.85 | |||||||||||||||
| Total risk-based capital | 13.60 | 13.21 | 13.08 | 16.99 | 17.10 | |||||||||||||||
Equity to assets (5) | 9.75 | 9.55 | 9.60 | 9.73 | 9.08 | |||||||||||||||
Common equity to assets(1) (5) | 7.28 | 6.94 | 8.63 | 8.81 | 8.17 | |||||||||||||||
Tangible common equity to tangible assets(2)(5) | 5.65 | % | 5.19 | % | 6.78 | % | 6.95 | % | 6.32 | % | ||||||||||
Asset quality: | ||||||||||||||||||||
| Non-performing loans | $ | 7,582 | $ | 8,681 | $ | 8,196 | $ | 8,077 | $ | 15,840 | ||||||||||
| Non-performing assets | 8,895 | 10,442 | 9,252 | 9,498 | 17,043 | |||||||||||||||
| Allowance for loan losses | 20,466 | 20,741 | 18,749 | 15,521 | 17,048 | |||||||||||||||
| Net loan charge-offs | $ | 6,962 | $ | 5,710 | $ | 3,323 | $ | 1,643 | $ | 1,341 | ||||||||||
| Total non-performing loans to total loans | 0.56 | % | 0.69 | % | 0.73 | % | 0.84 | % | 1.71 | % | ||||||||||
| Total non-performing assets to total assets | 0.40 | 0.51 | 0.48 | 0.51 | 0.89 | |||||||||||||||
| Net charge-offs to average loans | 0.54 | 0.47 | 0.32 | 0.18 | 0.14 | |||||||||||||||
| Allowance for loan losses to total loans | 1.52 | 1.64 | 1.67 | 1.61 | 1.84 | |||||||||||||||
| Allowance for loan losses to non-performing loans | 270 | % | 239 | % | 229 | % | 192 | % | 108 | % | ||||||||||
Other data: | ||||||||||||||||||||
| Number of branches | 50 | 50 | 51 | 50 | 50 | |||||||||||||||
| Full time equivalent employees | 577 | 572 | 600 | 621 | 640 | |||||||||||||||
| (4) | ||
Common dividend payout ratio equals dividends declared during the year divided by earnings per share for the year. There is no ratio shown for years where we both declared a dividend and incurred a loss because the ratio would result in a negative payout since the dividend declared (paid out) will always be greater than 100% of earnings. |
Efficiency ratio equals noninterest expense less other real estate expense and amortization of intangible assets as a percentage of net revenue, defined as the sum of tax-equivalent net interest income and noninterest income before net gains and impairment charges on investment securities and proceeds from company owned life insurance included in income |
- 28 -
| At or for the year ended December 31, | ||||||||||||||||||||
| (Dollars in thousands, except per share data) | 2012 | 2011 | 2010 | 2009 | 2008 | |||||||||||||||
Capital ratios: | ||||||||||||||||||||
Leverage ratio | 7.70 | % | 8.63 | % | 8.31 | % | 7.96 | % | 8.05 | % | ||||||||||
Tier 1 capital ratio | 10.70 | 12.20 | 12.34 | 11.95 | 11.83 | |||||||||||||||
Total risk-based capital ratio | 11.96 | 13.45 | 13.60 | 13.21 | 13.08 | |||||||||||||||
Equity to assets(3) | 9.84 | 10.20 | 9.75 | 9.55 | 9.60 | |||||||||||||||
Common equity to assets(1) (3) | 9.15 | 9.10 | 7.28 | 6.94 | 8.63 | |||||||||||||||
Tangible common equity to tangible assets(2)(3) | 7.56 | % | 7.58 | % | 5.65 | % | 5.19 | % | 6.78 | % | ||||||||||
Asset quality: | ||||||||||||||||||||
Non-performing loans | $ | 9,125 | $ | 7,076 | $ | 7,582 | $ | 8,681 | $ | 8,196 | ||||||||||
Non-performing assets | 10,062 | 9,187 | 8,895 | 10,442 | 9,252 | |||||||||||||||
Allowance for loan losses | 24,714 | 23,260 | 20,466 | 20,741 | 18,749 | |||||||||||||||
Net loan charge-offs | $ | 5,674 | $ | 4,986 | $ | 6,962 | $ | 5,710 | $ | 3,323 | ||||||||||
Non-performing loans to total loans | 0.53 | % | 0.48 | % | 0.56 | % | 0.69 | % | 0.73 | % | ||||||||||
Non-performing assets to total assets | 0.36 | 0.39 | 0.40 | 0.51 | 0.48 | |||||||||||||||
Net charge-offs to average loans | 0.36 | 0.36 | 0.54 | 0.47 | 0.32 | |||||||||||||||
Allowance for loan losses to total loans | 1.45 | 1.57 | 1.52 | 1.64 | 1.67 | |||||||||||||||
Allowance for loan losses to non-performing loans | 271 | % | 329 | % | 270 | % | 239 | % | 229 | % | ||||||||||
Other data: | ||||||||||||||||||||
Number of branches | 52 | 50 | 50 | 50 | 51 | |||||||||||||||
Full time equivalent employees | 628 | 575 | 577 | 572 | 600 | |||||||||||||||
| (1) | Excludes preferred shareholders’ equity. |
Excludes preferred shareholders’ equity, goodwill and other intangible assets. Ratios calculated using average balances for the periods shown. |
- 29 -
| 2010 | ||||||||||||||||
| Fourth | Third | Second | First | |||||||||||||
| (Dollars in thousands, except per share data) | Quarter | Quarter | Quarter | Quarter | ||||||||||||
| Interest income | $ | 24,297 | $ | 24,186 | $ | 24,202 | $ | 23,824 | ||||||||
| Interest expense | 4,229 | 4,393 | 4,526 | 4,572 | ||||||||||||
| Net interest income | 20,068 | 19,793 | 19,676 | 19,252 | ||||||||||||
| Provision for loan losses | 1,980 | 2,184 | 2,105 | 418 | ||||||||||||
| Net interest income, after provision for loan losses | 18,088 | 17,609 | 17,571 | 18,834 | ||||||||||||
| Noninterest income | 5,274 | 5,131 | 4,966 | 4,083 | ||||||||||||
| Noninterest expense | 16,373 | 14,936 | 14,870 | 14,738 | ||||||||||||
| Income before income taxes | 6,989 | 7,804 | 7,667 | 8,179 | ||||||||||||
| Income tax expense | 1,891 | 2,141 | 2,469 | 2,851 | ||||||||||||
| Net income | $ | 5,098 | $ | 5,663 | $ | 5,198 | $ | 5,328 | ||||||||
| Preferred stock dividends | 933 | 932 | 931 | 929 | ||||||||||||
| Net income applicable to common shareholders | $ | 4,165 | $ | 4,731 | $ | 4,267 | $ | 4,399 | ||||||||
Earnings per common share(1): | ||||||||||||||||
| Basic | $ | 0.38 | $ | 0.44 | $ | 0.39 | $ | 0.41 | ||||||||
| Diluted | 0.38 | 0.43 | 0.39 | 0.40 | ||||||||||||
| Market price (NASDAQ: FISI): | ||||||||||||||||
| High | $ | 20.74 | $ | 19.94 | $ | 19.48 | $ | 15.40 | ||||||||
| Low | 16.80 | 14.14 | 14.07 | 10.91 | ||||||||||||
| Close | 18.97 | 17.66 | 17.76 | 14.62 | ||||||||||||
| Dividends declared | $ | 0.10 | $ | 0.10 | $ | 0.10 | $ | 0.10 | ||||||||
| 2009 | ||||||||||||||||
| Fourth | Third | Second | First | |||||||||||||
| (Dollars in thousands, except per share data) | Quarter | Quarter | Quarter | Quarter | ||||||||||||
| Interest income | $ | 24,390 | $ | 23,697 | $ | 23,302 | $ | 23,093 | ||||||||
| Interest expense | 5,175 | 5,619 | 5,657 | 5,766 | ||||||||||||
| Net interest income | 19,215 | 18,078 | 17,645 | 17,327 | ||||||||||||
| Provision for loan losses | 1,088 | 2,620 | 2,088 | 1,906 | ||||||||||||
| Net interest income, after provision for loan losses | 18,127 | 15,458 | 15,557 | 15,421 | ||||||||||||
| Noninterest income | 5,183 | 4,406 | 4,515 | 4,691 | ||||||||||||
| Noninterest expense | 15,117 | 15,142 | 16,440 | 16,078 | ||||||||||||
| Income before income taxes | 8,193 | 4,722 | 3,632 | 4,034 | ||||||||||||
| Income tax expense | 2,756 | 1,313 | 1,004 | 1,067 | ||||||||||||
| Net income | $ | 5,437 | $ | 3,409 | $ | 2,628 | $ | 2,967 | ||||||||
| Preferred stock dividends | 927 | 927 | 925 | 918 | ||||||||||||
| Net income applicable to common shareholders | $ | 4,510 | $ | 2,482 | $ | 1,703 | $ | 2,049 | ||||||||
Earnings per common share(1): | ||||||||||||||||
| Basic | $ | 0.42 | $ | 0.23 | $ | 0.16 | $ | 0.19 | ||||||||
| Diluted | 0.42 | 0.23 | 0.16 | 0.19 | ||||||||||||
| Market price (NASDAQ: FISI): | ||||||||||||||||
| High | $ | 12.25 | $ | 15.00 | $ | 15.99 | $ | 14.95 | ||||||||
| Low | 9.71 | 9.90 | 6.98 | 3.27 | ||||||||||||
| Close | 11.78 | 9.97 | 13.66 | 7.62 | ||||||||||||
| Dividends declared | $ | 0.10 | $ | 0.10 | $ | 0.10 | $ | 0.10 | ||||||||
| Fourth | Third | Second | First | |||||||||||||
| (Dollars in thousands, except per share data) | Quarter | Quarter | Quarter | Quarter | ||||||||||||
2012 | ||||||||||||||||
Interest income | $ | 25,087 | $ | 25,299 | $ | 23,731 | $ | 23,450 | ||||||||
Interest expense | 1,999 | 2,200 | 2,343 | 2,509 | ||||||||||||
|
|
|
|
|
|
|
| |||||||||
Net interest income | 23,088 | 23,099 | 21,388 | 20,941 | ||||||||||||
Provision for loan losses | 2,520 | 1,764 | 1,459 | 1,385 | ||||||||||||
|
|
|
|
|
|
|
| |||||||||
Net interest income, after provision for loan losses | 20,568 | 21,335 | 19,929 | 19,556 | ||||||||||||
Noninterest income | 6,283 | 6,353 | 6,690 | 5,451 | ||||||||||||
Noninterest expense | 17,541 | 21,618 | 16,581 | 15,657 | ||||||||||||
|
|
|
|
|
|
|
| |||||||||
Income before income taxes | 9,310 | 6,070 | 10,038 | 9,350 | ||||||||||||
Income tax expense | 2,978 | 1,805 | 3,382 | 3,154 | ||||||||||||
|
|
|
|
|
|
|
| |||||||||
Net income | $ | 6,332 | $ | 4,265 | $ | 6,656 | $ | 6,196 | ||||||||
|
|
|
|
|
|
|
| |||||||||
Preferred stock dividends | 369 | 368 | 368 | 369 | ||||||||||||
|
|
|
|
|
|
|
| |||||||||
Net income applicable to common shareholders | $ | 5,963 | $ | 3,897 | $ | 6,288 | $ | 5,827 | ||||||||
|
|
|
|
|
|
|
| |||||||||
Earnings per common share(1): | ||||||||||||||||
Basic | $ | 0.44 | $ | 0.28 | $ | 0.46 | $ | 0.43 | ||||||||
Diluted | 0.43 | 0.28 | 0.46 | 0.42 | ||||||||||||
Market price (NASDAQ: FISI): | ||||||||||||||||
High | $ | 19.39 | $ | 19.52 | $ | 17.66 | $ | 17.99 | ||||||||
Low | 17.61 | 16.50 | 15.51 | 15.22 | ||||||||||||
Close | 18.63 | 18.64 | 16.88 | 16.17 | ||||||||||||
Dividends declared | $ | 0.16 | $ | 0.14 | $ | 0.14 | $ | 0.13 | ||||||||
2011 | ||||||||||||||||
Interest income | $ | 23,875 | $ | 23,774 | $ | 23,830 | $ | 23,639 | ||||||||
Interest expense | 2,721 | 3,156 | 3,577 | 3,801 | ||||||||||||
|
|
|
|
|
|
|
| |||||||||
Net interest income | 21,154 | 20,618 | 20,253 | 19,838 | ||||||||||||
Provision for loan losses | 2,162 | 3,480 | 1,328 | 810 | ||||||||||||
|
|
|
|
|
|
|
| |||||||||
Net interest income, after provision for loan losses | 18,992 | 17,138 | 18,925 | 19,028 | ||||||||||||
Noninterest income | 5,767 | 8,036 | 4,974 | 5,148 | ||||||||||||
Noninterest expense | 16,279 | 17,012 | 15,153 | 15,350 | ||||||||||||
|
|
|
|
|
|
|
| |||||||||
Income before income taxes | 8,480 | 8,162 | 8,746 | 8,826 | ||||||||||||
Income tax expense | 2,718 | 2,664 | 3,027 | 3,006 | ||||||||||||
|
|
|
|
|
|
|
| |||||||||
Net income | $ | 5,762 | $ | 5,498 | $ | 5,719 | $ | 5,820 | ||||||||
|
|
|
|
|
|
|
| |||||||||
Preferred stock dividends | 369 | 368 | 370 | 2,075 | ||||||||||||
|
|
|
|
|
|
|
| |||||||||
Net income applicable to common shareholders | $ | 5,393 | $ | 5,130 | $ | 5,349 | $ | 3,745 | ||||||||
|
|
|
|
|
|
|
| |||||||||
Earnings per common share(1): | ||||||||||||||||
Basic | $ | 0.39 | $ | 0.38 | $ | 0.39 | $ | 0.33 | ||||||||
Diluted | 0.39 | 0.37 | 0.39 | 0.33 | ||||||||||||
Market price (NASDAQ: FISI): | ||||||||||||||||
High | $ | 17.26 | $ | 17.98 | $ | 17.93 | $ | 20.36 | ||||||||
Low | 12.18 | 13.63 | 15.20 | 16.40 | ||||||||||||
Close | 16.14 | 14.26 | 16.42 | 17.52 | ||||||||||||
Dividends declared | $ | 0.13 | $ | 0.12 | $ | 0.12 | $ | 0.10 | ||||||||
| (1) | Earnings per share data is computed independently for each of the quarters presented. Therefore, the sum of the quarterly earnings |
- 30 -
2012 FOURTH QUARTER RESULTS
Net income was $6.3 million for the fourth quarter of 2012 compared with $5.8 million for the fourth quarter of 2011. After preferred dividends, fourth quarter diluted earnings per share for 2012 was $0.43 compared with $0.39 per share for the fourth quarter of 2011.
Net interest income totaled $23.1 million for the three months ended December 31, 2012, an increase of $1.9 million or 9% over the fourth quarter of 2011. Average earning assets increased $293.1 million during the fourth quarter 2012 compared to the same quarter last year, the result of a $219.6 million increase in average loans combined with a $73.5 million increase in investment securities.
The net interest margin on a tax-equivalent basis was 3.92% in the fourth quarter of 2012, compared with 4.07% in the fourth quarter of 2011. Our yield on earning-assets decreased 33 basis points in the fourth quarter of 2012 compared with the same quarter last year, a result of cash flows being reinvested in the current low interest rate environment, which includes the impact of investing the cash from the branch acquisitions into lower yielding securities. The cost of interest-bearing liabilities decreased 22 basis points compared with the fourth quarter of 2011, primarily a result of the continued downward re-pricing of our certificates of deposit.
The provision for loan losses was $2.5 million for the fourth quarter of 2012 compared with $2.2 million for the fourth quarter of 2011. Net charge-offs for the fourth quarter of 2012 were $2.1 million, or 0.50% annualized, of average loans, compared to $1.9 million, or 0.51% annualized, of average loans in the fourth quarter of 2011. See the sections “Allowance for Loan Losses” and “Non-performing Assets and Potential Problem Loans” for additional information on net charge-offs and non-performing loans.
Noninterest income totaled $6.3 million for the fourth quarter of 2012, a 9% increase over the fourth quarter of 2011. The majority of the increase related to a $452 thousand increase in income from service charges on deposit accounts when comparing the fourth quarter 2012 compared with the same quarter last year.
Noninterest expense was $17.5 million for the fourth quarter of 2012, an increase of $1.3 million or 8% from the fourth quarter of 2011. The increases in expenses across all categories for the fourth quarter of 2012 compared to the fourth quarter of 2011 reflect higher infrastructure costs to support the increased number of branches and employees.
Income tax expense for the fourth quarter of 2012 was $3.0 million compared to $2.7 million for the fourth quarter of 2011. The change in income tax expense was primarily due to an $830 thousand increase in pretax income between the periods.
- 31 -
The following is a discussion and analysis of our financial position and results of operations and should be read in conjunction with the information set forth under Part I, Item 1A, “Risks Factors,”Factors”, and our consolidated financial statements and notes thereto appearing under Part II, Item 8, “Financial Statements and Supplementary Data” of this report.Annual Report on Form 10-K.
OVERVIEW AND OUTLOOK
Business Overview
Financial Institutions, Inc. is a financial holding company headquartered in New York State, providing banking and nonbanking financial services to individuals and businesses primarily in our Western and Central New York footprint. We have also expanded our indirect lending network to include relationships with franchised automobile dealers in the Capital District of New York and Northern Pennsylvania. Through our wholly-owned banking subsidiary, Five Star Bank, we provide a wide range of services, including business and consumer loan and depository services, as well as other traditional banking services. Through our nonbanking subsidiary, Five Star Investment Services, we provide brokerage and investment advisory services to supplement our banking business.
Our primary sources of revenue are net interest income (predominantly from interest(interest earned on our loans and securities, net of interest paid on deposits and other funding sources), and noninterest income, particularly fees and other revenue from financial services provided to customers or ancillary services tied to loans and deposits. Business volumes and pricing drive revenue potential, and tend to be influenced by overall economic factors, including market interest rates, business spending, consumer confidence, economic growth, and competitive conditions within the marketplace. We are not able to predict market interest rate fluctuations with certainty and our asset/liability management strategy may not prevent interest rate changes from having a material adverse effect on our results of operations and financial condition.
2012 Significant Events
OutlookBranch Acquisitions.
The combined assets acquired and deposits assumed in the two transactions were recorded at their estimated fair values as follows:
Cash | $ | 195,778 | ||
Loans | 75,635 | |||
Bank premises and equipment | 1,938 | |||
Goodwill | 11,599 | |||
Core deposit intangible asset | 2,042 | |||
Other assets | 339 | |||
|
| |||
Total assets acquired | $ | 287,331 | ||
|
| |||
Deposits assumed | $ | 286,819 | ||
Other liabilities | 512 | |||
|
| |||
Total liabilities assumed | $ | 287,331 | ||
|
|
In anticipation of the U.S. economybranch acquisitions, we leveraged our balance sheet through the execution of short-term FHLB advances in order to “pre-acquire” investment securities. This strategy allowed us to purchase securities over time and in particular, economic and market conditions in Western and Central New York havecarry out a significant impact on loan demand, the abilitydollar cost averaging strategy. Our purchase of borrowers to repay loans and the value of any collateral securing loans and may also affect deposit levels. Accordingly, future general economic conditions and the impact on credit risk are key uncertainties that may materially affect our results of operations.
For detailed information on the Consumer Financial Protection Bureau andaccounting for the requirementsbranch acquisitions, see Note 2, Branch Acquisitions, of the enhanced supervision provisions, among others.
- 3132 -
Leadership Transition.
The Board of Directors subsequently appointed Mr. Birmingham as President and Chief Executive Officer, effective March 1, 2013.
2012 Performance Summary
Our reported net income was $21.3$23.4 million for the year ended December 31, 2010,2012, compared to a net income of $14.4$22.8 million for the year ended December 31, 2009.2011. For 2010,2012, net income available to common shareholders was $17.6$22.0 million, or $1.61$1.60 per diluted common share. Netshare, compared to 2011 net income available to common shareholders was $10.7of $19.6 million, for 2009, or $0.99$1.49 per diluted common share. Cash dividends of $0.40$0.57 and $0.47 per common share were paiddeclared in 20102012 and 2009.
We had total assets of $2.214$2.764 billion at December 31, 20102012 compared to $2.062$2.336 billion at December 31, 2009.2011. At December 31, 2010,2012, shareholders’ equity totaled $212.1$253.9 million with book value per common share at $14.48,$17.15, compared to $198.3$237.2 million with book value per common share at $13.39$15.92 at the end of 2009. Tangible common equity to tangible common assets improved to 5.65% during 2010 from 5.19% in 2009.2011. The Tier 1 capital ratio was 12.34%10.70% as of December 31, 20102012 compared to 11.95%12.20% at December 31, 2009.
Key factors behind these results are discussed below.
- 3233 -
RESULTS OF OPERATIONS FOR THE YEARS ENDED
DECEMBER 31, 20102012 AND DECEMBER 31, 20092011
Net Interest Income and Net Interest Margin
Net interest income is the primary source of our revenue. Net interest income is the difference between interest income on interest-earning assets, such as loans and investment securities, and the interest expense on interest-bearing deposits and other borrowings used to fund interest-earning and other assets or activities. Net interest income is affected by changes in interest rates and by the amount and composition of earning assets and interest-bearing liabilities, as well as the sensitivity of the balance sheet to changes in interest rates, including characteristics such as the fixed or variable nature of the financial instruments, contractual maturities and repricing frequencies.
Interest rate spread and net interest margin are utilized to measure and explain changes in net interest income. Interest rate spread is the difference between the yield on earning assets and the rate paid for interest-bearing liabilities that fund those assets. The net interest margin is expressed as the percentage of net interest income to average earning assets. The net interest margin exceeds the interest rate spread because noninterest-bearing sources of funds (“net free funds”), principally noninterest-bearing demand deposits and stockholders’ equity, also support earning assets. To compare tax-exempt asset yields to taxable yields, the yield on tax-exempt investment securities is computed on a taxable equivalent basis. Net interest income, interest rate spread, and net interest margin are discussed on a taxable equivalent basis.
The following table reconciles interest income per the consolidated statements of operationsincome to interest income adjusted to a fully taxable equivalent basis for the years ended December 31 (in thousands):
| 2010 | 2009 | 2008 | ||||||||||
| Interest income per consolidated statements of operations | $ | 96,509 | $ | 94,482 | $ | 98,948 | ||||||
| Adjustment to fully taxable equivalent basis | 1,895 | 2,692 | 4,292 | |||||||||
| Interest income adjusted to a fully taxable equivalent basis | 98,404 | 97,174 | 103,240 | |||||||||
| Interest expense per consolidated statement of operations | 17,720 | 22,217 | 33,617 | |||||||||
| Net interest income on a taxable equivalent basis | $ | 80,684 | $ | 74,957 | $ | 69,623 | ||||||
| 2012 | 2011 | 2010 | ||||||||||
Interest income per consolidated statements of income | $ | 97,567 | $ | 95,118 | $ | 96,509 | ||||||
Adjustment to fully taxable equivalent basis | 2,284 | 2,062 | 1,895 | |||||||||
|
|
|
|
|
| |||||||
Interest income adjusted to a fully taxable equivalent basis | 99,851 | 97,180 | 98,404 | |||||||||
Interest expense per consolidated statement of income | 9,051 | 13,255 | 17,720 | |||||||||
|
|
|
|
|
| |||||||
Net interest income on a taxable equivalent basis | $ | 90,800 | $ | 83,925 | $ | 80,684 | ||||||
|
|
|
|
|
| |||||||
Taxable equivalent net interest income of $80.7$90.8 million for 20102012 was $5.7$6.9 million or 8% higher than 2009. While the2011. The impact of a decline in average yields on our loans and assets declined, the impact was far exceededdiminished by the benefit of substantial loan production and asset growth.a $217.4 million or 10% increase in interest-earning assets. The average balance of loans rose $85.4$199.6 million or 14% to $1.295$1.593 billion, reflecting growth in the commercial and consumer indirectevery loan portfolios, ascategory. Consistent with our strategic plan, we have focused business development efforts in those areas, and the average balance of interest-earning assets rose $124.3 million to $1.981 billion, both increases of 7%. We will continue to pursue loan development efforts in the commercial and consumer indirect lending portfolios in accordance with our prudent underwriting standards.
The increase in taxable equivalent net interest income was a function of a favorable volume variance (asas balance sheet changes in both volume and mix increased taxable equivalent net interest income by $6.3 million),$11.7 million, partially offset by an unfavorable rate variance (decreasingthat decreased taxable equivalent net interest income by $573 thousand).$4.8 million. The change in mix and volume of earning assets increased taxable equivalent interest income by $6.8$11.2 million, while the change in volume and composition of interest-bearing liabilities increaseddecreased interest expense by $499$474 thousand, for a net favorable volume impact of $6.3$11.7 million on taxable equivalent net interest income. Rate changes on earning assets reduced interest income by $5.6$8.5 million, while changes in rates on interest-bearing liabilities lowered interest expense by $5.0$3.7 million, for a net unfavorable rate impact of $573 thousand.
The net interest margin for 20102012 was 4.07%3.95% compared to 4.04% in 2009. 2011.
The 3 basis point improvementdecrease in net interest margin was attributable to a 10 basis point increase in interest rate spread (the net of a 36 basis point decrease in the cost of interest-bearing liabilities and a 26 basis decrease in the yield on earning assets), partially offset by a 7 basis point lower contribution from net free funds (primarily attributable to lower rates on interest-bearing liabilities reducing the relative value of noninterest-bearing deposits and other net free funds).
The Federal Reserve left the Federal funds rate unchanged at 0.25% during 2010 through 2012. During 2011, the Federal Reserve disclosed that short-term interest rates would be held near zero through at least the middle of 2013, in anticipation of low growth and 2009.
- 34 -
MANAGEMENT’S DISCUSSION AND ANALYSIS
For 2010,2012, the yield on average earning assets of 4.97%4.35% was 2632 basis points lower than 2009.2011. Loan yields decreased 1544 basis points to 5.86%5.09%. Commercial mortgage and consumer indirect loans in particular, down 2628 and 3484 basis points, respectively, experiencedcontinued to experience lower yields given the competitive pricing pressures and re-pricing of loans in a low interest rate environment. The yield on investment securities dropped 6927 basis points to 3.31%2.66%, also impacted by the lower interest rate environment, and prepayments of mortgage-related investment securities and the impact of investing the excess cash related to our branch acquisitions into low yielding securities. Overall, earning asset rate changes reduced interest income by $5.6$8.5 million.
The cost of average interest-bearing liabilities of 1.10%0.50% in 20102012 was 3630 basis points lower than 2009.2011. The average cost of interest-bearing deposits was 0.97%0.50% in 2010, 362012, 24 basis points lower than 2009,2011, reflecting the lower rate environment, mitigated by a focus on product pricing to retain balances.sustained low-rate environment. The cost of wholesale funding (comprised of short-term borrowings and long-term borrowings) decreased 14110 basis points to 3.33%0.48% for 2010.2012, primarily a result of the redemption of the Company’s 10.20% junior subordinated debentures during the third quarter of 2011. The interest-bearing liability rate changes resulted in $5.0reduced interest expense by $3.7 million lower interest expense.
during 2012.
- 33 -
Average interest-bearing liabilities of $1.610$1.825 billion in 20102012 were up $85.1$162.9 million or 6%10% versus 2009, mainly attributable to higher average retail deposit balances.2011. The impacts of the recent recession have had a positivecontinue to positively impact on our deposit balances, as consumers tend to save more conservatively when consumer confidence is low. On average, interest-bearing deposits grew $89.0$156.2 million, while average noninterest-bearing demand deposits (a principal component of net free funds) increased by $36.0$62.0 million. Average wholesale funding decreased $3.9borrowings increased $6.7 million, net of the $6.0representing a $22.6 million increase and $9.9$15.9 million decrease in short-term and long-term borrowings, respectively.
- 3435 -
The following tables present, for the periods indicated, information regarding: (i) the average balance sheet; (ii) the amount of interest income from interest-earning assets and the resulting annualized yields (tax-exempt yields have been adjusted to a tax-equivalent basis using the applicable Federal tax rate in each year); (iii) the amount of interest expense on interest-bearing liabilities and the resulting annualized rates; (iv) net interest income; (v) net interest rate spread; (vi) net interest income as a percentage of average interest-earning assets (“net interest margin”); and (vii) the ratio of average interest-earning assets to average interest-bearing liabilities. Investment securities are at amortized cost for both held to maturity and available for sale securities. Loans include net unearned income, net deferred loan fees and costs and non-accruing loans. Dollar amounts are shown in thousands.
| Years ended December 31, | ||||||||||||||||||||||||||||||||||||
| 2010 | 2009 | 2008 | ||||||||||||||||||||||||||||||||||
| Average | Average | Average | Average | Average | Average | |||||||||||||||||||||||||||||||
| Balance | Interest | Rate | Balance | Interest | Rate | Balance | Interest | Rate | ||||||||||||||||||||||||||||
Interest-earning assets: | ||||||||||||||||||||||||||||||||||||
| Federal funds sold and other interest-earning deposits | $ | 5,034 | $ | 10 | 0.21 | % | $ | 37,214 | $ | 82 | 0.22 | % | $ | 26,568 | $ | 619 | 2.33 | % | ||||||||||||||||||
| Investment securities: | ||||||||||||||||||||||||||||||||||||
| Taxable | 571,856 | 17,101 | 2.99 | 454,552 | 16,466 | 3.62 | 487,687 | 21,882 | 4.49 | |||||||||||||||||||||||||||
| Tax-exempt | 108,900 | 5,416 | 4.97 | 155,054 | 7,920 | 5.11 | 233,864 | 13,065 | 5.59 | |||||||||||||||||||||||||||
| Total investment securities | 680,756 | 22,517 | 3.31 | 609,606 | 24,386 | 4.00 | 721,551 | 34,947 | 4.84 | |||||||||||||||||||||||||||
| Loans: | ||||||||||||||||||||||||||||||||||||
| Commercial business | 206,167 | 9,939 | 4.82 | 204,235 | 9,612 | 4.71 | 167,760 | 10,476 | 6.24 | |||||||||||||||||||||||||||
| Commercial mortgage | 338,149 | 20,389 | 6.03 | 306,763 | 19,309 | 6.29 | 274,677 | 18,877 | 6.87 | |||||||||||||||||||||||||||
| Residential mortgage | 138,954 | 8,157 | 5.87 | 161,055 | 9,701 | 6.02 | 172,083 | 10,761 | 6.25 | |||||||||||||||||||||||||||
| Home equity | 202,189 | 9,224 | 4.56 | 193,929 | 9,121 | 4.70 | 189,448 | 11,041 | 5.83 | |||||||||||||||||||||||||||
| Consumer indirect | 382,977 | 25,379 | 6.63 | 313,239 | 21,838 | 6.97 | 185,197 | 13,098 | 7.07 | |||||||||||||||||||||||||||
| Other consumer | 26,950 | 2,789 | 10.35 | 30,791 | 3,125 | 10.15 | 34,895 | 3,421 | 9.80 | |||||||||||||||||||||||||||
| Total loans | 1,295,386 | 75,877 | 5.86 | 1,210,012 | 72,706 | 6.01 | 1,024,060 | 67,674 | 6.61 | |||||||||||||||||||||||||||
| Total interest-earning assets | 1,981,176 | 98,404 | 4.97 | 1,856,832 | 97,174 | 5.23 | 1,772,179 | 103,240 | 5.83 | |||||||||||||||||||||||||||
| Less: Allowance for loan losses | 20,883 | 20,355 | 16,287 | |||||||||||||||||||||||||||||||||
| Other noninterest-earning assets | 206,303 | 197,439 | 149,453 | |||||||||||||||||||||||||||||||||
| Total assets | $ | 2,166,596 | $ | 2,033,916 | $ | 1,905,345 | ||||||||||||||||||||||||||||||
Interest-bearing liabilities: | ||||||||||||||||||||||||||||||||||||
| Deposits: | ||||||||||||||||||||||||||||||||||||
| Interest-bearing demand | $ | 382,517 | 705 | 0.18 | $ | 365,873 | 772 | 0.21 | $ | 347,702 | 3,246 | 0.93 | ||||||||||||||||||||||||
| Savings and money market | 414,953 | 1,133 | 0.27 | 383,697 | 1,090 | 0.28 | 369,926 | 3,773 | 1.02 | |||||||||||||||||||||||||||
| Certificates of deposit | 726,330 | 13,015 | 1.79 | 685,259 | 17,228 | 2.51 | 617,381 | 22,330 | 3.62 | |||||||||||||||||||||||||||
| Total interest-bearing deposits | 1,523,800 | 14,853 | 0.97 | 1,434,829 | 19,090 | 1.33 | 1,335,009 | 29,349 | 2.20 | |||||||||||||||||||||||||||
| Short-term borrowings | 49,104 | 365 | 0.74 | 43,092 | 270 | 0.63 | 38,028 | 721 | 1.90 | |||||||||||||||||||||||||||
| Long-term borrowings | 37,043 | 2,502 | 6.75 | 46,913 | 2,857 | 6.09 | 53,687 | 3,547 | 6.61 | |||||||||||||||||||||||||||
| Total borrowings | 86,147 | 2,867 | 3.33 | 90,005 | 3,127 | 3.47 | 91,715 | �� | 4,268 | 4.65 | ||||||||||||||||||||||||||
| Total interest-bearing liabilities | 1,609,947 | 17,720 | 1.10 | 1,524,834 | 22,217 | 1.46 | 1,426,724 | 33,617 | 2.36 | |||||||||||||||||||||||||||
| Noninterest-bearing deposits | 329,853 | 293,852 | 280,467 | |||||||||||||||||||||||||||||||||
| Other liabilities | 15,485 | 20,890 | 15,249 | |||||||||||||||||||||||||||||||||
| Shareholders’ equity | 211,311 | 194,340 | 182,905 | |||||||||||||||||||||||||||||||||
| Total liabilities and shareholders’ equity | $ | 2,166,596 | $ | 2,033,916 | $ | 1,905,345 | ||||||||||||||||||||||||||||||
| Net interest income (tax-equivalent) | $ | 80,684 | $ | 74,957 | $ | 69,623 | ||||||||||||||||||||||||||||||
| Interest rate spread | 3.87 | % | 3.77 | % | 3.47 | % | ||||||||||||||||||||||||||||||
| Net earning assets | $ | 371,229 | $ | 331,998 | $ | 345,455 | ||||||||||||||||||||||||||||||
| Net interest margin (tax-equivalent) | 4.07 | % | 4.04 | % | 3.93 | % | ||||||||||||||||||||||||||||||
| Ratio of average interest-earning assets to average interest-bearing liabilities | 123.06 | % | 121.77 | % | 124.21 | % | ||||||||||||||||||||||||||||||
| Years ended December 31, | ||||||||||||||||||||||||||||||||||||
| 2012 | 2011 | 2010 | ||||||||||||||||||||||||||||||||||
| Average | Average | Average | Average | Average | Average | |||||||||||||||||||||||||||||||
| Balance | Interest | Rate | Balance | Interest | Rate | Balance | Interest | Rate | ||||||||||||||||||||||||||||
Interest-earning assets: | ||||||||||||||||||||||||||||||||||||
Federal funds sold and other interest-earning deposits | $ | 113 | $ | — | 0.29 | % | $ | 140 | $ | — | 0.20 | % | $ | 5,034 | $ | 10 | 0.21 | % | ||||||||||||||||||
Investment securities: | ||||||||||||||||||||||||||||||||||||
Taxable | 525,912 | 12,202 | 2.32 | 545,112 | 14,185 | 2.60 | 571,856 | 17,101 | 2.99 | |||||||||||||||||||||||||||
Tax-exempt | 177,731 | 6,526 | 3.67 | 140,657 | 5,890 | 4.19 | 108,900 | 5,416 | 4.97 | |||||||||||||||||||||||||||
|
|
|
|
|
|
|
|
|
|
|
|
|
|
|
|
|
| |||||||||||||||||||
Total investment securities | 703,643 | 18,728 | 2.66 | 685,769 | 20,075 | 2.93 | 680,756 | 22,517 | 3.31 | |||||||||||||||||||||||||||
Loans: | ||||||||||||||||||||||||||||||||||||
Commercial business | 242,100 | 11,263 | 4.65 | 215,598 | 10,311 | 4.78 | 206,167 | 9,939 | 4.82 | |||||||||||||||||||||||||||
Commercial mortgage | 407,737 | 22,182 | 5.44 | 370,843 | 21,216 | 5.72 | 338,149 | 20,389 | 6.03 | |||||||||||||||||||||||||||
Residential mortgage | 127,363 | 6,637 | 5.21 | 121,742 | 6,868 | 5.64 | 138,954 | 8,157 | 5.87 | |||||||||||||||||||||||||||
Home equity | 257,537 | 10,984 | 4.27 | 216,428 | 9,572 | 4.42 | 202,189 | 9,224 | 4.56 | |||||||||||||||||||||||||||
Consumer indirect | 533,589 | 27,371 | 5.13 | 444,527 | 26,549 | 5.97 | 382,977 | 25,379 | 6.63 | |||||||||||||||||||||||||||
Other consumer | 25,058 | 2,686 | 10.72 | 24,686 | 2,589 | 10.49 | 26,950 | 2,789 | 10.35 | |||||||||||||||||||||||||||
|
|
|
|
|
|
|
|
|
|
|
|
|
|
|
|
|
| |||||||||||||||||||
Total loans | 1,593,384 | 81,123 | 5.09 | 1,393,824 | 77,105 | 5.53 | 1,295,386 | 75,877 | 5.86 | |||||||||||||||||||||||||||
|
|
|
|
|
|
|
|
|
|
|
|
|
|
|
|
|
| |||||||||||||||||||
Total interest-earning assets | 2,297,140 | 99,851 | 4.35 | 2,079,733 | 97,180 | 4.67 | 1,981,176 | 98,404 | 4.97 | |||||||||||||||||||||||||||
|
|
|
|
|
|
|
|
|
|
|
| |||||||||||||||||||||||||
Less: Allowance for loan losses | 24,305 | 21,567 | 20,883 | |||||||||||||||||||||||||||||||||
Other noninterest-earning assets | 246,423 | 218,983 | 206,303 | |||||||||||||||||||||||||||||||||
|
|
|
|
|
| |||||||||||||||||||||||||||||||
Total assets | $ | 2,519,258 | $ | 2,277,149 | $ | 2,166,596 | ||||||||||||||||||||||||||||||
|
|
|
|
|
| |||||||||||||||||||||||||||||||
Interest-bearing liabilities: | ||||||||||||||||||||||||||||||||||||
Deposits: | ||||||||||||||||||||||||||||||||||||
Interest-bearing demand | $ | 423,096 | 598 | 0.14 | $ | 383,122 | 614 | 0.16 | $ | 382,517 | 705 | 0.18 | ||||||||||||||||||||||||
Savings and money market | 586,329 | 998 | 0.17 | 451,030 | 1,056 | 0.23 | 414,953 | 1,133 | 0.27 | |||||||||||||||||||||||||||
Certificates of deposit | 693,353 | 6,866 | 0.99 | 712,411 | 9,764 | 1.37 | 726,330 | 13,015 | 1.79 | |||||||||||||||||||||||||||
|
|
|
|
|
|
|
|
|
|
|
|
|
|
|
|
|
| |||||||||||||||||||
Total interest-bearing deposits | 1,702,778 | 8,462 | 0.50 | 1,546,563 | 11,434 | 0.74 | 1,523,800 | 14,853 | 0.97 | |||||||||||||||||||||||||||
Short-term borrowings | 121,735 | 589 | 0.48 | 99,122 | 500 | 0.50 | 49,104 | 365 | 0.74 | |||||||||||||||||||||||||||
Long-term borrowings | — | — | — | 15,905 | 1,321 | 8.31 | 37,043 | 2,502 | 6.75 | |||||||||||||||||||||||||||
|
|
|
|
|
|
|
|
|
|
|
|
|
|
|
|
|
| |||||||||||||||||||
Total borrowings | 121,735 | 589 | 0.48 | 115,027 | 1,821 | 1.58 | 86,147 | 2,867 | 3.33 | |||||||||||||||||||||||||||
|
|
|
|
|
|
|
|
|
|
|
|
|
|
|
|
|
| |||||||||||||||||||
Total interest-bearing liabilities | 1,824,513 | 9,051 | 0.50 | 1,661,590 | 13,255 | 0.80 | 1,609,947 | 17,720 | 1.10 | |||||||||||||||||||||||||||
|
|
|
|
|
|
|
|
|
|
|
| |||||||||||||||||||||||||
Noninterest-bearing deposits | 430,240 | 368,268 | 329,853 | |||||||||||||||||||||||||||||||||
Other liabilities | 16,506 | 15,041 | 15,485 | |||||||||||||||||||||||||||||||||
Shareholders’ equity | 247,999 | 232,250 | 211,311 | |||||||||||||||||||||||||||||||||
|
|
|
|
|
| |||||||||||||||||||||||||||||||
Total liabilities and shareholders’ equity | $ | 2,519,258 | $ | 2,277,149 | $ | 2,166,596 | ||||||||||||||||||||||||||||||
|
|
|
|
|
| |||||||||||||||||||||||||||||||
Net interest income (tax-equivalent) | $ | 90,800 | $ | 83,925 | $ | 80,684 | ||||||||||||||||||||||||||||||
|
|
|
|
|
| |||||||||||||||||||||||||||||||
Interest rate spread | 3.85 | % | 3.87 | % | 3.87 | % | ||||||||||||||||||||||||||||||
|
|
|
|
|
| |||||||||||||||||||||||||||||||
Net earning assets | $ | 472,627 | $ | 418,143 | $ | 371,229 | ||||||||||||||||||||||||||||||
|
|
|
|
|
| |||||||||||||||||||||||||||||||
Net interest margin (tax-equivalent) | 3.95 | % | 4.04 | % | 4.07 | % | ||||||||||||||||||||||||||||||
|
|
|
|
|
| |||||||||||||||||||||||||||||||
Ratio of average interest-earning assets to average interest-bearing liabilities | 125.90 | % | 125.17 | % | 123.06 | % | ||||||||||||||||||||||||||||||
|
|
|
|
|
| |||||||||||||||||||||||||||||||
- 3536 -
Rate/Volume Analysis
The following table presents, on a tax equivalenttax-equivalent basis, the relative contribution of changes in volumes and changes in rates to changes in net interest income for the periods indicated. The change in interest not solely due to changes in volume or rate has been allocated in proportion to the absolute dollar amounts of the change in each (in thousands):
| Change from 2010 to 2009 | Change from 2009 to 2008 | |||||||||||||||||||||||
| Increase (decrease) in: | Volume | Rate | Total | Volume | Rate | Total | ||||||||||||||||||
Interest income: | ||||||||||||||||||||||||
| Federal funds sold and other interest-earning deposits | $ | (65 | ) | $ | (7 | ) | $ | (72 | ) | $ | 179 | $ | (716 | ) | $ | (537 | ) | |||||||
| Investment securities: | ||||||||||||||||||||||||
| Taxable | 3,807 | (3,172 | ) | 635 | (1,412 | ) | (4,004 | ) | (5,416 | ) | ||||||||||||||
| Tax-exempt | (2,300 | ) | (204 | ) | (2,504 | ) | (4,102 | ) | (1,043 | ) | (5,145 | ) | ||||||||||||
| Total investment securities | 1,507 | (3,376 | ) | (1,869 | ) | (5,514 | ) | (5,047 | ) | (10,561 | ) | |||||||||||||
| Loans: | ||||||||||||||||||||||||
| Commercial business | 92 | 235 | 327 | 2,015 | (2,879 | ) | (864 | ) | ||||||||||||||||
| Commercial mortgage | 1,916 | (836 | ) | 1,080 | 2,097 | (1,665 | ) | 432 | ||||||||||||||||
| Residential mortgage | (1,302 | ) | (242 | ) | (1,544 | ) | (673 | ) | (387 | ) | (1,060 | ) | ||||||||||||
| Home equity | 382 | (279 | ) | 103 | 256 | (2,176 | ) | (1,920 | ) | |||||||||||||||
| Consumer indirect | 4,665 | (1,124 | ) | 3,541 | 8,930 | (190 | ) | 8,740 | ||||||||||||||||
| Other consumer | (396 | ) | 60 | (336 | ) | (414 | ) | 118 | (296 | ) | ||||||||||||||
| Total loans | 5,357 | (2,186 | ) | 3,171 | 12,211 | (7,179 | ) | 5,032 | ||||||||||||||||
Total interest income | 6,799 | (5,569 | ) | 1,230 | 6,876 | (12,942 | ) | (6,066 | ) | |||||||||||||||
Interest expense: | ||||||||||||||||||||||||
| Deposits: | ||||||||||||||||||||||||
| Interest-bearing demand | 34 | (101 | ) | (67 | ) | 162 | (2,636 | ) | (2,474 | ) | ||||||||||||||
| Savings and money market | 86 | (43 | ) | 43 | 135 | (2,818 | ) | (2,683 | ) | |||||||||||||||
| Certificates of deposit | 982 | (5,195 | ) | (4,213 | ) | 2,257 | (7,359 | ) | (5,102 | ) | ||||||||||||||
| Total interest-bearing deposits | 1,102 | (5,339 | ) | (4,237 | ) | 2,554 | (12,813 | ) | (10,259 | ) | ||||||||||||||
| Short-term borrowings | 41 | 54 | 95 | 85 | (536 | ) | (451 | ) | ||||||||||||||||
| Long-term borrowings | (644 | ) | 289 | (355 | ) | (426 | ) | (264 | ) | (690 | ) | |||||||||||||
| Total borrowings | (603 | ) | 343 | (260 | ) | (341 | ) | (800 | ) | (1,141 | ) | |||||||||||||
Total interest expense | 499 | (4,996 | ) | (4,497 | ) | 2,213 | (13,613 | ) | (11,400 | ) | ||||||||||||||
Net interest income | $ | 6,300 | $ | (573 | ) | $ | 5,727 | $ | 4,663 | $ | 671 | $ | 5,334 | |||||||||||
| Change from 2012 to 2011 | Change from 2011 to 2010 | |||||||||||||||||||||||
| Increase (decrease) in: | Volume | Rate | Total | Volume | Rate | Total | ||||||||||||||||||
Interest income: | ||||||||||||||||||||||||
Federal funds sold and other interest-earning deposits | $ | — | $ | — | $ | — | $ | (5 | ) | $ | (5 | ) | $ | (10 | ) | |||||||||
Investment securities: | ||||||||||||||||||||||||
Taxable | (487 | ) | (1,496 | ) | (1,983 | ) | (772 | ) | (2,144 | ) | (2,916 | ) | ||||||||||||
Tax-exempt | 1,422 | (786 | ) | 636 | 1,418 | (944 | ) | 474 | ||||||||||||||||
|
|
|
|
|
|
|
|
|
|
|
| |||||||||||||
Total investment securities | 935 | (2,282 | ) | (1,347 | ) | 646 | (3,088 | ) | (2,442 | ) | ||||||||||||||
Loans: | ||||||||||||||||||||||||
Commercial business | 1,239 | (287 | ) | 952 | 452 | (80 | ) | 372 | ||||||||||||||||
Commercial mortgage | 2,041 | (1,075 | ) | 966 | 1,905 | (1,078 | ) | 827 | ||||||||||||||||
Residential mortgage | 308 | (539 | ) | (231 | ) | (980 | ) | (309 | ) | (1,289 | ) | |||||||||||||
Home equity | 1,763 | (351 | ) | 1,412 | 636 | (288 | ) | 348 | ||||||||||||||||
Consumer indirect | 4,879 | (4,057 | ) | 822 | 3,829 | (2,659 | ) | 1,170 | ||||||||||||||||
Other consumer | 39 | 58 | 97 | (237 | ) | 37 | (200 | ) | ||||||||||||||||
|
|
|
|
|
|
|
|
|
|
|
| |||||||||||||
Total loans | 10,269 | (6,251 | ) | 4,018 | 5,605 | (4,377 | ) | 1,228 | ||||||||||||||||
|
|
|
|
|
|
|
|
|
|
|
| |||||||||||||
Total interest income | 11,204 | (8,533 | ) | 2,671 | 6,246 | (7,470 | ) | (1,224 | ) | |||||||||||||||
|
|
|
|
|
|
|
|
|
|
|
| |||||||||||||
Interest expense: | ||||||||||||||||||||||||
Deposits: | ||||||||||||||||||||||||
Interest-bearing demand | 60 | (76 | ) | (16 | ) | 1 | (92 | ) | (91 | ) | ||||||||||||||
Savings and money market | 271 | (329 | ) | (58 | ) | 93 | (170 | ) | (77 | ) | ||||||||||||||
Certificates of deposit | (255 | ) | (2,643 | ) | (2,898 | ) | (245 | ) | (3,006 | ) | (3,251 | ) | ||||||||||||
|
|
|
|
|
|
|
|
|
|
|
| |||||||||||||
Total interest-bearing deposits | 76 | (3,048 | ) | (2,972 | ) | (151 | ) | (3,268 | ) | (3,419 | ) | |||||||||||||
Short-term borrowings | 110 | (21 | ) | 89 | 281 | (146 | ) | 135 | ||||||||||||||||
Long-term borrowings | (660 | ) | (661 | ) | (1,321 | ) | (1,662 | ) | 481 | (1,181 | ) | |||||||||||||
|
|
|
|
|
|
|
|
|
|
|
| |||||||||||||
Total borrowings | (550 | ) | (682 | ) | (1,232 | ) | (1,381 | ) | 335 | (1,046 | ) | |||||||||||||
|
|
|
|
|
|
|
|
|
|
|
| |||||||||||||
Total interest expense | (474 | ) | (3,730 | ) | (4,204 | ) | (1,532 | ) | (2,933 | ) | (4,465 | ) | ||||||||||||
|
|
|
|
|
|
|
|
|
|
|
| |||||||||||||
Net interest income | $ | 11,678 | $ | (4,803 | ) | $ | 6,875 | $ | 7,778 | $ | (4,537 | ) | $ | 3,241 | ||||||||||
|
|
|
|
|
|
|
|
|
|
|
| |||||||||||||
- 36 -
The provision for loan losses is based upon credit loss experience, growth or contraction of specific segments of the loan portfolio, and the estimate of losses inherent in the current loan portfolio. The provision for loan losses was $6.7$7.1 million for the year ended December 31, 20102012 compared with $7.7$7.8 million for 2009.2011. See the “Allowance for Loan Losses” section of this Management’s Discussion and Analysis for further discussion.
- 37 -
MANAGEMENT’S DISCUSSION AND ANALYSIS
Noninterest Income (Loss)
The following table summarizes our noninterest income (loss) for the years ended December 31 (in thousands):
| 2010 | 2009 | 2008 | ||||||||||
| Service charges on deposits | $ | 9,585 | $ | 10,065 | $ | 10,497 | ||||||
| ATM and debit card | 3,995 | 3,610 | 3,313 | |||||||||
| Broker-dealer fees and commissions | 1,283 | 1,022 | 1,458 | |||||||||
| Company owned life insurance | 1,107 | 1,096 | 563 | |||||||||
| Loan servicing | 1,124 | 1,308 | 664 | |||||||||
| Net gain on sale of loans held for sale | 650 | 699 | 339 | |||||||||
| Net gain on disposal of investment securities | 169 | 3,429 | 288 | |||||||||
| Impairment charges on investment securities | (594 | ) | (4,666 | ) | (68,215 | ) | ||||||
| Net (loss) gain on sale and disposal of other assets | (203 | ) | 180 | 305 | ||||||||
| Other | 2,338 | 2,052 | 2,010 | |||||||||
| Total noninterest income (loss) | $ | 19,454 | $ | 18,795 | $ | (48,778 | ) | |||||
| 2012 | 2011 | 2010 | ||||||||||
Service charges on deposits | $ | 8,627 | $ | 8,679 | $ | 9,585 | ||||||
ATM and debit card | 4,716 | 4,359 | 3,995 | |||||||||
Broker-dealer fees and commissions | 2,104 | 1,829 | 1,283 | |||||||||
Company owned life insurance | 1,751 | 1,424 | 1,107 | |||||||||
Loan servicing | 617 | 835 | 1,124 | |||||||||
Net gain on sale of loans held for sale | 1,421 | 880 | 650 | |||||||||
Net gain on disposal of investment securities | 2,651 | 3,003 | 169 | |||||||||
Impairment charges on investment securities | (91 | ) | (18 | ) | (594 | ) | ||||||
Net (loss) gain on sale and disposal of other assets | (381 | ) | 67 | (203 | ) | |||||||
Other | 3,362 | 2,867 | 2,338 | |||||||||
|
|
|
|
|
| |||||||
Total noninterest income | $ | 24,777 | $ | 23,925 | $ | 19,454 | ||||||
|
|
|
|
|
| |||||||
The components of noninterest income fluctuated as discussed below.
Service charges on deposits were $9.6 milliondecreased slightly during 2012 compared to 2011. An increase in 2010, which was $480 thousand or 5% lower than 2009. The decrease was primarily attributable to lower nonsufficient funds fees in 2010, which were down $407 thousand to $7.9 million. In November 2009, the FRB issued a final rule that, effective July 1, 2010, prohibits financial institutions from charging consumers fees for paying overdrafts on automated teller machine and one-time debit card transactions, unless a consumer consents, or opts in, to the overdraft service for those types of transactions, commonly referred to as “Reg.-E”. Consumers must be provided a notice that explains the financial institution’s overdraft services, including the fees associated with the service, and the consumer’s choices. We implemented the provisions of Reg.-E in the third quarter of 2010 and the number of customers that have chosen to opt-in has exceeded our original expectations; howevercustomer accounts, including those added from the extentbranch acquisitions in June and August of the adverse impacts of Reg.-E on our future2012, helped offset decreases in service charge revenue is uncertain.
ATM and debit card income was $4.0$4.7 million for 2010,2012, an increase of $385$357 thousand or 11%8%, compared to 2009, due to2011. The increased popularity of electronic banking and transaction processing has resulted in higher interchange fees resulting from an increase in the number of cardholdersATM and an increase in customer transactions.
Broker-dealer fees and commissions were up $261$275 thousand or 26%15%, compared to 2009.2011. Broker-dealer fees and commissions fluctuate mainly due to sales volume, which increasedcontinued to increase during 20102012 as a result of improving market and economic conditions.
During the third quarter of 2011 we purchased an additional $18.0 million of company owned life insurance. The increased amount of insurance was largely responsible for the $327 thousand increase in company owned life insurance income for 2012.
Loan servicing income represents fees earned for servicing mortgage and indirect auto loans sold to third parties, net of amortization expense and impairment losses, if any, associated with capitalized mortgageloan servicing assets. Loan servicing income decreased $184was down $218 thousand or 26% for the year ended December 31, 20102012 compared to 2009, mainly2011. Loan servicing income decreased as a result of more rapid amortization of servicing rights due to loans paying off, prior to maturity and lower fees collected due to a decrease in the sold and serviced portfolio.
Net gain on loans held for sale was $1.4 million in 2012, an increase of $541 thousand in net losses onor 61%, compared to 2011, mainly due to increased origination volume related primarily to refinancing activity, a result of low interest rates.
Net gains from the sales of investment securities duringwere $2.7 million for the year ended December 31, 2010 as2012, compared to $1.2$3.0 million for the year ended December 31, 2011. During 2012, we recognized gains totaling $2.6 million from the sale of net losses duringfive pooled trust-preferred securities. Net gains for 2011 included $2.3 million from the same period in 2009.sale of four pooled trust-preferred securities and $730 thousand from the sale of eight mortgage-backed securities. The investment security net losses for 2010 resulted from other-than-temporary impairment chargesamount and timing of $594 thousand, partly offset by $169 thousandour sale of investments securities is dependent on a number of factors, including our prudent efforts to realize gains while managing duration, premium and credit risk.
Due to their proximity to our existing locations, we consolidated four branches as part of the branch acquisitions. The majority of the loss on the disposal of securities. The 2010 OTTI charges primarily relateother assets for 2012 was due to pooled trust preferred securitieswrite-off of leasehold improvements and other fixed assets for these branches that were designated as impairedclosed.
Other noninterest income increased $495 thousand or 17% for the year ended December 31, 2012, compared to 2011. Income from our investment in several limited partnerships and dividends from FHLB stock comprised the first quarter due to credit quality. The $1.2 millionmajority of investment security losses for 2009 are a result of $4.7 million of other-than-temporary impairment charges, partly offset by $3.4 million of gains on the sale of securities.
- 3738 -
Noninterest Expense
The following table summarizes our noninterest expense for the years ended December 31 (in thousands):
| 2010 | 2009 | 2008 | ||||||||||
| Salaries and employee benefits | $ | 32,811 | $ | 33,634 | $ | 31,437 | ||||||
| Occupancy and equipment | 10,818 | 11,062 | 10,502 | |||||||||
| FDIC assessments | 2,507 | 3,651 | 674 | |||||||||
| Computer and data processing | 2,487 | 2,340 | 2,433 | |||||||||
| Professional services | 2,197 | 2,524 | 2,141 | |||||||||
| Supplies and postage | 1,772 | 1,846 | 1,800 | |||||||||
| Advertising and promotions | 1,121 | 949 | 1,453 | |||||||||
| Other | 7,204 | 6,771 | 7,021 | |||||||||
| Total noninterest expense | $ | 60,917 | $ | 62,777 | $ | 57,461 | ||||||
| 2012 | 2011 | 2010 | ||||||||||
Salaries and employee benefits | $ | 40,127 | $ | 35,743 | $ | 32,844 | ||||||
Occupancy and equipment | 11,419 | 10,868 | 10,818 | |||||||||
Professional services | 4,133 | 2,617 | 2,197 | |||||||||
Computer and data processing | 3,271 | 2,437 | 2,487 | |||||||||
Supplies and postage | 2,497 | 1,778 | 1,772 | |||||||||
FDIC assessments | 1,300 | 1,513 | 2,507 | |||||||||
Advertising and promotions | 929 | 1,259 | 1,121 | |||||||||
Loss on extinguishment of debt | — | 1,083 | — | |||||||||
Other | 7,721 | 6,496 | 7,171 | |||||||||
|
|
|
|
|
| |||||||
Total noninterest expense | $ | 71,397 | $ | 63,794 | $ | 60,917 | ||||||
|
|
|
|
|
| |||||||
The components of noninterest expense fluctuated as discussed below.
Salaries and employee benefits (which includes salary-related expenses and fringe benefit expenses) was $32.8$40.1 million for 2010, down $8232012, up $4.4 million or 12% from 2011. As discussed earlier, salaries and employee benefits for 2012 included pre-tax costs of approximately $2.6 million that were incurred in association with the retirement of our former CEO. After adjusting for these expenses, the increase in salaries and employee benefits for 2012 when compared to the prior year is attributable to higher pension costs along with increased staffing levels. Full time equivalent employees increased by 9% to 628 at December 31, 2012 from 575 at December 31, 2011, primarily due to the branch acquisitions.
Occupancy and equipment increased by $551 thousand or 2%5% when comparing 2012 to 2011. The increase was primarily related to the growth in the branch network related to the branch acquisitions.
Professional services expense of $4.1 million in 2012 increased $1.5 million or 58% from 2009. Average full-time equivalent employees (“FTEs”) were 577 for 2010, down 2% from 586 for 2009. Salary-related2011. Professional fees increased primarily due to legal expenses were relatively unchanged at $25.3related to the branch acquisitions. The management transition described earlier also contributed to the increase in professional fees.
Computer and data processing and supplies and postage expense increased, collectively, by $1.6 million for 2010 and $25.2 million for 2009. Fringe benefitwhen comparing 2012 to 2011. The year-over-year increase was due to expenses decreased $876 thousand or 10%, primarily attributablerelated to lower pension costs.
FDIC assessments comprised mostly of deposit insurance paid to the FDIC, decreased $1.1 million$213 thousand for the year ended December 31, 2010, due2012, compared to 2011, primarily toa result of changes implemented by the one-time specialFDIC in the method of calculating assessment of $923 thousand incurredrates which became effective in the second quarter of 2009. FDIC assessment rates have also declined as2011.
Advertising and promotions costs were $330 thousand or 26% lower in 2012 compared to 2011 due to the timing of marketing campaigns and promotions, coupled with cost management strategies.
We redeemed all of our 10.20% junior subordinated debentures during the third quarter of 2011. As a result of our improved financial ratios, upon which the assessment rate is based
Other noninterest expense increased $433 thousand$1.2 million or 6%19% during 20102012 compared to 2009. This increase was2011. The increases in other noninterest expenses were primarily duerelated to a loss of approximately $1.0 million relating to irregular instances of fraudulent debit card activity that we recorded in the fourth quarter of 2010. We have taken actions to limit our exposure to such fraudulent activity and we are reviewing the remedies that may by available. Any recoveries or other remedies received will be separate from the $1.0 million loss recorded in 2010 and will be recorded if and when received.
The efficiency ratio for the year ended December 31, 2010 improved to 60.36%2012 was 62.87% compared with 65.52%60.55% for 2009.2011. The higher efficiency ratio is a supplemental financial measure utilized in management’s internal evaluationsattributable to the additional expenses related to the branch acquisitions and is not defined under generally accepted accounting principles.retirement of our former CEO, as previously discussed. The efficiency ratio is calculated by dividing total noninterest expense, excluding other real estate expense and amortization of intangible assets, by net revenue, defined as the sum of tax-equivalent net interest income and noninterest income before net gains and impairment charges on investment securities. Taxes are not part of this calculation. An increase in the efficiency ratio indicates that more resources are being utilized to generate the same volume of income, while a decrease would indicate a more efficient allocation of resources.
Income Taxes
We recognized income tax expense of $9.4$11.3 million for 20102012 compared to $6.1$11.4 million for 2009.2011. The lower tax provision was primarily attributable to a decrease in our effective tax rate to 32.6% for 2012 compared to 33.4% for 2011. The lower effective tax rate in 2012 was a result of the greater impact of tax-exempt income on lower taxable income. Effective tax rates are impacted by items of income and expense that are not subject to federal or state taxation. Our effective tax rates reflect the impact of these items, which include, but are not limited to, interest income from tax-exempt securities and earnings on company owned life insurance.
- 39 -
MANAGEMENT’S DISCUSSION AND ANALYSIS
RESULTS OF OPERATIONS FOR THE YEARS ENDED
DECEMBER 31, 2011 AND DECEMBER 31, 2010
Net Interest Income and Net Interest Margin
Net interest income in the consolidated statements of income (which excludes the taxable equivalent adjustment) was $81.9 million in 2011, compared to $78.8 million in 2010. The taxable equivalent adjustments (the adjustments to bring tax-exempt interest to a level that would yield the same after-tax income had that income been subject to a taxation using a tax rate of 35%) of $2.1 million and $1.9 million for 2011 and 2010, respectively, resulted in fully taxable equivalent net interest income of $83.9 million in 2011 and $80.7 million in 2010.
Taxable equivalent net interest income of $83.9 million for 2011 was $3.2 million or 4% higher than 2010. The impact of a decline in average yields on our assets was diminished by a 5% increase in interest-earning assets. The average balance of loans rose $98.4 million or 8% to $1.394 billion, reflecting growth in the commercial and consumer indirect loan portfolios, and the average balance of interest-earning assets rose $98.6 million to $2.080 billion.
The increase in taxable equivalent net interest income was a function of a favorable volume variance (as balance sheet changes in both volume and mix increased taxable equivalent net interest income by $7.8 million), partially offset by an unfavorable rate variance (decreasing taxable equivalent net interest income by $4.5 million). The change in mix and volume of earning assets increased taxable equivalent interest income taxby $6.3 million, while the change in volume and composition of interest-bearing liabilities decreased interest expense by $1.5 million, for a net favorable volume impact of $7.8 million on taxable equivalent net interest income. Rate changes on earning assets reduced interest income by $7.4 million, while changes in rates on interest-bearing liabilities lowered interest expense by $2.9 million, for a net unfavorable rate impact of $4.5 million.
The net interest margin for 2011 was 4.04% compared to 4.07% in 2010. The slight decrease in net interest margin was attributable to a 3 basis point lower contribution from net free funds (primarily attributable to lower rates on interest-bearing liabilities reducing the value of noninterest-bearing deposits and other net free funds). The interest rate spread remained unchanged from the year ended December 31, 2010 at 3.87%, as a 30 basis point decrease in the yield on earning assets offset the 30 basis point decrease in the cost of interest-bearing liabilities.
The Federal Reserve left the Federal funds rate unchanged at 0.25% during 2011 and 2010.
For 2011, the yield on average earning assets of 4.67% was 30 basis points lower than 2010. Loan yields decreased 33 basis points to 5.53%. Commercial mortgage and consumer indirect loans in particular, down 31 and 66 basis points, respectively, experienced lower yields given the competitive pricing pressures and re-pricing of loans in a low interest rate environment. The yield on investment securities dropped 38 basis points to 2.93%, also impacted by the lower interest rate environment and prepayments of mortgage-related investment securities. Overall, earning asset rate changes reduced interest income by $7.5 million.
The cost of average interest-bearing liabilities of 0.80% in 2011 was 30 basis points lower than 2010. The average cost of interest-bearing deposits was 0.74% in 2011, 23 basis points lower than 2010, reflecting the low-rate environment, mitigated by a focus on product pricing to retain balances. The cost of borrowings decreased 175 basis points to 1.58% for 2011, primarily a result of the redemption of the 10.20% junior subordinated debentures. The interest-bearing liability rate changes reduced interest expense by $2.9 million.
Average interest-earning assets of $2.080 billion in 2011 were $98.6 million or 5% higher than 2010. Average investment securities increased $5.0 million while average loans increased $98.4 million or 8%. Commercial loans increased $42.1 million and consumer loans increased $73.5 million, offset by a $17.2 million decrease in residential mortgage loans.
Average interest-bearing liabilities of $1.662 billion in 2011 were up $51.6 million or 3% versus 2010. On average, interest-bearing deposits grew $22.8 million, while average noninterest-bearing demand deposits (a principal component of net free funds) increased by $38.4 million. Average borrowings increased $28.9 million, representing a $50.0 million increase and $21.1 million decrease in short-term and long-term borrowings, respectively.
Provision for Loan Losses
The provision for loan losses was $7.8 million for the year ended December 31, 2011 compared with $6.7 million for 2010.
- 40 -
MANAGEMENT’S DISCUSSION AND ANALYSIS
Noninterest Income
Service charges on deposits were $8.7 million in 2011, which was $906 thousand or 9% lower than 2010. The decrease was primarily due to changes in customer behavior and regulatory changes that included requirements for customers to opt-in for overdraft coverage for certain types of electronic banking activities.
ATM and debit card income was $4.4 million for 2011, an increase of $364 thousand or 9%, compared to 2010. The increased popularity of electronic banking and transaction processing has resulted in higher ATM and debit card point-of-sale usage income.
Broker-dealer fees and commissions were up $546 thousand or 43%, compared to 2010, as a $10.1result of improving market and economic conditions and our renewed focus on this line of business.
Company owned life insurance income was up $317 thousand or 29% for the year ended December 31, 2011 compared to the same period in 2010. The increase was the result of an additional $18.0 million investment in company owned life insurance during the third quarter of 2011.
Loan servicing income was down $289 thousand or 26% for the year ended December 31, 2011 compared to 2010. Loan servicing income decreased as a result of more rapid amortization of servicing rights due to loans paying off, lower fees collected due to a decrease in the sold and serviced portfolio and write-downs on capitalized mortgage servicing assets.
Net gain on loans held for sale was $880 thousand in 2011, an increase of $230 thousand or 35%, compared to 2010, mainly due to the $153 thousand gain relating to the servicing retained sale of $13.0 million of indirect auto loans during the third quarter of 2011.
Net gains from the sales of investment securities were $3.0 million for the year ended December 31, 2011, compared to $169 thousand in 2010. Net gains from the sales of investment securities in 2011 included net gains of $2.3 million from the sale of four pooled trust-preferred securities that had been written down in prior periods and included in non-performing assets. Net gains of $730 thousand from the sale of eight mortgage-backed securities were also recognized during 2011.
Other noninterest income increased $529 thousand or 23% for the year ended December 31, 2011, compared to 2010. Other noninterest income for 2011 includes $152 thousand related to insurance proceeds received for losses relating to an irregular instance of fraudulent debit card activity recorded in the fourth quarter of 2010. Merchant services fees paid by customers for account management and electronic processing of transactions and income from our capital investment in several limited partnerships also contributed to the 2011 increases.
Noninterest Expense
Salaries and employee benefits (which includes salary-related expenses and fringe benefit expenses) was $35.7 million for 2011, up $2.9 million or 9% from 2010. Average full-time equivalent employees (“FTEs”) were 576 for 2011, about the same as 577 for 2010. Salary-related expenses increased $2.0 million for the year ended December 31, 2011, compared to 2010, reflecting an increase in estimated incentive compensation, which was previously limited under the TARP Capital Purchase Program. Fringe benefit expenses increased $672 thousand or 9%, primarily attributable to higher medical expenses.
Professional services expense of $2.6 million in 2011 increased $420 thousand or 19% from 2010, primarily due to legal and shareholder expenses related to our common stock offering and redemption of our Series A preferred stock and 10.20% junior subordinated debentures. We also recognized a loss on extinguishment of debt of $1.1 million in connection with the redemption of the 10.20% junior subordinated debentures during 2011.
FDIC assessments decreased $1.0 million for the year ended December 31, 2011, compared to 2010, primarily a result of changes implemented by the FDIC in the method of calculating assessment rates which became effective in the second quarter of 2011.
Advertising and promotions expenses were $138 thousand or 12% higher in 2011 compared to 2010 due to increases in business development expenses and the opening of a new branch in suburban Rochester in the third quarter of 2011.
Other noninterest expense decreased $404 thousand or 6% during 2011 compared to 2010. The 2010 expense includes a loss of approximately $1.0 million relating to irregular instances of fraudulent debit card activity.
The efficiency ratio for the year ended December 31, 2011 was 60.55% compared with 60.36% for 2010.
Income Taxes
We recognized income tax expense of $11.4 million for 2011 compared to $9.4 million for 2010. The change was due in part to a $3.6 million increase in pretax income between the years. We alsoIn addition, during 2010, we recorded non-recurring tax benefits during 2010 of $1.2 million related to valuation of our deferred tax assets as a result of the NYS repeal of the experience method for determining bad debts and re-valuing at the highest Federal statutory rate of 35%. Our effective tax rates were 33.4% in 2011 and 30.5% in 2010 and 29.8% in 2009. Effective tax rates are affected by income and expense items that are not subject to Federal or state taxation. Our income tax provision reflects the impact of such items, including tax-exempt interest income from municipal securities, tax-exempt earnings on bank-owned life insurance and the effect of certain state tax credits.
2010.
- 38 -
- 39 -
- 40 -
- 41 -
ANALYSIS OF FINANCIAL CONDITION
OVERVIEW
At December 31, 2010,2012, we had total assets of $2.214$2.764 billion, an increase of 7%18% from $2.062$2.336 billion as of December 31, 2009, primarily a result of2011, largely attributable to the branch acquisitions combined with our continued core business growth in both loans and deposits. Total grossNet loans (includes loans held for sale) were $1.349$1.681 billion as of December 31, 2010,2012, up $84.7$219.5 million, or 7%15%, when compared to $1.264$1.462 billion as of December 31, 2009.2011. The increase in net loans was primarily attributed to the continued expansion of the indirect lending program, in existing and new markets and commercial business development efforts.efforts and loans acquired in the branch acquisition. At December 31, 2012, total loans included $64.5 million in loans obtained in the branch acquisitions. Non-performing assets totaled $8.9$10.1 million as of December 31, 2010, down $1.5 million2012, up $875 thousand from a year ago, due to decreases in both non-performing loans and investment securities for which we have stopped accruing interest.ago. Total deposits amounted to $1.883$2.262 billion and $1.743$1.932 billion as of December 31, 20102012 and 2009,2011, respectively. The impacts of the recent recession have had a positive impact on our deposit balances, as consumers tend to save more conservatively when consumer confidence is low. As of December 31, 2010, total2012, borrowed funds were $103.9totaled $179.8 million, compared to $106.4$150.7 million as of December 31, 2009.2011. Book value per common share was $14.48$17.15 and $13.39$15.92 as of December 31, 20102012 and 2009,2011, respectively. As of December 31, 20102012 our total shareholders’ equity was $212.1$253.9 million compared to $198.3$237.2 million a year earlier.
INVESTING ACTIVITIES
The following table summarizes the composition of the available for sale and held to maturity security portfolios (in thousands).
| Investment Securities Portfolio Composition | ||||||||||||||||||||||||
| At December 31, | ||||||||||||||||||||||||
| 2010 | 2009 | 2008 | ||||||||||||||||||||||
| Amortized | Fair | Amortized | Fair | Amortized | Fair | |||||||||||||||||||
| Cost | Value | Cost | Value | Cost | Value | |||||||||||||||||||
Securities available for sale: | ||||||||||||||||||||||||
| U.S. Government agency and government-sponsored enterprise securities | $ | 141,591 | $ | 140,784 | $ | 134,564 | $ | 134,105 | $ | 67,871 | $ | 68,173 | ||||||||||||
| State and political subdivisions | 105,622 | 105,666 | 80,812 | 83,659 | 129,572 | 131,711 | ||||||||||||||||||
| Mortgage-backed securities: | ||||||||||||||||||||||||
| Agency mortgage-backed securities | 414,502 | 417,709 | 356,044 | 356,355 | 297,278 | 303,105 | ||||||||||||||||||
| Non-Agency mortgage-backed securities | 981 | 1,572 | 5,087 | 5,160 | 42,296 | 39,447 | ||||||||||||||||||
| Asset-backed securities | 564 | 637 | 1,295 | 1,222 | 3,918 | 3,918 | ||||||||||||||||||
| Equity securities | — | — | — | — | 923 | 1,152 | ||||||||||||||||||
| Total available for sale securities | 663,260 | 666,368 | 577,802 | 580,501 | 541,858 | 547,506 | ||||||||||||||||||
Securities held to maturity: | ||||||||||||||||||||||||
| State and political subdivisions | 28,162 | 28,849 | 39,573 | 40,629 | 58,532 | 59,147 | ||||||||||||||||||
| Total investment securities | $ | 691,422 | $ | 695,217 | $ | 617,375 | $ | 621,130 | $ | 600,390 | $ | 606,653 | ||||||||||||
| Investment Securities Portfolio Composition | ||||||||||||||||||||||||
| At December 31, | ||||||||||||||||||||||||
| 2012 | 2011 | 2010 | ||||||||||||||||||||||
| Amortized | Fair | Amortized | Fair | Amortized | Fair | |||||||||||||||||||
| Cost | Value | Cost | Value | Cost | Value | |||||||||||||||||||
Securities available for sale: | ||||||||||||||||||||||||
U.S. Government agency and government-sponsored enterprise securities | $ | 128,097 | $ | 131,695 | $ | 94,947 | $ | 97,712 | $ | 141,591 | $ | 140,784 | ||||||||||||
State and political subdivisions | 188,997 | 195,210 | 119,099 | 124,424 | 105,622 | 105,666 | ||||||||||||||||||
Mortgage-backed securities: | ||||||||||||||||||||||||
Agency mortgage-backed securities | 479,913 | 494,770 | 390,375 | 401,596 | 414,502 | 417,709 | ||||||||||||||||||
Non-Agency mortgage-backed securities | 73 | 1,098 | 327 | 2,089 | 981 | 1,572 | ||||||||||||||||||
Asset-backed securities | 121 | 1,023 | 297 | 1,697 | 564 | 637 | ||||||||||||||||||
|
|
|
|
|
|
|
|
|
|
|
| |||||||||||||
Total available for sale securities | 797,201 | 823,796 | 605,045 | 627,518 | 663,260 | 666,368 | ||||||||||||||||||
Securities held to maturity: | ||||||||||||||||||||||||
State and political subdivisions | 17,905 | 18,478 | 23,297 | 23,964 | 28,162 | 28,849 | ||||||||||||||||||
|
|
|
|
|
|
|
|
|
|
|
| |||||||||||||
Total investment securities | $ | 815,106 | $ | 842,274 | $ | 628,342 | $ | 651,482 | $ | 691,422 | $ | 695,217 | ||||||||||||
|
|
|
|
|
|
|
|
|
|
|
| |||||||||||||
Our investment policy is contained within our overall Asset-Liability Management and Investment Policy. This policy dictates that investment decisions will be made based on the safety of the investment, liquidity requirements, potential returns, cash flow targets, need for collateral and desired risk parameters. In pursuing these objectives, we consider the ability of an investment to provide earnings consistent with factors of quality, maturity, marketability, pledgeable nature and risk diversification. Our Treasurer, guided by ALCO, is responsible for investment portfolio decisions within the established policies.
Impairment Assessment
We review investment securities on an ongoing basis for the presence of OTTI with formal reviews performed quarterly. Declines in the fair value of held-to-maturity and available-for-sale securities below their cost that are deemed to be other than temporary are reflected in earnings as realized losses to the extent the impairment is related to credit losses or the security is intended to be sold or will be required to be sold. The amount of the impairment related to non-credit related factors is recognized in other comprehensive income. Evaluating whether the impairment of a debt security is other than temporary involves assessing i.) the intent to sell the debt security or ii.) the likelihood of being required to sell the security before the recovery of its amortized cost basis. In determining whether the other-than-temporary impairment includes a credit loss, we use our best estimate of the present value of cash flows expected to be collected from the debt security considering factors such as: a.) the length of time and the extent to which the fair value has been less than the amortized cost basis, b.) adverse conditions specifically related to the security, an industry, or a geographic area, c.) the historical and implied volatility of the fair value of the security, d.) the payment structure of the debt security and the likelihood of the issuer being able to make payments that increase in the future, e.) failure of the issuer of the security to make scheduled interest or principal payments, f.) any changes to the rating of the security by a rating agency, and g.) recoveries or additional declines in fair value subsequent to the balance sheet date.
- 42 -
As of December 31, 2010,2012, management does not have the intent to sell any of the securities in a loss position and believes that it is not likely that it will not be required to sell any such securities before the anticipated recovery of amortized cost. The unrealized losses are largely due to increases in market interest rates over the yields available at the time the underlying securities were purchased. The fair value is expected to recover as the bonds approach their maturity date, repricing date or if market yields for such investments decline. Management does not believe any of the securities in a loss position are impaired due to reasons of credit quality. Accordingly, as of December 31, 2010,2012, management has concluded that unrealized losses on its investment securities are temporary and no further impairment loss has been realized in our consolidated statements of operations.income. The following discussion provides further details of our assessment of the securities portfolio by investment category.
| Unrealized Losses on Investment Securities | ||||||||||||||||||||||||
| At December 31, | ||||||||||||||||||||||||
| 2010 | 2009 | 2008 | ||||||||||||||||||||||
| Unrealized | % of | Unrealized | % of | Unrealized | % of | |||||||||||||||||||
| Losses | Total | Losses | Total | Losses | Total | |||||||||||||||||||
Securities available for sale: | ||||||||||||||||||||||||
| U.S. Government agency and government-sponsored enterprise securities | $ | 1,965 | 31.6 | % | $ | 545 | 19.8 | % | $ | 307 | 7.3 | % | ||||||||||||
| State and political subdivisions | 1,472 | 23.6 | 3 | 0.1 | 42 | 1.0 | ||||||||||||||||||
| Mortgage-backed securities: | ||||||||||||||||||||||||
| Agency mortgage-backed securities | 2,655 | 42.7 | 1,638 | 59.3 | 981 | 23.1 | ||||||||||||||||||
| Non-Agency mortgage-backed securities | — | — | 330 | 12.0 | 2,854 | 67.3 | ||||||||||||||||||
| Asset-backed securities | 131 | 2.1 | 244 | 8.8 | — | — | ||||||||||||||||||
| Equity securities | — | — | — | — | 52 | 1.2 | ||||||||||||||||||
| Total available for sale securities | 6,223 | 100.0 | 2,760 | 100.0 | 4,236 | 99.9 | ||||||||||||||||||
Securities held to maturity: | ||||||||||||||||||||||||
| State and political subdivisions | — | — | — | — | 4 | 0.1 | ||||||||||||||||||
| Total investment securities | $ | 6,223 | 100.0 | % | $ | 2,760 | 100.0 | % | $ | 4,240 | 100.0 | % | ||||||||||||
U.S. Government Agencies and Government Sponsored Enterprises (“GSE”).As of December 31, 2010,2012, there were 14six securities in an unrealized loss position in the U.S. Government agencies and GSE portfolio that were in anwith unrealized loss position.losses totaling $69 thousand. Of these, 7three were in an unrealized loss position for 12 months or longer and had an aggregate amortized cost of $8.9$3.0 million and unrealized losses of $54$2 thousand. Because theThe decline in fair value is attributable to changes in interest rates, and not credit quality, and because we do not have the intent to sell these securities and it is likely that we will not be required to sell the securities before their anticipated recovery, we do not consider these securities to be other-than-temporarily impaired at December 31, 2010.
State and Political Subdivisions.As of December 31, 2010,2012, the state and political subdivisions portfolio (“municipals”) portfolio totaled $133.9$213.1 million, of which $105.7$195.2 million was classified as available for sale. As of that date, $28.2$17.9 million was classified as held to maturity with a fair value of $28.8$18.5 million. As of December 31, 2010,2012, there were 9536 municipals in an unrealized loss position, all of which were available for sale. Thesesale and in an unrealized loss position for less than 12 months. Those 36 securities had an aggregate amortized cost of $39.9$8.5 million and unrealized losses of $1.5 million. There were no municipals in an unrealized loss position for 12 months or longer as of December 31, 2010. totaling $72 thousand.
Because the decline in fair value is attributable to changes in interest rates, and not credit quality, and because we do not have the intent to sell these securities and it is not likely that we will not be required to sell the securities before their anticipated recovery, we do not consider these securities to be other-than-temporarily impaired at December 31, 2010.
Agency Mortgage-backed Securities.With the exception of the non-Agency mortgage-backed securities (“non-Agency MBS”) discussed below, all of the mortgage-backed securities held by us as of December 31, 2010,2012, were issued by U.S. Government sponsored entities and agencies (“Agency MBS”), primarily GNMA.FNMA. The contractual cash flows of our Agency MBS are guaranteed by FNMA, FHLMC or GNMA. The GNMA mortgage-backed securities are backed by the full faith and credit of the U.S. Government.
As of December 31, 2010,2012, there were 36ten securities in the U.S. Government agencies and GSEAgency MBS portfolio that were in an unrealized loss position. Of these, only 4three were in an unrealized loss position for 12 months or longer and had an aggregate amortized cost of $2.3$1.2 million and unrealized losses of $11$2 thousand. Given the high credit quality inherent in Agency MBS, we do not consider any of the unrealized losses as of December 31, 2010,2012 on such MBS to be credit related or other-than-temporary. As of December 31, 2010,2012, we did not intend to sell any of Agency MBS that were in an unrealized loss position, all of which were performing in accordance with their terms.
- 43 -
Asset-backed Securities (“ABS”).As of December 31, 2010,2012, the fair value of theour ABS portfolio totaled $637 thousand$1.0 million and consisted of positions in 15six securities, the majority of which are pooled trust preferred securities (“TPS”) issued primarily by financial institutionsinsurance companies and, to a lesser extent, insurance companiesfinancial institutions located throughout the United States. As a result of some issuers defaulting and others electing to defer interest payments, we considered the TPS to be non-performing and stopped accruing interest on thethese investments during 2009.
During 2012, we recognized gains totaling $2.6 million from the sale of five TPS. The five securities had an aggregate amortized costa fair value of $166 thousand and unrealized losses of $70 thousand. We determined$1.1 million at December 31, 2010 that2011. We continue to monitor the unrealized losses inmarket for these securities and evaluate the ABS portfolio are temporary.
Other Investments.As a member of the FHLB the Bank is required to hold FHLB stock. The amount of required FHLB stock is based on the Bank’s asset size and the amount of borrowings from the FHLB. We have assessed the ultimate recoverability of our FHLB stock and believe that no impairment currently exists. Our ownership of FHLB stock, which totaled $2.5 million at December 31, 2010, is included in other assets and recorded at cost.
- 43 -
MANAGEMENT’S DISCUSSION AND ANALYSIS
LENDING ACTIVITIES
Total loans were $1.346$1.706 billion at December 31, 2010,2012, an increase $82.0of $220.9 million or 6%15% from December 31, 2009.2011. Commercial loans increased $26.9$44.9 million or 5%7% and represented 41.9%39.4% of total loans at the end of 2010, compared to 42.5% at December 31, 2009.2012. Residential mortgage loans were $129.6$133.5 million, down $14.6up $19.6 million or 10%17% and represented 9.6% of total loans compared to 11.4% at December 31, 2009, while consumer loans increased $69.8 million to represent 48.5%7.8% of total loans at December 31, 2010 and 46.1%2012, while consumer loans increased $156.4 million to represent 52.8% of total loans at December 31, 2009.2012 compared to 50.1% at December 31, 2011. The composition of our loan portfolio, excluding loans held for sale and including net unearned income and net deferred fees and costs, is summarized as follows (in thousands):
| Loan Portfolio Composition | ||||||||||||||||||||||||||||||||||||||||
| At December 31, | ||||||||||||||||||||||||||||||||||||||||
| 2010 | 2009 | 2008 | 2007 | 2006 | ||||||||||||||||||||||||||||||||||||
| Amount | Percent | Amount | Percent | Amount | Percent | Amount | Percent | Amount | Percent | |||||||||||||||||||||||||||||||
| Commercial business | $ | 211,031 | 15.7 | % | $ | 206,383 | 16.3 | % | $ | 180,100 | 16.1 | % | $ | 157,550 | 16.3 | % | $ | 130,695 | 14.1 | % | ||||||||||||||||||||
| Commercial mortgage | 352,930 | 26.2 | 330,748 | 26.2 | 285,383 | 25.5 | 272,394 | 28.3 | 275,884 | 29.8 | ||||||||||||||||||||||||||||||
| Total commercial | 563,961 | 41.9 | 537,131 | 42.5 | 465,483 | 41.6 | 429,944 | 44.6 | 406,579 | 43.9 | ||||||||||||||||||||||||||||||
| Residential mortgage | 129,580 | 9.6 | 144,215 | 11.4 | 177,683 | 15.8 | 166,863 | 17.3 | 163,244 | 17.6 | ||||||||||||||||||||||||||||||
| Home equity | 208,327 | 15.5 | 200,684 | 15.9 | 189,794 | 16.9 | 194,144 | 20.1 | 203,426 | 22.0 | ||||||||||||||||||||||||||||||
| Consumer indirect | 418,016 | 31.1 | 352,611 | 27.9 | 255,054 | 22.8 | 134,977 | 14.0 | 106,445 | 11.5 | ||||||||||||||||||||||||||||||
| Other consumer | 26,106 | 1.9 | 29,365 | 2.3 | 33,065 | 2.9 | 38,245 | 4.0 | 46,788 | 5.0 | ||||||||||||||||||||||||||||||
| Total consumer | 652,449 | 48.5 | 582,660 | 46.1 | 477,913 | 42.6 | 367,366 | 38.1 | 356,659 | 38.5 | ||||||||||||||||||||||||||||||
| Total loans | 1,345,990 | 100.0 | % | 1,264,006 | 100.0 | % | 1,121,079 | 100.0 | % | 964,173 | 100.0 | % | 926,482 | 100.0 | % | |||||||||||||||||||||||||
| Allowance for loan losses | 20,466 | 20,741 | 18,749 | 15,521 | 17,048 | |||||||||||||||||||||||||||||||||||
| Total loans, net | $ | 1,325,524 | $ | 1,243,265 | $ | 1,102,330 | $ | 948,652 | $ | 909,434 | ||||||||||||||||||||||||||||||
| Loan Portfolio Composition | ||||||||||||||||||||||||||||||||||||||||
| At December 31, | ||||||||||||||||||||||||||||||||||||||||
| 2012 | 2011 | 2010 | 2009 | 2008 | ||||||||||||||||||||||||||||||||||||
| Amount | Percent | Amount | Percent | Amount | Percent | Amount | Percent | Amount | Percent | |||||||||||||||||||||||||||||||
Commercial business | $ | 258,675 | 15.2 | % | $ | 233,836 | 15.7 | % | $ | 211,031 | 15.7 | % | $ | 206,383 | 16.3 | % | $ | 180,100 | 16.1 | % | ||||||||||||||||||||
Commercial mortgage | 413,324 | 24.2 | 393,244 | 26.5 | 352,930 | 26.2 | 330,748 | 26.2 | 285,383 | 25.5 | ||||||||||||||||||||||||||||||
|
|
|
|
|
|
|
|
|
|
|
|
|
|
|
|
|
|
|
| |||||||||||||||||||||
Total commercial | 671,999 | 39.4 | 627,080 | 42.2 | 563,961 | 41.9 | 537,131 | 42.5 | 465,483 | 41.6 | ||||||||||||||||||||||||||||||
Residential mortgage | 133,520 | 7.8 | 113,911 | 7.7 | 129,580 | 9.6 | 144,215 | 11.4 | 177,683 | 15.8 | ||||||||||||||||||||||||||||||
Home equity | 286,649 | 16.8 | 231,766 | 15.6 | 208,327 | 15.5 | 200,684 | 15.9 | 189,794 | 16.9 | ||||||||||||||||||||||||||||||
Consumer indirect | 586,794 | 34.4 | 487,713 | 32.9 | 418,016 | 31.1 | 352,611 | 27.9 | 255,054 | 22.8 | ||||||||||||||||||||||||||||||
Other consumer | 26,764 | 1.6 | 24,306 | 1.6 | 26,106 | 1.9 | 29,365 | 2.3 | 33,065 | 2.9 | ||||||||||||||||||||||||||||||
|
|
|
|
|
|
|
|
|
|
|
|
|
|
|
|
|
|
|
| |||||||||||||||||||||
Total consumer | 900,207 | 52.8 | 743,785 | 50.1 | 652,449 | 48.5 | 582,660 | 46.1 | 477,913 | 42.6 | ||||||||||||||||||||||||||||||
|
|
|
|
|
|
|
|
|
|
|
|
|
|
|
|
|
|
|
| |||||||||||||||||||||
Total loans | 1,705,726 | 100.0 | % | 1,484,776 | 100.0 | % | 1,345,990 | 100.0 | % | 1,264,006 | 100.0 | % | 1,121,079 | 100.0 | % | |||||||||||||||||||||||||
Allowance for loan losses | 24,714 | 23,260 | 20,466 | 20,741 | 18,749 | |||||||||||||||||||||||||||||||||||
|
|
|
|
|
|
|
|
|
| |||||||||||||||||||||||||||||||
Total loans, net | $ | 1,681,012 | $ | 1,461,516 | $ | 1,325,524 | $ | 1,243,265 | $ | 1,102,330 | ||||||||||||||||||||||||||||||
|
|
|
|
|
|
|
|
|
| |||||||||||||||||||||||||||||||
As of December 31, 2012, the residential mortgage portfolio consisted of $28.2 million of loans acquired with the branch acquisitions and $105.3 million of organic loans. The decrease in organic residential mortgage loans from $177.7$129.6 million to $144.2$113.9 million to $129.6$105.3 million for the periods ending December 31, 2008, 20092010, 2011 and 2010,2012, respectively, and the increase in consumer indirect loans from $255.1$418.0 million to $352.6$487.7 million to $418.0$586.8 million for the same periods reflects a strategic shift to increase our consumer indirect loan portfolio, while placing less emphasis on expanding our residential mortgage loan portfolio, coupled with our practice of selling the majority of our fixed-rate residential mortgages in the secondary market with servicing rights retained.
- 44 -
The Company participates in various lending programs in which guarantees are supplied by U.S. government agencies, such as the SBA, U.S. Department of Agriculture, Rural Economic and Community Development and Farm Service Agency, among others. As of December 31, 2012, the principal balance of such loans (included in commercial loans) was $62.5 million and the guaranteed portion amounted to $43.1 million. Most of these loans were guaranteed by the SBA.
Commercial business loans were $211.0$258.7 million at the end of 2010,2012, up $4.6$24.8 million or 2%11% since year-end 2009,2011, and comprised 15.7%15.2% of total loans outstanding at December 31, 2010 compared to 16.3% at December 31, 2009.2012. We typically originate business loans of up to $15.0 million for small to mid-sized businesses in our market area for working capital, equipment financing, inventory financing, accounts receivable financing, or other general business purposes. Loans of this type are in a diverse range of industries. Within the commercial business classification, loans to finance agricultural production totaled approximately 1% of totalcommercial business loans as of December 31, 2010.
Commercial mortgage loans totaled $352.9$413.3 million at December 31, 2010,2012, up $22.2$20.1 million or 7%5% from December 31, 2009,2011, and comprised 26.2%24.2% of total loans, unchanged from year-end 2009.compared to 26.5% at December 31, 2011. Commercial mortgage includes both owner occupied and non-owner occupied commercial real estate loans. Approximately 51%46% and 45% of the commercial mortgage portfolio at December 31, 20102012 and 2011, respectively, was owner occupied commercial real estate. The majority of our commercial real estate loans are secured by office buildings, manufacturing facilities, distribution/warehouse facilities, and retail centers, which are generally located in our local market area.
Our current lending standards for commercial real estate and real estate construction lending are determined by property type and specifically address many criteria, including: maximum loan amounts, maximum loan-to-value (“LTV”), requirements for pre-leasing and / or pre-sales, minimum debt-service coverage ratios, minimum borrower equity, and maximum loan to cost. Currently, the maximum standard for LTV is 80%85%, with lower limits established for certain higher risk types, such as raw land which has a 65% LTV maximum. Our LTV guidelines are in compliance with regulatory supervisory limits.
- 44 -
MANAGEMENT’S DISCUSSION AND ANALYSIS
Residential mortgage loans totaled $129.6$133.5 million at the end of 2010, down $14.62012, up $19.6 million or 10%17% from the prior year and comprised 9.6%7.8% of total loans outstanding at December 31, 20102012 and 11.4%7.7% at December 31, 2009.2011. Residential mortgage loans include conventional first lien home mortgages and we generally limit the maximum loan to 85% of collateral value without credit enhancement (e.g. PMI insurance). As part of management’s historical practice of originating and servicing residential mortgage loans, the majority of our fixed-rate residential mortgage loans are sold in the secondary market with servicing rights retained.
Consumer loans totaled $652.4$900.2 million at December 31, 2010,2012, up $69.8$156.4 million or 12%21% compared to 2009,2011, and represented 48.5%52.8% of the 20102012 year-end loan portfolio versus 46.1%50.1% at year-end 2009.2011. Loans in this classification include indirect consumer, home equity and other consumer installment loans. Credit risk for these types of loans is generally influenced by general economic conditions, the characteristics of individual borrowers, and the nature of the loan collateral. Risks of loss are generally on smaller average balances per loan spread over many borrowers. Once charged off, there is usually less opportunity for recovery on these smaller retail loans. Credit risk is primarily controlled by reviewing the creditworthiness of the borrowers, monitoring payment histories, and taking appropriate collateral and guaranty positions.
Consumer indirect loans amounted to $418.0$586.8 million at December 31, 20102012 up $65.4$99.1 million or 19%20% compared to 2009,2011, and represented 31.1%34.4% of the 20102012 year-end loan portfolio versus 27.9%32.9% at year-end 2009.2011. The loans are primarily for the purchase of automobiles (both new and used) and light duty trucks primarily to individuals, but also to corporations and other organizations. The loans are originated through dealerships and assigned to us with terms that typically range from 36 to 84 months. During the year ended December 31, 2010,2012, we originated $204.4$324.6 million in indirect loans with a mix of approximately 33%49% new auto and 67%51% used vehicles. This compares with $199.1$266.7 million in indirect loans with a mix of approximately 32%46% new auto and 68%54% used vehicles for the same period in 2009.2011. The increase in loans for new autos reflects changes in market conditions in 2012. We do business with over 300400 franchised auto dealers primarilylocated in Western, and Central, New York. During 2010, we continued to grow our indirect lending network by establishing relationships with dealerships inand the Capital District of New York. In the latter part of 2010, we began efforts to expand our dealer network intoYork, and Northern Pennsylvania and anticipate indirectly originating loans there in the first half of 2011.
Home equity consists of home equity lines, as well as home equity loans, some of which are first lien positions. Home equities amounted to $208.3$286.6 million at December 31, 20102012 up $7.6$54.9 million or 4%24% compared to 2009,2011, and represented 15.5%16.8% of the 20102012 year-end loan portfolio versus 15.9%15.6% at year-end 2009.2011. The increase included home equities acquired in the branch acquisitions, which totaled $26.8 million at December 31, 2012. The portfolio had a weighted average LTV at origination of approximately 52%54% and 53% at December 31, 2010.2012 and 2011, respectively. Approximately 37%69% of the loans in the home equity portfolio are secondwere first lien positions at December 31, 2010.
Our underwriting guidelines for home equity products includes a combination of borrower FICO (credit score), the LTV of the property securing the loan and evidence of the borrower having sufficient income to repay the loan. Currently, for home equity products, the maximum acceptable LTV is 90%. The average FICO score for new home equity production was 758 in 2012 compared to 755 in 2011.
Other consumer loans totaled $26.1$26.8 million at December 31, 2010, down $3.32012, up $2.5 million or 11%10% compared to 2009,2011, and represented 1.9%1.6% of the 2010 year-end loan portfolio versus 2.3% at year-end 2009.December 31, 2012 and 2011. The increase in other consumer loans is attributed to loans acquired in the branch acquisitions, which totaled $3.4 million at December 31, 2012. Other consumer consists of personal loans (collateralized and uncollateralized) and deposit account collateralized loans.
- 45 -
An active credit risk management process is used for commercial loans to further ensure that sound and consistent credit decisions are made. Credit risk is controlled by detailed underwriting procedures, comprehensive loan administration, and periodic review of borrowers’ outstanding loans and commitments. Borrower relationships are formally reviewed and graded on an ongoing basis for early identification of potential problems. Further analyses by customer, industry, and geographic location are performed to monitor trends, financial performance, and concentrations.
The loan portfolio is widely diversified by types of borrowers, industry groups, and market areas within our core footprint. Significant loan concentrations are considered to exist for a financial institution when there are amounts loaned to numerous borrowers engaged in similar activities that would cause them to be similarly impacted by economic or other conditions. At December 31, 2010,2012, no significant concentrations, as defined above, existed in the Company’sour portfolio in excess of 10% of total loans.
- 45 -
MANAGEMENT’S DISCUSSION AND ANALYSIS
Loans Held for Sale and MortgageLoan Servicing Rights.Loans held for sale (not included in the loan portfolio composition table) were entirely comprised of residential real estate mortgages and totaled $3.1$1.5 million and $421 thousand$2.4 million as of December 31, 20102012 and 2009, respectively, all of which were residential real estate loans.
We sell certain qualifying newly originated andor refinanced residential real estate mortgages on the secondary market. The sold and serviced residentialResidential real estate loan portfolio decreasedmortgages serviced for others, which are not included in the consolidated statements of financial condition, amounted to $328.9$273.3 million and $297.8 million as of December 31, 20102012 and 2011, respectively.
During 2011, we sold $13.0 million of indirect auto loans, which were reclassified from $349.8 millionportfolio to loans held for sale during the second quarter of 2011. The loan servicing asset for the sold and serviced indirect auto loans, included in other assets in the consolidated statements of financial condition, was $250 thousand and $574 thousand as of December 31, 2009. The decrease in the sold2012 and serviced portfolio resulted from a decrease in residential loan origination and refinancing volumes associated with the interest rate environment during 2010 compared to 2009.
Allowance for Loan Losses
The following table summarizes the activity in the allowance for loan losses (in thousands).
| Loan Loss Analysis | ||||||||||||||||||||
| Year Ended December 31, | ||||||||||||||||||||
| 2010 | 2009 | 2008 | 2007 | 2006 | ||||||||||||||||
| Allowance for loan losses, beginning of year | $ | 20,741 | $ | 18,749 | $ | 15,521 | $ | 17,048 | $ | 20,231 | ||||||||||
| Charge-offs: | ||||||||||||||||||||
| Commercial business | 3,426 | 2,360 | 720 | 618 | 1,472 | |||||||||||||||
| Commercial mortgage | 263 | 355 | 1,192 | 439 | 603 | |||||||||||||||
| Residential mortgage | 290 | 225 | 320 | 319 | 278 | |||||||||||||||
| Home equity | 259 | 195 | 110 | 255 | 108 | |||||||||||||||
| Consumer indirect | 4,669 | 3,637 | 2,011 | 988 | 532 | |||||||||||||||
| Other consumer | 909 | 1,058 | 1,106 | 1,276 | 1,206 | |||||||||||||||
| Total charge-offs | 9,816 | 7,830 | 5,459 | 3,895 | 4,199 | |||||||||||||||
| Recoveries: | ||||||||||||||||||||
| Commercial business | 326 | 428 | 684 | 1,140 | 1,777 | |||||||||||||||
| Commercial mortgage | 501 | 150 | 315 | 216 | 161 | |||||||||||||||
| Residential mortgage | 21 | 12 | 26 | 50 | 71 | |||||||||||||||
| Home equity | 36 | 20 | 19 | 12 | 22 | |||||||||||||||
| Consumer indirect | 1,485 | 1,030 | 548 | 235 | 224 | |||||||||||||||
| Other consumer | 485 | 480 | 544 | 599 | 603 | |||||||||||||||
| Total recoveries | 2,854 | 2,120 | 2,136 | 2,252 | 2,858 | |||||||||||||||
| Net charge-offs | 6,962 | 5,710 | 3,323 | 1,643 | 1,341 | |||||||||||||||
| Provision (credit) for loan losses | 6,687 | 7,702 | 6,551 | 116 | (1,842 | ) | ||||||||||||||
| Allowance for loan losses, end of year | $ | 20,466 | $ | 20,741 | $ | 18,749 | $ | 15,521 | $ | 17,048 | ||||||||||
| Net charge-offs to average loans | 0.54 | % | 0.47 | % | 0.32 | % | 0.18 | % | 0.14 | % | ||||||||||
| Allowance to end of period loans | 1.52 | % | 1.64 | % | 1.67 | % | 1.61 | % | 1.84 | % | ||||||||||
| Allowance to end of period non-performing loans | 270 | % | 239 | % | 229 | % | 192 | % | 108 | % | ||||||||||
| Loan Loss Analysis | ||||||||||||||||||||
| Year Ended December 31, | ||||||||||||||||||||
| 2012 | 2011 | 2010 | 2009 | 2008 | ||||||||||||||||
Allowance for loan losses, beginning of year | $ | 23,260 | $ | 20,466 | $ | 20,741 | $ | 18,749 | $ | 15,521 | ||||||||||
Charge-offs: | ||||||||||||||||||||
Commercial business | 729 | 1,346 | 3,426 | 2,360 | 720 | |||||||||||||||
Commercial mortgage | 745 | 751 | 263 | 355 | 1,192 | |||||||||||||||
Residential mortgage | 326 | 152 | 290 | 225 | 320 | |||||||||||||||
Home equity | 305 | 449 | 259 | 195 | 110 | |||||||||||||||
Consumer indirect | 6,589 | 4,713 | 4,669 | 3,637 | 2,011 | |||||||||||||||
Other consumer | 874 | 877 | 909 | 1,058 | 1,106 | |||||||||||||||
|
|
|
|
|
|
|
|
|
| |||||||||||
Total charge-offs | 9,568 | 8,288 | 9,816 | 7,830 | 5,459 | |||||||||||||||
Recoveries: | ||||||||||||||||||||
Commercial business | 336 | 401 | 326 | 428 | 684 | |||||||||||||||
Commercial mortgage | 261 | 245 | 501 | 150 | 315 | |||||||||||||||
Residential mortgage | 130 | 90 | 21 | 12 | 26 | |||||||||||||||
Home equity | 44 | 44 | 36 | 20 | 19 | |||||||||||||||
Consumer indirect | 2,769 | 2,066 | 1,485 | 1,030 | 548 | |||||||||||||||
Other consumer | 354 | 456 | 485 | 480 | 544 | |||||||||||||||
|
|
|
|
|
|
|
|
|
| |||||||||||
Total recoveries | 3,894 | 3,302 | 2,854 | 2,120 | 2,136 | |||||||||||||||
|
|
|
|
|
|
|
|
|
| |||||||||||
Net charge-offs | 5,674 | 4,986 | 6,962 | 5,710 | 3,323 | |||||||||||||||
Provision for loan losses | 7,128 | 7,780 | 6,687 | 7,702 | 6,551 | |||||||||||||||
|
|
|
|
|
|
|
|
|
| |||||||||||
Allowance for loan losses, end of year | $ | 24,714 | $ | 23,260 | $ | 20,466 | $ | 20,741 | $ | 18,749 | ||||||||||
|
|
|
|
|
|
|
|
|
| |||||||||||
Net charge-offs to average loans | 0.36 | % | 0.36 | % | 0.54 | % | 0.47 | % | 0.32 | % | ||||||||||
Allowance to end of period loans | 1.45 | % | 1.57 | % | 1.52 | % | 1.64 | % | 1.67 | % | ||||||||||
Allowance to end of period non-performing loans | 271 | % | 329 | % | 270 | % | 239 | % | 229 | % | ||||||||||
- 46 -
The following table sets forth the allocation of the allowance for loan losses by loan category as of the dates indicated. The allocation is made for analytical purposes and is not necessarily indicative of the categories in which actual losses may occur. The total allowance is available to absorb losses from any segment of the loan portfolio (in thousands).
| Allowance for Loan Losses by Loan Category | ||||||||||||||||||||||||||||||||||||||||
| At December 31, | ||||||||||||||||||||||||||||||||||||||||
| 2010 | 2009 | 2008 | 2007 | 2006 | ||||||||||||||||||||||||||||||||||||
| Percentage | Percentage | Percentage | Percentage | Percentage | ||||||||||||||||||||||||||||||||||||
| Loan | of loans by | Loan | of loans by | Loan | of loans by | Loan | of loans by | Loan | of loans by | |||||||||||||||||||||||||||||||
| Loss | category to | Loss | category to | Loss | category to | Loss | category to | Loss | category to | |||||||||||||||||||||||||||||||
| Allowance | total loans | Allowance | total loans | Allowance | total loans | Allowance | total loans | Allowance | total loans | |||||||||||||||||||||||||||||||
| Commercial business | $ | 3,712 | 15.7 | % | $ | 4,407 | 16.3 | % | $ | 3,300 | 16.1 | % | $ | 2,505 | 16.3 | % | $ | 3,294 | 14.1 | % | ||||||||||||||||||||
| Commercial mortgage | 6,431 | 26.2 | 6,638 | 26.2 | 4,635 | 25.5 | 4,640 | 28.3 | 5,494 | 29.8 | ||||||||||||||||||||||||||||||
| Residential mortgage | 1,013 | 9.6 | 1,251 | 11.4 | 2,516 | 15.8 | 1,763 | 17.3 | 1,748 | 17.6 | ||||||||||||||||||||||||||||||
| Home equity | 972 | 15.5 | 1,043 | 15.9 | 2,374 | 16.9 | 1,869 | 20.1 | 2,082 | 22.0 | ||||||||||||||||||||||||||||||
| Consumer indirect | 7,754 | 31.1 | 6,837 | 27.9 | 5,152 | 22.8 | 2,284 | 14.0 | 1,749 | 11.5 | ||||||||||||||||||||||||||||||
| Other consumer | 584 | 1.9 | 565 | 2.3 | 772 | 2.9 | 798 | 4.0 | 751 | 5.0 | ||||||||||||||||||||||||||||||
Unallocated(1) | — | — | — | — | — | — | 1,662 | — | 1,930 | — | ||||||||||||||||||||||||||||||
| Total | $ | 20,466 | 100.0 | % | $ | 20,741 | 100.0 | % | $ | 18,749 | 100.0 | % | $ | 15,521 | 100.0 | % | $ | 17,048 | 100.0 | % | ||||||||||||||||||||
| Allowance for Loan Losses by Loan Category | ||||||||||||||||||||||||||||||||||||||||
| At December 31, | ||||||||||||||||||||||||||||||||||||||||
| 2012 | 2011 | 2010 | 2009 | 2008 | ||||||||||||||||||||||||||||||||||||
| Percentage | Percentage | Percentage | Percentage | Percentage | ||||||||||||||||||||||||||||||||||||
| Loan | of loans by | Loan | of loans by | Loan | of loans by | Loan | of loans by | Loan | of loans by | |||||||||||||||||||||||||||||||
| Loss | category to | Loss | category to | Loss | category to | Loss | category to | Loss | category to | |||||||||||||||||||||||||||||||
| Allowance | total loans | Allowance | total loans | Allowance | total loans | Allowance | total loans | Allowance | total loans | |||||||||||||||||||||||||||||||
Commercial business | $ | 4,884 | 15.2 | % | $ | 4,036 | 15.7 | % | $ | 3,712 | 15.7 | % | $ | 4,407 | 16.3 | % | $ | 3,300 | 16.1 | % | ||||||||||||||||||||
Commercial mortgage | 6,581 | 24.2 | 6,418 | 26.5 | 6,431 | 26.2 | 6,638 | 26.2 | 4,635 | 25.5 | ||||||||||||||||||||||||||||||
Residential mortgage | 740 | 7.8 | 858 | 7.7 | 1,013 | 9.6 | 1,251 | 11.4 | 2,516 | 15.8 | ||||||||||||||||||||||||||||||
Home equity | 1,282 | 16.8 | 1,242 | 15.6 | 972 | 15.5 | 1,043 | 15.9 | 2,374 | 16.9 | ||||||||||||||||||||||||||||||
Consumer indirect | 10,715 | 34.4 | 10,189 | 32.9 | 7,754 | 31.1 | 6,837 | 27.9 | 5,152 | 22.8 | ||||||||||||||||||||||||||||||
Other consumer | 512 | 1.6 | 517 | 1.6 | 584 | 1.9 | 565 | 2.3 | 772 | 2.9 | ||||||||||||||||||||||||||||||
|
|
|
|
|
|
|
|
|
|
|
|
|
|
|
|
|
|
|
| |||||||||||||||||||||
Total | $ | 24,714 | 100.0 | % | $ | 23,260 | 100.0 | % | $ | 20,466 | 100.0 | % | $ | 20,741 | 100.0 | % | $ | 18,749 | 100.0 | % | ||||||||||||||||||||
|
|
|
|
|
|
|
|
|
|
|
|
|
|
|
|
|
|
|
| |||||||||||||||||||||
Management believes that the allowance for loan losses at December 31, 20102012 is adequate to cover probable losses in the loan portfolio at that date. Factors beyond our control, however, such as general national and local economic conditions, can adversely impact the adequacy of the allowance for loan losses. As a result, no assurance can be given that adverse economic conditions or other circumstances will not result in increased losses in the portfolio or that the allowance for loan losses will be sufficient to meet actual loan losses. See Part I, Item 1A “Risk Factors” for the risks impacting this estimate. Management presents a quarterly review of the adequacy of the allowance for loan losses to our Board of Directors based on the methodology that is described in further detail in Part I, Item I “Business” under the section titled “Lending Activities”. See also “Critical Accounting Estimates” for additional information on the allowance for loan losses.
Non-performing Assets and Potential Problem Loans
The following table sets forth information regarding non-performing assets (in thousands):
| Non-performing Assets | ||||||||||||||||||||
| At December 31, | ||||||||||||||||||||
| 2010 | 2009 | 2008 | 2007 | 2006 | ||||||||||||||||
| Non-accruing loans: | ||||||||||||||||||||
| Commercial business | $ | 947 | $ | 650 | $ | 510 | $ | 839 | $ | 4,031 | ||||||||||
| Commercial mortgage | 3,100 | 2,288 | 2,670 | 3,294 | 7,671 | |||||||||||||||
| Residential mortgage | 2,102 | 2,376 | 3,365 | 2,987 | 3,127 | |||||||||||||||
| Home equity | 875 | 880 | 1,143 | 661 | 712 | |||||||||||||||
| Consumer indirect | 514 | 621 | 445 | 278 | 166 | |||||||||||||||
| Other consumer | 41 | 7 | 56 | 16 | 130 | |||||||||||||||
| Total non-accruing loans | 7,579 | 6,822 | 8,189 | 8,075 | 15,837 | |||||||||||||||
| Restructured accruing loans | — | — | — | — | — | |||||||||||||||
| Accruing loans contractually past due over 90 days | 3 | 1,859 | 7 | 2 | 3 | |||||||||||||||
| Total non-performing loans | 7,582 | 8,681 | 8,196 | 8,077 | 15,840 | |||||||||||||||
| Foreclosed assets | 741 | 746 | 1,007 | 1,421 | 1,203 | |||||||||||||||
| Non-performing investment securities | 572 | 1,015 | 49 | — | — | |||||||||||||||
| Total non-performing assets | $ | 8,895 | $ | 10,442 | $ | 9,252 | $ | 9,498 | $ | 17,043 | ||||||||||
| Non-performing loans to total loans | 0.56 | % | 0.69 | % | 0.73 | % | 0.84 | % | 1.71 | % | ||||||||||
| Non-performing assets to total assets | 0.40 | % | 0.51 | % | 0.48 | % | 0.51 | % | 0.89 | % | ||||||||||
| Non-performing Assets | ||||||||||||||||||||
| At December 31, | ||||||||||||||||||||
| 2012 | 2011 | 2010 | 2009 | 2008 | ||||||||||||||||
Non-accruing loans: | ||||||||||||||||||||
Commercial business | $ | 3,413 | $ | 1,259 | $ | 947 | $ | 650 | $ | 510 | ||||||||||
Commercial mortgage | 1,799 | 2,928 | 3,100 | 2,288 | 2,670 | |||||||||||||||
Residential mortgage | 2,040 | 1,644 | 2,102 | 2,376 | 3,365 | |||||||||||||||
Home equity | 939 | 682 | 875 | 880 | 1,143 | |||||||||||||||
Consumer indirect | 891 | 558 | 514 | 621 | 445 | |||||||||||||||
Other consumer | 25 | — | 41 | 7 | 56 | |||||||||||||||
|
|
|
|
|
|
|
|
|
| |||||||||||
Total non-accruing loans | 9,107 | 7,071 | 7,579 | 6,822 | 8,189 | |||||||||||||||
Restructured accruing loans | — | — | — | — | — | |||||||||||||||
Accruing loans contractually past due over 90 days | 18 | 5 | 3 | 1,859 | 7 | |||||||||||||||
|
|
|
|
|
|
|
|
|
| |||||||||||
Total non-performing loans | 9,125 | 7,076 | 7,582 | 8,681 | 8,196 | |||||||||||||||
Foreclosed assets | 184 | 475 | 741 | 746 | 1,007 | |||||||||||||||
Non-performing investment securities | 753 | 1,636 | 572 | 1,015 | 49 | |||||||||||||||
|
|
|
|
|
|
|
|
|
| |||||||||||
Total non-performing assets | $ | 10,062 | $ | 9,187 | $ | 8,895 | $ | 10,442 | $ | 9,252 | ||||||||||
|
|
|
|
|
|
|
|
|
| |||||||||||
Non-performing loans to total loans | 0.53 | % | 0.48 | % | 0.56 | % | 0.69 | % | 0.73 | % | ||||||||||
Non-performing assets to total assets | 0.36 | % | 0.39 | % | 0.40 | % | 0.51 | % | 0.48 | % | ||||||||||
- 47 -
Non-performing assets include non-performing loans, foreclosed assets and non-performing investment securities. Non-performing assets at December 31, 20102012 were $8.9$10.1 million, a decreasean increase of $1.5 million$875 thousand from the $10.4$9.2 million balance at December 31, 2009.2011. The primary component of non-performing assets is non-performing loans, which were $7.6$9.1 million or 0.53% of total loans at December 31, 2010, a decrease2012, an increase of $1.1$2.0 million from the $8.7$7.1 million balanceor 0.48% of total loans at December 31, 2009.2011. The decrease in non-performing loans was attributable to a commercial relationship included in accruing loans past due 90 days or more at December 31, 2009 on which we collected substantially all of the $1.9 million balance during the first quarter of 2010, partially offset by a $757 thousand increase in non-accruing loans.
Approximately $3.3$4.2 million, or 43%46%, of the $7.6$9.1 million in non-accruingnon-performing loans as of December 31, 20102012 were current with respect to payment of principal and interest, but were classified as non-accruing because repayment in full of principal and/or interest was uncertain. For non-accruing loans outstanding as of December 31, 2010,2012, the amount of interest income forgone totaled $474$555 thousand. Included in nonaccrual loans are troubled debt restructurings (“TDRs”) of $534$636 thousand at December 31, 2010.2012. We had no TDRs whichthat were accruing interest as of December 31, 2010.
Foreclosed assets consist of real property formerly pledged as collateral to loans, which we have acquired through foreclosure proceedings or acceptance of a deed in lieu of foreclosure. Foreclosed asset holdings represented 135 properties totaling $741$184 thousand at December 31, 20102012 and 148 properties totaling $746$475 thousand at December 31, 2009.
Non-performing investment securities for which we have stopped accruing interest were $572$753 thousand at December 31, 2010, a decrease of $443 thousand from the $1.02012, compared to $1.6 million balance at December 31, 2009. The decrease2011. Non-performing investment securities are included in non-performing investmentassets at fair value and are comprised of pooled trust preferred securities. There have been no securities reflects net losses, both realizedtransferred to non-performing status since the first quarter of 2009. During 2012, we recognized gains totaling $2.6 million from the sale of five ABS securities. The five securities had a fair value of $1.1 million at December 31, 2011. We continue to monitor the market for these securities and unrealized, in our asset backed securities portfolio.
Potential problem loans are loans that are currently performing, but information known about possible credit problems of the borrowers causes management to have concern as to the ability of such borrowers to comply with the present loan payment terms and may result in disclosure of such loans as nonperforming at some time in the future. These loans remain in a performing status due to a variety of factors, including payment history, the value of collateral supporting the credits, and/or personal or government guarantees. Management considers loans classified as substandard, which continue to accrue interest, to be potential problem loans. We identified $11.5$13.8 million and $18.4$8.6 million in loans that continued to accrue interest which were classified as substandard as of December 31, 20102012 and 2009,2011, respectively.
In addition, we currently have a large commercial relationship with an Industrial Development Agency project in our market area. The relationship consists of a $14.1 million first lien mortgage position and $3.5 million second lien mortgage on a manufacturing facility. Recent events with the underlying third party tenant of the project has resulted in our monitoring the credit relationship more closely and including the first mortgage loan as “uncriticized—watch” and the second mortgage loan as “special mention” in our loan rating system. The loans are current as of December 31, 2012.
- 48 -
MANAGEMENT’S DISCUSSION AND ANALYSIS
FUNDING ACTIVITIES
Deposits
The following table summarizes the composition of our deposits (dollars in thousands).
| At December 31, | ||||||||||||||||||||||||
| 2010 | 2009 | 2008 | ||||||||||||||||||||||
| Amount | Percent | Amount | Percent | Amount | Percent | |||||||||||||||||||
| Noninterest-bearing demand | $ | 350,877 | 18.6 | % | $ | 324,303 | 18.6 | % | $ | 292,586 | 17.9 | % | ||||||||||||
| Interest-bearing demand | 374,900 | 19.9 | 363,698 | 20.9 | 344,616 | 21.1 | ||||||||||||||||||
| Savings and money market | 417,359 | 22.2 | 368,603 | 21.1 | 348,594 | 21.3 | ||||||||||||||||||
| Certificates of deposit < $100,000 | 555,840 | 29.5 | 512,969 | 29.5 | 482,863 | 29.6 | ||||||||||||||||||
| Certificates of deposit of $100,000 or more | 183,914 | 9.8 | 173,382 | 9.9 | 164,604 | 10.1 | ||||||||||||||||||
| Total deposits | $ | 1,882,890 | 100.0 | % | $ | 1,742,955 | 100.0 | % | $ | 1,633,263 | 100.0 | % | ||||||||||||
| At December 31, | ||||||||||||||||||||||||
| 2012 | 2011 | 2010 | ||||||||||||||||||||||
| Amount | Percent | Amount | Percent | Amount | Percent | |||||||||||||||||||
Noninterest-bearing demand | $ | 501,514 | 22.2 | % | $ | 393,421 | 20.3 | % | $ | 350,877 | 18.6 | % | ||||||||||||
Interest-bearing demand | 449,744 | 19.9 | 362,555 | 18.8 | 374,900 | 19.9 | ||||||||||||||||||
Savings and money market | 655,598 | 28.9 | 474,947 | 24.6 | 417,359 | 22.2 | ||||||||||||||||||
Certificates of deposit < $100,000 | 432,506 | 19.2 | 486,496 | 25.2 | 555,840 | 29.5 | ||||||||||||||||||
Certificates of deposit of $100,000 or more | 222,432 | 9.8 | 214,180 | 11.1 | 183,914 | 9.8 | ||||||||||||||||||
|
|
|
|
|
|
|
|
|
|
|
| |||||||||||||
Total deposits | $ | 2,261,794 | 100.0 | % | $ | 1,931,599 | 100.0 | % | $ | 1,882,890 | 100.0 | % | ||||||||||||
|
|
|
|
|
|
|
|
|
|
|
| |||||||||||||
We offer a variety of deposit products designed to attract and retain customers, with the primary focus on building and expanding long-term relationships. At December 31, 2010,2012, total deposits were $1.883$2.262 billion, representing an increase of $139.9$330.2 million for the year. The increase is largely attributable to $286.8 million in nonpublic (retail) deposits assumed from the branch acquisitions. Certificates of deposit were approximately 39%29% and 36% of total deposits at both December 31, 20102012 and 2009.
Nonpublic deposits, the largest component of our funding sources, represented 80% of total deposits and totaled $1.501$1.789 billion and $1.387$1.541 billion as of December 31, 20102012 and 2009,2011, respectively. We have managed this segment of funding through a strategy of competitive pricing that minimizes the number of customer relationships that have only a single service high cost deposit account. Nonpublic deposit levels continue to be positively impacted by the 2008 de novo branch expansion as our Henrietta and Greece branches have grown to $51.0 million and $34.6 million in deposits, respectively as of December 31, 2010.
We had no traditional brokered deposits at December 31, 2012 or 2011, however, we do participate in the Certificate of Deposit Account Registry Service (“CDARS”) and Insured Cash Sweep (“ICS”) programs, which enables depositors to receive FDIC insurance coverage for deposits otherwise exceeding the maximum insurable amount. Through these programs, deposits in excess of the maximum insurable amount are placed with multiple participating financial institutions. Reciprocal CDARS deposits totaled $61.0 million and $46.5 million at December 31, 2012 and 2011, respectively. ICS deposits totaled $18.1 million at December 31, 2012. There were non ICS deposits outstanding at December 31, 2010 or 2009.
2011.
- 48 -
Borrowings
There were no long-term borrowings fromoutstanding as of December 31, 2012 and 2011. Outstanding short-term borrowings are summarized as follows as of December 31 (in thousands):
| 2012 | 2011 | |||||||
Short-term borrowings: | ||||||||
Federal funds purchased | $ | — | $ | 11,597 | ||||
Repurchase agreements | 40,806 | 36,301 | ||||||
Short-term FHLB borrowings | 139,000 | 102,800 | ||||||
|
|
|
| |||||
Total short-term borrowings | $ | 179,806 | $ | 150,698 | ||||
|
|
|
| |||||
We classify borrowings as short-term or long-term in accordance with the original terms of the agreement.
We have credit capacity with the FHLB are used to satisfy funding requirements resulting from daily fluctuationsand can borrow through facilities that include amortizing and term advances or repurchase agreements. We had approximately $5 million of immediate credit capacity with FHLB as of December 31, 2012. We had approximately $452 million in deposit, loansecured borrowing capacity at the Federal Reserve Bank (“FRB”) Discount Window, none of which was outstanding at December 31, 2012. The FHLB and investment activities. FHLB borrowingsFRB credit capacity are collateralized by certainsecurities from our investment securities, FHLB stock owned by usportfolio and certain qualifying loans. AtWe had approximately $120 million of credit available under unsecured federal funds purchased lines with various banks as of December 31, 2010, short-term borrowings consisted2012. Additionally, we had approximately $150 million of unencumbered liquid securities available for pledging.
- 49 -
MANAGEMENT’S DISCUSSION AND ANALYSIS
Federal funds purchased are short-term borrowings that typically mature within one to ninety days. Short-term repurchase agreements are secured overnight borrowings with customers. Short-term FHLB borrowings have original maturities of $38.2 millionless than one year and $38.9 million ofinclude overnight repurchase agreements. Atborrowings which the Company typically utilizes to address short term funding needs as they arise. Short-term FHLB borrowings at December 31, 2009, short-term borrowings2012 consisted of Federal funds purchased$99.0 million in overnight borrowings and $40.0 million in short-term advances. Short-term FHLB borrowings at December 31, 2011 consisted of $9.4$65.0 million $35.1in overnight borrowings and $37.8 million of overnight repurchase agreements and a $15.0 million advance from the Federal Reserve’s Term Auction Facility.
The following table summarizes information relating to our short-term borrowings (dollars in thousands).
| At or for the Year Ended December 31, | ||||||||||||
| 2010 | 2009 | 2008 | ||||||||||
| Year-end balance | $ | 77,110 | $ | 59,543 | $ | 23,465 | ||||||
| Year-end weighted average interest rate | 0.21 | % | 0.59 | % | 0.48 | % | ||||||
| Maximum outstanding at any month-end | $ | 77,110 | $ | 85,912 | $ | 56,861 | ||||||
| Average balance during the year | $ | 49,104 | $ | 43,092 | $ | 38,028 | ||||||
| Average interest rate for the year | 0.74 | % | 0.63 | % | 1.90 | % | ||||||
| At or for the Year Ended December 31, | ||||||||||||
| 2012 | 2011 | 2010 | ||||||||||
Year-end balance | $ | 179,806 | $ | 150,698 | $ | 77,110 | ||||||
Year-end weighted average interest rate | 0.54 | % | 0.39 | % | 0.21 | % | ||||||
Maximum outstanding at any month-end | $ | 229,598 | $ | 188,355 | $ | 77,110 | ||||||
Average balance during the year | $ | 121,735 | $ | 99,122 | $ | 49,104 | ||||||
Average interest rate for the year | 0.48 | % | 0.50 | % | 0.74 | % | ||||||
There were no long-term borrowings totaled $26.8outstanding at December 31, 2012 and 2011. In August 2011, the Company redeemed all of the 10.20% junior subordinated debentures at a redemption price equaling 105.1% of the principal amount redeemed, plus all accrued and unpaid interest. As a result of the redemption, the Company recognized a loss on extinguishment of debt of $1.1 million, consisting of the redemption premium of $852 thousand and the write-off of the remaining unamortized issuance costs of $231 thousand.
Shareholders’ Equity
Total shareholders’ equity was $253.9 million at December 31, 2010 and consisted2012, an increase of $10.0 million in FHLB repurchase agreements, $65 thousand of FHLB amortizing advances and $16.7 million in junior subordinated debentures. At December 31, 2009, long-term borrowings totaled $46.8 million and consisted of $30.0 million in FHLB repurchase agreements, $145 thousand of FHLB amortizing advances and $16.7 million in junior subordinated debentures.
The Company and Bank are subject to various regulatory capital requirements. At December 31, 2010,2012, both the Company and the Bank exceeded all regulatory requirements. For detailed information on regulatory capital, see Note 10,11, Regulatory Matters, of the notes to consolidated financial statements.
GOODWILL
The carrying amountvalue of goodwill totaled $49.0 million and $37.4 million as of December 31, 20102012 and 2009. The2011, respectively. We performed a qualitative assessment of goodwill relates to our primary subsidiary andat the reporting unit level, Five Star Bank. We perform a goodwill impairment test on an annual basis or more frequentlyBank, to determine if events and circumstances warrant. On September 30, 2010, the Company performed the annual goodwill impairment test and determined the estimated fair value of our reporting unit to be in excess of its carrying amount. Accordingly, as of the annual impairment test date, thereit was no indication of goodwill impairment. We test goodwill for impairment between annual tests if an event occurs or circumstances change that would more likely than not reducethat the fair value of ourthe reporting unit belowis less than its carrying amount.
The change in the balance for goodwill during the years ended December 31 was as follows (in thousands):
| 2012 | 2011 | |||||||
Goodwill, beginning of year | $ | 37,369 | $ | 37,369 | ||||
Branch acquisitions | 11,599 | — | ||||||
Impairment | — | — | ||||||
|
|
|
| |||||
Goodwill, end of year | $ | 48,968 | $ | 37,369 | ||||
|
|
|
| |||||
Declines in the market value of our publicly traded stock price or declines in our ability to generate future cash flows may increase the potential that goodwill recorded on our consolidated statementstatements of financial condition be designated as impaired and that we may incur a goodwill write-down in the future.
The Company’s other intangible assets consisted entirely of a core deposit intangible asset. The gross carrying amount and accumulated amortization for the core deposit intangible asset was $2.0 million and $190 thousand, respectively, at December 31, 2012. The Company had no other intangible assets as of December 31, 2011. Core deposit intangible amortization expense, included in other noninterest expense on the consolidated statements of income, was $190 thousand for the year ended December 31, 2012. There was no core deposit intangible amortization expense for the years ended December 31, 2011 and 2010. For further discussion, see Note 1, Summary of Significant Accounting Policies, and Note 7, Goodwill and Other Intangible Assets, to the Consolidated Financial Statements included in Item 8 of this Annual Report on Form 10-K.
- 4950 -
LIQUIDITY AND CAPITAL RESOURCES
The objective of maintaining adequate liquidity is to assure that we meet our financial obligations. These obligations include the withdrawal of deposits on demand or at their contractual maturity, the repayment of matured borrowings, the ability to fund new and existing loan commitments and the ability to take advantage of new business opportunities. We achieve liquidity by maintaining a strong base of core customer funds, maturing short-term assets, our ability to sell or pledge securities, lines-of-credit, and access to the financial and capital markets. In addition, we currently have an effective shelf registration that allows for the ability to issue up to $50 million in common stock.
Liquidity for the Bank is managed through the monitoring of anticipated changes in loans, the investment portfolio, core deposits and wholesale funds. The strength of the Bank’s liquidity position is a result of its base of core customer deposits. These core deposits are supplemented by wholesale funding sources that include credit lines with the other banking institutions, the FHLB and the FRB.
The primary sources of liquidity for FII are dividends from the Bank and access to financial and capital markets. Dividends from the Bank are limited by various regulatory requirements related to capital adequacy and earnings trends. The Bank relies on cash flows from operations, core deposits, borrowings and short-term liquid assets. FSIS relies on cash flows from operations and funds from FII when necessary.
Our cash and cash equivalents were $39.1$60.4 million as of December 31, 2010, down2012, up $2.8 million from $43.0$57.6 million as of December 31, 2009.2011. Our net cash provided by operating activities totaled $35.4$38.7 million and the principal source of operating activity cash flow was net income adjusted for noncash income and expense items. Net cash used in investing activities totaled $169.2$99.1 million, which included outflows of $151.3 million for net loan origination funding of $89.5originations and $138.4 million andfrom net investment securities transactions, of $77.8 million.substantially offset by $195.8 million in cash received through the branch acquisitions. Net cash provided by financing activities of $129.9$63.2 million was attributed to the $139.9 million and $17.6a $43.4 million increase in deposits and a $29.1 million increase in short-term borrowings, respectively, partiallypartly offset by $20.1 million repayments of long-term debt and $7.7$8.9 million in cash paid for dividends.
Contractual Obligations and Other Commitments
The following table summarizes the maturities of various contractual obligations and other commitments (in thousands):
| At December 31, 2010 | ||||||||||||||||||||
| Within 1 | Over 1 to 3 | Over 3 to 5 | Over 5 | |||||||||||||||||
| year | years | Years | years | Total | ||||||||||||||||
On-Balance sheet: | ||||||||||||||||||||
Certificates of deposit (1) | $ | 554,104 | $ | 141,608 | $ | 43,888 | $ | 154 | $ | 739,754 | ||||||||||
| Long-term borrowings | 10,065 | — | — | 16,702 | 26,767 | |||||||||||||||
| Supplemental executive retirement plans | 155 | 318 | 318 | 708 | 1,499 | |||||||||||||||
Off-Balance sheet: | ||||||||||||||||||||
Limited partnership investments(2) | $ | 695 | $ | 1,391 | $ | 695 | $ | — | $ | 2,781 | ||||||||||
Commitments to extend credit(3) | 357,240 | — | — | — | 357,240 | |||||||||||||||
Standby letters of credit(3) | 4,075 | 1,216 | 1,233 | — | 6,524 | |||||||||||||||
| Operating leases | 1,218 | 2,188 | 1,933 | 5,868 | 11,207 | |||||||||||||||
| At December 31, 2012 | ||||||||||||||||||||
| Within 1 | Over 1 to 3 | Over 3 to 5 | Over 5 | |||||||||||||||||
| year | years | Years | years | Total | ||||||||||||||||
On-Balance sheet: | ||||||||||||||||||||
Certificates of deposit (1) | $ | 495,423 | $ | 127,045 | $ | 31,721 | $ | 749 | $ | 654,938 | ||||||||||
Supplemental executive retirement plans | 159 | 506 | 618 | 1,402 | 2,685 | |||||||||||||||
Off-Balance sheet: | ||||||||||||||||||||
Limited partnership investments(2) | $ | 402 | $ | 804 | $ | 402 | $ | — | $ | 1,608 | ||||||||||
Commitments to extend credit(3) | 435,948 | — | — | — | 435,948 | |||||||||||||||
Standby letters of credit(3) | 4,161 | 4,996 | 66 | — | 9,223 | |||||||||||||||
Operating leases | 1,433 | 2,689 | 2,023 | 4,347 | 10,492 | |||||||||||||||
| (1) | Includes the maturity of certificates of deposit amounting to $100 thousand or more as follows: |
| (2) | We have committed to capital investments in several limited partnerships of up to |
| (3) | We do not expect all of the commitments to extend credit and standby letters of credit to be funded. Thus, the total commitment amounts do not necessarily represent our future cash requirements. |
Off-Balance Sheet Arrangements
With the exception of obligations in connection with our trust preferred securities and in connection with our irrevocable loan commitments, operating leases and limited partnership investments, we had no other off-balance sheet arrangements that have or are reasonably likely to have a current or future effect on our financial condition, changes in financial condition, revenues or expenses, results of operations, liquidity, capital expenditures or capital resources that is material to investors. For additional information on off-balance sheet arrangements, see Note 1, Summary of Significant Accounting Policies and Note 9,10, Commitments and Contingencies, in the notes to the accompanying consolidated financial statements.
- 5051 -
Security Yields and Maturities Schedule
The following table sets forth certain information regarding the amortized cost (“Cost”), weighted average yields (“Yield”) and contractual maturities of our debt securities portfolio as of December 31, 2010.2012. Mortgage-backed securities are included in maturity categories based on their stated maturity date. Actual maturities may differ from the contractual maturities presented because borrowers may have the right to call or prepay certain investments. We have stopped accruing interest on our asset-backed securities. No tax-equivalent adjustments were made to the weighted average yields (in thousands).
| Due after five | ||||||||||||||||||||||||||||||||||||||||
| Due in one year | Due from one to | years through | Due after ten | |||||||||||||||||||||||||||||||||||||
| or less | five years | ten years | years | Total | ||||||||||||||||||||||||||||||||||||
| Cost | Yield | Cost | Yield | Cost | Yield | Cost | Yield | Cost | Yield | |||||||||||||||||||||||||||||||
Available for sale debt securities: | ||||||||||||||||||||||||||||||||||||||||
| U.S. Government agencies and government-sponsored enterprises | $ | — | — | % | $ | 59,324 | 2.25 | % | $ | 60,113 | 2.48 | % | $ | 22,154 | 1.40 | % | $ | 141,591 | 2.21 | % | ||||||||||||||||||||
| State and political subdivisions | 17,186 | 3.53 | 43,177 | 3.10 | 45,259 | 2.19 | — | — | 105,622 | 2.78 | ||||||||||||||||||||||||||||||
| Mortgage-backed securities | 8,503 | 4.02 | 12,423 | 3.96 | 118,320 | 1.96 | 276,237 | 3.57 | 415,483 | 3.13 | ||||||||||||||||||||||||||||||
| Asset-backed securities | — | — | — | — | — | — | 564 | — | 564 | — | ||||||||||||||||||||||||||||||
| 25,689 | 3.69 | 114,924 | 2.75 | 223,692 | 2.15 | 298,955 | 3.41 | 663,260 | 2.88 | |||||||||||||||||||||||||||||||
Held to maturity debt securities: | ||||||||||||||||||||||||||||||||||||||||
| State and political subdivisions | 21,439 | 2.43 | 5,490 | 4.13 | 1,055 | 5.08 | 178 | 5.53 | 28,162 | 2.88 | ||||||||||||||||||||||||||||||
| $ | 47,128 | 3.12 | % | $ | 120,414 | 2.82 | % | $ | 224,747 | 2.16 | % | $ | 299,133 | 3.41 | % | $ | 691,422 | 2.88 | % | |||||||||||||||||||||
| Due in one year or less | Due from one to five years | Due after five years through ten years | Due after ten years | Total | ||||||||||||||||||||||||||||||||||||
| Cost | Yield | Cost | Yield | Cost | Yield | Cost | Yield | Cost | Yield | |||||||||||||||||||||||||||||||
Available for sale debt securities: | ||||||||||||||||||||||||||||||||||||||||
U.S. Government agencies and government-sponsored enterprises | $ | 18,557 | 1.89 | % | $ | 23,973 | 2.20 | % | $ | 72,633 | 1.77 | % | $ | 12,934 | 0.87 | % | $ | 128,097 | 1.78 | % | ||||||||||||||||||||
State and political subdivisions | 10,064 | 3.64 | 68,677 | 2.21 | 110,256 | 2.06 | — | — | 188,997 | 2.20 | ||||||||||||||||||||||||||||||
Mortgage-backed securities | 346 | 3.76 | 1,829 | 3.65 | 135,235 | 1.82 | 342,576 | 2.33 | 479,986 | 2.19 | ||||||||||||||||||||||||||||||
Asset-backed securities | — | — | — | — | — | — | 121 | — | 121 | — | ||||||||||||||||||||||||||||||
|
|
|
|
|
|
|
|
|
| |||||||||||||||||||||||||||||||
| 28,967 | 2.52 | 94,479 | 2.24 | 318,124 | 1.89 | 355,631 | 2.27 | 797,201 | 2.13 | |||||||||||||||||||||||||||||||
Held to maturity debt securities: | ||||||||||||||||||||||||||||||||||||||||
State and political subdivisions | 12,886 | 2.24 | 4,164 | 3.69 | 768 | 4.78 | 87 | 5.53 | 17,905 | 2.70 | ||||||||||||||||||||||||||||||
|
|
|
|
|
|
|
|
|
| |||||||||||||||||||||||||||||||
| $ | 41,853 | 2.43 | % | $ | 98,643 | 2.30 | % | $ | 318,892 | 1.90 | % | $ | 355,718 | 2.28 | % | $ | 815,106 | 2.14 | % | |||||||||||||||||||||
|
|
|
|
|
|
|
|
|
| |||||||||||||||||||||||||||||||
Contractual Loan Maturity Schedule
The following table summarizes the contractual maturities of our loan portfolio at December 31, 2010.2012. Loans, net of deferred loan origination costs, include principal amortization and non-accruing loans. Demand loans having no stated schedule of repayment or maturity and overdrafts are reported as due in one year or less (in thousands).
| Due in less | Due from one | Due after five | ||||||||||||||
| than one year | to five years | years | Total | |||||||||||||
| Commercial business | $ | 130,990 | $ | 71,730 | $ | 8,311 | $ | 211,031 | ||||||||
| Commercial mortgage | 80,096 | 161,978 | 110,856 | 352,930 | ||||||||||||
| Residential mortgage | 25,556 | 57,534 | 46,490 | 129,580 | ||||||||||||
| Home equity | 35,208 | 91,464 | 81,655 | 208,327 | ||||||||||||
| Consumer indirect | 136,355 | 269,061 | 12,600 | 418,016 | ||||||||||||
| Other consumer | 11,772 | 13,006 | 1,328 | 26,106 | ||||||||||||
| Total loans | $ | 419,977 | $ | 664,773 | $ | 261,240 | $ | 1,345,990 | ||||||||
| Loans maturing after one year: | ||||||||||||||||
| With a predetermined interest rate | $ | 205,867 | $ | 166,360 | $ | 372,227 | ||||||||||
| With a floating or adjustable rate | 458,906 | 94,880 | 553,786 | |||||||||||||
| Total loans maturing after one year | $ | 664,773 | $ | 261,240 | $ | 926,013 | ||||||||||
| Due in less than one year | Due from one to five years | Due after five years | Total | |||||||||||||
Commercial business | $ | 158,620 | $ | 87,051 | $ | 13,004 | $ | 258,675 | ||||||||
Commercial mortgage | 134,797 | 212,004 | 66,523 | 413,324 | ||||||||||||
Residential mortgage | 28,496 | 64,013 | 41,011 | 133,520 | ||||||||||||
Home equity | 49,190 | 129,284 | 108,175 | 286,649 | ||||||||||||
Consumer indirect | 204,831 | 362,478 | 19,485 | 586,794 | ||||||||||||
Other consumer | 10,647 | 13,874 | 2,243 | 26,764 | ||||||||||||
|
|
|
|
|
|
|
| |||||||||
Total loans | $ | 586,581 | $ | 868,704 | $ | 250,441 | $ | 1,705,726 | ||||||||
|
|
|
|
|
|
|
| |||||||||
Loans maturing after one year: | ||||||||||||||||
With a predetermined interest rate | $ | 249,428 | $ | 131,385 | $ | 380,813 | ||||||||||
With a floating or adjustable rate | 619,276 | 119,056 | 738,332 | |||||||||||||
|
|
|
|
|
| |||||||||||
Total loans maturing after one year | $ | 868,704 | $ | 250,441 | $ | 1,119,145 | ||||||||||
|
|
|
|
|
| |||||||||||
- 5152 -
Capital Resources
The FRB has adopted a system using risk-based capital guidelines to evaluate the capital adequacy of bank holding companies on a consolidated basis. The guidelines require a minimum Tier 1 leverage ratio of 4.00%, a minimum Tier 1 capital ratio of 4.00% and a minimum total risk-based capital ratio of 8.00%. The following table reflects the ratios and their components (in thousands):
| 2010 | 2009 | |||||||
| Total shareholders’ equity | $ | 212,144 | $ | 198,294 | ||||
| Less: Unrealized gain on securities available for sale, net of tax | 1,877 | 1,655 | ||||||
| Unrecognized net periodic pension & postretirement benefits (costs), net of tax | (6,599 | ) | (5,357 | ) | ||||
| Disallowed goodwill and other intangible assets | 37,369 | 37,369 | ||||||
| Disallowed deferred tax assets | 14,608 | 17,214 | ||||||
| Plus: Qualifying trust preferred securities | 16,200 | 16,200 | ||||||
| Tier 1 capital | $ | 181,089 | $ | 163,613 | ||||
| Adjusted average total assets (for leverage capital purposes) | $ | 2,177,911 | $ | 2,054,699 | ||||
| Tier 1 leverage ratio (Tier 1 capital to adjusted average total assets) | 8.31 | % | 7.96 | % | ||||
| Total Tier 1 capital | $ | 181,089 | $ | 163,613 | ||||
| Plus: Qualifying allowance for loan losses | 18,363 | 17,153 | ||||||
| Total risk-based capital | $ | 199,452 | $ | 180,766 | ||||
| Net risk-weighted assets | $ | 1,466,957 | $ | 1,368,653 | ||||
| Tier 1 capital ratio (Tier 1 capital to net risk-weighted assets) | 12.34 | % | 11.95 | % | ||||
| Total risk-based capital ratio (Total risk-based capital to net risk-weighted assets) | 13.60 | % | 13.21 | % | ||||
| 2012 | 2011 | |||||||
Total shareholders’ equity | $ | 253,897 | $ | 237,194 | ||||
Less: Unrealized gain on securities available for sale, net of tax | 16,060 | 13,570 | ||||||
Unrecognized net periodic pension & postretirement benefits (costs), net of tax | (12,807 | ) | (12,625 | ) | ||||
Disallowed goodwill and other intangible assets | 50,820 | 37,369 | ||||||
Disallowed deferred tax assets | — | 1,794 | ||||||
|
|
|
| |||||
Tier 1 capital | $ | 199,824 | $ | 197,086 | ||||
|
|
|
| |||||
Adjusted average total assets (for leverage capital purposes) | $ | 2,595,691 | $ | 2,282,755 | ||||
|
|
|
| |||||
Tier 1 leverage ratio (Tier 1 capital to adjusted average total assets) | 7.70 | % | 8.63 | % | ||||
Total Tier 1 capital | $ | 199,824 | $ | 197,086 | ||||
Plus: Qualifying allowance for loan losses | 23,352 | 20,239 | ||||||
|
|
|
| |||||
Total risk-based capital | $ | 223,176 | $ | 217,325 | ||||
|
|
|
| |||||
Net risk-weighted assets | $ | 1,866,764 | $ | 1,616,119 | ||||
|
|
|
| |||||
Tier 1 capital ratio (Tier 1 capital to net risk-weighted assets) | 10.70 | % | 12.20 | % | ||||
Total risk-based capital ratio (Total risk-based capital to net risk-weighted assets) | 11.96 | % | 13.45 | % | ||||
CRITICAL ACCOUNTING ESTIMATES
Our consolidated financial statements are prepared in accordance with GAAP and are consistent with predominant practices in the financial services industry. Application of critical accounting policies, which are those policies that management believes are the most important to our financial position and results, requires management to make estimates, assumptions, and judgments that affect the amounts reported in the consolidated financial statements and accompanying notes and are based on information available as of the date of the financial statements. Future changes in information may affect these estimates, assumptions and judgments, which, in turn, may affect amounts reported in the financial statements.
We have numerous accounting policies, of which the most significant are presented in Note 1, Summary of Significant Accounting Policies, of the notes to consolidated financial statements. These policies, along with the disclosures presented in the other financial statement notes and in this discussion, provide information on how significant assets, liabilities, revenues and expenses are reported in the consolidated financial statements and how those reported amounts are determined. Based on the sensitivity of financial statement amounts to the methods, assumptions, and estimates underlying those amounts, management has determined that the accounting policies with respect to the allowance for loan losses, valuation of goodwill and deferred tax assets, the valuation of securities and determination of OTTI, and accounting for defined benefit plans require particularly subjective or complex judgments important to our financial position and results of operations, and, as such, are considered to be critical accounting policies as discussed below. These estimates and assumptions are based on management’s best estimates and judgment and are evaluated on an ongoing basis using historical experience and other factors, including the current economic environment. We adjust these estimates and assumptions when facts and circumstances dictate. Illiquid credit markets and volatile equity have combined with declines in consumer spending to increase the uncertainty inherent in these estimates and assumptions. As future events cannot be determined with precision, actual results could differ significantly from our estimates.
- 5253 -
Adequacy of the Allowance for Loan Losses
The allowance for loan losses represents management’s estimate of probable credit losses inherent in the loan portfolio. Determining the amount of the allowance for loan losses is considered a critical accounting estimate because it requires significant judgment and the use of subjective measurements including management’s assessment of the internal risk classifications of loans, changes in the nature of the loan portfolio, industry concentrations, existing economic conditions, the fair value of underlying collateral, and other qualitative and quantitative factors which could affect probable credit losses. Because current economic conditions can change and future events are inherently difficult to predict, the anticipated amount of estimated loan losses, and therefore the appropriateness of the allowance for loan losses, could change significantly. As an integral part of their examination process, various regulatory agencies also review the allowance for loan losses. Such agencies may require additions to the allowance for loan losses or may require that certain loan balances be charged off or downgraded into criticized loan categories when their credit evaluations differ from those of management, based on their judgments about information available to them at the time of their examination. We believe the level of the allowance for loan losses is appropriate as recorded in the consolidated financial statements.
For additional discussion related to our accounting policies for the allowance for loan losses, see the sections titled “Allowance for Loan Losses” in Part II, Item 7, “Management’s Discussion and Analysis of Financial Condition and Results of Operations” and Note 1, Summary of Significant Accounting Policies, of the notes to consolidated financial statements.
Valuation of Goodwill
Goodwill represents the excess of the purchase price over the fair value of net assets acquired in accordance with the purchase method of accounting for business combinations. Goodwill has an indefinite useful life and is not amortized, but instead, is subjecttested for impairment. GAAP requires goodwill to be tested for impairment testsat our reporting unit level on at least an annual basis, orwhich for us is September 30th, and more frequently if an event occursevents or circumstances changeindicate that reduce the fair value of a reporting unit below its carrying amount. The Company completes the annual goodwill impairment test as of September 30 of each year. The impairment testing process is conducted by assigning net assets and goodwill to each reporting unit.there may be impairment. Currently, the Company’sour goodwill is evaluated at the entity level as there is only one reporting unit. The
Impairment exists when a reporting unit’s carrying value of goodwill exceeds its implied fair value. In testing goodwill for impairment, GAAP permits us to first assess qualitative factors to determine whether it is more likely than not that the fair value of eacha reporting unit is comparedless than its carrying value. If, after assessing the totality of events and circumstances, we determine it is not more likely than not that the fair value of a reporting unit is less than its carrying value, then performing the two-step impairment test would be unnecessary. However, if we conclude otherwise, we would then be required to perform the first step (Step 1) of the goodwill impairment test, and continue to the recorded booksecond step (Step 2), if necessary. Step 1 compares the fair value “step one”.of a reporting unit with its carrying value, including goodwill. If the faircarrying value of the reporting unit exceeds its carryingfair value, Step 2 of the goodwill impairment test is not considered impaired and “step two” is not considered necessary. Ifperformed to measure the carrying value of a reporting unit exceeds its fair value, the impairment test continues (“step two”) by comparing the carrying value of the reporting unit’s goodwill to the implied fair value of goodwill. The implied fair value is computed by adjusting all assets and liabilities of the reporting unit to current fair value with the offset adjustment to goodwill. The adjusted goodwill balance is the implied fair value of the goodwill. An impairment charge is recognizedloss, if the carrying fair value of goodwill exceeds the implied fair value of goodwill.
Valuation of Deferred Tax Assets
The determination of deferred tax expense or benefit is based on changes in the carrying amounts of assets and liabilities that generate temporary differences. The carrying value of our net deferred tax assets assumes that we will be able to generate sufficient future taxable income based on estimates and assumptions (after consideration of historical taxable income as well as tax planning strategies). If these estimates and related assumptions change, we may be required to record valuation allowances against our deferred tax assets resulting in additional income tax expense in the consolidated statements of operations.income. Management evaluates deferred tax assets on a quarterly basis and assesses the need for a valuation allowance, if any. A valuation allowance is established when management believes that it is more likely than not that some portion of its deferred tax assets will not be realized. Changes in valuation allowance from period to period are included in the Company’sour tax provision in the period of change. For additional discussion related to our accounting policy for income taxes see Note 14,15, Income Taxes, of the notes to consolidated financial statements.
- 5354 -
Valuation and Other Than Temporary Impairment of Securities
We record all of our securities that are classified as available for sale at fair value. The fair value of equity securities are determined using public quotations, when available. Where quoted market prices are not available, fair values are estimated based on dealer quotes, pricing models, discounted cash flow methodologies, or similar techniques for which the determination of fair value may require significant judgment or estimation. Fair values of public bonds and those private securities that are actively traded in the secondary market have been determined through the use of third-party pricing services using market observable inputs. Private placement securities and other corporate fixed maturities wherefor which we do not receive a public quotation are valued using a variety of acceptable valuation methods. Market rates used are applicable to the yield, credit quality and average maturity of each security. Private equity securities may also utilize internal valuation methodologies appropriate for the specific asset. Fair values might also be determined using broker quotes or through the use of internal models or analysis.
Securities are evaluated quarterly to determine whether a decline in their fair value is other than temporary. Management utilizes criteria such as, the current intent or requirement to hold or sell the security, the magnitude and duration of the decline and, when appropriate, consideration of negative changes in expected cash flows, creditworthiness, near term prospects of issuers, the level of credit subordination, estimated loss severity, and delinquencies, to determine whether a loss in value is other than temporary. The term “other than temporary” is not intended to indicate that the decline is permanent, but indicates that the prospect for a near-term recovery of value is not necessarily favorable. Declines in the fair value of investment securities below their cost that are deemed to be other than temporary are reflected in earnings as realized losses to the extent the impairment is related to credit issues or concerns, or the security is intended to be sold. The amount of impairment related to non-credit related factors on securities not intended to be sold is recognized in other comprehensive income.
Defined Benefit Pension Plan
Management is required to make various assumptions in valuing its defined benefit pension plan assets and liabilities. These assumptions include, but are not limited to, the expected long-term rate of return on plan assets, the weighted average discount rate used to value certain liabilities and the rate of compensation increase. We use a third-party specialist to assist in making these estimates and assumptions. Changes in these estimates and assumptions are reasonably possible and may have a material impact on our consolidated financial statements, results of operationsincome or liquidity.
RECENT ACCOUNTING PRONOUNCEMENTS
See Note 1, Summary of Significant Accounting Policies — Policies—Recent Accounting Pronouncements, in the notes to consolidated financial statements for a discussion of recent accounting pronouncements.
- 5455 -
Asset-Liability Management
The principal objective of our interest rate risk management is to evaluate the interest rate risk inherent in assets and liabilities, determine the appropriate level of risk to us given our business strategy, operating environment, capital and liquidity requirements and performance objectives, and manage the risk consistent with the guidelines approved by our Board of Directors. Management is responsible for reviewing with the Board of Directors our activities and strategies, the effect of those strategies on the net interest margin,income, the fair value of the portfolio and the effect that changes in interest rates will have on the portfolio and exposure limits. Management has developed an Asset-Liability Policy that meets the strategic objectives and regularly reviews the activities of the Bank.
Portfolio Composition
Our balance sheet assets are a mix of fixed and variable rate assets with consumer indirect loans, commercial loans, and MBSs comprising a significant portion of our assets. Our consumer indirect loan portfolio comprised 21% of assets and is primarily fixed rate loans with relatively short durations. Our commercial loan portfolio totaled 24% of assets and is a combination of fixed and variable rate loans, lines and mortgages. The MBS portfolio, including collateralized mortgages obligations, totaled 18% of assets with durations averaging three to five years.
Our liabilities are made up primarily of deposits, which account for approximately 90% of total liabilities. Of these deposits, the majority, or 53%, is in nonpublic variable rate and noninterest bearing products including demand (both noninterest and interest- bearing), savings and money market accounts. In addition, fixed rate nonpublic certificate of deposit products make up 27% of total deposits. The bank also has a significant amount of public deposits, which represented 20% of total deposits as of December 31, 2012.
Net Interest Income at Risk Analysis
A primary tool we useused to manage interest rate risk is a “rate shock” simulation to measure the rate sensitivity of the statement of financial condition.sensitivity. Rate shock simulation is a modeling technique used to estimate the impact of changes in rates on net interest income andas well as economic value of equity. At December 31, 2012, the Company is generally asset sensitive, meaning that, in most cases, net interest income tends to rise as interest rates rise and decline as interest rates fall. The following table sets forth the results of the modeling analysis as of December 31, 20102012 (dollars in thousands):
| Changes in | Net Interest Income | Economic Value of Equity | ||||||||||||||||||||||
| interest rate | Amount | Change | Amount | Change | ||||||||||||||||||||
| + 300 basis points | $ | 80,089 | $ | (655 | ) | (0.81 | )% | $ | 409,884 | $ | (45,722 | ) | (10.04 | )% | ||||||||||
| + 200 basis points | 80,387 | (357 | ) | (0.44 | ) | 428,304 | (27,303 | ) | (5.99 | ) | ||||||||||||||
| + 100 basis points | 80,342 | (402 | ) | (0.50 | ) | 443,028 | (12,578 | ) | (2.76 | ) | ||||||||||||||
| - 100 basis points | 76,204 | (4,540 | ) | (5.62 | ) | 438,274 | (17,332 | ) | (3.80 | ) | ||||||||||||||
| Changes in Interest Rate | ||||||||||||||||
| -100 bp | +100 bp | +200 bp | +300 bp | |||||||||||||
Change in net interest income | $ | (106 | ) | $ | 2,611 | $ | 5,492 | $ | 6,565 | |||||||
% Change | (0.12 | )% | 2.85 | % | 5.99 | % | 7.16 | % | ||||||||
Net interest income at risk is measured by estimating the changes in net interest income resulting from instantaneous and sustained parallel shifts in interest rates of different magnitudes over a period of 12 months. As of December 31, 2010,2012, a 100300 basis point increase in rates would decreaseincrease net interest income by $402 thousand,$6.6 million, or 0.5%7.2%, over the nextfollowing twelve-month period. A 100 basis point decrease in rates would decrease net interest income by $4.5 million,$106 thousand, or 5.6%, over a twelve-month period. As of December 31, 2010, a 100 basis point increase in rates would decrease the economic value of equity by $12.6 million, or 2.8%0.1%, over the nextfollowing twelve-month period. A 100 basis point decrease
In addition to the changes in rates would decreaseinterest rate scenarios listed above, other scenarios are typically modeled to measure interest rate risk. These scenarios vary depending on the economic value of equity by $17.3 million, or 3.8%, over a twelve-month period. This simulation isand interest rate environment.
The simulations referenced above are based on management’s assumption as to the effect of interest rate changes on assets and liabilities and assumes a parallel shift of the yield curve. It also includes certain assumptions about the future pricing of loans and deposits in response to changes in interest rates. Further, it assumes that delinquency rates would not change as a result of changes in interest rates, although there can be no assurance that this will be the case. While this simulation is a useful measure as to net interest income at risk due to a change in interest rates, it is not a forecast of the future results and is based on many assumptions that, if changed, could cause a different outcome.
Economic Value of Equity At Risk
The economic (or “fair”) value of financial instruments on our balance sheet will also vary under the changes in interest rate scenarios listed above, we typically run other scenariospreviously discussed. This is measured by simulating changes in our economic value of equity (“EVE”), which is calculated by subtracting the estimated fair value of liabilities from the estimated fair value of assets. Fair values for financial instruments are estimated by discounting projected cash flows (principal and interest) at current replacement rates for each account type, while fair values of non-financial assets and liabilities are assumed to measureequal book value and do not vary with interest rate risk, which vary depending onfluctuations. An economic value simulation is a static measure for balance sheet accounts at a given point in time, but this measurement can change substantially over time as the economiccharacteristics of our balance sheet evolve and as interest rate environments.
- 5556 -
The amount of change in economic value under different interest rate scenarios depends on the characteristics of each class of financial instrument, including the stated interest rate or spread relative to current market rates or spreads, the likelihood of prepayment, whether the rate is fixed or floating, and the maturity date of the instrument. As a general rule, fixed-rate financial assets become more valuable in declining rate scenarios and less valuable in rising rate scenarios, while fixed-rate financial liabilities gain in value as interest rates rise and lose value as interest rates decline. The longer the duration of the financial instrument, the greater the impact a rate change will have on its value. In our economic value simulations, estimated prepayments are factored in for financial instruments with stated maturity dates, and decay rates for non-maturity deposits are projected based historical data (back-testing).
The table below shows estimated changes in our EVE under different interest rate scenarios relative to a base case of current interest rates.
| Changes in Interest Rate | ||||||||||||||||
| -100 bp | +100 bp | +200 bp | +300 bp | |||||||||||||
Change in EVE | $ | 27,739 | $ | 3,684 | $ | 172 | $ | (15,721 | ) | |||||||
% Change | 7.06 | % | 0.94 | % | 0.04 | % | (4.00 | )% | ||||||||
As of December 31, 2012, a 300 basis point increase in rates would decrease the economic value of equity by $15.7 million, or 4.0%. A 100 basis point decrease in rates would increase the economic value of equity by $27.7 million, or 7.0%. Embedded options within the current balance sheet such as caps, floors, and calls as well as changes in prepayment speeds and a decompression of deposit rates in rising interest rate scenarios are affecting the results, particularly as market rates begin to rise with rates increasing 100 and 200 basis points. Embedded optionality sometimes outweighs impacts of the movement in the direction of interest rates. This is evidenced in the results under the plus 100 and plus 200 basis point scenarios.
- 57 -
Interest Rate Sensitivity Gap
| At December 31, 2010 | ||||||||||||||||||||
| Over Three | Over | |||||||||||||||||||
| Three | Months | One Year | ||||||||||||||||||
| Months | Through | Through | Over | |||||||||||||||||
| or Less | One Year | Five Years | Five Years | Total | ||||||||||||||||
| INTEREST-EARNING ASSETS: | ||||||||||||||||||||
| Federal funds sold and interest-earning deposits in other banks | $ | — | $ | 94 | $ | — | $ | — | $ | 94 | ||||||||||
| Investment securities | 99,649 | 137,148 | 262,173 | 192,452 | 691,422 | |||||||||||||||
| Loans | 420,507 | 211,128 | 604,736 | 112,757 | 1,349,128 | |||||||||||||||
| Total interest-earning assets | $ | 520,156 | $ | 348,370 | $ | 866,909 | $ | 305,209 | 2,040,644 | |||||||||||
| Cash and due from banks | 38,964 | |||||||||||||||||||
Other assets(1) | 134,699 | |||||||||||||||||||
| Total assets | $ | 2,214,307 | ||||||||||||||||||
| INTEREST-BEARING LIABILITIES: | ||||||||||||||||||||
| Interest-bearing demand, savings and money market | $ | 792,259 | $ | — | $ | — | $ | — | $ | 792,259 | ||||||||||
| Certificates of deposit | 180,581 | 373,523 | 185,496 | 154 | 739.754 | |||||||||||||||
| Borrowings | 77,175 | 10,000 | — | 16,702 | 103,877 | |||||||||||||||
| Total interest-bearing liabilities | $ | 1,050,015 | $ | 383,523 | 185,496 | 16,856 | 1,635,890 | |||||||||||||
| Noninterest-bearing deposits | 350,877 | |||||||||||||||||||
| Other liabilities | 15,396 | |||||||||||||||||||
| Total liabilities | 2,002,163 | |||||||||||||||||||
| Shareholders’ equity | 212,144 | |||||||||||||||||||
| Total liabilities and shareholders’ equity | $ | 2,214,307 | ||||||||||||||||||
| Interest sensitivity gap | $ | (529,859 | ) | $ | (35,153 | ) | $ | 681,413 | $ | 288,353 | $ | 404,754 | ||||||||
| Cumulative gap | $ | (529,859 | ) | $ | (565,012 | ) | $ | 116,401 | $ | 404,754 | ||||||||||
Cumulative gap ratio(2) | 49.5 | % | 60.6 | % | 107.2 | % | 124.7 | % | ||||||||||||
| Cumulative gap as a percentage of total assets | (23.9 | )% | (25.5 | )% | 5.3 | % | 18.3 | % | ||||||||||||
| At December 31, 2012 | ||||||||||||||||||||
| Over Three | Over | |||||||||||||||||||
| Three | Months | One Year | ||||||||||||||||||
| Months | Through | Through | Over | |||||||||||||||||
| or Less | One Year | Five Years | Five Years | Total | ||||||||||||||||
INTEREST-EARNING ASSETS: | ||||||||||||||||||||
Federal funds sold and interest-earning deposits in other banks | $ | — | $ | 94 | $ | — | $ | — | $ | 94 | ||||||||||
Investment securities | 98,857 | 137,633 | 344,016 | 234,600 | 815,106 | |||||||||||||||
Loans | 521,041 | 306,079 | 749,167 | 130,957 | 1,707,244 | |||||||||||||||
|
|
|
|
|
|
|
|
|
| |||||||||||
Total interest-earning assets | $ | 619,898 | $ | 443,806 | $ | 1,093,183 | $ | 365,557 | 2,522,444 | |||||||||||
|
|
|
|
|
|
|
| |||||||||||||
Cash and due from banks | 60,342 | |||||||||||||||||||
Other assets(1) | 181,248 | |||||||||||||||||||
|
| |||||||||||||||||||
Total assets | $ | 2,764,034 | ||||||||||||||||||
|
| |||||||||||||||||||
INTEREST-BEARING LIABILITIES: | ||||||||||||||||||||
Interest-bearing demand, savings and money market | $ | 1,105,342 | $ | — | $ | — | $ | — | $ | 1,105,342 | ||||||||||
Certificates of deposit | 154,826 | 340,379 | 158,984 | 749 | 654,938 | |||||||||||||||
Borrowings | 139,806 | 40,000 | — | — | 179,806 | |||||||||||||||
|
|
|
|
|
|
|
|
|
| |||||||||||
Total interest-bearing liabilities | $ | 1,399,974 | $ | 380,379 | $ | 158,984 | $ | 749 | 1,940,086 | |||||||||||
|
|
|
|
|
|
|
| |||||||||||||
Noninterest-bearing deposits | 501,514 | |||||||||||||||||||
Other liabilities | 68,537 | |||||||||||||||||||
|
| |||||||||||||||||||
Total liabilities | 2,510,137 | |||||||||||||||||||
Shareholders’ equity | 253,897 | |||||||||||||||||||
|
| |||||||||||||||||||
Total liabilities and shareholders’ equity | $ | 2,764,034 | ||||||||||||||||||
|
| |||||||||||||||||||
Interest sensitivity gap | $ | (780,076 | ) | $ | 63,427 | $ | 934,199 | $ | 364,808 | $ | 582,358 | |||||||||
|
|
|
|
|
|
|
|
|
| |||||||||||
Cumulative gap | $ | (780,076 | ) | $ | (716,649 | ) | $ | 217,550 | $ | 582,358 | ||||||||||
|
|
|
|
|
|
|
| |||||||||||||
Cumulative gap ratio(2) | 44.3 | % | 59.7 | % | 111.2 | % | 130.0 | % | ||||||||||||
Cumulative gap as a percentage of total assets | (28.2 | )% | (25.9 | )% | 7.9 | % | 21.1 | % | ||||||||||||
| (1) | Includes net unrealized gain on securities available for sale and allowance for loan losses. |
| (2) | Cumulative total interest-earning assets divided by cumulative total interest-bearing liabilities. |
For purposes of interest rate risk management, we direct more attention on simulation modeling, such as “net interest income at risk” as previously discussed, rather than gap analysis. The net interest income at risk simulation modeling is considered by management to be more informative in forecasting future income at risk.
- 5658 -
| Page | |||||||
Consolidated Statements of Comprehensive Income for the years ended December 31, 2012, 2011 and 2010 | 65 | ||||||
- 5759 -
Management is responsible for establishing and maintaining adequate internal control over financial reporting for Financial Institutions, Inc. and its subsidiaries (the “Company”), as such term is defined in Exchange Act Rules 13a-15(f). The Company’s system of internal control over financial reporting has been designed to provide reasonable assurance to the Company’s management and board of directors regarding the reliability of financial reporting and the preparation and fair presentation of financial statements for external purposes in accordance with accounting principlesU.S. generally accepted in the United States of America.
Any system of internal control over financial reporting, no matter how well designed, has inherent limitations, including the possibility that a control can be circumvented or overridden and misstatements due to error or fraud may occur and not be detected. Also, because of changes in conditions, internal control effectiveness may vary over time. Accordingly, even an effective system of internal control will provide only reasonable assurance with respect to financial statement preparation and presentation.
The Company’s management has assessed the effectiveness of the Company’s internal control over financial reporting as of December 31, 2010.2012. To make this assessment, we used the criteria for effective internal control over financial reporting described inInternal Control —– Integrated Framework, issued by the Committee of Sponsoring Organizations of the Treadway Commission. Based on our assessment and based on such criteria, we believe that, as of December 31, 2010,2012, the Company’s internal control over financial reporting was effective.
The Company’s independent registered public accounting firm that audited the Company’s consolidated financial statements has issued an attestation report on internal control over financial reporting as of December 31, 2010.2012. That report appears herein.
| /s/ Martin K. Birmingham | ||
| /s/ Karl F. Krebs | ||
| President and Chief Executive Officer | Executive Vice President and Chief Financial Officer | |
| March | March |
- 5860 -
The Board of Directors and Shareholders
Financial Institutions, Inc.:
We have audited Financial Institutions, Inc. and subsidiaries’ (the Company) internal control over financial reporting as of December 31, 2010,2012, based on criteria established inInternal Control—Integrated Frameworkissued by the Committee of Sponsoring Organizations of the Treadway Commission (COSO). The Company’s management is responsible for maintaining effective internal control over financial reporting and for its assessment of the effectiveness of internal control over financial reporting, included in the accompanying Management’s Report on Internal Control over Financial Reporting. Our responsibility is to express an opinion on the Company’s internal control over financial reporting based on our audit.
We conducted our audit in accordance with the standards of the Public Company Accounting Oversight Board (United States). Those standards require that we plan and perform the audit to obtain reasonable assurance about whether effective internal control over financial reporting was maintained in all material respects. Our audit included obtaining an understanding of internal control over financial reporting, assessing the risk that a material weakness exists, and testing and evaluating the design and operating effectiveness of internal control based on the assessed risk. Our audit also includes performing such other procedures as we considered necessary in the circumstances. We believe that our audit provides a reasonable basis for our opinion.
A company’s internal control over financial reporting is a process designed to provide reasonable assurance regarding the reliability of financial reporting and the preparation of financial statements for external purposes in accordance with generally accepted accounting principles. A company’s internal control over financial reporting includes those policies and procedures that (1) pertain to the maintenance of records that, in reasonable detail, accurately and fairly reflect the transactions and dispositions of the assets of the company; (2) provide reasonable assurance that transactions are recorded as necessary to permit preparation of financial statements in accordance with generally accepted accounting principles, and that receipts and expenditures of the company are being made only in accordance with authorizations of management and directors of the company; and (3) provide reasonable assurance regarding prevention or timely detection of unauthorized acquisition, use, or disposition of the company’s assets that could have a material effect on the financial statements.
Because of its inherent limitations, internal control over financial reporting may not prevent or detect misstatements. Also, projections of any evaluation of effectiveness to future periods are subject to the risk that controls may become inadequate because of changes in conditions, or that the degree of compliance with the policies or procedures may deteriorate.
In our opinion, the CompanyFinancial Institutions, Inc. and subsidiaries maintained, in all material respects, effective internal control over financial reporting as of December 31, 2010,2012, based on criteria established inInternal Control—Integrated Frameworkissued by the Committee of Sponsoring Organizations of the Treadway Commission (COSO).
We also have audited, in accordance with the standards of the Public Company Accounting Oversight Board (United States), the consolidated statements of financial condition of the CompanyFinancial Institutions, Inc. and subsidiaries as of December 31, 20102012 and 2009,2011, and the related consolidated statements of operations,income, comprehensive income, changes in shareholders’ equity, and cash flows for each of the years in the three-year period ended December 31, 2010,2012, and our report dated March 7, 201118, 2013 expressed an unqualified opinion on those consolidated financial statements.
/s/ KPMG LLP
Rochester, New York
March 7, 2011
- 5961 -
The Board of Directors and Shareholders
Financial Institutions, Inc.:
We have audited the accompanying consolidated statements of financial condition of Financial Institutions, Inc. and subsidiaries (the Company) as of December 31, 20102012 and 2009,2011, and the related consolidated statements of operations,income, comprehensive income, changes in shareholders’ equity, and cash flows for each of the years in the three-year period ended December 31, 2010.2012. These consolidated financial statements are the responsibility of the Company’s management. Our responsibility is to express an opinion on these consolidated financial statements based on our audits.
We conducted our audits in accordance with the standards of the Public Company Accounting Oversight Board (United States). Those standards require that we plan and perform the audit to obtain reasonable assurance about whether the financial statements are free of material misstatement. An audit includes examining, on a test basis, evidence supporting the amounts and disclosures in the financial statements. An audit also includes assessing the accounting principles used and significant estimates made by management, as well as evaluating the overall financial statement presentation. We believe that our audits provide a reasonable basis for our opinion.
In our opinion, the consolidated financial statements referred to above present fairly, in all material respects, the consolidated financial position of the CompanyFinancial Institutions, Inc. and subsidiaries as of December 31, 20102012 and 2009,2011, and the results of their operations and their cash flows for each of the years in the three-year period ended December 31, 2010,2012, in conformity with U.S. generally accepted accounting principles.
We also have audited, in accordance with the standards of the Public Company Accounting Oversight Board (United States), the Company’s internal control over financial reporting as of December 31, 2010,2012, based on criteria established inInternal Control — Control—Integrated Frameworkissued by the Committee of Sponsoring Organizations of the Treadway Commission (COSO), and our report dated March 7, 201118, 2013 expressed an unqualified opinion on the effectiveness of the Company’s internal control over financial reporting.
/s/ KPMG LLP
Rochester, New York
March 7, 2011
- 6062 -
| December 31, | ||||||||
| (Dollars in thousands, except share and per share data) | 2010 | 2009 | ||||||
ASSETS | ||||||||
| Cash and cash equivalents: | ||||||||
| Cash and due from banks | $ | 38,964 | $ | 42,874 | ||||
| Federal funds sold and interest-bearing deposits in other banks | 94 | 85 | ||||||
| Total cash and cash equivalents | 39,058 | 42,959 | ||||||
| Securities available for sale, at fair value | 666,368 | 580,501 | ||||||
| Securities held to maturity, at amortized cost (fair value of $28,849 and $40,629, respectively) | 28,162 | 39,573 | ||||||
| Loans held for sale | 3,138 | 421 | ||||||
| Loans (net of allowance for loan losses of $20,466 and $20,741, respectively) | 1,325,524 | 1,243,265 | ||||||
| Company owned life insurance | 26,053 | 24,867 | ||||||
| Premises and equipment, net | 33,263 | 34,783 | ||||||
| Goodwill | 37,369 | 37,369 | ||||||
| Other assets | 55,372 | 58,651 | ||||||
| Total assets | $ | 2,214,307 | $ | 2,062,389 | ||||
LIABILITIES AND SHAREHOLDERS’ EQUITY | ||||||||
| Deposits: | ||||||||
| Noninterest-bearing demand | $ | 350,877 | $ | 324,303 | ||||
| Interest-bearing demand | 374,900 | 363,698 | ||||||
| Savings and money market | 417,359 | 368,603 | ||||||
| Certificates of deposit | 739,754 | 686,351 | ||||||
| Total deposits | 1,882,890 | 1,742,955 | ||||||
| Short-term borrowings | 77,110 | 59,543 | ||||||
| Long-term borrowings | 26,767 | 46,847 | ||||||
| Other liabilities | 15,396 | 14,750 | ||||||
| Total liabilities | 2,002,163 | 1,864,095 | ||||||
| Commitments and contingencies (Note 9) | ||||||||
| Shareholders’ equity: | ||||||||
| Series A 3% preferred stock, $100 par value; 1,533 shares authorized and issued | 153 | 153 | ||||||
| Series A preferred stock, $100 par value, 7,503 shares authorized and issued, aggregate liquidation preference of $37,515; net of $1,305 and $1,672 discount, respectively | 36,210 | 35,843 | ||||||
| Series B-1 8.48% preferred stock, $100 par value, 200,000 shares authorized, 174,223 shares issued | 17,422 | 17,422 | ||||||
| Total preferred equity | 53,785 | 53,418 | ||||||
| Common stock, $0.01 par value, 50,000,000 shares authorized, 11,348,122 shares issued | 113 | 113 | ||||||
| Additional paid-in capital | 26,029 | 26,940 | ||||||
| Retained earnings | 144,599 | 131,371 | ||||||
| Accumulated other comprehensive loss | (4,722 | ) | (3,702 | ) | ||||
Treasury stock, at cost—410,616 and 527,854 shares, respectively | (7,660 | ) | (9,846 | ) | ||||
| Total shareholders’ equity | 212,144 | 198,294 | ||||||
| Total liabilities and shareholders’ equity | $ | 2,214,307 | $ | 2,062,389 | ||||
| December 31, | ||||||||
| (Dollars in thousands, except share and per share data) | 2012 | 2011 | ||||||
| ASSETS | ||||||||
Cash and cash equivalents: | ||||||||
Cash and due from banks | $ | 60,342 | $ | 57,489 | ||||
Federal funds sold and interest-bearing deposits in other banks | 94 | 94 | ||||||
|
|
|
| |||||
Total cash and cash equivalents | 60,436 | 57,583 | ||||||
Securities available for sale, at fair value | 823,796 | 627,518 | ||||||
Securities held to maturity, at amortized cost (fair value of $18,478 and $23,964, respectively) | 17,905 | 23,297 | ||||||
Loans held for sale | 1,518 | 2,410 | ||||||
Loans (net of allowance for loan losses of $24,714 and $23,260, respectively) | 1,681,012 | 1,461,516 | ||||||
Company owned life insurance | 47,386 | 45,556 | ||||||
Premises and equipment, net | 36,618 | 33,085 | ||||||
Goodwill and other intangible assets, net | 50,820 | 37,369 | ||||||
Other assets | 44,543 | 48,019 | ||||||
|
|
|
| |||||
Total assets | $ | 2,764,034 | $ | 2,336,353 | ||||
|
|
|
| |||||
| LIABILITIES AND SHAREHOLDERS’ EQUITY | ||||||||
Deposits: | ||||||||
Noninterest-bearing demand | $ | 501,514 | $ | 393,421 | ||||
Interest-bearing demand | 449,744 | 362,555 | ||||||
Savings and money market | 655,598 | 474,947 | ||||||
Certificates of deposit | 654,938 | 700,676 | ||||||
|
|
|
| |||||
Total deposits | 2,261,794 | 1,931,599 | ||||||
Short-term borrowings | 179,806 | 150,698 | ||||||
Other liabilities | 68,537 | 16,862 | ||||||
|
|
|
| |||||
Total liabilities | 2,510,137 | 2,099,159 | ||||||
|
|
|
| |||||
Commitments and contingencies (Note 10) | ||||||||
Shareholders’ equity: | ||||||||
Series A 3% preferred stock, $100 par value; 1,533 shares authorized; 1,499 and 1,500 shares issued, respectively | 150 | 150 | ||||||
Series B-1 8.48% preferred stock, $100 par value, 200,000 shares authorized; 173,210 and 173,235 shares issued, respectively | 17,321 | 17,323 | ||||||
|
|
|
| |||||
Total preferred equity | 17,471 | 17,473 | ||||||
Common stock, $0.01 par value, 50,000,000 shares authorized and 14,161,597 shares issued | 142 | 142 | ||||||
Additional paid-in capital | 67,710 | 67,247 | ||||||
Retained earnings | 172,244 | 158,079 | ||||||
Accumulated other comprehensive income | 3,253 | 945 | ||||||
Treasury stock, at cost – 373,888 and 358,481 shares, respectively | (6,923 | ) | (6,692 | ) | ||||
|
|
|
| |||||
Total shareholders’ equity | 253,897 | 237,194 | ||||||
|
|
|
| |||||
Total liabilities and shareholders’ equity | $ | 2,764,034 | $ | 2,336,353 | ||||
|
|
|
| |||||
See accompanying notes to the consolidated financial statements.
- 6163 -
| Years ended December 31, | ||||||||||||
| (Dollars in thousands, except per share amounts) | 2010 | 2009 | 2008 | |||||||||
| Interest income: | ||||||||||||
| Interest and fees on loans | $ | 75,877 | $ | 72,706 | $ | 67,674 | ||||||
| Interest and dividends on investment securities | 20,622 | 21,694 | 30,655 | |||||||||
| Other interest income | 10 | 82 | 619 | |||||||||
| Total interest income | 96,509 | 94,482 | 98,948 | |||||||||
| Interest expense: | ||||||||||||
| Deposits | 14,853 | 19,090 | 29,349 | |||||||||
| Short-term borrowings | 365 | 270 | 721 | |||||||||
| Long-term borrowings | 2,502 | 2,857 | 3,547 | |||||||||
| Total interest expense | 17,720 | 22,217 | 33,617 | |||||||||
| Net interest income | 78,789 | 72,265 | 65,331 | |||||||||
| Provision for loan losses | 6,687 | 7,702 | 6,551 | |||||||||
| Net interest income after provision for loan losses | 72,102 | 64,563 | 58,780 | |||||||||
| Noninterest income (loss): | ||||||||||||
| Service charges on deposits | 9,585 | 10,065 | 10,497 | |||||||||
| ATM and debit card | 3,995 | 3,610 | 3,313 | |||||||||
| Broker-dealer fees and commissions | 1,283 | 1,022 | 1,458 | |||||||||
| Company owned life insurance | 1,107 | 1,096 | 563 | |||||||||
| Loan servicing | 1,124 | 1,308 | 664 | |||||||||
| Net gain on sale of loans held for sale | 650 | 699 | 339 | |||||||||
| Net gain on disposal of investment securities | 169 | 3,429 | 288 | |||||||||
| Impairment charges on investment securities | (594 | ) | (4,666 | ) | (68,215 | ) | ||||||
| Net (loss) gain on sale and disposal of other assets | (203 | ) | 180 | 305 | ||||||||
| Other | 2,338 | 2,052 | 2,010 | |||||||||
| Total noninterest income (loss) | 19,454 | 18,795 | (48,778 | ) | ||||||||
| Noninterest expense: | ||||||||||||
| Salaries and employee benefits | 32,811 | 33,634 | 31,437 | |||||||||
| Occupancy and equipment | 10,818 | 11,062 | 10,502 | |||||||||
| FDIC assessments | 2,507 | 3,651 | 674 | |||||||||
| Computer and data processing | 2,487 | 2,340 | 2,433 | |||||||||
| Professional services | 2,197 | 2,524 | 2,141 | |||||||||
| Supplies and postage | 1,772 | 1,846 | 1,800 | |||||||||
| Advertising and promotions | 1,121 | 949 | 1,453 | |||||||||
| Other | 7,204 | 6,771 | 7,021 | |||||||||
| Total noninterest expense | 60,917 | 62,777 | 57,461 | |||||||||
| Income (loss) before income taxes | 30,639 | 20,581 | (47,459 | ) | ||||||||
| Income tax expense (benefit) | 9,352 | 6,140 | (21,301 | ) | ||||||||
| Net income (loss) | $ | 21,287 | $ | 14,441 | $ | (26,158 | ) | |||||
| Preferred stock dividends, net of accretion | 3,725 | 3,697 | 1,538 | |||||||||
| Net income (loss) available to common shareholders | $ | 17,562 | $ | 10,744 | $ | (27,696 | ) | |||||
| Earnings (loss) per common share (Note 15): | ||||||||||||
| Basic | $ | 1.62 | $ | 0.99 | $ | (2.54 | ) | |||||
| Diluted | $ | 1.61 | $ | 0.99 | $ | (2.54 | ) | |||||
| Years ended December 31, | ||||||||||||
| (Dollars in thousands, except per share amounts) | 2012 | 2011 | 2010 | |||||||||
Interest income: | ||||||||||||
Interest and fees on loans | $ | 81,123 | $ | 77,105 | $ | 75,877 | ||||||
Interest and dividends on investment securities | 16,444 | 18,013 | 20,622 | |||||||||
Other interest income | — | — | 10 | |||||||||
|
|
|
|
|
| |||||||
Total interest income | 97,567 | 95,118 | 96,509 | |||||||||
|
|
|
|
|
| |||||||
Interest expense: | ||||||||||||
Deposits | 8,462 | 11,434 | 14,853 | |||||||||
Short-term borrowings | 589 | 500 | 365 | |||||||||
Long-term borrowings | — | 1,321 | 2,502 | |||||||||
|
|
|
|
|
| |||||||
Total interest expense | 9,051 | 13,255 | 17,720 | |||||||||
|
|
|
|
|
| |||||||
Net interest income | 88,516 | 81,863 | 78,789 | |||||||||
Provision for loan losses | 7,128 | 7,780 | 6,687 | |||||||||
|
|
|
|
|
| |||||||
Net interest income after provision for loan losses | 81,388 | 74,083 | 72,102 | |||||||||
|
|
|
|
|
| |||||||
Noninterest income: | ||||||||||||
Service charges on deposits | 8,627 | 8,679 | 9,585 | |||||||||
ATM and debit card | 4,716 | 4,359 | 3,995 | |||||||||
Broker-dealer fees and commissions | 2,104 | 1,829 | 1,283 | |||||||||
Company owned life insurance | 1,751 | 1,424 | 1,107 | |||||||||
Loan servicing | 617 | 835 | 1,124 | |||||||||
Net gain on sale of loans held for sale | 1,421 | 880 | 650 | |||||||||
Net gain on disposal of investment securities | 2,651 | 3,003 | 169 | |||||||||
Impairment charges on investment securities | (91 | ) | (18 | ) | (594 | ) | ||||||
Net (loss) gain on sale and disposal of other assets | (381 | ) | 67 | (203 | ) | |||||||
Other | 3,362 | 2,867 | 2,338 | |||||||||
|
|
|
|
|
| |||||||
Total noninterest income | 24,777 | 23,925 | 19,454 | |||||||||
|
|
|
|
|
| |||||||
Noninterest expense: | ||||||||||||
Salaries and employee benefits | 40,127 | 35,743 | 32,844 | |||||||||
Occupancy and equipment | 11,419 | 10,868 | 10,818 | |||||||||
Professional services | 4,133 | 2,617 | 2,197 | |||||||||
Computer and data processing | 3,271 | 2,437 | 2,487 | |||||||||
Supplies and postage | 2,497 | 1,778 | 1,772 | |||||||||
FDIC assessments | 1,300 | 1,513 | 2,507 | |||||||||
Advertising and promotions | 929 | 1,259 | 1,121 | |||||||||
Loss on extinguishment of debt | — | 1,083 | — | |||||||||
Other | 7,721 | 6,496 | 7,171 | |||||||||
|
|
|
|
|
| |||||||
Total noninterest expense | 71,397 | 63,794 | 60,917 | |||||||||
|
|
|
|
|
| |||||||
Income before income taxes | 34,768 | 34,214 | 30,639 | |||||||||
Income tax expense | 11,319 | 11,415 | 9,352 | |||||||||
|
|
|
|
|
| |||||||
Net income | $ | 23,449 | $ | 22,799 | $ | 21,287 | ||||||
|
|
|
|
|
| |||||||
Preferred stock dividends | 1,474 | 1,877 | 3,358 | |||||||||
Accretion of discount on Series A preferred stock | — | 1,305 | 367 | |||||||||
|
|
|
|
|
| |||||||
Net income available to common shareholders | $ | 21,975 | $ | 19,617 | $ | 17,562 | ||||||
|
|
|
|
|
| |||||||
Earnings per common share (Note 16): | ||||||||||||
Basic | $ | 1.60 | $ | 1.50 | $ | 1.62 | ||||||
Diluted | $ | 1.60 | $ | 1.49 | $ | 1.61 | ||||||
Cash dividends declared per common share | $ | 0.57 | $ | 0.47 | $ | 0.40 | ||||||
Weighted average common shares outstanding: | ||||||||||||
Basic | 13,696 | 13,067 | 10,767 | |||||||||
Diluted | 13,751 | 13,157 | 10,845 | |||||||||
See accompanying notes to the consolidated financial statements.
- 6264 -
| Accumulated | ||||||||||||||||||||||||||||
| Additional | Other | Total | ||||||||||||||||||||||||||
| (Dollars in thousands, | Preferred | Common | Paid-in | Retained | Comprehensive | Treasury | Shareholders’ | |||||||||||||||||||||
| except per share data) | Equity | Stock | Capital | Earnings | Income (Loss) | Stock | Equity | |||||||||||||||||||||
Balance at January 1, 2008 | $ | 17,581 | $ | 113 | $ | 24,778 | $ | 158,744 | $ | 667 | $ | (6,561 | ) | $ | 195,322 | |||||||||||||
| Comprehensive income: | ||||||||||||||||||||||||||||
| Net loss | — | — | — | (26,158 | ) | — | — | (26,158 | ) | |||||||||||||||||||
| Other comprehensive loss, net of tax | — | — | — | — | (4,680 | ) | — | (4,680 | ) | |||||||||||||||||||
| Total comprehensive loss | (30,838 | ) | ||||||||||||||||||||||||||
| Cumulative effect of adoption of new accounting pronouncements | — | — | — | (241 | ) | — | — | (241 | ) | |||||||||||||||||||
| Repurchase of common shares | — | — | — | — | — | (4,818 | ) | (4,818 | ) | |||||||||||||||||||
| Repurchase of Series A 3% preferred stock | (6 | ) | — | 3 | — | — | — | (3 | ) | |||||||||||||||||||
| Warrant issued in connection with Series A preferred stock | — | — | 2,025 | — | — | — | 2,025 | |||||||||||||||||||||
| Issue shares of Series A preferred stock | 37,515 | — | — | — | — | — | 37,515 | |||||||||||||||||||||
| Discount on Series A preferred stock | (2,025 | ) | — | — | — | — | — | (2,025 | ) | |||||||||||||||||||
| Share-based compensation plans: | ||||||||||||||||||||||||||||
| Share-based compensation | — | — | 603 | 30 | — | — | 633 | |||||||||||||||||||||
| Stock options exercised | — | — | (12 | ) | — | — | 44 | 32 | ||||||||||||||||||||
| Restricted stock awards issued | — | — | (998 | ) | — | — | 998 | — | ||||||||||||||||||||
| Directors’ retainer | — | — | (2 | ) | — | — | 114 | 112 | ||||||||||||||||||||
| Accrued undeclared cumulative dividend on Series A preferred stock, net of accretion | 9 | — | — | (56 | ) | — | — | (47 | ) | |||||||||||||||||||
| Cash dividends declared: | ||||||||||||||||||||||||||||
| Series A 3% preferred-$3.00 per share | — | — | — | (5 | ) | — | — | (5 | ) | |||||||||||||||||||
| Series B-1 8.48% preferred-$8.48 per share | — | — | — | (1,477 | ) | — | — | (1,477 | ) | |||||||||||||||||||
| Common-$0.54 per share | — | — | — | (5,885 | ) | — | — | (5,885 | ) | |||||||||||||||||||
Balance at December 31, 2008 | $ | 53,074 | $ | 113 | $ | 26,397 | $ | 124,952 | $ | (4,013 | ) | $ | (10,223 | ) | $ | 190,300 | ||||||||||||
| Comprehensive income: | ||||||||||||||||||||||||||||
| Net income | — | — | — | 14,441 | — | — | 14,441 | |||||||||||||||||||||
| Other comprehensive income, net of tax | — | — | — | — | 311 | — | 311 | |||||||||||||||||||||
| Total comprehensive income | 14,752 | |||||||||||||||||||||||||||
| Issuance costs of Series A preferred stock | — | — | (68 | ) | — | — | — | (68 | ) | |||||||||||||||||||
| Share-based compensation plans: | ||||||||||||||||||||||||||||
| Share-based compensation | — | — | 852 | 2 | — | — | 854 | |||||||||||||||||||||
| Stock options exercised | — | — | (4 | ) | — | — | 19 | 15 | ||||||||||||||||||||
| Restricted stock awards issued, net | — | — | (207 | ) | — | — | 207 | — | ||||||||||||||||||||
| Directors’ retainer | (30 | ) | 151 | 121 | ||||||||||||||||||||||||
| Accrued undeclared cumulative dividend on Series A preferred stock, net of accretion | 344 | — | — | (537 | ) | — | — | (193 | ) | |||||||||||||||||||
| Cash dividends declared: | ||||||||||||||||||||||||||||
| Series A 3% preferred-$3.00 per share | — | — | — | (5 | ) | — | — | (5 | ) | |||||||||||||||||||
| Series A preferred-$223.61 per share | — | — | — | (1,678 | ) | — | — | (1,678 | ) | |||||||||||||||||||
| Series B-1 8.48% preferred-$8.48 per share | — | — | — | (1,477 | ) | — | — | (1,477 | ) | |||||||||||||||||||
| Common-$0.40 per share | — | — | — | (4,327 | ) | — | — | (4,327 | ) | |||||||||||||||||||
Balance at December 31, 2009 | $ | 53,418 | $ | 113 | $ | 26,940 | $ | 131,371 | $ | (3,702 | ) | $ | (9,846 | ) | $ | 198,294 | ||||||||||||
| Years ended December 31, | ||||||||||||
| (Dollars in thousands) | 2012 | 2011 | 2010 | |||||||||
Net income | $ | 23,449 | $ | 22,799 | $ | 21,287 | ||||||
Other comprehensive income: | ||||||||||||
Unrealized gains on securities: | ||||||||||||
Change in net unrealized securities gains arising during period | 6,682 | 22,350 | (16 | ) | ||||||||
Deferred tax expense | (2,646 | ) | (8,855 | ) | (19 | ) | ||||||
Reclassification adjustment for gains included in income before income taxes | (2,560 | ) | (2,985 | ) | 425 | |||||||
Related tax expense (benefit) | 1,014 | 1,183 | (168 | ) | ||||||||
|
|
|
|
|
| |||||||
Change in net unrealized gains on securities, net of tax | 2,490 | 11,693 | 222 | |||||||||
Change in pension and post-retirement obligations: | ||||||||||||
Change in net actuarial gain\loss | (300 | ) | (9,979 | ) | (2,192 | ) | ||||||
Related tax expense | 118 | 3,953 | 950 | |||||||||
|
|
|
|
|
| |||||||
Change in pension and post-retirement obligations, net of tax | (182 | ) | (6,026 | ) | (1,242 | ) | ||||||
|
|
|
|
|
| |||||||
Other comprehensive income (loss) | 2,308 | 5,667 | (1,020 | ) | ||||||||
|
|
|
|
|
| |||||||
Comprehensive income | $ | 25,757 | $ | 28,466 | $ | 20,267 | ||||||
|
|
|
|
|
| |||||||
See accompanying notes to the consolidated financial statements.
- 6365 -
Consolidated Statements of Changes in Shareholders’ Equity
Years ended December 31, 2012, 2011 and 2010
(Dollars in thousands, except per share data) | Preferred Equity | Common Stock | Additional Paid-in Capital | Retained Earnings | Accumulated Other Comprehensive Income (Loss) | Treasury Stock | Total Shareholders’ Equity | |||||||||||||||||||||
Balance at January 1, 2010 | $ | 53,418 | $ | 113 | $ | 26,940 | $ | 131,371 | $ | (3,702 | ) | $ | (9,846 | ) | $ | 198,294 | ||||||||||||
Comprehensive income: | ||||||||||||||||||||||||||||
Net income | — | — | — | 21,287 | — | — | 21,287 | |||||||||||||||||||||
Other comprehensive loss, net of tax | — | — | — | — | (1,020 | ) | — | (1,020 | ) | |||||||||||||||||||
|
| |||||||||||||||||||||||||||
Total comprehensive income | 20,267 | |||||||||||||||||||||||||||
Purchases of common stock for treasury | — | — | — | — | — | (69 | ) | (69 | ) | |||||||||||||||||||
Share-based compensation plans: | ||||||||||||||||||||||||||||
Share-based compensation | — | — | 1,031 | — | — | — | 1,031 | |||||||||||||||||||||
Stock options exercised | — | — | (74 | ) | — | — | 290 | 216 | ||||||||||||||||||||
Restricted stock awards issued, net | — | — | (1,853 | ) | — | — | 1,853 | — | ||||||||||||||||||||
Directors’ retainer | — | — | (15 | ) | — | — | 112 | 97 | ||||||||||||||||||||
Accrued undeclared cumulative dividend on Series A preferred stock, net of accretion | 367 | — | — | (367 | ) | — | — | — | ||||||||||||||||||||
Cash dividends declared: | ||||||||||||||||||||||||||||
Series A 3% preferred-$3.00 per share | — | — | — | (5 | ) | — | — | (5 | ) | |||||||||||||||||||
Series A preferred-$250.00 per share | — | — | — | (1,876 | ) | — | — | (1,876 | ) | |||||||||||||||||||
Series B-1 8.48% preferred-$8.48 per share | — | — | — | (1,477 | ) | — | — | (1,477 | ) | |||||||||||||||||||
Common-$0.40 per share | — | — | — | (4,334 | ) | — | — | (4,334 | ) | |||||||||||||||||||
|
|
|
|
|
|
|
|
|
|
|
|
|
| |||||||||||||||
Balance at December 31, 2010 | $ | 53,785 | $ | 113 | $ | 26,029 | $ | 144,599 | $ | (4,722 | ) | $ | (7,660 | ) | $ | 212,144 | ||||||||||||
Comprehensive income: | ||||||||||||||||||||||||||||
Net income | — | — | — | 22,799 | — | — | 22,799 | |||||||||||||||||||||
Other comprehensive income, net of tax | — | — | — | — | 5,667 | — | 5,667 | |||||||||||||||||||||
|
| |||||||||||||||||||||||||||
Total comprehensive income | 28,466 | |||||||||||||||||||||||||||
Issuance of common stock | — | 29 | 43,098 | — | — | — | 43,127 | |||||||||||||||||||||
Purchases of common stock for treasury | — | — | — | — | — | (215 | ) | (215 | ) | |||||||||||||||||||
Repurchase of Series A 3% preferred stock | (3 | ) | — | — | — | — | — | (3 | ) | |||||||||||||||||||
Repurchase of warrant issued to U.S. Treasury | — | — | (2,080 | ) | — | — | — | (2,080 | ) | |||||||||||||||||||
Redemption of Series A preferred stock | (37,515 | ) | — | 68 | — | — | — | (37,447 | ) | |||||||||||||||||||
Repurchase of Series B-1 8.48% preferred stock | (99 | ) | — | — | — | — | — | (99 | ) | |||||||||||||||||||
Share-based compensation plans: | ||||||||||||||||||||||||||||
Share-based compensation | — | — | 1,105 | — | — | — | 1,105 | |||||||||||||||||||||
Stock options exercised | — | — | (28 | ) | — | — | 119 | 91 | ||||||||||||||||||||
Restricted stock awards issued, net | — | — | (954 | ) | — | — | 954 | — | ||||||||||||||||||||
Excess tax benefit on share-based compensation | — | — | 21 | — | — | — | 21 | |||||||||||||||||||||
Directors’ retainer | — | — | (12 | ) | 110 | 98 | ||||||||||||||||||||||
Accretion of discount on Series A preferred stock | 1,305 | — | — | (1,305 | ) | — | — | — | ||||||||||||||||||||
Cash dividends declared: | ||||||||||||||||||||||||||||
Series A 3% preferred-$3.00 per share | — | — | — | (5 | ) | — | — | (5 | ) | |||||||||||||||||||
Series A preferred-$53.24 per share | — | — | — | (399 | ) | — | — | (399 | ) | |||||||||||||||||||
Series B-1 8.48% preferred-$8.48 per share | — | — | — | (1,473 | ) | — | — | (1,473 | ) | |||||||||||||||||||
Common-$0.47 per share | — | — | — | (6,137 | ) | — | — | (6,137 | ) | |||||||||||||||||||
|
|
|
|
|
|
|
|
|
|
|
|
|
| |||||||||||||||
Balance at December 31, 2011 | $ | 17,473 | $ | 142 | $ | 67,247 | $ | 158,079 | $ | 945 | $ | (6,692 | ) | $ | 237,194 | |||||||||||||
|
|
|
|
|
|
|
|
|
|
|
|
|
| |||||||||||||||
Continued on next page
See accompanying notes to the consolidated financial statements.
- 66 -
FINANCIAL INSTITUTIONS, INC. AND SUBSIDIARIES
Consolidated Statements of Changes in Shareholders’ Equity (Continued)
Years ended December 31, 2010, 20092012, 2011 and 2008
| Accumulated | ||||||||||||||||||||||||||||
| Additional | Other | Total | ||||||||||||||||||||||||||
| (Dollars in thousands, | Preferred | Common | Paid-in | Retained | Comprehensive | Treasury | Shareholders’ | |||||||||||||||||||||
| except per share data) | Equity | Stock | Capital | Earnings | Income (Loss) | Stock | Equity | |||||||||||||||||||||
Balance at December 31, 2009 | $ | 53,418 | $ | 113 | $ | 26,940 | $ | 131,371 | $ | (3,702 | ) | $ | (9,846 | ) | $ | 198,294 | ||||||||||||
Balance carried forward | ||||||||||||||||||||||||||||
| Comprehensive income: | ||||||||||||||||||||||||||||
| Net income | — | — | — | 21,287 | — | — | 21,287 | |||||||||||||||||||||
| Other comprehensive loss, net of tax | — | — | — | — | (1,020 | ) | — | (1,020 | ) | |||||||||||||||||||
| Total comprehensive income | 20,267 | |||||||||||||||||||||||||||
| Purchases of treasury stock | — | — | — | — | — | (69 | ) | (69 | ) | |||||||||||||||||||
| Share-based compensation plans: | ||||||||||||||||||||||||||||
| Share-based compensation | — | — | 1,031 | — | — | — | 1,031 | |||||||||||||||||||||
| Stock options exercised | — | — | (74 | ) | — | — | 290 | 216 | ||||||||||||||||||||
| Restricted stock awards issued, net | — | — | (1,853 | ) | — | — | 1,853 | — | ||||||||||||||||||||
| Directors’ retainer | (15 | ) | 112 | 97 | ||||||||||||||||||||||||
| Accrued undeclared cumulative dividend on Series A preferred stock, net of accretion | 367 | — | — | (367 | ) | — | — | — | ||||||||||||||||||||
| Cash dividends declared: | ||||||||||||||||||||||||||||
| Series A 3% preferred-$3.00 per share | — | — | — | (5 | ) | — | — | (5 | ) | |||||||||||||||||||
| Series A preferred-$250.00 per share | — | — | — | (1,876 | ) | — | — | (1,876 | ) | |||||||||||||||||||
| Series B-1 8.48% preferred-$8.48 per share | — | — | — | (1,477 | ) | — | — | (1,477 | ) | |||||||||||||||||||
| Common-$0.40 per share | — | — | — | (4,334 | ) | — | — | (4,334 | ) | |||||||||||||||||||
Balance at December 31, 2010 | $ | 53,785 | $ | 113 | $ | 26,029 | $ | 144,599 | $ | (4,722 | ) | $ | (7,660 | ) | $ | 212,144 | ||||||||||||
(Dollars in thousands, except per share data) | Preferred Equity | Common Stock | Additional Paid-in Capital | Retained Earnings | Accumulated Other Comprehensive Income (Loss) | Treasury Stock | Total Shareholders’ Equity | |||||||||||||||||||||
Balance at December 31, 2011 | $ | 17,473 | $ | 142 | $ | 67,247 | $ | 158,079 | $ | 945 | $ | (6,692 | ) | $ | 237,194 | |||||||||||||
Balance carried forward | ||||||||||||||||||||||||||||
Comprehensive income: | ||||||||||||||||||||||||||||
Net income | — | — | — | 23,449 | — | — | 23,449 | |||||||||||||||||||||
Other comprehensive income, net of tax | — | — | — | — | 2,308 | — | 2,308 | |||||||||||||||||||||
|
| |||||||||||||||||||||||||||
Total comprehensive income | 25,757 | |||||||||||||||||||||||||||
Purchases of common stock for treasury | — | — | — | — | — | (557 | ) | (557 | ) | |||||||||||||||||||
Repurchase of Series B-1 8.48% preferred stock | (2 | ) | — | — | — | — | — | (2 | ) | |||||||||||||||||||
Share-based compensation plans: | ||||||||||||||||||||||||||||
Share-based compensation | — | — | 526 | — | — | — | 526 | |||||||||||||||||||||
Stock options exercised | — | — | (10 | ) | — | — | 79 | 69 | ||||||||||||||||||||
Restricted stock awards issued, net | — | — | (140 | ) | — | — | 140 | — | ||||||||||||||||||||
Excess tax benefit on share-based compensation | — | — | 97 | — | — | — | 97 | |||||||||||||||||||||
Directors’ retainer | — | — | (10 | ) | 107 | 97 | ||||||||||||||||||||||
Cash dividends declared: | ||||||||||||||||||||||||||||
Series A 3% Preferred-$3.00 per share | — | — | — | (5 | ) | — | — | (5 | ) | |||||||||||||||||||
Series B-1 8.48% Preferred-$8.48 per share | — | — | — | (1,469 | ) | — | — | (1,469 | ) | |||||||||||||||||||
Common-$0.57 per share | — | — | — | (7,810 | ) | — | — | (7,810 | ) | |||||||||||||||||||
|
|
|
|
|
|
|
|
|
|
|
|
|
| |||||||||||||||
Balance at December 31, 2012 | $ | 17,471 | $ | 142 | $ | 67,710 | $ | 172,244 | $ | 3,253 | $ | (6,923 | ) | $ | 253,897 | |||||||||||||
|
|
|
|
|
|
|
|
|
|
|
|
|
| |||||||||||||||
See accompanying notes to the consolidated financial statements.
- 6467 -
| Years ended December 31, | ||||||||||||
| (Dollars in thousands) | 2010 | 2009 | 2008 | |||||||||
| Cash flows from operating activities: | ||||||||||||
| Net income (loss) | $ | 21,287 | $ | 14,441 | $ | (26,158 | ) | |||||
| Adjustments to reconcile net income (loss) to net cash provided by operating activities: | ||||||||||||
| Depreciation and amortization | 3,537 | 4,067 | 3,959 | |||||||||
| Net amortization of premiums on securities | 3,005 | 2,587 | 390 | |||||||||
| Provision for loan losses | 6,687 | 7,702 | 6,551 | |||||||||
| Share-based compensation | 1,031 | 854 | 633 | |||||||||
| Deferred income tax expense (benefit) | 2,468 | 7,470 | (23,848 | ) | ||||||||
| Proceeds from sale of loans held for sale | 42,195 | 90,290 | 28,685 | |||||||||
| Originations of loans held for sale | (44,262 | ) | (88,999 | ) | (28,453 | ) | ||||||
| Increase in company owned life insurance | (1,107 | ) | (1,096 | ) | (563 | ) | ||||||
| Net gain on sale of loans held for sale | (650 | ) | (699 | ) | (339 | ) | ||||||
| Net gain on disposal of investment securities | (169 | ) | (3,429 | ) | (288 | ) | ||||||
| Impairment charges on investment securities | 594 | 4,666 | 68,215 | |||||||||
| Net loss (gain) on sale and disposal of other assets | 203 | (180 | ) | (305 | ) | |||||||
| Increase in other assets | (353 | ) | (8,773 | ) | (1,322 | ) | ||||||
| Increase (decrease) in other liabilities | 961 | (6,633 | ) | (5,866 | ) | |||||||
| Net cash provided by operating activities | 35,427 | 22,268 | 21,291 | |||||||||
| Cash flows from investing activities: | ||||||||||||
| Purchases of investment securities: | ||||||||||||
| Available for sale | (430,952 | ) | (602,259 | ) | (310,191 | ) | ||||||
| Held to maturity | (19,791 | ) | (29,280 | ) | (54,925 | ) | ||||||
| Proceeds from principal payments, maturities and calls on investment securities: | ||||||||||||
| Available for sale | 219,974 | 353,545 | 337,704 | |||||||||
| Held to maturity | 30,885 | 46,891 | 57,325 | |||||||||
| Proceeds from sales and calls of securities available for sale | 122,090 | 224,928 | 58,368 | |||||||||
| Net loan originations | (89,507 | ) | (165,716 | ) | (161,414 | ) | ||||||
| Purchases of company owned life insurance | (79 | ) | (79 | ) | (20,112 | ) | ||||||
| Proceeds from sales of other assets | 611 | 1,709 | 1,783 | |||||||||
| Purchases of premises and equipment | (2,438 | ) | (1,959 | ) | (6,333 | ) | ||||||
| Net cash used in investing activities | (169,207 | ) | (172,220 | ) | (97,795 | ) | ||||||
| Cash flows from financing activities: | ||||||||||||
| Net increase in deposits | 139,935 | 109,692 | 57,292 | |||||||||
| Net increase (decrease) in short-term borrowings | 17,567 | 36,078 | (2,178 | ) | ||||||||
| Proceeds from long-term borrowings | — | — | 30,000 | |||||||||
| Repayments of long-term borrowings | (20,080 | ) | (508 | ) | (25,212 | ) | ||||||
| Purchases of preferred and common shares | (69 | ) | — | (4,821 | ) | |||||||
| Proceeds from issuance of preferred and common shares, net of issuance costs | — | (68 | ) | 35,602 | ||||||||
| Proceeds from issuance of common stock warrant | — | �� | — | 2,025 | ||||||||
| Proceeds from stock options exercised | 216 | 15 | 32 | |||||||||
| Cash dividends paid to preferred shareholders | (3,358 | ) | (3,160 | ) | (1,482 | ) | ||||||
| Cash dividends paid to common shareholders | (4,332 | ) | (4,325 | ) | (6,240 | ) | ||||||
| Net cash provided by financing activities | 129,879 | 137,724 | 85,018 | |||||||||
| Net (decrease) increase in cash and cash equivalents | (3,901 | ) | (12,228 | ) | 8,514 | |||||||
| Cash and cash equivalents, beginning of period | 42,959 | 55,187 | 46,673 | |||||||||
| Cash and cash equivalents, end of period | $ | 39,058 | $ | 42,959 | $ | 55,187 | ||||||
| Years ended December 31, | ||||||||||||
| (Dollars in thousands) | 2012 | 2011 | 2010 | |||||||||
Cash flows from operating activities: | ||||||||||||
Net income | $ | 23,449 | $ | 22,799 | $ | 21,287 | ||||||
Adjustments to reconcile net income to net cash provided by operating activities: | ||||||||||||
Depreciation and amortization | 3,828 | 3,466 | 3,537 | |||||||||
Net amortization of premiums on securities | 5,284 | 5,722 | 3,005 | |||||||||
Provision for loan losses | 7,128 | 7,780 | 6,687 | |||||||||
Share-based compensation | 526 | 1,105 | 1,031 | |||||||||
Deferred income tax expense | 6,343 | 6,510 | 2,468 | |||||||||
Proceeds from sale of loans held for sale | 55,067 | 32,839 | 42,195 | |||||||||
Originations of loans held for sale | (52,754 | ) | (31,231 | ) | (44,262 | ) | ||||||
Increase in company owned life insurance | (1,751 | ) | (1,424 | ) | (1,107 | ) | ||||||
Net gain on sale of loans held for sale | (1,421 | ) | (880 | ) | (650 | ) | ||||||
Net gain on disposal of investment securities | (2,651 | ) | (3,003 | ) | (169 | ) | ||||||
Impairment charges on investment securities | 91 | 18 | 594 | |||||||||
Net loss (gain) on sale and disposal of other assets | 381 | (67 | ) | 203 | ||||||||
Contributions to defined benefit pension plan | (8,000 | ) | (10,000 | ) | (4,300 | ) | ||||||
Loss on extinguishment of debt | — | 1,083 | — | |||||||||
Increase in other assets | (4,249 | ) | (7,756 | ) | (353 | ) | ||||||
Increase in other liabilities | 7,429 | 5,057 | 5,261 | |||||||||
|
|
|
|
|
| |||||||
Net cash provided by operating activities | 38,700 | 32,018 | 35,427 | |||||||||
|
|
|
|
|
| |||||||
Cash flows from investing activities: | ||||||||||||
Purchases of investment securities: | ||||||||||||
Available for sale | (322,191 | ) | (158,013 | ) | (430,952 | ) | ||||||
Held to maturity | (15,484 | ) | (17,188 | ) | (19,791 | ) | ||||||
Proceeds from principal payments, maturities and calls on investment securities: | ||||||||||||
Available for sale | 175,679 | 168,976 | 219,974 | |||||||||
Held to maturity | 20,819 | 21,986 | 30,885 | |||||||||
Proceeds from sales of securities available for sale | 2,823 | 44,514 | 122,090 | |||||||||
Net increase in loans, excluding sales | (151,311 | ) | (157,110 | ) | (89,507 | ) | ||||||
Loans sold or participated to others | — | 13,033 | — | |||||||||
Purchases of company owned life insurance | (79 | ) | (18,079 | ) | (79 | ) | ||||||
Proceeds from sales of other assets | 734 | 705 | 611 | |||||||||
Purchases of premises and equipment | (5,840 | ) | (3,678 | ) | (2,438 | ) | ||||||
Net cash received in branch acquisitions | 195,778 | — | — | |||||||||
|
|
|
|
|
| |||||||
Net cash used in investing activities | (99,072 | ) | (104,854 | ) | (169,207 | ) | ||||||
|
|
|
|
|
| |||||||
Cash flows from financing activities: | ||||||||||||
Net increase in deposits | 43,376 | 48,709 | 139,935 | |||||||||
Net increase in short-term borrowings | 29,108 | 73,588 | 17,567 | |||||||||
Repayments of long-term borrowings | — | (26,767 | ) | (20,080 | ) | |||||||
Proceeds from issuance of common stock, net of issuance costs | — | 43,127 | — | |||||||||
Purchases of common stock for treasury | (557 | ) | (215 | ) | (69 | ) | ||||||
Repurchase of preferred stock | (2 | ) | (37,549 | ) | — | |||||||
Repurchase of warrant issued to U.S. Treasury | — | (2,080 | ) | — | ||||||||
Proceeds from stock options exercised | 69 | 91 | 216 | |||||||||
Excess tax benefit on share-based compensation | 97 | 21 | — | |||||||||
Cash dividends paid to preferred shareholders | (1,474 | ) | (2,118 | ) | (3,358 | ) | ||||||
Cash dividends paid to common shareholders | (7,392 | ) | (5,446 | ) | (4,332 | ) | ||||||
|
|
|
|
|
| |||||||
Net cash provided by financing activities | 63,225 | 91,361 | 129,879 | |||||||||
|
|
|
|
|
| |||||||
Net increase (decrease) in cash and cash equivalents | 2,853 | 18,525 | (3,901 | ) | ||||||||
Cash and cash equivalents, beginning of period | 57,583 | 39,058 | 42,959 | |||||||||
|
|
|
|
|
| |||||||
Cash and cash equivalents, end of period | $ | 60,436 | $ | 57,583 | $ | 39,058 | ||||||
|
|
|
|
|
| |||||||
See accompanying notes to the consolidated financial statements.
- 6568 -
December 31, 2010, 20092012, 2011 and 2008
(1.) SUMMARY OF SIGNIFICANT ACCOUNTING POLICIES
Financial Institutions, Inc., a financial holding company organized under the laws of New York State (“New York” or “NYS”), and its subsidiaries provide deposit, lending and other financial services to individuals and businesses in WesternCentral and CentralWestern New York. The Company has also expanded its indirect lending network to include relationships with franchised automobile dealers in the Capital District of New York and Northern Pennsylvania. Financial Institutions, Inc. owns 100%all of the capital stock of Five Star Bank, a New York State chartered bank, and Five Star Investment Services, Inc., a broker-dealerfinancial services subsidiary offering noninsured investment products. The Company also owns 100% of FISI Statutory Trust I (the “Trust”), which was formed in February 2001 for the purpose of issuing trust preferred securities.products and investment advisory services. References to “the Company” mean the consolidated reporting entities and references to “the Bank” mean Five Star Bank.
The accounting and reporting policies conform to general practices within the banking industry and to U.S. generally accepted accounting principles (“GAAP”). Prior years’ consolidated financial statements are re-classified whenever necessary to conform to the current year’s presentation.
The Company has evaluated events and transactions for potential recognition or disclosure through the day the financial statements were issued.
The following is a description of the Company’s significant accounting policies.
(a.) Principles of Consolidation
The consolidated financial statements include the accounts of the Company and its subsidiaries. All significant intercompany accounts and transactions have been eliminated in consolidation.
(b.) Use of Estimates
In preparing the consolidated financial statements in conformity with GAAP, management is required to make estimates and assumptions that affect the reported amount of assets and liabilities as of the date of the statement of financial condition and reported amounts of revenue and expenses during the reporting period. Material estimates relate to the determination of the allowance for loan losses, the carrying value of goodwill and deferred tax assets, the valuation and other than temporary impairment (“OTTI”) considerations related to the securities portfolio, and assumptions used in the defined benefit pension plan accounting. These estimates and assumptions are based on management’s best estimates and judgment and are evaluated on an ongoing basis using historical experience and other factors, including the current economic environment. The Company adjusts these estimates and assumptions when facts and circumstances dictate. As future events cannot be determined with precision, actual results could differ significantly from the Company’s estimates.
(c.) Cash Flow Reporting
Cash and cash equivalents include cash and due from banks, federal funds sold and interest-bearing deposits in other banks. Net cash flows are reported for loans, deposit transactions and short-term borrowings.
Supplemental cash flow information is summarized as follows for the years ended December 31 (in thousands):
| 2012 | 2011 | 2010 | ||||||||||
Cash payments: | ||||||||||||
Interest expense | $ | 10,438 | $ | 15,668 | $ | 17,676 | ||||||
Income taxes | 4,014 | 5,191 | 6,923 | |||||||||
Noncash investing and financing activities: | ||||||||||||
Real estate and other assets acquired in settlement of loans | $ | 322 | $ | 305 | $ | 561 | ||||||
Accrued and declared unpaid dividends | 2,562 | 2,144 | 1,694 | |||||||||
Accretion of preferred stock discount | — | 1,305 | 367 | |||||||||
Increase (decrease) in net unsettled security purchases | 51,135 | (67 | ) | (317 | ) | |||||||
Net transfer of portfolio loans to held for sale | — | 13,576 | — | |||||||||
Assets acquired and liabilities assumed in branch acquisition: | ||||||||||||
Loans and other non-cash assets, excluding goodwill and core deposit intangible asset | 77,912 | — | — | |||||||||
Deposits and other liabilities | 287,331 | — | — | |||||||||
- 69 -
FINANCIAL INSTITUTIONS, INC. AND SUBSIDIARIES
NOTES TO CONSOLIDATED FINANCIAL STATEMENTS
December 31, 2012, 2011 and 2010
| (1.) |
| 2010 | 2009 | 2008 | ||||||||||
| Cash paid during the year for: | ||||||||||||
| Interest expense | $ | 17,676 | $ | 21,682 | $ | 37,160 | ||||||
| Income taxes, net of income tax refunds | 6,923 | (1,312 | ) | 3,797 | ||||||||
| Non-cash activity: | ||||||||||||
| Real estate and other assets acquired in settlement of loans | $ | 561 | $ | 1,096 | $ | 1,185 | ||||||
| Dividends declared and unpaid | 1,694 | 1,692 | 1,497 | |||||||||
| (Decrease) increase in net unsettled security purchases | (317 | ) | (1,348 | ) | 1,453 | |||||||
| Loans securitized and sold | — | 15,983 | — | |||||||||
(d.) Investment Securities
- 66 -
| Purchase premiums and discounts are recognized in interest income using the interest method over the terms of the securities. Securities are evaluated periodically to determine whether a decline in their fair value is other than temporary. Management utilizes criteria such as, the current intent to hold or sell the security, the magnitude and duration of the decline and, when appropriate, consideration of negative changes in expected cash flows, creditworthiness, near term prospects of issuers, the level of credit subordination, estimated loss severity, and delinquencies, to determine whether a loss in value is other than temporary. The term “other than temporary” is not intended to indicate that the decline is permanent, but indicates that the prospect for a near-term recovery of value is not necessarily favorable. Declines in the fair value of investment |
- 67 -
- 68 -
- 69 -
- 70 -
- 71 -
- 72 -
| December 31, 2010 | ||||||||||||||||
| Amortized | Unrealized | Unrealized | Fair | |||||||||||||
| Cost | Gains | Losses | Value | |||||||||||||
Securities available for sale: | ||||||||||||||||
| U.S. Government agencies and government sponsored enterprises | $ | 141,591 | $ | 1,158 | $ | 1,965 | $ | 140,784 | ||||||||
| State and political subdivisions | 105,622 | 1,516 | 1,472 | 105,666 | ||||||||||||
| Mortgage-backed securities: | ||||||||||||||||
| Federal National Mortgage Association | 96,300 | 798 | 1,030 | 96,068 | ||||||||||||
| Federal Home Loan Mortgage Corporation | 83,745 | 321 | 1,317 | 82,749 | ||||||||||||
| Government National Mortgage Association | 102,633 | 2,422 | 7 | 105,048 | ||||||||||||
| Collateralized mortgage obligations: | ||||||||||||||||
| Federal National Mortgage Association | 8,938 | 231 | 11 | 9,158 | ||||||||||||
| Federal Home Loan Mortgage Corporation | 15,917 | 329 | 1 | 16,245 | ||||||||||||
| Government National Mortgage Association | 106,969 | 1,761 | 289 | 108,441 | ||||||||||||
| Privately issued | 981 | 591 | — | 1,572 | ||||||||||||
| Total collateralized mortgage obligations | 132,805 | 2,912 | 301 | 135,416 | ||||||||||||
| Total mortgage-backed securities | 415,483 | 6,453 | 2,655 | 419,281 | ||||||||||||
| Asset-backed securities | 564 | 204 | 131 | 637 | ||||||||||||
| Total available for sale securities | $ | 663,260 | $ | 9,331 | $ | 6,223 | $ | 666,368 | ||||||||
Securities held to maturity: | ||||||||||||||||
| State and political subdivisions | $ | 28,162 | $ | 687 | $ | — | $ | 28,849 | ||||||||
| December 31, 2009 | ||||||||||||||||
| Amortized | Unrealized | Unrealized | Fair | |||||||||||||
| Cost | Gains | Losses | Value | |||||||||||||
Securities available for sale: | ||||||||||||||||
| U.S. Government agencies and government sponsored enterprises | $ | 134,564 | $ | 86 | $ | 545 | $ | 134,105 | ||||||||
| State and political subdivisions | 80,812 | 2,850 | 3 | 83,659 | ||||||||||||
| Mortgage-backed securities: | ||||||||||||||||
| Federal National Mortgage Association | 75,108 | 629 | 259 | 75,478 | ||||||||||||
| Federal Home Loan Mortgage Corporation | 37,321 | 413 | 56 | 37,678 | ||||||||||||
| Government National Mortgage Association | 110,576 | 97 | 342 | 110,331 | ||||||||||||
| Collateralized mortgage obligations: | ||||||||||||||||
| Federal National Mortgage Association | 16,274 | 250 | 94 | 16,430 | ||||||||||||
| Federal Home Loan Mortgage Corporation | 20,879 | 504 | 14 | 21,369 | ||||||||||||
| Government National Mortgage Association | 95,886 | 56 | 873 | 95,069 | ||||||||||||
| Privately issued | 5,087 | 403 | 330 | 5,160 | ||||||||||||
| Total collateralized mortgage obligations | 138,126 | 1,213 | 1,311 | 138,028 | ||||||||||||
| Total mortgage-backed securities | 361,131 | 2,352 | 1,968 | 361,515 | ||||||||||||
| Asset-backed securities | 1,295 | 171 | 244 | 1,222 | ||||||||||||
| Total available for sale securities | $ | 577,802 | $ | 5,459 | $ | 2,760 | $ | 580,501 | ||||||||
Securities held to maturity: | ||||||||||||||||
| State and political subdivisions | $ | 39,573 | $ | 1,056 | $ | — | $ | 40,629 | ||||||||
- 73 -
| 2010 | 2009 | 2008 | ||||||||||
| Taxable interest and dividends | $ | 17,101 | $ | 16,466 | $ | 21,882 | ||||||
| Tax-exempt interest and dividends | 3,521 | 5,228 | 8,773 | |||||||||
| Total interest and dividends on securities | $ | 20,622 | $ | 21,694 | $ | 30,655 | ||||||
| 2010 | 2009 | 2008 | ||||||||||
| Proceeds from sales and calls | $ | 122,090 | $ | 224,928 | $ | 58,368 | ||||||
| Gross realized gains | 173 | 6,826 | 291 | |||||||||
| Gross realized losses | 4 | 3,397 | 3 | |||||||||
| Amortized | Fair | |||||||
| Cost | Value | |||||||
Debt securities available for sale: | ||||||||
| Due in one year or less | $ | 25,689 | $ | 25,952 | ||||
| Due from one to five years | 114,924 | 117,338 | ||||||
| Due after five years through ten years | 223,692 | 218,640 | ||||||
| Due after ten years | 298,955 | 304,438 | ||||||
| $ | 663,260 | $ | 666,368 | |||||
Debt securities held to maturity: | ||||||||
| Due in one year or less | $ | 21,439 | $ | 21,583 | ||||
| Due from one to five years | 5,490 | 5,856 | ||||||
| Due after five years through ten years | 1,055 | 1,205 | ||||||
| Due after ten years | 178 | 205 | ||||||
| $ | 28,162 | $ | 28,849 | |||||
- 74 -
| December 31, 2010 | ||||||||||||||||||||||||
| Less than 12 months | 12 months or longer | Total | ||||||||||||||||||||||
| Fair | Unrealized | Fair | Unrealized | Fair | Unrealized | |||||||||||||||||||
| Value | Losses | Value | Losses | Value | Losses | |||||||||||||||||||
Securities available for sale: | ||||||||||||||||||||||||
| U.S. Government agencies and government sponsored enterprises | $ | 47,752 | $ | 1,911 | $ | 8,821 | $ | 54 | $ | 56,573 | $ | 1,965 | ||||||||||||
| State and political subdivisions | 38,398 | 1,472 | — | — | 38,398 | 1,472 | ||||||||||||||||||
| Mortgage-backed securities: | ||||||||||||||||||||||||
| Federal National Mortgage Association | 46,777 | 1,030 | — | — | 46,777 | 1,030 | ||||||||||||||||||
| Federal Home Loan Mortgage Corporation | 60,707 | 1,317 | — | — | 60,707 | 1,317 | ||||||||||||||||||
| Government National Mortgage Association | 5,135 | 7 | — | — | 5,135 | 7 | ||||||||||||||||||
| Collateralized mortgage obligations: | ||||||||||||||||||||||||
| Federal National Mortgage Association | — | — | 2,332 | 11 | 2,332 | 11 | ||||||||||||||||||
| Federal Home Loan Mortgage Corporation | 612 | 1 | — | — | 612 | 1 | ||||||||||||||||||
| Government National Mortgage Association | 17,798 | 289 | — | — | 17,798 | 289 | ||||||||||||||||||
| Total collateralized mortgage obligations | 18,410 | 290 | 2,332 | 11 | 20,742 | 301 | ||||||||||||||||||
| Total mortgage-backed securities | 131,029 | 2,644 | 2,332 | 11 | 133,361 | 2,655 | ||||||||||||||||||
| Asset-backed securities | 111 | 61 | 96 | 70 | 207 | 131 | ||||||||||||||||||
Total temporarily impaired securities | $ | 217,290 | $ | 6,088 | $ | 11,249 | $ | 135 | $ | 228,539 | $ | 6,223 | ||||||||||||
| December 31, 2009 | ||||||||||||||||||||||||
| Less than 12 months | 12 months or longer | Total | ||||||||||||||||||||||
| Fair | Unrealized | Fair | Unrealized | Fair | Unrealized | |||||||||||||||||||
| Value | Losses | Value | Losses | Value | Losses | |||||||||||||||||||
Securities available for sale: | ||||||||||||||||||||||||
| U.S. Government agencies and government sponsored enterprises | $ | 83,480 | $ | 360 | $ | 10,003 | $ | 185 | $ | 93,483 | $ | 545 | ||||||||||||
| State and political subdivisions | — | — | 150 | 3 | 150 | 3 | ||||||||||||||||||
| Mortgage-backed securities: | ||||||||||||||||||||||||
| Federal National Mortgage Association | 24,964 | 258 | 643 | 1 | 25,607 | 259 | ||||||||||||||||||
| Federal Home Loan Mortgage Corporation | 5,627 | 56 | — | — | 5,627 | 56 | ||||||||||||||||||
| Government National Mortgage Association | 55,304 | 342 | — | — | 55,304 | 342 | ||||||||||||||||||
| Collateralized mortgage obligations: | ||||||||||||||||||||||||
| Federal National Mortgage Association | 353 | 2 | 5,384 | 92 | 5,737 | 94 | ||||||||||||||||||
| Federal Home Loan Mortgage Corporation | 490 | 1 | 814 | 13 | 1,304 | 14 | ||||||||||||||||||
| Government National Mortgage Association | 79,645 | 873 | — | — | 79,645 | 873 | ||||||||||||||||||
| Privately issued | — | — | 2,985 | 330 | 2,985 | 330 | ||||||||||||||||||
| Total collateralized mortgage obligations | 80,488 | 876 | 9,183 | 435 | 89,671 | 1,311 | ||||||||||||||||||
| Total mortgage-backed securities | 166,383 | 1,532 | 9,826 | 436 | 176,209 | 1,968 | ||||||||||||||||||
| Asset-backed securities | 278 | 244 | — | — | 278 | 244 | ||||||||||||||||||
Total temporarily impaired securities | $ | 250,141 | $ | 2,136 | $ | 19,979 | $ | 624 | $ | 270,120 | $ | 2,760 | ||||||||||||
- 75 -
(e.) Loans Held for Sale and Loan Servicing Rights
The Company generally makes the determination of whether to identify a mortgage as held for sale at the impairmenttime the loan is closed based on the Company’s intent and ability to hold the loan. Loans held for sale are recorded at the lower of cost or market computed on the aggregate portfolio basis. The amount, by which cost exceeds market value, if any, is accounted for as a debt securityvaluation allowance with changes included in the determination of results of operations for the period in which the change occurs. The amount of loan origination cost and fees are deferred at origination of the loans and recognized as part of the gain or loss on sale of the loans, determined using the specific identification method, in the consolidated statements of income.
The Company originates and sells certain residential real estate loans in the secondary market. The Company typically retains the right to service the mortgages upon sale. Mortgage-servicing rights (“MSRs”) represent the cost of acquiring the contractual rights to service loans for others. MSRs are recorded at their fair value at the time a loan is sold and servicing rights are retained. MSRs are reported in other than temporary involves assessing i.)assets in the intentconsolidated statements of financial position and are amortized to sellnoninterest income in the debt security or ii.)consolidated statements of income in proportion to and over the likelihoodperiod of being required to sell the security before the recovery of its amortized cost basis. In determining whether the OTTI includes a credit loss, theestimated net servicing income. The Company uses its best estimate ofa valuation model that calculates the present value of future cash flows to determine the fair value of servicing rights. In using this valuation method, the Company incorporates assumptions to estimate future net servicing income, which include estimates of the cost to service the loan, the discount rate, an inflation rate and prepayment speeds. On a quarterly basis, the Company evaluates its MSRs for impairment and charges any such impairment to current period earnings. In order to evaluate its MSRs the Company stratifies the related mortgage loans on the basis of their predominant risk characteristics, such as interest rates, year of origination and term, using discounted cash flows and market-based assumptions. Impairment of MSRs is recognized through a valuation allowance, determined by estimating the fair value of each stratum and comparing it to its carrying value. Subsequent increases in fair value are adjusted through the valuation allowance, but only to the extent of the valuation allowance. No impairment loss related to the MSRs was recognized during the years ended December 31, 2012 or 2010. The Company recognized an impairment loss related to the MSRs of $35 thousand during the year ended December 31, 2011.
Mortgage loan servicing includes collecting monthly mortgagor payments, forwarding payments and related accounting reports to investors, collecting escrow deposits for the payment of mortgagor property taxes and insurance, and paying taxes and insurance from escrow funds when due. Loan servicing income (a component of noninterest income in the consolidated statements of income) consists of fees earned for servicing mortgage loans sold to third parties, net of amortization expense and impairment losses associated with capitalized mortgage servicing assets.
- 70 -
FINANCIAL INSTITUTIONS, INC. AND SUBSIDIARIES
NOTES TO CONSOLIDATED FINANCIAL STATEMENTS
December 31, 2012, 2011 and 2010
| (1.) | SUMMARY OF SIGNIFICANT ACCOUNTING POLICIES (Continued) |
Automobile loan servicing rights are accounted for using the amortization method. A servicing asset is established at fair value at the time of the sale. The servicing asset is reported in other assets in the consolidated statements of financial position and amortized to noninterest income in the consolidated statements of income in proportion to and over the period of estimated net servicing income. Impairment, if any, is recognized when carrying value exceeds the fair value as determined by calculating the present value of expected net future cash flows. The primary risk characteristic for measuring servicing assets is payoff rates of the underlying loan pools. Valuation calculations rely on the predicted payoff assumption and, if actual payoff is quicker than expected, then future value would be impaired. Management reviewed the servicing asset related to the automobile loan servicing rights for impairment as of December 31, 2012 and determined that no valuation allowance was necessary.
(f.) Loans
Loans are classified as held for investment when management has both the intent and ability to hold the loan for the foreseeable future, or until maturity or payoff. Loans are carried at the principal amount outstanding, net of any unearned income and unamortized deferred fees and costs on originated loans. Loan origination fees and certain direct loan origination costs are deferred, and the net amount is amortized into net interest income over the contractual life of the related loans or over the commitment period as an adjustment of yield. Interest income on loans is based on the principal balance outstanding computed using the effective interest method.
A loan is considered delinquent when a payment has not been received in accordance with the contractual terms. The accrual of interest income for commercial loans is discontinued when there is a clear indication that the borrower’s cash flow may not be sufficient to meet payments as they become due, while the accrual of interest income for retail loans is discontinued when loans reach specific delinquency levels. Loans are generally placed on nonaccrual status when contractually past due 90 days or more as to interest or principal payments, unless the loan is well secured and in the process of collection. Additionally, if management becomes aware of facts or circumstances that may adversely impact the collectability of principal or interest on loans, it is management’s practice to place such loans on a nonaccrual status immediately, rather than delaying such action until the loans become 90 days past due. When a loan is placed on nonaccrual status, previously accrued and uncollected interest is reversed, amortization of related deferred loan fees or costs is suspended, and income is recorded only to the extent that interest payments are subsequently received in cash and a determination has been made that the principal balance of the loan is collectible. If collectability of the principal is in doubt, payments received are applied to loan principal. A nonaccrual loan may be returned to accrual status when all delinquent principal and interest payments become current in accordance with the terms of the loan agreement, the borrower has demonstrated a period of sustained performance (generally a minimum of six months) and the ultimate collectability of the total contractual principal and interest is no longer in doubt.
The Company’s loan policy dictates the guidelines to be followed in determining when a loan is charged-off. All charge offs are approved by the Bank’s senior loan officers or loan committees, depending on the amount of the charge off, and are reported in aggregate to the Bank’s Board of Directors. Commercial business and commercial mortgage loans are charged-off when a determination is made that the financial condition of the borrower indicates that the loan will not be collectible in the ordinary course of business. Residential mortgage loans and home equities are generally charged-off or written down when the credit becomes severely delinquent and the balance exceeds the fair value of the property less costs to sell. Indirect and other consumer loans, both secured and unsecured, are generally charged-off in full during the month in which the loan becomes 120 days past due, unless the collateral is in the process of repossession in accordance with the Company’s policy.
A loan is accounted for as a troubled debt restructuring if the Company, for economic or legal reasons related to the borrower’s financial condition, grants a significant concession to the borrower that it would not otherwise consider. A troubled debt restructuring may involve the receipt of assets from the debtor in partial or full satisfaction of the loan, or a modification of terms such as a reduction of the stated interest rate or face amount of the loan, a reduction of accrued interest, an extension of the maturity date at a stated interest rate lower than the current market rate for a new loan with similar risk, or some combination of these concessions. Troubled debt restructurings generally remain on nonaccrual status until there is a sustained period of payment performance (usually six months or longer) and there is a reasonable assurance that the payments will continue. See Allowance for Loan Losses below for further policy discussion and see Note 5 – Loans for additional information.
- 71 -
FINANCIAL INSTITUTIONS, INC. AND SUBSIDIARIES
NOTES TO CONSOLIDATED FINANCIAL STATEMENTS
December 31, 2012, 2011 and 2010
| (1.) | SUMMARY OF SIGNIFICANT ACCOUNTING POLICIES (Continued) |
(g.) Off-Balance Sheet Financial Instruments
In the ordinary course of business, the Company enters into off-balance sheet financial instruments consisting of commitments to extend credit, standby letters of credit and financial guarantees. Such financial instruments are recorded in the consolidated financial statements when they are funded or when related fees are incurred or received. The Company periodically evaluates the credit risks inherent in these commitments and establishes loss allowances for such risks if and when these are deemed necessary.
The Company recognizes as liabilities the fair value of the obligations undertaken in issuing the guarantees under the standby letters of credit, net of the related amortization at inception. The fair value approximates the unamortized fees received from the customers for issuing the standby letters of credit. The fees are deferred and recognized on a straight-line basis over the commitment period. Standby letters of credit outstanding at December 31, 2012 had original terms ranging from one to five years.
Fees received for providing loan commitments and letters of credit that result in loans are typically deferred and amortized to interest income over the life of the related loan, beginning with the initial borrowing. Fees on commitments and letters of credit are amortized to other income as banking fees and commissions over the commitment period when funding is not expected.
(h.) Allowance for Loan Losses
The allowance for loan losses is established through charges to earnings in the form of a provision for loan losses. When a loan or portion of a loan is determined to be uncollectible, the portion deemed uncollectible is charged against the allowance and subsequent recoveries, if any, are credited to the allowance.
The allowance for loan losses is evaluated on a regular basis and is based upon periodic review of the collectability of the loans in light of historical experience, the nature and volume of the loan portfolio, adverse situations that may affect the borrower’s ability to repay, estimated value of any underlying collateral, and prevailing economic conditions. This evaluation is inherently subjective as it requires estimates that are susceptible to significant revision as more information becomes available.
The allowance consists of specific and general components. Specific allowances are established for impaired loans. Impaired commercial business and commercial mortgage loans are individually evaluated and measured for impairment based on the present value of expected future cash flows discounted at the loan’s effective interest rate, a loan’s observable market price, or the fair value of the collateral if the loan is collateral dependent. Regardless of the measurement method, impairment is based on the fair value of the collateral when foreclosure is probable. If the recorded investment in impaired loans exceeds the measure of estimated fair value, a specific allowance is established as a component of the allowance for loan losses. Interest payments on impaired loans are typically applied to principal unless collectability of the principal amount is reasonably assured, in which case interest is recognized on a cash basis. Impaired loans, or portions thereof, are charged-off when deemed uncollectible.
A loan is considered impaired when, based on current information and events, it is probable that the Company will be unable to collect the scheduled payments of principal or interest when due according to the contractual terms of the loan agreement. Factors considered in determining impairment include payment status and the probability of collecting scheduled principal and interest payments when due. Loans that experience insignificant payment delays and payment shortfalls generally are not classified as impaired. The Company determines the significance of payment delays and payment shortfalls on a case-by-case basis, taking into consideration all of the circumstances surrounding the loan and the borrower, including the length of the delay, the reasons for the delay, the borrower’s prior payment record, and the amount of the shortfall in relation to the principal and interest owed. Impairment is measured on a loan by loan basis by either the present value of expected future cash flows discounted at the loan’s effective interest rate, the loans obtainable market price, or the fair value of the collateral if the loan is collateral dependent. Large groups of homogeneous loans are collectively evaluated for impairment. Accordingly, the Company does not separately identify individual consumer and residential loans for impairment disclosures unless the loan has been subject to a troubled debt restructure. At December 31, 2012, there were no commitments to lend additional funds to those borrowers whose loans were classified as impaired.
- 72 -
FINANCIAL INSTITUTIONS, INC. AND SUBSIDIARIES
NOTES TO CONSOLIDATED FINANCIAL STATEMENTS
December 31, 2012, 2011 and 2010
| (1.) | SUMMARY OF SIGNIFICANT ACCOUNTING POLICIES (Continued) |
General allowances are established for loan losses on a portfolio basis for loans that do not meet the definition of impaired. The portfolio is grouped into similar risk characteristics, primarily loan type. The Company applies an estimated loss rate to each loan group. The loss rate is based on historical experience and as a result can differ from actual losses incurred in the future. The historical loss rate is adjusted for qualitative factors such as levels and trends of delinquent and non-accruing loans, trends in volume and terms, effects of changes in lending policy, the experience, ability and depth of management, national and local economic trends and conditions, concentrations of credit risk, interest rates, highly leveraged borrowers, information risk and collateral risk. The qualitative factors are reviewed at least quarterly and adjustments are made as needed.
While management evaluates currently available information in establishing the allowance for loan losses, future adjustments to the allowance may be necessary if conditions differ substantially from the assumptions used in making the evaluations. In addition, various regulatory agencies, as an integral part of their examination process, periodically review a financial institution’s allowance for loan losses. Such agencies may require the financial institution to recognize additions to the allowance based on their judgments about information available to them at the time of their examination.
(i.) Other Real Estate Owned
Other real estate owned consists of properties acquired through foreclosure or by acceptance of a deed in lieu of foreclosure. These assets are recorded at the lower of fair value of the asset acquired less estimated costs to sell or “cost” (defined as the fair value at initial foreclosure). At the time of foreclosure, or when foreclosure occurs in-substance, the excess, if any, of the loan over the fair market value of the assets received, less estimated selling costs, is charged to the allowance for loan losses and any subsequent valuation write-downs are charged to other expense. In connection with the determination of the allowance for loan losses and the valuation of other real estate owned, management obtains appraisals for properties. Operating costs associated with the properties are charged to expense as incurred. Gains on the sale of other real estate owned are included in income when title has passed and the sale has met the minimum down payment requirements prescribed by GAAP. The balance of other real estate owned was $184 thousand and $475 thousand at December 31, 2012 and 2011, respectively.
(j.) Company Owned Life Insurance
The Company holds life insurance policies on certain current and former employees. The Company is the owner and beneficiary of the policies. The cash surrender value of these policies is included as an asset on the consolidated statements of financial condition, and any increase in cash surrender value is recorded as noninterest income on the consolidated statements of income. In the event of the death of an insured individual under these policies, the Company would receive a death benefit which would be recorded as noninterest income.
(k.) Premises and Equipment
Premises and equipment are stated at cost, less accumulated depreciation and amortization. Depreciation is computed on the straight-line method over the estimated useful lives of the assets. The Company generally amortizes buildings and building improvements over a period of 15 to 39 years and software, furniture and equipment over a period of 3 to 10 years. Leasehold improvements are amortized over the shorter of the lease term or the useful life of the improvements. Premises and equipment are periodically reviewed for impairment or when circumstances present indicators of impairment.
(l.) Goodwill and Other Intangible Assets
Goodwill represents the excess of the purchase price over the fair value of net assets acquired in accordance with the purchase method of accounting for business combinations. Goodwill has an indefinite useful life and is not amortized, but is tested for impairment. GAAP requires goodwill to be tested for impairment at the Company’s reporting unit level on an annual basis, which for the Company is September 30th, and more frequently if events or circumstances indicate that there may be impairment. Currently, the Company’s goodwill is evaluated at the entity level as there is only one reporting unit.
- 73 -
FINANCIAL INSTITUTIONS, INC. AND SUBSIDIARIES
NOTES TO CONSOLIDATED FINANCIAL STATEMENTS
December 31, 2012, 2011 and 2010
| (1.) | SUMMARY OF SIGNIFICANT ACCOUNTING POLICIES (Continued) |
Impairment exists when a reporting unit’s carrying value of goodwill exceeds its implied fair value. In testing goodwill for impairment, GAAP permits the Company to first assess qualitative factors to determine whether it is more likely than not that the fair value of a reporting unit is less than its carrying value. If, after assessing the totality of events and circumstances, the Company determines it is not more likely than not that the fair value of a reporting unit is less than its carrying value, then performing the two-step impairment test would be unnecessary. However, if the Company concludes otherwise, it would then be required to perform the first step (Step 1) of the goodwill impairment test, and continue to the second step (Step 2), if necessary. Step 1 compares the fair value of a reporting unit with its carrying value, including goodwill. If the carrying value of the reporting unit exceeds its fair value, Step 2 of the goodwill impairment test is performed to measure the amount of impairment loss, if any.
Intangible assets are acquired assets that lack physical substance but can be distinguished from goodwill because of contractual or other legal rights or because the asset is capable of being sold or exchanged either on its own or in combination with a related contract, asset, or liability. The Company’s intangible assets relate to core deposits. Intangible assets with definite useful lives are amortized on an accelerated basis over their estimated life of approximately nine and a half years. Intangible assets with indefinite useful lives are not amortized until their lives are determined to be definite. Intangible assets are tested for impairment whenever events or changes in circumstances indicate the carrying amount of the assets may not be recoverable from future undiscounted cash flows. If impaired, the assets are recorded at fair value. See Note 7—Goodwill and Other Intangible Assets.
(m.) Federal Home Loan Bank (“FHLB”) and Federal Reserve Bank (“FRB”) Stock
The non-marketable investments in FHLB and FRB stock are included in other assets in the consolidated statements of financial condition at par value or cost and are periodically reviewed for impairment. The dividends received relative to these investments are included in other noninterest income in the consolidated statements of income.
As a member of the FHLB system, the Company is required to maintain a specified investment in FHLB of New York (“FHLBNY”) stock in proportion to its volume of certain transactions with the FHLB. FHLBNY stock totaled $8.4 million and $6.8 million as of December 31, 2012 and 2011, respectively.
As a member of the FRB system, the Company is required to maintain a specified investment in FRB stock based on a ratio relative to the Company’s capital. FRB stock totaled $3.9 million as of December 31, 2012 and 2011.
(n.) Equity Method Investments
The Company has investments in limited partnerships and accounts for these investments under the equity method. These investments are included in other assets in the consolidated statements of financial condition and totaled $4.7 million and $4.0 million as of December 31, 2012 and 2011, respectively.
(o.) Treasury Stock
Acquisitions of treasury stock are recorded at cost. The reissuance of shares in treasury is recorded at weighted-average cost.
(p.) Employee Benefits
The Company participates in a non-contributory defined benefit pension plan for certain employees who previously met participation requirements. The Company also provides post-retirement benefits, principally health and dental care, to employees of a previously acquired entity. The Company has closed the pension and post-retirement plans to new participants. The actuarially determined pension benefit is based on years of service and the employee’s highest average compensation during five consecutive years of employment. The Company’s policy is to at least fund the minimum amount required by the Employment Retirement Income Security Act of 1974. The cost of the pension and post-retirement plans are based on actuarial computations of current and future benefits for employees, and is charged to noninterest expense in the consolidated statements of income.
The Company recognizes an asset or a liability for a plans’ overfunded status or underfunded status, respectively, in the consolidated financial statements and reports changes in the funded status as a component of other comprehensive income, net of applicable taxes, in the year in which changes occur.
- 74 -
FINANCIAL INSTITUTIONS, INC. AND SUBSIDIARIES
NOTES TO CONSOLIDATED FINANCIAL STATEMENTS
December 31, 2012, 2011 and 2010
| (1.) | SUMMARY OF SIGNIFICANT ACCOUNTING POLICIES (Continued) |
(q.) Share-Based Compensation Plans
Compensation expense for stock options and restricted stock awards is based on the fair value of the award on the measurement date, which, for the Company, is the date of grant and is recognized ratably over the service period of the award. The fair value of stock options is estimated using the Black-Scholes option-pricing model. The fair value of restricted stock awards is generally the market price of the Company’s stock on the date of grant.
Share-based compensation expense is included in the consolidated statements of income under salaries and employee benefits for awards granted to management and in other noninterest expense for awards granted to directors.
(r.) Income Taxes
Income taxes are accounted for using the asset and liability method. Deferred tax assets and liabilities are recognized for the future tax consequences attributable to differences between the financial statement carrying amounts of existing assets and liabilities and their respective tax bases. Deferred tax assets and liabilities are measured using enacted tax rates in effect for the year in which those temporary differences are expected to be collectedrecovered or settled. The effect of a change in tax rates on deferred tax assets and liabilities is recognized in income in the period that includes the enactment date. A valuation allowance is recognized on deferred tax assets if, based upon the weight of available evidence, it is more likely than not that some or all of the assets may not be realized. The Company recognizes interest and/or penalties related to income tax matters in income tax expense.
(s.) Earnings Per Common Share
The Company calculates earnings per common share (“EPS”) using the two-class method in accordance with Financial Accounting Standards Board (“FASB”) Accounting Standards Codification (“ASC”) Topic 260, “Earnings Per Share”. The two-class method requires the Company to present EPS as if all of the earnings for the period are distributed to common shareholders and any participating securities, regardless of whether any actual dividends or distributions are made. All outstanding unvested share-based payment awards that contain rights to nonforfeitable dividends are considered participating securities. Certain of the restricted shares issued under the Company’s share-based compensation plan are entitled to dividends at the same rate as common stock. The Company has determined that these outstanding non-vested stock awards qualify as participating securities.
Basic EPS is computed by dividing distributed and undistributed earnings available to common shareholders by the weighted average number of common shares outstanding for the period. Distributed and undistributed earnings available to common shareholders represent net income reduced by preferred stock dividends and distributed and undistributed earnings available to participating securities. Common shares outstanding include common stock and vested restricted stock awards. Diluted EPS reflects the assumed conversion of all potential dilutive securities. A reconciliation of the weighted-average shares used in calculating basic earnings per common share and the weighted average common shares used in calculating diluted earnings per common share for the reported periods is provided in Note 16—Earnings Per Common Share.
- 75 -
FINANCIAL INSTITUTIONS, INC. AND SUBSIDIARIES
NOTES TO CONSOLIDATED FINANCIAL STATEMENTS
December 31, 2012, 2011 and 2010
| (1.) | SUMMARY OF SIGNIFICANT ACCOUNTING POLICIES (Continued) |
(t.) Recent Accounting Pronouncements
In May 2011, the FASB issued Accounting Standards Update (“ASU”) No. 2011-04,“Amendments to Achieve Common Fair Value Measurement and Disclosure Requirements in U.S. GAAP and IFRSs.” The provisions of ASU No. 2011-04 provide a consistent definition of fair value and common requirements for the measurement of and disclosure about fair value between U.S. GAAP and International Financial Reporting Standards (“IFRS”). The changes to U.S. GAAP as a result of ASU No. 2011-04 are as follows: (1) the concepts of highest and best use and valuation premise are only relevant when measuring the fair value of nonfinancial assets (that is, it does not apply to financial assets or any liabilities); (2) extends the prohibition on applying a blockage factor in valuing financial instruments with quoted prices in active markets; (3) creates an exception to the basic fair value measurement principles for an entity that holds a group of financial assets and financial liabilities with offsetting positions in market risks or counterparty credit risk that are managed on the basis of the entity’s net exposure to either of those risks by allowing the entity, if certain criteria are met, to measure the fair value of the net asset or liability position in a manner consistent with how market participants would price the net risk position; (4) aligns the fair value measurement of instruments classified within an entity’s shareholders’ equity with the guidance for liabilities; and (5) enhances disclosure requirements for Level 3 fair value measurements to disclose quantitative information about unobservable inputs and assumptions used, to describe the valuation processes used by the entity, and to qualitatively describe the sensitivity of fair value measurements to changes in unobservable inputs and the interrelationships between those inputs. In addition, entities must report the level in the fair value hierarchy of items that are not measured at fair value in the statement of condition but whose fair value must be disclosed. The Company adopted the provisions of ASU No. 2011-04 effective January 1, 2012. The fair value measurement provisions of ASU No. 2011-04 had no material impact on the Company’s consolidated financial statements. See Note 18 – Fair Value Measurements to the consolidated financial statements for the enhanced disclosures required by ASU No. 2011-04.In June 2011, the FASB issued ASU No. 2011-05, “Presentation of Comprehensive Income.” The provisions of ASU No. 2011-05 allow an entity the option to present the total of comprehensive income, the components of net income, and the components of other comprehensive income either in a single continuous statement of comprehensive income or in two separate but consecutive statements. In both options, an entity is required to present each component of net income along with total net income, each component of other comprehensive income along with a total for other comprehensive income, and a total amount for comprehensive income. Under either method, entities are required to present on the face of the financial statements reclassification adjustments for items that are reclassified from other comprehensive income to net income in the statement(s) where the components of net income and the components of other comprehensive income are presented. ASU No. 2011-05 also eliminates the option to present the components of other comprehensive income as part of the statement of changes in shareholders’ equity but does not change the items that must be reported in other comprehensive income or when an item of other comprehensive income must be reclassified to net income. ASU No. 2011-05 was effective for the Company’s interim reporting period beginning on or after January 1, 2012, with retrospective application required. In December 2011, the FASB issued ASU No. 2011-12,“Deferral of the Effective Date for Amendments to the Presentation of Reclassifications of Items Out of Accumulated Other Comprehensive Income in Accounting Standards Update No. 2011-05.” The provisions of ASU No. 2011-12 defer indefinitely the requirement for entities to present reclassification adjustments out of accumulated other comprehensive income by component in both the statement in which net income is presented and the statement in which other comprehensive income is presented. ASU No. 2011-12, which shares the same effective date as ASU No. 2011-05, does not defer the requirement for entities to present components of comprehensive income in either a single continuous statement of comprehensive income or in two separate but consecutive statements. The Company adopted the provisions of ASU No. 2011-05 and ASU No. 2011-12 which resulted in a new statement of comprehensive income beginning with the interim period ended March 31, 2012. The adoption of ASU No. 2011-05 and ASU No. 2011-12 had no material impact on the Company’s statements of income and financial condition.
In September 2011, the FASB issued ASU No. 2011-08“Testing Goodwill for Impairment.” The provisions of ASU 2011-08 permit an entity the option to first perform a qualitative assessment to determine whether it is more likely than not that the fair value of a reporting unit is less than its carrying amount. If an entity believes, as a result of its qualitative assessment, that it is more likely than not that the fair value of a reporting unit is less than its carrying amount, the quantitative impairment test is required. Otherwise, no further impairment testing is required. ASU No. 2011-08 includes examples of events and circumstances that may indicate that a reporting unit’s fair value is less than its carrying amount. The provisions of ASU No. 2011-08 are effective for annual and interim goodwill impairment tests performed beginning in 2012. The adoption of ASU No. 2011-08 did not have a material impact on the Company’s consolidated financial statements.
- 76 -
FINANCIAL INSTITUTIONS, INC. AND SUBSIDIARIES
NOTES TO CONSOLIDATED FINANCIAL STATEMENTS
December 31, 2012, 2011 and 2010
| (1.) | SUMMARY OF SIGNIFICANT ACCOUNTING POLICIES (Continued) |
In July 2012, the FASB issued ASU No. 2012-02,“Testing Indefinite-Lived Intangible Assets for Impairment.” The provisions of ASU No. 2012-02 permit an entity to first assess qualitative factors to determine whether it is more likely than not that an indefinite-lived intangible asset is impaired as a basis for determining whether it is necessary to perform a quantitative impairment test, as is currently required by GAAP. ASU No. 2012-02 is effective for annual and interim impairment tests performed for fiscal years beginning after September 15, 2012. The Company does not have any indefinite-lived intangible assets other than goodwill, therefore the adoption of ASU No. 2012-02 is expected to have no material impact on the Company’s consolidated financial statements.
In February 2013, the FASB issued ASU No. 2013-02,Reporting of Amounts Reclassified Out of Accumulated Other Comprehensive Income. The Update requires an entity to provide information about the amounts reclassified out of accumulated other comprehensive income by component and to present either on the face of the statement where net income is presented, or in the notes, significant amounts reclassified out of accumulated other comprehensive income by the respective line items of net income, but only if the amount reclassified is required to be reclassified to net income in its entirety in the same reporting period. The amendments are effective for annual and interim reporting periods beginning on or after December 15, 2012. The Company is currently in the process of evaluating the ASU but does not expect it will have a material impact on the Company’s consolidated financial statements.
- 77 -
FINANCIAL INSTITUTIONS, INC. AND SUBSIDIARIES
NOTES TO CONSOLIDATED FINANCIAL STATEMENTS
December 31, 2012, 2011 and 2010
(2.) BRANCH ACQUISITIONS
On January 19, 2012, the Bank entered into agreements with First Niagara Bank, National Association (“First Niagara”) to acquire four First Niagara retail bank branches in Medina, Brockport, Batavia and Waterloo, New York (the “First Niagara Branches”) and four retail bank branches previously owned by HSBC Bank USA, National Association (“HSBC”) in Elmira, Elmira Heights, Horseheads and Albion, New York (the “HSBC Branches”). First Niagara assigned its rights to the HSBC branches in connection with its acquisition of HSBC’s Upstate New York banking franchise. Under the terms of the agreements, the Bank assumed all related deposits and purchased the related branch premises and certain performing loans. The transaction to acquire the First Niagara Branches was completed on June 22, 2012 and the transaction to acquire the HSBC Branches was completed on August 17, 2012. The combined assets acquired and deposits assumed in the two transactions were recorded at their estimated fair values as follows:
Cash | $ | 195,778 | ||
Loans | 75,635 | |||
Bank premises and equipment | 1,938 | |||
Goodwill | 11,599 | |||
Core deposit intangible asset | 2,042 | |||
Other assets | 339 | |||
|
| |||
Total assets acquired | $ | 287,331 | ||
|
| |||
Deposits assumed | $ | 286,819 | ||
Other liabilities | 512 | |||
|
| |||
Total liabilities assumed | $ | 287,331 | ||
|
|
The transactions were accounted for using the acquisition method of accounting and accordingly, assets acquired, liabilities assumed and consideration exchanged were recorded at their estimated fair values on the acquisition dates. Fair values are preliminary and in certain cases are subject to refinement for up to one year after the closing date of the acquisition as additional information relative to fair values becomes available.
The operating results of the acquired branches included in the Company’s consolidated statement of income for the year ended December 31, 2012 reflect only amounts from the acquisition dates through December 31, 2012. The operating results of the acquired branches prior to the acquisition dates were not material for purposes of supplemental disclosure under the FASB guidance on business combinations.
The Company acquired the loan portfolios at a fair value discount of $824 thousand. The discount represents expected credit losses, net of market interest rate adjustments. The discount on loans receivable will be amortized to interest income over the estimated remaining life of the acquired loans using the level yield method. The core deposit intangible asset will be amortized on an accelerated basis over a period of approximately nine and a half years. The time deposit premium of $335 thousand will be accreted over the estimated remaining life of the related deposits as a reduction of interest expense.
Preliminary goodwill of $11.6 million is calculated as the purchase premium after adjusting for the fair value of net assets acquired and represents the value expected from the synergies created and the economies of scale expected from combining the operations of the acquired branches with those of the Bank. All goodwill and core deposit intangible assets arising from this acquisition are expected to be deductible for tax purposes.
- 78 -
FINANCIAL INSTITUTIONS, INC. AND SUBSIDIARIES
NOTES TO CONSOLIDATED FINANCIAL STATEMENTS
December 31, 2012, 2011 and 2010
(3.) INVESTMENT SECURITIES
The amortized cost and estimated fair value of investment securities are summarized below (in thousands).
| Amortized Cost | Unrealized Gains | Unrealized Losses | Fair Value | |||||||||||||
December 31, 2012 | ||||||||||||||||
Securities available for sale: | ||||||||||||||||
U.S. Government agencies and government sponsored enterprises | $ | 128,097 | $ | 3,667 | $ | 69 | $ | 131,695 | ||||||||
State and political subdivisions | 188,997 | 6,285 | 72 | 195,210 | ||||||||||||
Mortgage-backed securities: | ||||||||||||||||
Federal National Mortgage Association | 147,946 | 4,394 | 188 | 152,152 | ||||||||||||
Federal Home Loan Mortgage Corporation | 65,426 | 1,430 | — | 66,856 | ||||||||||||
Government National Mortgage Association | 56,166 | 3,279 | — | 59,445 | ||||||||||||
Collateralized mortgage obligations: | ||||||||||||||||
Federal National Mortgage Association | 60,805 | 1,865 | 2 | 62,668 | ||||||||||||
Federal Home Loan Mortgage Corporation | 78,581 | 1,911 | — | 80,492 | ||||||||||||
Government National Mortgage Association | 70,989 | 2,168 | — | 73,157 | ||||||||||||
Privately issued | 73 | 1,025 | — | 1,098 | ||||||||||||
|
|
|
|
|
|
|
| |||||||||
Total collateralized mortgage obligations | 210,448 | 6,969 | 2 | 217,415 | ||||||||||||
|
|
|
|
|
|
|
| |||||||||
Total mortgage-backed securities | 479,986 | 16,072 | 190 | 495,868 | ||||||||||||
Asset-backed securities | 121 | 902 | — | 1,023 | ||||||||||||
|
|
|
|
|
|
|
| |||||||||
Total available for sale securities | $ | 797,201 | $ | 26,926 | $ | 331 | $ | 823,796 | ||||||||
|
|
|
|
|
|
|
| |||||||||
Securities held to maturity: | ||||||||||||||||
State and political subdivisions | $ | 17,905 | $ | 573 | $ | — | $ | 18,478 | ||||||||
|
|
|
|
|
|
|
| |||||||||
December 31, 2011 | ||||||||||||||||
Securities available for sale: | ||||||||||||||||
U.S. Government agencies and government sponsored enterprises | $ | 94,947 | $ | 2,770 | $ | 5 | $ | 97,712 | ||||||||
State and political subdivisions | 119,099 | 5,336 | 11 | 124,424 | ||||||||||||
Mortgage-backed securities: | ||||||||||||||||
Federal National Mortgage Association | 98,679 | 2,944 | — | 101,623 | ||||||||||||
Federal Home Loan Mortgage Corporation | 63,838 | 1,017 | — | 64,855 | ||||||||||||
Government National Mortgage Association | 73,226 | 3,376 | — | 76,602 | ||||||||||||
Collateralized mortgage obligations: | ||||||||||||||||
Federal National Mortgage Association | 28,339 | 581 | 7 | 28,913 | ||||||||||||
Federal Home Loan Mortgage Corporation | 22,318 | 675 | 1 | 22,992 | ||||||||||||
Government National Mortgage Association | 103,975 | 2,654 | 18 | 106,611 | ||||||||||||
Privately issued | 327 | 1,762 | — | 2,089 | ||||||||||||
|
|
|
|
|
|
|
| |||||||||
Total collateralized mortgage obligations | 154,959 | 5,672 | 26 | 160,605 | ||||||||||||
|
|
|
|
|
|
|
| |||||||||
Total mortgage-backed securities | 390,702 | 13,009 | 26 | 403,685 | ||||||||||||
Asset-backed securities | 297 | 1,400 | — | 1,697 | ||||||||||||
|
|
|
|
|
|
|
| |||||||||
Total available for sale securities | $ | 605,045 | $ | 22,515 | $ | 42 | $ | 627,518 | ||||||||
|
|
|
|
|
|
|
| |||||||||
Securities held to maturity: | ||||||||||||||||
State and political subdivisions | $ | 23,297 | $ | 667 | $ | — | $ | 23,964 | ||||||||
|
|
|
|
|
|
|
| |||||||||
- 79 -
FINANCIAL INSTITUTIONS, INC. AND SUBSIDIARIES
NOTES TO CONSOLIDATED FINANCIAL STATEMENTS
December 31, 2012, 2011 and 2010
(3.) INVESTMENT SECURITIES (Continued)
Interest and dividends on securities for the years ended December 31 are summarized as follows (in thousands):
| 2012 | 2011 | 2010 | ||||||||||
Taxable interest and dividends | $ | 12,202 | $ | 14,185 | $ | 17,101 | ||||||
Tax-exempt interest and dividends | 4,242 | 3,828 | 3,521 | |||||||||
|
|
|
|
|
| |||||||
Total interest and dividends on securities | $ | 16,444 | $ | 18,013 | $ | 20,622 | ||||||
|
|
|
|
|
| |||||||
Sales and calls of securities available for sale for the years ended December 31 were as follows (in thousands):
| 2012 | 2011 | 2010 | ||||||||||
Proceeds from sales | $ | 2,823 | $ | 44,514 | $ | 122,090 | ||||||
Gross realized gains | 2,651 | 3,051 | 173 | |||||||||
Gross realized losses | — | 48 | 4 | |||||||||
The scheduled maturities of securities available for sale and securities held to maturity at December 31, 2012 are shown below. Actual expected maturities may differ from contractual maturities because issuers may have the right to call or prepay obligations (in thousands).
| Amortized Cost | Fair Value | |||||||
Debt securities available for sale: | ||||||||
Due in one year or less | $ | 28,967 | $ | 29,165 | ||||
Due from one to five years | 94,479 | 98,341 | ||||||
Due after five years through ten years | 318,124 | 326,802 | ||||||
Due after ten years | 355,631 | 369,488 | ||||||
|
|
|
| |||||
| $ | 797,201 | $ | 823,796 | |||||
|
|
|
| |||||
Debt securities held to maturity: | ||||||||
Due in one year or less | $ | 12,886 | $ | 12,974 | ||||
Due from one to five years | 4,164 | 4,455 | ||||||
Due after five years through ten years | 768 | 931 | ||||||
Due after ten years | 87 | 118 | ||||||
|
|
|
| |||||
| $ | 17,905 | $ | 18,478 | |||||
|
|
|
| |||||
- 80 -
FINANCIAL INSTITUTIONS, INC. AND SUBSIDIARIES
NOTES TO CONSOLIDATED FINANCIAL STATEMENTS
December 31, 2012, 2011 and 2010
(3.) INVESTMENT SECURITIES (Continued)
There were no unrealized losses in held to maturity securities at December 31, 2012 or December 31, 2011. Unrealized losses on investment securities available for sale and the fair value of the related securities, aggregated by investment category and length of time that individual securities have been in a continuous unrealized loss position as of December 31 are summarized as follows (in thousands):
| Less than 12 months | 12 months or longer | Total | ||||||||||||||||||||||
| Fair | Unrealized | Fair | Unrealized | Fair | Unrealized | |||||||||||||||||||
| Value | Losses | Value | Losses | Value | Losses | |||||||||||||||||||
December 31, 2012 | ||||||||||||||||||||||||
U.S. Government agencies and government sponsored enterprises | $ | 13,265 | $ | 67 | $ | 2,967 | $ | 2 | $ | 16,232 | $ | 69 | ||||||||||||
State and political subdivisions | 8,471 | 72 | — | — | 8,471 | 72 | ||||||||||||||||||
Mortgage-backed securities: | ||||||||||||||||||||||||
Federal National Mortgage Association | 25,200 | 188 | — | — | 25,200 | 188 | ||||||||||||||||||
Collateralized mortgage obligations: | ||||||||||||||||||||||||
Federal National Mortgage Association | — | — | 1,173 | 2 | 1,173 | 2 | ||||||||||||||||||
|
|
|
|
|
|
|
|
|
|
|
| |||||||||||||
Total collateralized mortgage obligations | — | — | 1,173 | 2 | 1,173 | 2 | ||||||||||||||||||
|
|
|
|
|
|
|
|
|
|
|
| |||||||||||||
Total mortgage-backed securities | 25,200 | 188 | 1,173 | 2 | 26,373 | 190 | ||||||||||||||||||
|
|
|
|
|
|
|
|
|
|
|
| |||||||||||||
Total temporarily impaired securities | $ | 46,936 | $ | 327 | $ | 4,140 | $ | 4 | $ | 51,076 | $ | 331 | ||||||||||||
|
|
|
|
|
|
|
|
|
|
|
| |||||||||||||
December 31, 2011 | ||||||||||||||||||||||||
U.S. Government agencies and government sponsored enterprises | $ | 2,177 | $ | 1 | $ | 5,246 | $ | 4 | $ | 7,423 | $ | 5 | ||||||||||||
State and political subdivisions | 452 | 2 | 646 | 9 | 1,098 | 11 | ||||||||||||||||||
Mortgage-backed securities: | ||||||||||||||||||||||||
Collateralized mortgage obligations: | ||||||||||||||||||||||||
Federal National Mortgage Association | — | — | 1,817 | 7 | 1,817 | 7 | ||||||||||||||||||
Federal Home Loan Mortgage Corporation | — | — | 388 | 1 | 388 | 1 | ||||||||||||||||||
Government National Mortgage Association | 6,138 | 18 | — | — | 6,138 | 18 | ||||||||||||||||||
|
|
|
|
|
|
|
|
|
|
|
| |||||||||||||
Total collateralized mortgage obligations | 6,138 | 18 | 2,205 | 8 | 8,343 | 26 | ||||||||||||||||||
|
|
|
|
|
|
|
|
|
|
|
| |||||||||||||
Total mortgage-backed securities | 6,138 | 18 | 2,205 | 8 | 8,343 | 26 | ||||||||||||||||||
|
|
|
|
|
|
|
|
|
|
|
| |||||||||||||
Total temporarily impaired securities | $ | 8,767 | $ | 21 | $ | 8,097 | $ | 21 | $ | 16,864 | $ | 42 | ||||||||||||
|
|
|
|
|
|
|
|
|
|
|
| |||||||||||||
The total number of security positions in the investment portfolio in an unrealized loss position at December 31, 2012 was 52 compared to 14 at December 31, 2011. At December 31, 2012, the Company had positions in six investment securities with an amortized cost of $4.1 million and an unrealized loss of $4 thousand that have been in a continuous unrealized loss position for more than 12 months. There were a total of 46 securities positions in the Company’s investment portfolio, with an amortized cost of $47.3 million and a total unrealized loss of $327 thousand at December 31, 2012, that have been in a continuous unrealized loss position for less than 12 months. The unrealized loss on these investment securities was predominantly caused by changes in market interest rates, average life or credit spreads subsequent to purchase. The fair value of most of the investment securities in the Company’s portfolio fluctuates as market interest rates change.
- 81 -
FINANCIAL INSTITUTIONS, INC. AND SUBSIDIARIES
NOTES TO CONSOLIDATED FINANCIAL STATEMENTS
December 31, 2012, 2011 and 2010
(3.) INVESTMENT SECURITIES (Continued)
The Company reviews investment securities on an ongoing basis for the presence of other-than-temporary impairment (“OTTI”) with formal reviews performed quarterly. When evaluating debt security consideringsecurities for OTTI, management considers many factors, such as: a.)including: (1) the length of time and the extent to which the fair value has been less than cost, (2) the amortized cost basis, b.) adverse conditions specifically related to the security, an industry, or a geographic area, c.) the historicalfinancial condition and implied volatilitynear-term prospects of the fair value ofissuer, (3) whether the security, d.)market decline was affected by macroeconomic conditions, and (4) whether the payment structure ofCompany has the intention to sell the debt security or whether it is more likely than not that it will be required to sell the debt security before its anticipated recovery. The assessment of whether OTTI exists involves a high degree of subjectivity and judgment and is based on the likelihood of the issuer being ableinformation available to make payments that increase in the future, e.) failure of the issuer of the security to make scheduled interest or principal payments, f.) any changes to the rating of the security by a rating agency, and g.) recoveries or additional declines in fair value subsequent to the balance sheet date.
The following summarizes the amounts of OTTI recognized during the years ended December 31 by investment category (in thousands).
| 2010 | 2009 | 2008 | ||||||||||
| Mortgage-backed securities — Privately issued whole loan CMOs | $ | — | $ | 2,353 | $ | 5,918 | ||||||
| Asset-backed securities — Trust preferred securities | 526 | 1,787 | 23,443 | |||||||||
| Asset-backed securities — Other | 68 | 526 | 6,531 | |||||||||
| Equity securities — Auction rate securities | — | — | 32,323 | |||||||||
| $ | 594 | $ | 4,666 | $ | 68,215 | |||||||
| 2012 | 2011 | 2010 | ||||||||||
Mortgage-backed securities—Privately issued whole loan CMOs | $ | 91 | $ | 18 | $ | — | ||||||
Asset-backed securities—Trust preferred securities | — | — | 526 | |||||||||
Asset-backed securities—Other | — | — | 68 | |||||||||
|
|
|
|
|
| |||||||
Total OTTI | $ | 91 | $ | 18 | $ | 594 | ||||||
|
|
|
|
|
| |||||||
Based on management’s review and evaluation of the Company’s debt securities as of December 31, 2010,2012, the number of investmentdebt securities in anwith unrealized loss position totaled 156.losses were not considered to be OTTI. As of December 31, 2010, management2012, the Company does not have the intentintend to sell any of thedebt securities in awhich have an unrealized loss, position and believes that it is likely that itunlikely the Company will not be required to sell any suchthese securities before the anticipated recovery of amortized cost. The unrealized losses are largely due to increases in market interest rates and terms over the yields and terms available at the time the underlying securities were purchased or, for securities determined to have been other-than-temporarily impaired, from the time impairment charges were last recognized and the securities were written down. The fair value is expectedCompany expects to recover as the bonds approach their maturity date or repricing date or if market yields for such investments decline. Management does not believe anyentire amortized cost of the securities in a loss position arethese impaired due to reasons of credit quality.securities. Accordingly, as of December 31, 2010,2012, management has concluded that unrealized losses on its investment securities are temporary and no further impairment loss has been realized in the Company’s consolidated statements of income.
- 76 -
Loans held for sale were entirely comprised of residential real estate mortgages and totaled $3.1$1.5 million and $421 thousand$2.4 million as of December 31, 20102012 and 2009,2011, respectively.
The Company sells certain qualifying newly originated or refinanced residential real estate mortgages on the secondary market. Residential real estate mortgages serviced for others, which are not included in the consolidated statements of financial condition, amounted to $328.9$273.3 million and $349.8$297.8 million as of December 31, 20102012 and 2009,2011, respectively. In connection with these mortgage-servicing activities, the Company administered escrow and other custodial funds which amounted to approximately $6.2$5.6 million atand $5.9 million as of December 31, 2010. 2012 and 2011, respectively.
The activity in capitalized mortgage servicing assets included in other assets in the consolidated statements of financial condition, is summarized as follows for the years ended December 31 (in thousands):
| 2010 | 2009 | 2008 | ||||||||||
| Mortgage servicing assets, beginning of year | $ | 1,534 | $ | 925 | $ | 1,000 | ||||||
| Originations | 408 | 952 | 230 | |||||||||
| Amortization | (300 | ) | (343 | ) | (305 | ) | ||||||
| Mortgage servicing assets, end of year | 1,642 | 1,534 | 925 | |||||||||
| Valuation allowance | (175 | ) | (185 | ) | (362 | ) | ||||||
| Mortgage servicing assets, net, end of year | $ | 1,467 | $ | 1,349 | $ | 563 | ||||||
| 2012 | 2011 | 2010 | ||||||||||
Mortgage servicing assets, beginning of year | $ | 1,609 | $ | 1,642 | $ | 1,534 | ||||||
Originations | 554 | 319 | 408 | |||||||||
Amortization | (526 | ) | (352 | ) | (300 | ) | ||||||
|
|
|
|
|
| |||||||
Mortgage servicing assets, end of year | 1,637 | 1,609 | 1,642 | |||||||||
Valuation allowance | (168 | ) | (210 | ) | (175 | ) | ||||||
|
|
|
|
|
| |||||||
Mortgage servicing assets, net, end of year | $ | 1,469 | $ | 1,399 | $ | 1,467 | ||||||
|
|
|
|
|
| |||||||
During 2009,2011, the Company pooled $16.0sold $13.0 million of one-to-four family residential mortgageindirect auto loans and converted the loans to FHLMC securities.under a 90%/10% participation agreement, recognizing a gain of $153 thousand. The Company retained servicing responsibilities for this securitization. The mortgage-backed securities received in exchange for the loans were classified as available-for-sale and subsequently sold.reclassified from portfolio to loans held for sale during the second quarter of 2011. The $564 thousand gain recognized on the sale of the securities isloan servicing asset for these loans, included in other assets in the consolidated statements of operations under net gain on disposalfinancial condition, was $250 thousand and $574 thousand as of investment securities.
- 82 -
FINANCIAL INSTITUTIONS, INC. AND SUBSIDIARIES
NOTES TO CONSOLIDATED FINANCIAL STATEMENTS
December 31, 2012, 2011 and 2010
(5.) LOANS
The Company’s loan portfolio consisted of the following at December 31 (in thousands):
| Net Deferred | ||||||||||||
| Loan (Fees) | ||||||||||||
| Loans, Gross | Costs | Loans, Net | ||||||||||
2010 | ||||||||||||
| Commercial business | $ | 210,948 | $ | 83 | $ | 211,031 | ||||||
| Commercial mortgage | 353,537 | (607 | ) | 352,930 | ||||||||
| Residential mortgage | 129,553 | 27 | 129,580 | |||||||||
| Home equity | 205,070 | 3,257 | 208,327 | |||||||||
| Consumer indirect | 400,221 | 17,795 | 418,016 | |||||||||
| Other consumer | 25,937 | 169 | 26,106 | |||||||||
| Total | $ | 1,325,266 | $ | 20,724 | 1,345,990 | |||||||
| Allowance for loan losses | (20,466 | ) | ||||||||||
| Total loans, net | $ | 1,325,524 | ||||||||||
2009 | ||||||||||||
| Commercial business | $ | 206,512 | $ | (129 | ) | $ | 206,383 | |||||
| Commercial mortgage | 331,268 | (520 | ) | 330,748 | ||||||||
| Residential mortgage | 144,286 | (71 | ) | 144,215 | ||||||||
| Home equity | 197,795 | 2,889 | 200,684 | |||||||||
| Consumer indirect | 338,495 | 14,116 | 352,611 | |||||||||
| Other consumer | 29,192 | 173 | 29,365 | |||||||||
| Total | $ | 1,247,548 | $ | 16,458 | 1,264,006 | |||||||
| Allowance for loan losses | (20,741 | ) | ||||||||||
| Total loans, net | $ | 1,243,265 | ||||||||||
| Principal Amount Outstanding | Net Deferred Loan (Fees) Costs | Loans, Net | ||||||||||
2012 | ||||||||||||
Commercial business | $ | 258,706 | $ | (31 | ) | $ | 258,675 | |||||
Commercial mortgage | 414,282 | (958 | ) | 413,324 | ||||||||
Residential mortgage | 133,341 | 179 | 133,520 | |||||||||
Home equity | 282,503 | 4,146 | 286,649 | |||||||||
Consumer indirect | 559,964 | 26,830 | 586,794 | |||||||||
Other consumer | 26,657 | 107 | 26,764 | |||||||||
|
|
|
|
|
| |||||||
Total | $ | 1,675,453 | $ | 30,273 | 1,705,726 | |||||||
|
|
|
| |||||||||
Allowance for loan losses | (24,714 | ) | ||||||||||
|
| |||||||||||
Total loans, net | $ | 1,681,012 | ||||||||||
|
| |||||||||||
2011 | ||||||||||||
Commercial business | $ | 233,727 | $ | 109 | $ | 233,836 | ||||||
Commercial mortgage | 394,034 | (790 | ) | 393,244 | ||||||||
Residential mortgage | 113,865 | 46 | 113,911 | |||||||||
Home equity | 227,853 | 3,913 | 231,766 | |||||||||
Consumer indirect | 465,807 | 21,906 | 487,713 | |||||||||
Other consumer | 24,138 | 168 | 24,306 | |||||||||
|
|
|
|
|
| |||||||
Total | $ | 1,459,424 | $ | 25,352 | 1,484,776 | |||||||
|
|
|
| |||||||||
Allowance for loan losses | (23,260 | ) | ||||||||||
|
| |||||||||||
Total loans, net | $ | 1,461,516 | ||||||||||
|
| |||||||||||
- 77 -
Certain executive officers, directors and their business interests are customers of the Company. Transactions with these parties are based on substantially the same terms as similar transactions with unrelated third parties and do not carry more than normal credit risk. Borrowings by these related parties amounted to $609$292 thousand and $555$378 thousand at December 31, 20102012 and 2009,2011, respectively. During 2010,2012, new borrowings amounted to $144$50 thousand (including borrowings of executive officers and directors that were outstanding at the time of their election), and repayments and other reductions were $90$136 thousand.
- 83 -
FINANCIAL INSTITUTIONS, INC. AND SUBSIDIARIES
NOTES TO CONSOLIDATED FINANCIAL STATEMENTS
December 31, 2012, 2011 and 2010
(5.) LOANS (Continued)
Past Due Loans Aging
The following table provides an analysis,Company’s recorded investment, by loan class, of the Company’s delinquentin current and nonaccrual loans, as well as an analysis of accruing delinquent loans is set forth as of December 31 (in thousands):
| Greater | ||||||||||||||||||||||||||||
| 30-59 Days | 60-89 Days | Than 90 | Total Past | Total | ||||||||||||||||||||||||
| Past Due | Past Due | Days | Due | Nonaccrual | Current | Loans | ||||||||||||||||||||||
2010 | ||||||||||||||||||||||||||||
| Commercial business | $ | 172 | $ | 92 | $ | — | $ | 264 | $ | 947 | $ | 209,737 | $ | 210,948 | ||||||||||||||
| Commercial mortgage | 163 | — | — | 163 | 3,100 | 350,274 | 353,537 | |||||||||||||||||||||
| Residential mortgage | 492 | 6 | — | 498 | 2,102 | 126,953 | 129,553 | |||||||||||||||||||||
| Home equity | 428 | 47 | — | 475 | 875 | 203,720 | 205,070 | |||||||||||||||||||||
| Consumer indirect | 656 | 107 | — | 763 | 514 | 398,944 | 400,221 | |||||||||||||||||||||
| Other consumer | 82 | 1 | 3 | 86 | 41 | 25,810 | 25,937 | |||||||||||||||||||||
| Total loans, gross | $ | 1,993 | $ | 253 | $ | 3 | $ | 2,249 | $ | 7,579 | $ | 1,315,438 | $ | 1,325,266 | ||||||||||||||
2009 | ||||||||||||||||||||||||||||
| Commercial business | $ | 141 | $ | 3 | $ | 76 | $ | 220 | $ | 650 | $ | 205,642 | $ | 206,512 | ||||||||||||||
| Commercial mortgage | 212 | 319 | 1,783 | 2,314 | 2,288 | 326,666 | 331,268 | |||||||||||||||||||||
| Residential mortgage | 1,039 | — | — | 1,039 | 2,376 | 140,871 | 144,286 | |||||||||||||||||||||
| Home equity | 388 | 54 | — | 442 | 880 | 196,473 | 197,795 | |||||||||||||||||||||
| Consumer indirect | 1,304 | 110 | — | 1,414 | 621 | 336,460 | 338,495 | |||||||||||||||||||||
| Other consumer | 105 | 8 | — | 113 | 7 | 29,072 | 29,192 | |||||||||||||||||||||
| Total loans, gross | $ | 3,189 | $ | 494 | $ | 1,859 | $ | 5,542 | $ | 6,822 | $ | 1,235,184 | $ | 1,247,548 | ||||||||||||||
| 30-59 Days Past Due | 60-89 Days Past Due | Greater Than 90 Days | Total Past Due | Nonaccrual | Current | Total Loans | ||||||||||||||||||||||
2012 | ||||||||||||||||||||||||||||
Commercial business | $ | 160 | $ | — | $ | — | $ | 160 | $ | 3,413 | $ | 255,133 | $ | 258,706 | ||||||||||||||
Commercial mortgage | 331 | — | — | 331 | 1,799 | 412,152 | 414,282 | |||||||||||||||||||||
Residential mortgage | 376 | — | — | 376 | 2,040 | 130,925 | 133,341 | |||||||||||||||||||||
Home equity | 675 | 10 | — | 685 | 939 | 280,879 | 282,503 | |||||||||||||||||||||
Consumer indirect | 1,661 | 163 | — | 1,824 | 891 | 557,249 | 559,964 | |||||||||||||||||||||
Other consumer | 127 | 35 | 18 | 180 | 25 | 26,452 | 26,657 | |||||||||||||||||||||
|
|
|
|
|
|
|
|
|
|
|
|
|
| |||||||||||||||
Total loans, gross | $ | 3,330 | $ | 208 | $ | 18 | $ | 3,556 | $ | 9,107 | $ | 1,662,790 | $ | 1,675,453 | ||||||||||||||
|
|
|
|
|
|
|
|
|
|
|
|
|
| |||||||||||||||
2011 | ||||||||||||||||||||||||||||
Commercial business | $ | 35 | $ | — | $ | — | $ | 35 | $ | 1,259 | $ | 232,433 | $ | 233,727 | ||||||||||||||
Commercial mortgage | 165 | — | — | 165 | 2,928 | 390,941 | 394,034 | |||||||||||||||||||||
Residential mortgage | 517 | — | — | 517 | 1,644 | 111,704 | 113,865 | |||||||||||||||||||||
Home equity | 749 | 68 | — | 817 | 682 | 226,354 | 227,853 | |||||||||||||||||||||
Consumer indirect | 984 | 92 | — | 1,076 | 558 | 464,173 | 465,807 | |||||||||||||||||||||
Other consumer | 106 | 10 | 5 | 121 | — | 24,017 | 24,138 | |||||||||||||||||||||
|
|
|
|
|
|
|
|
|
|
|
|
|
| |||||||||||||||
Total loans, gross | $ | 2,556 | $ | 170 | $ | 5 | $ | 2,731 | $ | 7,071 | $ | 1,449,622 | $ | 1,459,424 | ||||||||||||||
|
|
|
|
|
|
|
|
|
|
|
|
|
| |||||||||||||||
There were no loans which were past due greater than 90 days and still accruing interest. Asinterest as of December 31, 2010, there2012 and December 31, 2011. There were $3$18 thousand and $5 thousand in consumer overdrafts which were past due greater than 90 days. Asdays as of December 31, 2009, there were $76 thousand in commercial business2012 and December 31, 2011, respectively. Consumer overdrafts are overdrawn deposit accounts which have been reclassified as loans and $1.8 million in commercial mortgage loans which were past due greater than 90 days and still accruingbut by their terms do not accrue interest.
Interest income on nonaccrual loans, if recognized, is recorded using the cash basis method of accounting. There was no interest income recognized on nonaccrual loans during the years ended December 31, 2010, 20092012, 2011 and 2008.2010. For the years ended December 31, 2010, 20092012, 2011 and 2008,2010, estimated interest income of $474$555 thousand, $388$438 thousand, and $546$474 thousand, respectively, would have been recorded if all such loans had been accruing interest according to their original contractual terms.
- 84 -
FINANCIAL INSTITUTIONS, INC. AND SUBSIDIARIES
NOTES TO CONSOLIDATED FINANCIAL STATEMENTS
December 31, 2012, 2011 and 2010
(5.) LOANS (Continued)
Troubled Debt Restructured Loans
A modification of a loan constitutes a troubled debt restructuring (“TDR”) when a borrower is experiencing financial difficulty and the modification constitutes a concession. The Company offers various types of concessions when modifying loans, however, forgiveness of principal is rarely granted. Commercial loans modified in a TDR may involve temporary interest-only payments, term extensions, reducing the interest rate for the remaining term of the loan, extending the maturity date at an interest rate lower than the current market rate for new debt with similar risk, requesting additional collateral, releasing collateral for consideration, or substituting or adding a new borrower or guarantor.
The following presents, by loan class, information related to loans modified in a TDR during the years ended December 31 (in thousands).
| Number of Contracts | Pre- Modification Outstanding Recorded Investment | Post- Modification Outstanding Recorded Investment | ||||||||||
2012 | ||||||||||||
Commercial business | 3 | $ | 536 | $ | 536 | |||||||
Commercial mortgage | 4 | 648 | 648 | |||||||||
|
|
|
|
|
| |||||||
Total | 7 | $ | 1,184 | $ | 1,184 | |||||||
|
|
|
|
|
| |||||||
2011 | ||||||||||||
Commercial business | 6 | $ | 142 | $ | 142 | |||||||
Commercial mortgage | 1 | 280 | 280 | |||||||||
|
|
|
|
|
| |||||||
Total | 7 | $ | 422 | $ | 422 | |||||||
|
|
|
|
|
| |||||||
All of the loans identified as TDRs by the Company were previously on nonaccrual status and reported as impaired loans prior to restructuring. The modifications primarily related to extending the amortization periods of the loans and releasing collateral in consideration of payment. All loans restructured loans (“TDRs”) areduring the years ended December 31, 2012 and 2011 were on nonaccrual status at the end of those respective years. Nonaccrual loans that the Company, for economic or legal reasons relatedare restructured remain on nonaccrual status, but may move to accrual status after they have performed according to the borrower’s financial condition, has grantedrestructured terms for a significant concessionperiod of time. The TDR classification did not have a material impact on the Company’s determination of the allowance for loan losses because the modified loans were impaired and evaluated for a specific reserve both before and after restructuring.
For purposes of this disclosure, a loan modified as a TDR is considered to have defaulted when the borrower that it would not otherwise consider. TDRs can be classified as either accrual or nonaccrual loans. Included in nonaccrual loans arebecomes 90 days past due. One commercial TDRsbusiness loan restructured during 2012 with a balance of $534$52 thousand at December 31, 2010. The Company had no TDRs on which it continued to accrue interest2012 was in default. One commercial real estate loan restructured during 2011 with a balance of $261 thousand at December 31, 2010. There were no TDRs outstanding at December 31, 2009.
- 7885 -
NOTES TO CONSOLIDATED FINANCIAL STATEMENTS
December 31, 2010, 20092012, 2011 and 2008
(5.) LOANS (Continued)
Impaired Loans
Management has determined that specific commercial loans on nonaccrual status and all loans that have had their terms restructured in a troubled debt restructuring are impaired loans. The following table presents data on impaired loans at December 31 (in thousands):
| Unpaid | Average | Interest | ||||||||||||||||||
| Recorded | Principal | Related | Recorded | Income | ||||||||||||||||
| Investment | Balance | Allowance | Investment | Recognized | ||||||||||||||||
2010 | ||||||||||||||||||||
| With no related allowance recorded: | ||||||||||||||||||||
| Commercial business | $ | 372 | $ | 524 | $ | — | $ | 275 | $ | — | ||||||||||
| Commercial mortgage | 187 | 187 | — | 481 | — | |||||||||||||||
| 559 | 711 | — | 756 | — | ||||||||||||||||
| With an allowance recorded: | ||||||||||||||||||||
| Commercial business | 576 | 576 | 149 | 1,828 | — | |||||||||||||||
| Commercial mortgage | 2,913 | 2,921 | 883 | 1,897 | — | |||||||||||||||
| 3,489 | 3,497 | 1,032 | 3,725 | — | ||||||||||||||||
| $ | 4,048 | $ | 4,208 | $ | 1,032 | $ | 4,481 | $ | — | |||||||||||
2009 | ||||||||||||||||||||
| With no related allowance recorded: | ||||||||||||||||||||
| Commercial business | $ | 292 | $ | 414 | $ | — | $ | 1,200 | $ | — | ||||||||||
| Commercial mortgage | 714 | 716 | — | 1,222 | — | |||||||||||||||
| 1,006 | 1,130 | — | 2,422 | — | ||||||||||||||||
| With an allowance recorded: | ||||||||||||||||||||
| Commercial business | 358 | 386 | 155 | 605 | — | |||||||||||||||
| Commercial mortgage | 1,574 | 1,574 | 699 | 758 | 69 | |||||||||||||||
| 1,932 | 1,960 | 854 | 1,363 | 69 | ||||||||||||||||
| $ | 2,938 | $ | 3,090 | $ | 854 | $ | 3,785 | $ | 69 | |||||||||||
| Recorded Investment(1) | Unpaid Principal Balance(1) | Related Allowance | Average Recorded Investment | Interest Income Recognized | ||||||||||||||||
2012 | ||||||||||||||||||||
With no related allowance recorded: | ||||||||||||||||||||
Commercial business | $ | 963 | $ | 1,425 | $ | — | $ | 755 | $ | — | ||||||||||
Commercial mortgage | 911 | 1,002 | — | 1,310 | — | |||||||||||||||
|
|
|
|
|
|
|
|
|
| |||||||||||
| 1,874 | 2,427 | — | 2,065 | — | ||||||||||||||||
With an allowance recorded: | ||||||||||||||||||||
Commercial business | 2,450 | 2,450 | 664 | 2,114 | — | |||||||||||||||
Commercial mortgage | 888 | 888 | 310 | 1,858 | — | |||||||||||||||
|
|
|
|
|
|
|
|
|
| |||||||||||
| 3,338 | 3,338 | 974 | 3,972 | — | ||||||||||||||||
|
|
|
|
|
|
|
|
|
| |||||||||||
| $ | 5,212 | $ | 5,765 | $ | 974 | $ | 6,037 | $ | — | |||||||||||
|
|
|
|
|
|
|
|
|
| |||||||||||
2011 | ||||||||||||||||||||
With no related allowance recorded: | ||||||||||||||||||||
Commercial business | $ | 342 | $ | 1,266 | $ | — | $ | 361 | $ | — | ||||||||||
Commercial mortgage | 605 | 696 | — | 583 | — | |||||||||||||||
|
|
|
|
|
|
|
|
|
| |||||||||||
| 947 | 1,962 | — | 944 | — | ||||||||||||||||
With an allowance recorded: | ||||||||||||||||||||
Commercial business | 917 | 917 | 436 | 1,033 | — | |||||||||||||||
Commercial mortgage | 2,323 | 2,323 | 644 | 2,172 | — | |||||||||||||||
|
|
|
|
|
|
|
|
|
| |||||||||||
| 3,240 | 3,240 | 1,080 | 3,205 | — | ||||||||||||||||
|
|
|
|
|
|
|
|
|
| |||||||||||
| $ | 4,187 | $ | 5,202 | $ | 1,080 | $ | 4,149 | $ | — | |||||||||||
|
|
|
|
|
|
|
|
|
| |||||||||||
| (1) | Difference between recorded investment and unpaid principal balance represents partial charge-offs. |
During the year ended December 31, 2008,2010, the Company’s average investment in impaired loans was $3.1$4.5 million. There was no interest income recognized on impaired loans during the year ended December 31, 2008. At December 31, 2010, there were no commitments2010.
Credit Quality Indicators
The Company categorizes loans into risk categories based on relevant information about the ability of borrowers to lend additional fundsservice their debt such as: current financial information, historical payment experience, credit documentation, public information, and current economic trends, among other factors such as the fair value of collateral. The Company analyzes commercial business and commercial mortgage loans individually by classifying the loans as to those borrowers whose loans werecredit risk. Risk ratings are updated any time the situation warrants. The Company uses the following definitions for risk ratings:
Special Mention:Loans classified as impaired.
Substandard:Loans classified as substandard are inadequately protected by the Company classifies problemcurrent net worth and potential problem loans as “Special Mention,” “Substandard,” and “Doubtful”. Substandard loans include thosepaying capacity of the obligor or of the collateral pledged, if any. Loans so classified have a well-defined weakness or weaknesses that jeopardize the liquidation of the debt. They are characterized by the distinct possibility that the Company will sustain some loss will be sustained if the deficiencies are not corrected.
- 86 -
FINANCIAL INSTITUTIONS, INC. AND SUBSIDIARIES
NOTES TO CONSOLIDATED FINANCIAL STATEMENTS
December 31, 2012, 2011 and 2010
(5.) LOANS (Continued)
Doubtful:Loans classified as Doubtfuldoubtful have all the weaknesses inherent in those classified as Substandard, with the added characteristic that the weaknesses present make collection or liquidation in full, on the basis of currently existing facts, conditions, and values, highly questionable and improbable.
Loans not meeting the criteria above that do not currently expose the Company to sufficient risk to warrant classification in oneare analyzed individually as part of the aforementioned categories, but possess weaknesses that deserve management’s close attention are deemed to be Special Mention. Risk ratings are updated any time the situation warrants. Loans that do not currently possess a sufficient degree of risk to warrant classification in one of the aforementioned categoriesprocess described above are considered “Uncriticized” or pass-rated loans and are included in groups of homogeneous loans with similar risk and loss characteristics.
- 79 -
| Commercial | Commercial | |||||||
| Business | Mortgage | |||||||
2010 | ||||||||
| Uncriticized | $ | 194,510 | $ | 338,061 | ||||
| Special mention | 11,479 | 4,931 | ||||||
| Substandard | 4,959 | 10,545 | ||||||
| Total | $ | 210,948 | $ | 353,537 | ||||
2009 | ||||||||
| Uncriticized | $ | 185,256 | $ | 305,129 | ||||
| Special mention | 12,737 | 13,339 | ||||||
| Substandard | 8,519 | 12,800 | ||||||
| Total | $ | 206,512 | $ | 331,268 | ||||
| Commercial Business | Commercial Mortgage | |||||||
2012 | ||||||||
Uncriticized | $ | 240,291 | $ | 400,576 | ||||
Special mention | 6,591 | 6,495 | ||||||
Substandard | 11,824 | 7,211 | ||||||
Doubtful | — | — | ||||||
|
|
|
| |||||
Total | $ | 258,706 | $ | 414,282 | ||||
|
|
|
| |||||
2011 | ||||||||
Uncriticized | $ | 221,477 | $ | 383,700 | ||||
Special mention | 7,445 | 2,388 | ||||||
Substandard | 4,805 | 7,946 | ||||||
Doubtful | — | — | ||||||
|
|
|
| |||||
Total | $ | 233,727 | $ | 394,034 | ||||
|
|
|
| |||||
The Company utilizes payment status as a means of identifying and reporting problem and potential problem retail loans. The Company considers nonaccrual loans and loans past due greater than 90 days and still accruing interest to be non-performing. The following table sets forth the Company’s retail loan portfolio, categorized by payment status, as of December 31 (in thousands):
| Residential | Home | Consumer | Other | |||||||||||||
| Mortgage | Equity | Indirect | Consumer | |||||||||||||
2010 | ||||||||||||||||
| Performing | $ | 127,451 | $ | 204,195 | $ | 399,707 | $ | 25,896 | ||||||||
| Non-performing | 2,102 | 875 | 514 | 41 | ||||||||||||
| Total | $ | 129,553 | $ | 205,070 | $ | 400,221 | $ | 25,937 | ||||||||
2009 | ||||||||||||||||
| Performing | $ | 141,910 | $ | 196,915 | $ | 337,874 | $ | 29,185 | ||||||||
| Non-performing | 2,376 | 880 | 621 | 7 | ||||||||||||
| Total | $ | 144,286 | $ | 197,795 | $ | 338,495 | $ | 29,192 | ||||||||
| Residential Mortgage | Home Equity | Consumer Indirect | Other Consumer | |||||||||||||
2012 | ||||||||||||||||
Performing | $ | 131,301 | $ | 281,564 | $ | 559,073 | $ | 26,632 | ||||||||
Non-performing | 2,040 | 939 | 891 | 25 | ||||||||||||
|
|
|
|
|
|
|
| |||||||||
Total | $ | 133,341 | $ | 282,503 | $ | 559,964 | $ | 26,657 | ||||||||
|
|
|
|
|
|
|
| |||||||||
2011 | ||||||||||||||||
Performing | $ | 112,221 | $ | 227,171 | $ | 465,249 | $ | 24,138 | ||||||||
Non-performing | 1,644 | 682 | 558 | — | ||||||||||||
|
|
|
|
|
|
|
| |||||||||
Total | $ | 113,865 | $ | 227,853 | $ | 465,807 | $ | 24,138 | ||||||||
|
|
|
|
|
|
|
| |||||||||
- 8087 -
NOTES TO CONSOLIDATED FINANCIAL STATEMENTS
December 31, 2010, 20092012, 2011 and 2008
(5.) LOANS (Continued)
Allowance for Loan Losses
The following table setstables set forth the changes in the allowance for loan losses for the years ended December 31 (in thousands):
| Commercial | Residential | Home | Consumer | Other | ||||||||||||||||||||||||
| Commercial | Mortgage | Mortgage | Equity | Indirect | Consumer | Total | ||||||||||||||||||||||
2010 | ||||||||||||||||||||||||||||
Allowance for loan losses: | ||||||||||||||||||||||||||||
| Beginning balance | $ | 4,407 | $ | 6,638 | $ | 1,251 | $ | 1,043 | $ | 6,837 | $ | 565 | $ | 20,741 | ||||||||||||||
| Charge-offs | 3,426 | 263 | 290 | 259 | 4,669 | 909 | 9,816 | |||||||||||||||||||||
| Recoveries | 326 | 501 | 21 | 36 | 1,485 | 485 | 2,854 | |||||||||||||||||||||
| Provision (credit) | 2,405 | (445 | ) | 31 | 152 | 4,101 | 443 | 6,687 | ||||||||||||||||||||
| Ending balance | $ | 3,712 | $ | 6,431 | $ | 1,013 | $ | 972 | $ | 7,754 | $ | 584 | $ | 20,466 | ||||||||||||||
| Evaluated for impairment: | ||||||||||||||||||||||||||||
| Individually | $ | 149 | $ | 883 | $ | — | $ | — | $ | — | $ | — | $ | 1,032 | ||||||||||||||
| Collectively | $ | 3,563 | $ | 5,548 | $ | 1,013 | $ | 972 | $ | 7,754 | $ | 584 | $ | 19,434 | ||||||||||||||
Loans: | ||||||||||||||||||||||||||||
| Ending balance | $ | 210,948 | $ | 353,537 | $ | 129,553 | $ | 205,070 | $ | 400,221 | $ | 25,937 | $ | 1,325,266 | ||||||||||||||
| Evaluated for impairment: | ||||||||||||||||||||||||||||
| Individually | $ | 948 | $ | 3,100 | $ | — | $ | — | $ | — | $ | — | $ | 4,048 | ||||||||||||||
| Collectively | $ | 210,000 | $ | 350,437 | $ | 129,553 | $ | 205,070 | $ | 400,221 | $ | 25,937 | $ | 1,321,218 | ||||||||||||||
| 2009 | 2008 | |||||||
| Beginning balance | $ | 18,749 | $ | 15,521 | ||||
| Charge-offs | 7,830 | 5,459 | ||||||
| Recoveries | 2,120 | 2,136 | ||||||
| Provision (credit) | 7,702 | 6,551 | ||||||
| Ending balance | $ | 20,741 | $ | 18,749 | ||||
| Commercial | Commercial Mortgage | Residential Mortgage | Home Equity | Consumer Indirect | Other Consumer | Total | ||||||||||||||||||||||
2012 | ||||||||||||||||||||||||||||
Allowance for loan losses: | ||||||||||||||||||||||||||||
Beginning balance | $ | 4,036 | $ | 6,418 | $ | 858 | $ | 1,242 | $ | 10,189 | $ | 517 | $ | 23,260 | ||||||||||||||
Charge-offs | (729 | ) | (745 | ) | (326 | ) | (305 | ) | (6,589 | ) | (874 | ) | (9,568 | ) | ||||||||||||||
Recoveries | 336 | 261 | 130 | 44 | 2,769 | 354 | 3,894 | |||||||||||||||||||||
Provision | 1,241 | 647 | 78 | 301 | 4,346 | 515 | 7,128 | |||||||||||||||||||||
|
|
|
|
|
|
|
|
|
|
|
|
|
| |||||||||||||||
Ending balance | $ | 4,884 | $ | 6,581 | $ | 740 | $ | 1,282 | $ | 10,715 | $ | 512 | $ | 24,714 | ||||||||||||||
|
|
|
|
|
|
|
|
|
|
|
|
|
| |||||||||||||||
Evaluated for impairment: | ||||||||||||||||||||||||||||
Individually | $ | 664 | $ | 310 | $ | — | $ | — | $ | — | $ | — | $ | 974 | ||||||||||||||
|
|
|
|
|
|
|
|
|
|
|
|
|
| |||||||||||||||
Collectively | $ | 4,220 | $ | 6,271 | $ | 740 | $ | 1,282 | $ | 10,715 | $ | 512 | $ | 23,740 | ||||||||||||||
|
|
|
|
|
|
|
|
|
|
|
|
|
| |||||||||||||||
Loans: | ||||||||||||||||||||||||||||
Ending balance | $ | 258,706 | $ | 414,282 | $ | 133,341 | $ | 282,503 | $ | 559,964 | $ | 26,657 | $ | 1,675,453 | ||||||||||||||
|
|
|
|
|
|
|
|
|
|
|
|
|
| |||||||||||||||
Evaluated for impairment: | ||||||||||||||||||||||||||||
Individually | $ | 3,413 | $ | 1,799 | $ | — | $ | — | $ | — | $ | — | $ | 5,212 | ||||||||||||||
|
|
|
|
|
|
|
|
|
|
|
|
|
| |||||||||||||||
Collectively | $ | 255,293 | $ | 412,483 | $ | 133,341 | $ | 282,503 | $ | 559,964 | $ | 26,657 | $ | 1,670,241 | ||||||||||||||
|
|
|
|
|
|
|
|
|
|
|
|
|
| |||||||||||||||
2011 | ||||||||||||||||||||||||||||
Allowance for loan losses: | ||||||||||||||||||||||||||||
Beginning balance | $ | 3,712 | $ | 6,431 | $ | 1,013 | $ | 972 | $ | 7,754 | $ | 584 | $ | 20,466 | ||||||||||||||
Charge-offs | (1,346 | ) | (751 | ) | (152 | ) | (449 | ) | (4,713 | ) | (877 | ) | (8,288 | ) | ||||||||||||||
Recoveries | 401 | 245 | 90 | 44 | 2,066 | 456 | 3,302 | |||||||||||||||||||||
Provision (credit) | 1,269 | 493 | (93 | ) | 675 | 5,082 | 354 | 7,780 | ||||||||||||||||||||
|
|
|
|
|
|
|
|
|
|
|
|
|
| |||||||||||||||
Ending balance | $ | 4,036 | $ | 6,418 | $ | 858 | $ | 1,242 | $ | 10,189 | $ | 517 | $ | 23,260 | ||||||||||||||
|
|
|
|
|
|
|
|
|
|
|
|
|
| |||||||||||||||
Evaluated for impairment: | ||||||||||||||||||||||||||||
Individually | $ | 436 | $ | 644 | $ | — | $ | — | $ | — | $ | — | $ | 1,080 | ||||||||||||||
|
|
|
|
|
|
|
|
|
|
|
|
|
| |||||||||||||||
Collectively | $ | 3,600 | $ | 5,774 | $ | 858 | $ | 1,242 | $ | 10,189 | $ | 517 | $ | 22,180 | ||||||||||||||
|
|
|
|
|
|
|
|
|
|
|
|
|
| |||||||||||||||
Loans: | ||||||||||||||||||||||||||||
Ending balance | $ | 233,727 | $ | 394,034 | $ | 113,865 | $ | 227,853 | $ | 465,807 | $ | 24,138 | $ | 1,459,424 | ||||||||||||||
|
|
|
|
|
|
|
|
|
|
|
|
|
| |||||||||||||||
Evaluated for impairment: | ||||||||||||||||||||||||||||
Individually | $ | 1,259 | $ | 2,928 | $ | — | $ | — | $ | — | $ | — | $ | 4,187 | ||||||||||||||
|
|
|
|
|
|
|
|
|
|
|
|
|
| |||||||||||||||
Collectively | $ | 232,468 | $ | 391,106 | $ | 113,865 | $ | 227,853 | $ | 465,807 | $ | 24,138 | $ | 1,455,237 | ||||||||||||||
|
|
|
|
|
|
|
|
|
|
|
|
|
| |||||||||||||||
- 88 -
FINANCIAL INSTITUTIONS, INC. AND SUBSIDIARIES
NOTES TO CONSOLIDATED FINANCIAL STATEMENTS
December 31, 2012, 2011 and 2010
(5.) LOANS (Continued)
| Commercial | Commercial Mortgage | Residential Mortgage | Home Equity | Consumer Indirect | Other Consumer | Total | ||||||||||||||||||||||
2010 | ||||||||||||||||||||||||||||
Allowance for loan losses: | ||||||||||||||||||||||||||||
Beginning balance | $ | 4,407 | $ | 6,638 | $ | 1,251 | $ | 1,043 | $ | 6,837 | $ | 565 | $ | 20,741 | ||||||||||||||
Charge-offs | (3,426 | ) | (263 | ) | (290 | ) | (259 | ) | (4,669 | ) | (909 | ) | (9,816 | ) | ||||||||||||||
Recoveries | 326 | 501 | 21 | 36 | 1,485 | 485 | 2,854 | |||||||||||||||||||||
Provision (credit) | 2,405 | (445 | ) | 31 | 152 | 4,101 | 443 | 6,687 | ||||||||||||||||||||
|
|
|
|
|
|
|
|
|
|
|
|
|
| |||||||||||||||
Ending balance | $ | 3,712 | $ | 6,431 | $ | 1,013 | $ | 972 | $ | 7,754 | $ | 584 | $ | 20,466 | ||||||||||||||
|
|
|
|
|
|
|
|
|
|
|
|
|
| |||||||||||||||
Evaluated for impairment: | ||||||||||||||||||||||||||||
Individually | $ | 149 | $ | 883 | $ | — | $ | — | $ | — | $ | — | $ | 1,032 | ||||||||||||||
|
|
|
|
|
|
|
|
|
|
|
|
|
| |||||||||||||||
Collectively | $ | 3,563 | $ | 5,548 | $ | 1,013 | $ | 972 | $ | 7,754 | $ | 584 | $ | 19,434 | ||||||||||||||
|
|
|
|
|
|
|
|
|
|
|
|
|
| |||||||||||||||
Loans: | ||||||||||||||||||||||||||||
Ending balance | $ | 210,948 | $ | 353,537 | $ | 129,553 | $ | 205,070 | $ | 400,221 | $ | 25,937 | $ | 1,325,266 | ||||||||||||||
|
|
|
|
|
|
|
|
|
|
|
|
|
| |||||||||||||||
Evaluated for impairment: | ||||||||||||||||||||||||||||
Individually | $ | 948 | $ | 3,100 | $ | — | $ | — | $ | — | $ | — | $ | 4,048 | ||||||||||||||
|
|
|
|
|
|
|
|
|
|
|
|
|
| |||||||||||||||
Collectively | $ | 210,000 | $ | 350,437 | $ | 129,553 | $ | 205,070 | $ | 400,221 | $ | 25,937 | $ | 1,321,218 | ||||||||||||||
|
|
|
|
|
|
|
|
|
|
|
|
|
| |||||||||||||||
Risk Characteristics
Commercial business loans primarily consist of loans to small to mid-sized businesses in our market area in a diverse range of industries. These loans are of higher risk and typically are made on the basis of the borrower’s ability to make repayment from the cash flow of the borrower’s business. Further, the collateral securing the loans may depreciate over time, may be difficult to appraise and may fluctuate in value. The credit risk related to commercial loans is largely influenced by general economic conditions and the resulting impact on a borrower’s operations or on the value of underlying collateral, if any.
Commercial mortgage loans generally have larger balances and involve a greater degree of risk than residential mortgage loans, inferring higher potential losses on an individual customer basis. Loan repayment is often dependent on the successful operation and management of the properties, as well as on the collateral securing the loan. Economic events or conditions in the real estate market could have an adverse impact on the cash flows generated by properties securing the Company’s commercial real estate loans and on the value of such properties.
Residential mortgage loans and home equities (comprised of home equity loans and home equity lines) are generally made on the basis of the borrower’s ability to make repayment from his or her employment and other income, but are secured by real property whose value tends to be more easily ascertainable. Credit risk for these types of loans is generally influenced by general economic conditions, the characteristics of individual borrowers, and the nature of the loan collateral.
Consumer indirect and other consumer loans may entail greater credit risk than residential mortgage loans and home equities, particularly in the case of other consumer loans which are unsecured or, in the case of indirect consumer loans, secured by depreciable assets, such as automobiles or boats. In such cases, any repossessed collateral for a defaulted consumer loan may not provide an adequate source of repayment of the outstanding loan balance. In addition, consumer loan collections are dependent on the borrower’s continuing financial stability, and thus are more likely to be affected by adverse personal circumstances such as job loss, illness or personal bankruptcy. Furthermore, the application of various federal and state laws, including bankruptcy and insolvency laws, may limit the amount which can be recovered on such loans.
- 8189 -
NOTES TO CONSOLIDATED FINANCIAL STATEMENTS
December 31, 2010, 20092012, 2011 and 2008
(6.) PREMISES AND EQUIPMENT, NET
Major classes of premises and equipment at December 31 are summarized as follows (in thousands):
| 2010 | 2009 | |||||||
| Land and land improvements | $ | 4,335 | $ | 4,334 | ||||
| Buildings and leasehold improvements | 39,215 | 39,553 | ||||||
| Furniture, fixtures, equipment and vehicles | 23,645 | 23,771 | ||||||
| Premises and equipment | 67,195 | 67,658 | ||||||
| Accumulated depreciation and amortization | (33,932 | ) | (32,875 | ) | ||||
| Premises and equipment, net | $ | 33,263 | $ | 34,783 | ||||
| 2012 | 2011 | |||||||
Land and land improvements | $ | 4,883 | $ | 4,330 | ||||
Buildings and leasehold improvements | 43,402 | 40,590 | ||||||
Furniture, fixtures, equipment and vehicles | 24,440 | 23,414 | ||||||
|
|
|
| |||||
Premises and equipment | 72,725 | 68,334 | ||||||
Accumulated depreciation and amortization | (36,107 | ) | (35,249 | ) | ||||
|
|
|
| |||||
Premises and equipment, net | $ | 36,618 | $ | 33,085 | ||||
|
|
|
| |||||
Depreciation and amortization expense relating to premises and equipment, included in occupancy and equipment expense in the consolidated statements of operations,income, amounted to $3.5$3.6 million for the year ended December 31, 2010, $3.82012 and $3.5 million for the yearyears ended December 31, 20092011 and $3.7 million for the year ended December 31, 2008.
(7.) GOODWILL AND OTHER INTANGIBLE ASSETS
The carrying amountchange in the balance for goodwill during the years ended December 31, 2012 and 2011 was as follows (in thousands):
| 2012 | 2011 | |||||||
Goodwill, beginning of year | $ | 37,369 | $ | 37,369 | ||||
Branch acquisitions | 11,599 | — | ||||||
Impairment | — | — | ||||||
|
|
|
| |||||
Goodwill, end of year | $ | 48,968 | $ | 37,369 | ||||
|
|
|
| |||||
Pursuant to the adoption of ASU 2011-08 in 2012, the Company first performed a qualitative assessment of goodwill totaled $37.4 million as of December 31, 2010 and 2009. The goodwill relates toat the Company’s primary subsidiary and reporting unit Five Star Bank. The Company performs a goodwill impairment test on an annual basis or more frequentlylevel, the Bank, to determine if events and circumstances warrant. On September 30, 2010, the Company performed the annual goodwill impairment test and determined the estimated fair value of our reporting unit to be in excess of its carrying amount. Accordingly, as of the Company’s annual impairment test date, thereit was no indication of goodwill impairment. The Company tests its goodwill for impairment between annual tests if an event occurs or circumstances change that would more likely than not reducethat the fair value of ourthe reporting unit belowis less than its carrying amount.
Declines in the market value of the Company’s publicly traded stock price or declines in the Company’s ability to generate future cash flows may increase the potential that goodwill recorded on the Company’s consolidated statement of financial condition be designated as impaired and that the Company may incur a goodwill write-down in the future.
The amount of goodwill to be deducted for tax purposes was $11.3 million at December 31, 2012.
The Company’s other intangible assets consisted entirely of a core deposit intangible asset. The gross carrying amount and accumulated amortization for the core deposit intangible asset was $2.0 million and $190 thousand, respectively, at December 31, 2012. The Company had no other intangible assets as of December 31, 2011. Core deposit intangible amortization expense, included in other noninterest expense on the consolidated statements of income, was $190 thousand for the year ended December 31, 2012. There was no core deposit intangible amortization expense for the years ended December 31, 2011 and 2010.
Estimated core deposit intangible amortization expense for each of the next five years is as follows:
2013 | $ | 386 | ||
2014 | 341 | |||
2015 | 296 | |||
2016 | 251 | |||
2017 | 205 |
- 8290 -
NOTES TO CONSOLIDATED FINANCIAL STATEMENTS
December 31, 2010, 20092012, 2011 and 2008
(8.) DEPOSITS
A summary of deposits as of December 31 are as follows (dollars in(in thousands):
| 2010 | 2009 | |||||||
| Noninterest-bearing demand | $ | 350,877 | $ | 324,303 | ||||
| Interest-bearing demand | 374,900 | 363,698 | ||||||
| Savings and money market | 417,359 | 368,603 | ||||||
| Certificates of deposit, due: | ||||||||
| Within one year | 554,104 | 526,549 | ||||||
| One to two years | 126,955 | 132,289 | ||||||
| Two to three years | 14,653 | 8,200 | ||||||
| Three to five years | 43,888 | 18,968 | ||||||
| Thereafter | 154 | 345 | ||||||
| Total certificates of deposits | 739,754 | 686,351 | ||||||
| Total deposits | $ | 1,882,890 | $ | 1,742,955 | ||||
| 2012 | 2011 | |||||||
Noninterest-bearing demand | $ | 501,514 | $ | 393,421 | ||||
Interest-bearing demand | 449,744 | 362,555 | ||||||
Savings and money market | 655,598 | 474,947 | ||||||
Certificates of deposit, due: | ||||||||
Within one year | 495,423 | 547,874 | ||||||
One to two years | 91,052 | 84,687 | ||||||
Two to three years | 35,993 | 17,974 | ||||||
Three to five years | 31,721 | 50,000 | ||||||
Thereafter | 749 | 141 | ||||||
|
|
|
| |||||
Total certificates of deposit | 654,938 | 700,676 | ||||||
|
|
|
| |||||
Total deposits | $ | 2,261,794 | $ | 1,931,599 | ||||
|
|
|
| |||||
Certificates of deposit in denominations of $100,000 or more at December 31, 2010, 20092012 and 20082011 amounted to $183.9 million, $173.4$222.4 million and $164.6$214.2 million, respectively. Interest expense on those certificates totaled $2.4 million, $3.2 million and $5.7 million in 2010, 2009 and 2008, respectively.
Interest expense by deposit type for the years ended December 31 is summarized as follows (in thousands):
| 2010 | 2009 | 2008 | ||||||||||
| Interest-bearing demand | $ | 705 | $ | 772 | $ | 3,246 | ||||||
| Savings and money market | 1,133 | 1,090 | 3,773 | |||||||||
| Certificates of deposit | 13,015 | 17,228 | 22,330 | |||||||||
| Total interest expense on deposits | $ | 14,853 | $ | 19,090 | $ | 29,349 | ||||||
| 2012 | 2011 | 2010 | ||||||||||
Interest-bearing demand | $ | 598 | $ | 614 | $ | 705 | ||||||
Savings and money market | 998 | 1,056 | 1,133 | |||||||||
Certificates of deposit | 6,866 | 9,764 | 13,015 | |||||||||
|
|
|
|
|
| |||||||
Total interest expense on deposits | $ | 8,462 | $ | 11,434 | $ | 14,853 | ||||||
|
|
|
|
|
| |||||||
(9.) BORROWINGS
There were no long-term borrowings outstanding as of December 31, 2012 and 2011. Outstanding short-term borrowings are summarized as follows as of December 31 (in thousands):
| 2010 | 2009 | |||||||
| Short-term borrowings: | ||||||||
| Federal funds purchased | $ | 38,200 | $ | 9,419 | ||||
| Repurchase agreements | 38,910 | 35,124 | ||||||
| Other short-term borrowings | — | 15,000 | ||||||
| Total short-term borrowings | 77,110 | 59,543 | ||||||
| Long-term borrowings: | ||||||||
| FHLB advances and repurchase agreements | 10,065 | 30,145 | ||||||
| Junior subordinated debentures | 16,702 | 16,702 | ||||||
| Total long-term borrowings | 26,767 | 46,847 | ||||||
| Total borrowings | $ | 103,877 | $ | 106,390 | ||||
| 2012 | 2011 | |||||||
Short-term borrowings: | ||||||||
Federal funds purchased | $ | — | $ | 11,597 | ||||
Repurchase agreements | 40,806 | 36,301 | ||||||
Short-term FHLB borrowings | 139,000 | 102,800 | ||||||
|
|
|
| |||||
Total short-term borrowings | $ | 179,806 | $ | 150,698 | ||||
|
|
|
| |||||
The Company classifies borrowings as short-term or long-term in accordance with the original terms of the agreement. At December 31, 2010,2012, the Company’s short-term and long-term borrowings had a weighted average ratesrate of 0.21% and 7.87%, respectively.
Short-term Borrowings
Federal funds purchased are short-term borrowings that typically mature within one to ninety days. Federal funds purchased totaled $38.2 million and $9.4 million at December 31, 2010 and 2009, respectively. RepurchaseShort-term repurchase agreements are secured overnight borrowings with customers. These short-term repurchase agreements amountedShort-term FHLB borrowings have original maturities of less than one year and include overnight borrowings which the Company typically utilizes to $38.9 million and $35.1 millionaddress short term funding needs as ofthey arise. Short-term FHLB borrowings at December 31, 20102012 consisted of $99.0 million in overnight borrowings and 2009, respectively.
- 8391 -
NOTES TO CONSOLIDATED FINANCIAL STATEMENTS
December 31, 2010, 20092012, 2011 and 2008
(9.) BORROWINGS (Continued)
Long-term Borrowings
The Company has credit capacity with the FHLB and can borrow through facilities that include an overnight line of credit, amortizing and term advances, and repurchase agreements. The FHLB credit capacity is collateralized by securities from the Company’s investment portfolio and certain qualifying loans. FHLB advances totaled $65 thousand and $145 thousand as of December 31, 2010 and 2009, respectively. The advances mature on various dates in 2011 and had a weighted average rate of 5.89% at December 31, 2010. FHLB repurchase agreements are stated at the amount of cash received in connection with the transaction. The Company may be required to provide additional collateral based on the fair value of the underlying securities. There were no FHLB repurchase agreements totaled $10.0 million and $30.0 millionborrowings outstanding as of December 31, 20102012 and 2009, respectively. The FHLB repurchase agreements mature during 2011 and bear a fixed interest rate of 3.98% at December 31, 2010. The $10.1 million of outstanding FHLB advances and repurchase agreements at December 31, 2010 is scheduled to be paid during 2011.
In February 2001, the Company formed Financial Institutions Statutory Trust I (the “Trust”) for the sole purpose of issuing trust preferred securities. The Company’s $502 thousand investment in the common equity of the Trust iswas classified in the consolidated statements of financial condition as other assets and $16.7 million of related 10.20% junior subordinated debentures arewere classified as long-term borrowings. In 2001, the Company incurred costs relating to the issuance of the debentures totaling $487 thousand. These costs, which arewere included in other assets on the consolidated statements of financial condition, were deferred and arewere being amortized to interest expense using the straight-line method over a twenty year period.
In August 2011, the Company through the Trust, issued 16,200 fixed rate pooled trust preferred securities with a liquidation preference of $1,000 per security. The trust preferred securities represent an interest in the related subordinated debenturesredeemed all of the Company, which were purchased by the Trust and have substantially the same payment terms as these trust preferred securities. The subordinated debentures are the only assets of the Trust and interest payments from the debentures finance the distributions paid on the trust preferred securities. Distributions on the debentures are payable semi-annually at a fixed interest rate of 10.20%. The trust preferred securities are subject to mandatory redemption at the liquidation preference, in whole or in part, upon repayment of the junior subordinated debentures at maturity or their earlier redemption. The subordinated debentures are redeemable prior to the maturity date of February 22, 2031, at the optiona redemption price equaling 105.1% of the Company on or after February 22, 2011, in whole or in part on semi-annual payment dates (February 22 or August 22) in periods thereafter. The subordinated debentures are also redeemable at any time, in whole, but not in part, uponprincipal amount redeemed, plus all accrued and unpaid interest. As a result of the occurrence of specific events defined within the trust indenture. The Company has the option to defer distributions on the subordinated debentures from time to time for a period not to exceed 20 consecutive quarters; howeverredemption, the Company has not opted to defer any payments to date.
| 2010 | 2009 | 2008 | ||||||||||
| Short-term borrowings | $ | 365 | $ | 270 | $ | 721 | ||||||
| Long-term borrowings | 2,502 | 2,857 | 3,547 | |||||||||
| Total interest expense on borrowings | $ | 2,867 | $ | 3,127 | $ | 4,268 | ||||||
redemption premium of $852 thousand and the write-off of the remaining unamortized issuance costs of $231 thousand.
- 84 -
Financial Instruments with Off-Balance Sheet Risk
The Company has financial instruments with off-balance sheet risk established in the normal course of business to meet the financing needs of its customers. These financial instruments include commitments to extend credit and standby letters of credit. These instruments involve, to varying degrees, elements of credit and interest rate risk extending beyond amounts recognized in the financial statements.
The Company’s exposure to credit loss in the event of nonperformance by the other party to the financial instrument for commitments to extend credit and standby letters of credit is essentially the same as that involved with extending loans to customers. The Company uses the same credit underwriting policies in making commitments and conditional obligations as for on-balance sheet instruments.
Off-balance sheet commitments as of December 31 consist of the following (in thousands):
| 2010 | 2009 | |||||||
| Commitments to extend credit | $ | 357,240 | $ | 316,688 | ||||
| Standby letters of credit | 6,524 | 6,887 | ||||||
| 2012 | 2011 | |||||||
Commitments to extend credit | $ | 435,948 | $ | 374,266 | ||||
Standby letters of credit | 9,223 | 8,855 | ||||||
Commitments to extend credit are agreements to lend to a customer as long as there is no violation of any condition established in the contract.agreement. Commitments generally have fixed expiration dates or other termination clauses and may require payment of a fee. Commitments may expire without being drawn upon; therefore the total commitment amounts do not necessarily represent future cash requirements. Each customer’s creditworthiness is evaluated on a case-by-case basis. The amount of collateral obtained, if any, is based on management’s credit evaluation of the borrower. Standby letters of credit are conditional lending commitments issued by the Company to guarantee the performance of a customer to a third party. These standby letters of credit are primarily issued to support private borrowing arrangements. The credit risk involved in issuing standby letters of credit is essentially the same as that involved in extending loan facilities to customers.
The Company also extends rate lock agreements to borrowers related to the origination of residential mortgage loans. To mitigate the interest rate risk inherent in these rate lock agreements when the Company intends to sell the related loan, once originated, as well as closed residential mortgage loans held for sale, the Company enters into forward commitments to sell individual residential mortgages. Rate lock agreements and forward commitments are considered derivatives and are recorded at fair value. Forward sales commitments totaled $8.0$1.8 million and $2.9 million at December 31, 2010. At December 31, 2010, forward sales commitments had positive fair values, included with other assets in the consolidated statements of financial condition, totaling $187 thousand2012 and negative fair values, included within other liabilities in the consolidated statements of financial condition, totaling $13 thousand. At December 31, 2009, forward sales commitments totaled $4.5 million. At December 31, 2009, these forward sales commitments had positive fair values, included with other assets in the consolidated statements of financial condition, totaling $63 thousand.2011, respectively. In addition, the net change in the fair values of these derivatives was recognized as other noninterest income or other noninterest expense in the consolidated statements of operations.
- 92 -
FINANCIAL INSTITUTIONS, INC. AND SUBSIDIARIES
NOTES TO CONSOLIDATED FINANCIAL STATEMENTS
December 31, 2012, 2011 and 2010
(10.) COMMITMENTS AND CONTINGENCIES (Continued)
Lease Obligations
The Company is obligated under a number of noncancellable operating lease agreements for land, buildings and equipment. Certain of these leases provide for escalation clauses and contain renewal options calling for increased rentals if the lease is renewed. Future minimum payments by year and in the aggregate, under the noncancellable leases with initial or remaining terms of one year or more, are as follows at December 31, 20102012 (in thousands):
| 2011 | $ | 1,218 | ||
| 2012 | 1,164 | |||
| 2013 | 1,024 | |||
| 2014 | 993 | |||
| 2015 | 940 | |||
| Thereafter | 5,868 | |||
| $ | 11,207 | |||
2013 | $ | 1,433 | ||
2014 | 1,384 | |||
2015 | 1,305 | |||
2016 | 1,197 | |||
2017 | 826 | |||
Thereafter | 4,347 | |||
|
| |||
| $ | 10,492 | |||
|
|
Rent expense relating to these operating leases, included in occupancy and equipment expense in the statements of operations,income, was $1.4$1.6 million, $1.5 million and $1.1$1.4 million in 2012, 2011 and 2010, 2009 and 2008, respectively.
Contingent Liabilities
In the ordinary course of business there are various threatened and pending legal proceedings against the Company. Based on consultation with outside legal counsel, management believes that the aggregate liability, if any, arising from such litigation would not have a material adverse effect on the Company’s consolidated financial statements.
- 85 -
General
The supervision and regulation of financial and bank holding companies and their subsidiaries is intended primarily for the protection of depositors, the deposit insurance funds regulated by the FDIC and the banking system as a whole, and not for the protection of shareholders or creditors of bank holding companies. The various bank regulatory agencies have broad enforcement power over financial holding companies and banks, including the power to impose substantial fines, operational restrictions and other penalties for violations of laws and regulations and for safety and soundness considerations.
Capital
Banks and financial holding companies are subject to various regulatory capital requirements administered by state and federal banking agencies. Failure to meet minimum capital requirements can initiate certain mandatory and possibly additional discretionary, actions by regulators that, if undertaken, could have a direct material impact on the Company’s consolidated financial statements. Capital adequacy guidelines and, additionally for banks, prompt corrective action regulations, involve quantitative measures of assets, liabilities, and certain off-balance sheet items calculated under regulatory accounting practices. Capital amounts and classifications are also subject to qualitative judgments by regulators about components, risk weighting and other factors.
Quantitative measures established by regulation to ensure capital adequacy require the Company and the Bank to maintain minimum amounts and ratios of Total and Tier 1 capital to risk-weighted assets and of Tier 1 capital to average assets (all as defined in the regulations). These minimum amounts and ratios are included in the table below.
The Company’s and the Bank’s Tier 1 capital consists of shareholders’ equity excluding unrealized gains and losses on securities available for sale (except for unrealized losses which have been determined to be other than temporary and recognized as expense in the consolidated statements of operations)income), goodwill and other intangible assets and disallowed portions of deferred tax assets. Tier 1 capital for the Company also includes, subject to limitation, $16.7 million of trust preferred securities issued by FISI Statutory Trust I and $37.5$17.5 million of preferred stock issued to the U.S. Department of Treasury (the “Treasury”) through the Treasury’s Troubled Asset Relief Program (“TARP”) (see Note 11, Shareholders’ Equity).stock. The Company and the Bank’s total capital are comprised of Tier 1 capital for each entity plus a permissible portion of the allowance for loan losses.
- 93 -
FINANCIAL INSTITUTIONS, INC. AND SUBSIDIARIES
NOTES TO CONSOLIDATED FINANCIAL STATEMENTS
December 31, 2012, 2011 and 2010
(11.) REGULATORY MATTERS (Continued)
The Tier 1 and total risk-based capital ratios are calculated by dividing the respective capital amounts by risk-weighted assets. Risk-weighted assets are calculated based on regulatory requirements and include total assets, excluding goodwill and other intangible assets and disallowed portions of deferred tax assets, allocated by risk weight category and certain off-balance sheetoff-balance-sheet items (primarily loan commitments and securities more than one level below investment grade that are subject to the low level exposure rule)commitments). The leverage ratio is calculated by dividing Tier 1 capital by adjusted quarterly average total assets, which exclude goodwill and other intangible assets and disallowed portions of deferred tax assets.
The Company’s and the Bank’s actual and required regulatory capital ratios were as follows as of December 31 (in thousands):
| For Capital | ||||||||||||||||||||||||||
| Actual | Adequacy Purposes | Well Capitalized | ||||||||||||||||||||||||
| Amount | Ratio | Amount | Ratio | Amount | Ratio | |||||||||||||||||||||
December 31, 2010: | ||||||||||||||||||||||||||
| Tier 1 leverage: | Company | $ | 181,089 | 8.31 | % | $ | 87,116 | 4.00 | % | $ | 108,896 | 5.00 | % | |||||||||||||
| Bank | 156,957 | 7.22 | 86,958 | 4.00 | 108,697 | 5.00 | ||||||||||||||||||||
| Tier 1 capital: | Company | 181,089 | 12.34 | 58,678 | 4.00 | 88,017 | 6.00 | |||||||||||||||||||
| Bank | 156,957 | 10.74 | 58,450 | 4.00 | 87,674 | 6.00 | ||||||||||||||||||||
| Total risk-based capital: | Company | 199,452 | 13.60 | 117,357 | 8.00 | 146,696 | 10.00 | |||||||||||||||||||
| Bank | 175,250 | 11.99 | 116,899 | 8.00 | 146,124 | 10.00 | ||||||||||||||||||||
December 31, 2009: | ||||||||||||||||||||||||||
| Tier 1 leverage: | Company | $ | 163,613 | 7.96 | % | $ | 82,188 | 4.00 | % | $ | 102,735 | 5.00 | % | |||||||||||||
| Bank | 154,316 | 7.53 | 82,018 | 4.00 | 102,522 | 5.00 | ||||||||||||||||||||
| Tier 1 capital: | Company | 163,613 | 11.95 | 54,746 | 4.00 | 82,119 | 6.00 | |||||||||||||||||||
| Bank | 154,316 | 11.33 | 54,475 | 4.00 | 81,712 | 6.00 | ||||||||||||||||||||
| Total risk-based capital: | Company | 180,766 | 13.21 | 109,492 | 8.00 | 136,865 | 10.00 | |||||||||||||||||||
| Bank | 171,385 | 12.58 | 108,949 | 8.00 | 136,186 | 10.00 | ||||||||||||||||||||
| For Capital | ||||||||||||||||||||||||||
| Actual | Adequacy Purposes | Well Capitalized | ||||||||||||||||||||||||
| Amount | Ratio | Amount | Ratio | Amount | Ratio | |||||||||||||||||||||
2012 | ||||||||||||||||||||||||||
Tier 1 leverage: | Company | $ | 199,824 | 7.70 | % | $ | 103,828 | 4.00 | % | $ | 129,785 | 5.00 | % | |||||||||||||
| Bank | 191,704 | 7.40 | 103,664 | 4.00 | 129,580 | 5.00 | ||||||||||||||||||||
Tier 1 capital: | Company | 199,824 | 10.70 | 74,671 | 4.00 | 112,006 | 6.00 | |||||||||||||||||||
| Bank | 191,704 | 10.29 | 74,515 | 4.00 | 111,773 | 6.00 | ||||||||||||||||||||
Total risk-based capital: | Company | 223,176 | 11.96 | 149,341 | 8.00 | 186,677 | 10.00 | |||||||||||||||||||
| Bank | 215,008 | 11.54 | 149,031 | 8.00 | 186,289 | 10.00 | ||||||||||||||||||||
2011 | ||||||||||||||||||||||||||
Tier 1 leverage: | Company | $ | 197,086 | 8.63 | % | $ | 91,310 | 4.00 | % | $ | 114,138 | 5.00 | % | |||||||||||||
| Bank | 184,639 | 8.10 | 91,192 | 4.00 | 113,990 | 5.00 | ||||||||||||||||||||
Tier 1 capital: | Company | 197,086 | 12.20 | 64,645 | 4.00 | 96,967 | 6.00 | |||||||||||||||||||
| Bank | 184,639 | 11.46 | 64,445 | 4.00 | 96,667 | 6.00 | ||||||||||||||||||||
Total risk-based capital: | Company | 217,325 | 13.45 | 129,290 | 8.00 | 161,612 | 10.00 | |||||||||||||||||||
| Bank | 204,817 | 12.71 | 128,890 | 8.00 | 161,112 | 10.00 | ||||||||||||||||||||
- 86 -
As of December 31,
Federal Reserve Requirements
The Bank is required to maintain a reserve balance at the FRB of New York. The reserve requirement for the Bank totaled $1.0 million as of December 31, 20102012 and 2009.
Dividend Restrictions
In the ordinary course of business, the Company is dependent upon dividends from Five Star Bank to provide funds for the payment of interest expense on the junior subordinated debentures, dividends to shareholders and to provide for other cash requirements. Banking regulations may limit the amount of dividends that may be paid. Approval by regulatory authorities is required if the effect of dividends declared would cause the regulatory capital of the Bank to fall below specified minimum levels. Approval is also required if dividends declared exceed the net profits for that year combined with the retained net profits for the preceding two years.
- 94 -
FINANCIAL INSTITUTIONS, INC. AND SUBSIDIARIES
NOTES TO CONSOLIDATED FINANCIAL STATEMENTS
December 31, 2012, 2011 and 2010
(12.) SHAREHOLDERS’ EQUITY
The Company’s authorized capital stock consists of 50,210,000 shares of capital stock, 50,000,000 of which are common stock, par value $0.01 per share, and 210,000 of which are preferred stock, par value $100 per share, which is designated into two classes, Class A of which 10,000 shares are authorized, and Class B of which 200,000 shares are authorized. There are two series of Class A preferred stock: Series A 3% preferred stock and the Series A preferred stock. There is one series of Class B preferred stock: Series B-1 8.48% preferred stock. As of December 31, 2010, thereThere were 183,259174,709 shares and 174,735 shares of preferred stock issued and outstanding.
Common Stock
The following table sets forth the Company currently has an effective shelf registration which allows forchanges in the ability to issue up to $50 million in common stock.
| 2010 | 2009 | |||||||
| Shares outstanding at beginning of period | 10,820,268 | 10,798,019 | ||||||
| Restricted stock awards issued, net | 99,324 | 13,172 | ||||||
| Stock options exercised | 15,563 | 1,010 | ||||||
| Directors’ retainer | 6,009 | 8,067 | ||||||
| Treasury stock purchases | (3,658 | ) | — | |||||
| Shares outstanding at end of period | 10,937,506 | 10,820,268 | ||||||
| Outstanding | Treasury | Issued | ||||||||||
2012 | ||||||||||||
Shares outstanding at beginning of year | 13,803,116 | 358,481 | 14,161,597 | |||||||||
Restricted stock awards issued, net of forfeitures | 7,857 | (7,857 | ) | — | ||||||||
Stock options exercised | 4,250 | (4,250 | ) | — | ||||||||
Treasury stock purchases | (33,330 | ) | 33,330 | — | ||||||||
Directors’ retainer | 5,816 | (5,816 | ) | — | ||||||||
|
|
|
|
|
| |||||||
Shares outstanding at end of year | 13,787,709 | 373,888 | 14,161,597 | |||||||||
|
|
|
|
|
| |||||||
2011 | ||||||||||||
Shares outstanding at beginning of year | 10,937,506 | 410,616 | 11,348,122 | |||||||||
Shares issued in common stock offering | 2,813,475 | — | 2,813,475 | |||||||||
Restricted stock awards issued, net of forfeitures | 51,070 | (51,070 | ) | — | ||||||||
Stock options exercised | 6,357 | (6,357 | ) | — | ||||||||
Treasury stock purchases | (11,181 | ) | 11,181 | — | ||||||||
Directors’ retainer | 5,889 | (5,889 | ) | — | ||||||||
|
|
|
|
|
| |||||||
Shares outstanding at end of year | 13,803,116 | 358,481 | 14,161,597 | |||||||||
|
|
|
|
|
| |||||||
Issuance of Common Stock
In March 2011, the Company had 410,616 shares and 527,854 sharescompleted the sale of treasury stock at December 31, 2010 and 2009, respectively. The Company repurchased 3,6582,813,475 shares of its common stock from employees in order to facilitate the paymentthrough an underwritten public offering at a price of withholding taxes on restricted shares granted. There were no open market transactions during the year ended December 31, 2010. There were no repurchases$16.35 per share. The net proceeds of the offering, after deducting underwriting discounts and commissions and offering expenses, were $43.1 million. A portion of the proceeds from this offering was used to redeem the Company’s Series A preferred stock during 2009.
and the 10.20% junior subordinated debentures.
- 87 -
Series A 3% Preferred Stock.As of December 31, 2010, thereThere were 1,5331,499 shares and 1,500 shares of Series A 3% preferred stock issued and outstanding.outstanding as of December 31, 2012 and 2011, respectively. Holders of Series A 3% preferred stock are entitled to receive an annual dividend of $3.00 per share, which is cumulative and payable quarterly. Holders of Series A 3% preferred stock have no pre-emptive right in, or right to purchase or subscribe for, any additional shares of the Company’s capital stock and have no voting rights. Dividend or dissolution payments to the Class A shareholders must be declared and paid, or set apart for payment, before any dividends or dissolution payments can be declared and paid, or set apart for payment, to the holders of Class B preferred stock or common stock. The Series A 3% preferred stock is not convertible into any other of the Company’s securities.
Series B-1 8.48% Preferred Stock.As of December 31, 2010, thereThere were 174,223173,210 shares and 173,235 shares of Series B-1 8.48% preferred stock issued and outstanding.outstanding as of December 31, 2012 and 2011, respectively. Holders of Series B-1 8.48% preferred stock are entitled to receive an annual dividend of $8.48 per share, which is cumulative and payable quarterly. Holders of Series B-1 8.48% preferred stock have no pre-emptive right in, or right to purchase or subscribe for, any additional shares of the Company’s common stock and have no voting rights. Accumulated dividends on the Series B-1 8.48% preferred stock do not bear interest, and the Series B-1 8.48% preferred stock is not subject to redemption. Dividend or dissolution payments to the Class B shareholders must be declared and paid, or set apart for payment, before any dividends or dissolution payments are declared and paid, or set apart for payment, to the holders of common stock. The Series B-1 8.48% preferred stock is not convertible into any other of the Company’s securities.
- 8895 -
NOTES TO CONSOLIDATED FINANCIAL STATEMENTS
December 31, 2010, 20092012, 2011 and 2008
(12.) SHAREHOLDERS’ EQUITY (Continued)
Redemption of Series A Preferred Stock and Warrant
In December 2008, under the Treasury’s TARP Capital Purchase Program, the Company entered into a Securities Purchase Agreement—Standard Terms with the Treasury pursuant to which, among other things, the Company sold to the Treasury for an aggregate purchase price of $37.5 million, 7,503 shares of fixed rate cumulative perpetual preferred stock, Series A (“Series A” preferred stock) and a warrant to purchase up to 378,175 shares of the Company’s common stock, par value $0.01 per share, at an exercise price of $14.88 per share (the “Warrant”), of the Company.
Pursuant to the terms of the Purchase Agreement, the Company’s ability to declare or pay dividends on any of its shares was limited. Specifically, the Company was prohibited from paying any dividend with respect to shares of common stock, other junior securities or preferred stock rankingpari passu with the Series A preferred stock or repurchasing or redeeming any shares of the Company’s common stock, other junior securities or preferred stock rankingpari passu with the Series A preferred stock in any quarter unless all accrued and unpaid dividends were paid on the Series A preferred stock for all past dividend periods (including the latest completed dividend period), subject to certain limited exceptions.
The $37.5 million in proceeds was allocated to the Series A preferred stock and the Warrant based on their relative fair values at issuance ($35.5 million was allocated to the Series A preferred stock and $2.0 million to the Warrant). The resulting discount for the Series A preferred stock was to be accreted over five years through retained earnings as a preferred stock dividend. The Warrant was to remain in additional paid-in-capital at its initial book value until it was exercised or expired.
In February 2011, the Company redeemed one-third, or $12.5 million, of the Series A preferred stock. In March 2011, the remaining $25.0 million of the Series A preferred stock was redeemed. The unamortized discount related to the Series A preferred stock was charged to retained earnings upon redemption. The complete redemption of the Series A preferred stock removed the TARP restrictions pertaining to the Company’s ability to declare and pay dividends and repurchase its common stock, as well as certain restrictions associated with executive compensation.
In May 2011, the Company repurchased the Warrant issued to the Treasury. The repurchase price of $2.1 million was recorded as a reduction of additional paid-in capital.
- 96 -
FINANCIAL INSTITUTIONS, INC. AND SUBSIDIARIES
NOTES TO CONSOLIDATED FINANCIAL STATEMENTS
December 31, 2012, 2011 and 2010
(13.) OTHER COMPREHENSIVE INCOME (LOSS)
Other comprehensive income (loss) is reported in the accompanying consolidated statements of comprehensive income and changes in shareholders’ equity. Information related to other comprehensive income (loss) for the years ended December 31 was as follows (in thousands):
| Pre-tax | Tax Expense | Net-of-tax | ||||||||||
| Amount | (Benefit) | Amount | ||||||||||
2010 | ||||||||||||
| Securities available for sale: | ||||||||||||
| Change in net unrealized gain/loss during the period | $ | (16 | ) | $ | 19 | $ | (35 | ) | ||||
| Reclassification adjustment for gains included in income | (169 | ) | (67 | ) | (102 | ) | ||||||
| Reclassification adjustment for impairment charges included in income | 594 | 235 | 359 | |||||||||
| 409 | 187 | 222 | ||||||||||
| Change in net actuarial gain/loss and prior service benefit (cost) on defined benefit pension and post-retirement plans | (2,192 | ) | (950 | ) | (1,242 | ) | ||||||
| Other comprehensive loss | $ | (1,783 | ) | $ | (763 | ) | (1,020 | ) | ||||
| Net income | 21,287 | |||||||||||
| Comprehensive income | $ | 20,267 | ||||||||||
2009 | ||||||||||||
| Securities available for sale: | ||||||||||||
| Change in net unrealized gain/loss during the period | $ | (4,186 | ) | $ | (1,619 | ) | $ | (2,567 | ) | |||
| Reclassification adjustment for gains included in income | (3,429 | ) | (1,327 | ) | (2,102 | ) | ||||||
| Reclassification adjustment for impairment charges included in income | 4,666 | 1,805 | 2,861 | |||||||||
| (2,949 | ) | (1,141 | ) | (1,808 | ) | |||||||
| Change in net actuarial gain/loss and prior service benefit (cost) on defined benefit pension and post-retirement plans | 3,457 | 1,338 | 2,119 | |||||||||
| Other comprehensive income | $ | 508 | $ | 197 | 311 | |||||||
| Net income | 14,441 | |||||||||||
| Comprehensive income | $ | 14,752 | ||||||||||
2008 | ||||||||||||
| Securities available for sale: | ||||||||||||
| Change in net unrealized gain/loss during the period | $ | (61,464 | ) | $ | (23,778 | ) | $ | (37,686 | ) | |||
| Reclassification adjustment for gains included in income | (288 | ) | (111 | ) | (177 | ) | ||||||
| Reclassification adjustment for impairment charges included in income | 68,215 | 26,389 | 41,826 | |||||||||
| 6,463 | 2,500 | 3,963 | ||||||||||
| Change in net actuarial gain/loss and prior service benefit (cost) on defined benefit pension and post-retirement plans | (14,098 | ) | (5,455 | ) | (8,643 | ) | ||||||
| Other comprehensive loss | $ | (7,635 | ) | $ | (2,955 | ) | (4,680 | ) | ||||
| Net loss | (26,158 | ) | ||||||||||
| Comprehensive loss | $ | (30,838 | ) | |||||||||
Pre-tax Amount | Tax Expense (Benefit) | Net-of-tax Amount | ||||||||||
2012 | ||||||||||||
Securities available for sale: | ||||||||||||
Change in net unrealized gain/loss during the period | $ | 6,682 | $ | 2,646 | $ | 4,036 | ||||||
Reclassification adjustment for gains included in income | (2,651 | ) | (1,050 | ) | (1,601 | ) | ||||||
Reclassification adjustment for impairment charges included in income | 91 | 36 | 55 | |||||||||
|
|
|
|
|
| |||||||
| 4,122 | 1,632 | 2,490 | ||||||||||
Change in net actuarial gain/loss and prior service cost on defined benefit pension and post-retirement plans | (300 | ) | (118 | ) | (182 | ) | ||||||
|
|
|
|
|
| |||||||
Other comprehensive income | $ | 3,822 | $ | 1,514 | $ | 2,308 | ||||||
|
|
|
|
|
| |||||||
2011 | ||||||||||||
Securities available for sale: | ||||||||||||
Change in net unrealized gain/loss during the period | $ | 22,350 | $ | 8,855 | $ | 13,495 | ||||||
Reclassification adjustment for gains included in income | (3,003 | ) | (1,190 | ) | (1,813 | ) | ||||||
Reclassification adjustment for impairment charges included in income | 18 | 7 | 11 | |||||||||
|
|
|
|
|
| |||||||
| 19,365 | 7,672 | 11,693 | ||||||||||
Change in net actuarial gain/loss and prior service cost on defined benefit pension and post-retirement plans | (9,979 | ) | (3,953 | ) | (6,026 | ) | ||||||
|
|
|
|
|
| |||||||
Other comprehensive income | $ | 9,386 | $ | 3,719 | $ | 5,667 | ||||||
|
|
|
|
|
| |||||||
2010 | ||||||||||||
Securities available for sale: | ||||||||||||
Change in net unrealized gain/loss during the period | $ | (16 | ) | $ | 19 | $ | (35 | ) | ||||
Reclassification adjustment for gains included in income | (169 | ) | (67 | ) | (102 | ) | ||||||
Reclassification adjustment for impairment charges included in income | 594 | 235 | 359 | |||||||||
|
|
|
|
|
| |||||||
| 409 | 187 | 222 | ||||||||||
Change in net actuarial gain/loss and prior service cost on defined benefit pension and post-retirement plans | (2,192 | ) | (950 | ) | (1,242 | ) | ||||||
|
|
|
|
|
| |||||||
Other comprehensive loss | $ | (1,783 | ) | $ | (763 | ) | $ | (1,020 | ) | |||
|
|
|
|
|
| |||||||
The components of accumulated other comprehensive income (loss), net of tax, as of December 31 were as follows (in thousands):
| 2010 | 2009 | |||||||
| Net actuarial loss and prior service cost on defined benefit pension and post-retirement plans | $ | (6,599 | ) | $ | (5,357 | ) | ||
| Net unrealized gain on securities available for sale | 1,877 | 1,655 | ||||||
| $ | (4,722 | ) | $ | (3,702 | ) | |||
| 2012 | 2011 | |||||||
Net actuarial loss and prior service cost on defined benefit pension and post-retirement plans | $ | (12,807 | ) | $ | (12,625 | ) | ||
Net unrealized gain on securities available for sale | 16,060 | 13,570 | ||||||
|
|
|
| |||||
| $ | 3,253 | $ | 945 | |||||
|
|
|
| |||||
- 8997 -
NOTES TO CONSOLIDATED FINANCIAL STATEMENTS
December 31, 2010, 20092012, 2011 and 2008
(14.) SHARE-BASED COMPENSATION
The Company maintains certain stock-based compensation plans, approved by the Company’s shareholders that are administered by the Board, or the Management Development and Compensation Committee (the “Compensation Committee”) of the Board. OnIn May 6, 2009, the shareholders of the Company approved two share-based compensation plans, the 2009 Management Stock Incentive Plan (“Management Plan”) and the 2009 Directors’ Stock Incentive Plan (“Director’s Plan”), and collectively with the Management Plan, “the Plans”. An aggregate of 690,000 shares hasof the Company’s common stock have been reserved for issuance by the Company under the terms of the Management Plan pursuant to the grant of incentive stock options (not to exceed 500,000 shares), non-qualified stock options and restricted stock grants, all which are defined in the plan. An aggregate of 250,000 shares hasof the Company’s common stock have been reserved for issuance by the Company under the terms of the Director’s Plan pursuant to the grant of non-qualified stock options and restricted stock grants, all which are defined in the plan. Under both plans, for purposes of calculating the number of shares of common stock available for issuance, each share of common stock granted pursuant to a restricted stock grant shall count as 1.64 shares of common stock. As of December 31, 2010,2012, there were approximately 225,000200,000 and 523,000451,000 shares available for grant under the Director’s Plan and Management Plan, respectively, of which 61% were available for issuance as restricted stock grants.
Under the Plans, the Board, in the case of the Director’s Plan, or the Compensation Committee, in the case of the Management Plan, and the Director’s Plan (the “Plans”), the Board (or the Compensation Committee) may establish and prescribe grant guidelines including various terms and conditions for the granting of stock-based compensation. For stock options, the exercise price of each option equals the market price of the Company’s stock on the date of the grant. All options expire after a period of ten years from the date of grant and generally become fully exercisable over a period of 3 to 5 years from the grant date. When option recipients exercise their options, the Company issues shares from treasury stock and records the proceeds as additions to capital. ForShares of restricted stock sharesgranted to employees generally vestsvest over 2 to 3 years from the grant date. Fifty percent of the shares of restricted stock granted to non-employee directors generally vests on the date of grant and the remaining fifty percent generally vests one year from the grant date. Vesting of the shares may be based on years of service, established performance measures or both. If restricted stock grants are forfeited before they vest, the shares are reacquired into treasury stock.
The share-based compensation plans were established to allow for the granting of compensation awards to attract, motivate and retain employees, executive officers and non-employee directors who contribute to the success and profitability of the Company and to give such persons a proprietary interest in the Company, thereby enhancing their personal interest in the Company’s success.
The share-based compensation expense for the years ended December 31 was as follows (in thousands):
| 2010 | 2009 | 2008 | ||||||||||
| Stock options: | ||||||||||||
| Management Stock Incentive Plan | $ | 110 | $ | 222 | $ | 378 | ||||||
| Director Stock Incentive Plan | 43 | 46 | 40 | |||||||||
| Total stock option expense | 153 | 268 | 418 | |||||||||
| Restricted stock awards: | ||||||||||||
| Management Stock Incentive Plan | 761 | 488 | 215 | |||||||||
| Director Stock Incentive Plan | 117 | 98 | — | |||||||||
| Total restricted stock award expense | 878 | 586 | 215 | |||||||||
| Total share-based compensation | $ | 1,031 | $ | 854 | $ | 633 | ||||||
| 2012 | 2011 | 2010 | ||||||||||
Stock options: | ||||||||||||
Management Stock Incentive Plan | $ | 12 | $ | 55 | $ | 110 | ||||||
Director Stock Incentive Plan | — | 14 | 43 | |||||||||
|
|
|
|
|
| |||||||
Total stock options | 12 | 69 | 153 | |||||||||
Restricted stock awards: | ||||||||||||
Management Stock Incentive Plan | 382 | 917 | 761 | |||||||||
Director Stock Incentive Plan | 132 | 119 | 117 | |||||||||
|
|
|
|
|
| |||||||
Total restricted stock awards | 514 | 1,036 | 878 | |||||||||
|
|
|
|
|
| |||||||
Total share-based compensation | $ | 526 | $ | 1,105 | $ | 1,031 | ||||||
|
|
|
|
|
| |||||||
- 98 -
FINANCIAL INSTITUTIONS, INC. AND SUBSIDIARIES
NOTES TO CONSOLIDATED FINANCIAL STATEMENTS
December 31, 2012, 2011 and 2010
(14.) SHARE-BASED COMPENSATION (Continued)
The Company uses the Black-Scholes valuation method to estimate the fair value of its stock option awards. There were no stock options awarded during 2012, 2011 or 2010. There was no unrecognized compensation expense related to unvested stock options as of December 31, 2012. The following is a summary of stock option activity for the year ended December 31, 20102012 (dollars in thousands, except per share amounts):
| Weighted | ||||||||||||||||
| Weighted | Average | |||||||||||||||
| Average | Remaining | Aggregate | ||||||||||||||
| Number of | Exercise | Contractual | Intrinsic | |||||||||||||
| Options | Price | Term | Value | |||||||||||||
| Outstanding at beginning of year | 458,734 | $ | 20.30 | |||||||||||||
| Granted | — | — | ||||||||||||||
| Exercised | (15,563 | ) | 13.88 | |||||||||||||
| Forfeited | (2,317 | ) | 17.94 | |||||||||||||
| Expired | (30,961 | ) | 19.25 | |||||||||||||
| Outstanding at end of year | 409,893 | 20.64 | 4.49 years | $ | 155 | |||||||||||
| Exercisable at end of year | 374,290 | 20.92 | 4.23 years | $ | 104 | |||||||||||
| Weighted | ||||||||||||||||
| Weighted | Average | |||||||||||||||
| Average | Remaining | Aggregate | ||||||||||||||
| Number of | Exercise | Contractual | Intrinsic | |||||||||||||
| Options | Price | Term | Value | |||||||||||||
Outstanding at beginning of year | 368,058 | $ | 20.70 | |||||||||||||
Granted | — | — | ||||||||||||||
Exercised | (4,250 | ) | 15.85 | |||||||||||||
Forfeited | — | — | ||||||||||||||
Expired | (44,533 | ) | 24.55 | |||||||||||||
|
| |||||||||||||||
Outstanding at end of period | 319,275 | $ | 20.22 | 2.6 years | $ | 71 | ||||||||||
Exercisable at end of period | 319,275 | $ | 20.22 | 2.6 years | $ | 71 | ||||||||||
- 90 -
| Options granted | 61,100 | |||
| Grant date weighted average fair value per share | $ | 5.09 | ||
| Grant date weighted average share price | $ | 16.98 | ||
| Risk-free interest rate | 3.40 | % | ||
| Expected dividend yield | 3.48 | % | ||
| Expected stock price volatility | 38.60 | % | ||
| Expected life (in years) | 6.19 |
The following is a summary of restricted stock award activity for the year ended December 31, 2010:
| Weighted | ||||||||
| Average | ||||||||
| Market | ||||||||
| Number of | Price at | |||||||
| Shares | Grant Date | |||||||
| Outstanding at beginning of year | 77,772 | $ | 15.05 | |||||
| Granted | 107,040 | 12.51 | ||||||
| Vested | (26,300 | ) | 18.24 | |||||
| Forfeited | (7,716 | ) | 13.64 | |||||
| Outstanding at end of year | 150,796 | $ | 12.76 | |||||
| Weighted | ||||||||
| Average | ||||||||
| Market | ||||||||
| Number of | Price at | |||||||
| Shares | Grant Date | |||||||
Outstanding at beginning of year | 166,654 | $ | 14.34 | |||||
Granted | 57,541 | 17.32 | ||||||
Vested | (94,931 | ) | 12.79 | |||||
Forfeited | (49,684 | ) | 16.67 | |||||
|
| |||||||
Outstanding at end of period | 79,580 | $ | 16.89 | |||||
|
| |||||||
As of December 31, 2010,2012, there was $869$458 thousand of unrecognized compensation expense related to unvested restricted stock awards that is expected to be recognized over a weighted average period of 1.661.31 years.
- 9199 -
NOTES TO CONSOLIDATED FINANCIAL STATEMENTS
December 31, 2010, 20092012, 2011 and 2008
(15.) INCOME TAXES
| 2010 | 2009 | 2008 | ||||||||||
| Income tax expense (benefit) | $ | 9,352 | $ | 6,140 | $ | (21,301 | ) | |||||
| Shareholder’s equity | (763 | ) | 197 | (2,955 | ) | |||||||
The income tax expense (benefit) for the years ended December 31 consisted of the following (in thousands):
| 2010 | 2009 | 2008 | ||||||||||
| Current tax expense (benefit): | ||||||||||||
| Federal | $ | 5,781 | $ | (1,355 | ) | $ | 2,043 | |||||
| State | 1,103 | 25 | 504 | |||||||||
| Total current tax expense (benefit) | 6,884 | (1,330 | ) | 2,547 | ||||||||
| Deferred tax expense (benefit): | ||||||||||||
| Federal | 2,852 | 6,189 | (19,640 | ) | ||||||||
| State | (384 | ) | 1,281 | (4,208 | ) | |||||||
| Total deferred tax expense (benefit) | 2,468 | 7,470 | (23,848 | ) | ||||||||
| Total income tax expense (benefit) | $ | 9,352 | $ | 6,140 | $ | (21,301 | ) | |||||
| 2012 | 2011 | 2010 | ||||||||||
Current tax expense: | ||||||||||||
Federal | $ | 4,021 | $ | 3,747 | $ | 5,781 | ||||||
State | 955 | 1,158 | 1,103 | |||||||||
|
|
|
|
|
| |||||||
Total current tax expense | 4,976 | 4,905 | 6,884 | |||||||||
|
|
|
|
|
| |||||||
Deferred tax expense (benefit): | ||||||||||||
Federal | 5,262 | 5,584 | 2,852 | |||||||||
State | 1,081 | 926 | (384 | ) | ||||||||
|
|
|
|
|
| |||||||
Total deferred tax expense | 6,343 | 6,510 | 2,468 | |||||||||
|
|
|
|
|
| |||||||
Total income tax expense | $ | 11,319 | $ | 11,415 | $ | 9,352 | ||||||
|
|
|
|
|
| |||||||
Income tax expense (benefit) differed from the statutory federal income tax rate for the years ended December 31 as follows:
| 2010 | 2009 | 2008 | ||||||||||
| Statutory federal tax rate | 35.0 | % | 34.0 | % | (34.0 | )% | ||||||
| Increase (decrease) resulting from: | ||||||||||||
| Tax exempt interest income | (4.2 | ) | (8.6 | ) | (5.2 | ) | ||||||
| Non-taxable earnings on company owned life insurance | (1.3 | ) | (1.8 | ) | (0.4 | ) | ||||||
| Dividend received deduction | (0.1 | ) | (0.1 | ) | (0.8 | ) | ||||||
| State taxes, net of federal tax benefit | 1.5 | 4.2 | (5.2 | ) | ||||||||
| Nondeductible expenses | 0.6 | 1.0 | 0.2 | |||||||||
| Disallowed interest expense | 0.2 | 0.5 | 0.5 | |||||||||
| Other, net | (1.2 | ) | 0.6 | — | ||||||||
| Effective tax rate | 30.5 | % | 29.8 | % | (44.9 | )% | ||||||
| 2012 | 2011 | 2010 | ||||||||||
Statutory federal tax rate | 35.0 | % | 35.0 | % | 35.0 | % | ||||||
Increase (decrease) resulting from: | ||||||||||||
Tax exempt interest income | (4.6 | ) | (4.3 | ) | (4.2 | ) | ||||||
Non-taxable earnings on company owned life insurance | (1.8 | ) | (1.5 | ) | (1.3 | ) | ||||||
State taxes, net of federal tax benefit | 3.8 | 4.0 | 1.5 | |||||||||
Nondeductible expenses | 0.3 | 0.4 | 0.6 | |||||||||
Other, net | (0.1 | ) | (0.2 | ) | (1.1 | ) | ||||||
|
|
|
|
|
| |||||||
Effective tax rate | 32.6 | % | 33.4 | % | 30.5 | % | ||||||
|
|
|
|
|
| |||||||
- 92 -
Total income tax expense was allocated as follows for the years ended December 31
| 2012 | 2011 | 2010 | ||||||||||||
Income tax expense | $ | 11,319 | $ | 11,415 | $ | 9,352 | ||||||||
Shareholder’s equity | 1,514 | 3,718 | (763 | ) | ||||||||||
The Company’s net deferred tax asset is included in other assets in the Consolidated Statementsconsolidated statements of Condition.condition. The tax effects of temporary differences that give rise to the deferred tax assets and deferred tax liabilities are as follows at December 31 (in thousands):
| 2010 | 2009 | |||||||
| Deferred tax assets: | ||||||||
| Other than temporary impairment of investment securities | $ | 15,418 | $ | 14,827 | ||||
| Allowance for loan losses | 8,108 | 7,418 | ||||||
| Tax attribute carryforward benefits | 2,033 | 5,559 | ||||||
| Share-based compensation | 1,250 | 1,033 | ||||||
| Interest on non-accruing loans | 781 | 788 | ||||||
| Core deposit intangible | 158 | 258 | ||||||
| Accrued pension costs | — | 92 | ||||||
| Other | 665 | 580 | ||||||
| Gross deferred tax assets | 28,413 | 30,555 | ||||||
| Deferred tax liabilities: | ||||||||
| Deferred loan origination costs | 2,263 | 3,290 | ||||||
| Depreciation and amortization | 1,489 | 1,283 | ||||||
| Net unrealized gain on securities available for sale | 1,231 | 1,044 | ||||||
| Loan servicing assets | 581 | 522 | ||||||
| Prepaid pension costs | 139 | — | ||||||
| Other | — | 1 | ||||||
| Gross deferred tax liabilities | 5,703 | 6,140 | ||||||
| Net deferred tax asset | $ | 22,710 | $ | 24,415 | ||||
| 2012 | 2011 | |||||||
Deferred tax assets: | ||||||||
Other than temporary impairment of investment securities | $ | 5,283 | $ | 11,326 | ||||
Allowance for loan losses | 9,791 | 9,106 | ||||||
Share-based compensation | 1,111 | 1,437 | ||||||
SERP agreements | 734 | 285 | ||||||
Deferred compensation | 868 | 499 | ||||||
Interest on nonaccrual loans | 732 | 716 | ||||||
Accrued pension costs | — | 538 | ||||||
Tax attribute carryforward benefits | — | 463 | ||||||
Other | 798 | 467 | ||||||
|
|
|
| |||||
Gross deferred tax assets | 19,317 | 24,837 | ||||||
Deferred tax liabilities: | ||||||||
Net unrealized gain on securities available for sale | 10,536 | 8,903 | ||||||
Depreciation and amortization | 1,827 | 1,741 | ||||||
Prepaid pension costs | 1,648 | — | ||||||
Loan servicing assets | 681 | 781 | ||||||
Deferred loan origination costs | — | 930 | ||||||
|
|
|
| |||||
Gross deferred tax liabilities | 14,692 | 12,355 | ||||||
|
|
|
| |||||
Net deferred tax asset | $ | 4,625 | $ | 12,482 | ||||
|
|
|
| |||||
- 100 -
FINANCIAL INSTITUTIONS, INC. AND SUBSIDIARIES
NOTES TO CONSOLIDATED FINANCIAL STATEMENTS
December 31, 2012, 2011 and 2010
(15.) INCOME TAXES (Continued)
The Company recognizes deferred income taxes for the estimated future tax effects of differences between the tax and financial statement bases of assets and liabilities considering enacted tax laws. These differences result in deferred tax assets and liabilities, which are included in other assets in the Company’s consolidated statements of condition. The Company also assesses the likelihood that deferred tax assets will be realizable based on, among other considerations, future taxable income and establishes, if necessary, a valuation allowance for those deferred tax assets determined to not likely be realizable. A deferred tax asset valuation allowance is recognized if, based on the weight of available evidence (both positive and negative), it is more likely than not that some portion or all of the deferred tax assets will not be realized. The future realization of deferred tax benefits depends upon the existence of sufficient taxable income within the carry-back and carry-forward periods. ManagementManagement’s judgment is required in determining the appropriate recognition of deferred tax assets and liabilities, including projections of future taxable income.
Based upon the Company’s historical and projected future levels of pre-tax and taxable income, the scheduled reversals of taxable temporary differences to offset future deductible amounts, and prudent and feasible tax planning strategies, management believes it is more likely than not that the deferred tax assets will be realized. As such, no valuation allowance has been recorded as of December 31, 20102012 or 2009.
The Company and its subsidiaries are subject to federal and New York State (“NYS”) income taxes. The federal income tax years currently open for audits are 2007 through 2010.2012. The NYS income tax years currently open for audits are 2009 and 2010.
At December 31, 2010,2012, the Company had no federal or NYS net operating loss carryforwards. The Company has federalor tax credits of approximately $2.0 million which have an unlimited carryforward period.
The Company’s unrecognized tax benefits and changes in unrecognized tax benefits were not significant as of or for the years ended December 31, 20102012 and 2009.2011. There were no interest or penalties recorded in the income statement in income tax expense for the year ended December 31, 2010.2012. As of December 31, 2010,2012, there were no amounts accrued for interest or penalties related to uncertain tax positions.
- 93 -
The following table presents a reconciliation of the earnings and shares used in calculating basic and diluted EPS for each of the years ended December 31 (in thousands, except per share amounts).
| 2010 | 2009 | 2008 | ||||||||||
| Net income (loss) available to common shareholders | $ | 17,562 | $ | 10,744 | $ | (27,696 | ) | |||||
| Less: Earnings (loss) allocated to participating securities | 105 | 87 | (230 | ) | ||||||||
| Earnings (loss) allocated to common shares outstanding | $ | 17,457 | $ | 10,657 | $ | (27,466 | ) | |||||
| Weighted average common shares used to calculate basic EPS | 10,767 | 10,730 | 10,818 | |||||||||
| Add: Effect of common stock equivalents | 78 | 39 | — | |||||||||
| Weighted average common shares used to calculate diluted EPS | 10,845 | 10,769 | 10,818 | |||||||||
| Earnings (loss) per common share: | ||||||||||||
| Basic | $ | 1.62 | $ | 0.99 | $ | (2.54 | ) | |||||
| Diluted | $ | 1.61 | $ | 0.99 | $ | (2.54 | ) | |||||
| Shares subject to the following securities, outstanding as of December 31 of the respective year, were excluded from the computation of diluted EPS because the effect would be antidilutive: | ||||||||||||
| Stock options | 353 | 459 | 583 | |||||||||
| Restricted stock awards | — | — | 82 | |||||||||
| Warrant | — | 378 | 378 | |||||||||
| 353 | 837 | 1,043 | ||||||||||
| 2012 | 2011 | 2010 | ||||||||||
Net income available to common shareholders | $ | 21,975 | $ | 19,617 | $ | 17,562 | ||||||
Less: Earnings allocated to participating securities | 2 | 38 | 105 | |||||||||
|
|
|
|
|
| |||||||
Net income available to common shareholders for EPS | $ | 21,973 | $ | 19,579 | $ | 17,457 | ||||||
|
|
|
|
|
| |||||||
Weighted average common shares outstanding: | ||||||||||||
Total shares issued | 14,162 | 13,599 | 11,348 | |||||||||
Unvested restricted stock awards | (107 | ) | (166 | ) | (154 | ) | ||||||
Treasury shares | (359 | ) | (366 | ) | (427 | ) | ||||||
|
|
|
|
|
| |||||||
Total basic weighted average common shares outstanding | 13,696 | 13,067 | 10,767 | |||||||||
Incremental shares from assumed: | ||||||||||||
Exercise of stock options | 4 | 3 | 6 | |||||||||
Vesting of restricted stock awards | 51 | 65 | 27 | |||||||||
Exercise of warrant | — | 22 | 45 | |||||||||
|
|
|
|
|
| |||||||
Total diluted weighted average common shares outstanding | 13,751 | 13,157 | 10,845 | |||||||||
Basic earnings per common share | $ | 1.60 | $ | 1.50 | $ | 1.62 | ||||||
|
|
|
|
|
| |||||||
Diluted earnings per common share | $ | 1.60 | $ | 1.49 | $ | 1.61 | ||||||
|
|
|
|
|
| |||||||
For each of the periods presented, average shares subject to the following instruments were excluded from the computation of diluted EPS because the effect would be antidilutive:
Stock options | 303 | 339 | 353 | |||||||||
Restricted stock awards | 1 | — | — | |||||||||
|
|
|
|
|
| |||||||
| 304 | 339 | 353 | ||||||||||
|
|
|
|
|
|
- 101 -
FINANCIAL INSTITUTIONS, INC. AND SUBSIDIARIES
NOTES TO CONSOLIDATED FINANCIAL STATEMENTS
December 31, 2012, 2011 and 2010
(17.) EMPLOYEE BENEFIT PLANS
Defined Benefit Pension Plan
The Company participates in The New York State Bankers Retirement System (the “Plan”), a defined benefit pension plan covering substantially all employees, subject to the limitations related to the plan closure effective December 31, 2006. The benefits are based on years of service and the employee’s highest average compensation during five consecutive years of employment. The defined benefit plan was closed to new participants effective December 31, 2006. Only employees hired on or before December 31, 2006 and who met participation requirements on or before January 1, 2008 are eligible to receive benefits.
The following table provides a reconciliation of the Company’s changes in the plan’s benefit obligations, fair value of assets and a statement of the funded status as of and for the year ended December 31 (in thousands):
| 2010 | 2009 | |||||||
| Change in projected benefit obligation: | ||||||||
| Projected benefit obligation at beginning of period | $ | (33,441 | ) | $ | (30,878 | ) | ||
| Service cost | (1,633 | ) | (1,689 | ) | ||||
| Interest cost | (1,933 | ) | (1,826 | ) | ||||
| Actuarial loss | (2,969 | ) | (489 | ) | ||||
| Benefits paid and plan expenses | 1,595 | 1,441 | ||||||
| Projected benefit obligation at end of period | (38,381 | ) | (33,441 | ) | ||||
| Change in plan assets: | ||||||||
| Fair value of plan assets at beginning of period | 33,203 | 24,431 | ||||||
| Actual return on plan assets | 2,823 | 5,132 | ||||||
| Employer contributions | 4,300 | 5,081 | ||||||
| Benefits paid and plan expenses | (1,595 | ) | (1,441 | ) | ||||
| Fair value of plan assets at end of period | 38,731 | 33,203 | ||||||
| Funded (unfunded) status at end of period | $ | 350 | $ | (238 | ) | |||
| 2012 | 2011 | |||||||
Change in projected benefit obligation: | ||||||||
Projected benefit obligation at beginning of period | $ | 48,303 | $ | 38,381 | ||||
Service cost | 2,037 | 1,756 | ||||||
Interest cost | 2,017 | 2,027 | ||||||
Actuarial loss | 3,291 | 7,939 | ||||||
Benefits paid and plan expenses | (2,023 | ) | (1,800 | ) | ||||
|
|
|
| |||||
Projected benefit obligation at end of period | 53,625 | 48,303 | ||||||
|
|
|
| |||||
Change in plan assets: | ||||||||
Fair value of plan assets at beginning of period | 46,943 | 38,731 | ||||||
Actual return on plan assets | 4,865 | 12 | ||||||
Employer contributions | 8,000 | 10,000 | ||||||
Benefits paid and plan expenses | (2,023 | ) | (1,800 | ) | ||||
|
|
|
| |||||
Fair value of plan assets at end of period | 57,785 | 46,943 | ||||||
|
|
|
| |||||
Funded (unfunded) status at end of period | $ | 4,160 | $ | (1,360 | ) | |||
|
|
|
| |||||
The accumulated benefit obligation was $34.3$48.0 million and $29.5$43.3 million at December 31, 20102012 and 2009,2011, respectively.
- 94 -
Estimated benefit payments under the pension plan over the next ten years at December 31, 20102012 are as follows (in thousands):
| 2011 | $ | 1,415 | ||
| 2012 | 1,504 | |||
| 2013 | 1,561 | |||
| 2014 | 1,682 | |||
| 2015 | 1,795 | |||
| 2016 - 2020 | 11,669 |
2013 | $ | 1,637 | ||
2014 | 1,724 | |||
2015 | 1,882 | |||
2016 | 2,106 | |||
2017 | 2,284 | |||
2018 – 2022 | 13,128 |
Net periodic pension cost consists of the following components for the years ended December 31 (in thousands):
| 2010 | 2009 | 2008 | ||||||||||
| Service cost | $ | 1,633 | $ | 1,689 | $ | 1,456 | ||||||
| Interest cost on projected benefit obligation | 1,933 | 1,826 | 1,562 | |||||||||
| Expected return on plan assets | (2,444 | ) | (1,848 | ) | (2,094 | ) | ||||||
| Amortization of unrecognized loss | 458 | 728 | — | |||||||||
| Amortization of unrecognized prior service cost | 11 | 11 | 11 | |||||||||
| Net periodic pension cost | $ | 1,591 | $ | 2,406 | $ | 935 | ||||||
| 2012 | 2011 | 2010 | ||||||||||
Service cost | $ | 2,037 | $ | 1,756 | $ | 1,633 | ||||||
Interest cost on projected benefit obligation | 2,017 | 2,027 | 1,933 | |||||||||
Expected return on plan assets | (3,211 | ) | (2,653 | ) | (2,444 | ) | ||||||
Amortization of unrecognized loss | 1,370 | 608 | 458 | |||||||||
Amortization of unrecognized prior service cost | 20 | 19 | 11 | |||||||||
|
|
|
|
|
| |||||||
Net periodic pension cost | $ | 2,233 | $ | 1,757 | $ | 1,591 | ||||||
|
|
|
|
|
| |||||||
- 102 -
FINANCIAL INSTITUTIONS, INC. AND SUBSIDIARIES
NOTES TO CONSOLIDATED FINANCIAL STATEMENTS
December 31, 2012, 2011 and 2010
(17.) EMPLOYEE BENEFIT PLANS (Continued)
The actuarial assumptions used to determine the net periodic pension cost were as follows:
| 2010 | 2009 | 2008 | ||||||||||
| Weighted average discount rate | 5.89 | % | 6.03 | % | 6.35 | % | ||||||
| Rate of compensation increase | 3.50 | % | 3.50 | % | 3.50 | % | ||||||
| Expected long-term rate of return | 7.50 | % | 7.50 | % | 7.50 | % | ||||||
| 2012 | 2011 | 2010 | ||||||||||
Weighted average discount rate | 4.27 | % | 5.38 | % | 5.89 | % | ||||||
Rate of compensation increase | 3.00 | % | 3.00 | % | 3.50 | % | ||||||
Expected long-term rate of return | 7.00 | % | 7.00 | % | 7.50 | % | ||||||
The actuarial assumptions used to determine the projected benefit obligation were as follows:
| 2010 | 2009 | 2008 | ||||||||||
| Weighted average discount rate | 5.38 | % | 5.89 | % | 6.03 | % | ||||||
| Rate of compensation increase | 3.00 | % | 3.50 | % | 3.50 | % | ||||||
| 2012 | 2011 | 2010 | ||||||||||
Weighted average discount rate | 3.84 | % | 4.27 | % | 5.38 | % | ||||||
Rate of compensation increase | 3.00 | % | 3.00 | % | 3.00 | % | ||||||
The weighted average discount rate was based upon the projected benefit cash flows and the market yields of high grade corporate bonds that are available to pay such cash flows.
- 95 -
Equity securities | Dividend discount model, the smoothed earnings yield model and the equity risk premium model | ||
Fixed income securities | Current yield-to-maturity and forecasts of future yields | ||
Other financial instruments | Comparison of the specific investment’s risk to that of fixed income and equity instruments and using judgment | ||
The long term rate of return considers historical returns. Adjustments were made to historical returns in order to reflect expectations of future returns. These adjustments were due to factor forecasts by economists and long-term U.S. Treasury yields to forecast long-term inflation. In addition forecasts by economists and others for long-term GDP growth were factored into the development of assumptions for earnings growth and per capital income.
The Plan’s overall investment strategy is to achieve a mix of approximately 97% of investments for long-term growth and 3% for near-term benefit payments with a wide diversification of asset types, fund strategies, and fund managers. The target allocations for Plan assets are shown in the table below. Cash equivalents consist primarily of short term investment funds. Equity securities primarily include investments in common stock and depository receipts. Fixed income securities include corporate bonds, government issues and mortgage backed securities. Other financial instruments primarily include rights and warrants.
- 103 -
FINANCIAL INSTITUTIONS, INC. AND SUBSIDIARIES
NOTES TO CONSOLIDATED FINANCIAL STATEMENTS
December 31, 2012, 2011 and 2010
(17.) EMPLOYEE BENEFIT PLANS (Continued)
Effective March 2009,September 2011, the Plan revised its investment guidelines. The Plan currently prohibits its investment managers from purchasing any security greater than 5% of the portfolio at the time of purchase or greater than 8% at market value in any one issuer. In addition, the following investments;
Equity securities | Short sales Unregistered securities Margin purchases | ||
Fixed income securities | |||
Mortgage backed derivatives that have an inverse floating rate Any ABS that is not issued by the U.S. Government Generally securities of less than Baa2/BBB quality may not be purchased Securities of less than A-quality may not in the aggregate exceed 10% of the investment manager’s portfolio | |||
Other financial instruments | Unhedged currency exposure in countries not defined as “high income economies” by the World Bank | ||
Prior to September 2011 investments in emerging countries as defined by the Morgan Stanley Emerging Markets Index and structured notes were prohibited.
- 96 -
| Weighted | ||||||||||||||||
| Average | ||||||||||||||||
| 2011 | Percentage of Plan Assets | Expected | ||||||||||||||
| Target | at December 31, | Long-term | ||||||||||||||
| Allocation | 2010 | 2009 | Rate of Return | |||||||||||||
| Asset category: | ||||||||||||||||
| Cash equivalents | 0 — 20% | 11.2 | % | 13.8 | % | — | ||||||||||
| Equity securities | 40 — 60 | 48.2 | 45.7 | 4.60 | % | |||||||||||
| Fixed income securities | 40 — 60 | 40.6 | 40.5 | 1.90 | % | |||||||||||
| Other financial instruments | 0 — 5 | — | — | — | ||||||||||||
| Weighted | ||||||||||||||||
| Average | ||||||||||||||||
| 2013 | Percentage of Plan Assets | Expected | ||||||||||||||
| Target | at December 31, | Long-term | ||||||||||||||
| Allocation | 2012 | 2011 | Rate of Return | |||||||||||||
Asset category: | ||||||||||||||||
Cash equivalents | 0 – 20 | % | 12.8 | % | 10.6 | % | 0.38 | % | ||||||||
Equity securities | 40 – 60 | 45.5 | 47.9 | 3.95 | ||||||||||||
Fixed income securities | 40 – 60 | 41.7 | 41.5 | 1.90 | ||||||||||||
Other financial instruments | 0 – 5 | — | — | — | ||||||||||||
- 104 -
FINANCIAL INSTITUTIONS, INC. AND SUBSIDIARIES
NOTES TO CONSOLIDATED FINANCIAL STATEMENTS
December 31, 2012, 2011 and 2010
(17.) EMPLOYEE BENEFIT PLANS (Continued)
Assets are segregated by the level of the valuation inputs within the fair value hierarchy established by ASC Topic 820 utilized to measure fair value (see Note 17 — 18—Fair Value Measurements).
| Level 1 | Level 2 | Level 3 | Total | |||||||||||||
| Inputs | Inputs | Inputs | Fair Value | |||||||||||||
December 31, 2010: | ||||||||||||||||
| Cash equivalents: | ||||||||||||||||
| Foreign currencies | $ | 84 | $ | — | $ | — | $ | 84 | ||||||||
| Short term investment funds | — | 4,266 | — | 4,266 | ||||||||||||
| Total cash equivalents | 84 | 4,266 | — | 4,350 | ||||||||||||
| Equity securities: | ||||||||||||||||
| U.S. Large Cap | 10,800 | — | — | 10,800 | ||||||||||||
| U.S. Mid Cap | 1,103 | — | — | 1,103 | ||||||||||||
| U.S. Small Cap | 82 | — | — | 82 | ||||||||||||
| International | 6,698 | — | — | 6,698 | ||||||||||||
| Total equities | 18,683 | — | — | 18,683 | ||||||||||||
| Fixed income securities: | ||||||||||||||||
| Corporate bonds | ||||||||||||||||
| Rated single A or higher by S&P | — | 2,113 | — | 2,113 | ||||||||||||
| Rate below single A by S&P | — | 1,483 | — | 1,483 | ||||||||||||
| Government issues | — | 11,259 | — | 11,259 | ||||||||||||
| Collateralized mortgage obligations: | — | |||||||||||||||
| Rated single A or higher by S&P | — | 582 | — | 582 | ||||||||||||
| Rate below single A by S&P | — | 261 | — | 261 | ||||||||||||
| Total fixed income securities | — | 15,698 | — | 15,698 | ||||||||||||
| Total Plan investments | $ | 18,767 | $ | 19,964 | $ | — | $ | 38,731 | ||||||||
- 97 -
| Level 1 | Level 2 | Level 3 | Total | |||||||||||||
| Inputs | Inputs | Inputs | Fair Value | |||||||||||||
December 31, 2009: | ||||||||||||||||
| Cash equivalents: | ||||||||||||||||
| Foreign currencies | $ | 114 | $ | — | $ | — | $ | 114 | ||||||||
| Short term investment funds | — | 4,486 | — | 4,486 | ||||||||||||
| Total cash equivalents | 114 | 4,486 | — | 4,600 | ||||||||||||
| Equity securities: | ||||||||||||||||
| U.S. Large Cap | 8,094 | — | — | 8,094 | ||||||||||||
| U.S. Mid Cap | 289 | — | — | 289 | ||||||||||||
| U.S. Small Cap | 83 | — | — | 83 | ||||||||||||
| International | 6,712 | — | — | 6,712 | ||||||||||||
| Total equities | 15,178 | — | — | 15,178 | ||||||||||||
| Fixed income securities: | ||||||||||||||||
| Corporate bonds | ||||||||||||||||
| Rated single A or higher by S&P | — | 1,722 | — | 1,722 | ||||||||||||
| Rate below single A by S&P | — | 1,433 | — | 1,433 | ||||||||||||
| Government issues | — | 9,281 | — | 9,281 | ||||||||||||
| Collateralized mortgage obligations: | ||||||||||||||||
| Rated single A or higher by S&P | — | 617 | — | 617 | ||||||||||||
| Rate below single A by S&P | — | 185 | — | 185 | ||||||||||||
| Other fixed income securities | — | 187 | — | 187 | ||||||||||||
| Total fixed income securities | — | 13,425 | — | 13,425 | ||||||||||||
| Total Plan investments | $ | 15,292 | $ | 17,911 | $ | — | $ | 33,203 | ||||||||
| Balance at beginning of year | $ | 130 | ||
| Change in unrealized appreciation | 53 | |||
| Realized loss | (57 | ) | ||
| Sale proceeds | (126 | ) | ||
| Balance at end of year | $ | — | ||
| Level 1 | Level 2 | Level 3 | Total | |||||||||||||
| Inputs | Inputs | Inputs | Fair Value | |||||||||||||
2012 | ||||||||||||||||
Cash equivalents: | ||||||||||||||||
Foreign currencies | 60 | — | — | 60 | ||||||||||||
Government issues | — | 314 | — | 314 | ||||||||||||
Short term investment funds | — | 7,083 | — | 7,083 | ||||||||||||
|
|
|
|
|
|
|
| |||||||||
Total cash equivalents | 60 | 7,397 | — | 7,457 | ||||||||||||
Equity securities: | ||||||||||||||||
Common stock | 25,447 | — | — | 25,447 | ||||||||||||
Depository receipts | 569 | — | — | 569 | ||||||||||||
Preferred stock | 113 | — | — | 113 | ||||||||||||
Real estate investment fund | 113 | — | — | 113 | ||||||||||||
|
|
|
|
|
|
|
| |||||||||
Total equity securities | 26,242 | — | — | 26,242 | ||||||||||||
Fixed income securities: | ||||||||||||||||
Auto loan receivable | — | 313 | — | 313 | ||||||||||||
Collateralized mortgage obligations | — | 6,262 | — | 6,262 | ||||||||||||
Corporate Bonds | — | 5,456 | — | 5,456 | ||||||||||||
FHLMC | — | 717 | — | 717 | ||||||||||||
FNMA | — | 2,867 | — | 2,867 | ||||||||||||
GNMA I | — | 31 | — | 31 | ||||||||||||
GNMA II | — | 133 | — | 133 | ||||||||||||
Government Issues | — | 8,231 | — | 8,231 | ||||||||||||
Municipals | — | 63 | — | 63 | ||||||||||||
Other Asset Backed | — | 14 | — | 14 | ||||||||||||
|
|
|
|
|
|
|
| |||||||||
Total fixed income securities | — | 24,087 | — | 24,087 | ||||||||||||
|
|
|
|
|
|
|
| |||||||||
Total Plan investments | $ | 26,302 | 31,484 | — | 57,786 | |||||||||||
|
|
|
|
|
|
|
| |||||||||
- 105 -
FINANCIAL INSTITUTIONS, INC. AND SUBSIDIARIES
NOTES TO CONSOLIDATED FINANCIAL STATEMENTS
December 31, 2012, 2011 and 2010
(17.) EMPLOYEE BENEFIT PLANS (Continued)
| Level 1 Inputs | Level 2 Inputs | Level 3 Inputs | Total Fair Value | |||||||||||||
2011 | ||||||||||||||||
Cash equivalents: | ||||||||||||||||
Foreign currencies | 81 | — | — | 81 | ||||||||||||
Short term investment funds | — | 4,901 | — | 4,901 | ||||||||||||
|
|
|
|
|
|
|
| |||||||||
Total cash equivalents | 81 | 4,901 | — | 4,982 | ||||||||||||
Equity securities: | ||||||||||||||||
Common stock | 21,951 | — | — | 21,951 | ||||||||||||
Depository receipts | 473 | — | — | 473 | ||||||||||||
Preferred stock | 69 | — | — | 69 | ||||||||||||
|
|
|
|
|
|
|
| |||||||||
Total equity securities | 22,493 | — | — | 22,493 | ||||||||||||
Fixed income securities: | ||||||||||||||||
Auto loan receivable | — | 6 | — | 6 | ||||||||||||
Collateralized mortgage obligations | — | 4,587 | — | 4,587 | ||||||||||||
Corporate Bonds | — | 4,171 | — | 4,171 | ||||||||||||
FHLMC | — | 809 | — | 809 | ||||||||||||
FNMA | — | 2,500 | — | 2,500 | ||||||||||||
GNMA I | — | 34 | — | 34 | ||||||||||||
GNMA II | — | 175 | — | 175 | ||||||||||||
Government Issues | — | 7,078 | — | 7,078 | ||||||||||||
Municipals | — | 55 | — | 55 | ||||||||||||
Other Asset Backed | — | 53 | — | 53 | ||||||||||||
|
|
|
|
|
|
|
| |||||||||
Total fixed income securities | — | 19,468 | — | 19,468 | ||||||||||||
|
|
|
|
|
|
|
| |||||||||
Total Plan investments | $ | 22,574 | 24,369 | — | 46,943 | |||||||||||
|
|
|
|
|
|
|
| |||||||||
At December 31, 2012 the portfolio was managed by two investment firms, with control of the portfolio split approximately 49% and 43% under the control of the investment managers with the remaining 8% under the direct control of the Plan. A portfolio concentration in the State Street Bank & Trust Co. Short Term Investment Fund of 12% and 10% existed at December 31, 2012 and 2011, respectively.
Postretirement Benefit Plan
An entity acquired by the Company provided health and dental care benefits to retired employees who met specified age and service requirements through a postretirement health and dental care plan in which both the acquired entity and the retirees shared the cost. The plan provided for substantially the same medical insurance coverage as for active employees until their death and was integrated with Medicare for those retirees aged 65 or older. In 2001, the plan’s eligibility requirements were amended to curtail eligible benefit payments to only retired employees and active participantsemployees who were fully vestedhad already met the then-applicable age and service requirements under the Plan. In 2003, retirees under age 65 began contributing to health coverage at the same cost-sharing level as that of active employees. The retirees agedRetirees ages 65 or older were offered new Medicare supplemental plans as alternatives to the plan historically offered. The cost sharing of medical coverage was standardized throughout the group of retirees aged 65 or older. In addition, to be consistent with the administration of the Company’s dental plan for active employees, all retirees who continued dental coverage began paying the full monthly premium. The accrued liability included in other liabilities in the consolidated statements of financial condition related to this plan amounted to $162$118 thousand and $155$122 thousand as of December 31, 20102012 and 2009,2011, respectively. The postretirement expense for the plan that was included in salaries and employee benefits in the consolidated statements of operationsincome was not significant for the years ended December 31, 2010, 20092012, 2011 and 2008.2010. The plan is not funded.
- 98106 -
NOTES TO CONSOLIDATED FINANCIAL STATEMENTS
December 31, 2010, 20092012, 2011 and 2008
(17.) EMPLOYEE BENEFIT PLANS (Continued)
The components of accumulated other comprehensive loss related to the defined benefit plan and postretirement benefit plan, on a pre-tax basis as of December 31 are summarized below (in thousands):
| 2010 | 2009 | |||||||
Defined benefit plan: | ||||||||
| Net actuarial loss | $ | (11,188 | ) | $ | (9,056 | ) | ||
| Prior service cost | (132 | ) | (143 | ) | ||||
| (11,320 | ) | (9,199 | ) | |||||
Postretirement benefit plan: | ||||||||
| Net actuarial loss | (252 | ) | (248 | ) | ||||
| Prior service credit | 643 | 710 | ||||||
| 391 | 462 | |||||||
| Total recognized in accumulated other comprehensive loss | $ | (10,929 | ) | $ | (8,737 | ) | ||
| 2012 | 2011 | |||||||
Defined benefit plan: | ||||||||
Net actuarial loss | $ | (21,428 | ) | $ | (21,160 | ) | ||
Prior service cost | (93 | ) | (113 | ) | ||||
|
|
|
| |||||
| (21,521 | ) | (21,273 | ) | |||||
|
|
|
| |||||
Postretirement benefit plan: | ||||||||
Net actuarial loss | (195 | ) | (210 | ) | ||||
Prior service credit | 508 | 575 | ||||||
|
|
|
| |||||
| 313 | 365 | |||||||
|
|
|
| |||||
Total recognized in accumulated other comprehensive loss | $ | (21,208 | ) | $ | (20,908 | ) | ||
|
|
|
| |||||
Changes in plan assets and benefit obligations recognized in other comprehensive income (loss)loss on a pre-tax basis during the years ended December 31 are as follows (in thousands):
| 2010 | 2009 | |||||||
Defined benefit plan: | ||||||||
| Net actuarial (loss) gain | $ | (2,590 | ) | $ | 2,795 | |||
| Amortization of net loss | 458 | 728 | ||||||
| Amortization of prior service cost | 11 | 12 | ||||||
| (2,121 | ) | 3,535 | ||||||
Postretirement benefit plan: | ||||||||
| Net actuarial loss | (4 | ) | (10 | ) | ||||
| Amortization of prior service credit | (67 | ) | (68 | ) | ||||
| (71 | ) | (78 | ) | |||||
| Total recognized in other comprehensive income (loss) | $ | (2,192 | ) | $ | 3,457 | |||
| 2012 | 2011 | |||||||
Defined benefit plan: | ||||||||
Net actuarial loss | $ | (1,638 | ) | $ | (10,580 | ) | ||
Amortization of net loss | 1,370 | 608 | ||||||
Amortization of prior service cost | 20 | 19 | ||||||
|
|
|
| |||||
| (248 | ) | (9,953 | ) | |||||
|
|
|
| |||||
Postretirement benefit plan: | ||||||||
Net actuarial gain | 15 | 42 | ||||||
Amortization of prior service credit | (67 | ) | (68 | ) | ||||
|
|
|
| |||||
| (52 | ) | (26 | ) | |||||
|
|
|
| |||||
Total recognized in other comprehensive loss | $ | (300 | ) | $ | (9,979 | ) | ||
|
|
|
| |||||
For the year ending December 31, 2011,2013, the estimated net loss and prior service cost for the plan that will be amortized from accumulated other comprehensive income into net periodic benefit cost is $608$1.3 million and $20 thousand, and $19 thousand, respectively.
Defined Contribution Plan
Employees that meet certain age and service requirementsspecified eligibility conditions are eligible to participate in the Company sponsored 401(k) plan. Under the plan, participants may make contributions, in the form of salary deferrals, up to the maximum Internal Revenue Code limit. The Company matches a participant’s contributions up to 4.5% of compensation, calculated as 100% of the first 3% of compensation and 50% of the next 3% of compensation deferred by the participant. The Company may also make additional discretionary matching contributions, although no such additional discretionary contributions were made in 2010, 20092012, 2011 or 2008.2010. The expense included in salaries and employee benefits in the consolidated statements of operationsincome for this plan amounted to $1.0 million in 2012 and 2011 and $936 thousand $914 thousand and $993 thousand in 2010, 2009 and 2008, respectively.
Supplemental Executive Retirement Plans
The Company has a non-qualified Supplemental Executive Retirement PlanPlans (“SERP”SERPs”) covering threefour former executives. At December 31, 2010, there was a $1.1 millionThe unfunded pension liability related to the SERP. PensionSERPs was $2.2 million and $1.0 million at December 31, 2012 and 2011, respectively. SERP expense was $1.3 million, $67 thousand, and $262 thousand $648 thousand,for 2012, 2011 and $309 thousand for 2010, 2009 and 2008, respectively.
- 99107 -
NOTES TO CONSOLIDATED FINANCIAL STATEMENTS
December 31, 2010, 20092012, 2011 and 2008
(18.) FAIR VALUE MEASUREMENTS
Determination of Fair Value —– Assets Measured at Fair Value on a Recurring and Nonrecurring Basis
Valuation Hierarchy
The fair value of an asset or liability is the price that would be received to sell that asset or paid to transfer that liability in an orderly transaction occurring in the principal market (or most advantageous market in the absence of a principal market) for such asset or liability. ASC Topic 820, “Fair Value Measurements and Disclosures,” establishes a fair value hierarchy for valuation inputs that gives the highest priority to quoted prices in active markets for identical assets or liabilities and the lowest priority to unobservable inputs. The fair value hierarchy is as follows:
Level 1—Unadjusted quoted prices in active markets for identical assets or liabilities that the reporting entity has the ability to access at the measurement date.
Level 2—Inputs other than quoted prices included in Level 1 that are observable for the asset or liability, either directly or indirectly. These might include quoted prices for similar assets or liabilities in active markets, quoted prices for identical or similar assets or liabilities in markets that are not active, inputs other than quoted prices that are observable for the asset or liability (such as interest rates, volatilities, prepayment speeds, credit risks, etc.) or inputs that are derived principally from or corroborated by market data by correlation or other means.
Level 3—Unobservable inputs for determining the fair values of assets or liabilities that reflect an entity’s own assumptions about the assumptions that market participants would use in pricing the assets or liabilities.
In general, fair value is based upon quoted market prices, where available. If such quoted market prices are not available, fair value is based upon internally developed models that primarily use, as inputs, observable market-based parameters. Valuation adjustments may be made to ensure that financial instruments are recorded at fair value. These adjustments may include amounts to reflect counterparty credit quality and the company’s creditworthiness, among other things, as well as unobservable parameters. Any such valuation adjustments are applied consistently over time. The Company’s valuation methodologies may produce a fair value calculation that may not be indicative of net realizable value or reflective of future fair values. While management believes the Company’s valuation methodologies are appropriate and consistent with other market participants, the use of different methodologies or assumptions to determine the fair value of certain financial instruments could result in a different estimate of fair value at the reporting date. Furthermore, the reported fair value amounts have not been comprehensively revalued since the presentation dates, and therefore, estimates of fair value after the balance sheet date may differ significantly from the amounts presented herein. A more detailed description of the valuation methodologies used for assets and liabilities measured at fair value, as well as the general classification of such instruments pursuant to the valuation hierarchy, is set forth below.
Investment securitiesSecurities available for sale:Publicly traded equity securities (stocks) are reported at fair value utilizing Level 1 inputs. Pooled trust preferred securities are reported at fair value utilizing Level 3 inputs. Fair values for these securities are determined through the use of internal valuation methodologies appropriate for the specific asset, which may include the use of a discounted expected cash flow analysis or the use of broker quotes. Other securitiesSecurities classified as available for sale are reported at fair value utilizing Level 2 inputs. For these securities, the Company obtains fair value measurements from an independent pricing service. The fair value measurements consider observable data that may include dealer quotes, market spreads, cash flows, the U.S. Treasury yield curve, live trading levels, trade execution data, market consensus prepayment speeds, credit information and the bond’s terms and conditions, among other things.
Loans held for sale: The fair value of loans held for sale is determined using quoted secondary market prices and investor commitments. Loans held for sale are classified as Level 2 in the fair value hierarchy.
Collateral dependent impaired loans:The fair Fair value of impaired loans with specific allocations of the allowance for loan losses is generallymeasured based on recentthe value of the collateral securing these loans and is classified as Level 3 in the fair value hierarchy. Collateral may be real estate appraisals.and/or business assets including equipment, inventory and/or accounts receivable and collateral value is determined based on appraisals performed by qualified licensed appraisers hired by the Company. These appraisals may utilize a single valuation approach or a combination of approaches including comparable sales and the income approach. Adjustments are routinely madeAppraised and reported values may be discounted based on management’s historical knowledge, changes in market conditions from the appraisal process bytime of valuation, and/or management’s expertise and knowledge of the appraisers to adjust for differences betweenclient and the comparable sales and income data available.client’s business. Such adjustmentsdiscounts are typically significant and result in a Level 3 classification of the inputs for determining fair value.
- 100108 -
NOTES TO CONSOLIDATED FINANCIAL STATEMENTS
December 31, 2010, 20092012, 2011 and 2008
(18.) FAIR VALUE MEASUREMENTS (Continued)
MortgageLoan servicing rights:MortgageLoan servicing rights do not trade in an active market with readily observable market data. As a result, the Company estimates the fair value of mortgageloan servicing rights by using a discounted cash flow model to calculate the present value of estimated future net servicing income. The assumptions used in the discounted cash flow model are those that we believe market participants would use in estimating future net servicing income, including estimates of loan prepayment rates, servicing costs, ancillary income, impound account balances, and discount rates. Significant assumptionsThe significant unobservable inputs used in the valuationfair value measurement of mortgagethe Company’s loan servicing rights include changes in interest rates, estimated loan repaymentare the constant prepayment rates and weighted average discount rate. Significant increases (decreases) in any of those inputs in isolation could result in a significantly lower (higher) fair value measurement. Although the timing of cash flows, among other factors. Mortgageconstant prepayment rate and the discount rate are not directly interrelated, they will generally move in opposite directions. Loan servicing rights are classified as Level 3 measurements due to the use of significant unobservable inputs, as well as significant management judgment and estimation.
Other real estate owned (Foreclosed assets): Nonrecurring adjustments to certain commercial and residential real estate properties classified as other real estate owned are measured at the lower of carrying amount or fair value, less costs to sell. Fair values are generally based on third party appraisals of the property, resulting in a Level 3 classification. The appraisals are sometimes further discounted based on management’s historical knowledge, changes in market conditions from the time of valuation, and/or management’s expertise and knowledge of the client and client’s business. Such discounts are typically significant and result in a Level 3 classification of the inputs for determining fair value. In cases where the carrying amount exceeds the fair value, less costs to sell, an impairment loss is recognized.
- 109 -
FINANCIAL INSTITUTIONS, INC. AND SUBSIDIARIES
NOTES TO CONSOLIDATED FINANCIAL STATEMENTS
December 31, 2012, 2011 and 2010
(18.) FAIR VALUE MEASUREMENTS (Continued)
Assets Measured at Fair Value
The following table presents for each of the fair-value hierarchy levels the Company’s assets that are measured at fair value on a recurring and non-recurring basis as of December 31 2010 (in thousands).
| Level 1 | Level 2 | Level 3 | Total | |||||||||||||
| Inputs | Inputs | Inputs | Fair Value | |||||||||||||
Measured on a recurring basis: | ||||||||||||||||
| Securities available for sale: | ||||||||||||||||
| U.S. Government agencies and government sponsored enterprises | $ | — | $ | 140,784 | $ | — | $ | 140,784 | ||||||||
| State and political subdivisions | — | 105,666 | — | 105,666 | ||||||||||||
| Mortgage-backed securities | — | 419,281 | — | 419,281 | ||||||||||||
| Asset-backed securities: | ||||||||||||||||
| Trust preferred securities | — | — | 572 | 572 | ||||||||||||
| Other | — | 65 | — | 65 | ||||||||||||
| $ | — | $ | 665,796 | $ | 572 | $ | 666,368 | |||||||||
Measured on a nonrecurring basis: | ||||||||||||||||
| Loans: | ||||||||||||||||
| Loans held for sale | $ | — | $ | 3,138 | $ | — | $ | 3,138 | ||||||||
| Collateral dependent impaired loans | — | — | 2,457 | 2,457 | ||||||||||||
| Other assets: | ||||||||||||||||
| Mortgage servicing rights | — | — | 1,467 | 1,467 | ||||||||||||
| Other real estate owned | — | — | 741 | 741 | ||||||||||||
| $ | — | $ | 3,138 | $ | 4,665 | $ | 7,803 | |||||||||
| Quoted Prices in Active Markets for Identical Assets or Liabilities (Level 1) | Significant Other Observable Inputs (Level 2) | Significant Unobservable Inputs (Level 3) | Total | |||||||||||||
2012 | ||||||||||||||||
Measured on a recurring basis: | ||||||||||||||||
Securities available for sale: | ||||||||||||||||
U.S. Government agencies and government sponsored enterprises | $ | — | $ | 131,695 | $ | — | $ | 131,695 | ||||||||
State and political subdivisions | — | 195,210 | — | 195,210 | ||||||||||||
Mortgage-backed securities | — | 495,868 | — | 495,868 | ||||||||||||
Asset-backed securities: | ||||||||||||||||
Trust preferred securities | — | 754 | — | 754 | ||||||||||||
Other | — | 269 | — | 269 | ||||||||||||
|
|
|
|
|
|
|
| |||||||||
| $ | — | $ | 823,796 | $ | — | $ | 823,796 | |||||||||
|
|
|
|
|
|
|
| |||||||||
Measured on a nonrecurring basis: | ||||||||||||||||
Loans: | ||||||||||||||||
Loans held for sale | $ | — | $ | 1,518 | $ | — | $ | 1,518 | ||||||||
Collateral dependent impaired loans | — | — | 2,364 | 2,364 | ||||||||||||
Other assets: | ||||||||||||||||
Loan servicing rights | — | — | 1,719 | 1,719 | ||||||||||||
Other real estate owned | — | — | 184 | 184 | ||||||||||||
|
|
|
|
|
|
|
| |||||||||
| $ | — | $ | 1,518 | $ | 4,267 | $ | 5,785 | |||||||||
|
|
|
|
|
|
|
| |||||||||
2011 | ||||||||||||||||
Measured on a recurring basis: | ||||||||||||||||
Securities available for sale: | ||||||||||||||||
U.S. Government agencies and government sponsored enterprises | $ | — | $ | 97,712 | $ | — | $ | 97,712 | ||||||||
State and political subdivisions | — | 124,424 | — | 124,424 | ||||||||||||
Mortgage-backed securities | — | 403,685 | — | 403,685 | ||||||||||||
Asset-backed securities: | ||||||||||||||||
Trust preferred securities | — | — | 1,636 | 1,636 | ||||||||||||
Other | — | 61 | — | 61 | ||||||||||||
|
|
|
|
|
|
|
| |||||||||
| $ | — | $ | 625,882 | $ | 1,636 | $ | 627,518 | |||||||||
|
|
|
|
|
|
|
| |||||||||
Measured on a nonrecurring basis: | ||||||||||||||||
Loans: | ||||||||||||||||
Loans held for sale | $ | — | $ | 2,410 | $ | — | $ | 2,410 | ||||||||
Collateral dependent impaired loans | — | — | 2,160 | 2,160 | ||||||||||||
Other assets: | ||||||||||||||||
Loan servicing rights | — | — | 1,973 | 1,973 | ||||||||||||
Other real estate owned | — | — | 475 | 475 | ||||||||||||
|
|
|
|
|
|
|
| |||||||||
| $ | — | $ | 2,410 | $ | 4,608 | $ | 7,018 | |||||||||
|
|
|
|
|
|
|
| |||||||||
- 101 -
There were no transfers between level 1 and 2 during the years ended December 31,
| Level 1 | Level 2 | Level 3 | Total | |||||||||||||
| Inputs | Inputs | Inputs | Fair Value | |||||||||||||
Measured on a recurring basis: | ||||||||||||||||
| Securities available for sale: | ||||||||||||||||
| U.S. Government agencies and government sponsored enterprises | $ | — | $ | 134,105 | $ | — | $ | 134,105 | ||||||||
| State and political subdivisions | — | 83,659 | — | 83,659 | ||||||||||||
| Mortgage-backed securities | — | 361,515 | — | 361,515 | ||||||||||||
| Asset-backed securities: | ||||||||||||||||
| Trust preferred securities | — | — | 1,015 | 1,015 | ||||||||||||
| Other | — | 207 | — | 207 | ||||||||||||
| $ | — | $ | 579,486 | $ | 1,015 | $ | 580,501 | |||||||||
Measured on a nonrecurring basis: | ||||||||||||||||
| Loans: | ||||||||||||||||
| Loans held for sale | $ | — | $ | 421 | $ | — | $ | 421 | ||||||||
| Collateral dependent impaired loans | — | — | 1,078 | 1,078 | ||||||||||||
| Other assets: | ||||||||||||||||
| Mortgage servicing rights | — | — | 1,349 | 1,349 | ||||||||||||
| Other real estate owned | — | 746 | 746 | |||||||||||||
| $ | — | $ | 421 | $ | 3,173 | $ | 3,594 | |||||||||
- 110 -
FINANCIAL INSTITUTIONS, INC. AND SUBSIDIARIES
NOTES TO CONSOLIDATED FINANCIAL STATEMENTS
December 31, 2012, 2011 and 2010
(18.) FAIR VALUE MEASUREMENTS (Continued)
The following table presents additional quantitative information about assets measured at fair value on a recurring and nonrecurring basis for which the Company has utilized Level 3 inputs to determine fair value (dollars in thousands).
Asset | Fair Value | Valuation Technique | Unobservable Input | Unobservable Input Value or Range | ||||||
Collateral dependent impaired loans | $ | 2,364 | Appraisal of collateral (1) | Appraisal adjustments (2) | 16% – 100% discount | |||||
| Discounted cash flow | Discount rate | 4.9%(3) | ||||||||
| Risk premium rate | 10.1%(3) | |||||||||
Loan servicing rights | 1,719 | Discounted cash flow | Discount rate | 4.1%(3) | ||||||
| Constant prepayment rate | 28.9%(3) | |||||||||
Other real estate owned | 184 | Appraisal of collateral (1) | Appraisal adjustments(2) | 20% – 55% discount | ||||||
| (1) | Fair value is generally determined through independent appraisals of the underlying collateral, which generally include various Level 3 inputs which are not identifiable. |
| (2) | Appraisals may be adjusted by management for qualitative factors such as economic conditions and estimated liquidation expenses. |
| (3) | Weighted averages. |
Changes in Level 3 Fair Value Measurements
There were no assets measured at fair value on a recurring basis using significant unobservable inputs (Level 3) as of December 31, 2012. The Company transferred all of the assets classified as Level 3 assets at December 31, 2011 to Level 2 during the three months ended March 31, 2012. The transfers of the $1.5 million of pooled trust preferred securities out of Level 3 was primarily the result of using observable pricing information or a third party pricing quote that appropriately reflects the fair value of those securities, without the need for adjustment based on our own assumptions regarding the characteristics of a specific security or the current liquidity in the market.
The reconciliation for all assets measured at fair value on a recurring basis using significant unobservable inputs (Level 3) for the years ended December 31 is as follows (in thousands):
| 2010 | 2009 | |||||||
| Securities available for sale (Level 3), beginning of year | $ | 1,015 | $ | 3,772 | ||||
| Transfers into Level 3 | — | — | ||||||
| Capitalized interest | 399 | 296 | ||||||
| Principal paydowns and amortization of premiums | — | (9 | ) | |||||
| Coupon payments applied to principal | (136 | ) | (273 | ) | ||||
| Total losses (realized/unrealized): | ||||||||
| Included in earnings | (526 | ) | (2,263 | ) | ||||
| Included in other comprehensive income | (180 | ) | (508 | ) | ||||
| Securities available for sale (Level 3), end of year | $ | 572 | $ | 1,015 | ||||
| 2012 | 2011 | |||||||
Securities available for sale, beginning of period | $ | 1,636 | $ | 572 | ||||
Sales | (360 | ) | (2,478 | ) | ||||
Principal paydowns and other | — | (53 | ) | |||||
Total gains (losses) realized/unrealized: | ||||||||
Included in earnings | 331 | 2,263 | ||||||
Included in other comprehensive income | (102 | ) | 1,332 | |||||
Transfers from Level 3 to Level 2 | (1,505 | ) | — | |||||
|
|
|
| |||||
Securities available for sale, end of period | $ | — | $ | 1,636 | ||||
|
|
|
| |||||
- 111 -
FINANCIAL INSTITUTIONS, INC. AND SUBSIDIARIES
NOTES TO CONSOLIDATED FINANCIAL STATEMENTS
December 31, 2012, 2011 and 2010
(18.) FAIR VALUE MEASUREMENTS (Continued)
Disclosures about Fair Value of Financial Instruments
The Fair Value of Financial Instruments Subsection of the ASC requires disclosure of the fair value of financial assets and financial liabilities, including those financial assets and financial liabilities that are not measured and reported at fair value on a recurring basis or non-recurring basis.
Fair value estimates are made at a specific point in time, based on available market information and judgments about the financial instrument, including estimates of timing, amount of expected future cash flows and the credit standing of the issuer. Such estimates do not consider the tax impact of the realization of unrealized gains or losses. In some cases, the fair value estimates cannot be substantiated by comparison to independent markets. In addition, the disclosed fair value may not be realized in the immediate settlement of the financial instrument.
Care should be exercised in deriving conclusions about our business, its value or financial position based on the fair value information of financial instruments presented below.
- 102 -
LoansSecurities held for sale.to maturity:The fair value of the Company’s investment securities held to maturity is based on estimates, quoted market prices and investor commitments.
Loans:The fair value isof the Company’s loans was estimated by discounting the expected future cash flows using the current interest rates at awhich similar loans would be made for the same remaining maturities. Loans were first segregated by type such as commercial, residential mortgage, and consumer, and were then further segmented into fixed and variable rate commensurate with the risk associated with the estimatedand loan quality categories. Expected future cash flows or estimates ofwere projected based on contractual cash flows, adjusted for estimated prepayments.
Time deposits:The fair value discounts based on observable market information.
The following presents the carrying amount, estimated using a discounted cash flow approach that applies prevailing market interest rates for similar maturity instruments.
| December 31, 2010 | December 31, 2009 | |||||||||||||||
| Estimated | Estimated | |||||||||||||||
| Carrying | Fair | Carrying | Fair | |||||||||||||
| Amount | Value | Amount | Value | |||||||||||||
Financial assets: | ||||||||||||||||
| Cash and cash equivalents | $ | 39,058 | $ | 39,058 | $ | 42,959 | $ | 42,959 | ||||||||
| Securities available for sale | 666,368 | 666,368 | 580,501 | 580,501 | ||||||||||||
| Securities held to maturity | 28,162 | 28,849 | 39,573 | 40,629 | ||||||||||||
| Loans held for sale | 3,138 | 3,138 | 421 | 421 | ||||||||||||
| Loans | 1,325,524 | 1,388,787 | 1,243,265 | 1,290,136 | ||||||||||||
| Accrued interest receivable | 7,613 | 7,613 | 7,386 | 7,386 | ||||||||||||
| FHLB and FRB stock | 6,353 | 6,353 | 7,185 | 7,185 | ||||||||||||
Financial liabilities: | ||||||||||||||||
| Demand, savings and money market deposits | 1,143,136 | 1,143,136 | 1,056,604 | 1,056,604 | ||||||||||||
| Certificate of deposit | 739,754 | 740,440 | 686,351 | 692,429 | ||||||||||||
| Short-term borrowings | 77,110 | 77,110 | 59,543 | 59,543 | ||||||||||||
| Long-term borrowings (excluding junior subordinated debentures) | 10,065 | 10,244 | 30,145 | 30,886 | ||||||||||||
| Junior subordinated debentures | 16,702 | 10,564 | 16,702 | 10,741 | ||||||||||||
| Accrued interest payable | 7,620 | 7,620 | 7,576 | 7,576 | ||||||||||||
| Level in | 2012 | 2011 | ||||||||||||||||
| Fair Value | Estimated | Estimated | ||||||||||||||||
| Measurement | Carrying | Fair | Carrying | Fair | ||||||||||||||
| Hierarchy | Amount | Value | Amount | Value | ||||||||||||||
Financial assets: | ||||||||||||||||||
Cash and cash equivalents | Level 1 | $ | 60,436 | $ | 60,436 | $ | 57,583 | $ | 57,583 | |||||||||
Securities available for sale | Level 2 | 823,796 | 823,796 | 625,882 | 625,882 | |||||||||||||
Securities available for sale(1) | Level 3 | — | — | 1,636 | 1,636 | |||||||||||||
Securities held to maturity | Level 2 | 17,905 | 18,478 | 23,297 | 23,964 | |||||||||||||
Loans held for sale | Level 2 | 1,518 | 1,547 | 2,410 | 2,442 | |||||||||||||
Loans | Level 2 | 1,678,648 | 1,701,419 | 1,459,356 | 1,490,999 | |||||||||||||
Loans(2) | Level 3 | 2,364 | 2,364 | 2,160 | 2,160 | |||||||||||||
Accrued interest receivable | Level 1 | 7,843 | 7,843 | 7,655 | 7,655 | |||||||||||||
FHLB and FRB stock | Level 2 | 12,321 | 12,321 | 10,674 | 10,674 | |||||||||||||
Financial liabilities: | ||||||||||||||||||
Non-maturity deposits | Level 1 | 1,606,856 | 1,606,856 | 1,230,923 | 1,230,923 | |||||||||||||
Time deposits | Level 2 | 654,938 | 658,342 | 700,676 | 702,720 | |||||||||||||
Short-term borrowings | Level 1 | 179,806 | 179,806 | 150,698 | 150,698 | |||||||||||||
Accrued interest payable | Level 1 | 3,819 | 3,819 | 5,207 | 5,207 | |||||||||||||
| (1) | Comprised of trust preferred asset-backed securities. |
| (2) | Comprised of collateral dependent impaired loans. |
- 103112 -
NOTES TO CONSOLIDATED FINANCIAL STATEMENTS
December 31, 2010, 20092012, 2011 and 2008
(19.) PARENT COMPANY FINANCIAL INFORMATION
Condensed financial statements pertaining only to the Parent are presented below (in thousands).
| December 31, | ||||||||
| 2010 | 2009 | |||||||
| Assets: | ||||||||
| Cash and due from subsidiary | $ | 23,894 | $ | 7,727 | ||||
| Investment in and receivables due from subsidiary | 202,754 | 203,986 | ||||||
| Other assets | 4,623 | 5,698 | ||||||
| Total assets | $ | 231,271 | $ | 217,411 | ||||
| Liabilities and shareholders’ equity: | ||||||||
| Junior subordinated debentures | $ | 16,702 | $ | 16,702 | ||||
| Other liabilities | 2,425 | 2,415 | ||||||
| Shareholders’ equity | 212,144 | 198,294 | ||||||
| Total liabilities and shareholders’ equity | $ | 231,271 | $ | 217,411 | ||||
| Years ended December 31, | ||||||||||||
| 2010 | 2009 | 2008 | ||||||||||
| Dividends from subsidiary and associated companies | $ | 23,151 | $ | 5,051 | $ | 11,251 | ||||||
| Management and service fees from subsidiary | 1,163 | 603 | 418 | |||||||||
| Other (loss) income | (134 | ) | 182 | 74 | ||||||||
| Total income | 24,180 | 5,836 | 11,743 | |||||||||
| Operating expenses | 4,005 | 4,436 | 4,363 | |||||||||
| Income before income tax benefit and equity in (excess distributions) undistributed earnings of subsidiary | 20,175 | 1,400 | 7,380 | |||||||||
| Income tax benefit | 1,323 | 1,286 | 1,499 | |||||||||
| Income before equity in (excess distributions) undistributed earnings of subsidiary | 21,498 | 2,686 | 8,879 | |||||||||
| Equity in (excess distributions) undistributed earnings of subsidiary | (211 | ) | 11,755 | (35,037 | ) | |||||||
| Net income (loss) | $ | 21,287 | $ | 14,441 | $ | (26,158 | ) | |||||
| Condensed Statements of Condition | December 31, | |||||||
| 2012 | 2011 | |||||||
Assets: | ||||||||
Cash and due from subsidiary | $ | 6,602 | $ | 11,621 | ||||
Investment in and receivables due from subsidiary | 246,535 | 223,577 | ||||||
Other assets | 3,563 | 4,337 | ||||||
|
|
|
| |||||
Total assets | $ | 256,700 | $ | 239,535 | ||||
|
|
|
| |||||
Liabilities and shareholders’ equity: | ||||||||
Other liabilities | $ | 2,803 | $ | 2,341 | ||||
Shareholders’ equity | 253,897 | 237,194 | ||||||
|
|
|
| |||||
Total liabilities and shareholders’ equity | $ | 256,700 | $ | 239,535 | ||||
|
|
|
| |||||
| Condensed Statements of Income | Years ended December 31, | |||||||||||
| 2012 | 2011 | 2010 | ||||||||||
Dividends from subsidiary and associated companies | $ | 4,000 | $ | 9,233 | $ | 23,151 | ||||||
Management and service fees from subsidiary | 517 | 1,161 | 1,163 | |||||||||
Other income (loss) | 24 | 78 | (134 | ) | ||||||||
|
|
|
|
|
| |||||||
Total income | 4,541 | 10,472 | 24,180 | |||||||||
|
|
|
|
|
| |||||||
Operating expenses | 2,732 | 3,787 | 4,005 | |||||||||
Loss on extinguishment of debt | — | 1,083 | — | |||||||||
|
|
|
|
|
| |||||||
Total expenses | 2,732 | 4,870 | 4,005 | |||||||||
|
|
|
|
|
| |||||||
Income before income tax benefit and equity in undistributed earnings of subsidiary | 1,809 | 5,602 | 20,175 | |||||||||
Income tax benefit | 991 | 1,539 | 1,323 | |||||||||
|
|
|
|
|
| |||||||
Income before equity in undistributed earnings of subsidiary | 2,800 | 7,141 | 21,498 | |||||||||
Equity in undistributed earnings (excess distributions) of subsidiary | 20,649 | 15,658 | (211 | ) | ||||||||
|
|
|
|
|
| |||||||
Net income | $ | 23,449 | $ | 22,799 | $ | 21,287 | ||||||
|
|
|
|
|
| |||||||
- 104113 -
NOTES TO CONSOLIDATED FINANCIAL STATEMENTS
December 31, 2010, 20092012, 2011 and 2008
(19.) PARENT COMPANY FINANCIAL INFORMATION (Continued)
| Years ended December 31, | ||||||||||||
| 2010 | 2009 | 2008 | ||||||||||
| Cash flows from operating activities: | ||||||||||||
| Net income (loss) | $ | 21,287 | $ | 14,441 | $ | (26,158 | ) | |||||
| Adjustments to reconcile net income (loss) to net cash provided by operating activities: | ||||||||||||
| Equity in excess distributions (undistributed earnings) of subsidiary | 211 | (11,755 | ) | 35,037 | ||||||||
| Depreciation and amortization | 193 | 318 | 427 | |||||||||
| Share-based compensation | 1,031 | 854 | 633 | |||||||||
| Decrease (increase) in other assets | 980 | 797 | (763 | ) | ||||||||
| Increase (decrease) in other liabilities | 8 | (230 | ) | (258 | ) | |||||||
| Net cash provided by operating activities | 23,710 | 4,425 | 8,918 | |||||||||
| Cash flows from investing activities: | ||||||||||||
| Purchase of investment assets, net of disposals | — | (1,323 | ) | (99 | ) | |||||||
| Capital investment in subsidiary | — | (15,000 | ) | (20,000 | ) | |||||||
| Net cash used in investing activities | — | (16,323 | ) | (20,099 | ) | |||||||
| Cash flows from financing activities: | ||||||||||||
| Purchase of preferred and common shares | (69 | ) | — | (4,821 | ) | |||||||
| Proceeds from issuance of preferred and common shares, net of issuance costs | — | (68 | ) | 35,602 | ||||||||
| Proceeds from issuance of common stock warrant | — | — | 2,025 | |||||||||
| Proceeds from stock options exercised | 216 | 15 | 32 | |||||||||
| Dividends paid | (7,690 | ) | (7,485 | ) | (7,722 | ) | ||||||
| Net cash (used in) provided by financing activities | (7,543 | ) | (7,538 | ) | 25,116 | |||||||
| Net increase (decrease) in cash and cash equivalents | 16,167 | (19,436 | ) | 13,935 | ||||||||
| Cash and cash equivalents as of beginning of year | 7,727 | 27,163 | 13,228 | |||||||||
| Cash and cash equivalents as of end of the year | $ | 23,894 | $ | 7,727 | $ | 27,163 | ||||||
| Condensed Statements of Cash Flows | Years ended December 31, | |||||||||||
| 2012 | 2011 | 2010 | ||||||||||
Cash flows from operating activities: | ||||||||||||
Net income | $ | 23,449 | $ | 22,799 | $ | 21,287 | ||||||
Adjustments to reconcile net income to net cash provided by operating activities: | ||||||||||||
Equity in (undistributed earnings) excess distributions of subsidiary | (20,649 | ) | (15,658 | ) | 211 | |||||||
Depreciation and amortization | 65 | 116 | 193 | |||||||||
Share-based compensation | 526 | 1,105 | 1,031 | |||||||||
Decrease in other assets | 805 | 771 | 980 | |||||||||
Increase (decrease) in other liabilities | 44 | (534 | ) | 8 | ||||||||
|
|
|
|
|
| |||||||
Net cash provided by operating activities | 4,240 | 8,599 | 23,710 | |||||||||
Cash flows from financing activities: | ||||||||||||
Redemption of junior subordinated debentures | — | (16,702 | ) | — | ||||||||
Proceeds from issuance of preferred and common shares, net of issuance costs | — | 43,127 | — | |||||||||
Purchase of preferred and common shares | (559 | ) | (37,764 | ) | (69 | ) | ||||||
Repurchase of warrant issued to U.S. Treasury | — | (2,080 | ) | — | ||||||||
Proceeds from stock options exercised | 69 | 91 | 216 | |||||||||
Dividends paid | (8,866 | ) | (7,564 | ) | (7,690 | ) | ||||||
Other | 97 | 20 | — | |||||||||
|
|
|
|
|
| |||||||
Net cash used in financing activities | (9,259 | ) | (20,872 | ) | (7,543 | ) | ||||||
|
|
|
|
|
| |||||||
Net (decrease) increase in cash and cash equivalents | (5,019 | ) | (12,273 | ) | 16,167 | |||||||
Cash and cash equivalents as of beginning of year | 11,621 | 23,894 | 7,727 | |||||||||
|
|
|
|
|
| |||||||
Cash and cash equivalents as of end of the year | $ | 6,602 | $ | 11,621 | $ | 23,894 | ||||||
|
|
|
|
|
| |||||||
- 105114 -
None.
Effectiveness of Controls and Procedures
As of the end of the period covered by this report, the Company carried out an evaluation, under the supervision and with the participation of the Company’s management, including the Company’s Chief Executive Officer (Principal Executive Officer) and Chief Financial Officer (Principal Accounting Officer), of the effectiveness of the design and operation of the Company’s disclosure controls and procedures pursuant to Rule 13a-15(b), as adopted by the Securities and Exchange Commission (“SEC”) under the Securities Exchange Act of 1934 (“Exchange Act”). Based upon that evaluation, the Chief Executive Officer and Chief Financial Officer concluded that the Company’s disclosure controls and procedures were effective as of the end of the period covered by this Annual Report on Form 10-K.
Disclosure controls and procedures are the controls and other procedures that are designed to ensure that information required to be disclosed in the reports that the Company files or submits under the Exchange Act is recorded, processed, summarized and reported within the time periods specified in the SEC’s rules and forms. Disclosure controls and procedures include, without limitation, controls and procedures designed to ensure that information required to be disclosed in the reports that the Company files or submits under the Exchange Act is accumulated and communicated to management, including the Chief Executive Officer and Chief Financial Officer, as appropriate, to allow timely decisions regarding required disclosure.
All internal control systems, no matter how well designed, have inherent limitations. Therefore, even those systems determined effective can provide only reasonable assurance with respect to financial statement preparation and presentation.
Management Report on Internal Control over Financial Reporting and Attestation Report of Independent Registered Public Accounting Firm
Management of Financial Institutions, Inc. (the Company)the Company is responsible for establishing and maintaining adequate internal control over financial reporting. Management assessed the Company’s internal control over financial reporting based on criteria established in the Internal Control—Integrated Framework issued by the Committee of Sponsoring Organizations of the Treadway Commission (COSO). Based on this assessment, management has concluded that, as of December 31, 2010,2012, the Company maintained effective internal control over financial reporting. Management’s Report on Internal Control over Financial Reporting is included under Item 8 “Financial Statements and Supplementary Data” in Part II of this Form 10-K.
KPMG LLP, aan independent registered public accounting firm, has audited the consolidated financial statements included in this Annual Report on Form 10-K, and has issued an attestation report on the effectiveness of the Company’s internal control over financial reporting. The Report of Independent Registered Public Accounting Firm that attests the effectiveness of internal control over financial reporting is included under Item 8 “Financial Statements and Supplementary Data” in Part II of this Form 10-K.
Changes in Internal Control over Financial Reporting
There were no changes in the Company’s internal control over financial reporting that occurred during the quarter ended December 31, 20102012 that have materially affected, or are reasonably likely to materially affect, the Company’s internal control over financial reporting.
Not applicable.
- 106115 -
In response to this Item, the many years of service that our Directors have at the Company and Five Star Bank (the “Bank”) is one of the Directors’ most important qualifications for service on our Board. This service has given them extensive knowledge of the banking business and our Company. Each outside Director also brings special skills, experience and expertise to the Board as a result of their other business activities and associations. The business experience of each Director of the Company for at least the past five years and the experience, qualifications, attributes, skills and areas of expertise of each Director that supports his or her service as a Director areinformation set forth below. Unless otherwise specified, each Director ofin the Company has also been a Director of the Bank since 2005. Age shownCompany’s Proxy Statement for each Director is as of May 4, 2011, the date of the 2011its 2013 Annual Meeting of Shareholders.
| Name | Age | Position(s) Held | Director Since | Term Expires | ||||||||||
| Karl V. Anderson, Jr. | 64 | Director | 2006 | 2012 | ||||||||||
| John E. Benjamin | 69 | Chairman of the Board | 2002 | 2011 | ||||||||||
| Barton P. Dambra | 69 | Director | 1993 | 2011 | ||||||||||
| Samuel M. Gullo | 62 | Director | 2000 | 2013 | ||||||||||
| Susan R. Holliday | 55 | Director | 2002 | 2011 | ||||||||||
| Peter G. Humphrey | 56 | President and Chief Executive Officer | 1983 | 2011 | ||||||||||
| Erland E. Kailbourne | 69 | Director | 2005 | 2012 | ||||||||||
| Robert N. Latella | 68 | Director | 2005 | 2012 | ||||||||||
| James L. Robinson | 68 | Director | 2007 | 2013 | ||||||||||
| James H. Wyckoff | 59 | Director | 1985 | 2013 | ||||||||||
incorporated herein by reference.
- 107 -
- 108 -
The Company has adopted a Code of Business Conduct and Ethics that applies to its principal executive officer, principal financial officer, principal accounting officer or controller, or persons performing similar functions. The Code of Business Conduct and Ethics is posted on the Company’s internet website at www.fiiwarsaw.com.www.fiiwarsaw.com under the Corporate Overview/Governance Documents tabs of the Investor Relations drop down menu. In addition, the Company will provide a copy of the Code of Business Conduct and Ethics to anyone, without charge, upon request addressed to Director of Human Resources at Financial Institutions, Inc., 220 Liberty Street, Warsaw, NY 14569. The Company intends to disclose any amendment to, or waiver from, a provision of its Code of Business Conduct and Ethics that applies to the Company’s principal executive officer, principal financial officer, principal accounting officer or controller, or persons performing similar functions, and that relates to any element of the Code of Business Conduct and Ethics, by posting such information on the Company’s website.
- 109 -
- 110 -
- 111 -
- 112 -
| Financial | ||||||||
| Institutions, Inc. | ||||||||
| Measure | Peer Median | Rank(1) | ||||||
| Asset Size | $2.0 Billion | 51 | % | |||||
| Return on Equity | 9.13 | % | 63 | % | ||||
| Return on Assets | 0.83 | % | 59 | % | ||||
| Net Interest Margin | 3.7 | % | 87 | % | ||||
| Efficiency Ratio | 61.2 | % | 56 | % | ||||
| Non-Performing Assets/Total Assets | 1.41 | % | 88 | % | ||||
| Earnings Per Share Growth | 11.7 | % | 95 | % | ||||
- 113 -
| Median Peer | ||||||||
| Group Base | Actual 2010 | |||||||
| Salary | Base Salary | |||||||
| Position | ($000) | ($000) | ||||||
| President and Chief Executive Officer | 365.5 | 406.1 | ||||||
| Chief Financial Officer | 197.0 | 180.0 | ||||||
| Senior Retail Lending Administrator | 194.2 | 200.0 | ||||||
| Retail Banking Executive/Regional President | 245.2 | 226.6 | ||||||
| Commercial Banking Executive/Regional President | 201.2 | 205.6 | ||||||
| Chief Risk Officer | 172.4 | 198.2 | ||||||
- 114 -
| 2010 | 2011 | |||||||||||||||
| Salary | Salary | |||||||||||||||
| Increase | Base Salary | Increase | Base Salary | |||||||||||||
| Executive Name | (%) | ($) | (%) | ($) | ||||||||||||
| Peter G. Humphrey | 2.00 | 406,132 | 3.50 | 420,347 | ||||||||||||
| Karl F. Krebs | 5.90 | 180,000 | 15.39 | 207,710 | ||||||||||||
| Richard J. Harrison | 2.10 | 200,000 | 11.34 | 222,670 | ||||||||||||
| John J. Witkowski | 1.70 | 226,644 | 6.59 | 241,580 | ||||||||||||
| Martin K. Birmingham | 2.30 | 205,641 | 8.16 | 222,424 | ||||||||||||
| George D. Hagi | 2.80 | 198,221 | 9.19 | 216,441 | ||||||||||||
- 115 -
| Performance | ||||||||||||||||||||
| Incentive as a % of Salary | Goal Weighting | |||||||||||||||||||
| Position | Threshold | Target | Max | Financial | Individual | |||||||||||||||
| President and Chief Executive Officer | 25 | % | 50 | % | 80 | % | 100 | % | — | |||||||||||
| Other Named Executive Officers | 20 | % | 40 | % | 60 | % | 75 | % | 25 | % | ||||||||||
| Weighting | |||||||||||||||||||||
| Financial | within | ||||||||||||||||||||
| Performance Goals | Category | Threshold | Target | Max | Triggers | ||||||||||||||||
| Earnings Per Share | 60 | % | $ | 0.99 | $ | 1.10 | $ | 1.375 | Each corporate goal has a threshold | ||||||||||||
| Non-Performing Assets/Total Assets | 20 | % | 0.75 | % | 0.50 | % | 0.45 | % | level of performance that must be achieved | ||||||||||||
Efficiency Ratio(1) | 20 | % | 64.5 | % | 63.0 | % | 61.5 | % | before awards are paid for such measure. | ||||||||||||
- 116 -
| Annual Cash Incentive Targets | ||||||||||||
| Financial | Individual | Total | ||||||||||
| Executive Name | ($) | ($) | ($) | |||||||||
| Peter G. Humphrey | 203,066 | n/a | 203,066 | |||||||||
| Karl F. Krebs | 54,000 | 18,000 | 72,000 | |||||||||
| Richard J. Harrison | 60,000 | 20,000 | 80,000 | |||||||||
| John J. Witkowski | 67,994 | 22,664 | 90,658 | |||||||||
| Martin K. Birmingham | 61,692 | 20,564 | 82,256 | |||||||||
| George D. Hagi | 59,466 | 19,822 | 79,288 | |||||||||
- 117 -
| Total | Equivalent | |||||||||||||||||||||||
| Annual | Reduction | Adjusted | Restricted | |||||||||||||||||||||
| Incentive | to Annual | Annual | Stock | |||||||||||||||||||||
| Earned (in | Incentive | Incentive | Awards | |||||||||||||||||||||
| Financial | Individual | accordance | Award(1) | Award | Granted(2) | |||||||||||||||||||
| Executive Name | ($) | ($) | with Plan) ($) | ($) | ($) | (#) | ||||||||||||||||||
| Peter G. Humphrey | 324,096 | n/a | 324,096 | 241,517 | 82,579 | 4,283 | ||||||||||||||||||
| Karl F. Krebs | 81,000 | 26,190 | 107,190 | 89,471 | 17,719 | 919 | ||||||||||||||||||
| Richard J. Harrison | 90,000 | 30,000 | 120,000 | 89,851 | 30,149 | 1,563 | ||||||||||||||||||
| John J. Witkowski | 101,990 | 29,917 | 131,907 | 95,030 | 36,877 | 1,912 | ||||||||||||||||||
| Martin K. Birmingham | 92,538 | 27,145 | 119,683 | 87,604 | 32,079 | 1,663 | ||||||||||||||||||
| George D. Hagi | 89,199 | 28,246 | 117,445 | 90,116 | 27,329 | 1,417 | ||||||||||||||||||
- 118 -
| Weighting | Result as | Restricted | ||||||||||||||||||||||||||
| within | 2010 | a % of | Stock | |||||||||||||||||||||||||
| Performance Goals | Category | Threshold | Target | Max | Results | Target | Awarded | |||||||||||||||||||||
| Earnings Per Share | 60 | % | $ | 0.99 | $ | 1.10 | $ | 1.375 | $ | 1.61 | 146.4 | % | 100 | % | ||||||||||||||
| Non-Performing Assets/Total Assets | 20 | % | 0.75 | % | 0.50 | % | 0.45 | % | 0.40 | % | 125.0 | % | 100 | % | ||||||||||||||
Efficiency Ratio(1) | 20 | % | 64.5 | % | 63.0 | % | 61.5 | % | 60.36 | % | 104.4 | % | 100 | % | ||||||||||||||
| Maximum | Actual | |||||||||||
| Target Award | Award | Award | ||||||||||
| Executive Name | (#) | (#) | (#) | |||||||||
| Peter G. Humphrey | 7,729 | 9,661 | 9,661 | |||||||||
| Karl F. Krebs | 2,790 | 3,488 | 3,488 | |||||||||
| Richard J. Harrison | 3,100 | 3,875 | 3,875 | |||||||||
| John J. Witkowski | 3,514 | 4,392 | 4,392 | |||||||||
| Martin K. Birmingham | 3,188 | 3,985 | 3,985 | |||||||||
| George D. Hagi | 3,073 | 3,841 | 3,841 | |||||||||
- 119 -
| For | Against | Abstain | ||||||
| 8,878,917 | 629,823 | 116,275 | ||||||
- 120 -
- 121 -
- 122 -
| Change in | ||||||||||||||||||||||||||||
| Stock | Pension | All Other | ||||||||||||||||||||||||||
| Salary | Bonus | Awards | Value | Compensation | Total | |||||||||||||||||||||||
| Name & Principal Position | Year | ($)(2) | ($) | ($)(3) | ($)(4) | ($)(5) | ($) | |||||||||||||||||||||
Peter G. Humphrey | 2010 | 406,132 | — | 355,959 | 179,930 | 73,037 | 1,015,058 | |||||||||||||||||||||
| President & Chief Executive Officer | 2009 | 413,483 | — | 79,260 | 138,264 | 72,912 | 703,919 | |||||||||||||||||||||
| of the Company and the Bank | 2008 | 398,169 | — | 115,320 | 159,816 | 74,183 | 747,488 | |||||||||||||||||||||
Karl F. Krebs(1) | 2010 | 180,000 | — | 77,245 | 28,212 | 26,671 | 312,128 | |||||||||||||||||||||
| EVP & Chief Financial Officer | 2009 | 40,539 | — | 19,996 | 9,316 | 13,084 | 82,935 | |||||||||||||||||||||
| of the Company and the Bank | ||||||||||||||||||||||||||||
Richard J. Harrison | 2010 | 200,000 | — | 138,384 | 60,414 | 28,045 | 426,843 | |||||||||||||||||||||
| EVP & Senior Retail Lending Administrator of the Bank | ||||||||||||||||||||||||||||
John J. Witkowski | 2010 | 226,644 | — | 152,421 | 24,100 | 23,592 | 426,757 | |||||||||||||||||||||
| EVP & Retail Banking Executive/ | 2009 | 231,089 | — | 66,050 | 15,734 | 25,176 | 338,049 | |||||||||||||||||||||
| Regional President of the Bank | 2008 | 218,484 | 27,857 | 96,100 | 16,899 | 24,010 | 383,350 | |||||||||||||||||||||
George D. Hagi | 2010 | 198,221 | — | 155,073 | 35,247 | 20,169 | 408,710 | |||||||||||||||||||||
| EVP & Chief Risk Officer | 2009 | 200,237 | — | 72,655 | 24,052 | 20,258 | 317,202 | |||||||||||||||||||||
| of the Company and the Bank | 2008 | 192,821 | — | 105,710 | 27,198 | 21,988 | 347,717 | |||||||||||||||||||||
Martin K. Birmingham | 2010 | 205,641 | — | 140,943 | 20,654 | 27,169 | 394,407 | |||||||||||||||||||||
| EVP & Commercial Banking Executive/ | 2009 | 208,484 | — | 66,050 | 12,387 | 26,053 | 312,974 | |||||||||||||||||||||
| Regional President of the Bank | 2008 | 195,732 | 24,369 | 96,100 | 14,085 | 26,365 | 356,651 | |||||||||||||||||||||
| Use of | 401(k) | Split Dollar | ||||||||||||||||||||||
| Company | Club | Matching | Insurance | |||||||||||||||||||||
| Vehicle | Memberships | Contribution | Premium | Other | Total | |||||||||||||||||||
| Executive Name | ($) | ($) | ($) | ($) | ($)(1) | ($) | ||||||||||||||||||
| Peter G. Humphrey | 1,900 | 3,150 | 11,025 | 50,830 | 6,132 | 73,037 | ||||||||||||||||||
| Karl F. Krebs | 7,701 | 9,434 | 8,110 | — | 1,426 | 26,671 | ||||||||||||||||||
| Richard J. Harrison | 4,354 | 8,177 | 9,010 | — | 6,504 | 28,045 | ||||||||||||||||||
| John J. Witkowski | 4,077 | 6,168 | 10,203 | — | 3,144 | 23,592 | ||||||||||||||||||
| George D. Hagi | 7,059 | — | 8,901 | — | 4,209 | 20,169 | ||||||||||||||||||
| Martin K. Birmingham | 1,877 | 13,039 | 9,259 | — | 2,994 | 27,169 | ||||||||||||||||||
- 123 -
| All other | ||||||||||||||||||||||||
| stock awards: | Grant date | |||||||||||||||||||||||
| Estimated future payouts under equity incentive | Number of | fair value of | ||||||||||||||||||||||
| plan awards(1)(2) | shares of | stock and | ||||||||||||||||||||||
| Grant | Threshold | stock or units | option awards | |||||||||||||||||||||
| Executive Name | Date | (#) | Target (#) | Maximum (#) | (#) | ($)(3) | ||||||||||||||||||
| Peter G. Humphrey | 01/13/10 | — | 17,807 | — | — | 199,082 | ||||||||||||||||||
| 02/23/10 | — | — | — | 2,500 | 32,250 | |||||||||||||||||||
| 02/23/10 | 3,864 | 7,729 | 9,661 | — | 124,627 | |||||||||||||||||||
| Karl F. Krebs | 02/23/10 | — | — | — | 2,500 | 32,250 | ||||||||||||||||||
| 02/23/10 | 1,395 | 2,790 | 3,488 | — | 44,995 | |||||||||||||||||||
| Richard J. Harrison | 01/13/10 | — | 5,022 | — | — | 56,146 | ||||||||||||||||||
| 02/23/10 | — | — | — | 2,500 | 32,250 | |||||||||||||||||||
| 02/23/10 | 1,550 | 3,100 | 3,875 | — | 49,988 | |||||||||||||||||||
| John J. Witkowski | 01/13/10 | — | 5,681 | — | — | 63,514 | ||||||||||||||||||
| 02/23/10 | — | — | — | 2,500 | 32,250 | |||||||||||||||||||
| 02/23/10 | 1,757 | 3,514 | 4,392 | — | 56,657 | |||||||||||||||||||
| George D. Hagi | 01/13/10 | — | 6,554 | — | — | 73,274 | ||||||||||||||||||
| 02/23/10 | — | — | — | 2,500 | 32,250 | |||||||||||||||||||
| 02/23/10 | 1,536 | 3,073 | 3,841 | — | 49,549 | |||||||||||||||||||
| Martin K. Birmingham | 01/13/10 | — | 5,124 | — | — | 57,286 | ||||||||||||||||||
| 02/23/10 | — | — | — | 2,500 | 32,250 | |||||||||||||||||||
| 02/23/10 | 1,594 | 3,188 | 3,985 | — | 51,407 | |||||||||||||||||||
- 124 -
| Option awards | Stock awards | |||||||||||||||||||||||||||||||
| Equity | ||||||||||||||||||||||||||||||||
| incentive | ||||||||||||||||||||||||||||||||
| Equity | plan | |||||||||||||||||||||||||||||||
| incentive | awards: | |||||||||||||||||||||||||||||||
| plan | market or | |||||||||||||||||||||||||||||||
| awards: | payout | |||||||||||||||||||||||||||||||
| Market | number of | value of | ||||||||||||||||||||||||||||||
| Number of | Number of | Number of | value of | unearned | unearned | |||||||||||||||||||||||||||
| securities | securities | shares or | shares or | shares, units | shares, units | |||||||||||||||||||||||||||
| underlying | underlying | units of | units of | or other | or other | |||||||||||||||||||||||||||
| unexercised | unexercised | Option | stock that | stock that | rights that | rights that | ||||||||||||||||||||||||||
| options | options | exercise | Option | have not | have not | have not | have not | |||||||||||||||||||||||||
| Exercisable | Unexercisable | price | expiration | vested | vested | vested | vested | |||||||||||||||||||||||||
| Executive Name | (#) | (#) | ($) | date | (#) | ($) | (#) | ($) | ||||||||||||||||||||||||
| Peter G. Humphrey | 14,083 | — | 23.80 | 02/04/14 | 2,500 | (2) | 47,425 | 34,044 | (3) | 645,815 | ||||||||||||||||||||||
| 16,659 | — | 21.05 | 02/23/15 | |||||||||||||||||||||||||||||
| 8,500 | — | 19.75 | 07/26/16 | |||||||||||||||||||||||||||||
| 6,375 | 2,125 | (1) | 19.41 | 07/25/17 | ||||||||||||||||||||||||||||
| Karl F. Krebs | — | — | — | — | 2,500 | (2) | 47,425 | 5,460 | (4) | 103,576 | ||||||||||||||||||||||
| Richard J. Harrison | 1,345 | — | 23.80 | 02/04/14 | 2,500 | (2) | 47,425 | 14,377 | (5) | 272,732 | ||||||||||||||||||||||
| 1,773 | — | 21.05 | 02/23/15 | |||||||||||||||||||||||||||||
| 1,650 | — | 19.75 | 07/26/16 | |||||||||||||||||||||||||||||
| John J. Witkowski | 7,450 | — | 17.80 | 09/07/15 | 2,500 | (2) | 47,425 | 15,553 | (6) | 295,040 | ||||||||||||||||||||||
| 1,650 | — | 19.75 | 07/26/16 | |||||||||||||||||||||||||||||
| 1,125 | 375 | (1) | 19.41 | 07/25/17 | ||||||||||||||||||||||||||||
| George D. Hagi | 6,047 | — | 19.59 | 01/18/16 | 2,500 | (2) | 47,425 | 16,423 | (7) | 311,544 | ||||||||||||||||||||||
| 1,650 | — | 19.75 | 07/26/16 | |||||||||||||||||||||||||||||
| 1,125 | 375 | (1) | 19.41 | 07/25/17 | ||||||||||||||||||||||||||||
| Martin K. Birmingham | 4,596 | — | 20.39 | 03/16/15 | 2,500 | (2) | 47,425 | 14,589 | (8) | 276,753 | ||||||||||||||||||||||
| 1,650 | — | 19.75 | 07/26/16 | |||||||||||||||||||||||||||||
| 1,125 | 375 | (1) | 19.41 | 07/25/17 | �� | |||||||||||||||||||||||||||
- 125 -
| Number of | ||||||||
| Shares | Value | |||||||
| Acquired on | Realized on | |||||||
| Vesting | Vesting(1) | |||||||
| Executive Name | (#) | ($) | ||||||
| Peter G. Humphrey | 4,800 | 85,938 | ||||||
| Karl F. Krebs | — | — | ||||||
| Richard J. Harrison | 2,000 | 33,975 | ||||||
| John J. Witkowski | 2,000 | 33,975 | ||||||
| George D. Hagi | 2,050 | 34,550 | ||||||
| Martin K. Birmingham | 2,000 | 33,975 | ||||||
| Number of | Present | |||||||||||||
| Years | Value of | Payments | ||||||||||||
| Credited | Accumulated | During | ||||||||||||
| Service | Benefit(1) | 2010 | ||||||||||||
| Executive Name | Plan Name | (#) | ($) | ($) | ||||||||||
| Peter G. Humphrey | New York Bankers Retirement Plan | 31.417 | 1,044,980 | — | ||||||||||
| Karl F. Krebs | New York Bankers Retirement Plan | 2.250 | 37,528 | — | ||||||||||
| Richard J. Harrison | New York Bankers Retirement Plan | 6.417 | 202,600 | — | ||||||||||
| John J. Witkowski | New York Bankers Retirement Plan | 4.333 | 66,121 | — | ||||||||||
| George D. Hagi | New York Bankers Retirement Plan | 3.917 | 97,230 | — | ||||||||||
| Martin K. Birmingham | New York Bankers Retirement Plan | 4.750 | 56,923 | — | ||||||||||
- 126 -
- 127 -
| Salary plus | Stock | Restricted | Medical & | Gross | ||||||||||||||||||||
| Continuation | Incentives | Options | Stock | Dental | Value | |||||||||||||||||||
| Executive Name | Period | ($) | ($) | ($) | ($) | ($) | ||||||||||||||||||
| Peter G. Humphrey | 36 months | 1,539,075 | — | 693,240 | 14,961 | 2,247,276 | ||||||||||||||||||
| John J. Witkowski | 12 months | 262,846 | — | 342,465 | 9,974 | 615,285 | ||||||||||||||||||
| George D. Hagi | 24 months | 473,746 | — | 358,969 | 14,961 | 847,676 | ||||||||||||||||||
| Martin K. Birmingham | 12 months | 237,129 | — | 324,178 | 9,974 | 571,281 | ||||||||||||||||||
- 128 -
| Fees Earned or | Stock | All Other | ||||||||||||||
| Paid in Cash | Awards(2)(3)(4) | Compensation(5) | Total | |||||||||||||
| Director Name | ($) | ($) | ($) | ($) | ||||||||||||
| Karl V. Anderson, Jr. | 32,166 | 20,444 | 160 | 52,770 | ||||||||||||
| John E. Benjamin | 73,724 | 47,936 | 160 | 121,820 | ||||||||||||
Thomas P. Connolly(1) | 8,300 | — | 80 | 8,380 | ||||||||||||
| Barton P. Dambra | 30,966 | 20,444 | 160 | 51,570 | ||||||||||||
| Samuel M. Gullo | 32,916 | 13,964 | 80 | 46,960 | ||||||||||||
| Susan R. Holliday | 38,416 | 20,444 | 160 | 59,020 | ||||||||||||
| Erland E. Kailbourne | 37,666 | 20,444 | 160 | 58,270 | ||||||||||||
| Robert N. Latella | 37,616 | 13,964 | 80 | 51,660 | ||||||||||||
| James L. Robinson | 40,921 | 22,939 | 160 | 64,020 | ||||||||||||
| James H. Wyckoff | 26,916 | 20,444 | 160 | 47,520 | ||||||||||||
- 129 -
| Five Star | ||||||||
| Company | Bank | |||||||
| Annual Retainer Fees | ||||||||
| Chair | $ | 40,000 | $ | 30,000 | ||||
Vice Chair(1) | 30,000 | 15,000 | ||||||
| Director | 10,000 | 5,000 | ||||||
| Committee Chair: | ||||||||
| Audit | 15,000 | |||||||
| Management Development and Compensation | 10,000 | |||||||
| Executive, Nominating and Governance | 10,000 | |||||||
| Risk Oversight Committee | 10,000 | |||||||
| Board Meeting Fees | ||||||||
| Chair | 3,000 | |||||||
| Vice Chair | 1,500 | |||||||
| Director | 1,200 | |||||||
| Committee Fees | ||||||||
| Chair | 1,550 | |||||||
| Member | 750 | |||||||
- 130 -
| ITEM 12. | SECURITY OWNERSHIP OF CERTAIN BENEFICIAL OWNERS AND MANAGEMENT AND RELATED STOCKHOLDER MATTERS |
In response to this Item, the information set forth in the 2013 Proxy Statement under the heading “Beneficial Ownership of Common Stock” is incorporated herein by reference. The information under the heading “Equity Compensation Plan Information” in Part II, Item 5 of this Form 10-K is also incorporated herein by reference.
| Number of shares | ||||||||||||
| included in previous | ||||||||||||
| column which the | ||||||||||||
| individual or group | ||||||||||||
| has/have the right to | Percent of | |||||||||||
| Number of shares | acquire within 60 days | outstanding | ||||||||||
| Name | beneficially owned | of March 7, 2011 | common stock(1) | |||||||||
| Canandaigua National Bank & Trust Co. (held in various trust / fiduciary capacities) | 993,643 | (2) | — | 9.05 | % | |||||||
| BlackRock, Inc. | 818,473 | (3) | — | 7.46 | % | |||||||
| Dimensional Fund Advisors LP | 555,951 | (4) | — | 5.06 | % | |||||||
| JPMorgan Chase and Co., Gail C. Humphrey and David G. Humphrey, as co-trustees | 549,360 | (5) | — | 5.00 | % | |||||||
Directors(6): | ||||||||||||
| Karl V. Anderson, Jr. | 11,063 | 6,133 | * | |||||||||
| John E. Benjamin | 18,263 | 10,133 | * | |||||||||
| Barton P. Dambra | 23,920 | (7) | 11,133 | * | ||||||||
| Samuel M. Gullo | 19,136 | 11,133 | * | |||||||||
| Susan R. Holliday | 19,887 | 9,333 | * | |||||||||
| Peter G. Humphrey | 405,152 | (8) | 45,617 | 3.69 | % | |||||||
| Erland E. Kailbourne | 32,457 | 5,700 | * | |||||||||
| Robert N. Latella | 12,473 | 6,481 | * | |||||||||
| James L. Robinson | 12,035 | 3,933 | * | |||||||||
| James H. Wyckoff | 424,340 | (9) | 10,533 | 3.86 | % | |||||||
Named Executive Officers(10): | ||||||||||||
| Richard J. Harrison | 35,993 | �� | 5,893 | * | ||||||||
| Karl F. Krebs | 11,579 | — | * | |||||||||
| John J. Witkowski | 36,266 | 10,225 | * | |||||||||
| George D. Hagi | 34,604 | 8,822 | * | |||||||||
| Martin K. Birmingham | 31,703 | 7,371 | * | |||||||||
| Directors and executive officers as a group (19 persons) | 1,172,762 | 169,523 | 10.68 | % | ||||||||
- 131 -
| ITEM 13. | CERTAIN RELATIONSHIPS AND RELATED TRANSACTIONS, AND DIRECTOR INDEPENDENCE |
In response to this Item, the oversight of related party transactions by our Chief Risk Officer. Pursuant to such policy, our Chief Risk Officer is notified whenever a potential related party transaction is being contemplated. Our Chief Risk Officer refers any potential transactions, with appropriate supporting detail, to the Audit Committee of our Board of Directors. The Audit Committee determines whether the transaction is a related party transaction as such term is defined under Item 404(a) of Regulation S-K. If the Audit Committee determines that the potential transaction would be a related party transaction, then the Audit Committee determines whether to approve or decline the proposed transaction. The Audit Committee has not established a written policy regarding the factors it considers in deciding whether to approve a potential related party transaction. Instead, the Audit Committee considers all factors that it considers appropriate and then decides whether to approve the transaction using its business judgment.
- 132 -
| ITEM 14. | PRINCIPAL ACCOUNTANT FEES AND SERVICES |
In response to this status.
- 116 -
| ITEM 15. | EXHIBITS AND FINANCIAL STATEMENT SCHEDULES |
| (a) | FINANCIAL STATEMENTS |
Reference is made to the Index to Consolidated Financial Statements of Financial Institutions, Inc. and subsidiaries under Item 8 “Financial Statements and Supplementary Data” in Part II of this Annual Report on Form 10-K.
| (b) | EXHIBITS |
The following is a list of all exhibits filed or incorporated by reference as part of this Report.
Exhibit | Description | Location | ||
- 133 -
| 3.1 | Amended and Restated Certificate of Incorporation of the Company | Incorporated by reference to Exhibits 3.1, 3.2 and 3.3 of the Form 10-K for the year ended December 31, 2008, dated March 12, 2009 | ||||||
| 3.2 | Amended and Restated Bylaws of the Company | Incorporated by reference to Exhibit 3.4 of the Form 10-K for the year ended December 31, 2008, dated March 12, 2009 | ||||||
| 10.1 | 1999 Management Stock Incentive Plan | Incorporated by reference to Exhibit 10.1 of the S-1 Registration Statement | ||||||
| 10.2 | Amendment Number One to the | Incorporated by reference to Exhibit | ||||||
| 10.3 | Form of Non-Qualified Stock Option Agreement Pursuant to the | Incorporated by reference to Exhibit 10.2 of the Form 8-K, dated July 28, 2006 | ||||||
| 10.4 | Form of Restricted Stock Award Agreement Pursuant to the | Incorporated by reference to Exhibit 10.3 of the Form 8-K, dated July 28, 2006 | ||||||
| 10.5 | Form of Restricted Stock Award Agreement Pursuant to the | Incorporated by reference to Exhibit 10.1 of the Form 8-K, dated January 23, 2008 | ||||||
| 10.6 | 1999 Directors Stock Incentive Plan | Incorporated by reference to Exhibit 10.2 of the S-1 Registration Statement | ||||||
| 10.7 | Amendment to the 1999 Director Stock Incentive Plan | Incorporated by reference to Exhibit 10.7 of the Form 10-K for the year ended December 31, 2008, dated March 12, 2009 | ||||||
| 10.8 | 2009 Management Stock Incentive Plan | Incorporated by reference to Exhibit 10.8 of the Form 10-Q for the quarterly period ended June 30, 2009, dated August 5, 2009 | ||||||
| 10.9 | 2009 Directors’ Stock Incentive Plan | Incorporated by reference to Exhibit 10.9 of the Form 10-Q for the quarterly period ended June 30, 2009, dated August 5, 2009 | ||||||
| 10.10 | Form of Restricted Stock Award Agreement Pursuant to the | Filed Herewith | ||||||
| 10.11 | Form of Restricted Stock Award Agreement Pursuant to the 2009 Management Stock Incentive Plan (Special, one-time Award) | Incorporated by reference to Exhibit 10.1 of the Form 8-K, dated January 19, 2010 | ||||||
| 10.12 | Form of Restricted Stock Award Agreement Pursuant to the | |||||||
| Incorporated by reference to Exhibit 10.2 of the Form 8-K, dated March 1, 2010 | ||||||||
- 134117 -
Exhibit | Description | Location | ||||||
| 10.13 | Incorporated by reference to Exhibit | |||||||
| 10.14 | Form of 2012 Performance Program Master Agreement | Incorporated by reference to Exhibit 10.13 of the Form 10-K for the year ended December 31, 2011, dated March 9, 2012 | ||||||
| 10.15 | Form of 2012 Performance Program Award Certificate | Incorporated by reference to Exhibit 10.14 of the Form 10-K for the year ended December 31, 2011, dated March 9, 2012 | ||||||
| 10.16 | Form of 2013 Performance Program Master Agreement | Filed Herewith | ||||||
| 10.17 | Form of 2013 Performance Program Award Certificate | Filed Herewith | ||||||
| 10.18 | Amended and Restated Executive Agreement | Incorporated by reference to Exhibit 10.1 of the Form 8-K, dated | ||||||
| 10.19 | ||||||||
| Amended and Restated Executive Agreement | Incorporated by reference to Exhibit 10.2 of the Form 8-K, dated | |||||||
| 10.20 | Executive Agreement | Incorporated by reference to Exhibit 10.3 of the Form 8-K, dated | ||||||
| 10.21 | Executive Agreement | Incorporated by reference to Exhibit 10.4 of the Form 8-K, dated | ||||||
| 10.22 | Executive Agreement | Incorporated by reference to Exhibit | ||||||
| 10.23 | ||||||||
| Incorporated by reference to Exhibit | ||||||||
| 10.24 | Voluntary Retirement Agreement with Ronald A. Miller | Incorporated by reference to Exhibit 10.2 of the Form 8-K, dated September 26, 2008 | ||||||
| 10.25 | Amendment to Voluntary Retirement Agreement with Ronald A. Miller | Incorporated by reference to Exhibit 10.1 of the Form 8-K, dated March 3, 2010 | ||||||
| 10.26 | Separation and release agreement between Financial Institutions, Inc. and Peter G. Humphrey | Incorporated by reference to Exhibit 10.2 of the Form 10-Q for the quarterly period ended September 30, 2012, dated November 6, 2012 | ||||||
| 10.27 | ||||||||
| Incorporated by reference to Exhibit 10.3 of the Form 10-Q for the quarterly period ended September 30, 2012, dated November 6, 2012 | ||||||||
| 10.28 | Assignment, Purchase and Assumption Agreement dated January 19, 2012 between First Niagara Bank, National Association and Five Star Bank | Incorporated by reference to Exhibit 10.24 of the Form 10-K for the year ended December | ||||||
| 10.29 | Amendment No. 1 to Assignment, Purchase | Incorporated by reference to Exhibit 10.1 of the | ||||||
| 10.30 | Purchase and Assumption Agreement dated January 19, 2012 between First Niagara Bank, National Association and Five Star Bank | Incorporated by reference to Exhibit 10.25 of the Form 10-K for the year ended December 31, 2011, dated March 9, 2012 | ||||||
| 10.31 | Amendment No. 1 to Purchase and Assumption Agreement, effective as of June 21, 2012, by and between Five Star Bank and First Niagara Bank, National Association. | Incorporated by reference to Exhibit 10.1 of the Form 8-K, dated | ||||||
- 118 -
Exhibit | Description | Location | ||||||
| 10.32 | ||||||||
| Incorporated by reference to | ||||||||
| 21 | Subsidiaries of Financial Institutions, Inc. | Filed Herewith | ||||||
| 23 | Consent of Independent Registered Public Accounting Firm | Filed Herewith | ||||||
| 31.1 | Certification pursuant to Section 302 of the Sarbanes-Oxley Act of | Filed Herewith | ||||||
| 31.2 | Certification pursuant to Section 302 of the Sarbanes-Oxley Act of | Filed Herewith | ||||||
| 32 | Certification pursuant | Filed Herewith | ||||||
| *101.INS | XBRL Instance Document | |||||||
| *101.SCH | ||||||||
| *101.CAL | XBRL Taxonomy Extension Calculation Linkbase Document | |||||||
| *101.LAB | XBRL Taxonomy Extension Label Linkbase Document | |||||||
| *101.PRE | XBRL Taxonomy Extension Presentation Linkbase Document | |||||||
| *101.DEF | XBRL Taxonomy Extension Definition Linkbase Document | |||||||
| * | Pursuant to Rule 406T of | |||||
- 135119 -
| FINANCIAL INSTITUTIONS, INC. | ||||
| March | By: | /s/ | ||
| President | ||||
Pursuant to the requirements of the Securities Exchange Act of 1934, this report has been signed below by the following persons on behalf of the registrant and in the capacities and on the dates indicated.
Signatures | Title | Date | ||||
/s/ Martin K. Birmingham | ||||||
| March 18, 2013 | ||||||
| Martin K. Birmingham | (Principal Executive Officer) | |||||
/s/ Karl F. Krebs | Executive Vice President and Chief Financial Officer | March 18, 2013 | ||||
| Karl F. Krebs | (Principal Financial and Accounting Officer) | |||||
/s/ Karl V. Anderson, Jr. | Director | March 18, 2013 | ||||
| Karl V. Anderson, Jr. | ||||||
/s/ John E. Benjamin | Director, Chairman | March | ||||
| John E. Benjamin | ||||||
/s/ Barton P. Dambra | Director | March | ||||
| Barton P. Dambra | ||||||
/s/ Samuel M. Gullo | Director | March | ||||
| Samuel M. Gullo | ||||||
/s/ Susan R. Holliday | Director | March | ||||
| Susan R. Holliday | ||||||
/s/ Peter G. Humphrey | Director | March 18, 2013 | ||||
| Peter G. Humphrey | ||||||
/s/ Erland E. Kailbourne | Director | March | ||||
| Erland E. Kailbourne | ||||||
/s/ Robert N. Latella | Director, Vice Chairman | March | ||||
| Robert N. Latella | ||||||
/s/ James L. Robinson | Director | March | ||||
| James L. Robinson | ||||||
/s/ James H. Wyckoff | Director | March | ||||
| James H. Wyckoff | ||||||
- 136120 -