| ¨ | TRANSITION REPORT PURSUANT TO SECTION 13 OR 15(d) OF THE SECURITIES EXCHANGE ACT OF 1934 | ||
Commission File Number 1-31719
MOLINA HEALTHCARE, INC.
(Exact name of registrant as specified in its charter)
| Delaware | 13-4204626 | |
| (State or other jurisdiction of | (I.R.S. Employer | |
| incorporation or organization) | Identification No.) | |
200 Oceangate, Suite 100, Long Beach, California 90802
(Address of principal executive offices)
(562) 435-3666
(Registrant’s telephone number, including area code)
Securities registered pursuant to Section 12(b) of the Act:
| Title of Class | ||
Name of Each Exchange on Which Registered | ||
Common Stock, $0.001 Par Value | New York Stock Exchange | |
Securities registered pursuant to Section 12(g) of the Act:
None
Indicate by check mark if the registrant is a well-known seasoned issuer, as defined in Rule 405 of the Securities Act. ox Yes þ¨ No
Indicate by check mark if the registrant is not required to file reports pursuant to Section 13 or Section 15(d) of the Act.
Indicate by check mark whether the registrant (1) has filed all reports required to be filed by Section 13 or 15(d) of the Securities Exchange Act of 1934 during the preceding 12 months (or for such shorter period that the registrant was required to file such reports), and (2) has been subject to such filing requirements for the past 90 days. þx Yes o¨ No
Indicate by check mark whether the registrant has submitted electronically and posted on its corporate Web site, if any, every Interactive Data File required to be submitted and posted pursuant to Rule 405 ofRegulation S-T during the preceding 12 months (or for such shorter period that the registrant was required to submit and post such files). ox Yes o¨ No
Indicate by check mark if disclosure of delinquent filers pursuant to Item 405 ofRegulation S-K is not contained herein, and will not be contained, to the best of registrant’s knowledge, in definitive proxy or information statements incorporated by reference in Part III of thisForm 10-K or any amendment to thisForm 10-K. þx
Indicate by check mark whether the registrant is a large accelerated filer, an accelerated filer, a non-accelerated filer, or a smaller reporting company. See the definitions of “large accelerated filer,” “accelerated filer” and “smaller reporting company” in Rule12b-2 of the Exchange Act. (Check one):
| Large accelerated filer | x | Accelerated filer | ¨ | |
| Non-accelerated filer | ¨ | (Do not check if a smaller reporting company) | Smaller reporting company | ¨ |
Indicate by check mark whether the registrant is a shell company (as defined inRule 12b-2 of the Exchange Act). o¨ Yes þý No
The aggregate market value of Common Stock held by non-affiliates of the registrant as of June 30, 2010,2012, the last business day of our most recently completed second fiscal quarter, was approximately $324$664.3 million (based upon the closing price for shares of the registrant’s Common Stock as reported by the New York Stock Exchange, Inc. on June 30, 2010)2012).
As of March 2, 2011,February 22, 2013, approximately 30,523,00045,154,000 shares of the registrant’s Common Stock, $0.001 par value per share, were outstanding.
DOCUMENTS INCORPORATED BY REFERENCE
Portions of the registrant’s Proxy Statement for the 20102013 Annual Meeting of Stockholders to be held on April 27, 2011,May 1, 2013, are incorporated by reference into Part III of thisForm 10-K.
MOLINA HEALTHCARE, INC.
Table of Contents
Form 10-K
PART I
Item 1:
| Business |
Molina Healthcare, Inc. provides quality and cost-effective Medicaid-related solutions to meet the health care needs of low-income families and individuals, and to assist state agencies in their administration of the Medicaid program. Our business focuses exclusively on government-sponsored health care programs, and includes our Health Plans segment, our Molina Medicaid Solutionssmsegment, and our smaller direct delivery line of business. Our Health Plans segment consists of licensed health maintenance organizations serving Medicaid populations in ten states. Our Molina Medicaid Solutions segment provides design, development, implementation, and business process outsourcing solutions to Medicaid agencies in an additional five states. Our direct delivery line of business consists of 16 primary care community clinics in California and two primary care community clinics in Washington, and we also manage three county-owned primary care community clinics under a contract with Fairfax County, Virginia. Dr. C. David Molina founded our company in 1980 as a provider organization serving the Medicaid population in Southern California. Today, we remain a provider-focused company led by his son, Dr.Joseph M. Molina, M.D. (Dr. J. Mario Molina.
Molina). We report our financial performance based on two reportable segments: Health Plans and Molina Medicaid Solutions.
Our Health Plans segment operates Medicaid managed careconsists of health plans in the states of California, Florida, Michigan, Missouri, New Mexico, Ohio, Texas, Utah, Washington, and Wisconsin, that serve a totaland includes our direct delivery business. As of December 31, 2012, these health plans served approximately 1.61.8 million members.members eligible for Medicaid, Medicare, and other government-sponsored health care programs for low-income families and individuals. The health plans are operated by our respective wholly owned subsidiaries in those states, each of which is licensed as a health maintenance organization, or HMO. Our direct delivery business consists of 24 primary care clinics in California, Florida, New Mexico, and Washington, and we manage three county-owned primary care clinics under a contract with Fairfax County, Virginia.
Our Health Plans segment derives its revenue principally in the form of premiums paidreceived under Medicaid contracts with the states in which our health plans operate. While the health plans receive fixed per-member per-month, or PMPM, premium payments from the states, the health plans are at risk for the medical costs associated with their members’members' health care. Our Health Plans segment operates in a highly regulated environment, with stringent minimum capitalization requirements which limit the ability of our health plan subsidiaries to pay dividends to us.
Our Molina Medicaid Solutions segment provides design, development, implementation, and business process outsourcing solutions to state governments for their Medicaid Management Information Systems, or MMIS. MMIS is a core information technology tool used to support the administration of state Medicaid and other health care entitlement programs. Our Molina Medicaid Solutions segment currently holds MMIS contracts with the states of Idaho, Louisiana, Maine, New Jersey, and West Virginia, as well as a contract to provide drug rebate administration services for the Florida Medicaid program. We added the Molina Medicaid Solutions segment to our business in May 2010 to expand our product offerings to include support of state Medicaid agency administrative needs; toneeds, reduce the variability in our earnings resulting from fluctuations in medical care costs; tocosts, improve our operating profit margin percentages;percentages, and to improve our cash flow by adding a business for which there are no restrictions on dividend payments.
From a strategic perspective, we believe our two business segments and our direct delivery business line allow us to participate in an expanding sector of the economy and continue our mission of serving low-income families and individuals eligible for government-sponsored health care programs. Operationally, our two business segments share a common systems platform, which allows for economies of scale and common experience in meeting the needs of state Medicaid programs. We also believe that we may have opportunities to market to state Medicaid agencies various cost containment and quality practices used by our health plans, such as care management and care coordination, for incorporation into their ownfee-for-service Medicaid programs.
Our principal executive offices are located at 200 Oceangate, Suite 100, Long Beach, California 90802, and our telephone number is(562) 435-3666. Our website iswww.molinahealthcare.com.
Information contained on our website or linked to our website is not incorporated by reference into, or as part of, this annual report. Unless the context otherwise requires, references to “Molina Healthcare,” the “Company,” “we,” “our,” and “us” herein refer to Molina Healthcare, Inc. and its subsidiaries. Our annual reports onForm 10-K, quarterly reports onForm 10-Q, current reports onForm 8-K, and all amendments to these reports, are available free of charge onunder the “investors” tab of our website,www.molinahealthcare.com, as soon as reasonably practicable after such reports are electronically filed with or furnished to the Securities and Exchange Commission, or SEC. Information regarding our officers and directors, and copies of our Code of Business Conduct and Ethics, Corporate Governance Guidelines, and the charters of our Audit Committee, Compensation Committee, Corporate Governance and Nominating Committee, and Compliance Committee Charters, are also available on our website. Such information is also available in print upon the request
1
of any stockholder to our Investor Relations department at the address of our executive offices set forth above. In accordance with New York Stock Exchange, or NYSE, rules, on June 2, 2010,May 21, 2012, we filed the annual certification by our Chief Executive Officer certifying that he was unaware of any violation by us of the NYSE’sNYSE's corporate governance listing standards at the time of the certification.
Our Industry
The Medicaid and CHIP Programs. The Medicaid program is a federal entitlement program administered by the states. Medicaid provides health care and long-term care services and support to low-income Americans. Subject to federal rules,laws and regulations, states have significant flexibility to structure their own programs in terms of eligibility, benefits, delivery of services, and provider payments. Medicaid is funded jointly by the states and the federal government. The federal government guarantees matching funds to states for qualifying Medicaid expenditures based on each state’sstate's federal medical assistance percentage, or
1
FMAP. A state’sstate's FMAP is calculated annually and varies inversely with average personal income in the state. The average FMAP across all states prior to FY 2009 wasis currently about 57 percent, but rangedand ranges from a federally established FMAP floor at 50 percentof 50% to as high as 76 percent. With the passage of the American Recovery and Reinvestment Act, or ARRA, stimulus package in 2009, FMAP rates for all states increased by a minimum of 6.2 percentage points between October 1, 2009 and December 31, 2010, plus an additional increase adjusted quarterly based on the state’s unemployment rate. Congress has extended through June 2011 the increased FMAP, but at a reduced rate from the previous ARRA enhancement.
74%.
The most common state-administered Medicaid program is the Temporary Assistance for Needy Families program, or TANF (often pronounced “TAN-if”).TANF. Another common state-administered Medicaid program is for the aged, blind or disabled, or ABD, Medicaid members. In addition, the Children’sChildren's Health Insurance Program, or CHIP, is a joint federal and state matching program that provides health care coverage to children whose families earn too much to qualify for Medicaid coverage. States have the option of administering CHIP through their Medicaid programs.
Each state establishes its own eligibility standards, benefit packages, payment rates, and program administration within broad federal statutory and regulatory guidelines. Every state Medicaid program must balance many potentially competing demands, including the need for quality care, adequate provider access, and cost-effectiveness. In an effort to improve quality and provide more uniform and more cost-effective care, many states have implemented Medicaid managed care programs. These programs seek to improve access to coordinated health care services, including preventive care, and to control health care costs. Under Medicaid managed care programs, a health plan receives capitation payments from the state. The health plan, in turn, arranges for the provision of health care services by contracting with a network of medical providers. The health plan implements care management and care coordination programs that seek to improve both care access and care quality, while controlling costs more effectively.
While many states have embraced Medicaid managed care programs, others continue to operate traditionalfee-for-service programs to serve all or part of their Medicaid populations. Underfee-for-service Medicaid programs, health care services are made available to beneficiaries as they seek that care, without the benefit of a coordinated effort to maintain and improve their health. As a consequence, treatment is often postponed until medical conditions become more severe, leading to higher costs and more unfavorable outcomes. Additionally, providers paid on afee-for-service basis are compensated based upon services they perform, rather than health outcomes, and therefore lack incentives to coordinate preventive care, monitor utilization, and control costs.
Because Medicaid is a state-administered program, every state must have mechanisms, policies, and procedures in place to perform a large number of crucial functions, including the determination of eligibility and the reimbursement of medical providers for services provided. This requirement exists regardless of whether a state has adopted afee-for-service or a managed care delivery model. MMIS are used by states to support these administrative activities. The federal government typically reimburses the states for 90% of the costs incurred in the
2
design, development, and implementation of an MMIS and for 50%75% of the costs incurred in operating an MMIS. Although a small number of states build and operate their own MMIS, a far more typical practice is for states tosub-contract the design, development, implementation, and operation of their MMIS to private parties. Through our Molina Medicaid Solutions segment, we now actively participate in this market.
In certain instances, states have elected to provide medical benefits to individuals and families who are not served by Medicaid. In New Mexico and Washington, our health plan segment participates in programs that are administered in a manner similar to Medicaid and CHIP, but without federal matching funds.
Medicare Advantage Plans. During 2010, each2012, all of our health plans, in California, Florida, Michigan, New Mexico, Ohio, Texas, Utah, and Washingtonexcept our Wisconsin health plan, operated Medicare Advantage plans, each of which included a mandatory Part D prescription drug benefit. Our Medicare Advantage special needs plans, or SNPs, operate under the trade name Molina Medicare Options Plus, and serve those beneficiaries who are dually eligible for both Medicare and Medicaid, such as low-income seniors and people with disabilities. Our Medicare Advantage Prescription Drug plans, or MA-PDs, operate under the trade name Molina Medicare Options. Although ourMA-PD benefit plans do not exclusively enroll dual eligible beneficiaries, the plans’plans' benefit structure is designed to appeal to lower income beneficiaries. We believe offering these Medicare plans is consistent with our historical mission of serving low-income and medically underserved families and individuals. None of our health plans operateoperates a Medicare Advantage privatefee-for-service plan. Total enrollment in our Medicare Advantage plans atas of December 31, 20102012 was approximately 24,50036,000 members. Our 2010For the year ended December 31, 2012, premium revenues from Medicare across all health plans represented approximately 6.6%8% of our total premium revenues.
Our Strengths
We focus on serving low-income families and individuals who receive health care benefits through government-sponsored programs within a managed care model. Additionally, we support state Medicaid agencies by providing them with comprehensive solutions to their MMIS development and operating needs. Our approach to our business is based on the following strengths:
Comprehensive Medicaid Services. We offer a complete suite of Medicaid services, ranging from quality care, disease management, and cost management, and direct delivery of health care services at our clinics through our Health Plans segment, to state-level MMIS administration through our Molina Medicaid Solutions segment, to the direct delivery of health care services at our clinics.segment. We have the ability to draw upon our experience and expertise in each of these areas to enhance the quality of the services we offer in the others.
2
Flexible Service Delivery Systems. Our health plan care delivery systems are diverse and readily adaptable to different markets and changing conditions. We arrange health care services with a variety of providers, including independent physicians and medical groups, hospitals, ancillary providers, and our own clinics. Our systems support multiple types of contract models. Our provider networks are well-suited, based on medical specialty, member proximity, and cultural sensitivity, to provide services to our members. Our Molina Medicaid Solutions platform is based upon commercialoff-the-shelf technology, or COTS. technology. As a result, we believe that our Molina Medicaid Solutions platform has the flexibility to meet a wide variety of state Medicaid administrative needs in a timely and cost-effective manner.
Proven Expansion and Acquisition Capability. We have successfully replicated the business model of our health plan segment through the acquisition of health plans, thestart-up development of new operations, and the transition of members from other health plans. The successful acquisition of our New Mexico Missouri, and Wisconsin health plans demonstrated our ability to expand into new states. The establishment of our health plans in Utah, Ohio, Texas, and Florida reflects our ability to replicate our business model on astart-up basis in new states, while contract acquisitions in California, Michigan, and Washington have demonstrated our ability to expand our operations within states in which we were already operating.
Administrative Efficiency. We have centralized and standardized various functions and practices to increase administrative efficiency. The steps we have taken include centralizing claims processing and information services onto a single platform. We have standardized medical management programs, pharmacy benefits management contracts, and health education programs. In addition, we have designed our administrative and operational infrastructure to be scalable for cost-effective expansion into new and existing markets.
3
Recognition for Quality of Care. The National Committee for Quality Assurance, or NCQA, has accredited eight of our tennine Medicaid managed care plans. Our Missouri health plan is currently seeking NCQA accreditation, and our recently acquired Wisconsin plan will be seekingacquired in September 2010 currently plans to seek NCQA accreditation in the future.early 2014. We believe that these objective measures of the quality of the services that we provide will become increasingly important to state Medicaid agencies.
Experience and Expertise. Since the founding of our Company in 1980 to serve the Medicaid population in Southern California through a small network of primary care clinics, we have increased our membership to 1.61.8 million members as of December 31, 2012, expanded our Health Plans segment to tennine states, and added our Molina Medicaid Solutions segment. Our experience over the last 30 years has allowed us to develop strong relationships with the constituents we serve, establish significant expertise as a government contractor, and develop sophisticated disease management, care coordination and health education programs that address the particular health care needs of our members. We also benefit from a thorough understanding of the cultural and linguistic needs of Medicaid populations.
Our Strategy
Our objective is to provide a comprehensive suite of Medicaid-related services to meet the health care needs of low-income families and individuals and the state Medicaid agencies that serve them. To achieve our objective, we intend to:
Continue to expand within existing markets.markets, including as a result of the Affordable Care Act Medicaid expansion, the duals pilot projects, and the insurance marketplaces. We plan to continue our growth in existing marketsmarkets. The Patient Protection and Affordable Care Act and the Health Care and Education Affordability Reconciliation Act, commonly referred to together as the Affordable Care Act, or the ACA, provides us with several opportunities for growth, including the expansion of Medicaid eligibility in the states that elect to participate, the implementation of pilot projects for those who are dually eligible for Medicaid and Medicare, and the implementation of insurance marketplaces.
Medicaid expansion. As of February 27, 2013, among the states where we operate our health plans, the states of California, Florida, Michigan, New Mexico, Ohio, and Washington have indicated that they intend to participate in the Medicaid expansion; the states of Texas and Wisconsin have indicated that they do not intend to participate in the expansion; and the state of Utah is undecided. We believe there are significant opportunities to increase our revenues through the Medicaid expansion.
Duals. Nine million low-income elderly and disabled people in the United States are covered under both the Medicare and Medicaid programs. These beneficiaries, often called “dual eligibles” or simply “duals,” are more likely than other Medicare beneficiaries to be frail, live with multiple chronic conditions, and have functional and cognitive impairments. Policymakers at the federal and state level are developing initiatives for dual eligibles both to improve the coordination of their care, and to reduce spending for both Medicare and Medicaid. The Centers for Medicare and Medicaid Services, or CMS, has implemented several demonstrations designed to improve the coordination of care for dual eligibles and reduce spending under Medicare and Medicaid. These demonstrations include issuing contracts to 15 states to design a program to integrate Medicare and Medicaid services for dual eligibles in the state. Our health plans in California, Illinois, Michigan, Ohio, Texas, and Washington intend to take part in the duals demonstrations in those states. Beginning in September 2013, our California plan intends to serve duals in Riverside, San Bernardino and San Diego counties, and may participate with Health Net, Inc. for the duals contract in Los Angeles County. Our new Illinois plan will serve duals
3
in Central Illinois beginning in 2014. Our Michigan plan will respond to a request for proposals to serve duals also beginning in late 2013. Our Ohio plan will serve duals in three regions in southwestern Ohio (Dayton, Columbus and Cincinnati) beginning in late 2013. The state of Texas announced that it intends to cover duals through its existing Medicaid contracts beginning in 2014. Our Washington plan will respond to a request for proposals to serve duals also beginning in 2014.
Insurance marketplaces. Under the ACA, insurance marketplaces will be online marketplaces organized on a state-by-state basis (although in many instances the insurance marketplace in a state will be operated by expanding our service areasthe federal government, and provider networks, increasing awarenessthere could also be regional marketplaces where states combine their marketplace products). In the insurance marketplace, individuals and groups can purchase health insurance that in many instances will be federally subsidized (up to 400% of the Molina brand name, extendingfederal poverty level by individual or family). We currently intend to participate in the insurance marketplaces in the states in which we operate our serviceshealth plans. Our principal focus in participating in the marketplace is to new populations (includingcapture the aged, blind, or disabled), maintaining positive provider relationships,transition in membership that may result from a Medicaid member's income rising above the 138% level of the federal poverty line. By retaining that member in the marketplace, if the member's income subsequently declines, we will continuously serve that same member in all instances and integrating members from othernot “lose” the member to another health plans.plan. We endorse the so-called “bridge plan” as the best way to serve low-income persons who may qualify for coverage through the insurance marketplaces, and will be working with legislators and regulators during 2013 to advocate for the merits of the bridge plan.
Continue to enter new strategic markets. We plan to continue to enter new markets through both acquisitions and by building our ownstart-up operations. For example, on September 1, 2010, we acquired for approximately $15.5 million Abri Health Plan, a provider of Medicaid managed care services in Wisconsin. We intend to focus our expansion in markets with competitive provider communities, supportive regulatory environments, significant size, and, where practicable, mandated Medicaid managed care enrollment.
Continue to provide quality cost-effective care. We plan to use our strong provider networks and the knowledge gained through the operation of our clinics to further develop and utilize effective medical management and other coordinated programs that address the distinct needs of our members and improve the quality and cost-effectiveness of their care.
Leverage operational efficiencies. We intend to leverage the operational efficiencies created by our centralized administrative infrastructure and flexible information systems to earn higher margins on future revenues. We believe our administrative infrastructure has significant expansion capacity, allowing us to integrate new members from expansion within existing markets and enter new markets at lower incremental cost.
Deliver administrative value to state Medicaid agencies. As Medicaid expenditures increase, we believe that an increasing number of states will demand comprehensive solutions that improve both quality andcost-effectiveness. We intend to use our MMIS solution to provide state Medicaid agencies with a flexible and robust solution to their administrative needs. For example, we can apply analytics to improve the functionality of care management processes. We believe that we can help strengthen these tools in ways that translate into both better care and cost containment. We believe that our MMIS platform, together with our extensive experience in health care management and health plan operations, enables us to offer state Medicaid agencies a comprehensive suite of Medicaid-related solutions that meets their needs for quality and for the cost-effective operation of their Medicaid programs.
Open additional primary care clinics. During 2010, we became more diversified and more efficient by expanding our involvement in the direct delivery of primary care. The community clinic model offers an integrated approach that helps us improve both the quality and cost-effectiveness of the care our members receive. In 2010 we opened two clinics in Washington so that we can serve our members’ needs forOur Health Plans segment direct delivery business currently consists of primary and behavioral health services in one place. We also expanded the capacity of our existingcare clinics in California, Florida, New Mexico, and Washington, and three county-owned clinics in anticipationFairfax County, Virginia that we manage on behalf of increases in the numbers of ABD members in our plans. Approximately 20% of our California health plan’s membership is now being served by the health plan’s 16 primary care clinics.county. The growth and aging of the population of the United States foreshadows an increasing shortage of physicians over the next 15 years. Health care reform is expected to
4
worsen this shortage. We believe the shortage will be felt most acutely among already underservedunder-served populations, such as the low income families and individuals we serve. We therefore intend to expand on the direct delivery component of our business by developing additional community care clinics at certain of our health plans during 2011. While we have no plans to become an organization that fully integrates primary care delivery with our health plans, by leveraging thisour direct delivery capability selectivelyon a selective basis we can improve access for our plan members in areas that are most underservedunder-served by primary care providers.
Medicaid Contracts
With the exception of our Missouri health plan, which does not serve ABD or Medicare members, and our Wisconsin health plan, which does not serve Medicare members, all of our health plans serve TANF, CHIP, ABD, and Medicare members. For its Medicare members, each health plan enters into a one-year annually renewable contract with the Centers for Medicare and Medicaid Services, or CMS. For its other members, each health plan enters into a contract with the state’s Medicaid agency. The contractual relationship with the state is generally for a period of one-three to two-yearsfour years and renewable on an annual or biannual basis at the discretion of the state. In general, either the state Medicaid agency or the health plan may terminate the state contract with or without cause upon 30 days to nine months prior written notice. Most of these contracts contain renewal options that are exercisable by the state. Our health plan subsidiaries have generally been successful in obtaining the renewal of their contracts in each state prior to the actual expiration of their contracts. Our state contracts are generally at greatest risk of loss when a state issues a new request for proposals, or RFP, subject to competitive bidding by other health plans. If one of our health plans is not a successful responsive bidder to a state RFP, its contract may be subject to non-renewal. For instance, on February 17, 2012, our Missouri
4
health plan was notified that it was not awarded a new contract under that state’s RFP, and therefore its contract expired on June 30, 2012.
Our contracts with the state determine the type and scope of health care services that we arrange for our members. Generally, our contracts require us to arrange for preventive care, office visits, inpatient and outpatient hospital and medical services, and pharmacy benefits. The contracts also detail the requirements for operating in the Medicaid sector, including provisions relating to: eligibility; enrollment and disenrollment processes; covered benefits; eligible providers; subcontractors; record-keeping and record retention; periodic financial and informational reporting; quality assurance; marketing; financial standards; timeliness of claims payments; health education, wellness and prevention programs; safeguarding of member information; fraud and abuse detection and reporting; grievance procedures; and organization and administrative systems. A health plan’s compliance with these requirements is subject to monitoring by state regulators. A health plan is subject to periodic comprehensive quality assurance evaluation by a third-party reviewing organization and generally by the insurance department of the jurisdiction that licenses the health plan. Most health plans must also submit quarterly and annual statutory financial statements and utilization reports, as well as many other reports in accordance with individual state requirements.
We are usually paid a negotiated PMPM amount, with the PMPM amount varying from contract to contract. Generally, that amount is higher in states where we are required to offer more extensive health benefits. We are also
5
paid an additional amount for each newborn delivery from the Medicaid programs in all of our state health plans, except with respect to our New Mexico health plan.
Provider Networks
We arrange health care services for our members through contracts with providers that include independent physicians and groups, hospitals, ancillary providers, and our own clinics. Our network of providers includes primary care physicians, specialists and hospitals. Our strategy is to contract with providers in those geographic areas and medical specialties necessary to meet the needs of our members. We also strive to ensure that our providers have the appropriate cultural and linguistic experience and skills.
Physicians. We contract with both primary care physicians and specialists, many of whom are organized into medical groups or independent practice associations, or IPAs. Primary care physicians provide office-based primary care services. Primary care physicians may be paid under capitation orfee-for-service contracts and may receive additional compensation by providing certain preventive services. Our specialists care for patients for a specific episode or condition, usually upon referral from a primary care physician, and are usually compensated on afee-for-service basis. When we contract with groups of physicians on a capitated basis, we monitor their solvency.
Hospitals. We generally contract with hospitals that have significant experience dealing with the medical needs of the Medicaid population. We reimburse hospitals under a variety of payment methods, includingfee-for-service, per diems, diagnostic-related groups, or DRGs, capitation, and case rates.
Primary Care Clinics. Our California health planHealth Plans segment operates 1624 company-owned primary care clinics located in California, staffed by our physicians, physician assistants,Florida, New Mexico and nurse practitioners.Washington. These clinics are located in neighborhoods where our members live, and provide us a first-hand opportunity to understand the special needs of our members. The clinics assist us in developing and implementing community education, disease management, and other programs. The clinics also give us direct clinic management experience that enables us to better understand the needs of our contracted providers. In addition, we have a non-licensed subsidiary in Virginia whichthat manages three health care clinics for Fairfax County, and our Washington health plan operates two Company-owned primary care clinics.County.
Medical Management
Our experience in medical management extends back to our roots as a provider organization. Primary care physicians are the focal point of the delivery of health care to our members, providing routine and preventive care, coordinating referrals to specialists, and assessing the need for hospital care. This model has proven to be an effective method for coordinating medical care for our members. The underlying challenge we face is to coordinate health care so that our members receive timely and appropriate care from the right provider at the appropriate cost. In support of this goal, and to ensure medical management consistency among our various state health plans, we continuously refine and upgrade our medical management efforts at both the corporate and subsidiary levels.
We seek to ensure quality care for our members on a cost-effective basis through the use of certain key medical management and cost control tools. These tools include utilization management, case and health management, and provider network and contract management.
Utilization Management. We continuously review utilization patterns with the intent to optimize quality of care and ensure that only appropriate services are rendered in the most cost-effective manner. Utilization management, along with our other tools of medical management and cost control, is supported by a centralized corporate medical informatics function which utilizes third-partythird-
5
party software and data warehousing tools to convert data into actionable information. We use a predictive modeling capability that supports a proactive case and health management approach both for us and our affiliated physicians.
Case and Health Management. We seek to encourage quality, cost-effective care through a variety of case and health management programs, including disease management programs, educational programs, and pharmacy management programs.
Disease Management Programs. We develop specialized disease management programs that address the particular health care needs of our members. "motherhood matters!smsm" is a comprehensive program designed to improve pregnancy outcomes and enhance member satisfaction.“breathe with ease!sm” is a multi-disciplinary disease management program that provides health education resources and case management services to assist physicians caring for asthmatic members between the ages of three and fifteen.15. “Healthy Living with Diabetessm” is a diabetes
6
disease management program.“Heart Health Living”is a cardiovascular disease management program for members who have suffered from congestive heart failure, angina, heart attack, or high blood pressure.
Educational Programs. Educational programs are an important aspect of our approach to health care delivery. These programs are designed to increase awareness of various diseases, conditions, and methods of prevention in a manner that supports our providers while meeting the unique needs of our members. For example, we provide our members with information to guide them through various episodes of care. This information, which is available in several languages, is designed to educate parents on the use of primary care physicians, emergency rooms, and nurse call centers.
Pharmacy Management Programs. Our pharmacy management programs focus on physician education regarding appropriate medication utilization and encouraging the use of generic medications. Our pharmacists and medical directors work with our pharmacy benefits manager to maintain a formulary that promotes both improved patient care and generic drug use. We employ full-time pharmacists and pharmacy technicians who work with physicians to educate them on the uses of specific drugs, the implementation of best practices, and the importance of cost-effective care.
Provider Network and Contract Management. The quality, depth, and scope of our provider network are essential if we are to ensure quality, cost-effective care for our members. In partnering with quality, cost-effective providers, we utilize clinical and financial information derived by our medical informatics function, as well as the experience we have gained in serving Medicaid members to gain insight into the needs of both our members and our providers. As we grow in size, we seek to strengthen our ties with high-quality, cost-effective providers by offering them greater patient volume.
Plan Administration and Operations
Management Information Systems. All of our health plan information technology and systems operate on a single platform. This approach avoids the costs associated with maintaining multiple systems, improves productivity, and enables medical directors to compare costs, identify trends, and exchange best practices among our plans. Our single platform also facilitates our compliance with current and future regulatory requirements.
The software we use is based on client-server technology and is scalable. We believe the software is flexible, easy to use, and allows us to accommodate anticipated enrollment growth and new contracts. The open architecture of the system gives us the ability to transfer data from other systems without the need to write a significant amount of computer code, thereby facilitating the integration of new plans and acquisitions.
We have designed our corporate website with a focus on ease of use and visual appeal. Our website has a secure ePortal which allows providers, members, and trading partners to access individualized data. The ePortal allows the following self-services:
Provider Self Services. Providers have the ability to access information regarding their members and claims. Key functionalities include "Check Member Eligibility," "View Claim," and "View/Submit Authorizations."
Member Self Services. Members can access information regarding their personal data, and can perform the following key functionalities: "View Benefits," "Request New ID Card," "Print Temporary ID Card," and "Request Change of Address/PCP."
File Exchange Services. Various trading partners — such as service partners, providers, vendors, management companies, and individual IPAs — are able to exchange data files (such as those that may be required by the Health Insurance Portability and Accountability Act of 1996, or HIPAA, or any other proprietary format) with us using the file exchange functionality.
Best Practices. We continuously seek to promote best practices. Our approach to quality is broad, encompassing traditional medical management and the improvement of our internal operations. We have staff assigned full-time to the development and implementation of a uniform, efficient, and quality-based medical care delivery model for our health plans. These employees coordinate and implement Company-widecompany-wide programs and strategic initiatives such as preparation of the Healthcare Effectiveness
6
Data and Information Set, or HEDIS, and accreditation by the NCQA. We use measures established by the NCQA in credentialing the physicians in our network. We routinely use peer review to assess the quality of care rendered by providers. Eight of our ten health plans are accredited by the NCQA. Our Wisconsin plan acquired in September 2010 currently plans to seek NCQA accreditation in early 2014.
7
Claims Processing. All of our health plans operate on a single managed care platform for claims processing (the QNXT 3.44.8 system), with the exception of our newly acquired Wisconsin plan which we expect will be migrated to the Molina standard platform in January 2012..
Centralized Management Services. We provide certain centralized medical and administrative services to our health plans pursuant to administrative services agreements, including medical affairs and quality management, health education, credentialing, management, financial, legal, information systems, and human resources services. Fees for such services are based on the fair market value of services rendered and are recorded as operating revenue. Payment is subordinated to the health plan’s ability to comply with minimum capital and other restrictive financial requirements of the states in which they operate.
Compliance. Our health plans have established high standards of ethical conduct. Our compliance programs are modeled after the compliance guidance statements published by the Office of the Inspector General of the U.S. Department of Health and Human Services. Our uniform approach to compliance makes it easier for our health plans to share information and practices and reduces the potential for compliance errors and any associated liability.
Disaster Recovery. We have established a disaster recovery and business resumption plan, withback-up operating sites, to be deployed in the case of a major disruptive event.
Competition
We operate in a highly competitive environment. The Medicaid managed care industry is fragmented, and the competitive landscape is subject to ongoing changes as a result of business consolidations and new strategic alliances. We compete with a large number of national, regional, and local Medicaid service providers, principally on the basis of size, location, and quality of provider network, quality of service, and reputation. Competition can vary considerably from state to state. Below is a general description of our principal competitors for state contracts, members, and providers:
Multi-Product Managed Care Organizations — National and regional managed care organizations that have Medicaid members in addition to numerous commercial health plan and Medicare members.
Medicaid HMOs — National and regional managed care organizations that focus principally on providing health care services to Medicaid beneficiaries, many of which operate in only one city or state.
Prepaid Health Plans — Health plans that provide less comprehensive services on an at-risk basis or that provide benefit packages on a non-risk basis.
Primary Care Case Management Programs — Programs established by the states through contracts with primary care providers to provide primary care services to Medicaid beneficiaries, as well as to provide limited oversight of other services.
We will continue to face varying levels of competition. Health care reform proposals may cause organizations to enter or exit the market for government sponsored health programs. However, the licensing requirements and bidding and contracting procedures in some states may present partial barriers to entry into our industry.
We compete for government contracts, renewals of those government contracts, members, and providers. State agencies consider many factors in awarding contracts to health plans. Among such factors are the health plan’s provider network, medical management, degree of member satisfaction, timeliness of claims payment, and financial resources. Potential members typically choose a health plan based on a specific provider being a part of the network, the quality of care and services available, accessibility of services, and reputation or name recognition of the health plan. We believe factors that providers consider in deciding whether to contract with a health plan include potential member volume, payment methods, timeliness and accuracy of claims payment, and administrative service capabilities.
Molina Medicaid Solutions competes with large MMIS vendors, such as HP Enterprise Services (formerly known as EDS), ACS (owned by Xerox Corporation), Computer Services Corporation, or CSC, and CNSI.
Regulation
Our health plans are highly regulated by both state and federal government agencies. Regulation of managed care products and health care services varies from jurisdiction to jurisdiction, and changes in applicable laws and rules can occur frequently. Regulatory agencies generally have discretion to issue regulations and interpret and enforce laws and
8
rules. Such agencies have
7
become increasingly active in recent years in their review and scrutiny of health insurers and managed care organization, including those operating in the Medicaid and Medicare programs.
To operate a health plan in a given state, we must apply for and obtain a certificate of authority or license from that state. Our operating health plans are licensed to operate as health maintenance organizations, or HMOs, in each of California, Florida, Michigan, Missouri, New Mexico, Ohio, Texas, Utah, Washington, and Wisconsin. In those states we are regulated by the agency with responsibility for the oversight of HMOs which, in most cases, is the state department of insurance. In California, however, the agency with responsibility for the oversight of HMOs is the Department of Managed Health Care. Licensing requirements are the same for us as they are for health plans serving commercial or Medicare members. We must demonstrate that our provider network is adequate, that our quality and utilization management processes comply with state requirements, and that we have adequate procedures in place for responding to member and provider complaints and grievances. We must also demonstrate that we can meet requirements for the timely processing of provider claims, and that we can collect and analyze the information needed to manage our quality improvement activities. In addition, we must prove that we have the financial resources necessary to pay our anticipated medical care expenses and the infrastructure needed to account for our costs.
Our health plans are required to file quarterly and annual reports of their operating results with the appropriate state regulatory agencies. These reports are accessible for public viewing. Each health plan undergoes periodic examinations and reviews by the state in which it operates. The health plans generally must obtain approval from the state before declaring dividends in excess of certain thresholds. Each health plan must maintain its net worth at an amount determined by statute or regulation. The minimum statutory net worth requirements differ by state, and are generally based on statutory minimum risk-based capital, or RBC, requirements. The RBC requirements are based on guidelines established by the National Association of Insurance Commissioners, or NAIC, and are administered by the states. Our Michigan, Missouri, New Mexico, Ohio, Texas, Utah, Washington, and Wisconsin health plans are subject to RBC requirements. Any acquisition of another plan’s members or its state contracts must also be approved by the state, and our ability to invest in certain financial securities may be prescribed by statute.
In addition, we are also regulated by each state’s department of health services or the equivalent agency charged with oversight of Medicaid and CHIP. These agencies typically require demonstration of the same capabilities mentioned above and perform periodic audits of performance, usually annually.
Medicaid. Medicaid was established in 1965 under the U.S. Social Security Act to provide medical assistance to the poor. Although both thejointly funded by federal and state governments, jointly fund it, Medicaid is a state-operated and state-implemented program. Our contracts with the state Medicaid programs impose various requirements on us in addition to those imposed by applicable federal and state laws and regulations. Within broad guidelines established by the federal government, each state:
establishes its own member eligibility standards; determines the type, amount, duration, and scope of services; sets the rate of payment for health care services; and administers its own program. |
We obtain our Medicaid contracts in different ways. Some states award contracts to any applicant demonstrating that it meets the state’s requirements. Other states engage in a competitive bidding process. In all cases, we must demonstrate to the satisfaction of the state Medicaid program that we are able to meet the state’s operational and financial requirements. These requirements are in addition to those required for a license and are targeted to the specific needs of the Medicaid population. For example:
We must measure provider access and availability in terms of the time needed to reach the doctor’s office using public transportation;
Our quality improvement programs must emphasize member education and outreach and include measures designed to promote utilization of preventive services;
We must have linkages with schools, city or county health departments, and other community-based providers of health care, to demonstrate our ability to coordinate all of the sources from which our members may receive care;
We must be able to meet the needs of the disabled and others with special needs;
Our providers and member service representatives must be able to communicate with members who do not speak English or who are deaf; and
Our member handbook, newsletters, and other communications must be written at the prescribed reading level, and must be available in languages other than English.
8
In addition, we must demonstrate that we have the systems required to process enrollment information, to report on care and services provided, and to process claims for payment in a timely fashion. We must also have the financial resources needed to protect the state, our providers, and our members against the insolvency of one of our health plans.
Medicare. Medicare is a federal program that provides eligible persons age 65 and over and some disabled persons a variety of hospital, medical insurance, and prescription drug benefits. Medicare is funded by Congress, and administered by the Centers for Medicare and Medicaid Services, or CMS. Medicare beneficiaries have the option to enroll in a Medicare Advantage plan. Under Medicare Advantage, managed care plans contract with CMS to provide benefits that are comparable to original Medicare in exchange for a fixed PMPM premium payment that varies based on the county in which a member resides, the demographics of the member, and the member’s health condition.
The Medicare Prescription Drug, Improvement and Modernization Act of 2003, or MMA, made numerous changes to the Medicare program, including expanding the Medicare program to include a prescription drug benefit. Since 2006, Medicare beneficiaries have had the option of selecting a new prescription drug benefit from an existing Medicare Advantage plan. The drug benefit, available to beneficiaries for a monthly premium, is subject to certain cost sharing depending upon the specific benefit design of the selected plan. Plans are not required to offer the same benefits, but are required to provide coverage that is at least actuarially equivalent to the standard drug coverage delineated in the MMA.
On July 15, 2008, the Medicare Improvements for Patients and Providers Act, or MIPPA, became law and, in September 2008, CMS promulgated implementing regulations. MIPPA impacts a broad range of Medicare activities and impacts all types of Medicare managed care plans. MIPPA and subsequent CMS guidance place prohibitions and limitations on certain sales and marketing activities of Medicare Advantage plans. Among other things, Medicare Advantage plans are not permitted to make unsolicited outbound calls to potential members or engage in other forms of unsolicited contact, establish appointments without documented consent from potential members, or conduct sales events in certain provider-based settings. MIPPA also establishes certain restrictions on agent and broker compensation.
HIPAA. In 1996, Congress enacted the Health Insurance Portability and Accountability Act, or HIPAA. All health plans are subject to HIPAA, including ours. HIPAA generally requires health plans to:
Establish the capability to receive and transmit electronically certain administrative health care transactions, like claims payments, in a standardized format; Afford privacy to patient health information; and Protect the privacy of patient health information through physical and electronic security measures. |
The Patient Protection and Affordable Care Act of 2010, or ACA created additional tools for fraud prevention, including increased oversight of providers and suppliers participating or enrolling in Medicaid, CHIP, and Medicare. Those enhancements included mandatory licensure for all providers, and site visits, fingerprinting, and criminal background checks for higher risk providers. On September 23, 2010, CMS issued proposed regulations designed to implement these requirements. It is not clear at this time the degree to which managed care providers would have to comply with these new requirements, many of which resemble procedures that we already have in place.
The Health Information Technology for Economic and Clinical Health Act (“HITECH Act”), a part of the American Recovery and Reinvestment Act of 2009, or ARRA, modified certain provisions of HIPAA by, among other things, extending the privacy and security provisions to business associates, mandating new regulations around electronic medical records, expanding enforcement mechanisms, allowing the state Attorneys General to bring enforcement actions, and increasing penalties for violations. The U.S. Department of Health and Human Services, as required by the HITECH Act, has issued interim final rules that set forth the breach notification obligations applicable to covered entities and their business associates, (the “HHSor the HHS Breach Notification Rule”).Rule. The various requirements of the HITECH Act and the HHS Breach Notification Rule have different compliance dates, some of which have passed and some of which will occur in the future. With respect to those requirements whose compliance dates have passed, we believe that we are
10
in compliance with these provisions. With respect to those requirements whose compliance dates are in the future, we are reviewing our current practices and identifying those which may be impacted by upcoming regulations. It is our intention to implement these new requirements on or before the applicable compliance dates.
Fraud and Abuse Laws. Our operations are subject to various state and federal health care laws commonly referred to as “fraud and abuse” laws. Fraud and abuse prohibitions encompass a wide range of activities, including kickbacks for referral of members, billing for unnecessary medical services, improper marketing, and violations of patient privacy rights. These fraud and abuse laws include the federal False Claims Act which prohibits the knowing filing of a false claim or the knowing use of false statements to obtain payment from the federal government. Many states have false claim act statutes that closely resemble the federal False Claims Act. If an entity is determined to have violated the federal False Claims Act, it must pay three times the actual damages sustained by the government, plus mandatory civil penalties up to fifty thousand dollars for each separate false claim. Suits filed under the Federal False Claims Act, known as“qui tam” actions, can be brought by any individual on behalf of the government and such individuals (known as “relators” or, more commonly, as “whistleblowers”) may share in any amounts paid
9
by the entity to the government in fines or settlement.Qui tamactions have increased significantly in recent years, causing greater numbers of health care companies to have to defend a false claim action, pay fines or be excluded from the Medicaid, Medicare or other state or Federal health care programs as a result of an investigation arising out of such action. In addition, the Deficit Reduction Action of 2005, (“DRA”)or DRA, encourages states to enact state-versions of the federal False Claims Act that establish liability to the state for false and fraudulent Medicaid claims and that provide for, among other things, claims to be filed byqui tamrelators.
Companies involved in public health care programs such as Medicaid are often the subject of fraud and abuse investigations. The regulations and contractual requirements applicable to participants in these public sector programs are complex and subject to change. Violations of certain fraud and abuse laws applicable to us could result in civil monetary penalties, criminal fines and imprisonment,and/or exclusion from participation in Medicaid, Medicare, other federal health care programs and federally funded state health programs.
Federal and state governments have made investigating and prosecuting health care fraud and abuse a priority. Although we believe that our compliance efforts are adequate, we will continue to devote significant resources to support our compliance efforts.
Employees
As of December 31, 2010,2012, we had approximately 4,2005,800 employees. Our employee base is multicultural and reflects the diverse Medicaid and Medicare membership we serve. We believe we have good relations with our employees. None of our employees is represented by a union.
Executive Officers of the Registrant
J. Mario Molina, M.D., 52,54, has served as President and Chief Executive Officer since succeeding his father and company founder, Dr. C. David Molina, in 1996. He has also served as Chairman of the Board since 1996. Prior to that, he served as Medical Director from 1991 through 1994 and was Vice President responsible for provider contracting and relations, member services, marketing and quality assurance from 1994 to 1996. He earned an M.D. from the University of Southern California and performed his medical internship and residency at the Johns Hopkins Hospital. Dr. Molina is the brother of John C. Molina.
John C. Molina, J.D., 46,48, has served in the role of Chief Financial Officer since 1995.1995, and has been employed by the Company for over 30 years in a variety of positions. He also has served as a director since 1994. Mr. Molina has been employed by us for over 30 years in a variety of positions. Mr. Molina is a past presidentmember of the California Association of Primary Care Case Management Plans. He was recently named to the Los Angeles branch of the Federal Reserve Bank of San Francisco’s board of directors. He earnedMr. Molina holds a Juris Doctorate from the University of Southern California School of Law. Mr. Molina is the brother of Dr. J. Mario Molina, M.D.
Molina.
Terry P. Bayer, 60,62, has served as our Chief Operating Officer since November 2005. She had formerly served as our Executive Vice President, Health Plan Operations since January 2005.Operations. Ms. Bayer has 26over 30 years of health care management experience, including staff model clinic administration, provider contracting, managed care operations, disease management, and home care. Prior to joining us, her professional experience included regional responsibility at FHP, Inc. and multi-state responsibility as Regional Vice-PresidentVice President at Maxicare; Partners National Health Plan, a joint venture of Aetna Life Insurance Company and Voluntary Hospital Association (VHA); and Lincoln National. She has also served as Executive Vice President of Managed Care at Matria Healthcare, President
11
and Chief Operating Officer of Praxis Clinical Services, and as Western Division President of AccentCare. She holds a Juris Doctorate from Stanford University, a Master’s degree in Public Health from the University of California, Berkeley, and a Bachelor’s degree in Communications from Northwestern University.
Joseph W. White, 52,54, has served as our Chief Accounting Officer since 2003.2007. In his role as Chief Accounting Officer, Mr. White is responsible for oversight of the Company’s accounting, reporting, forecasting, budgeting, actuarial, procurement, treasury and facilities functions. Mr. White has 25over 30 years of financial management experience in the health care industry. Prior to joining the Company in 2003, Mr. White worked for Maxicare Health Plans, Inc. from 1987 through 2002. Mr. White holds a Master’s degree in Business Administration and a Bachelor’s degree in Commerce from the University of Virginia. Mr. White is a Certified Public Accountant.
12
Utah.
Intellectual Property
We have registered and maintain various service marks, trademarks and trade names that we use in our businesses, including marks and names incorporating the “Molina” or “Molina Healthcare” phrase, and from time to time we apply for additional
10
registrations of such marks. We utilize these and other marks and names in connection with the marketing and identification of products and services. We believe such marks and names are valuable and material to our marketing efforts.
11
Item 1A: Risk Factors
RISK FACTORS
Safe Harbor Statement under the Private Securities Litigation Reform Act of 1995
This annual reportAnnual Report onForm 10-K and the documents we incorporate by reference in this report contain forward-looking statements within the meaning of Section 27A of the Securities Act of 1933, as amended (the “Securities Act”), and Section 21E of the Securities Exchange Act of 1934, as amended (the “Exchange Act”). Other than statements of historical fact, all statements that we include in this report and in the documents we incorporate by reference may be deemed to be forward-looking statements for purposes of the Securities Act and the Exchange Act. Such forward-looking statements may be identified by words such as “anticipates,” “believes,” “could,” “estimates,” “expects,” “guidance,” “intends,” “may,” “outlook,” “plans,” “projects,” “seeks,” “will,” or similar words or expressions.
Investing in our securities involves a high degree of risk. Before making an investment decision, you should carefully read and consider the following risk factors, as well as the other information we include or incorporate by reference in this report and the information in the other reports we file with the U.S. Securities Exchange Commission, or SEC. Such risk factors should be considered not only with regard to the information contained in this annual report, but also with regard to the information and statements in the other periodic or current reports we file with the SEC, as well as our press releases, presentations to securities analysts or investors, or other communications made by or with the approval of one of our executive officers. No assurance can be given that we will actually achieve the results contemplated or disclosed in our forward-looking statements. Such statements may turn out to be wrong due to the inherent uncertainties associated with future events. Accordingly, you should not place undue reliance on our forward-looking statements, which reflect management’s analyses, judgments, beliefs, or expectations only as of the date they are made.
If any of the events described in the following risk factors actually occur, our business, results of operations, financial condition, cash flows, or prospects could be materially adversely affected. The risks and uncertainties described below are those that we currently believe may materially affect us. Additional risks and uncertainties not currently known to us or that we currently deem immaterial may also affect our business and operations. As such, you should not consider this list to be a complete statement of all potential risks or uncertainties. Except to the extent otherwise required by federal securities laws, we do not undertake to address or update forward-looking statements in future filings or communications regarding our business or operating results, and do not undertake to address how any of these factors may have caused results to differ from discussions or information contained in previous filings or communications.
Risks Related to Our Health Plans Business
13
In March 2010, President Obama signed both the Patient Protection and Affordable Care Act and the Health Care and Education Affordability Reconciliation Act, commonly referred to together as the “ACA”. This legislationAffordable Care Act, or the ACA. The ACA enacts comprehensive changes to the U.S.United States health care system, componentselements of which will be phased in at various stages over the next eightseveral years. However, the most significant changes effected by the ACA are currently scheduled to be implemented as of January 1, 2014. There are a multitude of risks associated with the scope of change in the health care system represented by the ACA, including, but not limited to, the following:
Risks associated with the health care excise tax. One notable provision of the ACA is an excise tax that applies to most health plans, including both commercial health plans and Medicaid and/or Medicare managed care plans like Molina Healthcare. While characterized as a “fee” in the text of the ACA, the intent of Congress was to impose a broad-based health insurance industry excise tax, with the understanding that the tax could be passed on to consumers, most likely through slightly higher commercial insurance premiums. However, Medicaid is jointly paid for by the federal government and by state governments, so the cost of this excise tax, as it may be applied to Medicaid plans, will be passed on in the form of higher Medicaid costs and rates. In Medicaid and Medicare, capitated rates paid to managed care plans are required to be developed using generally accepted principles of actuarial soundness. Actuarial soundness requires that the full costs of doing business, including the costs of both federal and state taxes, be considered and factored into the applicable rate. Thus, for Medicaid and/or Medicare managed care plans like Molina Healthcare, Inc., the excise tax will be included in their capitated rates. Because of the novelty of this new tax, actuaries have never factored the tax into the development of capitated rates, an exercise which must be undertaken during 2013 and well in advance of the 2014 calendar year when the tax is scheduled to go into effect. Moreover, because the tax will be based on a health plan's market share as applied to a total excise tax base of $8 billion in 2014 (and rising thereafter), there is substantial uncertainty regarding the actual size of the tax assessment on Molina. Currently, we project that the excise tax assessment on Molina will be approximately $100 million. Since this amount is not deductible for income tax purposes under current law, and since our total net income for fiscal year 2011 was $20.8 million, and our net income for fiscal year 2012 was $9.8 million,
12
our estimated tax rate for 2014 could be driven to 100%, and the excise tax could effectively equal the entire amount of our projected earnings. We and others in the health care industry are working with Congress to carve out the application of the excise tax on Medicaid plans. As an alternative to the repeal of the tax as it applies to Medicaid managed care plans, we and others in the health care industry will also be working with state actuaries to take account of the tax in the calculation of our 2014 rates. However, state budget constraints, inaccurate actuarial calculations, inadequate federal oversight of actuarial soundness, and market competition could result in a failure to reflect in our rates the full amount of the excise tax. If the excise tax is imposed as enacted on Medicaid managed care plans, or we are unable to obtain premium increases to fully offset the impact of the tax or otherwise adjust our business model, our business, financial condition, cash flows, and results of operations could be materially adversely affected.
Risks associated with the duals expansion. Nine million low-income elderly and disabled people are covered under both the Medicare and Medicaid programs. These beneficiaries, often called “dual eligibles,” are more likely than other Medicare beneficiaries to be frail, live with multiple chronic conditions, and have functional and cognitive impairments. Medicare is their primary source of health insurance coverage, as it is for the nearly 50 million elderly and under-65 disabled beneficiaries in 2012. Medicaid supplements Medicare by paying for services not covered by Medicare, such as dental care and long-term care services and supports, and by helping to cover Medicare's premiums and cost-sharing requirements. Together, these two programs help to shield very low-income Medicare beneficiaries from potentially unaffordable out-of-pocket medical and long-term care costs. Policymakers at the federal and state level are increasingly developing initiatives for dual eligibles, both to improve the coordination of their care, and to reduce spending. The Centers for Medicare and Medicaid Services, or CMS, has implemented several demonstration projects designed to improve the coordination of care for dual eligibles and to reduce Medicare and Medicaid spending. These demonstrations include issuing contracts to 15 states to design a program to integrate Medicare and Medicaid services for dual eligibles in the relevant state. Our health plans in California, Illinois, Michigan, Ohio, Texas, and Washington intend to take part in the duals demonstrations in those states. Beginning in September 2013, our California plan intends to serve duals in Riverside, San Bernardino, and San Diego counties, and may participate with Health Net, Inc. for the duals contract in Los Angeles County. Our new Illinois plan will serve duals in Central Illinois beginning in 2014. Our Michigan plan will respond to a request for proposals to serve duals beginning in late 2013. Our Ohio plan will serve duals in three regions in southwestern Ohio (Dayton, Columbus and Cincinnati) beginning in late 2013. The state of Texas announced that it intends to cover duals through its existing Medicaid contracts beginning in 2014. Our Washington plan will respond to a request for proposals to serve duals also beginning in 2014.
There are numerous risks associated with the initial implementation of a new program, with a health plan's expansion into a new service area, or with the provision of medical services to a new population which has not previously been in managed care. One such risk is the development of actuarially sound rates. Because there is limited historical information on which to develop rates, certain assumptions are required to be made which may subsequently prove to have been inaccurate. Rates of utilization could be significantly higher than had been projected, or the assumptions of policymakers about the amount of savings that could be achieved through the use of utilization management in managed care could be seriously flawed. Moreover, because of our lack of actuarial experience for that program, region, or population, our reserve levels may be set at an inadequate level. For instance, these problems arose at our Texas health plan in the second quarter of 2012, leading to extremely elevated medical care costs and substantial losses at the health plan. All of these risks are presented in the implementation of the duals demonstration programs. In the event these risks materialize at one or more of our health plans, the negative results of that health plan or plans could adversely affect our business, financial condition, cash flows, and results of operations.
Risks associated with the Medicaid expansion. Among other things, by January 1, 2014, in the states that elect to participate, the ACA provides that the Medicaid program will be greatly expanded to provide eligibility to nearly all low-income people under age 65 with incomeincomes at or below 133 percent138% of the federal poverty line. As a result, millions of low-income adults without children who currently cannot qualify for coverage, as well as many low-income parents and, in some instances, children now covered through CHIP, will be made eligible for Medicaid. As of February 27, 2013, among the states where we operate our health plans, the states of California, Florida, Michigan, New Mexico, Ohio, and Washington have indicated that they intend to participate in the Medicaid expansion; the states of Texas and Wisconsin have indicated that they do not intend to participate in the expansion; and the state of Utah is undecided. In total,those states that participate in the Congressional Budget Office estimatesexpansion, our Medicaid membership is likely to grow appreciably. The new enrollees in our health plans will represent a population that is different from the population of Medicaid enrollees we have historically managed. In addition, such enrollees may be unfamiliar with managed care, and CHIPmay have substantial pent-up demand for medical services that could result in greater than anticipated rates of utilization. All of the risk factors described above with regard to the duals demonstration programs apply equally to the Medicaid expansion.
Risks associated with the insurance marketplaces.Under the ACA, insurance marketplaces will cover an additional 16 million peoplebe online marketplaces organized on a state-by-state basis (although in many instances the insurance marketplace in a state will be operated by 2019. The legislationthe federal government, and there could also imposesbe regional marketplaces where states combine their marketplace products).
13
In the insurance marketplace, individuals and groups can purchase health insurance that in many instances will be federally subsidized (up to 400% of the federal poverty level by individual or family). We currently intend to participate in the insurance marketplaces in the states in which we operate our health plans. Our principal focus in participating in the marketplace is to capture the transition in membership that may result from a franchise tax or premium excise taxMedicaid member's income rising above the 138% level of $8 billion startingthe federal poverty line. By retaining that member in 2014,the marketplace, if the member's income subsequently declines, we will continuously serve that same member in all instances and not “lose” the member to another health plan. We endorse the so-called “bridge plan” as the best way to serve low-income persons who may qualify for coverage through the insurance marketplaces, and will be working with increasing annual amounts thereafter. Such assessment may not be deductiblelegislators and regulators during 2013 to advocate for income tax purposes.the merits of the bridge plan. All of the risk factors described above with regard to the duals demonstration programs apply equally to our participation in the insurance marketplaces.
Risk associated with implementing regulations.There are many parts of the legislationACA that will require further guidance in the form of regulations. Due to the breadth and complexity of the health reform legislation,ACA, the lack of implementing regulations and interpretive
14
guidance, and the phased-in nature of the ACA's implementation, the overall impact of the health reform legislationACA on our business and on the health industry in general over the coming years is difficult to predict and not yet fully known.
Our profitability depends on our ability to accurately predict and effectively manage our medical care costs.
Our profitability depends to a significant degree on our ability to accurately predict and effectively manage our medical care costs. Historically, our medical care cost ratio, meaning our medical care costs as a percentage of our premium revenue net of premium tax, has fluctuated substantially, and has also varied across our state health plans. Because the premium payments we receive are generally fixed in advance and we operate with a narrow profit margin, relatively small changes in our medical care cost ratio can create significant changes in our overall financial results. For example, if our overall medical care ratio for 2010the year ended December 31, 2012 of 84.5%89.9% had been one percentage point higher, or 85.5%90.9%, our earningsresults for 2010the year ended December 31, 2012 would have been a net loss of approximately $1.14$(0.55) per diluted share rather than our actual 2010 earningsnet income of $1.98$0.21 per diluted share, a 42% reduction in our earnings.
decrease of over 300%.
Factors that may affect our medical care costs include the level of utilization of health care services, unexpected patterns in the annual influenza, or flu, season, increases in hospital costs, an increased incidence or acuity of high dollar claims related to catastrophic illnesses or medical conditions such as hemophilia for which we do not have adequate reinsurance coverage, increased maternity costs, payment rates that are not actuarially sound, changes in state eligibility certification methodologies, relatively low levels of hospital and specialty provider competition in certain geographic areas, increases in the cost of pharmaceutical products and services, changes in health care regulations and practices, epidemics, new medical technologies, and other various external factors. Many of these factors are beyond our control and could reduce our ability to accurately predict and effectively manage the costs of providing health care services. The inability to forecast and manage our medical care costs or to establish and maintain a satisfactory medical care cost ratio, either with respect to a particular state health plan or across the consolidated entity, could have a material adverse effect on our business, financial condition, cash flows, orand results of operations.
Stateand federal budget deficits may result in Medicaid, CHIP, or Medicare funding cuts which could reduce our revenues and profit margins.
Nearly all of our premium revenues come from the joint federal and state funding of the Medicaid and CHIP programs. Due to high unemployment levels, Medicaid enrollment levels and Medicaid costs remain elevated at the same time that state budgets are suffering from significant fiscal strain. Because Medicaid is one of the largest expenditures in every state budget, and one of the fastest-growing, it is a prime target for cost-containment efforts. All of the states in which we currently operate our health plans are currently facing significant budgetary pressures. These budgetary pressures may result in unexpected Medicaid, CHIP, or Medicare rate cuts which could reduce our revenues and profit margins. Moreover, some federal deficit reduction proposals would fundamentally change the structure and financing of the Medicaid program. Recently, various proposals have been advanced to reduce annual federal deficits and to slow the increase in the national debt. A number of these proposals include both tax increases and spending reductions in discretionary programs and mandatory programs, such as Social Security, Medicare, and Medicaid.
In addition, potential reductions in Medicare and Medicaid spending have been included in the discussions in Congress regarding deficit reduction measures. The Budget Control Act of 2011 provides that Medicare payments may be reduced by no more than 2% and certain other programs, including Medicaid, would be exempt from the automatic spending cuts associated with sequestration. At this time, we are unable to determine how any Congressional spending cuts will affect Medicare and Medicaid reimbursement in the future. We also cannot predict the initiatives that may be adopted in the future or their full impact. There likely will continue to be legislative and regulatory proposals at the federal and state levels directed at containing or lowering the cost of health care that, if adopted, could potentially have a material adverse effect on our business, financial condition, cash flows, and results of operations.
A failure to accurately estimate incurred but not reported medical care costs may negatively impact our results of operations.
14
Because of the time lag between when medical services are actually rendered by our providers and when we receive, process, and pay a claim for those medical services, we must continually estimate our medical claims liability at particular points in time, and establish claims reserves related to such estimates. Our estimated reserves for such “incurred but not paid,” or IBNP, medical care costs, are based on numerous assumptions. We estimate our medical claims liabilities using actuarial methods based on historical data adjusted for claims receipt and payment experience (and variations in that experience), changes in membership, provider billing practices, health care service utilization trends, cost trends, product mix, seasonality, prior authorization of medical services, benefit changes, known outbreaks of disease or increased incidence of illness such as influenza, provider contract changes, changes to Medicaid fee schedules, and the incidence of high dollar or catastrophic claims. Our ability to accurately estimate claims for our newer lines of business or populations, such as with respect to Medicare Advantageduals, Medicaid expansion members, or aged,
15
blind andor disabled Medicaid members, is impacted by the more limited experience we have had with those populations. Finally, withWith regard to the new previously uninsured Medicaid and CHIP members we expect to enroll in 2011 through organic growth2014 due primarily to the recession,Medicaid expansion, certain new members may be disproportionately costly due to high utilization in their first several months of Medicaid or CHIP membership as a result of their previously having been uninsured and therefore not seeking or deferring medical treatment.
The IBNP estimation methods we use and the resulting reserves that we establish are reviewed and updated, and adjustments, if deemed necessary, are reflected in the current period. Given the numerous uncertainties inherent in such estimates, our actual claims liabilities for a particular quarter or other period could differ significantly from the amounts estimated and reserved for that quarter or period. Our actual claims liabilities have varied and will continue to vary from our estimates, particularly in times of significant changes in utilization, medical cost trends, and populations and markets served.
If our actual liability for claims payments is higher than estimated, our earnings per share in any particular quarter or annual period could be negatively affected. Our estimates of IBNP may be inadequate in the future, which would negatively affect our results of operations for the relevant time period. Furthermore, if we are unable to accurately estimate IBNP, our ability to take timely corrective actions may be limited, further exacerbating the extent of the negative impact on our results.
Our results during 2009 were significantly impacted by the widespread incidence of the H1N1 flu in the states in which we operate our health plans. The recurrence in 2011 ofDuring December 2012 and January 2013, the H1N1 flu, another variantCDC reported that the incidence of the flu ornationwide had been very high and is expected to continue through the outbreak and rapid spread2013 flu season. We have taken steps to appropriately set our IBNP reserves to account for the high incidence of any other highly contagious and potentially virulent disease, could increasethe flu. However, if the utilization rates amongof our members resultingare higher than we anticipated our results in significantly increased outpatient, inpatient, emergency room,the first quarter of 2013 could be materially and pharmacy costs.adversely affected.
If the responsive bids of our health plans for new or renewed Medicaid contracts are not successful, or if our government contracts are terminated or are not renewed, our premium revenues could be materially reduced and our operating results could be negatively impacted.
Our government contracts may be subject to periodic competitive bidding. In such process, our health plans may face competition as other plans, many with greater financial resources and greater name recognition, attempt to enter our markets through the competitive bidding process. For instance, the state contract of our WashingtonFlorida health plan with respect to the Healthy Options program maywill be subject to competitive bidding during 2011 or 2012.in 2013 for a new contract commencing January 1, 2014. In the event the responsive bidsbid of our WashingtonFlorida health plan or those of our other health plans are not successful, we will lose our Medicaid contract in the applicable state, and our premium revenues could be materially reduced as a result. Alternatively, even if our responsive bids are successful, the bids may be based upon assumptions regarding enrollment, utilization, medical costs, or other factors which could result in the Medicaid contract being less profitable than we had expected.
In addition, all of our contracts may be terminated for cause if we breach a material provision of the contract or violate relevant laws or regulations. Our contracts with the states are also subject to cancellation by the state in the event of the unavailability of state or federal funding. In some jurisdictions, such cancellation may be immediate and in other jurisdictions a notice period is required. Further, most of our contracts are terminable without cause.
Our government contracts generally run for periods of one year to three years, and may be successively extended by amendment for additional periods if the relevant state agency so elects. Our current contracts expire on various dates over the next several years. Although our health plans have generally been successful in obtaining the renewaland/or extension of their state contracts, there can be no guarantee that any of our state government contracts will be renewed or extended.extended, as shown by the loss of our Missouri contract in 2012. If we are unable to renew, successfully re-bid, or compete for any of our government contracts, or if any of our contracts are terminated or renewed on less favorable terms, our business, financial condition, cash flows, orand results of operations could be adversely affected.
16
15
California Assembly Bill 97, or AB 97, is legislation that was signed by Governor Jerry Brown on March 24, 2011. Among other things, AB 97 proposes to effect a 10% reduction in Medi-Cal provider rates. It is currently uncertain whether the rate cut will be implemented, and if it is implemented, whether it will be effective retroactively to July 1, 2011. If the proposed rate cut is not finally implemented, if it is not made effective retroactively to July 1, 2011, or if it is otherwise modified from its current form, the results of our Texas, Wisconsin, or California health plan could adverselybe negatively affected depending on the action taken. In addition, recoveries from providers related to any final implemented rate cut could also affect our business, financial condition, cash flows, orthe results of operations.our California health plan.
States may not adequately compensate us for the value of drug rebates that were previously earned by the Company but that are now collectible by the states.
The ACA includes certain provisions that change the way drug rebates are handled for drug claims filled by Medicaid managed care plans. Retroactive to March 23, 2010, state Medicaid programs are now required to collect federal rebates on all Medicaid-covered outpatient drugs dispensed or administered to Medicaid managed care enrollees (excluding certain drugs that are already discounted), and pharmaceutical manufacturers are required to pay specified rebates directly to the state Medicaid programs for those claims. This has impacted the level of rebates received by managed care plans from the manufacturers for Medicaid managed care enrollees. Many manufacturers are in the process ofhave renegotiated or have completed renegotiatingdiscontinued their rebate contracts with Medicaid managed care plans and pharmacy benefits managers to offset these new rebates paid directly to state Medicaid programs. As a result, the drug rebate amounts paid to managed care plans like ours will likely decline significantly incontinue to remain at levels that are much lower than prior to the future.ACA implementation. There are provisions in the ACA that require rates paid to Medicaid managed care to be actuarially sound in regard to drug rebates. Although we will be pursuing rate increases with state agencies to make us whole for the rebate amounts lost, there can be no assurances that the premium increases we may receive, if any, will be adequate to offset the amount of the lost rebates. If such premium increases prove to be inadequate, our business, financial condition, cash flows, orand results of operations could be adversely affected.
We derive our premium revenues from a relatively small number of state health plans.
We currently derive our premium revenues from 10nine state health plans. If we wereare unable to continue to operate in any of those tennine states, or if our current operations in any portion of the states we are in wereare significantly curtailed, our revenues could decrease materially. Our reliance on operations in a limited number of states could cause our revenue and profitability to change suddenly and unexpectedly, depending on an abrupt loss of membership, significant rate reductions, a loss of a material contract, legislative actions, changes in Medicaid eligibility methodologies, catastrophic claims, an epidemic, or an unexpected increase in utilization, general economic conditions, and similar factors in those states. Our inability to continue to operate in any of the states in which we currently operate, or a significant change in the nature of our existing operations, could adversely affect our business, financial condition, cash flows, orand results of operations.
There are performance risks and other risks associated with certain provisions in the state Medicaid contracts of several of our Florida, New Mexico, Ohio, and Texas health plans.
The state contracts of our New Mexico, Ohio, Texas, and TexasWisconsin health plans contain provisions pertaining to at-risk premiums that require us to meet certain quality performance measures to earn all of our contract revenues in those states. In the event we are unsuccessful in achieving the stated performance measure, the health plan will be unable to recognize the revenue associated with that measure. Any failure of our health planplans to satisfy one of these performance measure provisions could adversely affect our business, financial condition, cash flows, orand results of operations.
17
In addition, the state contracts of our California, Florida, New Mexico, Texas, and TexasWashington health plans, and our contract with CMS, contain provisions pertaining to medical cost floors, administrative cost and profit ceilings, and profit-sharing arrangements. These provisions are subject to interpretation and application by our health plans. In the event the applicable state government agency disagrees with our health plan’splan's interpretation or application of the sometimes complicated contract provisions at issue, the health plan could be required to adjust the amount of its obligations under these provisionsand/or make a payment or payments to the state. Any interpretation or application of these provisions at variance with our health plan’splan's interpretation or inconsistent with our revenue recognition accounting treatment could adversely affect our business, financial condition, cash flows, orand results of operations.
Failure to attain profitability in any newstart-up operations could negatively affect our results of operations.
Start-up costs associated with a new business can be substantial. For example, to obtain a certificate of authority to operate as a health maintenance organization in most jurisdictions, we must first establish a provider network, have infrastructure and required systems in place, and demonstrate our ability to obtain a state contract and process claims. Often, we are also required to contribute significant capital to fund mandated net worth requirements, performance bonds or escrows, or contingency guaranties. If we wereare unsuccessful in obtaining the certificate of authority, winning the bid to provide services, or attracting members in sufficient numbers to cover our costs, any new business of ours would fail. We also could be required by the state to continue to provide services for some period of time without sufficient revenue to cover our ongoing costs or to recover our significantstart-up costs.
16
Even if we are successful in establishing a profitable health plan in a new state, increasing membership, revenues, and medical costs will trigger increased mandated net worth requirements which could substantially exceed the net income generated by the health plan. Rapid growth in an existing state will also createresult in increased net worth requirements. In such circumstances, we may not be able to fund on a timely basis or at all the increased net worth requirements with our available cash resources. The expenses associated with starting up a health plan in a new state or expanding a health plan in an existing state could have an adverse impact on our business, financial condition, cash flows, orand results of operations.
Receipt of inadequate or significantly delayed premiums could negatively affect our business, financial condition, cash flows, orand results of operations.
Our premium revenues consist of fixed monthly payments per member, and supplemental payments for other services such as maternity deliveries. These premiums are fixed by contract, and we are obligated during the contract periods to provide health care services as established by the state governments. We use a large portion of our revenues to pay the costs of health care services delivered to our members. If premiums do not increase when expenses related to medical services rise, our medical margins will be compressed, and our earnings will be negatively affected. A state could increase hospital or other provider rates without making a commensurate increase in the rates paid to us, or could lower our rates without making a commensurate reduction in the rates paid to hospitals or other providers. In addition, if the actuarial assumptions made by a state in implementing a rate or benefit change are incorrect or are at variance with the particular utilization patterns of the members of one of our health plans, our medical margins could be reduced. Any of these rate adjustments in one or more of the states in which we operate could adversely affect our business, financial condition, cash flows, orand results of operations.
Furthermore, a state undergoing a budget crisis may significantly delay the premiums paid to one of our health plans. During 2010,For instance, due to a prolonged budget impasse during 2010, some of the monthly premium payments made by the state of California to our California health plan were several months late. Any significant delay in the monthly payment of premiums to any of our health plans could have a material adverse affect on our business, financial condition, cash flows, orand results of operations.
Difficulties in executing our acquisition strategy could adversely affect our business.
The acquisitions of other health plans and the assignment and assumption of Medicaid contract rights of other health plans have accounted for a significant amount of our growth over the last several years. Although we cannot predict with certainty our rate of growth as the result of acquisitions, we believe that additional acquisitions of all sizes will be important to our future growth strategy. Many of the other potential purchasers of these assets — particularlyassets-particularly operators of large commercial health plans — haveplans-have significantly greater financial resources than we do.
18
Also, many of the sellers may insist on selling assets that we do not want, such as commercial lines of business, or may insist on transferring their liabilities to us as part of the sale of their companies or assets. Even if we identify suitable targets, we may be unable to complete acquisitions on terms favorable to us or obtain the necessary financing for these acquisitions. For these reasons, among others, we cannot provide assurance that we will be able to complete favorable acquisitions, especially in light of the volatility in the capital markets over the past several years. Further, to the extent we complete an acquisition, we may be unable to realize the anticipated benefits from such acquisition because of operational factors or difficulty in integrating the acquisition with our existing business. This may include problems involving the integration of:
additional employees who are not familiar with our operations or our corporate culture,
new provider networks which may operate on terms different from our existing networks, additional members who may decide to transfer to other health care providers or health plans, disparate information, claims processing, and record-keeping systems, internal controls and accounting policies, including those which require the exercise of judgment and complex estimation processes, such as estimates of claims incurred but not paid, accounting for goodwill, intangible assets, stock-based compensation, and income tax matters, and new regulatory schemes, relationships, practices, and compliance requirements. |
Also, we are generally required to obtain regulatory approval from one or more state agencies when making acquisitions of health plans. In the case of an acquisition of a business located in a state in which we do not already operate, we would be required to obtain the necessary licenses to operate in that state. In addition, although we may already operate in a state in which we acquire a new business, we would be required to obtain regulatory approval if, as a result of the acquisition, we will operate in an area of that state in which we did not operate previously. Furthermore, we may be required to renegotiate contracts with the network providers of the acquired business. We may be unable to obtain the necessary governmental approvals, or comply with these regulatory requirements or renegotiate the necessary provider contracts in a timely manner, if at all.
In addition, we may be unable to successfully identify, consummate and integrate future acquisitions, including integrating the acquired businesses on our information technology platform, or to implement our operations strategy in order to operate
17
acquired businesses profitably. Furthermore, we may incur significant transaction expenses in connection with a potential acquisition which may or may not be consummated. These expenses could impact our selling, general and administrative expense ratio.
For all of the above reasons, we may not be able to consummate our proposed acquisitions as announced from time to time to sustain our pattern of growth or to realize benefits from completed acquisitions.
We face periodic routine and non-routine reviews, audits, and investigations by government agencies, and these reviews and audits could have adverse findings, which could negatively impact our business.
We are subject to various routine and non-routine governmental reviews, audits, and investigations. Violation of the laws, regulations, or contract provisions governing our operations, or changes in interpretations of those laws and regulations, could result in the imposition of civil or criminal penalties, the cancellation of our contracts to provide managed care services, the suspension or revocation of our licenses, the exclusion from participation in government sponsored health programs, or the revision and recoupment of past payments made based on audit findings. For example, from July 26 to July 30, 2010, the Center for Medicare and Medicaid Services, or CMS, conducted anon-site audit with respect to our Medicare Advantage and Prescription Drug Plan contracts in the compliance areas of prescription drug formulary administration, prescription drug coverage determinations and appeals, prescription drug grievances, enrollment and disenrollment, premium billing, and an evaluation of whether we had implemented an effective compliance program. On February 25, 2011, we received from CMS the audit and inspection report. The report provides that we will be given until April 26, 2011 to develop and implement a corrective action plan to correct the deficiencies noted in the report and to demonstrate to CMS that the underlying deficiencies have been corrected and are not likely to recur. If we are unable to correct theany noted deficiencies, or become subject to material fines or other sanctions, whether as a result of this most recent CMS audit or otherwise, we might suffer a substantial reduction in profitability, and might also lose one or more of our government contracts and as a result lose significant numbers of members and amounts of revenue. In addition, government receivables are subject to government audit and negotiation, and government contracts are vulnerable to disagreements with the government. The final amounts we ultimately receive under government contracts may be different from the amounts we initially recognize in our financial statements.
We rely on the accuracy of eligibility lists provided by state governments. Inaccuracies in those lists would negatively affect our results of operations.
Premium payments to our health plan segment are based upon eligibility lists produced by state governments. From time to time, states require us to reimburse them for premiums paid to us based on an eligibility list that a state later discovers contains individuals who are not in fact eligible for a government sponsored program or are eligible for a different premium category or a different program. Alternatively, a state could fail to pay us for members for
19
whom we are entitled to payment. Our results of operations would be adversely affected as a result of such reimbursement to the state if we hadmake or have made related payments to providers and wereare unable to recoup such payments from the providers.
We are subject to extensive fraud and abuse laws which may give rise to lawsuits and claims against us, the outcome of which may have a material adverse effect on our financial position, results of operations, and cash flows.
Because we receive payments from federal and state governmental agencies, we are subject to various laws commonly referred to as “fraud and abuse” laws, including the federal False Claims Act, which permit agencies and enforcement authorities to institute suit against us for violations and, in some cases, to seek treble damages, penalties, and assessments. Liability under such federal and state statutes and regulations may arise if we know, or it is found that we should have known, that information we provide to form the basis for a claim for government payment is false or fraudulent, and some courts have permitted False Claims Act suits to proceed if the claimant was out of compliance with program requirements.Qui tamactions under federal and state law can be brought by any individual on behalf of the government.Qui tamactions have increased significantly in recent years, causing greater numbers of health care companies to have to defend a false claim action, pay fines, or be excluded from the Medicare, Medicaid, or other state or federal health care programs as a result of an investigation arising out of such action. Many states, including states where we currently operate, have enacted parallel legislation. In the event we are subject to liability under aqui tamaction, our business and operating results could be adversely affected.
Our business could be adversely impacted by adoption of the new ICD-10 standardized coding set for diagnoses.
The U.S. Department of Health and Human Services, or HHS, has released rules pursuant to HIPAA which mandate the use of standard formats in electronic health care transactions. HHS also has published rules requiring the use of standardized code sets and unique identifiers for providers. By October 2013,Originally, the federal government will requirerequired that health care organizations, including health insurers, upgrade to updated and expanded standardized code sets used for documenting health conditions.conditions by October 2013. These new standardized code sets, known as ICD-10, will require substantial investments from health care organizations, including us. However, CMS has now postponed implementation of ICD-10 to October 2014. While use of the ICD-10 code sets will require significant administrative changes, we believe that the cost of compliance with these regulations has not had and is not expected to have a material adverse effect on our cash flows, financial position, or results of operations. However, these changes may result in errors and otherwise negatively impact our service levels, and we may experience complications related to supporting customers that are not fully compliant with the revised requirements as of the applicable compliance date. Furthermore, if physicians fail to provide appropriate codes for services provided as a result of the new coding set, we may not be reimbursed, or adequately reimbursed, for such services.
20
If we are unable to deliver quality care, maintain good relations with the physicians, hospitals, and other providers with whom we contract, or if we are unable to enter into cost-effective contracts with such providers, our profitability could be adversely affected.
18
We contract with physicians, hospitals, and other providers as a means to ensure access to health care services for our members, to manage health care costs and utilization, and to better monitor the quality of care being delivered. We compete with other health plans to contract with these providers. We believe providers select plans in which they participate based on criteria including reimbursement rates, timeliness and accuracy of claims payment, potential to deliver new patient volumeand/or retain existing patients, effectiveness of resolution of calls and complaints, and other factors. We cannot be sure that we will be able to successfully attract and retain providers to maintain a competitive network in the geographic areas we serve. In addition, in any particular market, providers could refuse to contract with us, demand higher payments, or take other actions which could result in higher health care costs, disruption to provider access for current members, a decline in our growth rate, or difficulty in meeting regulatory or accreditation requirements.
The Medicaid program generally pays doctors and hospitals at levels well below those of Medicare and private insurance. Large numbers of doctors, therefore, do not accept Medicaid patients. In the face of fiscal pressures, some states may reduce rates paid to providers, which may further discourage participation in the Medicaid program.
In some markets, certain providers, particularly hospitals, physician/hospital organizations, and some specialists, may have significant market positions or even monopolies. If these providers refuse to contract with us or utilize their market position to negotiate favorable contracts which are disadvantageous to us, our profitability in those areas could be adversely affected.
Some providers that render services to our members are not contracted with our plans. In those cases, there is no pre-established understanding between the provider and our plan about the amount of compensation that is due to the provider. In some states, the amount of compensation is defined by law or regulation, but in most instances it is either not defined or it is established by a standard that is not clearly translatable into dollar terms. In such instances, providers may believe they are underpaid for their services and may either litigate or arbitrate their dispute with our plan. The uncertainty of the amount to pay and the possibility of subsequent adjustment of the payment could adversely affect our business, financial position, cash flows, orand results of operations.
The insolvency of a delegated provider could obligate us to pay theirits referral claims, which could have an adverse effect on our business, cash flows, orand results of operations.
Circumstances may arise where providers to whom we have delegated risk, due to insolvency or other circumstances, are unable to pay claims they have incurred with third parties in connection with referral services provided to our members. The inability of delegated providers to pay referral claims presents us with both immediate financial risk and potential disruption to member care. Depending on states’states' laws, we may be held liable for such unpaid referral claims even though the delegated provider has contractually assumed such risk. Additionally, competitive pressures may force us to pay such claims even when we have no legal obligation to do so or we have already paid claims to a delegated provider and payments cannot be recouped ifwhen the delegated provider becomes insolvent. To reduce the risk that delegated providers are unable to pay referral claims, we monitor the operational and financial performance of such providers. We also maintain contingency plans that include transferring members to other providers in response to potential network instability. In certain instances, we have required providers to place funds on deposit with us as protection against their potential insolvency. These funds are frequently in the form of segregated funds received from the provider and held by us or placed in a third-party financial institution. These funds may be used to pay claims that are the financial responsibility of the provider in the event the provider is unable to meet these obligations. However, there can be no assurances that these precautionary steps will fully protect us against the insolvency of a delegated provider. Liabilities incurred or losses suffered as a result of provider insolvency could have an adverse effect on our business, financial condition, cash flows, orand results of operations.
21
Regulatory actions and negative publicity regarding Medicaid managed care and Medicare Advantage may lead to programmatic changes and intensified regulatory scrutiny and regulatory burdens.
Several of our health care competitors have recently been involved in governmental investigations and regulatory actions which have resulted in significant volatility in the price of their stock. In addition, there has been negative publicity and proposed programmatic changes regarding Medicare Advantage privatefee-for-service plans, a part of the Medicare Advantage program in which the Company doeswe do not participate. These actions and the resulting negative publicity could become associated with or imputed to the Company,us, regardless of the Company’sour actual regulatory compliance or programmatic participation. Such an association, as well as any perception of a recurring pattern of abuse among the health plan participants in government programs and the diminished reputation of the managed care sector as a whole, could result in public distrust, political pressure for changes in the programs in which the Company doeswe do participate, intensified scrutiny by regulators, additional regulatory requirements and burdens, increased stock volatility due to speculative trading, and heightened barriers to new managed care markets and contracts, all of which could have a material adverse effect on our business, financial condition, cash flows, orand results of operations.
If a state fails to renew its federal waiver application for mandated Medicaid enrollment into managed care or such application is denied, our membership in that state will likely decrease.
19
States may only mandate Medicaid enrollment into managed care under federal waivers or demonstrations. Waivers and programs under demonstrations are approved for two- to five-year periods and can be renewed on an ongoing basis if the state applies and the waiver request is approved or renewed by CMS. We have no control over this renewal process. If a state does not renew its mandated program or the federal government denies the state’sstate's application for renewal, our business would suffer as a result of a likely decrease in membership.
If state regulators do not approve payments of dividends and distributions by our subsidiaries, it may negatively affect our business strategy.
We are a corporate parent holding company and hold most of our assets at, and conduct most of our operations through, direct subsidiaries. As a holding company, our results of operations depend on the results of operations of our subsidiaries. Moreover, we are dependent on dividends or other intercompanyinter-company transfers of funds from our subsidiaries to meet our debt service and other obligations. The ability of our subsidiaries to pay dividends or make other payments or advances to us will depend on their operating results and will be subject to applicable laws and restrictions contained in agreements governing the debt of such subsidiaries. In addition, our health plan subsidiaries are subject to laws and regulations that limit the amount of dividends and distributions that they can pay to us without prior approval of, or notification to, state regulators. In California, our health plan may dividend, without notice to or approval of the California Department of Managed Health Care, amounts by which its tangible net equity exceeds 130% of the tangible net equity requirement. Our other health plans must give thirty days’days' advance notice and the opportunity to disapprove “extraordinary” dividends to the respective state departments of insurance for amounts over the lesser of (a) ten percent of surplus or net worth at the prior year end or (b) the net income for the prior year. The discretion of the state regulators, if any, in approving or disapproving a dividend is not clearly defined. Health plans that declare non-extraordinaryordinary dividends must usually provide notice to the regulators ten or fifteen days in advance of the intended distribution date of the non-extraordinaryordinary dividend. For the years ended December 31, 2012, 2011 and 2010, we received dividends from our health plan subsidiaries amounting to $80.0 million, $76.6 million and $81.3 million, respectively. The aggregate additional amounts our health plan subsidiaries could have paid us at December 31, 2010, 2009,2012, 2011 and 20082010, without approval of the regulatory authorities, were approximately $18.8$8.1 million, $9.0$17.5 million, and $7.6$18.8 million, respectively. If the regulators were to deny or significantly restrict our subsidiaries’subsidiaries' requests to pay dividends to us, the funds available to our company as a whole would be limited, which could harm our ability to implement our business strategy. For example, we could be hindered instrategy or service our ability to make debt service payments under our credit facilityand/or our convertible senior notes.outstanding indebtedness.
Unforeseen changes in pharmaceutical regulations or market conditions may impact our revenues and adversely affect our results of operations.
A significant category of our health care costs relate to pharmaceutical products and services. Evolving regulations and state and federal mandates regarding coverage may impact the ability of our health plans to continue to receive existing price discounts on pharmaceutical products for our members. Other factors affecting our pharmaceutical costs include, but are not limited to, the price of pharmaceuticals, geographic variation in utilization
22
of new and existing pharmaceuticals, and changes in discounts. The unpredictable nature of these factors may have an adverse effect on our business, financial condition, cash flows, orand results of operations.
As part of our normal operations, we collect, process, and retain confidential member information. We are subject to various federal and state laws and rules regarding the use and disclosure of confidential member information, including HIPAA and the Gramm-Leach-Bliley Act. The Health Information Technology for Economic and Clinical Health Act, or HITECH, provisions of the ARRAHITECH American Reinvestment and Recovery Act of 2009 further expand the coverage of HIPAA by, among other things, extending the privacy and security provisions, mandating new regulations around electronic medical records, expanding enforcement mechanisms, allowing the state Attorneys General to bring enforcement actions, increasing penalties for violations, and requiring public disclosure of improper disclosures of the health information of more than 500 individuals.
Under ARRA,HITECH, civil penalties for HIPAA violations by covered entities and business associates are increased up to an annual maximumamount of $1.5 million per calendar year for uncorrected violations based on willful neglect.HIPAA violations. In addition, imposition of these penalties is now more likely because ARRAHITECH strengthens enforcement. For example, commencing February 2010, HHS was required to conduct periodic audits to confirm compliance. Investigations of violations that indicate willful neglect, for which penalties are now mandatory, beginning in February 2011, are statutorily required. In addition, state attorneys general are authorized to bring civil actions seeking either injunctions or damages in response to violations of HIPAA privacy and security regulations that threaten the privacy of state residents. Initially monies collected will be transferred to a division of HHS for further enforcement, and within three years, a methodology will be adopted for distributing a percentage of those monies to affected individuals to fund enforcement and provide incentive for individuals to report violations. In addition, ARRAHITECH requires us to notify affected individuals, HHS, and in some cases the media when unsecured personalprotected health information is subject to a security breach.
20
to us directly, states wishing to apply for grants under ARRA,HITECH, or otherwise participating in such programs, may impose new health care technology requirements on us through our contracts with state Medicaid agencies. We are unable to predict what such requirements may entail or what their effect on our business may be.
We will continue to assess our compliance obligations as regulations under ARRAHITECH are promulgated and more guidance becomes available from HHS and other federal agencies. The new privacy and security requirements, however, may require substantial operational and systems changes, employee education and resources and there is no guarantee that we be able to implement them adequately or prior to their effective date. Given HIPAA’sHIPAA's complexity and the anticipated new regulations, which may be subject to changing and perhaps conflicting interpretation, our ongoing ability to comply with all of the HIPAA requirements is uncertain, which may expose us to the criminal and increased civil penalties provided under ARRAHITECH and may require us to incur significant costs in order to seek to comply with its requirements.
While we currently expend significant resources and have implemented solutions, processes and procedures to protect against cyber-attacks and security breaches and have no evidence to suggest that such attacks have resulted in a breach of our systems, we may need to expend additional significant resources in the future to continue to protect against potential security breaches or to address problems caused by such attacks or any breach of our systems. Because the techniques used to circumvent security systems can be highly sophisticated and change frequently, often are not recognized until launched against a target, and may originate from less regulated and remote areas around the world, we may be unable to proactively address these techniques or to implement adequate preventive measures.
Despite the security measures we have in place to ensure compliance with applicable laws and rules, our facilities and systems, and those of our third-party service providers, may be vulnerable to security breaches, acts of vandalism, acts of malicious insiders, computer viruses, misplaced or lost data, programmingand/or human errors, or other similar events. Any security breach involving the misappropriation, loss or other unauthorized disclosure or use of confidential member information, whether by us or a third party, could subject us to civil and criminal penalties, divert management's time and energy and have a material adverse effect on our business, financial condition, cash flows, or results of operations.
Risks Related to the Operation of Our Molina Medicaid Solutions Business
23
We may be unable to retain or renew the state government contracts of the Molina Medicaid Solutions segment on terms consistent with our expectations or at all.
Molina Medicaid Solutions currently has management contracts in only six states. If we are unable to continue to operate in any of those six states, or if our current operations in any of those six states wereare significantly curtailed, the revenues and cash flows of Molina Medicaid Solutions could decrease materially, and as a result our profitability would be negatively impacted.
If the responsive bids to RFPs of Molina Medicaid Solutions are not successful, including its responsive bid in Louisiana during 2011, our revenues could be materially reduced and our operating results could be negatively impacted.
The government contracts of Molina Medicaid Solutions may be subject to periodic competitive bidding. In such process, Molina Medicaid Solutions may face competition as other service providers, some with much greater financial resources and greater name recognition, attempt to enter our markets through the competitive bidding process. For instance, in 2012, the state MMISgovernment contract of Molina Medicaid Solutions in Louisiana is currentlywas subject to competitive bidding.bidding, and we were unsuccessful in being awarded a new contract. Molina Medicaid Solutions also anticipates bidding in other states which have issued RFPs for procurement of a new MMIS. In the event the responsive bid in Louisiana is not successful, we will lose our fiscal agent contract in that state, and our revenues could be materially reduced as a result. In addition, in the event our responsive bids in other states are not successful, we will be unable to grow in a manner consistent with our projections. Even if our responsive bids are successful, the bids may be based upon assumptions or other factors which could result in the contract being less profitable than we had expected or had been the case prior to competitive re-bidding.
Because of the complexity and duration of the services and systems required to be delivered under the government contracts of Molina Medicaid Solutions, there are substantial risks associated with full performance under the contracts.
The state contracts of Molina Medicaid Solutions typically require significant investment in the early stages that is expected to be recovered through billings over the life of the contracts. These contracts involve the construction of new computer systems and communications networks and the development and deployment of complex technologies. Substantial performance risk exists under each contract. Some or all elements of service delivery under these contracts are dependent upon successful completion of the design, development, construction, and implementation phases. Any increased or unexpected costs or unanticipated delays in connection with the performance of these contracts, including delays caused by factors outside our control, could make these contracts less profitable or unprofitable, which could have an adverse effect on our overall business, financial condition, cash flows, orand results of operations.
24
If we fail to comply with our state government contracts or government contracting regulations, our business may be adversely affected.
21
Molina Medicaid Solutions’Solutions' contracts with state government customers may include unique and specialized performance requirements. In particular, contracts with state government customers are subject to various procurement regulations, contract provisions, and other requirements relating to their formation, administration, and performance. Any failure to comply with the specific provisions in our customer contracts or any violation of government contracting regulations could result in the imposition of various civil and criminal penalties, which may include termination of the contracts, forfeiture of profits, suspension of payments, imposition of fines, and suspension from future government contracting. Further, any negative publicity related to our state government contracts or any proceedings surrounding them may damage our business by affecting our ability to compete for new contracts. The termination of a state government contract, our suspension from government work, or any negative impact on our ability to compete for new contracts, could have an adverse effect on our business, financial condition, cash flows, orand results of operations.
System security risks and systems integration issues that disrupt our internal operations or information technology services provided to customers could adversely affect our financial results orand damage our reputation.
Experienced computer programmers and hackers may be able to penetrate our network security and misappropriate our confidential information or that of third parties, create system disruptions, or cause shutdowns. Computer programmers and hackers also may be able to develop and deploy viruses, worms, and other malicious software programs that attack our products or otherwise exploit any security vulnerabilities of our products. In addition, sophisticated hardware and operating system software and applications that we produce or procure from third parties may contain defects in design or manufacture, including “bugs” and other problems that could unexpectedly interfere with the operation of the system. The costs to us to eliminate or alleviate security problems, bugs, viruses, worms, malicious software programs and security vulnerabilities could be significant, and the efforts to address these problems could result in interruptions, delays, cessation of service, and loss of existing or potential government customers.
Molina Medicaid Solutions routinely processes, stores, and transmits large amounts of data for our clients, including sensitive and personally identifiable information. Breaches of our security measures could expose us, our customers, or the individuals affected to a risk of loss or misuse of this information, resulting in litigation and potential liability for us and damage to our brand and reputation. Accordingly, we could lose existing or potential government customers for outsourcing services or other information technology solutions or incur significant expenses in connection with our customers’customers' system failures or any actual or perceived security vulnerabilities in our products. In addition, the cost and operational consequences of implementing further data protection measures could be significant.
Portions of our information technology infrastructure also may experience interruptions, delays, or cessations of service or produce errors in connection with systems integration or migration work that takes place from time to time. We may not be successful in implementing new systems and transitioning data, which could cause business disruptions and be more expensive, time consuming, disruptive, and resource-intensive. Such disruptions could adversely impact our ability to fulfill orders and interrupt other processes. Delayed sales, lower margins, or lost government customers resulting from these disruptions could adversely affect our financial results, reputation, and stock price.
In the course of providing services to customers, Molina Medicaid Solutions may inadvertently infringe on the intellectual property rights of others and be exposed to claims for damages.
The solutions we provide to our state government customers may inadvertently infringe on the intellectual property rights of third parties resulting in claims for damages against us. The expense and time of defending against these claims may have a material and adverse impact on our profitability. Additionally, the publicity we may receive as a result of infringing intellectual property rights may damage our reputation and adversely impact our ability to develop new MMIS business.
25
Inherent in the government contracting process are various risks which may materially and adversely affect our business and profitability.
We are subject to the risks inherent in the government contracting process. These risks include government audits of billable contract costs and reimbursable expenses and compliance with government reporting requirements. In the event we are found to be out of compliance with government contracting requirements, our reputation may be adversely impacted and our relationship with the government agencies we work with may be damaged, resulting in a material and adverse effect on our profitability.
Our performance on contracts, including those on which we have partnered with third parties, may be adversely affected if we or the third parties fail to deliver on commitments.
In some instances, our contracts require that we partner with other parties including software and hardware vendors to provide the complex solutions required by our state government customers. Our ability to deliver the solutions and provide the services required by our customers is dependent on our and our partners’partners' ability to meet our customers’customers' delivery schedules. If we or our partners fail to deliver services or products on time, our ability to complete the contract may be adversely affected, which may have a material and adverse impact on our revenue and profitability.
22
Risks Related to our General Business Operations
Ineffective management of our growth may negatively affect our business, financial condition, orand results of operations.
Depending on acquisitions and other opportunities, we expect to continue to grow our membership and to expand into other markets. In fiscal year 2006, we had total premium revenue of $2.0 billion. In fiscal year 2010, we had total premium revenue of $4.0 billion, an increase of 100% over a five-year span. Continued rapid growth could place a significant strain on our management and on other Company resources. Our ability to manage our growth may depend on our ability to strengthen our management team and attract, train, and retain skilled employees, and our ability to implement and improve operational, financial, and management information systems on a timely basis. If we are unable to manage our growth effectively, our business, financial condition, cash flows, and results of operations could be materially and adversely affected. In addition, due to the initial substantial costs related to acquisitions, rapid growth could adversely affect our short-term profitability and liquidity.
Any changes to the laws and regulations governing our business, or the interpretation and enforcement of those laws or regulations, could cause us to modify our operations and could negatively impact our operating results.
Our business is extensively regulated by the federal government and the states in which we operate. The laws and regulations governing our operations are generally intended to benefit and protect health plan members and providers rather than managed care organizations. The government agencies administering these laws and regulations have broad latitude in interpreting and applying them. These laws and regulations, along with the terms of our government contracts, regulate how we do business, what services we offer, and how we interact with
26
members and the public. For instance, some states mandate minimum medical expense levels as a percentage of premium revenues. These laws and regulations, and their interpretations, are subject to frequent change. The interpretation of certain contract provisions by our governmental regulators may also change. Changes in existing laws or regulations, or their interpretations, or the enactment of new laws or regulations, could reduce our profitability by imposing additional capital requirements, increasing our liability, increasing our administrative and other costs, increasing mandated benefits, forcing us to restructure our relationships with providers, or requiring us to implement additional or different programs and systems. Changes in the interpretation of our contracts could also reduce our profitability if we have detrimentally relied on a prior interpretation.
Our business depends on our information and medical management systems, and our inability to effectively integrate, manage, and keep secure our information and medical management systems, could disrupt our operations.
Our business is dependent on effective and secure information systems that assist us in, among other things, processing provider claims, monitoring utilization and other cost factors, supporting our medical management techniques, and providing data to our regulators. Our providers also depend upon our information systems for membership verifications, claims status, and other information. If we experience a reduction in the performance, reliability, or availability of our information and medical management systems, our operations, ability to pay claims, and ability to produce timely and accurate reports could be adversely affected. In addition, if the licensor or vendor of any software which is integral to our operations were to become insolvent or otherwise fail to support the software sufficiently, our operations could be negatively affected.
Our information systems and applications require continual maintenance, upgrading, and enhancement to meet our operational needs. Moreover, our acquisition activity requires transitions to or from, and the integration of, various information systems. If we experience difficulties with the transition to or from information systems or are unable to properly implement, maintain, upgrade or expand our system, we could suffer from, among other things, operational disruptions, loss of members, difficulty in attracting new members, regulatory problems, and increases in administrative expenses.
Our business requires the secure transmission of confidential information over public networks. Advances in computer capabilities, new discoveries in the field of cryptography, or other events or developments could result in compromises or breaches of our security systems and member data stored in our information systems. Anyone who circumvents our security measures could misappropriate our confidential information or cause interruptions in services or operations. The internet is a public network, and data is sent over this network from many sources. In the past, computer viruses or software programs that disable or impair computers have been distributed and have rapidly spread over the internet. Computer viruses could be introduced into our systems, or those of our providers or regulators, which could disrupt our operations, or make our systems inaccessible to our members, providers, or regulators. We may be required to expend significant capital and other resources to protect against the threat of security breaches or to alleviate problems caused by breaches. Because of the confidential health information we store and transmit, security breaches could expose us to a risk of regulatory action, litigation, possible liability, and loss. Our security measures may be inadequate to prevent security breaches, and our business operations would be negatively impacted by cancellation of contracts and loss of members if security breaches are not prevented.
Because our corporate headquarters are located in Southern California, our business operations may be significantly disrupted as a result of a major earthquake.
Our corporate headquarters is located in Long Beach, California. In addition, the claims of our health plans are also processed in Long Beach. Southern California is exposed to a statistically greater risk of a major earthquake than most other parts of the United States. If a major earthquake were to strike the Los Angeles area, our corporate functions and claims processing could be
23
significantly impaired for a substantial period of time. Although we have established a disaster recovery and business resumption plan withback-up operating sites to be deployed in the case of such a major disruptive event, there can be no assurances that the disaster recovery plan will be successful or that the business operations of all our health plans, including those that are remote from any such event, would not be substantially impacted by a major Southern California earthquake.
27
We face claims related to litigation which could result in substantial monetary damages.
We are subject to a variety of legal actions, including medical malpractice actions, provider disputes, employment related disputes, and breach of contract actions. In the event we incur liability materially in excess of the amount for which we have insurance coverage, our profitability would suffer. In addition, our providers involved in medical care decisions are exposed to the risk of medical malpractice claims. Providers at our 16 primary care clinics in California and two in Washington are employees of our health plans. As a directan employer of physicians and ancillary medical personnel and as an operator of primary care clinics, our plans are subject to liability for negligent acts, omissions, or injuries occurring at one of itstheir clinics or caused by one of their employees. We maintain medical malpractice insurance for our clinics asin an amount which we believe areto be reasonable in light of our experience to date. However, given the significant amount of some medical malpractice awards and settlements, this insurance may not be sufficient or available at a reasonable cost to protect us from damage awards or other liabilities. Even if any claims brought against us wereare unsuccessful or without merit, we wouldmay have to defend ourselves against such claims. The defense of any such actions may be time-consuming and costly, and may distract our management’smanagement's attention. As a result, we may incur significant expenses and may be unable to effectively operate our business.
Furthermore, claimants often sue managed care organizations for improper denials of or delays in care, and in some instances improper authorizations of care. Claims of this nature could result in substantial damage awards against us and our providers that could exceed the limits of any applicable medical malpractice insurance coverage. Successful malpractice or tort claims asserted against us, our providers, or our employees could adversely affect our financial condition and profitability.
We cannot predict the outcome of any lawsuit with certainty. While we currently have insurance coverage for some of the potential liabilities relating to litigation, other such liabilities may not be covered by insurance, the insurers could dispute coverage, or the amount of insurance could be insufficient to cover the damages awarded. In addition, insurance coverage for all or certain types of liability may become unavailable or prohibitively expensive in the future or the deductible on any such insurance coverage could be set at a level which would result in us effectively self-insuring cases against us.
Although we establish reserves for litigation as we believe appropriate, we cannot assure youprovide assurance that our recorded reserves will be adequate to cover such costs. Therefore, the litigation to which we are subject could have a material adverse effect on our business, financial condition, cash flows, orand results of operations, and could prompt us to change our operating procedures.
We are subject to competition which negatively impacts our ability to increase penetration in the markets we serve.
serve and could result in the loss of members to other health plans.
We operate in a highly competitive environment and in an industry that is subject to ongoing changes from business consolidations, new strategic alliances, and aggressive marketing practices by other managed care organizations. We compete for members principally on the basis of size, location, and quality of provider network, benefits supplied, quality of service, and reputation. A number of these competitive elements are partially dependent upon and can be positively affected by the financial resources available to a health plan. Many other organizations with which we compete, including large commercial plans, have substantially greater financial and other resources than we do. For these reasons, we may be unable to grow our membership, or may lose members to other health plans.
Failure to maintain effective internal controls over financial reporting could have a material adverse effect on our business, operating results, and stock price.
The Sarbanes-Oxley Act of 2002 requires, among other things, that we maintain effective internal controlcontrols over financial reporting. In particular, we must perform system and process evaluation and testing of our internal controls over financial reporting to allow management to report on, and our independent registered public accounting firm to attest to, our internal controls over financial reporting as required by Section 404 of the Sarbanes-Oxley Act of 2002. Our future testing, or the subsequent testing by our independent registered public accounting firm, may reveal deficiencies in our internal controls over financial reporting that are deemed to be material weaknesses. Our compliance with Section 404 will continue to require that we incur substantial accounting expense and expend significant management time and effort. Moreover, if we are not able to continue to comply with the requirements of Section 404 in a timely manner, or if we or our independent registered public accounting firm identifies deficiencies
28
in our internal control over financial reporting that are deemed to be material weaknesses, the market price of our stock could decline and we could be subject to sanctions or investigations by the NYSE,New York Stock Exchange, SEC, or other regulatory authorities, which would require additional financial and management resources.
Changes in accounting may affect our results of operations.
24
U.S. generally accepted accounting principles (“GAAP”) and related implementation guidelines and interpretations can be highly complex and involve subjective judgments. Changes in these rules or their interpretation, or the adoption of new pronouncements could significantly affect our stated results of operations.
The value of our investments is influenced by varying economic and market conditions, and a decrease in value could have an adverse effect on our results of operations, liquidity, and financial condition.
Our investments consist solely of investment-grade debt securities. The unrestricted portion of this portfolio is designated asavailable-for-sale. Our non-current restricted investments are designated asheld-to-maturity.Available-for-sale held-to-maturity. Available-for-sale investments are carried at fair value, and the unrealized gains or losses are included in accumulated other comprehensive income or loss as a separate component of stockholders’stockholders' equity, unless the decline in value is deemed to beother-than-temporary and we do not have the intent and ability to hold such securities until their full cost can be recovered. For ouravailable-for-sale investments andheld-to-maturity investments, if a decline in value is deemed to beother-than-temporary and we do not have the intent and ability to hold such security until its full cost can be recovered, the security is deemed to beother-than-temporarily impaired and it is written down to fair value and the loss is recorded as an expense.
In accordance with applicable accounting standards, we review our investment securities to determine if declines in fair value below cost areother-than-temporary. This review is subjective and requires a high degree of judgment. We conduct this review on a quarterly basis, using both quantitative and qualitative factors, to determine whether a decline in value isother-than-temporary. Such factors considered include the length of time and the extent to which market value has been less than cost, the financial condition and near term prospects of the issuer, recommendations of investment advisors, and forecasts of economic, market or industry trends. This review process also entails an evaluation of our ability and intent to hold individual securities until they mature or full cost can be recovered.
The current economic environment and recent volatility of the securities markets increase the difficulty of assessing investment impairment and the same influences tend to increase the risk of potential impairment of these assets. Over time, the economic and market environment may provide additional insight regarding the fair value of certain securities, which could change our judgment regarding impairment. This could result in realized losses relating toother-than-temporary declines to be recorded as an expense. Given the current market conditions and the significant judgments involved, there is continuing risk that declines in fair value may occur and materialother-than-temporary impairments may result in realized losses in future periods which could have an adverse effect on our business, financial condition, cash flows, orand results of operations.
29
Unanticipated changes in our tax rates or exposure to additional income tax liabilities could affect our profitability.
We are subject to income taxes in the United States. Our effective tax rate could be adversely affected by changes in the mix of earnings in states with different statutory tax rates, changes in the valuation of deferred tax assets and liabilities, changes in U.S. tax laws and regulations, and changes in our interpretations of tax laws, including pending tax law changes.changes, such as the ACA excise tax discussed above. In addition, we are subject to the routine examination of our income tax returns by the Internal Revenue Service and other local and state tax authorities. We regularly assess the likelihood of outcomes resulting from these examinations to determine the adequacy of our estimated income tax liabilities. Adverse outcomes from tax examinations or the accounting reversal of any tax benefits or revenue previously recognized by us, could have an adverse effect on our provision for income taxes, estimated income tax liabilities, orand results of operations.
We are dependent on our executive officers and other key employees.
Our operations are highly dependent on the efforts of our executive officers. The loss of their leadership, knowledge, and experience could negatively impact our operations. Replacing many of our executive officers might be difficult or take an extended period of time because a limited number of individuals in the managed care industry have the breadth and depth of skills and experience necessary to operate and expand successfully a business such as ours. Our success is also dependent on our ability to hire and retain qualified management, technical, and medical personnel. We may beIt is critical that we recruit, manage, enable, and retain talent to successfully execute our strategic objections which requires aligned policies, a positive work environment, and a robust succession and talent development process. Further, particularly in light of the changing health care environment, we must focus on building employee capabilities to help ensure that we can meet upcoming challenges and opportunities. If we are unsuccessful in recruiting, retaining, managing, and retainingenabling such personnel whichand are unable to meet upcoming challenges and opportunities, our operations could be negatively impacted.
We are subject to risks associated with outsourcing services and functions to third parties.
We contract with independent third party vendors and service providers who provide services to us and our subsidiaries or to whom we delegate selected functions. Our arrangements with third party vendors and service providers may make our operations vulnerable if those third parties fail to satisfy their obligations to us, including their obligations to maintain and protect the security and confidentiality of our information and data. In addition, we may have disagreements with third party vendors and service providers regarding relative responsibilities for any such failures under applicable business associate agreements or other applicable outsourcing agreements. Further, we may not be adequately indemnified against all possible losses through the terms and conditions of our contracts with third party vendors and service providers. Our outsourcing arrangements could be adversely impacted by
25
changes in vendors' or service providers' operations or financial condition or other matters outside of our control. If we fail to adequately monitor and regulate the performance of our third party vendors and service providers, we could be subject to additional risk. Violations of, or noncompliance with, laws and/or regulations governing our business or noncompliance with contract terms by third party vendors and service providers could increase our exposure to liability to our members, providers, or other third parties, or sanctions and/or fines from the regulators that oversee our business. In turn, this could increase the costs associated with the operation of our business or have an adverse impact on our business and reputation. Moreover, if these vendor and service provider relationships were terminated for any reason, we may not be able to find alternative partners in a timely manner or on acceptable financial terms, and may incur significant costs in connection with any such vendor or service provider transition. As a result, we may not be able to meet the full demands of our customers and, in turn, our business, financial condition, and results of operations may be harmed. In addition, we may not fully realize the anticipated economic and other benefits from our outsourcing projects or other relationships we enter into with third party vendors and service providers, as a result of regulatory restrictions on outsourcing, unanticipated delays in transitioning our operations to the third party, vendor or service provider noncompliance with contract terms or violations of laws and/or regulations, or otherwise. This could result in substantial costs or other operational or financial problems that could adversely impact our business, financial condition, and results of operations.
An impairment charge with respect to our recorded goodwill and indefinite-lived intangible assets, or our finite-lived intangible assets, could have a material impact on our financial results.
As of December 31, 2012, the balance of goodwill and indefinite-lived intangible assets was $151.1 million. Goodwill and indefinite-lived intangible assets are not amortized, but are subject to annual impairment testing. Testing is performed more frequently if events occur or circumstances change that would more likely than not reduce the fair value of the underlying reporting units below their carrying amounts. The underlying reporting units generally comprise our health plan subsidiaries and our Molina Medicaid Solutions segment. As of December 31, 2012, the balance of intangible assets, net, was $77.7 million. Intangible assets are amortized generally on a straight-line basis over their estimated useful lives. Our intangible assets are subject to impairment tests when events or circumstances indicate that such an asset's (or asset group's) carrying value may not be recoverable. Consideration is given to a number of potential impairment indicators, including legal factors, market conditions, and operational performance. Such evaluation is significantly impacted by estimates and assumptions of future revenues, costs and expenses, and other factors.
For example, our health plan subsidiaries have generally been successful in obtaining the renewal by amendment of their contracts in each state prior to the actual expiration of their contracts. However, there can be no assurance that these contracts will continue to be renewed. The non-renewal of such a contract would be an indicator of impairment.
If an event or events occur that would cause us to revise our estimates and assumptions used in analyzing the value of our goodwill and indefinite-lived intangible assets, and intangible assets, net, such revision could result in a non-cash impairment charge that could have a material adverse impact on our financial results.
We are subject to the risks of owning real property.
We own an approximately 460,000 square foot office building housing our principal executive offices, which we purchased in a transaction that closed on December 7, 2011. We also own a nearby 32,000 square-foot office building in Long Beach, California, a 160,000 square-foot office building in Columbus, Ohio, a 26,000 square-foot data center in Albuquerque, New Mexico, and a 24,000 square-foot mixed use (office and clinic) facility in Pomona, California. Accordingly, we are subject to all of the risks generally associated with owning real estate, which include, but are not limited to: the possibility of environmental contamination, the costs associated with fixing any environmental problems and the risk of damages resulting from such contamination; risks related to natural disasters, such as earthquakes, flooding or severe weather; adverse changes in the value of the property due to interest rate changes, changes in the neighborhood in which the property is located, or other factors; ongoing maintenance expenses and costs of improvements; the possible need for structural improvements in order to comply with changes in zoning, seismic, disability act, or other requirements; inability to renew or enter into leases for space not utilized by the Company on commercially acceptable terms or at all; and possible disputes with neighboring owners or other individuals and entities.
Because we have guaranteed one of our subsidiary's obligations under a loan agreement, if this subsidiary fails to meet its obligations under the loan agreement, we may be required to satisfy such obligations, and such an undertaking could have an adverse affect on our financial condition.
On December 7, 2011, Molina Center LLC, or Molina Center, a wholly owned subsidiary of the Company, entered into a Term Loan Agreement with various lenders and East West Bank, as Administrative Agent, to borrow the aggregate principal amount of $48.6 million to finance a portion of the $81 million purchase price for the acquisition of the office building housing our corporate headquarters. While all amounts due under the Term Loan Agreement and related loan documents are secured by a security interest in the office building in favor of and for the benefit of the Administrative Agent and the other lenders under the Term Loan Agreement, the Company has additionally guaranteed Molina Center's obligations of payment and performance under the Term Loan Agreement, certain promissory notes executed in connection therewith, and other loan documents. The maximum amount of the promissory notes for which the Company is liable under the Guaranty will in no event exceed $20 million, but there
26
is no cap on the Company's total liability under the Guaranty. Furthermore, Molina Center and the Company also entered into an Environmental Indemnity in favor of the Administrative Agent and the other lenders pursuant to which the Company, jointly and severally with Molina Center, has agreed to indemnify and hold harmless the Administrative Agent and each of the other lenders under the Term Loan Agreement from and against any loss, damage, cost, expense, claim, or liability directly or indirectly arising out of or attributable to the use, generation, storage, release, discharge or disposal, or presence of certain hazardous materials on or about the office building. Neither the Company's nor Molina Center's liability under the Environmental Indemnity is limited by a maximum dollar amount. If Molina Center is unable to comply with the various customary financial covenants of the Term Loan Agreement, if it defaults under the Term Loan Agreement or if there are major environmental liabilities attributed to hazardous materials, such events could have an adverse effect on our business, financial condition, cash flows, and results of operations.
Risks Related to Our Common Stock
Delaware law and our charter documents may impede or discourage a takeover, which could cause the market price of our common stock to decline.
We are subject to the Delaware anti-takeover laws regulating corporate takeovers. These provisions may prohibit stockholders owning 15% or more of our outstanding voting stock from merging or combining with us. In addition, any change in control of our state health plans would require the approval of the applicable insurance regulator in each state in which we operate.
Our certificate of incorporation and bylaws also contain provisions that could have the effect of delaying, deferring, or preventing a change in control of our company that stockholders may consider favorable or beneficial. These provisions could discourage proxy contests and make it more difficult for our stockholders to elect directors and take other corporate actions. These provisions could also limit the price that investors might be willing to pay in the future for shares of our common stock. These provisions include:
a staggered board of directors, so that it would take three successive annual meetings to replace all directors,
prohibition of stockholder action by written consent,
advance notice requirements for the submission by stockholders of nominations for election to the board of directors and for proposing matters that can be acted upon by stockholders at a meeting, and
the ability of our board of directors, without stockholder approval, to designate the terms of one or more series of preferred stock and issue shares of preferred stock.
In addition, changes of control are often subject to state regulatory notification, and in some cases, prior approval.
Volatility of our stock price could adversely affect stockholders.
Since our initial public offering in July 2003, the sales price of our common stock has ranged from a low of $16.12$10.75 to a high of $53.23.$36.83. A number of factors willcould continue to influence the market price of our common stock, including:
the implementation of the ACA and duals demonstration programs,
state and federal budget pressures,
changes in expectations as to our future financial performance or changes in financial estimates, if any, by us or by security analysts or investors,
revisions in securities analysts' estimates,
announcements by us or our competitors of significant acquisitions or dispositions, strategic partnerships, joint ventures, or capital commitments,
announcements relating to our business or the business of our competitors,
changes in government payment levels,
adverse publicity regarding health maintenance organizations and other managed care organizations,
government action regarding member eligibility,
changes in state mandatory programs,
conditions generally affecting the managed care industry or our provider networks,
the success of our operating or acquisition strategy,
the operating and stock price performance of other comparable companies in the health care industry,
27
the termination of our Medicaid or CHIP contracts with state or county agencies, or subcontracts with other Medicaid managed care organizations that contract with such state or county agencies,
regulatory or legislative change,
general economic conditions, including unemployment rates, inflation, and interest rates, and
the other factors set forth under “Risk factors” in this Annual Report on Form 10-K.
Our common stock may not trade at the same levels as the stock of other health care companies or the market in general. Also, if the trading market for our common stock does not continue to develop, securities analysts may not maintain or initiate research coverage of our Companyus and our shares,common stock, and this could depress the market for our shares.common stock.
Members of the Molina family own a majoritysignificant amount of our capital stock, decreasing the influence of other stockholders on stockholder decisions.
Members of the Molina family, either directly or as trustees or beneficiaries of Molina family trusts, in the aggregate own or are entitled to receive upon certain events approximately 55%37% of our capital stock.stock as of December 31, 2012. Our president
30
and chief executive officer, as well as our chief financial officer, are members of the Molina family, and they are also on our board of directors. Because of the amount of their shareholdings, Molina family members, if they were to act as a group with the trustees of their family trusts, have the ability to significantly influence all matters submitted to stockholders for approval, including the election and removal of directors, amendments to our charter, and any merger, consolidation, or sale of ourthe Company. A significant concentration of share ownership can also adversely affect the trading price for our common stock because investors often discount the value of stock in companies that have controlling stockholders. Furthermore, the concentration of share ownership in the Molina family could delay or prevent a merger or consolidation, takeover, or other business combination that could be favorable to our stockholders. Finally, the interests and objectives of the Molina family may be different from those of our company or our other stockholders, and they may vote their common stock in a manner that is contrary to the vote of our other stockholders.
Future sales of our common stock or equity-linked securities in the public market could adversely affect the trading price of our common stock and our ability to raise funds in new stock offerings.
We may issue equity securities in the future, includingor securities that are convertible into or exchangeable for, or that represent the right to receive, shares of our common stock. Sales of a substantial number of shares of our common stock or other equity securities, including sales of shares in connection with any future acquisitions, could be substantially dilutive to our stockholders. These sales may have a harmful effect on prevailing market prices for our common stock and our ability to raise additional capital in the financial markets at a time and price favorable to us. Moreover, to the extent that we issue restricted stock units, stock appreciation rights, options, or warrants to purchase our common stock in the future and those stock appreciation rights, options, or warrants are exercised or as the restricted stock units vest, our stockholders may experience further dilution. Holders of our shares of common stock have no preemptive rights that entitle holders to purchase a pro rata share of any offering of shares of any class or series and, therefore, such sales or offerings could result in increased dilution to our stockholders. Our certificate of incorporation provides that we have authority to issue 80,000,000 shares of common stock and 20,000,000 shares of preferred stock. As of December 31, 2010, 30,308,6162012, approximately 46,762,000 shares of common stock and no shares of preferred or other capital stock were issued and outstanding.
31
| Unresolved Staff Comments |
None.
Item 2:Properties |
We lease a total of 67 facilities, including75 facilities. We own a 460,000 square foot office building housing our corporate headquarters at 200 Oceangate in Long Beach, California. WeCalifornia, and we also own a nearby 32,000 square-foot office building in Long Beach, California, oura 160,000 square-foot office building in Columbus, Ohio, a 26,000 square-foot data center in Albuquerque, New Mexico, and one of the community clinicsa 24,000 square-foot mixed use (office and clinic) facility in Pomona, California. We anticipate leasing additional space in the Long Beach, California area during 2013. While we believe our current and anticipated facilities arewill be adequate to meet our operational needs for the foreseeable future.future, we are continuing to periodically evaluate our employee and operations growth prospects to determine if additional space is required, and where it would be best located.
| Item 3:Legal Proceedings |
The health care and business process outsourcing industries areindustry is subject to numerous laws and regulations of federal, state, and local governments. Compliance with these laws and regulations can be subject to government review and interpretation, as well as regulatory actions unknown and unasserted at this time. Penalties associated with violations of these laws and regulations include significant fines, and penalties, exclusion from participating in publicly fundedpublicly-funded programs, and the repayment of previously billed and collected revenues.
28
We are involved in various legal actions in the ordinarynormal course of business, some of which seek monetary damages, including claims for punitive damages, which are not covered by insurance. The outcomeBased upon the evaluation of such legal actions is inherently uncertain. Nevertheless,information currently available, we believe that these actions, when finally concluded and determined, are not likely to have a material adverse effect on our consolidatedbusiness, financial position,condition, cash flows, or results of operations, or cash flows.operations.
32
Item 4: Mine Safety Disclosures
None.
29
PART II
Item 5: Market for Registrant’s Common Equity, Related Stockholder Matters and Issuer Purchases of Equity Securities
Our common stock is listed on the New York Stock Exchange under the trading symbol “MOH.” As of
Date Range | High | Low | ||||||
| 2010 | ||||||||
| First Quarter | $ | 26.39 | $ | 20.02 | ||||
| Second Quarter | $ | 31.20 | $ | 25.00 | ||||
| Third Quarter | $ | 31.80 | $ | 25.28 | ||||
| Fourth Quarter | $ | 28.28 | $ | 24.65 | ||||
| 2009 | ||||||||
| First Quarter | $ | 22.74 | $ | 16.22 | ||||
| Second Quarter | $ | 25.75 | $ | 18.11 | ||||
| Third Quarter | $ | 25.05 | $ | 19.36 | ||||
| Fourth Quarter | $ | 23.49 | $ | 17.05 | ||||
| Date Range | High | Low | |||||
| 2012 | |||||||
| First Quarter | $ | 36.83 | $ | 22.25 | |||
| Second Quarter | $ | 35.37 | $ | 17.63 | |||
| Third Quarter | $ | 27.73 | $ | 21.62 | |||
| Fourth Quarter | $ | 29.82 | $ | 21.74 | |||
| 2011 | |||||||
| First Quarter | $ | 26.86 | $ | 17.77 | |||
| Second Quarter | $ | 29.03 | $ | 24.72 | |||
| Third Quarter | $ | 28.21 | $ | 14.82 | |||
| Fourth Quarter | $ | 26.31 | $ | 13.93 | |||
To date we have nevernot paid cash dividends on our common stock. We currently intend to retain any future earnings to fund our projected business andgrowth. However, we do not anticipate paying anyintend to periodically evaluate our cash dividendsposition to determine whether to pay a cash dividend in the future.
Our ability to pay dividends is partially dependent on, among other things, our receipt of cash dividends from our regulated subsidiaries. The ability of our regulated subsidiaries to pay dividends to us is limited by the state departments of insurance in the states in which we operate or may operate, as well as requirements of the government-sponsored health programs in which we participate. Any future determination to pay dividends will be at the discretion of our Board and will depend upon, among other factors, our results of operations, financial condition, capital requirements and contractual and regulatory restrictions. For more information regarding restrictions on the ability of our regulated subsidiaries to pay dividends to us, please see Item 7 — Management’s Discussion and Analysis of Financial Condition and Results of Operations — RegulatoryLiquidity and Capital Resources —Regulatory Capital and Dividends Restrictions.
Unregistered Issuances of Equity Securities
None.
Stock Repurchase Programs
Common Stock Repurchase in Connection with Offering of 1.125% Cash Convertible Senior Notes Due 2020. We used a portion of the net proceeds in this offering to repurchase $50 million of our common stock in negotiated transactions with institutional investors in the offering, concurrently with the pricing of the offering. On February 12, 2013, we repurchased a total of 1,624,959 shares at $30.77 per share, which was our closing stock price on that date.
Securities Repurchases and Repurchase Programs. Effective as of February 13, 2013, our board of directors authorized the repurchase of $75 million in aggregate of either our common stock or our convertible senior note due 2014. The repurchase program extends through December 31, 2014.
Effective as of October 26, 2011, our board of directors authorized the repurchase of $75 million in aggregate of either our common stock or our convertible senior notes due 2014. The repurchase program expired October 25, 2012. No securities were purchased under this program in 2012.
Purchases of common stock made by or on behalf of the Company during the quarter ended December 31, 2012, including shares withheld by the Company to satisfy our employees’ income tax obligations, are set forth below:
30
Total Number of Shares Purchased (a)(b) | Average Price Paid per Share | Total Number of Shares Purchased as Part of Publicly Announced Plans or Programs | Maximum Number (or Approximate Dollar Value) of Shares That May Yet Be Purchased Under the Plans or Programs | ||||||||||
| October 1 — October 31 | 2,150 | $ | 25.03 | — | $ | — | |||||||
| November 1 — November 30 | 1,892 | $ | 25.31 | — | $ | — | |||||||
| December 1 — December 31 | 194,974 | $ | 27.97 | — | $ | — | |||||||
| Total | 199,016 | $ | 27.91 | — | |||||||||
| (a) | During the three months ended December 31, 2012, we repurchased shares of our common stock from certain Molina family trusts. Janet M. Watt is the sister, and her husband Lawrence B. Watt is the brother-in-law, of Dr. J. Mario Molina, the Company's Chief Executive Officer, and John Molina, the Company's Chief Financial Officer. Ms. Watt is the sole trustee of the Janet M. Watt Separate Property Trust dated 10/22/2007 (the “Separate Property Trust”) and a co-trustee with Lawrence B. Watt, of the Watt Family Trust dated 10/11/1996 (the “Family Trust” and together with the Separate Property Trust, the “Trusts”). On December 26, 2012, pursuant to a Stock Purchase Agreement between the Company and the Trusts, the Company purchased an aggregate of 110,988 shares of its common stock from the Trusts for an aggregate purchase price of $3,000,005.64, as follows: (i) 43,767 shares from the Family Trust for an aggregate purchase price of $ 1,183,022.01 and (ii) 67,221 shares from the Separate Property Trust for an aggregate purchase price of $1,816,983.63. The shares were purchased at a price per share of $27.03, representing the closing price per share of the Company's common stock on December 26, 2012, as reported by the New York Stock Exchange. The transaction was approved by the Company's board of directors. Other than these repurchases from the Trusts, we did not repurchase any shares of our common stock outside of our publicly announced repurchase program except shares of common stock withheld to settle our employees' income tax obligations described below. |
| (b) | During the quarter we withheld 88,028 shares of common stock under our 2002 Equity Incentive Plan and 2011 Equity Incentive Plan to settle our employees' income tax obligations. |
Securities Authorized for Issuance Under Equity Compensation Plans (as of December 31, 2010)2012)
| Number of Securities | ||||||||||||
| Remaining Available for | ||||||||||||
| Number of Securities to be | Weighted Average | Future Issuance | ||||||||||
| Issued Upon Exercise of | Exercise Price of | Under Equity Compensation | ||||||||||
| Outstanding Options, | Outstanding Options, | Plans (Excluding Securities | ||||||||||
| Warrants and Rights | Warrants and Rights | Reflected in Column (a)) | ||||||||||
Plan Category | (a) | (b) | (c) | |||||||||
| Equity compensation plans approved by security holders | 513,614(1 | ) | $ | 30.59 | 3,744,530(2 | ) | ||||||
33
| Plan Category | Number of Securities to be Issued Upon Exercise of Outstanding Options, Warrants and Rights (a) | Weighted Average Exercise Price of Outstanding Options, Warrants and Rights (b) | Number of Securities Remaining Available for Future Issuance Under Equity Compensation Plans (Excluding Securities Reflected in Column (a)) (c) | |||||||
| Equity compensation plans approved by security holders | 414,061 | (1) | $ | 22.39 | 6,537,592 | (2) | ||||
| (1) | Options to purchase shares of our common stock issued under the |
| (2) | Includes only shares remaining available to issue under the 2011 Equity Incentive Plan, and the 2011 Employee Stock Purchase Plan. Further grants under the 2002 Equity Incentive Plan |
34
31
STOCK PERFORMANCE GRAPH
The following graph and related discussion are being furnished solely to accompany this Annual Report on Form 10-K pursuant to Item 201(e) of Regulation S-K and shall not be deemed to be “soliciting material”materials” or to be “filed” with the SEC (other than as provided in Item 201) nor shall this information be incorporated by reference into any future filing under the Securities Act or the Exchange Act, whether made before or after the date hereof and irrespective of any general incorporation language contained therein, except to the extent that the Company specifically incorporates it by reference into a filing.
The following line graph compares the percentage change in the cumulative total return on our common stock against the cumulative total return of the Standard & Poor’sPoor's Corporation Composite 500 Index (the “S&P 500”), our old peer group index (as described below), and a new peer group index (as described below) for the five-year period from December 31, 20052007 to December 31, 2010.2012. We have revised our peer group to match the peer group that is used by our Compensation Committee in benchmarking our executive officers' compensation. The graphcomparison assumes an initial investment of $100 was invested on December 31, 2007, in Molina Healthcare, Inc.the Company’s common stock and in each of the indices.
foregoing indices and assumes reinvestment of dividends. The stock performance shown on the graph below represents historical stock performance and is not necessarily indicative of future stock price performance.
The old peer group index, used in last year's Annual Report on Form 10-K and also set forth below, consists of Amerigroup Corporation (AGP), Centene Corporation (CNC), Coventry Health Care, Inc. (CVH), Health Net, Inc. (HNT), Humana, Inc. (HUM), UnitedHealth Group Incorporated (UNH), and WellPoint, Inc. (WLP).
The new peer group index consists of Centene Corporation (CNC), Community Health Systems, Inc. (CYH), Coventry Health Care, Inc. (CVH), Health Management Associates, Inc. (HMA), Health Net, Inc. (HNT), Laboratory Corporation of America Holdings (LH), Lifepoint Hospitals, Inc. (LPNT), Magellan Health Services, Inc. (MGLN), Select Medical Holdings Corporation (SEM), Team Health Holdings, Inc. (TMH), Triple-S Management Corporation (GTS), Universal American Corporation (UAM), and WellCare Health Plans, Inc. (WCG).
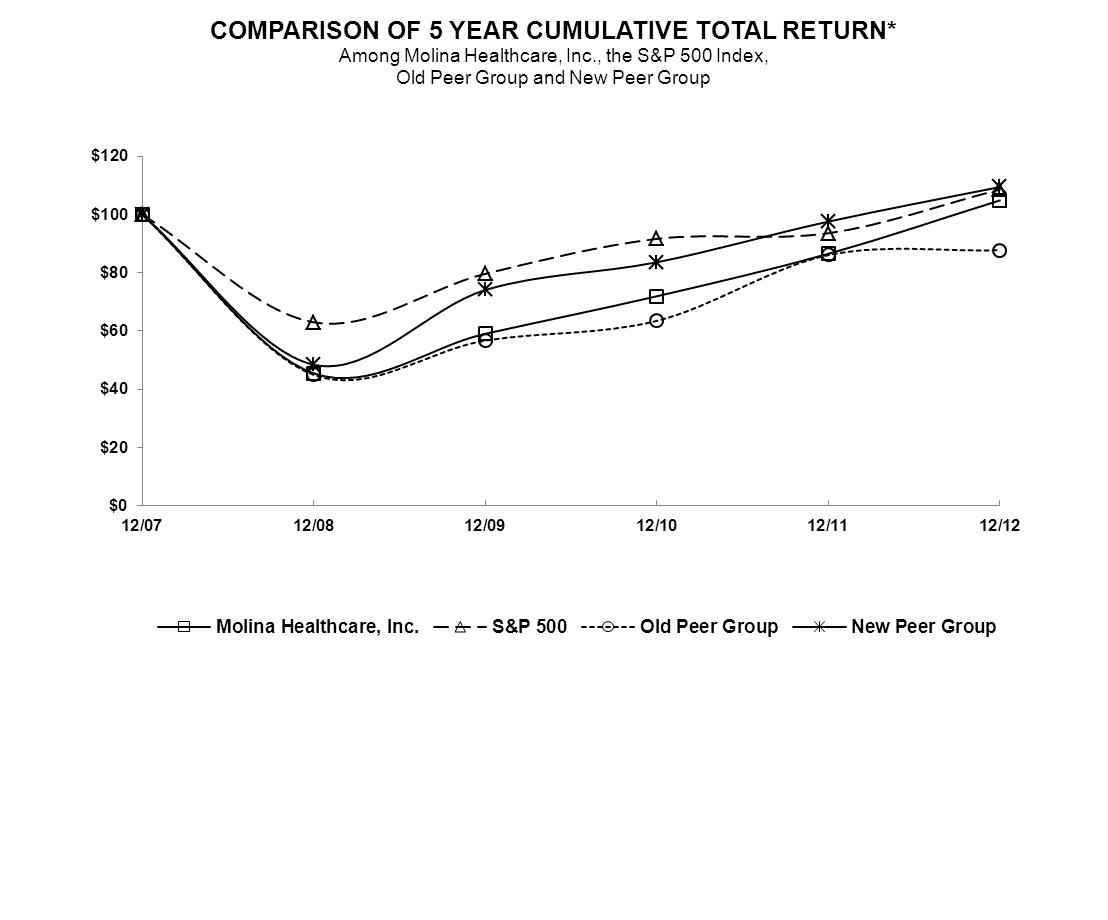
32
| Name | 12/07 | 12/08 | 12/09 | 12/10 | 12/11 | 12/12 | ||||||||||||
| Molina Healthcare, Inc. | $ | 100.00 | $ | 45.50 | $ | 59.10 | $ | 71.96 | $ | 86.55 | $ | 104.88 | ||||||
| S&P 500 | 100.00 | 63.00 | 79.67 | 91.67 | 93.61 | 108.59 | ||||||||||||
| Old Peer Group | 100.00 | 44.97 | 56.76 | 63.52 | 86.09 | 87.78 | ||||||||||||
| New Peer Group | 100.00 | 48.44 | 74.11 | 83.64 | 97.61 | 109.47 | ||||||||||||
33
Item 6.
35
SELECTED FINANCIAL DATA
We derived the following selected consolidated financial data (other than the data under the caption “Operating Statistics”) for the five years ended December 31, 20102012 from our audited consolidated financial statements. You should read the data in conjunction with our consolidated financial statements, related notes and other financial information included herein. All dollars are in thousands, except per share data. The data under the caption “Operating Statistics” has not been audited.
| Year Ended December 31, | ||||||||||||||||||||
| 2010(1)(3) | 2009(2)(3) | 2008(2)(3) | 2007(2)(8) | 2006(2)(9) | ||||||||||||||||
Statements of Income Data: | ||||||||||||||||||||
| Revenue: | ||||||||||||||||||||
| Premium revenue | $ | 3,989,909 | $ | 3,660,207 | $ | 3,091,240 | $ | 2,462,369 | $ | 1,985,109 | ||||||||||
| Service revenue(1) | 89,809 | — | — | — | — | |||||||||||||||
| Investment income | 6,259 | 9,149 | 21,126 | 30,085 | 19,886 | |||||||||||||||
| Total revenue | 4,085,977 | 3,669,356 | 3,112,366 | 2,492,454 | 2,004,995 | |||||||||||||||
| Expenses: | ||||||||||||||||||||
| Medical care costs | 3,370,857 | 3,176,236 | 2,621,312 | 2,080,083 | 1,678,652 | |||||||||||||||
| Cost of service revenue(1) | 78,647 | — | — | — | — | |||||||||||||||
| General and administrative expenses(2) | 345,993 | 276,027 | 249,646 | 205,057 | 168,280 | |||||||||||||||
| Premium tax expenses(2)(3) | 139,775 | 128,581 | 100,165 | 81,020 | 60,777 | |||||||||||||||
| Depreciation and amortization | 45,704 | 38,110 | 33,688 | 27,967 | 21,475 | |||||||||||||||
| Total expenses | 3,980,976 | 3,618,954 | 3,004,811 | 2,394,127 | 1,929,184 | |||||||||||||||
| Gain on purchase of convertible senior notes | — | 1,532 | — | — | — | |||||||||||||||
| Operating income | 105,001 | 51,934 | 107,555 | 98,327 | 75,811 | |||||||||||||||
| Interest expense | (15,509 | ) | (13,777 | ) | (13,231 | ) | (5,605 | ) | (2,353 | ) | ||||||||||
| Income before income taxes | 89,492 | 38,157 | 94,324 | 92,722 | 73,458 | |||||||||||||||
| Provision for income taxes(3) | 34,522 | 7,289 | 34,726 | 34,996 | 27,731 | |||||||||||||||
| Net income | $ | 54,970 | $ | 30,868 | $ | 59,598 | $ | 57,726 | $ | 45,727 | ||||||||||
| Net income per share: | ||||||||||||||||||||
| Basic | $ | 2.00 | $ | 1.19 | $ | 2.15 | $ | 2.04 | $ | 1.64 | ||||||||||
| Diluted | $ | 1.98 | $ | 1.19 | $ | 2.15 | $ | 2.03 | $ | 1.62 | ||||||||||
| Weighted average number of common shares outstanding | 27,449,000 | 25,843,000 | 27,676,000 | 28,275,000 | 27,966,000 | |||||||||||||||
| Weighted average number of common shares and potential dilutive common shares outstanding | 27,754,000 | 25,984,000 | 27,772,000 | 28,419,000 | 28,164,000 | |||||||||||||||
Operating Statistics: | ||||||||||||||||||||
| Medical care ratio(4) | 84.5 | % | 86.8 | % | 84.8 | % | 84.5 | % | 84.6 | % | ||||||||||
| General and administrative expense ratio(5) | 8.5 | % | 7.5 | % | 8.0 | % | 8.2 | % | 8.4 | % | ||||||||||
| Premium tax ratio(6) | 3.5 | % | 3.5 | % | 3.2 | % | 3.3 | % | 2.3 | % | ||||||||||
| Members(7) | 1,613,000 | 1,455,000 | 1,256,000 | 1,149,000 | 1,077,000 | |||||||||||||||
36
| As of December 31, | ||||||||||||||||||||
| 2010(1) | 2009 | 2008 | 2007(8) | 2006(9) | ||||||||||||||||
Balance Sheet Data: | ||||||||||||||||||||
| Cash and cash equivalents | $ | 455,886 | $ | 469,501 | $ | 387,162 | $ | 459,064 | $ | 403,650 | ||||||||||
| Total assets | 1,509,214 | 1,244,035 | 1,148,068 | 1,170,016 | 864,475 | |||||||||||||||
| Long-term debt (including current maturities) | 164,014 | 158,900 | 164,873 | 160,166 | 45,000 | |||||||||||||||
| Total liabilities | 790,157 | 701,297 | 616,306 | 655,640 | 444,309 | |||||||||||||||
| Stockholders’ equity | 719,057 | 542,738 | 531,762 | 514,376 | 420,166 | |||||||||||||||
| Year Ended December 31, | |||||||||||||||||||
| 2012 | 2011 | 2010 | 2009 | 2008 | |||||||||||||||
| Statements of Income Data: | |||||||||||||||||||
| Revenue: | |||||||||||||||||||
| Premium revenue | $ | 5,826,491 | $ | 4,603,407 | $ | 3,989,909 | $ | 3,660,207 | $ | 3,091,240 | |||||||||
| Service revenue (1) | 187,710 | 160,447 | 89,809 | — | — | ||||||||||||||
| Investment income | 5,188 | 5,539 | 6,259 | 9,149 | 21,126 | ||||||||||||||
| Rental income | 9,374 | 547 | — | — | — | ||||||||||||||
| Total revenue | 6,028,763 | 4,769,940 | 4,085,977 | 3,669,356 | 3,112,366 | ||||||||||||||
| Expenses: | |||||||||||||||||||
| Medical care costs | 5,096,760 | 3,859,994 | 3,370,857 | 3,176,236 | 2,621,312 | ||||||||||||||
| Cost of service revenue (1) | 141,208 | 143,987 | 78,647 | — | — | ||||||||||||||
| General and administrative expenses | 532,627 | 415,932 | 345,993 | 276,027 | 249,646 | ||||||||||||||
| Premium tax expenses | 158,991 | 154,589 | 139,775 | 128,581 | 100,165 | ||||||||||||||
| Depreciation and amortization | 63,704 | 50,690 | 45,704 | 38,110 | 33,688 | ||||||||||||||
| Total operating costs and expenses | 5,993,290 | 4,625,192 | 3,980,976 | 3,618,954 | 3,004,811 | ||||||||||||||
| Impairment of goodwill and intangible assets (2) | — | (64,575 | ) | — | — | — | |||||||||||||
| Gain on purchase of convertible senior notes | — | — | — | 1,532 | — | ||||||||||||||
| Operating income | 35,473 | 80,173 | 105,001 | 51,934 | 107,555 | ||||||||||||||
| Other expenses (income): | |||||||||||||||||||
| Interest expense | 16,769 | 15,519 | 15,509 | 13,777 | 13,231 | ||||||||||||||
| Other income | (361 | ) | — | — | — | — | |||||||||||||
| Total other expenses | 16,408 | 15,519 | 15,509 | 13,777 | 13,231 | ||||||||||||||
| Income before income taxes | 19,065 | 64,654 | 89,492 | 38,157 | 94,324 | ||||||||||||||
| Provision for income taxes | 9,275 | 43,836 | 34,522 | 7,289 | 34,726 | ||||||||||||||
| Net income | $ | 9,790 | $ | 20,818 | $ | 54,970 | $ | 30,868 | $ | 59,598 | |||||||||
| Net income per share: | |||||||||||||||||||
| Basic | $ | 0.21 | $ | 0.45 | $ | 1.34 | $ | 0.80 | $ | 1.44 | |||||||||
| Diluted | $ | 0.21 | $ | 0.45 | $ | 1.32 | $ | 0.79 | $ | 1.43 | |||||||||
| Weighted average number of common shares outstanding | 46,380,000 | 45,756,000 | 41,174,000 | 38,765,000 | 41,514,000 | ||||||||||||||
| Weighted average number of common shares and potential dilutive common shares outstanding | 46,999,000 | 46,425,000 | 41,631,000 | 38,976,000 | 41,658,000 | ||||||||||||||
| Operating Statistics: | |||||||||||||||||||
| Medical care ratio (3) | 89.9 | % | 86.8 | % | 87.6 | % | 89.9 | % | 87.6 | % | |||||||||
| General and administrative expense ratio (4) | 8.8 | % | 8.7 | % | 8.5 | % | 7.5 | % | 8.0 | % | |||||||||
| Premium tax ratio (5) | 2.8 | % | 3.5 | % | 3.6 | % | 3.6 | % | 3.3 | % | |||||||||
| Members (6) | 1,797,000 | 1,697,000 | 1,613,000 | 1,455,000 | 1,256,000 | ||||||||||||||
34
| Year Ended December 31, | |||||||||||||||||||
| 2012 | 2011 | 2010 | 2009 | 2008 | |||||||||||||||
| Balance Sheet Data: | |||||||||||||||||||
| Cash and cash equivalents | $ | 795,770 | $ | 493,827 | $ | 455,886 | $ | 469,501 | $ | 387,162 | |||||||||
| Total assets | 1,934,822 | 1,652,146 | 1,509,214 | 1,244,035 | 1,148,068 | ||||||||||||||
| Long-term debt (including current maturities) | 262,939 | 218,126 | 164,014 | 158,900 | 164,873 | ||||||||||||||
| Total liabilities | 1,152,508 | 897,073 | 790,157 | 701,297 | 616,306 | ||||||||||||||
| Stockholders’ equity | 782,314 | 755,073 | 719,057 | 542,738 | 531,762 | ||||||||||||||
_______________________________
| (1) | Service revenue and cost of service revenue represent revenue and costs generated by our Molina Medicaid Solutions segment. Because we acquired this business on May 1, 2010, results for the year ended December 31, 2010 include eight months of results for this segment. |
| (2) |
| (3) | ||
| Medical care ratio represents medical care costs as a percentage of premium |
| (4) | General and administrative expense ratio represents such expenses as a percentage of total revenue. |
| (5) | Premium tax ratio represents such expenses as a percentage of premium |
| (6) | Number of members at end of period. | |
37
35
Item 7.Management’s Discussion and Analysis of Financial Condition and Results of Operations |
The following discussion of our financial condition and results of operations should be read in conjunction with the “Selected Financial Data” and the accompanying consolidated financial statements and the notes to those statements appearing elsewhere in this report. This discussion contains forward-looking statements that involve known and unknown risks and uncertainties, including those set forth under Item 1A — Risk Factors, above.
Overview
Molina Healthcare, Inc. provides quality and cost-effective Medicaid-related solutions to meet the health care needs of low-income families and individuals, and to assist state agencies in their administration of the Medicaid program. Our business comprisesWe report our financial performance based on two reportable segments: Health Plans segment, consisting of licensed health maintenance organizations serving Medicaid populations in ten states, and our Molina Medicaid Solutions segment, which provides design, development, implementation, and business processing solutions to Medicaid agencies in an additional five states. Our direct delivery business currently consists of 16 primary care community clinics in California and two primary care community clinics in Washington, and we also manage three county-owned primary care clinics under a contract with Fairfax County, Virginia.Solutions.
Our Health Plans segment comprises health plans in California, Florida, Michigan, Missouri, New Mexico, Ohio, Texas, Utah, Washington, and Wisconsin. TheseWisconsin, and includes our direct delivery business. As of December 31, 2012, these health plans served approximately 1.6 1.8million members eligible for Medicaid, Medicare, and other government-sponsored health care programs for low-income families and individuals as of December 31, 2010.individuals. The health plans are operated by our respective wholly owned subsidiaries in those states, each of which is licensed as a health maintenance organization, or HMO. EffectiveOur direct delivery business consists of primary care clinics in California, Florida, New Mexico and Washington; additionally, we manage three county-owned primary care clinics under a contract with Fairfax County, Virginia.
Our health plans' state Medicaid contracts generally have terms of three to four years with annual adjustments to premium rates. These contracts are renewable at the discretion of the state. In general, either the state Medicaid agency or the health plan may terminate the state contract with or without cause. Most of these contracts contain renewal options that are exercisable by the state. Our health plan subsidiaries have generally been successful in obtaining the renewal of their contracts in each state prior to the actual expiration of their contracts. Our state contracts are generally at greatest risk of loss when a state issues a new request for proposals, or RFP, subject to competitive bidding by other health plans. If one of our health plans is not a successful responsive bidder to a state RFP, its contract may be subject to non-renewal. For instance, on February 17, 2012, the Division of Purchasing of the Missouri Office of Administration notified us that our Missouri health plan was not awarded a contract under the Missouri HealthNet Managed Care Request for Proposal; therefore, our Missouri health plan’s prior contract with the state expired without renewal on June 30, 2012 subject to certain transition obligations. As of December 31, 2012, we continued to process claims that were incurred by the Missouri health plan's members through the June 30, 2012 termination date. For the six months ended June 30, 2012, our Missouri health plan contributed premium revenue of $113.8 million, or 4.1% of total premium revenue, and comprised 79,000 members, or 4.3% of total Health Plans segment membership as of June 30, 2012.
With regard to our Ohio health plan, as a result of a lawsuit challenging the selection of several plans including our health plan for the new Medicaid managed care program in Ohio, the Ohio Office of Medical Assistance announced on October 5, 2012, that the operation of the program is being delayed from the previously scheduled January 1, 2010, we terminated operations at2013 start date and will now commence on July 1, 2013. Following the trial court's dismissal of the lawsuit, the court of appeals has permitted the state of Ohio to move forward with implementation of the new program and finalizing the provider agreements with our small MedicareOhio plan and the other selected managed care plans.
Our state Medicaid contracts may be periodically adjusted to include or exclude certain health benefits (such as pharmacy services, behavioral health services, or long-term care services); populations (such as the aged, blind or disabled, or ABD); and regions or service areas. For example, our Texas health plan added significant membership effective March 1, 2012, in Nevada.service areas we had not previously served (the Hidalgo and El Paso service areas); and among populations we had not previously served within existing service areas, such as the Temporary Assistance for Needy Families, or TANF, population in the Dallas service area. Additionally, the health benefits provided to our TANF and ABD members in Texas under our contracts with the state were expanded to include inpatient facility and pharmacy services.
During fiscal year 2012, we responded to several RFPs and invitations to negotiate with respect to new business, including proposals to serve dual eligible populations and applications to participate in the Centers for Medicare and Medicaid Services, or CMS', Capitated Financial Alignment Demonstration project. On August 27, 2012, our Ohio health plan was chosen to participate in the Southwest, West Central, and Central markets under the Ohio Integrated Care Delivery System, or ICDS. The Ohio ICDS is intended to improve care coordination for individuals enrolled in both Medicaid and Medicare. The selection of our Ohio health plan was made by the Ohio Department of Jobs and Family Services, or ODJFS, pursuant to the request for applications for qualified health plans to serve in the ICDS issued in April 2012. The commencement of the ICDS is subject to the readiness review of the selected health plans, and the execution of three-way provider agreements between the health plans, ODJFS, and CMS. Enrollment of dual eligible members in the ICDS is expected to begin during the second half of 2013.
36
On November 15, 2012, we announced that our new Illinois health plan had been chosen to serve members in Central Illinois under the state's Medicare-Medicaid Alignment Initiative (MMAI). The operational start date for the program is currently scheduled for October 2013 with an effective date of January 2014. In addition to the MMAI, we will also serve other seniors and persons with disabilities in the Medicaid Program as the state expands the Integrated Care Program that was implemented in suburban Cook County and the five collar counties in May of 2011.
On May 1, 2010,February 14, 2013, we acquired aannounced that the Florida Agency for Health Care Administration awarded our Florida health information management business which we now operateplan contracts in three regions under the name,MolinaStatewide Medicaid SolutionsSM. Managed Care Long-Term Care program. As a result of the awards, we will now enter into a comprehensive pre-contracting assessment, with the program currently scheduled to commence on December 1, 2013. Under the program, we will provide long-term care benefits, including institutional and home and community-based services.
On February 11, 2013, we announced that our New Mexico health plan was selected by the New Mexico Human Services Department, or HSD, to participate in the new Centennial Care program. In addition to continuing to provide physical and acute health care services, under the new program our New Mexico health plan will expand its services to provide behavioral health and long-term care services. The selection of our New Mexico health plan was made by HSD pursuant to its request for proposals issued in August 2012. The operational start date for the program is currently scheduled for January 2014.
Our Molina Medicaid Solutions segment provides design, development, implementation, and business process outsourcing solutions to state governments for their Medicaid Management Information Systems, or MMIS. MMIS is a core tool used to support the administration of state Medicaid and other health care entitlement programs. Molina Medicaid Solutions currently holds MMIS contracts with the states of Idaho, Louisiana, Maine, New Jersey, and West Virginia, as well as a contract to provide drug rebate administration services for the Florida Medicaid program. We paid $131.3 million
On October 12, 2012, the Governor of the U.S. Virgin Islands announced a partnership in which we will provide MMIS to acquire Molinathe U.S. Virgin Islands through our West Virginia fiscal agent operation. The contract outlining the sharing of our platform went through several rounds of review at the federal level and has been approved by CMS. The partnership will benefit both the Virgin Islands and taxpayers by circumventing the costs associated with establishing an independent system while gaining leverage from operating under a common platform. This partnership can serve as a model for the country by demonstrating that state and territorial governments can reduce local and federal costs by sharing such technologies for their Medicaid Solutions. The acquisition was funded with available cash of $26 million and $105 million drawn underpopulations.
On July 13, 2012, our credit facility.
On June 9, 2011, Molina Medicaid Solutions.
38
Composition of premium revenue because there are direct relationships between premium revenue earned,Revenue and the cost of health care and premium taxes.Membership
| Year Ended December 31, | ||||||||||||
| 2010 | 2009 | 2008 | ||||||||||
| (Dollar amounts in thousands, except per-share data) | ||||||||||||
| Earnings per diluted share | $ | 1.98 | $ | 1.19 | $ | 2.15 | ||||||
| Premium revenue | $ | 3,989,909 | $ | 3,660,207 | $ | 3,091,240 | ||||||
| Service revenue | $ | 89,809 | $ | — | $ | — | ||||||
| Operating income | $ | 105,001 | $ | 51,934 | $ | 107,555 | ||||||
| Net income | $ | 54,970 | $ | 30,868 | $ | 59,598 | ||||||
| Total ending membership | 1,613,000 | 1,455,000 | 1,256,000 | |||||||||
| Premium revenue | 97.6 | % | 99.8 | % | 99.3 | % | ||||||
| Service revenue | 2.2 | — | — | |||||||||
| Investment income | 0.2 | 0.2 | 0.7 | |||||||||
| Total revenue | 100.0 | % | 100.0 | % | 100.0 | % | ||||||
| Medical care ratio | 84.5 | % | 86.8 | % | 84.8 | % | ||||||
| General and administrative expense ratio | 8.5 | % | 7.5 | % | 8.0 | % | ||||||
| Premium tax ratio | 3.5 | % | 3.5 | % | 3.2 | % | ||||||
| Operating income | 2.6 | % | 1.4 | % | 3.5 | % | ||||||
| Net income | 1.3 | % | 0.8 | % | 1.9 | % | ||||||
| Effective tax rate | 38.6 | % | 19.1 | % | 36.8 | % | ||||||
Health Plans Segment
Our Health Plans segment derives its revenue, in the form of premiums, chiefly from Medicaid contracts with the states in which our health plans operate. The majority of medical costs associated with premium revenues are risk-based costs — while the health plans receive fixed per-member per-month, or PMPM, premium payments from the states, the health plans are at risk for the costs of their members’ health care. Our Health Plans segment operates
39
Premium revenue is fixed in advance of the periods covered and, except as described in “Critical Accounting Policies” below, is not generally subject to significant accounting estimates. For the year ended December 31, 2010,2012, we received approximately 94%96% of our premium revenue as a fixed amount per member per month, or PMPM, amount, pursuant to our Medicaid contracts with state agencies, our Medicare contracts with the Centers for Medicare and Medicaid Services, or CMS, and our contracts with other managed care organizations for which we operate as a subcontractor. These premium revenues are recognized in the month that members are entitled to receive health care services. The state Medicaid programs and the federal Medicare program periodically adjust premium rates.
40
For the year ended December 31, 2010,2012, we receivedrecognized approximately 6%4% of our premium revenue in the form of “birth income” — a one-time payment for the delivery of a child — from the Medicaid programs in all of our state health plans except New Mexico. Such payments are recognized as revenue in the month the birth occurs.
The amount of the premiums paid to us may vary substantially between states and among various government programs. PMPM premiums for the Children’s Health Insurance Program, or CHIP, members are generally among our lowest, with rates as
37
low as approximately $75 PMPM in California. Premium revenues for Medicaid members are generally higher. Among the TANF, Medicaid population — the Medicaid group that includes mostly mothers and children — PMPM premiums range between approximately $100$110 in California to $230$260 in Missouri.Ohio. Among our Medicaid ABD membership, PMPM premiums range from approximately $320$330 in Utah to $1,000$1,400 in Ohio. Contributing to the variability in Medicaid rates among the states is the practice of some states to exclude certain benefits from the managed care contract (most often pharmacy, inpatient, behavioral health and catastrophic case benefits) and retain responsibility for those benefits at the state level. Medicare membership generates the highest PMPM premiums are almost $1,100 PMPM, with Medicare revenue totaling $265.2 million, $135.9 million, and $95.1 million, forin the years ended December 31, 2010, 2009, and 2008, respectively.aggregate, at approximately $1,200 PMPM.
41
The following table sets forth the approximate total number of members by state health plan as of the dates indicated:
| As of December 31, | ||||||||||||
| 2010 | 2009 | 2008 | ||||||||||
Total Ending Membership by Health Plan: | ||||||||||||
| California | 344,000 | 351,000 | 322,000 | |||||||||
| Florida | 61,000 | 50,000 | — | |||||||||
| Michigan | 227,000 | 223,000 | 206,000 | |||||||||
| Missouri | 81,000 | 78,000 | 77,000 | |||||||||
| New Mexico | 91,000 | 94,000 | 84,000 | |||||||||
| Ohio | 245,000 | 216,000 | 176,000 | |||||||||
| Texas | 94,000 | 40,000 | 31,000 | |||||||||
| Utah | 79,000 | 69,000 | 61,000 | |||||||||
| Washington | 355,000 | 334,000 | 299,000 | |||||||||
| Wisconsin(1) | 36,000 | — | — | |||||||||
| Total | 1,613,000 | 1,455,000 | 1,256,000 | |||||||||
Total Ending Membership by State for our Medicare Advantage Plans(1): | ||||||||||||
| California | 4,900 | 2,100 | 1,500 | |||||||||
| Florida | 500 | — | — | |||||||||
| Michigan | 6,300 | 3,300 | 1,700 | |||||||||
| New Mexico | 600 | 400 | 300 | |||||||||
| Texas | 700 | 500 | 400 | |||||||||
| Utah | 8,900 | 4,000 | 2,400 | |||||||||
| Washington | 2,600 | 1,300 | 1,000 | |||||||||
| Total | 24,500 | 11,600 | 7,300 | |||||||||
Total Ending Membership by State for our Aged, Blind or Disabled Population: | ||||||||||||
| California | 13,900 | 13,900 | 12,700 | |||||||||
| Florida | 10,000 | 8,800 | — | |||||||||
| Michigan | 31,700 | 32,200 | 30,300 | |||||||||
| New Mexico | 5,700 | 5,700 | 6,300 | |||||||||
| Ohio | 28,200 | 22,600 | 19,000 | |||||||||
| Texas | 19,000 | 17,600 | 16,200 | |||||||||
| Utah | 8,000 | 7,500 | 7,300 | |||||||||
| Washington | 4,000 | 3,200 | 3,000 | |||||||||
| Wisconsin(1) | 1,700 | — | — | |||||||||
| Total | 122,200 | 111,500 | 94,800 | |||||||||
| As of December 31, | ||||||||
| 2012 | 2011 | 2010 | ||||||
| Total Ending Membership by Health Plan: | ||||||||
| California | 336,000 | 355,000 | 344,000 | |||||
| Florida | 73,000 | 69,000 | 61,000 | |||||
| Michigan | 220,000 | 222,000 | 227,000 | |||||
Missouri (1) | — | 79,000 | 81,000 | |||||
| New Mexico | 91,000 | 88,000 | 91,000 | |||||
| Ohio | 244,000 | 248,000 | 245,000 | |||||
| Texas | 282,000 | 155,000 | 94,000 | |||||
| Utah | 87,000 | 84,000 | 79,000 | |||||
| Washington | 418,000 | 355,000 | 355,000 | |||||
| Wisconsin | 46,000 | 42,000 | 36,000 | |||||
| Total | 1,797,000 | 1,697,000 | 1,613,000 | |||||
| Total Ending Membership by State for our Medicare Advantage Plans: | ||||||||
| California | 7,700 | 6,900 | 4,900 | |||||
| Florida | 900 | 800 | 500 | |||||
| Michigan | 9,700 | 8,200 | 6,300 | |||||
| New Mexico | 900 | 800 | 600 | |||||
| Ohio | 300 | 200 | — | |||||
| Texas | 1,500 | 700 | 700 | |||||
| Utah | 8,200 | 8,400 | 8,900 | |||||
| Washington | 6,500 | 5,000 | 2,600 | |||||
| Total | 35,700 | 31,000 | 24,500 | |||||
| Total Ending Membership by State for our Aged, Blind or Disabled Population: | ||||||||
| California | 44,700 | 31,500 | 13,900 | |||||
| Florida | 10,300 | 10,400 | 10,000 | |||||
| Michigan | 41,900 | 37,500 | 31,700 | |||||
| New Mexico | 5,700 | 5,600 | 5,700 | |||||
| Ohio | 28,200 | 29,100 | 28,200 | |||||
| Texas | 95,900 | 63,700 | 19,000 | |||||
| Utah | 9,000 | 8,500 | 8,000 | |||||
| Washington | 30,000 | 4,800 | 4,000 | |||||
| Wisconsin | 1,700 | 1,700 | 1,700 | |||||
| Total | 267,400 | 192,800 | 122,200 | |||||
| (1) |
42
Molina Medicaid Solutions Segment
38
The payments received by our Molina Medicaid Solutions segment provides technology solutions tounder its state Medicaid programs that include system design, development, implementation, and technology outsourcing services. In addition, this segment offers business process outsourcing services such as claims processing, provider enrollment, pharmacy drug rebate services, recipient eligibility management, and pre-authorization services to state Medicaid agencies.
Composition of Expenses
Health Plans Segment
Operating expenses for the Health Plans segment include expenses related to the provision of medical care services, G&Ageneral and administrative expenses, and premium tax expenses. Our results of operations are impacted by our ability to effectively manage expenses related to medical care services and to accurately estimate medical costs incurred. Expenses related to medical care services are captured in the following four categories:
Fee-for-service: Physician providers paid on a fee-for-service basis are paid according to a fee schedule set by the state or by our contracts with these providers. Most hospitals are paid on a fee-for-service basis in a variety of ways, including per diem amounts, diagnostic-related groups or DRGs, percent of billed charges, and case rates. As discussed below, we also pay a small portion of hospitals on a capitated basis. We also have stop-loss agreements with the hospitals with which we contract. Under all fee-for-service arrangements, we retain the financial responsibility for medical care provided. Expenses related to fee-for-service contracts are recorded in the period in which the related services are dispensed. The costs of drugs administered in a physician or hospital setting that are not billed through our pharmacy benefit manager are included in fee-for-service costs. | ||
43
Capitation: Many of our primary care physicians and a small portion of our specialists and hospitals are paid on a capitated basis. Under capitation contracts, we typically pay a fixed PMPM payment to the provider without regard to the frequency, extent, or nature of the medical services actually furnished. Under capitated contracts, we remain liable for the provision of certain health care services. Certain of our capitated contracts also contain incentive programs based on service delivery, quality of care, utilization management, and other criteria. Capitation payments are fixed in advance of the periods covered and are not subject to significant accounting estimates. These payments are expensed in the period the providers are obligated to provide services. The financial risk for pharmacy services for a small portion of our membership is delegated to capitated providers.
Pharmacy: Pharmacy costs include all drug, injectibles, and immunization costs paid through our pharmacy benefit manager. As noted above, drugs and injectibles not paid through our pharmacy benefit manager are included in fee-for-service costs, except in those limited instances where we capitate drug and injectible costs.
Other: Other medical care costs include medically related administrative costs, certain provider incentive costs, reinsurance cost, and other health care expense. Medically related administrative costs include, for example, expenses relating to health education, quality assurance, case management, disease management, and 24-hour on-call nurses. Salary and benefit costs are a substantial portion of these expenses. For the years ended December 31, 2012, 2011, and 2010, medically related administrative costs were approximately $127.5 million, $102.3 million, and $85.5 million, respectively.
Our medical care costs include amounts that have been paid by us through the reporting date as well as estimated liabilities for medical care costs incurred but not paid by us as of the reporting date. See “Critical Accounting Policies” below for a comprehensive discussion of how we estimate such liabilities.
Molina Medicaid Solutions Segment
Cost of service revenue consists primarily of the costs incurred to provide business process outsourcing and technology outsourcing services under our contracts in Louisiana, Maine, New Jersey, West Virginia and Florida, as well as certain selling, generalMMIS contracts. General and administrative expenses. Additionally, certaincosts consist primarily of indirect administrative costs incurred under our contracts in Maine (prior to exiting the DDI phase of that contract in September, 2010) and Idaho are also expensed to cost of services.
business development costs.
In some circumstances we may defer recognition of incremental direct costs (such as direct labor, hardware, and software) associated with a contract if revenue recognition is also deferred. Such deferred contract costs are amortized on a straight-line basis over the remaining original contract term, consistent with the revenue recognition period.
2012 Financial Performance Summary
39
The following table and narrative briefly summarizes our financial and operating performance for the years ended December 31, 2012, 2011, and 2010. All ratios, with the exception of the medical care ratio and the premium tax ratio, are shown as a percentage of total revenue. The medical care ratio and the premium tax ratio are computed as a percentage of premium revenue, net of premium tax, because there are direct relationships between premium revenue earned, and the cost of health care and premium taxes.
We beganhave changed our method of calculating the medical care ratio effective December 31, 2012. We now calculate the medical care ratio by dividing total medical care costs by premium revenue, net of premium taxes. Previously, we did not adjust premium revenue to recognize deferred costsremove the impact of premium taxes when calculating the medical care ratio. We made this change for all periods presented to allow better comparability of the medical care ratio between periods for health plans operating in states where premium taxes are either increased or decreased. Two states where we operate health plans (Michigan and California) either reduced or eliminated their premium tax during 2012.
| Year Ended December 31, | |||||||||||
| 2012 | 2011 | 2010 | |||||||||
| (Dollar amounts in thousands, except per-share data) | |||||||||||
| Earnings per diluted share | $ | 0.21 | $ | 0.45 | $ | 1.32 | |||||
| Premium revenue | $ | 5,826,491 | $ | 4,603,407 | $ | 3,989,909 | |||||
| Service revenue | $ | 187,710 | $ | 160,447 | $ | 89,809 | |||||
| Operating income | $ | 35,473 | $ | 80,173 | $ | 105,001 | |||||
| Net income | $ | 9,790 | $ | 20,818 | $ | 54,970 | |||||
| Total ending membership | 1,797,000 | 1,697,000 | 1,613,000 | ||||||||
| Premium revenue | 96.6 | % | 96.5 | % | 97.6 | % | |||||
| Service revenue | 3.1 | % | 3.4 | % | 2.2 | % | |||||
| Investment income | 0.1 | % | 0.1 | % | 0.2 | % | |||||
| Rental income | 0.2 | % | — | % | — | % | |||||
| Total revenue | 100.0 | % | 100.0 | % | 100.0 | % | |||||
| Medical care ratio (1) | 89.9 | % | 86.8 | % | 87.6 | % | |||||
| General and administrative expense ratio | 8.8 | % | 8.7 | % | 8.5 | % | |||||
| Premium tax ratio (1) | 2.8 | % | 3.5 | % | 3.6 | % | |||||
| Operating income | 0.6 | % | 1.7 | % | 2.6 | % | |||||
| Net income | 0.2 | % | 0.4 | % | 1.3 | % | |||||
| Effective tax rate | 48.6 | % | 67.8 | % | 38.6 | % | |||||
| (1) | Medical care ratio represents medical care costs as a percentage of premium revenue, net of premium taxes; premium tax ratio represents premium taxes as a percentage of premium revenue, net of premium taxes. |
Earnings before Interest, Taxes, Depreciation and Amortization, or EBITDA
We calculate a non-GAAP measure, EBITDA, which management uses as a supplemental metric in evaluating our Maine contractfinancial performance, in September 2010, atevaluating financing and business development decisions, and in forecasting and analyzing future periods. For these reasons, management believes that EBITDA is a useful supplemental measure to investors in evaluating our performance and the same time we beganperformance of other companies in our industry. The reconciliation of this non-GAAP to recognize revenue associated with that contract. In Idaho, we expect to begin recognitionGAAP financial measure is as follows (GAAP stands for U.S. generally accepted accounting principles):
40
| Year Ended December 31, | |||||||||||
| 2012 | 2011 | 2010 | |||||||||
| (In thousands) | |||||||||||
| Net income | $ | 9,790 | $ | 20,818 | $ | 54,970 | |||||
| Add back: | |||||||||||
| Depreciation and amortization reported in the consolidated statements of cash flows | 78,764 | 74,383 | 60,765 | ||||||||
| Interest expense | 16,769 | 15,519 | 15,509 | ||||||||
| Provision for income taxes | 9,275 | 43,836 | 34,522 | ||||||||
EBITDA(1) | $ | 114,598 | $ | 154,556 | $ | 165,766 | |||||
| (1) | EBITDA is not prepared in conformity with GAAP because it excludes depreciation and amortization, as well as interest expense, and the provision for income taxes. This non-GAAP financial measure should not be considered as an alternative to the GAAP measures of net income, operating income, operating margin, or cash provided by operating activities; nor should EBITDA be considered in isolation from these GAAP measures of operating performance. |
Year Ended December 31, 20102012 Compared with the Year Ended December 31, 20092011
Fiscal Year 2012 Overview and Highlights
Earnings decreased in2012compared with 2011because lower margins in the Health Plans segment more than offset higher premium revenue.Net income for the year endedDecember 31, 2012, was $9.8 million, or $0.21per diluted share, compared with net income of $20.8 million, or $0.45per diluted share, for the year endedDecember 31, 2011. Results for the quarter and year ended December 31, 2011, were affected by an impairment charge of$64.6 million related to our Missouri health plan.
Lower net income in 2012 was in large part tied to growth in our ABD membership in California and Texas, where margins were considerably lower than our margins in the aggregate. During 2012, both California and Texas transitioned large numbers of ABD members from fee-for-service reimbursement to managed care contracts. It has been our experience that members transitioning from fee-for-service reimbursement to managed care often bring with them pent up demand for medical services; and that the realization of both improved medical outcomes and costs savings from the application of managed care practices takes time as both members and providers acquaint themselves to new ways of accessing and providing care.
The initial reduction to margins associated with the transition of members from fee-for-service reimbursement to managed care was exacerbated by premium rates that assumed unrealistic costs savings from managed care practices. Premium rate increases received later in 2012 at least partially addressed this issue.
Those rate increases, together with the improved health outcomes and the gradual reduction in medical costs resulting from the application of managed care practices, produced improved financial results in the fourth quarter of 2012. Nevertheless, the aggregate impact of the ABD membership transitioned in 2012 was to substantially reduce margins. We believe, however, that in time the higher premium revenue associated with ABD members will allow us to earn acceptable returns on a total dollar basis even if percentage margins remain lower than those earned by serving TANF members, for whom PMPM revenue is much lower.
Health Plans Segment
Premium Revenue
Premium revenue grew 9.0%27%in the year endedDecember 31, 2012, compared with the year endedDecember 31, 2011, primarily due to a shift in member mix to populations generating higher premium revenue PMPM, benefit expansions, and an increase in membership. Medicare premium revenue was $468 million in the year ended December 31, 2010,2012, compared with $388 million in the year endedDecember 31, 2009, due2011.
Growth in our ABD membership led to a membership increase of 10.9%. On a PMPM basis, however, consolidatedhigher premium revenue decreased 2.1% becausePMPM in 2012. ABD membership, as a percent of declinestotal membership, has increased approximately31%year over year. Premium revenue PMPM also increased in premium rates. The decrease in PMPMthe year ended December 31, 2012, as a result of the inclusion of revenue was due to the transfer offrom the pharmacy benefit to the statefee-for-service programs infor our Ohio (effective February 1, 2010) and Missouri (effectivehealth plan effective October 1, 2009). Exclusive2011, and as a result of the transferinclusion of the pharmacy benefit in Ohio and Missouri, Medicaid premium revenue PMPM increased approximately 1.5% over the year ended December 31, 2009. Medicare enrollment exceeded 24,000 members at December 31, 2010, and Medicare premium revenue was $265.2 million for the year ended December 31, 2010, compared with $135.9 million for the year ended December 31, 2009.inpatient facility and pharmacy benefits across all of our Texas health plan membership effective March 1, 2012.
44
Medical Care Costs
The following table provides the details of consolidated medical care costs for the periods indicated (dollars in thousands except PMPM amounts):
41
| Year Ended December 31, | ||||||||||||||||||||||||
| 2010 | 2009 | |||||||||||||||||||||||
| % of | % of | |||||||||||||||||||||||
| Amount | PMPM | Total | Amount | PMPM | Total | |||||||||||||||||||
| Fee-for-service | $ | 2,360,858 | $ | 128.73 | 70.0 | % | $ | 2,077,489 | $ | 126.14 | 65.4 | % | ||||||||||||
| Capitation | 555,487 | 30.29 | 16.5 | 558,538 | 33.91 | 17.6 | ||||||||||||||||||
| Pharmacy | 325,935 | 17.77 | 9.7 | 414,785 | 25.18 | 13.1 | ||||||||||||||||||
| Other | 128,577 | 7.01 | 3.8 | 125,424 | 7.62 | 3.9 | ||||||||||||||||||
| Total | $ | 3,370,857 | $ | 183.80 | 100.0 | % | $ | 3,176,236 | $ | 192.85 | 100.0 | % | ||||||||||||
| Year Ended December 31, | |||||||||||||||||||||
| 2012 | 2011 | ||||||||||||||||||||
| Amount | PMPM | % of Total | Amount | PMPM | % of Total | ||||||||||||||||
| Fee for service | $ | 3,521,960 | $ | 162.60 | 69.1 | % | $ | 2,764,309 | $ | 139.02 | 71.6 | % | |||||||||
| Capitation | 557,087 | 25.72 | 10.9 | 518,835 | 26.09 | 13.4 | |||||||||||||||
| Pharmacy | 835,830 | 38.59 | 16.4 | 418,007 | 21.02 | 10.8 | |||||||||||||||
| Other | 181,883 | 8.39 | 3.6 | 158,843 | 8.00 | 4.2 | |||||||||||||||
| Total | $ | 5,096,760 | $ | 235.30 | 100.0 | % | $ | 3,859,994 | $ | 194.13 | 100.0 | % | |||||||||
Medical care costs increased in2012primarily due to the same shifts in member mix and the benefit expansions that led to increased premium revenue, particularly in California and Texas. Medical care costs as a percentage of premium revenue, net of premium taxes (the medical care ratio) also increased in 2012 when compared with 2011 because increases in premium rates have not kept pace with increases in medical costs.
Individual Health Plan Analysis
Membership and premium revenue increased significantly at the Texas health plan in 2012 as a result of the transition of large numbers of ABD, TANF and CHIP members from fee-for-service reimbursement into managed care effective March 1, 2012. Also on that date inpatient facility and pharmacy benefits that had previously been reimbursed through fee for service for managed care members were transitioned into managed care contracts; further increasing premium revenue and related medical costs. As noted above, margins on newly transitioned ABD members were considerably less than those experienced by the Company overall. The medical care ratio for the Texas health plan's ABD membership in total was approximately 97.8% for all of 2012. Nevertheless, the medical care ratio for the Texas health plan overall decreased to 84.5% 93.7%for the year ended December 31, 2010,all of 2012 compared with 86.8%95.1% for the year ended December 31, 2009.2011.
The medical care ratio ofat the California health plan decreasedincreased significantly in 2012, to 83.5% for91.1% in 2012 from 86.9% in 2011. As noted above, margins on newly transitioned ABD members were considerably less than those experienced by the year ended December 31, 2010, compared with 92.2% for the year ended December 31, 2009, primarily due to lower inpatient facilityfee-for-serviceCompany overall. costs resulting from provider network restructuring and improved medical management.
The medical care ratio of the Florida health plan increaseddecreased to 95.4% for the year ended December 31, 2010,85.3% in 2012, from 93.8% for the year ended December 31, 2009, primarily91.9% in 2011 due to higher capitation costsa premium rate increase effective September 1, 2011, the re-contracting of portions of the health plan's specialty care network, lower inpatient utilization and higherfee-for-servicelower pharmacy costs. costs in the outpatient and physician categories.
The medical care ratio of the Michigan health plan increased to 83.7%88.3% in 2012, from 86.3% in 2011. The primary reason for the year ended December 31, 2010, from 81.5%increase in the medical care ratio in 2012 was a reduction to premium rates linked to a decrease in premium taxes effective April 1, 2012. The result was a higher medical care ratio in 2012 because premium revenue decreased. There was no impact on profitability because premium tax expense was reduced by the same amount as premium revenue. The remainder of the deterioration in the Michigan plan's medical care ratio was the result of higher pharmacy and fee for the year ended December 31, 2009, primarily due to higher inpatient facilityfee-for-serviceservice costs. We received a blended rate increase in Michigan of approximately 2%, effective October 1, 2012. costs.
The medical care ratio of the New Mexico health plan decreasedincreased to 80.6% for the year ended December 31, 2010,84.7% in 2012, from 85.7% for the year ended December 31, 2009,82.4% in 2011, primarily due to reducedfee-for-service costs which more than offset decreasedas a result of lower premiums and higher inpatient facility costs. The New Mexico health plan received a premium revenue PMPM.rate reduction of approximately 2.5% effective July 1, 2011.
The medical care ratio of the Ohio health plan decreasedincreased to 79.1% for the year ended December 31, 2010,88.6% in 2012, from 86.1% for the year ended December 31, 2009, primarily due to an84.1% in 2011. The increase in Medicaid premium PMPMthe Ohio health plan's medical care ratio was partially the result of approximately 6%a 2% rate reduction effective January 1, 2010 (exclusive2012, together with the assumption of the reduction related tolower margin pharmacy benefits), partially offset by higher inpatient facilityfee-for-servicebenefit effective October 1, 2011. costs.
The medical care ratio of the Utah health plan decreasedincreased to 91.3% for the year ended December 31, 2010,82.3% in 2012 from 91.8% for the year ended December 31, 2009, due to improved financial performance78.1% in the second half of 2010. That improved financial performance was the result of reducedfee-for-service2011 costs in the second half of 2010 and an increase in Medicaid. The Utah health plan received a premium PMPMrate reduction of approximately 7%2% effective July 1, 2010.2012.
The addition of ABD members to the Washington health plan effective July 1, 2012 increased its medical care ratio to 86.8% in the 2012, compared with 85.4% in 2011. The higher premium revenue PMPM associated with the ABD membership, however, offset the increased medical care ratio so that income from operations was consistent between 2012 and 2011.
The medical care ratio of the WashingtonWisconsin health plan decreasedincreased to 83.9% for the year ended December 31, 2010 from 84.5% for the year ended December 31, 2009,96.2% in 2012, compared with 92.5% in 2011 primarily due to reducedfee-for-service costs which more than offset decreased premium revenue PMPM. Premium revenue PMPM decreased for allincreases in inpatient costs. The plan has implemented provider contracting initiatives and new utilization management techniques as a part of 2010 compared with 2009 because the rate increaseits efforts to improve profitability.
42
Health Plans Segment Operating Data
The following table summarizes member months, premium revenue, medical care costs, medical care ratio, and premium taxes by health plan for the periods indicated (PMPM amounts are in whole dollars; member months and other dollar amounts are in thousands):
| Year Ended December 31, 2010 | ||||||||||||||||||||||||||||
| Member | Premium Revenue | Medical Care Costs | Medical | Premium Tax | ||||||||||||||||||||||||
| Months(1) | Total | PMPM | Total | PMPM | Care Ratio | Expense | ||||||||||||||||||||||
| California | 4,197 | $ | 506,871 | $ | 120.77 | $ | 423,021 | $ | 100.79 | 83.5 | % | $ | 6,912 | |||||||||||||||
| Florida | 664 | 170,683 | 256.87 | 162,839 | 245.07 | 95.4 | 1 | |||||||||||||||||||||
| Michigan | 2,708 | 630,134 | 232.66 | 527,596 | 194.80 | 83.7 | 39,187 | |||||||||||||||||||||
| Missouri | 946 | 210,852 | 222.98 | 180,291 | 190.66 | 85.5 | — | |||||||||||||||||||||
| New Mexico | 1,104 | 366,784 | 332.02 | 295,633 | 267.61 | 80.6 | 9,300 | |||||||||||||||||||||
| Ohio | 2,817 | 860,324 | 305.42 | 680,802 | 241.69 | 79.1 | 67,358 | |||||||||||||||||||||
| Texas | 708 | 188,716 | 266.72 | 162,714 | 229.97 | 86.2 | 3,251 | |||||||||||||||||||||
| Utah | 921 | 258,076 | 280.27 | 235,576 | 255.84 | 91.3 | — | |||||||||||||||||||||
| Washington | 4,141 | 758,849 | 183.27 | 636,617 | 153.75 | 83.9 | 13,513 | |||||||||||||||||||||
| Wisconsin(2) | 134 | 30,033 | 224.75 | 27,574 | 206.35 | 91.8 | — | |||||||||||||||||||||
| Other(3) | — | 8,587 | — | 38,194 | — | — | 253 | |||||||||||||||||||||
| 18,340 | $ | 3,989,909 | $ | 217.56 | $ | 3,370,857 | $ | 183.80 | 84.5 | % | $ | 139,775 | ||||||||||||||||
| Year Ended December 31, 2012 | |||||||||||||||||||||||||
Member Months(1) | Premium Revenue | Medical Care Costs | Premium Tax Expense | MCR Excluding Premium Tax Expense(4) | |||||||||||||||||||||
| Total | PMPM | Total | PMPM | ||||||||||||||||||||||
| California | 4,177 | $ | 671,489 | $ | 160.77 | $ | 606,494 | $ | 145.20 | $ | 5,697 | 91.1 | % | ||||||||||||
| Florida | 850 | 228,828 | 269.36 | 195,226 | 229.80 | (4 | ) | 85.3 | |||||||||||||||||
| Michigan | 2,639 | 658,741 | 249.59 | 570,636 | 216.20 | 12,190 | 88.3 | ||||||||||||||||||
Missouri(2) | 483 | 113,818 | 236.87 | 113,101 | 234.15 | — | 99.4 | ||||||||||||||||||
| New Mexico | 1,069 | 338,770 | 316.90 | 280,108 | 262.03 | 8,208 | 84.7 | ||||||||||||||||||
| Ohio | 3,065 | 1,187,422 | 387.48 | 970,504 | 316.69 | 92,285 | 88.6 | ||||||||||||||||||
| Texas | 3,245 | 1,255,722 | 386.99 | 1,155,433 | 356.08 | 22,101 | 93.7 | ||||||||||||||||||
| Utah | 1,026 | 298,392 | 290.78 | 245,671 | 239.41 | — | 82.3 | ||||||||||||||||||
| Washington | 4,600 | 992,748 | 215.83 | 845,733 | 183.87 | 18,036 | 86.8 | ||||||||||||||||||
| Wisconsin | 508 | 70,673 | 139.24 | 67,968 | 133.91 | (5 | ) | 96.2 | |||||||||||||||||
Other(3) | — | 9,888 | — | 45,886 | — | 483 | — | ||||||||||||||||||
| 21,662 | $ | 5,826,491 | $ | 268.99 | $ | 5,096,760 | $ | 235.30 | $ | 158,991 | 89.9 | % | |||||||||||||
| Year Ended December 31, 2009 | ||||||||||||||||||||||||||||
| Member | Premium Revenue | Medical Care Costs | Medical | Premium Tax | ||||||||||||||||||||||||
| Months(1) | Total | PMPM | Total | PMPM | Care Ratio | Expense | ||||||||||||||||||||||
| California | 4,135 | $ | 481,717 | $ | 116.49 | $ | 443,892 | $ | 107.34 | 92.2 | % | $ | 16,446 | |||||||||||||||
| Florida | 386 | 102,232 | 264.94 | 95,936 | 248.62 | 93.8 | 16 | |||||||||||||||||||||
| Michigan | 2,523 | 557,421 | 220.94 | 454,431 | 180.12 | 81.5 | 36,482 | |||||||||||||||||||||
| Missouri | 927 | 230,222 | 248.25 | 191,585 | 206.59 | 83.2 | — | |||||||||||||||||||||
| New Mexico | 1,042 | 404,026 | 387.67 | 346,044 | 332.03 | 85.7 | 11,043 | |||||||||||||||||||||
| Ohio | 2,411 | 803,521 | 333.33 | 691,402 | 286.82 | 86.1 | 47,849 | |||||||||||||||||||||
| Texas | 402 | 134,860 | 335.69 | 110,794 | 275.78 | 82.2 | 2,513 | |||||||||||||||||||||
| Utah | 793 | 207,297 | 261.43 | 190,319 | 240.02 | 91.8 | — | |||||||||||||||||||||
| Washington | 3,847 | 726,137 | 188.77 | 613,876 | 159.58 | 84.5 | 14,175 | |||||||||||||||||||||
| Wisconsin(2) | — | — | — | — | — | — | — | |||||||||||||||||||||
| Other(3),(4) | — | 12,774 | — | 37,957 | — | — | 57 | |||||||||||||||||||||
| 16,466 | $ | 3,660,207 | $ | 222.24 | $ | 3,176,236 | $ | 192.85 | 86.8 | % | $ | 128,581 | ||||||||||||||||
| Year Ended December 31, 2011 | |||||||||||||||||||||||||
Member Months(1) | Premium Revenue | Medical Care Costs | Premium Tax Expense | MCR Excluding Premium Tax Expense(4) | |||||||||||||||||||||
| Total | PMPM | Total | PMPM | ||||||||||||||||||||||
| California | 4,190 | $ | 575,176 | $ | 137.27 | $ | 493,419 | $ | 117.75 | $ | 7,499 | 86.9 | % | ||||||||||||
| Florida | 788 | 203,945 | 258.70 | 187,358 | 237.66 | 41 | 91.9 | ||||||||||||||||||
| Michigan | 2,660 | 662,127 | 248.91 | 537,779 | 202.16 | 38,733 | 86.3 | ||||||||||||||||||
Missouri(2) | 959 | 229,584 | 239.38 | 195,832 | 204.19 | — | 85.3 | ||||||||||||||||||
| New Mexico | 1,074 | 345,732 | 321.94 | 277,338 | 258.25 | 9,285 | 82.4 | ||||||||||||||||||
| Ohio | 2,966 | 988,896 | 333.40 | 766,949 | 258.57 | 76,677 | 84.1 | ||||||||||||||||||
| Texas | 1,616 | 409,295 | 253.40 | 382,390 | 236.74 | 7,117 | 95.1 | ||||||||||||||||||
| Utah | 972 | 287,290 | 295.51 | 224,513 | 230.94 | — | 78.1 | ||||||||||||||||||
| Washington | 4,171 | 823,323 | 197.42 | 690,513 | 165.57 | 14,865 | 85.4 | ||||||||||||||||||
| Wisconsin | 488 | 69,596 | 142.56 | 64,346 | 131.81 | 44 | 92.5 | ||||||||||||||||||
Other(3) | — | 8,443 | — | 39,557 | — | 328 | — | ||||||||||||||||||
| 19,884 | $ | 4,603,407 | $ | 231.51 | $ | 3,859,994 | $ | 194.13 | $ | 154,589 | 86.8 | % | |||||||||||||
____________
| (1) | A member month is defined as the aggregate of each month’s ending membership for the period presented. |
| (2) | Our contract with the state of Missouri expired without renewal on June 30, 2012. The Missouri health plan's claims run-out activity subsequent to June 30, 2012, is reported in “Other.” |
| (3) | “Other” medical care costs also include medically related administrative costs |
| (4) |
Days in Medical Claims and Benefits Payable
46
The days in medical claims and benefits payable amount previously reported includedall medical care costs(fee-for-service, capitation, pharmacy, and administrative), andallmedical claims liabilities, including those liabilities that are typically paid concurrently, or shortly after the costs are incurred, such as capitation costs and pharmacy costs. Medical claims liabilities in this calculation do not include accrued costs — such as salaries — associated with the administrative portion of medical costs. By including onlyfee-for-service medical costs and liabilities in this computation, our days in claims payable metric is more indicative of the size of our reserves for liabilities subject to a substantial degree of estimation. The days in medical claims and benefits payable, excluding our Wisconsin health plan which was acquired September 1, 2010, were as follows:
| December 31, | ||||||||||||
| 2010 | 2009 | 2008 | ||||||||||
Days in claims payable —fee-for-service only | 42 days | 44 days | 51 days | |||||||||
| Number of claims in inventory at end of period | 143,600 | 93,100 | 87,300 | |||||||||
| Billed charges of claims in inventory at end of period (in thousands) | $ | 218,900 | $ | 131,400 | $ | 115,400 | ||||||
43
| December 31, | |||||||||||
| 2012 | 2011 | 2010 | |||||||||
| Days in claims payable: fee-for-service only | 40 days | 40 days | 42 days | ||||||||
| Number of claims in inventory at end of period | 122,700 | 111,100 | 143,600 | ||||||||
| Billed charges of claims in inventory at end of period (in thousands) | $ | 255,200 | $ | 207,600 | $ | 218,900 | |||||
Molina Medicaid Solutions contributed $2.6 million to operating income for the year ended December 31, 2010, but reported an operating loss of $3.6 million for the quarter ended December 31, 2010. The operating loss for the fourth quarter of 2010 was primarily the result of system stabilization costs incurred for two of Molina Medicaid Solutions’ contracts.
Segment
Performance of the Molina Medicaid Solutions segment for the year ended December 31, 2010 was as follows:
| (In thousands) | ||||
| Service revenue before amortization | $ | 98,125 | ||
| Less: amortization of contract backlog recorded as contra-service revenue | (8,316 | ) | ||
| Service revenue | 89,809 | |||
| Cost of service revenue | 78,647 | |||
| General and administrative costs | 5,135 | |||
| Amortization of customer relationship intangibles recorded as amortization | 3,418 | |||
| Operating income | $ | 2,609 | ||
47
| Year Ended December 31, | |||||||
| 2012 | 2011 | ||||||
| (In thousands) | |||||||
| Service revenue before amortization | $ | 189,281 | $ | 167,269 | |||
| Amortization recorded as reduction of service revenue | (1,571 | ) | (6,822 | ) | |||
| Service revenue | 187,710 | 160,447 | |||||
| Cost of service revenue | 141,208 | 143,987 | |||||
| General and administrative costs | 17,648 | 9,270 | |||||
| Amortization of customer relationship intangibles recorded as amortization | 5,127 | 5,127 | |||||
| Operating income | $ | 23,727 | $ | 2,063 | |||
Operating income for our Molina Medicaid Solutions segment improved$21.7 millionfor the year endedDecember 31, 2012, compared with2011. This improvement was primarily the result of stabilization of our newest contracts in Idaho and Maine.
Consolidated Expenses
General and Administrative Expenses
General and administrative or G&A, expenses were $346.0 million, or 8.5%increased to 8.8% of total revenue for the year ended December 31, 20102012, compared with $276.0 million, or 7.5%8.7% of total revenue for the year ended December 31, 2009. The increase in the G&A ratio was the result of higher administrative expenses for the Health Plans segment, driven in part by the cost of our Medicare expansion, higher variable compensation expense as a result of substantially improved financial performance in 2010, employee severance and settlement costs, and costs relating to the acquisitions of Molina Medicaid Solutions and the Wisconsin health plan.2011.
| Year Ended December 31, | ||||||||||||||||
| 2010 | 2009 | |||||||||||||||
| % of Total | % of Total | |||||||||||||||
| Amount | Revenue | Amount | Revenue | |||||||||||||
| (In thousands) | ||||||||||||||||
| Medicare-related administrative costs | $ | 30,254 | 0.7 | % | $ | 18,564 | 0.5 | % | ||||||||
| Non Medicare-related administrative costs: | ||||||||||||||||
| Health Plans segment administrative payroll, including employee incentive compensation | 239,146 | 5.9 | 204,432 | 5.6 | ||||||||||||
| Molina Medicaid Solutions segment administrative expenses | 5,135 | 0.1 | — | — | ||||||||||||
| Employee severance and settlement costs | 5,548 | 0.1 | 1,257 | — | ||||||||||||
| Molina Medicaid Solutions and Wisconsin plan acquisition costs | 2,957 | 0.1 | — | — | ||||||||||||
| All other Health Plans segment administrative expense | 62,953 | 1.6 | 51,774 | 1.4 | ||||||||||||
| $ | 345,993 | 8.5 | % | $ | 276,027 | 7.5 | % | |||||||||
Premium Tax Expense
Premium tax expense relatingdecreased to Health Plans segment2.8% of premium revenue was net of premium tax for the year ended December 31, 2012, compared with 3.5% of total premium revenue for both yearsthe year ended December 31, 2010,2011. The decrease in 2012 was primarily due to the reduction of premium taxes at the Michigan and 2009.California health plans effective in 2012, and the growth in revenue at our Texas health plan, which is subject to a lower premium tax rate (measured as a percentage of premium revenue) than our consolidated average.
Depreciation and Amortization
Depreciation and amortization related to our Health Plans segment is all recorded in “Depreciation and Amortization” in the consolidated statements of income. Depreciation and amortization related to our Molina Medicaid Solutions segment is recorded within three different captionsheadings in the consolidated statements of income as follows:
Amortization of purchased intangibles relating to customer relationships is reported as amortization within the heading “Depreciation and amortization;” Amortization of purchased intangibles relating to contract backlog is recorded as a reduction of “Service revenue;” and Depreciation is recorded within the heading “Cost of service revenue.” | ||
48
The following table presents all depreciation and amortization recorded in our consolidated statements of income, regardless of whether the item appears as depreciation and amortization, a reduction of revenue, or as cost of service revenue,revenue.
44
| Year Ended December 31, | |||||||||||||
| 2012 | 2011 | ||||||||||||
| Amount | % of Total Revenue | Amount | % of Total Revenue | ||||||||||
| (Dollar amounts in thousands) | |||||||||||||
| Depreciation, and amortization of capitalized software | $ | 43,201 | 0.7 | % | $ | 30,864 | 0.7 | % | |||||
| Amortization of intangible assets | 20,503 | 0.3 | 19,826 | 0.4 | |||||||||
| Depreciation and amortization reported as such in the consolidated statements of income | 63,704 | 1.0 | 50,690 | 1.1 | |||||||||
| Amortization recorded as reduction of service revenue | 1,571 | — | 6,822 | 0.1 | |||||||||
| Amortization of capitalized software recorded as cost of service revenue | 13,489 | 0.2 | 16,871 | 0.4 | |||||||||
| Total | $ | 78,764 | 1.2 | % | $ | 74,383 | 1.6 | % | |||||
Impairment of Goodwill and reconcilesIntangible Assets
We did not record an impairment charge in 2012. On February 17, 2012, our Missouri health plan was notified that amountit was not awarded a new contract under the state’s RFP, and therefore its contract expired on June 30, 2012. As a result, we recorded a non-cash impairment charge of approximately $64.6 million, or $1.34 per diluted share, in the fourth quarter of 2011. Of the total charge, $58.5 million was not tax deductible, resulting in a disproportionate impact to net income and to the consolidated statements of cash flows.
| Year Ended December 31, | ||||||||||||||||
| 2010 | 2009 | |||||||||||||||
| % of Total | % of Total | |||||||||||||||
| Amount | Revenue | Amount | Revenue | |||||||||||||
| (In thousands) | ||||||||||||||||
| Depreciation | $ | 27,230 | 0.7 | % | $ | 25,172 | 0.7 | % | ||||||||
| Amortization of intangible assets | 18,474 | 0.4 | 12,938 | 0.3 | ||||||||||||
| Depreciation and amortization reported in the consolidated statements of income | 45,704 | 1.1 | 38,110 | 1.0 | ||||||||||||
| Amortization recorded as reduction of service revenue | 8,316 | 0.2 | — | — | ||||||||||||
| Depreciation recorded as cost of service revenue | 6,745 | 0.2 | — | — | ||||||||||||
| Depreciation and amortization reported in the consolidated statements of cash flows | $ | 60,765 | 1.5 | % | $ | 38,110 | 1.0 | % | ||||||||
Interest Expense
Interest expense increased to $15.5was $16.8 million for the year ended December 31, 2010, from $13.82012, compared with $15.5 million for the year ended December 31, 2009. We incurred higher interest expense relating to the $105 million draw on our credit facility (beginning May 1, 2010) to fund the acquisition of Molina Medicaid Solutions. Amounts borrowed to fund this acquisition were repaid in the third quarter using proceeds from our equity offering in the third quarter of 2010.2011. Interest expense includes non-cash interest expense relating to our convertible senior notes, which totaled $5.1 million and $4.8 million for the years ended December 31, 2010, and 2009, respectively.
Income Taxes
Income tax expense is recorded at an effective rate of 48.6% for the year ended December 31, 2012, compared with 67.8% for the year ended December 31, 2011. The effective rate for the year ended December 31, 2012 is higher than our statutory rate primarily due to net income for either period presentednondeductible expenses primarily relating to this change.compensation and changes in the fair value of contingent consideration. The effective rate for the year ended December 31, 2011 reflects the nondeductible nature of the majority of the Missouri impairment charge and certain discrete tax benefits.
Year Ended December 31, 20092011 Compared with the Year Ended December 31, 20082010
Fiscal Year 2011 Overview and Highlights
For the year, our net income was $20.8 million, or $0.45 per diluted share, a decrease of 66% over 2010. We recorded a non-cash impairment charge of approximately $64.6 million, or $1.34 per diluted share, in connection with the expiration of our Missouri health plan's contract with the state of Missouri effective June 30, 2012. Absent this impairment charge, improved performance of the Health Plans Segment
We earned premium revenues of $4.6 billion, up 15.4% over the previous year. Meanwhile, we achieved a medical care ratio of 86.8%, compared with a medical care ratio of 87.6% for fiscal year 2010.
Health Plans Segment
Premium Revenue
Premium revenue increased 15.4% in the year ended December 31, 2011, compared with the same periodyear ended December 31, 2010, due to a membership increase of approximately 8.4% (on a member-month basis), and PMPM revenue increase of approximately 6.4%. Premium revenues were impacted by the following in 2008. During 2009, membership grew 16% overall,2011:
In the fourth quarter of 2011, our New Mexico health plan entered into a contract amendment that more closely aligns the calculation of revenue with Florida, California, Washington,the methodology adopted under the Affordable Care Act. The contract amendment changed the calculation of the amount of revenue that may be recognized relative to medical costs, and Ohio gainingresulted in the most members. Consolidatedrecognition of approximately $5.6 million of premium revenue which all related to periods prior to 2011.
Also in the fourth quarter of 2011, the addition of pharmacy benefits at our Ohio health plan effective October 1, 2011, increased 5.3% on a PMPM basis. Increased membership contributed 71%premium revenue.
45
Absent the growth inadjustment to New Mexico premium revenue and increases in PMPM revenue, as a result of both rate changes and shifts in member mix, contributed the remaining 29%.
49
Medical care costs
Care Costs
The following table provides the details of consolidated medical care costs for the periods indicated (dollars in thousands except PMPM amounts):
| Year Ended December 31, | ||||||||||||||||||||||||
| 2009 | 2008 | |||||||||||||||||||||||
| % of | % of | |||||||||||||||||||||||
| Amount | PMPM | Total | Amount | PMPM | Total | |||||||||||||||||||
| Fee-for-service | $ | 2,077,489 | $ | 126.14 | 65.4 | % | $ | 1,709,806 | $ | 116.69 | 65.2 | % | ||||||||||||
| Capitation | 558,538 | 33.91 | 17.6 | 450,440 | 30.74 | 17.2 | ||||||||||||||||||
| Pharmacy | 414,785 | 25.18 | 13.1 | 356,184 | 24.31 | 13.6 | ||||||||||||||||||
| Other | 125,424 | 7.62 | 3.9 | 104,882 | 7.16 | 4.0 | ||||||||||||||||||
| Total | $ | 3,176,236 | $ | 192.85 | 100.0 | % | $ | 2,621,312 | $ | 178.90 | 100.0 | % | ||||||||||||
| Year Ended December 31, | |||||||||||||||||||||
| 2011 | 2010 | ||||||||||||||||||||
| Amount | PMPM | % of Total | Amount | PMPM | % of Total | ||||||||||||||||
| Fee for service | $ | 2,764,309 | $ | 139.02 | 71.6 | % | $ | 2,360,858 | $ | 128.73 | 70.0 | % | |||||||||
| Capitation | 518,835 | 26.09 | 13.4 | 555,487 | 30.29 | 16.5 | |||||||||||||||
| Pharmacy | 418,007 | 21.02 | 10.8 | 325,935 | 17.77 | 9.7 | |||||||||||||||
| Other | 158,843 | 8.00 | 4.2 | 128,577 | 7.01 | 3.8 | |||||||||||||||
| Total | $ | 3,859,994 | $ | 194.13 | 100.0 | % | $ | 3,370,857 | $ | 183.80 | 100.0 | % | |||||||||
The medical care ratio decreased to 86.8% for the year ended December 31, 2011, compared with 87.6% for the year ended December 31, 2010.
The medical care ratio of the California health plan increased to 86.9% for the year ended December 31, 2011, from 84.6% for the year ended December 31, 2010. The California health plan received premium reductions of approximately 3% and 1% effective July 1, 2011, and October 1, 2011, respectively. In the second half of 2011, the California health plan added approximately 14,500 new ABD members with average premium revenue of approximately $385 PMPM.
The medical care ratio of the Florida health plan decreased to 91.9% for the year ended December 31, 2011, from 95.4% for the year ended December 31, 2010, primarily due to initiatives that have reduced pharmacy and behavioral health costs, and a premium rate increase of approximately 7.5% effective September 1, 2011.
The medical care ratio of the Michigan health plan decreased to 86.3% for the year ended December 31, 2011, from 89.3% for the year ended December 31, 2010, primarily due to improved Medicare performance and lower inpatient facility costs. The Michigan health plan received a premium rate increase of approximately 1% effective October 1, 2011.
The medical care ratio of the Missouri health plan decreased to 85.3% for the year ended December 31, 2011, from 85.5% for the year ended December 31, 2010. The health plan received a premium rate increase of approximately 5% effective July 1, 2011.
The medical care ratio of the New Mexico health plan decreased to 82.4% for the year ended December 31, 2011, from 82.7% for the year ended December 31, 2010. The New Mexico health plan received a premium rate reduction of approximately 2.5% effective July 1, 2011. As discussed above, the New Mexico health plan entered into a contract amendment that changed the calculation of the amount of revenue that may be recognized relative to medical costs in the aggregate, increased 8% on afourth quarter of 2011. Consequently, premium revenue recognized in the year ended December 31, 2011, includes $5.6 million related to periods prior to 2011.
The medical care ratio of the Ohio health plan decreased to 84.1% for the year ended December 31, 2011, from 85.9% for the year ended December 31, 2010, due to an increase in Medicaid premium PMPM basisof approximately 4.5% effective January 1, 2011, and relatively flat fee-for-service costs. The pharmacy benefit was restored to all managed care plans in Ohio effective October 1, 2011.
The medical care ratio of the Texas health plan increased to 95.1% for the year ended December 31, 2011, from 87.7% for the year ended December 31, 2010. Effective February 1, 2011, we added approximately 30,000 ABD members in the Dallas-Fort Worth area and effective September 1, 2011, we added approximately 8,000 ABD members and 3,000 TANF members in the Jefferson Service area. Medical costs in the Dallas-Fort Worth area were well in excess of premium revenue. Excluding the ABD population in the Dallas-Fort Worth region, the medical care ratio of the Texas health plan was 87.2% for the year ended December 31, 2009 compared with the same period in 2008. 2011.
The medical care ratio was 86.8%of the Utah health plan decreased to 78.1% for the year ended December 31, 2009, compared with 84.8%2011, from 91.3% for the same periodyear ended December 31, 2010, primarily due to reduced fee-for-service inpatient and physician costs and an increase in 2008. Increased expenses
46
Medicaid premiums PMPM. Effective July 1, 2010, the Utah health plan received a premium rate increase of approximately 7%. Lower fee-for-service costs were generally the result of higher utilization rather than higherboth lower unit costs (exceptand lower utilization. During the second quarter of 2011 we settled certain claims with the state regarding the savings share provision of our contract in effect from 2003 through June of 2009. We settled for the casecontract years 2006 through 2009 and recognized $6.9 million in premium revenue without any corresponding charge to expense. The Utah health plan received a premium rate reduction of outpatient costs, where both utilization and unit costs increased) and were most pronounced in connection with physician and outpatient emergency room facility services. Influenza-related illnesses andapproximately 2% effective July 1, 2011.
The medical care ratio of the costs associated with more recently enrolled members were key factors in the higher utilization. We estimate that the incremental costs associated with influenza-related illnesses were approximately $35 million, or $0.83 per diluted share, inWashington health plan remained flat at 85.4% for the year ended December 31, 20092011 compared with the year ended December 31, 2008.2010. Higher fee-for-service and pharmacy costs were offset by lower capitation costs.
50
Health Plans Segment Operating Data
The following table summarizes member months, premium revenue, medical care costs, medical care ratio, and premium taxes by health plan for the periods indicated (PMPM amounts are in whole dollars; member months and other dollar amounts are in thousands):
| Year Ended December 31, 2009 | ||||||||||||||||||||||||||||
| Member | Premium Revenue | Medical Care Costs | Medical | Premium Tax | ||||||||||||||||||||||||
| Months(1) | Total | PMPM | Total | PMPM | Care Ratio | Expense | ||||||||||||||||||||||
| California | 4,135 | $ | 481,717 | $ | 116.49 | $ | 443,892 | $ | 107.34 | 92.2 | % | $ | 16,446 | |||||||||||||||
| Florida(2) | 386 | 102,232 | 264.94 | 95,936 | 248.62 | 93.8 | 16 | |||||||||||||||||||||
| Michigan | 2,523 | 557,421 | 220.94 | 454,431 | 180.12 | 81.5 | 36,482 | |||||||||||||||||||||
| Missouri | 927 | 230,222 | 248.25 | 191,585 | 206.59 | 83.2 | — | |||||||||||||||||||||
| New Mexico | 1,042 | 404,026 | 387.67 | 346,044 | 332.03 | 85.7 | 11,043 | |||||||||||||||||||||
| Ohio | 2,411 | 803,521 | 333.33 | 691,402 | 286.82 | 86.1 | 47,849 | |||||||||||||||||||||
| Texas | 402 | 134,860 | 335.69 | 110,794 | 275.78 | 82.2 | 2,513 | |||||||||||||||||||||
| Utah | 793 | 207,297 | 261.43 | 190,319 | 240.02 | 91.8 | — | |||||||||||||||||||||
| Washington | 3,847 | 726,137 | 188.77 | 613,876 | 159.58 | 84.5 | 14,175 | |||||||||||||||||||||
| Other(3),(4) | — | 12,774 | — | 37,957 | — | — | 57 | |||||||||||||||||||||
| 16,466 | $ | 3,660,207 | $ | 222.24 | $ | 3,176,236 | $ | 192.85 | 86.8 | % | $ | 128,581 | ||||||||||||||||
| Year Ended December 31, 2008 | |||||||||||||||||||||||||||||||||||||||||||||||||||||
| Member | Premium Revenue | Medical Care Costs | Medical | Premium Tax | Year Ended December 31, 2011 | ||||||||||||||||||||||||||||||||||||||||||||||||
| Months(1) | Total | PMPM | Total | PMPM | Care Ratio | Expense | Member Months(1) | Premium Revenue | Medical Care Costs | Premium Tax Expense | MCR Excluding Premium Tax Expense(4) | ||||||||||||||||||||||||||||||||||||||||||
Member Months(1) | Total | PMPM | Total | PMPM | Premium Tax Expense | MCR Excluding Premium Tax Expense(4) | |||||||||||||||||||||||||||||||||||||||||||||||
| California | 3,721 | $ | 417,027 | $ | 112.06 | $ | 363,776 | $ | 97.75 | 87.2 | $ | 12,503 | 4,190 | $ | 575,176 | $ | 137.27 | $ | 493,419 | $ | 117.75 | $ | 7,499 | 86.9 | % | ||||||||||||||||||||||||||||
| Florida | — | — | — | — | — | — | — | 788 | 203,945 | 258.70 | 187,358 | 237.66 | 41 | 91.9 | |||||||||||||||||||||||||||||||||||||||
| Michigan | 2,526 | 509,782 | 201.86 | 405,683 | 160.64 | 79.6 | 31,760 | 2,660 | 662,127 | 248.91 | 537,779 | 202.16 | 38,733 | 86.3 | |||||||||||||||||||||||||||||||||||||||
| Missouri | 910 | 225,280 | 247.62 | 184,298 | 202.58 | 81.8 | — | 959 | 229,584 | 239.38 | 195,832 | 204.19 | — | 85.3 | |||||||||||||||||||||||||||||||||||||||
| New Mexico | 970 | 348,576 | 359.45 | 286,004 | 294.92 | 82.1 | 11,713 | 1,074 | 345,732 | 321.94 | 277,338 | 258.25 | 9,285 | 82.4 | |||||||||||||||||||||||||||||||||||||||
| Ohio | 1,998 | 602,826 | 301.76 | 549,182 | 274.91 | 91.1 | 30,505 | 2,966 | 988,896 | 333.40 | 766,949 | 258.57 | 76,677 | 84.1 | |||||||||||||||||||||||||||||||||||||||
| Texas | 348 | 110,178 | 316.32 | 84,324 | 242.09 | 76.5 | 1,995 | 1,616 | 409,295 | 253.40 | 382,390 | 236.74 | 7,117 | 95.1 | |||||||||||||||||||||||||||||||||||||||
| Utah | 659 | 155,991 | 236.75 | 139,011 | 210.98 | 89.1 | — | 972 | 287,290 | 295.51 | 224,513 | 230.94 | — | 78.1 | |||||||||||||||||||||||||||||||||||||||
| Washington | 3,514 | 709,943 | 202.02 | 575,085 | 163.64 | 81.0 | 11,668 | 4,171 | 823,323 | 197.42 | 690,513 | 165.57 | 14,865 | 85.4 | |||||||||||||||||||||||||||||||||||||||
| Other(3),(4) | — | 11,637 | — | 33,949 | — | — | 21 | ||||||||||||||||||||||||||||||||||||||||||||||
| Wisconsin | 488 | 69,596 | 142.56 | 64,346 | 131.81 | 44 | 92.5 | ||||||||||||||||||||||||||||||||||||||||||||||
Other(3) | — | 8,443 | — | 39,557 | — | 328 | — | ||||||||||||||||||||||||||||||||||||||||||||||
| 19,884 | $ | 4,603,407 | $ | 231.51 | $ | 3,859,994 | $ | 194.13 | $ | 154,589 | 86.8 | % | |||||||||||||||||||||||||||||||||||||||||
| 14,646 | $ | 3,091,240 | $ | 210.97 | $ | 2,621,312 | $ | 178.90 | 84.8 | % | $ | 100,165 | |||||||||||||||||||||||||||||||||||||||||
| Year Ended December 31, 2010 | |||||||||||||||||||||||||
Member Months(1) | Premium Revenue | Medical Care Costs | Premium Tax Expense | MCR Excluding Premium Tax Expenses(4) | |||||||||||||||||||||
| Total | PMPM | Total | PMPM | ||||||||||||||||||||||
| California | 4,197 | $ | 506,871 | $ | 120.77 | $ | 423,021 | $ | 100.79 | $ | 6,912 | 84.6 | % | ||||||||||||
| Florida | 664 | 170,683 | 256.87 | 162,839 | 245.07 | 1 | 95.4 | ||||||||||||||||||
| Michigan | 2,708 | 630,134 | 232.66 | 527,596 | 194.80 | 39,187 | 89.3 | ||||||||||||||||||
Missouri(2) | 946 | 210,852 | 222.98 | 180,291 | 190.66 | — | 85.5 | ||||||||||||||||||
| New Mexico | 1,104 | 366,784 | 332.02 | 295,633 | 267.61 | 9,300 | 82.7 | ||||||||||||||||||
| Ohio | 2,817 | 860,324 | 305.42 | 680,802 | 241.69 | 67,358 | 85.9 | ||||||||||||||||||
| Texas | 708 | 188,716 | 266.72 | 162,714 | 229.97 | 3,251 | 87.7 | ||||||||||||||||||
| Utah | 921 | 258,076 | 280.27 | 235,576 | 255.84 | — | 91.3 | ||||||||||||||||||
| Washington | 4,141 | 758,849 | 183.27 | 636,617 | 153.75 | 13,513 | 85.4 | ||||||||||||||||||
| Wisconsin | 134 | 30,033 | 224.75 | 27,574 | 206.35 | — | 91.8 | ||||||||||||||||||
Other(3) | — | 8,587 | — | 38,194 | — | 253 | — | ||||||||||||||||||
| 18,340 | $ | 3,989,909 | $ | 217.56 | $ | 3,370,857 | $ | 183.80 | $ | 139,775 | 87.6 | % | |||||||||||||
| (1) | A member month is defined as the aggregate of each month’s ending membership for the period presented. |
47
| (2) | Our contract with the state of Missouri expired without renewal on June 30, 2012. |
| (3) | “Other” medical care costs also include medically related administrative costs at the parent company. |
| (4) |
| Year Ended December 31, 2011 | Eight Months Ended December 31, 2010 | |||||
| (In thousands) | ||||||
| Service revenue before amortization | $ | 167,269 | $ | 98,125 | ||
| Amortization recorded as reduction of service revenue | (6,822 | ) | (8,316 | ) | ||
| Service revenue | 160,447 | 89,809 | ||||
| Cost of service revenue | 143,987 | 78,647 | ||||
| General and administrative costs | 9,270 | 5,135 | ||||
| Amortization of customer relationship intangibles recorded as amortization | 5,127 | 3,418 | ||||
| Operating income | $ | 2,063 | $ | 2,609 | ||
For the year ended December 31, 2008.Year-over-year, premium2011, cost of service revenue grew faster than administrativeincluded $11.5 million of direct costs causing administrativeassociated with the Idaho contract that would otherwise have been recorded as deferred contract costs. In assessing the recoverability of the deferred contract costs associated with the Idaho contract during 2011, we determined that these costs should be expensed as a percentageperiod cost. In December 2011, our MMIS in Maine received full certification from CMS.
Consolidated Expenses and Other
General and Administrative Expenses
General and administrative expenses were $415.9 million, or 8.7% of total revenue, to decrease. On a PMPM basis, G&A decreased to $16.76 in 2009, from $17.04 for the same period in 2008.
| Year Ended December 31, | ||||||||||||||||
| 2009 | 2008 | |||||||||||||||
| % of Total | % of Total | |||||||||||||||
| Amount | Revenue | Amount | Revenue | |||||||||||||
| (In thousands) | ||||||||||||||||
| Medicare-related administrative costs | $ | 18,857 | 0.5 | % | $ | 18,451 | 0.6 | % | ||||||||
| Non Medicare-related administrative costs: | ||||||||||||||||
| Administrative payroll, including employee incentive compensation | 205,396 | 5.6 | 190,932 | 6.1 | ||||||||||||
| Florida health plan start up expenses | — | — | 2,495 | 0.1 | ||||||||||||
| All other administrative expense | 51,774 | 1.4 | 37,768 | 1.2 | ||||||||||||
| G&A expenses | $ | 276,027 | 7.5 | % | $ | 249,646 | 8.0 | % | ||||||||
Premium Tax Expense
Premium tax expense decreased to depreciation expense associated3.5% of premium revenue net of premium tax for the year ended December 31, 2011, compared with investments in infrastructure. 3.6% for December 31, 2010.
Depreciation and Amortization
The following table presents the components ofall depreciation and amortization:amortization recorded in our consolidated statements of income, regardless of whether the item appears as depreciation and amortization, a reduction of service revenue, or as cost of service revenue.
| Year Ended December 31, | ||||||||||||||||
| 2009 | 2008 | |||||||||||||||
| % of Total | % of Total | |||||||||||||||
| Amount | Revenue | Amount | Revenue | |||||||||||||
| (In thousands) | ||||||||||||||||
| Depreciation | $ | 25,172 | 0.7 | % | $ | 20,718 | 0.7 | % | ||||||||
| Amortization of intangible assets | 12,938 | 0.3 | 12,970 | 0.4 | ||||||||||||
| Depreciation and amortization reported in the consolidated statements of cash flows | $ | 38,110 | 1.0 | % | $ | 33,688 | 1.1 | % | ||||||||
48
| Year Ended December 31, | |||||||||||||
| 2011 | 2010 | ||||||||||||
| Amount | % of Total Revenue | Amount | % of Total Revenue | ||||||||||
| (Dollar amounts in thousands) | |||||||||||||
| Depreciation, and amortization of capitalized software | $ | 30,864 | 0.7 | % | $ | 27,230 | 0.7 | % | |||||
| Amortization of intangible assets | 19,826 | 0.4 | 18,474 | 0.4 | |||||||||
| Depreciation and amortization reported as such in the consolidated statements of income | 50,690 | 1.1 | 45,704 | 1.1 | |||||||||
| Amortization recorded as reduction of service revenue | 6,822 | 0.1 | 8,316 | 0.2 | |||||||||
| Amortization of capitalized software recorded as cost of service revenue | 16,871 | 0.4 | 6,745 | 0.2 | |||||||||
| Total | $ | 74,383 | 1.6 | % | $ | 60,765 | 1.5 | % | |||||
Impairment of Goodwill and Intangible Assets
On February 17, 2012, our Missouri health plan was notified that it was not awarded a new contract under the state’s RFP, and therefore its contract expired on Retirement of Convertible Senior Notes
Interest Expense
Interest expense was $13.8$15.5 million for each of the yearyears ended December 31, 2009, a slight increase over interest expense of $13.2 million for the year ended December 31, 2008.2011 and 2010. Interest expense includes non-cash interest expense relating to our convertible senior notes, which totaled $4.8 million, and $4.7 million for the years ended December 31, 2009, and 2008, respectively.
52
Income Taxes
Income tax expense was no impact to net incomerecorded at an effective rate of 67.8% for either period presented relating to this change.
the year ended AcquisitionsDecember 31, 2011
Acquisitions
Molina Center. On December 7, 2011, our wholly owned subsidiary Molina Center LLC closed on its acquisition of the 460,000 square foot office building located in Long Beach, California. The building, or Molina Center, consists of two conjoined fourteen-story office towers on approximately five acres of land. For the last several years we expecthave leased approximately 155,000 square feet of the Molina Center for use as our corporate headquarters and also for use by our California health plan subsidiary. The final purchase price was $81 million, which amount was paid with a combination of cash on hand and bank financing under a term loan agreement. We acquired this business primarily to facilitate space needs for the acquisition to be approximately $15.5 million, subject to adjustments. As of December 31, 2010, we had paid $8.5 millionprojected future growth of the total purchase price. In the first quarter of 2011 we will compute the final purchase price based on the plan’s membership on that date.Company.
Molina Medicaid Solutions.Solutions. On May 1, 2010, we acquired a health information management business which we now operate under the name,Molina Medicaid SolutionsSM as.
Other Transactions
As described in “Overview,” above.
49
entity. Subject to appropriate regulatory approvals discussed above, ACH will retain certain assets and investments, to which we will no longer have access after the abandonment transaction is effected and which amounts we intend to write off.
Liquidity and Capital Resources
Introduction
We manage our cash, investments, and capital structure to meet the short- and long-term obligations of our business while maintaining liquidity and financial flexibility. We forecast, analyze, and monitor our cash flows to enable prudent investment management and financing within the confines of our financial strategy.
Our regulated subsidiaries generate significant cash flows from premium revenue and investment income.revenue. Such cash flows are our primary source of liquidity. Thus, any future decline in our premium revenue or our profitability may have a negative impact on our liquidity. We generally receive premium revenue in advance of the payment of claims for the related health care services. A majority of the assets held by our regulated subsidiaries are in the form of cash, cash equivalents, and investments. After considering expected cash flows from operating activities, we generally invest cash of regulated subsidiaries that exceeds our expected short-term obligations in longer term, investment-grade, and marketable debt securities to improve our overall investment return. These investments are made pursuant to board approved investment policies which conform to applicable state laws and regulations. Our investment policies are designed to provide liquidity, preserve capital, and maximize total return on invested assets, all in a manner consistent with state requirements that prescribe the types of instruments in which our subsidiaries may invest. These investment policies require that our investments have final maturities of five years or less (excluding auction rate securities and variable rate securities, for which interest rates are periodically reset) and that the average maturity be two years or less. Professional portfolio managers operating under documented guidelines manage our investments. As of December 31, 2010,2012, a substantial portion of our cash was invested in a portfolio of highly liquid money market securities, and our investments consisted solely of investment-grade debt securities. All of our investments are classified as current assets, except for our restricted investments, and our investments in auction rate securities, which are classified as non-current assets. Our restricted investments are invested principally in certificates of deposit and U.S. treasury securities.
Investment income decreased to $6.3$5.2 million for the year ended December 31, 2010,2012, compared with $9.1$5.5 million for the year ended December 31, 2009. This decline was primarily due to lower interest rates in 2010. The2011. Our annualized portfolio yields for the years ended December 31, 2010, 2009, and 2008, were 0.7%2012, 1.2%2011, and 3.0%2010 were 0.5%, 0.6%, and 0.7%, respectively.
Investments and restricted investments are subject to interest rate risk and will decrease in value if market rates increase. We have the ability to hold our restricted investments until maturity and, as a result, we would not expect to incur significantly losses due to a sudden change in market interest rates.maturity. Declines in interest rates over time will reduce our investment income.
Cash in excess of the capital needs of our regulated health plans is generally paid to our non-regulated parent company in the form of dividends, when and as permitted by applicable regulations, for general corporate use. See further discussion below, under Regulatory Capital and Dividend Restrictions.
Liquidity
Cash provided by operating activities for the year ended December 31, 2010 was $161.6$347.8 million in 2012compared with $155.4$225.4 million for the year ended December 31, 2009, in 2011, an increase of $6.2 million. Deferred$122.4 million. In 2012, deferred revenue which was a use of operating cash totaling $41.9 million in 2010, was a source of operating cash totaling $88.2from operations amounting to $90.9 million, compared with a use of cash amounting to $8.2 million in 2009. In 2009, the state of Ohio typically paid premiums in advance of the month the premium2011. This increase was earned. In 2010, the state of Ohio delayed its premium paymentsprimarily due to mid-month for the month premium is earned. Therefore, we did not receive advance payments for the Ohio health plan’s premiums during 2010. The changean increase in deferred revenue relating to an advance premium payment received by our Washington health plan in December 2012. In 2011, cash provided by operating activities was offset by increases$225.4 million compared with $161.4 million for 2010, an increase of $64.0 million. This increase was primarily due to higher operating income before giving effect to the $64.6 million non-cash impairment of goodwill and intangible assets relating to our Missouri health plan's state contract termination recorded in net income, depreciation and amortization, and other current liabilities.the fourth quarter of 2011.
Cash used in investing activities increased significantlywas $93.6 million in 20102012 compared with 2009,$236.9 million in 2011, a decrease of $143.3 million. This decrease was primarily due chiefly to the change in cash paid in business combinations resulting from our fourth quarter 2011 acquisition of the Molina Medicaid Solutions, which totaled $131.3 million.
Cash provided by financing activities was $47.7 million in 2012 compared with $49.5 million in 2011, a decrease of $1.8 million. Cash provided from borrowings under our credit facility in 2012 amounting to $40.0 million was consistent with cash provided from the $48.6 million term loan in 2011 used to finance the acquisition of the Molina Center. In 2011, cash provided
50
by financing activities was $49.5 million compared with $113.8 million in 2010, a decrease of $64.3 million. This decrease was due to $111.1 million of net proceeds from our common stock offering in the third quarter using proceeds fromof 2010, compared with the equity offering.$48.6 million term loan to acquire the Molina Center in 2011.
Financial Condition
| Year Ended | ||||||||
| December 31, | ||||||||
| 2010 | 2009 | |||||||
| (In thousands) | ||||||||
| Operating income | $ | 105,001 | $ | 51,934 | ||||
| Add back: | ||||||||
| Depreciation and amortization reported in the consolidated statements of cash flows | 60,765 | 38,110 | ||||||
| EBITDA | $ | 165,766 | $ | 90,044 | ||||
$521.1 million compared with $446.2 million at December 31, 2011. At December 31, 2010, the parent company — Molina Healthcare, Inc. — held2012 we had cash and investments of approximately $65.1$1,196.1 million, including $6.0 million in non-current auction rate securities, compared with $45.6$893.0 million of cash and investments at December 31, 2009.2011. We believe that our cash resources and internally generated funds will be sufficient to support our operations, regulatory requirements, and capital expenditures for at least the next 12 months.
Regulatory Capital and Dividend Restrictions
54
The National Association of Insurance Commissioners, or NAIC, adopted rules effective December 31, 1998, which, if implemented by the states, set minimum capitalization requirements for insurance companies, HMOs, and other entities bearing risk for health care coverage. The requirements take the form of risk-based capital, or RBC, rules. Michigan, New Mexico, Ohio, Texas, Utah, Washington, and Wisconsin have adopted these rules, which may vary from state to state. California and Florida have not yet adopted NAIC risk-based capital requirements for HMOs and have not formally given notice of their intention to do so. Such requirements, if adopted by California and Florida, may increase the minimum capital required for those states.
As ofDecember 31, 2012, our health plans had aggregate statutory capital and surplus of approximately $557.9 million compared with the required minimum aggregate statutory capital and surplus of approximately $345.7 million. All of our health plans were in compliance with the minimum capital requirements at December 31, 2012. We have the ability and commitment to provide additional capital to each of our health plans when necessary to ensure that statutory capital and surplus continue to meet regulatory requirements.
Future Sources and Uses of Liquidity
1.125% Cash Convertible Senior Notes due 2020
On February 15, 2013, we issued $550 million aggregate principal amount of 1.125% Cash Convertible Senior Notes due 2020, or the Notes. The Notes bear interest at a rate of 1.125% per year, payable semiannually in arrears on January 15 and July 15 of each year, beginning on July 15, 2013. The Notes will mature on January 15, 2020.
The Notes are not convertible into our common stock or any other securities under any circumstances. Holders may convert their Notes solely into cash at their option at any time prior to the close of business on the business day immediately preceding July 15, 2019 only under the following circumstances: (1) during any calendar quarter commencing after the calendar quarter ending on June 30, 2013 (and only during such calendar quarter), if the last reported sale price of the common stock for at least 20 trading days (whether or not consecutive) during a period of 30 consecutive trading days ending on the last trading day of the immediately preceding calendar quarter is greater than or equal to 130% of the conversion price on each applicable trading day; (2) during the five business day period immediately after any five consecutive trading day period in which the trading price per $1,000 principal amount of Notes for each trading day of the measurement period was less than 98% of the product of the last reported sale price of our common stock and the conversion rate on each such trading day; or (3) upon the occurrence of specified corporate events. On or after July 15, 2019 until the close of business on the second scheduled trading day immediately preceding the maturity date, holders may convert their Notes solely into cash at any time, regardless of the foregoing circumstances. Upon conversion, in lieu of receiving shares of our common stock, a holder will receive an amount in cash, per $1,000 principal amount of Notes, equal to the settlement amount, determined in the manner set forth in the Indenture.
The initial conversion rate will be 24.5277 shares of our common stock per $1,000 principal amount of Notes (equivalent to an initial conversion price of approximately $40.77 per share of common stock). The conversion rate will be subject to adjustment
51
in some events but will not be adjusted for any accrued and unpaid interest. In addition, following certain lenders,corporate events that occur prior to the maturity date, we will pay a cash make-whole premium by increasing the conversion rate for a holder who elects to convert its Notes in connection with such a corporate event in certain circumstances. We may not redeem the Notes prior to the maturity date, and no sinking fund is provided for the Notes.
If we undergo a fundamental change (as defined in the indenture to the Notes), holders may require us to repurchase for cash all or part of their Notes at a repurchase price equal to 100% of the principal amount of the Notes to be repurchased, plus accrued and unpaid interest to, but excluding, the fundamental change repurchase date. The indenture provides for customary events of default, including cross acceleration to certain other indebtedness of ours, and our significant subsidiaries.
The Notes will be senior unsecured obligations of the Company and will rank senior in right of payment to any of our indebtedness that is expressly subordinated in right of payment to the Notes; equal in right of payment to any of our unsecured indebtedness that is not so subordinated; effectively junior in right of payment to any of our secured indebtedness to the extent of the value of the assets securing such indebtedness; and structurally junior to all indebtedness and other liabilities (including trade payables) of our subsidiaries.
Cash Convertible Note Hedge and Warrant Transactions
In connection with the pricing of the Notes, on February 11, 2013, we entered into cash convertible note hedge transactions and warrant transactions relating to a notional number of shares of our common stock underlying the Notes to be issued by us (without regard to the initial purchasers' $100 million over-allotment option) with two counterparties, JPMorgan Chase Bank, National Association, London Branch and Bank of America, N.A. (the “Option Counterparties”). The cash convertible note hedge transactions are intended to offset cash payments due upon any conversion of the Notes. However, the warrant transactions could separately have a dilutive effect to the extent that the market value per share of our common stock (as measured under the terms of the warrant transactions) exceeds the applicable strike price of the warrants. The strike price of the warrants will initially be $53.8475 per share, which is 75% above the last reported sale price of our common stock on February 11, 2013.
In connection with the exercise in full by the initial purchasers of their over-allotment option in respect of the Notes, on February 13, 2013, we and the Option Counterparties amended the cash convertible note hedge transactions entered into on February 11, 2013 to upsize such transactions by a notional number of shares of our common stock corresponding to the number of shares underlying the Notes purchased pursuant to the exercise of such over-allotment option. On February 13, 2013, we also entered into additional warrant transactions with the Option Counterparties relating to a number of shares of our common stock corresponding to the number of shares underlying the Notes purchased pursuant to the exercise of such over-allotment option. Each of the amendments to the cash convertible note hedge transactions and the additional warrant transactions were on substantially similar terms to the corresponding transactions entered into on February 11, 2013. Pursuant to these warrant transactions, we issued 13,490,236 warrants with a strike price of $53.8475 per share. The number of warrants and the strike price are subject to adjustment under certain circumstances.
We used approximately $74.3 million of the net proceeds from the offering to pay the cost of the cash convertible note hedge transactions (after such cost was partially offset by the proceeds to us from the sale of warrants in the warrant transactions and the additional warrant transactions).
Aside from the initial payment of a premium to the Option Counterparties of approximately $149.3 million, as Administrative Agent (the “Credit Facility”) forwe will not be required to make any cash payments to the Option Counterparties under the cash convertible note hedge transactions and will be entitled to receive from the Option Counterparties an amount of cash, generally equal to the amount by which the market price per share of common stock exceeds the strike price of the cash convertible note hedge transactions during the relevant valuation period. The strike price under the cash convertible note hedge transactions is initially equal to the conversion price of the Notes. Additionally, if the market value per share of our common stock exceeds the strike price of the warrants on any trading day during the 160 trading day measurement period under the warrant transactions and the additional warrant transactions, we will be obligated to issue to the Option Counterparties a number of shares equal in value to the product of the amount by which such market value exceeds such strike price and 1/160th of the aggregate number of shares of our common stock underlying the warrant transactions and the additional warrant transactions, subject to a share delivery cap. The Company will not receive any additional proceeds if warrants are exercised.
Repurchase in Connection with Offering of 1.125% Cash Convertible Senior Notes Due 2020
We used a portion of the net proceeds in this offering to repurchase $50 million of our common stock in negotiated transactions with institutional investors in the offering, concurrently with the pricing of the offering. On February 12, 2013, we repurchased a total of 1,624,959 shares at $30.77 per share, which was our closing stock price on that date.
52
Credit Facility
On February 15, 2013, we used approximately $40.0 million of the net proceeds from the offering of the Notes to repay all of the outstanding indebtedness under our $170 million revolving credit line of $150 million that matures in May 2012. The Credit Facility is intended to be used for general corporate purposes. We borrowed $105 million underfacility, or the Credit Facility, to acquire Molina Medicaid Solutions in the second quarterwith various lenders and U.S. Bank National Association, as Line of 2010. During the third quarter of 2010, we repaid this amount using proceeds from our equity offering, described in Note 14 to the accompanying audited consolidated financial statements for the year ended December 31, 2010.Credit Issuer, Swing Line Lender, and Administrative Agent. As of December 31, 2010, and 2009,2012, there was no $40.0 million outstanding principal debt balance under the Credit Facility. However, as
We terminated the Credit Facility in connection with the closing of December 31, 2010, our lenders had issued two the offering and sale of the Notes. Two letters of credit in the aggregate principal amount of $10.3 million in connectionthat reduced the amount available for borrowing under the Credit Facilityas of December 31, 2012, were transferred to direct issue letters of credit with another financial institution. The Credit Facility had a term of five years under which all amounts outstanding would have been due and payable on September 9, 2016.
Borrowings under the contractCredit Facility accrued interest based, at our election, on the base rate plus an applicable margin or the Eurodollar rate. The base rate is, for any day, a rate of MMS withinterest per annum equal to the stateshighest of Maine(i) the prime rate of interest announced from time to time by U.S. Bank or its parent, (ii) the sum of the federal funds rate for such day plus 0.50% per annum and Idaho.
Our obligations under the Credit Facility such obligations will bewere secured by a lien on substantially all of our assets, with the exception of certain of our real estate assets, and by a pledge of the capital stock or membership interests of our operating subsidiaries and health plan subsidiariesplans (with the exception of the California health plan). The Credit Facility includesincluded usual and customary covenants for credit facilities of this type, including covenants limiting liens, mergers, asset sales, other fundamental changes, debt, acquisitions, dividends and other distributions, capital expenditures, investments, and a fixed charge coverage ratio.investments. The Credit Facility also requiresrequired us to maintain as of the end of any fiscal quarter (calculated for each four consecutive fiscal quarter period) a ratio of total consolidated debt to total consolidated EBITDA, as defined in the Credit Facility, of not more than 2.75 to 1.00 at any time., and a fixed charge coverage ratio of not less than 1.75 to 1.00. AtDecember 31, 2010,2012, we were in compliance with all financial covenants inunder the Credit Facility.
55
As of December 31, 2010, the remaining2012, $187.0 million in aggregate principal amount of our 3.75% Convertible Senior Notes due 2014, or the 3.75% Notes, was $187.0 million.remain outstanding. The 3.75% Notes rank equally in right of payment with our existing and future senior indebtedness.
The 3.75% Notes are convertible into cash and, under certain circumstances, shares of our common stock. The initial conversion rate is 21.3067 31.9601 shares of our common stock per $1,000one thousand dollar principal amount of the 3.75% Notes. This represents an initial conversion price of approximately $46.93 $31.29 per share of our common stock. In addition, if certain corporate transactions that constitute a change of control occur prior to maturity, we will increase the conversion rate in certain circumstances.
Term Loan
The Term Loan Agreement contains customary representations, warranties, and financial covenants. In the maintenanceevent of minimum levels of statutory capital,a default as defined by each state, and may restrict the timing, payment, and amount of dividends and other distributions that may be paid to Molina Healthcare, Inc. as the sole stockholder of each of our health plans. To the extent the subsidiaries must comply with these regulations, they may not have the financial flexibility to transfer funds to us. The net assets in these subsidiaries, after intercompany eliminations, which may not be transferable to usdescribed in the formTerm Loan Agreement, the outstanding principal amount under the Term Loan Agreement will bear interest at a rate 5.00% per annum higher than the otherwise applicable rate. All amounts due under the Term Loan Agreement and related loan documents are secured by a security interest in the Molina Center in favor of loans, advances,and for the benefit of the Administrative Agent and the other lenders under the Term Loan Agreement.
53
Interest Rate Swap
In May 2012, we entered into a $42.5 million notional amount interest rate swap agreement, or cash dividends totaled $397.8 million at Swap Agreement, with an effective date of March 1, 2013. While not designated as a hedge during the year ended December 31, 2010,2012, the Swap Agreement is intended to reduce our exposure to fluctuations in the contractual variable interest rates under our Term Loan Agreement, and $368.7 millionexpires on the maturity date of the Term Loan Agreement, which is November 30, 2018. Under the Swap Agreement, we will receive a variable rate of the one-month LIBOR plus 3.25%, and pay a fixed rate of 5.34%. The Swap Agreement is measured and reported at fair value on a recurring basis, within Level 2 of the fair value hierarchy. Gains and losses relating to changes in fair value are reported in earnings in the current period. For the year endedDecember 31, 2009.
Shelf Registration Statement
In May 2012, we filed an automatic shelf registration statement on Form S-3 with the Securities and Exchange Commission covering the issuance of an indeterminate number of our securities, including common stock, warrants, or debt securities. We may publicly offer securities from time to time at prices and terms to be determined at the time of the offering.
Securities Repurchase Program
Effective as of February 13, 2013, our board of directors authorized the repurchase of $75 million in compliance with these requirementsaggregate of either our common stock or our convertible senior note due 2014. The repurchase program extends through 2011.December 31, 2014.
Critical Accounting Policies
When we prepare our consolidated financial statements, we use estimates and assumptions that may affect reported amounts and disclosures. Actual results could differ from these estimates. Our most significant accounting policies relate to:
56
Health plan contractual provisions that may limit revenue based upon the costs incurred or the profits realized under a specific contract;
Health plan quality incentives that allow us to recognize incremental revenue if certain quality standards are met;
The recognition of revenue and costs associated with contracts held by our Molina Medicaid Solutions segment; and;
The determination of medical claims and benefits payable.
Revenue Recognition — Health Plans Segment
Premium revenue is fixed in advance of the periods covered and, except as described below, is not generally subject to significant accounting estimates. Premium revenues are recognized in the month that members are entitled to receive health care services.
Certain components of premium revenue of our Health Plans segment are subject to accounting estimates. The components of premium revenue subject to estimation fall into two categories:
Contractual provisions that may limit revenue based upon the costs incurred or the profits realized under a specific contract. These are contractual provisions that require the health plan to return premiums to the extent that certain thresholds are not met. In some instances premiums are returned when medical costs fall below a certain percentage of gross premiums; or when administrative costs or profits exceed a certain percentage of gross premiums. In other instances, premiums are partially determined by the acuity of care provided to members (risk adjustment). To the extent that our expenses and profits change from the amounts previously reported (due to changes in estimates) our revenue earned for those periods will also change. In all of these instances our revenue is only subject to estimate due to the fact that the thresholds themselves contain elements (expense or profit) that are subject to estimate. While we have adequate experience and data to make sound estimates of our expenses or profits, changes to those estimates may be necessary, which in turn will lead to changes in our estimates of revenue. In general, a change in estimate relating to expense or profit would offset any related change in estimate to premium, resulting in no or small impact to net income. The following contractual provisions fall into this category:
California Health Plan Medical Cost Floors (Minimums):A portion of certain premiums received by our California health plan may be returned to the state if certain minimum amounts are not spent on defined medical care costs. We
54
recorded a liability under the terms of these contract provisions of $0.3 million and $1.0 million at December 31, 2012, and December 31, 2011, respectively.
Florida Health Plan Medical Cost Floor (Minimum) for Behavioral Health:A portion of premiums received by our Florida health plan may be returned to the state if certain minimum amounts are thereforenot spent on defined behavioral health care costs. At bothDecember 31, 2012 and December 31, 2011, we had not recorded any liability under the terms of this contract provision since behavioral health expenses are not less than the contractual floor.
New Mexico Health Plan Medical Cost Floors (Minimums) and Administrative Cost and Profit Ceilings (Maximums): Our contract with the state of New Mexico directs that a portion of premiums received may be returned to the state if certain minimum amounts are not spent on defined medical care costs, or if administrative costs or profit (as defined) exceed certain amounts. At both December 31, 2012, and December 31, 2011, we had not recorded any liability under the terms of these contract provisions.
Texas Health Plan Profit Sharing: Under our contract with the state of Texas, there is a profit-sharing agreement under which we pay a rebate to the state of Texas if our Texas health plan generates pretax income, as defined in the contract, above a certain specified percentage, as determined in accordance with a tiered rebate schedule. We are limited in the amount of administrative costs that we may deduct in calculating the rebate, if any. As a result of profits in excess of the amount we are allowed to fully retain, we accrued an aggregate liability of approximately $3.2 million and $0.7 million pursuant to our profit-sharing agreement with the state of Texas at December 31, 2012 and December 31, 2011, respectively.
Washington Health Plan Medical Cost Floors (Minimums): A portion of certain premiums received by our Washington health plan may be returned to the state if certain minimum amounts are not spent on defined medical care costs. At both December 31, 2012, andDecember 31, 2011, we had not recorded any liability under the terms of this contract provision because medical expenses are not less than the contractual floor.
Medicare Revenue Risk Adjustment:Based on member encounter data that we submit to CMS, our Medicare premiums are subject to retroactive revision. Chief amongadjustment for both member risk scores and member pharmacy cost experience for up to two years after the original year of service. This adjustment takes into account the acuity of each member’s medical needs relative to what was anticipated when premiums were originally set for that member. In the event that a member requires less acute medical care than was anticipated by the original premium amount, CMS may recover premium from us. In the event that a member requires more acute medical care than was anticipated by the original premium amount, CMS may pay us additional retroactive premium. A similar retroactive reconciliation is undertaken by CMS for our Medicare members’ pharmacy utilization. We estimate the amount of Medicare revenue that will ultimately be realized for the periods presented based on our knowledge of our members’ heath care utilization patterns and CMS practices. Based on our knowledge of member health care utilization patterns and expenses we have recorded a net receivable of approximately $0.3 million and $5.0 million for anticipated Medicare risk adjustment premiums at December 31, 2012, and December 31, 2011, respectively.
Quality incentives that allow us to recognize incremental revenue if certain quality standards are met.These are contract provisions that allow us to earn additional premium revenue in certain states if we achieve certain quality-of-care or administrative measures. We estimate the amount of revenue that will ultimately be realized for the periods presented based on our experience and expertise in meeting the quality and administrative measures as well as our ongoing and current monitoring of our progress in meeting those measures. The amount of the revenue that we will realize under these are:contractual provisions is determinable based upon that experience. The following contractual provisions fall into this category:
New Mexico Health Plan Quality Incentive Premiums:Under our contract with the state of New Mexico, incremental revenue of up to 0.75% of our total premium is earned if certain performance measures are met. These performance measures are generally linked to various quality-of-care and administrative measures dictated by the state.
Ohio Health Plan Quality Incentive Premiums:Under our contract with the state of Ohio, incremental revenue of up to 1% of our total premium is earned if certain performance measures are met. These performance measures are generally linked to various quality-of-care measures dictated by the state.
Texas Health Plan Quality Incentive Premiums:Effective March 1, 2012, under our contract with the state of Texas, incremental revenue of up to 5% of our total premium may be earned if certain performance measures are met. These performance measures are generally linked to various quality-of-care measures established by the state.
Wisconsin Health Plan Quality Incentive Premiums:Under our contract with the state of Wisconsin, effective beginning in 2011, up to 3.25% of premium revenue is withheld by the state. The withheld premiums can be earned by the health plan by meeting certain performance measures. These performance measures are generally linked to various quality-of-care measures dictated by the state.
55
The following table quantifies the quality incentive premium revenue recognized for the periods presented, including the amounts earned in the period presented and prior periods. Although the reasonably possible effects of a change in estimate related to quality incentive premium revenue as of December 31, 2012are not known, we have no reason to believe that the adjustments to prior years noted below are not indicative of the potential future changes in our estimates as of December 31, 2012.
| Year Ended December 31, 2012 | |||||||||||||||||||
Maximum Available Quality Incentive Premium – Current Year | Amount of Current Year Quality Incentive Premium Revenue Recognized | Amount of Quality Incentive Premium Revenue Recognized from Prior Year | Total Quality Incentive Premium Revenue Recognized | Total Revenue Recognized | |||||||||||||||
| (In thousands) | |||||||||||||||||||
| New Mexico | $ | 2,244 | $ | 1,889 | $ | 643 | $ | 2,532 | $ | 338,770 | |||||||||
| Ohio | 12,033 | 8,079 | 966 | 9,045 | 1,187,422 | ||||||||||||||
| Texas | 58,516 | 52,521 | — | 52,521 | 1,255,722 | ||||||||||||||
| Wisconsin | 1,771 | — | 593 | 593 | 70,673 | ||||||||||||||
| $ | 74,564 | $ | 62,489 | $ | 2,202 | $ | 64,691 | $ | 2,852,587 | ||||||||||
58
| Year Ended December 31, 2011 | |||||||||||||||||||
Maximum Available Quality Incentive Premium – Current Year | Amount of Current Year Quality Incentive Premium Revenue Recognized | Amount of Quality Incentive Premium Revenue Recognized from Prior Year | Total Quality Incentive Premium Revenue Recognized | Total Revenue Recognized | |||||||||||||||
| (In thousands) | |||||||||||||||||||
| New Mexico | $ | 2,271 | $ | 1,558 | $ | 378 | $ | 1,936 | $ | 345,732 | |||||||||
| Ohio | 10,212 | 8,363 | 3,501 | 11,864 | 988,896 | ||||||||||||||
| Texas | — | — | — | — | 409,295 | ||||||||||||||
| Wisconsin | 1,705 | 542 | — | 542 | 69,596 | ||||||||||||||
| $ | 14,188 | $ | 10,463 | $ | 3,879 | $ | 14,342 | $ | 1,813,519 | ||||||||||
| Year Ended December 31, 2010 | |||||||||||||||||||
Maximum Available Quality Incentive Premium – Current Year | Amount of Current Year Quality Incentive Premium Revenue Recognized | Amount of Quality Incentive Premium Revenue Recognized from Prior Year | Total Quality Incentive Premium Revenue Recognized | Total Revenue Recognized | |||||||||||||||
| (In thousands) | |||||||||||||||||||
| New Mexico | $ | 2,581 | $ | 1,311 | $ | 579 | $ | 1,890 | $ | 366,784 | |||||||||
| Ohio | 9,881 | 3,114 | (1,248 | ) | 1,866 | 860,324 | |||||||||||||
| Texas | 1,771 | 1,771 | — | 1,771 | 188,716 | ||||||||||||||
| $ | 14,233 | $ | 6,196 | $ | (669 | ) | $ | 5,527 | $ | 1,415,824 | |||||||||
Service Revenue and Cost of Service Revenue — Molina Medicaid Solutions Segment
The payments received by our Molina Medicaid Solutions segment under its state contracts are based on the performance of three elements of service.multiple services. The first of these is the design, development and implementation, or DDI, of a Medicaid Management Information System, or MMIS. The second element,An additional service, following completion of the DDI, element, is the operation of the MMIS under a business process outsourcing, or BPO arrangement. While providing BPO services (which include claims payment and eligibility processing) we also provide the state with the third contracted element — trainingother services including both hosting and IT support and hostingmaintenance. Our Molina Medicaid Solutions contracts may extend over a number of years, particularly in circumstances where we are delivering extensive and complex DDI services, (trainingsuch as the initial design, development and support).implementation of a complete MMIS. For example, the terms of our most recently implemented Molina Medicaid Solutions contracts (in Idaho and Maine) were each seven years in total, consisting of two years allocated for the delivery of DDI services, followed by five years for the performance of BPO services. We receive progress payments from the state during the performance of DDI services based upon the attainment of predetermined milestones. We receive a flat monthly payment for BPO services under our Idaho and Maine contracts. The terms of our other Molina Medicaid
56
Solutions contracts - which primarily involve the delivery of BPO services with only minimal DDI activity (consisting of system enhancements) - are shorter in duration than our Idaho and Maine contracts.
Effective January 1, 2011, we adopted a new accounting standard that amends the guidance on the accounting for multiple-element arrangements. Pursuant to the new standard, each required deliverable is evaluated to determine whether it qualifies as a separate unit of accounting which is generally based on whether the deliverable has standalone value to the customer. In addition to standalone value, previous guidance also required objective and reliable evidence of fair value of a deliverable in order to treat the deliverable as a separate unit of accounting. The arrangement’s consideration that is fixed or determinable is then allocated to each separate unit of accounting based on the relative selling price of each deliverable. In general, the consideration allocated to each unit of accounting is recognized as the related goods or services are delivered, limited to the consideration that is not contingent. We have adopted this guidance on a prospective basis for all new or materially modified revenue arrangements with multiple deliverables entered into on or after January 1, 2011. Our adoption of this guidance has not impacted the timing or pattern of our revenue recognition in 2011 or 2012. Also, there would have been no change in revenue recognized relating to multiple-element arrangements if we had adopted this guidance retrospectively for contracts entered into prior to January 1, 2011.
We have concluded that the various service elements in our Molina Medicaid Solutions contracts represent a single unit of accounting due to the fact that DDI, which is the only service performed in advance of the other services (all other services are performed over an identical period), does not have standalone value because our DDI services are not sold separately by any vendor specificand the customer could not resell our DDI services. Further, we have no objective and reliable evidence or VSOE, of fair value for any of the individual elements in these contracts, and at no point in the contract will we have VSOEobjective and reliable evidence of fair value for the undelivered elements in the contract.contracts. For contracts entered into prior to January 1, 2011, objective and reliable evidence of fair value would be required, in addition to DDI standalone value which we do not have, in order to treat DDI as a separate unit of accounting. We lack VSOEobjective and reliable evidence of the fair value of the individual elements of our Molina Medicaid Solutions contracts for the following reasons:
Each contract calls for the provision of its own specific set of services. While all contracts support the system of record for state MMIS, the actual services we provide vary significantly between contracts; and The nature |
Because we have determined the services provided under our Molina Medicaid Solutions contracts represent a single unit of accounting, and because we are unable to determine a pattern of performance of services during the contract. Although the length ofcontract period, we recognize all revenue (both the DDI phase for any MMIS contract can vary considerably, the DDI phase typically takes about two years to complete. As a general principle, revenue recognition will therefore commence at the completion of the DDI phase, and all
59
Provisions specific to each contract may, however, lead us to modify this general principle. In those circumstances, the right of the state to refuse acceptance of services, as well as the related obligation to compensate us, may require us to delay recognition of all or part of our revenue until that contingency (the right of the state to refuse acceptance) has been removed. In those circumstances we defer recognition of any contingent revenue at risk (whether DDI, BPO services, or traininghosting, and IT support and maintenance services) until the contingency hadhas been removed. These types of contingency features are present in our Maine and Idaho contracts. In these circumstancesthose states, we would also deferdeferred recognition of incrementalrevenue until the contingencies were removed.
Costs associated with our Molina Medicaid Solutions contracts include software related costs and other costs. With respect to software related costs, we apply the guidance for internal-use software and capitalize external direct costs (such as direct labor, hardware,of materials and software)services consumed in developing or obtaining the software, and payroll and payroll-related costs associated with employees who are directly associated with and who devote time to the contract (whether DDI, BPO services or training and IT support services) on whichcomputer software project. With respect to all other direct costs, such costs are expensed as incurred, unless corresponding revenue recognition is being deferred. SuchIf revenue is being deferred, contractdirect costs relating to delivered service elements are deferred as well and are recognized on a straight-line basis over the period of revenue recognition.
57
Transaction processing costs.
Employee costs incurred in performing transaction services.
Vendor costs incurred in performing transaction services.
Costs incurred in performing required monitoring of and reporting on contract performance.
Costs incurred in maintaining and processing member and provider eligibility.
Costs incurred in communicating with members and providers.
The recoverability of deferred contract costs associated with a particular contract is analyzed on a periodic basis using the undiscounted estimated cash flows of the whole contract over its remaining contract term. If such undiscounted cash flows are insufficient to recover the long-lived assets and deferred contract costs, the deferred contract costs are written down by the amount of the cash flow deficiency. If a cash flow deficiency remains after reducing the balance of the deferred contract costs to zero, any remaining long-lived assets are evaluated for impairment. Any such impairment recognized would equal the amount by which the carrying value of the long-lived assets exceeds the fair value of those assets.
Medical Claims and Benefits Payable — Health Plans Segment
The following table provides the details of our medical claims and benefits payable as of the dates indicated:
| December 31, | ||||||||||||
| 2010 | 2009 | 2008 | ||||||||||
| (In thousands) | ||||||||||||
Fee-for-service claims incurred but not paid (IBNP) | $ | 275,259 | $ | 246,508 | $ | 236,492 | ||||||
| Capitation payable | 49,598 | 39,995 | 28,111 | |||||||||
| Pharmacy | 14,649 | 20,609 | 18,837 | |||||||||
| Other | 14,850 | 8,204 | 9,002 | |||||||||
| $ | 354,356 | $ | 315,316 | $ | 292,442 | |||||||
| December 31, | |||||||||||
| 2012 | 2011 | 2010 | |||||||||
| (In thousands) | |||||||||||
| Fee-for-service claims incurred but not paid (IBNP) | $ | 377,614 | $ | 301,020 | $ | 275,259 | |||||
| Capitation payable | 49,066 | 53,532 | 49,598 | ||||||||
| Pharmacy | 38,992 | 26,178 | 14,649 | ||||||||
| Other | 28,858 | 21,746 | 14,850 | ||||||||
| $ | 494,530 | $ | 402,476 | $ | 354,356 | ||||||
The determination of our liability for claims and medical benefits payable is particularly important to the determination of our financial position and results of operations in any given period. Such determination of our liability requires the application of a significant degree of judgment by our management.
As a result, the determination of our liability for claims and medical benefits payable is subject to an inherent degree of uncertainty. Our medical care costs include amounts that have been paid by us through the reporting date, as well as estimated liabilities for medical care costs incurred but not paid by us as of the reporting date. Such medical care cost liabilities include, among other items, unpaidfee-for-service claims, capitation payments owed providers, unpaid pharmacy invoices, and various medically related administrative costs that have been incurred but not paid. We use judgment to determine the appropriate assumptions for determining the required estimates.
The most important element in estimating our medical care costs is our estimate forfee-for-service claims which have been incurred but not paid by us. Thesefee-for-service costs that have been incurred but have not been paid at the reporting date are collectively referred to as medical costs that are “Incurred But Not Paid,” or IBNP. Our IBNP, as reported on our balance sheet, represents our best estimate of the total amount of claims we will ultimately
60
pay with respect to claims that we have incurred as of the balance sheet date. We estimate our IBNP monthly using actuarial methods based on a number of factors. As indicated in the table above, our estimated IBNP liability represented $275.3$377.6 million of our total medical claims and benefits payable of $354.4$494.5 million as of December 31, 2010.2012. Excluding amounts that we anticipate paying on behalf of a capitated provider in Ohio (which we will subsequently withhold from that provider’s monthly capitation payment), our IBNP liability at December 31, 20102012, was $268.3 million.
$371.4 million.
The factors we consider when estimating our IBNP include, without limitation, claims receipt and payment experience (and variations in that experience), changes in membership, provider billing practices, health care service utilization trends, cost trends, product mix, seasonality, prior authorization of medical services, benefit changes, known outbreaks of disease or increased incidence of illness such as influenza, provider contract changes, changes to Medicaid fee schedules, and the incidence of high dollar or catastrophic claims. Our assessment of these factors is then translated into an estimate of our IBNP liability at the relevant measuring point through the calculation of a base estimate of IBNP, a further reserve for adverse claims development, and an estimate of the
58
administrative costs of settling all claims incurred through the reporting date. The base estimate of IBNP is derived through application of claims payment completion factors and trended per member per month (PMPM)PMPM cost estimates.
For the fifth month of service prior to the reporting date and earlier, we estimate our outstanding claims liability based on actual claims paid, adjusted for estimated completion factors. Completion factors seek to measure the cumulative percentage of claims expense that will have been paid for a given month of service as of the reporting date, based on historical payment patterns.
The following table reflects the change in our estimate of claims liability as of December 31, 20102012 that would have resulted had we changed our completion factors for the fifth through the twelfth months preceding December 31, 2010,2012, by the percentages indicated. A reduction in the completion factor results in an increase in medical claims liabilities. Dollar amounts are in thousands.
| (Decrease) Increase in | Increase (Decrease) in | |||
| Estimated | Medical Claims and | |||
Completion Factors | Benefits Payable | |||
| (6)% | $ | 80,667 | ||
| (4)% | 53,778 | |||
| (2)% | 26,889 | |||
| 2% | (26,889 | ) | ||
| 4% | (53,778 | ) | ||
| 6% | (80,667 | ) | ||
| (Decrease) Increase in Estimated Completion Factors | Increase (Decrease) in Medical Claims and Benefits Payable | ||
| (6)% | $ | 152,598 | |
| (4)% | 101,732 | ||
| (2)% | 50,866 | ||
| 2% | (50,866 | ) | |
| 4% | (101,732 | ) | |
| 6% | (152,598 | ) | |
For the four months of service immediately prior to the reporting date, actual claims paid are not a reliable measure of our ultimate liability, given the inherent delay between the patient/physician encounter and the actual submission of a claim for payment. For these months of service, we estimate our claims liability based on trended PMPM cost estimates. These estimates are designed to reflect recent trends in payments and expense, utilization patterns, authorized services, and other relevant factors. The following table reflects the change in our estimate of claims liability as of December 31, 20102012 that would have resulted had we altered our trend factors by the
61
percentages indicated. An increase in the PMPM costs results in an increase in medical claims liabilities. Dollar amounts are in thousands.
| (Decrease) Increase in | (Decrease) Increase in | |||
| Trended Per member Per Month | Medical Claims and | |||
Cost Estimates | Benefits Payable | |||
| (6)% | $ | (64,958 | ) | |
| (4)% | (43,305 | ) | ||
| (2)% | (21,653 | ) | ||
| 2% | 21,653 | |||
| 4% | 43,305 | |||
| 6% | 64,958 | |||
| (Decrease) Increase in Trended Per member Per Month Cost Estimates | Increase (Decrease) in Medical Claims and Benefits Payable | ||
| (6)% | $ | (75,312 | ) |
| (4)% | (50,208 | ) | |
| (2)% | (25,104 | ) | |
| 2% | 25,104 | ||
| 4% | 50,208 | ||
| 6% | 75,312 | ||
The following per-share amounts are based on a combined federal and state statutory tax rate of 37%37.5%, and 27.8$47.0 million diluted shares outstanding for the year ended December 2010.31, 2012. Assuming a hypothetical 1% change in completion factors from those used in our calculation of IBNP at December 31, 2010,2012, net income for the year ended December 31, 20102012 would increase or decrease by approximately $8.5$15.9 million, or $0.31$0.34 per diluted share. Assuming a hypothetical 1% change in PMPM cost estimates from those used in our calculation of IBNP at December 31, 2010,2012, net income for the year ended December 31, 20102012 would increase or decrease by approximately $6.8$7.8 million, or $0.25$0.17 per diluted share, net of tax.share. The corresponding figures for a 5% change in completion factors and PMPM cost estimates would be $42.4$79.5 million, or $1.53$1.69 per diluted share, and $34.1$39.2 million, or $1.23$0.83 per diluted share, respectively.
It is important to note that any change in the estimate of either completion factors or trended PMPM costs would usually be accompanied by a change in the estimate of the other component, and that a change in one component would almost always compound rather than offset the resulting distortion to net income. When completion factors areoverestimated, trended PMPM costs tend to beunderestimated. Both circumstances will create an overstatement of net income. Likewise, when completion factors areunderestimated, trended PMPM costs tend to beoverestimated, creating an understatement of net income. In other words, errors in estimates involving both completion factors and trended PMPM costs will usually act to drive estimates of claims liabilities and medical care costs in the same direction. If completion factors were overestimated by 1%, resulting in an overstatement of
59
net income by approximately $8.5$15.9 million, it is likely that trended PMPM costs would be underestimated, resulting in an additional overstatement of net income.
After we have established our base IBNP reserve through the application of completion factors and trended PMPM cost estimates, we then compute an additional liability, once again using actuarial techniques, to account for adverse developments in our claims payments which the base actuarial model is not intended to and does not account for. We refer to this additional liability as the provision for adverse claims development. The provision for adverse claims development is a component of our overall determination of the adequacy of our IBNP. It is intended to capture the potential inadequacy of our IBNP estimate as a result of our inability to adequately assess the impact of factors such as changes in the speed of claims receipt and payment, the relative magnitude or severity of claims, known outbreaks of disease such as influenza, our entry into new geographical markets, our provision of services to new populations such as the aged, blind or disabled (ABD), changes to state-controlled fee schedules upon which a large proportion of our provider payments are based, modifications and upgrades to our claims processing systems and practices, and increasing medical costs. Because of the complexity of our business, the number of states in which we operate, and the need to account for different health care benefit packages among those states, we make an overall assessment of IBNP after considering the base actuarial model reserves and the provision for adverse claims development. We also include in our IBNP liability an estimate of the administrative costs of settling all claims incurred through the reporting date. The development of IBNP is a continuous process that we monitor and refine on a monthly basis as additional claims payment information becomes available. As additional information becomes known to us, we adjust our actuarial model accordingly to establish IBNP.
On a monthly basis, we review and update our estimated IBNP and the methods used to determine that liability. Any adjustments, if appropriate, are reflected in the period known. While we believe our current estimates are adequate, we have in the past been required to increase significantly our claims reserves for periods previously
62
reported, and may be required to do so again in the future. Any significant increases to prior period claims reserves would materially decrease reported earnings for the period in which the adjustment is made.
In our judgment, the estimates for completion factors will likely prove to be more accurate than trended PMPM cost estimates because estimated completion factors are subject to fewer variables in their determination. Specifically, completion factors are developed over long periods of time, and are most likely to be affected by changes in claims receipt and payment experience and by provider billing practices. Trended PMPM cost estimates, while affected by the same factors, will also be influenced by health care service utilization trends, cost trends, product mix, seasonality, prior authorization of medical services, benefit changes, outbreaks of disease or increased incidence of illness, provider contract changes, changes to Medicaid fee schedules, and the incidence of high dollar or catastrophic claims. As discussed above, however, errors in estimates involving trended PMPM costs will almost always be accompanied by errors in estimates involving completion factors, and vice versa. In such circumstances, errors in estimation involving both completion factors and trended PMPM costs will act to drive estimates of claims liabilities (and therefore medical care costs) in the same direction.
Assuming that base reserves have been adequately set,our initial estimate of IBNP is accurate, we believe that amounts ultimately paid out shouldwould generally be between 8% and 10% less than the liability recorded at the end of the period as a result of the inclusion in that liability of the allowance for adverse claims development and the accrued cost of settling those claims. However,Because the amount of our initial liability is merely an estimate (and therefore never perfectly accurate), we will always experience variability in that estimate as new information becomes available with the passage of time. Therefore, there can be no assurance that amounts ultimately paid out will not be higher or lower than this 8% to 10% range, as shown by our resultsrange. For example, for the yearyears ended December 31, 2011 and 2010, when the amounts ultimately paid out were less than the amount of the reserves we had established as of December 31, 2010 and 2009, by 14.6% and 15.7%, respectively. Furthermore, because the beginninginitial estimate of that year by 15.7%.IBNP is derived from many factors, some of which are qualitative in nature rather than quantitative, we are seldom able to assign specific values to the reasons for a change in estimate - we only know when the circumstances for any one or more of those factors are out of the ordinary.
As shown in greater detail in the table below, the amounts ultimately paid out on our prior period liabilities in fiscal years 20092012, 2011, and 2010were less than what we had expected when we had established our reserves. While many related factors working in conjunction with one another determine the specific reasons for the overestimationaccuracy of our liabilities were differentestimates, we are seldom able to quantify the impact that any single factor has on a change in eachestimate. In addition, given the variability inherent in the reserving process, we will only be able to identify specific factors if they represent a significant departure from expectations. As a result, we do not expect to be able to fully quantify the impact of the periods presented,individual factors on changes in general the overestimations were tied to our assessment of specific circumstances at our individual health plans which were unique to those reporting periods.estimate.
At our Washington health plan, we underestimated the amount of recoveries we would collect for certain high-cost newborn claims, resulting in an overestimation of reserves at year end.
60
At our Texas health plan, we overestimated the cost of new members in STAR+PLUS (the name of our ABD program in Texas), in the Dallas region.
In early 2011, the state of Michigan was delayed in the enrollment of newborns in managed care plans; the delay was resolved by mid-2011. This caused a large number of claims with older dates of service to be paid during late 2011, resulting in an artificial increase in the lag time for claims payment at our Michigan health plan. We adjusted reserves downward for this issue at December 31, 2011, but the adjustment did not capture all of the claims overestimation.
The overestimation of our liability for medical claims and benefits payable was partially offset by an underestimation of that liability at our Missouri health plan, as a result of the costs associated with an unusually large number of premature infants during the fourth quarter of 2011.
We recognized a benefit from prior period claims development in the amount of$51.8 millionfor the year endedDecember 31, 2011. This amount represents our estimate as of December 31, 2011, of the extent to which our initial estimate of medical claims and benefits payable at December 31, 2010was more than the amount that will ultimately be paid out in satisfaction of that liability. We believe that the overestimation of our claims liability atDecember 31, 2010 was due primarily to the following factors:
At our Ohio health plan, we overestimated the impact of a buildup in claims inventory.
At our California health plan, we overestimated the impact of the settlement of disputed provider claims.
At our New Mexico health plan, we underestimated the impact of a reduction in the outpatient facility fee schedule.
We recognized a benefit from prior period claims development in the amount of$49.4 millionfor the year ended December 31, 2010. This amount represents our estimate as ofDecember 31, 2010, of the extent to which our initial estimate of medical claims and benefits payable at December 31, 2009 exceededwas more than the amount that will ultimately be paid out in satisfaction of that liability. TheWe believe that the overestimation of our claims liability atDecember 31, 2009was due primarily to the following factors:
At our New Mexico health plan, we underestimated the degree to which cuts to the Medicaid fees schedule would reduce our liability as of December 31, 2009.
At our | ||
63
In estimating our claims liability atDecember 31, 2010,2012, we adjusted our base calculation to take account of the followingnumerous factors whichthat we believe are reasonablywill likely to change our final claims liability amount:amount. We believe that the most significant among those factors are:
Our Texas health plan membership nearly doubled effective March 1, 2012. In addition, effective March 1, 2012, we assumed inpatient medical liability for ABD members for which we were not previously responsible. Reserves for new coverage and new regions are now based on the newly developing claims lag patterns. While the lag patterns are now beginning to stabilize for the new membership and coverage, the true reserve liability continues to be more uncertain than usual.
Data published by the Centers for Disease Control, or CDC, indicated a significant increase in the percentage of office visits for influenza-like illnesses, or ILI, during December 2012. This indicated that the annual flu season was starting earlier than it had in most recent years. This was most noticeable in the southeast region of the country, but impacted other areas as well. Our leading indicators, including inpatient authorizations and overall pharmacy utilization, did not show as great an increase as we had expected based on the severity of the CDC's flu-related indices. However, we did see a significant increase in the use of prescription flu medication, especially in our Texas health plan. Therefore, we increased our reserves to account for expected additional utilization due to the early onset of the flu season.
Our California health plan has enrolled approximately 20,000 new ABD members since September 30, 2011, as a result of the mandatory assignment of ABD members to managed care plans effective July 1, 2011. These new members converted from a fee-for-service environment. Due to the relatively recent transition of these members to managed care, their utilization of medical services is less predictable than it is for many of our other members.
Prior to July 2012, it was the state of Washington's practice to disenroll certain sick newborns from the Healthy Options Medicaid managed care program and cover them under the Supplemental Security Income program, or SSI, instead. When this occurred, the health plan would reimburse the premiums received for that member back to the state and the state in turn reimbursed the health plan for the cost of care, usually retroactively to the date of birth. Effective July 1, 2012, the health plans now retain these members and cover them under a new ABD program entitled Healthy Options Blind and Disabled, or HOBD. The premium we receive from the state for the HOBD members is very high to cover
61
the substantial cost of care. By December, we had enrolled approximately 26,000 members under HOBD. Because the program is relatively new, there is still some uncertainty as to the level of claims to be expected from these high-cost members.
The use of a consistent methodology in estimating our liability for claims and medical benefits payable minimizes the degree to which the under- or overestimation of that liability at the close of one period may affect consolidated results of operations in subsequent periods. Facts and circumstances unique to the estimation process at any single date, however, may still lead to a material impact on consolidated results of operations in subsequent periods. Any absence of adverse claims development (as well as the expensing through general and administrative expense of the costs to settle claims held at the start of the period) will lead to the recognition of a benefit from prior period claims development in the period subsequent to the date of the original estimate. In 2009 2012, 2011and2010, the absence of adverse development of the liability for claims and medical benefits payable at the close of the previous period resulted in the recognition of substantial favorable prior period development. In boththese years, however, the recognition of a benefit from prior period claims development did not have a material impact on our consolidated results of operations because the amount of benefit recognized in each year was roughly consistent with that recognized in the previous year.
64
The following table presents the components of the change in our medical claims and benefits payable for the periods presented. The negative amounts displayed for “Components“Components of medical care costs related to:Prior years”year” represent the amount by which our original estimate of claims and benefits payable at the beginning of the period exceededwas more than the actual amount of the liability based on information (principally the payment of claims) developed since that liability was first reported.
| Year Ended December 31, | ||||||||
| 2010 | 2009 | |||||||
| (Dollars in thousands, except | ||||||||
| per-member amounts) | ||||||||
| Balances at beginning of year | $ | 315,316 | $ | 292,442 | ||||
| Balance of acquired subsidiary | 3,228 | — | ||||||
| Components of medical care costs related to: | ||||||||
| Current year | 3,420,235 | 3,227,794 | ||||||
| Prior years | (49,378 | ) | (51,558 | ) | ||||
| Total medical care costs | 3,370,857 | 3,176,236 | ||||||
| Payments for medical care costs related to: | ||||||||
| Current year | 3,085,388 | 2,920,015 | ||||||
| Prior years | 249,657 | 233,347 | ||||||
| Total paid | 3,335,045 | 3,153,362 | ||||||
| Balances at end of year | $ | 354,356 | $ | 315,316 | ||||
| Benefit from prior years as a percentage of: | ||||||||
| Balance at beginning of year | 15.7 | % | 17.6 | % | ||||
| Premium revenue | 1.2 | % | 1.4 | % | ||||
| Medical care costs | 1.5 | % | 1.6 | % | ||||
| Claims Data(1): | ||||||||
| Days in claims payable, fee for service only | 42 | 44 | ||||||
| Number of members at end of period | 1,613,000 | 1,455,000 | ||||||
Fee-for-service claims processing and inventory information: | ||||||||
| Number of claims in inventory at end of period | 143,600 | 93,100 | ||||||
| Billed charges of claims in inventory at end of period | $ | 218,900 | $ | 131,400 | ||||
| Claims in inventory per member at end of period | 0.09 | 0.06 | ||||||
| Billed charges of claims in inventory per member at end of period | $ | 135.71 | $ | 90.31 | ||||
| Number of claims received during the period | 14,554,800 | 12,930,100 | ||||||
| Billed charges of claims received during the period | $ | 11,686,100 | $ | 9,769,000 | ||||
| Year ended December 31, | |||||||||||
| 2012 | 2011 | 2010 | |||||||||
(Dollars in thousands, except per-member amounts) | |||||||||||
| Balances at beginning of period | $ | 402,476 | $ | 354,356 | $ | 315,316 | |||||
| Balance of acquired subsidiary | — | — | 3,228 | ||||||||
| Components of medical care costs related to: | |||||||||||
| Current year | 5,136,055 | 3,911,803 | 3,420,235 | ||||||||
| Prior year | (39,295 | ) | (51,809 | ) | (49,378 | ) | |||||
| Total medical care costs | 5,096,760 | 3,859,994 | 3,370,857 | ||||||||
| Payments for medical care costs related to: | |||||||||||
| Current year | 4,649,363 | 3,516,994 | 3,085,388 | ||||||||
| Prior year | 355,343 | 294,880 | 249,657 | ||||||||
| Total paid | 5,004,706 | 3,811,874 | 3,335,045 | ||||||||
| Balances at end of year | $ | 494,530 | $ | 402,476 | $ | 354,356 | |||||
| Benefit from prior years as a percentage of: | |||||||||||
| Balance at beginning of year | 9.8 | % | 14.6 | % | 15.7 | % | |||||
| Premium revenue | 0.7 | % | 1.1 | % | 1.2 | % | |||||
| Total medical care costs | 0.8 | % | 1.3 | % | 1.5 | % | |||||
| Claims Data | |||||||||||
| Days in claims payable, fee for service | 40 | 40 | 42 | ||||||||
| Number of members at end of period | 1,797,000 | 1,697,000 | 1,613,000 | ||||||||
| Number of claims in inventory at end of period | 122,700 | 111,100 | 143,600 | ||||||||
| Billed charges of claims in inventory at end of period | $ | 255,200 | $ | 207,600 | $ | 218,900 | |||||
| Claims in inventory per member at end of period | 0.07 | 0.07 | 0.09 | ||||||||
| Billed charges of claims in inventory per member end of period | $ | 142.01 | $ | 122.33 | $ | 135.71 | |||||
| Number of claims received during the period | 20,842,400 | 17,207,500 | 14,554,800 | ||||||||
| Billed charges of claims received during the period | $ | 19,429,300 | $ | 14,306,500 | $ | 11,686,100 | |||||
Commitments and Contingencies
62
We are not an obligor to or guarantor of any indebtedness of any other party. party, except for our obligation to pay benefits under policies in-force relating to an insurance subsidiary we sold in the first quarter of 2012, in the event such benefits are not paid by the reinsurer or current owner. This transaction is more fully described in Note 19 to the accompanying audited consolidated financial statements for the year ended December 31, 2012.
We are not a party to off-balance sheet financing arrangements except for operating leases which are disclosed in Note 1819 to the accompanying audited consolidated financial statements for the year ended December 31, 2010.2012.
Contractual Obligations
In the table below, we present our contractual obligations as of December 31, 2010.2012. Some of the amounts we have included in this table are based on management’s estimates and assumptions about these obligations, including their duration, the possibility of renewal, anticipated actions by third parties, and other factors. Because these estimates and assumptions are necessarily subjective, the contractual obligations we will actually pay in future periods may vary from those reflected in the table. Amounts are in thousands.
| Total | 2011 | 2012-2013 | 2014-2015 | 2016 and Beyond | ||||||||||||||||
| Medical claims and benefits payable | $ | 354,356 | $ | 354,356 | $ | — | $ | — | $ | — | ||||||||||
| Principal amount of long-term debt(1) | 187,000 | — | — | 187,000 | — | |||||||||||||||
| Operating leases | 133,806 | 28,004 | 44,143 | 31,037 | 30,622 | |||||||||||||||
| Interest on long-term debt | 26,297 | 7,012 | 14,025 | 5,260 | — | |||||||||||||||
| Purchase commitments | 28,557 | 13,401 | 14,828 | 328 | — | |||||||||||||||
| Total contractual obligations | $ | 730,016 | $ | 402,773 | $ | 72,996 | $ | 223,625 | $ | 30,622 | ||||||||||
| Total | 2013 | 2014-2015 | 2016-2017 | 2018 and Beyond | |||||||||||||||
| Medical claims and benefits payable | $ | 494,530 | $ | 494,530 | $ | — | $ | — | $ | — | |||||||||
| Principal amount of long-term debt(1) | 274,471 | 1,155 | 189,465 | 42,681 | 41,170 | ||||||||||||||
| Operating leases | 86,276 | 26,866 | 36,228 | 15,411 | 7,771 | ||||||||||||||
| Interest on long-term debt | 23,465 | 9,035 | 9,150 | 3,675 | 1,605 | ||||||||||||||
| Purchase commitments | 37,537 | 19,367 | 17,645 | 525 | — | ||||||||||||||
| Total contractual obligations | $ | 916,279 | $ | 550,953 | $ | 252,488 | $ | 62,292 | $ | 50,546 | |||||||||
| (1) | Represents the principal amount due on our 3.75% Convertible Senior Notes due |
As of December 31, 2010,2012, we have recorded approximately $11.0$10.6 million of unrecognized tax benefits. The above table does not contain this amount because we cannot reasonably estimate when or if such amount may be settled. See Note 13 to the accompanying audited consolidated financial statements for the year ended December 31, 20102012 for further information.
Item 7A.Quantitative and Qualitative Disclosures About Market Risk
Quantitative and Qualitative Disclosures About Market Risk
Financial instruments that potentially subject us to concentrations of credit risk consist primarily of cash and cash equivalents, investments, receivables, and restricted investments. We invest a substantial portion of our cash in the PFM FundsFund Prime Series — Institutional Class, and the PFM FundsFund Government Series. These funds represent a portfolio of highly liquid money market securities that are managed by PFM Asset Management LLC (PFM), a Virginia business trust registered as an open-end management investment fund. Our investments and a portion of our cash equivalents are managed by professional portfolio managers operating under documented investment guidelines. No investment that is in a loss position can be sold by our managers without our prior approval. Our investments consist solely of investment grade debt securities with a maximum maturity of five years and an average duration of two years.years or less. Restricted investments are invested principally in certificates of deposit and U.S. treasury securities. Concentration of credit risk with respect to accounts receivable is limited due to payors consisting principally of the governments of each state in which our health plan subsidiariesHealth Plans segment and our Molina Medicaid Solutions segment operate.
63
Inflation
We use various strategies to mitigate the negative effects of health care cost inflation. Specifically, our health plans try to control medical and hospital costs through contracts with independent providers of health care services. Through these contracted providers, our health plans emphasize preventive health care and appropriate use of specialty and hospital services. While we currently believeThere can be no assurance, however, that our strategies willto mitigate health care cost inflation competitivewill be successful. Competitive pressures, new health care and pharmaceutical product introductions, demands from health care providers and customers, applicable regulations, or other factors may affect our ability to control health care costs.
Compliance Costs
Our health plans are regulated by both state and federal government agencies. Regulation of managed care products and health care services is an evolving area of law that varies from jurisdiction to jurisdiction. Regulatory agencies generally have discretion to issue regulations and interpret and enforce laws and rules. Changes in applicable laws and rules occur frequently. Compliance with such laws and rules may lead to additional costs related to the implementation of additional systems, procedures and programs that we have not yet identified.
64
INDEX TO FINANCIAL STATEMENTS
| Page | ||||
MOLINA HEALTHCARE INC. | ||||
67
65
REPORT OF INDEPENDENT REGISTERED PUBLIC ACCOUNTING FIRM
The Board of Directors and Stockholders
of Molina Healthcare, Inc.
We have audited the accompanying consolidated balance sheets of Molina Healthcare, Inc. (the Company) as of December 31, 20102012 and 2009,2011, and the related consolidated statements of income and comprehensive income, stockholders’ equity and cash flows for each of the three years in the period ended December 31, 2010.2012. These financial statements are the responsibility of the Company’s management. Our responsibility is to express an opinion on these financial statements based on our audits.
We conducted our audits in accordance with the standards of the Public Company Accounting Oversight Board (United States). Those standards require that we plan and perform the audit to obtain reasonable assurance about whether the financial statements are free of material misstatement. An audit includes examining, on a test basis, evidence supporting the amounts and disclosures in the financial statements. An audit also includes assessing the accounting principles used and significant estimates made by management, as well as evaluating the overall financial statement presentation. We believe that our audits provide a reasonable basis for our opinion.
In our opinion, the financial statements referred to above present fairly, in all material respects, the consolidated financial position of Molina Healthcare, Inc. at December 31, 20102012 and 2009,2011, and the consolidated results of its operations and its cash flows for each of the three years in the period ended December 31, 2010,2012, in conformity with U.S. generally accepted accounting principles.
We also have audited, in accordance with the standards of the Public Company Accounting Oversight Board (United States), Molina Healthcare, Inc.’s internal control over financial reporting as of December 31, 2010,2012, based on criteria established inInternal Control — Integrated Frameworkissued by the Committee of Sponsoring Organizations of the Treadway Commission and our report dated March 8, 2011February 28, 2013 expressed an unqualified opinion thereon.
/s/ ERNST & YOUNG LLP
Los Angeles, California
66
MOLINA HEALTHCARE, INC.
CONSOLIDATED BALANCE SHEETS
| December 31, | |||||||
| 2012 | 2011 | ||||||
(Amounts in thousands, except per-share data) | |||||||
| ASSETS | |||||||
| Current assets: | |||||||
| Cash and cash equivalents | $ | 795,770 | $ | 493,827 | |||
| Investments | 342,845 | 336,916 | |||||
| Receivables | 149,682 | 167,898 | |||||
| Income tax refundable | — | 11,679 | |||||
| Deferred income taxes | 32,443 | 18,327 | |||||
| Prepaid expenses and other current assets | 28,386 | 19,435 | |||||
| Total current assets | 1,349,126 | 1,048,082 | |||||
| Property, equipment, and capitalized software, net | 221,443 | 190,934 | |||||
| Deferred contract costs | 58,313 | 54,582 | |||||
| Intangible assets, net | 77,711 | 101,796 | |||||
| Goodwill and indefinite-lived intangible assets | 151,088 | 153,954 | |||||
| Auction rate securities | 13,419 | 16,134 | |||||
| Restricted investments | 44,101 | 46,164 | |||||
| Receivable for ceded life and annuity contracts | — | 23,401 | |||||
| Other assets | 19,621 | 17,099 | |||||
| $ | 1,934,822 | $ | 1,652,146 | ||||
| LIABILITIES AND STOCKHOLDERS’ EQUITY | |||||||
| Current liabilities: | |||||||
| Medical claims and benefits payable | $ | 494,530 | $ | 402,476 | |||
| Accounts payable and accrued liabilities | 184,034 | 147,214 | |||||
| Deferred revenue | 141,798 | 50,947 | |||||
| Income taxes payable | 6,520 | — | |||||
| Current maturities of long-term debt | 1,155 | 1,197 | |||||
| Total current liabilities | 828,037 | 601,834 | |||||
| Long-term debt | 261,784 | 216,929 | |||||
| Deferred income taxes | 37,900 | 33,127 | |||||
| Liability for ceded life and annuity contracts | — | 23,401 | |||||
| Other long-term liabilities | 24,787 | 21,782 | |||||
| Total liabilities | 1,152,508 | 897,073 | |||||
| Stockholders’ equity: | |||||||
| Common stock, $0.001 par value; 80,000 shares authorized; outstanding: | 47 | 46 | |||||
| 46,762 shares at December 31, 2012 and 45,815 shares at December 31, 2011 | |||||||
| Preferred stock, $0.001 par value; 20,000 shares authorized, no shares issued and outstanding | — | — | |||||
| Additional paid-in capital | 285,524 | 266,022 | |||||
| Accumulated other comprehensive loss | (457 | ) | (1,405 | ) | |||
| Treasury stock, at cost; 111 shares at December 31, 2012 | (3,000 | ) | — | ||||
| Retained earnings | 500,200 | 490,410 | |||||
| Total stockholders’ equity | 782,314 | 755,073 | |||||
| $ | 1,934,822 | $ | 1,652,146 | ||||
| December 31, | ||||||||
| 2010 | 2009 | |||||||
| (Amounts in thousands, | ||||||||
| except per-share data) | ||||||||
ASSETS | ||||||||
Current assets: | ||||||||
| Cash and cash equivalents | $ | 455,886 | $ | 469,501 | ||||
| Investments | 295,375 | 174,844 | ||||||
| Receivables | 168,190 | 136,654 | ||||||
| Income tax refundable | — | 6,067 | ||||||
| Deferred income taxes | 15,716 | 8,757 | ||||||
| Prepaid expenses and other current assets | 22,772 | 14,383 | ||||||
| Total current assets | 957,939 | 810,206 | ||||||
| Property and equipment, net | 100,537 | 78,171 | ||||||
| Deferred contract costs | 28,444 | — | ||||||
| Intangible assets, net | 105,500 | 80,846 | ||||||
| Goodwill and indefinite-lived intangible assets | 212,228 | 133,408 | ||||||
| Investments | 20,449 | 59,687 | ||||||
| Restricted investments | 42,100 | 36,274 | ||||||
| Receivable for ceded life and annuity contracts | 24,649 | 25,455 | ||||||
| Other assets | 17,368 | 19,988 | ||||||
| $ | 1,509,214 | $ | 1,244,035 | |||||
| LIABILITIES AND STOCKHOLDERS’ EQUITY | ||||||||
Current liabilities: | ||||||||
| Medical claims and benefits payable | $ | 354,356 | $ | 315,316 | ||||
| Accounts payable and accrued liabilities | 137,930 | 71,732 | ||||||
| Deferred revenue | 60,086 | 101,985 | ||||||
| Income taxes payable | 13,176 | — | ||||||
| Total current liabilities | 565,548 | 489,033 | ||||||
| Long-term debt | 164,014 | 158,900 | ||||||
| Deferred income taxes | 16,235 | 12,506 | ||||||
| Liability for ceded life and annuity contracts | 24,649 | 25,455 | ||||||
| Other long-term liabilities | 19,711 | 15,403 | ||||||
| Total liabilities | 790,157 | 701,297 | ||||||
Stockholders’ equity: | ||||||||
| Common stock, $0.001 par value; 80,000 shares authorized; outstanding: 30,309 shares at December 31, 2010 and 25,607 shares at December 31, 2009 | 30 | 26 | ||||||
| Preferred stock, $0.001 par value; 20,000 shares authorized, no shares issued and outstanding | — | — | ||||||
| Additional paid-in capital | 251,627 | 129,902 | ||||||
| Accumulated other comprehensive loss | (2,192 | ) | (1,812 | ) | ||||
| Retained earnings | 469,592 | 414,622 | ||||||
| Total stockholders’ equity | 719,057 | 542,738 | ||||||
| $ | 1,509,214 | $ | 1,244,035 | |||||
See accompanying notes.
69
67
MOLINA HEALTHCARE, INC.
CONSOLIDATED STATEMENTS OF INCOME
| Year Ended December 31, | ||||||||||||
| 2010 | 2009 | 2008 | ||||||||||
| (In thousands, except per-share data) | ||||||||||||
Revenue: | ||||||||||||
| Premium revenue | $ | 3,989,909 | $ | 3,660,207 | $ | 3,091,240 | ||||||
| Service revenue | 89,809 | — | — | |||||||||
| Investment income | 6,259 | 9,149 | 21,126 | |||||||||
| Total revenue | 4,085,977 | 3,669,356 | 3,112,366 | |||||||||
Expenses: | ||||||||||||
| Medical care costs | 3,370,857 | 3,176,236 | 2,621,312 | |||||||||
| Cost of service revenue | 78,647 | — | — | |||||||||
| General and administrative expenses | 345,993 | 276,027 | 249,646 | |||||||||
| Premium tax expenses | 139,775 | 128,581 | 100,165 | |||||||||
| Depreciation and amortization | 45,704 | 38,110 | 33,688 | |||||||||
| Total expenses | 3,980,976 | 3,618,954 | 3,004,811 | |||||||||
| Gain on purchase of convertible senior notes | — | 1,532 | — | |||||||||
| Operating income | 105,001 | 51,934 | 107,555 | |||||||||
| Interest expense | (15,509 | ) | (13,777 | ) | (13,231 | ) | ||||||
| Income before income taxes | 89,492 | 38,157 | 94,324 | |||||||||
| Provision for income taxes | 34,522 | 7,289 | 34,726 | |||||||||
| Net income | $ | 54,970 | $ | 30,868 | $ | 59,598 | ||||||
| Net income per share: | ||||||||||||
| Basic | $ | 2.00 | $ | 1.19 | $ | 2.15 | ||||||
| Diluted | $ | 1.98 | $ | 1.19 | $ | 2.15 | ||||||
| Weighted average shares outstanding: | ||||||||||||
| Basic | 27,449 | 25,843 | 27,676 | |||||||||
| Diluted | 27,754 | 25,984 | 27,772 | |||||||||
| Year Ended December 31, | |||||||||||
| 2012 | 2011 | 2010 | |||||||||
| (In thousands, except per-share data) | |||||||||||
| Revenue: | |||||||||||
| Premium revenue | $ | 5,826,491 | $ | 4,603,407 | $ | 3,989,909 | |||||
| Service revenue | 187,710 | 160,447 | 89,809 | ||||||||
| Investment income | 5,188 | 5,539 | 6,259 | ||||||||
| Rental income | 9,374 | 547 | — | ||||||||
| Total revenue | 6,028,763 | 4,769,940 | 4,085,977 | ||||||||
| Expenses: | |||||||||||
| Medical care costs | 5,096,760 | 3,859,994 | 3,370,857 | ||||||||
| Cost of service revenue | 141,208 | 143,987 | 78,647 | ||||||||
| General and administrative expenses | 532,627 | 415,932 | 345,993 | ||||||||
| Premium tax expenses | 158,991 | 154,589 | 139,775 | ||||||||
| Depreciation and amortization | 63,704 | 50,690 | 45,704 | ||||||||
| Total expenses | 5,993,290 | 4,625,192 | 3,980,976 | ||||||||
| Impairment of goodwill and intangible assets | — | (64,575 | ) | — | |||||||
| Operating income | 35,473 | 80,173 | 105,001 | ||||||||
| Other expenses (income): | |||||||||||
| Interest expense | 16,769 | 15,519 | 15,509 | ||||||||
| Other income | (361 | ) | — | — | |||||||
| Total other expenses (income) | 16,408 | 15,519 | 15,509 | ||||||||
| Income before income taxes | 19,065 | 64,654 | 89,492 | ||||||||
| Provision for income taxes | 9,275 | 43,836 | 34,522 | ||||||||
| Net income | $ | 9,790 | $ | 20,818 | $ | 54,970 | |||||
| Net income per share: | |||||||||||
| Basic | $ | 0.21 | $ | 0.45 | $ | 1.34 | |||||
| Diluted | 0.21 | 0.45 | 1.32 | ||||||||
| Weighted average shares outstanding: | |||||||||||
| Basic | 46,380 | 45,756 | 41,174 | ||||||||
| Diluted | 46,999 | 46,425 | 41,631 | ||||||||
See accompanying notes.
68
MOLINA HEALTHCARE, INC.
CONSOLIDATED STATEMENTS OF STOCKHOLDERS’ EQUITYCOMPREHENSIVE INCOME
| Additional | Accumulated | |||||||||||||||||||||||||||
| Common Stock | Paid-in | Other | Retained | Treasury | ||||||||||||||||||||||||
| Outstanding | Amount | Capital | Comprehensive Loss | Earnings | Stock | Total | ||||||||||||||||||||||
| (In thousands) | ||||||||||||||||||||||||||||
| Balance at January 1, 2008 | 28,444 | $ | 28 | $ | 210,310 | $ | 272 | $ | 324,156 | $ | (20,390 | ) | $ | 514,376 | ||||||||||||||
| Comprehensive income: | ||||||||||||||||||||||||||||
| Net income | — | — | — | — | 59,598 | — | 59,598 | |||||||||||||||||||||
| Other comprehensive income, net of tax: | ||||||||||||||||||||||||||||
| Unrealized loss on investments | — | — | — | (7,025 | ) | — | — | (7,025 | ) | |||||||||||||||||||
Other-than-temporary impairment ofavailable-for-sale securities | — | — | — | 4,443 | — | — | 4,443 | |||||||||||||||||||||
| Total comprehensive income | — | — | — | (2,582 | ) | 59,598 | — | 57,016 | ||||||||||||||||||||
| Purchase of treasury stock | — | — | — | — | — | (49,940 | ) | (49,940 | ) | |||||||||||||||||||
| Retirement of treasury stock | (1,943 | ) | (1 | ) | (49,939 | ) | — | — | 49,940 | — | ||||||||||||||||||
| Stock issued in business purchase transaction | 48 | — | 1,262 | — | — | — | 1,262 | |||||||||||||||||||||
| Stock options exercised, employee stock grants and employee stock plan purchases | 176 | — | 9,340 | — | — | — | 9,340 | |||||||||||||||||||||
| Tax deficiency from employee stock compensation | — | — | (292 | ) | — | — | — | (292 | ) | |||||||||||||||||||
| Balance at December 31, 2008 | 26,725 | 27 | 170,681 | (2,310 | ) | 383,754 | (20,390 | ) | 531,762 | |||||||||||||||||||
| Comprehensive income: | ||||||||||||||||||||||||||||
| Net income | — | — | — | — | 30,868 | — | 30,868 | |||||||||||||||||||||
| Other comprehensive income, net of tax: | ||||||||||||||||||||||||||||
| Unrealized gain on investments | — | — | — | 498 | — | — | 498 | |||||||||||||||||||||
| Total comprehensive income | — | — | — | 498 | 30,868 | — | 31,366 | |||||||||||||||||||||
| Purchase of treasury stock | — | — | — | — | — | (27,712 | ) | (27,712 | ) | |||||||||||||||||||
| Retirement of treasury stock | (1,352 | ) | (1 | ) | (48,101 | ) | — | — | 48,102 | — | ||||||||||||||||||
| Retirement of convertible debt | — | — | (476 | ) | — | — | — | (476 | ) | |||||||||||||||||||
| Employee stock grants and employee stock plan purchases | 234 | — | 8,516 | — | — | — | 8,516 | |||||||||||||||||||||
| Tax deficiency from employee stock compensation | — | — | (718 | ) | — | — | — | (718 | ) | |||||||||||||||||||
| Balance at December 31, 2009 | 25,607 | 26 | 129,902 | (1,812 | ) | 414,622 | — | 542,738 | ||||||||||||||||||||
| Comprehensive income: | ||||||||||||||||||||||||||||
| Net income | — | — | — | — | 54,970 | — | 54,970 | |||||||||||||||||||||
| Other comprehensive income, net of tax: | ||||||||||||||||||||||||||||
| Unrealized loss on investments | — | — | — | (380 | ) | — | — | (380 | ) | |||||||||||||||||||
| Total comprehensive income | — | — | — | (380 | ) | 54,970 | — | 54,590 | ||||||||||||||||||||
| Common stock issued, net of issuance costs | 4,350 | 4 | 111,127 | — | — | 111,131 | ||||||||||||||||||||||
| Employee stock grants and employee stock plan purchases | 352 | — | 11,271 | — | — | — | 11,271 | |||||||||||||||||||||
| Tax deficiency from employee stock compensation | — | — | (673 | ) | — | — | — | (673 | ) | |||||||||||||||||||
| Balance at December 31, 2010 | 30,309 | $ | 30 | $ | 251,627 | $ | (2,192 | ) | $ | 469,592 | $ | — | $ | 719,057 | ||||||||||||||
| Year Ended December 31, | |||||||||||
| 2012 | 2011 | 2010 | |||||||||
| (In thousands) | |||||||||||
| Net income | $ | 9,790 | $ | 20,818 | $ | 54,970 | |||||
| Other comprehensive income (loss), before tax: | |||||||||||
| Unrealized gain (loss) on investments | 1,529 | 1,167 | (613 | ) | |||||||
| Total other comprehensive income (loss), before tax | 1,529 | 1,167 | (613 | ) | |||||||
| Income tax expense (benefit) related to items of other comprehensive income | 581 | 380 | (233 | ) | |||||||
| Total other comprehensive income (loss), net of tax | 948 | 787 | (380 | ) | |||||||
| Comprehensive income | $ | 10,738 | $ | 21,605 | $ | 54,590 | |||||
69
MOLINA HEALTHCARE, INC.
CONSOLIDATED STATEMENTS OF CASH FLOWS
| Year Ended December 31, | ||||||||||||
| 2010 | 2009 | 2008 | ||||||||||
| (In thousands) | ||||||||||||
Operating activities: | ||||||||||||
| Net income | $ | 54,970 | $ | 30,868 | $ | 59,598 | ||||||
| Adjustments to reconcile net income to net cash provided by operating activities: | ||||||||||||
| Depreciation and amortization | 60,765 | 38,110 | 33,688 | |||||||||
| Unrealized (gain) loss on trading securities | (4,170 | ) | (3,394 | ) | 399 | |||||||
| Loss (gain) on rights agreement | 3,807 | 3,100 | (6,907 | ) | ||||||||
Other-than-temporary impairment onavailable-for-sale securities | — | — | 7,166 | |||||||||
| Deferred income taxes | (4,092 | ) | (1 | ) | (3,404 | ) | ||||||
| Stock-based compensation | 9,531 | 7,485 | 7,811 | |||||||||
| Non-cash interest on convertible senior notes | 5,114 | 4,782 | 4,707 | |||||||||
| Gain on purchase of convertible senior notes | — | (1,532 | ) | — | ||||||||
| Amortization of deferred financing costs | 1,780 | 1,872 | 1,435 | |||||||||
| Tax deficiency from employee stock compensation | (968 | ) | (749 | ) | (335 | ) | ||||||
| Loss on disposal of property and equipment | — | — | 142 | |||||||||
| Changes in operating assets and liabilities, net of effects of business combinations: | ||||||||||||
| Receivables | (7,539 | ) | (8,092 | ) | (17,025 | ) | ||||||
| Prepaid expenses and other current assets | (9,756 | ) | 383 | (2,245 | ) | |||||||
| Medical claims and benefits payable | 34,363 | 22,874 | (19,164 | ) | ||||||||
| Accounts payable and accrued liabilities | 40,482 | (26,467 | ) | 10,830 | ||||||||
| Deferred revenue | (41,899 | ) | 88,181 | (26,300 | ) | |||||||
| Income taxes | 19,258 | (2,049 | ) | (9,965 | ) | |||||||
| Net cash provided by operating activities | 161,646 | 155,371 | 40,431 | |||||||||
Investing activities: | ||||||||||||
| Purchases of equipment | (48,538 | ) | (35,870 | ) | (34,690 | ) | ||||||
| Purchases of investments | (302,842 | ) | (186,764 | ) | (263,229 | ) | ||||||
| Sales and maturities of investments | 225,106 | 204,365 | 246,524 | |||||||||
| Net cash paid in business combinations | (130,743 | ) | (11,294 | ) | (1,000 | ) | ||||||
| Increase in deferred contract costs | (29,319 | ) | — | — | ||||||||
| (Increase) decrease in restricted investments | (5,566 | ) | 1,928 | (9,183 | ) | |||||||
| Change in other noncurrent assets and liabilities | 2,830 | (10,078 | ) | (2,942 | ) | |||||||
| Net cash used in investing activities | (289,072 | ) | (37,713 | ) | (64,520 | ) | ||||||
Financing activities: | ||||||||||||
| Proceeds from common stock offering, net of issuance costs | 111,131 | — | — | |||||||||
| Amount borrowed under credit facility | 105,000 | — | — | |||||||||
| Repayment of amount borrowed under credit facility | (105,000 | ) | — | — | ||||||||
| Treasury stock purchases | — | (27,712 | ) | (49,940 | ) | |||||||
| Purchase of convertible senior notes | — | (9,653 | ) | — | ||||||||
| Credit facility fees paid | (1,671 | ) | — | — | ||||||||
| Proceeds from employee stock plans | 4,056 | 2,015 | 2,084 | |||||||||
| Excess tax benefits from employee stock compensation | 295 | 31 | 43 | |||||||||
| Net cash provided by (used in) financing activities | 113,811 | (35,319 | ) | (47,813 | ) | |||||||
| Net (decrease) increase in cash and cash equivalents | (13,615 | ) | 82,339 | (71,902 | ) | |||||||
| Cash and cash equivalents at beginning of year | 469,501 | 387,162 | 459,064 | |||||||||
| Cash and cash equivalents at end of year | $ | 455,886 | $ | 469,501 | $ | 387,162 | ||||||
| Year Ended December 31, | |||||||||||
| 2012 | 2011 | 2010 | |||||||||
| (In thousands) | |||||||||||
| Operating activities: | |||||||||||
| Net income | $ | 9,790 | $ | 20,818 | $ | 54,970 | |||||
| Adjustments to reconcile net income to net cash provided by operating activities: | |||||||||||
| Depreciation and amortization | 78,764 | 74,383 | 60,765 | ||||||||
| Deferred income taxes | (9,887 | ) | 13,836 | (4,092 | ) | ||||||
| Stock-based compensation | 20,018 | 17,052 | 9,531 | ||||||||
| Non-cash interest on convertible senior notes | 5,942 | 5,512 | 5,114 | ||||||||
| Impairment of goodwill and intangible assets | — | 64,575 | — | ||||||||
| Change in fair value of interest rate swap | 1,307 | — | — | ||||||||
| Amortization of premium/discount on investments | 6,746 | 7,242 | 2,029 | ||||||||
| Amortization of deferred financing costs | 1,089 | 2,818 | 1,780 | ||||||||
| Gain on sale of subsidiary | (1,747 | ) | — | — | |||||||
| Loss on disposal of property and equipment | 2,608 | — | — | ||||||||
| Gain on acquisition | — | (1,676 | ) | — | |||||||
| Unrealized gain on trading securities | — | — | (4,170 | ) | |||||||
| Loss on rights agreement | — | — | 3,807 | ||||||||
| Tax deficiency from employee stock compensation | (526 | ) | (714 | ) | (968 | ) | |||||
| Changes in operating assets and liabilities: | |||||||||||
| Receivables | 18,216 | 352 | (7,539 | ) | |||||||
| Prepaid expenses and other current assets | (8,958 | ) | 3,308 | (12,034 | ) | ||||||
| Medical claims and benefits payable | 92,054 | 48,120 | 34,363 | ||||||||
| Accounts payable and accrued liabilities | 23,345 | 2,778 | 40,482 | ||||||||
| Deferred revenue | 90,851 | (8,154 | ) | (41,899 | ) | ||||||
| Income taxes | 18,172 | (24,855 | ) | 19,258 | |||||||
| Net cash provided by operating activities | 347,784 | 225,395 | 161,397 | ||||||||
| Investing activities: | |||||||||||
| Purchases of equipment | (78,145 | ) | (60,581 | ) | (48,538 | ) | |||||
| Purchases of investments | (306,437 | ) | (345,968 | ) | (302,842 | ) | |||||
| Sales and maturities of investments | 298,006 | 302,667 | 223,077 | ||||||||
| Net cash paid in business combinations | — | (84,253 | ) | (130,743 | ) | ||||||
| Proceeds from sale of subsidiary, net of cash surrendered | 9,162 | — | — | ||||||||
| Increase in deferred contract costs | (11,610 | ) | (42,830 | ) | (29,319 | ) | |||||
| Increase in restricted investments | (2,647 | ) | (4,064 | ) | (5,566 | ) | |||||
| Change in other noncurrent assets and liabilities | (1,913 | ) | (1,898 | ) | 5,108 | ||||||
| Net cash used in investing activities | (93,584 | ) | (236,927 | ) | (288,823 | ) | |||||
| Financing activities: | |||||||||||
| Amount borrowed under term loan | — | 48,600 | — | ||||||||
| Amount borrowed under credit facility | 60,000 | — | 105,000 | ||||||||
| Proceeds from common stock offering, net of issuance costs | — | — | 111,131 | ||||||||
| Repayment of amount borrowed under credit facility | (20,000 | ) | — | (105,000 | ) | ||||||
| Treasury stock purchases | (3,000 | ) | (7,000 | ) | — | ||||||
| Credit facility fees paid | — | (1,125 | ) | (1,671 | ) | ||||||
| Principal payments on term loan | (1,129 | ) | — | — | |||||||
| Proceeds from employee stock plans | 8,205 | 7,347 | 4,056 | ||||||||
| Excess tax benefits from employee stock compensation | 3,667 | 1,651 | 295 | ||||||||
| Net cash provided by financing activities | 47,743 | 49,473 | 113,811 | ||||||||
| Net increase (decrease) in cash and cash equivalents | 301,943 | 37,941 | (13,615 | ) | |||||||
| Cash and cash equivalents at beginning of period | 493,827 | 455,886 | 469,501 | ||||||||
| Cash and cash equivalents at end of period | $ | 795,770 | $ | 493,827 | $ | 455,886 | |||||
See accompanying notes.
70
MOLINA HEALTHCARE, INC.
CONSOLIDATED STATEMENTS OF CASH FLOWS — (Continued)(continued)
| Year Ended December 31, | ||||||||||||
| 2010 | 2009 | 2008 | ||||||||||
| (In thousands) | ||||||||||||
Supplemental cash flow information | ||||||||||||
| Cash paid during the year for: | ||||||||||||
| Income taxes | $ | 18,299 | $ | 23,480 | $ | 46,088 | ||||||
| Interest | $ | 10,951 | $ | 8,205 | $ | 7,797 | ||||||
Schedule of non-cash investing and financing activities: | ||||||||||||
| Retirement of treasury stock | $ | — | $ | 48,102 | $ | 49,940 | ||||||
| Details of business combinations: | ||||||||||||
| Fair value of assets acquired | $ | (159,916 | ) | $ | (34,594 | ) | $ | (2,262 | ) | |||
| Release of escrow and other deposits | — | 18,000 | — | |||||||||
| Common stock issued to seller | — | — | 1,262 | |||||||||
| Less payable to seller | 4,723 | 5,300 | — | |||||||||
| Fair value of liabilities assumed | 24,450 | — | — | |||||||||
| Net cash paid in business purchase transactions | $ | (130,743 | ) | $ | (11,294 | ) | $ | (1,000 | ) | |||
| Year Ended December 31, | |||||||||||
| 2012 | 2011 | 2010 | |||||||||
| (In thousands) | |||||||||||
| Supplemental cash flow information: | |||||||||||
| Cash (received) paid during the period for: | |||||||||||
| Income taxes | $ | (4,634 | ) | $ | 54,663 | $ | 18,299 | ||||
| Interest | $ | 10,099 | $ | 11,399 | $ | 10,951 | |||||
| Schedule of non-cash investing and financing activities: | |||||||||||
| Retirement of treasury stock | $ | — | $ | 7,000 | $ | — | |||||
| Retirement of common stock used for stock-based compensation | $ | (11,862 | ) | $ | (3,926 | ) | $ | (2,316 | ) | ||
| Details of sale of subsidiary | |||||||||||
| Decrease in carrying value of assets | 30,942 | — | — | ||||||||
| Decrease in carrying value of liabilities | (23,527 | ) | — | — | |||||||
| Gain on sale | 1,747 | — | — | ||||||||
| Proceeds from sale of subsidiary, net of cash surrendered | 9,162 | — | — | ||||||||
| Details of business combinations: | |||||||||||
| Increase in fair value of assets acquired | $ | — | $ | (81,256 | ) | $ | (159,916 | ) | |||
| (Decrease) increase in fair value of liabilities assumed | — | (1,045 | ) | 24,450 | |||||||
| (Decrease) increase in payable to seller | — | (1,952 | ) | 4,723 | |||||||
| Net cash paid in business combinations | $ | — | $ | (84,253 | ) | $ | (130,743 | ) | |||
See accompanying notes.
71
MOLINA HEALTHCARE, INC.
CONSOLIDATED STATEMENTS OF STOCKHOLDERS’ EQUITY
| Common Stock | Additional Paid-in Capital | Accumulated Other Comprehensive Loss | Retained Earnings | Treasury Stock | ||||||||||||||||||||||
| Outstanding | Amount | Total | ||||||||||||||||||||||||
| (In thousands) | ||||||||||||||||||||||||||
| Balance at January 1, 2010 | 38,410 | $ | 38 | $ | 129,890 | $ | (1,812 | ) | $ | 414,622 | $ | — | $ | 542,738 | ||||||||||||
| Net income | — | — | — | — | 54,970 | — | 54,970 | |||||||||||||||||||
| Other comprehensive loss, net of tax | — | — | — | (380 | ) | — | — | (380 | ) | |||||||||||||||||
| Common stock issued, net of issuance costs | 6,525 | 7 | 111,124 | — | — | — | 111,131 | |||||||||||||||||||
| Employee stock grants and employee stock purchase plans | 528 | — | 11,271 | — | — | — | 11,271 | |||||||||||||||||||
| Tax deficiency from employee stock compensation | — | — | (673 | ) | — | — | — | (673 | ) | |||||||||||||||||
| Balance at December 31, 2010 | 45,463 | 45 | 251,612 | (2,192 | ) | 469,592 | — | 719,057 | ||||||||||||||||||
| Net income | — | — | — | — | 20,818 | — | 20,818 | |||||||||||||||||||
| Other comprehensive income, net of tax | — | — | — | 787 | — | — | 787 | |||||||||||||||||||
| Purchase of treasury stock | — | — | — | — | — | (7,000 | ) | (7,000 | ) | |||||||||||||||||
| Retirement of treasury stock | (400 | ) | — | (7,000 | ) | — | — | 7,000 | — | |||||||||||||||||
| Employee stock grants and employee stock plan purchases | 752 | 1 | 20,473 | — | — | — | 20,474 | |||||||||||||||||||
| Tax benefit from employee stock compensation | — | — | 937 | — | — | — | 937 | |||||||||||||||||||
| Balance at December 31, 2011 | 45,815 | 46 | 266,022 | (1,405 | ) | 490,410 | — | 755,073 | ||||||||||||||||||
| Net income | — | — | — | — | 9,790 | — | 9,790 | |||||||||||||||||||
| Other comprehensive income, net of tax | — | — | — | 948 | — | — | 948 | |||||||||||||||||||
| Purchase of treasury stock | (111 | ) | — | — | — | — | (3,000 | ) | (3,000 | ) | ||||||||||||||||
| Employee stock grants and employee stock plan purchases | 1,058 | 1 | 16,361 | — | — | — | 16,362 | |||||||||||||||||||
| Tax benefit from employee stock compensation | — | — | 3,141 | — | — | — | 3,141 | |||||||||||||||||||
| Balance at December 31, 2012 | 46,762 | $ | 47 | $ | 285,524 | $ | (457 | ) | $ | 500,200 | $ | (3,000 | ) | $ | 782,314 | |||||||||||
See accompanying notes.
72
MOLINA HEALTHCARE, INC.
NOTES TO CONSOLIDATED FINANCIAL STATEMENTS
1. Basis of Presentation
Organization and Operations
Molina Healthcare, Inc. provides quality and cost-effective Medicaid-related solutions to meet the health care needs of low-income families and individuals, and to assist state agencies in their administration of the Medicaid program. We report our financial performance based on two reportable segments: Health Plans and Molina Medicaid Solutions.
Our Health Plans segment comprises health plans in California, Florida, Michigan, Missouri, New Mexico, Ohio, Texas, Utah, Washington, and Wisconsin. TheseWisconsin, and includes our direct delivery business. As of December 31, 2012, these health plans served approximately 1.6 1.8million members eligible for Medicaid, Medicare, and other government-sponsored health care programs for low-income families and individuals as of December 31, 2010.individuals. The health plans are operated by our respective wholly owned subsidiaries in those states, each of which is licensed as a health maintenance organization, or HMO. Effective January 1, 2010,Our direct delivery business consists of primary care clinics in California, Florida, New Mexico and Washington; additionally, we terminated operationsmanage three county-owned primary care clinics under a contract with Fairfax County, Virginia.
Our health plans' state Medicaid contracts generally have terms of three to four years with annual adjustments to premium rates. These contracts are renewable at our small Medicarethe discretion of the state. In general, either the state Medicaid agency or the health plan may terminate the state contract with or without cause. Most of these contracts contain renewal options that are exercisable by the state. Our health plan subsidiaries have generally been successful in Nevada.obtaining the renewal of their contracts in each state prior to the actual expiration of their contracts. Our state contracts are generally at greatest risk of loss when a state issues a new request for proposals, or RFP, subject to competitive bidding by other health plans. If one of our health plans is not a successful responsive bidder to a state RFP, its contract may be subject to non-renewal. For instance, on February 17, 2012, the Division of Purchasing of the Missouri Office of Administration notified us that our Missouri health plan was not awarded a contract under the Missouri HealthNet Managed Care Request for Proposal; therefore, our Missouri health plan’s prior contract with the state expired without renewal on June 30, 2012 subject to certain transition obligations. As of December 31, 2012, we continued to process claims that were incurred by the Missouri health plan's members through the June 30, 2012 termination date. For the six months ended June 30, 2012, our Missouri health plan contributed premium revenue of$113.8 million, or 4.1%of total premium revenue, and comprised79,000 members, or 4.3%of total Health Plans segment membership as of June 30, 2012.
Our state Medicaid contracts may be periodically adjusted to include or exclude certain health benefits (such as pharmacy services, behavioral health services, or long-term care services); populations (such as the aged, blind or disabled, or ABD); and regions or service areas. For example, our Texas health plan added significant membership effective March 1, 2012, in service areas we had not previously served (the Hidalgo and El Paso service areas); and among populations we had not previously served within existing service areas, such as the Temporary Assistance for Needy Families, or TANF, population in the Dallas service area. Additionally, the health benefits provided to our TANF and ABD members in Texas under our contracts with the state were expanded to include inpatient facility and pharmacy services.
Our Molina Medicaid Solutions which we acquired during 2010, segment provides business processing and information technology development and administrative services to Medicaid agencies in Idaho, Louisiana, Maine, New Jersey, and West Virginia, and drug rebate administration services in Florida.
On July 13, 2012, our Molina Medicaid Solutions segment received full federal certification of its Medicaid Management Information System, or MMIS, in the state of Idaho from CMS. As a result of the CMS certification, the state of Idaho is entitled to receive federal reimbursement of 75% of its MMIS operations costs retroactive to June 1, 2010, the date that the system first began processing claims. Our MMIS in Maine received full federal certification from CMS on December 19, 2011.
On June 9, 2011, Molina Medicaid Solutions received notice from the state of Louisiana that the state intends to award the contract for a replacement MMIS to another company. For the year endedDecember 31, 2012, our revenue under the Louisiana MMIS contract was$54.9 million, or 29.2%of total service revenue. We expect that we will continue to perform under this contract through implementation and acceptance of the successor MMIS. Based upon our past experience and our knowledge of the Louisiana MMIS bid process, we believe that implementation and acceptance of the successor MMIS will not occur until 2014 at the earliest. Through implementation and acceptance of the successor MMIS we expect to recognize approximately$40 millionin revenue annually under our Louisiana MMIS contract.
Consolidation and Presentation
The consolidated financial statements include the accounts of Molina Healthcare, Inc., its wholly owned subsidiaries, and two variable interest entities in which Molina Healthcare, Inc. is considered to be the primary beneficiary. See Note 18,
73
“Variable Interest Entities,” for more information regarding these variable interest entities. In the opinion of management, all majority owned subsidiaries.adjustments considered necessary for a fair presentation of the results as of the date and for the interim periods presented have been included; such adjustments consist of normal recurring adjustments. All significant intercompanyinter-company balances and transactions and balances have been eliminated in consolidation. Financial information related to subsidiaries acquired during any year is included only for the periodperiods subsequent to their acquisition. Our operating results for the year ended December 31, 2010, include the results of the following businesses acquired during 2010:
Use of Estimates
The preparation of consolidated financial statements in conformity with U.S. generally accepted accounting principles requires management to make estimates and assumptions that affect the reported amounts of assets and liabilities and the disclosure of contingent assets and liabilities at the date of the financial statements. Estimates also affect the reported amounts of revenues and expenses during the reporting period. Actual results could differ from these estimates. Principal areas requiring the use of estimates include:
74
Health plan contractual provisions that may limit revenue based upon the costs incurred or the profits realized under a specific contract;
Health plan quality incentives that allow us to recognize incremental revenue if certain quality standards are met;
The valuation of certain investments;
Settlements under risk or savings sharing programs;
The determination of professional and general liability claims, and reserves for potential absorption of claims unpaid by insolvent providers;
The determination of valuation allowances for deferred tax as a premiumassets; and
The determination of unrecognized tax and not as an income tax. For the years ended December 31, 2009, and 2008, amounts for premium tax expense and income tax expense have been reclassified to conform to this presentation. See Note 2, “Significantbenefits.
2. Significant Accounting Policies.”Policies
Cash and Cash Equivalents
Cash and cash equivalents consist of cash and short-term, highly liquid investments that are both readily convertible into known amounts of cash and have a maturity of three months or less on the date of purchase.
Investments
Our investments are principally held in debt securities, which are grouped into two separate categories for accounting and reporting purposes:available-for-sale securities, andheld-to-maturity securities.Available-for-sale securities are recorded at fair value and unrealized gains and losses, if any, are recorded in stockholders’ equity as other comprehensive income, net of applicable income taxes.Held-to-maturity securities are recorded at amortized cost, which approximates fair value, and unrealized holding gains or losses are not generally recognized. Realized gains and losses and unrealized losses judged to be other than temporary with respect toavailable-for-sale andheld-to-maturity securities are included in the determination of net income.
The cost of securities sold is determined using the specific-identification method, on an amortized cost basis. Fair values of securities are generally based on quoted prices in active markets.
Our investment policy requires that all of our investments have final maturities of five years or less (excluding auction rate and variable rate securities where interest rates may be periodically reset), and that the average maturity be two years or less.less. Investments and restricted investments are subject to interest rate risk and will decrease in value if market rates increase. Declines in interest rates over time will reduce our investment income.
In general, ouravailable-for-sale securities are classified as current assets without regard to the securities’ contractual maturity dates because they may be readily liquidated. Our auction rate securities are classified as non-current assets. For comprehensive discussions of the fair value and classification of our current and non-current investments, including auction rate securities, see Note 5, “Fair Value Measurements,” and Note 6, “Investments” and Note 10, “Restricted Investments.”
Receivables
Receivables consist primarily of amounts due from the various states in which we operate, and are subject to potential retroactive adjustment. Because such receivables are readily determinable, and our creditors are primarily state governments, and our allowance for doubtful accounts is immaterial. Any amounts determined to be uncollectible are charged to expense when such determination is made. See Note 7, “Receivables.” Additionally, we cede 100% of the financial responsibility for Medicare members covered by our Wisconsin health plan to third a party health reinsurer. In connection with the arrangement, as of December 31, 2010, we have recorded a receivable from the third party reinsurer of $5.0 million along with a corresponding current liability of $5.0 million."Receivables."
Property, Equipment, and Capitalized Software
Property and equipment are stated at historical cost. Replacements and major improvements are capitalized, and repairs and maintenance are charged to expense as incurred. Furniture and equipment are generally depreciated using the straight-line method over estimated useful lives ranging from three to seven years. Software developed for internal use is capitalized. Software is generally amortized over its estimated useful life of three years. Leasehold improvements are amortized over the term of the lease, or over their useful lives from five to 10 years, whichever is shorter. Buildings are depreciated over their estimated useful lives of 31.5 to 40 years. See Note 8, “Property, Equipment, and Equipment.Capitalized Software.”
As discussed below, the costs associated with certain of our Molina Medicaid Solutions segment equipment and software which may be ultimately transferred to our clients under fixed-price contracts, are capitalized and recorded as deferred contract costs. Such costs are amortized on a straight-line basis over the shorter of the useful life or the contract period.
Depreciation and Amortization
Amortization of service. purchased intangibles relating to customer relationships is reported as amortization within the heading “Depreciation and amortization;”
Amortization of purchased intangibles relating to contract backlog is recorded as a reduction of “Service revenue;” and
Depreciation is recorded within the heading “Cost of service revenue.”
The firstfollowing table presents all depreciation and amortization recorded in our consolidated statements of these isincome, regardless of whether the design, developmentitem appears as depreciation and implementation,amortization, a reduction of revenue, or DDI,as cost of a Medicaid Management Information System, or MMIS. The second element, following completion of the DDI element, is the operation of the MMIS under a business process outsourcing, or BPO, arrangement. While providing BPO services, we also provide the state with the third contracted element — training and IT support and hosting services (training and support).service revenue.
| Year Ended December 31, | |||||||||||
| 2012 | 2011 | 2010 | |||||||||
| (Dollar amounts in thousands) | |||||||||||
| Depreciation, and amortization of capitalized software | $ | 43,201 | $ | 30,864 | $ | 27,230 | |||||
| Amortization of intangible assets | 20,503 | 19,826 | 18,474 | ||||||||
| Depreciation and amortization reported as such in the consolidated statements of income | 63,704 | 50,690 | 45,704 | ||||||||
| Amortization recorded as reduction of service revenue | 1,571 | 6,822 | 8,316 | ||||||||
| Amortization of capitalized software recorded as cost of service revenue | 13,489 | 16,871 | 6,745 | ||||||||
| Total | $ | 78,764 | $ | 74,383 | $ | 60,765 | |||||
Long-Lived Assets, including Intangible Assets
Long-lived assets comprise primarily property, equipment, capitalized software and at no point in the contract will we have VSOE for the undelivered elements in the contract. We lack VSOE of the fair value of the individual elements of our Molina Medicaid Solutions contracts for the following reasons:
76
Identifiable intangible assets associated with Molina Medicaid Solutions are classified as either contract backlog or customer relationships.relationships as follows:
The contract backlog intangible asset comprises all contractual cash flows anticipated to be received during the remaining contracted period for each specific contract relating to work that was performed prior to the acquisition. The contract backlog intangible has been developed on acontract-by-contract basis. The amortizationBecause each
75
acquired contract constitutes a single revenue stream, amortization of the contract backlog intangible is recorded to contra-service revenue so that amortization is matched to any revenues associated with contract performance that occurred prior to the acquisition date. The contract backlog intangible asset is amortized on a straight-line basis for each specific contract over periods generally ranging from one to six years. The contract backlog intangible assets will be fully amortized in 2015.
The customer relationship intangible asset comprises all contractual cash flows that are anticipated to be received during the option periods of each specific contract as well as anticipated renewals of those contracts. The customer relationship intangible is amortized on a straight-line basis for each specific contract over periods generally ranging from four to nine years.
| Year Ended December 31, | ||||||||||||
| 2010 | 2009 | 2008 | ||||||||||
| (In thousands) | ||||||||||||
| Depreciation | $ | 27,230 | $ | 25,172 | $ | 20,718 | ||||||
| Amortization of intangible assets | 18,474 | 12,938 | 12,970 | |||||||||
| Depreciation and amortization reported in our consolidated statements of income | 45,704 | 38,110 | 33,688 | |||||||||
| Amortization recorded as reduction of service revenue | 8,316 | — | — | |||||||||
| Depreciation recorded as cost of service revenue | 6,745 | — | — | |||||||||
| Depreciation and amortization reported in our consolidated statements of cash flows | $ | 60,765 | $ | 38,110 | $ | 33,688 | ||||||
78
these contracts will continue to be renewed. Impaired assetsrenewed as in the case of our Missouri health plan, described below.
Following the identification of any potential impairment indicators, to determine whether an impairment exists, we would compare the carrying amount of a finite-lived intangible asset with the undiscounted cash flows that are written downexpected to fair value. We haveresult from the use of the asset or related group of assets. If it is determined that nothe carrying amount of the asset is not recoverable, the amount by which the carrying value exceeds the estimated fair value is recorded as an impairment.
On February 17, 2012, we received notification that our Missouri Health plan's contract with the state of Missouri would expire without renewal on June 30, 2012. As a result, we recorded a total non-cash impairment charge of $64.6 million in 2011, of which $6.1 million related to finite-lived intangible assets, and $58.5 million related to goodwill, discussed below. The impairment charge comprised substantially all intangible assets relating to contract rights and licenses, and provider networks recorded at the time of our acquisition of the Missouri health plan in 2007. No impairment charges relating to long-lived assets, including intangible assets, were impairedrecorded in the years ended December 31, 2010, 2009,2012, and 2008.2010.
Goodwill
Goodwill represents the amount of the purchase price in excess of the fair values assigned to the underlying identifiable net assets of acquired businesses. Goodwill is not amortized, but is subject to an annual impairment test. Tests are performed more frequently if events occur or circumstances change that would more likely than not reduce the fair value of the reporting unit below its carrying amount.
To determine whether goodwill is impaired, we measure the fair values of our reporting units and compare them to their aggregate carrying values, including goodwill. If the fair value is less than the carrying value of the reporting unit, then the implied value of goodwill would be calculated and compared to the carrying amount of goodwill to determine whether goodwill is impaired.
We estimate the fair values of our reporting units using discounted cash flows. To determine fair values, we must make assumptions about a wide variety of internal and external factors. Significant assumptions used in the impairment analysis include financial projections of free cash flow (including significant assumptions about operations, capital requirements and income taxes), long-term growth rates for determining terminal value, and discount rates.
In connection with our Missouri health plan as described above, we recorded a non-cash impairment charge of $58.5 million in the fourth quarter of 2011. The impairment charge comprised all of the goodwill recorded at the time of our acquisition of the Missouri health plan in 2007, and was not tax deductible. No impairment charges relating to goodwill were recorded in the years ended December 31, 2012, and 2010.
Restricted Investments
Restricted investments, which consist of certificates of deposit and treasury securities, are designated asheld-to-maturity and are carried at amortized cost, which approximates market value. The use of these funds is limited to specific purposes as required by each state, or as protection against the insolvency of capitated providers. We have the ability to hold our restricted investments until maturity and, as a result, we would not expect the value of these investments to decline significantly due to a sudden change in market interest rates. See Note 10, “Restricted Investments.”
Other Assets
Significant items included in other assets include deferred financing costs associated with our convertible senior notes and with our credit facility, certain investments held in connection with our employee deferred compensation program, and an
76
investment in a vision services provider (see Note 17, “Related Party Transactions”). The deferred financing costs are being amortized on a straight-line basis over the seven-yearseven-year term of the convertible senior notes and the five year-year term of the credit facility. See Note 12, "Long-Term Debt," regarding the termination of the Credit Facility.
Delegated Provider Insolvency
Circumstances may arise where providers to whom we have delegated risk, due to insolvency or other circumstances, are unable to pay claims they have incurred with third parties in connection with referral services (including hospital inpatient services) provided to our members. The inability of delegated providers to pay referral claims presents us with both immediate financial risk and potential disruption to member care. Depending on states’ laws, we may be held liable for such unpaid referral claims even though the delegated provider has contractually assumed such risk. Additionally, competitive pressures may force us to pay such claims even when we have no legal obligation to do so. To reduce the risk that delegated providers are unable to pay referral claims, we monitor the operational and financial performance of such providers. We also maintain contingency plans that include transferring members to other providers in response to potential network instability.
In certain instances, we have required providers to place funds on deposit with us as protection against their potential insolvency. These reserves are frequently in the form of segregated funds received from the provider and held by us or placed in a third-party financial institution. These funds may be used to pay claims that are the financial responsibility of the provider in the event the provider is unable to meet these obligations. Additionally, we have recorded liabilities for estimated losses arising from provider instability or insolvency in excess of provider funds on deposit with us. Such liabilities were not material at December 31, 2010,2012, or December 31, 2009.2011.
Premium Revenue
Premium revenue is fixed in advance of the periods covered and, except as described below, is not generally subject to significant accounting estimates. For the year ended December 31, 20102012 we received approximately 94%96% of our premium revenue as a fixed amount per member per month, or PMPM, pursuant to our contracts with state Medicaid agencies, Medicare and other managed care organizations for which we operate as a subcontractor. These
79
premium revenues are recognized in the month that members are entitled to receive health care services. The state Medicaid programs and the federal Medicare program periodically adjust premium rates.
The following table summarizes premium revenue by health plan for the periods indicated:
| Year Ended December 31, | ||||||||||||
| 2010 | 2009 | 2008 | ||||||||||
| (In thousands) | ||||||||||||
| California | $ | 506,871 | $ | 481,717 | $ | 417,027 | ||||||
| Florida(1) | 170,683 | 102,232 | — | |||||||||
| Michigan | 630,134 | 557,421 | 509,782 | |||||||||
| Missouri | 210,852 | 230,222 | 225,280 | |||||||||
| New Mexico | 366,784 | 404,026 | 348,576 | |||||||||
| Ohio | 860,324 | 803,521 | 602,826 | |||||||||
| Texas | 188,716 | 134,860 | 110,178 | |||||||||
| Utah | 258,076 | 207,297 | 155,991 | |||||||||
| Washington | 758,849 | 726,137 | 709,943 | |||||||||
| Wisconsin(2) | 30,033 | — | — | |||||||||
| Other | 8,587 | 12,774 | 11,637 | |||||||||
| $ | 3,989,909 | $ | 3,660,207 | $ | 3,091,240 | |||||||
| Year Ended December 31, | |||||||||||
| 2012 | 2011 | 2010 | |||||||||
| (In thousands) | |||||||||||
| California | $ | 671,489 | $ | 575,176 | $ | 506,871 | |||||
| Florida | 228,828 | 203,945 | 170,683 | ||||||||
| Michigan | 658,741 | 662,127 | 630,134 | ||||||||
| Missouri(1) | 113,818 | 229,584 | 210,852 | ||||||||
| New Mexico | 338,770 | 345,732 | 366,784 | ||||||||
| Ohio | 1,187,422 | 988,896 | 860,324 | ||||||||
| Texas | 1,255,722 | 409,295 | 188,716 | ||||||||
| Utah | 298,392 | 287,290 | 258,076 | ||||||||
| Washington | 992,748 | 823,323 | 758,849 | ||||||||
| Wisconsin | 70,673 | 69,596 | 30,033 | ||||||||
| Other | 9,888 | 8,443 | 8,587 | ||||||||
| $ | 5,826,491 | $ | 4,603,407 | $ | 3,989,909 | ||||||
| (1) | ||
For the year ended December 31, 2010,2012, we received approximately 6%4% of our premium revenue in the form of “birth income” — a one-time payment for the delivery of a child — from the Medicaid programs in all of our state health plans except New Mexico. Such payments are recognized as revenue in the month the birth occurs.
Certain components of premium revenue are subject to accounting estimates. The components of premium revenue subject to estimation fall into two categories:
77
Contractual provisions that may limit revenue based upon the costs incurred or the profits realized under a specific contract.These are contractual provisions that require the health plan to return premiums to the extent that certain thresholds are not met. In some instances premiums are returned when medical costs fall below a certain percentage of gross premiums; or when administrative costs or profits exceed a certain percentage of gross premiums. In other instances, premiums are partially determined by the acuity of care provided to members (risk adjustment). To the extent that our expenses and profits change from the amounts previously reported (due to changes in estimates) our revenue earned for those periods will also change. In all of these instances our revenue is only subject to estimate due to the fact that the thresholds themselves contain elements (expense or profit) that are subject to estimate. While we have adequate experience and data to make sound estimates of our expenses or profits, changes to those estimates may be necessary, which in turn will lead to changes in our estimates of revenue. In general, a change in estimate relating to expense or profit would offset any related change in estimate to premium, resulting in no or small impact to net income. The following contractual provisions fall into this category:
California Health Plan Medical Cost Floors (Minimums): A portion of certain premiums received by our California health plan may be returned to the state if certain minimum amounts are not spent on defined medical care costs. We recorded a liability under the terms of these contract provisions of $0.3 millionand therefore$1.0 million at December 31, 2012, and December 31, 2011, respectively.
Florida Health Plan Medical Cost Floor (Minimum) for Behavioral Health:A portion of premiums received by our Florida health plan may be returned to the state if certain minimum amounts are not spent on defined behavioral health care costs. At bothDecember 31, 2012, and December 31, 2011, we had not recorded any liability under the terms of this contract provision since behavioral health expenses are not less than the contractual floor.
New Mexico Health Plan Medical Cost Floors (Minimums) and Administrative Cost and Profit Ceilings (Maximums):Our contract with the state of New Mexico directs that a portion of premiums received may be returned to the state if certain minimum amounts are not spent on defined medical care costs, or if administrative costs or profit (as defined) exceed certain amounts. At both December 31, 2012, and December 31, 2011we had not recorded any liability under the terms of these contract provisions.
Texas Health Plan Profit Sharing:Under our contract with the state of Texas, there is a profit-sharing agreement under which we pay a rebate to the state of Texas if our Texas health plan generates pretax income, as defined in the contract, above a certain specified percentage, as determined in accordance with a tiered rebate schedule. We are limited in the amount of administrative costs that we may deduct in calculating the rebate, if any. As a result of profits in excess of the amount we are allowed to fully retain, we accrued an aggregate liability of approximately$3.2 million and $0.7 millionpursuant to our profit-sharing agreement with the state of Texas at December 31, 2012 and December 31, 2011, respectively.
Washington Health Plan Medical Cost Floors (Minimums): A portion of certain premiums received by our Washington health plan may be returned to the state if certain minimum amounts are not spent on defined medical care costs. At both December 31, 2012, andDecember 31, 2011, we had not recorded any liability under the terms of this contract provision because medical expenses are not less than the contractual floor.
Medicare Revenue Risk Adjustment:Based on member encounter data that we submit to CMS, our Medicare premiums are subject to retroactive revision.adjustment for both member risk scores and member pharmacy cost experience for up to2years after the original year of service. This adjustment takes into account the acuity of each member’s medical needs relative to what was anticipated when premiums were originally set for that member. In the event that a member requires less acute medical care than was anticipated by the original premium amount, CMS may recover premium from us. In the event that a member requires more acute medical care than was anticipated by the original premium amount, CMS may pay us additional retroactive premium. A similar retroactive reconciliation is undertaken by CMS for our Medicare members’ pharmacy utilization. We estimate the amount of Medicare revenue that will ultimately be realized for the periods presented based on our knowledge of our members’ heath care utilization patterns and CMS practices. Based on our knowledge of member health care utilization patterns and expenses we have recorded a net receivable of approximately$0.3 million and $5.0 millionfor anticipated Medicare risk adjustment premiums at December 31, 2012 and December 31, 2011, respectively.
Quality incentives that allow us to recognize incremental revenue if certain quality standards are met.These are contract provisions that allow us to earn additional premium revenue in certain states if we achieve certain quality-of-care or administrative measures. We estimate the amount of revenue that will ultimately be realized for the periods presented based on our experience and expertise in meeting the quality and administrative measures as well as our ongoing and current monitoring of our progress
78
in meeting those measures. The most significantamount of the revenue that we will realize under these contractual provisions is determinable based upon that experience. The following contractual provisions fall into this category:
New Mexico Health Plan Quality Incentive Premiums:Under our contract with the state of New Mexico, incremental revenue of up to 0.75%of our total premium is earned if certain performance measures are met. These performance measures are generally linked to various quality-of-care and administrative measures dictated by the state.
Ohio Health Plan Quality Incentive Premiums:Under our contract with the state of Ohio, incremental revenue of up to1%of our total premium is earned if certain performance measures are met. These performance measures are generally linked to various quality-of-care measures dictated by the state.
Texas Health Plan Quality Incentive Premiums:Effective March 1, 2012, under our contract with the state of Texas, incremental revenue of up to5%of our total premium may be earned if certain performance measures are met. These performance measures are generally linked to various quality-of-care measures established by the state.
Wisconsin Health Plan Quality Incentive Premiums:Under our contract with the state of Wisconsin, effective beginning in 2011, up to3.25%of premium revenue is withheld by the state. The withheld premiums can be earned by the health plan by meeting certain performance measures. These performance measures are generally linked to various quality-of-care measures dictated by the state.
The following table quantifies the quality incentive premium revenue recognized for the periods presented, including the amounts earned in the period presented and prior periods. Although the reasonably possible effects of a change in estimate related to quality incentive premium revenue as of December 31, 2012are not known, we have no reason to believe that the adjustments to prior years noted below are not indicative of the potential future changes in our estimates involve:as of December 31, 2012.
| Year Ended December 31, 2012 | |||||||||||||||||||
Maximum Available Quality Incentive Premium – Current Year | Amount of Current Year Quality Incentive Premium Revenue Recognized | Amount of Quality Incentive Premium Revenue Recognized from Prior Year | Total Quality Incentive Premium Revenue Recognized | Total Revenue Recognized | |||||||||||||||
| (In thousands) | |||||||||||||||||||
| New Mexico | $ | 2,244 | $ | 1,889 | $ | 643 | $ | 2,532 | $ | 338,770 | |||||||||
| Ohio | 12,033 | 8,079 | 966 | 9,045 | 1,187,422 | ||||||||||||||
| Texas | 58,516 | 52,521 | — | 52,521 | 1,255,722 | ||||||||||||||
| Wisconsin | 1,771 | — | 593 | 593 | 70,673 | ||||||||||||||
| $ | 74,564 | $ | 62,489 | $ | 2,202 | $ | 64,691 | $ | 2,852,587 | ||||||||||
| Year Ended December 31, 2011 | |||||||||||||||||||
Maximum Available Quality Incentive Premium – Current Year | Amount of Current Year Quality Incentive Premium Revenue Recognized | Amount of Quality Incentive Premium Revenue Recognized from Prior Year | Total Quality Incentive Premium Revenue Recognized | Total Revenue Recognized | |||||||||||||||
| (In thousands) | |||||||||||||||||||
| New Mexico | $ | 2,271 | $ | 1,558 | $ | 378 | $ | 1,936 | $ | 345,732 | |||||||||
| Ohio | 10,212 | 8,363 | 3,501 | 11,864 | 988,896 | ||||||||||||||
| Texas | — | — | — | — | 409,295 | ||||||||||||||
| Wisconsin | 1,705 | 542 | — | 542 | 69,596 | ||||||||||||||
| $ | 14,188 | $ | 10,463 | $ | 3,879 | $ | 14,342 | $ | 1,813,519 | ||||||||||
79
| Year Ended December 31, 2010 | |||||||||||||||||||
Maximum Available Quality Incentive Premium – Current Year | Amount of Current Year Quality Incentive Premium Revenue Recognized | Amount of Quality Incentive Premium Revenue Recognized from Prior Year | Total Quality Incentive Premium Revenue Recognized | Total Revenue Recognized | |||||||||||||||
| (In thousands) | |||||||||||||||||||
| New Mexico | $ | 2,581 | $ | 1,311 | $ | 579 | $ | 1,890 | $ | 366,784 | |||||||||
| Ohio | 9,881 | 3,114 | (1,248 | ) | 1,866 | 860,324 | |||||||||||||
| Texas | 1,771 | 1,771 | — | 1,771 | 188,716 | ||||||||||||||
| $ | 14,233 | $ | 6,196 | $ | (669 | ) | $ | 5,527 | $ | 1,415,824 | |||||||||
Medical Care Costs
Expenses related to medical care services are captured in the following four categories:
Fee-for-service: Physician providers paid on a fee-for-service basis are paid according to a fee schedule set by the state or by our contracts with these providers. Most hospitals are paid on a fee-for-service basis in a variety of ways, including per diem amounts, diagnostic-related groups, or DRGs, percent of billed charges, and case rates. As discussed below, we also pay a small portion of hospitals on a capitated basis. We also have stop-loss agreements with the hospitals with which we contract. Under all fee-for-service arrangements, we retain the financial responsibility for medical care provided. Expenses related to fee-for-service contracts are recorded in the period in which the related services are dispensed. The costs of drugs administered in a physician or hospital setting that are not billed through our pharmacy benefit manager are included in fee-for-service costs.
80
Capitation: Many of our primary care physicians and a small portion of our specialists and hospitals are paid on a capitated basis. Under capitation contracts, we typically pay a fixed per-member per-month, or PMPM, payment to the provider without regard to the frequency, extent, or nature of the medical services actually furnished. Under capitated contracts, we remain liable for the provision of certain health care services. Certain of our capitated contracts also contain incentive programs based on service delivery, quality of care, utilization management, and other criteria. Capitation payments are fixed in advance of the periods covered and are not subject to significant accounting estimates. These payments are expensed in the period the providers are obligated to provide services. The financial risk for pharmacy services for a small portion of our membership is delegated to capitated providers.
Pharmacy: Pharmacy costs include all drug, injectibles, and immunization costs paid through our pharmacy benefit manager. As noted above, drugs and injectibles not paid through our pharmacy benefit manager are included in fee-for-service costs, except in those limited instances where we capitate drug and injectible costs.
The following table provides the details of our consolidated medical care costs for the periods indicated (dollars in thousands, except PMPM amounts):
| Year Ended December 31, | ||||||||||||||||||||||||||||||||||||
| 2010 | 2009 | 2008 | ||||||||||||||||||||||||||||||||||
| % of | % of | % of | ||||||||||||||||||||||||||||||||||
| Amount | PMPM | Total | Amount | PMPM | Total | Amount | PMPM | Total | ||||||||||||||||||||||||||||
Fee-for- service | $ | 2,360,858 | $ | 128.73 | 70.0 | % | $ | 2,077,489 | $ | 126.14 | 65.4 | % | $ | 1,709,806 | $ | 116.69 | 65.2 | % | ||||||||||||||||||
| Capitation | 555,487 | 30.29 | 16.5 | 558,538 | 33.91 | 17.6 | 450,440 | 30.74 | 17.2 | |||||||||||||||||||||||||||
| Pharmacy | 325,935 | 17.77 | 9.7 | 414,785 | 25.18 | 13.1 | 356,184 | 24.31 | 13.6 | |||||||||||||||||||||||||||
| Other | 128,577 | 7.01 | 3.8 | 125,424 | 7.62 | 3.9 | 104,882 | 7.16 | 4.0 | |||||||||||||||||||||||||||
| Total | $ | 3,370,857 | $ | 183.80 | 100.0 | % | $ | 3,176,236 | $ | 192.85 | 100.0 | % | $ | 2,621,312 | $ | 178.90 | 100.0 | % | ||||||||||||||||||
| Year Ended December 31, | ||||||||||||||||||||||||||||||||
| 2012 | 2011 | 2010 | ||||||||||||||||||||||||||||||
| Amount | PMPM | % of Total | Amount | PMPM | % of Total | Amount | PMPM | % of Total | ||||||||||||||||||||||||
| Fee-for-service | $ | 3,521,960 | $ | 162.60 | 69.1 | % | $ | 2,764,309 | $ | 139.02 | 71.6 | % | $ | 2,360,858 | $ | 128.73 | 70.0 | % | ||||||||||||||
| Capitation | 557,087 | 25.72 | 10.9 | 518,835 | 26.09 | 13.4 | 555,487 | 30.29 | 16.5 | |||||||||||||||||||||||
| Pharmacy | 835,830 | 38.59 | 16.4 | 418,007 | 21.02 | 10.8 | 325,935 | 17.77 | 9.7 | |||||||||||||||||||||||
| Other | 181,883 | 8.39 | 3.6 | 158,843 | 8.00 | 4.2 | 128,577 | 7.01 | 3.8 | |||||||||||||||||||||||
| Total | $ | 5,096,760 | $ | 235.30 | 100.0 | % | $ | 3,859,994 | $ | 194.13 | 100.0 | % | $ | 3,370,857 | $ | 183.80 | 100.0 | % | ||||||||||||||
Our medical care costs include amounts that have been paid by us through the reporting date, as well as estimated liabilities for medical care costs incurred but not paid by us as of the reporting date. Such medical care cost liabilities include, among other items, unpaidfee-for-service claims, capitation payments owed providers, unpaid pharmacy invoices, and various medically related
80
administrative costs that have been incurred but not paid. We use judgment to determine the appropriate assumptions for determining the required estimates.
The most important element in estimating our medical care costs is our estimate forfee-for-service claims which have been incurred but not paid by us. Thesefee-for-service costs that have been incurred but have not been
81
paid at the reporting date are collectively referred to as medical costs that are “Incurred But Not Paid,” or IBNP. Our IBNP claims reserve, as reported in our balance sheet, represents our best estimate of the total amount of claims we will ultimately pay with respect to claims that we have incurred as of the balance sheet date. We estimate our IBNP monthly using actuarial methods based on a number of factors.
The factors we consider when estimating our IBNP include, without limitation, claims receipt and payment experience (and variations in that experience), changes in membership, provider billing practices, health care service utilization trends, cost trends, product mix, seasonality, prior authorization of medical services, benefit changes, known outbreaks of disease or increased incidence of illness such as influenza, provider contract changes, changes to Medicaid fee schedules, and the incidence of high dollar or catastrophic claims. Our assessment of these factors is then translated into an estimate of our IBNP liability at the relevant measuring point through the calculation of a base estimate of IBNP, a further reserve for adverse claims development, and an estimate of the administrative costs of settling all claims incurred through the reporting date. The base estimate of IBNP is derived through application of claims payment completion factors and trended PMPM cost estimates. See Note 11, “Medical Claims and Benefits Payable.”
We report reinsurance premiums as medical care costs, while related reinsurance recoveries are reported as deductions from medical care costs. We limit our risk of catastrophic losses by maintaining high deductible reinsurance coverage. We do not consider this coverage to be material because the cost is not significant and the likelihood that coverage will apply is low.
Taxes Based on Premiums
Our California (through June 30, 2012), Florida, Michigan, New Mexico, Ohio, Texas and Washington health plans are assessed a tax based on premium revenue collected. We report these taxes on a gross basis, included in premium tax expense.
Premium Deficiency Reserves on Loss Contracts
We assess the profitability of our contracts for providing medical care services to our members and identify those contracts where current operating results or forecasts indicate probable future losses. Anticipated future premiums are compared to anticipated medical care costs, including the cost of processing claims. If the anticipated future costs exceed the premiums, a loss contract accrual is recognized. No such accrual was recorded as of December 31, 2010,2012, or 2009.2011.
Service Revenue and Cost of Service Revenue — Molina Medicaid Solutions Segment
The payments received by our Molina Medicaid Solutions segment under its state contracts are based on the performance of multiple services. The first of these is the design, development and implementation, or DDI, of a Medicaid Management Information System, or MMIS. An additional service, following completion of DDI, is the operation of the MMIS under a business process outsourcing, or BPO arrangement. While providing BPO services (which include claims payment and eligibility processing) we also provide the state with other services including both hosting and support and maintenance. Our Molina Medicaid Solutions contracts may extend over a number of years, particularly in circumstances where we are delivering extensive and complex DDI services, such as the initial design, development and implementation of a complete MMIS. For example, the terms of our most recently implemented Molina Medicaid Solutions contracts (in Idaho and Maine) were each seven years in total, consisting of two years allocated for the delivery of DDI services, followed by five years for the performance of BPO services. We receive progress payments from the state during the performance of DDI services based upon the attainment of predetermined milestones. We receive a flat monthly payment for BPO services under our Idaho and Maine contracts. The terms of our other Molina Medicaid Solutions contracts - which primarily involve the delivery of BPO services with only minimal DDI activity (consisting of system enhancements) - are shorter in duration than our Idaho and Maine contracts.
We have evaluated our Molina Medicaid Solutions contracts to determine if such arrangements include a software element. Based on this evaluation, we have concluded that these arrangements do not include a software element. As such, we have concluded that our Molina Medicaid Solutions contracts are multiple-element service arrangements under the scope of FASB Accounting Standards Codification Subtopic 605-25, Revenue Recognition –– Multiple–Element Arrangements, and SEC Staff Accounting Bulletin Topic 13, Revenue Recognition.
Effective January 1, 2011, we adopted a new accounting standard that amends the guidance on the accounting for multiple-element arrangements. Pursuant to the new standard, each required deliverable is evaluated to determine whether it qualifies as a separate unit of accounting which is generally based on whether the deliverable has standalone value to the customer. In addition to standalone value, previous guidance also required objective and reliable evidence of fair value of a deliverable in order to treat the deliverable as a separate unit of accounting. The arrangement’s consideration that is fixed or determinable is then allocated to
81
each separate unit of accounting based on the relative selling price of each deliverable. In general, the consideration allocated to each unit of accounting is recognized as the related goods or services are delivered, limited to the consideration that is not contingent. We have adopted this guidance on a prospective basis for all new or materially modified revenue arrangements with multiple deliverables entered into on or after January 1, 2011. Our adoption of this guidance has not impacted the timing or pattern of our revenue recognition in 2011 or 2012. Also, there would have been no change in revenue recognized relating to multiple-element arrangements if we had adopted this guidance retrospectively for contracts entered into prior to January 1, 2011.
We have concluded that the various service elements in our Molina Medicaid Solutions contracts represent a single unit of accounting due to the fact that DDI, which is the only service performed in advance of the other services (all other services are performed over an identical period), does not have standalone value because our DDI services are not sold separately by any vendor and the customer could not resell our DDI services. Further, we have no objective and reliable evidence of fair value for any of the individual elements in these contracts, and at no point in the contract will we have objective and reliable evidence of fair value for the undelivered elements in the contracts. For contracts entered into prior to January 1, 2011, objective and reliable evidence of fair value would be required, in addition to DDI standalone value which we do not have, in order to treat DDI as a separate unit of accounting. We lack objective and reliable evidence of the fair value of the individual elements of our Molina Medicaid Solutions contracts for the following reasons:
Each contract calls for the provision of its own specific set of services. While all contracts support the system of record for state MMIS, the actual services we provide vary significantly between contracts; and
The nature of the MMIS installed varies significantly between our older contracts (proprietary mainframe systems) and our new contracts (commercial off-the-shelf technology solutions).
Because we have determined the services provided under our Molina Medicaid Solutions contracts represent a single unit of accounting, and because we are unable to determine a pattern of performance of services during the contract period, we recognize all revenue (both the DDI and BPO elements) associated with such contracts on a straight-line basis over the period during which BPO, hosting, and support and maintenance services are delivered. As noted above, the period of performance of BPO services under our Idaho and Maine contracts is five years. Therefore, absent any contingencies as discussed in the following paragraph, we would recognize all revenue associated with those contracts over a period of five years. In cases where there is no DDI element associated with our contracts, BPO revenue is recognized on a monthly basis as specified in the applicable contract or contract extension.
Provisions specific to each contract may, however, lead us to modify this general principle. In those circumstances, the right of the state to refuse acceptance of services, as well as the related obligation to compensate us, may require us to delay recognition of all or part of our revenue until that contingency (the right of the state to refuse acceptance) has been removed. In those circumstances we defer recognition of any contingent revenue (whether DDI, BPO services, hosting, and support and maintenance services) until the contingency has been removed. These types of contingency features are present in our Maine and Idaho contracts. In those states, we deferred recognition of revenue until the contingencies were removed.
Costs associated with our Molina Medicaid Solutions contracts include software related costs and other costs. With respect to software related costs, we apply the guidance for internal-use software and capitalize external direct costs of materials and services consumed in developing or obtaining the software, and payroll and payroll-related costs associated with employees who are directly associated with and who devote time to the computer software project. With respect to all other direct costs, such costs are expensed as incurred, unless corresponding revenue is being deferred. If revenue is being deferred, direct costs relating to delivered service elements are deferred as well and are recognized on a straight-line basis over the period of revenue recognition, in a manner consistent with our recognition of revenue that has been deferred. Such direct costs can include:
Transaction processing costs.
Employee costs incurred in performing transaction services.
Vendor costs incurred in performing transaction services.
Costs incurred in performing required monitoring of and reporting on contract performance.
Costs incurred in maintaining and processing member and provider eligibility.
Costs incurred in communicating with members and providers.
The recoverability of deferred contract costs associated with a particular contract is analyzed on a periodic basis using the undiscounted estimated cash flows of the whole contract over its remaining contract term. If such undiscounted cash flows are insufficient to recover the long-lived assets and deferred contract costs, the deferred contract costs are written down by the amount of the cash flow deficiency. If a cash flow deficiency remains after reducing the balance of the deferred contract costs to zero, any
82
remaining long-lived assets are evaluated for impairment. Any such impairment recognized would equal the amount by which the carrying value of the long-lived assets exceeds the fair value of those assets.
Income Taxes
The provision for income taxes is determined using an estimated annual effective tax rate, which is generally greater than the U.S. federal statutory rate primarily because of state taxes.taxes and nondeductible compensation and other general and administrative expenses. The effective tax rate may be subject to fluctuations during the year as new information is obtained. Such information may affect the assumptions used to estimate the annual effective tax rate, including factors such as the mix of pretax earnings in the various tax jurisdictions in which we operate, valuation allowances against deferred tax assets, the recognition or derecognition of tax benefits related to uncertain tax positions, and changes in or the interpretation of tax laws in jurisdictions where we conduct business. We recognize deferred tax assets and liabilities for temporary differences between the financial reporting basis and the tax basis of our assets and liabilities, along with net operating loss and tax credit carryovers. For further discussion and disclosure, see Note 13, “Income Taxes.”
82
Concentrations of Credit Risk
Financial instruments that potentially subject us to concentrations of credit risk consist primarily of cash and cash equivalents, investments, receivables, and restricted investments. We invest a substantial portion of our cash in the PFM Funds Prime Series — Institutional Class, and the PFM Funds Government Series. These funds represent a portfolio of highly liquid money market securities that are managed by PFM Asset Management LLC (PFM), a Virginia business trust registered as an open-end management investment fund. As of December 31, 2010,2012, and 2009,2011, our investments with PFM totaled $327$428 million and $296$209 million, respectively. Our investments and a portion of our cash equivalents are managed by professional portfolio managers operating under documented investment guidelines. No investment that is in a loss position can be sold by our managers without our prior approval. Concentration of credit risk with respect to accounts receivable is limited due to payors consisting principally of the governments of each state in which our health plan subsidiaries operate.
Risks and Uncertainties
Our profitability depends in large part on our ability to accurately predict and effectively manage medical care costs. We continually review our medical costs in light of our underlying claims experience and revised actuarial data. However, several factors could adversely affect medical care costs. These factors, which include changes in health care practices, inflation, new technologies, major epidemics, natural disasters, and malpractice litigation, are beyond our control and may have an adverse effect on our ability to accurately predict and effectively control medical care costs. Costs in excess of those anticipated could have a material adverse effect on our financial condition, results of operations, or cash flows.
At December 31, 2010,2012, we operated health plans in 10nine states, primarily as a direct contractor with the states, and in Los Angeles County, California, as a subcontractor to another health plan holding a direct contract with the state. We are therefore dependent upon a small number of contracts to support our revenue. The loss of any one of those contracts could have a material adverse effect on our financial position, results of operations, or cash flows. Our ability to arrange for the provision of medical services to our members is dependent upon our ability to develop and maintain adequate provider networks. Our inability to develop or maintain such networks might, in certain circumstances, have a material adverse effect on our financial position, results of operations, or cash flows.
Recent Accounting Pronouncements
83
Balance Sheet Offsetting. In January 2013, the FASB issued guidance for new disclosure requirements related to the nature of an entity's rights of setoff and related arrangements associated with certain financial instruments and derivative instruments. The new guidance is effective for annual reporting periods, and interim periods within those years, beginning on or after January 1, 2013. While we do not expect the adoption of this guidance in 2013 to impact our financial position, results of operations or cash flows, it may change our disclosure policies relative to certain arrangements with rights of setoff.
Goodwill. In September 2011, the FASB issued guidance related to evaluating goodwill for impairment. The new guidance provides entities with the option to perform a qualitative assessment of whether it is more likely than not that the fair value of a reporting unit is less than its carrying amount before applying the quantitative two-step goodwill impairment test. If an entity
83
concludes that it is not more likely than not that the fair value of a reporting unit is less than its carrying amount, it would not be required to perform the quantitative two-step goodwill impairment test. Entities also have the option to bypass the assessment of qualitative factors for any reporting unit in any period and proceed directly to performing the first step of the quantitative two-step goodwill impairment test, as was required prior to the issuance of this new guidance. An entity may begin or resume performing the qualitative assessment in any subsequent period. The new guidance became effective for annual reporting periods, and interim periods within those years, beginning after December 15, 2010, we adopted2011, with early adoption permitted. The adoption of this new guidance in 2012 did not impact our financial position, results of operations or cash flows.
Federal Premium-Based Assessment. In July 2011, the FASB issued guidance related to accounting for the fees to be paid by health insurers to the federal government under the Patient Protection and Affordable Care Act, as amended by the Health Care and Education Reconciliation Act (the “Affordable Care Act”). The Affordable Care Act imposes an annual fee on health insurers for each calendar year beginning on or after January 1, 2014 that is allocated to health insurers based on the ratio of the amount of an entity's net premium revenues written during the preceding calendar year to the amount of health insurance for any U.S. health risk that is written during the preceding calendar year. The new guidance specifies that the liability for the fee should be estimated and recorded in full once the entity provides qualifying health insurance in the applicable calendar year in which the fee is payable with a corresponding deferred cost that is amortized to expense using a straight-line method of allocation unless another method better allocates the fee over the calendar year that it is payable. The new guidance is effective for annual reporting periods beginning after December 31, 2013, when the fee initially becomes effective. As enacted, this federal premium-based assessment is non-deductible for income tax purposes, and is anticipated to be significant. It is yet undetermined how this premium-based assessment will be factored into the calculation of our premium rates, if at all. Accordingly, adoption of this guidance and the enactment of this assessment as currently written will have a material impact on our financial position, results of operations, or cash flows in full duringfuture periods.
Comprehensive Income. In June 2011, the FASB issued guidance, as amended in December 2011, related to the presentation of other comprehensive income. The new guidance provides entities with an option to either replace the statement of income with a statement of comprehensive income which would display both the components of net income and comprehensive income in a combined statement, or to present a separate statement of comprehensive income immediately following the statement of income. The new guidance does not affect the components of other comprehensive income or the calculation of earnings per share. To be applied retrospectively with early adoption permitted, the new guidance became effective for annual reporting periods, and interim period ended March 31, 2010.periods within those years, beginning after December 15, 2011. We have elected to present a separate statement of comprehensive income immediately following the statement of income. The adoption of this new guidance in 2012 did not impact our financial position, results of operations or cash flows.
Fair Value.In May 2011, the FASB issued guidance related to fair value measurement and disclosure. The new guidance is a result of joint efforts by the FASB and the International Accounting Standards Board to develop a single converged fair value framework. The new guidance expands existing disclosure requirements for fair value measurements and makes other amendments; mostly to eliminate wording differences between U.S. generally accepted accounting principles, or GAAP, and international financial reporting standards. To be applied prospectively, the new guidance became effective for annual reporting periods, and interim periods within those years, beginning after December 15, 2011. Although the adoption of this new guidance in 2012 did not impact our financial position, results of operations or cash flows, it did change our disclosure policies relative to fair value measurements.
Other recent accounting pronouncements issued by the FASB (including its Emerging Issues Task Force), the American Institute of Certified Public Accountants, or AICPA, and the Securities and Exchange Commission, or SEC, did not have, or are not believed by management to have, a material impact on our present or future consolidated financial statements.
3. | Earnings per Share |
The denominators for the computation of basic and diluted earnings per share were calculated as follows:
| Year Ended December 31, | ||||||||||||
| 2010 | 2009 | 2008 | ||||||||||
| (In thousands) | ||||||||||||
| Shares outstanding at the beginning of the year | 25,607 | 26,725 | 28,444 | |||||||||
| Weighted-average number of shares: | ||||||||||||
| Issued under equity offering | 1,671 | — | — | |||||||||
| Purchased | — | (988 | ) | (871 | ) | |||||||
| Issued under employee stock plans | 171 | 106 | 103 | |||||||||
| Denominator for basic earnings per share | 27,449 | 25,843 | 27,676 | |||||||||
| Dilutive effect of employee stock options and stock grants(1) | 305 | 141 | 96 | |||||||||
| Denominator for diluted earnings per share(2) | 27,754 | 25,984 | 27,772 | |||||||||
84
| December 31, | ||||||||
| 2012 | 2011 | 2010 | ||||||
| (In thousands) | ||||||||
| Shares outstanding at the beginning of the period | 45,815 | 45,463 | 38,410 | |||||
| Weighted-average number of shares issued under equity offering | — | — | 2,506 | |||||
| Weighted-average number of shares purchased | (2 | ) | (160 | ) | — | |||
| Weighted-average number of shares issued under employee stock plans | 567 | 453 | 258 | |||||
| Denominator for basic earnings per share | 46,380 | 45,756 | 41,174 | |||||
| Dilutive effect of employee stock options and stock grants(1) | 619 | 669 | 457 | |||||
| Denominator for diluted earnings per share(2) | 46,999 | 46,425 | 41,631 | |||||
| (1) | Options to purchase common shares are included in the calculation of diluted earnings per share when their exercise prices are below the average fair value of the common shares for each of the periods presented. For the years ended December 31, |
84
| periods presented. For the year ended December 31, 2012, there were approximately 304,000 anti-dilutive restricted shares. For the years ended December 31, |
| (2) | Potentially dilutive shares issuable pursuant to our |
4. | Business Combinations |
On September 1, 2010,December 7, 2011, our wholly owned subsidiary Molina Center LLC acquired 100%a 460,000 square foot office building located in Long Beach, California. The building, or Molina Center, consists of two conjoined fourteen-story office towers on approximately five acres of land. For the last several years we have leased approximately 155,000 square feet of the voting equity interests in Avatar Partners, LLC, which is the sole shareholder of Abri Health Plan, Inc. (“Abri”), a Medicaid managed care organization based in Milwaukee, Wisconsin. This acquisition is consistent withMolina Center for use as our stated strategy to enter markets with competitive provider communities, supportive regulatory environments, significant sizecorporate headquarters and where practicable, mandated Medicaid managed care enrollment.
85
| (In thousands) | ||||
Assets | ||||
| Accounts receivable | $ | 17,128 | ||
| Other current assets | 3,901 | |||
| Equipment and other long-term assets | 783 | |||
| Identifiable intangible assets | 48,150 | |||
| Goodwill | 72,367 | |||
| 142,329 | ||||
Less: liabilities | ||||
| Accounts payable and accrued liabilities | 11,079 | |||
Net assets acquired | $ | 131,250 | ||
| Estimated Fair | Weighted Average | |||||||
| Value | Useful Life | |||||||
| (In thousands) | (Years) | |||||||
| Customer relationships | $ | 24,550 | 5.3 | |||||
| Contract backlog | 23,600 | 2.4 | ||||||
| $ | 48,150 | |||||||
86
| Year Ended December 31, | ||||||||||||
| 2010 | 2009 | 2008 | ||||||||||
| Revenue | $ | 4,124,058 | $ | 3,767,888 | $ | 3,202,581 | ||||||
| Net income | $ | 57,800 | $ | 26,192 | $ | 54,228 | ||||||
| Diluted earnings per share | $ | 2.08 | $ | 1.01 | $ | 1.95 | ||||||
87
| 5. | Fair Value Measurements |
Our consolidated balance sheets include the following financial instruments: cash and cash equivalents, investments, receivables, trade accounts payable, medical claims and benefits payable, long-term debt, and other liabilities. We consider the carrying amounts of cash and cash equivalents, receivables, other current assets and current liabilities to approximate their fair value because of the relatively short period of time between the origination of these instruments and their expected realization or payment. For a comprehensive discussion ofour financial instruments measured at fair value measurements with regard to our current and non-current investments, see below.
Level 1 defined as observable— Observable inputs such as quoted prices in active markets; markets: Our Level 1 financial instruments recorded at fair value consist of investments including government-sponsored enterprise securities (GSEs) and U.S. treasury notes that are classified as current investments in the accompanying consolidated balance sheets. These financial instruments are actively traded and therefore the fair value for these securities is based on quoted market prices on one or more securities exchanges.
Level 2 defined as inputs— Inputs other than quoted prices in active markets that are either directly or indirectly observable;observable: Our Level 2 financial instruments recorded at fair value consist of investments including corporate debt securities, municipal securities, and certificates of deposit that are classified as current investments in the accompanying consolidated balance sheets, and an interest rate swap derivative recorded as a noncurrent liability. Our investments classified as Level 2 are traded frequently though not necessarily daily. Fair value for these investments is determined using a market approach based on quoted prices for similar securities in active markets or quoted prices for identical securities in inactive markets. Fair value for the interest rate swap derivative is based on forward LIBOR rates that are and will be observable at commonly
85
quoted intervals for the full term of the interest rate swap agreement. See Note 12, “Long-Term Debt,” for further information regarding the interest rate swap agreement.
Level 3 defined as unobservable— Unobservable inputs in which little or no market data exists, therefore requiring an entity to develop its own assumptions.
88
| Fair Value Measurements at Reporting Date Using | ||||||||||||||||
| Total | Level 1 | Level 2 | Level 3 | |||||||||||||
| (In thousands) | ||||||||||||||||
| Corporate debt securities | $ | 177,929 | $ | 177,929 | $ | — | $ | — | ||||||||
| Government-sponsored enterprise securities | 59,713 | 59,713 | — | — | ||||||||||||
| Municipal securities | 30,563 | 30,563 | — | — | ||||||||||||
| U.S. treasury notes | 23,918 | 23,918 | — | — | ||||||||||||
| Certificates of deposit | 3,252 | 3,252 | — | — | ||||||||||||
Auction rate securities(available-for-sale) | 20,449 | — | — | 20,449 | ||||||||||||
| $ | 315,824 | $ | 295,375 | $ | — | $ | 20,449 | |||||||||
| Total | Level 1 | Level 2 | Level 3 | ||||||||||||
| (In thousands) | |||||||||||||||
| Corporate debt securities | $ | 191,008 | $ | — | $ | 191,008 | $ | — | |||||||
| GSEs | 29,525 | 29,525 | — | — | |||||||||||
| Municipal securities | 75,848 | — | 75,848 | — | |||||||||||
| U.S. treasury notes | 35,740 | 35,740 | — | — | |||||||||||
| Auction rate securities | 13,419 | — | — | 13,419 | |||||||||||
| Certificates of deposit | 10,724 | — | 10,724 | — | |||||||||||
| Total assets at fair value | $ | 356,264 | $ | 65,265 | $ | 277,580 | $ | 13,419 | |||||||
| Interest rate swap liability | $ | 1,307 | $ | — | $ | 1,307 | $ | — | |||||||
Our financial instruments measured at fair value on a recurring basis at December 31, 2011, were as follows:
| Total | Level 1 | Level 2 | Level 3 | ||||||||||||
| (In thousands) | |||||||||||||||
| Corporate debt securities | $ | 231,634 | $ | — | $ | 231,634 | $ | — | |||||||
| GSEs | 33,949 | 33,949 | — | — | |||||||||||
| Municipal securities | 47,313 | — | 47,313 | — | |||||||||||
| U.S. treasury notes | 21,748 | 21,748 | — | — | |||||||||||
| Auction rate securities | 16,134 | — | — | 16,134 | |||||||||||
| Certificates of deposit | 2,272 | — | 2,272 | — | |||||||||||
| Total assets at fair value | $ | 353,050 | $ | 55,697 | $ | 281,219 | $ | 16,134 | |||||||
| Interest rate swap liability | $ | — | $ | — | $ | — | $ | — | |||||||
The following table presents activity for the year ended December 31, 2012, relating to our assets measured at fair value on a recurring basis using significant unobservable inputs (Level 3):
| (Level 3) | ||||
| (In thousands) | ||||
| Balance at December 31, 2009 | $ | 63,494 | ||
| Total gains (realized or unrealized): | ||||
| Included in earnings: | ||||
| Gain on auction rate securities designated as trading securities | 4,170 | |||
| Loss on change in fair value of Rights | (3,807 | ) | ||
| Included in other comprehensive income | (208 | ) | ||
| Settlements | (43,200 | ) | ||
| Balance at December 31, 2010 | $ | 20,449 | ||
| The amount of total losses for the period included in other comprehensive income attributable to the change in unrealized gains relating to assets still held at December 31, 2010 | $ | (208 | ) | |
86
89
| (Level 3) | |||
| (In thousands) | |||
| Balance at December 31, 2011 | $ | 16,134 | |
| Total gains (unrealized only): | |||
| Included in other comprehensive income | 1,635 | ||
| Settlements | (4,350 | ) | |
| Balance at December 31, 2012 | $ | 13,419 | |
| The amount of total unrealized gains for the period included in other comprehensive income attributable to the change in accumulated other comprehensive losses relating to assets still held at December 31, 2012 | $ | 1,059 | |
| (Level 3) | ||||
| (In thousands) | ||||
| Balance at December 31, 2009 | $ | — | ||
| Addition through acquisition — 2010 | 2,800 | |||
| Balance at December 31, 2010 | $ | 2,800 | ||
| December 31, 2012 | |||||||||||||||
| Carrying | Total | ||||||||||||||
| Value | Fair Value | Level 1 | Level 2 | Level 3 | |||||||||||
| (In thousands) | |||||||||||||||
| Convertible senior notes | $ | 175,468 | $ | 208,460 | $ | — | $ | 208,460 | $ | — | |||||
| Credit facility | 40,000 | 40,000 | — | — | 40,000 | ||||||||||
| Term loan | 47,471 | 47,471 | — | — | 47,471 | ||||||||||
| $ | 262,939 | $ | 295,931 | $ | — | $ | 208,460 | $ | 87,471 | ||||||
| December 31, 2011 | |||||||||||||||
| Carrying | Total | ||||||||||||||
| Value | Fair Value | Level 1 | Level 2 | Level 3 | |||||||||||
| (In thousands) | |||||||||||||||
| Convertible senior notes | $ | 169,526 | $ | 192,049 | $ | — | $ | 192,049 | $ | — | |||||
| Credit facility | — | — | — | — | — | ||||||||||
| Term loan | 48,600 | 48,600 | — | — | 48,600 | ||||||||||
| $ | 218,126 | $ | 240,649 | $ | — | $ | 192,049 | $ | 48,600 | ||||||
6. | Investments |
The following tables summarize our investments as of the dates indicated:
| December 31, 2010 | ||||||||||||||||
| Cost or | Gross | Estimated | ||||||||||||||
| Amortized | Unrealized | Fair | ||||||||||||||
| Cost | Gains | Losses | Value | |||||||||||||
| (In thousands) | ||||||||||||||||
| Corporate debt securities | $ | 179,124 | $ | 193 | $ | 1,388 | $ | 177,929 | ||||||||
| Government-sponsored enterprise securities (GSEs) | 59,790 | 293 | 370 | 59,713 | ||||||||||||
| Municipal securities (including non-current auction rate securities) | 55,247 | 78 | 4,313 | 51,012 | ||||||||||||
| U.S. treasury notes | 23,864 | 114 | 60 | 23,918 | ||||||||||||
| Certificates of deposit | 3,252 | — | — | 3,252 | ||||||||||||
| $ | 321,277 | $ | 678 | $ | 6,131 | $ | 315,824 | |||||||||
87
| December 31, 2009 | |||||||||||||||||||||||||||||||
| Cost or | Gross | Estimated | |||||||||||||||||||||||||||||
| Amortized | Unrealized | Fair | December 31, 2012 | ||||||||||||||||||||||||||||
| Cost | Gains | Losses | Value | Amortized | Gross Unrealized | Estimated | |||||||||||||||||||||||||
| (In thousands) | Cost | Gains | Losses | Fair Value | |||||||||||||||||||||||||||
| (In thousands) | |||||||||||||||||||||||||||||||
| Corporate debt securities | $ | 32,543 | $ | 206 | $ | 185 | $ | 32,564 | $ | 190,545 | $ | 528 | $ | 65 | $ | 191,008 | |||||||||||||||
| GSEs | 89,451 | 504 | 281 | 89,674 | 29,481 | 45 | 1 | 29,525 | |||||||||||||||||||||||
| Municipal securities (including non-current auction rate securities) | 82,009 | 3,120 | 4,154 | 80,975 | |||||||||||||||||||||||||||
| Municipal securities | 75,909 | 185 | 246 | 75,848 | |||||||||||||||||||||||||||
| U.S. treasury notes | 28,052 | 92 | 84 | 28,060 | 35,700 | 42 | 2 | 35,740 | |||||||||||||||||||||||
| Auction rate securities | 14,650 | — | 1,231 | 13,419 | |||||||||||||||||||||||||||
| Certificates of deposit | 3,258 | — | — | 3,258 | 10,715 | 9 | — | 10,724 | |||||||||||||||||||||||
| $ | 357,000 | $ | 809 | $ | 1,545 | $ | 356,264 | ||||||||||||||||||||||||
| $ | 235,313 | $ | 3,922 | $ | 4,704 | $ | 234,531 | ||||||||||||||||||||||||
| December 31, 2011 | |||||||||||||||
| Amortized | Gross Unrealized | Estimated | |||||||||||||
| Cost | Gains | Losses | Fair Value | ||||||||||||
| (In thousands) | |||||||||||||||
| Corporate debt securities | $ | 231,407 | $ | 442 | $ | 215 | $ | 231,634 | |||||||
| GSEs | 33,912 | 46 | 9 | 33,949 | |||||||||||
| Municipal securities | 47,099 | 232 | 18 | 47,313 | |||||||||||
| U.S. treasury notes | 21,627 | 121 | — | 21,748 | |||||||||||
| Auction rate securities | 19,000 | — | 2,866 | 16,134 | |||||||||||
| Certificates of deposit | 2,272 | — | — | 2,272 | |||||||||||
| $ | 355,317 | $ | 841 | $ | 3,108 | $ | 353,050 | ||||||||
The contractual maturities of our investments as of December 31, 20102012 are summarized below.
90
below:
| Estimated | |||||||||||||||
| Amortized | Fair | ||||||||||||||
| Cost | Value | ||||||||||||||
| (In thousands) | Amortized Cost | Estimated Fair Value | |||||||||||||
| (In thousands) | |||||||||||||||
| Due in one year or less | $ | 168,948 | $ | 167,856 | $ | 195,986 | $ | 196,201 | |||||||
| Due one year through five years | 127,549 | 127,144 | 146,364 | 146,644 | |||||||||||
| Due after five years through ten years | 930 | 990 | |||||||||||||
| Due after ten years | 23,850 | 19,834 | 14,650 | 13,419 | |||||||||||
| $ | 357,000 | $ | 356,264 | ||||||||||||
| $ | 321,277 | $ | 315,824 | ||||||||||||
Gross realized gains and gross realized losses from sales ofavailable-for-sale securities are calculated under the specific identification method and are included in investment income. Total proceeds from sales and maturities ofavailable-for-sale securities were $124.5$298.0 million $60.3, $302.7 million, and $55.3$182.3 million for the yearsyear ended December 31, 2010, 20092012, 2011, and 2008,2010, respectively. Net realized investment gains for the yearsyear ended December 31, 2010, 20092012, 2011, and 20082010 were $110,000, $267,000,$293,000, $367,000, and $342,000$110,000, respectively.
We monitor our investments forother-than-temporary impairment. For investments other than our municipalauction rate securities as described below, we have determined that unrealized gains and losses at December 31, 20102012, and 20092011, are temporary in nature, because the change in market value for these securities has resulted from fluctuating interest rates, rather than a deterioration of the credit worthiness of the issuers. So long as we do not intend to sellhold these securities prior to maturity, we are unlikely to experience gains or losses. In the unlikely event that we dispose of these securities before maturity, we expect that realized gains or losses, if any, will be immaterial.
Due to events in municipal securities consists ofthe credit markets, the auction rate securities. As describedsecurities held by us experienced failed auctions beginning in Note 5, “Fair Value Measurements,” the unrealized losses on thesefirst quarter of 2008, and such auctions have not resumed. Therefore, quoted prices in active markets have not been available since early 2008. Our investments were caused primarilyin auction rate securities are collateralized by student loan portfolios guaranteed by the illiquidityU.S.
88
government, and the range of maturities for such securities is from 18 years to 34 years. Considering the relative insignificance of these securities when compared with our liquid assets and other sources of liquidity, we have no current intention of selling these securities nor do we expect to be required to sell these securities before a recovery in the auction markets. Becausetheir cost basis. For this reason, and because the decline in marketthe fair value isof the auction securities was not due to the credit quality of the issuers, and because we do not intend to sell, nor is it more likely than not that we will be required to sell these investments before recovery of their cost, we do not consider the auction rate securities that are designated asavailable-for-saleto beother-than-temporarily impaired at December 31, 2010.2012. At the time of the first failed auctions during first quarter 2008, we held a total of $82.1 million in auction rate securities at par value; since that time, we have settled $67.4 million of these instruments at par value. For the years ended December 31, 2012, and 2011, we recorded pretax unrealized gains of $1.6 million and $1.2 million, respectively, to accumulated other comprehensive income for the changes in their fair value. Any future fluctuations in fair value related to these instruments that we deem to be temporary, including any recoveries of previous write-downs, would be recorded to accumulated other comprehensive income. If we determine that any future valuation adjustment was other-than-temporary, we would record a charge to earnings as appropriate.
The following table segregatestables segregate thoseavailable-for-sale investments that have been in a continuous loss position for less than 12 months, and those that have been in a loss position for 12 months or more as of December 31, 2010.
| In a Continuous Loss | In a Continuous Loss | |||||||||||||||||||||||
| Position | Position | |||||||||||||||||||||||
| for Less than 12 Months | for 12 Months or More | |||||||||||||||||||||||
| as of December 31, 2010 | as of December 31, 2010 | Total as of December 31, 2010 | ||||||||||||||||||||||
| Estimated | Estimated | Estimated | ||||||||||||||||||||||
| Fair | Unrealized | Fair | Unrealized | Fair | Unrealized | |||||||||||||||||||
| Value | Losses | Value | Losses | Value | Losses | |||||||||||||||||||
| (In thousands) | ||||||||||||||||||||||||
| Corporate debt securities | $ | 103,225 | $ | 1,060 | $ | 10,490 | $ | 328 | $ | 113,715 | $ | 1,388 | ||||||||||||
| GSEs | 13,014 | 71 | 7,539 | 299 | 20,553 | 370 | ||||||||||||||||||
| Municipal securities | 18,884 | 117 | 25,271 | 4,196 | 44,155 | 4,313 | ||||||||||||||||||
| U.S. treasury notes | 5,480 | 40 | 6,806 | 20 | 12,286 | 60 | ||||||||||||||||||
| $ | 140,603 | $ | 1,288 | $ | 50,106 | $ | 4,843 | $ | 190,709 | $ | 6,131 | |||||||||||||
2012.
In a Continuous Loss Position for Less than 12 Months | In a Continuous Loss Position for 12 Months or More | ||||||||||||||||||||
Estimated Fair Value | Unrealized Losses | Total Number of Securities | Estimated Fair Value | Unrealized Losses | Total Number of Securities | ||||||||||||||||
| (In thousands, except number of securities) | |||||||||||||||||||||
| Corporate debt securities | $ | 44,457 | $ | 65 | 23 | $ | — | $ | — | — | |||||||||||
| GSEs | 5,004 | 1 | 1 | — | — | — | |||||||||||||||
| Municipal securities | 35,223 | 246 | 43 | — | — | — | |||||||||||||||
| U.S. treasury notes | 4,511 | 2 | 5 | — | — | — | |||||||||||||||
| Auction rate securities | — | — | — | 13,419 | 1,231 | 21 | |||||||||||||||
| Total temporarily impaired securities | $ | 89,195 | $ | 314 | 72 | $ | 13,419 | $ | 1,231 | 21 | |||||||||||
The following table segregates thoseavailable-for-sale investments that have been in a continuous loss position for less than 12 months, and those that have been in a loss position for 12 months or more as of December 31, 2009. At December 31, 2009, we previously reported only those2011available-for-sale. investments in an unrealized loss position for at least two consecutive months. To conform to the current year presentation, we have
91
In a Continuous Loss Position for Less than 12 Months | In a Continuous Loss Position for 12 Months or More | ||||||||||||||||||||
Estimated Fair Value | Unrealized Losses | Total Number of Securities | Estimated Fair Value | Unrealized Losses | Total Number of Securities | ||||||||||||||||
| (In thousands, except number of securities) | |||||||||||||||||||||
| Corporate debt securities | $ | 72,766 | $ | 215 | 47 | $ | — | $ | — | — | |||||||||||
| GSEs | 11,493 | 9 | 9 | — | — | — | |||||||||||||||
| Municipal securities | 12,033 | 18 | 8 | — | — | — | |||||||||||||||
| Auction rate securities | — | — | — | 16,134 | 2,866 | 27 | |||||||||||||||
| Total temporarily impaired securities | $ | 96,292 | $ | 242 | 64 | $ | 16,134 | $ | 2,866 | 27 | |||||||||||
| In a Continuous Loss | In a Continuous Loss | |||||||||||||||||||||||
| Position | Position | |||||||||||||||||||||||
| for Less than 12 Months | for 12 Months or More | |||||||||||||||||||||||
| as of December 31, 2009 | as of December 31, 2009 | Total as of December 31, 2009 | ||||||||||||||||||||||
| Estimated | Estimated | Estimated | ||||||||||||||||||||||
| Fair | Unrealized | Fair | Unrealized | Fair | Unrealized | |||||||||||||||||||
| Value | Losses | Value | Losses | Value | Losses | |||||||||||||||||||
| (In thousands) | ||||||||||||||||||||||||
| Corporate debt securities | $ | 13,513 | 149 | $ | 1,203 | $ | 36 | $ | 14,716 | $ | 185 | |||||||||||||
| GSEs | 30,460 | 187 | 7,297 | 94 | 37,757 | 281 | ||||||||||||||||||
| Municipal securities | 12,460 | 78 | 24,031 | 3,902 | 36,491 | 3,980 | ||||||||||||||||||
| U.S. treasury notes | 21,824 | 84 | — | — | 21,824 | 84 | ||||||||||||||||||
| $ | 78,257 | $ | 498 | $ | 32,531 | $ | 4,032 | $ | 110,788 | $ | 4,530 | |||||||||||||
| 7. | Receivables |
Health Plans segment receivables consist primarily of amounts due from the various states in which we operate. Such receivables are subject to potential retroactive adjustment. Because all of our receivable amounts are readily determinable and our creditors are in almost all instances state governments, our allowance for doubtful accounts is immaterial. Any amounts determined to be uncollectible are charged to expense when such determination is made. Accounts receivable were as follows:
| December 31, | ||||||||
| 2010 | 2009 | |||||||
| (In thousands) | ||||||||
| Health Plans Segment: | ||||||||
| California | $ | 46,482 | $ | 34,289 | ||||
| Michigan | 13,596 | 14,977 | ||||||
| Missouri | 22,841 | 19,670 | ||||||
| New Mexico | 18,310 | 11,919 | ||||||
| Ohio | 21,622 | 37,004 | ||||||
| Utah | 1,589 | 6,107 | ||||||
| Washington | 14,486 | 9,910 | ||||||
| Wisconsin | 5,437 | — | ||||||
| Other | 3,598 | 2,778 | ||||||
| Total Health Plans | 147,961 | 136,654 | ||||||
| Molina Medicaid Solutions Segment | 20,229 | — | ||||||
| $ | 168,190 | $ | 136,654 | |||||
89
92
| December 31, | |||||||
| 2012 | 2011 | ||||||
| (In thousands) | |||||||
| Health Plans segment: | |||||||
| California | $ | 28,553 | $ | 22,175 | |||
| Michigan | 12,873 | 8,864 | |||||
| Missouri | 1,053 | 27,092 | |||||
| New Mexico | 9,059 | 9,350 | |||||
| Ohio | 40,980 | 27,458 | |||||
| Texas | 7,459 | 1,608 | |||||
| Utah | 3,359 | 2,825 | |||||
| Washington | 17,587 | 15,006 | |||||
| Wisconsin | 4,098 | 4,909 | |||||
| Others | 2,077 | 2,489 | |||||
| Total Health Plans segment | 127,098 | 121,776 | |||||
| Molina Medicaid Solutions segment | 22,584 | 46,122 | |||||
| $ | 149,682 | $ | 167,898 | ||||
8. Property, Equipment, and Capitalized Software
A summary of property, equipment, and equipmentcapitalized software is as follows:
| December 31, | ||||||||
| 2010 | 2009 | |||||||
| (In thousands) | ||||||||
| Land | $ | 3,524 | $ | 3,524 | ||||
| Building and improvements | 49,735 | 41,476 | ||||||
| Furniture and equipment | 60,074 | 54,898 | ||||||
| Capitalized computer software costs | 90,003 | 66,526 | ||||||
| 203,336 | 166,424 | |||||||
| Less: accumulated depreciation and amortization on building and improvements, furniture and equipment | (54,341 | ) | (50,911 | ) | ||||
| Less: accumulated amortization for capitalized computer software costs | (48,458 | ) | (37,342 | ) | ||||
| (102,799 | ) | (88,253 | ) | |||||
| Property and equipment, net | $ | 100,537 | $ | 78,171 | ||||
| December 31, | |||||||
| 2012 | 2011 | ||||||
| (In thousands) | |||||||
| Land | $ | 15,764 | $ | 14,094 | |||
| Building and improvements | 124,163 | 109,789 | |||||
| Furniture and equipment | 97,865 | 79,112 | |||||
| Capitalized software | 154,708 | 116,389 | |||||
| 392,500 | 319,384 | ||||||
| Less: accumulated depreciation and amortization on building and improvements, furniture and equipment | (84,156 | ) | (65,518 | ) | |||
| Less: accumulated amortization for capitalized software | (86,901 | ) | (62,932 | ) | |||
| (171,057 | ) | (128,450 | ) | ||||
| Property, equipment, and capitalized software, net | $ | 221,443 | $ | 190,934 | |||
Depreciation expense recognized for building and improvements, and furniture and equipment was $13.9$20.5 million $11.0, $17.5 million, and $9.0$13.9 million for the years ended December 31, 2010, 20092012, 2011 and 2008,2010, respectively. Amortization expense recognized forof capitalized computer software costs was $20.1$36.2 million $14.2, $30.2 million, and $11.7$20.1 million for the years ended December 31, 2010, 2009,2012, 2011 and 2008,2010, respectively.
Molina Center
As described in Note 4, “Business Combinations,” we acquired the Molina Center in December 2011. At December 31, 2012, the carrying amount of the Molina Center building and leasehold improvements was $44.4 million and the accumulated depreciation was $1.8 million. Future minimum rentals on noncancelable leases are as follows:
90
| (In thousands) | |||
| 2013 | $ | 9,784 | |
| 2014 | 9,954 | ||
| 2015 | 9,878 | ||
| 2016 | 8,054 | ||
| 2017 | 7,419 | ||
| Thereafter | 10,295 | ||
| Total minimum future rentals | $ | 55,384 | |
9. Goodwill and Intangible Assets
Other intangible assets are amortized over their useful lives ranging from one to 15 years. The weighted average amortization period for contract rights and licenses is approximately 11 years, for customer relationships is approximately 5five years, for backlog is approximately 2two years, and for provider networks is approximately 10 years. Based on the balances of our identifiable intangible assets as of December 31, 2010,2012, we estimate that our intangible asset amortization will be $27.5$17.9 million in 2011, $19.02013, $17.0 million in 2012, $15.82014, $12.1 million in 2013, $12.82015, $9.4 million in 2014,2016, and $7.0$9.3 million in 2015.2017. The following table provides the details of identified intangible assets, by major class, for the periods indicated:
| Accumulated | Net | |||||||||||
| Cost | Amortization | Balance | ||||||||||
| (In thousands) | ||||||||||||
| Intangible assets: | ||||||||||||
| Contract rights and licenses (Health Plans segment) | $ | 120,920 | $ | 64,201 | $ | 56,719 | ||||||
| Customer relationships (Molina Medicaid Solutions segment) | 24,550 | 3,418 | 21,132 | |||||||||
| Backlog (Molina Medicaid Solutions segment) | 23,600 | 8,316 | 15,284 | |||||||||
| Provider networks (Health Plans segment) | 18,622 | 6,257 | 12,365 | |||||||||
| Balance at December 31, 2010 | $ | 187,692 | $ | 82,192 | $ | 105,500 | ||||||
| Intangible assets: | ||||||||||||
| Contract rights and licenses | $ | 119,101 | $ | 51,246 | $ | 67,855 | ||||||
| Provider networks | 17,146 | 4,155 | 12,991 | |||||||||
| Balance at December 31, 2009 | $ | 136,247 | $ | 55,401 | $ | 80,846 | ||||||
93
indicated. As described in Note MOLINA HEALTHCARE, INC.
2
2
| Cost | Accumulated Amortization | Net Balance | |||||||||
| (In thousands) | |||||||||||
| Intangible assets: | |||||||||||
| Contract rights and licenses | $ | 135,932 | $ | 81,376 | $ | 54,556 | |||||
| Customer relationships | 24,550 | 12,513 | 12,037 | ||||||||
| Contract backlog | 23,600 | 17,870 | 5,730 | ||||||||
| Provider networks | 11,990 | 6,602 | 5,388 | ||||||||
| Balance at December 31, 2012 | $ | 196,072 | $ | 118,361 | $ | 77,711 | |||||
| Intangible assets: | |||||||||||
| Contract rights and licenses | $ | 140,242 | $ | 69,515 | $ | 70,727 | |||||
| Customer relationships | 24,550 | 8,546 | 16,004 | ||||||||
| Contract backlog | 23,600 | 15,139 | 8,461 | ||||||||
| Provider networks | 11,990 | 5,386 | 6,604 | ||||||||
| Balance at December 31, 2011 | $ | 200,382 | $ | 98,586 | $ | 101,796 | |||||
The following table presents the balances of goodwill and indefinite-lived intangible assets were as follows (in thousands)of December 31, 2012 and 2011:
| Balance as of December 31, 2009 | $ | 133,408 | ||
| Goodwill recorded for acquisition of Molina Medicaid Solutions on May 1, 2010 | 72,367 | |||
| Goodwill recorded for acquisition of the Wisconsin health plan on September 1, 2010 | 5,474 | |||
| Goodwill adjustment related to the 2009 acquisition of the Florida health plan | 979 | |||
| Balance at December 31, 2010 | $ | 212,228 | ||
| December 31, 2011 | Reductions | December 31, 2012 | |||||||||
| (In thousands) | |||||||||||
| Goodwill and indefinite-lived intangible assets, gross | $ | 212,484 | $ | (2,866 | ) | $ | 209,618 | ||||
| Accumulated impairment losses | (58,530 | ) | — | (58,530 | ) | ||||||
| Goodwill and indefinite-lived intangible assets, net | $ | 153,954 | $ | (2,866 | ) | $ | 151,088 | ||||
The change in the carrying amount in 2012 was due to the sale of the Molina Healthcare Insurance Company. 91 10. | Restricted Investments |
Pursuant to the regulations governing our health planHealth Plan subsidiaries, we maintain statutory deposits and deposits required by state Medicaid authorities.authorities in certificates of deposit and U.S. treasury securities. Additionally, we maintain restricted investments as protection against the insolvency of certain capitated providers. The following table presents the carrying valuebalances of restricted investments by health plan, and by our insurance company:
| December 31, | ||||||||
| 2010 | 2009 | |||||||
| (In thousands) | ||||||||
| California | $ | 372 | $ | 368 | ||||
| Florida | 4,508 | 2,052 | ||||||
| Insurance Company | 4,689 | 4,686 | ||||||
| Michigan | 1,000 | 1,000 | ||||||
| Missouri | 508 | 503 | ||||||
| New Mexico | 15,881 | 15,497 | ||||||
| Ohio | 9,066 | 9,036 | ||||||
| Texas | 3,501 | 1,515 | ||||||
| Utah | 1,279 | 578 | ||||||
| Washington | 151 | 151 | ||||||
| Wisconsin | 260 | — | ||||||
| Other | 885 | 888 | ||||||
| $ | 42,100 | $ | 36,274 | |||||
investments:
| December 31, | |||||||
| 2012 | 2011 | ||||||
| (In thousands) | |||||||
| California | $ | 373 | $ | 372 | |||
| Florida | 5,738 | 5,198 | |||||
| Insurance Company | — | 4,711 | |||||
| Michigan | 1,014 | 1,000 | |||||
| Missouri | 500 | 504 | |||||
| New Mexico | 15,915 | 15,905 | |||||
| Ohio | 9,082 | 9,078 | |||||
| Texas | 3,503 | 3,518 | |||||
| Utah | 3,126 | 2,895 | |||||
| Washington | 151 | 151 | |||||
| Other | 4,699 | 2,832 | |||||
| $ | 44,101 | $ | 46,164 | ||||
The contractual maturities of ourheld-to-maturity restricted investments as of December 31, 20102012 are summarized below.
| Amortized | Estimated | |||||||
| Cost | Fair Value | |||||||
| (In thousands) | ||||||||
| Due in one year or less | $ | 40,757 | $ | 40,792 | ||||
| Due one year through five years | 1,218 | 1,216 | ||||||
| Due after five years through ten years | 125 | 158 | ||||||
| $ | 42,100 | $ | 42,166 | |||||
94
Amortized Cost | Estimated Fair Value | ||||||
| (In thousands) | |||||||
| Due in one year or less | $ | 39,733 | $ | 39,738 | |||
| Due one year through five years | 4,368 | 4,368 | |||||
| $ | 44,101 | $ | 44,106 | ||||
11. Medical Claims and Benefits Payable
The following table presents the components of the change in our medical claims and benefits payable for the years ended December 31, 20102012, 2011, and 2009.2010. The negative amounts displayed for “Components“Components of medical care costs related to: Prior years”period” represent the amount by which our original estimate of claims and benefits payable at the beginning of the period exceededwere (more) or less than the actual amount of the liability based on information (principally the payment of claims) developed since that liability was first reported.
| Year Ended December 31, | ||||||||
| 2010 | 2009 | |||||||
| (Dollars in thousands, except per-member amounts) | ||||||||
| Balances at beginning of year | $ | 315,316 | $ | 292,442 | ||||
| Balance of acquired subsidiary | 3,228 | — | ||||||
| Components of medical care costs related to: | ||||||||
| Current year | 3,420,235 | 3,227,794 | ||||||
| Prior years | (49,378 | ) | (51,558 | ) | ||||
| Total medical care costs | 3,370,857 | 3,176,236 | ||||||
| Payments for medical care costs related to: | ||||||||
| Current year | 3,085,388 | 2,920,015 | ||||||
| Prior years | 249,657 | 233,347 | ||||||
| Total paid | 3,335,045 | 3,153,362 | ||||||
| Balances at end of year | $ | 354,356 | $ | 315,316 | ||||
| Benefit from prior years as a percentage of: | ||||||||
| Balance at beginning of year | 15.7 | % | 17.6 | % | ||||
| Premium revenue | 1.2 | % | 1.4 | % | ||||
| Total medical care costs | 1.5 | % | 1.6 | % | ||||
92
| Year Ended December 31, | |||||||||||
| 2012 | 2011 | 2010 | |||||||||
(Dollars in thousands, except per-member amounts) | |||||||||||
| Balances at beginning of period | $ | 402,476 | $ | 354,356 | $ | 315,316 | |||||
| Balance of acquired subsidiary | — | — | 3,228 | ||||||||
| Components of medical care costs related to: | |||||||||||
| Current period | 5,136,055 | 3,911,803 | 3,420,235 | ||||||||
| Prior period | (39,295 | ) | (51,809 | ) | (49,378 | ) | |||||
| Total medical care costs | 5,096,760 | 3,859,994 | 3,370,857 | ||||||||
| Payments for medical care costs related to: | |||||||||||
| Current period | 4,649,363 | 3,516,994 | 3,085,388 | ||||||||
| Prior period | 355,343 | 294,880 | 249,657 | ||||||||
| Total paid | 5,004,706 | 3,811,874 | 3,335,045 | ||||||||
| Balances at end of period | $ | 494,530 | $ | 402,476 | $ | 354,356 | |||||
| Benefit from prior period as a percentage of: | |||||||||||
| Balance at beginning of period | 9.8 | % | 14.6 | % | 15.7 | % | |||||
| Premium revenue | 0.7 | % | 1.1 | % | 1.2 | % | |||||
| Total medical care costs | 0.8 | % | 1.3 | % | 1.5 | % | |||||
Assuming that our initial estimate of IBNP is accurate, we believe that amounts ultimately paid out would generally be between 8% and 10% less than the liability recorded at the end of the period as a result of the inclusion in that liability of the allowance for adverse claims development and the accrued cost of settling those claims. Because the amount of our initial liability is merely an estimate (and therefore never perfectly accurate), we will always experience variability in that estimate as new information becomes available with the passage of time. Therefore, there can be no assurance that amounts ultimately paid out will not be higher or lower than this 8% to 10% range. For example, for the yearyears ended December 31, 2011 and 2010, the amounts ultimately paid out were less than the amount of the reserves we had established as of December 31, 2010 and 2009, by 14.6% and 15.7%, respectively. Furthermore, because the initial estimate of IBNP is derived from many factors, some of which are qualitative in nature rather than quantitative, we are seldom able to assign specific values to the reasons for a change in estimate - we only know when the circumstances for any one or more of those factors are out of the ordinary.
As indicated above, the amounts ultimately paid out on our liabilities in fiscal years 2012, 2011, and 2010were less than what we had expected when we established our reserves. While many related factors working in conjunction with one another determine the accuracy of our estimates, we are seldom able to quantify the impact that any single factor has on a change in estimate. In addition, given the variability inherent in the reserving process, we will only be able to identify specific factors if they represent a significant departure from expectations. As a result, we do not expect to be able to fully quantify the impact of individual factors on changes in estimate.
We recognized a benefit from prior period claims development in the amount of $49.4 million.$39.3 millionfor the year endedDecember 31, 2012. This amount represents our estimate as of December 31, 2012, of the extent to which our initial estimate of medical claims and benefits payable at December 31, 2011was more than the amount that will ultimately be paid out in satisfaction of that liability. We believe that the overestimation of our claims liability atDecember 31, 2011was due primarily to the following factors:
At our Washington health plan, we underestimated the amount of recoveries we would collect for certain high-cost newborn claims, resulting in an overestimation of reserves at year end.
At our Texas health plan, we overestimated the cost of new members in STAR+PLUS (the name of our ABD program in Texas), in the Dallas region.
In early 2011, the state of Michigan was delayed in the enrollment of newborns in managed care plans; the delay was resolved by mid-2011. This caused a large number of claims with older dates of service to be paid during late 2011, resulting in an artificial increase in the lag time for claims payment at our Michigan health plan. We adjusted reserves downward for this issue at December 31, 2011, but the adjustment did not capture all of the claims overestimation.
93
The overestimation of our liability for medical claims and benefits payable was partially offset by an underestimation of that liability at our Missouri health plan, as a result of the costs associated with an unusually large number of premature infants during the fourth quarter of 2011.
We recognized a benefit from prior period claims development in the amount of$51.8 millionfor the year endedDecember 31, 2011. This amount represents our estimate as of December 31, 2011, of the extent to which our initial estimate of medical claims and benefits payable at December 31, 2010was more than the amount that will ultimately be paid out in satisfaction of that liability. We believe that the overestimation of our claims liability atDecember 31, 2010was due primarily to the following factors:
At our Ohio health plan, we overestimated the impact of a buildup in claims inventory.
At our California health plan, we overestimated the impact of the settlement of disputed provider claims.
At our New Mexico health plan, we underestimated the impact of a reduction in the outpatient facility fee schedule.
We recognized a benefit from prior period claims development in the amount of$49.4 millionfor the year ended December 31, 2010. This amount represents our estimate as ofDecember 31, 2010, of the extent to which our initial estimate of medical claims and benefits payable at December 31, 2009 exceededwas more than the amount that will ultimately be paid out in satisfaction of that liability. TheWe believe that the overestimation of our claims liability atDecember 31, 2009was due primarily to the following factors:
At our New Mexico health plan, we underestimated the degree to which cuts to the Medicaid fees schedule would reduce our liability as of December 31, 2009.
At our California health plan, we underestimated the extent to which various network restructuring, provider contracting, and medical management initiatives had reduced our medical care costs during the second half of 2009, thereby resulting in a lower liability at December 31, 20092009.
In estimating our claims liability atDecember 31, 2012, we adjusted our base calculation to take account of the numerous factors that we believe will likely change our final claims liability amount. We believe that the most significant among those factors are:
Our Texas health plan membership nearly doubled effective March 1, 2012. In addition, effective March 1, 2012, we assumed inpatient medical liability for ABD members for which we were not previously responsible. Reserves for new coverage and new regions are now based on the newly developing claims lag patterns. While the lag patterns are now beginning to stabilize for the new membership and coverage, the true reserve liability continues to be more uncertain than usual.
Data published by the Centers for Disease Control, or CDC, indicated a significant increase in the percentage of office visits for influenza-like illnesses, or ILI, during December 2012. This indicated that the annual flu season was starting earlier than it had in most recent years. This was most noticeable in the southeast region of the country, but impacted other areas as well. Our leading indicators, including inpatient authorizations and overall pharmacy utilization, did not show as great an increase as we had expected based on the severity of the CDC's flu-related indices. However, we did see a significant increase in the use of prescription flu medication, especially in our Texas health plan. Therefore, we increased our reserves to account for expected additional utilization due to the early onset of the flu season.
Our California health plan has enrolled approximately 20,000 new ABD members since September 30, 2011, as a result of the following factors:
Prior to July 2012, it was the state of Washington's practice to disenroll certain sick newborns from the Healthy Options Medicaid managed care program and benefits payable at December 31, 2008 exceededcover them under the amountSupplemental Security Income program, or SSI, instead. When this occurred, the health plan would reimburse the premiums received for that was ultimately be paid outmember back to the state and the state in satisfactionturn reimbursed the health plan for the cost of that liability. The overestimationcare, usually retroactively to the date of birth. Effective July 1, 2012, the claims liability at our Michigan, New Mexico, Ohio, and Washington health plans was principallynow retain these members and cover them under a new ABD program entitled Healthy Options Blind and Disabled, or HOBD. The premium we receive from the causestate for the HOBD members is very high to cover the substantial cost of care. By December, we had enrolled approximately 26,000 members under HOBD. Because the recognitionprogram is relatively new, there is still some uncertainty as to the level of a benefitclaims to be expected from prior period claims development. This was partially offset by the underestimation of our claims liability at December 31, 2008 at our California health plan.these high-cost members.
95
The use of a consistent methodology in estimating our liability for claims and medical benefits payable minimizes the degree to which the under- or over-estimationoverestimation of that liability at the close of one period may affect consolidated results of operations in subsequent periods. Facts and circumstances unique to the estimation process at any single date, however, may still lead to a
94
material impact on consolidated results of operations in subsequent periods. Any absence of adverse claims development (as well as the expensing through general and administrative expense of the costs to settle claims held at the start of the period) will lead to the recognition of a benefit from prior period claims development in the period subsequent to the date of the original estimate. In 2012, 2011and2010, and 2009 the absence of adverse development of the liability for claims and medical benefits payable at the close of the previous period resulted in the recognition of substantial favorable prior period development. In boththese years, however, the recognition of a benefit from prior period claims development did not have a material impact on our consolidated results of operations asbecause the amount of benefit recognized in each youryear was roughly consistent with that recognized in the previous year.
On February 15, 2013, we issued$550 millionaggregate principal amount of1.125%Cash Convertible Senior Notes due 2020, or the Notes. The Notes bear interest at a rate of1.125% per year, payable semiannually in arrears on January 15 and July 15 of each year, beginning on July 15, 2013. The Notes will mature on January 15, 2020.
The Notes are not convertible into our common stock or any other securities under any circumstances. Holders may convert their Notes solely into cash at their option at any time prior to the close of business on the business day immediately preceding July 15, 2019 only under the following circumstances: (1) during any calendar quarter commencing after the calendar quarter ending on June 30, 2013 (and only during such calendar quarter), if the last reported sale price of the common stock for at least 20 trading days (whether or not consecutive) during a partyperiod of30consecutive trading days ending on the last trading day of the immediately preceding calendar quarter is greater than or equal to130%of the conversion price on each applicable trading day; (2) during the five business day period immediately after any five consecutive trading day period in which the trading price per$1,000principal amount of Notes for each trading day of the measurement period was less than98%of the product of the last reported sale price of our common stock and the conversion rate on each such trading day; or (3) upon the occurrence of specified corporate events. On or after July 15, 2019 until the close of business on the second scheduled trading day immediately preceding the maturity date, holders may convert their Notes solely into cash at any time, regardless of the foregoing circumstances. Upon conversion, in lieu of receiving shares of our common stock, a holder will receive an amount in cash, per$1,000principal amount of Notes, equal to the settlement amount, determined in the manner set forth in the Indenture.
The initial conversion rate will be24.5277shares of our common stock per$1,000principal amount of Notes (equivalent to an Amendedinitial conversion price of approximately$40.77per share of common stock). The conversion rate will be subject to adjustment in some events but will not be adjusted for any accrued and Restated Credit Agreement, dated asunpaid interest. In addition, following certain corporate events that occur prior to the maturity date, we will pay a cash make-whole premium by increasing the conversion rate for a holder who elects to convert its Notes in connection with such a corporate event in certain circumstances. We may not redeem the Notes prior to the maturity date, and no sinking fund is provided for the Notes.
If we undergo a fundamental change (as defined in the indenture to the Notes), holders may require us to repurchase for cash all or part of March 9, 2005, as amendedtheir Notes at a repurchase price equal to100%of the principal amount of the Notes to be repurchased, plus accrued and unpaid interest to, but excluding, the fundamental change repurchase date. The indenture provides for customary events of default, including cross acceleration to certain other indebtedness of ours, and our significant subsidiaries.
The Notes will be senior unsecured obligations of the Company and will rank senior in right of payment to any of our indebtedness that is expressly subordinated in right of payment to the Notes; equal in right of payment to any of our unsecured indebtedness that is not so subordinated; effectively junior in right of payment to any of our secured indebtedness to the extent of the value of the assets securing such indebtedness; and structurally junior to all indebtedness and other liabilities (including trade payables) of our subsidiaries.
Cash Convertible Note Hedge and Warrant Transactions
In connection with the pricing of the Notes, on February 11, 2013, we entered into cash convertible note hedge transactions and warrant transactions relating to a notional number of shares of our common stock underlying the Notes to be issued by us (without regard to the first amendment on October 5, 2005, the second amendment on November 6, 2006, the third amendment on May 25, 2008, the fourth amendment on April 29, 2010, and the fifth amendment on April 29, 2010, among Molina Healthcare Inc., certain lenders,initial purchasers'$100 million over-allotment option) with twocounterparties, JPMorgan Chase Bank, National Association, London Branch and Bank of America, N.A., as Administrative Agent (the “Credit Facility”“Option Counterparties”) for a revolving credit line of $150 million that matures in May 2012.. The Credit Facility iscash convertible note hedge transactions are intended to be used for general corporate purposes. As described below and in Note 4, “Business Combinations,” we borrowed $105 millionoffset cash payments due upon any conversion of the Notes. However, the warrant transactions could separately have a dilutive effect to the extent that the market value per share of our common stock (as measured under the Credit Facilityterms of the warrant transactions) exceeds the applicable strike price of the warrants. The strike price of the warrants will initially be$53.8475per share, which is75%above the last reported sale price of our common stock on February 11, 2013.
95
In connection with the exercise in full by the initial purchasers of their over-allotment option in respect of the Notes, on February 13, 2013, we and the Option Counterparties amended the cash convertible note hedge transactions entered into on February 11, 2013 to acquire Molina Medicaid Solutionsupsize such transactions by a notional number of shares of our common stock corresponding to the number of shares underlying the Notes purchased pursuant to the exercise of such over-allotment option. On February 13, 2013, we also entered into additional warrant transactions with the Option Counterparties relating to a number of shares of our common stock corresponding to the number of shares underlying the Notes purchased pursuant to the exercise of such over-allotment option. Each of the amendments to the cash convertible note hedge transactions and the additional warrant transactions were on substantially similar terms to the corresponding transactions entered into on February 11, 2013. Pursuant to these warrant transactions, we issued13,490,236warrants with a strike price of$53.8475per share. The number of warrants and the strike price are subject to adjustment under certain circumstances.
We used approximately$74.3 millionof the net proceeds from the offering to pay the cost of the cash convertible note hedge transactions (after such cost was partially offset by the proceeds to us from the sale of warrants in the second quarterwarrant transactions and the additional warrant transactions).
Aside from the initial payment of 2010. Duringa premium to the third quarterOption Counterparties of 2010,approximately$149.3 million, we repaid thiswill not be required to make any cash payments to the Option Counterparties under the cash convertible note hedge transactions and will be entitled to receive from the Option Counterparties an amount usingof cash, generally equal to the amount by which the market price per share of common stock exceeds the strike price of the cash convertible note hedge transactions during the relevant valuation period. The strike price under the cash convertible note hedge transactions is initially equal to the conversion price of the Notes. Additionally, if the market value per share of our common stock exceeds the strike price of the warrants on any trading day during the160trading day measurement period under the warrant transactions and the additional warrant transactions, we will be obligated to issue to the Option Counterparties a number of shares equal in value to the product of the amount by which such market value exceeds such strike price and1/160thof the aggregate number of shares of our common stock underlying the warrant transactions and the additional warrant transactions, subject to a share delivery cap. The Company will not receive any additional proceeds from our equity offering, described in Note 14, “Stockholders’ Equity.” if warrants are exercised.
As of December 31, 2010,2012, maturities of long-term debt for the years ending December 31 are as follows (in thousands):
| Total | 2013 | 2014 | 2015 | 2016 | 2017 | Thereafter | |||||||||||||||||||||
| Credit Facility | $ | 40,000 | $ | — | $ | — | $ | — | $ | 40,000 | $ | — | $ | — | |||||||||||||
| Convertible senior notes | 187,000 | — | 187,000 | — | — | — | — | ||||||||||||||||||||
| Term loan | 47,471 | 1,155 | 1,206 | 1,259 | 1,309 | 1,372 | 41,170 | ||||||||||||||||||||
| $ | 274,471 | $ | 1,155 | $ | 188,206 | $ | 1,259 | $ | 41,309 | $ | 1,372 | $ | 41,170 | ||||||||||||||
Credit Facility
On February 15, 2013, we used approximately$40.0 millionof the net proceeds from the offering of the Notes to repay all of the outstanding indebtedness under our$170 millionrevolving credit facility, or the Credit Facility, with various lenders and 2009,U.S. Bank National Association, as Line of Credit Issuer, Swing Line Lender, and Administrative Agent. As of December 31, 2012, there was no $40.0 millionoutstanding principal balance under the Credit Facility. However, as
We terminated the Credit Facility in connection with the closing of December 31, 2010, our lenders had issued the offering and sale of the Notes.twoletters of credit in the aggregate principal amount of $10.3$10.3 million in connectionthat reduced the amount available for borrowing under the Credit Facilityas of December 31, 2012, were transferred to direct issue letters of credit with another financial institution. The Credit Facility had a term offive yearsunder which all amounts outstanding would have been due and payable on September 9, 2016.
Borrowings under the contractCredit Facility accrued interest based, at our election, on the base rate plus an applicable margin or the Eurodollar rate. The base rate is, for any day, a rate of MMS withinterest per annum equal to the stateshighest of Maine(i) the prime rate of interest announced from time to time by U.S. Bank or its parent, (ii) the sum of the federal funds rate for such day plus0.50%per annum and Idaho.
96
Our obligations under the Credit Facility such obligations will bewere secured by a lien on substantially all of our assets, with the exception of certain of our real estate assets, and by a pledge of the capital stock or membership interests of our operating subsidiaries and health plan subsidiariesplans (with the exception of the California health plan). The Credit Facility includesincluded usual and customary covenants for credit facilities of this type, including covenants limiting liens, mergers, asset sales, other fundamental changes, debt, acquisitions, dividends and other distributions, capital expenditures, investments, and a fixed charge coverage ratio.investments. The Credit Facility also requiresrequired us to maintain as of the end of any fiscal quarter (calculated for each four consecutive fiscal quarter period) a ratio of total consolidated debt to total consolidated EBITDA, as defined in the Credit Facility, of not more than2.75 to 1.00, at any time.and a fixed charge coverage ratio of not less than1.75 to 1.00.. AtDecember 31, 2010,2012, we were in compliance with all financial covenants inunder the Credit Facility.
96
As of the Notes resulted December 31, 2012, $187.0 millionin net proceeds totaling $193.4 million. During 2009, we purchased and retired $13.0 million face amount of the Notes, so the remaining aggregate principal amount totaled $187.0 million as of December 31, 2010 (see further discussion below regardingour 3.75%Convertible Senior Notes due 2014, or the purchase program).3.75% Notes, remain outstanding. The 3.75% Notes rank equally in right of payment with our existing and future senior indebtedness.
The 3.75% Notes are convertible into cash and, under certain circumstances, shares of our common stock. The initial conversion rate is 21.3067 31.9601shares of our common stock per one thousand dollar principal amount of the 3.75% Notes. This represents an initial conversion price of approximately $46.93 $31.29per share of our common stock. In addition, if certain corporate transactions that constitute a change of control occur prior to maturity, we will increase the conversion rate will increase in certain circumstances. Prior to July 2014, holders may convert their 3.75% Notes only under the following circumstances:
During any fiscal quarter after our fiscal quarter ending December 31, 2007, if the closing sale price per share of our common stock, for each of at least 20 trading days during the period of 30 consecutive trading days ending on the last trading day of the previous fiscal quarter, is greater than or equal to 120% of the conversion price per share of our common stock; During the five business day period immediately following any five consecutive trading day period in which the trading price per one thousand dollar principal amount of the 3.75% Notes for each trading day of such period was less than 98% of the product of the closing price per share of our common stock on such day and the conversion rate in effect on such day; or Upon the occurrence of specified corporate transactions or other specified events. |
On or after July 1, 2014, holders may convert their 3.75% Notes at any time prior to the close of business on the scheduled trading day immediately preceding the stated maturity date regardless of whether any of the foregoing conditions is satisfied.
We will deliver cash and shares of our common stock, if any, upon conversion of each $1,000$1,000 principal amount of 3.75% Notes, as follows:
An amount in cash (the “principal return”) equal to the sum of, for each of the 20 Volume-Weighted Average Price ("VWAP") trading days during the conversion period, the lesser of the daily conversion value for such VWAP trading day and fifty dollars (representing 1/20th of one thousand dollars); and
A number of shares based upon, for each of the 20 VWAP trading days during the conversion period, any excess of the daily conversion value above fifty dollars.
The proceeds from the issuance of the 3.75% Notes have been allocated between a liability component and an equity component. We have determined that the effective interest rate of the 3.75% Notes is 7.5%, principally based on the seven-year U.S. treasuryTreasury note rate as of the October 2007 issuance date, plus an appropriate credit spread. The resulting debt discount is being amortized over the period the 3.75% Notes are expected to be outstanding, as additional non-cash interest expense. As of December 31, 2010,2012, we expect the 3.75% Notes to be outstanding until their October 1, 2014 maturity date, for a remaining amortization period of 4521 months. The 3.75% Notes’ if-converted value did not exceed their principal amount as of December 31, 2010.2012. At December 31, 2010,2012, the equity component of the 3.75% Notes, net of the
97
impact of deferred taxes, was $24.0 million.$24.0 million. The following table provides the details of the liability amounts recorded:
| December 31, | ||||||||
| 2010 | 2009 | |||||||
| (In thousands) | ||||||||
| Details of the liability component: | ||||||||
| Principal amount | $ | 187,000 | $ | 187,000 | ||||
| Unamortized discount | (22,986 | ) | (28,100 | ) | ||||
| Net carrying amount | $ | 164,014 | $ | 158,900 | ||||
| Years Ended December 31, | ||||||||||||
| 2010 | 2009 | 2008 | ||||||||||
| (In thousands) | ||||||||||||
| Interest cost recognized for the period relating to the: | ||||||||||||
| Contractual interest coupon rate of 3.75% | $ | 7,012 | $ | 7,076 | $ | 7,500 | ||||||
| Amortization of the discount on the liability component | 5,114 | 4,782 | 4,707 | |||||||||
| Total interest cost recognized | $ | 12,126 | $ | 11,858 | $ | 12,207 | ||||||
| December 31, | |||||||
| 2012 | 2011 | ||||||
| (In thousands) | |||||||
| Details of the liability component: | |||||||
| Principal amount | $ | 187,000 | $ | 187,000 | |||
| Unamortized discount | (11,532 | ) | (17,474 | ) | |||
| Net carrying amount | $ | 175,468 | $ | 169,526 | |||
97
| Years Ended December 31, | |||||||||||
| 2012 | 2011 | 2010 | |||||||||
| (In thousands) | |||||||||||
| Interest cost recognized for the period relating to the: | |||||||||||
| Contractual interest coupon rate of 3.75% | $ | 7,012 | $ | 7,012 | $ | 7,012 | |||||
| Amortization of the discount on the liability component | 5,942 | 5,512 | 5,114 | ||||||||
| Total interest cost recognized | $ | 12,954 | $ | 12,524 | $ | 12,126 | |||||
Term Loan
On December 7, 2011, our wholly owned subsidiary Molina Center LLC entered into a Term Loan Agreement, dated as of December 1, 2011, with various lenders and East West Bank, as Administrative Agent (the “Administrative Agent”). Pursuant to the terms of the Term Loan Agreement, Molina Center LLC borrowed the aggregate principal amount of$48.6 millionto finance a portion of the$81 millionpurchase price for the acquisition of the Molina Center, located in Long Beach, California.
The outstanding principal amount under the Term Loan Agreement bears interest at the Eurodollar rate for each Interest Period (as defined below) commencing January 1, 2012. The Eurodollar rate is a per annum rate of interest equal to the greater of (a) the rate that is published in the Wall Street Journal as the London interbank offered rate for deposits in United States dollars, for a period of one month, two business days prior to the commencement of an Interest Period, multiplied by a statutory reserve rate established by the Board of Governors of the Federal Reserve System, or (b)4.25%. "Interest Period" means the period commencing on the first day of each calendar month and ending on the last day of each calendar month. The loan matures on November 30, 2018, and is subject to a 25-yearamortization schedule that commenced on January 1, 2012.
The Term Loan Agreement contains customary representations, warranties, and financial covenants. In the event of a default as described in the Term Loan Agreement, the outstanding principal amount under the Term Loan Agreement will bear interest at a rate 5.00% per annum higher than the otherwise applicable rate. All amounts due under the Term Loan Agreement and related loan documents are secured by a security interest in the Molina Center in favor of and for the benefit of the Administrative Agent and the other lenders under the Term Loan Agreement.
Interest Rate Swap
In May 2012, we entered into a $42.5 millionnotional amount interest rate swap agreement, or Swap Agreement, with an effective date of March 1, 2013. While not designated as a hedge during the year ended December 31, 2012, the Swap Agreement is intended to reduce our exposure to fluctuations in the contractual variable interest rates under our Term Loan Agreement, and expires on the maturity date of the Term Loan Agreement, which is November 30, 2018. Under the $25Swap Agreement, we will receive a variable rate of the one-month LIBOR plus3.25%, and pay a fixed rate of5.34%. The Swap Agreement is measured and reported at fair value on a recurring basis, within Level 2 of the fair value hierarchy. Gains and losses relating to changes in fair value are reported in earnings in the current period. For the year endedDecember 31, 2012, we have recorded losses of$1.3 million securities purchase program announced in January 2009,to general and administrative expense. As ofDecember 31, 2012the fair value of the Swap Agreement is a liability of $1.3 million, recorded to other noncurrent liabilities. We do not use derivatives for trading or speculative purposes. We believe that we purchased and retired $13.0 million faceare not exposed to more than a nominal amount of credit risk relating to the Notes duringSwap Agreement because the first quarter of 2009. We purchased the Notes atcounterparty is an average price of $74.25 per $100 principal amount, for a total of $9.8 million, including accrued interest. The gain recognized during 2009 on the purchase of the Notes was $1.5 million.established and well-capitalized financial institution.
| 13. | Income Taxes |
The provision for income taxes consisted of the following:
98
| Year Ended December 31, | ||||||||||||
| 2010 | 2009 | 2008 | ||||||||||
| (In thousands) | ||||||||||||
| Current: | ||||||||||||
| Federal | $ | 36,395 | $ | 9,421 | $ | 32,972 | ||||||
| State | 2,144 | (1,558 | ) | 1,866 | ||||||||
| Total current | 38,539 | 7,863 | 34,838 | |||||||||
| Deferred: | ||||||||||||
| Federal | (4,717 | ) | 1,924 | 378 | ||||||||
| State | 700 | (2,498 | ) | (490 | ) | |||||||
| Total deferred | (4,017 | ) | (574 | ) | (112 | ) | ||||||
| Total provision for income taxes | $ | 34,522 | $ | 7,289 | $ | 34,726 | ||||||
98
| Years Ended December 31, | |||||||||||
| 2012 | 2011 | 2010 | |||||||||
| (In thousands) | |||||||||||
| Current: | |||||||||||
| Federal | $ | 17,853 | $ | 28,336 | $ | 36,395 | |||||
| State | 1,308 | 1,639 | 2,144 | ||||||||
| Total current | 19,161 | 29,975 | 38,539 | ||||||||
| Deferred: | |||||||||||
| Federal | (6,300 | ) | 14,028 | (4,717 | ) | ||||||
| State | (3,586 | ) | (167 | ) | 700 | ||||||
| Total deferred | (9,886 | ) | 13,861 | (4,017 | ) | ||||||
| Total provision for income taxes | $ | 9,275 | $ | 43,836 | $ | 34,522 | |||||
A reconciliation of the effectiveU.S. federal statutory income tax rate to the statutory federalcombined effective income tax rate is as follows:
| Year Ended December 31, | ||||||||||||
| 2010 | 2009 | 2008 | ||||||||||
| (In thousands) | ||||||||||||
| Taxes on income at statutory federal tax rate (35)% | $ | 31,323 | $ | 13,355 | $ | 33,014 | ||||||
| State income taxes, net of federal benefit | 1,849 | (2,637 | ) | 894 | ||||||||
| (Benefit) liability for unrecognized tax benefits | (57 | ) | (3,315 | ) | 450 | |||||||
| Other | 1,407 | (114 | ) | 368 | ||||||||
| Reported income tax expense | $ | 34,522 | $ | 7,289 | $ | 34,726 | ||||||
| Years Ended December 31, | ||||||||
| 2012 | 2011 | 2010 | ||||||
| Statutory federal tax rate | 35.0 | % | 35.0 | % | 35.0 | % | ||
| State income taxes, net of federal benefit | (7.8 | ) | 1.5 | 2.1 | ||||
| Benefit for unrecognized tax benefits | (1.2 | ) | (0.6 | ) | (0.1 | ) | ||
| Nondeductible compensation | 7.6 | — | 1.0 | |||||
| Nondeductible goodwill | — | 31.7 | — | |||||
| Nondeductible lobbying | 5.2 | 1.1 | 0.7 | |||||
| Purchase accounting adjustment | — | (1.5 | ) | — | ||||
| Change in fair value of contingent consideration | 5.9 | — | — | |||||
| Other | 3.9 | 0.6 | (0.1 | ) | ||||
| Effective tax rate | 48.6 | % | 67.8 | % | 38.6 | % | ||
Our effective tax rate is based on expected income, statutory tax rates, and tax planning opportunities available to us in the various jurisdictions in which we operate. Significant management estimates and judgments are required in determining our effective tax rate. We are routinely under audit by federal, state, or local authorities regarding the timing and amount of deductions, nexus of income among various tax jurisdictions, and compliance with federal, state, and local tax laws. We have pursued various strategies to reduce our federal, state and local taxes. As a result, we have reduced our state income tax expense due to California enterprise zone credits.
During 2010, 2009,2012 and 2008,2011, excess tax benefits from shared-based compensation were $3.1 million and $937,000, respectively. These amounts were recorded as a decrease to income taxes payable and an increase to additional paid-in capital. During 2010, tax-related deficiencies on share-based compensation were $673,000, $718,000, and $292,000, respectively. Such amounts were$673,000. This amount was recorded as adjustmentsan adjustment to income taxes payable with a corresponding decrease to additional paid-in capital.
99
Deferred tax assets and liabilities are classified as current or non-current according to the classification of the related asset or liability. Significant components of our deferred tax assets and liabilities as of December 31, 20102012 and 20092011 were as follows:
99
| December 31, | |||||||||||||||
| 2010 | 2009 | December 31, | |||||||||||||
| (In thousands) | 2012 | 2011 | |||||||||||||
| (In thousands) | |||||||||||||||
| Accrued expenses | $ | 12,618 | $ | 2,494 | $ | 15,381 | $ | 14,541 | |||||||
| Reserve liabilities | 877 | 285 | 2,936 | 1,292 | |||||||||||
| State taxes | (120 | ) | 1,151 | (606 | ) | (396 | ) | ||||||||
| Other accrued medical costs | 2,126 | 1,628 | 2,518 | 2,051 | |||||||||||
| Net operating losses | 27 | 27 | 27 | 27 | |||||||||||
| Unrealized (gains) losses | (254 | ) | (408 | ) | |||||||||||
| Unrealized gains | (283 | ) | (316 | ) | |||||||||||
| Unearned premiums | 3,517 | 6,554 | 15,675 | 4,139 | |||||||||||
| Prepaid expenses | (3,006 | ) | (2,894 | ) | (4,390 | ) | (3,032 | ) | |||||||
| Deferred compensation | 1,611 | — | |||||||||||||
| Other, net | (69 | ) | (80 | ) | (426 | ) | 21 | ||||||||
| Deferred tax asset, net of valuation allowance — current | 15,716 | 8,757 | 32,443 | 18,327 | |||||||||||
| Accrued expenses | 791 | (281 | ) | — | 223 | ||||||||||
| Reserve liabilities | 3,071 | 2,501 | 2,013 | 3,015 | |||||||||||
| State taxes | 1,960 | — | |||||||||||||
| Other accrued medical costs | (358 | ) | (866 | ) | |||||||||||
| State tax credit carryover | 4,149 | 2,609 | |||||||||||||
| Net operating losses | 1,362 | 237 | 3,341 | 2,694 | |||||||||||
| Unrealized losses | 1,559 | 1,480 | 563 | 1,176 | |||||||||||
| Unearned premiums | (135 | ) | (264 | ) | |||||||||||
| Depreciation and amortization | (20,110 | ) | (10,415 | ) | (44,198 | ) | (39,939 | ) | |||||||
| Deferred compensation | 6,829 | 6,817 | 3,323 | 7,904 | |||||||||||
| Debt basis | (9,673 | ) | (11,555 | ) | (5,410 | ) | (7,604 | ) | |||||||
| Other, net | (337 | ) | (160 | ) | 702 | (278 | ) | ||||||||
| Valuation allowance | (1,194 | ) | — | (2,383 | ) | (2,927 | ) | ||||||||
| Deferred tax liability, net of valuation allowance — long term | (16,235 | ) | (12,506 | ) | (37,900 | ) | (33,127 | ) | |||||||
| Net deferred income tax liability | $ | (519 | ) | $ | (3,749 | ) | $ | (5,457 | ) | $ | (14,800 | ) | |||
At December 31, 2010,2012, we had federal and state net operating loss carryforwards of $475,000$319,000 and $28$73.0 million, respectively. The federal net operating loss begins expiring in 2018, and state net operating losses begin expiring in 2015.2013. The utilization of the net operating losses is subject to certain limitations under federal law.
At December 31, 2010,2012, we had California enterprise zone tax credit carryovers of $3$6.3 million which do not expire.
We evaluate the need for a valuation allowance taking into consideration the ability to carry back and carry forward tax credits and losses, available tax planning strategies and future income, including reversal of temporary differences. We have determined that as of December 31, 2010, $1.22012, $3.0 million of deferred tax assets did not satisfy the recognition criteria due to uncertainty regarding the realization of some of our state tax operating loss carryforwards. We increased our valuation allowance $100,000 from zero$2.9 million at December 31, 20092011 to $1.2$3.0 million as of December 31, 2010.
2012.
We recognize tax benefits only if the tax position is more likely than not to be sustained. We are subject to income taxes in the U.S. and numerous state jurisdictions. Significant judgment is required in evaluating our tax positions and determining our provision for income taxes. During the ordinary course of business, there are many transactions and calculations for which the ultimate tax determination is uncertain. We establish reserves for tax-related uncertainties based on estimates of whether, and the extent to which, additional taxes will be due. These
100
reserves are established when we believe that certain positions might be challenged despite our belief that our tax return positions are fully supportable. We adjust these reserves in light of changing facts and circumstances, such as the outcome of tax audits. The provision for income taxes includes the impact of reserve provisions and changes to reserves that are considered appropriate.
The roll forwardroll-forward of our unrecognized tax benefits is as follows:
100
| Year Ended December 31, | ||||||||||||
| 2010 | 2009 | 2008 | ||||||||||
| (In thousands) | ||||||||||||
| Gross unrecognized tax benefits at beginning of period | $ | (4,128 | ) | $ | (11,676 | ) | $ | (10,278 | ) | |||
| Increases in tax positions for prior years | (6,891 | ) | (3,748 | ) | (3,310 | ) | ||||||
| Decreases in tax positions for prior years | — | 6,804 | 2,682 | |||||||||
| Increases in tax positions for current year | — | — | (2,061 | ) | ||||||||
| Decreases in tax positions for current year | — | — | 892 | |||||||||
| Settlements | — | 4,355 | — | |||||||||
| Lapse in statute of limitations | 57 | 137 | 399 | |||||||||
| Gross unrecognized tax benefits at end of period | $ | (10,962 | ) | $ | (4,128 | ) | $ | (11,676 | ) | |||
| Years Ended December 31, | |||||||||||
| 2012 | 2011 | 2010 | |||||||||
| (In thousands) | |||||||||||
| Gross unrecognized tax benefits at beginning of period | $ | (10,712 | ) | $ | (10,962 | ) | $ | (4,128 | ) | ||
| Increases in tax positions for prior years | (441 | ) | (137 | ) | (6,891 | ) | |||||
| Decreases in tax positions for prior years | 320 | — | — | ||||||||
| Settlements | — | — | — | ||||||||
| Lapse in statute of limitations | 211 | 387 | 57 | ||||||||
| Gross unrecognized tax benefits at end of period | $ | (10,622 | ) | $ | (10,712 | ) | $ | (10,962 | ) | ||
As of December 31, 2010,2012, we had $11.0$10.6 million of unrecognized tax benefits of which $7.8$7.4 million, if fully recognized, would affect our effective tax rate. We anticipate a decreaseApproximately $8.4 million of $499,000 to our liability forthe unrecognized tax benefits withinrecorded at December 31, 2012 relates to a tax position claimed on a state refund claim that will not result in a cash payment for income taxes if our claim is denied. We expect that during the next twelve-month period12 months it is reasonably possible that unrecognized tax benefit liabilities may decrease by as much as $8.6 million due the resolution to the state refund claim as well as the normal expiration of tax statutes.statute of limitations.
Our continuing practice is to recognize interestand/or penalties related to unrecognized tax benefits in income tax expense. As of December 31, 2012, December 31, 2011, and December 31, 2010 December 31, 2009, and December 31, 2008,, we had accrued $82,000, $75,000$56,000, $65,000, and $1.4 million,$82,000, respectively, for the payment of interest and penalties.
We may be subject to examination by the Internal Revenue Service, (“IRS”)or IRS, for calendar years 20072009 through 2010.2012. We are under examination, or may be subject to examination, in certain state and local jurisdictions, with the major jurisdictions being California, Missouri, and Michigan, for the years 2004 through 2010. Our subsidiary, HCLB, entered into2012.
14. Stockholders’ Equity
Repurchase in Connection with Offering of 1.125% Cash Convertible Senior Notes Due 2020. Subsequent to December 31, 2012, we used a closing agreementportion of the net proceeds from the offering to repurchase $50 million of our common stock in negotiated transactions with institutional investors in the offering, concurrently with the IRSpricing of the offering. On February 12, 2013, we repurchased a total of 1,624,959 shares at $30.77 per share, which was our closing stock price on that date.
Securities Repurchases and Repurchase Programs. Effective as of February 13, 2013, our board of directors authorized the repurchase of $75 million in aggregate of either our common stock or our convertible senior note due 2014. The repurchase program extends through December 2009 that successfully concluded with certainty the IRS examination of HCLB for the year ended May 2006.31, 2014.
Effective as of October 26, 2011, our board of directors authorized the repurchase of $75 million in aggregate of either our common stock or our convertible senior notes due 2014 (see Note 12, “Long-Term Debt”). The repurchase program expired October 25, 2012. No securities were purchased under this program in 2012.
In connection with the offering, we granted the underwriters an overallotment optionJuly 2011, our board of directors approved a stock repurchase program of up to $7.0 million, to be used to purchase up to 350,000 shares, and the single selling stockholder, the Molina Siblings Trust, granted the underwriters an option to purchase up to 250,000 shares. The overallotment option was subsequently exercised in August 2010. Our chief financial officer, John Molina, is the trustee of the Molina Siblings Trust, with sole voting and investment power. Dr. J. Mario Molina, our president and chief executive officer and the brother of John Molina, is a beneficiary of the Molina Siblings Trust, as is John Molina and each of his other three siblings.
101
under a Rule 10b5-1 trading plan. Under the purchasethis program, described in Note 12, “Long-Term Debt,” we purchased approximately 1.4 million400,000 shares of our common stock for $27.7$7.0 million (average cost of approximately $20.49$17.47 per share) during 2009.August 2011. These purchases increaseddid not materially impact diluted earnings per share for the year ended December 31, 2009 by $0.04. In 2009,2011. Subsequently, we retired the $27.7$7.0 million of treasury shares purchased, in 2009, and we also retired $20.4 million of treasury shares that were purchased prior to 2009 ($48.1 million in aggregate), which reduced additional paid-in capital.capital as of December 31, 2011.
Shelf Registration Statement.In May 2012, we filed an automatic shelf registration statement on Form S-3 with the Securities and Exchange Commission covering the issuance of an indeterminate number of our securities, including common stock, warrants, or debt securities. We may publicly offer securities from time to time at prices and terms to be determined at the time of the offering.
Stock Split. On April 27, 2011, we announced that our board of directors authorized a 3-for-2 stock split of our common stock to be effected in the form of a stock dividend of one share of our stock for every two shares outstanding. The dividend was distributed on May 20, 2011.
101
Stock Plans. In connection with the plans described in Note 16, “Share-Based Compensation,” we issued approximately 1,057,000 shares of common stock, net of shares used to settle employees’ income tax obligations, for the year ended December 31, 2012. Stock plan activity resulted in a $19.5 million increase to additional paid-in capital for the same period.
15. Employee Benefits
We sponsor a defined contribution 401(k) plan that covers substantially all full-time salaried and hourly employees of our company and its subsidiaries. Eligible employees are permitted to contribute up to the maximum amount allowed by law. We match up to the first 4% of compensation contributed by employees. Expense recognized in connection with our contributions to the 401(k) plan totaled $5.9$10.7 million $4.7, $8.5 million and $3.9$5.9 million in the years ended December 31, 2010, 2009,2012, 2011, and 2008,2010, respectively.
We also have a nonqualified deferred compensation plan for certain key employees. Under this plan, eligible participants may defer up to 100% of their base salary and 100% of their bonus to provide tax-deferred growth for retirement. The funds deferred are invested in corporate-owned life insurance, under a rabbi trust.
16. Share-Based Compensation
In 2002,2011, we adopted the 20022011 Equity Incentive Plan (the “2002“2011 Plan”), which provides for the award of stock options, restricted stock,shares and units, performance shares and units, and stock bonuses to the company’s officers, employees, directors, consultants, advisors, and other service providers. The 20022011 Plan initially allowedallows for the issuance of 1.64.5 million shares of common stock. Beginning January 1, 2004,
At December 31, 2012, we had equity incentives outstanding under two plans: (1) the 2011 Plan; and (2) the 2002 Equity Incentive Plan (from which equity incentives are no longer awarded). In March 2012, our chief executive officer, chief financial officer, and chief operating officer were awarded 94,050 performance units, 53,236 performance units, and 30,167 performance units, respectively, that would vest and be settled in shares eligibleof the Company's common stock equal in number to the units awarded upon the achievement of certain performance and service conditions as follows: (i) the Company’s total operating revenue for issuance automatically increase2012 is equal to or greater than $5.5 billion, and (ii) the respective officer continues to be employed by the lesserCompany if and when the operating revenue target is met. Such awards vested when the performance and service conditions were met in December 2012. Also in March 2012, our chief executive officer, chief financial officer, chief operating officer, and chief accounting officer were awarded 8,000 performance units, 8,000 performance units, 8,000 performance units, and 3,000 performance units respectively, that would vest and be settled in shares of 400,000 shares or 2%the Company's common stock equal in number to the units granted upon the certification of total outstanding capital stock on a fully diluted basis, unlessour Idaho MMIS by CMS. Such awards vested when the board of directors affirmatively acts to nullify the automatic increase. There were 4.4 million shares reserved for issuance under the 2002 Plan as of January 1, 2010.
Idaho MMIS was certified in July 2012.
Restricted stockshare awards are granted with a fair value equal to the market price of our common stock on the date of grant, and generally vest in equal annual installments over periods up to four years from the date of grant. Stock option awards have an exercise price equal to the fair market value of our common stock on the date of grant, generally vest in equal annual installments over periods up to four years from the date of grant, and have a maximum term of ten years from the date of grant.
Under our 2002 Employee Stock Purchase Planemployee stock purchase plan (the “ESPP”), eligible employees may purchase common shares at 85% of the lower of the fair market value of our common stock on either the first or last trading day of each six-month offering period. Each participant is limited to a maximum purchase of $25,000$25,000 (as measured by the fair value of the stock acquired) per year through payroll deductions. Under the ESPP, weWe issued 109,800277,400 and 120,300201,700 shares of our common stock under the ESPP during the years ended December 31, 20102012 and 2009,2011, respectively. Beginning January 1, 2004, and each year until the 2.2 million maximum aggregate number of shares reserved for issuance was reached on December 31, 2008, shares available for issuance under theIn 2011, stockholders approved our 2011 ESPP, automatically increased by 1% of total outstanding capital stock. The aggregate number of unissued common shares available for future grants underwhich superseded the 2002 Plan andEmployee Stock Purchase Plan. The 2011 ESPP allows for the ESPP combined was 3.7issuance of three million as shares of December 31, 2010, and 3.8 million as of December 31, 2009.
102
common stock.
The following table illustrates the components of our stock-basedshare-based compensation expense that are reported in general and administrative expenses in the consolidated statements of income:
| Year Ended December 31, | ||||||||||||||||||||||||
| 2010 | 2009 | 2008 | ||||||||||||||||||||||
| Pretax | Net-of-Tax | Pretax | Pretax | Pretax | Net-of-Tax | |||||||||||||||||||
| Charges | Amount | Charges | Charges | Charges | Amount | |||||||||||||||||||
| Restricted stock awards | $ | 8,007 | $ | 5,044 | $ | 5,789 | $ | 3,589 | $ | 5,171 | $ | 3,206 | ||||||||||||
| Stock options (including expense relating to our ESPP) | 1,524 | 960 | 1,696 | 1,052 | 2,640 | 1,637 | ||||||||||||||||||
| Total | $ | 9,531 | $ | 6,004 | $ | 7,485 | $ | 4,641 | $ | 7,811 | $ | 4,843 | ||||||||||||
| Year Ended December 31, | |||||||||||||||||||||||
| 2012 | 2011 | 2010 | |||||||||||||||||||||
| (In thousands) | |||||||||||||||||||||||
Pretax Charges | Net-of-Tax Amount | Pretax Charges | Net-of-Tax Amount | Pretax Charges | Net-of-Tax Amount | ||||||||||||||||||
| Restricted share and performance unit awards | $ | 18,106 | $ | 12,943 | $ | 15,914 | $ | 9,946 | $ | 8,007 | $ | 5,044 | |||||||||||
| Stock options (including expense relating to our ESPP) | 1,912 | 1,613 | 1,138 | 712 | 1,524 | 960 | |||||||||||||||||
| $ | 20,018 | $ | 14,556 | $ | 17,052 | $ | 10,658 | $ | 9,531 | $ | 6,004 | ||||||||||||
102
As of December 31, 2010,2012, there was $12.5$15.1 million of total unrecognized compensation costexpense related to unvested restricted stockshare awards, which we expect to recognize over a remaining weighted-average period of 2.5 years.2.1 years. This unrecognized compensation cost assumes an estimated forfeiture rate of 7.8%7.5% as of December 31, 2010.2012. Also as of December 31, 2009,2012, there was $0.2$0.1 million of unrecognized compensation expense related to unvested stock options, which we expect to recognize over a weighted-average period of 0.32.1 years.
Restricted share activity for the year ended December 31, 2012 is summarized below:
| Shares | Weighted Average Grant Date Fair Value | |||||
| Unvested balance as of December 31, 2011 | 1,435,882 | $ | 18.97 | |||
| Granted | 511,557 | 31.71 | ||||
| Vested | (786,135 | ) | 20.49 | |||
| Forfeited | (174,727 | ) | 22.53 | |||
| Unvested balance as of December 31, 2012 | 986,577 | 23.74 | ||||
The total fair value of restricted shares and performance shares granted during the year ended December 31, 2012, 2011, and 2010 was $16.2 million, $18.4 million, and $12.7 million, respectively. The total fair value of restricted shares vested during the yearsyear ended December 31, 2010, 2009,2012, 2011, and 20082010 was $6.4$25.4 million $3.2, $12.2 million, and $2.5$6.4 million, respectively. Unvested
Performance and restricted stockunit activity for the year ended December 31, 2010 was as follows:2012 is summarized below:
| Weighted- | ||||||||
| Average Grant Date | ||||||||
| Shares | Fair Value | |||||||
| Unvested balance as of December 31, 2009 | 687,630 | $ | 24.64 | |||||
| Granted | 554,475 | $ | 22.95 | |||||
| Vested | (271,381 | ) | $ | 25.95 | ||||
| Forfeited | (134,975 | ) | $ | 23.26 | ||||
| Unvested balance as of December 31, 2010 | 835,749 | $ | 23.32 | |||||
| Shares | Weighted Average Grant Date Fair Value | Aggregate Intrinsic Value | Weighted Average Remaining Contractual term | |||||||||
| (In thousands) | (Years) | |||||||||||
| Outstanding as of December 31, 2011 | — | $ | — | |||||||||
| Granted | 213,022 | 33.59 | ||||||||||
| Vested | (210,880 | ) | 33.58 | $ | 6,066 | |||||||
| Outstanding as of December 31, 2012 | 2,142 | 35.01 | $ | 58 | 0.2 | |||||||
| Performance and restricted units expected to vest as of December 31, 2012 | 2,142 | 35.01 | $ | 58 | 0.2 | |||||||
The total intrinsicfair value of stock options exercisedperformance and restricted units granted during the year ended December 31, 20102012 was $0.3 million.$7.2 million No stock optionsperformance or restricted units were exercised during the year ended December 31, 2009; the total intrinsic value of stock options exercised during the year ended December 31, 2008 was nominal. granted or vested in 2011 and 2010.
Stock option activity for the year ended December 31, 2010 was as follows:
| Weighted- | ||||||||||||||||
| Weighted- | Average | Aggregate | ||||||||||||||
| Average | Remaining | Intrinsic | ||||||||||||||
| Number | Exercise | Contractual | Value | |||||||||||||
| of Options | Price | Term (Years) | (000s) | |||||||||||||
| Outstanding at December 31, 2009 | 650,739 | $ | 30.25 | |||||||||||||
| Exercised | (64,662 | ) | $ | 24.16 | ||||||||||||
| Forfeited | (72,463 | ) | $ | 33.24 | ||||||||||||
| Outstanding at December 31, 2010 | 513,614 | $ | 30.59 | 4.9 | $ | 528 | ||||||||||
| Exercisable and expected to vest at December 31, 2010 | 512,381 | $ | 30.59 | 4.9 | $ | 528 | ||||||||||
| Exercisable at December 31, 2010 | 468,564 | $ | 30.47 | 4.7 | $ | 528 | ||||||||||
103
2012MOLINA HEALTHCARE, INC.
is summarized below:
is summarized below:
| Shares | Weighted Average Exercise Price | Aggregate Intrinsic Value | Weighted Average Remaining Contractual term | |||||||||
| (In thousands) | (Years) | |||||||||||
| Stock options outstanding as of December 31, 2011 | 553,049 | $ | 20.91 | |||||||||
| Granted | 15,000 | 34.82 | ||||||||||
| Exercised | (153,238 | ) | 18.27 | |||||||||
| Forfeited | (750 | ) | 22.37 | |||||||||
| Stock options outstanding as of December 31, 2012 | 414,061 | 22.39 | $ | 2,204 | 3.3 | |||||||
| Stock options exercisable and expected to vest as of December 31, 2012 | 414,061 | 22.39 | $ | 2,204 | 3.3 | |||||||
| Exercisable as of December 31, 2012 | 399,061 | 21.93 | $ | 2,204 | 3.1 | |||||||
103
The weighted-average grant date fair value per share of the sole stock option awarded during 2012 was $13.97. To determine this fair value we applied a risk-free interest rate of 1.1%, expected volatility of 43.0%, an expected option life of 6 years, and expected dividend yield of 0%. No stock options were granted in 2011 or 2010. The following is a summary of information about stock options outstanding and exercisable at December 31, 2010:2012:
| Options Outstanding | Options Exercisable | |||||||||||||||||||
| Weighted- | ||||||||||||||||||||
| Average | Weighted- | Weighted- | ||||||||||||||||||
| Remaining | Average | Average | ||||||||||||||||||
| Number | Contractual | Exercise | Number | Exercise | ||||||||||||||||
Range of Exercise Prices | Outstanding | Life (Years) | Price | Exercisable | Price | |||||||||||||||
| $16.98 - $28.66 | 243,889 | 4.1 | $ | 26.13 | 243,889 | $ | 28.66 | |||||||||||||
| $29.17 - $32.58 | 174,950 | 6.0 | $ | 31.33 | 135,200 | $ | 31.23 | |||||||||||||
| $33.56 - $44.29 | 94,775 | 4.7 | $ | 40.71 | 89,475 | $ | 39.73 | |||||||||||||
| 513,614 | 468,564 | |||||||||||||||||||
| Options Outstanding | Options Exercisable | ||||||||||||||
| Range of Exercise Prices | Number Outstanding | Weighted- Average Remaining Contractual Life (Years) | Weighted- Average Exercise Price | Number Exercisable | Weighted- Average Exercise Price | ||||||||||
| $16.89 – $19.11 | 137,161 | 2.5 | $ | 18.46 | 137,161 | $ | 18.46 | ||||||||
| $20.88 | 148,500 | 4.1 | 20.88 | 148,500 | 20.88 | ||||||||||
| $22.86 – $34.82 | 128,400 | 3.3 | 28.35 | 113,400 | 27.49 | ||||||||||
| 414,061 | 399,061 | ||||||||||||||
17. Related Party Transactions
On February 27, 2013, we entered into a lease (the “Lease”) with 6th & Pine Development, LLC (the “Landlord”) for office space located in Long Beach, California. The lease consists of two office buildings as follows:
an existing building, which comprises approximately 70,000 square feet of office space, and
a new building, which is expected to comprise approximately 120,000 square feet of office space.
The term of the Lease with respect to the existing building is expected to commence on June 1, 2013, and the term of the Lease with respect to the new building is expected to commence on November 1, 2014. The initial term of the Lease with respect to both buildings expires on December 31, 2024, subject to two options to extend the term for a period of five years each. Initial annual rent for the existing building is expected to be approximately $2.5 million and initial annual rent for the new building is expected to be approximately $4.0 million. Rent will increase 3.75% per year through the initial term. Rent during the extension terms will be the greater of then-current rent or fair market rent.
The principal members of the Landlord are John C. Molina, the Chief Financial Officer and a director of the Company, and his wife. In addition, in connection with the development of the buildings being leased, the Landlord has pledged shares of common stock in the Company he holds as trustee. Dr. J. Mario Molina, the Company's Chief Executive Officer and Chairman of the Board of Directors, holds a partial interest in such shares as trust beneficiary.
We have an equity investment in a medical service provider that provides certain vision services to our members. We account for this investment under the equity method of accounting because we have an ownership interest in the investee that confers significant influence over operating and financial policies of the investee. As of For both years ended December 31, 2010,2012, and 2009,2011 our carrying amount for this investment totaled $4.4amounted to $3.9 million and $4.1 million, respectively.. For the years ended December 31, 2010, 20092012, 2011, and 2008,2010, we paid $22.0$28.4 million $21.8, $24.3 million, and $15.4$22.0 million, respectively, for medical service fees to this provider.
We are a party to afee-for-service agreement with Pacific Hospital of Long Beach, (“or Pacific Hospital”). Until October 2010,Hospital. Pacific Hospital wasis owned by Abrazos Healthcare, Inc., Until October 12, 2010, the majority of the shares of which areAbrazos Healthcare, Inc. were held as community property by the husband of Dr. Martha Bernadett and her husband. Dr. Martha Bernadett is the sister of Dr.Joseph M. Molina, M.D. (Dr. J. Mario Molina,Molina), our Chief Executive Officer, and John Molina, our Chief Financial Officer. AmountsOn October 12, 2010, Dr. Bernadett and her husband sold their shares in Abrazos Healthcare, Inc., terminating our related party relationship with Pacific Hospital. Under the terms of this fee-for-service agreement we paid to Pacific Hospital$0.8 millionfor the period from January 1, 2010 to October 12, 2010.
On December 26, 2012, we purchased 110,988 shares of our common stock from certain Molina family trusts for an aggregate purchase price of $3.0 million. This purchase transaction was approved by our board of directors. The shares were purchased at a price of $27.03, representing the closing price per share of our common stock on December 26, 2012. The shares were purchased from the Janet M. Watt Separate Property Trust dated 10/22/2007, or the Separate Property Trust, and the Watt Family Trust dated 10/11/1996, or the Family Trust. Janet M. Watt is the sister, and her husband Lawrence B. Watt is the brother-in-law, of Dr. J. Mario Molina and John Molina. Ms. Watt is the sole trustee of the Separate Property Trust, and a co-trustee with Lawrence B. Watt of the Family Trust.
104
18. Variable Interest Entities
Joseph M. Molina M.D., Professional Corporations
Our wholly owned subsidiary, American Family Care, Inc., or AFC, operates our primary care clinics. In 2012, AFC entered into services agreements with theJoseph M. Molina, M.D. Professional Corporations, or JMMPC. JMMPC was created to further advance our direct delivery line of business. Its sole shareholder is Dr. J. Mario Molina, our Chairman of the Board, President and Chief Executive Officer. Dr. Molina is paid no salary and receives no dividends in connection with his work for, or ownership of, JMMPC. Under the services agreements, AFC provides the clinic facilities, clinic administrative support staff, patient scheduling services and medical supplies to JMMPC, and JMMPC provides outpatient professional medical services to the general public for routine non-life threatening, outpatient health care needs. While JMMPC may provide services to the general public, substantially all of the individuals served by JMMPC are members of our health plans. JMMPC does not have agreements to provide professional medical services with any other entities. In addition to the services agreements with AFC, JMMPC has entered into affiliation agreements with us. Under these agreements, we have agreed to fund JMMPC's operating deficits, or receive JMMPC's operating surpluses, based on a monthly reconciliation such that JMMPC will operate at break even and derive no profit.
We have determined that JMMPC is a variable interest entity, or VIE, and that we are its primary beneficiary. We have reached this conclusion under the power and benefits criterion model according to U.S. generally accepted accounting principles. Specifically, we have the power to direct the activities that most significantly affect JMMPC's economic performance, and the obligation to absorb losses or right to receive benefits that are potentially significant to the VIE, under the services and affiliation agreements described above. Because we are its primary beneficiary, we have consolidated JMMPC. JMMPC's assets may be used to settle only JMMPC's obligations, and JMMPC's creditors have no recourse to the general credit of Molina Healthcare, Inc. As of December 31, 2012, JMMPC had total assets of $1.4 million, comprising primarily cash and equivalents, and total liabilities of $1.1 million, comprising primarily accrued payroll and employee benefits.
Our maximum exposure to loss as a result of our involvement with this entity is equal to the amounts needed to fund JMMPC's ongoing payroll and employee benefits. We believe that such loss exposure will be immaterial to our consolidated operating results and cash flows for the foreseeable future. For the year ended December 31, 2012, we provided an initial cash infusion of $0.3 million to JMMPC in the first quarter of 2012 to fund its start-up operations. During 2012 our health plans received $0.2 million from JMMPC under the terms of thisthe affiliation agreement.
New Markets Tax Credit
In the fourth quarter of 2011, as a result of a series of simultaneous financing transactions, Wells Fargo contributed capital of $5.9 million to the Investment Fund, and Molina Healthcare, Inc. loaned the principal amount of $15.5 million to the Investment Fund. The Investment Fund then contributed the proceeds to certain CDEs, which, in turn, loaned the proceeds of $20.9 million to our New Mexico data center subsidiary. Wells Fargo will be entitled to claim the NMTC while we effectively received net loan proceeds equal to Wells Fargo's contribution to the Investment Fund, or approximately $5.9 million. Additionally, financing costs incurred in structuring the arrangement amounting to $1.2 million were $1.0deferred and will be recognized as expense over the term of the loans. This transaction also includes a put/call feature that becomes enforceable at the end of the seven-year compliance period. Wells Fargo may exercise its put option or we can exercise the call, both of which will serve to transfer the debt obligation to us. Incremental costs to maintain the structure during the compliance period will be recognized as incurred.
We have determined that the financing arrangement with Investment Fund and CDEs is a VIE, and that we are the primary beneficiary of the VIE. We reached this conclusion based on the following:
The ongoing activities of the VIE-collecting and remitting interest and fees and NMTC compliance-were all considered in the initial design and are not expected to significantly affect economic performance throughout the life of the VIE;
105
Contractual arrangements obligate us to comply with NMTC rules and regulations and provide various other guarantees to Investment Fund and CDEs;
Wells Fargo lacks a material interest in the underling economics of the project; and
We are obligated to absorb losses of the VIE.
Because we are the primary beneficiary of the VIE, we have included it in our consolidated financial statements. Wells Fargo's contribution of $5.9 million $0.7 million, and $0.2 million, for the years ended is included in cash at December 31, 2010, 20092012 and 2008, respectively. the offsetting Wells Fargo's interest in the financing arrangement is included in other liabilities in the accompanying consolidated balance sheets.
As of October 2010, Pacific Hospital is no longer owned by Abrazos Healthcare, Inc.described above, this transaction also includes a put/call provision whereby we may be obligated or any other related partyentitled to repurchase Wells Fargo's interest in the Investment Fund. The value attributed to the Company.put/call is nominal. The NMTC is subject to 100% recapture for a period of seven years as provided in the Internal Revenue Code and applicable U.S. Treasury regulations. We are required to be in compliance with various regulations and contractual provisions that apply to the NMTC arrangement. Non-compliance with applicable requirements could result in Wells Fargo's projected tax benefits not being realized and, therefore, require us to indemnify Wells Fargo for any loss or recapture of NMTCs related to the financing until such time as the recapture provisions have expired under the applicable statute of limitations. We do not anticipate any credit recaptures will be required in connection with this arrangement.
19. Commitments and Contingencies
Leases
We lease office space, clinics,administrative and clinic facilities and certain equipment and automobiles under agreements that expirenon-cancelable operating leases expiring at various dates through 2018.2021. Facility lease terms generally range from five to ten years with one to two renewal options for extended terms. In most cases, we are required to make additional payments under facility operating leases for taxes, insurance and other operating expenses incurred during the lease period. Certain of our leases contain rent escalation clauses or lease incentives, including rent abatements and tenant improvement allowances. Rent escalation clauses and lease incentives are taken into account in determining total rent expense to be recognized during the lease term. Future minimum lease payments by year and in the aggregate under all non-cancelable operating leases consist of the following approximate amounts:
Year ending December 31, | ||||
| (In thousands) | ||||
| 2011 | $ | 28,004 | ||
| 2012 | 23,794 | |||
| 2013 | 20,349 | |||
| 2014 | 17,366 | |||
| 2015 | 13,671 | |||
| Thereafter | 30,622 | |||
| Total minimum lease payments | $ | 133,806 | ||
| (In thousands) | |||
| 2013 | $ | 26,866 | |
| 2014 | 21,420 | ||
| 2015 | 14,808 | ||
| 2016 | 8,472 | ||
| 2017 | 6,939 | ||
| Thereafter | 7,771 | ||
| Total minimum lease payments | $ | 86,276 | |
Rental expense related to these leases amounted to $25.1$20.5 million $20.8, $23.1 million, and $17.5$25.1 million for the years ended December 31, 2010, 2009,2012, 2011, and 2008,2010, respectively.
104
Employment Agreements
In 2002 we entered into employment agreements with our Chief Executive Officer and Chief Financial Officer, which have been amended and restated as of December 31, 2009. These employment agreements had initial terms of one to three years and are subject to automatic one-year extensions thereafter. Should the executives be terminated without cause or resign for good reason before a change of control, as defined, we will pay one year’s base salary and termination bonus, as defined, in addition to full vesting of 401(k) employer contributions and stock-based awards, and a cash sum equal in value to health and welfare benefits provided for 18 months.months. If the executives are terminated for cause, no further payments are due under the contracts.
If termination occurs within two years following a change of control, the executives will receive two times their base salary and termination bonus, in addition to full vesting of 401(k) employer contributions and stock-based awards, and a cash sum equal in value to health and welfare benefits provided for three years.
Legal Proceedings
106
The health care and business process outsourcing industries are subject to numerous laws and regulations of federal, state, and local governments. Compliance with these laws and regulations can be subject to government review and interpretation, as well as regulatory actions unknown and unasserted at this time. Penalties associated with violations of these laws and regulations include significant fines and penalties, exclusion from participating in publicly funded programs, and the repayment of previously billed and collected revenues.
We are involved in legal actions in the ordinary course of business, some of which seek monetary damages, including claims for punitive damages, which are not covered by insurance. We have accrued liabilities for certain matters for which we deem the loss to be both probable and estimable. Although we believe that our estimates of such losses are reasonable, these estimates could change as a result of further developments of these matters. The outcome of such legal actions is inherently uncertain. Nevertheless, we believe thatuncertain and such pending matters for which accruals have not been established have not progressed sufficiently through discovery and/or development of important factual information and legal issues to enable us to estimate a range of possible loss, if any. While it is not possible to accurately predict or determine the eventual outcomes of these actions, when finally concluded and determined, are not likely toitems, an adverse determination in one or more of these pending matters could have a material adverse effect on our consolidated financial position, results of operations, or cash flows.
Professional Liability Insurance
We carry medical professional liability insurance for health care services rendered through our clinics in California, Florida, New Mexico, Virginia, and Washington. Claims-made coverage under the policies for California and Washington is $1.0 million per occurrence with an annual aggregate limit of $3.0 million for Washington, beginning in 2010, and for California, each of the years ended December 31, 2010, 2009 and 2008. Claims-made coverage under the Virginia policy is $2.0 million per occurrence with an annual aggregate limit of $6.0 million for each of the years ended December 31, 2010 and 2009, and beginning July 1, 2008. We also carry claims-made managed care errors and omissions professional liability insurance for our health plan operations. This insurance is subject to a coverage limit of $15.0 million per occurrence and $15.0 million in the aggregate for each policy year.
Provider Claims
Many of our medical contracts are complex in nature and may be subject to differing interpretations regarding amounts due for the provision of various services. Such differing interpretations may leadhave led certain medical providers to pursue us for additional compensation. The claims made by providers in such circumstances often involve issues of contract compliance, interpretation, payment methodology, and intent. These claims often extend to services provided by the providers over a number of years.
Various providers have contacted us seeking additional compensation for claims that we believe to have been settled. These matters, when finally concluded and determined, will not, in our opinion, have a material adverse effect on our business, consolidated financial position, results of operations, or cash flows.
105
Regulatory Capital and Dividend Restrictions
The National Association of Insurance Commissioners, or NAIC, adopted rules effective December 31, 1998, which, if implemented by the states, set minimum capitalization requirements for insurance companies, HMOs, and other entities bearing risk for health care coverage. The requirements take the form of risk-based capital, (RBC)or RBC, rules. Michigan, Missouri, New Mexico, Ohio, Texas, Utah, Washington, and Wisconsin have adopted these rules, which may vary from state to state. California and Florida have not yet adopted NAIC risk-based capital requirements for HMOs and have not formally given notice of their intention to do so. Such requirements, if adopted by California and Florida, may increase the minimum capital required for those states.
As ofDecember 31, 2010,2012, our health plans had aggregate statutory capital and surplus of approximately $416.6$557.9 millioncompared with the required minimum aggregate statutory capital and surplus of approximately $278.0$345.7 million. All of our HMOshealth plans were in compliance with the minimum capital requirements at December 31, 2010.2012. We have the ability and commitment to provide additional capital to each of our health plans when necessary to ensure that statutory capital and surplus continue to meet regulatory requirements.
Receivable/Liability for Ceded Life and Annuity Contracts
Prior to February 17, 2012, we reported a 100% ceded reinsurance arrangement for life insurance policies written and held by our then wholly owned insurance subsidiary, Molina Healthcare Insurance Company, by recording a non-current receivable
107
from the reinsurer with a corresponding non-current liability for ceded life and annuity contracts. Effective February 17, 2012, we sold Molina Healthcare Insurance Company. The transaction resulted in the elimination of both the noncurrent receivable and liability for ceded life and annuity contracts, each amounting to $23.4 million as of December 31, 2011. Additionally, we recorded a gain of approximately $1.7 million to general and administrative expenses in the first quarter of 2012 upon closing of the transaction.
Molina Healthcare Insurance Company is now named Catamaran Insurance of Ohio, or Catamaran. In the event that both the reinsurer and Catamaran are unable to pay benefit on policies that were in-force as of the sale date, we remain ultimately liable for payment of such benefits. Because we no longer own Catamaran, we no longer have access to its financial records; therefore, the maximum amount of potential future payments is not determinable. We believe the possibility of our having to pay such benefits is remote, and no provision for the payment of such benefits is included in our consolidated financial statements.
20. Segment Reporting
We report our financial performance based on two reportable segments: Health Plans and Molina Medicaid Solutions. Our reportable segments are consistent with how we manage the business and view the markets we serve. InOur Health Plans segment consists of our state health plans which serve Medicaid populations in nine states, subsequent to the second quartertermination of 2010, weour Medicaid contract in Missouri effective June 30, 2012, and also includes our smaller direct delivery line of business. Our state health plans represent operating segments that have been aggregated for reporting purposes because they share similar economic characteristics.
Our Molina Medicaid Solutions segment provides design, development, implementation; business process outsourcing solutions; hosting services; and information technology support services to Medicaid agencies in an additional five states. The Molina Medicaid Solutions segment was added a segment to our internal financial reporting structure as a resultwhen we acquired this business in the second quarter of the acquisition of Molina Medicaid Solutions described in Note 4, “Business Combinations.” We now report our financial performance based on the following two reportable segments — Health Plans and Molina Medicaid Solutions. The Health Plans segment represents our former single-segment health plan operations. The Molina Medicaid Solutions segment represents the operations of our new MMIS solutions business.2010.
We rely on an internal management reporting process that provides segment information to the operating income level for purposes of making financial decisions and allocating resources. The accounting policies of the segments are the same as those described in Note 2, “Significant Accounting Policies.” The cost of services shared
106
between the Health Plans and Molina Medicaid Solutions segments is charged to the Health Plans segment.
Molina Medicaid Solutions was acquired on May 1, 2010; therefore, the year ended December 31, 2010 includes only eight months of operating results for this segment. Operating segment revenues and profitability wereinformation is as follows:
| Molina | ||||||||||||
| Medicaid | ||||||||||||
| Health Plans | Solutions | Total | ||||||||||
| (In thousands) | ||||||||||||
Year ended December 31, 2010 | ||||||||||||
| Premium revenue | $ | 3,989,909 | $ | — | $ | 3,989,909 | ||||||
| Service revenue | — | 89,809 | 89,809 | |||||||||
| Investment income | 6,259 | — | 6,259 | |||||||||
| Total revenue | $ | 3,996,168 | $ | 89,809 | $ | 4,085,977 | ||||||
| Operating income | $ | 102,392 | $ | 2,609 | $ | 105,001 | ||||||
Year ended December 31, 2009 | ||||||||||||
| Premium revenue | $ | 3,660,207 | $ | — | $ | 3,660,207 | ||||||
| Service revenue | — | — | — | |||||||||
| Investment income | 9,149 | — | 9,149 | |||||||||
| Total revenue | $ | 3,669,356 | $ | — | $ | 3,669,356 | ||||||
| Operating income | $ | 51,934 | $ | — | $ | 51,934 | ||||||
Year ended December 31, 2008 | ||||||||||||
| Premium revenue | $ | 3,091,240 | $ | — | $ | 3,091,240 | ||||||
| Service revenue | — | — | — | |||||||||
| Investment income | 21,126 | — | 21,126 | |||||||||
| Total revenue | $ | 3,112,366 | $ | — | $ | 3,112,366 | ||||||
| Operating income | $ | 107,555 | $ | — | $ | 107,555 | ||||||
108
| Year Ended December 31, | |||||||||||
| 2012 | 2011 | 2010 | |||||||||
| (In thousands) | |||||||||||
| Segment Information: | |||||||||||
| Revenue: | |||||||||||
| Health Plans: | |||||||||||
| Premium revenue | $ | 5,826,491 | $ | 4,603,407 | $ | 3,989,909 | |||||
| Investment income | 5,188 | 5,539 | 6,259 | ||||||||
| Rental income | 9,374 | 547 | — | ||||||||
| Molina Medicaid Solutions: | |||||||||||
| Service revenue | 187,710 | 160,447 | 89,809 | ||||||||
| $ | 6,028,763 | $ | 4,769,940 | $ | 4,085,977 | ||||||
| Depreciation and amortization: | |||||||||||
| Health Plans | $ | 58,577 | $ | 45,734 | $ | 42,282 | |||||
| Molina Medicaid Solutions | 20,187 | 28,649 | 18,483 | ||||||||
| $ | 78,764 | $ | 74,383 | $ | 60,765 | ||||||
| Operating Income: | |||||||||||
| Health Plans | $ | 11,746 | $ | 78,110 | $ | 102,392 | |||||
| Molina Medicaid Solutions | 23,727 | 2,063 | 2,609 | ||||||||
| Total operating income | 35,473 | 80,173 | 105,001 | ||||||||
| Interest expense | (16,769 | ) | (15,519 | ) | (15,509 | ) | |||||
| Other income | 361 | — | — | ||||||||
| Income before income taxes | $ | 19,065 | $ | 64,654 | $ | 89,492 | |||||
| Year Ended December 31, | ||||||||||||
| 2010 | 2009 | 2008 | ||||||||||
| (In thousands) | ||||||||||||
| Segment operating income | $ | 105,001 | $ | 51,934 | $ | 107,555 | ||||||
| Interest expense | (15,509 | ) | (13,777 | ) | (13,231 | ) | ||||||
| Income before income taxes | $ | 89,492 | $ | 38,157 | $ | 94,324 | ||||||
| As of December 31, | |||||||
| 2012 | 2011 | ||||||
| (In thousands) | |||||||
| Goodwill and intangible assets, net: | |||||||
| Health Plans | $ | 139,710 | $ | 159,963 | |||
| Molina Medicaid Solutions | 89,089 | 95,787 | |||||
| $ | 228,799 | $ | 255,750 | ||||
| Total assets: | |||||||
| Health Plans | $ | 1,702,212 | $ | 1,429,283 | |||
| Molina Medicaid Solutions | 232,610 | 222,863 | |||||
| $ | 1,934,822 | $ | 1,652,146 | ||||
21. Quarterly Results of Operations (Unaudited)
| Molina | ||||||||||||
| Medicaid | ||||||||||||
| Health Plans | Solutions | Total | ||||||||||
| (In thousands) | ||||||||||||
| As of December 31, 2010 | $ | 1,333,599 | $ | 175,615 | $ | 1,509,214 | ||||||
| As of December 31, 2009 | $ | 1,244,035 | $ | — | $ | 1,244,035 | ||||||
107
The following is a summary of the quarterly results of operations for the years ended December 31, 20102012 and 2009.2011.
| For The Quarter Ended | ||||||||||||||||
| March 31, | June 30, | September 30, | December 31, | |||||||||||||
| 2010 | 2010 | 2010 | 2010 | |||||||||||||
| (In thousands) | ||||||||||||||||
| Premium revenue | $ | 965,220 | $ | 976,685 | $ | 1,005,115 | $ | 1,042,889 | ||||||||
| Service revenue | — | 21,054 | 32,271 | 36,484 | ||||||||||||
| Operating income | 20,438 | 21,178 | 29,953 | 33,432 | ||||||||||||
| Income before income taxes | 17,081 | 17,079 | 25,353 | 29,979 | ||||||||||||
| Net income | 10,590 | 10,579 | 16,173 | 17,628 | ||||||||||||
| Net income per share(1): | ||||||||||||||||
| Basic | $ | 0.41 | $ | 0.41 | $ | 0.58 | $ | 0.58 | ||||||||
| Diluted | $ | 0.41 | $ | 0.41 | $ | 0.57 | $ | 0.58 | ||||||||
109
| For The Quarter Ended | |||||||||||||||||||||||||||||||
| March 31, | June 30, | September 30, | December 31, | ||||||||||||||||||||||||||||
| 2009 | 2009 | 2009 | 2009 | For The Quarter Ended, | |||||||||||||||||||||||||||
| (In thousands) | March 31, 2012 | June 30, 2012 | September 30, 2012 | December 31, 2012 | |||||||||||||||||||||||||||
| (In thousands, except per-share data) | |||||||||||||||||||||||||||||||
| Premium revenue | $ | 857,484 | $ | 925,507 | $ | 914,805 | $ | 962,411 | $ | 1,327,449 | $ | 1,492,272 | $ | 1,488,718 | $ | 1,518,052 | |||||||||||||||
| Service revenue | — | — | — | — | 42,205 | 41,724 | 48,422 | 55,359 | |||||||||||||||||||||||
| Operating income (loss)(2) | 23,161 | 19,488 | 15,089 | (5,804 | ) | ||||||||||||||||||||||||||
| Income (loss) before income taxes(2) | 19,746 | 16,265 | 11,810 | (9,664 | ) | ||||||||||||||||||||||||||
| Operating income (loss) | 33,420 | (59,267 | ) | 7,187 | 54,133 | ||||||||||||||||||||||||||
| Income (loss) before income taxes | 29,122 | (63,075 | ) | 2,872 | 50,146 | ||||||||||||||||||||||||||
| Net income (loss) | 12,211 | 14,565 | 8,564 | (4,472 | ) | 18,089 | (37,306 | ) | 3,364 | 25,643 | |||||||||||||||||||||
| Net income (loss) per share(1),(3): | |||||||||||||||||||||||||||||||
| Net income (loss) per share (2): | |||||||||||||||||||||||||||||||
| Basic | $ | 0.46 | $ | 0.56 | $ | 0.34 | $ | (0.18 | ) | $ | 0.39 | $ | (0.80 | ) | $ | 0.07 | $ | 0.55 | |||||||||||||
| Diluted | $ | 0.46 | $ | 0.56 | $ | 0.33 | $ | (0.18 | ) | $ | 0.39 | $ | (0.80 | ) | $ | 0.07 | $ | 0.54 | |||||||||||||
| For The Quarter Ended, | |||||||||||||||
| March 31, 2011 | June 30, 2011 | September 30, 2011 | December 31, 2011(1) | ||||||||||||
| (In thousands, except per-share data) | |||||||||||||||
| Premium revenue | $ | 1,081,438 | $ | 1,128,770 | $ | 1,138,230 | $ | 1,254,969 | |||||||
| Service revenue | 36,674 | 36,888 | 37,728 | 49,157 | |||||||||||
| Operating income (loss) | 31,300 | 31,410 | 33,566 | (16,103 | ) | ||||||||||
| Income (loss) before income taxes | 27,697 | 27,727 | 29,186 | (19,956 | ) | ||||||||||
| Net income (loss) | 17,388 | 17,440 | 18,950 | (32,960 | ) | ||||||||||
| Net income (loss) per share (2): | |||||||||||||||
| Basic | $ | 0.38 | $ | 0.38 | $ | 0.41 | $ | (0.72 | ) | ||||||
| Diluted | $ | 0.38 | $ | 0.38 | $ | 0.41 | $ | (0.72 | ) | ||||||
| (1) | On February 17, 2012, the Division of Purchasing of the Missouri Office of Administration notified us that our Missouri health plan was not awarded a contract under the Missouri HealthNet Managed Care Request for Proposal; therefore, our Missouri health plan's existing contract with the state expired without renewal on June 30, 2012. In connection with this notification, we recorded a total non-cash impairment charge of $64.6 million in the fourth quarter of 2011, of which $6.1 million related to finite-lived intangible assets, and $58.5 million related to goodwill. The impairment charge comprised substantially all intangible assets relating to contract rights and licenses, and provider networks recorded at the time of our acquisition of the Missouri health plan in 2007. For the quarter ended December 31, 2011, the impairment charge reduced diluted earnings per share by $1.34. |
| (2) | Potentially dilutive shares issuable pursuant to our 2007 offering of convertible senior notes were not included in the computation of diluted net income per share because to do so would have been anti-dilutive for the years ended December 31, | |
108
22. Condensed Financial Information of Registrant
Following are our parent company only condensed balance sheets as of December 31, 20102012 and 2009,2011, and our condensed statements of income and condensed statements of cash flows for each of the three years in the period ended December 31, 2010.2012.
Condensed Balance Sheets
| December 31, | |||||||
| 2012 | 2011 | ||||||
| (Amounts in thousands, except per-share data) | |||||||
| ASSETS | |||||||
| Current assets: | |||||||
| Cash and cash equivalents | $ | 39,068 | $ | 14,650 | |||
| Investments | 2,015 | 2,010 | |||||
| Income tax refundable | 8,868 | 14,126 | |||||
| Deferred income taxes | 9,706 | 9,133 | |||||
| Due from affiliates | 55,382 | 60,569 | |||||
| Prepaid and other current assets | 19,164 | 10,467 | |||||
| Total current assets | 134,203 | 110,955 | |||||
| Property and equipment, net | 108,808 | 82,437 | |||||
| Goodwill | 52,302 | 53,769 | |||||
| Auction rate securities | 3,615 | 4,694 | |||||
| Investments in subsidiaries | 768,765 | 740,345 | |||||
| Advances to related parties and other assets | 34,600 | 32,473 | |||||
| $ | 1,102,293 | $ | 1,024,673 | ||||
| LIABILITIES AND STOCKHOLDERS' EQUITY | |||||||
| Liabilities: | |||||||
| Accounts payable and accrued liabilities | $ | 73,883 | $ | 71,392 | |||
| Long-term debt | 215,468 | 169,526 | |||||
| Deferred income taxes | 17,122 | 16,909 | |||||
| Other long-term liabilities | 13,506 | 11,773 | |||||
| Total liabilities | 319,979 | 269,600 | |||||
| Stockholders' equity: | |||||||
| Common stock, $0.001 par value; 80,000 shares authorized; outstanding: | |||||||
| 46,762 shares at December 31, 2012 and 45,815 shares at December 31, 2011 | 47 | 46 | |||||
| Preferred stock, $0.001 par value; 20,000 shares authorized, no shares issued and outstanding | — | — | |||||
| Paid-in capital | 285,524 | 266,022 | |||||
| Accumulated other comprehensive loss | (457 | ) | (1,405 | ) | |||
| Treasury stock, at cost; 111 shares at December 31, 2012 | (3,000 | ) | — | ||||
| Retained earnings | 500,200 | 490,410 | |||||
| Total stockholders' equity | 782,314 | 755,073 | |||||
| $ | 1,102,293 | $ | 1,024,673 | ||||
| December 31, | ||||||||
| 2010 | 2009 | |||||||
| (In thousands except per- share data) | ||||||||
ASSETS | ||||||||
Current assets: | ||||||||
| Cash and cash equivalents | $ | 57,020 | $ | 26,040 | ||||
| Investments | 2,000 | 3,002 | ||||||
| Income tax receivable | 1,928 | — | ||||||
| Deferred income taxes | 7,006 | — | ||||||
| Due from affiliates | 19,059 | 19,121 | ||||||
| Prepaid and other current assets | 11,009 | 11,435 | ||||||
| Total current assets | 98,022 | 59,598 | ||||||
| Property and equipment, net | 81,445 | 65,067 | ||||||
| Goodwill | 58,719 | 45,943 | ||||||
| Investments | 6,046 | 16,516 | ||||||
| Investment in subsidiaries | 702,096 | 545,731 | ||||||
| Advances to related parties and other assets | 16,397 | 16,742 | ||||||
| $ | 962,725 | $ | 749,597 | |||||
| LIABILITIES AND STOCKHOLDERS’ EQUITY | ||||||||
Current liabilities: | ||||||||
| Accounts payable and accrued liabilities | $ | 56,910 | $ | 24,577 | ||||
| Long-term debt | 164,014 | 158,900 | ||||||
| Deferred income taxes | 8,425 | 10,769 | ||||||
| Other long-term liabilities | 14,319 | 12,613 | ||||||
| Total liabilities | 243,668 | 206,859 | ||||||
Stockholders’ equity: | ||||||||
| Common stock, $0.001 par value; 80,000 shares authorized, outstanding 30,309 shares at December 31, 2010 and 25,607 shares at December 31, 2009 | 30 | 26 | ||||||
| Preferred stock, $0.001 par value; 20,000 shares authorized, no shares issued and outstanding | — | — | ||||||
| Paid-in capital | 251,627 | 129,902 | ||||||
| Accumulated other comprehensive loss | (2,192 | ) | (1,812 | ) | ||||
| Retained earnings | 469,592 | 414,622 | ||||||
| Total stockholders’ equity | 719,057 | 542,738 | ||||||
| $ | 962,725 | $ | 749,597 | |||||
109
Condensed Statements of Income
| Year Ended December 31, | ||||||||||||
| 2010 | 2009 | 2008 | ||||||||||
| (In thousands) | ||||||||||||
Revenue: | ||||||||||||
| Management fees and other operating revenue | $ | 238,883 | $ | 218,911 | $ | 190,538 | ||||||
| Investment income | 1,153 | 1,540 | 2,733 | |||||||||
| Total revenue | 240,036 | 220,451 | 193,271 | |||||||||
Expenses: | ||||||||||||
| Medical care costs | 30,582 | 26,865 | 21,759 | |||||||||
| General and administrative expenses | 218,834 | 160,792 | 143,709 | |||||||||
| Depreciation and amortization | 27,166 | 25,223 | 18,980 | |||||||||
| Total expenses | 276,582 | 212,880 | 184,448 | |||||||||
| Gain on purchase of convertible senior notes | — | 1,532 | — | |||||||||
| Operating (loss) income | (36,546 | ) | 9,103 | 8,823 | ||||||||
| Interest expense | (15,500 | ) | (13,770 | ) | (13,167 | ) | ||||||
| Loss before income taxes and equity in net income of subsidiaries | (52,046 | ) | (4,667 | ) | (4,344 | ) | ||||||
| Income tax benefit | (16,936 | ) | (3,755 | ) | (456 | ) | ||||||
| Net loss before equity in net income of subsidiaries | (35,110 | ) | (912 | ) | (3,888 | ) | ||||||
| Equity in net income of subsidiaries | 90,080 | 31,780 | 63,486 | |||||||||
| Net income | $ | 54,970 | $ | 30,868 | $ | 59,598 | ||||||
110
| Year Ended December 31, | |||||||||||
| 2012 | 2011 | 2010 | |||||||||
| (In thousands) | |||||||||||
| Revenue: | |||||||||||
| Management fees and other operating revenue | $ | 406,981 | $ | 308,287 | $ | 238,883 | |||||
| Investment income | 550 | 81 | 1,153 | ||||||||
| Total revenue | 407,531 | 308,368 | 240,036 | ||||||||
| Expenses: | |||||||||||
| Medical care costs | 33,102 | 31,672 | 30,582 | ||||||||
| General and administrative expenses | 367,606 | 272,302 | 218,834 | ||||||||
| Depreciation and amortization | 38,794 | 31,355 | 27,166 | ||||||||
| Total expenses | 439,502 | 335,329 | 276,582 | ||||||||
| Operating loss | (31,971 | ) | (26,961 | ) | (36,546 | ) | |||||
| Interest expense | 14,469 | 14,958 | 15,500 | ||||||||
| Loss before income taxes and equity in net income of subsidiaries | (46,440 | ) | (41,919 | ) | (52,046 | ) | |||||
| Income tax benefit | (15,779 | ) | (14,826 | ) | (16,936 | ) | |||||
| Net loss before equity in net income of subsidiaries | (30,661 | ) | (27,093 | ) | (35,110 | ) | |||||
| Equity in net income of subsidiaries | 40,451 | 47,911 | 90,080 | ||||||||
| Net income | $ | 9,790 | $ | 20,818 | $ | 54,970 | |||||
112
Condensed Statements of Cash Flows
| Year Ended December 31, | ||||||||||||
| 2010 | 2009 | 2008 | ||||||||||
| (In thousands) | ||||||||||||
Operating activities: | ||||||||||||
| Cash provided by operating activities | $ | 19,380 | $ | 40,551 | $ | 17,532 | ||||||
Investing activities: | ||||||||||||
| Net dividends from and capital contributions to subsidiaries | 70,800 | 21,960 | 42,872 | |||||||||
| Purchases of investments | (2,019 | ) | (3,844 | ) | (25,515 | ) | ||||||
| Sales and maturities of investments | 14,083 | 12,669 | 56,833 | |||||||||
| Cash paid in business purchase transactions | (139,762 | ) | (2,894 | ) | (1,000 | ) | ||||||
| Purchases of equipment | (40,419 | ) | (32,245 | ) | (33,047 | ) | ||||||
| Changes in amounts due to and due from affiliates | (5,723 | ) | (17,074 | ) | (6,542 | ) | ||||||
| Change in other assets and liabilities | 829 | (540 | ) | 3,170 | ||||||||
| Net cash (used in) provided by investing activities | 102,211 | (21,968 | ) | 36,771 | ||||||||
Financing activities: | ||||||||||||
| Proceeds from common stock offering, net of issuance costs | 111,131 | — | — | |||||||||
| Amount borrowed under credit facility | 105,000 | — | — | |||||||||
| Repayment of amount borrowed under credit facility | (105,000 | ) | — | — | ||||||||
| Treasury stock purchases | — | (27,712 | ) | (49,940 | ) | |||||||
| Purchase of convertible senior notes | — | (9,653 | ) | — | ||||||||
| Payment of credit facility fees | (1,671 | ) | — | — | ||||||||
| Excess tax benefits from employee stock compensation | 295 | 31 | 43 | |||||||||
| Proceeds from exercise of stock options and employee stock plan purchases | 4,056 | 2,015 | 2,084 | |||||||||
| Net cash provided (used in) by financing activities | 113,811 | (35,319 | ) | (47,813 | ) | |||||||
| Net increase (decrease) in cash and cash equivalents | 30,980 | (16,736 | ) | 6,490 | ||||||||
| Cash and cash equivalents at beginning of year | 26,040 | 42,776 | 36,286 | |||||||||
| Cash and cash equivalents at end of year | $ | 57,020 | $ | 26,040 | $ | 42,776 | ||||||
111
| Year Ended December 31, | |||||||||||
| 2012 | 2011 | 2010 | |||||||||
| (In thousands) | |||||||||||
| Operating activities: | |||||||||||
| Cash provided by operating activities | $ | 20,611 | $ | 28,606 | $ | 19,380 | |||||
| Investing activities: | |||||||||||
| Net dividends from and capital contributions to subsidiaries | 1,579 | 27,872 | 70,800 | ||||||||
| Purchases of investments | (1,905 | ) | (2,020 | ) | (2,019 | ) | |||||
| Sales and maturities of investments | 4,067 | 3,760 | 14,083 | ||||||||
| Cash paid in business combinations | — | — | (139,762 | ) | |||||||
| Proceeds from sale of subsidiary, net of cash surrendered | 9,162 | — | — | ||||||||
| Purchases of equipment | (61,813 | ) | (30,930 | ) | (40,419 | ) | |||||
| Changes in amounts due to and due from affiliates | 5,187 | (50,090 | ) | (5,723 | ) | ||||||
| Change in other assets and liabilities | (1,342 | ) | (20,441 | ) | 829 | ||||||
| Net cash used in investing activities | (45,065 | ) | (71,849 | ) | (102,211 | ) | |||||
| Financing activities: | |||||||||||
| Proceeds from common stock offering, net of issuance costs | — | — | 111,131 | ||||||||
| Amount borrowed under credit facility | 60,000 | — | 105,000 | ||||||||
| Repayment of amount borrowed under credit facility | (20,000 | ) | — | (105,000 | ) | ||||||
| Treasury stock repurchases | (3,000 | ) | (7,000 | ) | — | ||||||
| Payment of credit facility fees | — | (1,125 | ) | (1,671 | ) | ||||||
| Excess tax benefits from employee stock compensation | 3,667 | 1,651 | 295 | ||||||||
| Proceeds from exercise of stock options and employee stock plan purchases | 8,205 | 7,347 | 4,056 | ||||||||
| Net cash provided by financing activities | 48,872 | 873 | 113,811 | ||||||||
| Net increase (decrease) in cash and cash equivalents | 24,418 | (42,370 | ) | 30,980 | |||||||
| Cash and cash equivalents at beginning of year | 14,650 | 57,020 | 26,040 | ||||||||
| Cash and cash equivalents at end of year | $ | 39,068 | $ | 14,650 | $ | 57,020 | |||||
Notes to Condensed Financial Information of Registrant
Note A - Basis of Presentation |
Molina Healthcare, Inc. (Registrant), or the Registrant, was incorporated on July 24, 2002. Prior to that date, Molina Healthcare of California (formerly known as Molina Medical Centers) operated as a California health plan and as the parent company for Molina Healthcare of Utah, Inc. Molina Healthcare of Michigan, Inc. and Molina Healthcare of Michigan,Washington, Inc. In June 2003, the employees and operations of the corporate entity were transferred from Molina Healthcare of California to the Registrant.
The Registrant’sRegistrant's investment in subsidiaries is stated at cost plus equity in undistributed earnings of subsidiaries since the date of acquisition. The parent company-onlyaccompanying condensed financial statementsinformation of the Registrant should be read in conjunction with the consolidated financial statements and accompanying notes.
| Note B - Transactions with Subsidiaries |
The Registrant provides certain centralized medical and administrative services to its subsidiaries pursuant to administrative services agreements, including medical affairs and quality management, health education, credentialing, management, financial, legal, information systems and human resources services. Fees are based on the fair market value of services rendered and are recorded as operating revenue. Payment is subordinated to the subsidiaries’subsidiaries' ability to comply with minimum capital and other restrictive financial requirements of the states in which they operate. Charges in 2010, 2009,2012, 2011, and 20082010 for these services totaled $238.5$406.4 million $218.6, $307.9 million, and $190.4$238.5 million, respectively, which are included in operating revenue.
The Registrant and its subsidiaries are included in the consolidated federal and state income tax returns filed by the Registrant. Income taxes are allocated to each subsidiary in accordance with an intercompany tax allocation agreement. The agreement allocates income taxes in an amount generally equivalent to the amount which would be expensed by the subsidiary if it filed a separate
113
tax return. Net operating loss benefits are paid to the subsidiary by the Registrant to the extent such losses are utilized in the consolidated tax returns.
| Note C - Capital Contribution, Dividends and Surplus Note |
During 2010, 2009,2012, 2011, and 2008,2010, the Registrant received dividends from its subsidiaries totaling $81.3amounting to $101.8 million $76.7, $76.6 million, and $91.5$81.3 million, respectively. Such amounts have been recorded as a reduction to the investments in the respective subsidiaries. In addition, in 2011 a subsidiary of the Registrant repaid a surplus note in favor of the Registrant amounting to $9.7 million, including accrued interest. Such amount was a reduction of due from affiliates and prepaid and other current assets.
During 2010, 2009,2012, 2011, and 2008,2010, the Registrant made capital contributions to certain subsidiaries totaling $10.5amounting to $100.2 million $54.7, $58.4 million, and $48.6$10.5 million, respectively, primarily to comply with minimum net worth requirements and to fund contract acquisitions. Such amounts have been recorded as an increase in investment in the respective subsidiaries.
| Note D - Related Party Transactions |
On February 27, 2013, the Registrant entered into a lease (the “Lease”) with 6th & Pine Development, LLC (the “Landlord”) for office space located in Long Beach, California. The lease consists of two office buildings as follows:
an existing building, which comprises approximately 70,000 square feet of office space, and
a new building, which is expected to comprise approximately 120,000 square feet of office space.
The term of the Lease with respect to the existing building is expected to commence on June 1, 2013, and the term of the Lease with respect to the new building is expected to commence on November 1, 2014. The initial term of the Lease with respect to both buildings expires on December 31, 2024, subject to two options to extend the term for a period of five years each. Initial annual rent for the existing building is expected to be approximately $2.5 million and initial annual rent for the new building is expected to be approximately $4.0 million. Rent will increase 3.75% per year through the initial term. Rent during the extension terms will be the greater of then-current rent or fair market rent.
The principal members of the Landlord are John C. Molina, the Chief Financial Officer and a director of the Registrant, and his wife. In addition, in connection with the development of the buildings being leased, the Landlord has pledged shares of common stock in the Registrant he holds as trustee. Dr. J. Mario Molina, the Registrant's Chief Executive Officer and Chairman of the Board of Directors, holds a partial interest in such shares as trust beneficiary.
The Registrant has an equity investment in a medical service provider that provides certain vision services to its members. The Registrant accounts for this investment under the equity method of accounting because the Registrant has an ownership interest in the investee that confers significant influence over operating and financial policies of the investee. As of For both years ended December 31, 20102012 and 2009,2011, the Registrant’sRegistrant's carrying amount for this investment totaled $4.4amounted to $3.9 million and $4.1 million, respectively.. For the years ended December 31, 2010, 20092012, 2011, and 2008,2010, the Registrant paid $22.0$28.4 million $21.8, $24.3 million, and $15.4$22.0 million, respectively, for medical service fees to this provider.
112
The Registrant is a party to afee-for-service agreement with Pacific Hospital of Long Beach, (“or Pacific Hospital”). Until October 2010,Hospital. Pacific Hospital wasis owned by Abrazos Healthcare, Inc., Until October 12, 2010, the majority of the shares of which areAbrazos Healthcare, Inc. were held as community property by the husband of Dr. Martha Bernadett and her husband. Dr. Martha Bernadett is the sister of Dr.Joseph M. Molina, M.D. (Dr. J. Mario Molina,Molina), our Chief Executive Officer, and John Molina, our Chief Financial Officer. Amounts paid toOn October 12, 2010, Dr. Bernadett and her husband sold their shares in Abrazos Healthcare, Inc., terminating our related party relationship with Pacific Hospital underHospital. Under the terms of thisfee-for-service agreement we paid Pacific Hospital agreement were $1.0$0.8 million $0.7 million, and $0.2 million, for the years endedperiod from January 1, 2010 to October 12, 2010.
On December 31, 2010, 200926, 2012, the Registrant purchased 110,988 shares of its common stock from certain Molina family trusts for an aggregate purchase price of $3.0 million. This purchase transaction was approved by the Registrant's board of directors. The shares were purchased at a price of $27.03, representing the closing price per share of the Registrant's common stock on December 26, 2012. The shares were purchased from the Janet M. Watt Separate Property Trust dated 10/22/2007, or the Separate Property Trust, and 2008, respectively. Asthe Watt Family Trust dated 10/11/1996, or the Family Trust. Janet M. Watt is the sister, and her husband Lawrence B. Watt is the brother-in-law, of October 2010, Pacific HospitalDr. J. Mario Molina and John Molina. Ms. Watt is no longer ownedthe sole trustee of the Separate Property Trust, and a co-trustee with Lawrence B. Watt of the Family Trust.
23. Subsequent Event
New Mexico Health Plan
On February 11, 2013, we announced that our New Mexico health plan was selected by Abrazosthe New Mexico Human Services Department (HSD) to participate in the new Centennial Care program. In addition to continuing to provide physical and acute health care services, under the new program Molina Healthcare Inc. or any other related partyof New Mexico will expand its services to provide behavioral
114
health and long-term care services. The selection of Molina Healthcare of New Mexico was made by HSD pursuant to its request for proposals issued in August 2012. The operational start date for the Company.program is currently scheduled for January 2014.
115
Item 9.Changes in and Disagreements with Accountants on Accounting and Financial Disclosures |
None.
Item 9A.Controls and Procedures |
Disclosure Controls and Procedures: Our management is responsible for establishing and maintaining effective internal control over financial reporting as defined inRules 13a-15(f) and15d-15(f) under the Securities Exchange Act of 1934 (the “Exchange Act”). Our internal control over financial reporting is designed to provide reasonable assurance to our management and board of directors regarding the preparation and fair presentation of published financial statements. We maintain controls and procedures designed to ensure that we are able to collect the information we are required to disclose in the reports we file with the Securities and Exchange Commission, and to process, summarize and disclose this information within the time periods specified in the rules of the Securities and Exchange Commission.
Evaluation of Disclosure Controls and Procedures: Our management, with the participation of our Chief Executive Officer and our Chief Financial Officer, has conducted an evaluation of the design and operation of our “disclosure controls and procedures” (as defined inRules 13a-15(e) and15d-15(e)) under the Exchange Act. Based on this evaluation, our Chief Executive Officer and our Chief Financial Officer have concluded that our disclosure controls and procedures are effective as of the end of the period covered by this report to ensure that information required to be disclosed in the reports that we file or submit under the Exchange Act is recorded, processed, summarized and reported within the time periods specified in the Securities and Exchange Commission’s rules and forms.
Because of its inherent limitations, internal control over financial reporting may not prevent or detect misstatements. Therefore, even those systems determined to be effective can provide only reasonable assurance with respect to financial statement preparation and presentation.
Changes in Internal Controls: There were no changes in our internal control over financial reporting that occurred during the three monthsquarter ended December 31, 20102012, that have materially affected, or are reasonably likely to materially affect, our internal controlscontrol over financial reporting.
Management’s Report on Internal Control over Financial Reporting: Management of the Company is responsible for establishing and maintaining adequate internal control over financial reporting, as such term is defined inRule 13a-15(f) under the Exchange Act. The Company’s internal control over financial reporting is designed to provide reasonable assurance regarding the reliability of financial reporting and the preparation of financial statements for external purposes in accordance with generally accepted accounting principles in the United States. However, all internal control systems, no matter how well designed, have inherent limitations. Therefore, even those systems determined to be effective can provide only reasonable assurance with respect to financial statement preparation and reporting.
Management assessed the effectiveness of the Company’s internal control over financial reporting as of December 31, 2010.2012. In making this assessment, management used the criteria set forth by the Committee of Sponsoring Organizations of the Treadway Commission (“COSO”) inInternal Control-Integrated Framework.
Based on our assessment, management believes that the Company maintained effective internal control over financial reporting as of December 31, 2010,2012, based on those criteria.
The effectiveness of the Company’s internal control over financial reporting has been audited by Ernst & Young LLP, an independent registered public accounting firm, as stated in their report appearing on page 115117 of this Annual Report onForm 10-K, which expresses an unqualified opinion on the effectiveness of the Company’s internal control over financial reporting as of December 31, 2010.2012.
Item 9B.Other Information |
On February 27, 2013, Molina Healthcare, Inc. (the “Company”) entered into a build-to-suit office building lease (the “Lease”) with 6th & Pine Development, LLC (the “Landlord”) for approximately 190,000 rentable square feet of office space and 15,000 square feet of storage space located at 604 Pine Avenue, Long Beach, California (the “Project”). The Landlord is expected to construct the Project on a “turnkey” basis, which will consist of two office buildings, on-site parking, common areas and certain amenities, and the right to use up to 500 off-site parking spaces to be secured by the Landlord. The two office buildings will be comprised of:
116
an existing building located on the site and commonly known as the Independent Press Telegram building (the “Existing Building”), which the Landlord is required to substantially refurbish as part of Phase I of the Project. Upon completion of the refurbishment, the Existing Building is expected to contain approximately 70,000 square feet of office space and 15,000 square feet of storage space, and
a new building (the “New Building”), which the Landlord is required to construct as part of Phase II of the Project following the demolition of a building currently located on the site commonly known as the Meeker-Baker building. Upon completion of the construction, the New Building is expected to contain approximately 120,000 square feet of office space.
The term of the Lease with respect to the Existing Building is expected to commence on June 1, 2013, and the term of the Lease with respect to the New Building is expected to commence on November 1, 2014. The initial term of the Lease with respect to both buildings expires on December 31, 2024, subject to two options to extend the term for a period of five years each.
Commencing on the commencement date of the lease for the Existing Building, the monthly base rent due under the Lease is (i) for the office space, initially $2.70 per rentable square foot, increasing by 3.75% per year through the initial term, and (ii) for the storage space, $1.40 per rentable square foot, increasing by 3.75% per year through the initial term. Base rent during the extension terms will be the greater of then-current base rent or fair market rent. The Lease is a full service, base year, gross lease. Accordingly, the rent payable by the Company includes the cost of all utilities, taxes, insurance and maintenance with respect to the Project for the base year, 2015. The Company will be responsible for any increases in the cost of utilities, taxes, insurance and/or maintenance in excess of the cost therefor during the base year, 2015 (subject to certain customary limitations). The Company will also pay $600 per year for each on-site parking space (213) and for each off-site parking space that the Company elects to use (up to 500). The per year, per space parking rate will increase by 3% each year for each on-site parking space and by CPI, with a cap of 3%, for each off-site space.
During the first five years of the term of the Lease, the Company has a right of first offer to purchase the Project (including any transferable off-site parking rights held by the Landlord), and from and after year five of the Lease, the Company has an option to purchase the Project (including any transferable off-site parking rights held by the Landlord) for a purchase price equal to the fair market value for the Project.
The principal members of the Landlord are John C. Molina, the Chief Financial Officer and a director of the Company, and his wife. In addition, in connection with the Project the Landlord has pledged shares of common stock in the Company he holds as trustee. Dr. J. Mario Molina, the Company's Chief Executive Officer and Chairman of the Board of Directors, holds a partial interest in such shares as trust beneficiary.
In November 2011, the Company's Board of Directors organized a special committee of five independent directors (the “Special Committee”) consisting of Steve Orlando, Ronna Romney, John Szabo, Charles Fedak, and Dr. Frank Murray, and delegated to the Special Committee full power and authority to consider and enter into any real property transaction to meet the Company's space needs. Following its formation, the Special Committee undertook a review of, among other things, the Company's projected space needs and available space options. In connection with its work, the Special Committee retained Latham & Watkins LLP, as its independent legal counsel, and Duff & Phelps LLC, as its independent real estate advisor. Following the completion of its work, the Committee determined that it was appropriate to enter into the Lease with the Landlord under its terms and conditions, and accordingly approved the Company's entry into the Lease.
The foregoing description of the Lease is not complete and is qualified in its entirety by reference to the full text of such agreement, a copy of which is filed as Exhibit 10.32 herewith and which is incorporated herein by reference.
117
REPORT OF INDEPENDENT REGISTERED PUBLIC ACCOUNTING FIRM
The Board of Directors and Stockholders
of Molina Healthcare, Inc.
We have audited Molina Healthcare, Inc.’s (the “Company’s”) internal control over financial reporting as of December 31, 2010,2012, based on criteria established inInternal Control — Integrated Frameworkissued by the Committee of Sponsoring Organizations of the Treadway Commission (the COSO criteria). The Company’s management is responsible for maintaining effective internal control over financial reporting, and for its assessment of the effectiveness of internal control over financial reporting included in the accompanying Management’s Report on Internal Control over Financial Reporting. Our responsibility is to express an opinion on the Company’s internal control over financial reporting based on our audit.
We conducted our audit in accordance with the standards of the Public Company Accounting Oversight Board (United States). Those standards require that we plan and perform the audit to obtain reasonable assurance about whether effective internal control over financial reporting was maintained in all material respects. Our audit included obtaining an understanding of internal control over financial reporting, assessing the risk that a material weakness exists, testing and evaluating the design and operating effectiveness of internal control based on the assessed risk, and performing such other procedures as we considered necessary in the circumstances. We believe that our audit provides a reasonable basis for our opinion.
A company’s internal control over financial reporting is a process designed to provide reasonable assurance regarding the reliability of financial reporting and the preparation of financial statements for external purposes in accordance with generally accepted accounting principles. A company’s internal control over financial reporting includes those policies and procedures that (1) pertain to the maintenance of records that, in reasonable detail, accurately and fairly reflect the transactions and dispositions of the assets of the company; (2) provide reasonable assurance that transactions are recorded as necessary to permit preparation of financial statements in accordance with generally accepted accounting principles, and that receipts and expenditures of the company are being made only in accordance with authorizations of management and directors of the company; and (3) provide reasonable assurance regarding prevention or timely detection of unauthorized acquisition, use, or disposition of the company’s assets that could have a material effect on the financial statements.
Because of its inherent limitations, internal control over financial reporting may not prevent or detect misstatements. Also, projections of any evaluation of effectiveness to future periods are subject to the risk that controls may become inadequate because of changes in conditions, or that the degree of compliance with the policies or procedures may deteriorate.
In our opinion, Molina Healthcare, Inc. maintained, in all material respects, effective internal control over financial reporting as of December 31, 2010,2012, based on the COSO criteria.
We also have audited, in accordance with the standards of the Public Company Accounting Oversight Board (United States), the consolidated balance sheets of Molina Healthcare, Inc. as of December 31, 20102012 and 2009,2011, and the related consolidated statements of income and comprehensive income, stockholders’ equity, and cash flows for each of the three years in the period ended December 31, 20102012 and our report dated March 8, 2011February 28, 2013 expressed an unqualified opinion thereon.
| /s/ ERNST & YOUNG LLP | |
Los Angeles, California
118
PART III
Pursuant to General Instruction G(3) toForm 10-K and Instruction 3 to Item 401(b) ofRegulation S-K, information regarding our executive officers is provided in Item 1 of Part I of this Annual Report onForm 10-K under the caption “Executive Officers of the Registrant,” and will also appear in our Proxy Statementdefinitive proxy statement for our 20112013 Annual Meeting of Stockholders. Such portionThe remaining information required by Items 401, 405, 406 and 407(c)(3), (d)(4) and (d)(5) of Regulation S-K will be included under the Proxy Statementheadings “Election of Directors,” “Corporate Governance,” and “Section 16(a) Beneficial Ownership Reporting Compliance” in our definitive proxy statement for our 2013 Annual Meeting of Shareholders, and such required information is incorporated herein by reference.
Item 11. Executive Compensation |
Item 12.Security Ownership of Certain Beneficial Owners and Management and Related Stockholder Matters |
116
Item 13. Certain Relationships and Related Transactions, and Director Independence
The information required by Items 404 and 407(a) of Regulation S-K will be included under “Related Party Transactions.” Information concerning director independence will appearthe headings “Certain Relationships and Transactions” and “Corporate Governance” in our Proxy Statement under “Director Independence.” These portionsdefinitive proxy statement for our 2013 Annual Meeting of Shareholders, and such required information is incorporated herein by reference.
Joseph M. Molina, M.D., Professional Corporations
Our wholly owned subsidiary, American Family Care, Inc., or AFC, operates our primary care clinics. In 2012, AFC entered into services agreements with theJoseph M. Molina, M.D. Professional Corporations, or JMMPC. JMMPC was created to further advance our direct delivery line of business. Its sole shareholder is Joseph M. Molina, M.D. (Dr. J. Mario Molina), our Chairman of the Board, President and Chief Executive Officer. Dr. Molina is paid no salary and receives no dividends in connection with his work for, or ownership of, JMMPC. Under the services agreements, AFC provides the clinic facilities, clinic administrative support staff, patient scheduling services and medical supplies to JMMPC, and JMMPC provides outpatient professional medical services to the general public for routine non-life threatening, outpatient health care needs. While JMMPC may provide services to the general public, substantially all of the individuals served by JMMPC are members of our Proxy Statementhealth plans. JMMPC does not have agreements to provide professional medical services with any other entities. In addition to the services agreements with AFC, JMMPC has entered into affiliation agreements with us. Under these agreements, we have agreed to fund JMMPC's operating deficits, or receive JMMPC's operating surpluses, based on a monthly reconciliation such that JMMPC will operate at break even and derive no profit.
We have determined that JMMPC is a variable interest entity, or VIE, and that we are its primary beneficiary. We have reached this conclusion under the power and benefits criterion model according to U.S. generally accepted accounting principles. Specifically, we have the power to direct the activities that most significantly affect JMMPC's economic performance, and the obligation to absorb losses or right to receive benefits that are potentially significant to the VIE, under the services and affiliation agreements described above. Because we are its primary beneficiary, we have consolidated JMMPC. JMMPC's assets may be used to settle only JMMPC's obligations, and JMMPC's creditors have no recourse to the general credit of Molina Healthcare, Inc. As of December 31, 2012, JMMPC had total assets of $1.4 million, comprising primarily cash and equivalents, and total liabilities of $1.1 million, comprising primarily accrued payroll and employee benefits.
Our maximum exposure to loss as a result of our involvement with this entity is equal to the amounts needed to fund JMMPC's ongoing payroll and employee benefits. We believe that such loss exposure will be immaterial to our consolidated
119
operating results and cash flows for the foreseeable future. For the year ended December 31, 2012, we provided an initial cash infusion of $0.3 million to JMMPC in the first quarter of 2012 to fund its start-up operations. During 2012 our health plans received $0.2 million from JMMPC under the terms of the affiliation agreement.
Stock Repurchase
Janet M. Watt is the sister, and her husband Lawrence B. Watt is the brother-in-law, of Dr. J. Mario Molina, the Company's Chief Executive Officer, and John Molina, the Company's Chief Financial Officer. Ms. Watt is the sole trustee of the Janet M. Watt Separate Property Trust dated 10/22/2007 (the “Separate Property Trust”) and a co-trustee with Lawrence B. Watt, of the Watt Family Trust dated 10/11/1996 (the “Family Trust” and together with the Separate Property Trust, the “Trusts”). On December 26, 2012, pursuant to a Stock Purchase Agreement between the Company and the Trusts, the Company purchased an aggregate of 110,988 shares of its common stock from the Trusts for an aggregate purchase price of $3,000,005.64, as follows: (i) 43,767 shares from the Family Trust for an aggregate purchase price of $ 1,183,022.01 and (ii) 67,221 shares from the Separate Property Trust for an aggregate purchase price of $1,816,983.63. The shares were purchased at a price per share of $27.03, representing the closing price per share of the Company's common stock on December 26, 2012, as reported by the New York Stock Exchange. The transaction was approved by the Company's Board of Directors.
6th and Pine Lease
Please see the information disclosed under Part II, Item 9B. Other Information, in this Annual Report, which disclosure is incorporated herein by reference.
Item 14. Principal Accountant Fees and Services
The information required by Item 9(e) of Schedule 14A will be included under the heading “Independent Registered Public Accounting Firm” in our definitive proxy statement for our 2013 Annual Meeting of Shareholders, and such required information is incorporated herein by reference.
120
PART IV
Item 15. Exhibits and Financial Statement Schedules
117
| (1) | The |
Report of Independent Registered Public Accounting Firm
Consolidated Statements of Income - Years ended December 31, 2012, 2011, and 2010
Consolidated Statements of Stockholders' Equity - Years ended December 31, 2012, 2011, and 2010
Consolidated Statements of Cash Flows - Years ended December 31, 2012, 2011, and 2010
Notes to Consolidated Financial Statement SchedulesStatements
| (2) | Financial Statement Schedules |
None of the schedules apply, or the information required is included in the Notes to the Consolidated Financial Statements.
| (3) | Exhibits |
Reference is made to the accompanying Index to Exhibits.
121
119
The following exhibits, which are furnished with this annual report or incorporated herein by reference, are filed as part of this annual report.
The agreements included or incorporated by reference as exhibits to this Annual Report onForm 10-K contain representations and warranties by each of the parties to the applicable agreement. These representations and warranties were made solely for the benefit of the other parties to the applicable agreement and (i) were not intended to be treated as categorical statements of fact, but rather as a way of allocating the risk to one of the parties if those statements prove to be inaccurate; (ii) may have been qualified in such agreement by disclosures that were made to the other party in connection with the negotiation of the applicable agreement; (iii) may apply contract standards of “materiality” that are different from “materiality” under the applicable securities laws; and (iv) were made only as of the date of the applicable agreement or such other date or dates as may be specified in the agreement. The Company acknowledges that, notwithstanding the inclusion of the foregoing cautionary statements, it is responsible for considering whether additional specific disclosures of material information regarding material contractual provisions are required to make the statements in this Annual Report onForm 10-K not misleading.
| Number | Description | Method of Filing | ||
| 1.1 | Purchase Agreement, dated as of February 11, 2013, among Molina Healthcare, Inc. and J.P. Morgan Securities LLC and Merrill Lynch, Pierce, Fenner & Smith Incorporated, as Representatives of the Initial Purchasers. | Filed as Exhibit 1.1 to registrant's Form 8-K filed February 15, 2013. | ||
| 2.1 | Asset Purchase Agreement between Molina Healthcare, Inc. and Unisys Corporation dated as of January 18, 2010 | Filed as Exhibit 2.1 to registrant's Form 8-K filed January 19, 2010. | ||
| 3.1 | Certificate of Incorporation | Filed as Exhibit 3.2 to registrant's Registration Statement on Form S-1 filed December 30, 2002. | ||
| 3.2 | Amended and Restated Bylaws | Filed as Exhibit 3.2 to registrant's Form 8-K filed February 17, 2009. | ||
| 4.1 | Indenture dated as of October 11, 2008 | Filed as Exhibit 4.1 to registrant's Form 8-K filed October 5, 2007. | ||
| 4.2 | First Supplemental Indenture dated as of October 11, 2008 | Filed as Exhibit 4.2 to registrant's Form 8-K filed October 5, 2007. | ||
| 4.3 | Global Form of 3.75% Convertible Senior Note due 2014 | Filed as Exhibit 4.3 to registrant's Form 8-K filed October 5, 2007. | ||
| 4.4 | Indenture, dated as of February 15, 2013, by and between Molina Healthcare, Inc. and U.S. Bank, National Association. | Filed as Exhibit 4.1 to registrant's Form 8-K filed February 15, 2013. | ||
| 4.5 | Form of 1.125% Cash Convertible Senior Note due 2020 | Included in Exhibit 4.1 to registrant's Form 8-K filed February 15, 2013. | ||
| 10.1 | 2000 Omnibus Stock and Incentive Plan | Filed as Exhibit 10.12 to registrant's Form S-1 filed December 30, 2002. | ||
| 10.2 | 2002 Equity Incentive Plan | Filed as Exhibit 10.13 to registrant's Form S-1 filed December 30, 2002. | ||
| 10.3 | 2002 Employee Stock Purchase Plan | Filed as Exhibit 10.14 to registrant's Form S-1 filed December 30, 2002. | ||
| 10.4 | 2005 Molina Deferred Compensation Plan adopted November 6, 2006 | Filed as Exhibit 10.4 to registrant's Form 10-Q filed November 9, 2006. | ||
| 10.5 | 2005 Incentive Compensation Plan | Filed as Appendix A to registrant's Proxy Statement filed March 28, 2005. | ||
| 10.6 | 2011 Equity Incentive Plan | Filed as Exhibit 10.2 to registrant's Form 8-K filed May 2, 2011. | ||
| 10.7 | 2011 Employee Stock Purchase Plan | Filed as Exhibit 10.1 to registrant's Form 8-K filed May 2, 2011. | ||
| 10.8 | Form of Restricted Stock Award Agreement (Executive Officer) under Molina Healthcare, Inc. Equity Incentive Plan | Filed as Exhibit 10.1 to registrant's Form 10-Q filed August 9, 2005. | ||
| 10.9 | Form of Restricted Stock Award Agreement (Outside Director) under Molina Healthcare, Inc. Equity Incentive Plan | Filed as Exhibit 10.1 to registrant's Form 10-Q filed August 9, 2005. | ||
122
| Number | Description | Method of Filing | ||
| 10.10 | Form of Restricted Stock Award Agreement (Employee) under Molina Healthcare, Inc. Equity Incentive Plan | Filed as Exhibit 10.1 to registrant's Form 10-Q filed August 9, 2005. | ||
| 10.11 | Form of Stock Option Agreement under Equity Incentive Plan | Filed as Exhibit 10.3 to registrant's Form 10-K filed March 14, 2007. | ||
| 10.12 | Amended and Restated Employment Agreement with J. Mario Molina, M.D. dated as of December 31, 2009 | Filed as Exhibit 10.1 to registrant's Form 8-K filed January 7, 2010. | ||
| 10.13 | Amended and Restated Employment Agreement with John C. Molina dated as of December 31, 2009 | Filed as Exhibit 10.2 to registrant's Form 8-K filed January 7, 2010. | ||
| 10.14 | Amended and Restated Change in Control Agreement with Terry Bayer, dated as of December 31, 2009 | Filed as Exhibit 10.4 to registrant's Form 8-K filed January 7, 2010. | ||
| 10.15 | Amended and Restated Change in Control Agreement with Joseph W. White, dated as of December 31, 2009 | Filed as Exhibit 10.6 to registrant's Form 8-K filed January 7, 2010. | ||
| 10.16 | Change in Control Agreement with Jeff D. Barlow, dated as of September 18, 2012 | Filed herewith. | ||
| 10.17 | Form of Indemnification Agreement | Filed as Exhibit 10.14 to registrant's Form 10-K filed March 14, 2007. | ||
| 10.18 | Base Call Option Transaction Confirmation, dated as of February 11, 2013, between Molina Healthcare, Inc. and JPMorgan Chase Bank, National Association, London Branch. | Filed as Exhibit 10.1 to registrant's Form 8-K filed February 15, 2013. | ||
| 10.19 | Base Call Option Transaction Confirmation, dated as of February 11, 2013, between Molina Healthcare, Inc. and Bank of America, N.A. | Filed as Exhibit 10.2 to registrant's Form 8-K filed February 15, 2013. | ||
| 10.20 | Base Warrants Confirmation, dated as of February 11, 2013, between Molina Healthcare, Inc. and JPMorgan Chase Bank, National Association, London Branch. | Filed as Exhibit 10.3 to registrant's Form 8-K filed February 15, 2013. | ||
| 10.21 | Base Warrants Confirmation, dated as of February 11, 2013, between Molina Healthcare, Inc. and Bank of America, N.A. | Filed as Exhibit 10.4 to registrant's Form 8-K filed February 15, 2013. | ||
| 10.22 | Amendment to Base Call Option Transaction Confirmation, dated as of February 13, 2013, between Molina Healthcare, Inc. and JPMorgan Chase Bank, National Association, London Branch. | Filed as Exhibit 10.5 to registrant's Form 8-K filed February 15, 2013. | ||
| 10.23 | Amendment to Base Call Option Transaction Confirmation, dated as of February 13, 2013, between Molina Healthcare, Inc. and Bank of America, N.A. | Filed as Exhibit 10.6 to registrant's Form 8-K filed February 15, 2013. | ||
| 10.24 | Additional Base Warrants Confirmation, dated as of February 13, 2013, between Molina Healthcare, Inc. and JPMorgan Chase Bank, National Association, London Branch. | Filed as Exhibit 10.7 to registrant's Form 8-K filed February 15, 2013. | ||
| 10.25 | Additional Base Warrants Confirmation, dated as of February 13, 2013, between Molina Healthcare, Inc. and Bank of America, N.A. | Filed as Exhibit 10.8 to registrant's Form 8-K filed February 15, 2013. | ||
| 10.26 | Term Loan Agreement, dated as of December 1, 2011, among Molina Center LLC, various lenders and East West Bank, as Administrative Agent | Filed as Exhibit 10.18 to registrant's From 10-K filed February 29, 2012. | ||
| 10.27 | Guaranty, dated as of December 1, 2011, by Molina Healthcare, Inc. in favor of East West Bank, as Administrative Agent | Filed as Exhibit 10.9 to registrant's Form 10-K filed February 29, 2012. | ||
| 10.28 | Environmental Indemnity, dated as of December 1, 2011, by Molina Center LLC and Molina Healthcare, Inc. for the benefit of certain lenders and East West Bank, as Administrative Agent | Filed as Exhibit 10.20 to registrant's Form 10-K filed February 29, 2012. | ||
| 10.29 | Purchase Agreement, dated as of October 11, 2011, between Molina Center LLC and 200 Oceangate, LLC | Filed as Exhibit 10.21 to registrant's Form 10-K filed February 29, 2012. | ||
123
| Number | Description | Method of Filing | ||
| 10.30 | First Amendment to Purchase Agreement, dated as of November 10, 2011, between Molina Center LLC and 200 Oceangate, LLC | Filed as Exhibit 10.22 to registrant's Form 10-K filed February 29, 2012. | ||
| 10.31 | Second Amendment to Purchase Agreement, dated as of November 30, 2011, between Molina Center LLC and 200 Oceangate, LLC | Filed as Exhibit 10.23 to registrant's Form 10-K filed February 29, 2012. | ||
| 10.32 | Lease Agreement, dated as of February 27, 2013, by and between 6th & Pine Development, LLC and Molina Healthcare, Inc. | Filed herewith. | ||
| 12.1 | Computation of Ratio of Earnings to Fixed Charges | Filed herewith. | ||
| 21.1 | List of subsidiaries | Filed herewith. | ||
| 23.1 | Consent of Independent Registered Public Accounting Firm | Filed herewith. | ||
| 31.1 | Section 302 Certification of Chief Executive Officer | Filed herewith. | ||
| 31.2 | Section 302 Certification of Chief Financial Officer | Filed herewith. | ||
| 32.1 | Certificate of Chief Executive Officer pursuant to 18 U.S.C. Section 1350, as adopted pursuant to Section 906 of the Sarbanes-Oxley Act of 2002 | Filed herewith. | ||
| 32.2 | Certificate of Chief Financial Officer pursuant to 18 U.S.C. Section 1350, as adopted pursuant to Section 906 of the Sarbanes-Oxley Act of 2002 | Filed herewith. | ||
| 101.INS(1) | XBRL Taxonomy Instance Document | Filed herewith. | ||
| 101.SCH(1) | XBRL Taxonomy Extension Schema Document | Filed herewith. | ||
| 101.CAL(1) | XBRL Taxonomy Extension Calculation Linkbase Document | Filed herewith. | ||
| 101.DEF(1) | XBRL Taxonomy Extension Definition Linkbase Document | Filed herewith. | ||
| 101.LAB(1) | XBRL Taxonomy Extension Label Linkbase Document | Filed herewith. | ||
| 101.PRE(1) | XBRL Taxonomy Extension Presentation Linkbase Document | Filed herewith. | ||
(1) Pursuant to Rule 406T of Regulation S-T, XBRL (eXtensible Business Reporting Language) information is furnished and not filed or a part of a registration statement or prospectus for purposes of Sections 11 or 12 of the Securities Act of 1933, as amended, is deemed not filed for purposes of Section 18 of the Securities Exchange Act of 1934, as amended, and otherwise is not subject to liability under these sections.
124
SIGNATURES
Pursuant to the requirements of Section 13 or 15(d) of the Securities Exchange Act of 1934, as amended, the undersigned registrant has duly caused this report to be signed on its behalf by the undersigned, thereunto duly authorized, on the 28th day of February, 2013.
Number | Description | Method of Filing | ||||
| 2 | .1 | Asset Purchase Agreement between Molina Healthcare, Inc. and Unisys Corporation dated as of January 18, 2010 | Filed as Exhibit 2.1. to registrant’s Form8-K filed January 19, 2010. | |||
| 3 | .1 | Certificate of Incorporation | Filed as Exhibit 3.2 to registrant’s Registration Statement onForm S-1 filed December 30, 2002. | |||
| 3 | .2 | Amended and Restated Bylaws | Filed as Exhibit 3.2 to registrant’sForm 8-K filed February 17, 2009. | |||
| 4 | .1 | Indenture dated as of October 11, 2008 | Filed as Exhibit 4.1 to registrant’sForm 8-K filed October 5, 2007. | |||
| 4 | .2 | First Supplemental Indenture dated as of October 11, 2008 | Filed as Exhibit 4.2 to registrant’sForm 8-K filed October 5, 2007. | |||
| 4 | .3 | Global Form of 3.75% Convertible Senior Note due 2014 | Filed as Exhibit 4.3 to registrant’sForm 8-K filed October 5, 2007. | |||
| 10 | .1 | 2000 Omnibus Stock and Incentive Plan | Filed as Exhibit 10.12 to registrant’sForm S-1 filed December 30, 2002. | |||
| 10 | .2 | 2002 Equity Incentive Plan | Filed as Exhibit 10.13 to registrant’sForm S-1 filed December 30, 2002. | |||
| 10 | .3 | Form of Stock Option Agreement under 2002 Equity Incentive Plan | Filed as Exhibit 10.3 to registrant’sForm 10-K filed March 14, 2007. | |||
| 10 | .4 | 2002 Employee Stock Purchase Plan | Filed as Exhibit 10.14 to registrant’sForm S-1 filed December 30, 2002. | |||
| 10 | .5 | 2005 Molina Deferred Compensation Plan adopted November 6, 2006 | Filed as Exhibit 10.4 to registrant’sForm 10-Q filed November 9, 2006. | |||
| 10 | .6 | 2005 Incentive Compensation Plan | Filed as Appendix A to registrant’s Proxy Statement filed March 28, 2005. | |||
| 10 | .7 | Form of Restricted Stock Award Agreement (Executive Officer) under Molina Healthcare, Inc. 2002 Equity Incentive Plan | Filed as Exhibit 10.1 to registrant’sForm 10-Q filed August 9, 2005. | |||
| 10 | .8 | Form of Restricted Stock Award Agreement (Outside Director) under Molina Healthcare, Inc. 2002 Equity Incentive Plan | Filed as Exhibit 10.1 to registrant’sForm 10-Q filed August 9, 2005. | |||
| 10 | .9 | Form of Restricted Stock Award Agreement (Employee) under Molina Healthcare, Inc. 2002 Equity Incentive Plan | Filed as Exhibit 10.1 to registrant’sForm 10-Q filed August 9, 2005. | |||
| 10 | .10 | Amended and Restated Employment Agreement with J. Mario Molina, M.D. dated as of December 31, 2009 | Filed as Exhibit 10.1 to registrant’sForm 8-K filed January 7, 2010. | |||
Number | Description | Method of Filing | ||||
| 10 | .11 | Amended and Restated Employment Agreement with John C. Molina dated as of December 31, 2009 | Filed as Exhibit 10.2 to registrant’sForm 8-K filed January 7, 2010. | |||
| 10 | .12 | Amended and Restated Employment Agreement with Mark L. Andrews dated as of December 31, 2009 (terminated July 29, 2010) | Filed as Exhibit 10.3 to registrant’sForm 8-K filed January 7, 2010. | |||
| 10 | .13 | Separation Agreement, General Waiver, and Release of Claims with Mark L. Andrews entered into July 29, 2010 | Filed as Exhibit 10.1 to registrant’sForm 8-K filed August 2, 2010. | |||
| 10 | .14 | Amended and Restated Change in Control Agreement with Terry Bayer, dated as of December 31, 2009 | Filed as Exhibit 10.4 to registrant’sForm 8-K filed January 7, 2010. | |||
| 10 | .15 | Amended and Restated Change in Control Agreement with James W. Howatt, M.D., dated as of December 31, 2009 | Filed as Exhibit 10.5 to registrant’sForm 8-K filed January 7, 2010. | |||
| 10 | .16 | Amended and Restated Change in Control Agreement with Joseph W. White, dated as of December 31, 2009 | Filed as Exhibit 10.6 to registrant’sForm 8-K filed January 7, 2010. | |||
| 10 | .17 | Form of Indemnification Agreement | Filed as Exhibit 10.14 to registrant’sForm 10-K filed March 14, 2007. | |||
| 10 | .18 | Amended and Restated Credit Agreement, dated as of March 9, 2005, among Molina Healthcare, Inc., as the Borrower, certain lenders, and Bank of America, N.A., as Administrative Agent | Filed as Exhibit 10.1 to registrant’s current report onForm 8-K filed March 10, 2005. | |||
| 10 | .19 | First Amendment and Waiver to the Amended and Restated Credit Agreement, dated as of October 5, 2005, among Molina Healthcare, Inc., certain lenders, and Bank of America, N.A., as Administrative Agent | Filed as Exhibit 10.1 to registrant’s current report onForm 8-K filed October 13, 2005. | |||
| 10 | .20 | Second Amendment and Waiver to the Amended and Restated Credit Agreement, dated as of November 6, 2006, among Molina Healthcare, Inc., certain lenders, and Bank of America, N.A., as Administrative Agent | Filed as Exhibit 10.1 to registrant’sForm 10-Q filed November 9, 2006. | |||
| 10 | .21 | Third Amendment and Waiver to the Amended and Restated Credit Agreement, dated as of May 25, 2008, among Molina Healthcare, Inc., certain lenders, and Bank of America, N.A., as Administrative Agent | Filed as Exhibit 10.1 to registrant’sForm 8-K filed May 31, 2008. | |||
| 10 | .22 | Fourth Amendment and Waiver to the Amended and Restated Credit Agreement, dated as of April 29, 2010, among Molina Healthcare, Inc., certain lenders, and Bank of America, N.A., as Administrative Agent (date to be inserted on Fourth Amendment Effective Date) | Filed as Exhibit 10.1 to registrant’sForm 8-K filed January 19, 2010. | |||
| 10 | .23 | Fifth Amendment and Waiver to the Amended and Restated Credit Agreement, dated as of April 29, 2010, among Molina Healthcare, Inc., certain lenders, and Bank of America, N.A., as Administrative Agent | Filed as Exhibit 10.22 to registrant’sForm 10-K filed March 16, 2010. | |||
| 10 | .24 | Office Lease with Pacific Towers Associates for 200 Oceangate Corporate Headquarters. | Filed as Exhibit 10.34 to registrant’sForm 10-K filed March 17, 2008. | |||
| 10 | .25 | Hospital Services Agreement (fee-for-service) by and between Molina Healthcare of California, a California corporation, and Pacific Hospital of Long Beach | Filed as Exhibit 10.24 to registrant’sForm 10-K filed March 16, 2010. | |||
Number | Description | Method of Filing | ||||
| 10 | .26 | Hospital Services Agreement (capitation) by and between Molina Healthcare of California, a California corporation, and HealthSmart Pacific, Inc., dba Pacific Hospital of Long Beach | Filed as Exhibit 10.25 to registrant’sForm 10-K filed March 16, 2010. | |||
| 10 | .27 | Purchase Agreement between 200 Oceangate, LLC and Molina Center LLC dated November 30, 2010 (which terminated effective as of December 30, 2010 in accordance with its terms) | Filed herewith. | |||
| 12 | .1 | Computation of Ratio of Earnings to Fixed Charges | Filed herewith. | |||
| 21 | .1 | List of subsidiaries | Filed herewith. | |||
| 23 | .1 | Consent of Independent Registered Public Accounting Firm | Filed herewith. | |||
| 31 | .1 | Section 302 Certification of Chief Executive Officer | Filed herewith. | |||
| 31 | .2 | Section 302 Certification of Chief Financial Officer | Filed herewith. | |||
| 32 | .1 | Certificate of Chief Executive Officer pursuant to 18 U.S.C. Section 1350, as adopted pursuant to Section 906 of the Sarbanes-Oxley Act of 2002. | Filed herewith. | |||
| 32 | .2 | Certificate of Chief Financial Officer pursuant to 18 U.S.C. Section 1350, as adopted pursuant to Section 906 of the Sarbanes-Oxley Act of 2002. | Filed herewith. | |||
| MOLINA HEALTHCARE, INC. | |||
| By: | /s/ Joseph M. Molina | ||
| Joseph M. Molina, M.D. (Dr. J. Mario Molina) | |||
Chief Executive Officer (Principal Executive Officer) | |||
Pursuant to the requirements of the Securities Exchange Act of 1934, as amended, this report has been signed below by the following persons on behalf of the registrant and in the capacities and on the dates indicated.
125
| Signature | Title | Date | ||
| /s/ Joseph M. Molina | Chairman of the Board, Chief Executive Officer, and President | February 28, 2013 | ||
| Joseph M. Molina, M.D. | (Principal Executive Officer) | |||
| /s/ John C. Molina | Director, Chief Financial Officer, and Treasurer | February 28, 2013 | ||
| John C. Molina, J.D. | (Principal Financial Officer) | |||
| /s/ Joseph W. White | Chief Accounting Officer | February 28, 2013 | ||
| Joseph W. White, CPA, MBA | (Principal Accounting Officer) | |||
| /s/ Garrey E. Carruthers | Director | February 28, 2013 | ||
| Garrey E. Carruthers, Ph.D. | ||||
| /s/ Charles Z. Fedak | Director | February 28, 2013 | ||
| Charles Z. Fedak, CPA, MBA | ||||
| /s/ Frank E. Murray | Director | February 28, 2013 | ||
| Frank E. Murray, M.D. | ||||
| /s/ Steven Orlando | Director | February 28, 2013 | ||
| Steven Orlando, CPA (inactive) | ||||
| /s/ Ronna Romney | Director | February 28, 2013 | ||
| Ronna Romney | ||||
| /s/ John P. Szabo, Jr. | Director | February 28, 2013 | ||
| John P. Szabo, Jr. | ||||
126