UNITED STATES SECURITIES AND EXCHANGE COMMISSION
Washington, D.C. 20549
Form 10-K
| x | ANNUAL REPORT PURSUANT TO SECTION 13 or 15(d) OF THE SECURITIES EXCHANGE ACT OF 1934 | ||
| For the fiscal year ended December 31, | |||
or | |||
o | TRANSITION REPORT PURSUANT TO SECTION 13 or 15(d) OF THE SECURITIES EXCHANGE ACT OF 1934 | ||
For the transition period from________to | |||
Commission file number001-34963
LPL Investment Holdings Inc.
(Exact name of registrant as specified in its charter)
| Delaware | 20-3717839 | ||
| (State or other jurisdiction of incorporation or organization) | (I.R.S. Employer Identification No.) | ||
One Beacon Street, Boston, MA 02108
(Address of principal executive officesoffices; including zip code)
617-423-3644
(Registrant’s telephone number, including area code)
Securities registered pursuant to Section 12(b) of the Act:
| Title of Each Class | Name of Each Exchange on Which Registered | ||
| Common Stock — $.001 par value per share | NASDAQ Global Select Market | ||
Securities registered pursuant to Section 12(g) of the Act:
None
Indicate by check mark if the registrant is a well-known seasoned issuer, as defined in Rule 405 of the Securities Act. Yes þx No o
Indicate by check mark if the registrant is not required to file reports pursuant to Section 13 or 15(d) of the Exchange Act. Yes o No þx
Indicate by check mark whether the registrant (1) has filed all reports required to be filed by Section 13 or 15(d) of the Securities Exchange Act of 1934 during the preceding 12 months (or for such shorter period that the registrant was required to file such reports), and (2) has been subject to such filing requirements for the past 90 days. Yes þx No o
Indicate by check mark whether the registrant has submitted electronically and posted on its corporate web site, if any, every Interactive Data File required to be submitted and posted pursuant to Rule 405 ofRegulation S-T (§ 232.405 of this chapter) during the preceding 12 months (or for such shorter period that the registrant was required to submit and post such files). Yes x No o No o (Registrant is not subject to the requirements of Rule 405 ofRegulation S-T at this time).
Indicate by check mark if disclosure of delinquent filers pursuant to Item 405 ofRegulation S-K (§ 229.405 of this chapter) is not contained herein, and will not be contained, to the best of registrant’s knowledge, in definitive proxy or information statements incorporated by reference in Part III of thisForm 10-K or any amendment to thisForm 10-K. þo
Indicate by check mark whether the registrant is a large accelerated filer, an accelerated filer, a non-accelerated filer, or a smaller reporting company. See the definitions of “large accelerated filer,” “accelerated filer” and “smaller reporting company” in Rule12b-2 of the Exchange Act. (Check one):
Large accelerated filer | Accelerated filer o | Non-accelerated filer | Smaller reporting company o |
| (Do not check if a smaller reporting company) | |||
Indicate by check mark whether the registrant is a shell company (as defined inRule 12b-2 of the Act). Yes o No þx
As of June 30, 2010,2011, the last business dayaggregate market value of the registrant’s most recently completed second fiscal quarter, there was no established public trading market for the commonvoting stock held by non-affiliates of the registrant. The registrant completedwas $1.3 billion. For purposes of this information, the initial public offeringoutstanding shares of its commonCommon Stock owned by directors and executive officers of the registrant were deemed to be shares of the voting stock on November 23, 2010.held by affiliates.
The number of shares of common stock, par value $0.001 per share, outstanding as of March 1, 2011February 20, 2012 was 108,801,822.110,814,426.
DOCUMENTS INCORPORATED BY REFERENCE
Portions of the definitive Proxy Statement to be delivered to stockholders in connection with the Annual Meeting of Stockholders are incorporated by reference into Part III.
TABLE OF CONTENTS
i
WHERE YOU CAN FIND MORE INFORMATION
We file annual, quarterly and current reports, proxy statements and other information required by the Securities Exchange Act of 1934, as amended (the “Exchange Act”), with the Securities and Exchange Commission or SEC.(the "SEC"). You may read and copy any document we file with the SEC at the SEC’s public reference room located at 100 F Street, N.E., Washington, D.C. 20549, U.S.A. Please call the SEC at1-800-SEC-0330 for further information on the public reference room. Our SEC filings are also available to the public from the SEC’s internet site athttp://www.sec.gov.
On our Internet website,http://www.lpl.com, we post the following recent filings as soon as reasonably practicable after they are electronically filed with or furnished to the SEC: our annual reports onForm 10-K, our quarterly reports onForm 10-Q, our current reports onForm 8-K, and any amendments to those reports filed or furnished pursuant to Section 13(a) or 15(d) of the Exchange Act. Hard copies of all such filings are available free of charge by request via email (investor.relations@lpl.com), telephone(617) 897-4574, or mail (LPL Financial Investor Relations at One Beacon Street, 22nd Floor, Boston, MA 02108). The information contained or incorporated on our website is not a part of this Annual Report onForm 10-K.
When we use the terms “LPLIH”, “we”, “us”, “our”, and the “firm” we mean LPLInvestment Holdings Inc., a Delaware corporation, and its consolidated subsidiaries,taken as a whole, as well as any predecessor entities, unless the context otherwiseindicates.
SPECIAL NOTE REGARDING FORWARD-LOOKING STATEMENTS
Item 7 — “Management’s Discussion and Analysis of Financial Condition and Results of Operations” — and other sections of this Annual Report onForm 10-K contain forward-looking statements (regarding future financial position, budgets, business strategy, projected costs, plans, objectives of management for future operations, and other similar matters) that involve risks and uncertainties. Forward-looking statements can be identified by words such as “anticipates”, “expects”, “believes”, “plans”, “predicts”, and similar terms. Forward-looking statements are not guarantees of future performance and there are important factors that could cause our actual results, level of activity, performance or achievements to differ materially from the results, level of activity, performance or achievements expressed or implied by the forward-looking statements including, but not limited to, changes in general economic and financial market conditions, fluctuations in the value of assets under management, our ability to close and integrate our acquisition of Fortigent Holdings Company, Inc., effects of competition in the financial services industry, changes in the number of our financial advisors and institutions and their ability to effectively market financial products and services, the effect of current, pending and future legislation and regulation and regulatory actions. In particular, you should consider the numerous risks outlined in Part I, Item 1A — “Risk Factors”.
Although we believe the expectations reflected in the forward-looking statements are reasonable, we cannot guarantee future results, level of activity, performance or achievements. You should not rely upon forward-looking statements as predictions of future events. Unless required by law, we will not undertake and we specifically disclaim any obligation to release publicly the result of any revisions which may be made to any forward-looking statements to reflect events or circumstances after the date of such statements or to reflect the occurrence of events, whether or not anticipated. In that respect, we wish to caution readers not to place undue reliance on any such forward-looking statements, which speak only as of the date made.
ii
PART I
Item 1.Business |
General Corporate Overview
We provide an integrated platform of proprietary technology, brokerage and investment advisory services to over 12,400approximately 12,800 independent financial advisors and financial advisors at financial institutions (our “advisors”) across the country, enabling them to successfully serviceserve their retail investors with unbiased,objective, conflict-free financial advice. In addition, we support approximately 4,000 financial advisors with customized clearing, advisory platforms and technology solutions. Our singular focus is to support our advisors with the front, middle and back-office support they need to serve the large and growing market for independent investment advice particularly in the mass affluent market (which we define as investors with $100,000-$1,000,000 in investable assets).and high-net-worth markets. We believe we are the only company that offers advisors the unique combination of an integrated technology platform, comprehensive self-clearing services and full open architecture access to leading financial products, all delivered in an environment unencumbered by conflicts from product manufacturing, underwriting or market making.
For over 20 years we have served and supported the independent advisor market. We currently supportare the market leader with the largest independent advisor base and the fourth largest overall advisor base in the United States. Through our advisors, we are also one of the largest distributors of financial products in the United States. Our scale is a substantial competitive advantage and enables us to more effectively attract and retain advisors. Our unique model allows us to invest more resources in our advisors increasingto help them manage complexity and increase their revenues andproductivity, creating a virtuous cycle of growth. We are headquartered in Boston and currently have over 2,500approximately 2,700 employees across our locationswith headquarters in Boston, Charlotte and San Diego.
Our Business
With our focus and scale, we are not only a beneficiary of the secular shift among advisors toward independence, but an active catalyst of this trend. We enable our advisors to provide their clients with high quality independent financial advice and investment solutions, and support our advisors in managing the complexity of their businesses by providing a comprehensive integrated platform of technology and clearing services. We provide these services through an open architecture product platform withoffering no proprietary manufactured products, which enableshelps ensure an unbiased,objective, conflict-free environment. Our business is dedicated exclusively to our advisors; we are not a market-maker nor do we offer investment banking or underwriting services. Additionally, we offer our advisors the highest average payout ratios among the five largest U.S. broker-dealers, as ranked by number of advisors, which we believe provides us with an important competitive advantage. Our business is dedicated exclusively to our advisors; we are not a market-maker nor do we offer investment banking or underwriting services.
The size of our organization and scalability of our solutions allow us to continually reinvest in our technology and clearing platforms, tailor our services to the needs of our advisors and provide them with an attractive value proposition. We believe that ourOur technology and service platforms allow our advisors to spend more time with their clients and enhanceefficiently manage and grow their businesses. Our flexible platform attracts many different types of advisors, such as independent financial advisors, registered investment advisors (“RIAs”) and advisors at small and mid-sized financial institutions. Furthermore, our wholly owned subsidiary LPL Financial LLC ("LPL Financial") is the only independent broker-dealer with an integrated platform servicing RIAs.
Our revenues are derived primarily from commissions and fees generated by our advisors. We also generate asset-based fees from our financial product sponsor relationships, our cash sweep programs and omnibus processing and networking services. Under our self-clearing platform, we custody the majority of client assets invested in these products, which includes providing statements, transaction processing and ongoing account management for which we receive a fee.fees.
Our Financial Advisors
Serving clients in communities across the nation, our advisors build long-term relationships with their clients by guiding them through the complexities of investment decisions, retirement solutions, financial planning and wealth-management. We support the evolution of our advisors’ businesses over time and provide a range of solutions as their needs change.
1
The relationship with our advisors is embodied in our Commitment Creed, which serves as a set of guiding principles for our relationships with our advisors. For more than 20 years it has been ingrained inthe foundation of our culture and reflects our singular focus on the advisors we serve. The size and growth of our business has benefited from this focus. Our advisor base has grown from 3,596 advisors in 2000
Advisors licensed with LPL Financial are able to 12,444 as of December 31, 2010, representing a Compound Annual Growth Rate (“CAGR”) of 13.2%. Our historical advisor growth rate does not guarantee that we will attract advisors at comparable rates in the future.
In return for a high level ofthe services provided by us,we provide, including, among others, transaction processing and technology services we provide to the advisors to support their daily activities, we typically retain a range of 10 to 15 percent of the commission and advisory fee revenue generated by our advisors and pay out the remaining 85 to 90 percent to them. In addition, advisors pay certain fees directly to us relating to technology and platform access, insurance coverage and licensing fees. The registered representative agreement is terminable by us without cause on 30 days notice and for cause immediately upon notice.
LPL Financial also supports stand-alone RIAs ("Independent RIAs") who conduct their advisory business through separate entities by establishing their own RIAs pursuant to the Investment Advisers Act of 1940, rather than using our corporate registered RIA. These Independent RIAs engage us for technology, clearing, regulatory and custody services, as well as access to certain of our investment platforms. In return, we charge fees to the Independent RIAs including a program fee based on the value of assets within these advisory accounts. In addition, Independent RIAs carry their brokerage license exclusively with LPL Financial and access our fully-integrated brokerage platform for those seeking to operate a dually-registered model.
Our advisors average over 1514 years of industry experience. This substantial industry experience allows us to focus on enhancing our advisors’ businesses without the need for basic training or subsidizing advisors that are new to the industry. Our independent advisors join us from a broad range of firms including wirehouses, regional and insurance broker dealers, banks and other independent firms. Our flexible business platform allows our advisors to choose the most appropriate business model to support their clients, whether they conduct brokerage business, offer brokerage and fee-based services on our corporate RIA platforms or provide fee-based services through their own RIAs.
Our independent advisors and RIAs are entrepreneurial independent contractors who marketdeliver their services through over 4,2004,100 branch offices. They are primarily located in rural and suburban areas and as such are viewed as local providers of independent advice. Approximately 70% of these advisors operate under their own brandbusiness name. We approve and assist these advisors with their own branding, marketing and promotion.
We believe we are the market leader in providing support to over 2,4002,200 advisors at more than 750approximately 670 banks and credit unions seeking to provide a broad array of services for their financial advisors. For these institutions, whose core capabilities may not include investment and financial planning services, or who find the technology, infrastructure and regulatory requirements to be cost prohibitive, we provide their financial advisors with the services they need to be successful, allowing the institutions to focus their energy and capital on their core businesses. In addition, we have expanded our technology and wealth management solutions to support trust departments enabling them to efficiently manage their assets.
2
We also provide support to approximately 4,000 additional financial advisors who are affiliated and licensed with insurance companies. These outsourcing arrangements provide customized clearing, advisory platforms and technology solutions that enable financial advisors at these insurance companies to efficiently provide a breadth of services to their client base.
3
Our Service Value Proposition
The core of our business is dedicated to meeting the evolving needs of our advisors and providing the platform and tools to grow and enhance the profitability of their businesses. We support our advisors by providing front, middle and back-office solutions through the four pillars of our distinct value proposition: enabling technology, comprehensive clearing and compliance services, practice management programs and training and independent research. The comprehensive and automated nature of our offering enables our advisors to focus on their clients while successfully and efficiently managing the complexities of running their own practice.
Enabling Technology
We provide our technology and service to advisors through BranchNet, our proprietary, integrated technology platform that is server-based and web-accessed. Using the BranchNet workstation, our advisors effectively manage all critical aspects of their businesses while remaining highly efficient and responsive to their clients’ needs. Time-consuming processes, such as account opening and management, document imaging, transaction execution, and account rebalancing, are automated to improve efficiency and accuracy. Substantially all of ourOur advisors utilize BranchNet as their core technology platform. Through BranchNet, our advisors have direct access to a fully-integratedfully integrated array of tools and support systems, including:
comprehensive account lookup for accounts and direct business data;
straight-through processing of trade orders and account maintenance requests and
secure and reliable data maintenance.
In addition to the account management capabilities of BranchNet, theour Resource Center, embedded within BranchNet, provides advisors with access to our research, training, compliance and support services and the ability to review products and develop marketing materials, including:
direct access to financial product information, exclusive research commentaries, detailed regulatory requirements, valuable marketing tools, operational details, comprehensive training and technical support;
client management and business development tools;
trading and research tools and
business management resources.
Many advisors also subscribe to premium features, such as performance reporting, financial planning and customized websites. Select third-party resources have been integrated into our technology software, enabling seamless access to important tools, broadening our range of offerings and reducing duplicate operational functions.
We believe BranchNet allows our advisors to transact and monitor their business more efficiently, lowering operating costs for their business. Once on BranchNet, advisors have the ability to choose which services suit their business plan, purchasing only the services that they believe are needed to grow their business.
Comprehensive Clearing and Compliance Services
We custody and clear the majority of our advisors’ transactions, providing an enhanced advisor experience and expedited processing capabilities. Our self-clearing platform enables us to better control client data, more efficiently process and report trades, facilitate platform development, reduce costs and ultimately enhance the quality of the services we provide our advisors. Our self-clearing platform also enables us to serve a wider variety of advisors, including RIAs and hybridIndependent RIAs.
4
3
Because we are self-clearing, we can address all facets of securities transaction processing, including:
order routing, trading support, execution and clearing, and position keeping;
regulatory and tax compliance and reporting and
investment accounting and recordkeeping.
All of these services are backed by our service center and operations organizations focused on providing timely, accurate and consistent support, with each employee committed to delivering best in classbest-in-class service. This shared commitment allows us to meet our financial advisors’ and institutions’ needs so they can best serve their clients.
In 2010, we launched Service360, a new service paradigm forinitially available to our top producing advisors. Service360 offers a wide array of organizational support, adopting a team-based approach to service, in which teams are dedicated to a defined set of advisors. This new service structure was fully implemented in December 2010, and now services over 6,7009,200 advisors with timely, accurate and efficient service delivered in a more personal, relationship-focused manner and with greater accountability and ownershipempowerment on the part of the service teams.
We have made sizeablecontinue to make substantial investments in our compliance offering to enableprovide our advisors to run a fully compliant office. Since 2000,strong compliance framework. Our ongoing investments include hiring and retaining experienced compliance and risk professionals and keeping our commitment of resources and focus on compliance have enabled us to maintain one of the best regulatory compliance records, based upon the number of regulatory events reported in the Financial Industry Regulatory Authority’s (“FINRA”) BrokerCheck Reports, among the ten largest U.S. broker-dealers, ranked by number of advisors.technology current. Several years ago we made the strategic decision to fully integrate our compliance tools into our technology platform to further enhance compliance effectiveness and scalability. All of this enables us to maintain our long term trend of having one of the best regulatory compliance records, as evidenced by the number of regulatory events reported in the Financial Industry Regulatory Authority's (“FINRA”) BrokerCheck Reports.
Approximately 300 risk and compliance employees assist our advisors through:
training and advising advisors on new products, new regulatory guidelines, compliance and risk management tools, security policies and procedures, anti-money laundering and best practices;
reviewing and approving advertising materials;
technology-enabled surveillance of trading activities and sales practices;
overseeing and monitoring of registered investment advisory activities;
securities registration and advisory and insurance licensing of advisors;
inspecting branch offices and advising on how to strengthen compliance procedures; and
continuing to invest in technology assisted supervisory tools.
Practice Management Programs and Training
Our practice management programs help our advisors enhance and grow their businesses. Our experience gives us the ability to benchmark the best practices of successful advisors and develop customized recommendations to meet the specific needs of an advisor’s business and market. Because of our scale, we are able to dedicate an experienced group of approximately 100120 professionals that work with our advisors to build and better manage their business and client relationships throughone-on-one consulting as well as group training. In addition, we hold over 130140 conferences and group training events annually for the benefit of our advisors. Our practice management and training services include:
5
personalized business consulting support that helps advisors enhance the value and operational efficiency of their businesses;
4
advisory and brokerage consulting and financial planning to support advisors in growing their businesses with our broad range of products and fee-based offerings, as well as wealth management services to assist advisors serving high net worth clients with comprehensive estate, tax, philanthropic, and financial planning processes;
marketing campaigns and consultation to enable advisors to build awareness of their services and capitalize on opportunities in their local markets;
transition services to help advisors establish independent practices and migrate client accounts to us and
training and consulting programs on topics including technology, use of advisory platforms and business development.
Independent Research
We provide our advisors with integrated access to comprehensive proprietary research on mutual funds, separate accounts, insurancealternative investments and annuities, asset allocation strategies, financial markets and the economy, among other areas. Our research team consists of 29 professionals withapproximately 35 professionals. Our investments team has an average of 1210 years of industry experience, dedicated to providing unbiased and conflict-free advice. Our research is designed to empower our advisors to give their clients thoughtful advice in an efficient manner. In particular, our research facilitates the growth of our advisory platform through generation of model portfolio andby providing asset allocation, overlay servicesinvestment recommendation guidance and the distribution ofcompletely packaged, solutions. turnkey portfolios.Our research team actively works with our product due diligence group in screeningto effectively vet the financial products offered through our platform. Our lack of proprietary products or investment banking services helps ensure that our research remains unbiased and objective. A substantial portion of our research is approved by our Marketing Regulatory Review organization for use with clients, allowing our advisors to leverage these materials to help clients understand complex investment topics and make informed decisions.
Our research enables advisors to:
keep abreast of changes in markets and the global economy, through our daily market update call and email, published materials, blogs and media presence;
proactively respond to emerging trends;
leverage the expertise and experience of our research team in building individual investment portfolios and
seek specific advice through our ASK (accurate, swift and knowledgeable) Research Team, a group of research professionals dedicated exclusively to advisor investment-research inquiries via phone and email.
With a focus on performance, service and transparency, our research team utilizes a wide spectrum of available tools to deliver timely perspectives on the ever-changing economic marketplace and products, enabling advisors to help their clients understand and adjust to the latest developments. Through its objective recommendations and portfolio management, the research group helps advisors meet a broad range of investor needs effectively. Our research enables advisors to:
Our Economic Value Proposition
We offer a compelling economic value proposition that is a key factor in our ability to attract and retain advisors. The independent channels pay advisors a greater share of brokerage commissions and advisory fees than the captive channels — generally80-90% compared to30-50%. Because of our scale and efficient operating model, we believe we offer our advisors the highest average payout ratios among the tenfive largest U.S. broker-dealers, ranked by number of advisors, which we believe provides us with an important competitive advantage. We believe our superior technology and service platforms enable our advisors to operate their practices at a lower cost than other independent advisors. As a result, we believe owners of practices associated with us earn meaningfully more pre-tax profit than owners of practices affiliated with other independent brokerage firms. We attribute this difference in profitability in part to lower fixed costs driven by the need for fewer staff at our associated practices.
6
Finally, as business owners, independent financial advisors, unlike captive advisors, also have the opportunity to
5
build equity in their own businesses.
We also believe our solutions enable our financial institutions to be more productive and therefore generate greater profitability relative to other financial institutions supported by third party firms.
Our Product Access
We do not manufacture any financial products. Instead, we provide our advisors open architecture access to a unique variety of commission, fee-based, cash and money market products and services. Our product due diligence group conducts extensive diligence on substantially all of the new products we offer, including annuities, mutual funds, exchange-traded funds, alternative investments and real estate investment trusts, alternative investments and mutual funds.trusts. Our platform provides access to over 8,50010,000 financial products, manufactured by over 400575 product sponsors. Typically, we enter into arrangements with these product sponsors pursuant to the sponsor’s standard distribution agreement.
The sales and administration of these products are facilitated through BranchNet and our Resource Center, which allow our advisors to access client accounts, product information, asset allocation models, investment recommendations, and economic insight as well as perform trade execution.
As of December 31, 2010,2011, advisory and brokerage assets totaled $315.6$330.3 billion, of which $93.0$101.6 billion was in advisory assets. Of the $330.3 billion billion in assets, $22.7 billion is attributable to our Independent RIA platform, which includes advisory and brokerage assets of 146 Independent RIA firms who either conduct investment advisory business on our platform or carry a dual license and manage brokerage accounts as well.
In 2010,2011, brokerage sales were over $26 billion, including over $9 billion in mutual funds and $15 billion in annuities. Advisory sales were over $27$32 billion, which consisted primarily of mutual funds. As a result of this scale and significant distribution capabilities, we can offer leading products and services with attractive economics to our advisors.
Commission-Based Products
Commission-based products are those for which we and our advisors receive an upfront commission and, for certain products, a trailing commission. Our brokerage offerings include variable and fixed annuities, mutual funds, general securities, alternative investments, retirement and 529 education savings plans, fixed income and insurance. Our insurance offering is provided through LPL Insurance Associates, Inc. (“LPLIA”), a brokerage general agency which provides personalized advance case design,point-of-sale service and product support for a broad range of life, disability and long-term care products. As of December 31, 2010,2011, the total assets in our commission-based products were approximately $222.6$228.7 billion.
Fee-Based Advisory Platforms and Support
We have been an innovator in fee-based advisory solutions since the introduction of our Strategic Asset Management platform in 1991. Today we have five fee-based advisory platforms that provide centrally managed or customized solutions from which advisors can choose to meet the investment needs of their mass affluent and high net worth clients. The fee structure aligns the interests of our advisors with their clients, while establishing a valuable recurring revenue stream for the advisor and for us. Our fee-based platforms provide access to no-load/load-waived mutual funds, exchange-traded funds, stocks, bonds, conservative option strategies, unit investment trusts and no-load, institutional money managers and multi-manager variable annuities. We also provide third-party equity research and asset-management services as well as fee-based advisory and consulting services to retirement plans. As of December 31, 2010,2011, the total assets in these platforms were $93.0 billion.$101.6 billion.
Cash Sweep Programs
We assist our advisors in managing their clients’ cash balances through two primary cash sweep programs depending on account type: a money market sweep vehicle involving multiple money market fund providers and an insured bank deposit sweep vehicle. Our insured bank deposit sweep vehicle
7
allocates client cash balances across multiple non-affiliated banks to provide advisors with up to $1.5 million ($3.0 million joint) of insurance through the Federal Deposit Insurance Corporation (“FDIC”). As of December 31, 2010,2011, the total assets in our cash sweep programs, which are held within brokerage and advisory accounts, were approximately $19.1$22.4 billion.
6
Other Services
We provide a number of tools and services that enable advisors to the products above, we also offer trust, investment management oversightmaintain and custodial services for estates and families throughgrow their practice. Through our subsidiary, The Private Trust Company, N.A. (“PTC”("PTC"), we provide administrative and custodial services to trusts for estates and families. Under our unique model, the advisor may provide the trust with investment management services. We also are an industry leader in providing technology and open architecture investment management solutions to trust departments of financial institutions through Concord Capital Partners, Inc. and its subsidiaries ("Concord Wealth Management" or "CCP"). At December 31, 2011, CCP serviced $8.7 billion in trust assets for 61 institutions. These assets are not custodied by LPL Financial and are therefore not included in our reported brokerage and advisory assets.
Our Financial Model
We have a proven track record of strong financial performance. We have increased our annual Adjusted EBITDA for the past five consecutive years with only one decline in annual revenue in 2009 in conjunction with the major market downturn. We have experienced greater variability in our net income primarily due to amortization of purchased assets and interest expense from our senior secured credit facilities and subordinated notes, a result of our merger transaction in 2005 with TPG Capital and Hellman & Friedman LLC (collectively, the “Majority Holders”), and expenses associated with our acquisition integration and restructuring initiatives. In 2010, we generated a net loss due to equity issuance and other costs related to our initial public offering (“IPO”) that was completed in the fourth quarter. Accordingly, the presentation of net income CAGRCompound Annual Growth Rate ("CAGR") is not meaningful. Since 2005, we have grown our net revenues at a 17.2%5.1% CAGR, our Adjusted EBITDA at a 16.9%6.9% CAGR and our Adjusted Earnings at a 17.1%15.3% CAGR. In 2011, we grew our net revenues by 11.8%, our Adjusted EBITDA by 11.3%, and our Adjusted Earnings by 26.6% as compared to 2010. Our historical growth rates do not guarantee future results, levels of activity, performance or achievements. A reconciliation of non-GAAP measures Adjusted EBITDA and Adjusted Earnings, to GAAP measures, along with an explanation of these metrics, is provided in Item 7 — “Management’s Discussion and Analysis”.
As we demonstrated during the financial crisis of 2008 and 2009, our financial model has inherent resilience, and our overall financial performance is a function of the following favorable characteristics:
8
Our revenues stem from diverse sources, including advisor-generated commission and advisory fees as well as fees from product manufacturers, recordkeeping, cash sweep balances and other ancillary services. They are not concentrated by advisor, product or geography. For the year ended December 31, 2011, no single relationship with our independent advisor practices, banks, credit unions, or insurance companies accounted for more than 3% of our net revenues, and no single advisor accounted for more than 1% of our net revenues.
Furthermore, a majority of our revenue base is recurring in nature, with 63% recurring revenue in 2011.
A significant proportion of our revenues, such as software licensing, account and client fees, are not correlated with the equity financial markets.
The variable component of our cost base is directly linked to revenues generated by our advisors. Furthermore, the payout percentages are tied to advisor productivity levels.
Our profit margins are stable and should expand over time because we actively manage our general and administrative expenses.
We are able to operate with low capital expenditures and limited capital requirements, and as a result our cash flow is not encumbered.
We generate substantial free cash flow which we reinvest into our business.
7
Our Competitive Strengths
Significant Scale and Market LeadershipPosition. We are the established leader in the independent advisor market, which is our core business focus. Our scale enables us to benefit from the following dynamics:
We actively reinvest in our comprehensive technology platform and practice support, which further improves the productivity of our advisors.
As one of the largest distributors of financial products in the United States, we are able to obtain attractive economics from product manufacturers.
Among the five largest U.S. broker-dealers by number of advisors, we offer the highest average payout ratios to our advisors.
The combination of our ability to reinvest in the business and maintain highly competitive payout ratios allows us to attract and retain advisors successfully. This, in turn, drives our growth and leads to a virtuous cycle that reinforces our established scale advantage.
Unique Value Proposition for IndependentAdvisors. We deliver a comprehensive and integrated suite of products and services to support the practices of our independent advisors. We believe we are the only institution that offers a conflict-free, open architecture and scalable platform. The benefits of our purchasing power lead to high average payouts and greater economics to our advisors. Our platform also creates an entrepreneurial opportunity that empowers independent advisors to build equity in their businesses. This generates a significant opportunity to attract and retain highly qualified advisors who are seeking independence.
Unique Value Proposition for Institutions. We provide solutions to financial institutions, such as regional banks, credit unions and insurers, who seek to provide a broad array of services for their customers. We believe many institutions find the technology, infrastructure and regulatory requirements associated with delivering financial advice to be cost-prohibitive. We provide comprehensive solutions that enable financial advisors at these institutions to offer financial advice.
Ability to Profitably Serve the Mass-AffluentMarket. Our historic focus has been on advisors who serve the mass-affluent market. We have designed and integrated all aspects of our platforms and services to profitably meet the needs of these advisors. We believe there continues to be an attractive opportunity in the mass-affluent market, in part because wirehouses have not historically focused on this space. We believe our scale position will sustain and strengthen our competitive advantage in the mass-affluent market.
Ability to Serve a Broad Range of AdvisorModels. As a result of our integrated technology platform and the resulting flexibility, we are able to attract and retain advisors from multiple channels, including wirehouses, regional broker-dealers and other independent broker-dealers. This platform serves a variety of independent advisor models, including independent financial advisors, RIAs and Independent RIAs.
We are able to give our advisors flexibility in choosing how they conduct their business. This enables us to better retain our existing advisor base by facilitating their ability to transition among independent advisor models as preferences evolve within the market.
In addition, although we have grown through our focus on the mass-affluent market (investors with $100,000 or greater in investable assets), the breadth of our platform has facilitated growing penetration of the high net worth market. As of December 31, 2011, our advisors supported accounts with more than $1 million in assets that in the aggregate represented $52.2 billion in advisory and brokerage assets, 15.8% of our total. Although our advisors average production is typically below that of some of the wirehouse channel firms, our array of integrated technology and services can support advisors with significant production and compete directly with wirehouses.
These abilities results in advisor production retention of 96%, which we believe to be industry leading.
8
Experienced and Committed Senior ManagementTeam. We have an experienced and committed senior management team that provides stable and long-standing leadership for our business. On average, our senior management has 27 years of industry experience. The team has a track record of delivery and success as demonstrated in the company’s financial performance through the recent market downturn. As the current management team has played a significant role in building out the business, they have a fundamental and thorough understanding of the operations. The management team is aligned with stockholders and holds significant equity ownership in the company.
Our Sources of Growth
We expect to increase our revenue and profitability by benefiting from favorable industry trends and by executing strategies to accelerate our growth beyond that of the broader markets in which we operate.
Favorable Industry Trends
Growth in Investable Assets. According to Cerulli Associates, over the next four years, assets under management for the predominant market segments in the United States are anticipated to grow at 8.9% per year and retirement assets are expected to grow 6.6% per year (in part due to the retirement of the baby boomer generation and the resulting assets which are projected to flow out of retirement plans and into individual retirement accounts). In addition, individual retirement account ("IRA") assets are projected to grow from $4.8 trillion as of 2011 to $6.7 trillion by 2015.
Increasing Demand for Independent FinancialAdvice. Retail investors, particularly in the mass affluent market, are increasingly seeking financial advice from independent sources. We are highly focused on helping independent advisors meet the needs of the mass-affluent market, which constitutes a significant and underserved portion of investable assets, according to Cerulli Associates, and we believe presents significant opportunity for growth.
Advisor Migration to Independence. Independent channels are gaining market share from captive channels. We believe that we are not just a beneficiary of this secular shift, but an active catalyst in the movement to independence.
Macroeconomic Trends. While the current macroeconomic environment has shown volatility recently, we anticipate an appreciation in asset prices and a rise in interest rates in the long term. We expect that our business will benefit from growth in advisory and brokerage assets as well as increasing asset-based and cash sweep fees.
LPL-Specific Growth Opportunities
10
Ramp-up of Newly-Attracted Advisors. We predominately attract experienced advisors who have established practices. In our experience, it takes an average of three years for newly hired advisors to fully re-establish their practices and associated revenues. This seasoning process creates accelerated growth of revenue from new advisors.
Our Business Model has Inherent Economies ofScale. The largely fixed costs necessary to support our advisors delivers higher marginal profitability as client assets and revenue grow. Historically, this dynamic has been demonstrated through the growth in our operating margins.
Expansions of our Product & Service Offerings. Through our internally developed projects and synergies from opportunistic acquisitions we have further advanced our capabilities and servicing offerings in order to ensure we are continuing to provide a premium platform for our advisors.
9
Attracting New Advisors to Our Platform. We intend to grow the number of advisors — either independent or with financial institutions — who are served by our platform. Based on the number of financial advisors, we have only 3.9% market share of the approximately 320,000 financial advisors in the United States, according to Cerulli Associates, and we have the ability to attract seasoned advisors of any practice size and from any channel, including wirehouses, regional broker-dealers and other independent broker-dealers.
Opportunistic Pursuit of Acquisitions. We have a proven history of expanding our business through opportunistic acquisitions. In the past seven years, we have successfully completed six transactions providing scale and entry to adjacent markets. Our scalable business model and operating platform make us an attractive acquirer in a fragmented and consolidating market.
Competition
We believe we offer a unique and dedicated value proposition to independent financial advisors and financial institutions who are focused primarily on mass affluent investors.institutions. This value proposition is built upon the delivery of our services through our scale, independence and integrated technology, which we believe is not replicated in the industry, and as a result we do not have any direct competitors to our business model. For example, because we do not have any proprietary manufacturing products, we do not view firms that manufacture asset management products and other financial products as competitors.
We compete to attract and retain experienced and productive advisors with a variety of financial firms. Within the independent channel, the industry is highly fragmented, comprised primarily of small regional firms that rely on third-party custodians and technology providers to support their operations. Within theThe captive wirehouse channel which tends to consist of large nationwide firms with multiple lines of business competitorsthat have a focus on the highly competitive high-net-worth investor market. Competitors in this channel include Morgan Stanley Smith Barney LLC; Merrill Lynch, Pierce, Fenner, & Smith Incorporated; UBS Financial Services Inc.; and Wells Fargo Advisors, LLC; who typically focus on the highly competitive high net worth investor market.LLC. Competition for
advisors also includes regional firms, such as Edward D. Jones & Co., L.P. and Raymond James Financial Services, Inc. RIAs,Registered Investment Advisors (RIAs), who are licensed directly with the SEC and not through a broker-dealer, selectchoose third-party firms forto provide custodial services, and competitorsservices. Competitors in this space include Charles Schwab & Co. and, Fidelity Brokerage Services LLC.LLC and TD Ameritrade.
Our competitors who do not offer a complete solution for advisors are frequently enabled by third-party firms. Pershing LLC a subsidiaryand Albridge Solutions, subsidiaries of Bank of New York Mellon, offersoffer custodial services to independent firms and RIAs who are not self-clearing and to RIAs.offer technology solutions, respectively. Other examples include Albridge Solutions, a subsidiary of PNC Financial Services LLC, Advent Software, Inc. and Morningstar, Inc., who provide an array of technology and research resources.
Our advisors compete for clients with financial advisors of brokerage firms, banks, insurance companies, asset management and investment advisory firms. In addition, they also compete with a number of firms offering direct to investor on-line financial services and discount brokerage services, such as Charles Schwab & Co. and Fidelity Brokerage Services LLC.
Employees
As of December 31, 2010,2011, we had 2,5832,726 full-time employees. None of our employees are subject to collective bargaining agreements governing their employment with us. Our continued growth is dependent, in part, on our ability to recruit and retain skilled technical sales and professional personnel. We believe that our relationship with our employees is strong.
Our Corporate Structure
LPL Investment Holdings Inc. is the parent company of our collective businesses. Our original broker-dealer, LPL Financial, was formed in 1989. In 2005, investment funds affiliated with the Majority Holders acquired a majority ownership stake in LPL Investment Holdings Inc., with the remaining interest owned primarily by our founders, senior management and advisors.
In recent years we have grown our business through a number of opportunistic acquisitions. We strengthened our position as a leading independent broker-dealer through our acquisition on June 20, 2007 of Pacific Select Group, LLC (renamed LPL Independent Advisor Services Group, LLC) and its wholly owned subsidiaries: Mutual
10
Service Corporation (“MSC”), Associated Financial Group, Inc. (“AFG”), Associated Securities Corp. (“Associated”), Associated Planners Investment Advisory, Inc. (“APIA”) and Waterstone Financial Group, Inc. (“WFG”) (MSC, AFG, Associated, APIA and WFG, are collectively referred to herein as the “Affiliated Entities”). In September of 2009, we consolidated the operations of the Affiliated Entities with those of LPL Financial. The consolidation involved the transfer of securities licenses of certain registered representatives associated with the Affiliated Entities and their client accounts. Following the completion of these transfer activities, the registered representatives and client accounts that transferred are now associated with LPL Financial. On February 5, 2011,Forms BD-W for Associated and WFG were approved by the SEC and ason November 11, 2011, the Form BD-W for MSC was approved by the SEC. As a result, Associated, WFG, and WFGMSC are no longer registered as broker-dealers.
Our acquisitions of UVEST Financial Services Group, Inc. (“UVEST”), and IFMG Securities, Inc., Independent Financial Marketing Group, Inc. and LSC Insurance Agency of Arizona, Inc. (collectively “IFMG”) further expanded our reach in offering financial services through banks, savings and loan institutions and credit unions nationwide. In March 2011, we committed to a corporate restructuring plan to enhance our service offering, while generating efficiencies by consolidating the operations of UVEST with those of LPL Financial (See Item 7 — “Management’s Discussion and Analysis” for further discussion).
Our acquisition of certain assets of National Retirement Partners, Inc. (“NRP”) in February of 2011 enhanced our capabilities in the group retirement space. Our NRP advisors offer retirement products, consulting and investment services to retirement plan sponsors and plan participants as well as comprehensive financial services to plan participants. In June of 2011, we acquired Concord Capital Partners, Inc. (“CCP”) and its subsidiaries Concord Technology Services (“CTS”) and Concord Equity Group Advisors (“CEGA”, and together with CCP and CTS, “Concord Wealth Management”). Concord Wealth Management is an industry leader in providing technology and open architecture investment management solutions for trust departments of financial institutions. Through this acquisition, we will have the ability to support both the brokerage and trust business lines of current and prospective financial institutions. The acquisition will also create new expansion opportunities such as giving us the ability to custody personal trust assets within banks across the country. (See Item 7 — “Management’s Discussion and Analysis” for further discussion of our acquisitions of NRP and Concord Wealth Management.)
Our subsidiary, Independent Advisers Group Corporation (“IAG”), offers an investment advisory solution to insurance companies to support their financial advisors who are licensed with them. Our subsidiary, LPLIA, operates as a brokerage general agency which offers life, long-term care and disability insurance sales and services. Through our subsidiary PTC we offer trust, investment management oversight and custodial services for estates and families.
Regulation
The financial services industry is subject to extensive regulation by U.S. federal, state, and state regulatoryinternational government agencies and securities exchanges and bynon-U.S. government agencies or regulatory bodies and securities exchanges.as well as various self-regulatory organizations. We take an active leadership role in the development of the rules and regulations that govern our industry. Given the recent turmoil in the financial services industry, we anticipate continued heightened scrutiny and significant modifications in these rules and regulations. We strive to be at the forefront of influencing this change. Throughout our history we have also invested heavily, with the benefit of our scale, in our compliance functions to monitor our compliance with the numerous legal and regulatory requirements applicable to our business.
Broker-Dealer Regulation
LPL Financial is a registered broker-dealer with the SEC, a member of FINRA a member ofand various other self-regulatory organizations and a participant in various clearing organizations including the Depository Trust Company, the National Securities Clearing Corporation and the Options Clearing Corporation. LPL Financial is registered as a broker-dealer in each of the 50 states, the District of Columbia, Puerto Rico and the U.S. Virgin Islands.
Our subsidiariessubsidiary UVEST and MSC areis also a registered broker-dealersbroker-dealer with the SEC, and are membersis a member of FINRA. SimilarIn March of 2011, we committed to a corporate restructuring plan to enhance our service offering while generating efficiencies by consolidating the operations of UVEST with those of LPL Financial,Financial. Prior to this consolidation, UVEST conductsconducted business on a national basis; however it actsacted as an introducing firm usingand used a third-party firm for securities clearing and custody functions. Prior to the consolidation of the Affiliated Entities, MSC also conducted business on a national basis as an introducing firm, using a third-party firm for securities clearing and custody functions.
11
Broker-dealers are subject to rules and regulations covering all aspects of the securities business, including sales and trading practices, public offerings, publication of research reports, use and safekeeping of clients’ funds and securities, capital adequacy, recordkeeping and reporting, and the conduct of directors, officers and employees. Broker dealers are also regulated by state securities administrators in those jurisdictions where they do business. Compliance with many of the rules and regulations applicable to us involves a number of risks because rules and regulations are subject to varying interpretations. Regulators make periodic examinations and review annual, monthly and other reports on our operations, track record and financial condition. Violations of rules and regulations governing a broker dealer’s actions could result in censure, penalties and fines, the issuance ofcease-and-desist orders, the suspension or expulsion from the securities industry of such broker dealer or its officers or employees, or other similar adverse consequences. The rules of the Municipal Securities Rulemaking Board, which are enforced by the SEC and FINRA, apply to the municipal securities activities of LPL Financial UVEST and MSC.UVEST.
Our margin lending is regulated by the Federal Reserve Board’s restrictions on lending in connection with client purchases and short sales of securities, and FINRA rules also require suchour subsidiaries to impose maintenance requirements on the value of securities contained in margin accounts. In many cases, our margin policies are more stringent than these rules.
Significant new rules and regulations are likely to arise as a result of the Dodd-Frank Wall Street Reform and Consumer Protection Act (the “Dodd-Frank Act”), which was enacted in July 2010, including development by2010. Provisions of the SECDodd-Frank Act that may impact our business include, but are not limited to: the potential implementation of a newmore stringent fiduciary standard of conduct applicable tofor broker-dealers and investment advisors. These new rulesenhanced regulatory oversight of incentive compensation. Compliance with these provisions, including those related to executive compensation, have resulted in, and are likely to continue to result in, increased costs. Moreover, to the extent the Dodd-Frank Act impacts the operations, financial condition, liquidity and capital requirements of financial institutions with whom we do business, those institutions may seek to pass on increased costs, reduce their capacity to transact, or otherwise present inefficiencies in their interactions with us. The ultimate impact that the Dodd-Frank Act will have on us, the financial industry and the economy cannot be known until all such applicable regulations may adversely affect our business by increasing our costscalled for under the Dodd-Frank Act have been finalized and exposure to litigation.implemented.
Investment Adviser Regulation
As investment advisers registered with the SEC, our subsidiaries LPL Financial, UVEST, IAG, and IAGCEGA are subject to the requirements of the Investment Advisers Act of 1940, as amended (the "Advisers Act"), and the SEC’s regulations promulgated thereunder, as well as to examination by the SEC’s staff. Such requirements relate to, among other things, fiduciary duties to clients, performance fees, maintaining an effective compliance program, solicitation arrangements, conflicts of interest, advertising, limitations on agency cross and principal transactions between the advisor and advisory clients, recordkeeping and reporting requirements, disclosure requirements and general anti-fraud provisions. In addition,
The SEC is authorized to institute proceedings and impose sanctions for violations of the Advisers Act, ranging from fines and censure to termination of an investment adviser’s registration. Investment advisers also are subject to certain state securities laws and regulations. Non-compliance with the Advisers Act or other federal and state securities laws and regulations could result in investigations, sanctions, disgorgement, fines or other similar consequences.
ERISA Regulation
Certain of our subsidiaries are subject to ERISA, and Sections 4975(c)(1)(A), (B), (C) or (D) of the Internal Revenue Code, and to regulations promulgated thereunder, insofar as they are a “fiduciary” under ERISA with respect to benefit plan clients or otherwise deal with benefit plan clients. ERISA and applicable provisions of the Internal Revenue Code, impose certain duties on persons who are fiduciaries under ERISA, prohibit certain transactions involving ERISA plan clients (including, without limitation, employee benefit plans (as defined in Section 3(3) of ERISA), individual retirement accounts and Keogh plans) and provide monetary penalties for violations of these prohibitions.
Commodities and Futures Regulation
LPL Financial is licensed as a futures commission merchant (“FCM”) and commodity pool operator ("CPO")
12
with the Commodities FutureCommodity Futures Trading Commission (“CFTC”) and is a member of the National Futures Association (“NFA”). Although licensed as a FCM and a commodity pool operator,CPO, LPL Financial’s futures activities are limited to conducting business as a guaranteed introducing broker. LPL Financial is regulated by the CFTC and NFA. Violations of the rules of the CFTC and the NFA
13
could result in remedial actions including fines, registration terminations or revocations of exchange memberships. As a guaranteed introducing broker, LPL Financial clears commodities and futures products through ADM Investor Services International Limited (“ADM”), and all commodities accounts and related client positions are held by ADM.
Trust Regulation
Through our subsidiary, PTC, we offer trust, investment management oversight and custodial services for estates and families. PTC is chartered as a non-depository national banking association. As a limited purpose national bank, PTC is regulated and regularly examined by the Office of the Comptroller of the Currency (“OCC”). PTC files reports with the OCC within 30 days after the conclusion of each calendar quarter. Because the powers of PTC are limited to providing fiduciary services and investment advice, it does not have the power or authority to accept deposits or make loans. For this reason, trust assets under PTC’s management are not insured by the FDIC.
As PTC is not a “bank” as defined under the Bank Holding Company Act of 1956, neither it nor its parent, PTC Holdings, Inc., nor PTC is regulated by the Board of Governors of the Federal Reserve System as a bank holding company. However, because it is subject to regulation by the OCC, PTC is subject to various laws and regulations enforced by the OCC, such as capital adequacy, change of control restrictions and regulations governing fiduciary duties, conflicts of interest, self-dealing and anti-money laundering. For example, the Change in Bank Control Act, as implemented by OCC supervisory policy, imposes restrictions on parties who wish to acquire a controlling interest in a trust company or the holding company of a trust company such as LPL Investment Holdings Inc. In general, an acquisition of 10% or more of our common stock, or an acquisition of “control” as defined in OCC regulations, would require OCC approval. These laws and regulations are designed to serve specific bank regulatory and supervisory purposes and are not meant for the protection of PTC, LPL Financial or its stockholders.
Regulatory Capital
The SEC, FINRA, OCC, CFTC and the NFA have stringent rules and regulations with respect to the maintenance of specific levels of net capital by regulated entities. Generally, a broker-dealer’s net capital is net worth plus qualified subordinated debt less deductions for certain types of assets. The net capital rule under the Exchange Act requires that at least a minimum part of a broker-dealer’s assets be maintained in a relatively liquid form. Because LPL Financial is registered as a guaranteed introducing broker for commoditiesFCM and futures that is also a registered broker-dealer,as such, CFTC rules requirepermit us to complymeet CFTC net capital requirements by complying with higherthe net capital requirements of the net capital rule under the Exchange Act.
The SEC, FINRA and CFTC impose rules that require notification when net capital falls below certain predefined criteria. These rules also dictate the ratio of debt to equity in the regulatory capital composition of a broker-dealer, and constrain the ability of a broker-dealer to expand its business under certain circumstances. If a broker-dealer fails to maintain the required net capital, it may be subject to suspension or revocation of registration by the applicable regulatory agency, and suspension or expulsion by these regulators ultimately could lead to the broker-dealer’s liquidation. Additionally, the net capital rule and certain FINRA rules impose requirements that may have the effect of prohibiting a broker-dealer from distributing or withdrawing capital, and that require prior notice to the SEC and FINRA for certain capital withdrawals. All of our subsidiaries that are subject to net capital rules have been, and currently are, in compliance with those rules and have net capital in excess of the minimum requirements.
Anti-Money Laundering
The USA PATRIOT Act of 2001 (the “PATRIOT Act”) contains anti-money laundering and financial transparency laws and mandates the implementation of various regulations applicable to broker-dealers, FCMs and other financial services companies. Financial institutions subject to the PATRIOT
14
Act generally must have anti-money laundering procedures in place, implement specialized employee training programs, designate an anti-money laundering compliance officer and are audited periodically by an independent party to test the effectiveness of compliance. We have established policies, procedures and systems designed to comply with these regulations.
13
Privacy
Regulatory activity in the areas of privacy and data protection continues to grow worldwide and is generally being driven by the growth of technology and related concerns about the rapid and widespread dissemination and use of information. WeTo the extent they are applicable to us, we must comply with these global, federal, and state information-related laws and regulations, including, but not limited to,for example, those in the United States, such as the 1999 Gramm-Leach-Bliley Act, SECRegulation S-P and the Fair Credit Reporting Act of 1970, as amended,amended.
Financial Information about Geographic Areas
Our revenues for fiscal years ended December 31, 2011, 2010 and 2009 were derived from our operations in the 2003 Fair and Accurate Credit Transactions Act, to the extent they are applicable to us.United States.
Trademarks
LPL Financial®, LPL®, LPL Career Match®, the LPL Financial logo, LPL Partners Program®, Integrated Advisory Services®, Manager Access Select®, OMP®, DO IT SMARTER®, Manager Access Network®, BranchNet®, National Retirement Partners®, and BranchNetNRP National Retirement Partners®, are our registered trademarks. Applications for registered trademarks are pending for DO IT SMARTER and Manager Access Network. Service360tmtm, LPL Financial AdvisorFirsttmtm, ClientsFirsttmtm, LPL Financial RolloverNettm, LPL Accounttm, Montagetm, Mosaictm, INVIEW Dashboardtm, Symphonytm and LPL AccountModel Wealth Portfoliotmtm are unregistered trademarks that we use as well.
Item 1A.Risk Factors |
Risks Related to Our Business and Industry
We depend on our ability to attract and retain experienced and productive advisors.
We derive a large portion of our revenues from commissions and fees generated by our advisors. Our ability to attract and retain experienced and productive advisors has contributed significantly to our growth and success, and our strategic plan is premised upon continued growth in the number of our advisors. If we fail to attract new advisors or to retain and motivate our current advisors, our business may suffer.
The market for experienced and productive advisors is highly competitive, and we devote significant resources to attracting and retaining the most qualified advisors. In attracting and retaining advisors, we compete directly with a variety of financial institutions such as wirehouses, regional broker-dealers, banks, insurance companies and other independent broker-dealers. If we are not successful in attracting or retaining highly qualified advisors, we may not be able to recover the expense involved in attracting and training these individuals. There can be no assurance that we will be successful in our efforts to attract and retain the advisors needed to achieve our growth objectives.
Our financial condition and results of operations may be adversely affected by marketfluctuations and other economic factors.
Our financial condition and results of operations may be adversely affected by market fluctuations and other economic factors. Significant downturns and volatility in equity and other financial markets have had and could continue to have an adverse effect on our financial condition and results of operations.
General economic and market factors can affect our commission and fee revenue. For example, a decrease in market levels can:
reduce new investments by both new and existing clients in financial products that are linked to the stock market, such as variable life insurance, variable annuities, mutual funds and managed accounts;
reduce trading activity, thereby affecting our brokerage commissions;
reduce the value of advisory and brokerage assets, thereby reducing asset-based fee income and
14
motivate clients to withdraw funds from their accounts, reducing advisory and brokerage assets, advisory fee revenue and asset-based fee income.
In addition, because certain of our expenses are fixed, our ability to reduce them over short periods of time is limited, which could negatively impact our profitability.
Significant interest rate changes could affect our profitability and financialcondition.
Our revenues are exposed to interest rate risk primarily from changes in the interest rates payable to us from banks participating in our cash sweep program. In the current low interest rate environment, our revenue from our cash sweep program has declined and may decline further due to changes in interest rates or clients moving assets out of our cash sweep program. We may also be limited in the amount we can reduce interest rates payable to clients in our cash sweep program and still offer a competitive return. Furthermore, a sustained low interest rate environment may have a negative impact upon our ability to renegotiate contracts with banks participating in our cash sweep program.
Lack of liquidity or access to capital could impair our business and financialcondition.
Liquidity, or ready access to funds, is essential to our business. We expend significant resources investing in our business, particularly with respect to our technology and service platforms. In addition, we must maintain certain levels of required capital. As a result, reduced levels of liquidity could have a significant negative effect on us. Some potential conditions that could negatively affect our liquidity include:
illiquid or volatile markets;
diminished access to debt or capital markets or
unforeseen cash or capital requirements, adverse legal settlements or judgments (including, among others, risks associated with auction rate securities).
The capital and credit markets continue to experience varying degrees of volatility and disruption. In some cases, the markets have exerted downward pressure on availability of liquidity and credit capacity for businesses similar to ours. Without sufficient liquidity, we could be required to curtail our operations, and our business would suffer.
Notwithstanding the self-funding nature of our operations, we may sometimes be required to fund timing differences arising from the delayed receipt of client funds associated with the settlement of client transactions in securities markets. These timing differences are funded either with internally generated cash flow or, if needed, with funds drawn under theour revolving credit facility, at the holding company,and/or uncommitted lines of credit at our broker-dealer subsidiary LPL Financial.
In the event current resources are insufficient to satisfy our needs, we may need to rely on financing sources such as bank debt. The availability of additional financing will depend on a variety of factors such as
16
market conditions;
the general availability of credit;
the volume of trading activities;
the overall availability of credit to the financial services industry;
our credit ratings and credit capacity and
the possibility that our stockholders, advisors or lenders could develop a negative perception of our long-or short-term financial prospects if the level of our business activity decreases due to a market downturn. Similarly, our access to funds may be impaired if regulatory authorities or rating organizations take negative actions against us.
15
Disruptions, uncertainty or volatility in the capital and credit markets may also limit our access to capital required to operate our business. Such market conditions may limit our ability to satisfy statutory capital requirements, generate commission, fee and other market-related revenue to meet liquidity needs and access the capital necessary to grow our business. As such, we may be forced to delay raising capital, issue different types of capital than we would otherwise, less effectively deploy such capital or bear an unattractive cost of capital, which could decrease our profitability and significantly reduce our financial flexibility.
If the counterparties to the derivative instruments we use to hedge our interest raterisk default, we may be exposed to risks we had sought to mitigate.
We use derivative instruments to hedge our interest rate risk. If our counterparties fail to honor their obligations under the derivative instruments, we could be subject to the risk of loss and our hedges of the interest rate risk will be ineffective. That failure could have an adverse effect on our financial condition, results of operations and cash flows that could be material. For the names of key counterparties upon which we currently rely, see “Management’s Discussion and Analysis of Financial Condition and Results of Operations — Quantitative and Qualitative Disclosures About Risk — Interest Rate Risk”.
A loss of our marketing relationships with manufacturers of financial products could harm our relationship with our advisors and, in turn, their clients.
We operate on an open architectureopen-architecture product platform withoffering no proprietary financial products. To help our advisors meet their clients’ needs with suitable investment options, we have relationships with most of the industry-leading providers of financial and insurance products. We have sponsorship agreements with some manufacturers of fixed and variable annuities and mutual funds that, subject to the survival of certain terms and conditions, may be terminated by the manufacturer upon notice. If we lose our relationships with one or more of these manufacturers, our ability to serve our advisors and, in turn, their clients, and our business may be materially and adversely affected.
Our business could be materially adversely affected as a result of the risks associated with acquisitions and investments.
We have made acquisitions in the past and may pursue further acquisitions in the future. These acquisitions are accompanied by risks. For instance, an acquisition could have a negative effect on our financial and strategic position and reputation or the acquired business could fail to further our strategic goals. Moreover, we may not be able to successfully integrate acquired businesses into ours, and therefore we may not be able to realize the intended benefits from an acquisition. We may have a lack of experience in new markets, products or technologies brought on by the acquisition and we may have an initial dependence on unfamiliar supply or distribution partners. An acquisition may create an impairment of relationships with customers or suppliers of the acquired business or our advisors or suppliers. All of these and other potential risks may serve as a diversion of our management's attention from other business concerns, and any of these factors could have a material adverse effect on our business.
Risks Related to Our Regulatory Environment
Regulatory developments and our failure to comply with regulations could adverselyaffect our business by increasing our costs and exposure to litigation, affecting ourreputation and making our business less profitable.
Our business is subject to extensive U.S. regulation and supervision, including securities and investment advisory services. The securities industry in the United States is subject to extensive regulation under both federal and state laws. Our broker-dealer subsidiary, LPL Financial, is:
registered as a broker-dealer with the SEC, each of the 50 states, and the District of Columbia, Puerto Rico and the U.S. Virgin Islands;
registered as an investment advisor with the SEC;
a member of FINRA;
regulated by the CFTC with respect to the futures and commodities trading activities it conducts as an
16
introducing broker and
a member of the NASDAQ Global Select Market (“NASDAQ”) and the Chicago Stock Exchange.
Much of the regulation of broker-dealers has been delegated to self-regulatory organizations (“SROs”), namely FINRA and the Municipal Securities Rulemaking Board (“MSRB”). The primary
17
regulators of LPL Financial are FINRA, and for municipal securities, the MSRB.Municipal Securities Rulemaking Board (“MSRB”). The CFTC has designated the NFANational Futures Association ("NFA") as LPL Financial’s primary regulator for futures and commodities trading activities.
The SEC, FINRA, CFTC, OCC, various securities and futures exchanges and other U.S. governmental or regulatory authorities continuously review legislative and regulatory initiatives and may adopt new or revised laws and regulations. There can also be no assurance that other federal or state agencies will not attempt to further regulate our business. These legislative and regulatory initiatives may affect the way in which we conduct our business and may make our business model less profitable.
Our ability to conduct business in the jurisdictions in which we currently operate depends on our compliance with the laws, rules and regulations promulgated by federal regulatory bodies and the regulatory authorities in each of these jurisdictions. Our ability to comply with all applicable laws, rules and regulations is largely dependent on our establishment and maintenance of compliance, audit and reporting systems and procedures, as well as our ability to attract and retain qualified compliance, audit and risk management personnel. While we have adopted policies and procedures reasonably designed to comply with all applicable laws, rules and regulations, these systems and procedures may not be fully effective, and there can be no assurance that regulators or third parties will not raise material issues with respect to our past or future compliance with applicable regulations.
Our profitability could also be affected by rules and regulations that impact the business and financial communities generally and, in particular, our advisors’ and their clients, including changes to the interpretation or enforcement of laws governing taxation (including the classification of independent contractor status of our advisors), electronic commerce, privacy and data protection. FailureFor instance, failure to comply with new rules and regulations, including in particular, rules and regulations that may arise pursuant to the Dodd-Frank Wall Street Reform and Consumer Protection Act (the "Dodd-Frank Act"), could subject us to regulatory actions or litigation and it could have a material adverse effect on our business, results of operations, cash flows or financial condition. Provisions of the Dodd-Frank Act that may impact our business include, but are not limited to: the potential implementation of a more stringent fiduciary standard for broker-dealers and enhanced regulatory oversight of incentive compensation. Compliance with these provisions, including those related to executive compensation, have resulted in, and are likely to continue to result in, increased costs. Moreover, to the extent the Dodd-Frank Act impacts the operations, financial condition, liquidity and capital requirements of financial institutions with whom we do business, those institutions may seek to pass on increased costs, reduce their capacity to transact, or otherwise present inefficiencies in their interactions with us. The ultimate impact that the Dodd-Frank Act will have on us, the financial industry and the economy cannot be known until all such applicable and regulations called for under the Dodd-Frank Act have been finalized and implemented.
In addition, new rules and regulations could result in limitations on the lines of business we conduct, modifications to our business practices, increased capital requirements or additional costs. For example, the U.S. Department of Labor has issuedstated that it plans to re-propose a proposed rule that, if re-proposed and adopted as currentlypreviously proposed, would broaden the circumstances under which we may be considered a “fiduciary” under Section 3(21) of the Employee Retirement Income Security Act of 1974, as amended (“ERISA”). and would impact the compensation we receive for retirement accounts.
We are subject to various regulatory ownership requirements, which, if not compliedwith, could result in the restriction of the ongoing conduct or growth, or evenliquidation of, parts of our business.
The business activities that we may conduct are limited by various regulatory agencies. Our membership agreement with FINRA may be amended by application to include additional business activities. This application process is time-consuming and may not be successful. As a result, we may be prevented from entering new potentially profitable businesses in a timely manner, or at all. In addition, as a member of FINRA, we are subject to certain regulations regarding changes in control of our ownership. Rule 1017 of the National Association of Securities Dealers (“NASD”) generally provides, among other things, that FINRA approval must be obtained in connection with any transaction resulting in a change in our equity ownership that results in one person or entity directly or indirectly owning or controlling 25% or more of our equity capital. Similarly, the OCC imposes advance approval
17
requirements for a change of control, and control is presumed to exist if a person acquires 10% or more of our common stock. These regulatory approval processes can result in delay, increased costsand/or impose additional transaction terms in connection with a proposed change of control, such as capital contributions to the regulated entity. As a result of these regulations, our future efforts to sell shares or raise additional capital may be delayed or prohibited.
We are subject to various regulatory capital requirements, which, if not compliedwith, could result in the restriction of the ongoing conduct or growth, or evenliquidation of, parts of our business.
The SEC, FINRA, CFTC, OCC and NFA have extensive rules and regulations with respect to capital requirements. As a registered broker-dealer, LPL Financial is subject toRule 15c3-1 (“Uniform Net Capital Rule”) under the Exchange Act, and related SRO requirements. The CFTC and NFA also impose net capital requirements. The Uniform Net Capital Rule specifies minimum capital requirements that are intended to ensure the general soundness and liquidity of broker-dealers. Because weour holding companies are not a registered broker-dealer, webroker-dealers, they are not subject to the Uniform Net Capital Rule. However, the ability of our abilityholding companies to withdraw capital from our broker-dealer subsidiaries could be restricted, which in turn could limit our ability to repay debt and redeem or purchase shares of our outstanding stock. A large operating loss or charge against net capital could adversely affect our ability to expand or even maintain our present levels of business.
Failure to comply with ERISA regulations could result in penalties against us.
We are subject to ERISA and Sections 4975(c)(1)(A), (B), (C) and (D) of the Internal Revenue Code of 1986, as amended (the “Internal Revenue Code”), and to regulations promulgated thereunder, insofar as we act as a “fiduciary” under ERISA with respect to benefit plan clients or otherwise deal with benefit plan clients. ERISA and applicable provisions of the Internal Revenue Code impose duties on persons who are fiduciaries under ERISA, prohibit specified transactions involving ERISA plan clients (including, without limitation, employee benefit plans (as defined in Section 3(3) of ERISA), individual retirement accounts and Keogh plans) and impose monetary penalties for violations of these prohibitions. Our failure to comply with these requirements could result in significant penalties against us that could have a material adverse effect on our business (or, in a worst case, severely limit the extent to which we could act as fiduciaries for any plans under ERISA).
Risks Related to Our Competition
We operate in an intensely competitive industry, which could cause us to loseadvisors and their assets, thereby reducing our revenues and net income.
We are subject to competition in all aspects of our business, including competition for our advisors and their clients, from:
asset management firms;
commercial banks and thrift institutions;
insurance companies;
other clearing/custodial technology companies and
brokerage and investment banking firms.
Many of our competitors have substantially greater resources than we do and may offer a broader range of services, including financial products, across more markets. Some operate in a different regulatory environment than we do, which may give them certain competitive advantages in the services they offer. For example, certain of our competitors only provide clearing services and consequently would not have any supervision or oversight liability relating to actions of their financial advisors. We believe that competition within our industry will intensify as a result of consolidation and acquisition activity and because new competitors face few barriers to entry.
If we fail to continue to attract highly qualified advisors or advisors licensed with us leave us to pursue other opportunities, or if current or potential clients of our advisors decide to use one of our competitors, we could face a significant decline in market share, commission and fee revenues and
19
net income. If we are required to increase
18
our payout of commissions and fees to our advisors in order to remain competitive, our net income could be significantly reduced.
Poor service or performance of the financial products that we offer or competitivepressures on pricing of such services or products may cause clients of our advisorsto withdraw their assets on short notice.
Clients of our advisors control their assets under management with us. Poor service or performance of the financial products that we offer or competitive pressures on pricing of such services or products may result in the loss of accounts. In addition, we must monitor the pricing of our services and financial products in relation to competitors and periodically may need to adjust commission and fee rates, interest rates on deposits and margin loans and other fee structures to remain competitive. Competition from other financial services firms, such as reduced commissions to attract clients or trading volume or higher deposit rates to attract client cash balances, could adversely impact our business. The decrease in revenue that could result from such an event could have a material adverse effect on our business.
We face competition in attracting and retaining key talent.
Our success and future growth depends upon our ability to attract and retain qualified employees. There is significant competition for qualified employees in the broker-dealer industry. We may not be able to retain our existing employees or fill new positions or vacancies created by expansion or turnover. The loss or unavailability of these individuals could have a material adverse effect on our business.
Moreover, our success depends upon the continued services of our key senior management personnel, including our executive officers and senior managers. The loss of one or more of our key senior management personnel, and the failure to recruit a suitable replacement or replacements, could have a material adverse effect on our business.
Risks Related to Our Debt
Our indebtedness could adversely affect our financial health and may limit ourability to use debt to fund future capital needs.
At December 31, 2010,2011, we had total indebtedness of $1.4 billion.$1.3 billion. Our level of indebtedness could increase our vulnerability to general adverse economic and industry conditions. It could also require us to dedicate a substantial portion of our cash flow from operations to payments on our indebtedness, thereby reducing the availability of our cash flow to fund working capital, capital expenditures and other general corporate purposes. In addition, our level of indebtedness may limit our flexibility in planning for changes in our business and the industry in which we operate, place us at a competitive disadvantage compared to our competitors that have less debt and limit our ability to borrow additional funds.
Our Third Amended and Restated Credit Agreement (“senior secured credit agreement”) requires quarterly repayments of our term loans. These payments equal approximately $3.5 million per quarter through March 31, 2013, $2.7 million per quarter through March 31, 2015 and $1.5 million per quarter through March 31, 2017. In addition, we have a revolving credit facility under our senior secured credit facility with an available balance of $163.5 million. This facility matures on June 28, 2013, and we will be obligated to repay any outstanding balance under this facility at that time. Our ability to make scheduled payments on or to refinance indebtedness obligations depends on our financial condition and operating performance, which are subject to prevailing economic and competitive conditions and to certain financial, business and other factors beyond our control.
We may not be able to maintain a level of cash flows from operating activities sufficient to permit us to pay the principal, premium, if any, and interest on our indebtedness. In addition, as discussed above, we are limited in the amount of capital that we can draw from our broker-dealer subsidiaries. If our cash flows and capital resources are insufficient to fund our debt service obligations, we could face substantial liquidity problems and could be forced to sell assets, seek additional capital or seek to restructure or refinance our indebtedness. These alternative measures may not be successful or feasible. Our Third Amended and Restated Credit Agreement (“senior secured credit agreement”)agreement restricts our ability to sell assets. Even if we could consummate those sales, the proceeds that we
20
realize from them may not be adequate to meet any debt service obligations then due. Furthermore, if an event of default were to occur with respect to our senior secured credit agreement or other future indebtedness, our creditors could, among other things, accelerate the maturity of our indebtedness.
19
Our senior secured credit agreement permits us to incur additional indebtedness. Although our senior secured credit agreement contains restrictions on the incurrence of additional indebtedness, these restrictions are subject to a number of significant qualifications and exceptions, and the indebtedness incurred in compliance with these restrictions could be substantial. Also, these restrictions do not prevent us from incurring obligations that do not constitute “indebtedness” as defined in our senior secured credit agreement. To the extent new debt or other obligations are added to our currently anticipated debt levels, the substantial indebtedness risks described above would increase.
A credit rating downgrade would not impact the terms of our repayment obligations under our senior secured credit agreement. However, any such downgrade would negatively impact our ability to obtain comparable rates and terms on any future refinancing of our debt and could restrict our ability to refinance.
Restrictions under certain of our indebtednesssenior secured credit agreement may prevent us from taking actionsthat we believe would be in the best interest of our business.
incurring additional indebtedness or issuing disqualified stock or preferred stock;
paying dividends on, redeeming or repurchasing our capital stock;
making investments or acquisitions;
creating liens;
selling assets;
restricting dividends or other payments to us;
guaranteeing indebtedness;
engaging in transactions with affiliates and
consolidating, merging or transferring all or substantially all of our assets.
We are also required to meet specified financial ratios.leverage ratio and interest coverage ratio tests. These restrictions may prevent us from taking actions that we believe would be in the best interest of our business. Our ability to comply with these restrictive covenants will depend on our future performance, which may be affected by events beyond our control. If we violate any of these covenants and are unable to obtain waivers, we would be in default under the applicable agreementsour senior secured credit agreement and payment of the indebtedness could be accelerated. The acceleration of our indebtedness under oneour senior secured credit agreement may permit acceleration of indebtedness under other agreements that contain cross-default or cross-acceleration provisions. If our indebtedness is accelerated, we may not be able to repay that indebtedness or borrow sufficient funds to refinance it. Even if we are able to obtain new financing, it may not be on commercially reasonable terms or on terms that are acceptable to us. If our indebtedness is in default for any reason, our business could be materially and adversely affected. In addition, complying with these covenants may also cause us to take actions that are not favorable to holders of theour common stock and may make it more difficult for us to successfully execute our business strategy and compete against companies that are not subject to such restrictions.
Provisions of our senior secured credit agreement could discourage an acquisition ofus by a third party.
Certain provisions of our senior secured credit agreement could make it more difficult or more expensive for a third party to acquire us, and any of our future debt agreements may contain similar
21
provisions. Upon the occurrence of certain transactions constituting a change of control, all indebtedness under our senior secured credit agreement may be accelerated and become due and payable. A potential acquirer may not have sufficient financial resources to purchase our outstanding indebtedness in connection with a change of control.
20
Risks Related to Our Technology
We rely on technology in our business, and technology and execution failures couldsubject us to losses, litigation and regulatory actions.
Our business relies extensively on electronic data processing and communications systems. In addition to better serving our advisors and their clients, the effective use of technology increases efficiency and enables firms like ours to reduce costs. Our continued success will depend, in part, upon:
our ability to successfully maintain and upgrade the capability of our systems;
our ability to address the needs of our advisors and their clients by using technology to provide products and services that satisfy their demands and
our ability to retain skilled information technology employees.
Extraordinary trading volumes, beyond reasonably foreseeable spikes in volumes, could cause our computer systems to operate at an unacceptably slow speed or even fail. Failure of our systems, which could result from these or other events beyond our control, or an inability to effectively upgrade those systems or implement new technology-driven products or services, could result in financial losses, unanticipated disruptions in service to clients, liability to our advisors' clients and damage to our reputation.
Our operations rely on the secure processing, storage and transmission of confidential and other information in our computer systems and networks. Although we take protective measures and endeavor to modify them as circumstances warrant, the computer systems, software and networks may be vulnerable to unauthorized access, human error, computer viruses, denial-of-service attacks, or other malicious code and other events that could have aimpact the security, impact.reliability, and availability of our systems. If one or more of these events occur, this could jeopardize our own, our advisors’ or their clients’ or counterparties’ confidential and other information processed, stored in and transmitted through our computer systems and networks, or otherwise cause interruptions or malfunctions in our own, our advisors’ or their clients’, our counterparties’ or third parties’ operations. We may be required to expend significant additional resources to modify our protective measures, to investigate and remediate vulnerabilities or other exposures or to make required notifications, and we may be subject to litigation and financial losses that are either not insured or are not fully covered through any insurance we maintain.
The securities settlement process exposes us to risks that may expose our advisorsand us to adverse movements in price.
LPL Financial, one of our subsidiaries, provides clearing services and trade processing for our advisors and their clients and certain financial institutions. Broker-dealers that clear their own trades are subject to substantially more regulatory requirements than brokers that outsource these functions to third-party providers. Errors in performing clearing functions, including clerical, technological and other errors related to the handling of funds and securities held by us on behalf of our advisors' clients, could lead to censures, fines or other sanctions imposed by applicable regulatory authorities as well as losses and liability in related lawsuits and proceedings brought by our advisors’ clients and others. Any unsettled securities transactions or wrongly executed transactions may expose our advisors and us to adverse movements in the prices of such securities.
Our networks may be vulnerable to security risks.
The secure transmission of confidential information over public networks is a critical element of our operations. As part of our normal operations, we maintain and transmit confidential information about clients of our advisors as well as proprietary information relating to our business operations. Our application service provider systems maintain and process confidential data on behalf of advisors
22
and their clients, some of which is critical to our advisors’ business operations. If our application service provider systems are disrupted or fail for any reason, or if our systems or facilities are infiltrated or damaged by unauthorized persons, our advisors could experience data loss, financial loss, harm to reputation and significant business interruption. In addition, vulnerabilities of our external service providers could pose security risks to client information. If any such a disruption or failure occurs, we may be exposed to unexpected liability, advisorsadvisors' clients may withdraw their assets, our reputation may be tarnished and there could be a material adverse effect on our business.
21
Our networks may be vulnerable to unauthorized access, computer viruses and other security problems in the future. We rely on our advisors and employees to comply with our policies and procedures to safeguard confidential data. The failure of our advisors and employees to comply with such policies and procedures could result in the loss or wrongful use of their clients’ confidential information or other sensitive information. In addition, even if we and our advisors comply with our policies and procedures, persons who circumvent security measures could wrongfully use our confidential information or clients’ confidential information or cause interruptions or malfunctions in our operations. Such loss or use could, among other things:
seriously damage our reputation;
allow competitors access to our proprietary business information;
subject us to liability for a failure to safeguard client data;
result in the termination of relationships with our advisors;
subject us to regulatory sanctions or burdens, based on the authority of the SEC and FINRA to enforce regulations regarding business continuity planning;
result in inaccurate financial data reporting and
require significant capital and operating expenditures to investigate and remediate the breach.
Failure to maintain technological capabilities, flaws in existing technology,difficulties in upgrading our technology platform or the introduction of acompetitive platform could have a material adverse effect on our business.
We depend on highly specialized and, in many cases, proprietary technology to support our business functions, including among others:
securities trading and custody;
portfolio management;
customer service;
accounting and internal financial processes and controls and
regulatory compliance and reporting.
In addition, our continued success depends on our ability to effectively adopt new or adapt existing technologies to meet client, industry and regulatory demands. We might be required to make significant capital expenditures to maintain competitive technology. For example, we believe that our technology platform, particularly our BranchNet system, is one of our competitive strengths, and our future success will depend in part on our ability to anticipate and adapt to technological advancements required to meet the changing demands of our advisors. The emergence of new industry standards and practices could render our existing systems obsolete or uncompetitive. Any upgrades or expansions may require significant expenditures of funds and may also cause us to suffer system degradations, outages and failures. There cannot be any assurance that we will have sufficient funds to adequately update and expand our networks, nor can there be any assurance that any upgrade or expansion attempts will be successful and accepted by our current and prospective advisors. If our technology systems were to fail and we were unable to recover in a timely way, we would be unable to fulfill critical business functions, which could lead to a loss of advisors and could harm our reputation. A technological breakdown could also interfere with our ability to comply with financial reporting and
23
other regulatory requirements, exposing us to disciplinary action and to liability to our advisors and their clients. There cannot be any assurance that another company will not design a similar platform that affects our competitive advantage.
22
Inadequacy or disruption of our disaster recovery plans and procedures in the eventof a catastrophe could adversely affect our business.
We have made a significant investment in our infrastructure, and our operations are dependent on our ability to protect the continuity of our infrastructure against damage from catastrophe or natural disaster, breach of security, loss of power, telecommunications failure or other natural or man-made events. A catastrophic event could have a direct negative impact on us by adversely affecting our advisors, employees or facilities, or an indirect impact on us by adversely affecting the financial markets or the overall economy. While we have implemented business continuity and disaster recovery plans and maintain business interruption insurance, it is impossible to fully anticipate and protect against all potential catastrophes. If our business continuity and disaster recovery plans and procedures were disrupted or unsuccessful in the event of a catastrophe, we could experience a material adverse interruption of our operations.
We rely on outsourced service providers to perform key functions.
We rely on outsourced service providers to perform certain key technology, processing and support functions. For example, we have an agreement with Thomson Reuters BETA Systems, a division of Thomson Reuters, under which they provide us operational support, including data processing services for securities transactions and back office processing support. Any significant failures by these service providers could cause us to incur losses and could harm our reputation. If we had to change these service providers, we would experience a disruption to our business. Although we believe we have the resources to make such transitions with minimal disruption, we cannot predict the costs and time for such conversions. We cannot provide any assurance that the disruption caused by a change in our service providers would not have a material adverse affect on our business.
Risks Related to Our Business Generally
Any damage to our reputation could harm our business and lead to a loss of revenuesand net income.
We have spent many years developing our reputation for integrity and superior client service, which is built upon our four pillars of support for our advisors: enabling technology, comprehensive clearing and compliance services, practice management programs and training, and independent research. Our ability to attract and retain advisors and employees is highly dependent upon external perceptions of our level of service, business practices and financial condition. Damage to our reputation could cause significant harm to our business and prospects and may arise from numerous sources, including:
litigation or regulatory actions;
failing to deliver minimum standards of service and quality;
compliance failures and
unethical behavior and the misconduct of employees, advisors or counterparties.
Negative perceptions or publicity regarding these matters could damage our reputation among existing and potential advisors and employees. Adverse developments with respect to our industry may also, by association, negatively impact our reputation or result in greater regulatory or legislative scrutiny or litigation against us. These occurrences could lead to loss of revenue and net income.
Our business is subject to risks related to litigation, arbitration actions andgovernmental and SRO investigations.
We are subject to legal proceedings arising out of our business operations, including lawsuits, arbitration claims, regulatory, governmental or SRO subpoenas, investigations and actions and other claims. Many of our legal claims are client initiated and involve the purchase or sale of investment securities. In our investment advisory programs, we have fiduciary obligations that require us and our advisors to act in the best interests of our advisors’ clients. We may face liabilities for actual or alleged breaches of legal duties to our advisors’ clients, in respect of issues related to the suitability of the financial products we make available in our open architecture product platform or the investment advice of our advisors based on their clients’ investment objectives (including, for example, auction rate securities or exchange traded funds). In addition, we, along with other industry participants, are subject
23
to risks related to litigation and settlements arising from market events such as the failures in the auction rate securities market. We may also become subject to claims, allegations and legal proceedings that we infringe or misappropriate intellectual property or other proprietary rights of others. In addition, we may be subject to legal proceedings related to employment matters, including wage and hour, discrimination or harassment claims. The outcome of any such actions cannot be predicted, and a negative outcome in such a proceeding could result in substantial legal liability, loss of intellectual property rights and injunctive or other equitable relief against us. Further, such outcome may cause us significant reputational harm and could have a material adverse effect on our business, results of operations, cash flows or financial condition.
Our risk management policies and procedures may not be fully effective in mitigatingour risk exposure in all market environments or against all types of risks.
We have adopted policies and procedures to identify, monitor and manage our operational risk. These policies and procedures, however, may not be fully effective. Some of our risk evaluation methods depend upon information provided by others and public information regarding markets, clients or other matters that are otherwise accessible by us. In some cases, however, that information may not be accurate, complete orup-to-date. Also, because our advisors work in small, decentralized offices, additional risk management challenges may exist. If our policies and procedures are not fully effective or we are not always successful in capturing all risks to which we are or may be exposed, we may suffer harm to our reputation or be subject to litigation or regulatory actions that could have a material adverse effect on our business and financial condition.
Misconduct and errors by our employees and our advisors, who operate in a decentralized-environment,decentralized environment, could harm our business.
Misconduct and errors by our employees and our advisors could result in violations of law by us, regulatory sanctionsand/or serious reputational or financial harm. We cannot always prevent misconduct and errors by our employees and our advisors, and the precautions we take to prevent and detect these activities may not be effective in all cases. Prevention and detection among our advisors, who are not our direct employees and some of whom tend to be located in small, decentralized offices, present additional challenges. There cannot be any assurance that misconduct and errors by our employees and advisors will not lead to a material adverse effect on our business.
Our insurance coverage may be inadequate or expensive.
We are subject to claims in the ordinary course of business. These claims may involve substantial amounts of money and involve significant defense costs. It is not always possible to prevent or detect activities giving rise to claims, and the precautions we take may not be effective in all cases.
We maintain voluntary and required insurance coverage, including, among others, general liability, property, director and officer, excess-SIPC, business interruption, errors and omissions,
25
excess entity errors and omissions and fidelity bond insurance. Recently, premium and deductible costs associated with certain insurance coverages have increased, coverage terms have become more restrictive and the number of insurers has decreased. While we endeavor to purchase coverage that is appropriate to our assessment of our risk, we are unable to predict with certainty the frequency, nature or magnitude of claims for direct or consequential damages. Our business may be negatively affected if in the future our insurance proves to be inadequate or unavailable. In addition, insurance claims may harm our reputation or divert management resources away from operating our business.
Changes in U.S. federal income tax law could make some of the products distributed byour advisors less attractive to clients.
Some of the financial products distributed by our advisors, such as variable annuities, enjoy favorable treatment under current U.S. federal income tax law. Changes in U.S. federal income tax law, in particular with respect to variable annuity products or with respect to tax rates on capital gains or dividends, could make some of these products less attractive to clients and, as a result, could have a material adverse effect on our business, results of operations, cash flows or financial condition.
24
Risks Related to Ownership of Our Common Stock
The Majority Holders will have the ability to control the outcome of matterssubmitted for stockholder approval and may have interests that differ from those ofour other stockholders.
As of December 31, 2010,2011, investment funds affiliated with the Majority Holders own approximately 62.9%61.9% of our common stock, or 56.2%55.9% on a fully diluted basis. The Majority Holders have significant influence over corporate transactions. So long as investment funds associated with or designated by the Majority Holders continue to own a significant amount of the outstanding shares of our common stock, even if such amount is less than 50%, the Majority Holders will continue to be able to strongly influence or effectively control our decisions, regardless of whether or not other stockholders believe that the transaction is in their own best interests. Such concentration of voting power could also have the effect of delaying, deterring or preventing a change of control or other business combination that might otherwise be beneficial to our stockholders. If the Majority Holders enter into a change in control transaction, certain members of our executive team have the contractual ability to terminate their employment within the thirty day period immediately following the twelve month anniversary of a change in control and receive severance payments.
In addition, the Majority Holders and their affiliates are in the business of making investments in companies and may, from time to time in the future, acquire interests in businesses that directly or indirectly compete with certain portions of our business. To the extent the Majority Holders invest in such other businesses, the Majority Holders may have differing interests than our other stockholders. The Majority Holders may also pursue acquisition opportunities that may be complementary to our business and, as a result, those acquisition opportunities may not be available to us.
The price of our common stock may be volatile and fluctuate substantially, whichcould result in substantial losses for our investors.
The market price of our common stock is likely to be highly volatile and may fluctuate substantially due to the following factors (in addition to the other risk factors described in this section):
actual or anticipated fluctuations in our results of operations;
variance in our financial performance from the expectations of equity research analysts;
conditions and trends in the markets we serve;
announcements of significant new services or products by us or our competitors;
additions or changes to key personnel;
the commencement or outcome of litigation;
changes in market valuation or earnings of our competitors;
the trading volume of our common stock;
future sale of our equity securities;
changes in the estimation of the future size and growth rate of our markets;
legislation or regulatory policies, practices or actions and
general economic conditions.
In addition, the stock markets in general have experienced extreme price and volume fluctuations that have often been unrelated or disproportionate to the operating performance of the particular companies affected. These broad market and industry factors may materially harm the market price of our common stock irrespective of our operating performance. In addition, in the past, following periods of volatility in the overall market and the market price of a company’s securities, securities class action litigation has often been instituted against the affected
25
company. This type of litigation, if instituted against us, could result in substantial costs and a diversion of our management’s attention and resources.
We are a holding company and rely on dividends, distributions and other payments,advances and transfers of funds from our subsidiaries to meet our debt service andother obligations.
We have no direct operations and derive all of our cash flow from our subsidiaries. Because we conduct our operations through our subsidiaries, we depend on those entities for dividends and other payments or distributions to meet any existing or future debt service and other obligations. The deterioration of the earnings from, or other available assets of, our subsidiaries for any reason could limit or impair their ability to pay dividends or other distributions to us. In addition, FINRA regulations restrict dividends in excess of 10% of a member firm’s excess net capital without FINRA’s prior approval. Compliance with this regulation may impede our ability to receive dividends from LPL Financial.our broker-dealer subsidiaries.
We dohave not anticipate that we will paypaid any cash dividends on shares of our common stock forduring the foreseeable future.last six years. Any future determination relating to our dividend policy will be made at the discretion of our board of directors and will depend on a number of factors, including future earnings, capital requirements, financial conditions, future prospects, contractual restrictions and covenants and other factors that our board of directors may deem relevant. Furthermore, our senior secured credit agreement places substantial restrictions on our ability to pay cash dividends. Any determination to pay dividends in the future will be at the discretion of our board of directors and will depend on results of operations, financial condition, contractual restrictions, restrictions imposed by applicable law and other factors our board of directors deems relevant. Accordingly, realization of a gain on your investment willmay depend solely on the appreciation
27
of the price of our common stock, which may never occur. Please see the section titled “Dividend Policy” for additional information.
Anti-takeover provisions in our certificate of incorporation and bylaws could preventor delay a change in control of our company.
Our certificate of incorporation and our bylaws contain certain provisions that may discourage, delay or prevent a change in our management or control over us that stockholders may consider favorable, including the following, some of which may only become effective when the Majority Holders collectively own less than 40% of our outstanding shares of common stock:
the division of our board of directors into three classes and the election of each class for three-year terms;
the sole ability of the board of directors to fill a vacancy created by the expansion of the board of directors;
advance notice requirements for stockholder proposals and director nominations;
limitations on the ability of stockholders to call special meetings and to take action by written consent;
when the Majority Holders collectively own 50% or less of our outstanding shares of common stock, the approval of holders of at least two-thirds of the shares entitled to vote generally on the making, alteration, amendment or repeal of our certificate of incorporation or bylaws, will be required to adopt, amend or repeal our bylaws, or amend or repeal certain provisions of our certificate of incorporation;
the required approval of holders of at least two-thirds of the shares entitled to vote at an election of the directors to remove directors and, following the classification of the board of directors, removal only for cause and
the ability of our board of directors to designate the terms of and issue new series of preferred stock, without stockholder approval, which could be used to institute a rights plan, or a poison pill, that would work to dilute the stock ownership or a potential hostile acquirer, likely preventing acquisitions that have not been approved by our board of directors.
The existence of the foregoing provisions and anti-takeover measures could limit the price that investors might be willing to pay in the future for shares of our common stock. They could also deter potential acquirers of our company, thereby reducing the likelihood that you could receive a premium for your common stock in the acquisition.
28
26
Item 1B. Unresolved Staff Comments
None.
Item 2. Properties
Our corporate offices are located in Boston, Massachusetts where we lease approximately 36,000 square feet of space under a lease agreement that expires on June 30, 2012, and approximately 21,000 square feet of space under a lease agreement that expires on May 31, 2013; in San Diego, California where we lease approximately 407,000 square feet of space under lease agreements that expire starting on May 31, 2012;February 28, 2014; in Charlotte, North Carolina where we lease a total of approximately 238,000 square feet of space under lease agreements expiring on November 30, 2016 and February 28, 2017.
We also entered into a new lease agreement on December 16, 2011, for approximately 415,000 square feet of space in San Diego, California and plan to move our San Diego offices to this location during 2014. We own approximately 4.4 acres of land in San Diego.
We lease smaller administrative and operational offices in various locations throughout the U.S. We believe that our existing properties are adequate for the current operating requirements of our business and that additional space will be available as needed.
Item 3. Legal Proceedings
For a discussion of legal proceedings, see The Consolidated Financial Statements and Supplementary Data - Notes to Consolidated Financial Statements - 14. Commitments and Contingencies, which are included as an annex to this Annual Report on Form 10-K.
Item 4. Mine Safety Disclosures
Not applicable.
27
PART II
29
| Item 5. | Market for Registrant’s Common Equity, Related StockholderMatters and Issuer Purchases of Equity Securities |
Market Information
The Company’s common stock commenced trading on the NASDAQ under the symbol “LPLA” on November 18, 2010. Prior to that time, there was no public market for our common stock. As of December 31, 2010, we have 1,191 stockholders of recordThe following table shows the high and 108,714,757 shares oflow sales prices for our common stock outstanding. The following table sets forthfor theintra-day high and low sale prices of the Company’s common stock from the IPO date of November 18, 2010 to December 31, 2010, periods indicated, as reported by the NASDAQ. The prices reflect inter-dealer prices and do not include retail markups, markdowns or commissions.
2010 | High | Low | ||||||
| Fourth Quarter (beginning November 18, 2010) | 37.22 | 31.50 | ||||||
| High | Low | ||||||
| 2011 | |||||||
| First Quarter | $ | 35.99 | $ | 32.15 | |||
| Second Quarter | 36.95 | 33.15 | |||||
| Third Quarter | 34.65 | 24.47 | |||||
| Fourth Quarter | 30.54 | 25.10 | |||||
| 2010 | |||||||
| Fourth Quarter (beginning November 18, 2010) | $ | 37.22 | $ | 31.50 | |||
The closing sale price of the Company's common stock as reported on the NASDAQ on December 30, 2011 was $30.54 per share. As of that date there were 487 holders of record of the Company's common stock based on information provided by our transfer agent. The number of stockholders of record does not reflect the number of individual or institutional stockholders that beneficially own the Company's stock because most stock is held in the name of nominees.
Performance Graph
The following graph compares the cumulative total stockholder return since November 18, 2010, the date our common stock began trading on the NASDAQ, with the Standard & Poor’s 500 Financial Sector Index (the "S&P 500") and the Dow Jones U.S. Financial Services Index.Index (the "Dow Jones"). The graph assumes that the value of the investment in our common stock, and the S&P 500 and the Dow Jones was $100 on November 18, 2010.
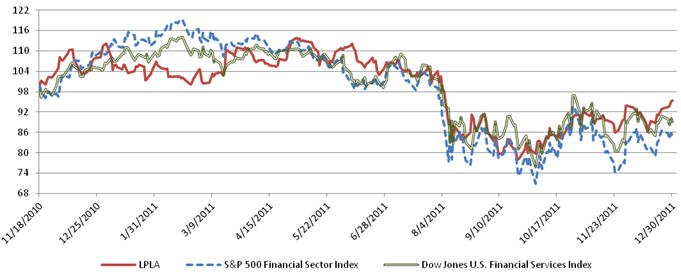
28
Dividends
We have not paid any dividends on our common stock during the past four years and we do not currently anticipate declaring or paying cash dividends onsix years. Any future determination relating to our common stock individend policy will be made at the foreseeable future. We currently intend to retain alldiscretion of our board of directors and will depend on a number of factors, including future earnings, if any, to finance operationscapital requirements, financial conditions, future prospects, contractual restrictions and repay debt.covenants and other factors that our board of directors may deem relevant. Our senior secured credit facilities containagreement contains restrictions on our activities, including paying dividends on our capital stock. For an explanation of these restrictions, see “Management’s Discussion and Analysis of Financial Condition and Results of Operations — Indebtedness”. In addition, FINRA regulations restrict dividends in excess of 10% of a member firm’s excess net capital without FINRA’s prior approval, potentially impeding our ability to receive dividends from LPL Financial. Any future determination relating to our dividend policy will be made at the discretion of our board of directors and will
30
Equity Compensation Plan Information
The table below sets forth as of December 31, 20102011 information on compensation plans under which our equity securities are authorized for issuance:
| Number of Securities | Number of Securities | |||||||||||
| to be Issued | Weighted Average | Remaining Available | ||||||||||
| upon Exercise of | Exercise Price of | for Future | ||||||||||
| Outstanding Options, | Outstanding Options, | Issuance under Equity | ||||||||||
Plan category | Warrants and Rights | Warrants and Rights | Compensation Plans | |||||||||
| Equity compensation plans approved by security holders | 10,253,843 | $ | 18.09 | 10,315,678 | (1) | |||||||
| Equity compensation plans not approved by security holders | 2,859,647 | 0.28 | — | (2) | ||||||||
| Total | 13,113,490 | $ | 14.21 | 10,315,678 | ||||||||
| Plan category | Number of Securities to be Issued upon Exercise of Outstanding Options, Warrants and Rights | Weighted Average Exercise Price of Outstanding Options, Warrants and Rights | Number of Securities Remaining Available for Future Issuance under Equity Compensation Plans | |||||||||
| Equity compensation plans approved by security holders | 9,025,055 | $ | 21.74 | 9,367,444 | (1) | |||||||
| Equity compensation plans not approved by security holders | 2,857,279 | 0.27 | — | (2) | ||||||||
| Total | 11,882,334 | $ | 16.58 | 9,367,444 | ||||||||
____________
| (1) | Includes shares available for future issuance under our 2010 Omnibus Equity Incentive Plan. Following our IPO, grants |
| (2) |
Issuance Under 2008 Nonqualified Deferred Compensation Plan
As of December 31, 2010,2011, we issued and had outstanding 2,823,452 restricted stock units under our 2008 Nonqualified Deferred Compensation Plan (the “Deferred Compensation Plan”). The purpose of the Deferred Compensation Plan is to permit employees and former employees of the Company and its subsidiaries thatwho held stock options issued under the 2005 Option Plans that were to expire in 2009 or 2010 to receive stock units under the Deferred Compensation Plan that are paid out at a later date in the form of shares of our common stock. The Deferred Compensation Plan is administered by the Board, or such other committee as may be appointed by the Board to administer the Deferred Compensation Plan (the “Administrator”). The Administrator has all powers necessary to administer the Deferred Compensation Plan, including discretionary authority to determine eligibility for benefits and to decide claims under the Deferred Compensation Plan.
Current and former employees of LPLIH and its subsidiaries thatwho held stock options under the 2005 Option Plans that were scheduled to expire in 2009 or 2010 (the “Expiring Options”) were able to make a one-time election to participate in the Deferred Compensation Plan. Participants elected to cancel their Expiring Options and receive stock units held in an account under the Deferred Compensation Plan. Each stock unit is a bookkeeping entry of which one stock unit is the economic equivalent of one share of our common stock. The Administrator created an account on each participant’s behalf to which the participant’s initial balance was credited, which will then be converted into stock units. A participant’s initial balance was an amount equal to the fair market value on December 31, 2008 of the shares underlying the stock options the participant elected to defer, less the aggregate exercise price of these options. The initial number of stock units in a participant’s account equals his or her initial balance divided by the fair market value of a share of our common stock on December 31, 2008.
Pursuant to the cash dividend paid, multiplied byterms of the number of stock units in the account on the day the cash dividend is paid. The amount credited to the account will then be converted into stock units, calculated by dividing the aggregate amount credited to the account by the fair market value of a share of our common stock on the date the dividend is paid. Fair market value is determined byDeferred Compensation Plan, the Board in good faith.
Issuance Under 2008 LPL Investment Holdings Inc. Financial Institution Incentive Plan
As of December 31, 2010,2011, we issued and had outstanding 36,19533,827 warrants to purchase common stock under our 2008 LPL Investment Holdings Inc. Financial Institution Incentive Plan (the “Financial Institution Incentive Plan”). Eligible participants under this plan include financial institutions in a position to make a significant contribution to the success of our firm. The plan is administered by the Board or such other committee as may be appointed by the Board to administer the plan. Subject to the approval of our compensation committee, the Financial Institution Incentive Plan, together with our 2008 Stock Option Plan and our Advisor Incentive Plan, provides for an allocation of up to 2% of the outstanding stock (determined at January 1st on a fully diluted basis), with an additional 2% available on the first anniversary, and an additional 2.5% available on the second and third anniversaries. The exercise price of warrants is equal to the fair market value on the grant date. Warrant awards vest in equal increments of 20.0% over a five-year period and expire on the 10th anniversary following the date of grant. The Financial Institution Incentive Plan has not been approved by security holders. Following our IPO, grants were no longer to be made under our Financial Institution Incentive Plan.
Recent Sales of Unregistered Securities
None.
30
Item 6. Selected Financial Data
32
| Number of | ||||||||
| Shares | Aggregate | |||||||
| Offered in the | Offering Price | |||||||
| IPO | (In thousands) | |||||||
| Common stock offered by selling stockholders | 15,657,482 | $ | 469,724 | |||||
| Common stock sold by Company pursuant to the over-allotment option granted to the underwriters | 1,465,748 | 43,972 | ||||||
| Common stock sold by stockholder pursuant to over-allotment option granted to the underwriters | 100,000 | 3,000 | ||||||
| Over-allotment option granted to the underwriters | 1,565,748 | 46,972 | ||||||
| Total shares offered in the IPO | 17,223,230 | $ | 516,696 | |||||
33
The following table sets forth our selected historical financial information for the past five fiscal years. The selected historical financial information presented below should be read in conjunction with the information included under the heading “Management’s Discussion and Analysis of Financial Condition and Results of Operations” and our consolidated financial statements and related notes included elsewhere in this Annual Report onForm 10-K. We have derived the consolidated statements of operations data for the years ended December 31, 2011, 2010 and 2009 and the consolidated statements of financial condition data as of December 31, 2011 and 2010 from our audited financial statements included in this Annual Report on Form 10-K. We have derived the consolidated statements of operations data for the years ended December 31, 2010, 2009 and 2008 and the consolidated statements of financial condition data as of December 31, 2010 and 2009 from our audited financial statements. We have derived the consolidated statements of operations data for the years ended December 31, 2007 and 2006 and consolidated statements of financial condition data as of December 31, 2009, 2008 2007 and 20062007 from our audited financial statements not included in this Annual Report onForm 10-K. Our historical results for any prior period are not necessarily indicative of results to be expected in any future period.
| For the Year Ended December 31, | ||||||||||||||||||||
| 2010 | 2009 | 2008 | 2007 | 2006(1) | ||||||||||||||||
Consolidated statements of operations data: | ||||||||||||||||||||
| Net revenues | $ | 3,113,486 | $ | 2,749,505 | $ | 3,116,349 | $ | 2,716,574 | $ | 1,739,635 | ||||||||||
| Total expenses | 3,202,335 | 2,676,938 | 3,023,584 | 2,608,741 | 1,684,769 | |||||||||||||||
| (Loss) Income from operations before (benefit from) provision for income taxes | (88,849 | ) | 72,567 | 92,765 | 107,833 | 54,866 | ||||||||||||||
| (Benefit from) Provision for income taxes | (31,987 | ) | 25,047 | 47,269 | 46,764 | 21,224 | ||||||||||||||
| Net (loss) income | (56,862 | ) | 47,520 | 45,496 | 61,069 | 33,642 | ||||||||||||||
Per share data: | ||||||||||||||||||||
| (Loss) Earnings per basic share | $ | (0.64 | ) | $ | 0.54 | $ | 0.53 | $ | 0.72 | $ | 0.41 | |||||||||
| (Loss) Earnings per diluted share | $ | (0.64 | ) | $ | 0.47 | $ | 0.45 | $ | 0.62 | $ | 0.35 | |||||||||
| As of December 31, | ||||||||||||||||||||
| 2010 | 2009 | 2008 | 2007 | 2006(1) | ||||||||||||||||
Consolidated statements of financial condition data: | ||||||||||||||||||||
| Cash and cash equivalents | $ | 419,208 | $ | 378,594 | $ | 219,239 | $ | 188,003 | $ | 245,163 | ||||||||||
| Total assets | 3,646,167 | 3,336,936 | 3,381,779 | 3,287,349 | 2,797,544 | |||||||||||||||
| Total debt(2) | 1,386,639 | 1,369,223 | 1,467,647 | 1,451,071 | 1,344,375 | |||||||||||||||
| As of and for the Year Ended December 31, | ||||||||||||||||||||
| 2010 | 2009 | 2008 | 2007 | 2006(1) | ||||||||||||||||
Other financial and operating data: | ||||||||||||||||||||
| Adjusted EBITDA (in thousands)(3) | $ | 413,113 | $ | 356,068 | $ | 350,171 | $ | 329,079 | $ | 247,912 | ||||||||||
| Adjusted Earnings (in thousands)(3) | $ | 172,720 | $ | 129,556 | $ | 108,863 | $ | 107,404 | $ | 65,372 | ||||||||||
| Adjusted Earnings per share(3) | $ | 1.71 | $ | 1.32 | $ | 1.09 | $ | 1.08 | $ | 0.68 | ||||||||||
| Gross margin (in thousands)(4) | $ | 937,933 | $ | 844,926 | $ | 953,301 | $ | 781,102 | $ | 508,530 | ||||||||||
| Gross margin as a % of net revenue(4) | 30.1 | % | 30.7 | % | 30.6 | % | 28.8 | % | 29.2 | % | ||||||||||
| Number of advisors(5) | 12,444 | 11,950 | 11,920 | 11,089 | 7,006 | |||||||||||||||
| Advisory and brokerage assets (in billions)(6) | $ | 315.6 | $ | 279.4 | $ | 233.9 | $ | 283.2 | $ | 164.7 | ||||||||||
| Advisory assets under management (in billions)(7) | $ | 93.0 | $ | 77.2 | $ | 59.6 | $ | 73.9 | $ | 51.1 | ||||||||||
| Insured cash account balances (in billions)(7) | $ | 12.2 | $ | 11.6 | $ | 11.2 | $ | 8.6 | $ | 5.8 | ||||||||||
| Money market account balances (in billions)(7) | $ | 6.9 | $ | 7.0 | $ | 11.2 | $ | 7.4 | $ | 3.5 | ||||||||||
34
| For the Year Ended December 31, | |||||||||||||||||||
| 2011 | 2010 | 2009 | 2008 | 2007 | |||||||||||||||
| (In thousands, except per share data) | |||||||||||||||||||
| Consolidated statements of operations data: | |||||||||||||||||||
| Net revenues | $ | 3,479,375 | $ | 3,113,486 | $ | 2,749,505 | $ | 3,116,349 | $ | 2,716,574 | |||||||||
| Total expenses | 3,196,690 | 3,202,335 | 2,676,938 | 3,023,584 | 2,608,741 | ||||||||||||||
| Income (loss) from operations before provision for (benefit from) income taxes | 282,685 | (88,849 | ) | 72,567 | 92,765 | 107,833 | |||||||||||||
| Provision for (benefit from) income taxes | 112,303 | (31,987 | ) | 25,047 | 47,269 | 46,764 | |||||||||||||
| Net income (loss) | 170,382 | (56,862 | ) | 47,520 | 45,496 | 61,069 | |||||||||||||
| Per share data: | |||||||||||||||||||
| Earnings (loss) per basic share | $ | 1.55 | $ | (0.64 | ) | $ | 0.54 | $ | 0.53 | $ | 0.72 | ||||||||
| Earnings (loss) per diluted share | $ | 1.50 | $ | (0.64 | ) | $ | 0.47 | $ | 0.45 | $ | 0.62 | ||||||||
| As of December 31, | |||||||||||||||||||
| 2011 | 2010 | 2009 | 2008 | 2007 | |||||||||||||||
| (In thousands) | |||||||||||||||||||
| Consolidated statements of financial condition data: | |||||||||||||||||||
| Cash and cash equivalents | $ | 720,772 | $ | 419,208 | $ | 378,594 | $ | 219,239 | $ | 188,003 | |||||||||
| Total assets | 3,816,326 | 3,646,167 | 3,336,936 | 3,381,779 | 3,287,349 | ||||||||||||||
| Total debt(1) | 1,332,668 | 1,386,639 | 1,369,223 | 1,467,647 | 1,451,071 | ||||||||||||||
31
| As of and for the Year Ended December 31, | |||||||||||||||||||
| 2011 | 2010 | 2009 | 2008 | 2007 | |||||||||||||||
| Other financial and operating data: | |||||||||||||||||||
| Adjusted EBITDA (in thousands)(2) | $ | 459,720 | $ | 413,113 | $ | 356,068 | $ | 350,171 | $ | 329,079 | |||||||||
| Adjusted Earnings (in thousands)(2) | $ | 218,585 | $ | 172,720 | $ | 129,556 | $ | 108,863 | $ | 107,404 | |||||||||
| Adjusted Earnings per share(2) | $ | 1.95 | $ | 1.71 | $ | 1.32 | $ | 1.09 | $ | 1.08 | |||||||||
| Gross Margin (in thousands)(3) | $ | 1,030,951 | $ | 937,933 | $ | 844,926 | $ | 953,301 | $ | 781,102 | |||||||||
| Gross Margin as a % of net revenue(3) | 29.6 | % | 30.1 | % | 30.7 | % | 30.6 | % | 28.8 | % | |||||||||
| Number of advisors(4) | 12,847 | 12,444 | 11,950 | 11,920 | 11,089 | ||||||||||||||
| Advisory and brokerage assets (in billions)(5) | $ | 330.3 | $ | 315.6 | $ | 279.4 | $ | 233.9 | $ | 283.2 | |||||||||
| Advisory assets under management (in billions)(6) | $ | 101.6 | $ | 93.0 | $ | 77.2 | $ | 59.6 | $ | 73.9 | |||||||||
| Insured cash account balances (in billions)(6) | $ | 14.4 | $ | 12.2 | $ | 11.6 | $ | 11.2 | $ | 8.6 | |||||||||
| Money market account balances (in billions)(6) | $ | 8.0 | $ | 6.9 | $ | 7.0 | $ | 11.2 | $ | 7.4 | |||||||||
____________
| (1) | ||
| Total debt consists of our senior secured credit facilities, senior unsecured subordinated notes, revolving line of credit facility and bank loans payable. |
| (2) | See “Management’s Discussion and Analysis of Financial Condition and Results of Operations — How We Evaluate Growth” for an explanation of non-GAAP measures Adjusted EBITDA, Adjusted Earnings and Adjusted Earnings per share. |
| (3) | Gross |
| (4) | Number of advisors is defined as those investment professionals who are licensed to do business with our broker-dealer subsidiaries. In 2011, we consolidated the operations of UVEST with LPL Financial which resulted, as expected, in attrition of 146 advisors. Excluding attrition from the integration of the UVEST platform, we added 549 net new advisors during the year ended December 31, 2011. In 2009, we attracted record levels of new advisors due to the dislocation in the marketplace that impacted many of our competitors. This record recruitment was offset by attrition related to the consolidation of the operations of the Affiliated |
| (5) | Advisory and brokerage assets are comprised of assets that are custodied, networked andnon-networked and reflect market movement in addition to new assets, inclusive of new business development and net of attrition. Such totals do not include the market value of client assets held in retirement plans administered by us and trust assets supported by Concord Wealth Management. |
| (6) | Advisory assets under management, insured cash account balances and money market balances are components of advisory and brokerage assets. |
32
Item 7. Management’s Discussion and Analysis of Financial Condition andResults of Operations
The following discussion of our financial condition and results of operations shouldbe read in conjunction with our consolidated financial statements and the notes tothose consolidated financial statements included in Item 8 of thisForm 10-K. This discussion contains forward-looking statements that involvesignificant risks and uncertainties. As a result of many factors, such as those setforth under “Risk Factors” and elsewhere in thisForm 10-K, our actualresults may differ materially from those anticipated in these forward-lookingstatements.
Overview
We provide an integrated platform of proprietary technology, brokerage and investment advisory services to over 12,400approximately 12,800 independent financial advisors and financial advisors at financial institutions (our "advisors")across the country, enabling them to successfully service their retail investors with unbiased, conflict-free financial advice. In addition, we support approximatelyover 4,000 financial advisors who are affiliated and licensed with insurance companies with customized clearing, advisory platforms and technology solutions. Our singular focus is to support our advisors with the front, middle and back-office support they need to serve the large and growing market for independent investment advice, particularly in the mass affluent market. We believe we are the only company that offers advisors the unique combination of an integrated technology platform, comprehensive self-clearing services and full open architecture access to leading financial products, all delivered in an environment unencumbered by conflicts from product manufacturing, underwriting or market making.
For over 20 years we have served the independent advisor market. We currently support the largest independent advisor base and we believe we have the fourth largest overall advisor base in the United States based on the latest information available as of the date this Annual Report on Form 10-K has been issued. Through our advisors, we are also one of the largest distributors of financial products in the United States. Our scale is a substantial competitive advantage and enables us to more effectively attract and retain advisors. Our unique model allows us to invest more resources in our advisors, increasing their revenues and creating a virtuous cycle of growth. We currently have approximately 2,700 employees with headquarters in Boston, Charlotte and San Diego.
Our Sources of Revenue
Our revenues are derived primarily from fees and commissions from products and advisory services offered by our advisors to their clients, a substantial portion of which we pay out to our advisors, as well as fees we receive from our advisors for use of our technology, custody and clearing platforms. We also generate asset-based fees through the distribution of financial products for a broad range of product manufacturers. Under our self-clearing platform, we custody the majority of client assets invested in these financial products, which includes providing statements, transaction processing and ongoing account management. In return for these services, mutual funds, insurance companies, banks and other financial product manufacturers pay us fees based on asset levels or number of accounts managed. We also earn fees for margin lending to our advisors’ clients.
We track recurring revenue, a characterization of net revenue and statistical measure, which we define to include our revenues from asset-based fees, advisory fees, our trailing commissions, cash sweep programs and certain transaction and other fees that are based upon accounts and advisors. Because recurring revenue is associated with asset balances, it will fluctuate depending on the market value of the asset balances and current interest rates. Accordingly, recurring revenue can be negatively impacted by adverse external market conditions. However, recurring revenue is meaningful to us despite these fluctuations because it is not based on transaction volumes or other activity-based fees, which are more difficult to predict, particularly in declining or volatile markets.
33
The table below summarizes the sources of our revenue, the primary drivers of each revenue source and the underlying drivers:percentage of each revenue source that represents recurring revenue, a characterization of revenue and a statistical measure:
For the Year Ended December 31, 2011 | |||||
| Sources of revenue | Primary Drivers | Total (millions) | % of Total Net Revenue | % Recurring | |
| Advisor-driven revenue with ~85%-90% payout ratio | Commissions | - Transactions - Brokerage asset levels | $1,754 | 51% | 35% |
| Advisory Fees | - Advisory asset levels | $1,027 | 30% | 99% | |
Attachment revenue retained by us | Asset-Based Fees - Cash Sweep Fees - Sponsorship Fees - Record Keeping | - Cash balances - Interest rates - Number of accounts - Client asset levels | $360 | 10% | 100% |
Transaction and Other Fees - Transactions - Client (Investor) Accounts - Advisor Seat and Technology | - Client activity - Number of clients - Number of advisors - Number of accounts - Premium technology subscribers | $292 | 8% | 57% | |
| Interest and Other Revenue | - Margin accounts - Marketing re-allowances fees | $46 | 1% | 48% | |
| Total Net Revenue | $3,479 | 100% | 63% | ||
| Total Recurring Revenue | $2,180 | 63% | |||
37
Commissions and Advisory Fees. Transaction-based commissions and advisory fees both represent advisor-generated revenue, generally 85-90% of which is paid to advisors.
Commissions. Transaction-based commission revenues represent gross commissions generated by our advisors, primarily from commissions earned on the sale of various financial products such as variable and fixed annuities, mutual funds, general securities, fixed income, alternative investments and insurance and can vary from period to period based on the overall economic environment, number of trading days in the reporting period and investment activity of our advisors' clients. We also earn trailing commission type revenues (a commission that is paid over time, such as 12(b)-1 fees) on mutual funds and variable annuities held by clients of our advisors. Trail commissions are recurring in nature and are earned based on the current market value of investment holdings.
Advisory Fees. Advisory fee revenues represent fees charged on our corporate Registered Investment Advisor ("RIA") platform to clients of our advisors based on the value of advisory assets. Advisory fees are typically billed to clients quarterly, in advance, and are recognized as revenue ratably during the quarter. The value of the assets in the advisory account on the billing date determines the amount billed, and accordingly, the revenues earned in the following three month period. The majority of our accounts are billed using values as of the last business day of the quarter. In addition, we support independent Registered Investment Advisors ("Independent RIA") who conduct their advisory business through separate entities by establishing their own RIA pursuant to the Investment Advisers Act of 1940, rather than using our corporate registered RIA. The assets held under these investment advisory accounts custodied with LPL Financial LLC (“LPL Financial”) are included in our advisory and brokerage assets and advisory assets under management metrics. The fee-based production generated by the Independent RIA is earned by the advisor, and accordingly not included in our advisory fee revenue. However, there are administrative fees charged to
34
Independent RIAs including custody and clearing and trading fees, based on the value of assets within these advisory accounts. Furthermore, we support certain financial advisors with customized clearing and advisory platforms and charge fees to these advisors based on the value of assets within these advisory accounts.
Asset-Based Fees. Asset-based fees are comprised of fees from cash sweep programs, our sponsorship programs with financial product manufacturers, and omnibus processing and networking services. Pursuant to contractual arrangements, uninvested cash balances in our advisors’ client accounts are swept into either insured deposit accounts at various banks or third-party money market funds, for which we receive fees, including administrative and record-keeping fees based on account type and the invested balances. In addition, we receive fees from certain financial product manufacturers in connection with sponsorship programs that support our marketing and sales-force education and training efforts. We also earn fees on mutual fund assets for which we provide administrative and record-keeping services. Our networking fees represent fees paid to us by mutual fund and annuity product manufacturers in exchange for administrative and record-keeping services that we provide to clients of our advisors. Networking fees are correlated to the number of positions we administer, not the value of assets under administration.
Transaction and Other Fees. Revenues earned from transaction and other fees primarily consist of transaction fees and ticket charges, subscription fees, Individual Retirement Account ("IRA") custodian fees, contract and license fees, conference fees and small/inactive account fees. We charge fees to our advisors and their clients for executing transactions in brokerage and fee-based advisory accounts. We earn subscription fees for various services provided to our advisors and on IRA custodial services that we provide for their client accounts. We charge monthly administrative fees to our advisors. We charge fees to financial product manufacturers for participating in our training and marketing conferences and fees to our advisors and their clients for accounts that do not meet certain specified thresholds of size or activity. In addition, we host certain advisor conferences that serve as training, sales and marketing events in our first and third fiscal quarters and as a result, we anticipate higher transaction and other fees resulting from the collection of revenues from sponsors and advisors, in comparison to other periods.
Interest and Other Revenue. Other revenue includes marketing re-allowances from certain financial product manufacturers as well as interest income from client margin accounts and cash equivalents, net of operating interest expense, and other items.
Our Operating Expenses
Production Expenses. Production expenses are comprised of the following: gross commissions and advisory fees that are earned by and paid out to advisors based on the sale of various products and services; production bonuses for achieving certain levels of production; recognition of share-based compensation expense from stock options and warrants granted to advisors and financial institutions based on the fair value of the awards at each interim reporting period; amounts designated by advisors as deferred commissions in a non-qualified deferred compensation plan that are marked to market at each interim reporting period; and brokerage, clearing and exchange fees. Our production payout includes all production expenses except brokerage, clearing and exchange expenses. Substantially all of the production payout is variable and correlated to the revenues generated by each advisor. Our production payout percentage is calculated as commission and advisory fees divided by commission and advisory revenues, and we exclude brokerage, clearing and exchange fees from this measure.
Upon closing of our IPO in the fourth quarter of 2010, the restriction of approximately 7.4 million shares of common stock issued to advisors under the Fifth Amended and Restated 2000 Stock Bonus Plan was released. Accordingly, we recorded a share-based compensation charge of $222.0 million in the fourth quarter of 2010, representing the offering price of $30.00 per share multiplied by 7.4 million shares. This charge has been classified as production expense, but has been excluded from our production payout for 2010 to derive an adjusted production payout, a non-GAAP measure, for consistency and comparability to other periods presented.presented because this charge related to equity awards granted in prior periods.
Compensation and Benefits Expense. Compensation and benefits expense includes salaries and wages and related employee benefits and taxes for our employees (including share-based compensation), as well as compensation for temporary employees and consultants.
35
General and Administrative Expenses. General and administrative expenses include promotional fees, occupancy and equipment, communications and data processing, regulatory fees, travel and entertainment, professional services and other expenses. We host certain advisor conferences that serve as training, sales and marketing events in our first and third fiscal quarters and as a result, we anticipate higher general and administrative expenses in comparison to other periods.
Depreciation and Amortization Expense. Depreciation and amortization expense represents the benefits received for using long-lived assets. Those assets represent significant intangible assets established through our acquisitions, as well as fixed assets which include internally developed software, hardware, leasehold improvements and other equipment.
Restructuring Charges. Restructuring charges represent expenses incurred as a result of our 2011 consolidation of UVEST Financial Services Group, Inc. ("UVEST") and our 2009 consolidation of Mutual Service Corporation (“MSC”), Associated Financial Group, Inc. (“AFG”), Associated Securities Corp. (“Associated”), Associated Planners Investment Advisory, Inc. (“APIA”) and Waterstone Financial Group, Inc. (“WFG”) (MSC, AFG, Associated, APIA and WFG, are collectively referred to herein as the “Affiliated Entities”).
How We Evaluate GrowthOur Business
We focus on several business and key financial metrics in evaluating the success of our business relationships and our resulting financial position and operating performance. Our key metrics as of and for the years ended December 31, 2011, 2010 2009, and 20082009 are as follows:
| As of and for the Year Ended | ||||||||||||
| December 31, | ||||||||||||
| 2010 | 2009 | 2008 | ||||||||||
Business Metrics | ||||||||||||
| Advisors(1) | 12,444 | 11,950 | 11,920 | |||||||||
| Advisory and brokerage assets (in billions)(2) | $ | 315.6 | $ | 279.4 | $ | 233.9 | ||||||
| Advisory assets under management (in billions)(3) | $ | 93.0 | $ | 77.2 | $ | 59.6 | ||||||
| Net new advisory assets (in billions)(3)(4) | $ | 8.5 | $ | 7.0 | N/A | |||||||
| Insured cash account balances (in billions)(3) | $ | 12.2 | $ | 11.6 | $ | 11.2 | ||||||
| Money market account balances (in billions)(3) | $ | 6.9 | $ | 7.0 | $ | 11.2 | ||||||
Financial Metrics | ||||||||||||
| Revenue growth (decline) from prior year | 13.2 | % | (11.8 | )% | 14.7 | % | ||||||
| Recurring revenue as a % of net revenue(5) | 60.7 | % | 57.3 | % | 58.5 | % | ||||||
| Gross margin (in millions)(6) | $ | 937.9 | $ | 844.9 | $ | 953.3 | ||||||
| Gross margin as a % of net revenue(6) | 30.1 | % | 30.7 | % | 30.6 | % | ||||||
| Net (loss) income (in millions) | $ | (56.9 | ) | $ | 47.5 | $ | 45.5 | |||||
| Adjusted EBITDA (in millions) | $ | 413.1 | $ | 356.1 | $ | 350.2 | ||||||
| Adjusted Earnings (in millions) | $ | 172.7 | $ | 129.6 | $ | 108.9 | ||||||
| (Loss) Earnings Per Share (diluted) | $ | (0.64 | ) | $ | 0.47 | $ | 0.45 | |||||
| Adjusted Earnings per Share (diluted) | $ | 1.71 | $ | 1.32 | $ | 1.09 | ||||||
| As of and for the Year Ended December 31, | |||||||||||
| 2011 | 2010 | 2009 | |||||||||
| Business Metrics | |||||||||||
| Advisors(1) | 12,847 | 12,444 | 11,950 | ||||||||
| Advisory and brokerage assets (in billions)(2) | $ | 330.3 | $ | 315.6 | $ | 279.4 | |||||
| Advisory assets under management (in billions)(3) | $ | 101.6 | $ | 93.0 | $ | 77.2 | |||||
| Net new advisory assets (in billions)(3)(4) | $ | 10.8 | $ | 8.5 | $ | 7.0 | |||||
| Insured cash account balances (in billions)(3) | $ | 14.4 | $ | 12.2 | $ | 11.6 | |||||
| Money market account balances (in billions)(3) | $ | 8.0 | $ | 6.9 | $ | 7.0 | |||||
| Financial Metrics | |||||||||||
| Revenue growth (decline) from prior year | 11.8 | % | 13.2 | % | (11.8 | )% | |||||
| Recurring revenue as a % of net revenue(5) | 62.7 | % | 60.7 | % | 57.3 | % | |||||
| Net income (loss) (in millions) | $ | 170.4 | $ | (56.9 | ) | $ | 47.5 | ||||
| Earnings (loss) per share (diluted) | $ | 1.50 | $ | (0.64 | ) | $ | 0.47 | ||||
| Non-GAAP Measures: | |||||||||||
| Gross margin (in millions)(6) | $ | 1,031.0 | $ | 937.9 | $ | 844.9 | |||||
| Gross margin as a % of net revenue(6) | 29.6 | % | 30.1 | % | 30.7 | % | |||||
| Adjusted EBITDA (in millions) | $ | 459.7 | $ | 413.1 | $ | 356.1 | |||||
| Adjusted EBITDA as a % of net revenue | 13.2 | % | 13.3 | % | 13.0 | % | |||||
| Adjusted EBITDA as a % of gross margin(6) | 44.6 | % | 44.0 | % | 42.1 | % | |||||
| Adjusted Earnings (in millions) | $ | 218.6 | $ | 172.7 | $ | 129.6 | |||||
| Adjusted Earnings per share (diluted) | $ | 1.95 | $ | 1.71 | $ | 1.32 | |||||
____________
| (1) | Advisors are defined as those investment professionals who are licensed to do business with our broker-dealer subsidiaries. In |
39
| (2) | Advisory and brokerage assets are comprised of assets that are custodied, networked andnon-networked |
36
and reflect market movement in addition to new assets, inclusive of new business development and net of attrition.
| (3) | Advisory assets under management, insured cash account balances and money market account balances |
| (4) | Represents net new advisory assets consisting of funds from new accounts and additional funds deposited into existing advisory accounts that are custodied in |
| (5) | Recurring revenue, a characterization of net revenue and a statistical measure, is derived from sources such as advisory fees, asset-based fees, trailing commission fees, fees related to our cash sweep programs, interest earned on margin accounts and technology and service |
| (6) | Gross margin is calculated as net revenues less production expenses. Production expenses consist of the following expense categories from our consolidated statements of operations: (i) commissions and advisory fees and (ii) brokerage, clearing and exchange. All other expense categories, including depreciation and amortization, are considered general and administrative in nature. Because our gross margin amounts do not include any depreciation and amortization expense, we consider our gross margin amounts to be non-GAAP measures that may not be comparable to those of others in our industry. In 2010, upon closing our IPO in the fourth quarter, the restriction on approximately 7.4 million shares of common stock issued to our advisors under the Fifth Amended and Restated 2000 Stock Bonus Plan was released. Accordingly, we recorded a share-based compensation charge of $222.0 million in the fourth quarter of 2010, representing the offering price of $30.00 per share multiplied by 7.4 million shares. This charge has been classified as production expense in 2010. |
Adjusted EBITDA
Adjusted EBITDA is defined as EBITDA (net income plus interest expense, income tax expense, depreciation and amortization), further adjusted to exclude certain non-cash charges and other adjustments set forth below. We present Adjusted EBITDA because we consider it an important measure of our performance. Adjusted EBITDA is a useful financial metric in assessing our operating performance from period to period by excluding certain items that we believe are not representative of our core business, such as certain material non-cash items and other adjustments.
We believe that Adjusted EBITDA, viewed in addition to, and not in lieu of, our reported GAAP results, provides useful information to investors regarding our performance and overall results of operations for the following reasons:
because non-cash equity grants made to employees at a certain price and point in time do not necessarily reflect how our business is performing at any particular time, share-based compensation expense is not a key measure of our operating performance and
because costs associated with acquisitions and the resulting integrations, debt refinancing, restructuring and conversions and equity issuance and related offering costs can vary from period to period and transaction to transaction, expenses associated with these activities are not considered a key measure of our operating performance.
We use Adjusted EBITDA:
as a measure of operating performance;
for planning purposes, including the preparation of budgets and forecasts;
to allocate resources to enhance the financial performance of our business;
to evaluate the effectiveness of our business strategies;
in communications with our board of directors concerning our financial performance and
as a factor in determining employee and executive bonuses.
37
Adjusted EBITDA is a non-GAAP measure and does not purport to be an alternative to net income as a measure of operating performance or to cash flows from operating activities as a measure of liquidity. The term Adjusted EBITDA is not defined under GAAP, and Adjusted EBITDA is not a measure of net income, operating income or any other performance measure derived in accordance with GAAP, and is subject to important limitations.GAAP.
Adjusted EBITDA has limitations as an analytical tool and should not be considered in isolation or as a substitute for analysis of our results as reported under GAAP. Some of these limitations are:
Adjusted EBITDA does not reflect changes in, or cash requirements for, working capital needs
Adjusted EBITDA does not reflect the significant interest expense, or the cash requirements necessary to service interest or principal payments, on our debt and
Adjusted EBITDA can differ significantly from company to company depending on long-term strategic decisions regarding capital structure, the tax jurisdictions in which companies operate and capital investments. Because of these limitations, investments, limiting its usefulness as a comparative measure.
Adjusted EBITDA should not be considered as a measure of discretionary cash available to us to invest in our business. We compensate for these limitations by relying primarily on the GAAP results and using Adjusted EBITDA as supplemental information.
Set forth below is a reconciliation from our net income (loss) income to Adjusted EBITDA, a non-GAAP measure, for the years ended December 31, 2011, 2010 2009, and 20082009 (in thousands):
| For the Year Ended December 31, | ||||||||||||
| 2010 | 2009 | 2008 | ||||||||||
| Net (loss) income | $ | (56,862 | ) | $ | 47,520 | $ | 45,496 | |||||
| Interest expense | 90,407 | 100,922 | 115,558 | |||||||||
| Income tax (benefit) expense | (31,987 | ) | 25,047 | 47,269 | ||||||||
| Amortization of purchased intangible assets and software(1) | 43,658 | 59,577 | 61,702 | |||||||||
| Depreciation and amortization of all other fixed assets | 42,379 | 48,719 | 38,760 | |||||||||
| EBITDA | 87,595 | 281,785 | 309,785 | |||||||||
| EBITDA Adjustments: | ||||||||||||
| Share-based compensation expense(2) | 10,429 | 6,437 | 4,160 | |||||||||
| Acquisition and integration related expenses(3) | 12,569 | 3,037 | 18,326 | |||||||||
| Restructuring and conversion costs(4) | 22,835 | 64,078 | 15,122 | |||||||||
| Debt amendment and extinguishment costs(5) | 38,633 | — | — | |||||||||
| Equity issuance and IPO related costs(6) | 240,902 | 580 | — | |||||||||
| Other(7) | 150 | 151 | 3,778 | |||||||||
| Total EBITDA Adjustments | 325,518 | (8) | 74,283 | 41,386 | ||||||||
| Adjusted EBITDA | $ | 413,113 | $ | 356,068 | $ | 350,171 | ||||||
| For the Year Ended December 31, | |||||||||||
| 2011 | 2010 | 2009 | |||||||||
| Net income (loss) | $ | 170,382 | $ | (56,862 | ) | $ | 47,520 | ||||
| Interest expense | 68,764 | 90,407 | 100,922 | ||||||||
| Income tax expense (benefit) | 112,303 | (31,987 | ) | 25,047 | |||||||
| Amortization of purchased intangible assets and software(1) | 38,981 | 43,658 | 59,577 | ||||||||
| Depreciation and amortization of all other fixed assets | 33,760 | 42,379 | 48,719 | ||||||||
| EBITDA | 424,190 | 87,595 | 281,785 | ||||||||
| EBITDA Adjustments: | |||||||||||
| Share-based compensation expense(2) | 14,978 | 10,429 | 6,437 | ||||||||
| Acquisition and integration related expenses(3) | (3,815 | ) | 12,569 | 3,037 | |||||||
| Restructuring and conversion costs(4) | 22,052 | 22,835 | 64,078 | ||||||||
| Debt amendment and extinguishment costs(5) | — | 38,633 | — | ||||||||
| Equity issuance and related offering costs(6) | 2,062 | 240,902 | 580 | ||||||||
| Other(7) | 253 | 150 | 151 | ||||||||
| Total EBITDA Adjustments | 35,530 | 325,518 | 74,283 | ||||||||
| Adjusted EBITDA | $ | 459,720 | $ | 413,113 | $ | 356,068 | |||||
____________
| (1) | Represents amortization of intangible assets and software as a result of our purchase accounting adjustments from our merger transaction in 2005 |
| (2) | Represents share-based compensation expense related to |
41
| (3) | Represents acquisition and integration costs |
38
within general and administrative expenses and included in the presentation of Adjusted EBITDA, a non-GAAP measure. We settled our legal dispute with the third-party indemnitor in the fourth quarter of 2011. Accordingly in 2011, we received a $10.5 million cash settlement, $9.8 million of which has been excluded from the presentation of Adjusted EBITDA, a non-GAAP measure. See Note 14 of our consolidated financial statements for additional information on litigation-related expenses.
| (4) | Represents organizational restructuring charges |
| (5) | Represents debt amendment costs incurred in 2010 for amending and restating our senior secured credit agreement to establish a new term loan tranche and to extend the maturity of an existing tranche on our senior credit |
| (6) | Represents equity issuance and related costs for our IPO, which was completed in the fourth quarter of 2010. For 2009, $0.6 million of costs that were previously classified as restructuring and conversion have been reclassified to equity issuance and IPO related costs to conform to the current period presentation. Upon closing of the offering, the restriction on approximately 7.4 million shares of common stock issued to advisors under our Fifth Amended and Restated 2000 Stock Bonus Plan was released. Accordingly, the Company recorded a share-based compensation charge of $222.0 million, representing the offering price of $30.00 per share multiplied by 7.4 million shares. |
| (7) | Represents | |
| Year Ended December 31, 2010 | ||||||||
| GAAP | Adjustments | |||||||
Revenues | ||||||||
| Commissions | $ | 1,620,811 | $ | — | ||||
| Advisory fees | 860,227 | — | ||||||
| Asset-based fees | 317,505 | — | ||||||
| Transaction and other fees | 274,148 | 1,317 | ||||||
| Other | 40,795 | 5 | ||||||
Net revenues | 3,113,486 | 1,322 | ||||||
Expenses | ||||||||
| Production | 2,397,535 | (222,028 | ) | |||||
| Compensation and benefits | 308,656 | (20,760 | ) | |||||
| General and administrative | 233,015 | (7,511 | ) | |||||
| Depreciation and amortization | 86,037 | — | ||||||
| Restructuring charges | 13,922 | (13,922 | ) | |||||
| Other | 34,826 | (21,996 | ) | |||||
Total operating expenses | 3,073,991 | (286,217 | ) | |||||
| Non-operating interest expense | 90,407 | — | ||||||
| Loss on extinguishment of debt | 37,979 | (37,979 | ) | |||||
| Gain on equity method investment | (42 | ) | — | |||||
Total expenses | 3,202,335 | (324,196 | ) | |||||
(Loss) income before (benefit from) provision for income taxes | $ | (88,849 | ) | $ | 325,518 | |||
42
Adjusted Earnings and Adjusted Earnings per share
Adjusted Earnings represents net income before: (a) share-based compensation expense, (b) amortization of intangible assets and software, a component of depreciation and amortization resulting from our merger transaction in 2005 with the Majority Holders and our 2007various acquisitions, (c) acquisition and integration related expenses, and (d) restructuring and conversion costs, (e) debt amendment and extinguishment costs, (f) equity issuance and IPO related offering costs and (g) other. Reconciling items are tax effected using the income tax rates in effect for the applicable period, adjusted for any potentially non-deductible amounts.
In reporting our financial and operating results for the years ended December 31, 2011, 2010 2009 and 2008,2009, we renamed our non-GAAP performance measures to Adjusted Earnings and Adjusted Earnings per share (formerly known as Adjusted Net Income and Adjusted Net Income per share).share.
Adjusted Earnings per share represents Adjusted Earnings divided by weighted average outstanding shares on a fully diluted basis.
We prepared Adjusted Earnings and Adjusted Earnings per share to eliminate the effects of items that we do not consider indicative of our core operating performance.
We believe that Adjusted Earnings and Adjusted Earnings per share, viewed in addition to, and not in lieu of, our reported GAAP results provide useful information to investors regarding our performance and overall results of operations for the following reasons:
because costs associated with acquisitions and related integrations, debt refinancing, restructuring and conversions, and equity issuance and related offering costs can vary from period to period and transaction to transaction, expenses associated with these activities are not considered a key measure of our operating performance and
because amortization expenses can vary substantially from company to company and from period to period depending upon each company’s financing and accounting methods, the fair value and average expected life of acquired intangible assets and the method by which assets were acquired, the amortization of intangible assets obtained in acquisitions are not considered a key measure in comparing our operating performance.
Since 2010, we have historically not used Adjusted Earnings for internal management reporting and evaluation purposes; however, wepurposes.
39
We also believe Adjusted Earnings and Adjusted Earnings per share are useful to investors in evaluating our operating performance because securities analysts use them as supplemental measures to evaluate the overall performance of companies, and our investor and analyst presentations include Adjusted Earnings and Adjusted Earnings per share.
Adjusted Earnings and Adjusted Earnings per share are not measures of our financial performance under GAAP and should not be considered as an alternative to net income or earnings per share or any other performance measure derived in accordance with GAAP, or as an alternative to cash flows from operating activities as a measure of our profitability or liquidity.
We understand that, although Adjusted Earnings and Adjusted Earnings per share are frequently used by securities analysts and others in their evaluation of companies, they have limitations as analytical tools, and you should not consider Adjusted Earnings and Adjusted Earnings per share in isolation, or as substitutes for an analysis of our results as reported under GAAP. In particular you should consider:
Adjusted Earnings and Adjusted Earnings per share do not reflect our cash expenditures, or future requirements for capital expenditures or contractual commitments;
Adjusted Earnings and Adjusted Earnings per share do not reflect changes in, or cash requirements for, our working capital needs and
Other companies in our industry may calculate Adjusted Earnings and Adjusted Earnings per share differently than we do, limiting their usefulness as comparative measures.
Management compensates for the inherent limitations associated with using Adjusted Earnings and Adjusted Earnings per share through disclosure of such limitations, presentation of our financial statements in accordance with GAAP and reconciliation of Adjusted Earnings to the most directly comparable GAAP measure, net income.
The following table sets forth a reconciliation of net income (loss) income to non-GAAP measures Adjusted Earnings and Adjusted Earnings per share for the years ended December 31, 2011, 2010 2009, and 2008:2009 (in thousands, except per share data):
| For the Year Ended December 31, | ||||||||||||
| 2010 | 2009 | 2008 | ||||||||||
| (In thousands, except per share data) | ||||||||||||
| Net (loss) income | $ | (56,862 | ) | $ | 47,520 | $ | 45,496 | |||||
| After-Tax: | ||||||||||||
| EBITDA Adjustments(1) | ||||||||||||
| Share-based compensation expense(2) | 8,400 | 5,146 | 3,553 | |||||||||
| Acquisition and integration related expenses | 7,638 | 1,833 | 11,080 | |||||||||
| Restructuring and conversion costs | 13,877 | 38,669 | 9,143 | |||||||||
| Debt amendment and extinguishment costs | 23,477 | — | — | |||||||||
| Equity issuance and IPO related costs(3) | 149,568 | 350 | — | |||||||||
| Other | 91 | 91 | 2,269 | |||||||||
| Total EBITDA Adjustments | 203,051 | 46,089 | 26,045 | |||||||||
| Amortization of purchased intangible assets and software(1) | 26,531 | 35,947 | 37,322 | |||||||||
| Adjusted Earnings(4) | $ | 172,720 | $ | 129,556 | $ | 108,863 | ||||||
| Adjusted Earnings per share(4)(5) | $ | 1.71 | $ | 1.32 | $ | 1.09 | ||||||
| Weighted average shares outstanding — diluted | 100,933 | 98,494 | 100,334 | |||||||||
| For the Year Ended December 31, | |||||||||||
| 2011 | 2010 | 2009 | |||||||||
| (unaudited) | |||||||||||
| Net income (loss) | $ | 170,382 | $ | (56,862 | ) | $ | 47,520 | ||||
| After-Tax: | |||||||||||
| EBITDA Adjustments(1) | |||||||||||
| Share-based compensation expense(2) | 11,472 | 8,400 | 5,146 | ||||||||
| Acquisition and integration related expenses | (2,354 | ) | 7,638 | 1,833 | |||||||
| Restructuring and conversion costs | 13,606 | 13,877 | 38,669 | ||||||||
| Debt amendment and extinguishment costs | — | 23,477 | — | ||||||||
| Equity issuance and related offering costs(3) | 1,272 | 149,568 | 350 | ||||||||
| Other | 156 | 91 | 91 | ||||||||
| Total EBITDA Adjustments | 24,152 | 203,051 | 46,089 | ||||||||
| Amortization of purchased intangible assets and software(1) | 24,051 | 26,531 | 35,947 | ||||||||
| Adjusted Earnings | $ | 218,585 | $ | 172,720 | $ | 129,556 | |||||
| Adjusted Earnings per share(4) | $ | 1.95 | $ | 1.71 | $ | 1.32 | |||||
| Weighted average shares outstanding — diluted(5) | 112,119 | 100,933 | 98,494 | ||||||||
____________
| (1) | EBITDA Adjustments and amortization of purchased intangible assets and software have been tax effected using a federal rate of 35.0% and the applicable effective state rate which ranged from |
| (2) | Represents the after-tax expense of non-qualified stock options in which we receive a tax deduction upon |
40
exercise, and the full expense impact of incentive stock options granted to employees that have vested and qualify for preferential tax treatment and conversely, we do not receive a tax deduction. Share-based compensation for vesting of incentive stock options was $5.8 million, $5.3 million and $3.2 million, respectively, for the years ended December 31, 2011, 2010 and 2009.
| (3) | Represents the after-tax expense of equity issuance and |
| (4) |
44
| For the Year Ended December 31, | ||||||||||||
| 2010 | 2009 | 2008 | ||||||||||
| (Loss) earnings per share — diluted | $ | (0.64 | ) | $ | 0.47 | $ | 0.45 | |||||
| Adjustment to include dilutive shares, not included in GAAP loss per share | 0.08 | — | — | |||||||||
| Adjustment for allocation of undistributed earnings to stock units | — | 0.01 | — | |||||||||
| After-Tax: | ||||||||||||
| EBITDA Adjustments per share | 2.01 | 0.47 | 0.26 | |||||||||
| Amortization of purchased intangible assets and software per share | 0.26 | 0.37 | 0.38 | |||||||||
| Adjusted Earnings per share | $ | 1.71 | $ | 1.32 | $ | 1.09 | ||||||
| For the Year Ended December 31, | |||||||||||
| 2011 | 2010 | 2009 | |||||||||
| (unaudited) | |||||||||||
| Earnings (loss) per share — diluted | $ | 1.50 | $ | (0.64 | ) | $ | 0.47 | ||||
| Adjustment to include dilutive shares, not included in GAAP earnings (loss) per share | — | 0.08 | — | ||||||||
| Adjustment for allocation of undistributed earnings to stock units | 0.02 | — | 0.01 | ||||||||
| After-Tax: | |||||||||||
| EBITDA Adjustments per share | 0.22 | 2.01 | 0.47 | ||||||||
| Amortization of purchased intangible assets and software per share | 0.21 | 0.26 | 0.37 | ||||||||
| Adjusted Earnings per share | $ | 1.95 | $ | 1.71 | $ | 1.32 | |||||
| (5) | Weighted average shares outstanding on a fully diluted basis increased from 100.9 million shares for the year ended December 31, 2010 to 112.1 million shares for the year ended December 31, 2011, due primarily to the successful completion of our IPO in the fourth quarter of 2010. The increase is attributed to the release of the restriction of approximately 7.4 million shares of common stock upon closing of our IPO in the fourth quarter of 2010, the issuance of approximately 1.5 million shares of common stock by the Company pursuant to the over-allotment option granted to the underwriters in connection with the IPO, and shares that were issued upon exercise of options by selling stockholders in connection with the IPO, net of any shares retired to satisfy the exercise price in a cashless exercise. |
| For the Year Ended December 31, | ||||||||||
| 2011 | 2010 | % Change | ||||||||
| (unaudited) | ||||||||||
| Adjusted Earnings | $ | 218,585 | $ | 172,720 | ||||||
| Weighted average shares outstanding — diluted as of December 31, 2011 | 112,119 | 112,119 | ||||||||
| Pro-forma Adjusted Earnings per share | $ | 1.95 | $ | 1.54 | 26.6 | % | ||||
Acquisitions, Integrations and brokerage assets and improved those revenue sources which are directly driven by asset-based pricing.Divestitures
From time to time we undertake acquisitionsand/or divestitures based on opportunities in the competitive landscape. These activities are part of our overall growth strategy, but can distort comparability when reviewing revenue and expense trends for periods presented. The following describes significant acquisition and divestiture activities that have impacted our 2008, 2009, 2010 and 20102011 results.
41
Consolidation of the Affiliated Entities
On September 1, 2009, we consolidated the operations of the Affiliated Entities with those of LPL Financial. The consolidation involved the transfer of securities licenses of certain registered representatives associated with the Affiliated Entities and their client accounts. Following the consolidation, the registered representatives and client accounts that were transferred are now associated with LPL Financial. The consolidation of the Affiliated Entities was effected to enhance service offerings to our advisors while also generating efficiencies.
While our acquisition of the Affiliated Entities has contributed to the overall growth of our base of advisors and related revenue and market position, the consolidation into LPL Financial resulted in acquisition integrationrestructuring costs in the form of personnel costs, system costs and professional fees, as well as restructuring charges including severance and one-time termination benefits, lease and contract termination fees, asset impairments and transfer and conversion costs. See Note 34 of our
45
consolidated financial statements for further discussion on restructuring costs incurred to date and total expected restructuring costs related to our consolidation of the Affiliated Entities.
Acquisition of National Retirement Partners, Inc.
On July 14, 2010, we announced a definitive agreement pursuant to which our subsidiary, LPLH would acquire certain assets fromof National Retirement Partners, Inc. (“NRP”). InNRP’s advisors offer products and services to retirement plan sponsors and participants and comprehensive financial services to high net worth individuals. This strategic acquisition further enhances our capabilities and presence in the fourth quarter of 2010,group retirement plan space. Our existing advisors benefit from growth opportunities, as well as IRA rollovers and other retirement related services and solutions.
The transaction closed on February 9, 2011, and accordingly 206 advisors previously registered with (or licensed through) NRP transferred their securities and advisory licenses and registrations to LPL Financial. Approximately 3,800These advisors primarily support small and medium sized business with employee retirement solutions, including group annuities and 401(k) plans.
We paid $17.2 million at the closing of the transaction and placed $3.7 million of cash into an escrow subject to adjustment pursuant to the terms of the purchase agreement. In the third quarter of 2011, we accrued additional consideration of $1.1 million pursuant to the terms of the asset purchase agreement. In October 2011, we paid $4.8 million of cash consideration to former shareholders of NRP, consisting of $3.7 million from escrow and $1.1 million in additional consideration.
We may be required to pay future consideration to former shareholders of NRP that is contingent upon the achievement of certain revenue-based milestones in the third year following the acquisition. There is no maximum amount of contingent consideration; however, we have estimated the amount of future payment of contingent consideration to be $7.9 million. Immediately following the close of the transaction, we paid $2.0 million of the contingent consideration in advance to former shareholders of NRP, which reduced the remaining amount of future contingent consideration to be paid to $5.9 million.
We estimated the fair value of the remaining contingent consideration to be $3.3 million at the close of the transaction, which was determined using a discounted cash flow methodology based on financial forecasts that include assumptions about revenue growth, operating margins and discount rates. We have recorded the $3.3 million of contingent consideration within accounts payable and accrued liabilities, and we re-measure contingent consideration at fair value at each interim reporting period with changes recognized in earnings.
Including the contingent consideration of $5.3 million, representing $2.0 million paid upon the close of the transaction and an estimated $3.3 million to be paid, the total consideration for the acquisition was approximately $25.3 million.
Consolidation of UVEST Financial Services Group, Inc.
On March 14, 2011, we committed to a corporate restructuring plan to enhance our service offering, while generating efficiencies. The restructuring plan included the consolidation of the operations of our subsidiary, UVEST with those of LPL Financial. In connection with the consolidation of UVEST, certain registered representatives formerly associated with UVEST moved to LPL Financial through a transfer of their licenses. The transfers occurred beginning in July 2011 and were completed in December 2011. Following the transfer, all registered representatives and client accounts that transferred are associated with advisory and brokerage assets of $564.3 million were converted from NRP’s formerLPL Financial. In addition, UVEST expects to terminate its relationship with a third-party clearing firm and plans to LPL Financial.file a broker-dealer withdrawal request with the Financial
42
Industry Regulatory Authority ("FINRA").
During 2011, we successfully converted 142 institutions representing 337 advisors and $96.2 million in commission and advisory revenues. We expect to incur restructuring charges of $31.6 million; $21.4 million has been incurred as of December 31, 2011, including a non-cash intangible asset impairment charge of $2.8 million; $10.2 million is expected to be incurred in 2012 and beyond, of which $6.3 million is expected to occur in the first quarter. In addition, we expect to spend $12.0 million for application development supporting the conversion that for accounting purposes is capitalized as internally-developed software. We expect to improve pre-tax profitability by approximately $10.0 million to $12.0 million per year upon the completion of integration activities by creating operational efficiencies and revenue opportunities. See Note 4 of our consolidated financial statements for further details on this initiative.
Acquisition of Concord Capital Partners
On April 20, 2011, we announced our intent to acquire all of the outstanding common stock of Concord Capital Partners (“Concord Wealth Management”). Concord Wealth Management is an industry leader in providing technology and open architecture investment management solutions for trust departments of financial institutions. Through this acquisition, we will have the ability to support both the brokerage and trust business lines of current and prospective financial institutions. The acquisition will also create new expansion opportunities such as giving us the ability to custody personal trust assets within banks across the country.
On June 22, 2011, the transaction closed on February 9, 2011.closed. We paid $20.0 million at the closing of the transaction. As of December 31, 2011, $2.3 million remains in an escrow account to be paid to former shareholders of Concord Wealth Management in accordance with the terms of the stock purchase agreement.
We may be required to pay future consideration that is contingent upon the achievement of certain gross margin-based milestones for the year ended December 31, 2013. The maximum amount of contingent consideration is $15.0 million, which also represents the estimated amount of future payment.
We estimated the fair value of the contingent consideration to be $11.5 million at the close of the transaction, which was determined using a discounted cash flow methodology based on financial forecasts that includes assumptions about growth in gross margin, and discount rates. We have recorded the contingent consideration of $11.5 million within accounts payable and accrued liabilities, and re-measure contingent consideration at fair value at each interim reporting period with changes recognized in earnings.
Including the contingent consideration of $11.5 million, the total consideration for the acquisition was approximately $33.8 million.
Acquisition of Fortigent
On January 3, 2012, we announced our intent to acquire Fortigent Holdings Company, Inc. and its wholly owned subsidiaries Fortigent, LLC, Fortigent Reporting Company, LLC, and Fortigent Strategies Company, LLC (together, "Fortigent"). Fortigent is a leading provider of high net worth solutions and consulting services to RIAs, banks, and trust companies. With approximately 90 institutions with more than $50.0 billion in advisory assets, Fortigent offers a high net worth oriented platform that provides concentrated research, reporting, and alternative investment solutions specifically designed for the RIA and high net worth space. This strategic acquisition will further enhance our capabilities and offer an extension of our existing services for wealth management advisors.
Economic Overview and Impact of Financial Market Events
The year of 2011 has been a challenging and volatile period for the equity markets in response to concerns about European sovereign debt issues and the sustainability of economic growth. The S&P 500 closed the third quarter of 2011 at 1,131, down 10.1% from the close on December 31, 2010 and recovered to 1,258 at December 31, 2011, unchanged from December 31, 2010. While equity markets have recovered from the market lows that occurred in March 2009, markets have remained unstable with periods of relative calm followed by periods of rapid declines such as encountered in the third quarter.
Volatility in the equity markets increased in the last five months of the year as the S&P 500 rose or fell by more than one percent on 63 out of 107 trading days and 18 of these days experienced declines of more than two percent.
43
In response to the market turbulence and overall economic environment, the central banks, including the Federal Reserve, have continued to maintain historically low interest rates. The average effective rate for federal funds was 0.10% in 2011, a decrease from the average of 0.18% for 2010. The low interest rate environment negatively impacts our revenues from client assets in our cash sweep programs. The low interest rate also impacted investor demand for fixed income securities and fixed annuities.
During the third quarter of 2011, a downgrade of U.S. Treasury securities by Standard & Poor's Ratings Services had an initial, adverse impact on financial markets, including the equity markets. While the longer-term impact of the downgrade on the markets cannot be determined, it is possible that this downgrade, concerns about fiscal policy and the debt levels in the United States, and uncertainties about European sovereign debt, including recent downgrades, could disrupt economic activity in the United States. To date, our business and operations have not been directly impacted by this downgrade and we continue to maintain nominal direct exposure to U.S. or other sovereign debt securities.
During the first half of 2011, our business experienced record levels in commission and advisory revenue; however, in the latter half of the year, we were impacted by turbulent markets as revenues experienced modest declines sequentially. Despite the economic challenges faced, all significant revenue categories had substantial increases in 2011 compared to 2010.
While our business has improved as a result of our focus on multiple organic growth drivers, our outlook for the markets remains cautiously optimistic and we continue to attempt to manage the impact of financial market events on our earnings. We maintain a strategic focus on attractive growth opportunities such as supporting our existing advisors to sustain their businesses, continuing to attract new advisors and pursuing expense management activities.
44
Results of Operations
The following discussion presents an analysis of our results of operations for the years ended December 31, 2011, 2010 2009 and 2008.2009. Where appropriate, we have identified specific events and changes that affect comparability or trends, and where possible and practical, have quantified the impact of such items.
| Year Ended December 31, | Percentage Change | |||||||||||||||||||
| 2010 | 2009 | 2008 | ‘10 vs. ‘09 | ‘09 vs. ‘08 | ||||||||||||||||
| (In thousands) | ||||||||||||||||||||
Revenues | ||||||||||||||||||||
| Commissions | $ | 1,620,811 | $ | 1,477,655 | $ | 1,640,218 | 9.7 | % | (9.9 | )% | ||||||||||
| Advisory fees | 860,227 | 704,139 | 830,555 | 22.2 | % | (15.2 | )% | |||||||||||||
| Asset-based fees | 317,505 | 272,893 | 352,293 | 16.3 | % | (22.5 | )% | |||||||||||||
| Transaction and other fees | 274,148 | 255,574 | 240,486 | 7.3 | % | 6.3 | % | |||||||||||||
| Other | 40,795 | 39,244 | 52,797 | 4.0 | % | (25.7 | )% | |||||||||||||
Net revenues | 3,113,486 | 2,749,505 | 3,116,349 | 13.2 | % | (11.8 | )% | |||||||||||||
Expenses | ||||||||||||||||||||
| Production | 2,397,535 | 1,904,579 | 2,163,048 | 25.9 | % | (11.9 | )% | |||||||||||||
| Compensation and benefits | 308,656 | 270,436 | 343,171 | 14.1 | % | (21.2 | )% | |||||||||||||
| General and administrative | 233,015 | 218,416 | 266,447 | 6.7 | % | (18.0 | )% | |||||||||||||
| Depreciation and amortization | 86,037 | 108,296 | 100,462 | (20.6 | )% | 7.8 | % | |||||||||||||
| Restructuring charges | 13,922 | 58,695 | 14,966 | (76.3 | )% | 292.2 | % | |||||||||||||
| Other | 34,826 | 15,294 | 17,558 | 127.7 | % | (12.9 | )% | |||||||||||||
Total operating expenses | 3,073,991 | 2,575,716 | 2,905,652 | 19.3 | % | (11.4 | )% | |||||||||||||
| Non-operating interest expense | 90,407 | 100,922 | 115,558 | (10.4 | )% | (12.7 | )% | |||||||||||||
| Loss on extinguishment of debt | 37,979 | — | — | * | * | |||||||||||||||
| (Gain) loss on equity method investment | (42 | ) | 300 | 2,374 | * | (87.4 | )% | |||||||||||||
Total expenses | 3,202,335 | 2,676,938 | 3,023,584 | 19.6 | % | (11.5 | )% | |||||||||||||
(Loss) income before (benefit from) provision for income taxes | (88,849 | ) | 72,567 | 92,765 | * | (21.8 | )% | |||||||||||||
(Benefit from) provision for income taxes | (31,987 | ) | 25,047 | 47,269 | * | (47.0 | )% | |||||||||||||
Net (loss) income | $ | (56,862 | ) | $ | 47,520 | $ | 45,496 | * | 4.4 | % | ||||||||||
| Year Ended December 31, | Percentage Change | ||||||||||||||||
| 2011 | 2010 | 2009 | ‘11 vs. ‘10 | ‘10 vs. ‘09 | |||||||||||||
| (In thousands) | |||||||||||||||||
| Revenues | |||||||||||||||||
| Commissions | $ | 1,754,435 | $ | 1,620,811 | $ | 1,477,655 | 8.2 | % | 9.7 | % | |||||||
| Advisory fees | 1,027,473 | 860,227 | 704,139 | 19.4 | % | 22.2 | % | ||||||||||
| Asset-based fees | 359,724 | 317,505 | 272,893 | 13.3 | % | 16.3 | % | ||||||||||
| Transaction and other fees | 292,207 | 274,148 | 255,574 | 6.6 | % | 7.3 | % | ||||||||||
| Other | 45,536 | 40,795 | 39,244 | 11.6 | % | 4.0 | % | ||||||||||
Net revenues | 3,479,375 | 3,113,486 | 2,749,505 | 11.8 | % | 13.2 | % | ||||||||||
| Expenses | |||||||||||||||||
| Production | 2,448,424 | 2,397,535 | 1,904,579 | 2.1 | % | 25.9 | % | ||||||||||
| Compensation and benefits | 322,126 | 308,656 | 270,436 | 4.4 | % | 14.1 | % | ||||||||||
| General and administrative | 263,228 | 267,799 | 234,010 | (1.7 | )% | 14.4 | % | ||||||||||
| Depreciation and amortization | 72,741 | 86,037 | 108,296 | (15.5 | )% | (20.6 | )% | ||||||||||
| Restructuring charges | 21,407 | 13,922 | 58,695 | 53.8 | % | (76.3 | )% | ||||||||||
Total operating expenses | 3,127,926 | 3,073,949 | 2,576,016 | 1.8 | % | 19.3 | % | ||||||||||
| Non-operating interest expense | 68,764 | 90,407 | 100,922 | (23.9 | )% | (10.4 | )% | ||||||||||
| Loss on extinguishment of debt | — | 37,979 | — | * | * | ||||||||||||
Total expenses | 3,196,690 | 3,202,335 | 2,676,938 | (0.2 | )% | 19.6 | % | ||||||||||
Income (loss) before provision for (benefit from) income taxes | 282,685 | (88,849 | ) | 72,567 | * | * | |||||||||||
Provision for (benefit from) income taxes | 112,303 | (31,987 | ) | 25,047 | * | * | |||||||||||
Net income (loss) | $ | 170,382 | $ | (56,862 | ) | $ | 47,520 | * | * | ||||||||
____________
* Not meaningful.Meaningful
45
Revenues
Commissions
The following table sets forth our commission revenue, by product category included in our consolidated statements of operations for the periods indicated (in(dollars in thousands):
| Years Ended December 31, | ||||||||||||||||||||||||
| 2010 | % Total | 2009 | % Total | 2008 | % Total | |||||||||||||||||||
| Variable annuities | $ | 672,369 | 41.5 | % | $ | 551,345 | 37.3 | % | $ | 627,021 | 38.2 | % | ||||||||||||
| Mutual funds | 457,947 | 28.2 | % | 389,458 | 26.4 | % | 474,948 | 28.9 | % | |||||||||||||||
| Fixed annuities | 138,753 | 8.6 | % | 225,342 | 15.3 | % | 179,743 | 11.0 | % | |||||||||||||||
| Alternative investments | 97,606 | 6.0 | % | 77,079 | 5.2 | % | 112,706 | 6.9 | % | |||||||||||||||
| Equities | 93,961 | 5.8 | % | 86,606 | 5.8 | % | 85,586 | 5.2 | % | |||||||||||||||
| Fixed income | 85,250 | 5.2 | % | 75,210 | 5.1 | % | 65,309 | 4.0 | % | |||||||||||||||
| Insurance | 72,297 | 4.5 | % | 69,907 | 4.7 | % | 91,327 | 5.6 | % | |||||||||||||||
| Other | 2,628 | 0.2 | % | 2,708 | 0.2 | % | 3,578 | 0.2 | % | |||||||||||||||
Total commission revenue | $ | 1,620,811 | 100.0 | % | $ | 1,477,655 | 100.0 | % | $ | 1,640,218 | 100.0 | % | ||||||||||||
| Years Ended December 31, | ||||||||||||||||||||
| 2011 | % Total | 2010 | % Total | 2009 | % Total | |||||||||||||||
| Variable annuities | $ | 777,349 | 44.3 | % | $ | 672,369 | 41.5 | % | $ | 551,345 | 37.3 | % | ||||||||
| Mutual funds | 472,466 | 26.9 | % | 457,947 | 28.2 | % | 389,458 | 26.4 | % | |||||||||||
| Fixed annuities | 136,020 | 7.8 | % | 138,753 | 8.6 | % | 225,342 | 15.3 | % | |||||||||||
| Alternative investments | 113,589 | 6.5 | % | 97,606 | 6.0 | % | 77,079 | 5.2 | % | |||||||||||
| Equities | 97,882 | 5.6 | % | 93,961 | 5.8 | % | 86,606 | 5.8 | % | |||||||||||
| Fixed income | 84,568 | 4.8 | % | 85,250 | 5.2 | % | 75,210 | 5.1 | % | |||||||||||
| Insurance | 70,060 | 4.0 | % | 72,297 | 4.5 | % | 69,907 | 4.7 | % | |||||||||||
| Other | 2,501 | 0.1 | % | 2,628 | 0.2 | % | 2,708 | 0.2 | % | |||||||||||
Total commission revenue | $ | 1,754,435 | 100.0 | % | $ | 1,620,811 | 100.0 | % | $ | 1,477,655 | 100.0 | % | ||||||||
Commission revenue increased by $133.6 million, or 8.2%, for 2011 compared with 2010. In 2011, the product mix reflects the volatility of the financial markets in the latter half of the year as retail investors sought protection from downside risk while maintaining their upside potential with investment products such as variable annuities with minimum guarantee options. Mutual fund commission revenues were bolstered by increasing levels of trail-based commissions due to strong growth of the underlying assets. The increase in alternative investments is reflective of more product availability and investor preferences for diversification. Insurance commissions declined as term life insurance experienced reduced sales.
Commission revenue increased by $143.2 million, or 9.7%, for 2010 compared to 2009. The increase iswas primarily due to an increase in trail-based commissions related to improved market conditions as well as growth in assets eligible for trail payment. Sales-based commissions also increased as a resultsales of greater commission-based products activity. Sales-based commissions from more market sensitive products such as variable annuities and mutual funds experienced an increase over the prior year period due to increasingbenefited from improved investor confidence. Sales of certain financial products with more predictable cash flows such as fixed annuities, which typically increase during periods of financial uncertainty, decreased during this period, consistent with the market’s recovery.
Advisory fees increased by $162.6$167.2 million, or 9.9%19.4%, for 2009in 2011 compared to 2008. Sales-based commissions decreased2010. Advisory revenue for a particular quarter is predominately driven by the prior quarter-end advisory assets under management. The growth in advisory fee revenue is due to both higher levels of the S&P 500 on the applicable billing dates in 2011 compared to 2010 and net new advisory assets. The average of the S&P 500 on the close of the four prior quarter-end dates, September 30, 2011, June 30, 2011, March 31, 2011 and December 31, 2010, was 1,259, which is a 13.0% increase over the average of 1,114 for the prior year corresponding dates. Net new asset flows in 2011 were $10.8 billion, a $2.3 billion increase over 2010 as as a result of market turbulencestrong new business development and volatility that dampened client demand for purchases of new financial products, particularly in thea shift by our existing advisors towards more market sensitive products such as mutual funds, alternative investments and variable annuities. This decline was partially offset by increased sales of products with more predictable cash flows such as fixed annuities and fixed income securities, which investors normally favor during periods of uncertain equity markets. Trail commissions also decreased as a result of the effect of the market’s decline on the underlying assets eligible for trail commissions, partially offset by additional sales of assets eligible for trail payment.advisory business.
Advisory fees increased by $156.1 million, or 22.2%, for 2010 compared to 2009. The increase was primarily due to the effect of the rebounding market, which resulted in a significant increase in the value of client assets in advisory programs, as well as net new advisory assets. For 2010,The average of the S&P 500 index averaged 1,140, up 20.3% fromon the close of the four prior quarter-end dates, September 30, 2010, June 30, 2010, March 31, 2010 and December 31, 2009, was a 21.2% increase over the average of 948919 for 2009. Our advisorythe corresponding dates for the prior year. Advisory assets under management increased 20.5% from $77.2$77.2 billion at December 31, 2009 to $93.0$93.0 billion at December 31, 2010. The increase in advisory assets was2010, primarily driven by a continued shift toward a higher percentage of advisory business within our existing advisor base, as well as by assets from advisors who joined the firm in 2009 and whose business beganadvisory assets transferred to ramp up on our platform inthroughout 2010.
46
The following table summarizes the activity within our advisory assets under management for the periods ended December 30,31, 2011, 2010 and 2009 (in billions):
2010 | 2009 | |||||||
| Beginning balance at January 1 | $ | 77.2 | $ | 59.6 | ||||
| Net new advisory assets | 8.5 | 7.0 | ||||||
| Market impacts | 7.3 | 10.6 | ||||||
| Ending balance at December 31 | $ | 93.0 | $ | 77.2 | ||||
| 2011 | 2010 | 2009 | |||||||||
| Beginning balance at January 1 | $ | 93.0 | $ | 77.2 | $ | 59.6 | |||||
| Net new advisory assets | 10.8 | 8.5 | 7.0 | ||||||||
| Market impact and other | (2.2 | ) | 7.3 | 10.6 | |||||||
| Ending balance at December 31 | $ | 101.6 | $ | 93.0 | $ | 77.2 | |||||
Asset-Based Fees
Asset-based fees increased by $42.2 million, or 13.3%, to $359.7 million for 2011 compared with 2010. Revenues for record-keeping services and from product sponsors, which are largely based on the underlying asset values, increased due to the impact of the higher average market indices on the value of those underlying assets and net new sales of eligible assets. The average S&P 500 index for 2011 was 1,268, an increase of 11.2% over the 2010 average. In addition, revenues from our cash sweep programs increased by $7.0 million, or 5.8%, to $126.7 million for year ended December 31, 2011 from $119.7 million for the year ended December 31, 2010. This was driven by an increase in the assets in our cash sweep programs, which averaged $20.9 billion and $18.5 billion for 2011 and 2010, respectively, as investors and advisors were wary of the volatility in the financial markets.
Asset-based fees increased $44.6 million, or 16.3%, for 2010 compared to 2009. Revenues from product sponsors and for record-keeping services, which are largely based on the underlying asset values, increased due to the impact of the market’s recovery on the value of those underlying assets. The average for the S&P 500 index increased 20.3% from 2009 to 2010. This increase was offset by lower revenues from our cash sweep programs, which declined by $0.7 million, or 0.6%, to $119.7 million for the year ended December 31, 2010 from $120.4 million for the year ended December 31, 2009, as a result of lower assets in our cash sweep programs. Assets in our cash sweep programs averaged $18.5 billion and $20.5 billion for the years ended December 31, 2010 and 2009, respectively. The decrease of assets in cash sweep programs is due to the redeployment of cash balances into other securities as investors and advisors gainhad gained confidence in the market. For the year ended December 31, 2010, the effective federal funds rate averaged 0.18% compared to 0.16% for the prior year.market during 2010.
Transaction and Other Fees
Transaction and other fees increased by $18.1 million, or 6.6%, for 2011 compared with 2010. Transactional revenues increased by $7.9 million due to increased transaction volumes in investment activities, including advisory products, general securities and fixed income products. The average number of advisors increased 5.0% in 2011 compared to 2010, which led to the increase in other fees, specifically advisor based, technology and conference fees.
Transaction and other fees increased $18.6 million, or 7.3%, for 2010 compared to 2009. This increase is due, in part, to increased prices and corresponding fees to advisors for licensing, technology, and professional liability insurance services of $3.9 million, $3.5 million and $2.5 million, respectively, and increased revenue of $2.6 million from additional advisor conferences held in 2010.
Other revenue increased $15.1$4.7 million, or 6.3%11.6%, to $45.5 millionfor 20092011 compared to 2008. This2010. The primary contributor to this increase was primarily attributed to increases in our number2011 is growth in retirement sponsorship programs of advisors and their client accounts. We also had increases of $6.6$1.9 million, in charges to advisors largely for professional liability insurance premiums and $5.3 million in IRA custodial fees. Transaction and other fees include revenues from conferences held for advisors; these revenues declined by $4.4 million from 2008 to 2009, as we cancelled various conferences as a partan effect of our cost containment efforts.
Other revenue increased $1.6 million, or 4.0%, for 2010 compared to 2009. The increase was primarily attributed to higher direct investment marketing allowances received from product sponsors, largely based on sales volumes, which was offset by unrealizedmark-to-market losses in securities owned and certain other assets.
Expenses
Production Expenses
Production expenses increased by $50.9 million, or 25.7%2.1%, for 20092011 compared to 2008. The decrease was due primarily to lower interest revenue from client margin lending activities and towith 2010. Excluding a lesser extent, by lower interest income earned on our cash equivalents. Our average client margin balances decreased 33.5% from $328.3$222.0 million in 2008 to $218.3 million in 2009, reflecting a reduced demand by clients for margin leverage in reaction to volatility in the equity markets. Margin balances have typically decreased during periods of declining, volatile markets such as those experienced beginning in 2008.
Excluding a $222.0 million share-based compensation charge in 2010 representing the offering price of $30.00 per share multiplied by 7.4 million shares. This charge has been classified as production expense in 2010. Excluding this charge,related to our IPO, production expenses increased $271.0 million, or 14.2% for 2010 compared to 2009. This increase was primarily a result of a 13.7% increase in our commission and advisory revenues during the same period. Our adjusted production payout, averaged 86.3% ina non-GAAP measure, was 86.29% for 2010 and 85.8% in 2009.
The following table shows our production payout toratio and our advisors. Our productionadjusted payout averaged 85.8% in 2009ratio, a non-GAAP measure, for the years ended December 31, 2011, 2010 and 86.3% in 2008.2009:
| 2011 | 2010 | 2009 | ||||||
| Base payout rate | 84.15 | % | 83.86 | % | 83.92 | % | ||
| Production based bonuses | 2.37 | % | 2.19 | % | 1.71 | % | ||
| Other(1) | 0.12 | % | 9.19 | % | 0.19 | % | ||
| Total Payout Ratio | 86.64 | % | 95.24 | % | 85.82 | % | ||
| IPO related share-based compensation charge(2) | — | (8.95 | )% | — | ||||
| Adjusted Payout Ratio | 86.64 | % | 86.29 | % | 85.82 | % | ||
__________________________
| (1) | Includes the recognition of advisor share-based compensation expense from stock options and warrants granted to advisors and financial institutions based on the fair value of the awards, and amounts designated by advisors as deferred commissions in a non-qualified deferred compensation plan that are marked to market. |
| (2) | Upon closing of our IPO in the fourth quarter of 2010, the restriction on approximately 7.4 million shares of common stock issued to advisors under the Fifth Amended and Restated 2000 Stock Bonus Plan was released. Accordingly, we recorded a share-based compensation charge of $222.0 million in 2010, representing the offering price of $30.00 per share multiplied by 7.4 million shares. This charge has been excluded for 2010 for consistency and comparability to other periods presented because this charge related to equity awards granted in prior periods. |
Compensation and Benefits Expense
Compensation and benefits increased by $13.5 million, or 4.4%, for 2011 compared with 2010. The increase was driven by increases in staffing to support higher levels of advisor and client activities. Our average number of full-time employees increased 6.8% from 2,517 in 2010 to 2,687 in 2011, partially due to our acquisitions of NRP and Concord Wealth Management. Underlying this increase is a 5.7% increase in wages offset by flat employee benefits and other compensation year over year. In addition, employee related share-based compensation increased $4.5 million for the year ended December 31, 2011 compared to the prior year, primarily due to equity grants issued in December 2010.
Compensation and benefits increased $38.2 million, or 14.1%, for 2010 compared to 2009. Expenses in 2010 include $5.8 million in employer taxes arising from non-qualified stock option exercises in connection with our IPO. The remaining increase was primarily attributed to the restoration of certain employee-related items, including increases in bonus levels and contributions to employee retirement plans in 2010 that were reduced in 2009 as a result of our cost management initiatives. In addition, share-based compensation expense related to employee stock option awards increased to $10.4 million in 2010, compared to $6.5 million in 2009. Our average number of
48
full-time employees was 2,517 and 2,430 for 2010 and 2009, respectively, representing an increase of 3.6%.
General and Administrative Expenses
General and administrative expenses decreased by $4.6 million, or 1.7%, to $263.2 million for 2011 compared with 2010. The decrease is primarily due to $10.5 million of indemnification payment collections associated with the resolution of a legal dispute with a third-party indemnitor. Refer to the Litigation section in Note 14 within the consolidated financial statements for additional details regarding this matter. Advisor growth of 549 net new advisors excluding attrition related to UVEST in 2011, fueled a 20.1% increase in business development and other promotional expenses. Further, we had a $3.8 million increase in expenditures on non-depreciable equipment, licensing fees and other costs year over year.
General and administrative expenses increased by $14.6$33.8 million, or 6.7%14.4%, for 2010 compared to 2009. The increase compared to the prior year was due to the reinstatement of general and administrative expenses to levels necessary to support growth and service to our advisors. During 2010, we restored certain advisor conference services, which contributed to $6.4 million of the change. Other increases were primarily due to expenses for travel related costs and licensing fees that increased by $4.6 million and $1.6 million, respectively.
49
Depreciation and Amortization Expense
For the year ended December 31, 2011, depreciation and amortization decreased by $13.3 million, or 15.5% compared to the prior year. This decrease is primarily attributed to a $27.9 million reduction in depreciation incurred in 2010, attributed to assets that became fully depreciated in 2010 and 2011. This was partially offset by an increase of $7.5 million of depreciation on assets placed in service during 2010 and 2011, and depreciation of $2.7 million on assets for our acquisitions of NRP and CCP.
Depreciation and amortization expense decreased by $22.3 million, or 20.6%, for 2010 compared to 2009. The decrease is primarily attributed to a step up in basis of $89.1 million in ourthe internally developed software that was established at the time ofrecorded in connection with our 2005 merger transaction andleveraged buyout that became fully amortized in April 2010. We recorded $6.3 million and $19.1 million ina full year of amortization expense for these assets for 2010 andin 2009, respectively.totaling $19.1 million, compared to $6.5 million in 2010. In addition, we recorded asset impairments of $19.9 million in the third and fourth quarter of 2009 in the consolidation of our Affiliated Entities, which resulted in lower balances remaining in those intangible assets that continue to be amortized.
Restructuring Charges
Restructuring charges represent expenses incurred as a result of our 2011 consolidation of UVEST and our 2009 consolidation of the Affiliated EntitiesEntities.
Restructuring charges were $21.4 million in 2011. These charges relate primarily to technology costs and our strategic business review committedother expenditures incurred for the conversion and transfer of advisors and their client accounts from UVEST to in 2008LPL Financial. Additionally, impairment charges of $2.8 million related to reduce our cost structure and improve operating efficiencies.
advisor intangible assets are included for the year ended December 31, 2011. Refer to Note 4 within the consolidated financial statements for additional details regarding this matter.
Restructuring charges were $13.9 million in 2010, compared to $58.7 million in 2009. In 2010, restructuring charges were incurred for severance and termination benefits of $2.0 million, contract termination costs of $5.4 million related to the abandonment of certain lease facilities, asset impairment charges of $0.8 million, and $5.7 million in conversion and transfer costs primarily attributed to advisor retention.
Interest Expense
Interest expense includes non-operating interest expense for our senior secured credit facilities and, historically for our senior unsecured subordinated notes.
Interest expense decreased $21.6 million, or 23.9%, for 2011 compared with 2010. The reduction in interest expense for 2011 is primarily attributed to our debt refinancing in the second quarter of 2010, which included the redemption of our senior unsecured subordinated notes, resulting in a lower cost of borrowing and $8.7 million of
49
savings in 2011 compared to 2010. Interest rate swap agreements with notional values of $190.0 million and $145.0 million matured on June 30, 2010 and 2011, respectively, reducing our comparative interest expense by $7.2 million for the year ended December 31, 2011 compared to 2010. Additionally, we repaid $40.0 million of term loans under our senior secured credit facilities using net proceeds received in our IPO, as well as cash on hand, which resulted in interest savings of $1.5 million in 2011.
Interest expense decreased by $10.5 million, or 10.4%, for 2010 compared with 2009. The reduction in interest expense is attributed to our debt refinancing in the second quarter of 2010, which included the redemption of our senior unsecured subordinated notes, resulting in a lower cost of borrowing. In addition, two of our interest rate swap agreements matured during 2010, which resulted in interest savings of approximately $3.8 million.
Provision for Income Taxes
During 2010, we recorded an income tax benefit of $32.0 million compared to an income tax expense of $25.0 million for 2009. The 2010 tax benefit was a result of the net loss resulting from IPO related expenses. Our effective income tax rates were 36.0% and 34.5% for 2010 and 2009, respectively. Our 2010 effective tax rate reflects $8.1 million of transaction expenses that are not deductible for tax purposes, which reduced the tax benefit by 3.2%. Our 2009 effective tax rate reflects a benefit of approximately 8.0% from a newly enacted change to California’s income sourcing rules which were enacted in 2009 and effective as of January 1, 2011.
Liquidity and Capital Resources
Senior management establishes our liquidity and capital policies. These policies include senior management’s review of short- and long-term cash flow forecasts, review of monthly capital expenditures and daily monitoring of liquidity for our subsidiaries. Decisions on the allocation of capital include projected profitability and cash flow, risks of the business, regulatory capital requirements and future liquidity needs for strategic activities. Our Treasury Department assists in evaluating, monitoring and controlling the business activities that impact our financial condition, liquidity and capital structure and maintains relationships with various lenders. The objectives of these policies are to support the executive business strategies while ensuring ongoing and sufficient liquidity.
A summary of changes in cash flow data is provided as follows (in thousands):follows:
| December 31, | ||||||||||||
| 2010 | 2009 | 2008 | ||||||||||
| Net cash flows (used in) provided by: | ||||||||||||
| Operating activities | $ | (22,914 | ) | $ | 271,157 | $ | 89,277 | |||||
| Investing activities | (39,192 | ) | (13,724 | ) | (76,202 | ) | ||||||
| Financing activities | 102,720 | (98,078 | ) | 18,161 | ||||||||
| Net increase in cash and cash equivalents | 40,614 | 159,355 | 31,236 | |||||||||
| Cash and cash equivalents — beginning of year | 378,594 | 219,239 | 188,003 | |||||||||
| Cash and cash equivalents — end of year | $ | 419,208 | $ | 378,594 | $ | 219,239 | ||||||
| For the Year Ended December 31, | |||||||||||
| 2011 | 2010 | 2009 | |||||||||
| (In thousands) | |||||||||||
| Net cash flows provided by (used in): | |||||||||||
| Operating activities | $ | 442,378 | $ | (22,914 | ) | $ | 271,157 | ||||
| Investing activities | (65,558 | ) | (39,192 | ) | (13,724 | ) | |||||
| Financing activities | (75,256 | ) | 102,720 | (98,078 | ) | ||||||
| Net increase in cash and cash equivalents | 301,564 | 40,614 | 159,355 | ||||||||
| Cash and cash equivalents — beginning of year | 419,208 | 378,594 | 219,239 | ||||||||
| Cash and cash equivalents — end of year | $ | 720,772 | $ | 419,208 | $ | 378,594 | |||||
Cash requirements and liquidity needs are primarily funded through our cash flow from operations and our capacity for additional borrowing.
Net cash (used in) provided by operating activities includes net (loss) income adjusted for non-cash expenses such as depreciation and amortization, restructuring charges, share-based compensation, amortization of debt issuance costs, deferred income tax provision and changes in operating assets and liabilities. Net cash used in operating activities for 2010 was $22.9 million, compared to net cash provided by operating activities for 2009 and 2008 of $271.2 million and $89.3 million, respectively. In 2010, net cash used in operating activities includes $93.4 million of excess tax benefits resulting from stock options exercised related to our IPO, and a $73.8 million change in tax receivables that arose primarily from a tax benefit resulting from the release on the restriction on 7.4 million shares of our common stock. Operating assets and liabilities include balances related to settlement and funding of client transactions, receivables from product sponsors and accrued commissions and advisory fees due to our advisors. Operating assets and liabilities that arise from the settlement and funding of transactions by our advisors’ clients are the principal cause of changes to our net cash from operating activities and can fluctuate significantly from day to day and period to period depending on overall
50
trends and client behaviors.
Net cash provided by operating activities for 2011 was $442.4 million, compared to net cash used in operating activities for 2010 of $22.9 million and net cash provided by operating activities in 2009 of $271.2 million. Cash flows from operating activities increased in 2011 due to an increase of $227.2 million in net income from the loss position in 2010. Net cash provided by operating activities in 2011 also includes $57.6 million of excess tax benefits resulting from stock options exercised that primarily occurred in May 2011 at the expiration of the IPO lock-up and a $202.5 million decrease in tax receivables that arose primarily from tax benefits resulting from our IPO in November 2010. In 2010, net cash used in operating activities includes $93.4 million of excess tax benefits related to stock options exercised as part of our IPO, and a $73.8 million increase in tax receivables that arose primarily from a tax benefit resulting from the release on the restriction on 7.4 million shares of our common stock.
Net cash used in investing activities for 2011, 2010 and 2009, totaled $65.6 million, $39.2 millionand 2008, totaled $39.2$13.7 million $13.7, respectively. The increase in 2011, as compared to 2010 was primarily due to $42.0 million used in the current year for the acquisitions of NRP and $76.2 million, respectively.Concord Wealth Management. The increase in 2010 as compared to 2009 was principally due to an increase of $14.8 million in capital expenditures and an increase in restricted cash deposits of $11.4 million. Included in the deposits of restricted cash in 2010 is $20.0 million to fund a pendingthe NRP acquisition, thatwhich was completed in the first quarter of 2011. The decrease
Net cash used in 2009 asfinancing activities for 2011 was $75.3 million compared to 2008 of $62.5 million was principally due to a decrease in capital expenditures of $54.5 million, and acquisition activity of $13.3 million. Capital expenditures decreased in 2009 in response to economic conditions and due to the completion in 2008 of capital projects related to our 2007 acquisitions.
We believe that based on current levels of operations and anticipated growth, cash flow from operations, together with other available sources of funds, which includes three uncommitted lines of credit available, will be adequate to satisfy our working
52
capital needs, the payment of all of our obligations and the funding of anticipated capital expenditures for the foreseeable future. In addition, we have certain capital requirements due to our registered broker-dealer entities and have met all capital adequacy requirements for each entity and expect this to also continue for the foreseeable future. We regularly evaluate our existing indebtedness, including refinancing thereof, based on a number of factors, including our capital requirements, future prospects, contractual restrictions, the availability of refinancing on attractive terms and general market conditions.
Tax Benefit Analysis
In 2010, upon closing our IPO in the fourth quarter, the restriction on 7.4 million shares of common stock issued to our advisors under the Fifth Amended and Restated 2000 Stock Bonus Plan was released. Accordingly, we recorded a share-based compensation charge and a corresponding tax deduction of $222.0 million in the fourth quarter of 2010, representing the offering price of $30.00 per share multiplied by 7.4 million shares. We were able to take a tax deduction for the share-based compensation charge, as noted below.
| Stock | ||||||||||||
| Release on the | Option | |||||||||||
| Restriction of | and | |||||||||||
| Shares of | Warrant | |||||||||||
Common Stock | Exercises | Total | ||||||||||
| Tax deduction available | $ | 221,982 | $ | 382,990 | $ | 604,972 | ||||||
| Tax benefit expected to be realized | $ | 87,072 | $ | 150,228 | $ | 237,300 | ||||||
| Tax benefit recorded in 2010 as income tax receivables on the consolidated statements of financial condition | $ | (87,072 | ) | $ | (57,474 | ) | $ | (144,546 | )(1) | |||
| Tax benefit utilized in the fourth quarter of 2010 by not making a quarterly payment | — | $ | (37,534 | ) | $ | (37,534 | ) | |||||
| Tax benefit expected to be utilized in future periods through the use of NOLs from tax deductions resulting from the IPO | — | $ | (55,220 | ) | $ | (55,220 | ) | |||||
The remaining tax benefit expected to be utilized through the use of net operating losses ("NOL") from tax deductions resulting from the IPO primarily relate to state taxes that are expected to be utilized over the next few years dependent upon each state's tax laws related to NOL carryforwards. We have tax carryforwards in a few states that have temporarily suspended or limited the use of tax carryforwards to offset current taxable income. We do not anticipate these suspensions will prevent the full realization of these benefits in the future as the carryforward periods have been extended.
51
Issuance Under 2008 Nonqualified Deferred Compensation Plan
On February 22, 2012, we distributed 1,673,556 shares, net of shares withheld to satisfy withholding tax requirements of the recipients, pursuant to the terms of our 2008 Nonqualified Deferred Compensation Plan. Distributions to participants were made in the form of whole shares of common stock equal to the number of stock units allocated to the participant's account (fractional shares were paid out in cash). Participants authorized us to withhold shares from their distribution of common stock to satisfy their withholding tax obligations. On February 22, 2012 we repurchased 1,149,896 shares and made the related withholding tax payment of approximately $37.5 million. See "Item 5 - Market for Registrant's Common Equity, Related Stockholder Matters and Issuer Purchases of Equity Securities".
In calculating earnings (loss) per share and diluted earnings (loss) per share using the two-class method, we are required to allocate a portion of our earnings to employees that hold stock units that contain non-forfeitable rights to dividends or dividend equivalents under our 2008 Nonqualified Deferred Compensation Plan. After the distribution of shares under the 2008 Nonqualified Deferred Compensation Plan, the two-class method is no longer applicable. This distribution of shares did not have a material impact on earnings (loss) per share or diluted earnings (loss) per share. However, the distribution increases share count by approximately 850,000 shares.
Operating Capital Requirements
Our primary requirement for working capital relates to funds we loan to our advisors’ clients for trading doneconducted on margin and funds we are required to maintain at clearing organizations to support these clients’ trading activities. We require that our advisors’ clients deposithave several sources of funds withto enable us in support of their trading activities and we hypothecate securities held as margin collateral, which we in turn use to lend to clients for margin transactions and deposit with our clearing organizations. These activities
53
Our other working capital needs are primarily limitedrelated to regulatory capital requirements at our broker-dealer and bank trust subsidiaries and software development, which we have satisfied in the past from internally generated cash flows.
Notwithstanding the self-funding nature of our operations, we may sometimes be required to fund timing differences arising from the delayed receipt of client funds associated with the settlement of client transactions in securities markets. These timing differences are funded either with internally generated cash flow or, if needed, with funds drawn under the revolving credit facility at the holding company,and/oron our uncommitted lines of credit at our broker-dealer subsidiary LPL Financial.Financial, and/or under our revolving credit facility.
Our registered broker-dealers are subject to the SEC’s Uniform Net Capital Rule, which requires the maintenance of minimum net capital. LPL Financial computes net capital requirements under the alternative method, which requires firms to maintain minimum net capital, as defined, equal to the greater of $250,000 or 2% of aggregate debit balances arising from client transactions plus 1% of net commission payable, as defined. LPL Financial is also subject to the CFTC’s minimumNational Futures Association's ("NFA) financial requirements which require that itand is required to maintain net capital as defined,that is in excess of or equal to 4%the greatest of customer funds required to be segregatedits minimum financial requirements. Currently the highest NFA requirement is the minimum net capital calculated pursuant to the Commodity Exchange Act, less the market value of certain commodity options, all as defined.SEC's Uniform Net Capital Rule. UVEST and MSC computecomputes net capital requirements under the aggregate indebtedness method, which requires firms to maintain minimum net capital, as defined, of not less than 6.67% of aggregate indebtedness plus 1% of net commission payable, also as defined.
Our subsidiary, PTC, is subject to various regulatory capital requirements. Failure to meet minimum capital
52
requirements can initiate certain mandatory and possible additional discretionary actions by regulators that, if undertaken, could have a direct material effect on our consolidated financial statements.
In connection with the consolidation of the Affiliated Entitites, MSC withdrew its registration with FINRA effective November 11, 2011, and is no longer subject to regulatory net capital requirements. UVEST plans to file a broker-dealer withdrawal request with FINRA during 2012 and to maintain sufficient capital to carry out any remaining activities during the interim.
Liquidity Assessment
Our ability to meet our debt service obligations and reduce our total debt will depend upon our future performance, which, in turn, will be subject to general economic, financial, business, competitive, legislative, regulatory and other conditions, many of which are beyond our control. In addition, our operating results, cash flow and capital resources may not be sufficient for repayment of our indebtedness in the future. Some risks that could materially adversely affect our ability to meet our debt service obligations include, but are not limited to, general economic conditions and economic activity in the financial markets. The performance of our business is correlated with the economy and financial markets, and a continuing slowdown in the economy or financial markets could adversely affect our business, results of operations, cash flows or financial condition.
If our cash flows and capital resources are insufficient to fund our debt service obligations, we may be forced to reduce or delay investments, seek additional capital or restructure or refinance our indebtedness. These measures may not be successful and may not permit us to meet our scheduled debt service obligations. In the absence of sufficient cash flows and capital resources, we could face substantial liquidity constraints and might be required to dispose of material assets or operations to meet our debt service and other obligations. However, our senior secured credit agreement will restrict our ability to dispose of assets and the use of proceeds from any such dispositions. We may not be able to consummate those dispositions, and even if we could consummate such dispositions, or to obtain the proceeds that we could realize from them and, in any event, the proceeds may not be adequate to meet any debt service obligations then due.
Indebtedness
On May 24, 2010, we amended and restated our senior secured credit agreement to add a new term loan tranche of $580.0 million maturing at June 28, 2017, which we used, together with cash on hand, to redeem our $550.0 million of senior unsecured subordinated notes, as described below. We
54
also extended the maturity of a $500.0 million tranche of our term loan facility to June 25, 2015, with the remaining $317.1 million tranche maturing at the original maturity date of June 28, 2013. In September 2011, our corporate credit rating was upgraded to Ba2 from Ba3 by a leading credit rating agency. The upgrade did not affect the interest rate or the covenants in the senior secured credit agreement.
On May 24, 2010, we gave notice of redemption of all of our outstanding senior unsecured subordinated notes. The redemption price of the senior unsecured subordinated notes was 105.375% of the outstanding aggregate principal amount, plus accrued and unpaid interest thereon up to but not including June 22, 2010 (the “Redemption Date”). The senior unsecured subordinated notes were redeemed on the Redemption Date.
We also maintain a revolving credit facility which is provided through the senior secured credit facilities. On January 25, 2010, we amended our senior secured credit agreement to increase the revolving credit facility from $100$100.0 million to $218.2 million. In connection with this amendment, we extended the maturity of a $163.5 million tranche of the revolving credit facility to June 28, 2013. The remaining $54.7 million tranche retains its original maturity date ofmatured with no borrowings against the facility on December 28, 2011.
We also maintain twothree uncommitted lines of credit. Onecredit at LPL Financial. Two of the lines has anhave unspecified limit,limits, and isare primarily dependent on our ability to provide sufficient collateral. The other line had a limit of $100$100.0 million, which was increased to $150$150.0 million on May 27, 2010, and allows for both collateralized and uncollateralized (unsecured) borrowings. The lines were utilized in 2011 and 2010; however, there were no balances outstanding at December 31, 2011 or 2010.
We also are a party to an interest rate swap agreements,agreement, in an aggregatea notional amount of $210$65.0 million, to mitigate interest rate risk by hedging the variability of a portion of our floating-rate senior secured term loan. This agreement expires on June 30, 2012.
53
Interest Rate and Fees
Borrowings under our senior secured credit facilities bear interest at a base rate equal to the one, two, three, six, nine or twelve-month LIBOR plus our applicable margin, or an alternative base rate (“ABR”) plus our applicable margin. The ABR is equal to the greatest of (a) the prime rate in effect on such day, (b) the effective federal funds rate in effect on such day plus 0.5% and (c) solely in the case of the 2015 Term Loans and the 2017 Term Loans, 2.50%.
The applicable margin for borrowings (a) with respect to the 2013 Term Loans is currently 0.75% for base rate borrowings and 1.75% for LIBOR borrowings, (b) with respect to the 2015 Term Loans is currently 1.75% for base rate borrowings and 2.75% for LIBOR borrowings, (c) with respect to the 2017 Term Loans is currently 2.75% for base rate borrowings and 3.75% for LIBOR borrowings, (d) with respect to revolver tranche maturingthat matured in 2011 is currentlywas 1.00% for base rate borrowings and 2.00% for LIBOR borrowings and (e) with respect to revolver tranche maturing in 2013 is currently 2.50% for base rate borrowings and 3.50% for LIBOR borrowings. The applicable margin on our 2013 Term Loans could change depending on our credit rating. The LIBOR Raterate with respect to the 2015 Term Loans and the 2017 Term Loans shall in no event be less than 1.50%.
In addition to paying interest on outstanding principal under the senior secured credit facilities, we are required to pay a commitment fee to the lenders under the revolving credit facility in respect of the unutilized commitments thereunder. The commitment fee ratesrate at December 31, 2010 were 0.375% for our revolver tranche maturing in 2011 and was 0.75% for our revolver tranche maturing in 2013, but are subject to change depending on our leverage ratio. We must also pay customary letter of credit fees.
Prepayments
The senior secured credit facilities (other than the revolving credit facility) require us to prepay outstanding amounts under our senior secured term loan facility subject to certain exceptions, with:
50% (percentage will be reduced to 25% if our total leverage ratio is 5.00 or less and to 0% if our total leverage ratio is 4.00 or less) of our annual excess cash flow (as defined in our senior secured credit agreement) adjusted for, among other things, changes in our net working capital (as of December 31, 2011 our total leverage ratio was 1.77);
100% of the net cash proceeds of any incurrence of debt, other than proceeds from debt permitted under the senior secured credit agreement.
The foregoing mandatory prepayments will be applied to scheduled installments of principal of the senior secured term loan facility in direct order.
We may voluntarily repay outstanding loans under the senior secured credit agreement at any time without premium or penalty, other than customary “breakage” costs with respect to LIBOR loans.
Amortization
We are required to repay the loans under the senior secured term loan facility in equal quarterly installments in aggregate annual amounts equal to 1% of the original funded principal amount of such facility, with the balance being payable on the final maturity date of the facility.
Principal amounts outstanding under the revolving credit facilities are due and payable in full at maturity.
Guarantee and Security
The senior secured credit facilities are secured primarily through pledges of the capital stock in our subsidiaries.
54
Certain Covenants and Events of Default
The senior secured credit agreement contains a number of covenants that, among other things, restrict, subject to certain exceptions, our ability to:
incur additional indebtedness;
create liens;
enter into sale and leaseback transactions;
engage in mergers or consolidations;
sell or transfer assets;
pay dividends and distributions or repurchase our capital stock;
make investments, loans or advances;
prepay certain subordinated indebtedness;
engage in certain transactions with affiliates;
amend material agreements governing certain subordinated indebtedness and
change our lines of business.
Our senior secured credit facilities prohibitagreement prohibits us from paying dividends and distributions or repurchasing our capital stock except for limited purposes, including, but not limited to payments in connection with: (i) redemption, repurchase, retirement or other acquisition of our equity interests from present or former officers, managers, consultants, employees and directors upon the death, disability, retirement, or termination of employment of any such person or otherwise in accordance with any
56
stock option or stock appreciate rights plan, any management or employee stock ownership plan, stock subscription plan, employment termination agreement or any employment agreements or stockholders’ agreement, in an aggregate amount not to exceed $5.0 million in any fiscal year plus the amount of cash proceeds from certain equity issuances to such persons, the amount of equity interests subject to a certain deferred compensation plan and the amount of certain key-man life insurance proceeds, (ii) franchise taxes, general corporate and operating expenses not to exceed $3.0 million in any fiscal year, and fees and expenses related to any unsuccessful equity or debt offering permitted by the senior secured credit facilities, (iii) tax liabilities to the extent attributable to our business and our subsidiaries and (iv) dividends and other distributions in an aggregate amount not to exceed 50% of our cumulative consolidated net income available to stockholders at such time so long as at the time of such payment of dividend or the making of such distribution, and after giving effect thereto, our leverage ratio is less than 3.50:1.00. The share repurchase programs were authorized by the Board of Directors pursuant to item (iv) above.
In addition, our financial covenant requirements include a leverage ratio test and an interest coverage ratio test. Under our leverage ratio test, we covenant not to allow the ratio of our consolidated total debt (as defined in our senior secured credit agreement) to an adjusted EBITDA reflecting financial covenants in our senior secured credit facilities (“Credit Agreement Adjusted EBITDA”) to exceed certain prescribed levels set forth in the agreement. Under our interest coverage ratio test, we covenant not to allow the ratio of our Credit Agreement Adjusted EBITDA to our consolidated interest expense (as defined in our senior secured credit agreement) to be less than certain prescribed levels set forth in the agreement. Each of our financial ratios is measured at the end of each fiscal quarter.
Our senior secured credit agreement provides us with a right to cure in the event we fail to comply with our leverage ratio test or our interest coverage test. We must exercise this right to cure within ten days of the delivery of our quarterly certificate calculating the financial ratio for that quarter.
If we fail to comply with these covenants and are unable to cure, we could face substantial liquidity problems
55
and could be forced to sell assets, seek additional capital or seek to restructure or refinance our indebtedness. These alternative measures may not be successful or feasible. Our senior secured credit agreement restricts our ability to sell assets. Even if we could consummate those sales, the proceeds that we realize from them may not be adequate to meet any debt service obligations then due. Furthermore, if an event of default were to occur with respect to our senior secured credit agreement, our creditors could, among other things, accelerate the maturity of our indebtedness. See “Risk Factors — Our indebtedness could adversely affect our financial health and may limit our ability to use debt to fund future capital needs”.
As of December 31, 2011 and 2010 we were in compliance with all of our covenant requirements.
Our covenant requirements and actual ratios as of December 31, 20102011 are as follows:
| December 31, | |||||||
| 2011 | 2010 | ||||||
| Financial Ratio | Covenant Requirement | Actual Ratio | Covenant Requirement | Actual Ratio | |||
| Leverage Test (Maximum) | 3.00 | 1.77 | 3.70 | 2.64 | |||
| Interest Coverage (Minimum) | 3.00 | 7.10 | 2.60 | 4.81 | |||
| December 31, 2010 | ||||||||
| Covenant | Actual | |||||||
Financial Ratio | Requirement | Ratio | ||||||
| Leverage Test (Maximum) | 3.70 | 2.64 | ||||||
| Interest Coverage (Minimum) | 2.60 | 4.81 | ||||||
57
Set forth below is a reconciliation from EBITDA, Adjusted EBITDA and Credit Agreement Adjusted EBITDA to our net income (loss) for the years ending December 31, 20102011 and December 31, 20092010 (in thousands):
| For the Year Ended December 31, | ||||||||
| 2010 | 2009 | |||||||
| Net (loss) income | $ | (56,862 | ) | $ | 47,520 | |||
| Interest expense | 90,407 | 100,922 | ||||||
| Income tax (benefit) expense | (31,987 | ) | 25,047 | |||||
| Amortization of purchased intangible assets and software(1) | 43,658 | 59,577 | ||||||
| Depreciation and amortization of all other fixed assets | 42,379 | 48,719 | ||||||
| EBITDA | 87,595 | 281,785 | ||||||
| EBITDA Adjustments: | ||||||||
| Share-based compensation expense(2) | 10,429 | 6,437 | ||||||
| Acquisition and integration related expenses(3) | 12,569 | 3,037 | ||||||
| Restructuring and conversion costs(4) | 22,835 | 64,078 | ||||||
| Debt amendment and extinguishment costs(5) | 38,633 | — | ||||||
| Equity issuance and IPO related costs(6) | 240,902 | 580 | ||||||
| Other(7) | 150 | 151 | ||||||
| Total EBITDA Adjustments | 325,518 | 74,283 | ||||||
| Adjusted EBITDA | 413,113 | 356,068 | ||||||
| Pro-forma adjustments(8) | — | — | ||||||
| Credit Agreement Adjusted EBITDA | $ | 413,113 | $ | 356,068 | ||||
| For the Year Ended December 31, | |||||||
| 2011 | 2010 | ||||||
| Net income (loss) | $ | 170,382 | $ | (56,862 | ) | ||
| Interest expense | 68,764 | 90,407 | |||||
| Income tax expense (benefit) | 112,303 | (31,987 | ) | ||||
| Amortization of purchased intangible assets and software(1) | 38,981 | 43,658 | |||||
| Depreciation and amortization of all other fixed assets | 33,760 | 42,379 | |||||
| EBITDA | 424,190 | 87,595 | |||||
| EBITDA Adjustments: | |||||||
| Share-based compensation expense(2) | 14,978 | 10,429 | |||||
| Acquisition and integration related expenses(3) | (3,815 | ) | 12,569 | ||||
| Restructuring and conversion costs(4) | 22,052 | 22,835 | |||||
| Debt amendment and extinguishment costs(5) | — | 38,633 | |||||
| Equity issuance and IPO related costs(6) | 2,062 | 240,902 | |||||
| Other(7) | 253 | 150 | |||||
| Total EBITDA Adjustments | 35,530 | 325,518 | |||||
| Adjusted EBITDA | 459,720 | 413,113 | |||||
| Pro-forma adjustments(8) | — | — | |||||
| Credit Agreement Adjusted EBITDA | $ | 459,720 | $ | 413,113 | |||
____________
| (1) | Represents amortization of intangible assets and software as a result of our purchase accounting adjustments from our merger transaction in 2005 |
| (2) | Represents share-based compensation expense |
| (3) | Represents acquisition and integration costs |
| (4) | Represents organizational restructuring charges |
| (5) | Represents debt amendment costs incurred in 2010 for amending and restating our |
56
agreement to establish a new term loan tranche and to extend the maturity of an existing tranche on our senior credit facilities, and debt extinguishment costs to redeem our subordinated notes, as well as certain professional fees incurred.
| (6) | Represents equity issuance and offering costs related |
| (7) | Represents excise and other taxes. |
58
| (8) | Credit Agreement Adjusted EBITDA excludes pro-forma general and administrative expenditures from acquisitions, as defined under the terms of our senior secured credit agreement. There were no such adjustments for the years ended December 31, |
Interest Rate Swaps
An interest rate swap is a financial derivative instrument whereby two parties enter into a contractual agreement to exchange payments based on underlying interest rates. We use an interest rate swap agreementsagreement, which matures on June 30, 2012, to hedge the variability on our floating interest rate for $210.0$65.0 million of our term loan under our senior secured credit facilities. We are required to pay the counterparty to the agreement fixed interest payments on a notional balance and in turn receive variable interest payments on that notional balance. Payments are settled quarterly on a net basis. As of December 31, 2010,2011, we assessed our interest rate swapsswap as being highly effective and we expect themit to continue to be highly effective. While approximately $1.2$1.3 billion of our term loan remains unhedged as of December 31, 2010,2011, the risk of variability on our floating interest rate is partially mitigated by the client margin loans on which we carry floating interest rates. At December 31, 2010,2011, our receivables from our advisors’ clients for margin loan activity were approximately $233.5$250.1 million.
Off-Balance Sheet Arrangements
We enter into various off-balance-sheet arrangements in the ordinary course of business, primarily to meet the needs of our advisors’ clients. These arrangements include firm commitments to extend credit. For information on these arrangements, see Notes 14 and 20 to our consolidated financial statements.
Contractual Obligations
The following table provides information with respect to our commitments and obligations as of December 31, 2010:2011:
| Payments Due by Period | ||||||||||||||||||||
| Total | < 1 Year | 1-3 Years | 4-5 Years | > 5 Years | ||||||||||||||||
| (In thousands) | ||||||||||||||||||||
| Leases and other obligations(1) | $ | 97,225 | $ | 31,380 | $ | 41,380 | $ | 16,557 | $ | 7,908 | ||||||||||
| Senior secured term loan facilities(2) | 1,386,639 | 13,971 | 333,168 | 492,850 | 546,650 | |||||||||||||||
| Commitment fee on revolving line of credit(3) | 3,086 | 1,364 | 1,722 | — | — | |||||||||||||||
| Variable interest payments:(4) | ||||||||||||||||||||
| 2013 Loan Hedged | 3,520 | 2,849 | 671 | — | — | |||||||||||||||
| 2013 Loan Unhedged | 12,615 | 3,665 | 8,950 | — | — | |||||||||||||||
| 2015 Loan Unhedged | 93,856 | 21,302 | 42,015 | 30,539 | — | |||||||||||||||
| 2017 Loan Unhedged | 192,779 | 30,525 | 60,205 | 58,889 | 43,160 | |||||||||||||||
| Interest rate swap agreements(5) | 7,791 | 6,296 | 1,495 | — | — | |||||||||||||||
| Total contractual cash obligations | $ | 1,797,511 | $ | 111,352 | $ | 489,606 | $ | 598,835 | $ | 597,718 | ||||||||||
59
| Payments Due by Period | |||||||||||||||||||
| Total | < 1 Year | 1-3 Years | 4-5 Years | > 5 Years | |||||||||||||||
| (In thousands) | |||||||||||||||||||
| Leases and other obligations(1) | $ | 139,553 | $ | 29,448 | $ | 39,486 | $ | 23,149 | $ | 47,470 | |||||||||
| Senior secured term loan facilities(2) | 1,332,668 | 13,971 | 320,918 | 473,535 | 524,244 | ||||||||||||||
| Commitment fee on revolving line of credit(3) | 1,719 | 1,154 | 565 | — | — | ||||||||||||||
| Variable interest payments(4): | |||||||||||||||||||
| 2013 Loan (Hedged) | 757 | 757 | — | — | — | ||||||||||||||
| 2013 Loan (Unhedged) | 8,627 | 5,603 | 3,024 | — | — | ||||||||||||||
| 2015 Loan (Unhedged) | 70,348 | 20,525 | 40,292 | 9,531 | — | ||||||||||||||
| 2017 Loan (Unhedged) | 157,315 | 29,411 | 57,736 | 56,579 | 13,589 | ||||||||||||||
| Interest rate swap agreement(5) | 1,397 | 1,397 | — | — | — | ||||||||||||||
| Total contractual cash obligations | $ | 1,712,384 | $ | 102,266 | $ | 462,021 | $ | 562,794 | $ | 585,303 | |||||||||
____________
| (1) | Minimum payments have not been reduced by minimum sublease rental income of |
57
detail on operating lease obligations and obligations under noncancelable service contracts.
| (2) | Represents principal payments on our senior secured term loan facilities. See Note 12 of our consolidated financial statements for further detail. |
| (3) | Represents commitment fees for unused borrowings on our senior secured revolving line of credit facility. See Note 12 of our consolidated financial statements for further detail. |
| (4) | Our senior secured term loan facilities bear interest at floating rates. Variable interest payments are shown assuming the applicable LIBOR rates at December 31, |
| (5) | Represents fixed interest payments net of variable interest received on our interest rate swap |
As of December 31, 2010,2011, we reflect a liability for unrecognized tax benefits of $21.1$20.1 million, which we have included in income taxes payable in the consolidated statements of financial condition. This amount has been excluded from the contractual obligations table because we are unable to reasonably predict the ultimate amount or timing of future tax payments.
Fair Value of Financial Instruments
We use fair value measurements to record certain financial assets and liabilities at fair value and to determine fair value disclosures.
We use prices obtained from an independent third-party pricing service to measure the fair value of our trading securities. We validate prices received from the pricing service using various methods including, comparison to prices received from additional pricing services, comparison to available market prices and review of other relevant market data including implied yields of major categories of securities.
At December 31, 2010,2011, we did not adjust prices received from the independent third-party pricing service. For certificates of deposit and treasury securities, we utilize market-based inputs including observable market interest rates that correspond to the remaining maturities or next interest reset dates.
Critical Accounting Policies and Estimates
Our consolidated financial statements are prepared in accordance with GAAP, which require management to make estimates, judgments and assumptions that affect the amounts reported in the consolidated financial statements and accompanying notes. We believe that of our critical accounting policies, the following are noteworthy because they require management to make estimates regarding matters that are uncertain and susceptible to change where such change may result in a material adverse impact on our financial position and reported financial results.
Revenue Recognition
We record commissions receivedearned from customers for purchases of securities including mutual funds, annuity, insurance, equity, fixed income, direct investment, option and commodity transactions on a trade-date basis. Commissions also include mutual fund and variable annuity trails, which are recognized as a percentage of assets under management over the period for which services are performed. A substantial portion of the commissions revenue is ultimately paid to the advisors. Due to the significant volume of mutual fund and variable annuity purchases and sales transacted by financial advisors directly with product manufacturers, management must estimate a portion of its upfront commission and trail revenues for each accounting period for which the proceeds have not yet been received. These estimates are based on a number of factors including market levels, the volume of transactions in prior
60
periods and cash receipts in the current period. We record commissions payable to advisors based upon standard payout ratios for each product as it accrues for which we have accrued commission revenue.
We record fees charged to customers as advisory fee revenue in advisory accounts where LPL Financial or Independent Advisers Group Corporation is the registered investment advisor. A substantial portion of these advisory fees are paid to the related advisor; such payments are recorded as production expense. Certain advisors conduct their advisory business through separate entities by establishing their own Registered Investment Advisor (“RIA”) pursuant to the Investment Advisers Act of 1940, rather than using our corporate registered RIA. These
58
stand-alone RIAs engage us for technology, clearing, regulatory and custody services, as well as access to our investment advisory platforms. The fee-based production generated by the stand-alone RIA is earned by the advisor, and accordingly not included in our advisory fee revenue. We charge administrative fees based on the value of assets within these advisory accounts, and classify such revenues as asset-based fees and transaction and other fees.
Legal Reserves
We record reserves for legal proceedings in accounts payable and accrued liabilities in our consolidated statements of financial condition. The determination of these reserve amounts requires significant judgment on the part of management. We consider many factors including, but not limited to, the amount of the claim, the amount of the loss in the client’s account, the basis and validity of the claim, the possibility of wrongdoing on the part of an advisor, likely insurance coverage, previous results in similar cases, and legal precedents and case law. Each legal proceeding is reviewed with counsel in each accounting period and the reserve is adjusted as deemed appropriate by management. Any change in the reserve amount is recorded as professional services in our consolidated statements of operations.
Valuation of Goodwill and Other Intangibles
We test intangible assets determined to have indefinite useful lives, including trademarks, trade names and goodwill, for impairment at least annually, or whenever indicationsmore frequently if events or circumstances indicate that assets might be impaired. We perform these annual impairment reviews as of the first day of the fourth quarter (October 1). We use a variety of methodologies in conducting impairment exist. We test otherassessments of indefinite-lived intangible assets, whenever indications of impairment exist.including, but not limited to, discounted cash flow models, which are based on the assumptions we believe hypothetical marketplace participants would use. Impairment exists when the carrying amount of goodwill exceeds its implied fair value, resulting in an impairment charge for the excess. For indefinite-lived intangible assets, other than goodwill, if the carrying amount exceeds the fair value, an impairment charge is recognized in an amount equal to that excess.
We perform an impairment analysis on oura goodwill on an annual basis onassessment using a more-likely-than-not approach to determine whether there is a greater than 50 percent chance that the first day of the fourth fiscal quarter (October 1). In testing for a potential impairment of goodwill on October 1, 2010, the estimated fair value of each of ourthe reporting units was significantly greaterunit is less than its carrying values. If, after performing the qualitative assessment, management determines there is a less than a 50 percent chance that the fair value and therefore we concluded that no amount of goodwill was impaired. At a reporting unit level, the estimated fair value was, at a minimum, 2.5 timesis less than its carrying value.amount, then performing the two-step test is unnecessary.
61
As part of our qualitative assessment, we considered macroeconomic conditions such as general deterioration in economic conditions, limitations on accessing capital, debt rating changes and other intangibles exist as of December 31, 2010.developments in equity and credit markets. We evaluated industry and market considerations for any deterioration in the environment in which we operate, the increased competitive environment, a decline in market-dependent multiples or metrics (considered in both absolute terms and relative to peers), any change in the market for products or services and regulatory and political developments. We assessed our overall financial performance, cost factors that would have a negative effect on earnings and prior quantitative assessments.
59
Income Taxes
We estimate income tax expense based on the various jurisdictions where we conduct business. We must then assess the likelihood that the deferred tax assets will be realized. A valuation allowance is established to the extent that it is more-likely-than-not that such deferred tax assets will not be realized. When we establish a valuation allowance or modify the existing allowance in a certain reporting period, we generally record a corresponding increase or decrease to the provision for income taxes in the consolidated statements of operations. We make significant judgments in determining the provision for income taxes, the deferred tax assets and liabilities and any valuation allowances recorded against the deferred tax asset. Changes in the estimate of these taxes occur periodically due to changes in the tax rates, changes in the business operations, implementation of tax planning strategies, resolution with taxing authorities of issues where we have previously taken certain tax positions and newly enacted statutory, judicial and regulatory guidance. These changes, when they occur, affect accrued taxes and can be material to our operating results for any particular reporting period.
Additionally, we account for uncertain tax positions in accordance with GAAP. The application of income tax law is inherently complex. We are required to make many subjective assumptions and
62
judgments regarding our income tax exposures. Interpretations of and guidance surrounding income tax laws and regulations change over time. As such, changes in our subjective assumptions and judgments can materially affect amounts recognized in our consolidated financial statements.
Valuation and Accounting for Financial Derivatives
We periodically use financial derivative instruments, such as interest rate swap agreements, to protect us against changing market prices or interest rates and the related impact to our assets, liabilities, or cash flows. We also evaluate our contracts and commitments for terms that qualify as embedded derivatives. All derivatives are reported at their corresponding fair value in our consolidated statements of financial condition.
Financial derivative instruments expected to be highly effective hedges against changes in cash flows are designated as such upon entering into the agreement. At each reporting date, we reassess the effectiveness of the hedge to determine whether or not it can continue to use hedge accounting. Under hedge accounting, we record the increase or decrease in fair value of the derivative, net of tax impact, as other comprehensive income or losses. If the hedge is not determined to be a perfect hedge, yet still considered highly effective, we will calculate the ineffective portion and record the related change in its fair value as additional interest income or expense in the consolidated statements of operations. Amounts accumulated in other comprehensive income are generally reclassified into earnings in the same period or periods during which the hedged forecasted transaction affects earnings.
Share-Based Compensation
Certain employees, advisors, officers and directors who contribute to our success participate in various stock option plans. In addition, certain financial institutions participate in a warrant plan. Stock options and warrants generally vest in equal increments over a three to five-year period and expire on the 10th anniversary following the date of grant.
We recognize share-based compensation expense related to employee stock option awards in net income based on the grant-date fair value over the requisite service period of the individual grants, which generally equals the vesting period. We account for stock options and warrants awarded to our advisors and financial institutions based on the fair value of the award at each interim reporting period. We record the increase in price of the option or warrant as commission expense during such period. If the value of our common stock increases over a given period, this accounting treatment results in additional commission expense.
As there are no observable market prices for identical or similar instruments, we estimate fair value using a Black-Scholes valuation model. We must make assumptions regarding the number of share-based awards that will be forfeited. The forfeiture assumption is ultimately adjusted to the actual forfeiture rate. Therefore, changes in the forfeiture assumptions do not impact the total amount of expense ultimately recognized over the vesting period. Rather, different forfeiture assumptions would only impact the timing of expense recognition over the vesting period.
60
The following table presents the weighted averageweighted-average assumptions used by us in calculating the fair value of ourits stock options and warrants with the Black-Scholes valuation model forthat have been granted during the years ended December 31, 2011, 2010 2009 and 2008:2009:
| December 31, | ||||||||||||
2010 | 2009 | 2008 | ||||||||||
| Expected life (in years) | 6.50 | 7.13 | 6.52 | |||||||||
| Expected stock price volatility | 49.22 | % | 51.35 | % | 33.78 | % | ||||||
| Expected dividend yield | — | — | — | |||||||||
| Annualized forfeiture rate | 3.00 | % | 4.35 | % | 1.51 | % | ||||||
| Fair value of options | $ | 17.43 | $ | 12.30 | $ | 9.96 | ||||||
| Risk-free interest rate | 2.70 | % | 2.93 | % | 2.73 | % | ||||||
| Employees | Advisors and Financial Institutions | ||||||||||||||||||||||
| 2011 | 2010 | 2009 | 2011 | 2010 | 2009 | ||||||||||||||||||
| Expected life (in years) | 6.50 | 6.50 | 6.50 | 9.71 | 9.20 | 9.32 | |||||||||||||||||
| Expected stock price volatility | 48.82 | % | 49.22 | % | 50.41 | % | 48.49 | % | 49.46 | % | 54.66 | % | |||||||||||
| Expected dividend yield | — | % | — | % | — | % | — | % | — | % | — | % | |||||||||||
| Fair value of options | $ | 15.99 | $ | 17.42 | $ | 11.32 | $ | 16.59 | $ | 25.62 | $ | 15.72 | |||||||||||
| Risk-free interest rate | 2.20 | % | 2.70 | % | 2.70 | % | 1.95 | % | 3.35 | % | 3.75 | % | |||||||||||
The risk-free interest rates are based on the implied yield available on U.S. Treasury constant maturities in effect at the time of the grant with remaining terms equivalent to the respective expected terms of the options. The dividend yield of zero is based on the fact that we have no present intention to paynot paid a cash dividends. Individend on our common stock in the future, as we gain historical data for volatility of our stock and the actual term over which employees hold our options, expected volatility and the expected term may change, which could substantially change the grant-date fair value of future awards of stock options and, ultimately, compensation recorded on future grants.last six years. We estimate the expected term for our employee option awards using the simplified method in accordance with Staff Accounting Bulletin 110,CertainAssumptions Used in Valuation Methods, because we do not have sufficient relevant historical information to develop reasonable expectations about future exercise patterns. We estimate the expected term for stock options and warrants awarded to our advisors using the contractual term. Expected volatility is calculated based on companies of similar growth and maturity and our peer group in the industry in which we do business because we do not have sufficient historical volatility data. We will continue to use peer group volatility information until our historical volatility is relevant to measure expected volatility for future grants. In the future, as we gain historical data for volatility of our stock and the actual term over which employees hold our options, expected volatility and the expected term may change, which could substantially change the grant-date fair value of future awards of stock options and, ultimately, compensation recorded on future grants.
We have assumed an annualized forfeiture rate for our stock options and warrants based on a combined review of industry and employee turnover data, as well as an analytical review performed of historical pre-vesting forfeitures occurring over the previous year. We record additional expense if the actual forfeiture rate is lower than estimated and record a recovery of prior expense if the actual forfeiture is higher than estimated.
Acquisitions
Accounting for business combinations requires our management to make significant estimates and assumptions, especially at the acquisition date with respect to intangible assets, support liabilities assumed, and pre-acquisition contingencies. Although we believe the assumptions and estimates we have made in the past have been reasonable and appropriate, they are based in part on historical experience, market data and information obtained from the management of the acquired companies and are inherently uncertain.
Examples of critical estimates in valuing certain of the intangible assets we have acquired include but are not limited to: (i) future expected cash flows from client relationships, advisor relationships and product sponsor relationships; (ii) estimates to develop or use software; and (iii) discount rates.
If we determine that a pre-acquisition contingency is probable in nature and estimable as of the acquisition date, we record our best estimate for such a contingency as a part of the preliminary purchase price allocation. We continue to gather information for and evaluate our pre-acquisition contingencies throughout the measurement period and if we make changes to the amounts recorded or if we identify additional pre-acquisition contingencies
61
during the measurement period, such amounts will be included in the purchase price allocation during the measurement period and, subsequently, in our results of operations.
Recent Accounting Pronouncements
Refer to Note 2 of our consolidated financial statements for a discussion of recent accounting standards and pronouncements.
Item 7A. | Quantitative and Qualitative Disclosures About |
Market Risk
Market Risk
We maintain trading securities owned and securities sold but not yet purchased in order to facilitate client transactions, to meet a portion of our clearing deposit requirements at various clearing organizations, and to track the performance of our research models. These securities include mutual funds, debt securities issued by the U.S. government, money market funds, corporate debt securities, certificates of deposit and equity securities.
Changes in the value of our trading inventory may result from fluctuations in interest rates, credit
ratings of the issuer, equity prices and the correlation among these factors. We manage our trading
ratings of the issuer, equity prices and the correlation among these factors. We manage our trading
64
inventory by product type. Our activities to facilitate client transactions generally involve
mutual fund activities, including dividend reinvestments. The balances are based upon pending
client activities which are monitored by our broker dealer support services department. Because
these positions arise from pending client transactions, there are no specific trading or position
limits. Positions held to meet clearing deposit requirements consist of U.S. government securities.
The amount of securities deposited depends upon the requirements of the clearing organization. The
level of securities deposited is monitored by the settlement area within our broker dealer support
services department. Our research department develops model portfolios that are used by advisors in developing client portfolios. We currently maintain173approximately 175 accounts based on model portfolios. At the time the portfolio is developed, we purchase the securities in that model portfolio in an amount equal to the account minimum for a client. Account minimums vary by product and can range from $10,000 to $50,000 per model. We utilize these positions to track the performance of the research department. The limits on this activity are based at the inception of each new model.
mutual fund activities, including dividend reinvestments. The balances are based upon pending
client activities which are monitored by our broker dealer support services department. Because
these positions arise from pending client transactions, there are no specific trading or position
limits. Positions held to meet clearing deposit requirements consist of U.S. government securities.
The amount of securities deposited depends upon the requirements of the clearing organization. The
level of securities deposited is monitored by the settlement area within our broker dealer support
services department. Our research department develops model portfolios that are used by advisors in developing client portfolios. We currently maintain
At December 31, 2010,2011, the fair value of our trading securities owned were $9.3 million.$6.3 million. Securities sold but not yet purchased were $4.8$0.2 million at December 31, 2010.2011. See Note 5 of our consolidated financial statements for information regarding the fair value of trading securities owned and securities sold but not yet purchased associated with our client facilitation activities. See Note 5 of our consolidated financial statements for information regarding the fair value of securities held to maturity.
We do not enter into contracts involving derivatives or other similar financial instruments for trading or proprietary purposes.
We also have market risk on the fees we earn that are based on the market value of advisory and brokerage assets, assets on which trail commissions are paid and assets eligible for sponsor payments.
Interest Rate Risk
We are exposed to risk associated with changes in interest rates. As of December 31, 2010,2011, all of the outstanding debt under our senior secured credit facilities, $1.4$1.3 billion, was subject to floating interest rate risk. To provide some protection against potential rate increases associated with our floating senior secured credit facilities, we have entered into a derivative instrumentsinstrument in the form of an interest rate swap agreementsagreement with Morgan Stanley Capital Services, Inc. covering a portion, ($210.0 million)$65.0 million, of our senior secured indebtedness. While the unhedged portion of our senior secured debt is subject to increases in interest rates, we do not believe that a short-term change in interest rates would have a material impact on our income before taxes.
62
The following table summarizes the impact of increasing interest rates on our interest expense from the variable portion of our debt outstanding at December 31, 2010 (in thousands)2011:
| Outstanding at | Annual Impact of an Interest Rate Increase of | |||||||||||||||||||
| Variable Interest | 10 Basis | 25 Basis | 50 Basis | 100 Basis | ||||||||||||||||
Senior Secured Term Loans | Rates | Points | Points | Points | Points | |||||||||||||||
| 2013 Term Loan (Hedged)(1) | $ | 210,000 | $ | — | $ | — | $ | — | $ | — | ||||||||||
| 2013 Term Loan (Unhedged)(2) | 104,739 | 104 | 259 | 518 | 1,035 | |||||||||||||||
| 2015 Term Loan (Unhedged)(3) | 496,250 | — | — | — | — | |||||||||||||||
| 2017 Term Loan (Unhedged)(3) | 575,650 | — | — | — | — | |||||||||||||||
| Variable Rate Debt Outstanding | $ | 1,386,639 | $ | 104 | $ | 259 | $ | 518 | $ | 1,035 | ||||||||||
3-month LIBOR(4) | 0.30 | % | 0.40 | % | 0.55 | % | 0.80 | % | 1.30 | % | ||||||||||
| Outstanding at | Annual Impact of an Interest Rate Increase of | |||||||||||||||||||
| Variable Interest | 10 Basis | 25 Basis | 50 Basis | 100 Basis | ||||||||||||||||
| Senior Secured Term Loans | Rates | Points | Points | Points | Points | |||||||||||||||
| (In thousands) | ||||||||||||||||||||
| 2013 Term Loan (Hedged)(1) | $ | 65,000 | $ | — | $ | — | $ | — | $ | — | ||||||||||
| 2013 Term Loan (Unhedged)(2) | 237,489 | 236 | 591 | 1,181 | 2,363 | |||||||||||||||
| 2015 Term Loan (Unhedged)(3) | 476,935 | — | — | — | 376 | |||||||||||||||
| 2017 Term Loan (Unhedged)(3) | 553,244 | — | — | — | 437 | |||||||||||||||
| Variable Rate Debt Outstanding | $ | 1,332,668 | $ | 236 | $ | 591 | $ | 1,181 | $ | 3,176 | ||||||||||
____________
| (1) | Represents the portion of our 2013 Term Loan that is hedged by interest rate swap agreements, which have been designated as cash flow hedges against specific payments due on the 2013 |
65
| Term Loan. Accordingly, any interest rate differential is reflected in an adjustment to interest expense over the term of the interest rate swap |
| (2) | Represents the unhedged portion of our 2013 Term Loan outstanding at December 31, |
| (3) | The variable interest rate for our 2015 Term Loan and our 2017 Term Loan is based on the greater of the | |
We offer our advisors and their clients two primary cash sweep programs that are interest rate sensitive: our insured cash programs and money market sweep vehicles involving multiple money market fund providers. Our insured cash programs use multiple non-affiliated banks to provide up to $1.5 million ($3.0 million joint) of FDIC insurance for client deposits custodied at the banks. While clients earn interest for balances on deposit in the insured cash programs, we earn a fee. Our fees from the insured cash programs are based on prevailing interest rates in the current interest rate environment, but may be adjusted in an increasing or decreasing interest rate environment or for other reasons. Changes in interest rates and fees for the insured cash programs are monitored by our fee and rate setting committee (the “FRS committee”), which governs and approves any changes to our fees. By meeting promptly after interest rates change, or for other market or non-market reasons, the FRS committee balances financial risk of the insured cash programs with products that offer competitive client yields. However, as short-term interest rates hit lower levels, the FRS committee may be compelled to lower fees.
The average Federal Reserve effective federal funds rate for December 20102011 was 0.18%0.07%. A downward change of 10 basis points in short-term interest rates, if accompanied by a commensurate change inThe following table reflects the approximate annual impact to asset-based fees foron our insured cash programs could result in a decrease of $12.2 million in income before taxes on an annual basis (assuming that client balances at December 31, 20102011 remain unchanged). Assuming client balances at December 31, 2010 do not of an upward or downward change each 25 basis point increase in short-term interest rates between the current federal funds effective rate and 125of one basis points, if accompanied by a commensurate change in fees for our insured cash programs, could result in an incremental increase of $14.9 million in income before taxes on an annual basis, after consideration of amounts paid to clients. point (in thousands):
| Federal Reserve Effective Federal Funds Rate | Annualized Increase or Decrease in Asset-Based Fees per One Basis Point Change | ||||
| (Dollars in thousands) | |||||
| 0.00% - 0.25% | $ | 1,442 | |||
| 0.26% - 1.25% | 721 | ||||
| 1.26% - 2.50% | 334 | ||||
| > 2.50% | $ | — | |||
Actual impacts may vary depending on interest rate levels, the significance of change, and the FRS committee’s strategy in responding to that change.
Credit Risk
Credit risk is the risk of loss due to adverse changes in a borrower’s, issuer’s or counterparty’s ability to meet its financial obligations under contractual or agreed upon terms. We bear credit risk on the activities of our advisors’
63
clients, including the execution, settlement, and financing of various transactions on behalf of these clients.
These activities are transacted on either a cash or margin basis. Our credit exposure in these transactions consists primarily of margin accounts, through which we extend credit to clients collateralized by cash (for purposes of margin lending - cash is not used as collateral) and securities in the client’s account. Under many of these agreements, we are permitted to sell or repledge these securities held as collateral and use these securities to enter into securities lending arrangements or to deliver to counterparties to cover short positions.
As our advisors execute margin transactions on behalf of their clients, we may incur losses if clients do not fulfill their obligations, the collateral in the client’s account is insufficient to fully cover losses from such investments and our advisors fail to reimburse us for such losses. Our loss on margin accounts is immaterial and did not exceed $0.1 million during the years ended December 31, 2011, 2010 2009 and 2008.2009. We monitor exposure to industry sectors and individual securities and perform analyses on a regular basis in connection with our margin lending activities. We adjust our margin requirements if we believe our risk exposure is not appropriate based on market conditions.
We are subject to concentration risk if we extend large loans to or have large commitments with a single counterparty, borrower, or group of similar counterparties or borrowers (e.g. in the same industry). Receivables from and payables to clients and stock borrowing and lending activities are conducted with a large number of clients and counterparties and potential concentration is carefully monitored. We seek to limit this risk through careful review of the underlying business and the use of limits established by senior management, taking into consideration factors including the financial strength of the counterparty, the size of the position or commitment, the expected duration of the position or commitment and other positions or commitments outstanding.
Operational Risk
Operational risk generally refers to the risk of loss resulting from our operations, including, but not limited to, improper or unauthorized execution and processing of transactions, deficiencies in our technology or financial operating systems and inadequacies or breaches in our control processes. We operate in diverse markets and are reliant on the ability of our employees and systems to process a large number of transactions. These risks are less direct and quantifiable than credit and market risk, but managing them is critical, particularly in a rapidly changing environment with increasing transaction volumes. In the event of a breakdown or improper operation of systems or improper action by employees or advisors, we could suffer financial loss, regulatory sanctions and damage to our reputation. Business continuity plans exist for critical systems, and redundancies are built into the systems as deemed appropriate. In order to mitigate and control operational risk, we have developed and continue to enhance specific policies and procedures that are designed to identify and manage operational risk at appropriate levels throughout our organization and within various departments. These control mechanisms attempt to ensure that operational policies and procedures are being followed and that our employees and advisors operate within established corporate policies and limits.
Risk Management
We have established various committees of the boardBoard of directorsDirectors to manage the risks associated with our business. Our Audit Committee was established for the primary purpose of overseeing (i) the integrity of our consolidated financial statements, (ii) our compliance with legal and regulatory requirements that may impact our consolidated financial statements or financial operations, (iii) the independent auditor’s qualifications and independence and (iv) the performance of our independent auditor and internal audit function. Our Compensation and Human Resources Committee was established for the primary purpose of (i) overseeing our efforts to attract, retain and motivate members of our senior management team in partnership with the chief executive officer,Chief Executive Officer, (ii) to carry out the board’sBoard’s overall responsibility relating to the determination of compensation for all executive officers to achieve the proper risk-reward balance and not encourage unnecessary or excessive risk-taking, (iii) to oversee all other aspects of our compensation and human resource policies and (iv) to oversee our management resources, succession planning and management development activities. WeAs mandated by the Audit Committee, we also have established a Risk Oversight Committee comprised of a group of seniorour senior-most executives to oversee the risk management activities of our business risks.the Company.
In addition to various committees, we have written policies and procedures that govern the conduct of business by our advisors, our employees, our relationship with advisors' clients and the terms and conditions of our relationships with product manufacturers. Our client and advisor policies address the extension of credit for client accounts, data and physical security, compliance with industry regulation and codes of ethics to govern employee
64
and advisor conduct among other matters.
Item 8. Financial Statements and Supplementary Data
The Consolidated Financial Statements and Supplementary Data are included as an annex to this Annual Report onForm 10-K. See the Index to Consolidated Financial Statements and Supplementary Data onpage F-1.
Item 9. Changes in and Disagreements with Accountants on Accounting andFinancial Disclosure
None.
Item 9A. Controls and Procedures
Evaluation of Disclosure Controls and Procedures
Our Disclosure Committee, with the participation of our Chief Executive Officer and Chief Financial Officer, evaluated the effectiveness of our disclosure controls and procedures, as defined inRules 13a-15(e) and15d-15(e) under the Securities Exchange Act of 1934, as amended, as of the end of the period covered by this report. Based on that evaluation, the Chief Executive Officer and Chief Financial Officer concluded that our disclosure controls and procedures as of the end of the period covered by this report were effective.
Change in Internal Control over Financial Reporting
There were no changes in our internal control over financial reporting that occurred during the fourth quarter ended December 31, 2010,2011, that have materially affected, or are reasonably likely to materially affect, our internal control over financial reporting.
Management’s Annual Report on Internal Control Over Financial Reporting
Our management is responsible for establishing and maintaining adequate internal control over our financial reporting. Internal control over financial reporting is defined inRules 13a-15(f) and15d-15(f) under the Exchange Act as the process designed by, or under the supervision of, our Chief Executive Officer and Chief Financial Officer, and effected by our board of directors, management and other personnel, to provide reasonable assurance regarding the reliability of our financial reporting and the preparation of our consolidated financial statements for external purposes in accordance with generally accepted accounting principles.
Our internal control over financial reporting includes policies and procedures that pertain to the maintenance of records that, in reasonable detail, accurately and fairly reflect transactions and dispositions of assets; provide reasonable assurances that transactions are recorded as necessary to permit preparation of the consolidated financial statements in accordance with accounting principles generally accepted in the United States, and that receipts and expenditures are being made only in accordance with authorizations of management and the directors of the Company; and provide reasonable assurance regarding prevention or timely detection of unauthorized acquisition, use or disposition of the Company’s assets that could have a material effect on our consolidated financial statements.
As of December 31, 2010,2011, management conducted an assessment of the effectiveness of our internal control over financial reporting based on the framework established inInternal Control — Integrated Frameworkissued by the Committee of Sponsoring Organizations of the Treadway Commission. Based on this assessment, management has determined that our internal control over financial reporting as of December 31, 20102011 was effective.
Deloitte & Touche LLP, our independent registered public accounting firm, has issued an audit report appearing on the following page on the effectiveness of our internal control over financial reporting as of December 31, 2010.2011.
65
REPORT OF INDEPENDENT REGISTERED PUBLIC ACCOUNTING FIRM
To the Board of Directors and Stockholders of
LPL Investment Holdings Inc.
Boston, Massachusetts
We have audited the internal control over financial reporting of LPL Investment Holdings Inc. and subsidiaries (the “Company”) as of December 31, 2010,2011, based on criteria established inInternal Control —- Integrated Frameworkissued by the Committee of Sponsoring Organizations of the Treadway Commission. The Company’sCompany's management is responsible for maintaining effectiveeffectiveness of internal control over financial reporting and for its assessment of the effectiveness of internal control over financial reporting included in the accompanying Management’sManagement's Annual Report on Internal Control Over Financial Reporting. Our responsibility is to express an opinion on the Company’sCompany's internal control over financial reporting based on our audit.
We conducted our audit in accordance with the standards of the Public Company Accounting Oversight Board (United States). Those standards require that we plan and perform the audit to obtain reasonable assurance about whether effective internal control over financial reporting was maintained in all material respects. Our audit included obtaining an understanding of internal control over financial reporting, assessing the risk that a material weakness exists, testing and evaluating the design and operating effectiveness of internal control based on the assessed risk, and performing such other procedures as we considered necessary in the circumstances. We believe that our audit provides a reasonable basis for our opinion.
A company’scompany's internal control over financial reporting is a process designed by, or under the supervision of, the company’scompany's principal executive and principal financial officers, or persons performing similar functions, and effected by the company’scompany's board of directors, management, and other personnel to provide reasonable assurance regarding the reliability of financial reporting and the preparation of financial statements for external purposes in accordance with accounting principles generally accepted in the United States of America (“generally accepted accounting principles.principles”). A company’scompany's internal control over financial reporting includes those policies and procedures that (1) pertain to the maintenance of records that, in reasonable detail, accurately and fairly reflect the transactions and dispositions of the assets of the company; (2) provide reasonable assurance that transactions are recorded as necessary to permit preparation of financial statements in accordance with generally accepted accounting principles, and that receipts and expenditures of the company are being made only in accordance with authorizations of management and directors of the company; and (3) provide reasonable assurance regarding prevention or timely detection of unauthorized acquisition, use, or disposition of the company’scompany's assets that could have a material effect on the financial statements.
Because of the inherent limitations of internal control over financial reporting, including the possibility of collusion or improper management override of controls, material misstatements due to error or fraud may not be prevented or detected on a timely basis. Also, projections of any evaluation of the effectiveness of the internal control over financial reporting to future periods are subject to the risk that the controls may become inadequate because of changes in conditions, or that the degree of compliance with the policies or procedures may deteriorate.
In our opinion, the Company maintained, in all material respects, effective internal control over financial reporting as of December 31, 2010,2011, based on the criteria established inInternal Control —- Integrated Frameworkissued by the Committee of Sponsoring Organizations of the Treadway Commission.
We have also audited, in accordance with the standards of the Public Company Accounting Oversight Board (United States), the consolidated financial statements as of and for the year ended December 31, 20102011, of the Company, and our report dated March 9, 2011February 27, 2012, expressed an unqualified opinion on those consolidated financial statements.
/s/ Deloitte & Touche LLP
Costa Mesa, California
69
66
Item 9B. Other Information
None.
PART III
Item 10. Directors, Executive Officers and Corporate Governance
Other than the information relating to our executive officers provided below, the information required to be furnished pursuant to this item is incorporated by reference to the Company’s definitive proxy statement for the 20112012 Annual Meeting of Stockholders.
The following table provides certain information about each of the Company’s current executive officers as of the date this Annual Report onForm 10-K has been filed with the SEC:
| Name | Age | Position | ||||||
| Mark S. Casady | 51 | Chief Executive Officer and Chairman ofthe Board | ||||||
| Esther M. Stearns | 51 | President and Chief Operating Officer | ||||||
| Robert J. Moore | 50 | Chief Financial Officer and Treasurer | ||||||
| William E. Dwyer | 54 | Managing Director, President —National Sales and Marketing | ||||||
| Dan H. Arnold | 47 | Managing Director, | ||||||
| Stephanie L. Brown | 59 | Managing Director, General Counsel andSecretary | ||||||
| Jonathan G. Eaton | 53 | Managing Director, Custom ClearingServices | ||||||
| Christopher F. Feeney | 56 | Managing Director, Chief InformationOfficer | ||||||
| Mark R. Helliker | 48 | Managing Director, Broker-Dealer SupportServices | ||||||
| John J. McDermott | 55 | Managing Director, Chief | ||||||
Executive Officers
Mark S. Casady — Chief Executive Officer and Chairman of the Board
Mr. Casady is chairman of the board of directors and our chief executive officer. He joined us in May 2002 as chief operating officer, became our president in April 2003, and became our chief executive officer and chairman in December 2005. Before joining our firm, Mr. Casady was managing director, mutual fund group for Deutsche Asset Management, Americas — formerly Scudder Investments. He joined Scudder in 1994 and held roles as managing director — Americas; head of global mutual fund group and head of defined contribution services. He was also a member of the Scudder, Stevens and Clark Board of Directors and Management Committee. He is former chairman and a current board member of the Insured Retirement Institute, is a member of the Financial Services Roundtable board of directors and serves on FINRA’s board of governors. Mr. Casady received his B.S. from Indiana University and his M.B.A. from DePaul University.
Esther M. Stearns — President and Chief Operating Officer
Ms. Stearns has been our president since March 2007 and our chief operating officer since September 2004. She joined us in July 1996 as chief information officer. Today, Ms. Stearns is responsible forprovides oversight ofto our Broker-Dealer Support Services, Business Technology Services and Custom Clearing Services business units, in addition to several Corporate Shared Services areas, such as Corporate Communication, Human Capital, Strategic Planning and Sponsor Relations.company, with a focus on strategic direction. Prior to joining us, she was vice president of information systems at Charles Schwab & Co., Inc., where she worked for 14 years in a variety of leadership roles. She received her B.A. from the University of Chicago.
Robert J. Moore — Chief Financial Officer and Treasurer
Mr. Moore joined us in September 2008 as chief financial officer. He is responsible forIn addition to formulating financial policy and planning as well asand ensuring the effectiveness of the financial functions within our firm. He also hasfirm, Mr. Moore participates directly in the strategic direction and oversight of all aspects of our company. He is also responsible for oversight of our
67
research and risk management functions.functions, as well as several areas of national sales and marketing. From2006-2008, 2006 to 2008, Mr. Moore served as chief executive officer and chief financial officer at ABN AMRO North America and LaSalle Bank Corporation. Before this role, Mr. Moore worked for Diageo PLC, Europe and Great Britain, in a number of finance management positions, ultimately serving as chief financial officer. Mr. Moore serves as a board member of Optimum Funds Trust and an independent board member and compensation committee member for Legal and General Investment Management America. He holds a B.B.A. in finance from the University of Texas, Austin and a M.M. in finance, marketing and international business from Northwestern University and is a Chartered Financial Analyst (CFA).
William E. Dwyer — Managing Director, President — National Sales andMarketing
Mr. Dwyer has served as managing director, president — National Sales and Marketing since September 2009. He joined us in July 1992 and became managing director, branch development in January 2004, managing director, national sales in July 2005, and managing director, president of Independent Advisor Services in February 2007. Mr. Dwyer is responsible for the management, satisfaction, retention and recruitment of our advisors.independent advisors and financial institutions, as well as for LPL Financial Retirement Partners. Mr. Dwyer serves as vice chaira member of the Financial Services Institute Board of Directors. He is also a member ofIn addition, he serves on the boardsboard of directors ofand is on the Securities Industry and Financial Markets Association and serves on its Private Client Services Executive Committee.Committee for the Securities Industry Financial Markets Association. He received his B.A. from Boston College.
Dan H. Arnold — Managing Director, and Divisional President, Financial Institution ServicesHead of Strategy
Mr. Arnold serves as managing director, and divisional presidenthead of our Institution Services businessstrategy. In this role since June 2007. HeOctober 2011, he is responsible for new business development and business consulting, as well aslong-term strategic planning for Insurance Associates Incorporated, which provides insurance solutions for ourthe firm. Mr. Arnold joined our firm in January 2007 following our acquisition of UVEST.UVEST and served as managing director and divisional president of Institution Services. Between 2009 and 2011, Mr. Arnold also provided executive oversight of LPL Insurance Associates, which provides insurance services to LPL advisors. Prior to joining us, Mr. Arnold worked at UVEST for 13 years, serving most recently as president and chief operating officer. Mr. Arnold serves on the board of directors of the Bank Insurance & Securities Association. He is a graduate of Auburn University and holds an M.B.A. in finance from Georgia State University.
Stephanie L. Brown — Managing Director, General Counsel and Secretary
Ms. Brown joined us in August 1989 and has been responsible for the Legal Department throughout her tenure. From 1989 to 2004, Ms. Brown was also responsible for our Compliance organization. Ms. Brown is currently serving as a member of FINRA’s National Adjudicatory Council’s Statutory Disqualification Committee and also as a member of FINRA’s Independent Broker/Dealer and Membership Committees, the SIFMA Private Client Legal Committee, and the IRI Government Relations Committee. Ms Brown is also a member representative of the Financial Services Roundtable as well as a member of the Financial Services Roundtable’s Lawyers’ Council, the Regulatory Oversight Committee, and the Securities Working Group. Prior to joining us, Ms. Brown was an
71
associate attorney with the law firm of Kelley Drye & Warren in Washington, D.C., specializing in corporate and securities law. Ms. Brown received her B.A.cum laudefrom Bryn Mawr College and her J.D. from the Catholic University of America.
Jonathan G. Eaton — Managing Director, Custom Clearing Services
Mr. Eaton joined us in June 1997 and became managing director, Custom Clearing Services in January 2008. He is also responsible for our Sponsor Relations Group and The Private Trust Company, N.A. Prior to this position, Mr. Eaton served as our executive vice president of product marketing. Before joining us, Mr. Eaton spent 14 years at MFS Investment Management. His positions at MFS included national account management, corporate marketing, product development, and market research. Mr. Eaton attended the University of Maine.
Christopher F. Feeney — Managing Director, Chief Information Officer
Mr. Feeney joined us in January 2008 as chief information officer and managing director for the Business Technology Services business unit. Mr. Feeney is responsible for enhancing the technology offerings and support we provide to our advisors and their clients. From2005-2007, 2005 to 2007, Mr. Feeney was global managing director of wealth management at Thomson Financial. Mr. Feeney was chief executive officer of Telerate, Inc., from July 2003 until its sale to Reuters in December 2004. He holds a B.A. in literature from the State University of New York, Oneonta, and completedgraduated from the Securities Industry Institute at the Wharton School.
68
Mark R. Helliker — Managing Director, Broker-Dealer Support Services
Mr. Helliker joined us in July 2008 as managing director of Broker-Dealer Support Services. He is responsible for theday-to-day management of operations for advisors and new-advisor transitions, as well as for enhancing the financial professional experience. Prior to joining us, Mr. Helliker worked at Charles Schwab for 10 years, most recently as senior vice president of Charles Schwab Institutional. Mr. Helliker has a B.A. in political science from the University of Portsmouth in England and an M.B.A. in management from San Diego State University.
John J. McDermott — Managing Director, Chief Enterprise Risk Officer
Mr. McDermott joined us in July 2009 as managing director and chief risk officer. In this role, he is focused on optimizing resources dedicated to risk and compliance across our firm, building consistency, and continuing to strengthen all teams with a holistic and strategic approach. Prior to joining us, Mr. McDermott worked for 35 years at Merrill Lynch, where he held a series of leadership roles including global head of compliance and internal audit. Mr. McDermott has a B.A. from Wesleyan University and a J.D. from Rutgers University.
Items 11, 12, 13 and14.
The information required by Items 11, 12, 13 and 14 is incorporated by reference from the Company’s definitive proxy statement for the 20112012 Annual Meeting of Stockholders.
69
PART IV
Item 15.Exhibits and Financial Statement Schedules |
(a) Consolidated Financial Statements
Our consolidated financial statements appearing on pages F-1 through F-35F-42 are incorporated herein by reference.
(b) Exhibits
Exhibit No. | Description of Exhibit | |||
| 3 | .1 | Amended and Restated Certificate of Incorporation of LPL Investment Holdings Inc., dated November 23, 2010. (1) | ||
| 3 | .2 | Second Amended and Restated Bylaws of LPL Investment Holdings Inc. (2) | ||
| 4 | .1 | Stockholders’ Agreement, dated as of December 28, 2005, among LPL Investment Holdings Inc., LPL Holdings, Inc. and other stockholders party thereto. (3) | ||
| 4 | .2 | First Amendment to Stockholders’ Agreement dated December 28, 2005, among LPL Investment Holdings Inc., LPL Holdings, Inc. and other stockholders party thereto, dated November 23, 2010.* | ||
| 4 | .3 | Stockholders’ Agreement among the Company and Hellman & Friedman Capital Partners IV, L.Pl, Hellman & Friedman Capital Partners V (Parallel), L.P., Hellman & Friedman Capital Associates V, L.P. and TPG Partners IV, L.P., dated November 23, 2010.* | ||
| 4 | .4 | Fifth Amended and Restated LPL Investment Holdings Inc. 2000 Stock Bonus Plan. (4) | ||
| 4 | .5 | Management Stockholders’ Agreement among the Company, Stephanie L. Brown, Mark S. Casady, William E. Dwyer III, Robert J. Moore, and Esther M. Stearns, dated November 23, 2010.* | ||
| 10 | .1 | 2005 Stock Option Plan for Incentive Stock Options. (5) | ||
| 10 | .2 | 2005 Stock Option Plan for Non-Qualified Stock Options. (5) | ||
| 10 | .3 | Amended and Restated Executive Employment Agreement among Mark S. Casady, the Company, LPL Holdings, Inc. and LPL Financial Corporation, dated July 23, 2010. (2) | ||
| 10 | .4 | Amended and Restated Executive Employment Agreement among Esther M. Stearns, the Company, LPL Holdings, Inc. and LPL Financial Corporation, dated July 23, 2010. (2) | ||
| 10 | .5 | Amended and Restated Executive Employment Agreement among William E. Dwyer III, the Company, LPL Holdings, Inc. and LPL Financial Corporation, dated July 23, 2010. (2) | ||
| 10 | .6 | Executive Employment Agreement between Dan H. Arnold and UVEST Financial Services Group Inc. dated January 2, 2007. (6) | ||
| 10 | .7 | Amendment dated September 28, 2009 to the Executive Employment Agreement between Dan H. Arnold and UVEST Financial Services Group Inc. dated January 2, 2007. (6) | ||
| 10 | .8 | Amended and Restated Executive Employment Agreement among Stephanie L. Brown, the Company, LPL Holdings, Inc. and LPL Financial Corporation dated July 23, 2010. (2) | ||
| 10 | .9 | Executive Employment Agreement between Jonathan G. Eaton and LPL Holdings Inc., dated December 28, 2005. (5) | ||
| 10 | .10 | Executive Employment Agreement among Robert J. Moore, the Company, LPL Holdings, Inc. and LPL Financial Corporation, dated July 23, 2010. (2) | ||
| 10 | .11 | Form of Indemnification Agreement. (1) | ||
| 10 | .12 | LPL Investment Holdings Inc. 2008 Stock Option Plan. (7) | ||
| 10 | .13 | Form of LPL Investment Holdings Inc. Stock Option Agreement. (6) | ||
| 10 | .14 | LPL Investment Holdings Inc. 2008 Nonqualified Deferred Compensation Plan. (8) | ||
| 10 | .15 | LPL Investment Holdings Inc. Advisor Incentive Plan. (9) | ||
| 10 | .16 | LPL Investment Holdings Inc. Financial Institution Incentive Plan. (6) | ||
| 10 | .17 | LPL Investment Holdings Inc. and Affiliates Corporate Executive Bonus Plan. (10) | ||
73
Exhibit No. | Description of Exhibit | |||
| 10 | .18 | Thomson Transaction Services Master Subscription Agreement dated as of January 5, 2009 between LPL Financial Corporation and Thomson Financial LLC. (11)† | ||
| 10 | .19 | Third Amended and Restated Credit Agreement, dated as of May 24, 2010, by and among LPL Investment Holdings, Inc., LPL Holdings, Inc., the several lenders from time to time party thereto, Morgan Stanley Senior Funding, Inc., as Administrative Agent and Morgan Stanley & Co., as Collateral Agent. (12) | ||
| 10 | .20 | LPL Investment Holdings Inc. 2010 Omnibus Equity Incentive Plan. (1) | ||
| 10 | .21 | Form of Senior Executive Stock Option Award granted under the LPL Investment Holdings Inc. 2010 Omnibus Equity Incentive Plan. (13) | ||
| 10 | .22 | Form of Senior Management Stock Option Award granted under the LPL Investment Holdings Inc. 2010 Omnibus Equity Incentive Plan. (13) | ||
| 10 | .23 | LPL Financial LLC Executive Severance Plan, effective as of November 23, 2010.* | ||
| 10 | .24 | Relocation Bonus Agreement between Mark R. Helliker and LPL Financial LLC, dated January 25, 2011.* | ||
| 21 | .1 | List of Subsidiaries of LPL Investment Holdings Inc.* | ||
| 23 | .1 | Consent of Deloitte & Touche LLP, independent registered public accounting firm.* | ||
| 31 | .1 | Certification of the Chief Executive Officer pursuant to Rule 13a-14(a).* | ||
| 31 | .2 | Certification of the Chief Financial Officer pursuant to Rule 13a-14(a).* | ||
| 32 | .1 | Certification of the Chief Executive Officer pursuant to 18 U.S.C. Section 1350, as adopted pursuant to Section 906 of the Sarbanes-Oxley Act of 2002.* | ||
| 32 | .2 | Certification of the Chief Financial Officer pursuant to 18 U.S.C. Section 1350, as adopted pursuant to Section 906 of the Sarbanes-Oxley Act of 2002.* | ||
| Exhibit No. | Description of Exhibit |
| 3.1 | Amended and Restated Certificate ofIncorporation of LPL Investment HoldingsInc., dated November 23, 2010. (1) |
| 3.2 | Second Amended and Restated Bylaws ofLPL Investment Holdings Inc. (2) |
| 4.1 | Stockholders’ Agreement, dated as ofDecember 28, 2005, among LPL InvestmentHoldings Inc., LPL Holdings, Inc. andother stockholders party thereto. (3) |
| 4.2 | First Amendment to Stockholders’Agreement dated December 28, 2005, amongLPL Investment Holdings Inc., LPLHoldings, Inc. and other stockholdersparty thereto, dated November 23, 2010. (14) |
| 4.3 | Stockholders’ Agreement among theCompany and Hellman & Friedman CapitalPartners IV, L.Pl, Hellman & FriedmanCapital Partners V (Parallel), L.P.,Hellman & Friedman CapitalAssociates V, L.P. and TPG PartnersIV, L.P., dated November 23, 2010.* |
| 4.4 | Fifth Amended and Restated LPLInvestment Holdings Inc. 2000 StockBonus Plan. (4) |
| 4.5 | Management Stockholders’ Agreement amongthe Company, Stephanie L. Brown,Mark S. Casady, William E. DwyerIII, Robert J. Moore, and Esther M.Stearns, dated November 23, 2010. (14) |
| 10.1 | 2005 Stock Option Plan for IncentiveStock Options. (5) |
| 10.2 | 2005 Stock Option Plan for Non-QualifiedStock Options. (5) |
| 10.3 | Amended and Restated ExecutiveEmployment Agreement among Mark S.Casady, the Company, LPL Holdings, Inc.and LPL Financial Corporation, datedJuly 23, 2010. (2) |
| 10.4 | Amended and Restated ExecutiveEmployment Agreement among Esther M.Stearns, the Company, LPL Holdings, Inc.and LPL Financial Corporation, datedJuly 23, 2010. (2) |
| 10.5 | Amended and Restated ExecutiveEmployment Agreement among William E.Dwyer III, the Company, LPL Holdings,Inc. and LPL Financial Corporation,dated July 23, 2010. (2) |
| 10.6 | Executive Employment Agreement betweenDan H. Arnold and UVEST FinancialServices Group Inc. dated January 2,2007. (6) |
| 10.7 | Amendment dated September 28, 2009 tothe Executive Employment Agreementbetween Dan H. Arnold and UVESTFinancial Services Group Inc. datedJanuary 2, 2007. (6) |
| 10.8 | Amended and Restated ExecutiveEmployment Agreement among Stephanie L.Brown, the Company, LPL Holdings, Inc.and LPL Financial Corporation dated July23, 2010. (2) |
| 10.9 | Executive Employment Agreement betweenJonathan G. Eaton and LPL Holdings Inc.,dated December 28, 2005. (5) |
| 10.10 | Executive Employment Agreement amongRobert J. Moore, the Company, LPLHoldings, Inc. and LPL FinancialCorporation, dated July 23, 2010. (2) |
| 10.11 | Form of Indemnification Agreement. (1) |
| 10.12 | LPL Investment Holdings Inc. 2008 StockOption Plan. (7) |
| 10.13 | Form of LPL Investment Holdings Inc.Stock Option Agreement. (6) |
| 10.14 | LPL Investment Holdings Inc. 2008Nonqualified Deferred Compensation Plan.(8) |
| 10.15 | LPL Investment Holdings Inc. AdvisorIncentive Plan. (9) |
| 10.16 | LPL Investment Holdings Inc. FinancialInstitution Incentive Plan. (6) |
| 10.17 | LPL Investment Holdings Inc. andAffiliates Corporate Executive BonusPlan. (10) |
| 10.18 | Thomson Transaction Services MasterSubscription Agreement dated as ofJanuary 5, 2009 between LPL FinancialCorporation and Thomson Financial LLC.(11)† |
70
| Exhibit No. | Description of Exhibit |
| 10.19 | Third Amended and Restated CreditAgreement, dated as of May 24, 2010, byand among LPL Investment Holdings, Inc.,LPL Holdings, Inc., the several lendersfrom time to time party thereto, MorganStanley Senior Funding, Inc., asAdministrative Agent and Morgan Stanley& Co., as Collateral Agent. (12) |
| 10.20 | LPL Investment Holdings Inc. 2010Omnibus Equity Incentive Plan. (1) |
| 10.21 | Form of Senior Executive Stock OptionAward granted under the LPL InvestmentHoldings Inc. 2010 Omnibus EquityIncentive Plan. (13) |
| 10.22 | Form of Senior Management Stock OptionAward granted under the LPL InvestmentHoldings Inc. 2010 Omnibus EquityIncentive Plan. (13) |
| 10.23 | LPL Financial LLC Executive SeverancePlan, effective as of November 23,2010. (14) |
| 10.24 | Relocation Bonus Agreement between MarkR. Helliker and LPL Financial LLC, datedJanuary 25, 2011. (14) |
| 10.25 | Amendment to the LPL Investment Holdings Inc. 2008 Nonqualified Deferred Compensation Plan, dated December 1, 2011.* |
| 21.1 | List of Subsidiaries of LPL InvestmentHoldings Inc.* |
| 23.1 | Consent of Deloitte & Touche LLP,independent registered public accountingfirm.* |
| 31.1 | Certification of the Chief ExecutiveOfficer pursuant to Rule 13a-14(a).* |
| 31.2 | Certification of the Chief FinancialOfficer pursuant to Rule 13a-14(a).* |
| 32.1 | Certification of the Chief ExecutiveOfficer pursuant to 18 U.S.C.Section 1350, as adopted pursuant toSection 906 of the Sarbanes-Oxley Act of2002.* |
| 32.2 | Certification of the Chief FinancialOfficer pursuant to 18 U.S.C.Section 1350, as adopted pursuant toSection 906 of the Sarbanes-Oxley Act of2002.* |
| 101.INS | XBRL Instance Document* |
| 101.SCH | XBRL Taxonomy Extension Schema* |
| 101.CAL | XBRL Taxonomy Extension Calculation* |
| 101.DEF | XBRL Taxonomy Extension Definition* |
| 101.LAB | XBRL Taxonomy Extension Label* |
| 101.PRE | XBRL Taxonomy Extension Presentation* |
____________
71
| * | Filed herewith. | |
| † | Confidential treatment requested as to certain portions, which portions have been omitted and filed separately with the Securities and Exchange Commission. | |
| ) | Incorporated by reference to the Amendment No. 2 to the Registration Statement onForm S-1 filed on July 9, 2010. | |
| ) | Incorporated by reference to current report onForm 8-K filed on July 23, 2010. | |
| ) | Incorporated by reference to Amendment No. 1 to the Registration Statement on Form 10 filed on July 10, 2007. | |
| ) | Incorporated by reference to theForm 8-K filed on December 18, 2008. | |
| ) | Incorporated by reference to the Registration Statement on Form 10 filed on April 30, 2007. | |
| ) | Incorporated by reference to the Registration Statement onForm S-1 filed on June 4, 2010. | |
| ) | Incorporated by reference to theForm 8-K filed on February 21, 2008. | |
| ) | Incorporated by reference to theForm 8-K filed on November 25, 2008. | |
| ) | Incorporated by reference to theForm S-8 on June 5, 2008. | |
| ) | Incorporated by reference to the Schedule 14A filed on April 27, 2010. | |
| ) | Incorporated by reference to Amendment No. 2 to the Registration Statement onForm S-1 filed on June 22, 2010. | |
| ) | Incorporated by reference to theForm 8-K filed on May 28, 2010. | |
| ) | Incorporated by reference to Amendment No. 4 to the Registration Statement onForm S-1 filed on November 3, 2010. | |
| (14 | ) | Incorporated by reference to the Form 10-K filed on March 9, 2011. |
74
72
SIGNATURES
Pursuant to the requirements of Section 12 of the Securities Exchange Act of 1934, the registrant has duly caused this Annual Report onForm 10-K to be signed on its behalf by the undersigned, thereunto duly authorized.
LPL Investment Holdings Inc.
By: /s/ Mark S. Casady |
Mark S. Casady
Chief Executive Officer and Chairman
Dated: March 9, 2011February 27, 2012
Pursuant to the requirements of the Securities and Exchange Act of 1934, this report has been signed below by the following persons on behalf of the Registrant and in the capacities and on the dates indicated.
| Signature | Title | Date | ||||
Mark S. Casady | Chief Executive Officer and Chairman | |||||
/s/ Robert J. Moore | Chief | |||||
/s/ Thomas D. Lux | Chief | |||||
/s/ Richard W. Boyce | Director | |||||
/s/ John J. Brennan | Director | |||||
/s/ James S. Putnam | Director | |||||
/s/ Jeffrey A. Goldstein | Director | |||||
/s/ James S. Riepe | Director | |||||
/s/ Richard P. Schifter | Director | |||||
/s/ Jeffrey E. Stiefler | Director | |||||
75
/s/ | ||||||
Allen R. Thorpe | Director | |||||
76
Exhibit No. | Description of Exhibit | |||
| 3 | .1 | Amended and Restated Certificate of Incorporation of LPL Investment Holdings Inc., dated November 23, 2010. (1) | ||
| 3 | .2 | Second Amended and Restated Bylaws of LPL Investment Holdings Inc. (2) | ||
| 4 | .1 | Stockholders’ Agreement, dated as of December 28, 2005, among LPL Investment Holdings Inc., LPL Holdings, Inc. and other stockholders party thereto. (3) | ||
| 4 | .2 | First Amendment to Stockholders’ Agreement dated December 28, 2005, among LPL Investment Holdings Inc., LPL Holdings, Inc. and other stockholders party thereto, dated November 23, 2010.* | ||
| 4 | .3 | Stockholders’ Agreement among the Company and Hellman & Friedman Capital Partners IV, L.Pl, Hellman & Friedman Capital Partners V (Parallel), L.P., Hellman & Friedman Capital Associates V, L.P. and TPG Partners IV, L.P., dated November 23, 2010.* | ||
| 4 | .4 | Fifth Amended and Restated LPL Investment Holdings Inc. 2000 Stock Bonus Plan. (4) | ||
| 4 | .5 | Management Stockholders’ Agreement among the Company, Stephanie L. Brown, Mark S. Casady, William E. Dwyer III, Robert J. Moore, and Esther M. Stearns, dated November 23, 2010.* | ||
| 10 | .1 | 2005 Stock Option Plan for Incentive Stock Options. (5) | ||
| 10 | .2 | 2005 Stock Option Plan for Non-Qualified Stock Options. (5) | ||
| 10 | .3 | Amended and Restated Executive Employment Agreement among Mark S. Casady, the Company, LPL Holdings, Inc. and LPL Financial Corporation, dated July 23, 2010. (2) | ||
| 10 | .4 | Amended and Restated Executive Employment Agreement among Esther M. Stearns, the Company, LPL Holdings, Inc. and LPL Financial Corporation, dated July 23, 2010. (2) | ||
| 10 | .5 | Amended and Restated Executive Employment Agreement among William E. Dwyer III, the Company, LPL Holdings, Inc. and LPL Financial Corporation, dated July 23, 2010. (2) | ||
| 10 | .6 | Executive Employment Agreement between Dan H. Arnold and UVEST Financial Services Group Inc. dated January 2, 2007. (6) | ||
| 10 | .7 | Amendment dated September 28, 2009 to the Executive Employment Agreement between Dan H. Arnold and UVEST Financial Services Group Inc. dated January 2, 2007. (6) | ||
| 10 | .8 | Amended and Restated Executive Employment Agreement among Stephanie L. Brown, the Company, LPL Holdings, Inc. and LPL Financial Corporation dated July 23, 2010. (2) | ||
| 10 | .9 | Executive Employment Agreement between Jonathan G. Eaton and LPL Holdings Inc., dated December 28, 2005. (5) | ||
| 10 | .10 | Executive Employment Agreement among Robert J. Moore, the Company, LPL Holdings, Inc. and LPL Financial Corporation, dated July 23, 2010. (2) | ||
| 10 | .11 | Form of Indemnification Agreement. (1) | ||
| 10 | .12 | LPL Investment Holdings Inc. 2008 Stock Option Plan. (7) | ||
| 10 | .13 | Form of LPL Investment Holdings Inc. Stock Option Agreement. (6) | ||
| 10 | .14 | LPL Investment Holdings Inc. 2008 Nonqualified Deferred Compensation Plan. (8) | ||
| 10 | .15 | LPL Investment Holdings Inc. Advisor Incentive Plan. (9) | ||
| 10 | .16 | LPL Investment Holdings Inc. Financial Institution Incentive Plan. (6) | ||
| 10 | .17 | LPL Investment Holdings Inc. and Affiliates Corporate Executive Bonus Plan. (10) | ||
| 10 | .18 | Thomson Transaction Services Master Subscription Agreement dated as of January 5, 2009 between LPL Financial Corporation and Thomson Financial LLC. (11)† | ||
| 10 | .19 | Third Amended and Restated Credit Agreement, dated as of May 24, 2010, by and among LPL Investment Holdings, Inc., LPL Holdings, Inc., the several lenders from time to time party thereto, Morgan Stanley Senior Funding, Inc., as Administrative Agent and Morgan Stanley & Co., as Collateral Agent. (12) | ||
| 10 | .20 | LPL Investment Holdings Inc. 2010 Omnibus Equity Incentive Plan. (1) | ||
| 10 | .21 | Form of Senior Executive Stock Option Award granted under the LPL Investment Holdings Inc. 2010 Omnibus Equity Incentive Plan. (13) | ||
77
Exhibit No. | Description of Exhibit | |||
| 10 | .22 | Form of Senior Management Stock Option Award granted under the LPL Investment Holdings Inc. 2010 Omnibus Equity Incentive Plan. (13) | ||
| 10 | .23 | LPL Financial LLC Executive Severance Plan, effective as of November 23, 2010.* | ||
| 10 | .24 | Relocation Bonus Agreement between Mark R. Helliker and LPL Financial LLC, dated January 25, 2011.* | ||
| 21 | .1 | List of Subsidiaries of LPL Investment Holdings Inc.* | ||
| 23 | .1 | Consent of Deloitte & Touche LLP, independent registered public accounting firm.* | ||
| 31 | .1 | Certification of the Chief Executive Officer pursuant to Rule 13a-14(a).* | ||
| 31 | .2 | Certification of the Chief Financial Officer pursuant to Rule 13a-14(a).* | ||
| 32 | .1 | Certification of the Chief Executive Officer pursuant to 18 U.S.C. Section 1350, as adopted pursuant to Section 906 of the Sarbanes-Oxley Act of 2002.* | ||
| 32 | .2 | Certification of the Chief Financial Officer pursuant to 18 U.S.C. Section 1350, as adopted pursuant to Section 906 of the Sarbanes-Oxley Act of 2002.* | ||
78
73
LPL INVESTMENT HOLDINGS INC.
INDEX TO CONSOLIDATED FINANCIAL STATEMENTS AND SUPPLEMENTARY DATA
The following consolidated financial statements of LPL Investment Holdings Inc. are included in response to Item 8:
| Page | |||||
Consolidated Financial Statements | |||||
F-1
REPORT OF INDEPENDENT REGISTERED PUBLIC ACCOUNTING FIRM
To the Board of Directors and Stockholders of
LPL Investment Holdings Inc.
Boston, Massachusetts
We have audited the accompanying consolidated statements of financial condition of LPL Investment Holdings Inc., and subsidiaries (the “Company”"Company") as of December 31, 20102011 and 2009,2010, and the related consolidated statements of operations, stockholders’stockholders' equity, and cash flows for each of the three years in the period ended December 31, 2010.2011. These consolidated financial statements are the responsibility of the Company’sCompany's management. Our responsibility is to express an opinion on these consolidated financial statements based on our audits.
We conducted our audits in accordance with the standards of the Public Company Accounting Oversight Board (United States). Those standards require that we plan and perform the audit to obtain reasonable assurance about whether the financial statements are free of material misstatement. An audit includes examining, on a test basis, evidence supporting the amounts and disclosures in the financial statements. An audit also includes assessing the accounting principles used and significant estimates made by management, as well as evaluating the overall financial statement presentation. We believe that our audits provide a reasonable basis for our opinion.
In our opinion, such consolidated financial statements present fairly, in all material respects, the financial position of LPL Investment Holdings Inc. and subsidiaries as of December 31, 20102011 and 2009,2010, and the results of their operations and their cash flows for each of the three years in the period ended December 31, 2010,2011, in conformity with accounting principles generally accepted in the United States of America.
We have also audited, in accordance with the standards of the Public Company Accounting Oversight Board (United States), the Company’sCompany's internal control over financial reporting as of December 31, 2010,2011, based on the criteria established inInternal Control — IntegratedControl-Integrated Frameworkissued by the Committee of Sponsoring Organizations of the Treadway Commission and our report dated March 9, 2011February 27, 2012, expressed an unqualified opinion on the Company’sCompany's internal control over financial reporting.
/s/ Deloitte & Touche LLP
Costa Mesa, California
F-2
LPL INVESTMENT HOLDINGS INC. AND SUBSIDIARIES
Consolidated Statements of Operations
For the Years Ended December 31, 2011, 2010 2009 and 2008
2009
2009
(Dollars in thousands, except per share data)
| 2010 | 2009 | 2008 | ||||||||||||||
| REVENUES: | ||||||||||||||||
| Commissions | $ | 1,620,811 | $ | 1,477,655 | $ | 1,640,218 | ||||||||||
| Advisory fees | 860,227 | 704,139 | 830,555 | |||||||||||||
| Asset-based fees | 317,505 | 272,893 | 352,293 | |||||||||||||
| Transaction and other fees | 274,148 | 255,574 | 240,486 | |||||||||||||
| Interest income, net of interest expense | 19,807 | 20,545 | 33,684 | |||||||||||||
| Other | 20,988 | 18,699 | 19,113 | |||||||||||||
| Total net revenues | 3,113,486 | 2,749,505 | 3,116,349 | |||||||||||||
| EXPENSES: | ||||||||||||||||
| Commissions and advisory fees | 2,362,910 | 1,872,478 | 2,132,050 | |||||||||||||
| Compensation and benefits | 308,656 | 270,436 | 343,171 | |||||||||||||
| Depreciation and amortization | 86,037 | 108,296 | 100,462 | |||||||||||||
| Promotional | 69,191 | 61,451 | 99,707 | |||||||||||||
| Occupancy and equipment | 50,159 | 50,475 | 58,752 | |||||||||||||
| Professional services | 39,521 | 38,071 | 31,492 | |||||||||||||
| Brokerage, clearing and exchange | 34,625 | 32,101 | 30,998 | |||||||||||||
| Communications and data processing | 34,372 | 36,194 | 39,967 | |||||||||||||
| Regulatory fees and expenses | 26,143 | 23,217 | 21,747 | |||||||||||||
| Restructuring charges | 13,922 | 58,695 | 14,966 | |||||||||||||
| Travel and entertainment | 13,629 | 9,008 | 14,782 | |||||||||||||
| Other | 34,826 | 15,294 | 17,558 | |||||||||||||
| Total operating expenses | 3,073,991 | 2,575,716 | 2,905,652 | |||||||||||||
| Interest expense from senior credit facilities, subordinated notes and revolving line of credit | 90,407 | 100,922 | 115,558 | |||||||||||||
| Loss on extinguishment of debt | 37,979 | — | — | |||||||||||||
| (Gain) loss on equity method investment | (42 | ) | 300 | 2,374 | ||||||||||||
| Total expenses | 3,202,335 | 2,676,938 | 3,023,584 | |||||||||||||
| (LOSS) INCOME BEFORE (BENEFIT FROM) PROVISION FOR INCOME TAXES | (88,849 | ) | 72,567 | 92,765 | ||||||||||||
| (BENEFIT FROM) PROVISION FOR INCOME TAXES | (31,987 | ) | 25,047 | 47,269 | ||||||||||||
| NET (LOSS) INCOME | $ | (56,862 | ) | $ | 47,520 | $ | 45,496 | |||||||||
| (LOSS) EARNINGS PER SHARE (Note 16): | ||||||||||||||||
| Basic | $ | (0.64 | ) | $ | 0.54 | $ | 0.53 | |||||||||
| Diluted | $ | (0.64 | ) | $ | 0.47 | $ | 0.45 | |||||||||
| 2011 | 2010 | 2009 | ||||||||||
| REVENUES: | ||||||||||||
| Commissions | $ | 1,754,435 | $ | 1,620,811 | $ | 1,477,655 | ||||||
| Advisory fees | 1,027,473 | 860,227 | 704,139 | |||||||||
| Asset-based fees | 359,724 | 317,505 | 272,893 | |||||||||
| Transaction and other fees | 292,207 | 274,148 | 255,574 | |||||||||
| Interest income, net of interest expense | 20,065 | 19,807 | 20,545 | |||||||||
| Other | 25,471 | 20,988 | 18,699 | |||||||||
| Total net revenues | 3,479,375 | 3,113,486 | 2,749,505 | |||||||||
| EXPENSES: | ||||||||||||
| Commissions and advisory fees | 2,410,337 | 2,362,910 | 1,872,478 | |||||||||
| Compensation and benefits | 322,126 | 308,656 | 270,436 | |||||||||
| Promotional | 82,885 | 69,191 | 61,451 | |||||||||
| Depreciation and amortization | 72,741 | 86,037 | 108,296 | |||||||||
| Occupancy and equipment | 55,470 | 50,159 | 50,475 | |||||||||
| Professional services | 41,590 | 39,521 | 38,071 | |||||||||
| Brokerage, clearing and exchange | 38,087 | 34,625 | 32,101 | |||||||||
| Communications and data processing | 36,696 | 34,372 | 36,194 | |||||||||
| Regulatory fees and expenses | 26,116 | 26,143 | 23,217 | |||||||||
| Restructuring charges | 21,407 | 13,922 | 58,695 | |||||||||
| Other | 20,471 | 48,413 | 24,602 | |||||||||
| Total operating expenses | 3,127,926 | 3,073,949 | 2,576,016 | |||||||||
Interest expense from senior credit facilities, subordinated notes and revolving line of credit | 68,764 | 90,407 | 100,922 | |||||||||
| Loss on extinguishment of debt | — | 37,979 | — | |||||||||
| Total expenses | 3,196,690 | 3,202,335 | 2,676,938 | |||||||||
INCOME (LOSS) BEFORE PROVISION FOR (BENEFIT (FROM) INCOME TAXES | 282,685 | (88,849 | ) | 72,567 | ||||||||
| PROVISION FOR (BENEFIT FROM) INCOME TAXES | 112,303 | (31,987 | ) | 25,047 | ||||||||
| NET INCOME (LOSS) | $ | 170,382 | $ | (56,862 | ) | $ | 47,520 | |||||
| EARNINGS (LOSS) PER SHARE (Note 16): | ||||||||||||
| Basic | $ | 1.55 | $ | (0.64 | ) | $ | 0.54 | |||||
| Diluted | $ | 1.50 | $ | (0.64 | ) | $ | 0.47 | |||||
See notes to consolidated financial statements.
F-3
F-3
LPL INVESTMENT HOLDINGS INC. AND SUBSIDIARIES
Consolidated Statements of Financial Condition
2010
(Dollars in thousands, except par value)
| 2010 | 2009 | |||||||
ASSETS | ||||||||
| Cash and cash equivalents | $ | 419,208 | $ | 378,594 | ||||
| Cash and securities segregated under federal and other regulations | 373,634 | 288,608 | ||||||
| Receivables from: | ||||||||
| Clients, net of allowance of $655 at December 31, 2010 and $792 at December 31, 2009 | 271,051 | 257,529 | ||||||
| Product sponsors, broker-dealers and clearing organizations | 203,332 | 171,900 | ||||||
| Others, net of allowances of $6,796 at December 31, 2010 and $6,159 at December 31, 2009 | 169,391 | 139,317 | ||||||
| Securities owned: | ||||||||
| Trading | 9,259 | 15,361 | ||||||
| Held-to-maturity | 9,563 | 10,454 | ||||||
| Securities borrowed | 8,391 | 4,950 | ||||||
| Income taxes receivable | 144,041 | — | ||||||
| Fixed assets, net of accumulated depreciation and amortization of $276,501 at December 31, 2010 and $239,868 at December 31, 2009 | 78,671 | 101,584 | ||||||
| Debt issuance costs, net of accumulated amortization of $14,106 at December 31, 2010 and $15,724 at December 31, 2009 | 23,711 | 16,542 | ||||||
| Goodwill | 1,293,366 | 1,293,366 | ||||||
| Intangible assets, net of accumulated amortization of $172,726 at December 31, 2010 and $136,177 at December 31, 2009 | 560,077 | 597,083 | ||||||
| Other assets | 82,472 | 61,648 | ||||||
| Total assets | $ | 3,646,167 | $ | 3,336,936 | ||||
| LIABILITIES AND STOCKHOLDERS’ EQUITY | ||||||||
| LIABILITIES: | ||||||||
| Drafts payable | $ | 182,489 | $ | 125,767 | ||||
| Payables to clients | 383,289 | 493,943 | ||||||
| Payables to broker-dealers and clearing organizations | 39,070 | 18,217 | ||||||
| Accrued commissions and advisory fees payable | 130,408 | 110,040 | ||||||
| Accounts payable and accrued liabilities | 154,586 | 129,898 | ||||||
| Income taxes payable | — | 24,226 | ||||||
| Unearned revenue | 53,618 | 45,844 | ||||||
| Interest rate swaps | 7,281 | 17,292 | ||||||
| Securities sold but not yet purchased — at fair value | 4,821 | 4,003 | ||||||
| Senior credit facilities and subordinated notes | 1,386,639 | 1,369,223 | ||||||
| Deferred income taxes — net | 130,211 | 147,608 | ||||||
| Total liabilities | 2,472,412 | 2,486,061 | ||||||
| STOCKHOLDERS’ EQUITY: | ||||||||
| Common stock, $.001 par value; 600,000,000 shares authorized; 108,714,757 shares issued and outstanding at December 31, 2010, and 94,214,762 shares issued and outstanding at December 31, 2009 of which 7,423,973 are restricted | 109 | 87 | ||||||
| Additional paid-in capital | 1,051,722 | 679,277 | ||||||
| Stockholder loans | — | (499 | ) | |||||
| Accumulated other comprehensive loss | (4,496 | ) | (11,272 | ) | ||||
| Retained earnings | 126,420 | 183,282 | ||||||
| Total stockholders’ equity | 1,173,755 | 850,875 | ||||||
| Total liabilities and stockholders’ equity | $ | 3,646,167 | $ | 3,336,936 | ||||
| 2011 | 2010 | |||||||
| ASSETS | ||||||||
| Cash and cash equivalents | $ | 720,772 | $ | 419,208 | ||||
| Cash and securities segregated under federal and other regulations | 382,905 | 373,634 | ||||||
| Receivables from: | ||||||||
| Clients, net of allowance of $716 at December 31, 2011 and $655 at December 31, 2010 | 301,292 | 271,051 | ||||||
| Product sponsors, broker-dealers and clearing organizations | 143,493 | 203,332 | ||||||
| Others, net of allowance of $8,833 at December 31, 2011 and $6,796 at December 31, 2010 | 187,408 | 169,391 | ||||||
| Securities owned: | ||||||||
| Trading — at fair value | 6,290 | 9,259 | ||||||
| Held-to-maturity | 11,167 | 9,563 | ||||||
| Securities borrowed | 7,890 | 8,391 | ||||||
| Income taxes receivable | — | 144,041 | ||||||
| Fixed assets, net of accumulated depreciation and amortization of $305,143 at December 31, 2011 and $276,501 at December 31, 2010 | 91,317 | 78,671 | ||||||
| Debt issuance costs, net of accumulated amortization of $19,197 at December 31, 2011 and $14,106 at December 31, 2010 | 18,620 | 23,711 | ||||||
| Goodwill | 1,334,086 | 1,293,366 | ||||||
| Intangible assets, net of accumulated amortization of $198,139 at December 31, 2011 and $172,726 at December 31, 2010 | 537,670 | 560,077 | ||||||
| Other assets | 73,416 | 82,472 | ||||||
| Total assets | $ | 3,816,326 | $ | 3,646,167 | ||||
| LIABILITIES AND STOCKHOLDERS’ EQUITY | ||||||||
| LIABILITIES: | ||||||||
| Drafts payable | $ | 187,575 | $ | 182,489 | ||||
| Payables to clients | 456,719 | 383,289 | ||||||
| Payables to broker-dealers and clearing organizations | 34,755 | 39,070 | ||||||
| Accrued commissions and advisory fees payable | 109,715 | 130,408 | ||||||
| Accounts payable and accrued liabilities | 160,399 | 154,586 | ||||||
| Income taxes payable | 906 | — | ||||||
| Unearned revenue | 59,537 | 53,618 | ||||||
| Interest rate swaps | 1,377 | 7,281 | ||||||
| Securities sold but not yet purchased — at fair value | 161 | 4,821 | ||||||
| Senior credit facilities | 1,332,668 | 1,386,639 | ||||||
| Deferred income taxes — net | 127,766 | 130,211 | ||||||
| Total liabilities | 2,471,578 | 2,472,412 | ||||||
| STOCKHOLDERS’ EQUITY: | ||||||||
| Common stock, $.001 par value; 600,000,000 shares authorized; 110,531,939 shares issued at December 31, 2011 and 108,714,757 shares issued at December 31, 2010 | 110 | 109 | ||||||
| Additional paid-in capital | 1,137,723 | 1,051,722 | ||||||
| Treasury stock, at cost — 2,617,629 shares at December 31, 2011 and 0 shares at December 31, 2010 | (89,037 | ) | — | |||||
| Accumulated other comprehensive loss | (850 | ) | (4,496 | ) | ||||
| Retained earnings | 296,802 | 126,420 | ||||||
| Total stockholders’ equity | 1,344,748 | 1,173,755 | ||||||
| Total liabilities and stockholders’ equity | $ | 3,816,326 | $ | 3,646,167 | ||||
See notes to consolidated financial statements.
F-4
F-4
LPL INVESTMENT HOLDINGS INC. AND SUBSIDIARIES
Consolidated Statements of Stockholders’ Equity
For the Years Ended December 31, 2011, 2010 2009 and 2008
2009
2009
(In thousands)
| Accumulated | ||||||||||||||||||||||||||||
| Additional | Other | Total | ||||||||||||||||||||||||||
| Common Stock | Paid-In | Stockholder | Comprehensive | Retained | Stockholders’ | |||||||||||||||||||||||
| Shares | Amount | Capital | Loans | Loss | Earnings | Equity | ||||||||||||||||||||||
| BALANCE — December 31, 2007 | 86,250 | $ | 86 | $ | 664,568 | $ | (1,242 | ) | $ | (6,512 | ) | $ | 90,266 | $ | 747,166 | |||||||||||||
| Comprehensive income: | ||||||||||||||||||||||||||||
| Net income | 45,496 | 45,496 | ||||||||||||||||||||||||||
| Unrealized loss on interest rate swaps, net of tax benefit of $5,596 | (8,986 | ) | (8,986 | ) | ||||||||||||||||||||||||
| Total comprehensive income | 36,510 | |||||||||||||||||||||||||||
| Stockholder loans | 306 | 306 | ||||||||||||||||||||||||||
| Excess tax benefits from stock options exercised | 668 | 668 | ||||||||||||||||||||||||||
| Exercise of stock options | 286 | 1 | 585 | 586 | ||||||||||||||||||||||||
| Share-based compensation | 4,859 | 4,859 | ||||||||||||||||||||||||||
| Issuance of restricted stock awards | 7,424 | |||||||||||||||||||||||||||
| Issuance of common stock | 144 | 4,000 | 4,000 | |||||||||||||||||||||||||
| Repurchase of common stock | (136 | ) | (3,783 | ) | (3,783 | ) | ||||||||||||||||||||||
| BALANCE — December 31, 2008 | 93,968 | $ | 87 | $ | 670,897 | $ | (936 | ) | $ | (15,498 | ) | $ | 135,762 | $ | 790,312 | |||||||||||||
| Comprehensive income: | ||||||||||||||||||||||||||||
| Net income | 47,520 | 47,520 | ||||||||||||||||||||||||||
| Unrealized gain on interest rate swaps, net of tax expense of $3,899 | 4,226 | 4,226 | ||||||||||||||||||||||||||
| Total comprehensive income | 51,746 | |||||||||||||||||||||||||||
| Stockholder loans | 437 | 437 | ||||||||||||||||||||||||||
| Exercise of stock options | 257 | 290 | 290 | |||||||||||||||||||||||||
| Excess tax benefits from stock options exercised | 147 | 147 | ||||||||||||||||||||||||||
| Share-based compensation | 8,124 | 8,124 | ||||||||||||||||||||||||||
| Repurchase of common stock | (10 | ) | (181 | ) | (181 | ) | ||||||||||||||||||||||
| BALANCE — December 31, 2009 | 94,215 | $ | 87 | $ | 679,277 | $ | (499 | ) | $ | (11,272 | ) | $ | 183,282 | $ | 850,875 | |||||||||||||
| Comprehensive loss: | ||||||||||||||||||||||||||||
| Net loss | (56,862 | ) | (56,862 | ) | ||||||||||||||||||||||||
| Unrealized gain on interest rate swaps, net of tax expense of $3,235 | 6,776 | 6,776 | ||||||||||||||||||||||||||
| Total comprehensive loss | (50,086 | ) | ||||||||||||||||||||||||||
| Stockholder loans | 499 | 499 | ||||||||||||||||||||||||||
| Revocation of restricted stock awards | (25 | ) | ||||||||||||||||||||||||||
| Exercise of stock options and warrants | 13,039 | 13 | 88 | 101 | ||||||||||||||||||||||||
| Release on the restriction of stock awards | 7 | 221,975 | 221,982 | |||||||||||||||||||||||||
| Excess tax benefits from share-based compensation | 93,445 | 93,445 | ||||||||||||||||||||||||||
| Share-based compensation | 15,137 | 15,137 | ||||||||||||||||||||||||||
| Issuance of common stock | 1,486 | 2 | 41,800 | 41,802 | ||||||||||||||||||||||||
| BALANCE — December 31, 2010 | 108,715 | $ | 109 | $ | 1,051,722 | $ | — | $ | (4,496 | ) | $ | 126,420 | $ | 1,173,755 | ||||||||||||||
Additional Paid-In Capital | Stockholder Loans | Accumulated Comprehensive Loss | Retained Earnings | Total Stockholders' Equity | |||||||||||||||||||||||||||||
| Common Stock | Treasury Stock | ||||||||||||||||||||||||||||||||
| Shares | Amount | Shares | Amount | ||||||||||||||||||||||||||||||
| BALANCE — December 31, 2008 | 93,968 | $ | 87 | $ | 670,897 | — | $ | — | $ | (936 | ) | $ | (15,498 | ) | $ | 135,762 | $ | 790,312 | |||||||||||||||
| Comprehensive income: | |||||||||||||||||||||||||||||||||
| Net income | 47,520 | 47,520 | |||||||||||||||||||||||||||||||
| Unrealized gain on interest rate swaps, net of tax expense of $3,899 | 4,226 | 4,226 | |||||||||||||||||||||||||||||||
| Other comprehensive income | 51,746 | ||||||||||||||||||||||||||||||||
| Stockholder loans | 437 | 437 | |||||||||||||||||||||||||||||||
| Exercise of stock options | 257 | 290 | 290 | ||||||||||||||||||||||||||||||
| Excess tax benefits from stock options exercised | 147 | 147 | |||||||||||||||||||||||||||||||
| Share-based compensation | 8,124 | 8,124 | |||||||||||||||||||||||||||||||
| Repurchase of common stock | (10 | ) | (181 | ) | (181 | ) | |||||||||||||||||||||||||||
| BALANCE — December 31, 2009 | 94,215 | $ | 87 | $ | 679,277 | — | $ | — | $ | (499 | ) | $ | (11,272 | ) | $ | 183,282 | $ | 850,875 | |||||||||||||||
| Comprehensive loss: | |||||||||||||||||||||||||||||||||
| Net loss | (56,862 | ) | (56,862 | ) | |||||||||||||||||||||||||||||
| Unrealized gain on interest rate swaps, net of tax expense of $3,235 | 6,776 | 6,776 | |||||||||||||||||||||||||||||||
| Other comprehensive loss | (50,086 | ) | |||||||||||||||||||||||||||||||
| Stockholder loans | 499 | 499 | |||||||||||||||||||||||||||||||
| Revocation of restricted stock awards | (25 | ) | |||||||||||||||||||||||||||||||
| Exercise of stock options and warrants | 13,039 | 13 | 88 | 101 | |||||||||||||||||||||||||||||
| Release on the restriction of stock awards | 7 | 221,975 | 221,982 | ||||||||||||||||||||||||||||||
| Excess tax benefits from share-based compensation | 93,445 | 93,445 | |||||||||||||||||||||||||||||||
| Share-based compensation | 15,137 | 15,137 | |||||||||||||||||||||||||||||||
| Issuance of common stock | 1,486 | 2 | 41,800 | 41,802 | |||||||||||||||||||||||||||||
| BALANCE — December 31, 2010 | 108,715 | $ | 109 | $ | 1,051,722 | — | $ | ��� | $ | — | $ | (4,496 | ) | $ | 126,420 | $ | 1,173,755 | ||||||||||||||||
| Comprehensive income: | |||||||||||||||||||||||||||||||||
| Net income | 170,382 | 170,382 | |||||||||||||||||||||||||||||||
| Unrealized gain on interest rate swaps, net of tax expense of $2,258 | 3,646 | 3,646 | |||||||||||||||||||||||||||||||
| Total comprehensive income | 174,028 | ||||||||||||||||||||||||||||||||
| Treasury stock purchases | 2,618 | (89,037 | ) | (89,037 | ) | ||||||||||||||||||||||||||||
| Exercise of stock options and warrants | 1,817 | 1 | 10,161 | 10,162 | |||||||||||||||||||||||||||||
| Excess tax benefits from share-based compensation | 57,590 | 57,590 | |||||||||||||||||||||||||||||||
| Share-based compensation | 18,250 | 18,250 | |||||||||||||||||||||||||||||||
| BALANCE — December 31, 2011 | 110,532 | $ | 110 | $ | 1,137,723 | 2,618 | $ | (89,037 | ) | $ | — | $ | (850 | ) | $ | 296,802 | $ | 1,344,748 | |||||||||||||||
See notes to consolidated financial statements.
F-5
F-5
LPL INVESTMENT HOLDINGS INC. AND SUBSIDIARIES
Condensed Consolidated Statements of Cash Flows
For the Years Ended December 31, 2011, 2010 2009 and 2008
2009
2009
(Dollars in thousands)
| 2010 | 2009 | 2008 | ||||||||||
| CASH FLOWS FROM OPERATING ACTIVITIES: | ||||||||||||
| Net (loss) income | $ | (56,862 | ) | $ | 47,520 | $ | 45,496 | |||||
| Adjustments to reconcile net (loss) income to net cash (used in) provided by operating activities: | ||||||||||||
| Noncash items: | ||||||||||||
| Benefits received from retention plans | — | — | 4,347 | |||||||||
| Depreciation and amortization | 86,037 | 108,296 | 100,462 | |||||||||
| Amortization of debt issuance costs | 4,896 | 3,757 | 3,742 | |||||||||
| Impairment of fixed assets | 840 | 1,288 | — | |||||||||
| Loss on disposal of fixed assets | 160 | 329 | 47 | |||||||||
| Share-based compensation | 237,119 | 8,124 | 4,859 | |||||||||
| Excess tax benefits related to share-based compensation | (93,445 | ) | (147 | ) | (668 | ) | ||||||
| Provision for bad debts | 1,621 | 3,319 | 3,471 | |||||||||
| Deferred income tax provision | (21,619 | ) | (41,460 | ) | (26,138 | ) | ||||||
| Loss on extinguishment of debt | 37,979 | — | — | |||||||||
| (Gain) loss on equity method investment | (42 | ) | 300 | 2,374 | ||||||||
| Impairment of intangible assets | — | 18,636 | — | |||||||||
| Lease abandonment | 5,383 | 6,612 | — | |||||||||
| Loan forgiveness | 4,359 | 2,072 | — | |||||||||
| Other | (118 | ) | (647 | ) | 1,815 | |||||||
| Changes in operating assets and liabilities: | ||||||||||||
| Cash and securities segregated under federal and other regulations | (85,026 | ) | 52,967 | (145,764 | ) | |||||||
| Receivables from clients | (13,522 | ) | 38,268 | 114,833 | ||||||||
| Receivables from product sponsors, broker-dealers and clearing organizations | (31,432 | ) | 59,500 | (71,247 | ) | |||||||
| Receivables from others | (35,546 | ) | (50,937 | ) | 423 | |||||||
| Securities owned | 6,297 | (3,832 | ) | 2,542 | ||||||||
| Securities borrowed | (3,441 | ) | (4,346 | ) | 8,434 | |||||||
| Other assets | (3,877 | ) | (8,061 | ) | (6,687 | ) | ||||||
| Drafts payable | 56,722 | (28,664 | ) | 27,287 | ||||||||
| Payables to clients | (110,654 | ) | 30,932 | 56,334 | ||||||||
| Payables to broker-dealers and clearing organizations | 20,853 | (3,517 | ) | (26,191 | ) | |||||||
| Accrued commissions and advisory fees payable | 20,368 | 9,713 | (26,257 | ) | ||||||||
| Accounts payable and accrued liabilities | 15,279 | (236 | ) | 26,628 | ||||||||
| Income taxes receivable/payable | (73,835 | ) | 12,092 | 2,301 | ||||||||
| Unearned revenue | 7,774 | 9,186 | (4,239 | ) | ||||||||
| Securities sold but not yet purchased | 818 | 93 | (8,927 | ) | ||||||||
| Net cash (used in) provided by operating activities | (22,914 | ) | 271,157 | 89,277 | ||||||||
| CASH FLOWS FROM INVESTING ACTIVITIES: | ||||||||||||
| Capital expenditures | (23,095 | ) | (8,313 | ) | (62,812 | ) | ||||||
| Proceeds from disposal of fixed assets | — | 200 | — | |||||||||
Purchase of securities classified asheld-to-maturity | (5,392 | ) | (3,746 | ) | (7,732 | ) | ||||||
| 2011 | 2010 | 2009 | ||||||||||
| CASH FLOWS FROM OPERATING ACTIVITIES: | ||||||||||||
| Net income (loss) | $ | 170,382 | $ | (56,862 | ) | $ | 47,520 | |||||
| Adjustments to reconcile net income (loss) to net cash provided by (used in) operating activities: | ||||||||||||
| Noncash items: | ||||||||||||
| Depreciation and amortization | 72,741 | 86,037 | 108,296 | |||||||||
| Amortization of debt issuance costs | 5,091 | 4,896 | 3,757 | |||||||||
| Impairment of fixed assets | — | 840 | 1,288 | |||||||||
| Loss on disposal of fixed assets | 112 | 160 | 329 | |||||||||
| Share-based compensation | 18,250 | 237,119 | 8,124 | |||||||||
| Excess tax benefits related to share-based compensation | (57,590 | ) | (93,445 | ) | (147 | ) | ||||||
| Provision for bad debts | 3,833 | 1,621 | 3,319 | |||||||||
| Deferred income tax provision | (8,432 | ) | (21,619 | ) | (41,460 | ) | ||||||
| Loss on extinguishment of debt | — | 37,979 | — | |||||||||
| Impairment of intangible assets | 2,776 | — | 18,636 | |||||||||
| Lease abandonment | 1,054 | 5,383 | 6,612 | |||||||||
| Loan forgiveness | 1,530 | 4,359 | 2,072 | |||||||||
| Other | 1,511 | (160 | ) | (347 | ) | |||||||
| Changes in operating assets and liabilities: | ||||||||||||
| Cash and securities segregated under federal and other regulations | (9,271 | ) | (85,026 | ) | 52,967 | |||||||
| Receivables from clients | (30,302 | ) | (13,522 | ) | 38,268 | |||||||
| Receivables from product sponsors, broker-dealers and clearing organizations | 59,839 | (31,432 | ) | 59,500 | ||||||||
| Receivables from others | (22,549 | ) | (35,546 | ) | (50,937 | ) | ||||||
| Securities owned | 3,158 | 6,297 | (3,832 | ) | ||||||||
| Securities borrowed | 501 | (3,441 | ) | (4,346 | ) | |||||||
| Other assets | (7,806 | ) | (3,877 | ) | (8,061 | ) | ||||||
| Drafts payable | 5,086 | 56,722 | (28,664 | ) | ||||||||
| Payables to clients | 73,430 | (110,654 | ) | 30,932 | ||||||||
| Payables to broker-dealers and clearing organizations | (4,315 | ) | 20,853 | (3,517 | ) | |||||||
| Accrued commissions and advisory fees payable | (20,693 | ) | 20,368 | 9,713 | ||||||||
| Accounts payable and accrued liabilities | (19,754 | ) | 15,279 | (236 | ) | |||||||
| Income taxes receivable/payable | 202,537 | (73,835 | ) | 12,092 | ||||||||
| Unearned revenue | 5,919 | 7,774 | 9,186 | |||||||||
| Securities sold but not yet purchased | (4,660 | ) | 818 | 93 | ||||||||
| Net cash provided by (used in) operating activities | 442,378 | (22,914 | ) | 271,157 | ||||||||
F-6
LPL INVESTMENT HOLDINGS INC. AND SUBSIDIARIES
Condensed Consolidated Statements of Cash Flows —- (Continued)
For the Years Ended December 31, 2011, 2010 and 2009
(Dollars in thousands)
| 2010 | 2009 | 2008 | ||||||||||
Proceeds from maturity of securities classified asheld-to-maturity | 6,200 | 3,700 | 7,600 | |||||||||
| Proceeds from the sale of equity investment | — | 31 | — | |||||||||
| Deposits of restricted cash | (24,121 | ) | (12,759 | ) | — | |||||||
| Release of restricted cash | 7,216 | 7,163 | — | |||||||||
| Acquisitions, net of existing cash balance | — | — | (13,258 | ) | ||||||||
| Net cash used in investing activities | (39,192 | ) | (13,724 | ) | (76,202 | ) | ||||||
| CASH FLOWS FROM FINANCING ACTIVITIES: | ||||||||||||
| Net (repayment of) proceeds from revolving line of credit | — | (90,000 | ) | 25,000 | ||||||||
| Repayment of senior credit facilities | (12,584 | ) | (8,424 | ) | (8,424 | ) | ||||||
| Proceeds from senior credit facilities | 566,700 | — | — | |||||||||
| Redemption of subordinated notes | (579,563 | ) | — | — | ||||||||
| Payment of debt amendment costs | (7,181 | ) | (372 | ) | — | |||||||
| Excess tax benefits related to share-based compensation | 93,445 | 147 | 668 | |||||||||
| Repayment of stockholder loans | — | 462 | 114 | |||||||||
| Proceeds from stock options and warrants exercised | 101 | 290 | 586 | |||||||||
| Issuance of common stock | 41,802 | — | 4,000 | |||||||||
| Repurchase of common stock | — | (181 | ) | (3,783 | ) | |||||||
| Net cash provided by (used in) financing activities | 102,720 | (98,078 | ) | 18,161 | ||||||||
| NET INCREASE IN CASH AND CASH EQUIVALENTS | 40,614 | 159,355 | 31,236 | |||||||||
| CASH AND CASH EQUIVALENTS — Beginning of year | 378,594 | 219,239 | 188,003 | |||||||||
| CASH AND CASH EQUIVALENTS — End of year | $ | 419,208 | $ | 378,594 | $ | 219,239 | ||||||
| SUPPLEMENTAL DISCLOSURES OF CASH FLOW INFORMATION: | ||||||||||||
| Interest paid | $ | 92,888 | $ | 101,128 | $ | 116,581 | ||||||
| Income taxes paid | $ | 63,387 | $ | 54,919 | $ | 71,487 | ||||||
| NONCASH DISCLOSURES: | ||||||||||||
| Capital expenditures purchased through short-term credit | $ | 4,023 | $ | 2,640 | $ | 1,294 | ||||||
| Increase (decrease) in unrealized gain (loss) on interest rate swaps, net of tax expense (benefit) | $ | 6,776 | $ | 4,226 | $ | (8,986 | ) | |||||
| Discount on proceeds from senior credit facilities recorded as debt issuance costs | $ | 13,300 | $ | — | $ | — | ||||||
| Acquisitions: | ||||||||||||
| Fair value of assets acquired | $ | 17,556 | ||||||||||
| Cash paid for common stock acquired | — | |||||||||||
| Additional consideration for post-closing payments | (13,258 | ) | ||||||||||
| Common stock issued for acquisitions | — | |||||||||||
| Liabilities assumed | $ | 4,298 | ||||||||||
| 2011 | 2010 | 2009 | ||||||||||
| CASH FLOWS FROM INVESTING ACTIVITIES: | ||||||||||||
| Capital expenditures | (36,347 | ) | (23,095 | ) | (8,313 | ) | ||||||
| Proceeds from disposal of fixed assets | — | — | 200 | |||||||||
| Purchase of securities classified as held-to-maturity | (7,685 | ) | (5,392 | ) | (3,746 | ) | ||||||
| Proceeds from maturity of securities classified as held-to-maturity | 6,000 | 6,200 | 3,700 | |||||||||
| Proceeds from the sale of equity investment | — | — | 31 | |||||||||
| Deposits of restricted cash | (7,794 | ) | (24,121 | ) | (12,759 | ) | ||||||
| Release of restricted cash | 22,245 | 7,216 | 7,163 | |||||||||
| Acquisitions (Note 3) | (41,977 | ) | — | — | ||||||||
| Net cash used in investing activities | (65,558 | ) | (39,192 | ) | (13,724 | ) | ||||||
| CASH FLOWS FROM FINANCING ACTIVITIES: | ||||||||||||
| Repayment of revolving line of credit | — | — | (90,000 | ) | ||||||||
| Repayment of senior credit facilities | (53,971 | ) | (12,584 | ) | (8,424 | ) | ||||||
| Proceeds from senior credit facilities | — | 566,700 | — | |||||||||
| Redemption of subordinated notes | — | (579,563 | ) | — | ||||||||
| Payment of debt amendment costs | — | (7,181 | ) | (372 | ) | |||||||
| Repurchase of common stock | (89,037 | ) | — | (181 | ) | |||||||
| Excess tax benefits related to share-based compensation | 57,590 | 93,445 | 147 | |||||||||
| Repayment of stockholder loans | — | — | 462 | |||||||||
| Proceeds from stock options and warrants exercised | 10,162 | 101 | 290 | |||||||||
| Issuance of common stock | — | 41,802 | — | |||||||||
| Net cash (used in) provided by financing activities | (75,256 | ) | 102,720 | (98,078 | ) | |||||||
| NET INCREASE IN CASH AND CASH EQUIVALENTS | 301,564 | 40,614 | 159,355 | |||||||||
| CASH AND CASH EQUIVALENTS — Beginning of year | 419,208 | 378,594 | 219,239 | |||||||||
| CASH AND CASH EQUIVALENTS — End of year | $ | 720,772 | $ | 419,208 | $ | 378,594 | ||||||
| SUPPLEMENTAL DISCLOSURES OF CASH FLOW INFORMATION: | ||||||||||||
| Interest paid | $ | 68,669 | $ | 92,888 | $ | 101,128 | ||||||
| Income taxes paid | $ | 60,651 | $ | 63,387 | $ | 54,919 | ||||||
| NONCASH DISCLOSURES: | ||||||||||||
| Capital expenditures purchased through short-term credit | $ | 6,226 | $ | 4,023 | $ | 2,640 | ||||||
| Increase in unrealized gain on interest rate swaps, net of tax expense | $ | 3,646 | $ | 6,776 | $ | 4,226 | ||||||
| Discount on proceeds from senior credit facilities recorded as debt issuance costs | $ | — | $ | 13,300 | $ | — | ||||||
See notes to consolidated financial statements.
F-7
LPL INVESTMENT HOLDINGS INC. AND SUBSIDIARIES
1. Organization and Description of the Company
LPL Investment Holdings Inc. (“LPLIH”), a Delaware holding corporation, together with its consolidated subsidiaries (collectively, the “Company”) provides an integrated platform of proprietary technology, brokerage and investment advisory services to independent financial advisors and financial advisors at financial institutions (collectively “advisors”) in the United States of America. Through its proprietary technology, custody and clearing platforms,platform, using both proprietary and third-party technology, the Company provides access to diversified financial products and services enabling its advisors to offer independent financial advice and brokerage services to retail investors (their “clients”).
On December 28, 2005, LPL Holdings, Inc. (“LPLH”), and its subsidiaries were acquired through a merger transaction with BD Acquisition Inc., a wholly owned subsidiary of LPLIH (previously named BD Investment Holdings, Inc.). LPLIH was formed by investment funds affiliated with TPG Capital and Hellman & Friedman LLC (collectively, the “Majority Holders”). The acquisition was accomplished through the merger of BD Acquisition Inc. with and into LPLH, with LPLH being the surviving entity (the “Acquisition”). The Acquisition was financed by a combination of borrowings under the Company’s senior credit facilities, the issuance of senior unsecured subordinated notes and direct and indirect equity investments from the Majority Holders, co-investors, management and the Company’s advisors.
Description of Our Subsidiaries— LPLH, a Massachusetts holding corporation, owns 100% of the issued and outstanding common stock of LPL Financial LLC (“LPL Financial”), UVEST Financial Services Group, Inc. (“UVEST”), LPL Independent Advisor Services Group LLC (“IASG”), Independent Advisers Group Corporation (“IAG”) and, LPL Insurance Associates, Inc. (“LPLIA”) and Concord Capital Partners (“Concord Wealth Management” or “CCP”). LPLH is also the majority stockholder in PTC Holdings, Inc. (“PTCH”), and owns 100% of the issued and outstanding voting common stock. As required by the Office of the Comptroller of the Currency, members of the Board of Directors of PTCH own shares of nonvoting common stock in PTCH.
LPL Financial, headquartered in Boston, San Diego and Charlotte, is a clearing broker-dealer and an investment adviser that principally transacts business as an agent for its advisors and financial institutions on behalf of their clients in a broad array of financial products and services. LPL Financial is licensed to operate in all 50 states, Washington D.C. and Puerto Rico.
UVEST, headquartered in Charlotte, is an introducing broker-dealer and investment adviser that provides independent, nonproprietary third-party brokerage and advisory services to banks, credit unions and other financial institutions. UVEST is licensed to operate in all 50 states and Washington D.C. During 2011, the Company committed to a corporate restructuring plan to enhance its service offering, while generating efficiencies by consolidating the operations of UVEST with those of LPL Financial (see Note 4).
IASG is a holding company for Mutual Service Corporation (“MSC”), Associated Financial Group, Inc. (“AFG”), Associated Securities Corp., Inc. (“Associated”), Associated Planners Investment Advisory, Inc. (“APIA”) and Waterstone Financial Group, Inc. (“WFG”) (together, the “Affiliated Entities”). On July 10, 2009, the Company committed to a corporate restructuring plan to consolidate the operations of the Affiliated Entities with those of LPL Financial. Prior to the consolidation of operations, the Affiliated Entities engaged primarily in introducing brokerage and advisory transactions to unaffiliated third-party clearing broker-dealers. The Affiliated Entities ceased operations as active broker-dealers on September 14, 2009 and the securities licenses of advisors associated with the Affiliated Entities who elected to transfer, as well as their respective client accounts which had previously cleared through a third-party platform, were transferred to the LPL Financial clearing platform. Following the completion of these transfer activities, advisors and client accounts previously associated with the Affiliated Entities are associated with LPL Financial. The Affiliated Entities had no active employees, advisors or client accounts as of December 31, 2010.2011. Associated and WFG have withdrawn their registration with the Financial Industry Regulatory Authority’s (“FINRA”) effective February 5, 2011, and MSC expects to withdrawhas withdrawn its registrationsregistration with FINRA and has maintained
F-8
IAG is a registered investment adviser which offers an investment advisory platform for clients of advisors working for other financial institutions.
F-8
LPL INVESTMENT HOLDINGS INC. AND SUBSIDIARIES
Notes to Consolidated Financial Statements
LPLIA operates as a brokerage general agency, which offers life, long-term care and disability insurance sales and services.
PTCH is a holding company for The Private Trust Company, N.A. (“PTC”). PTC is chartered as a non-depository limited purpose national bank, providing a wide range of trust, investment management oversight and custodial services for estates and families. PTC also provides Individual Retirement Account custodial services for LPL Financial.
Concord Capital Partners provides technology and open architecture investment management solutions for trust departments of financial institutions. See Note 3 for additional details.
2. Summary of Significant Accounting Policies
Basis of Presentation— These consolidated financial statements are prepared in accordance with accounting principles generally accepted in the United States of America (“GAAP”), which require the Company to make estimates and assumptions regarding the valuation of certain financial instruments, intangible assets, allowance for doubtful accounts, valuation of stockshare-based compensation, accruals for liabilities, income taxes, revenue and expense accruals, and other matters that affect the consolidated financial statements and related disclosures. Actual results could differ materially from those estimates under different assumptions or conditions and the differences may be material to the consolidated financial statements. Certain reclassifications were made to previously reported amounts in the consolidated financial statements and notes thereto to make them consistent with the current period presentation. The Company has evaluated subsequent events up to and including the date these consolidated financial statements were issued.
Consolidation— These consolidated financial statements include the accounts of LPLIH and its subsidiaries. Intercompany transactions and balances have been eliminated. Equity investments in which the Company exercises significant influence but does not exercise control and is not the primary beneficiary are accounted for using the equity method.
Revenue Recognition Policies:
Commission — The Company records commissions received from mutual funds, annuity, insurance, equity, fixed income, direct investment, option and commodity transactions on a trade-date basis.transactions. Commissions also include mutual fund and variable annuity trails, which are recognized as earned. Due to the significant volume of mutual fund and variable annuity purchases and sales transacted by advisors directly with product manufacturers, management estimates its trail revenues and upfront commission for each accounting period for which the proceeds have not yet been received. These estimates are based on a number of factors, primarily on market levels and the volume of similar transactions in prior periods. The amount of such accruals are shown as commissions receivable from product sponsors and others (see Note 7) included in the caption,, and are classified within receivables from product sponsors, broker-dealers and clearing organizations in the consolidated statements of financial condition. The Company also records commissions payable based upon standard payout ratios for each product as it accrues for commission revenue. Clients' securities transactions are recorded on a settlement-date basis, with related commission income and expense reported on a trade-date basis.
Advisory and Asset-Based Fees — The Company charges investment advisory fees based on an advisor’seach client’s portfolio value, generally atprimarily on the beginninglast business day of eachthe preceding quarter. Advisory fees collected in advance are recorded as unearned revenue and are recognized ratably over the period in which such fees are earned. Advisory fees collected in arrears are recorded as earned. Asset-based fees are comprised of fees from cash sweep programs, financial product manufacturer sponsorship programs,
F-9
Certain advisors conduct their advisory business through separate entities by establishing their own Registered Investment Advisor (“RIA”) pursuant to the Investment Advisers Act of 1940, rather than using the Company’s corporate registered RIA. These stand-alone RIAs ("Independent RIA") engage the Company for technology, clearing, regulatory and custody services, as well as access to the Company’s investment advisory platforms. The fee-based production generated by the stand-alone RIA isadvisory fees charged to clients are earned by the advisor,Independent RIA, and accordingly are not included inrecorded as advisory revenue of the Company’sCompany. Furthermore, the Company supports certain financial advisors with customized clearing, advisory fee revenue. Theplatforms. Accordingly, the Company charges administrative fees to stand-aloneIndependent RIAs including administrativecustody and clearing and trading fees, based on the value of assets within these advisory accounts. Such
F-9
LPL INVESTMENT HOLDINGS INC. AND SUBSIDIARIES
Notes to Consolidated Financial Statements
Asset-Based Fees — Asset-based fees are included within asset-basedcomprised of fees from cash sweep programs, financial product manufacturer sponsorship programs, and transactionomnibus processing and other fees onnetworking services and are recorded and recognized ratably over the consolidated statements of operations, as described below.period in which services are provided.
Transaction and Other Fees — The Company charges transaction fees for executing noncommissionable transactions in client accounts. Transaction related charges are recognized on a trade-date basis. Other fees relate to services provided and other account charges generally outlined in the Company’s agreements with its clients, advisors and financial institutions. Such fees are recognized as services are performed or as earned, as applicable. In addition, the Company offers various software-related products,services, for which fees are charged on a subscription basis and are recognized over the subscription period.
Interest Income, Net of Interest Expense — The Company earns interest income from its cash equivalents and client margin balances, less interest expense on related transactions. Because interest expense incurred in connection with cash equivalents and client margin balances is completely offset by revenue on related transactions, the Company considers such interest to be an operating expense. Interest expense from operations for the years ended December 31, 2011, 2010 2009 and 20082009 did not exceed $1.0$1.0 million in any fiscal year presented.
Compensation and Benefits— The Company records compensation and benefits for all cash and deferred compensation, benefits and related taxes as earned by its employees. Compensation and benefits expense also includes fees earned by temporary employees and contractors who perform similar services to those performed by the Company’s employees, primarily software development and project management activities. Temporary employee and contractor services of $21.8$21.0 million $18.0, $21.8 million, and $36.9$18.0 million were incurred during the years ended December 31, 2011, 2010 2009,, and 2008,2009, respectively.
Share-Based Compensation— The Company recognizes share-based compensation expense related to employee stock option awards based on the grant-date fair value over the requisite service period of the individual grants, which generally equals the vesting period. The Company accounts for stock options and warrants awarded to its advisors and financial institutions based on the fair value of the award at each interim reporting period.
Earnings Per Share — In calculating earnings (loss) per share using the two-class method, the Company is required to allocate a portion of its earnings to employees that hold stock units that contain non-forfeitable rights to dividends or dividend equivalents under its 2008 Nonqualified Deferred Compensation Plan. Basic earnings per share is computed by dividing income less earnings attributable to employees that hold stock units under the 2008 Nonqualified Deferred Compensation Plan by the basic weighted average number of shares outstanding. Diluted earnings per share is computed in a manner similar to basic earnings per share, except the weighted average number of shares outstanding is increased to include the dilutive effect of outstanding stock options, warrants and other stock-based awards.
Income Taxes— In preparing the consolidated financial statements, the Company estimates income tax expense based on various jurisdictions where it conducts business. The Company must then assess the likelihood that the deferred tax assets will be realized. A valuation allowance is established to the extent that it is more-likely-than-not that such deferred tax assets will not be realized. When the Company establishes a valuation allowance or modifies the existing allowance in a certain reporting period, the Company generally records a corresponding increase or decrease to tax expense in the consolidated statements of operations. Management makes significant judgments in determining the provision for income taxes, the deferred tax assets and liabilities, and any valuation allowances recorded against the deferred tax asset. Changes in the estimate of these taxes occur periodically due to changes in the tax rates, changes in the business operations, implementation of
F-10
tax planning strategies, resolution with taxing authorities of issues where the Company had previously taken certain tax positions and newly enacted statutory, judicial and regulatory guidance. These changes could have a material effect on the Company’s consolidated statements of financial condition, operations or cash flows in the period or periods in which they occur.
The Company recognizes the tax effects of a position in the financial statements only if it is more-likely-than-not to be sustained based solely on its technical merits, otherwise no benefits of the position are to be recognized. The more-likely-than-not threshold must continue to be met in each reporting period to support continued recognition of a benefit. Moreover, each tax position meeting the recognition threshold is required to be measured as the largest amount that is greater than 50 percent likely to be realized upon ultimate settlement with a taxing
F-10
LPL INVESTMENT HOLDINGS INC. AND SUBSIDIARIES
Notes to Consolidated Financial Statements
authority that has full knowledge of all relevant information. See Note 11 for additional detail regarding the Company’s uncertain tax positions.
Employee Health Care Self-Insurance— The Company is partially self-insured for benefits paid under employee healthcare programs. Self-insurance estimates are determined with the assistance of insurance actuaries, based on historical experience and trends related to claims and payments, information provided by the insurance broker, and industry experience. The Company has coverage for excess losses on either an individual or an aggregate case basis. Estimates of future claim costs are recorded on an undiscounted basis, and are recognized as a liability within accounts payable and accrued liabilities in the consolidated statements of financial condition.
Cash and Cash Equivalents— Cash and cash equivalents are composed of interest and noninterest-bearing deposits, money market funds and U.S. government obligations that meet the definition of a cash equivalent. Cash equivalents are highly liquid investments, with original maturities of less than 90 days that are not required to be segregated under federal or other regulations.
Cash and Securities Segregated Under Federal and Other Regulations— Certain subsidiaries of the Company are subject to requirements related to maintaining cash or qualified securities in a segregated reserve account for the exclusive benefit of its customers in accordance with SECRule 15c3-3 and other regulations.
Receivables From and Payables to Clients— Receivables from and payables to clients includes amounts due on cash and margin transactions. The Company extends credit to its clients to finance their purchases of securities on margin. The Company receives income from interest charged on such extensions of credit. Payables to clients represent credit balances in client accounts arising from deposits of funds, proceeds from sales of securities, and dividend and interest payments received on securities held in client accounts at LPL Financial. Of the balance at December 31, 2011, $445.9 million of the balance represent free credit balances which are held pending re-investment by the clients. The remaining balance represents funds received from clients to support their trading activities, primarily as collateral for clients' short selling of securities. The Company pays interest on certain client free credit balances held pending investment. Loans to clients are generally fully collateralized by client securities, which are not included in the consolidated statements of financial condition.payable balances.
To the extent that margin loans and other receivables from clients are not fully collateralized by client securities, management establishes an allowance that it believes is sufficient to cover any probable losses. When establishing this allowance, management considers a number of factors, including its ability to collect from the clientand/or the client’s advisor and the Company’s historical experience in collecting on such transactions.
The following schedule reflects the Company’s activity in providing for an allowance for uncollectible amounts due from clients for the years ended December 31, 20102011 and 20092010 (in thousands):
2010 | 2009 | |||||||
| Beginning balance — January 1 | $ | 792 | $ | 972 | ||||
| Charge-offs — net of recoveries | (137 | ) | (180 | ) | ||||
| Ending balance — December 31 | $ | 655 | $ | 792 | ||||
F-11
| 2011 | 2010 | |||||||
| Beginning balance — January 1 | $ | 655 | $ | 792 | ||||
| Provision for bad debts | 61 | — | ||||||
| Charge-offs — net of recoveries | — | (137 | ) | |||||
| Ending balance — December 31 | $ | 716 | $ | 655 | ||||
Receivables From Product Sponsors, Broker-Dealers and Clearing Organizations— Receivables from product sponsors, broker-dealers and clearing organizations primarily consists of commission and transaction-related receivables.
Receivables From Others— Receivables from others primarily consists of other accrued fees from product sponsors and advisors. The Company periodically extends credit to its advisors in the form of recruiting loans, commission advances, and other loans. The decisions to extend credit to advisors are generally based on either the advisors’ credit history, their ability to generate future commissions, or both. Management maintains an allowance for uncollectible amounts using an aging analysis that takes into account the advisors’ registration status and the specific type of receivable. The aging thresholds and specific percentages used represent management’s best estimates of probable losses. Management monitors the adequacy of these estimates through periodic evaluations
F-11
LPL INVESTMENT HOLDINGS INC. AND SUBSIDIARIES
Notes to Consolidated Financial Statements
against actual trends experienced.
The following schedule reflects the Company’s activity in providing for an allowance for uncollectible amounts due from others for the years ended December 31, 20102011 and 20092010 (in thousands):
2010 | 2009 | |||||||
| Beginning balance — January 1 | $ | 6,159 | $ | 4,076 | ||||
| Provision for bad debts(1) | 1,621 | 3,319 | ||||||
| Charge-offs — net of recoveries | (984 | ) | (1,236 | ) | ||||
| Ending balance — December 31 | $ | 6,796 | $ | 6,159 | ||||
| 2011 | 2010 | |||||||
| Beginning balance — January 1 | $ | 6,796 | $ | 6,159 | ||||
| Provision for bad debts | 3,772 | 1,621 | ||||||
| Charge-offs — net of recoveries | (1,735 | ) | (984 | ) | ||||
| Ending balance — December 31 | $ | 8,833 | $ | 6,796 | ||||
Classification and Valuation of Certain Investments— The classification of an investment determines its accounting treatment. The Company generally classifies its investments in debt and equity instruments (including mutual funds, annuities, corporate bonds, government bonds and municipal bonds) as trading securities, except for government notes held by PTC, which are classified asheld-to-maturity based on management’s intent and ability to hold them to maturity. The Company has not classified any investments asavailable-for-sale. Investment classifications are subject to ongoing review and can change. Securities classified as trading are carried at fair value, while securities classified asheld-to-maturity are carried at cost or amortized cost. When possible, the fair value of securities is determined by obtaining quoted market prices. The Company also makes estimates about the fair value of investments and the timing for recognizing losses based on market conditions and other factors. If its estimates change, the Company may recognize additional losses. Both unrealized and realized gains and losses on trading securities are recognized in other revenue on a net basis in the consolidated statements of operations.
Securities Owned and Sold But Not Yet Purchased— Securities owned and securities sold but not yet purchased are reflected on a trade-date basis at market value with realized and unrealized gains and losses being recorded in other revenue in the consolidated statements of operations. Interest income is accrued as earned and dividends are recorded on the ex-dividend date.
U.S. government notes are carried at amortized cost and classified asheld-to-maturity, as the Company has both the intent and ability to hold them to maturity. Interest income is accrued as earned. Premiums and discounts are amortized, using a method that approximates the effective yield method, over the term of the security and recorded as an adjustment to the investment yield.
Securities Borrowed and Loaned— Securities borrowed and securities loaned are accounted for as collateralized financings and are recorded at contract value, representing the amount of the cash provided for securities borrowed transactions and the amount of cash received for securities loaned (generally in excess of market values). The adequacy of the collateral deposited, forwhich is determined by comparing the market value of the securities borrowed to the cash loaned, is continuously monitored and adjusted when considered necessary to minimize the risk associated with this activity. At December 31, 2010 and December 31, 2009, the Company had $8.4 million and $5.0 million, respectively, in securities borrowed. The collateral received for securities loaned is generally cash and is adjusted daily through the Depository Trust Company’s (“DTC”National Securities Clearing Corporation's ("NSCC") net settlement process, and securities loaned is included in payableclassified as payables to broker-dealers and clearing organizations in the consolidated statements of financial condition. Securities loaned generally represent client securities that can be pledgedhypothecated under standard margin loan agreements.
At December 31, 2011 and 2010, and December 31, 2009,the values of the securities borrowed by the Company had $8.1 million and $7.2 million, respectively, of pledgedthe rehypothecated securities loaned under the DTCNSCC Stock Borrow Program.Program are as follows (in thousands):
| 2011 | 2010 | ||||||||||||||
| Contract Value | Collateral Market Value | Contract Value | Collateral Market Value | ||||||||||||
| Securities borrowed | $ | 7,890 | $ | 7,653 | $ | 8,391 | $ | 8,176 | |||||||
| Securities loaned | $ | 14,302 | $ | 14,302 | $ | 8,113 | $ | 8,113 | |||||||
F-12
LPL INVESTMENT HOLDINGS INC. AND SUBSIDIARIES
Notes to Consolidated Financial Statements
Fixed Assets— Furniture, equipment, computers, purchased software, capitalized software and leasehold improvements are recorded at historical cost, net of accumulated depreciation and amortization. Depreciation is recognized using the straight-line method over the estimated useful lives of the assets. Furniture, equipment, computers and purchased software are depreciated over a period of three to seven years. Automobiles have depreciable lives of five years. Leasehold improvements are amortized over the lesser of their useful lives or the terms of the underlying leases. Management reviews fixed assets for impairment whenever events or changes in circumstances indicate the carrying amount of the assets may not be recoverable. In 2010, the Company recorded a fixed asset impairment charge of $0.6$0.6 million for certain fixed assets that were attributed to the Affiliated Entities business, whose use has since been discontinued, as well as $0.2$0.2 million related to fixed assets at the abandoned lease locations.
Software Development Costs— Software development costs are charged to operations as incurred. Software development costs include costs incurred in the development and enhancement of software used in connection with services provided by the Company that do not otherwise qualify for capitalization.
The costs of internally developed software that qualify for capitalization are capitalized as fixed assets and subsequently amortized over the estimated useful life of the software, which is generally three years. The costs of internally developed software are included in fixed assets at the point at which the conceptual formulation, design and testing of possible software project alternatives are complete and management authorizes and commits to funding the project. The Company does not capitalize pilot projects and projects where it believes that the future economic benefits are less than probable.
Acquisitions — When acquiring companies, the Company recognizes separately from goodwill the assets acquired and the liabilities assumed at their acquisition date fair values. Goodwill as of the acquisition date is measured as the excess of consideration transferred and the net of the acquisition date fair values of the assets acquired and the liabilities assumed. While the Company uses its best estimates and assumptions as a part of the purchase price allocation process to accurately value assets acquired and liabilities assumed at the acquisition date, the Company's estimates are inherently uncertain and subject to refinement. As a result, during the measurement period, which may be up to one year from the acquisition date, the Company records adjustments to the assets acquired and liabilities assumed, with the corresponding offset to goodwill. Upon the conclusion of the measurement period or final determination of the values of assets acquired or liabilities assumed, whichever comes first, any subsequent adjustments are recorded to the consolidated statements of operations.
Accounting for business combinations requires the Company's management to make significant estimates and assumptions, especially at the acquisition date with respect to intangible assets, support liabilities assumed, and pre-acquisition contingencies. Although the Company believes the assumptions and estimates it has made in the past have been reasonable and appropriate, they are based in part on historical experience, market data and information obtained from the management of the acquired companies and are inherently uncertain.
Examples of critical estimates in valuing certain of the intangible assets the Company has acquired include but are not limited to: (i) future expected cash flows from client relationships, advisor relationships and product sponsor relationships; (ii) estimates to develop or use software; and (iii) discount rates.
If the Company determines that a pre-acquisition contingency is probable in nature and estimable as of the acquisition date, the Company records its best estimate for such a contingency as a part of the preliminary purchase price allocation. The Company continues to gather information for and evaluate pre-acquisition contingencies throughout the measurement period and if the Company makes changes to the amounts recorded or if the Company identifies additional pre-acquisition contingencies during the measurement period, such amounts will be included in the purchase price allocation during the measurement period and, subsequently, in our results of operations.
Reportable Segment— The Company’s internal reporting is organized into three service channels; Independent Advisor Services, Institution Services and Custom Clearing Services, which are designed to enhance the services provided to its advisors and financial institutions. These service channels qualify as individual operating segments, but are aggregated and viewed as one single reportable segment due to their similar economic characteristics, products and services, production and distribution process, regulatory environment and quantitative thresholds.
F-13
LPL INVESTMENT HOLDINGS INC. AND SUBSIDIARIES
Intangible Assets, and Trademarks and Trade Names and Goodwill — The Company classifies intangible assets into three categories: (1) intangible assets with definite lives subject to amortization, (2) intangible assets with indefinite lives not subject to amortization and (3) goodwill. The Company determines the useful lives of identifiable intangible assets after considering the specific facts and circumstances related to each intangible asset. Factors considered when determining useful lives
F-13
include the contractual term of any agreement, the history of the asset, the Company’sCompany's long-term strategy for the use of the asset, any laws or other local regulations which could impact the useful life of the asset and other economic factors, including competition and specific market conditions. Intangible assets that are deemed to have definite lives are amortized on a straight-line basis, over their useful lives, generally ranging from 5 — - 20 years. See Note 9 for further discussion.
When facts and circumstances indicate that the carrying value of definite-lived intangible assets may not be recoverable, the Company assesses the recoverability of the carrying value by preparing estimates of future cash flows. The Company recognizes an impairment loss if the sum of the expected future cash flows (undiscounted and without interest charges) is less than the carrying amount. The impairment loss recognized is the amount by which the carrying amount exceeds the fair value. The Company uses a variety of methodologies to determine the fair value of these assets, including discounted cash flow models, which are consistent with the assumptions the Company believes hypothetical marketplace participants would use. For the yearyears ended December 31, 2011 and 2009, the Company recorded a $17.5$2.8 million and $17.5 million, respectively, charge for the impairment of advisor and financial institution relationship intangible assets which is included in restructuring charges within the consolidated statements of operations. See Notes 34 and 9 for further discussion. No impairment occurred for the yearsyear ended December 31, 2010 and 2008..
The Company tests intangible assets determined to have indefinite useful lives, including trademarks, trade names and goodwill, for impairment annually, or more frequently if events or circumstances indicate that assets might be impaired. The Company performs these annual impairment reviews as of the first day of the fourth quarter (October 1). The Company uses a variety of methodologies in conducting impairment assessments of indefinite-lived intangible assets, including, but not limited to, discounted cash flow models, which are based on the assumptions the Company believes hypothetical marketplace participants would use. For indefinite-lived intangible assets, other than goodwill, if the carrying amount exceeds the fair value, an impairment charge is recognized in an amount equal to that excess. For the year ended December 31, 2009, the Company recorded a $1.1$1.1 million charge for the impairment of trademarks and trade names which is included in restructuring charges within the consolidated statements of operations. See Notes 3 and 9 for further discussion. No impairment occurred for the years ended December 31, 20102011 and 2008.2010.
ASU 2011-08 is intended to reduce the costs and complexity of performing the annual goodwill impairment test. The qualitative assessment requires management to perform the assessment using a more-likely-than-not approach to determine whether there is a greater than 50 percent chance that the fair value of the reporting unit level, which representis less than its operating segments. There were no changes tocarrying values. If, after performing the Company’s reporting units in 2010. The goodwill impairment test consistsqualitative assessment, management determines there is a less than a 50 percent chance that the fair value of a reporting unit is less than its carrying amount, then performing the two-step process, if necessary. Thetest is unnecessary.
If the Company deems the two-step test is necessary, the first step is to compare the fair value of a reporting unit to its carrying value, including goodwill. The Company typically uses an income approach methodology to determine the fair value of a reporting unit, which includes the discounted cash flow method and the market approach methodology that includes the use of market multiples. The assumptions used in these models are consistent with those the Company believes hypothetical marketplace participants would use. If the fair value of the reporting unit is less than its carrying value, the second step of the impairment test must be performed in order to determine the amount of impairment loss, if any. The second step compares the implied fair value of the reporting unit goodwill with the carrying amount of that goodwill. If the carrying amount of the reporting unit’sunit's goodwill exceeds its implied fair value, an impairment charge is recognized in an amount equal to that excess. The loss recognized cannot exceed the carrying amount of goodwill. No impairment occurred for the years ended December 31, 2010, 2009 and 2008.
F-14
F-14
LPL INVESTMENT HOLDINGS INC. AND SUBSIDIARIES
Notes to Consolidated Financial Statements — (Continued)
As part of the qualitative assessment, the Company considered macroeconomic conditions such as general deterioration in economic conditions, limitations on accessing capital and other developments in equity and credit markets. The Company evaluated industry and market considerations for any deterioration in the environment in which the Company operates, the increased competitive environment, a decline in market-dependent multiples or metrics (considered in both absolute terms and relative to peers), any change in the market for products or services and regulatory and political developments. The Company assessed its overall financial performance, cost factors that would have a negative effect on earnings and prior quantitative assessments.
Based on a qualitative assessment and a historical cushion of approximately three times the carrying amount, the Company has determined that it is not necessary to perform a quantitative goodwill impairment test. Annual goodwill impairment assessments performed has indicated that it is more-likely-than-not that the fair value of the reporting units is substantially in excess of carrying value and not at risk of failing the first step of the quantitative goodwill impairment test. No impairment has been recognized during the years ended December 31, 2011, 2010 and 2009.
Deferred Loan Issuance and Amendment Costs— Debt issuance and amendment costs have been capitalized and are being amortized as additional interest expense over the expected terms of the related debt agreements.
Equity Method Investment— The Company’s equity method investment is accounted for under the equity method when it exerts significant influence and ownership does not exceed 50% of the common stock. The Company records the investment at cost in the consolidated statements of financial condition and adjusts the carrying amount of the investment to recognize its share of earnings or losses while recording such earnings or losses within the consolidated statements of operations.
Drafts Payable— Drafts payable represent checks drawn against the Company that have not yet cleared through the bank. At December 31, 2010,2011, the Company had amounts drawn of $168.0$176.2 million related to client activities, and $14.5$11.4 million of corporate overdrafts.
Legal Reserves— The Company records reserves for legal proceedings in accounts payable and accrued liabilities in the statements of financial condition. The determination of these reserve amounts requires significant judgment on the part of management. Management considers many factors including, but not limited to, future legal expenses, the amount of the claim, the amount of the loss in the client’s account, the basis and validity of the claim, the possibility of wrongdoing on the part of advisors and financial institutions, likely insurance coverage, previous results in similar cases, and legal precedents and case law. Each legal proceeding is reviewed with counsel in each accounting period and the reserve is adjusted as deemed appropriate by management. Any change in the reserve amount is recorded as professional services in the consolidated statements of operations.
Derivative Instruments and Hedging Activities— The Company uses interest rate swap agreements to protect itself against changing interest rates and the related impact to the Company’s cash flows. An interest rate swap is a financial derivative instrument whereby two parties enter into a contractual agreement to exchange payments based on underlying interest rates. The Company also evaluatesuses interest rate swap agreements to hedge the variability on its contractsfloating rate senior secured term loan. The Company is required to pay the counterparty to the agreement fixed interest payments on a notional balance and commitments for termsin turn, receives variable interest payments on that qualify as embedded derivatives. notional balance. Payments are settled quarterly on a net basis.
All derivatives are reported at their corresponding fair value in the Company’s consolidated statements of financial condition.
Financial derivative instruments expected to be highly effective hedges against changes in cash flows are designated as such upon entering into the agreement. At each reporting date, the Company reassesses the effectiveness of the hedge to determine whether or not it can continue to use hedge accounting. Under hedge accounting, the Company records the increase or decrease in fair value of the derivative, net of tax impact, as other comprehensive income or loss. If the hedge is not determined to be a perfect hedge, yet is still considered highly effective, the Company will calculate the ineffective portion and record the related change in its fair value as additional interest income or expense in the consolidated statements of operations. Amounts accumulated in other comprehensive income (loss) are reclassified into earnings in the same period or periods during which the hedged forecasted transaction affects earnings.
F-15
LPL INVESTMENT HOLDINGS INC. AND SUBSIDIARIES
Notes to Consolidated Financial Statements
Fair Value of Financial Instruments— The Company’s financial assets and liabilities are carried at fair value or at amounts that, because of their short-term nature, approximate current fair value, with the exception of its indebtedness. The Company carries its indebtedness at amortized cost and measures the implied fair value of its debt instruments using trading levels obtained from a third-party service provider. As of December 31, 2010,2011, the carrying amount and fair value of the Company’s indebtedness was approximately $1,387$1,332.7 million and $1,390$1,328.2 million, respectively. As of December 31, 2009,2010, the carrying amount and fair value was approximately $1,369$1,386.6 million and $1,278$1,389.6 million, respectively. See Note 5 for additional detail regarding the Company’s fair value measurements.
Commitments and Contingencies— The Company recognizes liabilities for contingencies when analysis indicates it is both probable that a liability has been incurred and the amount of loss
F-15
can be reasonably estimated. When a range of probable loss can be estimated, the Company accrues the most likely amount.
Comprehensive Income (Loss) Income— The Company’s comprehensive income (loss) income is composed of net income (loss) and the effective portion of the unrealized gains (losses) on financial derivatives in cash flow hedge relationships, net of related tax effects.
Recently Issued Accounting Pronouncements— Recent accounting pronouncements or changes in accounting pronouncements during the year ended December 31, 2010,2011, that are of significance, or potential significance, to the Company are discussed below.
In January 2010,May 2011, the Financial Accounting Standards Board (“FASB”) issued ASU No. 2011-04, Fair Value Measurement (Topic 820)—Amendments to Achieve Common Fair Value Measurement and Disclosure Requirements in U.S. GAAP and IFRSs (“ASU 2011-04”), which clarifies the wording and disclosures required in Accounting Standards UpdateCodification (“ASU”ASC”) Topic 820, No. 2010-06,Fair Value MeasurementsMeasurement (“ASC 820”), to converge with those used in International Financial Reporting Standards. The update explains how to measure and Disclosures (Topic 820) — Improving Disclosures about Fair Value Measurements (“ASU2010-6”). ASU2010-6 requires new disclosures regarding significant transfers into and out of Level 1 and Level 2disclose fair value measurementsunder ASC 820. However, the FASB does not expect the changes in this standard’s update to alter the current application of the requirements in ASC 820. The provisions of ASU 2011-04 are effective for public entities prospectively for interim and annual periods beginning after December 15, 2011, and early adoption is prohibited. Therefore, ASU 2011-04 is effective for the Company during the first quarter of fiscal 2012. The Company does not expect ASU 2011-04 to have a material impact on its results of operations, financial condition or cash flows.
In June 2011, the FASB issued ASU No. 2011-05, Comprehensive Income (ASC Topic 220)—Presentation of Comprehensive Income (“ASU 2011-05”), which amends current comprehensive income guidance by eliminating the option to present the components of other comprehensive income as part of the statement of stockholders’ equity. Instead, the Company must report comprehensive income in either a single continuous statement of comprehensive income which contains two sections, net income and other comprehensive income, or in two separate disclosures about purchases, sales, issuancesbut consecutive statements. ASU 2011-05 will be effective for public companies during the interim and settlements relatingannual periods beginning after December 15, 2011, with early adoption permitted. The Company does not anticipate the adoption of ASU 2011-05 to Level 3 fair value measurements.have a material impact on its results of operations, financial condition or cash flows as the only requirement is a change in the format of the current presentation.
In September 2011, the FASB issued ASU No. 2011-08, which updated guidance on the periodic testing of goodwill for impairment. This guidance will allow companies to assess qualitative factors to determine if it is more-likely-than-not that goodwill might be impaired and whether it is necessary to perform the two-step goodwill impairment test required under current accounting standards. ASU also clarifies existing disclosures2011-08 will be effective for public companies during annual periods beginning after December 15, 2011, with early adoption permitted. The Company elected to adopt ASU 2011-08 on the first day of inputs and valuation techniques for Level 2 and Level 3 fair value measurements.its fourth fiscal quarter (October 1), coinciding with its 2011 annual goodwill impairment test. The adoption of ASU2010-6 2011-08 did not have a material impact on its results of operations, financial condition or cash flows.
In December 2011, the Company’s consolidatedFASB issued ASU No. 2011-11, Balance Sheet (ASC Topic 210)—Disclosures about Offsetting Assets and Liabilities ("ASU 2011-11"), which amended current balance sheet guidance by requiring that companies enhance current disclosures about offsetting assets and liabilities in order to reduce differences between US GAAP and IFRS. Entities are required to disclose both gross information and net information about both instruments and transactions eligible for offset in the statement of financial statements.position and instruments and
F-16
LPL INVESTMENT HOLDINGS INC. AND SUBSIDIARIES
transactions subject to an agreement similar to a master netting arrangement. This scope would include derivatives, sale and repurchase agreements and reverse sale and repurchase agreements, and securities borrowing and securities lending arrangements. The disclosures are effective for annual reporting periods beginning on or after January 1, 2013. The Company does not anticipate the adoption of ASU 2011-11 to have a material impact on its results of operations, financial condition or cash flows as the only requirement is a change in the format of the current presentation.
3. Acquisitions
National Retirement Partners, Inc.
On December 29, 2008,July 14, 2010, the Company committedannounced a definitive agreement pursuant to which it would acquire certain assets of National Retirement Partners, Inc. (“NRP”). NRP's advisors offer retirement products, consulting, and implemented an organizational restructuringinvestment services to retirement plan intendedsponsors and plan participants as well as comprehensive financial services to reduce its cost structureplan participants. This strategic acquisition further enhances the capabilities and improve operating efficiencies, which resultedpresence of the Company in a reductionthe group retirement space.
On February 9, 2011, the transaction closed. The Company paid $17.2 million at the closing of the transaction and placed $3.7 million of cash into escrow subject to adjustment pursuant to the terms of the purchase agreement. In the third quarter of 2011, the Company accrued additional consideration of $1.1 million pursuant to the terms of the asset purchase agreement. In October 2011, the Company paid $4.8 million of cash consideration, consisting of $3.7 million from escrow and $1.1 million in its overall workforceadditional consideration that was previously accrued.
The Company may be required to pay future consideration to former shareholders of approximately 250 employees. In accordance withNRP that is contingent upon the FASB Accounting Standards Codification (“ASC”) Topic 420,Accounting for Costs Associated with Exit or Disposal Activities,achievement of certain revenue-based milestones in the third year following the acquisition. There is no maximum amount of contingent consideration; however, the Company has estimated the amount of future payment of contingent consideration to be $7.9 million. Immediately following the close of the transaction, the Company paid $2.0 million of the contingent consideration in advance to former shareholders of NRP, which reduced the remaining amount of future contingent consideration to be paid to $5.9 million.
The Company estimated the fair value of the remaining contingent consideration to be $3.3 million at the close of the transaction, which was determined using a discounted cash flow methodology based on financial forecasts determined by management that includes assumptions about revenue growth, operating margins and discount rates. The Company has recorded severance and one-time involuntary termination benefit accruals inthe $3.3 million of contingent consideration within accounts payable and accrued liabilities, and re-measures contingent consideration at fair value at each interim reporting period with changes recognized in earnings (see Note 5).
Including the contingent consideration of $5.3 million, representing $2.0 million paid upon the close of the transaction and an estimated $3.3 million to be paid, total consideration for the NRP acquisition was $25.3 million. Transaction costs associated with the Company’s acquisition of NRP totaling $4.8 million were expensed as incurred through other expense in the consolidated statements of operations. Of these transaction costs, $2.5 million were incurred during the year ended December 31, 2011.
Concord Wealth Management
On April 20, 2011, the Company announced its intent to acquire all of the outstanding common stock of Concord Wealth Management. Concord Wealth Management is an industry leader in providing technology and open architecture investment management solutions for trust departments of financial institutions. Through this acquisition, the Company will have the ability to support both the brokerage and trust business lines of current and prospective financial institutions. The acquisition will also create new expansion opportunities such as giving the Company the ability to custody personal trust assets within banks across the country.
On June 22, 2011, the transaction closed. The Company paid $20.0 million, net of cash acquired, at the closing of the transaction to the former shareholders of Concord Wealth Management and placed $2.3 million of cash into escrow subject to adjustment pursuant to the terms of the stock purchase agreement. As of December 31, 2011, $2.3 million remains in an escrow account to be paid to former shareholders of Concord Wealth Management in accordance with the terms of the stock purchase agreement. The Company has classified the escrow account as restricted cash, which is included in other assets on the consolidated statements of financial condition.
F-17
LPL INVESTMENT HOLDINGS INC. AND SUBSIDIARIES
Notes to Consolidated Financial Statements
The Company completed this initiative and expectsmay be required to pay all costs by April 2011.
The Company estimated the fair value of the contingent consideration to be $11.5 million at the close of the transaction, which was determined using a discounted cash flow methodology based on financial forecasts determined by management that includes assumptions about growth in gross margin, and discount rates. The Company has recorded the contingent consideration of $11.5 million within accounts payable and accrued liabilities, and re-measures contingent consideration at fair value at each interim reporting period with changes recognized in earnings (see Note 5).
Including the contingent consideration of $11.5 million, the total consideration for the acquisition was approximately $33.8 million. During the year ended December 31, 2011, the Company incurred transaction costs associated with its acquisition of Concord Wealth Management totaling $1.0 million which were recorded as other expense in the consolidated statements of operations.
The Company is in the process of finalizing the purchase allocations and the value of contingent considerations for NRP and CCP; therefore, the provisional measures of goodwill, intangibles, fixed assets, and contingent consideration are subject to change.
Set forth below is a reconciliation of assets acquired and liabilities assumed during the year ended December 31, 2011 (in thousands):
| Accrued | Accrued | Cumulative | ||||||||||||||||||||||
| Balance at | Balance at | Costs | ||||||||||||||||||||||
| December 31, | Costs | December 31, | Incurred | |||||||||||||||||||||
| 2009 | Incurred(1) | Payments | Non-cash | 2010 | to Date(2) | |||||||||||||||||||
| Severance and benefits | $ | 1,996 | $ | 43 | $ | (1,442 | ) | $ | — | $ | 597 | $ | 14,548 | |||||||||||
| NRP | CCP | Total | |||||||||
| Goodwill | $ | 13,698 | $ | 27,022 | $ | 40,720 | |||||
| Accounts receivable | — | 770 | 770 | ||||||||
| Other assets | — | 190 | 190 | ||||||||
| Intangibles | 11,800 | 7,550 | 19,350 | ||||||||
| Fixed assets(1) | — | 3,950 | 3,950 | ||||||||
| Accounts payable and accrued liabilities | (190 | ) | (5,721 | ) | (5,911 | ) | |||||
| Net assets acquired | $ | 25,308 | $ | 33,761 | $ | 59,069 | |||||
___________________
| (1) | Fixed assets acquired from CCP relate primarily to | |
Set forth below is supplemental cash flow information for the year ended December 31, 2011 (in thousands):
| NRP | CCP | Total | |||||||||
| Cash payments, net of cash acquired | $ | 22,008 | $ | 19,969 | $ | 41,977 | |||||
| Cash held in escrow | — | 2,250 | 2,250 | ||||||||
| Contingent consideration | 3,300 | 11,542 | 14,842 | ||||||||
| Total purchase price | $ | 25,308 | $ | 33,761 | $ | 59,069 | |||||
F-18
LPL INVESTMENT HOLDINGS INC. AND SUBSIDIARIES
Notes to Consolidated Financial Statements
The Company allocated the estimated purchase price to specific amortizable intangible asset categories as follows (dollars in thousands):
Amortization Period (in years) | Amount Assigned | ||||
| NRP | |||||
| Client relationships | 11.0 | $ | 4,730 | ||
| Advisor relationships | 9.0 | 4,080 | |||
| Product sponsor relationships | 4.0 | 2,990 | |||
| Total intangible assets acquired from NRP | $ | 11,800 | |||
| CCP | |||||
| Client relationships | 15.0 | $ | 7,550 | ||
Pro-forma information related to the acquisitions was not included because the impact on the Company’s consolidated statements of operations, financial condition and cash flows was not considered to be material.
4. Restructuring
Consolidation of Affiliated Entities Initiative
On July 10, 2009, the Company committed to a corporate restructuring plan that consolidated the operations of the Affiliated Entities with LPL Financial. This restructuring was effected to enhance service offerings to financial advisors while also generating efficiencies. The Company incurred and paid a majority of the restructuring charges in 2010, including transition assistance to certain advisors that transferred from the Affiliated Entities to the Company. Advisors that received transition assistance entered into contracts with the Company ranging from three to five years. The Company amortizes transition assistance over the contract term, and expense is classified as restructuring charges on the consolidated statements of operations. During the year ended December 31, 2011, the Company recorded $1.5 million of expense related to the amortization of transition assistance. Remaining transition assistance of $2.8 million is expected to be recognized into earnings by December 2013.
Consolidation of UVEST Financial Services Group, Inc.
On March 14, 2011, the Company committed to a corporate restructuring plan to consolidate the operations of UVEST with LPL Financial. The restructuring plan was effected to enhance the Company’s service offering, while also generating efficiencies. In connection with the consolidation, certain registered representatives currently associated with UVEST will move to LPL Financial through a transfer of their licenses. The Company completed the transfers in three waves with the first wave occurring in July 2011, the second in October 2011 and the third in December 2011. Following the transfer of registered representatives and client accounts to LPL Financial, all registered representatives and client accounts that transferred shall be associated with LPL Financial and all of the Company’s securities business will be done through a single broker-dealer. In addition, UVEST expects to terminate its clearing relationship with a third-party clearing firm and plans to file a broker-dealer withdrawal request with the Financial Industry Regulatory Authority ("FINRA").
The Company estimates total costsexpenditures associated with the initiative to be approximately $77.3 million. The Company incurred$31.6 million over the majoritycourse of thesethe restructuring plan. These expenditures are comprised of advisor retention and related benefits, contract penalties, technology costs, non-cash charges for the impairment of intangible assets resulting from advisor attrition and anticipates recognizing the remaining costs by December 2013; however,
F-16
F-19
LPL INVESTMENT HOLDINGS INC. AND SUBSIDIARIES
Notes to deposit $12.8 million into escrow accounts pending the resolution of certain matters, of which $7.3 million was released. During 2010, the Company deposited an additional $4.1 million into the escrow accounts and withdrew $7.2 million. These escrow accounts are considered restricted cash and included in other assets within the consolidated statements of financial condition.Consolidated Financial Statements
The following table summarizes the balance of accrued expenses and the changes in the accrued amounts as of and for the year ended December 31, 20102011 (in thousands):
| Accrued | Accrued | Cumulative | Total | |||||||||||||||||||||||||
| Balance at | Balance at | Costs | Expected | |||||||||||||||||||||||||
| December 31, | Costs | December 31, | Incurred | Restructuring | ||||||||||||||||||||||||
| 2009 | Incurred | Payments | Non-cash | 2010 | to Date | Costs | ||||||||||||||||||||||
| Severance and benefits | $ | 2,759 | $ | 2,034 | $ | (3,717 | ) | $ | (456 | ) | $ | 620 | $ | 11,470 | $ | 11,470 | ||||||||||||
| Lease and contract termination fees | 7,458 | 5,340 | (4,071 | ) | 224 | 8,951 | 21,259 | 21,359 | ||||||||||||||||||||
| Asset impairments | — | 840 | — | (840 | ) | — | 20,764 | 20,764 | ||||||||||||||||||||
| Conversion and transfer costs | 304 | 5,665 | (1,963 | ) | (3,797 | ) | 209 | 19,548 | 23,662 | |||||||||||||||||||
| Total | $ | 10,521 | $ | 13,879 | $ | (9,751 | ) | $ | (4,869 | ) | $ | 9,780 | $ | 73,041 | $ | 77,255 | ||||||||||||
Accrued Balance at December 31, 2010 | Costs Incurred(1) | Payments | Non-cash | Accrued Balance at December 31, 2011 | Total Expected Restructuring Costs(2) | ||||||||||||||||||
| Conversion and transfer costs(2) | $ | — | $ | 9,178 | $ | (8,102 | ) | $ | — | $ | 1,076 | $ | 14,690 | ||||||||||
| Contract penalties | — | 8,642 | 190 | — | 8,832 | 8,642 | |||||||||||||||||
| Advisor retention and related benefits | — | 789 | (472 | ) | (67 | ) | 250 | 5,513 | |||||||||||||||
| Asset impairments | — | 2,776 | — | (2,776 | ) | — | 2,776 | ||||||||||||||||
| Total | $ | — | $ | 21,385 | $ | (8,384 | ) | $ | (2,843 | ) | $ | 10,158 | $ | 31,621 | |||||||||
F-17
5. Fair Value Measurements
Fair value is defined as the exchange price that would be received for an asset or paid to transfer a liability (an exit price) in the principal or most advantageous market for the asset or liability in an orderly transaction between market participants at the measurement date. Inputs used to measure fair value are prioritized within a three-level fair value hierarchy. This hierarchy requires entities to maximize the use of observable inputs and minimize the use of unobservable inputs. The three levels of inputs used to measure fair value are as follows:
Level 1 — Quoted prices in active markets for identical assets or liabilities.
Level 2 — Observable inputs other than quoted prices included in Level 1, such as quoted prices for similar assets and liabilities in active markets; quoted prices for identical or similar assets and liabilities in markets that are not active; or other inputs that are observable or can be corroborated by observable market data.
Level 3 — Unobservable inputs that are supported by little or no market activity and that are significant to the fair value of the assets or liabilities. This includes certain pricing models, discounted cash flow methodologies and similar techniques that use significant unobservable inputs.
The Company’s fair value measurements are evaluated within the fair value hierarchy, based on the nature of inputs used to determine the fair value at the measurement date. At December 31, 2010,2011, the Company had the following financial assets and liabilities that are measured at fair value on a recurring basis:
Cash Equivalents — The Company’s cash equivalents include money market funds, which are short term in nature with readily determinable values derived from active markets.
Securities Segregated Under Federal and Other Regulations— The Company’s segregated accounts contain U.S. treasury securities that are short term in nature with readily determinable values derived from quoted prices in active markets.
Securities Owned and Securities Sold But Not Yet Purchased — The Company’s trading securities consist of house account model portfolios for the purpose of benchmarking the performance of its fee based advisory platforms and temporary positions resulting from the processing of client transactions. Examples of these
F-20
LPL INVESTMENT HOLDINGS INC. AND SUBSIDIARIES
Notes to Consolidated Financial Statements
securities include money market funds, U.S. treasuries, mutual funds, certificates of deposit, traded equity securities and debt securities.
The Company uses prices obtained from independent third-party pricing services to measure the fair value of its trading securities. Prices received from the pricing services are validated using various methods including comparison to prices received from additional pricing services, comparison to available quoted market prices and review of other relevant market data including implied yields of major categories of securities. In general, these quoted prices are derived from active markets for identical assets or liabilities. When quoted prices in active markets for identical assets and liabilities are not available, the quoted prices are based on similar assets and liabilities or inputs other than the quoted prices that are observable, either directly or indirectly. For certificates of deposit and treasury securities, the Company utilizes market-based inputs including observable market interest rates that correspond to the remaining maturities or the next interest reset dates. At December 31, 2010,2011, the Company did not adjust prices received from the independent third-party pricing services.
Other Assets — The Company’s other assets include deferred compensation plan assets that are invested in money market funds and mutual funds which are actively traded and valued based on quoted market prices in active markets.
F-18
Accounts Payable and Accrued Liabilities — The Company’s accounts payable and accrued liabilities include contingent consideration from its acquisitions. Contingent consideration is measured by discounting, to present value, the contingent payments expected to be made based on the Company’s estimates of certain financial targets expected to result from the acquisitions. See Note 3 for more information regarding the acquisitions and related contingent consideration.
Interest Rate Swaps — The Company’s interest rate swaps are not traded on a market exchange; therefore, the fair values are determined using externally developed valuation models which include assumptions about the London Interbank Offered Rate (“LIBOR”) yield curve at interim reporting dates as well as counterparty credit risk and the Company’s own non-performance risk.
There have been no transfers of assets or liabilities between fair value measurement classifications during the years ended December 31, 20102011 and 2009.2010.
F-21
LPL INVESTMENT HOLDINGS INC. AND SUBSIDIARIES
Notes to Consolidated Financial Statements
The following table summarizes the Company’s financial assets and financial liabilities measured at fair value on a recurring basis at December 31, 20102011 (in thousands):
| Quoted | ||||||||||||||||
| Prices in | ||||||||||||||||
| Active | Significant | |||||||||||||||
| Markets for | Other | Significant | ||||||||||||||
| Identical | Observable | Unobservable | ||||||||||||||
| Assets | Inputs | Inputs | Fair Value | |||||||||||||
(Level 1) | (Level 2) | (Level 3) | Measurements | |||||||||||||
At December 31, 2010: | ||||||||||||||||
Assets | ||||||||||||||||
| Cash equivalents | $ | 279,048 | $ | — | $ | — | $ | 279,048 | ||||||||
| Securities owned — trading: | ||||||||||||||||
| Money market funds | 316 | — | — | 316 | ||||||||||||
| Mutual funds | 7,300 | — | — | 7,300 | ||||||||||||
| Equity securities | 17 | — | — | 17 | ||||||||||||
| Debt securities | — | 516 | — | 516 | ||||||||||||
| U.S. treasury obligations | 1,010 | — | — | 1,010 | ||||||||||||
| Certificates of deposit | — | 100 | — | 100 | ||||||||||||
| Total securities owned — trading | 8,643 | 616 | — | 9,259 | ||||||||||||
| Other assets | 17,175 | — | — | 17,175 | ||||||||||||
| Total assets at fair value | $ | 304,866 | $ | 616 | $ | — | $ | 305,482 | ||||||||
Liabilities | ||||||||||||||||
| Securities sold but not yet purchased: | ||||||||||||||||
| Mutual funds | $ | 4,563 | $ | — | $ | — | $ | 4,563 | ||||||||
| Equity securities | 204 | — | — | 204 | ||||||||||||
| Debt securities | — | 54 | — | 54 | ||||||||||||
| Total securities sold but not yet purchased | 4,767 | 54 | — | 4,821 | ||||||||||||
| Interest rate swaps | — | 7,281 | — | 7,281 | ||||||||||||
| Total liabilities at fair value | $ | 4,767 | $ | 7,335 | $ | — | $ | 12,102 | ||||||||
Quoted Prices in Active Markets for Identical Assets (Level 1) | Significant Other Observable Inputs (Level 2) | Significant Unobservable Inputs (Level 3) | Fair Value Measurements | ||||||||||||
| At December 31, 2011: | |||||||||||||||
| Assets | |||||||||||||||
| Cash equivalents | $ | 575,243 | $ | — | $ | — | $ | 575,243 | |||||||
| Securities owned — trading: | |||||||||||||||
| Money market funds | 262 | — | — | 262 | |||||||||||
| Mutual funds | 4,966 | — | — | 4,966 | |||||||||||
| Equity securities | 47 | — | — | 47 | |||||||||||
| Debt securities | — | 115 | — | 115 | |||||||||||
| Certificates of deposit | 900 | — | — | 900 | |||||||||||
| Total securities owned — trading | 6,175 | 115 | — | 6,290 | |||||||||||
| Other assets | 21,400 | — | — | 21,400 | |||||||||||
| Total assets at fair value | $ | 602,818 | $ | 115 | $ | — | $ | 602,933 | |||||||
| Liabilities | |||||||||||||||
| Securities sold but not yet purchased: | |||||||||||||||
| Equity securities | $ | 134 | $ | — | $ | — | $ | 134 | |||||||
| Debt securities | — | 2 | — | 2 | |||||||||||
| Certificates of deposit | — | 25 | — | 25 | |||||||||||
| Total securities sold but not yet purchased | 134 | 27 | — | 161 | |||||||||||
| Interest rate swap | — | 1,377 | — | 1,377 | |||||||||||
| Accounts payable and accrued liabilities | — | — | 16,104 | 16,104 | |||||||||||
| Total liabilities at fair value | $ | 134 | $ | 1,404 | $ | 16,104 | $ | 17,642 | |||||||
Certain assets and liabilities are not measured at fair value on an ongoing basis but are subject to fair value measurement in certain circumstances, for example, when evidence of impairment exists. During the year ended December 31, 2011, the Company recorded an asset impairment charge of $2.8 million for certain intangible assets that were determined to have no estimated fair value (See Note 9). The fair value was determined based on the loss of future expected cash flows for institutional relationships that were not retained as a result of the Company’s ongoing consolidation of UVEST with LPL Financial. The Company has determined that the impairment qualifies as a non-recurring Level 3 measurement under the fair value hierarchy.
F-22
LPL INVESTMENT HOLDINGS INC. AND SUBSIDIARIES
Notes to Consolidated Financial Statements
Changes in Level 3 Recurring Fair Value Measurements
Set forth below is a reconciliation of contingent consideration classified as accounts payable and accrued liabilities on the consolidated statements of financial condition and measured at fair value on a recurring basis using significant unobservable inputs (Level 3). Contingent consideration is measured by discounting, to present value, the contingent payments expected to be made based on the Company’s estimates of certain financial targets expected to result from the acquisitions.
Twelve Months Ended December 31, 2011 (in thousands): | |||
| Fair value at December 31, 2010 | $ | — | |
| Issuances of contingent consideration | 16,842 | ||
| Total unrealized losses included in earnings (1) | 1,262 | ||
| Payments | (2,000 | ) | |
| Fair value at December 31, 2011 | $ | 16,104 | |
(1) Represents the accretion of contingent consideration as the Company approaches the future expected payment.
The following table summarizes the Company’s financial assets and financial liabilities measured at fair value on a recurring basis at December 31, 2010 (in thousands):
Quoted Prices in Active Markets for Identical Assets (Level 1) | Significant Other Observable Inputs (Level 2) | Significant Unobservable Inputs (Level 3) | Fair Value Measurements | ||||||||||||
| At December 31, 2010: | |||||||||||||||
| Assets | |||||||||||||||
| Cash equivalents | $ | 279,048 | $ | — | $ | — | $ | 279,048 | |||||||
| Securities owned — trading: | |||||||||||||||
| Money market funds | 316 | — | — | 316 | |||||||||||
| Mutual funds | 7,300 | — | — | 7,300 | |||||||||||
| Equity securities | 17 | — | — | 17 | |||||||||||
| Debt securities | — | 516 | — | 516 | |||||||||||
| U.S. treasury obligations | 1,010 | — | — | 1,010 | |||||||||||
| Certificates of deposit | — | 100 | — | 100 | |||||||||||
| Total securities owned — trading | 8,643 | 616 | — | 9,259 | |||||||||||
| Other assets | 17,175 | — | — | 17,175 | |||||||||||
| Total assets at fair value | $ | 304,866 | $ | 616 | $ | — | $ | 305,482 | |||||||
| Liabilities | |||||||||||||||
| Securities sold but not yet purchased: | |||||||||||||||
| Mutual funds | $ | 4,563 | $ | — | $ | — | $ | 4,563 | |||||||
| Equity securities | 204 | — | — | 204 | |||||||||||
| Debt securities | — | 54 | — | 54 | |||||||||||
| Total securities sold but not yet purchased | 4,767 | 54 | — | 4,821 | |||||||||||
| Interest rate swaps | — | 7,281 | — | 7,281 | |||||||||||
| Total liabilities at fair value | $ | 4,767 | $ | 7,335 | $ | — | $ | 12,102 | |||||||
Certain assets and liabilities are not measured at fair value on an ongoing basis but are subject to fair value measurement in certain circumstances, for example, when evidence of impairment exists. During the year ended December 31, 2010, the Company recorded asset impairment charges of $0.6$0.6 million for certain fixed assets that were determined to have no estimated fair value. The fair value was determined based on the loss of future expected cash flows of the discontinued use of
F-19
assets attributed to the Affiliated Entities business. The Company
F-23
LPL INVESTMENT HOLDINGS INC. AND SUBSIDIARIES
Notes to Consolidated Financial Statements
has determined that the impairment qualifies as a non-recurring Level 3 measurement under the fair value hierarchy.
6. Held-to-Maturity Securities
| Quoted | ||||||||||||||||
| Prices in | ||||||||||||||||
| Active | Significant | |||||||||||||||
| Markets for | Other | Significant | ||||||||||||||
| Identical | Observable | Unobservable | ||||||||||||||
| Assets | Inputs | Inputs | Fair Value | |||||||||||||
(Level 1) | (Level 2) | (Level 3) | Measurements | |||||||||||||
At December 31, 2009: | ||||||||||||||||
Assets | ||||||||||||||||
| Cash equivalents | $ | 223,665 | $ | — | $ | — | $ | 223,665 | ||||||||
| Securities segregated under federal and other regulations | 279,579 | — | — | 279,579 | ||||||||||||
| Securities owned — trading: | ||||||||||||||||
| Money market funds | 181 | — | — | 181 | ||||||||||||
| Mutual funds | 6,694 | — | — | 6,694 | ||||||||||||
| Equity securities | 11 | — | — | 11 | ||||||||||||
| Debt securities | — | 425 | — | 425 | ||||||||||||
| U.S. treasury obligations | 7,797 | — | — | 7,797 | ||||||||||||
| Certificates of deposit | — | 253 | — | 253 | ||||||||||||
| Total securities owned — trading | 14,683 | 678 | — | 15,361 | ||||||||||||
| Other assets | 12,739 | — | — | 12,739 | ||||||||||||
| Total assets at fair value | $ | 530,666 | $ | 678 | $ | — | $ | 531,344 | ||||||||
Liabilities | ||||||||||||||||
| Securities sold but not yet purchased: | ||||||||||||||||
| Mutual funds | $ | 3,773 | $ | — | $ | — | $ | 3,773 | ||||||||
| U.S. treasury obligations | 5 | — | — | 5 | ||||||||||||
| Equity securities | 7 | — | — | 7 | ||||||||||||
| Certificates of deposit | — | 123 | — | 123 | ||||||||||||
| Debt securities | — | 95 | — | 95 | ||||||||||||
| Total securities sold but not yet purchased | 3,785 | 218 | — | 4,003 | ||||||||||||
| Interest rate swaps | — | 17,292 | — | 17,292 | ||||||||||||
| Total liabilities at fair value | $ | 3,785 | $ | 17,510 | $ | — | $ | 21,295 | ||||||||
F-20
The Company holds certain investments in securities including U.S. government notes. The Company has both the intent and the ability to hold these investments to maturity and classifies them as such. Interest income is accrued as earned. Premiums and discounts are amortized using a method that approximates the effective yield method over the term of the security and are recorded as an adjustment to the investment yield.
The amortized cost, gross unrealized gains and fair value of securitiesheld-to-maturity were as follows (in thousands):
| Gross | ||||||||||||
| Amortized | Unrealized | Fair | ||||||||||
| Cost | Gains | Value | ||||||||||
At December 31, 2010: | ||||||||||||
| U.S. government notes | $ | 9,563 | $ | 69 | $ | 9,632 | ||||||
At December 31, 2009: | ||||||||||||
| U.S. government notes | $ | 10,354 | $ | 49 | $ | 10,403 | ||||||
| Certificate of deposit | 100 | — | 100 | |||||||||
| Total | $ | 10,454 | $ | 49 | $ | 10,503 | ||||||
Amortized Cost | Gross Unrealized Gains | Fair Value | |||||||||
| At December 31, 2011: | |||||||||||
| U.S. government notes | $ | 11,167 | $ | 27 | $ | 11,194 | |||||
| At December 31, 2010: | |||||||||||
| U.S. government notes | $ | 9,563 | $ | 69 | $ | 9,632 | |||||
Within 1 Year | 1-2 Years | Total | ||||||||||
| U.S. government notes — at amortized cost | $ | 6,049 | $ | 3,514 | $ | 9,563 | ||||||
| U.S. government notes- at fair value | $ | 6,075 | $ | 3,557 | $ | 9,632 | ||||||
| Within 1 Year | 1-3 Years | Total | ||||||||||
| U.S. government notes — at amortized cost | $ | 8,120 | — | $ | 3,047 | $ | 11,167 | |||||
| U.S. government notes — at fair value | $ | 8,147 | $ | 3,047 | $ | 11,194 | ||||||
| 7. | Receivables from Product Sponsors, Broker-Dealers and ClearingOrganizations and Payables to Broker-Dealers and Clearing Organizations |
Receivables from product sponsors, broker-dealers and clearing organizations and payables to broker-dealers and clearing organizations were as follows (in thousands):
| December 31, | ||||||||
| 2010 | 2009 | |||||||
| Receivables: | ||||||||
| Commissions receivable from product sponsors and others | $ | 114,829 | $ | 102,920 | ||||
| Receivable from clearing organizations | 65,501 | 49,793 | ||||||
| Receivable from broker-dealers | 12,507 | 12,195 | ||||||
Securitiesfailed-to-deliver | 10,495 | 6,992 | ||||||
| Total receivables | $ | 203,332 | $ | 171,900 | ||||
| Payables: | ||||||||
| Securities loaned | $ | 8,113 | $ | 7,239 | ||||
Securitiesfailed-to-receive | 11,425 | 5,495 | ||||||
| Payable to broker-dealers | 1,023 | 2,787 | ||||||
| Payable to clearing organizations | 18,509 | 2,696 | ||||||
| Total payables | $ | 39,070 | $ | 18,217 | ||||
F-21
| December 31, | ||||||||
| 2011 | 2010 | |||||||
| Receivables: | ||||||||
| Commissions receivable from product sponsors and others | $ | 85,486 | $ | 114,829 | ||||
| Receivable from clearing organizations | 47,039 | 65,501 | ||||||
| Securities failed-to-deliver | 6,052 | 10,495 | ||||||
| Receivable from broker-dealers | 4,916 | 12,507 | ||||||
| Total receivables | $ | 143,493 | $ | 203,332 | ||||
| Payables: | ||||||||
| Securities loaned | $ | 14,302 | $ | 8,113 | ||||
| Payable to clearing organizations | 13,454 | 18,509 | ||||||
| Securities failed-to-receive | 5,885 | 11,425 | ||||||
| Payable to broker-dealers | 1,114 | 1,023 | ||||||
| Total payables | $ | 34,755 | $ | 39,070 | ||||
LPL Financial clears commodities transactions for its customers through another broker-dealer on a fully disclosed basis. The amount payable to broker-dealers relates to the aforementioned transactions and is collateralized by securities owned by LPL Financial.
F-24
LPL INVESTMENT HOLDINGS INC. AND SUBSIDIARIES
Notes to Consolidated Financial Statements
8. Fixed Assets
The components of fixed assets were as follows (in thousands):
| December 31, | ||||||||
| 2010 | 2009 | |||||||
| Internally developed software | $ | 206,002 | $ | 193,682 | ||||
| Computers and software | 84,241 | 82,459 | ||||||
| Leasehold improvements | 41,772 | 41,559 | ||||||
| Furniture and equipment | 16,585 | 17,180 | ||||||
| Property | 6,572 | 6,572 | ||||||
| Total fixed assets | 355,172 | 341,452 | ||||||
| Accumulated depreciation and amortization | (276,501 | ) | (239,868 | ) | ||||
| Fixed assets — net | $ | 78,671 | $ | 101,584 | ||||
| December 31, | ||||||||
| 2011 | 2010 | |||||||
| Internally developed software | $ | 239,219 | $ | 206,002 | ||||
| Computers and software | 87,798 | 84,241 | ||||||
| Leasehold improvements | 46,939 | 41,772 | ||||||
| Furniture and equipment | 15,932 | 16,585 | ||||||
| Property | 6,572 | 6,572 | ||||||
| Total fixed assets | 396,460 | 355,172 | ||||||
| Accumulated depreciation and amortization | (305,143 | ) | (276,501 | ) | ||||
| Fixed assets — net | $ | 91,317 | $ | 78,671 | ||||
Depreciation and amortization expense for fixed assets was $49.0$33.8 million $69.3, $49.0 million and $60.2$69.3 million for the years ended December 31, 2011, 2010 2009 and 2008,2009, respectively.
9. Goodwill and Intangible Assets
A summary of the activity in goodwill is presented below (in thousands):
| Balance at December 31, 2010 | $ | 1,293,366 | |
| Acquisition of NRP | 13,698 | ||
| Acquisition of CCP | 27,022 | ||
| Balance at December 31, 2011 | $ | 1,334,086 | |
F-25
LPL INVESTMENT HOLDINGS INC. AND SUBSIDIARIES
Notes to Consolidated Financial Statements — (Continued)
The components of intangible assets as of December 31, 2011 and December 31, 2010 and 2009 were are as follows (in(dollars in thousands):
| Gross | Net | ||||||||||||||||||||||||
| Carrying | Accumulated | Carrying | Weighted Average Life Remaining (in years) | Gross Carrying Value | Accumulated Amortization | Net Carrying Value | |||||||||||||||||||
| Value | Amortization | Value | |||||||||||||||||||||||
| At December 31, 2011: | |||||||||||||||||||||||||
| Definite-lived intangible assets: | |||||||||||||||||||||||||
| Advisor and financial institution relationships | 13.7 | $ | 450,164 | $ | (132,503 | ) | $ | 317,661 | |||||||||||||||||
| Product sponsor relationships | 14.0 | 230,916 | (63,710 | ) | 167,206 | ||||||||||||||||||||
| Client relationships | 12.9 | 14,910 | (1,926 | ) | 12,984 | ||||||||||||||||||||
| Total definite-lived intangible assets | $ | 695,990 | $ | (198,139 | ) | $ | 497,851 | ||||||||||||||||||
| Indefinite-lived intangible assets: | |||||||||||||||||||||||||
| Trademark and trade name | 39,819 | ||||||||||||||||||||||||
| Total intangible assets | $ | 537,670 | |||||||||||||||||||||||
At December 31, 2010: | |||||||||||||||||||||||||
| Definite-lived intangible assets: | |||||||||||||||||||||||||
| Advisor and financial institution relationships | $ | 458,424 | $ | (116,687 | ) | $ | 341,737 | 14.7 | $ | 458,424 | $ | (116,687 | ) | $ | 341,737 | ||||||||||
| Product sponsor relationships | 231,930 | (55,255 | ) | 176,675 | 15.2 | 231,930 | (55,255 | ) | 176,675 | ||||||||||||||||
| Trust client relationships | 2,630 | (784 | ) | 1,846 | |||||||||||||||||||||
| Client relationships | 14.2 | 2,630 | (784 | ) | 1,846 | ||||||||||||||||||||
| Total definite-lived intangible assets | $ | 692,984 | $ | (172,726 | ) | $ | 520,258 | $ | 692,984 | $ | (172,726 | ) | $ | 520,258 | |||||||||||
| Indefinite-lived intangible assets: | |||||||||||||||||||||||||
| Trademark and trade name | 39,819 | 39,819 | |||||||||||||||||||||||
| Total intangible assets | $ | 560,077 | $ | 560,077 | |||||||||||||||||||||
At December 31, 2009: | |||||||||||||||||||||||||
| Definite-lived intangible assets: | |||||||||||||||||||||||||
| Advisor and financial institution relationships | $ | 458,424 | $ | (91,586 | ) | $ | 366,838 | ||||||||||||||||||
| Product sponsor relationships | 231,930 | (43,482 | ) | 188,448 | |||||||||||||||||||||
| Trust client relationships | 2,630 | (652 | ) | 1,978 | |||||||||||||||||||||
| Trademarks and trade names | 457 | (457 | ) | — | |||||||||||||||||||||
| Total definite-lived intangible assets | $ | 693,441 | $ | (136,177 | ) | $ | 557,264 | ||||||||||||||||||
| Indefinite-lived intangible assets: | |||||||||||||||||||||||||
| Trademark and trade name | 39,819 | ||||||||||||||||||||||||
| Total intangible assets | $ | 597,083 | |||||||||||||||||||||||
Total amortization expense of intangible assets was $37.0$39.0 million $39.0, $37.0 million and $40.3$39.0 million for the years ended December 31, 2011, 2010 2009, and 2008,2009, respectively. Amortization expense for each of the fiscal years ended December 201131, 2012 through 20152016 and thereafter is estimated as follows (in thousands):
| 2011 | $ | 36,840 | ||
| 2012 | 36,548 | |||
| 2013 | 35,927 | |||
| 2014 | 35,927 | |||
| 2015 | 35,927 | |||
| Thereafter | 339,089 | |||
| Total | $ | 520,258 | ||
| 2012 | $ | 39,050 | |
| 2013 | 38,268 | ||
| 2014 | 37,991 | ||
| 2015 | 37,111 | ||
| 2016 | 37,004 | ||
| Thereafter | 308,427 | ||
| Total | $ | 497,851 | |
F-26
LPL INVESTMENT HOLDINGS INC. AND SUBSIDIARIES
Notes to Consolidated Financial Statements — (Continued)
10. Accounts Payable and Accrued Liabilities
Accounts payable and accrued liabilities were as follows (in thousands):
| December 31, | ||||||||
| 2010 | 2009 | |||||||
| Accounts payable accruals | $ | 56,377 | $ | 47,145 | ||||
| Accrued net payroll | 44,401 | 36,203 | ||||||
| Legal accrual | 17,602 | 13,715 | ||||||
| Advisor deferred compensation plan liability | 16,542 | 12,305 | ||||||
| Deferred rent | 11,391 | 14,121 | ||||||
| Other accrued liabilities | 8,273 | 6,409 | ||||||
| Total payables | $ | 154,586 | $ | 129,898 | ||||
| December 31, | |||||||
| 2011 | 2010 | ||||||
| Accounts payable accruals | $ | 51,173 | $ | 56,377 | |||
| Accrued net payroll | 42,559 | 44,401 | |||||
| Other accrued liabilities | 24,515 | 8,273 | |||||
| Advisor deferred compensation plan liability | 20,166 | 16,542 | |||||
| Legal accrual | 13,221 | 17,602 | |||||
| Deferred rent | 8,765 | 11,391 | |||||
| Total payables | $ | 160,399 | $ | 154,586 | |||
11. Income Taxes
The Company’s provision for (benefit from) provision for income taxes was as follows (in thousands):
| 2010 | 2009 | 2008 | ||||||||||
| Current (benefit) provision: | ||||||||||||
| Federal | $ | (6,316 | ) | $ | 53,757 | $ | 61,498 | |||||
| State | (4,052 | ) | 12,750 | 11,909 | ||||||||
| Total current (benefit) provision | (10,368 | ) | 66,507 | 73,407 | ||||||||
| Deferred benefit: | ||||||||||||
| Federal | (17,877 | ) | (24,360 | ) | (25,385 | ) | ||||||
| State | (3,742 | ) | (17,100 | ) | (753 | ) | ||||||
| Total deferred benefit | (21,619 | ) | (41,460 | ) | (26,138 | ) | ||||||
| (Benefit from) Provision for income taxes | $ | (31,987 | ) | $ | 25,047 | $ | 47,269 | |||||
| 2011 | 2010 | 2009 | |||||||||
| Current provision (benefit): | |||||||||||
| Federal | $ | 105,176 | $ | (6,316 | ) | $ | 53,757 | ||||
| State | 15,559 | (4,052 | ) | 12,750 | |||||||
| Total current provision (benefit) | 120,735 | (10,368 | ) | 66,507 | |||||||
| Deferred benefit: | |||||||||||
| Federal | (6,781 | ) | (17,877 | ) | (24,360 | ) | |||||
| State | (1,651 | ) | (3,742 | ) | (17,100 | ) | |||||
| Total deferred benefit | (8,432 | ) | (21,619 | ) | (41,460 | ) | |||||
| Provision for (Benefit from) income taxes | $ | 112,303 | $ | (31,987 | ) | $ | 25,047 | ||||
A reconciliation of the U.S. federal statutory income tax rates to the Company’s effective income tax rates is set forth below:
2010 | 2009 | 2008 | ||||||||||
| Federal statutory income tax rates | (35.0 | )% | 35.0 | % | 35.0 | % | ||||||
| State income taxes — net of federal benefit | (5.7 | ) | (3.9 | ) | 7.8 | |||||||
| Share-based compensation | 1.5 | 1.5 | 1.0 | |||||||||
| Uncertain tax positions | (0.1 | ) | 1.8 | 3.6 | ||||||||
| Non-deductible expenses | 0.7 | 0.6 | 1.6 | |||||||||
| Change in valuation allowance | — | 0.1 | 1.2 | |||||||||
| Transaction costs | 3.2 | — | — | |||||||||
| Research and development credits | (1.2 | ) | — | (0.5 | ) | |||||||
| Other | 0.6 | (0.6 | ) | 1.3 | ||||||||
| Effective income tax rates | (36.0 | )% | 34.5 | % | 51.0 | % | ||||||
| 2011 | 2010 | 2009 | ||||||
| Federal statutory income tax rates | 35.0 | % | (35.0 | )% | 35.0 | % | ||
| State income taxes — net of federal benefit | 3.2 | (5.7 | ) | (3.9 | ) | |||
| Share-based compensation | 0.6 | 1.5 | 1.5 | |||||
| Uncertain tax positions | 0.1 | (0.1 | ) | 1.8 | ||||
| Non-deductible expenses | 0.4 | 0.7 | 0.6 | |||||
| Change in valuation allowance | — | — | 0.1 | |||||
| Transaction costs | 0.2 | 3.2 | — | |||||
| Research and development credits | (0.2 | ) | (1.2 | ) | — | |||
| Other | 0.4 | 0.6 | (0.6 | ) | ||||
| Effective income tax rates | 39.7 | % | (36.0 | )% | 34.5 | % | ||
The Company’s 2009 effective tax rate reflects a benefit of approximately 8% from a newly enacted change to California’s income sourcing rules that took effect on January 1, 2011. This change required the Company to revalue its deferred tax liabilities to the rate that is in effect when the tax
F-24
liabilities are utilized. The currentCompany's 2010 effective tax rate includes $8.1$8.1 million in transaction expenses, which are not deductible for tax purposes.
F-27
LPL INVESTMENT HOLDINGS INC. AND SUBSIDIARIES
Notes to Consolidated Financial Statements
The components of the net deferred tax liabilities included in the consolidated statements of financial condition were as follows (in thousands):
| December 31, | ||||||||
| 2010 | 2009 | |||||||
| Deferred tax assets: | ||||||||
| State taxes | $ | 10,507 | $ | 15,019 | ||||
| Reserves for litigation, vacation, and bonuses | 26,539 | 24,030 | ||||||
| Unrealized gain on interest rate swaps | 2,786 | 5,675 | ||||||
| Deferred rent | 4,557 | 5,649 | ||||||
| Share-based compensation | 8,091 | 6,905 | ||||||
| Provision for bad debts | 7,495 | 2,849 | ||||||
| Net operating losses | 107 | 172 | ||||||
| Other | 1,625 | 1,841 | ||||||
| Subtotal | 61,707 | 62,140 | ||||||
| Valuation allowance | (1,323 | ) | (1,340 | ) | ||||
| Total deferred tax assets | 60,384 | 60,800 | ||||||
| Deferred tax liabilities: | ||||||||
| Amortization of intangible assets and trademarks and trade names | (179,590 | ) | (191,108 | ) | ||||
| Depreciation of fixed assets | (11,005 | ) | (17,300 | ) | ||||
| Other | — | — | ||||||
| Total deferred tax liabilities | (190,595 | ) | (208,408 | ) | ||||
| Deferred income taxes — net | $ | (130,211 | ) | $ | (147,608 | ) | ||
| December 31, | |||||||
| 2011 | 2010 | ||||||
| Deferred tax assets: | |||||||
| State taxes | $ | 11,005 | $ | 10,507 | |||
| Reserves for litigation, vacation, and bonuses | 24,374 | 26,539 | |||||
| Unrealized gain on interest rate swaps | 528 | 2,786 | |||||
| Deferred rent | 3,506 | 4,557 | |||||
| Share-based compensation | 12,377 | 8,091 | |||||
| Provision for bad debts | 3,689 | 7,495 | |||||
| Net operating losses | 712 | 107 | |||||
| Other | 2,323 | 1,625 | |||||
| Subtotal | 58,514 | 61,707 | |||||
| Valuation allowance | (1,438 | ) | (1,323 | ) | |||
| Total deferred tax assets | 57,076 | 60,384 | |||||
| Deferred tax liabilities: | |||||||
| Amortization of intangible assets and trademarks and trade names | (173,602 | ) | (179,590 | ) | |||
| Depreciation of fixed assets | (11,240 | ) | (11,005 | ) | |||
| Total deferred tax liabilities | (184,842 | ) | (190,595 | ) | |||
| Deferred income taxes — net | $ | (127,766 | ) | $ | (130,211 | ) | |
As a result of certain realization requirements of ASC Topic 718,Compensation — -Stock Compensation,the table of deferred tax assets and liabilities shown above does not include certain federal and state net operating loss carryovers and other federal credit carryforwards that arose directly from tax deductions related to equity compensation in excess of share-based compensation recognized for financial reporting. To the extent that the Company utilizes all of these tax attributes in the future to reduce income taxes payable, the Company will record an increase to additional paid-in capital of $55.2 million.$7.9 million. The Company uses “with and without ordering” for purposes of determining when excess tax benefits have been realized.
At January 1,December 31, 2010, the Company had gross unrecognized tax benefits of $22.0 million.$21.1 million. Of this total, $2.1$1.3 million represents amounts acquired during the Company’s acquisition of the Affiliated Entities. The acquired unrecognized tax benefits will have no impact on the Company’s annual effective tax rate as these are fully indemnified by the seller in accordance with the purchase and sale agreement. At January 1,December 31, 2010, the Company had recorded a receivable from the seller in the amount of $2.1$1.3 million, which is included in other assets in the accompanying consolidated statements of financial condition. Of the remaining $19.9$19.8 million $14.4, $14.3 million (net of the federal benefit on state issues) represents the amount of unrecognized tax benefits that, if recognized, would favorably affect the effective income tax rate in any future periods.
F-25
The following table reflects a reconciliation of the beginning and ending balances of the total amounts of gross unrecognized tax benefits including interest and penalties (in thousands):
| 2010 | 2009 | 2008 | ||||||||||
| Balance — Beginning of year | $ | 21,958 | $ | 20,258 | $ | 15,139 | ||||||
| Increases related to acquired tax positions | 111 | 142 | 969 | |||||||||
| Increases related to current year tax positions | 4,076 | 4,066 | 6,480 | |||||||||
| Reductions as a result of a lapse of the applicable statute of limitations related to acquired tax positions | (858 | ) | (627 | ) | (596 | ) | ||||||
| Reductions as a result of a lapse of the applicable statute of limitations related to prior period tax positions | (4,230 | ) | (1,881 | ) | (1,734 | ) | ||||||
| Balance — End of year | $ | 21,057 | $ | 21,958 | $ | 20,258 | ||||||
| 2011 | 2010 | 2009 | |||||||||
| Balance — Beginning of year | $ | 21,057 | $ | 21,958 | $ | 20,258 | |||||
| Increases related to acquired tax positions | 69 | 111 | 142 | ||||||||
| Increases related to current year tax positions | 3,245 | 4,076 | 4,066 | ||||||||
| Reductions as a result of a lapse of the applicable statute of limitations related to acquired tax positions | (1,377 | ) | (858 | ) | (627 | ) | |||||
| Reductions as a result of a lapse of the applicable statute of limitations related to prior period tax positions | (2,874 | ) | (4,230 | ) | (1,881 | ) | |||||
| Balance — End of year | $ | 20,120 | $ | 21,057 | $ | 21,958 | |||||
F-28
LPL INVESTMENT HOLDINGS INC. AND SUBSIDIARIES
Notes to Consolidated Financial Statements
At December 31, 2010,2011, the Company had gross unrecognized tax benefits of $21.1 million. Of this total, $1.3$20.1 million represents amounts acquired due to the Company’s acquisition, of the Affiliated Entities. The acquired unrecognized tax benefits will have no impact on the Company’s annual effective tax rate as these are fully indemnified by the seller in accordance with the purchase and sale agreement. At December 31, 2010, the Company has recorded a receivable from seller in the amount of $1.3which $14.7 million which is included in other assets in the accompanying consolidated statements of financial condition. Of the remaining $19.8 million, $14.3 million (net of the federal benefit on state issues) represents the amount of unrecognized tax benefits that, if recognized, would favorably affect the effective income tax rate in any future periods.
The Company accrues interest and penalties related to unrecognized tax benefits in its provision for income taxes within the consolidated statements of financial condition. At January 1, 2010,2011, the Company had $1.9$2.0 million accrued for interest and $3.4$3.3 million accrued for penalties. At December 31, 2010,2011, the liability for unrecognized tax benefits included accrued interest of $2.0$1.9 million and penalties of $3.3 million.$3.1 million. Tax expense for the year ended December 31, 20102011 includes interest expense of $0.1 million.$0.1 million.
The Company and its subsidiaries file income tax returns in the federal jurisdiction, as well as most state jurisdictions, and are subject to routine examinations by the respective taxing authorities. The Company has concluded all federal and state income tax matters for years through 2005.2006.
The tax years of 20062007 to 20102011 remain open to examination by major taxing jurisdictions to which the Company is subject. In the next 12 months, it is reasonably possible that the Company expects a reduction in unrecognized tax benefits of $5.7$5.4 million primarily related to the statute of limitations expiration in various state jurisdictions.
12. | Indebtedness |
Senior Secured Credit Facilities— Term Loans— On May 24, 2010, the Company entered into a Third Amended and Restated Credit Agreement (the “Amended Credit Agreement”). The Amended Credit Agreement amended and restated the Company’s Second Amended and Restated Credit Agreement, dated as of June 18, 2007. Pursuant to the Amended Credit Agreement, the Company established a new term loan tranche of $580.0$580.0 million maturing on June 28, 2017 (the “2017 Term Loans”) and recorded $16.6$16.6 million in debt issuance costs that are capitalized in the consolidated statements of financial condition. The Company also extended the maturity of a $500.0$500.0 million tranche of its term loan facility to June 25, 2015 (the “2015 Term Loans”), with the remaining $317.1$317.1 million tranche of the term loan facility maturing on the original maturity date of June 28, 2013 (the “2013 Term Loans”).
F-26
The applicable margin for borrowings with respect to the (a) 2013 Term Loans is currently 0.75% for base rate borrowings and 1.75% for LIBOR borrowings and could change depending on the Company’s credit rating; (b) 2015 Term Loans is currently 1.75% for base rate borrowings and 2.75% for LIBOR borrowings, and (c) 2017 Term Loans is currently 2.75% for base rate borrowings and 3.75% for LIBOR borrowings. The LIBOR Rate with respect to the 2015 Term Loans and the 2017 Term Loans shall in no event be less than 1.50%.
Borrowings under the Company’s senior secured term loan facilities bear interest at a base rate equal to either one, two, three, six, nine or twelve-month LIBOR plus the applicable margin, or an alternative base rate (“ABR”) plus the applicable margin. The ABR is equal to the greater of the prime rate or the effective federal funds rate plus1½/2 of 1.00% for the 2013 Term Loans and the greater of the prime rate, effective federal funds rate plus1½/2 of 1.00%, or 2.50% for the 2015 Term Loans and the 2017 Term Loans. The senior secured credit facilities are subject to certain financial and nonfinancialnon-financial covenants. As of December 31, 20102011 and 2009,2010, the Company was in compliance with such covenants. The Company may voluntarily repay outstanding loans under its senior secured credit facilities at any time without premium or penalty, other than customary “breakage” costs with respect to LIBOR loans.
Senior Secured Credit Facilities — Revolving Line of Credit— On January 25, 2010, the Company amended its senior secured credit facilities to increase the revolving credit facility from $100.0$100.0 million to $218.2$218.2 million $10.0, $10.0 million of which is being used to support the issuance of an irrevocable letter of credit for its subsidiary, PTC. As a result of the amendment, the Company paid $2.8$2.8 million in debt issuance costs, which have been capitalized within the consolidated statements of financial condition and are being amortized as additional interest expense over the expected term of the related debt agreement. The Company also extended the maturity of a $163.5$163.5 million tranche of the revolving credit facility to June 28, 2013, while the remaining $54.7$54.7 million tranche retains its original maturity date ofmatured on December 28, 2011. The tranche maturing in 2013 is priced at LIBOR + 3.50% with a commitment fee of 0.75%.
F-29
LPL INVESTMENT HOLDINGS INC. AND SUBSIDIARIES
Notes to Consolidated Financial Statements
The tranche maturingwhich matured in 2011 maintainsmaintained its previous pricing of LIBOR + 2.00% with a commitment fee of 0.375%. There waswere no outstanding balancebalances on the revolving facility at December 31, 2010.2011 or December 31, 2010.
Senior Unsecured Subordinated Notes— On May 24, 2010, the Company gave notice of redemption of all of its outstanding senior unsecured subordinated notes due 2015 (the “2015 Notes”), representing an aggregate principal amount of $550.0 million.$550.0 million. The redemption price of the 2015 Notes was 105.375% of the outstanding aggregate principal amount, or approximately $579.6$579.6 million, plus accrued and unpaid interest thereon up to but not including June 22, 2010 (the “Redemption Date”). The Company redeemed the 2015 Notes on the Redemption Date and accordingly, recorded the charge as a loss on debt extinguishment within its consolidated statements of operations. None of the 2015 Notes remain outstanding. The Company used the proceeds from the 2017 Term Loans under its Amended Credit Agreement and additional cash on hand to finance the redemption. The aggregate cash payment for the redemption, including accrued and unpaid interest, was approximately $610.4 million.$610.4 million.
Prior to the Redemption Date, the Company had $550.0$550.0 million of senior unsecured subordinated notes due December 15, 2015 bearing interest at 10.75% per annum. The interest payments were payable semiannually in arrears.
Bank Loans Payable— The Company maintains twothree uncommitted lines of credit. One line hasTwo of the lines have an unspecified limit, and is primarily dependent on the Company’s ability to provide sufficient collateral. The other line has a $150.0$150.0 million limit and allows for both collateralized and uncollateralized borrowings. Both lines were utilized in 20102011 and 2009;2010; however, there were no balances outstanding at December 31, 2011 or December 31, 2010 or December 31, 2009.
F-27
.
The Company’s outstanding borrowings were as follows (in(dollars in thousands):
| December 31, 2010 | December 31, 2009 | |||||||||||||||||||
| Interest | Interest | |||||||||||||||||||
Maturity | Balance | Rate | Balance | Rate | ||||||||||||||||
| Senior secured term loan: | ||||||||||||||||||||
| Hedged with interest rate swaps | 6/28/2013 | $ | 210,000 | 2.05% | (1) | $ | 400,000 | 2.00% | (6) | |||||||||||
| Unhedged: | ||||||||||||||||||||
| 2013 Term Loans | 6/28/2013 | 104,739 | 2.01% | (2) | 419,223 | 2.00% | (7) | |||||||||||||
| 2015 Term Loans | 6/25/2015 | 496,250 | 4.25% | (3) | — | |||||||||||||||
| 2017 Term Loans | 6/28/2017 | 575,650 | 5.25% | (4) | — | |||||||||||||||
| Senior unsecured subordinated notes | (5 | ) | — | 550,000 | 10.75% | |||||||||||||||
| Total borrowings | 1,386,639 | 1,369,223 | ||||||||||||||||||
| Less current borrowings (maturities within 12 months) | 13,971 | 8,424 | ||||||||||||||||||
| Long-term borrowings — net of current portion | $ | 1,372,668 | $ | 1,360,799 | ||||||||||||||||
| December 31, 2011 | December 31, 2010 | ||||||||||||||||
Maturity | Balance | Interest Rate | Balance | Interest Rate | |||||||||||||
| Senior secured term loan: | |||||||||||||||||
| Hedged with interest rate swaps | 6/28/2013 | $ | 65,000 | 2.33 | % | (1) | $ | 210,000 | 2.05 | % | (5) | ||||||
| Unhedged: | |||||||||||||||||
| 2013 Term Loans | 6/28/2013 | 237,489 | 2.05 | % | (2) | 104,739 | 2.01 | % | (6) | ||||||||
| 2015 Term Loans | 6/25/2015 | 476,935 | 4.25 | % | (3) | 496,250 | 4.25 | % | (7) | ||||||||
| 2017 Term Loans | 6/28/2017 | 553,244 | 5.25 | % | (4) | 575,650 | 5.25 | % | (8) | ||||||||
| Total borrowings | 1,332,668 | 1,386,639 | |||||||||||||||
Less current borrowings (maturities within 12 months) | 13,971 | 13,971 | |||||||||||||||
| Long-term borrowings — net of current portion | $ | 1,318,697 | $ | 1,372,668 | |||||||||||||
____________
| (1) | As of December 31, |
| (2) | As of December 31, |
| (3) | As of December 31, |
| (4) | As of December 31, |
| (5) | ||
As of December 31, |
F-30
LPL INVESTMENT HOLDINGS INC. AND SUBSIDIARIES
Notes to Consolidated Financial Statements
on the three-month LIBOR of 0.30%, plus the applicable interest rate margin of 1.75%.
As of December 31, |
| (7) | As of December 31, 2010, the variable interest rate for the unhedged portion of the 2015 Term Loans is based on the greater of the one-month LIBOR of 0.26% or 1.50%, plus the applicable interest rate margin of 2.75%. |
| (8) | As of December 31, 2010, the variable interest rate for the unhedged portion of the 2017 Term Loans is based on the greater of the one-month LIBOR of 0.26% or 1.50%, plus the applicable interest rate margin of 3.75%. |
The following summarizes borrowing activity in the revolving and uncommitted line of credit facilities (in(dollars in thousands):
| Year Ended December 31, | ||||||||||||
| 2010 | 2009 | 2008 | ||||||||||
| Average balance outstanding | $ | 2,074 | $ | 56,472 | $ | 48,725 | ||||||
| Weighted-average interest rate | 1.16 | % | 2.41 | % | 4.74 | % | ||||||
F-28
| Year Ended December 31, | |||||||||||
| 2011 | 2010 | 2009 | |||||||||
| Average balance outstanding | $ | 104 | $ | 2,074 | $ | 56,472 | |||||
| Weighted-average interest rate | 1.00 | % | 1.16 | % | 2.41 | % | |||||
The minimum calendar year payments and maturities of the senior secured borrowings as of December 31, 20102011 are as follows (in thousands):
| 2011 | $ | 13,971 | ||
| 2012 | 13,971 | |||
| 2013 | 319,197 | |||
| 2014 | 10,800 | |||
| 2015 | 482,050 | |||
| Thereafter | 546,650 | |||
| Total | $ | 1,386,639 | ||
| 2012 | $ | 13,971 | |
| 2013 | 310,117 | ||
| 2014 | 10,800 | ||
| 2015 | 467,735 | ||
| 2016 | 5,800 | ||
| Thereafter | 524,245 | ||
| Total | $ | 1,332,668 | |
13. Interest Rate Swaps
At December 31, 2011, the Company has an interest rate swap iswith a financial derivative instrument whereby two parties enter intonotional balance of $65.0 million and a contractual agreement to exchange payments basedfair value of $1.4 million that carries a fixed pay rate of 4.85% and has a variable receive rate of 0.58%, with a maturity date of June 30, 2012. The effective rate from September 30, 2011 through December 30, 2011 was 0.37%, and the rate resets on underlying interest rates. Thethe last day of the period. During 2011, the Company useshad another interest rate swap agreements to hedge the variability on its floating rate senior secured term loan. The Company is required to pay the counterparty to the agreement fixed interest payments onwith a notional balance and in turn, receives variable interest paymentsof $145.0 million that matured on that notional balance. Payments are settled quarterly on a net basis.June 30, 2011.
| Variable | ||||||||||||||||||
| Notional | Fixed | Receive | Fair | Maturity | ||||||||||||||
Balance | Pay Rate | Rate(1) | Value | Date | ||||||||||||||
| $145,000 | 4.83% | 0.30% | $(3,235) | June 30, 2011 | ||||||||||||||
| 65,000 | 4.85% | 0.30% | (4,046) | June 30, 2012 | ||||||||||||||
| $210,000 | $(7,281) | |||||||||||||||||
The interest rate swap agreements qualify for hedge accounting and have been designated as cash flow hedges against specific payments due on the Company’s senior secured term loan. As of December 31, 2010,2011, the Company assessed the interest rate swap agreements as being highly effective and expects them to continue to be highly effective. Accordingly, the changes in fair value of the interest rate swaps have been recorded as other comprehensive loss, with the fair value included as a liability on the Company’s consolidated statements of financial condition. The Company has recorded net unrealized gains of $10.0$5.9 million and $8.1$10.0 million for the years ended December 31, 20102011 and 2009,2010, respectively, to accumulated other comprehensive loss related to the change in the fair value of its interest rate swap agreements. The Company has reclassified $13.4$6.3 million and $16.6$13.4 million to interest expense from accumulated other comprehensive loss for the years ended December 31, 20102011 and 2009,2010, respectively. Based on current interest rate assumptions and assuming no additional interest rate swap agreements are entered into, the Company expects to reclassify $9.5$1.4 million, or $6.1$0.8 million after tax, from other comprehensive loss as additional interest expense over the next 12 months.
F-29
14. Commitments and Contingencies
| Leases |
F-31
LPL INVESTMENT HOLDINGS INC. AND SUBSIDIARIES
Notes to Consolidated Financial Statements
increases, which are recognized on a straight-line basis over the period of the leases.
Service Contracts — The Company is party to certain long-term contracts for systems and services that enable back office trade processing and clearing for its product and service offerings. One agreement, for clearing services, contains no minimum annual purchase commitment, but the agreement provides for certain penalties should the Company fail to maintain a certain threshold of client accounts.
Future minimum payments under leases, lease commitments and other noncancellable contractual obligations with remaining terms greater than one year as of December 31, 2010,2011, are as follows (in thousands):
| 2011 | $ | 31,380 | ||
| 2012 | 25,235 | |||
| 2013 | 16,145 | |||
| 2014 | 9,400 | |||
| 2015 | 7,157 | |||
| Thereafter | 7,908 | |||
| Total(1) | $ | 97,225 | ||
| 2012 | $ | 27,507 | |
| 2013 | 23,938 | ||
| 2014 | 15,548 | ||
| 2015 | 11,836 | ||
| 2016 | 11,313 | ||
| Thereafter | 47,470 | ||
| Total(1) | $ | 137,612 | |
____________
| (1) | Minimum payments have not been reduced by minimum sublease rental income of |
Total rental expense for all operating leases was approximately $17.1$17.2 million $20.1, $17.1 million and $22.1$20.1 million for the years ended December 31, 2011, 2010 2009 and 2008,2009, respectively.
Guarantees — The Company occasionally enters into certain types of contracts that contingently require it to indemnify certain parties against third-party claims. The terms of these obligations vary and, because a maximum obligation is not explicitly stated, the Company has determined that it is not possible to make an estimate of the amount that it could be obligated to pay under such contracts.
The Company’s subsidiaries provide guarantees to securities clearing houses and exchanges under their standard membership agreements, which require a member to guarantee the performance of other members. Under these agreements, if a member becomes unable to satisfy its obligations to the clearing houses and exchanges, all other members would be required to meet any shortfall. The Company’s liability under these arrangements is not quantifiable and may exceed the cash and securities it has posted as collateral. However, the potential requirement for the Company to make payments under these agreements is remote. Accordingly, no liability has been recognized for these transactions.
Loan Commitments — From time to time, the Company makes loans to its advisors, primarily to newly recruited advisors to assist in the transition process. Due to timing differences, the Company may make commitments to issue such loans prior to actually funding them. These commitments are generally contingent upon certain events occurring, including but not limited to the advisor joining the Company, and may be forgivable. The Company had no significant unfunded commitments at December 31, 2010.2011.
Litigation — The Company has been named as a defendant in various legal actions, includingsubstantially all of which are arbitrations. In view of the inherent difficulty of predicting the outcome of such matters, particularly in
F-30
cases in which claimants seek substantial or indeterminate damages, the Company cannot predict with certainty what the eventual loss or range of loss related to such matters will be. The Company recognizes a legal liability when it believes it is probable a liability has occurred and the amount can be reasonably estimated. If some amount within a range of loss appears at the time to be a better estimate than any other amount within the range, the Company accrues that amount. When no amount within the range is a better estimate than any other amount, however, the Company accrues the minimum amount in the range.
The Company records legal reserves and related insurance recoveries for significant or unusual cases on a gross basis.
F-32
LPL INVESTMENT HOLDINGS INC. AND SUBSIDIARIES
Notes to Consolidated Financial Statements
The Company is subject to and maintains insurance coverage for claims and lawsuits in the ordinary course of business, such as customer complaints or disclosures about risks with securities purchased, as well as various arbitrations and other litigation matters. With respect to these matters, the estimated losses on the majority of pending matters are less than the applicable deductibles of the insurance policies, and matters with estimated losses in excess of the applicable deductibles are not, in the aggregate, material.
Defense costs are expensed as incurred and classified as professional services within the consolidated statements of operations. When there is indemnification or insurance, the Company may engage in defense of settlement and subsequently seek reimbursement for such matters.
In connection with various acquisitions, and pursuant to the purchase and sale agreements, the Company has received third-party indemnification for certain legal proceedings and claims. These matters have been defended and paid directly by the indemnifying party.
On October 1, 2009, LPLH received written notice from a third-party indemnitor under a certain purchase and sale agreement asserting that it is no longer obligated to indemnify the Company for certain claims under the provisions of the purchase and sale agreement. The Company believesbelieved that this assertion iswas without merit and has commenced litigation to enforce its indemnity rights. On November 20, 2009, LPLH and three of its affiliated broker-dealers, filed suit to enforceMarch 31, 2011, the indemnitor’s performance pursuant tocourt entered judgment granting the provisions of the contract. In February 2010, the plaintiffs filed aCompany’s motion for summary judgment with the court, which was opposedin all respects, denied all counterclaims by the third party indemnitor. Inindemnitor and awarded attorney fees to the Company. On May 2010, the court heard oral argument on the motion and see Note 22 for further discussion on this matter.
During 2010, the Company settled twocertain arbitrations that involve activities covered under the third-party indemnification agreement described above. In connection with these settlements in 2010, the Company has recorded legal expenses of $8.9 million. These legal expenses$11.4 million that have been included in professional services withinclassified as other expense on the consolidated statements of operations. The Company will seek to recover the costs associated with defending and settling these matters, plus other costs incurred on matters thatSeparately, the Company believes are subject toevaluated the indemnification. The remaining claims outstanding for whichcollectability of the indemnifying party is disputing its obligation involve alleged damages that are not material toreceivable and established a valuation allowance. As a result, the Company’sCompany's consolidated statements of financial condition operations orat December 31, 2010, included a gross receivable of $12.8 million for amounts due from the indemnifying party, which was reduced by a valuation allowance of $11.4 million. On December 29, 2011, the Company received a $10.5 million cash flows.settlement from the third-party indemnitor, substantially all of which has been classified as a reduction of other expense on the consolidated statements of operations.
The Company believes, based on the information available at this time, after consultation with counsel, consideration of insurance, if any, and indemnifications provided by the third-party indemnitors, notwithstanding the assertions by an indemnifying party noted in the preceding paragraphs, that the outcomeoutcomes will not have a material adverse impact on the consolidated statements of financial condition, operations or cash flows.
Other Commitments — As of December 31, 2010,2011, the Company had received collateral primarily in connection with client margin loans with a market value of approximately $326.9$350.2 million, which it can sell or repledge. Of this amount, approximately $167.4$32.7 million has been pledged or sold as of December 31, 2010; $145.82011; $18.4 million was pledged to banks in connection with unutilized secured margin lines of credit, $13.5 million was pledged with client-owned securities to the Options Clearing Corporation ("OCC") as collateral to secure client obligations related to options positions, and $8.1$14.3 million was loaned to the DTCNSCC through participation in its Stock Borrow Program. Additionally, approximately $145.0 million are held at banks in connection with unutilized secured margin lines of credit; these securities may be used as collateral for loans from these banks. Remaining client collateral of $172.5 million has not been re-pledged or sold, and as of December 31, 2011 there are no restrictions that materially limit the Company's ability to re-pledge or sell the remaining client collateral.
As of December 31, 2009,2010, the Company had received collateral primarily in connection with client margin loans with a market value of approximately $227.9$326.9 million, which it can sell or repledge. Of this amount, approximately $158.8$21.6 million has been pledged or sold as of December 31, 2009; $141.62010; $13.5 million was pledged with client-owned securities to the OCC as collateral to secure client obligations related to options positions, and $8.1 million was loaned to the NSCC through participation in its Stock Borrow Program. Additionally, approximately $145.8 million are held at banks in connection with unutilized secured margin lines of credit, $10.0credit; these securities may be used as collateral for loans from these banks. Remaining client collateral of $159.5 million was pledged with client-owned securities has not been re-pledged or sold, and as of December 31, 2010 there are no restrictions that materially limit the Company's ability to re-pledge or sell the Options Clearing Corporation, and $7.2 million was loaned to the DTC through participation in its Stock Borrow Program.remaining client collateral.
F-31
F-33
LPL INVESTMENT HOLDINGS INC. AND SUBSIDIARIES
Notes to Consolidated Financial Statements — (Continued)
In August of 2007, pursuant to agreements with a large global insurance company, LPL Financial began providing brokerage, clearing and custody services on a fully disclosed basis; offering its investment advisory programs and platforms; and providing technology and additional processing and related services to its advisors and their clients. The terms ofIn January 2012, the agreements are five years, subject to additional24-month extensions.two parties entered into a new multi-year agreement. Termination fees may be payable by a terminating or breaching party depending on the specific cause of termination.
15. | Share-Based Compensation |
Stock Option and Warrant Plans
Certain employees, advisors, officers and directors who contribute to the success of the Company participate in various stock option plans. In addition, certain financial institutions participate in a warrant plan. Stock options and warrants generally vest in equal increments over a three- to five-year period and expire on the 10th anniversary following the date of grant.
The Company recognizes share-based compensation expense related to employee stock option awards based on the grant date fair value over the requisite service period of the award, which generally equals the vesting period. The Company recognized $10.3$14.7 million $6.5, $10.3 million and $4.6$6.5 million of share-based compensation related to the vesting of employee stock option awards during the years ended December 31, 2011, 2010 2009 and 2008,2009, respectively, which is included in compensation and benefits on the consolidated statements of operations. As of December 31, 2010,2011, total unrecognized compensation cost related to non-vested share-based compensation arrangements granted was $53.0$37.9 million, which is expected to be recognized over a weighted-average period of 4.143.40 years.
The Company recognizes share-based compensation expense for stock options and warrants awarded to its advisors and financial institutions based on the fair value of the awards at each interim reporting period. The Company recognized $4.7$3.3 million $1.6, $4.7 million, and $0.3$1.6 million of share-based compensation during the years ended December 31, 2011, 2010 2009 and 2008,2009, respectively, related to the vesting of stock options and warrants awarded to its advisors and financial institutions, which is classified within commission and advisory fees on the consolidated statements of operations. As of December 31, 2010,2011, total unrecognized compensation cost related to non-vested share-based compensation arrangements granted was $12.2$19.3 million for advisors and financial institutions, which is expected to be recognized over a weighted-average period of 3.373.84 years.
The following table presents the weighted-average assumptions used by the Company in calculating the fair value of its employee, advisor and financial institution stock options and warrants with the Black-Scholes valuation model that have been granted during the years ended December 31, 2011, 2010 2009 and 2008:2009:
2010 | 2009 | 2008 | ||||||||||
| Expected life (in years) | 6.50 | 7.13 | 6.52 | |||||||||
| Expected stock price volatility | 49.22 | % | 51.35 | % | 33.78 | % | ||||||
| Expected dividend yield | — | — | — | |||||||||
| Annualized forfeiture rate | 3.00 | % | 4.35 | % | 1.51 | % | ||||||
| Fair value of options | $ | 17.43 | $ | 12.30 | $ | 9.96 | ||||||
| Risk-free interest rate | 2.70 | % | 2.93 | % | 2.73 | % | ||||||
| Employees | Advisors and Financial Institutions | |||||||||||||||||||||||
| 2011 | 2010 | 2009 | 2011 | 2010 | 2009 | |||||||||||||||||||
| Expected life (in years) | 6.50 | 6.50 | 6.50 | 9.71 | 9.20 | 9.32 | ||||||||||||||||||
| Expected stock price volatility | 48.82 | % | 49.22 | % | 50.41 | % | 48.49 | % | 49.46 | % | 54.66 | % | ||||||||||||
| Expected dividend yield | — | % | — | % | — | % | — | % | — | % | — | % | ||||||||||||
| Fair value of options | $ | 15.99 | $ | 17.42 | $ | 11.32 | $ | 16.59 | $ | 25.62 | $ | 15.72 | ||||||||||||
| Risk-free interest rate | 2.20 | % | 2.70 | % | 2.70 | % | 1.95 | % | 3.35 | % | 3.75 | % | ||||||||||||
The risk-free interest rates are based on the implied yield available on U.S. Treasury constant maturities in effect at the time of the grant with remaining terms equivalent to the respective expected terms of the options. The dividend yield of zero is based on the fact that the Company has no present intention to paynot paid a cash dividends.dividend on its common stock during the last six years. The Company estimates the expected term for its employee option awards using the simplified method in accordance with Staff Accounting Bulletin 110,Certain
F-32
Assumptions Used in Valuation Methods, because the Company does not have sufficient relevant historical information to develop reasonable expectations about future exercise patterns. The Company estimates the expected term for stock options and warrants awarded to advisors and financial institutions using the contractual term. Expected volatility is calculated based on companies of similar growth and maturity and the Company’s peer group in the industry in which the
F-34
LPL INVESTMENT HOLDINGS INC. AND SUBSIDIARIES
Notes to Consolidated Financial Statements
Company does business because the Company does not have sufficient historical volatility data. The Company will continue to use peer group volatility information until historical volatility of the Company is available to measure expected volatility for future grants. In the future, as the Company gains historical data for volatility of its own stock and the actual term over which stock options and warrants are held, expected volatility and the expected term may change, which could substantially change the grant-date fair value of future awards of stock options and warrants and, ultimately, compensation recorded on future grants.
The Company has assumed an annualized forfeiture rate for its stock options and warrants based on a combined review of industry, employee and advisor turnover data, as well as an analytical review performed of historical pre-vesting forfeitures occurring over the previous year. The Company records additional expense if the actual forfeiture rate is lower than estimated and records a recovery of prior expense if the actual forfeiture is higher than estimated.
The following table summarizes the Company’s activity in its stock option and warrant plans for the years ended December 31, 2011, 2010 2009 and 2008:2009:
| Weighted- | ||||||||||||||||
| Average | ||||||||||||||||
| Remaining | Aggregate | |||||||||||||||
| Weighted- | Contractual | Intrinsic | ||||||||||||||
| Number of | Average | Term | Value | |||||||||||||
| Shares | Exercise Price | (Years) | (In thousands) | |||||||||||||
| Outstanding — December 31, 2007 | 21,748,080 | 2.46 | ||||||||||||||
| Granted | 1,936,206 | 27.55 | ||||||||||||||
| Exercised | (286,968 | ) | 2.04 | |||||||||||||
| Forfeited | (3,319,035 | ) | 2.59 | |||||||||||||
| Outstanding — December 31, 2008 | 20,078,283 | 4.87 | ||||||||||||||
| Granted | 3,209,361 | 21.32 | ||||||||||||||
| Exercised | (256,795 | ) | 1.13 | |||||||||||||
| Forfeited | (328,380 | ) | 21.83 | |||||||||||||
| Outstanding — December 31, 2009 | 22,702,469 | 6.99 | ||||||||||||||
| Granted | 1,804,759 | 33.79 | ||||||||||||||
| Exercised | (13,883,847 | ) | 1.85 | |||||||||||||
| Forfeited | (344,329 | ) | 22.36 | |||||||||||||
| Outstanding — December 31, 2010 | 10,279,052 | $ | 18.12 | 6.66 | $ | 187,568 | ||||||||||
| Exercisable — December 31, 2010 | 4,954,868 | $ | 8.95 | 4.43 | $ | 135,886 | ||||||||||
F-33
Number of Shares | Weighted- Average Exercise Price | Weighted- Average Remaining Contractual Term (Years) | Aggregate Intrinsic Value (In thousands) | |||||||||||
| Outstanding — December 31, 2008 | 20,078,283 | $ | 4.87 | |||||||||||
| Granted | 3,209,361 | 21.32 | ||||||||||||
| Exercised | (256,795 | ) | 1.13 | |||||||||||
| Forfeited | (328,380 | ) | 21.83 | |||||||||||
| Outstanding — December 31, 2009 | 22,702,469 | 6.99 | ||||||||||||
| Granted | 1,804,759 | 33.79 | ||||||||||||
| Exercised | (13,883,847 | ) | 1.85 | |||||||||||
| Forfeited | (344,329 | ) | 22.36 | |||||||||||
| Outstanding — December 31, 2010 | 10,279,052 | 18.12 | ||||||||||||
| Granted | 1,151,082 | 31.90 | ||||||||||||
| Exercised | (1,807,746 | ) | 5.42 | |||||||||||
| Forfeited | (599,638 | ) | 27.01 | |||||||||||
| Outstanding — December 31, 2011 | 9,022,750 | $ | 21.83 | 6.63 | $ | 78,546 | ||||||||
| Exercisable — December 31, 2011 | 4,323,410 | $ | 15.16 | 4.91 | $ | 66,495 | ||||||||
The following table summarizes information about outstanding stock options and warrants:
| Outstanding | Exercisable | |||||||||||||||||||
| Weighted- | ||||||||||||||||||||
| Average | Weighted- | Weighted- | ||||||||||||||||||
| Total | Remaining | Average | Average | |||||||||||||||||
| Number of | Life | Exercise | Number of | Exercise | ||||||||||||||||
Range of Exercise Prices | Shares | (Years) | Price | Shares | Price | |||||||||||||||
| At December 31, 2010: | ||||||||||||||||||||
| $1.35 — $2.38 | 3,350,900 | 2.96 | $ | 1.69 | 3,350,900 | $ | 1.69 | |||||||||||||
| $10.30 — $19.74 | 896,294 | 7.92 | 18.38 | 198,992 | 16.91 | |||||||||||||||
| $21.60 — $22.08 | 2,053,100 | 8.42 | 22.02 | 519,040 | 21.94 | |||||||||||||||
| $23.02 — $27.80 | 2,242,775 | 7.52 | 26.55 | 885,936 | 26.99 | |||||||||||||||
| $30.00 — $34.61 | 1,735,983 | 9.98 | 34.21 | — | — | |||||||||||||||
| 10,279,052 | 6.66 | $ | 18.12 | 4,954,868 | $ | 8.95 | ||||||||||||||
| Outstanding | Exercisable | ||||||||||||||||
| Range of Exercise Prices | Total Number of Shares | Weighted- Average Remaining Life (Years) | Weighted- Average Exercise Price | Number of Shares | Weighted- Average Exercise Price | ||||||||||||
| At December 31, 2011: | |||||||||||||||||
| $1.35 — $2.38 | 1,843,059 | 2.12 | $ | 1.66 | 1,843,059 | $ | 1.66 | ||||||||||
| $10.30 — $19.74 | 787,770 | 6.95 | 18.46 | 262,532 | 17.53 | ||||||||||||
| $21.60 — $22.08 | 1,821,025 | 7.41 | 22.02 | 805,195 | 21.97 | ||||||||||||
| $23.02 — $29.99 | 2,438,814 | 7.28 | 27.20 | 1,097,969 | 26.79 | ||||||||||||
| $30.00 — $34.79 | 2,132,082 | 9.02 | 34.22 | 314,655 | 34.24 | ||||||||||||
| 9,022,750 | 6.63 | $ | 21.83 | 4,323,410 | $ | 15.16 | |||||||||||
F-35
LPL INVESTMENT HOLDINGS INC. AND SUBSIDIARIES
Notes to Consolidated Financial Statements
2008 Nonqualified Deferred Compensation Plan
On November 19, 2008, the Company established an unfunded, unsecured deferred compensation plan to permit employees and former employees that held non-qualified stock options issued under the 2005 Stock Option Plan for Incentive Stock Options and 2005 Stock Option Plan for Non-qualified Stock Options that were to expire in 2009 and 2010, to receive stock units under the 2008 Nonqualified Deferred Compensation Plan.Plan ("Deferred Compensation Plan"). Stock units represent the right to receive one share of common stock. Distribution will occur at the earliest of (a) a date in 2012 to be determined by the Board of Directors;Directors (see Note 22); (b) a change in control of the Company; or (c) death or disability of the participant. Issuance of stock units, which occurred in December 2008, is not taxable for federal and state income tax purposes until the participant receives a distribution under the deferred compensation plan. At December 31, 2010,2011, the Company had 2,823,452 stock units outstanding under the 2008 Nonqualified Deferred Compensation Plan.
Initial Public Offering
In 2008, certain advisors were issued 7.4 million shares of common stock. Transferability of the shares was restricted until the completion of a change in control event or an initial public offering (“IPO”). The Company has accounted for restricted shares granted to its advisors by measuring such grants at their then-current lowest aggregate value. Since the value of the award was contingent upon the Company’s decision to sell itself or issue its common stock to the public through an IPO, the aggregate value had been zero until such event had occurred.
On November 17, 2010, the Company sold shares of common stock in an IPO. Upon closing of the IPO, the Company recorded a share-based compensation charge of $222.0$222.0 million, representing the IPO price of $30.00$30.00 per share multiplied by 7.4 million shares that were issued and outstanding at the time of the offering, which is classified within commission and advisory fees on the consolidated statements of operations. The Company was able to take a tax deduction for the share-based compensation charge, as noted below.
F-34
$45.0 million
Director Restricted Stock Plan
In March 2010, the Company established a Director Restricted Stock Plan (the “Director Plan”). Eligible participants include non-employee directors who are in a position to make a significant contribution to the success of the Company. Restricted stock awards vest on the second anniversary of the date of grant and upon termination of service, unvested awards shall immediately be forfeited. On March 15, 2010 and , December 22, 2010, March 4, 2011 and December 1, 2011, the Company issued 6,408, 4,284, 12,104 and 4,284,13,336, respectively, of restricted stock awards to certain of its directors at a fair value of $23.41$23.41, $35.61, $33.05 and $35.61$29.99 per share, respectively. A summary of the status of the Company’s restricted stock awards under the Director Plan as of and for the yearyears ending December 31, 2011, 2010 and 2009 was as follows:
| Weighted-Average | ||||||||||||
| Number of | Grant-Date | |||||||||||
| Shares | Fair Value | |||||||||||
| Nonvested at January 1, 2010 | — | $ | — | |||||||||
| Granted | 10,692 | 28.30 | ||||||||||
| Vested | — | — | ||||||||||
| Forfeited | — | — | ||||||||||
| Nonvested at December 31, 2010 | 10,692 | $ | 28.30 | |||||||||
Number of Shares | Weighted-Average Grant-Date Fair Value | ||||||
| Nonvested at December 31, 2009 | — | $ | — | ||||
| Granted | 10,692 | 28.30 | |||||
| Vested | — | — | |||||
| Forfeited | — | — | |||||
| Nonvested at December 31, 2010 | 10,692 | $ | 28.30 | ||||
| Granted | 25,440 | 31.45 | |||||
| Vested | — | — | |||||
| Forfeited | — | — | |||||
| Nonvested at December 31, 2011 | 36,132 | $ | 30.51 | ||||
F-36
LPL INVESTMENT HOLDINGS INC. AND SUBSIDIARIES
Notes to Consolidated Financial Statements
The Company accounts for restricted stock awards granted to its non-employee directors by measuring such awards at their grant date fair value. Share-based compensation expense is recognized ratably over the requisite service period, which generally equals the vesting period. Based upon the Company’s history of termination of non-employee directors, management has assumed zero forfeitures for restricted stock awards. The Company recognized $0.1$0.3 million and $0.1 million of share-based compensation related to the vesting of restricted stock awards granted to its directors during the yearyears ended December 31, 2011 and December 31, 2010, respectively, which is included in compensation and benefits on the consolidated statements of operations. As of December 31, 2010,2011, total unrecognized compensation cost was $0.2$0.7 million, which is expected to be recognized over a weighted-average remaining period of 1.641.51 years.
Share Reservations
As of December 31, 2010,2011, the Company had approximately 10.39.4 million of authorized unissued shares reserved for issuance upon exercise and conversion of outstanding awards.
16. | Earnings per Share |
F-35
A reconciliation of the income (loss) income used to compute basic and diluted earnings (loss) per share for the years noted was as follows:
| For the Year Ended | ||||||||||||
| December 31, | ||||||||||||
| 2010 | 2009 | 2008 | ||||||||||
| (In thousands) | ||||||||||||
| Basic earnings per share: | ||||||||||||
| Net (loss) income, as reported | $ | (56,862 | ) | $ | 47,520 | $ | 45,496 | |||||
| Less: allocation of undistributed earnings to stock units | — | (919 | ) | (4 | ) | |||||||
| Net (loss) income, for computing basic earnings per share | $ | (56,862 | ) | $ | 46,601 | $ | 45,492 | |||||
| Diluted earnings per share: | ||||||||||||
| Net (loss) income, as reported | $ | (56,862 | ) | $ | 47,520 | $ | 45,496 | |||||
| Less: allocation of undistributed earnings to stock units | — | (810 | ) | (3 | ) | |||||||
| Net (loss) income, for computing diluted earnings per share | $ | (56,862 | ) | $ | 46,710 | $ | 45,493 | |||||
For the Year Ended December 31, | ||||||||||||
| 2011 | 2010 | 2009 | ||||||||||
| (In thousands) | ||||||||||||
| Basic earnings per share: | ||||||||||||
| Net income (loss), as reported | $ | 170,382 | $ | (56,862 | ) | $ | 47,520 | |||||
| Allocation of undistributed earnings to stock units | (2,176 | ) | — | (919 | ) | |||||||
| Net income (loss), for computing basic earnings per share | $ | 168,206 | $ | (56,862 | ) | $ | 46,601 | |||||
| Diluted earnings per share: | ||||||||||||
| Net income (loss), as reported | $ | 170,382 | $ | (56,862 | ) | $ | 47,520 | |||||
| Allocation of undistributed earnings to stock units | (2,104 | ) | — | (810 | ) | |||||||
| Net income (loss), for computing diluted earnings per share | $ | 168,278 | $ | (56,862 | ) | $ | 46,710 | |||||
A reconciliation of the weighted average number of shares outstanding used to compute basic and diluted earnings per share for the years noted was as follows:
| For the Year Ended | ||||||||||||
| December 31, | ||||||||||||
| 2010 | 2009 | 2008 | ||||||||||
| (In thousands) | ||||||||||||
| Basic weighted average number of shares outstanding | 89,441 | 86,649 | 86,447 | |||||||||
| Dilutive common share equivalents | — | 11,845 | 13,887 | |||||||||
| Diluted weighted average number of shares outstanding | 89,441 | 98,494 | 100,334 | |||||||||
For the Year Ended December 31, | |||||||||
| 2011 | 2010 | 2009 | |||||||
| (In thousands) | |||||||||
| Basic weighted average number of shares outstanding | 108,374 | 89,441 | 86,649 | ||||||
| Dilutive common share equivalents | 3,745 | — | 11,845 | ||||||
| Diluted weighted average number of shares outstanding | 112,119 | 89,441 | 98,494 | ||||||
F-37
LPL INVESTMENT HOLDINGS INC. AND SUBSIDIARIES
Notes to Consolidated Financial Statements
Basic and diluted earnings (loss) earnings per share for the years noted was as follows:
| For the Year Ended | ||||||||||||
| December 31, | ||||||||||||
| 2010 | 2009 | 2008 | ||||||||||
| Basic (loss) earnings per share | $ | (0.64 | ) | $ | 0.54 | $ | 0.53 | |||||
| Diluted (loss) earnings per share | $ | (0.64 | ) | $ | 0.47 | $ | 0.45 | |||||
For the Year Ended December 31, | ||||||||||||
| 2011 | 2010 | 2009 | ||||||||||
| Basic earnings (loss) per share | $ | 1.55 | $ | (0.64 | ) | $ | 0.54 | |||||
| Diluted earnings (loss) per share | $ | 1.50 | $ | (0.64 | ) | $ | 0.47 | |||||
Basic weighted average shares outstanding and diluted weighted average shares outstanding were the same for the year ended December 31, 2010, because the effect of potential shares of common stock was anti-dilutive since the Company generated a net loss.
The computation of diluted earnings per share excluded stock options and warrants to purchase 3,162,9013,919,267 shares, 3,443,1463,162,901 shares and 2,076,7623,443,146 shares for the years ended December 31, 2011, 2010 2009 and 2008,2009, respectively, because the effect would have been anti-dilutive.
Share Repurchase Program
On May 25, 2011, the Board of Directors approved a share repurchase program pursuant to which the Company may repurchase up to $80.0 million of its issued and outstanding shares of common stock through May 31, 2013. The purchases were effected in open market transactions with the timing of purchases and the amount of stock purchased determined at the discretion of the Company's management. As of December 31, 2011, the Company repurchased 2,297,723 shares of common stock at a weighted-average price of $34.84 per share for an aggregate purchase price of $80.0 million.
On August 16, 2011, the Board of Directors approved a share repurchase program pursuant to which the Company may repurchase an additional $70.0 million of its issued and outstanding shares of common stock through August 31, 2012. The purchases will be effected in open market transactions with the timing of purchases and the amount of stock purchased determined at the discretion of the Company's management. As of December 31, 2011, the Company repurchased 319,906 shares of common stock at a weighted-average price of $28.11 per share for an aggregate purchase price of $9.0 million.
17. Employee and Advisor Benefit Plans
The Company participates in a 401(k) defined contribution plan sponsored by LPL Financial. All employees meeting minimum age and length of service requirements are eligible to participate. The Company has an employer matching program whereby employer contributions were made to the 401(k) plan.plan, and employees are eligible for matching contributions after completing one year of service. For 2011, contributions were made in an amount equal to 30% of the first 10% of an employee's designated deferral of their eligible compensation and the Company has accrued an additional match equal to 10% of the first 10% of an employee's designated deferral of their eligible compensation. For 2010, contributions were made in an amount equal to the lesser of 40% of the amount designated by the employee for withholding or 4% of the employee’s eligible compensation. For 2009, contributions were made in an amount equal to the lesser of 20% of the amount designated by the employee for withholding or 2% of the employee’s eligible compensation. For 2008, contributions were made in an amount equal to the lesser of 50% of the amount designated by the employee for withholding or 5% of the employee’s eligible compensation. The Company’s total cost under the 401(k) plan was $3.5$3.8 million $1.7, $3.5 million and $4.8$1.7 million for the years ended December 31, 2011, 2010 2009 and 2008,2009, respectively.
On January 1, 2008, the Company adopted a non-qualified deferred compensation plan for the purpose of attracting and retaining advisors who operate, for tax purposes, as independent contractors, by providing an opportunity for participating advisors to defer receipt of a portion of their gross commissions generated primarily from commissions earned on the sale of various products. The deferred compensation plan has been fully funded to date by participant contributions. Plan assets are invested in mutual funds, which are held by the Company in a Rabbi Trust. The liability for benefits accrued under the non-qualified deferred compensation plan totaled $16.5$20.2 million at December 31, 2010,2011, which is included in accounts payable and accrued liabilities in the consolidated statements of financial condition. The cash values of the related trust assets was $16.2$20.2 million at December 31, 2010,2011, which is measured at fair value and included in other assets in the consolidated statements of financial condition.
F-38
LPL INVESTMENT HOLDINGS INC. AND SUBSIDIARIES
Notes to Consolidated Financial Statements
Certain employees and advisors of the Company’s subsidiaries participated in non-qualified deferred compensation plans (the “Plans”) that permitted participants to defer portions of their compensation and earn interest on the deferred amounts. The Plans have been closed to new participants and no contributions have been made since the acquisition date. Plan assets are held by the Company in a Rabbi Trust and accounted for in the manner described above. As of December 31, 2010,2011, the Company has recorded assets of approximately $1.0$1.3 million and liabilities of $1.1$1.0 million, which are included in other assets and accounts payable and accrued liabilities, respectively, in the consolidated statements of financial condition.
18. | Related Party Transactions |
One of the Company’s majority stockholders owns a minority interest in Artisan Partners Limited Partnership (“Artisan”), which pays fees in exchange for product distribution and record-keeping services. During the years ended December 31, 2011, 2010 2009 and 2008,2009, the Company earned $2.3$2.9 million $1.5, $2.3 million and $1.6$1.5 million, respectively, in fees from Artisan. Additionally, as of December 31, 20102011 and 2009,2010, Artisan owed the Company $0.6
$0.7 million and $0.5$0.6 million, respectively,
F-37
which is included in receivables from product sponsors, broker-dealers and clearing organizations on the consolidated statements of financial condition.
American Beacon Advisor, Inc. (“American Beacon”), a company majority-owned by one of the Company’s majority stockholders, pays fees in exchange for product distribution and record-keeping services. During the years ended December 31, 2010 2009 and 2008,2009, the Company earned $0.2$0.2 million $0.4, and $0.4 million and $0.3 million,, respectively, in fees from American Beacon. Additionally, as of December 31, 2009, American Beacon owed the Company $0.1 million, which is included in receivables from product sponsors, broker-dealers and clearing organizations on the consolidated statements of financial condition.
One of the Company’s majority stockholders owns a minority interest in XOJET, Inc. (“XOJET”), which provides chartered aircraft services. The Company paid $1.4$1.3 million to XOJET during the year ended December 31, 2010.2011.
Certain entities affiliated with SunGard Data Systems Inc. (“SunGard”), a company majority-owned by one of the Company’s majority stockholders, provide data center recovery services. The Company paid $0.3$0.3 million and $0.5$0.5 million to SunGard during the years ended December 31, 2010 and 2009, respectively.
TPG Capital (“TPG”("TPG"), one of the Company’sCompany's majority stockholders, provided certain consulting services. The Company paid $0.3$0.3 million to TPG during the year ended December 31, 2010.
In conjunction with the acquisition of UVEST Financial Services Group, Inc. (“UVEST”("UVEST"), the Company made full-recourse loans to certain members of UVEST’sUVEST's management (also selling stockholders), most of whom are now stockholders of the Company. In February 2010, the Company forgave approximately $0.4$0.4 million to a stockholder. As of At December 31, 2009, outstanding stockholder loans, which are reported as a deduction from stockholders’ equity, were $0.5 million. At December 31, 2011 and 2010, there were no loans outstanding.
An immediate family member of one of the Company’s executive officers, is an executive officer of CresaPartners LLC (“CresaPartners”). CresaPartners provides the Company and its subsidiaries real estate advisory, transaction and project management services. The Company paid $0.1$0.6 million to CresaPartners during the year ended December 31, 2010.2011.
The Company’s registered broker-dealers are subject to the SEC’s Uniform Net Capital Rule(Rule (Rule 15c3-1 under the Securities Exchange Act of 1934)Act), which requires the maintenance of minimum net capital, as defined. Net capital is calculated for each broker-dealer subsidiary individually. Excess net capital of one broker-dealer subsidiary may not
F-39
LPL INVESTMENT HOLDINGS INC. AND SUBSIDIARIES
Notes to Consolidated Financial Statements
be used to offset a net capital deficiency of another broker-dealer subsidiary. Net capital and the related net capital requirement may fluctuate on a daily basis.
Net capital and net capital requirements for the Company’s broker-dealer subsidiaries as of December 31, 20102011 are presented in the following table (in thousands):
| December 31, 2010 | ||||||||||||
| Minimum | ||||||||||||
| Net | Net Capital | Excess Net | ||||||||||
Capital | Required | Capital | ||||||||||
| LPL Financial LLC | $ | 95,362 | $ | 6,416 | $ | 88,946 | ||||||
| UVEST Financial Services Group, Inc. | 7,884 | 1,451 | 6,433 | |||||||||
| Total | $ | 103,246 | $ | 7,867 | $ | 95,379 | ||||||
Net Capital | Minimum Net Capital Required | Excess Net Capital | |||||||||
| LPL Financial LLC | $ | 100,944 | $ | 7,028 | $ | 93,916 | |||||
| UVEST Financial Services Group, Inc. | $ | 15,031 | $ | 937 | $ | 14,094 | |||||
LPL Financial is a clearing broker-dealer and UVEST is an introducing broker-dealer. In connection with the Company's 2011 initiative to consolidate UVEST with LPL Financial, UVEST plans to file a broker-dealer withdrawal request with FINRA upon transfer of all clients accounts and to maintain sufficient capital to carry out any remaining activities during the interim.
In connection with the consolidation of the Affiliated Entities;Company’s 2009 initiative that consolidated Associated Securities Corp. (“Associated”), Mutual Service Corporation (“MSC”) and Waterstone Financial Group, Inc. (“WFG”), with LPL Financial, Associated and WFG have withdrawn their registration with FINRA effective February 5, 2011, and are no longer subject to net capital filing requirements. MSC expects to withdrawwithdrew its registration with FINRA effective November 11, 2011, and has maintained sufficient capitalis no longer subject to carry out any remaining activities during the interim. At December 31, 2010, MSC had a net capital of $8.7 million, which was $8.2 million in excess of its minimum required net capital.filing requirements.
PTC is also subject to various regulatory capital requirements. Failure to meet minimum capital requirements can initiate certain mandatory and possible additional discretionary actions by regulators that, if undertaken, could have a direct material effect on the Company’s consolidated financial statements. As of December 31, 2011 and 2010, the Company’s registered broker-dealers and PTC have met all capital adequacy requirements to which it isthey are subject.
The Company operates in a highly regulated industry. Applicable laws and regulations restrict permissible activities and investments. These policies require compliance with various financial and customer-related regulations. The consequences of noncompliance can include substantial monetary and nonmonetarynon-monetary sanctions. In addition, the Company is also subject to comprehensive examinations and supervision by various governmental and self-regulatory agencies. These regulatory agencies generally have broad discretion to prescribe greater limitations on the operations of a regulated entity for the protection of investors or public interest. Furthermore, where the agencies determine that such operations are unsafe or unsound, fail to comply with applicable law, or are otherwise inconsistent with the laws and regulations or with the supervisory policies, greater restrictions may be imposed.
20. | Financial Instruments with Off-Balance-Sheet Credit Risk and Concentrations of Credit Risk |
LPL Financial’s client securities activities are transacted on either a cash or margin basis. In margin transactions, LPL Financial extends credit to the advisor's client, subject to various regulatory and internal margin requirements, collateralized by cash and securities in the client’s account. As clients write options contracts or sell securities short, LPL Financial may incur losses if the clients do not fulfill their obligations and the collateral in the clients’ accounts is not sufficient to fully cover losses that clients may incur from these strategies. To control this risk, LPL Financial monitors margin levels daily and clients are required to deposit additional collateral, or reduce positions, when necessary.
LPL Financial is obligated to settle transactions with brokers and other financial institutions even if its advisor's clients fail to meet their obligation to LPL Financial. Clients are required to complete their transactions on the settlement date, generally three business days after the trade date. If clients do not fulfill their contractual obligations, LPL Financial may incur losses. In addition, the Company occasionally enters into certain types of contracts to fulfill its sale of when, as, and if issued securities. When, as, and if issued securities have been authorized but are contingent upon the actual issuance of the security. LPL Financial has established
F-39
procedures to reduce this risk by generally requiring that clients deposit cashand/or securities into their account prior to placing an order.
F-40
LPL INVESTMENT HOLDINGS INC. AND SUBSIDIARIES
Notes to Consolidated Financial Statements
LPL Financial may at times maintain inventories inhold equity securities on both a long and short basis that are recorded on the consolidated statements of financial condition at market value. While long inventory positions represent LPL Financial’s ownership of securities, short inventory positions represent obligations of LPL Financial to deliver specified securities at a contracted price, which may differ from market prices prevailing at the time of completion of the transaction. Accordingly, both long and short inventory positions may result in losses or gains to LPL Financial as market values of securities fluctuate. To mitigate the risk of losses, long and short positions aremarked-to-market daily and are continuously monitored by LPL Financial.
UVEST is engaged in buying and selling securities and other financial instruments for clients of advisors. Such transactions are introduced and cleared through a third-party clearing firm on a fully disclosed basis. While introducing broker-dealers generally have less risk than clearing firms, their clearing agreements expose them to credit risk in the event that their clients don’t fulfill contractual obligations with the clearing broker-dealer.
21. Selected Quarterly Financial Data (Unaudited)
| 2011 | |||||||||||||||
| (In thousands) | |||||||||||||||
First Quarter | Second Quarter | Third Quarter | Fourth Quarter | ||||||||||||
| Net revenues | $ | 873,869 | $ | 893,996 | $ | 882,857 | $ | 828,653 | |||||||
| Net income | $ | 48,999 | $ | 45,507 | $ | 36,428 | $ | 39,448 | |||||||
| Basic earnings per share | $ | 0.44 | $ | 0.41 | $ | 0.33 | $ | 0.36 | |||||||
| Diluted earnings per share | $ | 0.43 | $ | 0.40 | $ | 0.32 | $ | 0.35 | |||||||
| 2010 | |||||||||||||||
| (In thousands) | |||||||||||||||
First Quarter | Second Quarter | Third Quarter | Fourth Quarter | ||||||||||||
| Net revenues | $ | 743,406 | $ | 790,161 | $ | 759,964 | $ | 819,955 | |||||||
| Net income (loss) | $ | 25,554 | $ | 8,000 | $ | 26,144 | $ | (116,560 | ) | ||||||
| Basic earnings (loss) per share | $ | 0.29 | $ | 0.09 | $ | 0.30 | $ | (1.20 | ) | ||||||
| Diluted earnings (loss) per share | $ | 0.25 | $ | 0.08 | $ | 0.26 | $ | (1.20 | ) | ||||||
22. Subsequent Events
Acquisition of Fortigent Holdings Company, Inc.
On January 3, 2012, the Company announced its intent to acquire Fortigent Holdings Company, Inc. and its wholly owned subsidiaries Fortigent, LLC, Fortigent Reporting Company, LLC, and Fortigent Strategies Company, LLC (together, "Fortigent"). Fortigent is a leading provider of high net worth solutions and consulting services to RIA's, banks, and trust companies. With over 90 institutions with more than $50.0 billion in advisory assets, Fortigent offers a high net worth oriented platform that provides concentrated research, reporting, and alternative investment solutions specifically designed for the RIA and high net worth space. This strategic acquisition will further enhance the Company's capabilities and offer an extension of the Company's existing services for wealth management advisors.
Issuance Under 2008 Nonqualified Deferred Compensation Plan
On February 22, 2012, the Company distributed 1,673,556 shares, net of shares withheld to satisfy withholding tax requirements, pursuant to the terms of the Deferred Compensation Plan. Distributions to participants were engaged in buying and selling securities and other financial instruments for clients of advisors. Such transactions were introduced and cleared through a third-party clearing firm on a fully disclosed basis. These firms no longer conduct such activities. The registered representatives and their client accounts have either transitioned or aremade in the processform of transitioningwhole shares of common stock equal to LPL Financial orthe number of stock units allocated to new firms.the participant's account, with fractional shares paid out in cash. Participants authorized the Company to withhold shares from their distribution of common stock to satisfy their withholding tax obligations. Accordingly on February 22, 2012, the Company repurchased 1,149,896 shares and paid $37.5 million of cash consideration related to tax withholdings.
F-41
| 2010 | ||||||||||||||||
| (In thousands) | ||||||||||||||||
| First | Second | Third | Fourth | |||||||||||||
Quarter | Quarter | Quarter | Quarter | |||||||||||||
| Revenues | $ | 743,452 | $ | 790,185 | $ | 759,988 | $ | 819,972 | ||||||||
| Net revenues | 743,406 | 790,161 | 759,964 | 819,955 | ||||||||||||
| Gross margin(1)(2) | 230,204 | 233,623 | 234,336 | 239,770 | ||||||||||||
| Net income (loss) | $ | 25,554 | $ | 8,000 | $ | 26,144 | $ | (116,560 | ) | |||||||
| 2009 | ||||||||||||||||
| (In thousands) | ||||||||||||||||
| First | Second | Third | Fourth | |||||||||||||
Quarter | Quarter | Quarter | Quarter | |||||||||||||
| Revenues | $ | 643,040 | $ | 669,366 | $ | 702,378 | $ | 734,906 | ||||||||
| Net revenues | 642,978 | 669,317 | 702,326 | 734,884 | ||||||||||||
| Gross margin(1) | 200,447 | 205,329 | 221,144 | 218,006 | ||||||||||||
| Net income (loss) | $ | 14,797 | $ | 15,581 | $ | (1,456 | ) | $ | 18,598 | |||||||
F-40
LPL INVESTMENT HOLDINGS INC. AND SUBSIDIARIES
Notes to Consolidated Financial Statements — (Continued)
******
F-41
F-42