Our research and development organization is responsible for the design, development, testing and certification of our data and information management software applications. As of March 31, 2011,2012, we had 326348 employees in our research and development group, of which 105115 are located at our Hyderabad, India development center. In April 2012, we opened a new product development center in Bangalore, India, which increases our existing presence in India. Our engineering efforts support product development across all major operating systems, databases, applications and network storage devices. A substantial amount of our development effort goes into certification, integration and support of our applications to ensure interoperability with our strategic partners’ hardware and software products. We have also made substantial investments in the automation of our product test and quality assurance laboratories. We spent $37.0$39.9 million on research and development activities in fiscal 2012, $37.0 million in fiscal 2011 and $33.4 million in fiscal 2010 and $30.7 million in fiscal 2009.
Competition
The data storage management market is intensely competitive, highly fragmented and characterized by rapidly changing technology and evolving standards. We currently compete with other providers of data and information management software as well as large storage hardware manufacturers that have developed or acquired their own data and information management software products. These manufacturers have the resources and capabilities to develop their own data and information management software applications, and many have been making acquisitions and broadening their efforts to include broader data and information management and storage products. These manufacturers and/or our other current and potential competitors may establish cooperative relationships among themselves or with third parties, creating new competitors or alliances. Large operating system and application vendors, including Microsoft, have introduced products or functionality that includes some of the same functions offered by our software applications. In the future, further development by these vendors could cause some features of our software applications to become redundant.
The following are our primary competitors in the data and information management software applications market, each of which has one or more products that compete with a part of or our entire software suite:
EMC;
Hewlett-Packard;
IBM; and
Symantec.
The principal competitive factors in our industry include product functionality, product performance, product integration, platform coverage, ability to scale, price, worldwide sales infrastructure, global technical support, name recognition and reputation. The ability of major system vendors to bundle hardware and software solutions is also a significant competitive factor in our industry. Although many of our competitors have greater resources, a larger installed customer base and greater name recognition, we believe we compete favorably on the basis of these competitive factors.
Our unique product architecture is one of the primary reasons why we compete so successfully. Whereas other competitive solutions in the market are based on multiple, disparate products, our modular offering is based on a single, unified, underlying code base resulting in favorable efficiencies in functionality, integration, scalability and support. Our focused approach to data and information management and our ability to respond to customer feedback also drives the functionality and features of our products, which we believe lead the industry in terms of performance and usability, as evidenced by numerous industry awards we have received in the past 12 months such as the 2011 Windows IT Pro Editors’ Best Back Software Product Silver Award; 2011 Midsize Enterprise Summit West Inovations Award; 2011 Microsoft Server Platform Partner of the Year; 2011 Storage Magazine’s Deduplication Product of the Year; Microsoft Best of Tech-Ed 2011 Backup and Recovery Award; 2011 Gartner Magic Quadrant for Enterprise Disk-Based Backup and Recovery; 2011 DCIG Best in Class Virtual Server Backup Software; 2011 Info-Tech Research Group’s Champion for Enterprise Backup Software; the 2010 Storage Magazine/SearchStorage.com Quality Awards for Enterprise-class Backup and Recovery software; and 20102011 Gartner Magic Quadrant for Enterprise Information Archiving.
12
Some of our competitors have greater financial resources and may have the ability to offer their products at lower prices than ours. In addition, some of our competitors have greater name recognition than us, which could provide them a competitive advantage at some customers. Some of our competitors also have longer operating histories, have substantially greater technical, sales, marketing and other global resources than we do, as well as a larger installed customer base and broader product offerings, including hardware. As a result, these competitors can devote greater resources to the development, promotion, sale and support of their products than we can.
Intellectual Property and Proprietary Rights
Our success and ability to compete depend on our continued development and protection of our proprietary software and other technologies. We rely primarily on a combination of trade secret, patent, copyright and trademark laws, as well as contractual provisions, to establish and protect our intellectual property rights. We provide our software to customers pursuant to license agreements that impose restrictions on use. These license agreements are primarily in the form of shrink-wrap or click-wrap licenses, which are not negotiated with or signed by our end-user customers. These measures may afford only limited protection of our intellectual property and proprietary rights associated with our software. We also enter into confidentiality agreements with employees and consultants involved in product development. We routinely require our employees, customers and potential business partners to enter into confidentiality agreements before we disclose any sensitive aspects of our software, technology or business plans.
As of March 31, 2011,2012, we had 118162 issued patents and 174172 pending patent applications in the United States, as well as 5557 issued patents in foreign countries and 7683 pending foreign patent applications. Pending patent
applications may receive unfavorable examination and are not guaranteed allowance as issued patents. We may elect to abandon or otherwise not pursue prosecution of certain pending patent applications due to patent examination results, economic considerations, strategic concerns or other factors. We will continue to assess appropriate occasions to seek patent and other intellectual property protection for innovative aspects of our technology that we believe provide us a significant competitive advantage.
Despite our efforts to protect our trade secrets and proprietary rights through patents and license and confidentiality agreements, unauthorized parties may still attempt to copy or otherwise obtain and use our software and technology. In addition, we intend to expand our international operations and effective patent, copyright, trademark and trade secret protection may not be available or may be limited in foreign countries. If we fail to protect our intellectual property and other proprietary rights, our business could be harmed.
We currently resell certain software from Microsoft, including Microsoft SQL Server, used in conjunction with our software applications pursuant to an independent software vendor royalty license and distribution agreement that we have and plan to continue renewing annually. We also currently resell certain other software from Microsoft, including Windows Pre-installation Environment software, used in conjunction with our software applications, pursuant to an agreement with Microsoft that expires May 31, 2012. We have entered into and expect to enter into agreements with additional third parties to license their technology for use with our software applications.
Some of the products or technologies acquired, licensed or developed by us may incorporate so-called “open source” software and we may incorporate open source software into other products in the future. The use of such open source software may ultimately subject some products to unintended conditions, which may negatively affect our business, financial condition, operating results, cash flow and ability to commercialize our products or technologies.
From time to time, we are participants or members of various industry standard-setting organizations or other industry technical organizations. Our participation or membership in such organizations may, in some circumstances, require us to enter into royalty or licensing agreements with third parties regarding our intellectual property under terms established by those organizations, which we may find unfavorable.
13
Employees
As of March 31, 2011,2012, we had 1,2681,437 employees worldwide, including 362422 in sales and marketing, 326348 in research and development, 136147 in general and administration and 444520 in customer services and support. None of our employees are represented by a labor union. We have never experienced a work stoppage and believe our relationship with our employees is good.
Executive Officers of the Registrant
The following table presents information with respect to our executive officers as of May 15, 2011:
Name | Age | Position | ||||
N. Robert Hammer | ||||||
| Chairman, President and Chief Executive Officer | ||||||
Alan G. Bunte | Executive Vice President and Chief Operating Officer | |||||
Louis F. Miceli | Senior Vice President and Chief Financial Officer | |||||
Ron Miiller | Senior Vice President of Worldwide Sales | |||||
David West | Senior Vice President, Marketing and Business Development | |||||
N. Robert Hammerhas served as our Chairman, President and Chief Executive Officer since March 1998. Mr. Hammer was also a venture partner from 1997 until December 2003 of the Sprout Group, the venture capital arm of Credit Suisse’s asset management business. Prior to joining the Sprout Group, Mr. Hammer served as the chairman, president and chief executive officer of Norand Corporation, a portable computer systems manufacturer, from 1988 until its acquisition by Western Atlas, Inc. in 1997. Mr. Hammer led Norand following its leveraged buy-out from Pioneer Hi-Bred International, Inc. and through its initial public offering in 1993. Prior to joining Norand, Mr. Hammer also served as chairman, president and chief executive officer of publicly-held Telequest Corporation from 1987 until 1988 and of privately-held Material Progress Corporation from 1982 until 1987. Prior to joining Material Progress Corporation, Mr. Hammer spent 15 years in various sales, marketing and management positions with Celanese Corporation, rising to the level of vice president and general manager of the structural composites materials business. Mr. Hammer obtained his bachelor’s degree and master’s degree in business administration from Columbia University.
Alan G. Buntehas served as our Executive Vice President and Chief Operating Officer since October 2003 and served as our senior vice president from December 1999 until October 2003. Since January 2008, Mr. Bunte has also served as a director of CommVault. Prior to joining our company, Mr. Bunte was with Norand Corporation from 1986 to January 1998, serving as its senior vice president of planning and business development from 1991 to January 1998. Mr. Bunte obtained his bachelor’s and master’s degrees in business administration from the University of Iowa.
Louis F. Micelihas served as our Senior Vice President and Chief Financial Officer since April 2011. Prior to his current role, Mr. Miceli served as our Vice President and Chief Financial Officer from April 1997 to March 2011. Mr. Miceli has over 30 years of experience in various finance capacities for several high-technology companies. Prior to joining our company, Mr. Miceli served as chief financial officer of University Hospital, part of the University of Medicine and Dentistry of New Jersey (UMDNJ), from 1994 until 1997 and as the corporate controller of UMDNJ from 1992 until 1994. Prior to joining UMDNJ, Mr. Miceli served as the chief financial officer of Syntrex, Inc., a word processing software and hardware manufacturer, from 1985 until 1992, and as its controller from 1980 until 1985. Mr. Miceli began his career as a staff auditor at Ernst & Ernst LLP (currently Ernst &Young LLP), where he served five years. Mr. Miceli obtained his bachelor’s degree,cum laude, in accounting from Seton Hall University and is a certified public accountant in the State of New Jersey.
Ron Miillerhas served as our Senior Vice President of Worldwide Sales since April 2011. Prior to his current role, Mr. Miiller served as our Vice President of Sales, Americas from January 2005 to March 2011 and as our Central Region Sales Manager from March 2000 to December 2004. Prior to joining our company, Mr. Miiller served as Director, Central Region Sales for Softworks, Inc., an EMC company, from March 1997 through March 2000, and prior to that Mr. Miiller was with Moore Corporation, a diversified print and electronic communications company from 1989 through March 1997 in various leadership roles. Mr. Miiller received his bachelor of science degree in marketing from Ball State University in 1989.
14
September 2005 to March 2011 and Vice President, Business Development from August 2000 to September 2005. Prior to joining our company, Mr. West served as a director of strategic alliances from April 1999 to July 2000 and vice president of storage solutions in July 2000 at Legato Systems, Inc., which was subsequently acquired by EMC Corporation. Prior to joining Legato Systems, Mr. West served as vice president of sales at Intelliguard Software, Inc., which was also subsequently acquired by EMC Corporation, from 1990 to April 1999. Mr. West obtained his bachelor’s degree in electrical engineering from Villanova University.
| Item 1A. | Risk Factors |
You should consider each of the following factors as well as the other information in this Annual Report in evaluating our business and our prospects. The risks and uncertainties described below are not the only ones we face. Additional risks and uncertainties not presently known to us or that we currently consider immaterial may also impair our business operations. If any of the following risks actually occurs, our business and financial results could be harmed. In that case, the trading price of our common stock could decline. You should also refer to the other information set forth in this Annual Report, including our financial statements and the related notes.
Risks Related to Our Business
Our industry is intensely competitive, and most of our competitors have greater financial, technical and sales and marketing resources and larger installed customer bases than we do, which could enable them to compete more effectively than we do.
The data and information management software market is intensely competitive, highly fragmented and characterized by rapidly changing technology and evolving standards, changing customer requirements and frequent new product introductions. Competitors vary in size and in the scope and breadth of the products and services offered. Our primary competitors include CA, Inc., EMC, Hewlett-Packard, IBM and Symantec Corporation.
The principal competitive factors in our industry include product functionality, product integration, platform coverage, ability to scale, price, worldwide sales infrastructure, global technical support, name recognition and reputation. The ability of major system vendors to bundle hardware and software solutions is also a significant competitive factor in our industry. If we are unable to address these competitive factors, our competitive position could weaken and we could experience a decline in revenues that could adversely affect our business.
Most of our current and potential competitors have longer operating histories and have substantially greater financial, technical, sales, marketing and other resources than we do, as well as larger installed customer bases, greater name recognition and broader product offerings, including hardware. These competitors can devote greater resources to the development, promotion, sale and support of their products than we can and have the ability to bundle their hardware and software products in a combined offering. As a result, these competitors may be able to respond more quickly to new or emerging technologies and changes in customer requirements.
15
Our current and potential competitors may establish cooperative relationships among themselves or with third parties. If so, new competitors or alliances that include our competitors may emerge that could acquire significant market share. In addition, large operating system and application vendors, such as Microsoft Corporation, as well as some hardware manufacturers, have introduced products or functionality that includes some of the same functions offered by our software applications. In the future, further development by these vendors could cause our software applications and services to become redundant, which could seriously harm our sales, results of operations and financial condition.
New competitors entering our markets can have a negative impact on our competitive positioning. In addition, we expect to encounter new competitors as we enter new markets. Furthermore, many of our existing competitors are broadening their operating systems platform coverage. We also expect increased competition from original equipment manufacturers, including those we partner with, and from systems and network management companies, especially those that have historically focused on the mainframe computer market and have been making acquisitions and broadening their efforts to include data and information management and storage products. We expect that competition will increase as a result of future software industry consolidation. Increased competition could harm our business by causing, among other things, price reductions of our products, reduced profitability and loss of market share.
We may not be able to respond to rapid technological changes with new software applications and services offerings, which could have a material adverse effect on our sales and profitability.
The markets for our software applications are characterized by rapid technological changes, changing customer needs, frequent new software product introductions and evolving industry standards. The introduction of software applications embodying new technologies and the emergence of new industry standards could make our existing and future software applications obsolete and unmarketable. As a result, we may not be able to accurately predict the lifecycle of our software applications, and they may become obsolete before we receive the amount of revenues that we anticipate from them. If any of the foregoing events were to occur, our ability to retain or increase market share in the data and information management software market could be materially adversely affected.
We devote significant resources to the development of new products and the enhancement of existing products. To be successful, we need to anticipate, develop and introduce new software applications and services on a timely and cost-effective basis that keep pace with technological developments and emerging industry standards and that address the increasingly sophisticated needs of our customers. We may fail to develop and market software applications and services that respond to technological changes or evolving industry standards, experience difficulties that could delay or prevent the successful development, introduction and marketing of these applications and services or fail to develop applications and services that adequately meet the requirements of the marketplace or achieve market acceptance. Our failure to develop and market such applications and services on a timely basis, or at all, could have a material adverse effect on our sales and profitability.
Volatility in the global economy could adversely impact our continued growth, results of operations and our ability to forecast future business.
As our business has expanded globally, we have become increasingly subject to the risks arising from adverse changes in domestic and global economic and political conditions. TheUncertainty in the macroeconomic environment and associated global economic conditions have been volatileresulted in volatility in credit, equity, particularly with respect to the European sovereign debt markets and potential ramifications of the recent fiscal yearsU.S. debt issues and have resultedbudget concerns. These global economic conditions can result in slower economic activity, decreased consumer confidence, reduced corporate profits and capital spending, adverse business conditions and liquidity concerns. There has also been increased volatility in foreign exchange markets. We believe that our sales and results of operations were impacted by these economic factors. These factors make it difficult for our customers, our vendors and us to accurately forecast and plan future business activities. In addition, these factors could cause customers to slow or defer spending on our software and services products, which would delay and lengthen sales cycles and negatively affect our results of operations. We cannot predictThough current macroeconomic conditions appear to be stabilizing, if such conditions deteriorate or if the timing or durationpace of any economic slowdown or the timing or strength of a subsequent economic recovery on either a worldwide basisis slower or more uneven, our results of operations could be adversely affected, we may not be able to sustain the growth rates we have experienced recently, and we could fail to meet the expectations of stock analysts and investors, which could cause the price of our common stock to decline.
We continue to invest in our industry.
business in the Asia-Pacific and Europe, Middle East, and Africa (“EMEA”) regions. There are significant risks with overseas investments and growth prospects in these regions can be
16
uncertain. Increased volatility or further declines in the European credit, equity and foreign currency markets could cause delays in or cancellations of European orders. Deterioration of economic conditions in the countries in which we do business could also cause slower or impaired collections on accounts receivable. In addition, we could experience delays in the payment obligations of our worldwide resellers if they experience weakness in the end-user market, which would increase our credit risk exposure and harm our financial condition.
We rely significantly on our value-added resellers, systems integrators and corporate resellers, which we collectively refer to as resellers, for the marketing and distribution of our software applications and services. Resellers are our most significant distribution channel. However, our agreements with resellers are generally not exclusive, are generally renewable annually, generallytypically do not contain minimum sales requirements and in many cases may be terminated by either party without cause. Many of our resellers carry software applications that are competitive with ours. These resellers may give a higher priority to other software applications, including those of our competitors, or may not continue to carry our software applications at all. If a number of resellers were to discontinue or reduce the sales of our products, or were to promote our competitors’ products in lieu of our own, it would have a material adverse effect on our future revenues. Events or occurrences of this nature could seriously harm our sales and results of operations. If we fail to manage our resellers successfully, there may be conflicts between resellers, or they could fail to perform as we anticipate, which could reduce our sales. In addition, we expect that a significant portion of our sales growth will depend upon our ability to identify and attract new reseller partners. We believe that ourOur competitors also use reseller arrangements. Our competitorsarrangements and may be more successful in attracting reseller partners and could enter into exclusive relationships with resellers that make it difficult to expand our reseller network. Any failure on our part to maintain and/or expand our network of resellers could impair our ability to grow revenues in the future.
Some of our resellers possess significant resources and advanced technical abilities. These resellers, particularly our corporate resellers, may, either independently or jointly with our competitors, develop and market software applicationsproducts and related services that compete with our offerings. If this were to occur, these resellers might discontinue marketing and distributing our software applications and services. In addition, these resellers would have an advantage over us when marketing their competing software applicationsproducts and related services because of their existing customer relationships. The occurrence of any of these events could have a material adverse effect on our revenues and results of operations.
In addition, we have distribution agreements covering our North American commercial markets and our U.S. Federal Government market with Arrow Enterprise Computing Solutions, Inc. (“Arrow”), a subsidiary of Arrow Electronics, Inc., and Avnet Technology Solutions (“Avent”Avnet”), a subsidiary of Avnet, Inc. Pursuant to these distribution agreements, these distributors primary role is to enable a more efficient and effective distribution channel for our products and services by managing our reseller partners and leveraging their own industry experience. Many of our North American resellers have been transitioned to either Arrow or Avnet. Sales through our distribution agreement with Arrow accounted for approximately 25%26% of our total revenues for fiscal 20112012 and approximately 24%25% for fiscal 2010.2011. Arrow accounted for a total of approximately 32%30% of our accounts receivable balance as of March 31, 20112012 as a result of our reseller agreement. Avnet’s total revenue contribution was not material for fiscal 20112012 and 20102011 and its accounts receivable balance was not material as of March 31, 2011.2012. If Arrow or Avnet were to discontinue or reduce the sales of our products or if our agreement with Arrow or Avnet was terminated, and if we were unable to take back the management of our reseller channel or find another North American distributor to replace Arrow or Avnet, then it could have a material adverse effect on our future revenues.
Sales through Dell as a result of our reseller agreement and as well as our original equipment manufacturer agreement, which is discussed below, accounted for approximately 22% of total revenues for fiscal 2012 and
23% of total revenues for fiscal 2011 and approximately 24% of total revenues for fiscal 2010.2011. Dell also accounted for a total of approximately 25% of our accounts receivable balance as of March 31, 2011.2012. If we were to see an impairment of our receivable balance from Dell, it could have a significant adverse effect on our results of operations.
Our original equipment manufacturer agreements are primarily with Dell, and Hitachi Data Systems.Systems and NetApp. Our original equipment manufacturers sell our software applications and in some cases incorporate our data and information management software into systems that they sell. A material portion of our revenues is generated through these arrangements. However, we have no control over the shipping dates or volumes of systems these original equipment manufacturers ship and they have no obligation to ship systems incorporating our software applications. They also have no obligation to recommend or offer our software applications exclusively or at all, and they have no minimum sales requirements and can terminate our relationship at any time. These original equipment manufacturers also could choose to develop their own data and information management software internally and incorporate those products into their systems instead of our software applications. The original equipment manufacturers that we do business with also compete with one another. If one of our original equipment manufacturer partners views our arrangement with another original equipment manufacturer as competing with its products, it may decide to stop doing business with us. Any material decrease in the volume of sales generated by original equipment manufacturers we do business with, as a result of these factors or otherwise, wouldcould have a material adverse effect on our revenues and results of operations in future periods. Sales through our original equipment manufacturer agreements accounted for approximately 12% of our total revenues for fiscal 2012 and 10% of our total revenues for both fiscal 2011 and fiscal 2010.
2011.
17
Our outstanding accounts receivables are generally not secured. In addition, our standard terms and conditions permit payment within a specified number of days following the receipt of our product. During the recent volatile economic downturn,conditions certain of our customers and resellers have faced or may face liquidity concerns which could result in our customers or resellers not to bebeing able to satisfy their payment obligations to us, which would have a material adverse effect on our financial condition, operating results and cash flows. While we have procedures to monitor and limit exposure to credit risk on our receivables and have not suffered any material losses to date, there can be no assurance such procedures will continue to effectively limit our credit risk and avoid future losses.
We may experience a decline in revenues or volatility in our quarterly operating results, which may adversely affect the market price of our common stock.
We cannot predict our future quarterly revenues or operating results with certainty because of many factors outside of our control. A significant revenue or profit decline, lowered forecasts or volatility in our operating results could cause the market price of our common stock to decline substantially. Factors that could affect our revenues and operating results include the following:
the unpredictability of the timing and magnitude of orders for our software applications, particularly software transactions greater than $100,000 — in recent fiscal years, a majority of our quarterly revenues was earned and recorded near the end of each quarter;
the possibility that our customers may cancel, defer or limit purchases as a result of reduced information technology budgets;
the possibility that our customers may defer purchases of our software applications in anticipation of new software applications or updates from us or our competitors;
the ability of our original equipment manufacturers and resellers to meet their sales objectives;
market acceptance of our new applications and enhancements;
our ability to control expenses;
changes in our pricing and distribution terms or those of our competitors; and
the demands on our management, sales force and services infrastructure as a result of the introduction of new software applications or updates.
Our expense levels are relatively fixed and are based, in part, on our expectations of our future revenues. If revenue levels fall below our expectations and we are profitable at the time, our net income would decrease because only a small portion of our expenses varies with our revenues. Therefore, any significant decline in revenues for any period could have an immediate adverse impact on our results of operations for that period. We believe that period-to-period comparisons of our results of operations should not be relied upon as an indication of future performance. In addition, our results of operations could be below expectations of public market analysts and investors in future periods, which would likely cause the market price of our common stock to decline.
We encounter long sales and implementation cycles, particularly for our larger customers, which could have an adverse effect on the size, timing and predictability of our revenues.
Potential or existing customers, particularly larger enterprise customers, generally commit significant resources to an evaluation of available software and require us to expend substantial time, effort and money educating them as to the value of our software and services. Sales of our core software products to these larger customers often require an extensive education and marketing effort.
18
our customers’ budgetary constraints;
the timing of our customers’ budget cycles and approval processes;
our customers’ willingness to replace their current software solutions;
our need to educate potential customers about the uses and benefits of our products and services; and
the timing of the expiration of our customers’ current license agreements or outsourcing agreements for similar services.
If our sales cycles lengthen unexpectedly, they could adversely affect the timing of our revenues or increase costs, which may cause fluctuations in our quarterly revenues and results of operations. Finally, if we are unsuccessful in closing sales it could have a material adverse effect on the size, timing and predictability of our revenues.
We depend on growth in the data and information management software market, and lack of growth or contraction in this market or could have a material adverse effect on our sales and financial condition.
Demand for data and information management software is linked to growth in the amount of data generated and stored, demand for data retention and management (whether as a result of regulatory requirements or otherwise) and demand for and adoption of new storage devices and networking technologies. Because our software applications are concentrated within the data and information management software market, if the demand for storage devices, storage software applications, storage capacity or storage networking devices declines, our sales, profitability and financial condition would be materially adversely affected. Segments of the computer and software industry have in the past experienced significant economic downturns. The occurrence of any of these factors in the data and information management software market could materially adversely affect our sales, profitability and financial condition.
Furthermore, the data and information management software market is dynamic and evolving. Our future financial performance will depend in large part on continued growth in the number of organizations adopting data and information management software for their computing environments. The market for data and information management software may not continue to grow at historic rates, or at all. If this market fails to grow or grows more slowly than we currently anticipate, our sales and profitability could be adversely affected.
Our software applications are complex and may contain undetected errors, which could adversely affect not only our software applications’ performance but also our reputation and the acceptance of our software applications in the market.
Software applications as complex as those we offer contain undetected errors or failures, especially when products are first introduced or new versions are released. Despite extensive testing by us and by our customers, we have in the past discovered errors in our software applications and will do so in the future. As a result of past discovered errors, we experienced delays and lost revenues while we corrected those software applications. In addition, customers in the past have brought to our attention “bugs” in our software created by the customers’ unique operating environments, which are often characterized by a wide variety of both standard and non-standard configurations that make pre-release testing very difficult and time consuming. Although we have been able to fix these software bugs in the past, we may not always be able to do so. Our software products may also be subject to intentional attacks by viruses that seek to take advantage of these bugs, errors or other weaknesses. Any of these events may result in the loss of, or delay in, market acceptance of our software applications and services, which would seriously harm our sales, results of operations and financial condition.
Furthermore, we believe that our reputation and name recognition are critical factors in our ability to compete and generate additional sales. Promotion and enhancement of our name will depend largely on our success in continuing to provide effective software applications and services. The occurrence of errors in our software applications or the detection of bugs by our customers may damage our reputation in the market and our relationships with our existing customers, and as a result, we may be unable to attract or retain customers.
In addition, because our software applications are used to manage data that is often critical to our customers, they may have a greater sensitivity to defects in our products than to defects in other, less critical, applications. As a result, the licensing and support of our software applications involve the risk of product liability claims. AnyOur license agreements with our customers typically contain provisions designed to limit our exposure to potential product liability insurance we carryclaims. However, the limitation of liability provisions contained in our license agreements vary and may not be sufficienteffective as a result of existing or future national, federal, state, or local laws or ordinances or unfavorable judicial decisions. Although we have not experienced any material product liability claims to date, the sale and support of our products entail the risk of such claims, which could be substantial in light of the use of our products in enterprise-wide environments. In addition, our insurance against product liability may not be adequate to cover our losses resulting from product liabilityall potential claims. The successful assertion of one or more large claims against us could have a material adverse effect on our financial condition.
19
Most of our maintenance agreements are for a one year term. As the end of the annual period approaches, we pursue the renewal of the agreement with the customer. Historically, maintenance renewals have represented a significant portion of our total revenue. Because of this characteristic of our business, if our customers choose not to renew their maintenance and support agreements with us on beneficial terms, or at all, our business, operating results and financial condition could be harmed.
We develop software applications that interoperate with operating systems and hardware developed by others, and if the developers of those operating systems and hardware do not cooperate with us or we are unable to devote the necessary resources so that our applications interoperate with those systems, our software development efforts may be delayed or foreclosed and our business and results of operations may be adversely affected.
Our software applications operate primarily on the Windows, UNIX, Linux and Novell Netware operating systems and the hardware devices of numerous manufacturers. When new or updated versions of these operating systems and hardware devices are introduced, it is often necessary for us to develop updated versions of our software applications so that they interoperate properly with these systems and devices. We may not accomplish these development efforts quickly or cost-effectively, and it is not clear what the relative growth rates of these operating systems and hardware will be. These development efforts require the cooperation of the developers of the operating systems and hardware, substantial capital investment and the devotion of substantial employee resources. For some operating systems, we must obtain some proprietary application program interfaces from the owner in order to develop software applications that interoperate with the operating system. Operating system owners have no obligation to assist in these development efforts. If they do not provide us with assistance or the necessary proprietary application program interfaces on a timely basis, we may experience delays or be unable to expand our software applications into other areas.
We may not receive significant revenues from our current research and development efforts for up to several years, if at all.
Developing software is expensive, and the investment in product development may involve a long payback cycle. Our research and development expenses were $39.9 million, or 10% of our total revenues in fiscal 2012, $37.0 million, or approximately 12% of our total revenues in fiscal 2011 and $33.4 million, or 12% of our total revenues in fiscal 2010. Our future plans include significant investments in software research and development and related product opportunities. We believe that we must continue to dedicate a significant amount of resources to our research and development efforts to maintain our competitive position. However, we may not recognize significant revenues from these investments for up toseveral years, if at all.
The loss of key personnel or the failure to attract and retain highly qualified personnel could have an adverse effect on our business.
Our future performance depends on the continued service of our key technical, sales, services and management personnel. We rely on our executive officers and senior management to execute our existing business operations and identify and pursue new growth opportunities. The loss of key employees could result in significant disruptions to our business, and the integration and training of replacement personnel could be time consuming, cause additional disruptions to our business and be unsuccessful. We do not carry key person life insurance covering any of our employees.
20
Furthermore, in the past, we have experienced higher levels of turnover in our sales force compared to other employee groups in our company. Increases in the turnover rate of our sales force may affect our ability to generate license revenue growth. Although we have hired replacements in our sales force and are continuing to hire additional sales personnel to grow our business, we sometimes experience lower productivity from newly hired sales personnel for a period up to twelve months. In addition, we periodically make adjustments to our sales organization in response to a variety of internal and external factors, such as market opportunities, competitive threats, product introductions or enhancements and sales performance. Such adjustments could be temporarily disruptive and result in reduced productivity.
The volatility of our stock price may from time to time adversely affect our ability to attract or retain employees. If we are unable to hire or retain qualified employees across our organization, or conversely, if we fail to manage employee performance or reduce staffing levels when required by market conditions, our personnel costs would be excessive and our business and profitability could be adversely affected.
Our international sales and operations are subject to factors that could have an adverse effect on our results of operations.
We have significant sales and services operations outside the United States, and derive a substantial portion of our revenues from these operations. We also plan to continue to expand our international operations. We generated approximately 39% of our revenues from outside the United States in both fiscal 20112012 and approximately 38% in fiscal 2010.2011. Accordingly, international sales increased 22%27% in fiscal 20112012 compared to fiscal 2010.2011. Expansion of our international operations will require a significant amount of attention from our management and substantial financial resources and might require us to add qualified management in these markets.
In addition to facing risks similar to the risks faced by our domestic operations, our international operations are also subject to risks related to the differing legal, political, social and regulatory requirements and economic conditions of many countries, including:
difficulties in staffing and managing our international operations;
foreign countries may impose additional withholding taxes or otherwise tax our foreign income, impose tariffs or adopt other restrictions on foreign trade or investment, including currency exchange controls;
difficulties in coordinating the activities of our geographically dispersed and culturally diverse operations;
general economic conditions in the countries in which we operate, including seasonal reductions in business activity in the summer months in Europe and in other periods in other countries, could have an adverse effect on our earnings from operations in those countries;
imposition of, or unexpected adverse changes in, foreign laws or regulatory requirements may occur, including those pertaining to export restrictions, trade and employment restrictions and intellectual property protections;
longer payment cycles for sales in foreign countries and difficulties in collecting accounts receivable;
competition from local suppliers;
greater risk of a failure of our employees to comply with both U.S. and foreign laws, including antitrust regulations, the U.S. Foreign Corrupt Practices Act, the U.K. Bribery Act of 2010, and any trade regulations ensuring fair trade practices;
costs and delays associated with developing software in multiple languages; and
political unrest, war or acts of terrorism.
Our business in emerging markets requires us to respond to rapid changes in market conditions in those markets. Our overall success in international markets depends, in part, upon our ability to succeed in differing legal, regulatory, economic, social and political conditions. We may not continue to succeed in developing and implementing policies and strategies that will be effective in each location where we do business. Furthermore, the occurrence of any of the foregoing factors may have a material adverse effect on our business and results of operations.
We may experience fluctuations in foreign currency exchange rates that could adversely impact our results of operations.
Our international sales are generally denominated in foreign currencies, and this revenue could be materially affected by currency fluctuations. Our primary exposures are to fluctuations in exchange rates for the U.S. dollar
versus the Euro and, to a lesser extent, the Australian dollar, British pound sterling, Canadian dollar, Chinese yuan, Indian rupee, Korean won and Singapore dollar. Changes in currency exchange rates could adversely affect our reported revenues and could require us to reduce our prices to remain competitive in foreign markets, which could also have a material adverse effect on our results of operations. An unfavorable change in the exchange rate of foreign currencies against the U.S. dollar would result in lower revenues when translated into U.S. dollars, although operating expenditures would be lower as well. Historically, the effect of changes in foreign currency exchange rates on our revenues and operating expenses has not been material, although it may be in the future.
In recent fiscal years, we have selectively hedged our exposure to changes in foreign currency exchange rates on the balance sheet. In the future, we may enter into additional foreign currency-based hedging contracts to reduce our exposure to significant fluctuations in currency exchange rates on the balance sheet, although there can be no assurances that we will do so.
However, as our international operations grow, or if dramatic fluctuations in foreign currency exchange rates continue or increase or if our hedging strategies become ineffective, the effect of changes in the foreign currency exchange rates could become material to revenue, operating expenses, and income.
21
Our services include the assessment and design of solutions to meet our customers’ storage management requirements and the efficient installation and deployment of our software applications based on specified business objectives. Further, once our software applications are deployed, our customers depend on us to resolve issues relating to our software applications. A high level of service is critical for the successful marketing and sale of our software. If we or our partners do not effectively install or deploy our applications, or succeed in helping our customers quickly resolve post-deployment issues, it would adversely affect our ability to sell software products to existing customers and could harm our reputation with prospective customers. As a result, our failure to maintain high quality support and professional services would have a material adverse effect on our sales of software applications and results of operations.
Our services revenue produces lower gross margins than our software revenue, and an increase in services revenue relative to software revenue would harm our overall gross margins.
Our services revenue, which includes fees for customer support, assessment and design consulting, implementation and post-deployment services and training, has lower gross margins than our software revenue. An increase in the percentage of total revenues represented by services revenue would adversely affect our overall gross margins. The volume and profitability of services can depend in large part upon competitive pricing pressure on the rates that we can charge for our services; the complexity of our customers’ information technology environments and the existence of multiple non-integrated legacy databases;environments; the resources directed by our customers to their implementation projects; and the extent to which outside consulting organizations provide services directly to customers. Any erosion of our margins for our services revenue or any adverse change in the mix of our license versus services revenue would adversely affect our operating results.
Our abilityA portion of our revenue is generated by sales to sell to the U.S. Federal Government isgovernment entities, which are subject to uncertainties, which coulda number of challenges and risks.
Sales to U.S. and foreign federal, state, and local governmental agency end-customers have accounted for a material adverse effect onportion of our revenue, and we may in the future increase sales to government entities. However, government entities have recently announced reductions in, or experienced increased pressure to reduce spending. In particular, such measures have adversely affected European public sector transactions, and resultsthe recent U.S. debt issues and budget concerns may adversely impact future U.S. public sector transactions. Such budgetary constraints or shifts in spending priorities of operations.
government entities can be highly competitive, expensive and time consuming, often requiring significant upfront time and expense without any assurance that we will successfully sell our products to such governmental entity. Government entities may require contract terms that differ from our standard arrangements. Government contracts may require the government’s future funding commitments and our ability to maintainmaintenance of certain security clearances complyingfor facilities and employees which can entail administrative time and effort possibly resulting in additional costs and delays. In addition, government demand for our products may be more volatile as they are affected by public sector budgetary cycles, funding authorizations, and the potential for funding reductions or delays, making the time to close such transactions more difficult to predict. This risk is enhanced as the size of such sales to the government entities increases. If the use of our products expands to more sensitive, secure or mission critical uses by our government customers, we may be subject to increased scrutiny, potential reputational risk, or potential liability should our products fail to perform as expected or should we not comply with the Departmentterms of Defense and other agency requirements. Revenues derived from sales where the U.S. Federal Government was the end-user was approximately 8% in fiscal 2011 and approximately 9% in fiscal 2010. The future prospects for our business are also sensitive to changes in government policies and funding priorities. Changes in government policies or priorities, including funding levels through agency or program budget reductions by the U.S. Congresscontracts or government agencies, could materially adversely affectcontracting requirements.
Most of our abilitysales to government entities have been made indirectly through providers that sell our software applicationsproducts. Government entities may have contractual or other legal rights to the U.S. Federal Government, causingterminate contracts with our business prospectsproviders for convenience or due to suffer.
If we are unable to manage our growth, there could be a material adverse effect on our business, the quality of our products and services and our ability to retain key personnel.
We have experienced periods of growth in recent years. Our revenues increased 29% for fiscal 2012 compared to fiscal 2011 and also increased 16% for fiscal 2011 compared to fiscal 2010 and also increased 16% for fiscal 2010 compared to fiscal 2009.2010. The number of our customers increased significantly during these periods. Our growth has placed increased demands on our management and other resources and will continue to do so in the future. We may not be able to maintain or accelerate our current growth rate, manage our expanding operations effectively or achieve planned growth on a timely or profitable basis. Managing our growth effectively will involve, among other things:
continuing to retain, motivate and manage our existing employees and attract and integrate new employees;
continuing to provide a high level of services to an increasing number of customers;
22
developing new sales channels that broaden the distribution of our software applications and services; and
developing, implementing and improving our operational, financial, accounting and other internal systems and controls on a timely basis.
If we are unable to manage our growth effectively, there could be a material adverse effect on our ability to maintain or increase revenues and profitability, the quality of our data and information management software, the quality of our services offerings and our ability to retain key personnel. These factors could adversely affect our reputation in the market and our ability to generate future sales from new or existing customers.
We may be subject to information technology system failures, network disruptions and breaches in data security.
Information technology system failures, network disruptions and breaches of data security could disrupt our operations by causing delays or cancellation of customer orders, impeding the shipment of software products, negatively affecting our service offerings, preventing the processing transactions and reporting of financial results. Information technology system failures, network disruptions and breaches of data security could also
result in the unintentional disclosure of customer or our information as well as damage to our reputation. While management has taken steps to address these concerns by implementing sophisticated network security and internal control measures, there can be no assurance that a system failure or data security breach will not have a material adverse effect on our financial condition and operating results.
Protection of our intellectual property is limited, and any misuse of our intellectual property by others could materially adversely affect our sales and results of operations.
Our success depends significantly upon proprietary technology in our software, documentation and other written materials. To protect our proprietary rights, we rely on a combination of:
patents;
copyright and trademark laws;
trade secrets;
confidentiality procedures; and
contractual provisions.
These methods afford only limited protection. Despite this limited protection, any issued patent may not provide us with any competitive advantages or may be challenged by third parties, and the patents of others may seriously impede our ability to conduct our business. Further, our pending patent applications may not result in the issuance of patents, and any patents issued to us may not be timely or broad enough to protect our proprietary rights. We may also develop proprietary products or technologies that cannot be protected under patent law.
Despite our efforts to protect our proprietary rights, unauthorized parties may attempt to copy aspects of our software applications or to obtain and use information that we regard as proprietary. Policing unauthorized use of our software applications is difficult, and we expect software piracy to continue to be a persistent problem. In licensing our software applications, we typically rely on “shrink wrap” or “click wrap” licenses that are not signed by licensees. We may have difficulty enforcing these licenses in some jurisdictions. In addition, the laws of some foreign countries do not protect our proprietary rights to as great an extent as do the laws of the United States. Our attempts to protect our proprietary rights may not be adequate. Our competitors may independently develop similar technology, duplicate our software applications or design around patents issued to us or other intellectual property rights of ours. Litigation may be necessary in the future to enforce our intellectual property rights, protect our trade secrets or determine the validity and scope of the proprietary rights of others. Litigation could result in substantial costs and diversion of resources and management attention. In addition, from time to time we are participants or members of various industry standard-setting organizations or other industry technical organizations. Our participation or membership in such organizations may, in some circumstances, require us to enter into royalty or licensing agreements with third parties regarding our intellectual property under terms established by those organizations, which we may not find favorable.
In addition, many of our agreements with our customers and partners require us to indemnify them for certain intellectual property infringement claims against them, which would increase our costs as a result of defending such claims, and may require that we pay significant damages if there were an adverse ruling in any such claims. Furthermore, such customers and partners may discontinue the use of our products, services, and technologies, as a result of injunctions or otherwise, which could result in loss of revenues and adversely impact our business.
23
Due to the nature of our business, we may become subject to material claims of infringement by competitors and other third parties with respect to current or future software applications, trademarks or other proprietary
rights. We expect that software developers will increasingly be subject to infringement claims as the number of software applications and competitors in our industry segment grows and the functionality of software applications in different industry segments overlaps. Any such claims, whether meritorious or not, could be time-consuming, result in costly litigation, cause shipment delays or require us to enter into royalty or licensing agreements with third parties, which may not be available on terms that we deem acceptable, if at all. In addition, we may decide to settle a claim or action against us, which settlement could be costly. We may also be liable for any past infringement. If there is an adverse ruling against us in an infringement lawsuit, an injunction could be issued barring production or sale of any infringing product. It could also result in a damage award equal to a reasonable royalty or lost profits or, if there is a finding of willful infringement, treble damages. Any of these claims could disrupt our business and have a material adverse effect on our results of operations and financial condition.
In addition, we license and use software from third parties in our business. These third-party software licenses may not continue to be available to us on acceptable terms or at all, and may expose us to additional liability. This liability, or our inability to use any of this third-party software, could result in shipment delays or other disruptions in our business that could materially and adversely affect our operating results.
Our use of “open source” software could negatively affect our business and subjects us to possible litigation.
Some of the products or technologies acquired, licensed or developed by us may incorporate so-called “open source” software, and we may incorporate open source software into other products in the future. Such open source software is generally licensed by its authors or other third parties under open source licenses, including, for example, the GNU General Public License, the GNU Lesser General Public License, the Common Public License, “Apache-style” licenses, “Berkley Software Distribution or BSD-style” licenses and other open source licenses. We monitor our use of open source software to avoid subjecting our products to conditions we do not intend.intend, but these efforts may not be successful. Although we believe that we have complied with our obligations under the various applicable licenses for open source software that we use, there is little or no legal precedent governing the interpretation of many of the terms of certain of these licenses, and therefore the potential impact of these terms on our business is somewhat unknown and may result in unanticipated obligations regarding our products and technologies. The use of such open source software may ultimately subject some of our products to unintended conditions, which may negatively affect our business, financial condition, operating results, cash flow and ability to commercialize our products or technologies.
Some of these open source licenses may subject us to certain conditions, including requirements that we offer our products that use the open source software for no cost, that we make available source code for modifications or derivative works we create based upon, incorporating or using the open source software and/or that we license such modifications or derivative works under the terms of the particular open source license. If an author or other third-party that distributes such open source software were to allege that we had not complied with the conditions of one or more of these licenses, we could be required to incur significant legal expenses defending against such allegations. If our defenses were not successful, we could be enjoined from the distribution of our products that contained the open source software and required to make the source code for the open source software available to others, to grant third parties certain rights of further use of our software or to remove the open source software from our products, which could disrupt the distribution and sale of some of our products. In addition, if we combine our proprietary software with open source software in a certain manner, under some open source licenses we could be required to release the source code of our proprietary software. If an author or other third-party that distributes open source software were to obtain a judgment against us based on allegations that we had not complied with the terms of any such open source licenses, we could also be subject to liability for copyright infringement damages and breach of contract for our past distribution of such open source software.
Our effective tax rate is difficult to project, and changes in such tax rate or adverse results of tax examinations could adversely affect our operating results.
We are currently unablea United States-based multinational company subject to accurately predict whattax in multiple U.S. and foreign tax jurisdictions. Our results of operations would be adversely affected to the extent that our long-term effectivegeographical mix of
income becomes more weighted toward jurisdictions with higher tax rates willand would be favorably affected to the extent the relative geographic mix shifts to lower tax jurisdictions. Any change in our mix of earnings is dependent upon many factors and is therefore difficult to predict.
The process of determining our anticipated tax liabilities involves many calculations and estimates that are inherently complex and make the future.
Furthermore, our overall effective income tax rate and tax expenses may be affected by various factors in determining our worldwide provision for income taxes, andbusiness, including changes in the ordinary course of business, there are many transactions and calculations where the ultimate tax determination is uncertain. Our long-term effective tax rates could be adversely affected byour legal structure, changes in the geographic mix of earnings in countries with differing statutory tax rates;income and expenses, changes in tax laws and applicable accounting pronouncements and variations in the estimated and actual level of annual profits before income tax. For example, our effective tax rate has benefited from an existing U.S. research and development tax credit. If this tax credit is not renewed for 2012 or in the future, we would expect our effective tax rate to increase.
We also determine the need to record deferred tax liabilities and the recoverability of deferred tax assets. A valuation allowance is established to the extent recovery of deferred tax assets and liabilities; changes in tax laws;is not likely based on our ability to utilize net operating loss carryforwards and research tax credit carryforwards;estimation of future taxable income and other factors. Our judgments may be subject to audits or reviews by local tax authoritiesfactors in each of these jurisdictions, which could adversely affect our income tax provisions.jurisdiction. As of March 31, 2011,2012, we had net deferred tax assets of approximately $33.8$38.6 million, which were primarily related to federal and state research tax credit carryforwards, stock-based compensation and foreign net operating loss carryforwards. Consequently, our cash tax rate will be significantly lower than our effective tax rate for the next 12 months.though fiscal 2013 and into fiscal 2014. However, we expect our cash taxes to continue to increase as our cash tax rate approaches our effective tax rate.
24
Our cash and cash equivalents are highly liquid investments with original maturities of three months or less at the time of purchase. We maintain the cash and cash equivalents with major financial institutions. Deposits with these banks exceed the Federal Deposit Insurance Corporation (“FDIC”) insurance limits or similar limits in foreign jurisdictions. While we monitor daily the cash balances in the operating accounts and adjust the balances as appropriate, these balances could be impacted if one or more of the financial institutions with which we deposit fails or is subject to other adverse conditions in the financial or credit markets. To date, we have experienced no loss or lack of access to our invested cash or cash equivalents; however, we can provide no assurance that access to our invested cash and cash equivalents will not be impacted by adverse conditions in the financial and credit markets.
We cannot predict our future capital needs and we may be unable to obtain additional financing, which could have a material adverse effect on our business, results of operations and financial condition.
We may need to raise additional funds in the future in order to acquire complementary businesses, technologies, products or services. Any required additional financing may not be available on terms acceptable to us, or at all. If we raise additional funds by issuing equity securities, you may experience significant dilution of your ownership interest, and the newly-issued securities may have rights senior to those of the holders of our common stock. If we raise additional funds by obtaining loans from third parties, the terms of those financing arrangements may include negative covenants or other restrictions on our business that could impair our operational flexibility, and would also require us to fund additional interest expense. If additional financing is not available when required or is not available on acceptable terms, we may be unable to successfully develop or enhance our software and services through acquisitions in order to take advantage of business opportunities or
respond to competitive pressures, which could have a material adverse effect on our software and services offerings, revenues, results of operations and financial condition. We have no plans, nor are we currently considering any proposals or arrangements, written or otherwise, to acquire a business, technology, product or service.
Risks Relating to Ownership of Our Common Stock
The price of our common stock may be highly volatile and may decline regardless of our operating performance.
The market price of our common stock could be subject to significant fluctuations in response to:
variations in our quarterly or annual operating results;
changes in financial estimates, treatment of our tax assets or liabilities or investment recommendations by securities analysts following our business or our competitors;
the public’s response to our press releases, rumors, our other public announcements and our filings with the SEC;
changes in accounting standards, policies, guidance or interpretations or principles;
sales of common stock by our directors, officers and significant stockholders;
announcements of technological innovations or enhanced or new products by us or our competitors;
our failure to achieve operating results consistent with securities analysts’ projections;
the operating and stock price performance of other companies that investors may deem comparable to us;
broad market and industry factors; and
other events or factors, including those resulting from war, incidents of terrorism or responses to such events.
25
Future sales of our common stock, or the perception that such future sales may occur, may cause our stock price to decline and impair our ability to obtain capital through future stock offerings.
A substantial number of shares of our common stock are available for sale into the public market. The occurrence of such sales, or the perception that such sales could occur, could materially and adversely affect our stock price and could impair our ability to obtain capital through an offering of equity securities.
Certain provisions in our charter documents and agreements and Delaware law, as well as our stockholder rights plan, may inhibit potential acquisition bids for CommVault and prevent changes in our management.
Our certificate of incorporation and bylaws contain provisions that could depress the trading price of our common stock by acting to discourage, delay or prevent a change of control of our company or changes in management that our stockholders might deem advantageous. Specific provisions in our certificate of incorporation include:
our ability to issue preferred stock with terms that the Board of Directors may determine, without stockholder approval;
a classified board in which only a third of the total board members will be elected at each annual stockholder meeting;
advance notice requirements for stockholder proposals and nominations; and
limitations on convening stockholder meetings.
In addition to the provision described above, on November 13, 2008, our Board of Directors adopted a stockholders rights plan and declared a dividend distribution of one Right for each outstanding share of our common stock to shareholders of record on November 24, 2008. Each Right, when exercisable, entitles the registered holder to purchase from us one one-thousandth of a share of Series A Junior Participating Preferred Stock, par value $0.01 per share, at a purchase price of $80 per one one-thousandth of a share, subject to adjustment. The Rights may discourage a third-party from making an unsolicited proposal to acquire us, as exercise of the Rights would cause substantial dilution to such third-party attempting to acquire us.
As a result of the provisions in our certificate of incorporation and our stockholder rights plan, the price investors may be willing to pay in the future for shares of our common stock may be limited.
Also, we are subject to Section 203 of the Delaware General Corporation Law, which imposes certain restrictions on mergers and other business combinations between us and any holder of 15% or more of our common stock. Further, certain of our employment agreements and incentive plans provide for vesting of stock options and/or payments to be made to the employees there under if their employment is terminated in connection with a change of control, which could discourage, delay or prevent a merger or acquisition at a premium price.
We do not expect to pay any dividends in the foreseeable future.
We do not anticipate paying any cash dividends to holders of our common stock in the foreseeable future. Consequently, investors must rely on sales of their common stock after price appreciation, which may never occur, as the only way to realize any future gains on their investment. Investors seeking cash dividends should not purchase our common stock.
26
Although we currently believe our internal control over financial reporting is effective, the year. Our continued compliance with Section 404 will requireeffectiveness of our internal controls in future periods is subject to the risk that we incur substantial expenses and expend significant management time on compliance related issues.our controls may become inadequate or may not operate effectively. In future years, if we fail to timely complete this assessment, or if E&Your auditors cannot timely attest, there may be a loss of public confidence in our internal controls, the market price of our stock could decline and we could be subject to regulatory sanctions or investigations by the NASDAQ Stock Market, the Securities and Exchange Commission or other regulatory authorities, which would require additional financial and management resources. In addition, any failure to implement required new or improved controls, or difficulties encountered in their implementation, could harm our operating results or cause us to fail to timely meet our regulatory reporting obligations.
During the past few years, our organizational structure has increased in complexity due to compliance with tax regulations and tax accounting requirements and other regulatory and compliance requirements, including compliance with anti-corruption and anti-bribery laws such as the U.S. Foreign Corrupt Practices Act (the “FCPA”) and the UK Bribery Act of 2010 (the “UK Bribery Act”). Further, we have expanded our presence in the Asia-Pacific region, where business practices can differ from those in other regions of the world and can create internal control risks. We provide business practices training to our employees worldwide. Overall, the combination of increased structural complexity and the ever-increasing regulatory complexity make it more critical for us to attract and retain qualified and technically competent employees.
Item 1B. | Unresolved Staff Comments |
None.
Our principal administrative, sales, marketing, customer support and research and development facility is located at our headquarters in Oceanport, New Jersey. We currently occupy approximately 162,000 square feet of office space in the Oceanport facility under the terms of an operating lease expiring in July 2015. We believe that our current facility is adequate to meet our needs for at least the next 12 months. We believe that suitable additional facilities will be available as needed on commercially reasonable terms. In addition, we have offices in the United States in Arizona, California, Colorado, Connecticut, Florida, Georgia, Illinois, Massachusetts, Minnesota, New York, North Carolina, Ohio, Oregon, Pennsylvania, Tennessee, Texas, Virginia and Washington; and outside the United States in Kanata, Ontario; Toronto, Ontario; Calgary, Alberta; Montreal, Quebec; Vancouver, British Columbia; Reading, United Kingdom; Oberhausen, Germany; Utrecht, Netherlands; Milan, Italy; Madrid, Spain; Dubai; Moscow, Russia; Johannesburg, South Africa; Riyadh, Saudi Arabia; Beijing, China; Shanghai, China; Guangzhou, China; Chengdu, China; Sydney, Australia; Melbourne, Australia; Canberra, Australia; Auckland, New Zealand; Tokyo, Japan; Singapore; Mexico City, Mexico; Kuala Lumpar, Malaysia; Bangkok, Thailand; Sao Paulo, Brazil; Seoul, South Korea; Mumbai, India; Bangalore, India and Hyderabad, India.
From time to time, we are subject to claims in legal proceedings arising in the normal course of our business. We do not believe that we are currently party to any pending legal action that could reasonably be expected to have a material adverse effect on our business or operating results.
Item 4. |
Not Applicable.
PART II
27
Market for our Common Stock
Our common stock is listed and traded on The NASDAQ Global Market under the symbol “CVLT.” The following table sets forth, for the periods indicated, the high and the low closing sales prices of our common stock, as reported on The NASDAQ Global Market.
| Common Stock | ||||||||||||||||
| 2012 | 2011 | |||||||||||||||
| High | Low | High | Low | |||||||||||||
First Quarter | $ | 44.45 | $ | 36.47 | $ | 23.96 | $ | 19.29 | ||||||||
Second Quarter | $ | 47.06 | $ | 31.22 | $ | 28.03 | $ | 17.80 | ||||||||
Third Quarter | $ | 50.54 | $ | 34.66 | $ | 31.41 | $ | 25.51 | ||||||||
Fourth Quarter | $ | 54.71 | $ | 42.93 | $ | 40.94 | $ | 28.93 | ||||||||
On April 30, 2012, the last reported sale price of our common stock as reported on The NASDAQ Global Market was $52.07 per share.
Stockholders
As of April 30, 2012, there were approximately 66 holders of our common stock. The number of record holders does not represent the actual number of beneficial owners of shares of our common stock because shares are frequently held in street name by securities dealers and others for the benefit of individual owners who have the right to vote their shares.
Dividend Policy
We have never paid cash dividends on our common stock, and we intend to retain our future earnings, if any, to fund the growth of our business. We therefore do not anticipate paying any cash dividends on our common stock in the foreseeable future. Our future decisions concerning the payment of dividends on our common stock will depend upon our results of operations, financial condition and capital expenditure plans, as well as any other factors that the Board of Directors, in its sole discretion, may consider relevant.
Stock Performance Graph
The graph set forth below compares the cumulative total stockholder return on our common stock between March 30, 2007 and March 30, 2012, with the cumulative total return of (i) The NASDAQ Computer Index and (ii) The NASDAQ Composite Index, over the same period. This graph assumes the investment of $100,000 on March 30, 2007 in our common stock, The NASDAQ Composite Index and The NASDAQ Computer Index, and assumes the reinvestment of dividends, if any. The graph assumes the initial value of our common stock on March 30, 2007 was the closing sales price of $16.20 per share.
The comparisons shown in the graph below are based upon historical data. The stock price performance shown in the graph below is not necessarily indicative of, nor is it intended to forecast, the future performance of our common stock. Information used in the graph was obtained from NASDAQ, a source we believe to be reliable, but we are not responsible for any errors or omissions in such information.
The performance graph shall not be deemed “filed” for purposes of Section 18 of the Exchange Act or otherwise subject to the liabilities under that Section, and shall not be deemed to be incorporated by reference into any filing of CommVault under the Securities Act or the Exchange Act.
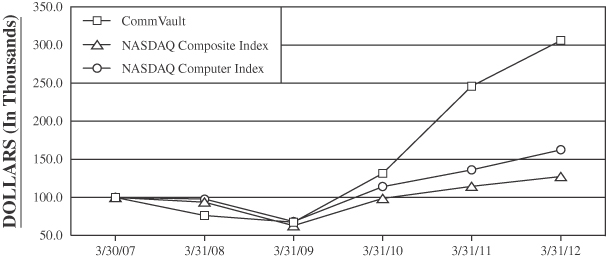
| 3/30/07 | 3/31/08 | 3/31/09 | 3/31/10 | 3/31/11 | 3/30/12 | |||||||||||||||||||
CommVault | 100.0 | 76.5 | 67.7 | 131.8 | 246.2 | 306.4 | ||||||||||||||||||
NASDAQ Composite Index | 100.0 | 94.1 | 63.1 | 99.0 | 114.8 | 127.7 | ||||||||||||||||||
NASDAQ Computer Index | 100.0 | 97.9 | 68.5 | 114.5 | 136.5 | 162.8 | ||||||||||||||||||
Issuer Purchases of Equity Securities
There were no repurchases of our common stock during the three months ended March 31, 2012. As of March 31, 2012, we have repurchased $117.2 million of common stock (5.7 million shares) out of the $170.0 million in total that is authorized under our stock repurchase program. As a result, we may repurchase an additional $52.8 million of our common stock under the current program through March 31, 2013.
28
| Selected Financial Data
The following selected financial data should be read in conjunction with our financial statements and related notes, “Risk Factors” and “Management’s Discussion and Analysis of Financial Condition and Results of Operations” included elsewhere in this Annual Report on Form 10-K. The selected statements of operations and the selected balance sheet data are derived from our audited financial statements. The historical results presented below are not necessarily indicative of the results to be expected in any future period.
You should read the following discussion and analysis along with our consolidated financial statements and the related notes included elsewhere in this Annual Report on Form 10-K. The statements in this discussion regarding our expectations of our future performance, liquidity and capital resources, and other non-historical statements are forward-looking statements. These forward-looking statements are subject to numerous risks and uncertainties, including, but not limited to, the risks and uncertainties described under “Risk Factors” and elsewhere in this Annual Report on Form 10-K. Our actual results may differ materially from those contained in or implied by any forward-looking statements. Overview We are a leading provider of data and information management software applications and related services in terms of product breadth and functionality and market penetration. We develop, market and sell a unified suite of data and information management software applications under the Simpana® brand. Our Simpana software is a platform with licensable modules that work together seamlessly, sharing a single code and common function set, to deliver Backup and Recovery, Archive, Replication, Search and Resource Management capabilities. With a single platform approach, Simpana is specifically designed to protect, manage and access data throughout its lifecycle in less time, at lower cost and with fewer resources than alternative solutions. Our products and capabilities enable our customers to deploy solutions for data protection, business continuance, corporate compliance and centralized management and reporting. We also provide our customers with a broad range of highly effective services that are delivered by our worldwide support and field operations. As of March 31, 2012, we had licensed our software applications to approximately 16,100 registered customers.
History and Background In early 2000, we launched CommVault Galaxy for backup and recovery, a storage industry award winner. In the years since, CommVault has forged numerous alliances with top software application and hardware vendors, such as Dell, HP, Hitachi Data Systems, Microsoft, Network Appliance, Fujitsu, Novell and Oracle, to enhance capabilities and to create a premiere suite of data and information management solutions. In 2002, we launched our single-platform technology that provides the foundation of our information management approach to storing, managing, and accessing data. Our Simpana software suite is comprised of the following five distinct data and information management software application modules: In In August 2010, our CommVault Simpana 9.0 software suite (“Simpana 9”) was made available for public release. We believe that Simpana 9, which builds on and significantly expands Simpana 8, allows customers to deploy a modern data management solution to achieve gains in efficiency, cost optimization and scale. We believe that Simpana 9 solves real-world IT challenges with major technology advancements, including increased virtualization scalability and performance, integrated source and target data deduplication, automatic and transparent integration with hardware array-based snapshots, as well as new tools that ease migration to our next generation Simpana 9 platform.
In January 2012, we released enhancements to our existing Simpana 9 software suite. These enhancements include new capabilities that converges backup, archive and reporting processes; additional SnapProtect technology that delivers hardware snapshot integration; enhancements to virtual server protection; new innovations to protect data on laptops and desktops with embedded source deduplication for optimized efficiency; and new integration with Microsoft SharePoint. Our software licenses typically provide for a perpetual right to use our software and are sold on a capacity basis, on a per-copy basis or as site licenses. During the fiscal year ended March 31, 2012, approximately 62% of software license transactions were sold on a capacity basis. Capacity based software licenses provide our customers with unlimited licenses of specified software products based on a defined level of terabytes of data under management. As a result, when we sell our platform through a capacity license, many of the various Simpana functionalities are bundled into one capacity based price. We The industry in which we currently operate Given the nature of the industry in which we operate, our software applications are subject to obsolescence. As noted above, we continually develop and introduce updates to our existing software applications in order to keep pace with evolving industry Sources of Revenues We derive a significant portion of our total revenues from sales of licenses of our software applications. We do not customize our software for a specific end-user customer. We sell our software applications to end-user customers both directly through our sales force and indirectly through our global network of value-added reseller partners, systems integrators, corporate resellers and original equipment manufacturers. Our software revenue was 2010. In recent fiscal years, we have generated approximately two-thirds of our software revenue from our existing customer base and approximately one-third of our software revenue from new customers. In addition, our total software revenue in any particular period is, to a certain extent, dependent upon our ability to generate revenues from large customer software deals, which we refer to as enterprise software transactions. We expect the number of enterprise software transactions (transactions greater than $0.1 million) and resulting software revenue to increase throughout fiscal 2010.
Software revenue generated through indirect distribution channels was We have a worldwide reseller and an original equipment agreement with Dell. Our reseller agreement with Dell provides them the right to market, resell and distribute certain of our products to their customers. Our original equipment manufacturer agreement with Dell is discussed more fully below. Sales through our agreements with Dell accounted for 22% of our total revenues for fiscal 2012, 23% of our total revenues for fiscal 2011 In May 2011, we announced that we entered into a global original equipment manufacturer agreement with NetApp under which NetApp will integrate elements of our Simpana 9 software suite with NetApp SnapShot™ and replication technology, under the NetApp SnapProtect® brand. During the fiscal year ended March 31, 2012, we did not recognize a material amount of revenue under our original equipment manufacturer agreement with NetApp. Overall, we have original equipment manufacturer agreements primarily with Dell, 2010. We also have non-exclusive distribution agreements covering our North American commercial markets and our U.S. Federal Government market with Arrow Enterprise Computing Solutions, Inc. (“Arrow”), a subsidiary of Arrow Electronics, Inc., and Avnet Technology Solutions (“Avnet”), a subsidiary of Avnet, Inc. Pursuant to these distribution agreements, these distributors’ primary role is to enable a more efficient and effective distribution channel for our products and services by managing our reseller partners and leveraging their own industry experience. Many of our North American resellers have been transitioned to either Arrow or Avnet. We generated approximately We also derive a significant portion of our total revenues from services revenue. Our services revenue is made up of fees from the delivery of customer support and other professional services, which are typically sold in connection with the sale of our software applications. Customer support agreements provide technical support and unspecified software updates on a when-and-if-available basis for an annual fee based on licenses purchased and the level of service subscribed. Other professional services include consulting, assessment and design services, implementation and post-deployment services and training, all of which to date have predominantly been sold in connection with the sale of software applications. Our services revenue was 2010. The gross margin of our services revenue was 75.3% for fiscal 2012, 76.6% for fiscal 2011 and 76.1% for fiscal
Description of Costs and Expenses Our cost of revenues is as follows:
Our operating expenses are as follows:
We anticipate that each of the above categories of operating expenses will increase in dollar amounts, but will decline as a percentage of total revenues in the long-term. Foreign Currency Exchange Rates’ Impact on Results of Operations Sales outside the United States were approximately 39% of our total revenue for fiscal 2012, 39% for fiscal 2011 and 38% for fiscal at the average exchange rates for each applicable month in a period. To the extent the U.S. dollar weakens against foreign currencies, the translation of these foreign currency denominated transactions generally results in increased revenue, operating expenses and income from operations for our non-U.S. operations. Similarly, our revenue, operating expenses and net income will generally decrease for our non-U.S. operations if the U.S. dollar strengthens against foreign currencies. Using the average foreign currency exchange rates from the corresponding fiscal 2011 period, our total revenues, cost of revenues and operating expenses from non-U.S. operations for fiscal 2012 would have been lower by approximately $6.4 million, $1.0 million and $3.5 million, respectively. Using the average foreign currency exchange rates from the corresponding fiscal 2010 period, our total revenues, cost of revenues and operating expenses from non-U.S. operations for fiscal 2011 would have been lower by approximately $0.6 million, $0.1 million and $0.3 million, respectively. In addition, we are exposed to risks of foreign currency fluctuation primarily from cash balances, accounts receivables and intercompany accounts denominated in foreign currencies and are subject to the resulting transaction gains and losses, which are recorded as a component of general and administrative expenses. We recognized net foreign currency transaction losses of 2010.
Critical Accounting Policies In presenting our consolidated financial statements in conformity with U.S. generally accepted accounting principles, we are required to make estimates and judgments that affect the amounts reported therein. Some of the estimates and assumptions we are required to make relate to matters that are inherently uncertain as they pertain to future events. We base these estimates on historical experience and on various other assumptions that we believe to be reasonable and appropriate. Actual results may differ significantly from these estimates. The following is a description of our accounting policies that we believe require subjective and complex judgments, which could potentially have a material effect on our reported financial condition or results of operations. Revenue Recognition Our revenue recognition policy is based on complex rules that require us to make significant judgments and estimates. In applying our revenue recognition policy, we must determine which portions of our revenue are recognized currently (generally software revenue) and which portions must be deferred and recognized in future periods (generally services revenue). We analyze various factors including, but not limited to, the sales of undelivered services when sold on a stand-alone basis, our pricing policies, the credit-worthiness of our customers and resellers, accounts receivable aging data and contractual terms and conditions in helping us to make such judgments about revenue recognition. Changes in judgment on any of these factors could materially impact the timing and amount of revenue recognized in a given period. Currently, we derive revenues from two primary sources. For sales arrangements involving multiple elements, we recognize revenue using the residual method. Under the residual method, we allocate and defer revenue for the undelivered elements based on Our software licenses typically provide for a perpetual right to use our software and are sold on a per-copy basis, on a capacity basis or as site licenses. Software licenses sold on a capacity basis provide the customer with unlimited licenses of specified software products based on a defined level of terabytes of data under management. Site licenses give the customer the additional right to deploy the software on a limited basis during a specified term. We recognize software revenue through direct sales channels upon receipt of a purchase order or other persuasive evidence and when the other three basic revenue recognition criteria are met as described in the revenue recognition section in Note 2 of our “Notes to Consolidated Financial Statements.”We recognize software revenue through all indirect sales channels on a sell-through model. A sell-through model requires that we recognize revenue when the basic revenue recognition criteria are met and these channels complete the sale of our software products to the end-user. Revenue from software licenses sold through an original equipment manufacturer partner is recognized upon the receipt of a royalty report or purchase order from that original equipment manufacturer partner. Services revenue includes revenue from customer support and other professional services. Customer support includes software updates on a when-and-if-available basis, telephone support, integrated web-based support and bug fixes or patches. Customer support revenue is recognized ratably over the term of the customer support agreement, which is typically one year. To determine the price for the customer support element when sold separately, we primarily use historical Our other professional services include consulting, assessment and design services, installation services and training. Other professional services provided by us are not mandatory and can also be performed by the customer or a third-party. In addition to a signed purchase order, our consulting, assessment and design services and installation services are, in some cases, evidenced by a Statement of Work, which defines the specific scope of the services to be performed when sold and performed on a stand-alone basis or included in multiple-element sales arrangements. Revenues from consulting, assessment and design services and installation services are based upon a daily, weekly or monthly rate and are recognized when the services are completed. Training includes courses taught by our instructors or third-party contractors either at one of our facilities or at the customer’s site. Training fees are recognized after the training course has been provided. Based on our analysis of such other professional services transactions sold on a stand-alone basis, we have concluded we have established VSOE for such other professional services when sold in connection with a multiple-element sales arrangement.
In summary, we have analyzed all of the undelivered elements included in our multiple-element sales arrangements and determined that we have VSOE of fair value to allocate revenues to services. Our analysis of the undelivered elements has provided us with results that are consistent with the estimates and assumptions used to determine the timing and amount of revenue recognized in our multiple-element sales arrangements. Accordingly, assuming all basic revenue recognition criteria are met, software revenue is recognized upon delivery of the software license using the residual method. We are not likely to materially change our pricing and discounting practices in the future. Our sales arrangements generally do not include acceptance clauses. However, if an arrangement does include an acceptance clause, we defer the revenue for such an arrangement and recognize it upon acceptance. Acceptance occurs upon the earliest of receipt of a written customer acceptance, waiver of customer acceptance or expiration of the acceptance period. Stock-Based Compensation As of March 31, 718. We estimated the fair value of stock options granted using the Black-Scholes formula. The fair value of restricted stock units awarded is determined based on the number of shares granted and the closing price of our common stock on the date of grant. Compensation for all share-based payment awards is recognized on a straight-line basis over the requisite service period of the awards, which is generally the vesting period. Forfeitures are estimated based on a historical analysis of our actual stock award forfeitures. The average expected life was determined according to the “simplified” method, which is the mid-point between the vesting date and the end of the contractual term. We The risk-free interest rate is determined by reference to U.S. Treasury yield curve rates with a remaining term equal to the expected life assumed at the date of grant. Expected volatility
The assumptions used in the Black-Scholes option-pricing model in the fiscal year ended March 31,
The weighted average fair value of stock options granted was 2011. As of March 31, We anticipate that future grants under our stock incentive plans will include both non-qualified stock options and restricted stock units. Accounting for Income Taxes As part of the process of preparing our financial statements, we are required to estimate our income taxes in each of the jurisdictions in which we operate. This process involves estimating our actual current tax exposure, including assessing the risks associated with tax audits, and assessing temporary differences resulting from different treatment of items for tax and accounting purposes. These differences result in deferred tax assets and liabilities. As of March 31, At March 31, At March 31, As of March 31, We conduct business globally and as a result, file income tax returns in the United States and in various state and foreign jurisdictions. In the normal course of business, we are subject to examination by taxing authorities throughout the world, including such major jurisdictions as the United States, Australia, Canada, Germany, Netherlands and United Kingdom. We are currently not under audit in any tax jurisdiction.
The following table summarizes the tax years in the major tax jurisdictions that remain subject to income tax examinations by tax authorities as of March 31,
Software Development Costs Research and development expenditures are charged to operations as incurred. Based on our software development process, technological feasibility is established upon completion of a working model, which also requires certification and extensive testing. Costs incurred by us between completion of the working model and the point at which the product is ready for general release are immaterial. Results of Operations The following table sets forth each of our sources of revenues and costs of revenues for the specified periods as a percentage of our total revenues for those periods:
Fiscal year ended March 31, 2012 compared to fiscal year ended March 31, 2011 Revenues Total revenues increased $91.9 million, or 29%, from $314.8 million in fiscal 2011 to $406.6 million in fiscal 2012. Software Revenue. Software revenue increased $52.0 million, or 35%, from $149.8 million in fiscal 2011 to $201.8 million in fiscal 2012. Software revenue represented 50% of our total revenues in fiscal 2012 compared to 48% in fiscal 2011. The overall increase in software revenue was primarily driven by higher enterprise software transactions (transactions greater than $0.1 million), which increased by $33.1 million in fiscal 2012 compared to fiscal 2011. As a result, enterprise software transactions represented approximately 52% of our software revenue in fiscal 2012 and approximately 48% of our software revenue in fiscal 2011. The increase in enterprise software transactions is due to both a 37% increase in the number of transactions of this type and an 7% increase in the average dollar amount of such transactions. The average dollar amount of enterprise transactions was approximately $241,000 in fiscal 2012 and approximately $226,000 in fiscal 2011. Software revenue derived from transactions less than $0.1 million increased $18.9 million, or 24%, in fiscal 2012 compared to fiscal 2011. Software revenue derived from the United States in fiscal 2012 increased 40% compared to fiscal 2011 and software revenue derived from our international operations in fiscal 2012 increased 28% compared to fiscal 2011. The growth in software revenue in our international locations is primarily due to increases in Europe, Australia and Canada as we expand our international operations. Software revenue derived from our indirect distribution channel (resellers and original equipment manufacturers) increased $44.0 million in fiscal 2012 compared to fiscal 2011, and software revenue through our direct sales force increased $8.0 million in fiscal 2012 compared to fiscal 2011. The increase in the dollar value of the software revenue through our indirect distribution channel is primarily due to the increase in software revenue generated in foreign locations, which is substantially sold through our channel partners. The increase in the dollar value of the software revenue through our direct sales channel is primarily due certain of our enterprise software transactions in the United States in the first quarter and fourth quarter of fiscal 2012 being sold through our direct sales channel. Software revenue that is derived from both our indirect channel partners and direct sales force are key attributes to our long-term growth strategy. We will continue to invest in both our channel relationships and direct sales force in the future, but we continue to expect more revenue to be generated through indirect distribution channels over the long term as more fully discussed above in the“Sources of Revenue” section. Services Revenue. Services revenue increased $39.9 million, or 24%, from $165.0 million in fiscal 2011 to $204.8 million in fiscal 2012. Services revenue represented 50% of our total revenues in fiscal 2012 compared to 52% in fiscal 2011. The increase in services revenue is primarily due to a $31.8 million increase in revenue from customer support agreements as a result of software sales to new customers and renewal agreements with our installed software base. Cost of Revenues Total cost of revenues increased $12.4 million, or 30%, from $41.0 million in fiscal 2011 to $53.4 million in fiscal 2012. Total cost of revenues represented 13% of our total revenues in both fiscal 2012 and fiscal 2011. Cost of Software Revenue. Cost of software revenue increased approximately $0.4 million, or 16%, from $2.4 million in fiscal 2011 to $2.7 million in fiscal 2012. Cost of software revenue represented 1% of our total software revenue in fiscal 2012 and 2% of our total software revenue in fiscal 2011. The increase in cost of software revenue is primarily due to higher third party royalty costs associated with our Simpana software suite in fiscal 2012 compared to fiscal 2011. Cost of Services Revenue. Cost of services revenue increased $12.0 million, or 31%, from $38.6 million in fiscal 2011 to $50.7 million in fiscal 2012. Cost of services revenue represented 25% of our services revenue in fiscal 2012 compared to 23% in fiscal 2011. The increase in the cost of services as a percentage of total services revenue in fiscal 2012 compared to fiscal 2011 was primarily due to a higher percentage of our services revenue being derived from professional services engagements as well as higher costs of services associated with the expansion of our worldwide customer support operations. The increase in the dollar amount of cost of services revenue is primarily the result of higher employee compensation and travel expenses totaling approximately $5.6 million as well as a $3.6 million increase in third-party outsourcing costs to facilitate our services revenue growth. Operating Expenses Sales and Marketing. Sales and marketing expenses increased $56.0 million, or 34%, from $163.1 million in fiscal 2011 to $219.0 million in fiscal 2012. The increase is primarily due to a $42.7 million increase in employee compensation and related expenses attributable to the expansion of our sales force from the prior year as well as higher commissions expense due to record revenues and higher headcount. The increase in sales and marketing expenses also includes $3.0 million in higher travel and related expenses due to the expansion of our sales force, a $2.8 million increase in stock-based compensation expenses and a $2.1 million increase in advertising and marketing related expenses as we continue to build brand awareness for our Simpana software products. Sales and marketing expenses as a percentage of total revenues increased to 54% in fiscal 2012 compared to 52% in fiscal 2011. Research and Development. Research and development expenses increased $3.0 million, or 8%, from $37.0 million in fiscal 2011 to $39.9 million in fiscal 2012. The increase is primarily due to higher salary and related expenses resulting from the expansion of our engineering group and higher fiscal 2012 bonus expense totaling approximately $2.8 million. Research and development expenses as a percentage of total revenues decreased to 10% in fiscal 2012 from 12% in fiscal 2011. Investing in research and development has been a priority for CommVault, and we anticipate continued spending related to the development of our data and information management software applications. General and Administrative. General and administrative expenses increased $6.4 million, or 19%, from $34.2 million in fiscal 2011 to $40.6 million in fiscal 2012. This increase is primarily due to a $3.7 million increase in employee and related compensation due to higher headcount and higher fiscal 2012 bonus expense as well as a $2.2 million increase in stock-based compensation expenses. These increases were partially offset by lower net foreign currency transaction losses of $0.4 million. General and administrative expenses in fiscal 2012 includes $0.2 million of net foreign currency transaction losses compared to $0.6 million of net foreign currency transaction losses recognized in general and administrative expenses in fiscal 2011. General and administrative expenses as a percentage of total revenues decreased to 10% in fiscal 2012 from 11% in fiscal 2011. Depreciation and Amortization. Depreciation expense increased $0.6 million, from $3.8 million in fiscal 2011 to $4.4 million in fiscal 2012. This reflects higher depreciation associated with increased capital expenditures primarily over the past 12 months as we expand our worldwide operations. Interest Income Interest income increased $0.1 million, from $0.7 million in fiscal 2011 to $0.8 million in fiscal 2012. The increase in interest income is primarily due to higher balances in our cash and related investment accounts. Income Tax Expense Income tax expense was $18.1 million in fiscal 2012 compared to $15.3 million in fiscal 2011. The effective tax rate in fiscal 2012 was 36% as compared to 42% in fiscal 2011. In fiscal 2012, the effective rate is higher than the expected federal statutory rate of 35% primarily due to state income taxes and permanent differences in both the United States and foreign jurisdictions, partially offset by income tax benefits from recording research and foreign tax credits; domestic production activities deductions; reversing $1.6 million of our valuation allowance against certain state research tax credits due to the passage of state laws in New Jersey as well as reversing $0.5 million of certain tax reserves as a result of the expiration of a statute of limitations in a foreign jurisdiction. In fiscal 2011, the effective rate is higher than the expected federal statutory rate of 35% primarily due to recording a valuation allowance against certain state research tax credits as well as the impact of state income taxes and permanent differences in both the United States and foreign jurisdictions. These items were partially offset by the reversal of certain tax reserves as a result of the expiration of a statute of limitations in a foreign jurisdiction as well as recording additional research tax credits. Fiscal year ended March 31, 2011 compared to fiscal year ended March 31, 2010 Revenues Total revenues increased $43.8 million, or 16%, from $271.0 million in fiscal 2010 to $314.8 million in fiscal 2011. Software Revenue.Software revenue increased $15.3 million, or 11%, from $134.5 million in fiscal 2010 to $149.8 million in fiscal 2011. Software revenue represented 48% of our total revenues in fiscal 2011 compared to 50% in fiscal 2010. The increase in software revenue is primarily due to increased software revenue derived from our foreign locations, which increased 18% while software revenue derived from the United States grew 7% in fiscal 2011 compared to fiscal 2010. The growth in software revenue in foreign locations is primarily due to increases in Europe, Canada, Australia and Asia as we expand our international operations. Software revenue derived from enterprise software transactions (transactions greater than $0.1 million) increased by $9.0 million, or 14%, in fiscal 2011 compared to fiscal 2010. As a result, software revenue derived from enterprise software transactions represented approximately 48% of our software revenue in fiscal 2011 and approximately 47% of our software revenue in fiscal 2010. The increase in software revenue derived from enterprise transactions is primarily due to an 18% increase in the number of transactions of this type. The average dollar amount of such transactions was approximately $226,000 in fiscal 2011 and was approximately $233,000 in fiscal 2010. Software revenue derived from transactions less than $0.1 million increased $6.3 million, or 9% in fiscal 2011 compared to fiscal 2010.
Software revenue derived from our indirect distribution channel (resellers and original equipment manufacturers) increased $12.2 million in fiscal 2011 compared to fiscal 2010, and software revenue through our direct sales force increased $3.1 million in fiscal 2011 compared to fiscal 2010. The increase in the dollar value of the software revenue through our indirect distribution channel is primarily due to the higher growth percentage of software generated in foreign locations, which is substantially sold through our channel partners. Software revenue that is derived from both our indirect channel partners and direct sales force are key attributes to our long-term growth strategy. We will continue to invest in both our channel relationships and direct sales force in the future, but we continue to expect more revenue to be generated through indirect distribution channels over the long term as more fully discussed above in the“Sources of Revenue”section. Services Revenue.Services revenue increased $28.5 million, or 21%, from $136.5 million in fiscal 2010 to $165.0 million in fiscal 2011. Services revenue represented 52% of our total revenues in fiscal 2011 compared to 50% in fiscal 2010. The increase in services revenue is primarily due to a $24.7 million increase in revenue from customer support agreements as a result of software sales to new customers and renewal agreements with our installed software base. Cost of Revenues Total cost of revenues increased $5.4 million, or 15%, from $35.6 million in fiscal 2010 to $41.0 million in fiscal 2011. Total cost of revenues represented 13% of our total revenues in both fiscal 2011 and fiscal 2010. Cost of Software Revenue.Cost of software revenue decreased approximately $0.6 million, or 21%, from $3.0 million in fiscal 2010 to $2.4 million in fiscal 2011. Cost of software revenue represented 2% of our total software revenue in both fiscal 2011 and 2010. The decrease in cost of software revenue is primarily due to lower distribution and third-party media costs related to our Simpana software suite in fiscal 2011 compared to fiscal 2010. Cost of Services Revenue.Cost of services revenue increased $6.0 million, or 18%, from $32.6 million in fiscal 2010 to $38.6 million in fiscal 2011. Cost of services revenue represented 23% of our services revenue in fiscal 2011 compared to 24% in fiscal 2010. The increase in cost of services revenue is primarily the result of higher employee compensation and travel expenses totaling approximately $4.2 million. Operating Expenses Sales and Marketing.Sales and marketing expenses increased $26.3 million, or 19%, from $136.8 million in fiscal 2010 to $163.1 million in fiscal 2011. The increase is primarily due to a Research and Development.Research and development expenses increased $3.5 million, or 11%, from $33.4 million in fiscal 2010 to $37.0 million in fiscal 2011. The increase is primarily due to General and Administrative.General and administrative expenses increased $4.4 million, or 15%, from $29.8 million in fiscal 2010 to $34.2 million in fiscal 2011. This increase is primarily due to $1.9 million of higher employee compensation due to higher headcount and higher fiscal 2011 bonuses, a $0.9 million increase in stock-based compensation expense and a $0.4 million increase in legal fees. General and administrative expenses as a percentage of total revenues were relatively flat at 11% in both fiscal 2011 and 2010.
Depreciation and Amortization.Depreciation expense increased $0.3 million, from $3.5 million in fiscal 2010 to $3.8 million in fiscal 2011. This reflects higher depreciation associated with increase capital expenditures primarily for product development and other computer-related equipment. Interest Income Interest income increased $0.3 million, from $0.4 million in fiscal 2010 to $0.7 million in fiscal 2011. The increase in interest income is primarily due to higher balances in our cash and related investment accounts. Income Tax Expense Income tax expense was $15.3 million in fiscal 2011 compared to $13.7 million in fiscal 2010. The effective tax rate in fiscal 2011 was 42% as compared to 43% in fiscal 2010. In fiscal 2011, the effective rate is higher than the expected federal statutory rate of 35% primarily due to recording a valuation allowance against certain state research tax credits as well as the impact of state income taxes and permanent differences in both the United States and foreign jurisdictions. These items were partially offset by the reversal of certain tax reserves as a result of the expiration of a statute of limitations in a foreign jurisdiction as well as recording additional research tax credits. In fiscal 2010, the effective rate is higher than the expected federal statutory rate of 35% primarily due to state income taxes, adjustments to foreign tax credits and permanent differences in both the United States and foreign jurisdictions, partially offset by recording additional research tax credits.
Liquidity and Capital Resources As of March 31, As of March 31, As of March 31 2013. The primary business reason for our stock repurchase program is to reduce the dilutive impact on our common shares outstanding associated with stock option exercises and our previous public and private stock offerings. Under our stock repurchase program, we have bought back approximately
Our summarized annual cash flow information is as follows (in thousands):
Net cash provided by operating activities was $100.0 million in fiscal 2012, $52.4 million in fiscal 2011 and $57.2 million in fiscal Net cash provided by (used in) investing activities was ($7.8) million in fiscal 2012, less than $0.1 million in fiscal 2011 and ($8.4) million in fiscal million. Net cash provided by (used in) financing activities was A summary of the cash used for the stock repurchase program consists of the following:
Working capital increased $42.9 million from $179.4 million as of March 31, 2011 to $222.3 million as of March 31, 2012. The increase in working capital is primarily due to an $81.9 million increase in cash and short-term investments. These increases were partially offset by a $27.1 million increase in deferred revenue, a $12.4 million increase in accrued liabilities and a $6.1 million decrease in accounts receivable. The increase in cash and short-term investments is primarily due to net income generated during the period, cash received from the collection of account receivables and cash received from the exercise of stock options, partially offset by cash used to repurchase common stock during fiscal 2012. The increase in deferred revenue is primarily due to higher deferred services revenue from customer support agreements from software sales to new customers and renewal agreements with our installed software base. The increase in accrued expenses is primarily due to higher employee and related compensation accruals and the decrease in accounts receivable is primarily due to strong collections efforts and timing of cash receipts. Working capital increased $36.2 million from $143.2 million as of March 31, 2010 to $179.4 million as of March 31, 2011. The increase in working capital is primarily due to a $47.7 million increase in cash and cash equivalents and a $15.8 million increase in accounts receivable, partially offset by a $15.1 million increase in deferred revenue, a $7.7 million increase in accrued liabilities and a $4.7 million decrease in net deferred tax assets. The increase in cash and cash equivalents is primarily due to net income generated during the period, cash received from the exercise of stock options and the increase in deferred revenue, partially offset by cash used to repurchase approximately 1.6 million shares of our common stock under our share repurchase program. In July 2009, we entered into an amended and restated credit facility in which we could borrow up to $30.0 million restated credit facility.
We believe that our existing cash, cash equivalents and our cash from operations Summary Disclosures about Contractual Obligations and Commercial Commitments Our material capital commitments consist of obligations under facilities and operating leases. Some of these leases have free or escalating rent payment provisions. We recognize rent expense under leases on a straight-line basis. We anticipate that we will experience an increase in our capital expenditures and lease commitments name. The following table summarizes our obligations as of March 31,
We generally do not enter into binding purchase obligations. The purchase obligations above relate primarily to software licensing and IT infrastructure costs. The contractual obligations table above excludes unrecognized tax benefits recorded in Other Liabilities totaling 2012. As of March 31, 2012, we have an outstanding letter of credit for $0.1 million issued in connection with a revenue transaction. This letter of credit will remain outstanding until September 30, 2012. We have certain software royalty commitments associated with the shipment and licensing of certain products. Royalty expense is generally based on 2010. We offer a 90-day limited product warranty for our software. To date, costs relating to this product warranty have not been material. Off-Balance Sheet Arrangements As of March 31, Indemnifications Certain of our software licensing agreements contain certain provisions that indemnify our customers from any claim, suit or proceeding arising from alleged or actual intellectual property infringement. These provisions continue in perpetuity along with our software licensing agreements. We have never incurred a liability relating to one of these indemnification provisions in the past and we believe that the likelihood of any future payout relating to these provisions is remote. Therefore, we have not recorded a liability during any period related to these indemnification provisions.
Impact of Recently Issued Accounting Standards In statements.
Interest Rate Risk As of March 31, In July 2009, we entered into an amended and restated credit facility in which we risk. Foreign Currency Risk Economic Exposure As a global company, we face exposure to adverse movements in foreign currency exchange rates. Our international sales are generally denominated in foreign currencies, and this revenue could be materially affected by currency fluctuations. Approximately 39% of our sales were outside the United States in both fiscal We estimate that a 10% change in all foreign exchange rates would impact our reported operating profit by approximately
Transaction Exposure Our exposure to foreign currency transaction gains and losses is primarily the result of certain net receivables due from our foreign subsidiaries and customers being denominated in currencies other than the functional currency of the subsidiary. Our foreign subsidiaries conduct their businesses in local currency and we generally do not maintain excess U.S. dollar cash balances in foreign accounts. Foreign currency transaction gains and losses are recorded in “General and administrative expenses” in the Consolidated Statements of Income. We recognized net foreign currency transaction To date, we have selectively hedged our exposure to foreign currency transaction gains and losses on the balance sheet through the use of forward contracts, which were not designated as hedging instruments. The duration of forward contracts utilized for hedging our balance sheet exposure is
CommVault Systems, Inc. Consolidated Financial Statements Fiscal Years Ended March 31, 2012, 2011
Report of Independent Registered Public Accounting Firm The Board of Directors and Stockholders of CommVault Systems, Inc. We have audited the accompanying consolidated balance sheets of CommVault Systems, Inc. as of March 31, We conducted our audits in accordance with the standards of the Public Accounting Oversight Board (United States). Those standards require that we plan and perform the audit to obtain reasonable assurance about whether the financial statements are free of material misstatement. An audit includes examining, on a test basis, evidence supporting the amounts and disclosures in the financial statements. An audit also includes assessing the accounting principles used and significant estimates made by management, as well as evaluating the overall financial statement presentation. We believe that our audits provide a reasonable basis for our opinion. In our opinion, the financial statements referred to above present fairly, in all material respects, the consolidated financial position of CommVault Systems, Inc. at March 31, We also have audited, in accordance with the standards of the Public Company Accounting Oversight Board (United States), CommVault Systems, Inc.’s internal control over financial reporting as of March 31, /s/ Ernst & Young LLP MetroPark, New Jersey May 15, 2012
Consolidated Balance Sheets (In thousands, except per share data)
Consolidated Statements of Income (In thousands, except per share data)
Consolidated Statements of Stockholders’ Equity (In thousands)
Consolidated Statements of Cash Flows (In thousands)
Notes to Consolidated Financial Statements (In thousands, except per share data)
CommVault Systems, Inc. and its subsidiaries (“CommVault” or the “Company”) is a leading provider of data and information management software applications and related services. The Company develops, markets and sells a suite of software applications and services, primarily in North America, Europe, Australia and Asia, that provides its customers with high-performance data protection; data migration and archiving; snapshot management and replication of data; integrated source and target deduplication; e-discovery and compliance solutions; protection, recovery and discovery of data in virtual server environments; enterprise-wide search capabilities; and management and operational reports, remote services and troubleshooting tools. The Company’s unified suite of data and information management software applications, which is sold under the Simpana brand, shares an underlying architecture that has been developed to minimize the cost and complexity of managing data on globally distributed and networked storage infrastructures. The Company also provides its customers with a broad range of professional and customer support services.
Basis of Presentation The consolidated financial statements include the accounts of the Company. All intercompany transactions and balances have been eliminated. Use of Estimates The preparation of financial statements and related disclosures in conformity with U.S. GAAP requires management to make judgments and estimates that affect the amounts reported in the Company’s consolidated financial statements and the accompanying notes. The Company bases its estimates and judgments on historical experience and on various other assumptions that it believes are reasonable under the circumstances. The amounts of assets and liabilities reported in the Company’s balance sheets and the amounts of revenues and expenses reported for each of its periods presented are affected by estimates and assumptions, which are used for, but not limited to, the accounting for revenue recognition, allowance for doubtful accounts, income taxes and related reserves, stock-based compensation and accounting for research and development costs. Actual results could differ from those estimates. Revenue Recognition The Company derives revenues from two primary sources. For sales arrangements involving multiple elements, the Company recognizes revenue using the residual method. Under the residual method, the Company allocates and defers revenue for the undelivered elements based on The Company’s software licenses typically provide for a perpetual right to use the Company’s software and are sold on a per-copy basis, on a capacity basis or as site licenses. Software licenses sold on a capacity basis provide the customer with unlimited licenses of specified software products based on a defined level of terabytes CommVault Systems, Inc. Notes to Consolidated Financial Statements — (Continued) (In thousands, except per share data) of data under management. Site licenses give the customer the additional right to deploy the software on a limited basis during a specified term. The Company recognizes software revenue through direct sales channels upon receipt of a purchase order or other persuasive evidence and when all other basic revenue recognition criteria are met as described below. The Company recognizes software revenue through all indirect sales channels on a sell-through model. A sell-through model requires that the Company recognize revenue when the basic revenue recognition criteria are met as described below and these channels complete the sale of the Company’s software products to the end-user. Revenue from software licenses sold through an original equipment manufacturer partner is recognized upon the receipt of a royalty report or purchase order from that original equipment manufacturer partner.
Services revenue includes revenue from customer support and other professional services. Customer support includes software updates on a when-and-if-available basis, telephone support, integrated web-based support and bug fixes or patches. Customer support revenue is recognized ratably over the term of the customer support agreement, which is typically one year. To determine the price for the customer support element when sold separately, the Company primarily uses historical The Company’s determination of fair value for customer support has not changed for the periods presented. The Company’s other professional services include consulting, assessment and design services, installation services and training. Other professional services provided by the Company are not mandatory and can also be performed by the customer or a third-party. In addition to a signed purchase order, the Company’s consulting, assessment and design services and installation services are, in some cases, evidenced by a Statement of Work, which defines the specific scope of such services to be performed when sold and performed on a stand-alone basis or included in multiple-element sales arrangements. Revenues from consulting, assessment and design services and installation services are based upon a daily or weekly rate and are recognized when the services are completed. Training includes courses taught by the Company’s instructors or third-party contractors either at one of the Company’s facilities or at the customer’s site. Training fees are recognized after the training course has been provided. Based on the Company’s analysis of such other professional services transactions sold on a stand-alone basis, the Company has concluded it has established VSOE for such other professional services when sold in connection with a multiple-element sales arrangement. The Company generally performs its other professional services within 90 days of entering into an agreement. The The Company has analyzed all of the undelivered elements included in its multiple-element sales arrangements and determined that VSOE of fair value exists to allocate revenues to services. Accordingly, assuming all basic revenue recognition criteria are met, software revenue is recognized upon delivery of the software license using the residual method. The Company considers the four basic revenue recognition criteria for each of the elements as follows:
CommVault Systems, Inc. Notes to Consolidated Financial Statements — (Continued) (In thousands, except per share data)
The Company’s sales arrangements generally do not include acceptance clauses. However, if an arrangement does include an acceptance clause, revenue for such an arrangement is deferred and recognized upon acceptance. Acceptance occurs upon the earliest of receipt of a written customer acceptance, waiver of customer acceptance or expiration of the acceptance period. Net Income per Common Share Basic net income per common share is computed by dividing net income by the weighted average number of common shares during the period. Diluted net income per share is computed using the weighted average number of common shares and, if dilutive, potential common shares outstanding during the period. Potential common shares consist of the incremental common shares issuable upon the exercise of stock options and the vesting of restricted stock units. The dilutive effect of such potential common shares is reflected in diluted earnings per share by application of the treasury stock method. The following table sets forth the computation of basic and diluted net income per common share:
CommVault Systems, Inc. Notes to Consolidated Financial Statements — (Continued) (In thousands, except per share data) The following table summarizes the potential outstanding common stock equivalents of the Company at the end of each period, which
Software Development Costs Research and development expenditures are charged to operations as incurred. Based on the Company’s software development process, technological feasibility is established upon completion of a working model, which also requires certification and extensive testing. Costs incurred by the Company between completion of the working model and the point at which the product is ready for general release are immaterial. Accounts Receivable and Allowance for Doubtful Accounts Accounts receivable consist of amounts due to the Company from normal business activities. The Company maintains an allowance for estimated losses resulting from the inability of its customers to make required payments. The Company estimates uncollectible amounts based upon historical bad debts, evaluation of current customer receivable balances, age of customer receivable balances, the customer’s financial condition and current economic trends.
Accounting for Income Taxes As part of the process of preparing financial statements, the Company is required to estimate its income taxes in each of the jurisdictions in which it operates. This process involves estimating actual current tax exposure, including assessing the risks associated with tax audits, and assessing temporary differences resulting from different treatment of items for tax and accounting purposes. These differences result in deferred tax assets and liabilities. As of March 31, The Company based its valuation allowance on its estimates of taxable income by legal entity and the period over which its state research tax credits will be recoverable. The calculation of the Company’s tax liabilities involves dealing with uncertainties in the application of complex tax regulations in each of its tax jurisdictions. The number of years with open tax audits varies depending on the tax jurisdiction. A number of years may lapse before a particular matter is audited and finally resolved. CommVault Systems, Inc. Notes to Consolidated Financial Statements — (Continued) (In thousands, except per share data) As of March 31, Cash and Cash Equivalents The Company considers all highly liquid investments purchased with maturities of three months or less at the date of purchase to be cash equivalents. As of March 31, Concentration of Credit Risk The Company grants credit to customers in a wide variety of industries worldwide and generally does not require collateral. Credit losses relating to these customers have been minimal. Sales through the Company’s reseller and original equipment manufacturer agreements with Dell totaled approximately Fair Value of Financial Instruments The carrying amounts of the Company’s cash and cash equivalents, accounts receivable and accounts payable approximate their fair values due to the short-term maturity of these instruments. As of March 31,
Fair value is defined as the exchange price that would be received for an asset or paid to transfer a liability (an exit price) in the principal or most advantageous market for such asset or liability in an orderly transaction between market participants on the measurement date. Valuation techniques used to measure fair value should maximize the use of observable inputs and minimize the use of unobservable inputs. To measure fair value, the Company uses the following fair value hierarchy based on three levels of inputs, of which the first two are considered observable and the last unobservable: Level 1 — Quoted prices in active markets for identical assets or liabilities. Level 2 — Inputs other than Level 1 that are observable for the asset or liability, either directly or indirectly, such as quoted prices for similar assets and liabilities in active markets; quoted prices for identical or similar assets or liabilities in markets that are not active; or other inputs that are observable or can be corroborated by observable market data by correlation or other means. Level 3 — Unobservable inputs that are supported by little or no market activity and that are significant to the fair value of the assets or liabilities. CommVault Systems, Inc. Notes to Consolidated Financial Statements — (Continued) (In thousands, except per share data) The following table summarizes the composition of the Company’s financial assets measured at fair value on a recurring basis at March 31,
2011:
All of the Company’s financial instruments in the table above were classified and measured as Level 1 instruments. Property and Equipment Property and equipment are stated at cost, less accumulated depreciation and amortization. The Company provides for depreciation on a straight-line basis over the estimated useful lives of the assets. Computer and related equipment is generally depreciated over eighteen months to three years and furniture and fixtures are generally depreciated over three to five years. Leasehold improvements are amortized over the shorter of the useful life of the improvement or the term of the related lease. Expenditures for routine maintenance and repairs are charged against operations. Major replacements, improvements and additions are capitalized. Asset Retirement Obligation A liability for the fair value of an asset retirement obligation and corresponding increase to the carrying value of the related leasehold improvements are recorded at the time leasehold improvements are acquired. As of March 31, 2012, the Company maintains office space in the United Kingdom for which the lease agreement requires that the Company return the office space to its original condition upon vacating the premises. Accordingly, the balance of the asset retirement obligation as of March 31, 2012 is $552. Long-Lived Assets The Company reviews its long-lived assets for impairment whenever events or changes in circumstances indicate that the carrying amount of the assets may not be fully recoverable. To determine the recoverability of its long-lived assets, the Company evaluates the estimated future undiscounted cash flows that are directly associated with, and that are expected to arise as a direct result of, the use and eventual disposition of the long-lived asset. If the estimated future undiscounted cash flows demonstrate that recoverability is not probable, an impairment loss would be recognized. An impairment loss would be calculated based on the excess carrying amount of the long-lived asset over the long-lived asset’s fair value. The fair value is determined based on valuation techniques such as a comparison to fair values of similar assets. There were no impairment charges recognized during the years ended March 31, 2012, 2011 2010. Deferred Revenue Deferred revenues represent amounts collected from, or invoiced to, customers in excess of revenues recognized. This results primarily from the billing of annual customer support agreements, as well as billings for other professional services fees that have not yet been performed by the Company and billings for license fees that are deferred due to
CommVault Systems, Inc. Notes to Consolidated Financial Statements — (Continued) (In thousands, except per share data) Deferred revenue consists of the following:
Accounting for Stock-Based Compensation The Company utilizes the Black-Scholes pricing model to determine the fair value of non-qualified stock options on the dates of grant. Restricted stock units are measured based on the fair market The Company classifies benefits of tax deductions in excess of the compensation cost recognized (excess tax benefits) as a financing item cash inflow with a corresponding operating cash outflow. For the years ended March 31, 2012, 2011 Share Repurchases The Company considers all shares repurchased as cancelled shares restored to the status of authorized but unissued shares on the trade date. The aggregate purchase price of the shares of the Company’s common stock repurchased is reflected as a reduction to Stockholders’ Equity. The Company accounts for shares repurchased as an adjustment to common stock (at par value) with the excess repurchase price allocated between Additional Paid-in Capital and Accumulated Deficit. As a result of the Company’s stock repurchases in the fiscal years ended March 31, Sales Tax The Company records revenue net of sales tax. Advertising Costs The Company expenses advertising costs as incurred. Advertising expenses were $4,582, $3,819, Shipping and Handling Costs Shipping and handling costs are included in cost of revenues for all periods presented. CommVault Systems, Inc. Notes to Consolidated Financial Statements — (Continued) (In thousands, except per share data) Foreign Currency Translation The functional currencies of the Company’s foreign operations are deemed to be the local country’s currency. Assets and liabilities of the Company’s international subsidiaries are translated at their respective period-end exchange rates, and revenues and expenses are translated at average currency exchange rates for the period. The resulting balance sheet translation adjustments are included in Other Comprehensive Income (Loss) and are reflected as a separate component of Stockholders’ Equity.
Foreign currency transaction gains and losses are recorded in “General and administrative expenses” in the Consolidated Statements of Income. The Company recognized net foreign currency transaction losses of $232 in the year ending March 31, 2012, net foreign currency transaction losses of $623 in the year ending March 31, 2011, and net foreign currency transaction losses of $647 in the year ending March 31, To date, the Company has selectively hedged its exposure to foreign currency transaction gains and losses on the balance sheet through the use of forward contracts, which were not designated as hedging instruments. The duration of forward contracts utilized for hedging the Company’s balance sheet exposure is Comprehensive Income Comprehensive income is defined to include all changes in equity, except those resulting from investments by stockholders and distribution to stockholders. Comprehensive income for the fiscal years ending March 31, 2012, 2011
Impact of Recently Issued Accounting Standards In Accumulated Other Comprehensive Income
CommVault Systems, Inc. Notes to Consolidated Financial Statements — (Continued) (In thousands, except per share data) (“ASU 2011-12”), to defer the effective date of the specific requirement to present items that are reclassified out of accumulated other comprehensive income to net income alongside their respective components of net income and other comprehensive income. All other provisions of this update are effective for the Company in the first quarter of fiscal 2013. The Company does not believe the adoption of this new guidance will have a significant impact on its consolidated financial statements.
Property and equipment consist of the following:
The Company recorded depreciation and amortization expense of $4,484, $3,906,
Accrued liabilities consist of the following:
In July
CommVault Systems, Inc. Notes to Consolidated Financial Statements — (Continued) (In thousands, except per share data)
Leases The Company leases various office and warehouse facilities under non-cancelable leases, which expire on various dates through
Rent expenses were $8,498, $6,778, Rent expense is calculated by amortizing total rental payments (net of any rental abatements, allowances and other rental concessions), on a straight-line basis, over the lease term. Accordingly, rent expense charged to operations differs from rent paid resulting in the Company recording deferred rent. Letter of Credit As of March 31, 2012, the Company had an outstanding letter of credit for $144 issued in connection with a revenue transaction. This letter of credit will remain outstanding until September 30, 2012. Purchase Commitments The Company, in the normal course of business, enters into various purchase commitments for goods or services. Total non-cancellable purchase commitments as of March 31, The Company has certain software royalty commitments associated with the shipment and licensing of certain products. Royalty expense is generally based on 2010. Indemnifications The Company offers a 90-day limited product warranty for its software. Legal Proceedings In the normal course of its business, the Company may be involved in various claims, negotiations and legal CommVault Systems, Inc. Notes to Consolidated Financial Statements — (Continued) (In thousands, except per share data) The Company provides certain provisions within its software licensing agreements to indemnify its customers from any claim, suit or proceeding arising from alleged or actual intellectual property infringement. These provisions continue in perpetuity, along with the Company’s software licensing agreements. The Company has never incurred a liability relating to one of these indemnification provisions, and management believes that the likelihood of any future payout relating to these provisions is remote. Therefore, the Company has not recorded a liability during any period for these indemnification provisions.
As of March 31, On November 13, 2008, the Board of Directors of the Company adopted a Rights Plan and declared a dividend distribution of one Right for each outstanding share of common stock to shareholders of record on November 24, 2008. Each Right, when exercisable, entitles the registered holder to purchase one one-thousandth of a share of Series A Junior Participating Preferred Stock, par value $0.01 per share, at a purchase price of eighty dollars per one one-thousandth of a share, subject to adjustment. Of the 50,000 shares of preferred stock authorized under the Company’s certificate of incorporation, 150 have been designated as Series A Junior Participating Preferred. The Rights will become exercisable following the tenth business day after (i) a person or group announces the acquisition of 15% or more of the Company’s common stock or (ii) commencement of a tender or exchange offer, the consummation of which would result in ownership by the person or group of 15% or more of the Company’s common stock. The Company is also entitled to redeem the Rights at $0.001 per right under certain circumstances. The Rights expire on November 14, 2018, if not exercised or redeemed. Common Stock The Company had As of March 31, 2013. Shares Reserved for Issuance The Company has reserved 2012.
As of March 31, CommVault Systems, Inc. Notes to Consolidated Financial Statements — (Continued) (In thousands, except per share data) Under the Plan, the Company may grant non-qualified stock options to purchase 11,705 shares of common stock to certain officers and employees. Stock options are granted at the discretion of the Board and expire 10 years from the date of the grant. At March 31, The LTIP permits the grant of incentive stock options, non-qualified stock options, restricted stock awards, restricted stock units, stock appreciation rights, performance stock awards and stock unit awards based on, or related to, shares of the Company’s common stock. On each April 1, the number of shares available for issuance under the LTIP is increased, if applicable, such that the total number of shares available for awards under the LTIP as of any April 1 is equal to 5% of the number of outstanding shares of the Company’s common stock on that April 1. As of March 31,
As of March 31, The Company estimated the fair value of stock options granted using the Black-Scholes formula. The average expected life was determined according to the “simplified method”, which is the mid-point between the vesting date and the end of the contractual term. The risk-free interest rate is determined by reference to U.S. Treasury yield curve rates with a remaining term equal to the expected life assumed at the date of grant. Forfeitures are estimated based on the Company’s historical analysis of actual stock option forfeitures. Expected volatility The assumptions used in the Black-Scholes option-pricing model are as follows:
CommVault Systems, Inc. Notes to Consolidated Financial Statements — (Continued) (In thousands, except per share data) The following table presents the stock-based compensation expense included in cost of services revenue, sales and marketing, research and development and general and administrative expenses for the years ended March 31, 2012, 2011
2010.
The Company recognized a tax benefit related to stock-based compensation of $7,276 in the year ended March 31, 2012, $5,352 in the year ended March 31, 2011 and $5,135 in the year ended March 31, 2010. As of March 31,
The following summarizes the activity for the Company’s two stock incentive plans from March 31,
2012:
CommVault Systems, Inc. Notes to Consolidated Financial Statements — (Continued) (In thousands, except per share data) The weighted average fair value of stock options granted was $18.77 per share, $12.23 per share, Restricted stock unit activity is as follows:
The total fair value of the restricted stock units that vested during the years ended March 31, 2012, 2011 and 2010 was $18,579, $10,157 and
The following table summarizes information on stock options outstanding under the Plan and LTIP at March 31,
2012:
CommVault Systems, Inc. Notes to Consolidated Financial Statements — (Continued) (In thousands, except per share data)
The components of income before income taxes were as follows:
The components of income tax
A reconciliation of the statutory tax rates and the effective tax rates for the years ended March 31, 2012, 2011
CommVault Systems, Inc. Notes to Consolidated Financial Statements — (Continued) (In thousands, except per share data) Deferred tax assets arise due to the recognition of income and expense items for tax purposes, which differ from those used for financial statement purposes. The Company assesses the likelihood that its deferred tax assets will be recovered from future taxable income, and to the extent that the Company believes recovery is not likely, the Company establishes a valuation allowance. The significant components of the Company’s deferred tax assets are as follows:
At March 31, It is the Company’s intention to reinvest undistributed earnings of its foreign subsidiaries and thereby infinitely postpone their remittance. As a result, deferred U.S. income taxes have not been provided on undistributed earnings of foreign subsidiaries of the Company. The cumulative amount of unremitted earnings from the foreign subsidiaries that is expected to be permanently reinvested was approximately 2012. Excess tax benefits related to share-based payments are credited to equity. When determining this excess tax benefit, the Company elected to follow the tax law approach. As a result, the Company’s excess tax benefit which was recorded to equity was approximately respectively. At March 31, $6,973. At March 31, $1,586.
CommVault Systems, Inc. Notes to Consolidated Financial Statements — (Continued) (In thousands, except per share data) The Company conducts business globally and as a result, files income tax returns in the United States and in various state and foreign jurisdictions. In the normal course of business, the Company is subject to examination by taxing authorities throughout the world, including such major jurisdictions as the United States, Australia, Canada, Germany, Netherlands and United Kingdom. The Company is not currently under audit in any tax jurisdiction. The following table summarizes the tax years in the Company’s major tax jurisdictions that remain subject to income tax examinations by tax authorities as of March 31,
The calculation of the Company’s tax liabilities involves dealing with uncertainties in the application of complex tax regulations in each of its tax jurisdictions. The number of years with open tax audits varies depending on the tax jurisdiction. A number of years may lapse before a particular matter is audited and finally resolved. A reconciliation of the amounts of unrecognized tax benefits is as follows:
All of the Company’s unrecognized tax benefits at March 31, CommVault Systems, Inc. Notes to Consolidated Financial Statements — (Continued) (In thousands, except per share data) March 31, 2012 and March 31, 2011,
The Company has a defined contribution plan, as allowed under Section 401(k) of the Internal Revenue Code, covering substantially all employees. fiscal year ending March 31, 2012 were $265.
The Company operates in one reportable segment, storage software solutions. The Company’s products and services are sold throughout the world, through direct and indirect sales channels. The Company’s chief operating decision maker, the chief executive officer, evaluates the performance of the Company presented on a consolidated basis, accompanied by information about revenue by geographic region for purposes of tracking distribution of resources and analyzing overall return on investment for both domestic and international operations. The chief operating decision maker does not receive discrete financial information about asset allocation, expense allocation or profitability from the Company’s storage products or services. Revenues by geography are based upon the billing address of the customer. All transfers between geographic regions have been eliminated from consolidated revenues. The following table sets forth revenue and long-lived assets by geographic area:
No individual country other than the United States accounts for 10% or more of revenues in the years ended March 31, 2012, 2011
CommVault Systems, Inc. Notes to Consolidated Financial Statements — (Continued) (In thousands, except per share data) At March 31,
Not applicable
Our management, with the participation of the Chief Executive Officer and Chief Financial Officer, has evaluated the effectiveness of our disclosure controls and procedures, as defined in Rules 13a-15(e) and 15d-15(e) of the Securities Exchange Act of 1934, as of March 31, 2012. Based on that evaluation, the Chief Executive Officer and Chief Financial Officer concluded that our disclosure controls and procedures were effective as of March 31, 2012.
Our management is responsible for establishing and maintaining adequate internal control over our financial reporting as defined in Rules 13a-15(f) of the Exchange Act. There are inherent limitations in the effectiveness of any internal control, including the possibility of human error and the circumvention or overriding of controls. Accordingly, even an effective internal control can provide only reasonable assurance with respect to financial statement preparation. Further, because of changes in conditions, the effectiveness of any internal control may vary over time. Our management, with the participation of our principal executive officer and principal financial officer, has evaluated the effectiveness of our internal control over financial reporting as of March 31, 2012. In making this assessment, management used the framework set forth by the Committee of Sponsoring Organizations of the Treadway Commission (COSO) in Internal Control-Integrated Framework. Based on our assessment, using those criteria, our management concluded that, as of March 31, 2012, our internal control over financial reporting was effective. The effectiveness of our internal control over financial reporting as of March 31, 2012 has been audited by Ernst & Young LLP, our independent registered public accounting firm, as stated in their report, which is included below in this Annual Report on Form 10-K.
There was no change in our internal control over financial reporting that occurred during the fourth quarter of fiscal 2012 that has materially affected, or is reasonably likely to materially affect, our internal control over financial reporting. Report of Independent Registered Public Accounting Firm on Internal Control over Financial Reporting The Board of Directors and Stockholders of CommVault Systems, Inc. We have audited CommVault Systems, Inc.’s internal control over financial reporting as of March 31, 2012, based on criteria established in Internal Control — Integrated Framework issued by the Committee of Sponsoring Organizations of the Treadway Commission (the COSO criteria). CommVault Systems, Inc.’s management is responsible for maintaining effective internal control over financial reporting, and for its assessment of the effectiveness of internal control over financial reporting included in the accompanying Management’s Report on Internal Control over Financial Reporting. Our responsibility is to express an opinion on the company’s internal control over financial reporting based on our audit. We conducted our audit in accordance with the standards of the Public Accounting Oversight Board (United States). Those standards require that we plan and perform the audit to obtain reasonable assurance about whether effective internal control over financial reporting was maintained in all material respects. Our audit included obtaining an understanding of internal control over financial reporting, assessing the risk that a material weakness exists, testing and evaluating the design and operating effectiveness of internal control based on the assessed risk, and performing such other procedures as we considered necessary in the circumstances. We believe that our audit provides a reasonable basis for our opinion. A company’s internal control over financial reporting is a process designed to provide reasonable assurance regarding the reliability of financial reporting and the preparation of financial statements for external purposes in accordance with generally accepted accounting principles. A company’s internal control over financial reporting includes those policies and procedures that (1) pertain to the maintenance of records that, in reasonable detail, accurately and fairly reflect the transactions and dispositions of the assets of the company; (2) provide reasonable assurance that transactions are recorded as necessary to permit preparation of financial statements in accordance with generally accepted accounting principles, and that receipts and expenditures of the company are being made only in accordance with authorizations of management and directors of the company; and (3) provide reasonable assurance regarding prevention or timely detection of unauthorized acquisition, use or disposition of the company’s assets that could have a material effect on the financial statements. Because of its inherent limitations, internal control over financial reporting may not prevent or detect misstatements. Also, projections of any evaluation of effectiveness to future periods are subject to the risk that controls may become inadequate because of changes in conditions, or that the degree of compliance with the policies or procedures may deteriorate. In our opinion, CommVault Systems, Inc. maintained, in all material respects, effective internal control over financial reporting as of March 31, 2012, based on the COSO criteria. We also have audited, in accordance with the standards of the Public Company Accounting Oversight Board (United States), the consolidated balance sheets of CommVault Systems, Inc. as of March 31, 2012 and 2011, and the related consolidated statements of income, stockholders’ equity, and cash flows for each of the three years in the period ended March 31, 2012 of CommVault Systems, Inc. and our report dated May 15, 2012 expressed an unqualified opinion thereon. /s/ Ernst & Young LLP MetroPark, New Jersey May 15, 2012
Not applicable PART III
We will furnish to the SEC a definitive Proxy Statement not later than 120 days after the close of the fiscal year ended March 31, 2012. Information with respect to this Item is incorporated herein by reference from our 2012 Proxy Statement, including in the sections captioned, “Our Board of Directors” and “Corporate Governance”. Our Board of Directors has adopted a code of business ethics and conduct, which applies to all our employees. The code of business ethics and conduct is in addition to our code of ethics for senior financial officers. The full texts of our code of business ethics and conduct and our code of ethics for senior financial officers can be found on our website,www.commvault.com.
Information with respect to this Item is incorporated herein by reference from our 2012 Proxy Statement, including in the section captioned “Compensation Discussion and Analysis”.
Information with respect to this Item is incorporated herein by reference from our 2012 Proxy Statement, including in the section captioned, “Transactions with Related Persons”.
Information with respect to this Item is incorporated herein by reference from our 2012 Proxy Statement, including in the sections captioned “Audit, Audit-related, Tax and All Other Fees”. PART IV
Financial Statements See “Index to Consolidated Financial Statements” set forth in Item 8 for a list of financial statements filed as part of this report. Financial Statement Schedules The following financial statement schedule should be read in conjunction with the Consolidated Financial Statements set forth in Item 8 and appears below: Schedule II — Valuation and Qualifying Accounts for the years ended March 31, 2010, 2011 and 2012. All other schedules are omitted because they are not required or the required information is shown in the financial statements or notes thereto. Schedule II — Valuation and Qualifying Accounts
Exhibits The following exhibits are incorporated by reference or filed herewith.
| ||||||||||||||||||||||||||||||||||||||||||||||||||||||||||||||||||||||||||||||||||||||||||||||||||||||||||||||||||||||||||||||||||||||||||||||||||||||||||||||||||||||||||||||||||||||||||||||||||||||||||||||||||||||||||||||||||||||||||||||||||||||||||||||||||||||||||||||||||||||||||||||||||||||||||||||||||||||||||||||||||||||||||||||||||||||||||||||||||||||||||||||||||||||||||||||||||||||||||||||||||||||||||||||||||||||||||||||||||||||||||||||||||||||||||||||||||||||||||||||||||||||||||||||||||||||||||||||||||||||||||||||||||||||||||||||||||||||||||||||||||||||||||||||||||||||||||||||||||||||||||||||||||||||||||||||||||||||||||||||||||||||||||||||||||||||||||||||||||||||||||||||||||||||||||||||||||||||||||||||||||||||||||||||||||||||||||||||||||||||||||||||||||||||||||||||||||||||||||||||||||||||||||||||||||||||||||||||||||||||||||||||||||||||||||||||||||||||||||||||||||||||||||||||||||||||||||||||||||||||||||||||||||||||||||||||||||||||||||||||||||||||||||||||||||||||||||||||||||||||