SECURITIES AND EXCHANGE COMMISSION
Washington, D.C. 20549
FORM 10-K
| þ | ANNUAL REPORT PURSUANT TO SECTION 13 OR 15(d) OF THE SECURITIES EXCHANGE ACT OF 1934 | |
| For the fiscal year ended April | ||
| or | ||
| o | TRANSITION REPORT PURSUANT TO SECTION 13 OR 15(d) OF THE SECURITIES EXCHANGE ACT OF 1934 | |
For the transition period fromto | ||
Commission File Number 1-3385
H. J. HEINZ COMPANY
(Exact name of registrant as specified in its charter)
| PENNSYLVANIA | 25-0542520 | |
| (State of Incorporation) | (I.R.S. Employer Identification No.) | |
One PPG Place | 15222 | |
Pittsburgh, Pennsylvania | (Zip Code) | |
| (Address of principal executive offices) | ||
412-456-5700
(Registrant’s telephone number)
SECURITIES REGISTERED PURSUANT TO SECTION 12(b) OF THE ACT:
None
SECURITIES REGISTERED PURSUANT TO SECTION 12(g) OF THE ACT:
None.
Indicate by check mark if the registrant is a well-known seasoned issuer, as defined in Rule 405 of the Securities Act. Yes þ No o
Indicate by check mark if the registrant is not required to file reports pursuant to Section 13 or Section 15(d) of the Act. Yes þ No o No þ
Indicate by check mark whether the Registrant (1) has filed all reports required to be filed by Section 13 or 15(d) of the Securities Exchange Act of 1934 during the preceding 12 months (or for such shorter period that the Registrant was required to file such reports), and (2) has been subject to such filing requirements for the past 90 days. Yes þ No o
Indicate by check mark whether the Registrant has submitted electronically and posted on its corporate Web site, if any, every Interactive Data File required to be submitted and posted pursuant to Rule 405 ofRegulation S-T during the preceding 12 months (or for such shorter period that the registrant was required to submit and post such files). Yes þ No o
Indicate by check mark if disclosure of delinquent filers pursuant to Item 405 ofRegulation S-K is not contained herein, and will not be contained, to the best of the Registrant’s knowledge, in definitive proxy or information statements incorporated by reference in Part III of thisForm 10-K or any amendment to thisForm 10-K. þ
Indicate by check mark whether the registrant is a large accelerated filer, an accelerated filer, a non-accelerated filer, or a smaller reporting company. See the definitions of “large accelerated filer,” “accelerated filer” and “smaller reporting company” inRule 12b-2 of the Exchange Act. (Check one):
Large accelerated filer | Accelerated filer o | Non-accelerated filer (Do not check if a smaller reporting company) | Smaller reporting company o | |||
Indicate by check mark whether the registrant is a shell company (as defined inRule 12b-2 of the Exchange Act). Yes o No þ
As of October 27, 201028, 2012, the aggregate market value of the Registrant’s voting stock held by non-affiliates of the Registrant was approximately $15.5 billion.$18.3 billion.
The number of shares of the Registrant’s Common Stock, par value $.25 per share, outstanding as of May 31, 2011,June 20, 2013, was 321,767,370100 shares.
DOCUMENTS INCORPORATED BY REFERENCE
Portions of the Registrant’s Proxy Statement for the Annual Meeting of ShareholdersCompany's Amendment to be held on August 30, 2011,Form 10-K, which will be filed with the Securities and Exchange Commission within 120 days after the end of the Registrant’sRegistrant's fiscal year ended April 27, 2011,28, 2013, are incorporated into Part III, Items 10, 11, 12, 13, and 14.
Introductory Note
On June 7, 2013, H. J. Heinz Company (the “Company,” “we,” “us,” and “our”) was acquired by H.J. Heinz Holding Corporation (formerly known as Hawk Acquisition Holding Corporation) (“Parent”), a Delaware corporation controlled by Berkshire Hathaway Inc. (“Berkshire Hathaway”) and 3G Special Situations Fund III, L.P. (“3G Capital,” and together with Berkshire Hathaway, the “Sponsors”), pursuant to the Agreement and Plan of Merger, dated February 13, 2013 (the “Merger Agreement”), as amended by the Amendment to Agreement and Plan of Merger, dated March 4, 2013 (the “Amendment”), by and among the Company, Parent and Hawk Acquisition Sub, Inc., a Pennsylvania corporation and wholly owned subsidiary of Parent (“Merger Subsidiary”), in a transaction hereinafter referred to as the “Merger.” As a result of the Merger, all issued and outstanding shares of our common stock outstanding immediately prior to the effective time of the Merger was converted into the right to receive $72.50 in cash, without interest and less applicable withholding taxes thereon, and the Company continued as the surviving corporation in the Merger, becoming an indirect wholly owned subsidiary of Parent.
The total cash consideration paid in connection with the Merger was approximately $28,750,000,000, which was funded from equity contributions from the Sponsors, as well as proceeds received by Merger Subsidiary in connection with debt financing provided by JPMorgan Chase Bank, N.A., Wells Fargo Bank, National Association and a syndicate of other lenders pursuant to a new senior secured credit facility (the “Senior Credit Facilities”) and upon the issuance of the Notes (as defined and described herein).
As a result of the Merger and the transactions entered into in connection therewith, we have inherited the liabilities and obligations of Merger Subsidiary, including Merger Subsidiary's obligations under the Senior Credit Facilities. The Senior Credit Facilities consist of (i)(a) term B-1 loans in an aggregate principal amount of $2,950,000,000 (the “B-1 Loans”) and (b) term B-2 loans in aggregate principal amount of $6,550,000,000 (the “B-2 Loans”) in each case under the new senior secured term loan facilities (the “Term Loan Facilities”) and (ii) revolving loans of up to $2,000,000,000 (including revolving loans, swingline loans and letters of credit), a portion of which may be denominated in Euro, Sterling, Australian Dollars, Japanese Yen or New Zealand Dollars, under the new senior secured revolving loan facilities (the “Revolving Credit Facilities”). Concurrently with the consummation of the Merger, the full amount of the term loan was drawn, and no revolving loans were drawn.
Also on June 7, 2013, in connection with the Merger, we executed a Joinder Agreement (the “Purchase Agreement Joinder”) to the Purchase Agreement, dated March 22, 2013 (the “Purchase Agreement”), among Merger Subsidiary, Parent and the several initial purchasers named in the schedule thereto (the “Initial Purchasers”), relating to the issuance and sale by Merger Subsidiary to the Initial Purchasers of $3,100,000,000 in aggregate principal amount of Merger Subsidiary's 4.25% Second Lien Senior Secured Notes due 2020 (the “Notes”), pursuant to which the H. J. Heinz Company and certain of its subsidiaries became parties to the Purchase Agreement. On June 7, 2013, the Company entered into a supplemental indenture to the Indenture dated as of April 1, 2013 governing the Notes pursuant to which the Company assumed all of the obligations of Merger Subsidiary as issuer of the Notes.
We refer to the Merger and the related transactions, including the issuance and sale of the Notes, the entering into the Purchase Agreement Joinder and the borrowings under the Senior Credit Facilities, as the “Transactions.”
As a result of the Merger, our common stock is no longer publicly traded.
CAUTIONARY STATEMENT RELEVANT TO FORWARD-LOOKING INFORMATION
Statements about future growth, profitability, costs, expectations, plans, or objectives included in this report, including in management's discussion and analysis, and the financial statements and footnotes, are forward-looking statements based on management's estimates, assumptions, and projections. These forward-looking statements are subject to risks, uncertainties, assumptions and other important factors, many of which may be beyond the Company's control and could cause actual results to differ materially from those expressed or implied in this report and the financial statements and footnotes. Uncertainties contained in such statements include, but are not limited to:
the ability of the Company to retain and hire key personnel and maintain relationships with customers, suppliers and other business partners,
sales, volume, earnings, or cash flow growth,
general economic, political, and industry conditions, including those that could impact consumer spending,
competitive conditions, which affect, among other things, customer preferences and the pricing of products, production, and energy costs,
competition from lower-priced private label brands,
increases in the cost and restrictions on the availability of raw materials including agricultural commodities and packaging materials, the ability to increase product prices in response, and the impact on profitability,
the ability to identify and anticipate and respond through innovation to consumer trends,
the need for product recalls,
the ability to maintain favorable supplier and customer relationships, and the financial viability of those suppliers and customers,
currency valuations and devaluations and interest rate fluctuations,
changes in credit ratings, leverage, and economic conditions, and the impact of these factors on our cost of borrowing and access to capital markets,
our ability to effectuate our strategy, including our continued evaluation of potential opportunities, such as strategic acquisitions, joint ventures, divestitures and other initiatives, our ability to identify, finance and complete these transactions and other initiatives, and our ability to realize anticipated benefits from them,
the ability to successfully complete cost reduction programs and increase productivity,
the ability to effectively integrate acquired businesses,
new products, packaging innovations, and product mix,
the effectiveness of advertising, marketing, and promotional programs,
supply chain efficiency,
cash flow initiatives,
risks inherent in litigation, including tax litigation,
the ability to further penetrate and grow and the risk of doing business in international markets, particularly our emerging markets, economic or political instability in those markets, strikes, nationalization, and the performance of business in hyperinflationary environments, in each case, such as Venezuela; and the uncertain global macroeconomic environment and sovereign debt issues, particularly in Europe,
changes in estimates in critical accounting judgments and changes in laws and regulations, including tax laws,
the success of tax planning strategies,
the possibility of increased pension expense and contributions and other people-related costs,
the potential adverse impact of natural disasters, such as flooding and crop failures, and the potential impact of climate change,
the ability to implement new information systems, potential disruptions due to failures in information technology systems, and risks associated with social media, and
other factors described in "Risk Factors" below.
The forward-looking statements are and will be based on management's then current views and assumptions regarding future events and speak only as of their dates. The Company undertakes no obligation to publicly update or revise any forward-looking statements, whether as a result of new information, future events or otherwise, except as required by the securities laws.
PART I
| Item 1. | Business. |
H. J. Heinz Company was incorporated in Pennsylvania on July 27, 1900. In 1905, it succeeded to the business of a partnership operating under the same name which had developed from a food business founded in 1869 in Sharpsburg, Pennsylvania by Henry J. Heinz. H. J. Heinz Company and its subsidiaries (collectively, the “Company”) manufacture and market an extensive line of food products throughout the world. The Company’s principal products include ketchup, condiments and sauces, frozen food, soups, beans and pasta meals, infant nutrition and other food products.
The Company’s products are manufactured and packaged to provide safe, wholesome foods for consumers, as well as foodservice and institutional customers. Many products are prepared from recipes developed in the Company’s innovation and research laboratories and experimental kitchens.centers. Ingredients are carefully selected, inspected and passed on to modern factory kitchens where they are processed, after which the intermediate product is filled automatically into containers of glass, metal, plastic, paper or fiberboard, which are then sealed. Products are prepared by sterilization, blending, fermentation, pasteurization, homogenization, chilling, freezing, pickling, drying, freeze drying, baking or extruding, then labeled and cased for market. Quality assurance procedures are designed for each product and process and applied for quality and compliance with applicable laws.
The Company manufactures (and contracts for the manufacture of) its products from a wide variety of raw food materials. Pre-season contracts are made with farmers for certain raw materials such as a portion of the Company’s requirements of tomatoes, cucumbers, potatoes, onions and some other fruits and vegetables. Ingredients, such as dairy products, meat, sugar and other sweeteners, including high fructose corn syrup, spices, flour and fruits and vegetables, are purchased from approved suppliers.
The following table lists the number of the Company’s principal food processing factories and major trademarks by region:
| Factories | ||||||||||
| Owned | Leased | Major Owned and Licensed Trademarks | ||||||||
| North America | 20 | 4 | Heinz, Classico, Quality Chef Foods, Jack Daniel’s*, Catelli*, Wyler’s, Heinz Bell ’Orto, Bella Rossa, Chef Francisco, Dianne’s, Ore-Ida, Tater Tots, Bagel Bites, Weight Watchers* Smart Ones, Poppers, T.G.I. Friday’s*, Delimex, Truesoups, Alden Merrell, Escalon, PPI, Todd’s, Nancy’s, Lea & Perrins, Renee’s Gourmet, HP, Diana, Bravo, Arthur’s Fresh | |||||||
| Europe | 21 | — | Heinz, Orlando, Karvan Cevitam, Brinta, Roosvicee, Venz, Weight Watchers*, Farley’s, Sonnen Bassermann, Plasmon, Nipiol, Dieterba, Bi-Aglut, Aproten, Pudliszki, Ross, Honig, De Ruijter, Aunt Bessie*, Mum’s Own, Moya Semya, Picador, Derevenskoye, Mechta Hoziajki, Lea & Perrins, HP, Amoy*, Daddies, Squeezme!, Wyko, Benedicta | |||||||
| Asia/Pacific | 25 | 2 | Heinz, Tom Piper, Wattie’s, ABC, Chef, Craig’s, Bruno, Winna, Hellaby, Hamper, Farley’s, Greenseas, Gourmet, Nurture, LongFong, Ore-Ida, SinSin, Lea & Perrins, HP, Classico, Weight Watchers*, Cottee’s, Rose’s*, Complan, Glucon D, Nycil, Golden Circle, La Bonne Cuisine, Original Juice Co., The Good Taste Company, Master, Guanghe | |||||||
| Rest of World | 7 | 2 | Heinz, Wellington’s, Today, Mama’s, John West, Farley’s, Complan, HP, Lea & Perrins, Classico, Banquete, Wattie’s, Quero | |||||||
| 73 | 8 | * Used under license | ||||||||
| Factories | |||||||
| Owned | Leased | Major Owned and Licensed Trademarks | |||||
| North America | 15 | 4 | Heinz, Classico, Quality Chef Foods, Jack Daniel’s*, Catelli*, Wyler’s, Heinz Bell ’Orto, Bella Rossa, Chef Francisco, Ore-Ida, Tater Tots, Bagel Bites, Weight Watchers* Smart Ones, Poppers, T.G.I. Friday’s*, Delimex, Truesoups, Escalon, PPI, Todd’s, Nancy’s, Lea & Perrins, Renee’s Gourmet, HP, Diana, Bravo, Arthur’s Fresh | ||||
| Europe | 17 | — | Heinz, Orlando, Karvan Cevitam, Brinta, Roosvicee, Venz, Weight Watchers*, Farley’s, Plasmon, Nipiol, Dieterba, Bi-Aglut, Aproten, Pudliszki, Ross, Honig, De Ruijter, Aunt Bessie*, Mum’s Own, Moya Semya, Picador, Derevenskoye, Lea & Perrins, HP, Amoy*, Daddies, Squeezme!, Wyko, Benedicta | ||||
| Asia/Pacific | 24 | — | Heinz, Tom Piper, Wattie’s, ABC, Chef, Craig’s, Winna, Hellaby, Hamper, Farley’s, Greenseas, Gourmet, Nurture, Ore-Ida, SinSin, Lea & Perrins, HP, Classico, Weight Watchers*, Cottee’s, Rose’s*, Complan, Glucon D, Nycil, Golden Circle, La Bonne Cuisine, Original Juice Co., The Good Taste Company, Master, Guanghe | ||||
| Rest of World | 7 | 2 | Heinz, Wellington’s, Today, Mama’s, John West, Farley’s, Complan, HP, Lea & Perrins, Classico, Banquete, Wattie’s, Quero | ||||
| 63 | 6 | * Used under license | |||||
The Company also owns or leases office space, warehouses, distribution centers and research and other facilities throughout the world. The Company’s food processing factories and principal properties are in good condition and are satisfactory for the purposes for which they are being utilized.
The Company has developed or participated in the development of certain of its equipment, manufacturing processes and packaging, and maintains patents and has applied for patents for some of those developments. The Company regards these patents and patent applications as important but does not consider any one or group of them to be materially important to its business as a whole.
Although crops constituting some of the Company’s raw food ingredients are harvested on a seasonal basis, most of the Company’s products are produced throughout the year. Seasonal factors inherent in the business have always influenced the quarterly sales, operating income and cash flows of the Company. Consequently, comparisons between quarters have always been more meaningful when made between the same quarters of prior years.
The products of the Company are sold under highly competitive conditions, with many large and small competitors. The Company regards its principal competition to be other manufacturers of prepared foods, including branded retail products, foodservice products and private label products, that compete with the Company for consumer preference, distribution, shelf space and merchandising support. Product quality and consumer value are important areas of competition.
2
The Company’s products are sold through its own sales organizations and through independent brokers, agents and distributors to chain, wholesale, cooperative and independent grocery accounts, convenience stores, bakeries, pharmacies, mass merchants, club stores, foodservice distributors and institutions, including hotels, restaurants, hospitals, health-care facilities, and certain government agencies. For Fiscal 2011,2013 and 2012, one customer, Wal-Mart Stores Inc., represented approximately 11%10% of the Company’s sales. We closely monitor the credit risk associated with our customers and to date have not experienced material losses.
Compliance with the provisions of national, state and local environmental laws and regulations has not had a material effect upon the capital expenditures, earnings or competitive position of the Company. The Company’s estimated capital expenditures for environmental control facilities for the remainder of Fiscal 20122014 and the succeeding fiscal year are not material and are not expected to materially affect the earnings, cash flows or competitive position of the Company.
The Company’s factories are subject to inspections by various governmental agencies in the U.S. and other countries where the Company does business, including the United States Department of Agriculture, and the Occupational Health and Safety Administration, and its products must comply with the applicable laws, including food and drug laws, such as the Federal Food and Cosmetic Act of 1938, as amended, and the Federal Fair Packaging or Labeling Act of 1966, as amended, of the jurisdictions in which they are manufactured and marketed.
The Company employed, on a full-time basis as of April 27, 2011,28, 2013, approximately 34,80031,900 people around the world.
Segment information is set forth in this report on pages 8378 through 8580 in Note 15,16, “Segment Information” in Item 8—“Financial Statements and Supplementary Data.”
Income from international operations is subject to fluctuation in currency values, export and import restrictions, foreign ownership restrictions, economic controls and other factors. From time to time, exchange restrictions imposed by various countries have restricted the transfer of funds between countries and between the Company and its subsidiaries. To date, such exchange restrictions have not had a material adverse effect on the Company’s operations.
The Company’s annual report onForm 10-K, quarterly reports onForm 10-Q, current reports onForm 8-K, and amendments to those reports filed or furnished pursuant to section 13(a) or 15(d) of the Exchange Act are available free of charge on the Company’s websiteweb site atwww.heinz.com, as soon as
3
reasonably practicable after being filed or furnished to the Securities and Exchange Commission (“SEC”). Our reports filed with the SEC are also made available on its website atwww.sec.gov. www.sec.gov.
Recent Developments
Completion of Acquisition by Berkshire Hathaway and 3G Capital
The total cash consideration paid in connection with the Merger was approximately $28.75 billion, which was funded from equity contributions from the Sponsors, as well as proceeds received by Merger Subsidiary from the Senior Credit Facilities and upon the issuance of the Notes (as defined and described herein). The Senior Credit Facilities consist of:
$9.5 billion in senior secured term loans, with tranches of 6 and 7 year maturities and fluctuating interest rates based on, at the Company's election, base rate or LIBOR plus a spread on each of the tranches, with respective spreads ranging from 125-150 basis points for base rate loans with a 2% base rate floor and 225-250 basis points for LIBOR loans with a 1% LIBOR floor, and
$2.0 billion senior secured revolving credit facility with a 5 year maturity and a fluctuating interest rate based on, at the Company's election, base rate or LIBOR, with respective spreads ranging from 50-100 basis points for base rate loans and 150-200 basis points for LIBOR loans, on which nothing is currently drawn.
On June 7, 2013, this indebtedness was assumed by the Company, substantially increasing the Company's overall level of debt.
On April 1, 2013, in connection with the Merger, Merger Subsidiary completed the private placement of $3.1 billion aggregate principal amount of 4.25% Second Lien Senior Secured Notes due 2020 (the “Notes”) to initial purchasers for resale by the Initial Purchasers to qualified institutional buyers pursuant to Rule 144A under the Securities Act and to persons outside the United States
3
under Regulation S of the Securities Act. The Notes were issued pursuant to an indenture (the “Indenture”), dated as of April 1, 2013, by and among Merger Subsidiary, Hawk Acquisition Intermediate Corporation II and Wells Fargo Bank, National Association, as trustee (in such capacity, the “Trustee”) and as collateral agent (in such capacity, the “Collateral Agent”). On June 7, 2013, the Company, certain of its direct and indirect wholly owned domestic subsidiaries (the “Guarantors”), the Trustee and the Collateral Agent entered into a supplemental indenture (the “Supplemental Indenture”) to the Indenture pursuant to which the Company assumed all of the obligations of Merger Subsidiary as issuer of the Notes. The Notes mature in 2020 and are required, within one year of consummation of the Merger Agreement, to be exchanged for notes registered with the SEC.
In addition, in connection with the Merger, Parent issued to Berkshire Hathaway 80,000 shares of its 9% Cumulative Perpetual Series A Preferred Stock for $8 billion.
In the Merger, (i) each outstanding share of Company common stock (other than shares owned by the Company, Parent, Merger Sub or any other direct or indirect wholly owned subsidiary of Parent, and in each case not held on behalf of third parties) was cancelled and automatically converted into the right to receive $72.50 in cash, without interest and less applicable withholding taxes thereon (the “Merger Consideration”), (ii) each outstanding stock option, whether vested or unvested, was cancelled and automatically converted into the right to receive, with respect to each share subject to the option, the Merger Consideration less the exercise price per share, (iii) each outstanding Company phantom unit, whether vested or unvested, was cancelled and automatically converted into the right to receive the Merger Consideration, and (iv) each outstanding Company restricted stock unit (other than retention restricted stock units, which will remain subject to the vesting schedule pursuant to the existing terms of the applicable award agreements and that the general timing of payment would be in accordance with such terms), whether vested or unvested, was cancelled and automatically converted into the right to receive, with respect to each share subject to the restricted stock unit, the Merger Consideration plus any accrued and unpaid dividend equivalents, except that payment in respect of Company restricted stock units that have been deferred will be made in accordance with the terms of the award and the applicable deferral election made by the holder.
At the effective time of the Merger, each holder of a certificate formerly representing any shares of Company common stock or of book-entry shares no longer had any rights with respect to the shares, except for the right to receive the Merger Consideration upon surrender thereof.
The acquisition will be accounted for as a purchase business combination. The application of purchase accounting as of the closing date is expected to have a material effect on the Company's results of operations for periods after the acquisition. The Company has begun the process to determine the purchase accounting allocation to the Company's assets and liabilities including estimating fair values of the Company's intangible and tangible assets. While these estimates have not been completed, management expects that a substantial portion of the purchase price will be allocated to indefinite-lived intangible assets (principally brands) and goodwill.
Financing implications of the acquisition on our existing debt
A substantial portion of the Company's indebtedness was subject to acceleration upon a change of control or required the Company to offer holders the option to repurchase such indebtedness from such holders (assuming such change of control triggered certain downgrades in the ratings of the Company's debt). Certain of the Company's outstanding indebtedness at April 28, 2013 that was not subject to acceleration upon a change of control and that either did not contain change of control repurchase obligations or where the holders did not elect to have such indebtedness repurchased in a change of control offer remain outstanding.
On March 13, 2013, the Company launched a consent solicitation relating to the 7.125% Notes due 2039 seeking a waiver of the change of control provisions as applicable to the Merger Agreement. As of March 21, 2013, the Company received the required consents to waive such provisions and as a result those notes remain outstanding.
Changes in the Directors and Officers of the RegistrantCompany
Also in accordance with the Merger and related transactions, in accordance with the terms of the Merger Agreement, as of the effective time of the Merger, each of William R. Johnson, Charles E. Bunch, Leonard S. Coleman Jr., John G. Drosdick, Edith E. Holiday, Candace Kendle, Franck J. Moison, Dean R. O'Hare, Nelson Peltz, Dennis H. Reilley, Lynn C. Swann, Thomas J. HeinzUsher and Michael F. Weinstein (the “Former Directors”) ceased serving as members of the board of directors of the Company indicating all
4
and, in connection therewith, the Former Directors also ceased serving on any committees of which such Former Directors were members. Information on the positions and offices held by each such personthe Former Directors on any committee of the board of directors of the Company at the time of the Former Directors' resignation is set forth under the caption “Board of Directors and each such person’s principal occupations or employment duringCommittees of the past five years. AllBoard” in the executive officers have beenCompany's definitive Proxy Statement filed with the Securities and Exchange Commission on June 15, 2012 and is incorporated herein by reference.
Warren Buffett, Alexandre Behring, Gregory Abel, Jorge Paulo Lemann, Marcel Herrmann Telles and Tracy Britt were elected to serve untilas new members of the next annual electionboard of officers, until their successors are elected, or until their earlier resignation or removal. The next annual electiondirectors of officers is scheduled to occurthe Company on August 30, 2011.June 7, 2013.
4
| Item 1A. | Risk |
In addition to the factors discussed elsewhere in this report, the following risks and uncertainties could materially and adversely affect the Company’s business, financial condition, and results of operations. Additional risks and uncertainties that are not presently known to the Company or are currently deemed by the Company to be immaterial also may impair the Company’s business operations and financial condition.
Risks Related to Our Business
Competitive product and pricing pressures in the food industry and the financial condition of customers and suppliers could adversely affect the Company’s ability to gain or maintain market share and/or profitability.
The Company operates in the highly competitive food industry, competing with other companies that have varying abilities to withstand changing market conditions. Any significant change in the Company’s relationship with a major customer, including changes in product prices, sales volume, or contractual terms may impact financial results. Such changes may result because the Company’s competitors may have substantial financial, marketing, and other resources that may change the competitive environment. Private label brands sold by retail customers, which are typically sold at lower prices, are a source of competition for certain of our product lines. Such competition could cause the Company to reduce pricesand/or increase capital, marketing, and other expenditures, or could
5
result in the loss of category share. Such changes could have a material adverse impact on the Company’s net income. As the retail grocery trade continues to consolidate, the larger retail customers of the Company could seek to use their positions to improve their profitability through lower pricing and increased promotional programs. If the Company is unable to use its scale, marketing expertise, product innovation, and category leadership positions to respond to these changes, or is unable to increase its prices, its profitability and volume growth could be impacted in a materially adverse way. The success of our business depends, in part, upon the financial strength and viability of our suppliers and customers. The financial condition of those suppliers and customers is affected in large part by conditions and events that are beyond our control. A significant deterioration of their financial condition could adversely affect our financial results.
The Company’s performance may be adversely affected by economic and political conditions in the U.S. and in various other nations where it does business.
The Company’s performance has been in the past and may continue in the future to be impacted by economic and political conditions in the United States and in other nations. Such conditions and factors include changes in applicable laws and regulations, including changes in food and drug laws, accounting standards and critical accounting estimates, taxation requirements and environmental laws. Other factors impacting our operations in the U.S., Venezuela and other international locations where the Company does business include export and import restrictions, currency exchange rates, currency devaluation, recessionary conditions, foreign ownership restrictions, nationalization, the impact of hyperinflationary environments, and terrorist acts, and political unrest. Such factors in either domestic or foreign jurisdictions could materially and adversely affect our financial results.
Increases in the cost and restrictions on the availability of raw materials could adversely affect our financial results.
The Company sources raw materials including agricultural commodities such as tomatoes, cucumbers, potatoes, onions, other fruits and vegetables, dairy products, meat, sugar and other sweeteners, including high fructose corn syrup, spices, and flour, as well as packaging materials such as glass, plastic, metal, paper, fiberboard, and other materials and inputs such as water, in order to manufacture products. The availability or cost of such commodities may fluctuate widely due to government policy and regulation, crop failures or shortages due to plant disease or insect and other pest infestation, weather conditions, potential impact of climate change, increased demand for biofuels, or other unforeseen circumstances. Additionally, the cost of raw materials and finished products may fluctuate due to movements in cross-currency transaction rates. To the extent that any of the foregoing or other unknown factors increase the prices of such commodities or materials and the Company is unable to increase its prices or adequately hedge against such changes in a manner that offsets such changes, the results of its operations could be materially and adversely affected. Similarly, if supplier arrangements and relationships result in increased and unforeseen expenses, the Company’s financial results could be materially and adversely impacted.
6
5
Disruption of our supply chain could adversely affect our business.
Damage or disruption to our manufacturing or distribution capabilities due to weather, natural disaster, fire, terrorism, pandemic, strikes, the financialand/or operational instability of key suppliers, distributors, warehousing and transportation providers, or brokers, or other reasons could impair our ability to manufacture or sell our products. To the extent the Company is unable to, or cannot, financially mitigate the likelihood or potential impact of such events, or to effectively manage such events if they occur, particularly when a product is sourced from a single location, there could be a materially adverse affect on our business and results of operations, and additional resources could be required to restore our supply chain.
Higher energy costs and other factors affecting the cost of producing, transporting, and distributing the Company’s products could adversely affect our financial results.
Rising fuel and energy costs may have a significant impact on the cost of operations, including the manufacture, transportation, and distribution of products. Fuel costs may fluctuate due to a number of factors outside the control of the Company, including government policy and regulation and weather conditions. Additionally, the Company may be unable to maintain favorable arrangements with respect to the costs of procuring raw materials, packaging, services, and transporting products, which could result in increased expenses and negatively affect operations. If the Company is unable to hedge against such increases or raise the prices of its products to offset the changes, its results of operations could be materially and adversely affected.
The results of the Company could be adversely impacted as a result of increased pension, labor, and people-related expenses.
Inflationary pressures and any shortages in the labor market could increase labor costs, which could have a material adverse effect on the Company’s consolidated operating results or financial condition. The Company’s labor costs include the cost of providing employee benefits in the U.S. and foreign jurisdictions, including pension, health and welfare, and severance benefits. Any declines in market returns could adversely impact the funding of pension plans, the assets of which are invested in a diversified portfolio of equity and fixed income securities and other investments. Additionally, the annual costs of benefits vary with increased costs of health care and the outcome of collectively-bargained wage and benefit agreements.
The impact of various food safety issues, environmental, legal, tax, and other regulations and related developments could adversely affect the Company’s sales and profitability.
The Company is subject to numerous food safety and other laws and regulations regarding the manufacturing, marketing, and distribution of food products. These regulations govern matters such as ingredients, advertising, taxation, relations with distributors and retailers, health and safety matters, and environmental concerns. The ineffectiveness of the Company’s planning and policies with respect to these matters, and the need to comply with new or revised laws or regulations with regard to licensing requirements, trade and pricing practices, environmental permitting, or other food or safety matters, or new interpretations or enforcement of existing laws and regulations, as well as any related litigation, may have a material adverse effect on the Company’s sales and profitability. Influenza or other pandemics could disrupt production of the Company’s products, reduce demand for certain of the Company’s products, or disrupt the marketplace in the foodservice or retail environment with consequent material adverse effects on the Company’s results of operations.
7
The need for and effect of product recalls could have an adverse impact on the Company’s business.
If any of the Company’s products become misbranded or adulterated, the Company may need to conduct a product recall. The scope of such a recall could result in significant costs incurred as a result of the recall, potential destruction of inventory, and lost sales. Should consumption of any product cause injury, the Company may be liable for monetary damages as a result of a judgment against it. A significant product recall or product liability case could cause a loss of consumer confidence in the Company’s food products and could have a material adverse effect on the value of its brands and results of operations.
The failure of new product or packaging introductions to gain trade and consumer acceptance and changes in consumer preferences could adversely affect our sales.
The success of the Company is dependent upon anticipating and reacting to changes in consumer preferences, including health and wellness. There are inherent marketplace risks associated with new product or packaging introductions, including uncertainties about trade and consumer acceptance. Moreover, success is dependent upon the Company’s ability to identify and respond to consumer trends through innovation. The Company may be required to increase expenditures for new product development. The Company may not be successful in developing new products or improving existing products, or its new products may not achieve consumer acceptance, each of which could materially and negatively impact sales.
6
The failure to successfully integrate acquisitions and joint ventures into our existing operations or the failure to gain applicable regulatory approval for such transactions or divestitures could adversely affect our financial results.
The Company’s ability to efficiently integrate acquisitions and joint ventures into its existing operations also affects the financial success of such transactions. The Company may seek to expand its business through acquisitions and joint ventures, and may divest underperforming or non-core businesses. The Company’s success depends, in part, upon its ability to identify such acquisition, joint venture, and divestiture opportunities and to negotiate favorable contractual terms. Activities in such areas are regulated by numerous antitrust and competition laws in the U. S., the European Union, and other jurisdictions, and the Company may be required to obtain the approval of acquisition and joint venture transactions by competition authorities, as well as satisfy other legal requirements. The failure to obtain such approvals could materially and adversely affect our results.
The Company’s operations face significant foreign currency exchange rate exposure, which could negatively impact its operating results.
The Company holds assets and incurs liabilities, earns revenue, and pays expenses in a variety of currencies other than the U.S. dollar, primarily the British Pound, Euro, Australian dollar, Canadian dollar, and New Zealand dollar. The Company’s consolidated financial statements are presented in U.S. dollars, and therefore the Company must translate its assets, liabilities, revenue, and expenses into U.S. dollars for external reporting purposes. Increases or decreases in the value of the U.S. dollar relative to other currencies may materially and negatively affect the value of these items in the Company’s consolidated financial statements, even if their value has not changed in their original currency. In addition, the impact of fluctuations in foreign currency exchange rates on transaction costs ( i.e., the impact of foreign currency movements on particular transactions such as raw material sourcing), most notably in the U.K., could materially and adversely affect our results.
8
The failure to implement our growth plans could adversely affect the Company’s ability to increase net income and generate cash.
The success of the Company could be impacted by its inability to continue to execute on its growth plans regarding product innovation, implementing cost-cutting measures, improving supply chain efficiency, enhancing processes and systems, including information technology systems, on a global basis, and growing market share and volume. The failure to fully implement the plans, in a timely manner or within our cost estimates, could materially and adversely affect the Company’s ability to increase net income. Additionally, the Company’s ability to pay cash dividends will depend upon its ability to generate cash and profits, which, to a certain extent, is subject to economic, financial, competitive, and other factors beyond the Company’s control.
The Sponsors control us and may have conflicts of interest with us in the future.
Our business could be adversely impacted as a result of the Merger and significant costs, expenses and fees.
The Merger could cause disruptions to our business or business relationships, which could have an adverse impact on our financial condition, results of operations and cash flows. For example:
• the attention of our management may be directed to transaction-related considerations or activities and may be diverted from the day-today operations of our business;
• our associates may experience uncertainty about their future roles with us, which might adversely affect our ability to retain and hire key personnel and other employees; and
• vendors or other parties with which we maintain business relationships may experience uncertainty about our future and seek alternative relationships with third parties or seek to alter their business relationships with us.
7
In addition, we incurred significant costs, expenses and fees for professional services and other transaction costs in connection with the Merger.
The Company is increasingly dependent on information technology, and potential disruption, cyber attacks, security problems, and expanding social media vehicles present new risks.
The inappropriate use of certain media vehicles could cause brand damage or information leakage. Negative posts or comments about usthe Company on any social networking web site could seriously damage ourits reputation. In addition, the disclosure of non-public company sensitive information through external media channels could lead to information loss. Identifying new points of entry as social media continues to expand presents new challenges. Any business interruptions or damage to the Company’sCompany's reputation could negatively impact the Company’sCompany's financial condition and results of operation,operation.
The Company's operating results may be adversely affected by the current sovereign debt crisis in Europe and elsewhere and by related global economic conditions.
The current European debt crisis, particularly most recently in Greece, Italy, Ireland, Portugal and Spain, and related European financial restructuring efforts may cause the value of the European currencies, including the Euro, to further deteriorate, thus reducing the purchasing power of European customers. One potential extreme outcome of the European financial situation is the re-introduction of individual currencies in one or more Eurozone countries or the dissolution of the Euro entirely. Should the Euro dissolve entirely, the legal and contractual consequences for holders of Euro-denominated obligations would be determined by laws in effect at such time. The potential dissolution of the Euro, or market perceptions concerning this and related issues, could adversely affect the value of the Company's Euro-denominated assets and obligations. In addition, the European crisis is contributing to instability in global credit markets. The world has recently experienced a global macroeconomic downturn, and if global economic and market conditions, or economic conditions in Europe, the United States or other key markets, remain uncertain, persist, or deteriorate further, consumer purchasing power and demand for Company products could decline, and the market priceCompany may experience material adverse impacts on its business, operating results, and financial condition.
Risks Related to Our Indebtedness and Certain Other Obligations
Our indebtedness could adversely affect our ability to raise additional capital to fund our operations and make strategic acquisitions, limit our ability to react to changes in the economy or our industry, expose us to interest rate risk to the extent of our variable rate debt and prevent us from meeting our obligations under our indebtedness, including the Company’s common stock.Notes.
Our high degree of indebtedness could have important consequences for our creditors, including holders of the Notes. For example, they could:
•limit our ability to obtain additional financing for working capital, capital expenditures, research and development, debt service requirements, acquisitions and general corporate or other purposes;
•restrict us from making strategic acquisitions or cause actual resultsus to differ materiallymake non-strategic divestitures;
•limit our ability to adjust to changing market conditions and place us at a competitive disadvantage compared to our competitors who are not as highly leveraged;
•increase our vulnerability to general economic and industry conditions;
8
•expose us to the risk of increased interest rates as the borrowings under our Senior Credit Facilities will be at variable rates of interest;
•make it more difficult for us to make payments on our indebtedness; and
•require a substantial portion of cash flow from those expressed or impliedoperations to be dedicated to the payment of principal and interest on our indebtedness, thereby reducing our ability to use our cash flow to fund our operations, capital expenditures and future business opportunities.
For the fiscal year ended April 28, 2013, on a pro forma basis after giving effect to the Merger and related financing transactions as if they had closed at the beginning of fiscal 2013, our cash interest expense would have been approximately $603 million. As of April 28, 2013, on a pro forma basis after giving effect to the Transactions as if they had closed on such date, we would have had approximately $14.5 billion of debt outstanding.
Despite current indebtedness levels and restrictive covenants, we and our subsidiaries may incur additional indebtedness in this reportthe future. This could further exacerbate the risks associated with our substantial financial leverage.
The terms of the indenture governing our Notes and the financial statementscredit agreements governing our Senior Credit Facilities permit us to incur a substantial amount of additional debt, including secured debt. Any additional borrowings under our Senior Credit Facilities, and footnotes. Uncertainties contained incertain other secured debt, would be senior to the Notes and the guarantees thereto to the extent of the value of the assets securing such statements include, but are not limited to:
9
10
Our debt agreements contain restrictions that limit our flexibility in operating our business.
The credit agreement governing our Senior Credit Facilities and the indenture governing our Notes contain various covenants that limit our ability to engage in specified types of transactions. These covenants limit our, our immediate parent's and our restricted subsidiaries' ability to, among other things, incur or guarantee additional indebtedness, pay dividends on, or redeem or repurchase, our capital stock, make certain acquisitions or investments, materially change our business, incur or permit to exist certain liens, enter into transactions with affiliates or sell our assets to, or merge or consolidate with or into, another company, in each case with customary exceptions.
Upon the occurrence of an event of default under our Senior Credit Facilities, the lenders thereunder could elect to declare all amounts outstanding under our Senior Credit Facilities to be immediately due and payable and terminate all commitments to extend further credit. If we were unable to repay those amounts, the lenders under our Senior Credit Facilities could proceed against the collateral granted to them to secure that indebtedness. We have pledged a significant portion of our assets as collateral under our Senior Credit Facilities. If the lenders under our Senior Credit Facilities accelerate the repayment of borrowings, we cannot assure you that we will have sufficient assets to repay our Senior Credit Facilities, as well as our other secured and unsecured indebtedness, including our outstanding Notes.
To service our indebtedness, we will require a significant amount of cash and our ability to generate cash depends on many factors beyond our control.
Our ability to make cash payments on and to refinance our indebtedness and to fund planned capital expenditures will depend on our ability to generate significant operating cash flow in the future. This ability is, to a significant extent, subject to general economic, financial, competitive, legislative, regulatory and other factors that are beyond our control.
Our business may not generate sufficient cash flow from operations, and future eventsborrowings may not be available under our Senior Credit Facilities, in an amount sufficient to enable us to pay our indebtedness, including the outstanding Notes, or to fund our other liquidity needs. In any such circumstance, we may need to refinance all or a portion of our indebtedness, including our Senior Credit Facilities and the Notes, on or before maturity. We may not be able to refinance any of our indebtedness, including our Senior Credit Facilities and the Notes, on commercially reasonable terms or at all. If we cannot service our indebtedness, we may have to take actions such as selling assets, seeking additional equity or reducing or delaying capital expenditures, strategic acquisitions and investments. Any such action, if necessary, may not be effected on commercially reasonable terms or at all. The credit agreements governing our Senior Credit Facilities and the indenture governing the Notes restrict our ability to sell assets and use the proceeds from such sales.
9
If we are unable to generate sufficient cash flow or are otherwise exceptunable to obtain funds necessary to meet required payments of principal, premium, if any, and interest on our indebtedness, or if we otherwise fail to comply with the various covenants in the instruments governing our indebtedness (including covenants in the credit agreement governing our Senior Credit Facilities and the indenture governing the Notes), we could be in default under the terms of the agreements governing such indebtedness. In the event of such default, the holders of such indebtedness could elect to declare all the funds borrowed thereunder to be due and payable, together with accrued and unpaid interest, the lenders under our Senior Credit Facilities could elect to terminate their commitments thereunder, cease making further loans and institute foreclosure proceedings against our assets, and we could be forced into bankruptcy or liquidation. If our operating performance declines, we may in the future need to obtain waivers from the required lenders under our Senior Credit Facilities to avoid being in default. If we breach our covenants under the credit agreements governing our Senior Credit Facilities and seek a waiver, we may not be able to obtain a waiver from the required lenders. If this occurs, we would be in default under our Senior Credit Facilities, the lenders could exercise their rights, as required by the securities laws.described above, and we could be forced into bankruptcy or liquidation.
| Item 1B. | Unresolved Staff Comments. |
Nothing to report under this item.
| Item 2. | Properties. |
See table in Item 1.
| Item 3. | Legal Proceedings. |
Nothing to report under this item.
| Item 4. |
Nothing to report under this item.
10
PART II
| Item 5. | Market for |
Information relating to the Company’s common stock is set forth in this report on page 3632 under the caption “Stock Market Information” in Item 7—“Management’s Discussion and Analysis of Financial Condition and Results of Operations,” and on page 86pages 80 and 81 in Note 16,17, “Quarterly Results” in Item 8—“Financial Statements and Supplementary Data.”
| Maximum | ||||||||||||||||
| Total | Total Number of | Number of Shares | ||||||||||||||
| Number of | Average | Shares Purchased as | that May Yet Be | |||||||||||||
| Shares | Price Paid | Part of Publicly | Purchased Under | |||||||||||||
| Period | Purchased | per Share | Announced Programs | the Programs | ||||||||||||
| January 27, 2011— | ||||||||||||||||
| February 23, 2011 | — | $ | — | — | — | |||||||||||
| February 24, 2011— | ||||||||||||||||
| March 23, 2011 | — | — | — | — | ||||||||||||
| March 24, 2011— | ||||||||||||||||
| April 27, 2011 | 1,425,000 | 49.12 | — | — | ||||||||||||
| Total | 1,425,000 | $ | 49.12 | — | — | |||||||||||
| Item 6. | Selected Financial Data. |
The following table presents selected consolidated financial data for the Company and its subsidiaries for each of the five fiscal years 20072009 through 2011.2013. All amounts are in thousands except per share data.
| Fiscal Year Ended | ||||||||||||||||||||
| April 27, | April 28, | April 29, | April 30, | May 2, | ||||||||||||||||
| 2011 | 2010 | 2009 | 2008 | 2007 | ||||||||||||||||
| (52 Weeks) | (52 Weeks) | (52 Weeks) | (52 Weeks) | (52 Weeks) | ||||||||||||||||
| Sales(1) | $ | 10,706,588 | $ | 10,494,983 | $ | 10,011,331 | $ | 9,885,556 | $ | 8,800,071 | ||||||||||
| Interest expense(1) | 275,398 | 295,711 | 339,635 | 364,808 | 333,037 | |||||||||||||||
| Income from continuing operations(1) | 1,005,948 | 931,940 | 944,400 | 858,176 | 794,398 | |||||||||||||||
| Income from continuing operations per share attributable to H.J. Heinz Company common shareholders—diluted(1) | 3.06 | 2.87 | 2.91 | 2.62 | 2.34 | |||||||||||||||
| Income from continuing operations per share attributable to H.J. Heinz Company common shareholders—basic(1) | 3.09 | 2.89 | 2.95 | 2.65 | 2.37 | |||||||||||||||
| Short-term debt and current portion of long- term debt | 1,534,932 | 59,020 | 65,638 | 452,708 | 468,243 | |||||||||||||||
| Long-term debt, exclusive of current portion(2) | 3,078,128 | 4,559,152 | 5,076,186 | 4,730,946 | 4,413,641 | |||||||||||||||
| Total assets | 12,230,645 | 10,075,711 | 9,664,184 | 10,565,043 | 10,033,026 | |||||||||||||||
| Cash dividends per common share | 1.80 | 1.68 | 1.66 | 1.52 | 1.40 | |||||||||||||||
| Fiscal Year Ended | |||||||||||||||||||
| April 28, 2013 | April 29, 2012 | April 27, 2011 | April 28, 2010 | April 29, 2009 | |||||||||||||||
| (52 Weeks) | (52 1/2 Weeks) | (52 Weeks) | (52 Weeks) | (52 Weeks) | |||||||||||||||
Sales(1) | $ | 11,528,886 | $ | 11,507,572 | $ | 10,558,636 | $ | 10,323,968 | $ | 9,826,298 | |||||||||
Interest expense(1) | 283,607 | 293,009 | 272,660 | 293,574 | 336,509 | ||||||||||||||
Income from continuing operations attributable to H.J. Heinz Company common shareholders(1) | 1,087,615 | 974,374 | 1,029,067 | 945,389 | 954,297 | ||||||||||||||
Income from continuing operations per share attributable to H.J. Heinz Company common shareholders—diluted(1) | 3.37 | 3.01 | 3.18 | 2.96 | 2.99 | ||||||||||||||
Income from continuing operations per share attributable to H.J. Heinz Company common shareholders—basic(1) | 3.39 | 3.03 | 3.21 | 2.99 | 3.03 | ||||||||||||||
| Short-term debt and current portion of long-term debt | 2,160,393 | 246,708 | 1,534,932 | 59,020 | 65,638 | ||||||||||||||
Long-term debt, exclusive of current portion(2) | 3,848,339 | 4,779,981 | 3,078,128 | 4,559,152 | 5,076,186 | ||||||||||||||
| Total assets | 12,939,007 | 11,983,293 | 12,230,645 | 10,075,711 | 9,664,184 | ||||||||||||||
| Cash dividends per common share | 2.06 | 1.92 | 1.80 | 1.68 | 1.66 | ||||||||||||||
| (1) | Amounts exclude the operating results as well as any associated impairment charges and losses on sale related to the Company’s Shanghai LongFong Foods business in China and U.S. Foodservice frozen desserts business, which were divested in Fiscal 2013, as well as the private label frozen desserts business in the U.K. |
| (2) | Long-term debt, exclusive of current portion, includes |
Fiscal 2013 results include the following special items:
•As a result of the Merger, the Company incurred $44.8 million pre-tax ($27.8 million after-tax) of transaction-related costs, including legal, accounting and other professional fees, during the fourth quarter of Fiscal 2013. See Note 21, “Subsequent Events” in Item 8- “Financial Statements and Supplementary Data” for further explanation. The Company expects to incur additional costs related to the Merger including costs associated with changing our debt and equity structure, additional professional fees, gains and losses on derivative instruments, acceleration of stock based compensation expense, and potential tax costs associated with changes in plans with respect to earnings invested outside of the United States.
11
•Also during the fourth quarter of Fiscal 2013, the Company closed a factory in South Africa resulting in a $3.5 million pre-tax charge ($2.6 million million after-tax) primarily related to asset write-downs.
•On February 8, 2013, the Venezuelan government announced the devaluation of its currency relative to the U.S. dollar, changing the official exchange rate from 4.30 to 6.30, resulting in a $42.7 million pre-tax ($39.1 million after-tax) currency translation loss during the fourth quarter of Fiscal 2013. See Note 20, "Venezuela- Foreign Currency" in Item 8—"Financial Statement and Supplementary Data" for further explanation.
•During the third quarter of Fiscal 2013, the Company renegotiated the terms of the Foodstar Holdings Pte earn-out that was due in Fiscal 2014 resulting in a $12.1 million pre-tax and after-tax charge. See Note 11, "Fair Value Measurements" in Item 8—"Financial Statement and Supplementary Data" for further explanation.
Fiscal 2012 results from continuing operations include expenses of $205.4 million pre-tax ($144.0 million after-tax or $0.45 per share) for productivity initiatives. See Note 4, "Fiscal 2012 Productivity Initiatives" in Item 8—"Financial Statement and Supplementary Data" for further explanation of these initiatives.
Fiscal 2010 results from continuing operations include expenses of $37.7$35.9 million pretax ($27.826.0 million after tax) for upfront productivity charges and a gain of $15.0 million pretax ($11.1 million after tax) on a property disposal in the Netherlands. The upfront productivity charges include costs associated with targeted workforce reductions and asset write-offs, that were part of a corporation-wide initiative to improve productivity. The asset write-offs related to two factory closures and the exit of a formula business in the U.K. See “Discontinued Operations and Other Disposals” in Item 7, “Management’s Discussion and Analysis of Financial Condition and Results of Operations” on pages 15 through 16 for further explanation of the property disposal in the Netherlands.
13
12
| Item 7. |
Executive Overview- Fiscal 20112013
The H.J. Heinz Company has been a pioneer in the food industry for over 140 years and possesses one of the world’s best and most recognizable brands—Heinz®. The Company has a global portfolio of leading brands focused in three core categories, Ketchup and Sauces, Meals and Snacks, and Infant/Nutrition.
The Company's Fiscal 2013 results reflect strong organic sales growth(1) of 3.1% comprised of a 1.0% volume improvement and a 2.1% increase in net pricing. Overall reported recordsales improved slightly by 0.2% as product line divestitures reduced sales 0.3% and foreign currency decreased sales 2.5%. Organic sales growth was led by our trio of growth engines comprised of emerging markets, the Company's top 15 brands and global ketchup. The emerging markets posted organic sales growthof 16.8% for the fiscal year (14.3% reported) and represented 23.6% of total Company sales. The Company's top 15 brands generated organic sales growth of 3.6% (0.8% reported) driven by the Heinz®, ABC®, Quero®, and Master® brands. Global ketchup grew organically 4.6% (2.8% reported) mainly driven by improvements in Russia, Brazil and the U.S.
Fiscal 2013 results include the following special, non-recurring items:
•As a result of the Merger, the Company incurred $45 million pre-tax ($28 million after-tax) of transaction-related costs, including legal, accounting and other professional fees, during the fourth quarter of Fiscal 2013. These costs were recorded in selling, general and administrative expenses ("SG&A") on the consolidated income statement and in the Non-Operating segment. The Company expects to incur additional costs related to the Merger including costs associated with changing our debt and equity structure, additional professional fees, gains and losses on derivative instruments, acceleration of stock based compensation expense, and potential tax costs associated with changes in plans with respect to earnings invested outside of the United States.
•Also during the fourth quarter of Fiscal 2013, the Company closed a factory in South Africa resulting in a $3.5 million pre-tax charge ($2.6 million after-tax) primarily related to asset write-downs that were recorded in costs of products sold on the consolidated income statement and in the Non-Operating segment.
•On February 8, 2013, the Venezuelan government announced the devaluation of its currency relative to the U.S. dollar, changing the official exchange rate from 4.30 to 6.30. As a result, the Company recorded a $43 million pre-tax currency translation loss during the fourth quarter of Fiscal 2013, which was reflected within other expense, net, on the consolidated statement of income ($39 million after-tax loss). See the “Venezuela - Foreign Currency and Inflation” section below for further discussion.
•During the third quarter of Fiscal 2013, the Company renegotiated the terms of the Foodstar Holdings Pte ("Foodstar") earn-out that was due in Fiscal 2014 in order to give the Company additional flexibility in the future for growing its business in China, one of its largest and most important emerging markets. This renegotiation resulted in a cash payment of $60 million and a $12 million charge, which represents the difference between the settlement amount and carrying value of the earn-out on the Company's balance sheet at the date of this transaction. This charge was recorded in SG&A on the consolidated income statement and in the Non-Operating segment.
On a reported basis, gross margin for Fiscal 2013 improved 170 basis points to 36.4%, compared to prior year. Excluding charges for special items in the current year(2) as well as charges for productivity initiatives in Fiscal 2012(3), gross margin for the year improved 60 basis points driven by higher pricing and productivity improvements which more than offset higher commodity costs.
13
Operating income for the fiscal year increased 10.6% to $1.66 billion on a reported basis. Excluding charges for special items in the current yearas well as charges for productivity initiatives in the prior year, operating income increased 0.8% versus prior year to $1.72 billion despite increased investments in the business, including higher marketing (+2.5%), enhanced selling capabilities in emerging markets and incremental spending on Project Keystone.
Reported diluted earnings per share from continuing operations of $3.06,were $3.37 for Fiscal 2013, compared to $2.87$3.01 in the prior year. Excluding charges for special items, current year diluted earnings per share from continuing operations were $3.62 in the current year compared to $3.45 in the prior year an increase of 6.6%, overcoming a $0.06excluding charges for productivity initiatives. Earnings per share unfavorable impact from currency translation and translation hedges and a $0.02 per share unfavorable impact for acquisition costs from our recent acquisition in Brazil. Given that almost two-thirds of the Company’s sales and net income are generated outside of the U.S., foreign currency movements can have a significant impact on the Company’s financial results.
| (1) | Organic sales growth is defined as volume plus price or total sales growth excluding the impact of foreign exchange, acquisitions and divestitures. See “Non-GAAP Measures” section below for the reconciliation of all of these organic sales growth measures to the reported GAAP measure. |
| (2) |
| (3) | All Fiscal 2012 results excluding charges for productivity initiatives are non-GAAP measures used for management reporting and incentive compensation purposes. See “Non-GAAP Measures” section below for the reconciliation of all Fiscal 2012 non-GAAP measures to the reported GAAP measures. |
| (4) | ||
Discontinued Operations and Other Disposals
During the first quarter of Fiscal 2013, the Company completed the sale of its Appetizers And, Inc. frozen hors d’oeuvres business which was previously reported within the U.S. Foodservice segment,frozen desserts business, resulting in a $14.5$32.7 million pre-tax ($10.4($21.1 million after-tax) loss. Also during the third quarter of Fiscal 2010, the Company completed the sale of its private label frozen desserts business in the U.K., resulting in a $31.4 million pre-tax ($23.6 million after-tax) loss. During the second quarter of Fiscal 2010, the Company completed the sale of its Kabobs frozen hors d’oeuvres businessloss which was previously reported within the U.S. Foodservice segment, resulting in a $15.0 million pre-tax ($10.9 million after-tax) loss. The losses on each of these transactions havehas been recorded in discontinued operations.
| Fiscal Year Ended | ||||||||
| April 28, | April 29, | |||||||
| 2010 | 2009 | |||||||
| FY 2010 | FY 2009 | |||||||
| (Millions of Dollars) | ||||||||
| Sales | $ | 63.0 | $ | 136.8 | ||||
| Net after-tax losses | $ | (4.7 | ) | $ | (6.4 | ) | ||
| Tax benefit on losses | $ | 2.0 | $ | 2.4 | ||||
| Fiscal Year Ended | |||
| April 28, 2013 FY 2013 | April 29, 2012 FY 2012 | April 27, 2011 FY 2011 | |
| (In millions) | |||
| Sales | $47.7 | $141.5 | $148.0 |
| Net after-tax losses | $(17.6) | $(51.2) | $(39.6) |
| Tax benefit on losses | $0.6 | $1.4 | $2.6 |
Fiscal 2010,2012 Productivity Initiatives
On May 26, 2011, the Company received cash proceedsannounced that it would invest in productivity initiatives during Fiscal 2012 designed to increase manufacturing effectiveness and efficiency as well as accelerate overall productivity on a global scale. The Company recorded costs related to these productivity initiatives of $95$205.4 million from pre-tax ($144.0 million after-tax or $0.45 per share) during the governmentfiscal year ended April 29, 2012, all of the Netherlands for property the government acquired through eminent domain proceedings. The transaction includes the purchase by the government of the Company’s factory located in Nijmegen, which produces soups, pasta and cereals. The cash proceeds are intended to compensate the Company for costs, both capital and expense, the Company will incur three years from the date of the transaction, which is the length of time the Company has to exit the current
15
14
million were recorded in the leased factory while commencing to execute its plans for closure and relocation of the operations. The Company has accountedlosses from discontinued operations for the proceeds on a cost recovery basis. In doing so, the Company has made its estimates of cost, both of a capital and expense nature, to be incurred and recovered and to which proceeds from the transaction will be applied. Of the proceeds received, $81 million was deferred based on management’s total estimated future costs to be recovered and incurred and recorded in other non-current liabilities, other accrued liabilities and accumulated depreciation in the Company’s consolidated balance sheet as of April 28, 2010. These deferred amounts are recognized as the related costs are incurred. If estimated costs differ from what is actually incurred, these adjustments are reflected in earnings. As of April 27, 2011, the remaining deferred amount on the consolidated balance sheet was $63 million and was recorded in other non-current liabilities, other accrued liabilities and accumulated depreciation. No significant adjustments were reflected in earnings in Fiscal 2011. The excess of the $95 million of proceeds received over estimated costs to be recovered and incurred was $15 million which has been recorded as a reduction of cost of products sold in the consolidated statement of income for thefiscal year ended April 28, 2010.29, 2012 . See Note 4, "Fiscal 2012 Productivity Initiatives" in Item 8- "Financial Statements and Supplementary Data" and the "Liquidity and Financial Position" section below for additional information on these productivity initiatives.
Results of Continuing Operations
On March 14, 2012 the Company's Board of Directors authorized a change in the Company's fiscal year end from the Wednesday nearest April 30 to the Sunday nearest April 30. The change in the fiscal year end resulted in Fiscal 2012 changing from a 53 week year to a 52 1/2 week year and was intended to better align the Company's financial reporting period with its business partners and production schedules. This change did not have a material impact on the Company's financial statements.
The Company’s revenues are generated via the sale of products in the following categories:
| Fiscal Year Ended | ||||||||||||
| April 27, | April 28, | April 29, | ||||||||||
| 2011 | 2010 | 2009 | ||||||||||
| (52 Weeks) | (52 Weeks) | (52 Weeks) | ||||||||||
| (Dollars in thousands) | ||||||||||||
| Ketchup and sauces | $ | 4,607,971 | $ | 4,446,911 | $ | 4,251,583 | ||||||
| Meals and snacks | 4,282,318 | 4,289,977 | 4,225,127 | |||||||||
| Infant/Nutrition | 1,175,438 | 1,157,982 | 1,105,313 | |||||||||
| Other | 640,861 | 600,113 | 429,308 | |||||||||
| Total | $ | 10,706,588 | $ | 10,494,983 | $ | 10,011,331 | ||||||
| Fiscal Year Ended | |||||||||||
| April 28, 2013 | April 29, 2012 | April 27, 2011 | |||||||||
| (52 Weeks) | (52 1/2 Weeks) | (52 Weeks) | |||||||||
| (In thousands) | |||||||||||
| Ketchup and Sauces | $ | 5,375,788 | $ | 5,232,607 | $ | 4,607,326 | |||||
| Meals and Snacks | 4,240,808 | 4,337,995 | 4,134,836 | ||||||||
| Infant/Nutrition | 1,189,015 | 1,232,248 | 1,175,438 | ||||||||
| Other | 723,275 | 704,722 | 641,036 | ||||||||
| Total | $ | 11,528,886 | $ | 11,507,572 | $ | 10,558,636 | |||||
Fiscal 2013 Company Results- Fiscal Year Ended April 28, 2013 compared to Fiscal Year Ended April 29, 2012
Sales for Fiscal 2013 increased $21 million, or 0.2%, to $11.53 billion. Volume increased 1.0%, as volume gains in emerging markets were partially offset by declines in the U.S., Continental Europe, Australia and Italy. Emerging markets volume included an extra month of results for Brazil, which was more than offset by the Company's decision to exit the T.G.I Friday's® frozen meals business in the U.S. Emerging markets, the Company's top 15 brands and global ketchup continued to be the Company's primary growth drivers, with organic sales growth of 16.8%, 3.6% and 4.6%, respectively (reported sales growth of 14.3%, 0.8%, and 2.8%, respectively). Net pricing increased sales by 2.1%, driven by price increases across the emerging markets, as well as in Continental Europe and U.S. Foodservice. Divestitures decreased sales by 0.3%, and unfavorable foreign exchange rates decreased sales by 2.5%.
Gross profit increased $201 million, or 5.0%, to $4.20 billion, and gross profit margin increased 170 basis points to 36.4%. Current year gross profit includes the previously discussed $3.5 million charge related to the closure of a factory in South Africa. Excluding this charge and charges for productivity initiatives in Fiscal 2012, gross profit margin increased 60 basis points, and gross profit increased $74 million, or 1.8%, as the benefits from higher pricing, volume and productivity initiatives were offset by a $104 million unfavorable impact from foreign exchange and higher commodity costs.
SG&A increased $41 million, or 1.7%, to $2.53 billion, and increased as a percentage of sales to 22.0% from 21.7%. Current year SG&A includes the previously discussed special items of $12 million for the Foodstar earn-out settlement and $45 million in transaction-related costs associated with the Merger Agreement. Excluding these current year special items and charges for productivity initiatives in Fiscal 2012, SG&A increased $60 million, or 2.5%, to $2.48 billion and increased as a percentage of sales to 21.5% from 21.0%. The increase in aggregate spending reflects higher marketing spending, incremental investments in Project Keystone, and strategic investments to drive growth in emerging markets partially offset by a $66 million impact from foreign exchange translation rates, reduced pension expense and effective cost management in developed markets.
Operating income increased $159 million, or 10.6%, to $1.66 billion Excluding the special items in the current year and charges for productivity initiatives in Fiscal 2012, operating income increased $14 million, or 0.8%, to $1.72 billion.
Net interest expense decreased $3 million, to $256 million, reflecting a $9 million decrease in interest expense and a $7 million decrease in interest income, both of which are driven by lower interest rates. Other expense, net, increased $54 million, to $62 million in the current year, primarily due to a $43 million currency translation loss previously discussed recorded during the fourth quarter of Fiscal 2013 resulting from the devaluation of the Venezuelan currency relative to the U.S. dollar, changing the official
15
exchange rate from 4.30 to 6.30. The remaining increase is due to other currency losses this year compared to currency gains last year.
The effective tax rate for Fiscal 2013 decreased to 18.0% from 19.8% in the prior year on a reported basis. Excluding special items in the current year and productivity initiatives last year, the effective rate was 18.2% compared to 21.3% last year. The decrease in the effective tax rate is primarily the result of increased benefits from the revaluation of the tax basis of certain foreign assets, which includes our Fiscal 2013 reorganization, and reduced charges for the repatriation of current year foreign earnings. See below in "Liquidity and Financial Position" for further explanation.These amounts were partially offset by lower current year benefits from tax free interest and tax on income of foreign subsidiaries. The prior year also contained a benefit from the resolution of a foreign tax case. Both periods contained a benefit of approximately $15 million from the reversal of an uncertain tax position liability due to the expiration of the statute of limitations in a foreign tax jurisdiction as well as benefits in each year related to 200 basis point statutory tax rate reductions in the United Kingdom.
Income from continuing operations attributable to H. J. Heinz Company was $1.09 billion, an increase of 11.6% compared to $974 million in the prior year on a reported basis. Excluding special items, income from continuing operations was $1.17 billion, an increase of 4.5% compared to $1.12 billion in the prior year excluding charges for productivity initiatives. Diluted earnings per share from continuing operations of $3.37 were up 12.0% compared to $3.01 in the prior year on a reported basis. Excluding special items, diluted earnings per share was $3.62, an increase of 4.9% compared to $3.45 in the prior year excluding charges for productivity initiatives. EPS movements were unfavorably impacted by $0.09 from currency translation and translation hedges.
The impact of fluctuating translation exchange rates in Fiscal 2013 has had a relatively consistent impact on all components of operating income on the consolidated statement of income.
FISCAL YEAR 2013 OPERATING RESULTS BY BUSINESS SEGMENT
North American Consumer Products
Sales of the North American Consumer Products segment decreased $46 million, or 1.4%, to $3.20 billion. Volume decreased 1.1% despite volume improvements in Heinz® ketchup and mayonnaise, Ore-Ida® and non-branded frozen potatoes, Classico® pasta sauces and Delimex® frozen snacks. These volume improvements were more than offset by the planned exit of T.G.I Friday's® frozen meals and volume declines in Smart Ones® frozen products, reflecting category softness and the discontinuation of bagged meals, and in T.G.I Friday's® frozen snacks. Higher net price of 0.6% reflects price increases in Heinz® ketchup and Smart Ones® frozen products, reflecting reduced promotions, partially offset by increased promotions on Ore-Ida® frozen potatoes. Sales were also unfavorably impacted by 0.7% from the Company's strategic decision to exit the Boston Market® license. Unfavorable Canadian exchange translation rates decreased sales 0.2%
Gross profit increased $7 million, or 0.6%, to $1.33 billion, and the gross profit margin increased to 41.7% from 40.9%. Gross margin increased as productivity improvements and slightly higher pricing more than offset increased commodity costs. Operating income decreased $21 million, or 2.6% to $791 million, largely due to higher marketing (+9%) and increased selling and distribution expense ("S&D") and general and administrative expenses ('"G&A") in Canada related to the implementation of Project Keystone.
Europe
Heinz Europe sales decreased $127 million, or 3.7%, to $3.31 billion, reflecting a 3.4% decline from foreign exchange translation rates. Net pricing increased 0.9%, driven by lower promotions across Continental Europe and on Aunt Bessie's® frozen potatoes in the U.K. and higher pricing on Heinz® ketchup in Russia, partially offset by higher promotions on Heinz® soup and beans in the U.K. Volume decreased 0.8%, as strong performance in Heinz® ketchup, our Russian business and Heinz® soup in the U.K. were more than offset by volume declines in Heinz® beans and pasta meals and frozen meals in the U.K. and the impact from weak economies and soft category sales in Italy and Continental Europe. The divestitures of two small businesses decreased sales 0.5%.
Gross profit decreased $44 million, or 3.3%, to $1.28 billion, while the gross profit margin increased slightly to 38.5% from 38.3%. The gross margin improvement reflects higher pricing, productivity improvements and favorable cross currency rate movements related to the sourcing of finished goods across the European supply chain, partially offset by higher commodity costs. The $44 million decrease in gross profit was due to the impact of unfavorable foreign exchange translation rates. Operating income decreased $16 million, or 2.6%, to $593 million, as lower G&A costs reflecting reduced pension and incentive compensation expense were more than offset by unfavorable foreign exchange translation rates and increased investments in our emerging markets businesses.
16
Asia/Pacific
Heinz Asia/Pacific sales increased $33 million, or 1.3%, to $2.53 billion, despite unfavorable exchange translation rates decreasing sales by 3.0%. Volume increased 2.7%, largely a result of growth in ABC® products in Indonesia, Glucon D® and Nycil® branded products in India resulting from an excellent summer season and increased marketing, strong performance in Japan and continued strong performance of Heinz® and Master® branded sauces in China. These increases were partially offset by declines in soup and infant feeding in Australia and Complan® nutritional beverages in India. Pricing increased 1.6%, due to ABC® products in Indonesia, Complan® nutritional beverages in India and Master® branded sauces in China, partially offset by higher promotional spending in Australia.
Despite unfavorable foreign exchange translation rates, gross profit increased $48 million, or 6.3%, to $805 million, and the gross profit margin increased to 31.8% from 30.3%. The higher gross margin reflects productivity improvements and higher pricing, partially offset by higher commodity costs, particularly sugar costs in Indonesia. SG&A increased as investments in marketing and in improved capabilities in our emerging markets businesses were partially offset by foreign exchange translation rates and a gain in the current year on the sale of excess land in Indonesia. Operating income increased by $31 million, or 13.3%, to $266 million. Australia's operating income improved this year as a result of savings from last year's productivity initiatives.
U.S. Foodservice
Sales of the U.S. Foodservice segment increased $25 million, or 1.9%, to $1.37 billion. Pricing increased sales 2.7%, largely due to price increases across this segment's product portfolio to offset commodity cost increases. Volume decreased by 0.8%, as improvements in sauces were offset by declines in frozen soup and ketchup.
Gross profit increased $16 million, or 4.2%, to $406 million, and the gross profit margin increased to 29.6% from 29.0%, as higher pricing more than offset increases in manufacturing and commodity costs. Operating income increased $16 million, or 9.6%, to $186 million, which was primarily due to higher gross profit.
Rest of World
Sales for Rest of World increased $137 million, or 14.0%, to $1.12 billion. Volume increased 12.3% due primarily to increases in both Quero® and Heinz® branded products in Brazil, Heinz® baby food in Mexico reflecting the launch of pouch packaging, and Complan® nutritional beverages in the Middle East. Approximately 60% of the volume gains in Brazil are a result of the favorable impacts from marketing and promotional activities, increased distribution and the successful introduction of Heinz® branded ketchup into this market. Approximately one-third of the volume gains in this segment and 40% of Brazil's volume gains are a result of one extra month of sales reported in Brazil in the current year, as the business no longer requires an earlier closing date to facilitate timely reporting. This extra month impact was split evenly between the Ketchup & Sauces and Meals & Snacks categories and mainly impacted Quero® branded sales. Pricing across the region increased sales by 11.3%, largely due to price increases on Quero® branded products in Brazil as well as increases in Venezuela taken to mitigate inflation. Venezuela's pricing was still significantly favorable despite the unfavorable pricing impact of the devaluation of the Venezuelan currency relative to the U.S. dollar that occurred at the beginning of the fourth quarter of this year. (See the “Venezuela- Foreign Currency and Inflation” section below for further discussion on inflation in Venezuela.) Foreign exchange translation rates decreased sales 9.6%.
Gross profit increased $46 million, or 14.0%, to $373 million, due to strong results in Brazil which are a result of significant growth in this business and the extra month of results in the current year, partially offset by unfavorable foreign exchange translation rates and the impact from the Venezuelan currency devaluation. Gross profit margin increased slightly to 33.5% from 33.4% as higher pricing and productivity improvements were offset by increased commodity and other manufacturing costs particularly in Venezuela and Brazil. Operating income increased $8 million, or 7.2%, to $113 million, due to strong performance in Brazil.
Fiscal 2012 Company Results- Fiscal Year Ended April 27, 201129, 2012 compared to Fiscal Year Ended April 28, 201027, 2011
Sales for Fiscal 20112012 increased $212$949 million, or 2.0%9.0%, to $10.71$11.51 billion. Net pricing increased sales by 3.7%, driven by price increases across the Company, particularly in the U.S., Latin America, U.K. and China. Volume increased 0.7%decreased 0.1%, as favorable volume in emerging markets, as well as improvements in North American Consumer ProductsJapan and Germany were partiallymore than offset by declines in the U.S. Foodservice,, Australia and Germany.Italy. Emerging markets, global ketchup and our Topthe Company's top 15 brands continued to be importantthe most significant growth drivers, with combined volumeorganic sales growth of 17.6%, 8.0%, and pricing gains5.0%, respectively (43.1%, 9.7% and 12.3%, respectively, reported). Acquisitions, net of 14.4% in emerging markets and 3.8% in our Top 15 brands. Net pricingdivestitures, increased sales by 1.2%, as price increases in emerging markets, particularly Latin America, U.S. Foodservice and the U.K. were partially offset by increased trade promotions in the North American Consumer Products and Australian businesses. Acquisitions3.6%. Foreign exchange translation rates increased sales by 0.6%, while foreign exchange translation rates reduced sales by 0.5%1.8%.
Gross profit increased $158$50 million, or 4.2%1.3%, to $3.95$3.99 billion andhowever, the gross profit margin increaseddecreased 270 basis points to 36.9% from 36.2%34.7%. GrossExcluding charges for productivity initiatives, gross profit increased as$180 million, or 4.6%, to $4.12 billion, largely due
17
to higher volume, net pricing, productivity improvementsacquisitions and thea $59 million favorable impact from the Foodstar acquisition wereforeign exchange, partially offset by lower volume and commodity cost inflation. Gross profit margin excluding charges for productivity initiatives reflected industry-wide price and cost pressure and decreased 160 basis points to 35.8%, resulting from higher commodity and other costs, the impact of acquisitions and unfavorable sales mix, partially offset by higher pricing and productivity improvements.
SG&A increased $236 million, or 10.4% to $2.49 billion. Excluding charges for productivity initiatives, SG&A increased $160 million, or 7.1% to $2.42 billion, and decreased as a $33percentage of sales to 21.0% versus 21.4% last year. This increase in SG&A reflects a $36 million unfavorable impact from foreign exchange translation rates, as well as increases from acquisitions, higher commodity costs.marketing spending and incremental investments in Project Keystone. In addition, last year’s gross profit included $24 million in charges for a corporation-wide initiative to improve productivity, partially offset by a $15 million gain related to property sold in the Netherlands as discussed previously.
16
Operating income increased $89decreased $185 million, or 5.7%11.0%, to $1.65 billion, reflecting the items above.$1.50 billion. Excluding charges for productivity initiatives, operating income was up $20 million, or 1.2%, to $1.71 billion.
Net interest expense increased $2$8 million, to $253$258 million, reflecting a $23$20 million decreaseincrease in interest income andexpense, partially offset by a $20$12 million decreaseincrease in interest expense.income. The decreaseincrease in interest income is mainly due to a $24 million gainearnings on short-term investments and the increase in interest expense is largely due to interest rate mix in the prior year on a total rate of return swap, which was terminatedCompany's debt portfolio and acquisitions made in August 2009. Interest expense decreased due to lower average interest rates and debt balances.Fiscal 2011. Other expenses, net, increased $3.0decreased $13 million, to $21$8 million, primarily due to currency gains in Fiscal 2012 compared to currency losses partially offset by $9 million of charges in the prior year recognized in connection with the dealer remarketable securities exchange transaction (see below in “Liquidity and Financial Position” for further explanation of this transaction).Fiscal 2011.
The effective tax rate for Fiscal 20112012 was 26.8% compared to 27.8%19.8%. Excluding charges for productivity initiatives, the prior year. The current year effective tax rate was lower than21.3% in Fiscal 2012 compared to 26.2% in Fiscal 2011. The decrease in the prior yeareffective tax rate is primarily due tothe result of the increased benefits from the revaluation of the tax basis of foreign assets, the reversal of an uncertain tax position liability due to the expiration of the statute of limitations in a foreign tax planningjurisdiction, the beneficial resolution of a foreign tax case, and increasedlower tax exempton the income of foreign income,subsidiaries primarily resulting from a statutory tax rate reduction in the U.K. These benefits were partially offset by higher taxes on repatriation of earnings.the Fiscal 2012 expense for changes in valuation allowances.
Income from continuing operations attributable to H. J. Heinz Company was $990$974 million, a decrease of 5.3%. Excluding charges for productivity initiatives, income from continuing operations attributable to H. J. Heinz Company was $1.12 billion compared to $914 million$1.03 billion in the prior year,Fiscal 2011, an increase of 8.2%8.7%. TheThis increase was largely due to higher operating income, reduced interest expense,sales and a lower effective tax rate, and $28 million in prior year after-tax charges ($0.09 per share) for targeted workforce reductions and non-cash asset write-offs. These were partially offset by an $11 million after-tax gaina lower gross margin and investments in the prior year related to property sold in the Netherlandsmarketing, emerging markets capabilities and a $15 million after-tax gain in the prior year on a total rate of return swap.Project Keystone. Diluted earnings per share from continuing operations were $3.06$3.01 in the current yearFiscal 2012, down 5.3%. Excluding charges for productivity initiatives, diluted earnings per share from continuing operations were $3.45 in Fiscal 2012 compared to $2.87$3.18 in the prior year,Fiscal 2011, up 6.6%8.5%. EPS movements were unfavorablyfavorably impacted by 1.5% higher shares outstanding and by $0.06 from currency fluctuations, after taking into account the net effect of currenttranslation and prior year currency translation contracts and foreign currency movements on translation.hedges.
The impact of fluctuating translation exchange rates in Fiscal 20112012 has had a relatively consistent impact on all components of operating income on the consolidated statement of income.
FISCAL YEAR 20112012 OPERATING RESULTS BY BUSINESS SEGMENT
North American Consumer Products
Sales of the North American Consumer Products segment increased $74decreased $24 million, or 2.3%0.7%, to $3.27$3.24 billion. Volume increased 2.0% asHigher net price of 2.8% reflects price increases across the leading brands and reduced trade promotions. Despite volume gains from new products and increased trade promotions drove improvements inHeinz® ketchup and gravy,Smart Ones® frozen entrees,Classico® pasta sauces,Ore-Ida® frozen potatoes andTGI Friday’s® frozen meals and appetizers. These increases were partially offset by declines inBoston Market® frozen products as we transition away from theBoston Market® license which should be completed in the first quarter of Fiscal 2012. In addition,product launches, overall volume is updeclined 2.3% across most product categories in Canada. Net prices decreased 1.1%of our key brands reflecting trade promotion increases in Canada,reduced promotional activity and the Consumer Value Program launched inimpact of price increases. Sales were also unfavorably impacted by 1.6% from the U.S. inCompany's strategic decision to exit the second half of the prior year and trade spending in the current year to support the launch ofTGI Friday’sBoston Market®single serve frozen products. The acquisition of Arthur’s Fresh Company, a small chilled smoothies business in Canada, in the third quarter of Fiscal 2010, increased sales 0.2%. license effective July 2011. Favorable Canadian exchange translation rates increased sales 1.1%0.3%.
Gross profit increased $38decreased $51 million, or 2.8%3.7%, to $1.38$1.32 billion, and the gross profit margin decreased to 40.9% from 42.1%. Gross profit declined as higher pricing and productivity improvements were more than offset by increased commodity and fuel costs, lower volume and the impact from the exit of the Boston Market®license. The decline in gross margin is due to 42.1%higher commodity costs and unfavorable sales mix. Operating income decreased $21 million, or 2.5% to $812 million, as the decline in gross profit was partially offset by a decrease in G&A reflecting effective cost management, lower incentive compensation expenses and decreased S&D largely due to lower volume.
18
Europe
Heinz Europe sales increased $204 million, or 6.3%, to $3.44 billion. Net pricing increased 3.7%, driven by price increases across Europe and reduced promotions in the U.K. Volume increased by 0.6% as growth in ketchup across Europe, soup in the U.K., sauces in Germany and Heinz® branded sauces in Russia were offset by declines in Italian infant nutrition and frozen products in the U.K. The Italian infant nutrition business was unfavorably impacted by weakness in the Italian economy and corresponding softness in the category. Favorable foreign exchange translation rates increased sales by 1.9%.
Gross profit increased $52 million, or 4.1%, to $1.32 billion, while the gross profit margin decreased to 38.3% from 41.9%39.1%. The $52 million increase in gross profit dollars was aided byis due to favorable net pricing, increased volume and foreign exchange translation rates. The decrease in the gross profit margin improved asreflects the benefits from higher pricing and productivity improvements more than offset the shift in marketing funds to trade promotion investments and increased commodity costs. SG&A decreased as a result of the shift of marketing funds to trade promotions. Operating income increased $61 million, or 7.9%, to $833 million, reflecting higher volume, gross margin improvements and tight control of SG&A.
Asia/Pacific
Heinz Asia/Pacific sales increased $314$253 million, or 15.6%11.3%, to $2.32$2.50 billion. VolumeFavorable exchange translation rates increased 4.8%, due to significant growth inComplan® andGlucon D® nutritional beverages in India,ABC® products in Indonesia and infant feeding and frozen products in China and Japan. These increases were partially offsetsales by softness in Australia, which has been impacted by a difficult trade environment and generally weak category trends. Pricing rose 0.2%, reflecting increases onABC® products in Indonesia andComplan® andGlucon D® products in India offset by higher promotions in Australia.5.4%. The acquisition of Foodstar in China during the third quarter of Fiscal 2011 increased sales 2.9%3.2%. Favorable exchange translation ratesPricing increased sales2.1% and volume increased 0.5%. Total segment volume was negatively impacted by 7.7%.poor operating results in Australia. The Australian business has been impacted by a challenging market environment, higher promotions and reduced market demand. Price increases were realized on ABC® products in Indonesia, Complan®products in India, and Heinz® infant feeding products in China. Significant volume growth occurred in Complan® nutritional beverages in India, frozen potatoes and sauces in Japan, ABC® sauces in Indonesia, and Heinz® and Master® branded sauces and Heinz® branded infant feeding products in China. Beyond Australia, volume declines were noted in Glucon D® and Nycil® branded products in India.
Gross profit increased $103$46 million, or 16.8%6.4%, to $715$758 million, and the gross profit margin increaseddecreased to 30.8%30.3% from 30.5%31.7%. These increases reflect higher volumeThe $46 million increase in gross profit largely reflects favorable net pricing and pricing, favorable foreign exchange translation rates the impact ofand the Foodstar acquisition, a gainpartially offset by weakness in the current year on the sale of a factory in India,Australia, and productivity improvements, which includeFiscal 2011 gains from the favorable renegotiation of a long-term supply contract in Australia. These increases were reduced byAustralia and the sale of a factory in India. The decline in gross margin is a result of higher commodity costs particularlyand poor operating results in Indonesia and India,Australia which were only partially offset by transactional currency benefits.higher pricing and productivity improvements. SG&A increased as a result of foreign exchange translation rates, the Foodstar acquisition, increased marketing and investments to improve capabilities in our emerging markets businesses. Operating income increased $26decreased by $19 million, or 13.5%7.4%, to $222$235 million, primarily reflecting higher volume, improved gross margins and favorable foreign exchange. These improvements were partially offset by increased marketing investments and higher G&A.results in Australia.
U.S. Foodservice
Sales of the U.S. Foodservice segment decreased $16increased $7 million, or 1.1%0.5%, to $1.41$1.35 billion. Pricing increased sales 2.3%, largely due toHeinz® ketchup and other tomato products, reflecting reduced trade promotions and price increases takenacross this segment's product portfolio to help offset commodity cost increases. Volume decreased by 3.5%1.8%, due largely to declines in frozen desserts and soup as well as non-branded sauces.
18
Gross profit increased $20decreased $27 million, or 5.1%6.5%, to $422$390 million, and the gross profit margin increaseddecreased to 29.9%29.0% from 28.1%31.1%, as pricing and productivity improvements were more than offset by increased commodity and fuel costs and lower volume.unfavorable volume and product mix. Operating income increased $25decreased $14 million, or 16.8%7.4%, to $176$170 million, which is primarily due to the gross margin improvements and lower SGhigher commodity costs, partially offset by a decrease in G&A costs relating toexpenses which reflects effective cost management, including reduced incentive compensation expense.
Rest of World
Sales for Rest of World decreased $64increased $509 million, or 11.9%108.3%, to $470$979 million. Foreign exchange translation rates decreased sales 24.6%The Coniexpress acquisition in Brazil ("Quero"), or $131 million, largely due towhich was completed at the devaluation of the Venezuelan bolivar fuerte (“VEF”) late in the third quarterend of Fiscal 2010 (See the “Venezuela-Foreign Currency and Inflation” section below for further explanation)2011, increased sales 76.6%. Higher pricing increased sales by 17.2%21.5%, largely due to price increases in Latin America taken to mitigate inflation. Volume decreased 4.5% as increases in the Middle East resulting from new products, market expansion and increased marketing and promotions were more than offset by declines in Venezuela resulting from labor disruptions which occurred during Fiscal 2011.
19
20
21
19
Gross profit increased $37$158 million, or 23.1%93.2%, to $199$327 million, due mainly to increasedthe Quero acquisition in Brazil and higher pricing and volume, partially offset by increased commodity costs andcosts. The gross profit margin declined to 33.4% from 36.0% primarily reflecting the impact of the VEF devaluation.Quero acquisition. Operating income increased $17$52 million, or 32.2%96.9%, to $69$105 million asresulting from higher pricing and volume and the increase in gross profit was partially offset by increased marketing and higher S&D and G&A expenses reflecting growth-related investments and inflation in Latin America.Quero acquisition.
Liquidity and Financial Position
During the first quarter of cash received underFiscal 2013, the Company entered into an amendment of its $175 million accounts receivable securitization program (see additional explanation below), and from inventories, accrued expenses and income taxes. The Company received $12 million of cash in Fiscal 2011 forthat extended the termination of foreign currency hedge contracts (see Note 12, “Derivative Financial Instruments and Hedging Activities” in Item 8—“Financial Statements and Supplementary Data” for additional information) and received $48 million in the prior year from the termination of a total rate of return swap. The Company’s cash conversion cycle improved 5 days, to 42 days in Fiscal 2011 due to the improvements in accounts payable.
22
$853 million for the fiscal year ended April 27, 2011. and $117 million in Fiscals 2013 and 2012, respectively. See Note 14, “Financing8, “Debt and Financing Arrangements” inItem 8- “Financial Statements and Supplementary Data” for additional information. On May 31, 2013, subsequent to the Fiscal 2013 year end, the Company entered into an amendment of the $175 million accounts receivables securitization program that extended the term until May 30, 2014. Prior to this amendment, the Company accounted for transfers of receivables pursuant to this program as a sale and removed them from the consolidated balance sheet. This amendment results in the transfers no longer qualifying for sale treatment under U.S. GAAP. As a result, all transfers will be accounted for subsequent to this amendment as secured borrowings and the receivables sold pursuant to this program will be included on the balance sheet as trade receivables, along with the Deferred Purchase Price.
During the second quarter of Fiscal 2013, the Company completed a tax-free reorganization in a foreign jurisdiction which resulted in an increase in the tax basis of both fixed and intangible assets. The increased tax basis resulted in a $63 million discrete tax benefit fully recognized in the second quarter and is expected to provide cash flow benefits of approximately $91 million over the next 10 years as a result of the tax deductions of the assets over their amortization periods.
During the first quarter of Fiscal 2013, a foreign subsidiary of the Company exercised a tax option under local law to revalue certain of its intangible assets, increasing the local tax basis by $82 million. This revaluation resulted in a reduction of tax expense in Fiscal 2013 of $13 million, reflecting the deferred tax benefit from the higher tax basis partially offset by the tax liability arising from this revaluation of $13 million. During the second quarter of Fiscal 2012, a foreign subsidiary of the Company also exercised a tax option under local law to revalue certain of its intangible assets, increasing the local tax basis by $220 million. This revaluation resulted in a reduction in Fiscal 2012 tax expense of $35 million reflecting the deferred tax benefit from the higher tax basis partially offset by the tax liability arising from this revaluation of $35 million. The tax benefit from the higher basis amortization of both revaluations above will result in a reduction in cash taxes over the 20 year tax amortization period of approximately $95 million. Also, as a result of these taxable revaluations, the subsidiary made tax payments of $18 million and $10 million during the fiscal years ended April 28, 2013 and April 29, 2012, respectively, and is expected to make additional payments of approximately $16 million and $4 million during Fiscals 2014 and 2015, respectively.
Cash used for investing activities totaled $950$373 million compared to providing $13$402 million of cash last year. Capital expenditures totaled $336$399 million (3.1% (3.4% of sales) compared to $278$419 million (2.6% (3.6% of sales) in the prior year, which is in-line with planned levels. The Company expects capital spending as a percentage of sales to be 3.4% to 3.8% in Fiscal 2012. Cash paid for acquisitions in the current year totaled $618 million primarily related to Foodstar in China and Coniexpress in Brazil. In the prior year, cash paid for acquisitions was $11 million and primarily related to the Arthur’s Fresh Company in Canada. Proceeds from divestitures provided cash of $2 million in the current year compared to $19 million in the prior year which primarily related to the sale of our Kabobs and Appetizers And, Inc. frozen hors d’oeuvres foodservice businesses in the U.S. and our private label frozen desserts business in the U.K. Proceeds from disposals of property, plant and equipment were $13$19 million in the current year compared to $96$10 million in the prior year. The increase is primarily due to cash received for the sale of land in Indonesia in the current year. Proceeds from divestitures were $17 million in the current year reflecting proceeds receivedcompared to $4 million in Fiscal 2010 related to property sold in The Netherlands as discussed previously.the prior year. The current year decrease in restricted cash was $4 million compared to an increase in restricted cash of $10$39 million relates to restricted funds in our Foodstar business in China, and the prior year, decrease of $193 million in restricted cash representswhich primarily represented collateral that the
20
Company was returnedrequired to the Companymaintain in connection with the termination of a total rate of return swap entered into during the third quarter of Fiscal 2012 (see Note 13, "Derivative Financial Instruments and Hedging Activities" in August 2009.
Cash provided by financing activities totaled $257 million compared to cash used of $363 million last year.
Proceeds from long-term debt were $205 million in the current year and $1.91 billion in the prior year. During the first quarter of Fiscal 2013, the Company entered into a new variable rate three year 15 billion Japanese yen denominated credit agreement. The proceeds were swapped to 188.5 million U.S. dollars and the interest rate was fixed at 2.22%. During the fourth quarter of Fiscal 2012, the Company issued $300 million1.50% Notes due 2017 and $300 million2.85% Notes due 2022. During the second quarter of Fiscal 2012, the Company issued $300 million2.00% Notes due 2016 and $400 million3.125% Notes due 2021. During the first quarter of Fiscal 2012, the Company issued $500 million of private placement notes at an average interest rate of 3.48% with maturities of three, five, seven and ten years. Additionally, during the first quarter of Fiscal 2012, the Company issued $100 million of private placement notes at an average interest rate of 3.38% with maturities of five and seven years.
The current year proceeds from debt issuances were used to terminate a variable rate three year 15 billion Japanese yen denominated credit agreement that was due October 2012, and settle the associated swap, which had an immaterial impact to the Company's consolidated statement of income. Overall, payments on long-term debt were $224 million in the current year compared to $1.44 billion in the prior year. The prior year proceeds from debt issuances were used for the repayment of commercial paper and to pay off the Company's $750 million of notes which matured on July 15, 2011 and $600 million notes which matured on March 15, 2012.
Net proceeds on commercial paper and short-term debt were $1.09 billion this year compared to net payments of $43 million in the prior year. See below for further discussion of a Level 3 instrument. Key assumptionsshort-term credit agreement entered into in determiningApril 2013.
Cash payments for treasury stock purchases, net of cash from option exercises, used $26 million of cash in the fair valuecurrent year compared to $119 million in the prior year. The Company repurchased 2.4 million shares of stock at a total cost of $139 million, in the current year and 3.9 million shares of stock at a total cost of $202 million in the prior year. Under the terms of the earn-out includeMerger Agreement, the discount rateCompany suspended its share repurchase program from February 13, 2013 through the closing of the acquisition on June 7, 2013.
Dividend payments totaled $666 million this year, compared to $619 million for the same period last year, reflecting an increase in the annualized dividend per common share to $2.06. Until the effective time of the merger, the Merger Agreement permitted the Company to continue to declare and revenuepay regular quarterly cash dividends not to exceed $0.515 per share of common stock with record dates and EBITDA projectionspayment dates that were substantially consistent with the Company's past practice. The Merger Agreement did not permit the Company to pay a prorated dividend for Fiscalsthe quarter in which the merger was completed.
During the first quarter of Fiscal 2013, and 2014.
23
24
At April 27, 2011,28, 2013, the Company had total debt of $4.61$6.01 billion (including $151$122 million relating to the hedge accounting adjustments) and cash and cash equivalents and short-term investments of $784 million.$2.48 billion. Total debt balances have decreased slightlyincreased since prior year end due to the items discussed above.
At April 28, 2013, the Company had a $1.5 billion credit agreement which was scheduled to expire in June 2016. This credit agreement supported the Company's commercial paper borrowings. In April 2013, the Company entered into a new $1.5 billion 1.28% credit agreement under which it borrowed $1.1 billion primarily to pay off all of the outstanding commercial paper. Both credit agreements were terminated on June 7, 2013 in conjunction with the closing of the Merger Agreement. The Company has historically maintained a commercial paper program that was used to fund operations in the U.S., principally within fiscal quarters. The Company's average commercial paper borrowings during the fourth quarter of Fiscal 2013 was approximately $1.01 billion and the maximum amount of commercial paper borrowings outstanding during the fourth quarter of Fiscal 2013 was $1.34 billion. Historically, the Company's commercial paper maturities were funded principally through new issuances and were repaid by quarter-end using cash from operations and overseas cash which was available for use in the U.S. on a short-term basis without being subject to U.S. tax. In addition, the Company has $438 million of foreign lines of credit available at April 28, 2013. Certain of the Company's debt agreements contain customary covenants, including a leverage ratio covenant. The Company was in compliance with all of its debt covenants as of April 28, 2013.
21
In connection with the closing of the Merger, Merger Subsidiary obtained the following:
$9.5 billion in senior secured term loans, with tranches of 6 and 7 year maturities and fluctuating interest rates based on, at the Company's election, base rate or LIBOR plus a spread on each of the tranches, with respective spreads ranging from 125-150 basis points for base rate loans with a 2% base rate floor and 225-250 basis points for LIBOR loans with a 1% LIBOR floor, and
$2.0 billion senior secured revolving credit facility with a 5 year maturity and a fluctuating interest rate bsed on, at the Company's election, base rate or LIBOR, with respective spreads ranging from 50-100 basis points for base rate loans and 150-200 basis points for LIBOR loans, on which nothing is currently evaluating alternativesdrawn.
When the Merger was consummated, such indebtedness was assumed by the Company, substantially increasing the Company's overall level of debt.
On April 1, 2013, in connection with the Merger, Merger Subsidiary completed the private placement of $3.1 billion aggregate principal amount of Notes to initial purchasers for resale by the refinancingand/or retirementInitial Purchasers to qualified institutional buyers pursuant to Rule 144A under the Securities Act and to persons outside the United States under Regulation S of the $1.45 billion of long-term debt maturing in Fiscal 2012. On May 26, 2011, subsequentSecurities Act. The Notes were issued pursuant to the fiscal year end,Indenture, dated as of April 1, 2013, by and among Merger Subsidiary, Hawk Acquisition Intermediate Corporation II and the Trustee and Collateral Agent On June 7, 2013, the Company, certain of its direct and indirect wholly owned domestic subsidiaries, the Trustee and the Collateral Agent entered into the Indenture Supplemental pursuant to which the Company assumed all of the obligations of Merger Subsidiary as issuer of the Notes. The Notes mature in 2020 and are required, within one year of consummation of the Merger Agreement, to be exchanged for notes registered with the SEC. In addition, in connection with the Merger, Parent issued $500 millionto Berkshire Hathaway 80,000 shares of private placement notes at an average interest rateits 9% Cumulative Perpetual Series A Preferred Stock for $8 billion.
A substantial portion of 3.48% with maturitiesthe Company's indebtedness outstanding prior to the Merger was subject to acceleration upon a change of three, five, sevencontrol or required the Company to offer holders the option to repurchase such indebtedness from such holders (assuming such change of control triggers certain downgrades in the ratings of the Company's debt). Certain of the Company's outstanding indebtedness as of April 28, 2013 that was not subject to acceleration upon a change of control and ten years. The proceeds will be usedthat either does not contain change of control repurchase obligations or where the holders did not elect to partially refinance debt that matureshave such indebtedness repurchased in Fiscal 2012.a change of control offer remained outstanding following completion of the Merger.
At April 27, 2011,28, 2013, approximately $600 million$2.3 billion of cash and short-term investments waswere held by international subsidiaries whose undistributed earnings are considered permanently reinvested. Our intent is to reinvest these funds in our international operations and our current plans do not demonstrate a need to repatriate them to fund our U.S. operations. If we decideddecide at a later date to repatriate these funds to the U.S., the Company would be required to provide taxes on these amounts based on the applicable U.S. tax rates net of credits for foreign taxes already paid.
After-tax return on invested capital (“ROIC”) is calculated by taking net income attributable to H.J. Heinz Company, plus net interest expense net of tax, divided by average invested capital. Average invested capital is a five-point quarterly average of debt plus total H.J. Heinz Company shareholders’ equity less cash and cash equivalents, short-term investments, restricted cash, and the hedge accounting adjustments. ROIC was 19.3%18.9% in Fiscal 2011, 17.8%2013, 16.8% in Fiscal 2010,2012, and 18.4%19.3% in Fiscal 2009. Fiscal 2011 ROIC was unfavorably impacted by 40 basis points as a result of the Coniexpress acquisition. Fiscal 2010 ROIC was negatively impacted by 90 basis points for the losses on discontinued operations.. The increase in ROIC in Fiscal 20112013 versus Fiscal 2012 was due to a 240 basis point unfavorable impact to Fiscal 2012 ROIC from charges for productivity initiatives, a 120 basis point unfavorable impact to Fiscal 2012 ROIC from the Quero and Foodstar acquisitions, and higher earnings excluding special items and charges for productivity initiatives in Fiscal 2013 compared to 2012, partially offset by a 130 basis point unfavorable impact to Fiscal 2010 is largely2013 ROIC from charges for special items as previously discussed and a 110 basis point unfavorable impact to Fiscal 2013 ROIC for losses on discontinued operations. The decrease in ROIC in Fiscal 2012 versus Fiscal 2011 was due to higher earningsa 240 basis point unfavorable impact to Fiscal 2012 ROIC from charges for productivity initiatives and reduced debt levelsa 180 basis point unfavorable impact to Fiscal 2012 ROIC from the Quero and Foodstar acquisitions, partially offset by higher equity reflecting the impact of cumulative translation adjustments. ROICearnings excluding charges for productivity initiatives in Fiscal 2009 was favorably impacted by 110 basis points due to the $107 million gain on foreign currency forward contracts discussed earlier. The remaining increase in Fiscal 2010 ROIC2012 compared to Fiscal 2009 is largely due to reduced debt levels and effective management of the asset base.2011.
25
Contractual Obligations and Other Commitments
Contractual Obligations
The Company is obligated to make future payments under various contracts such as debt agreements, lease agreements and unconditional purchase obligations. In addition, the Company has purchase obligations for materials, supplies, services and property, plant and equipment as part of the ordinary conduct of business. A few of these obligations are long-term and are based on minimum purchase requirements. Certain purchase obligations contain variable pricing components, and, as a result, actual cash payments are expected to fluctuate based on changes in these variable components. Due to the proprietary nature of some of the Company’s materials and processes, certain supply contracts contain penalty provisions for early terminations. The Company
22
does not believe that a material amount of penalties is reasonably likely to be incurred under these contracts based upon historical experience and current expectations.
The following table represents the contractual obligations of the Company as of April 27, 2011.28, 2013.
| Fiscal Year | ||||||||||||||||||||
| 2017 | ||||||||||||||||||||
| 2012 | 2013-2014 | 2015-2016 | Forward | Total | ||||||||||||||||
| (Amounts in thousands) | ||||||||||||||||||||
| Long Term Debt(1) | $ | 1,627,834 | $ | 1,630,192 | $ | 285,750 | $ | 4,455,247 | $ | 7,999,023 | ||||||||||
| Capital Lease Obligations | 65,275 | 34,845 | 13,611 | 19,389 | 133,120 | |||||||||||||||
| Operating Leases | 90,828 | 149,015 | 90,190 | 194,345 | 524,378 | |||||||||||||||
| Purchase Obligations | 989,102 | 762,729 | 278,488 | 51,715 | 2,082,034 | |||||||||||||||
| Other Long Term Liabilities Recorded on the Balance Sheet | 67,734 | 196,198 | 105,797 | 160,147 | 529,876 | |||||||||||||||
| Total | $ | 2,840,773 | $ | 2,772,979 | $ | 773,836 | $ | 4,880,843 | $ | 11,268,431 | ||||||||||
| Fiscal Year | |||||||||||||||||||
| 2014 | 2015-2016 | 2017-2018 | 2019 Forward | Total | |||||||||||||||
| (In thousands) | |||||||||||||||||||
Long Term Debt(1) | $ | 2,325,234 | $ | 555,607 | $ | 1,068,135 | $ | 5,338,616 | $ | 9,287,592 | |||||||||
| Capital Lease Obligations | 14,820 | 12,103 | 20,580 | 10,321 | 57,824 | ||||||||||||||
| Operating Leases | 242,638 | 135,220 | 102,549 | 196,162 | 676,569 | ||||||||||||||
| Purchase Obligations | 1,074,725 | 511,331 | 160,616 | 232,893 | 1,979,565 | ||||||||||||||
| Other Long Term Liabilities Recorded on the Balance Sheet | 167,421 | 305,928 | 211,915 | 274,713 | 959,977 | ||||||||||||||
| Total | $ | 3,824,838 | $ | 1,520,189 | $ | 1,563,795 | $ | 6,052,705 | $ | 12,961,527 | |||||||||
| (1) | Amounts include expected cash payments for interest on fixed rate long-term debt. Due to the uncertainty of forecasting expected variable rate interest payments, those amounts are not included in the table. |
Other long-term liabilities primarily consist of certain specific incentive compensation arrangements and pension and postretirement benefit commitments. The following long-termLong-term liabilities related to income taxes and insurance accruals included on the consolidated balance sheet are excluded from the table above: income taxes and insurance accruals. Theabove as the Company is unable to estimate the timing of the payments for these items.
At April 27, 2011,28, 2013, the total amount of gross unrecognized tax benefits for uncertain tax positions, including an accrual of related interest and penalties along with positions only impacting the timing of tax benefits, was approximately $117 million.$52 million. The timing of payments will depend on the progress of examinations with tax authorities. The Company does not expect a significant tax payment related to these obligations within the next year. The Company is currently unable to make a reasonably reliable estimate as to when any significant cash settlements with taxing authorities may occur.
Off-Balance Sheet Arrangements and Other Commitments
The Company does not have guarantees or other off-balance sheet financing arrangements that we believe are reasonably likely to have a current or future effect on our financial condition, changes in financial condition, revenue or expenses, results of operations, liquidity, capital expenditures or capital resources. In addition, the Company does not have any related party transactions that materially affect the results of operations, cash flow or financial condition.
26
As of April 27, 2011,28, 2013, the Company was a party to two operating leases for buildings and equipment, one of which also includes land, under which the Company has guaranteed supplemental payment obligations of approximately $135$150 million at the termination of these leases. TheOn June 3, 2013, the Company believes, basedpaid $88.7 million to buy-out one of these leases and recorded them within Property, plant and equipment on current facts and circumstances,the balance sheet as of that any payment pursuant to these guarantees is remote.date.
The Company acted as servicer for $29$159 million and $84$162 million of U.S. trade receivables sold through an accounts receivable securitization program that are not recognized on the balance sheet as of April 27, 2011 and April 28, 2010,2013 and April 29, 2012, respectively. In addition, the Company acted as servicer for approximately $146$184 million and $126$206 million of trade receivables which were sold to unrelated third parties without recourse as of April 27, 2011 and April 28, 2010,2013 and April 29, 2012, respectively. On May 31, 2013, subsequent to the Fiscal 2013 year end, the Company entered into an amendment of the $175 million accounts receivables securitization program that extended the term until May 30, 2014. Prior to this amendment, the Company accounted for transfers of receivables pursuant to this program as a sale and removed them from the consolidated balance sheet. This amendment results in the transfers no longer qualifying for sale treatment under U.S. GAAP. As a result, all transfers will be accounted for subsequent to this amendment as secured borrowings and the receivables sold pursuant to this program will be included on the balance sheet as trade receivables, along with the Deferred Purchase Price.
No significant credit guarantees existed between the Company and third parties as of April 27, 2011.28, 2013.
Market Risk Factors
The Company is exposed to market risks from adverse changes in foreign exchange rates, interest rates, commodity prices and production costs. As a policy, the Company does not engage in speculative or leveraged transactions, nor does the Company hold or issue financial instruments for trading purposes.
23
Foreign Exchange Rate Sensitivity: The Company’s cash flow and earnings are subject to fluctuations due to exchange rate variation. Foreign currency risk exists by nature of the Company’s global operations. The Company manufactures and sells its products on six continents around the world, and hence foreign currency risk is diversified.
The Company may attempt to limit its exposure to changing foreign exchange rates through both operational and financial market actions. These actions may include entering into forward contracts, option contracts, or cross currency swaps to hedge existing exposures, firm commitments and forecasted transactions. The instruments are used to reduce risk by essentially creating offsetting currency exposures.
The following table presents information related to foreign currency contracts held by the Company:
| Aggregate Notional Amount | Net Unrealized Gains/(Losses) | |||||||||||||||
| April 27, 2011 | April 28, 2010 | April 27, 2011 | April 28, 2010 | |||||||||||||
| (Dollars in millions) | ||||||||||||||||
| Purpose of Hedge: | ||||||||||||||||
| Intercompany cash flows | $ | 1,031 | $ | 726 | $ | 29 | $ | (5 | ) | |||||||
| Forecasted purchases of raw materials and finished goods and foreign currency denominated obligations | 726 | 814 | (32 | ) | (17 | ) | ||||||||||
| Forecasted sales and foreign currency denominated assets | 104 | 98 | 12 | 22 | ||||||||||||
| $ | 1,861 | $ | 1,638 | $ | 9 | $ | — | |||||||||
| Aggregate Notional Amount | Net Unrealized Gains/(Losses) | ||||||||||||
| April 28, 2013 | April 29, 2012 | April 28, 2013 | April 29, 2012 | ||||||||||
| (In millions) | |||||||||||||
| Purpose of Hedge: | |||||||||||||
| Intercompany cash flows | $ | 402 | 1,090 | $ | (3 | ) | 13 | ||||||
| Forecasted purchases of raw materials and finished goods and foreign currency denominated obligations | 422 | 578 | 21 | (5 | ) | ||||||||
| Forecasted sales and foreign currency denominated assets | 49 | 245 | 11 | 9 | |||||||||
| $ | 873 | 1,913 | $ | 29 | 17 | ||||||||
As of April 27, 2011,28, 2013, the Company’s foreign currency contracts mature within threetwo years. Contracts that meet qualifying criteria are accounted for as either foreign currency cash flow hedges, fair value hedges or net investment hedges of foreign operations. Any gains and losses related to contracts that do not qualify for hedge accounting are recorded in current period earnings in other income and expense.
Substantially all of the Company’s foreign business units’ financial instruments are denominated in their respective functional currencies. Accordingly, exposure to exchange risk on
27
foreign currency financial instruments is not material. (See Note 12,13, “Derivative Financial Instruments and Hedging Activities” in Item 8—“Financial Statements and Supplementary Data.”)
Interest Rate Sensitivity: The Company is exposed to changes in interest rates primarily as a result of its borrowing and investing activities used to maintain liquidity and fund business operations. The nature and amount of the Company’s long-term and short-term debt can be expected to vary as a result of future business requirements, market conditions and other factors. The Company’s debt obligations totaled $4.61$6.01 billion (including $151$122 million relating to hedge accounting adjustments) and $4.62$5.03 billion (including $207$128 million relating to hedge accounting adjustments) at April 27, 2011 and April 28, 2010,2013 and April 29, 2012, respectively. The Company’s debt obligations are summarized in Note 7,8, “Debt and Financing Arrangements” in Item 8—“Financial Statements and Supplementary Data.”
In order to manage interest rate exposure, the Company utilizes interest rate swaps to convert fixed-rate debt to floating. These derivatives are primarily accounted for as fair value hedges. Accordingly, changes in the fair value of these derivatives, along with changes in the fair value of the hedged debt obligations that are attributable to the hedged risk, are recognized in current period earnings. Based on the amount of fixed-rate debt converted to floating as of April 27, 2011,28, 2013, a variance of 1/8% in the related interest rate would cause annual interest expense related to this debt to change by approximately $2 million.$0.2 million. The following table presents additional information related to interest rate contracts designated as fair value hedges by the Company:
| April 27, 2011 | April 28, 2010 | |||||||
| (Dollars in millions) | ||||||||
| Pay floating swaps—notional amount | $ | 1,510 | $ | 1,516 | ||||
| Net unrealized gains | $ | 55 | $ | 109 | ||||
| Weighted average maturity (years) | 1.4 | 2.5 | ||||||
| Weighted average receive rate | 6.30 | % | 6.30 | % | ||||
| Weighted average pay rate | 1.32 | % | 1.47 | % | ||||
| April 28, 2013 | April 29, 2012 | ||||||
| (Dollars in millions) | |||||||
| Pay floating swaps—notional amount | $ | 160 | $ | 160 | |||
| Net unrealized gains | $ | 33 | $ | 36 | |||
| Weighted average maturity (years) | 7.2 | 8.2 | |||||
| Weighted average receive rate | 5.87 | % | 6.09 | % | |||
| Weighted average pay rate | 1.48 | % | 1.57 | % | |||
The Company terminated its $175 million notionalentered into a three-year total rate of return swap that waswith an unaffiliated international financial institution during the third quarter of Fiscal 2012 with a notional amount of $119 million. This instrument is being used as an economic hedge to reduce a portion of the interest cost related to the Company’s DRS.Company's $119 million remarketable securities. The unwinding of the total rate of return swap was completed in conjunction with the exchange of $681 million of DRS discussed in Note 7, “Debt and Financing Arrangements” in Item 8-“Financial Statements and Supplementary Data.” Upon termination of the swap, the Company received net cash proceeds of $48 million, in addition to the release of the $193 million of restricted cash collateral that the Company was required to maintain with the counterparty for the term of the swap. Prior to termination, the swap wasis being accounted for on a fullmark-to-market basis through current earnings, with gains and losses recorded as a component of interest income. TheDuring the fiscal year ended April 28, 2013, the Company recorded a benefit$1.8 million reduction in interest income, of $28 million for the year ended April 28, 2010, and $28 million for the year ended April 29, 2009, representing
24
changes in the fair value of the swap and interest earned on the arrangement, netarrangement. Net unrealized losses totaled $1.0 million as of transaction fees.April 28, 2013. In connection with this swap, the Company is required to maintain a restricted cash collateral balance of $34 million with the counterparty for the term of the swap. See Note 13, “Derivative Financial Instruments and Hedging Activities” in Item 8-“Financial Statements and Supplementary Data” for additional information.
The Company had outstanding cross-currency interest rate swaps with a total notional amount of $377$316 million and $160$386 million as of April 27, 2011 and April 28, 2010,2013 and April 29, 2012, respectively, which were designated as cash flow hedges of the future payments of loan principal and interest associated with certain foreign denominated variable rate debt obligations. As a result of exchange rate movement between the Japanese Yen and the U.S. Dollar throughout the fiscal year, net losses of $70.1 million on the cross-currency derivatives were reclassified from other comprehensive loss to other expense, net during Fiscal 2013. This net loss on the derivative was offset by a currency gain on the principal balance of the underlying debt obligation. Net unrealized gains/(losses)/gains related to these swaps totaled $9$(72) million and $(12)$20 million as of April 27, 2011 and April 28, 2010,2013 and April 29, 2012, respectively. The swaps that were entered into in Fiscal 2010These contracts are scheduled to mature in Fiscal 20132014 and the swaps that were entered into in the third quarter of Fiscal 2011 are scheduled to mature in Fiscal 2014.2016.
Effect of Hypothetical 10% Fluctuation in Market Prices: As of April 27, 2011,28, 2013, the potential gain or loss in the fair value of the Company’s outstanding foreign currency contracts,
28
interest rate contracts and cross-currency interest rate swaps assuming a hypothetical 10% fluctuation in currency and swap rates would be approximately:
| Fair Value Effect | ||||
| (Dollars in millions) | ||||
| Foreign currency contracts | $ | 137 | ||
| Interest rate swap contracts | $ | 5 | ||
| Cross-currency interest rate swaps | $ | 39 | ||
| Fair Value Effect | |||
| (In millions) | |||
| Foreign currency contracts | $ | 32 | |
| Interest rate swap contracts | $ | 3 | |
| Cross-currency interest rate swaps | $ | 32 | |
However, it should be noted that any change in the fair value of the contracts, real or hypothetical, would be significantly offset by an inverse change in the value of the underlying hedged items. In relation to currency contracts, this hypothetical calculation assumes that each exchange rate would change in the same direction relative to the U.S. dollar.
Venezuela- Foreign Currency and Inflation
The Company uses the official exchange rate to translate the financial statements of its Venezuelan subsidiary, since we expect to obtain U.S. dollars at the official rate for future dividend remittances. The official exchange rate in Venezuela had been fixed at 2.15 VEF to 1 U.S. dollar for several years, despite significant inflation. On January 8, 2010, the Venezuelan government announced the devaluation of its currency relative to the U.S. dollar. The official exchange rate for imported goods classified as essential, such as food and medicine, changed from 2.15 to 2.60, while payments for other non-essential goods moved to an exchange rate of 4.30. Effective January 1, 2011, the Venezuelan government eliminated the 2.60 exchange rate for essential goods leaving one flat official exchange rate of 4.30.
29
The impact of applying highly inflationary accounting for Venezuela on our consolidated financial statements is dependent upon movements in the applicableofficial exchange rates (at this time, the official rate)rate between the local currencyVenezuelan bolivar fuerte and the U.S. dollar and the amount of net monetary assets and liabilities included in our subsidiary’ssubsidiary's balance sheet. At April 27, 2011,
On February 8, 2013, the Venezuelan government announced the devaluation of its currency relative to the U.S. dollar, value of monetary assets, net of monetary liabilities, which would be subject to an earnings impact fromchanging the official exchange rate movements forfrom 4.30 to 6.30. As a result, the Company recorded a $43 million pre-tax currency translation loss, which was reflected within other expense, net, on the consolidated statement of income during the fourth quarter of Fiscal 2013 ($39 million after-tax loss). The monetary net asset position of our Venezuelan subsidiary under highly inflationary accounting was $67 million.also reduced as a result of the devaluation to $99 million at April 28, 2013. While our future operating results in Venezuela will be negatively impacted by the currency devaluation, we plan to take actions to help mitigate these effects. Accordingly, we do not expect the devaluation to have a material impact on our operating results going forward.
During Fiscal 2012, the Venezuelan government announced that it will be instituting price controls on a number of food and personal care products sold in the country. Such controls have impacted the products that the Company currently sells within this country. In Fiscal 2013, sales in Venezuela represented approximately 3% of the Company's total sales.
Recently Issued Accounting Standards
25
Non-GAAP Measures
Included in this report are measures of financial performance that are not defined by generally accepted accounting principles in the United States (“GAAP”). Each of the measures is used in reporting to the Company's executive management and as a component of the Board of Directors' measurement of the Company's performance for incentive compensation purposes. Management and the Board of Directors believed that these measures provided useful information to investors, and included these measures in other communications to investors.
For each of these non-GAAP financial measures, a reconciliation of the differences between the non-GAAP measure and the most directly comparable GAAP measure has been provided. In addition, an explanation of why management believes the non-GAAP measure provides useful information to investors and any additional information),purposes for which management uses the non-GAAP measure are provided below. These non-GAAP measures should be viewed in addition to, and not in lieu of, the comparable GAAP measure.
Results Excluding Special Items
Management believes that this measure provides useful information to investors because it is the profitability measure used to evaluate earnings performance on a reporting entity should apply premiums or discounts when market participants would do so when pricingcomparable year-over-year basis.
Fiscal 2013 Results Excluding Special Items
The special items are charges in Fiscal 2013 related to the asset or liability. The Company is required to adopt this amendment on January 26, 2012,following that, in management's judgment, significantly affect the first dayyear-over-year assessment of operating results:
Transaction-related costs, including legal, accounting and other professional fees, recorded during the fourth quarter of Fiscal 2012. The Company is currently evaluating the impact this amendment will have, if any, on its financial statements.
30
A charge primarily related to asset write-downs for the closure of a factory in South Africa.
A currency translation loss recorded in our Venezuelan business due to a devaluation of its currency relative to the U.S. dollar during the fourth quarter of Fiscal 2013. See Note 20, "Venezuela- Foreign Currency" in Item 8—"Financial Statement and Supplementary Data" for further explanation.
A charge for the Company's early settlement of the earn-out payment that was due in Fiscal 2014 related to the Fiscal 2011 acquisition of Foodstar. See Note 11, "Fair Value Measurements" in Item 8—"Financial Statement and Supplementary Data" for further explanation.
The following is the reconciliation of the Company's Fiscal 2013 results excluding these charges to the relevant GAAP measures.
| Fiscal Year Ended | ||||||||||||||
| April 28, 2013 | ||||||||||||||
| (Continuing Operations) | Sales | Gross Profit | SG&A | Operating Income | Effective Tax Rate | Net Income attributable to H.J. Heinz Company | Diluted EPS | |||||||
| (Amounts in thousands except per share amounts) | ||||||||||||||
| Reported results | $11,528,886 | $4,195,470 | $2,533,819 | $1,661,651 | 18.0 | % | $1,087,615 | $3.37 | ||||||
| Transaction-related costs | — | — | 44,814 | 44,814 | 38.1 | % | 27,752 | 0.09 | ||||||
| Charge for South Africa factory closure | — | 3,543 | — | 3,543 | 28.0 | % | 2,550 | 0.01 | ||||||
| Currency translation loss in Venezuela | — | — | — | — | 8.4 | % | 39,132 | 0.12 | ||||||
| Charge for settlement of Foodstar earn-out | — | — | 12,081 | 12,081 | — | % | 12,081 | 0.04 | ||||||
| Results excluding special items | $11,528,886 | $4,199,013 | $2,476,924 | $1,722,089 | 18.2 | % | $1,169,130 | $3.62 | ||||||
(Totals may not add due to rounding)
26
Fiscal 2012 Results Excluding Charges for Productivity Initiatives
| Fiscal Year Ended | ||||||||||||||
| April 29, 2012 | ||||||||||||||
| (Continuing Operations) | Sales | Gross Profit | SG&A | Operating Income | Effective Tax Rate | Net Income attributable to H.J. Heinz Company | Diluted EPS | |||||||
| Reported results | $11,507,572 | $3,994,789 | $2,492,482 | $1,502,307 | 19.8 | % | $974,374 | $3.01 | ||||||
| Charges for productivity initiatives | — | 129,938 | 75,480 | 205,418 | 29.9 | % | 143,974 | 0.45 | ||||||
| Results excluding charges for productivity initiatives | $11,507,572 | $4,124,727 | $2,417,002 | $1,707,725 | 21.3 | % | $1,118,348 | $3.46 | ||||||
Organic Sales Growth
Organic sales growth is a reporting entity determines when an entitynon-GAAP measure that is insufficiently capitalizeddefined as either volume plus price or total sales growth excluding the impact of foreign exchange and acquisitions and divestitures. This measure is not controlled through voting (or similar rights) should be consolidated.utilized by senior management to provide investors with a more complete understanding of underlying sales trends by providing sales growth on a consistent basis. The determinationlimitation of whether a reporting entitythis measure is required to consolidate another entity is based on, among other things, the purpose and designits exclusion of the other entityimpact of foreign exchange and acquisitions and divestitures.
| Organic Sales Growth | + | Foreign Exchange | + | Acquisitions/ Divestitures | = | Total Net Sales Change | ||||||
| FY13 Total Company | 3.1 | % | (2.5 | )% | (0.3 | )% | 0.2 | % | ||||
| FY12 Total Company | 3.6 | % | 1.8 | % | 3.6 | % | 9.0 | % | ||||
| FY13 global ketchup | 4.6 | % | (1.8 | )% | — | % | 2.8 | % | ||||
| FY12 global ketchup | 8.0 | % | 0.5 | % | 1.2 | % | 9.7 | % | ||||
| FY13 Emerging Markets | 16.8 | % | (7.1 | )% | 4.5 | % | * | 14.3 | % | |||
| FY12 Emerging Markets | 17.6 | % | (0.6 | )% | 26.0 | % | 43.1 | % | ||||
| FY13 Top 15 brands | 3.6 | % | (2.8 | )% | — | % | 0.8 | % | ||||
| FY12 Top 15 brands | 5.0 | % | 1.7 | % | 5.6 | % | 12.3 | % | ||||
* Emerging markets sales in Fiscal 2013 now include the markets of Papua New Guinea, South Korea and Singapore. Sales in these markets were included in developed markets sales in the prior year and therefore, were treated as an acquisition variance when comparing current year sales to the prior year for emerging markets.
Operating Free Cash Flow
Operating free cash flow is defined by the Company as cash flow from operations less capital expenditures net of proceeds from disposal of property, plant and equipment. This measure is utilized by senior management and the reporting entity’s abilityBoard of Directors to directgauge the activitiesCompany's business operating performance, including the progress of management to profitably monetize low return assets. The limitation of operating free cash flow is that it adjusts for cash used for capital expenditures and cash received from disposals of property, plant and equipment, the net of which is no longer available to the Company for other purposes. Management compensates for this limitation by using the GAAP operating cash flow number as well. Operating free cash flow does not represent residual cash flow available for discretionary expenditures and does not provide insight to the entire scope of the historical cash inflows or outflows of the Company's operations that are captured in the other entity that most significantly impact its economic performance. The amendment also requires additional disclosures about a reporting entity’s involvement with variable interest entities and any significant changescash flow measures reported in risk exposurethe statement of cash flows.
27
Total Company (in millions) | 2013 | 2012 | ||||
| Cash provided by operating activities | $ | 1,390.0 | $ | 1,493.1 | ||
| Capital expenditures | (399.1 | ) | (418.7 | ) | ||
| Proceeds from disposals of property, plant and equipment | 19.0 | 9.8 | ||||
| Operating Free Cash Flow | $ | 1,009.9 | $ | 1,084.2 | ||
| Cash paid for special items/productivity initiatives | 45.0 | 121.9 | ||||
| Operating Free Cash Flow excluding cash paid for special items/productivity initiatives | $ | 1,054.8 | $ | 1,206.1 | ||
(Totals may not add due to that involvement. A reporting entity is required to disclose how its involvement with a variable interest entity affects the reporting entity’s financial statements. The Company adopted this amendment on April 29, 2010, the first day of Fiscal 2011. This adoption did not have a material impact on the Company’s financial statements.rounding)
Discussion of Significant Accounting Estimates
In the ordinary course of business, the Company has made a number of estimates and assumptions relating to the reporting of results of operations and financial condition in the preparation of its financial statements in conformity with accounting principles generally accepted in the United States of America.GAAP. Actual results could differ significantly from those estimates under different assumptions and conditions. The Company believes that the following discussion addresses its most critical accounting policies, which are those that are most important to the portrayal of the Company’s financial condition and results and require management’s most difficult, subjective and complex judgments, often as a result of the need to make estimates about the effect of matters that are inherently uncertain.
Marketing Costs—Trade promotions are an important component of the sales and marketing of the Company’s products and are critical to the support of the business. Trade promotion costs include amounts paid to retailers to offer temporary price reductions for the sale of the Company’s products to consumers, amounts paid to obtain favorable display positions in retailers’ stores, and amounts paid to customers for shelf space in retail stores. Accruals for trade promotions are initially recorded at the time of sale of product to the customer based on an estimate of the expected levels of performance of the trade promotion, which is dependent upon factors such as historical trends with similar promotions, expectations regarding customer participation, and sales and payment trends with similar previously offered programs. Our original estimated costs of trade promotions may change in the future as a result of changes in customer participation, particularly for new programs and for programs related to the introduction of new products. We perform monthly evaluations of our
31
outstanding trade promotions, making adjustments where appropriate to reflect changes in estimates. Settlement of these liabilities typically occurs in subsequent periods primarily through an authorization process for deductions taken by a customer from amounts otherwise due to the Company. As a result, the ultimate cost of a trade promotion program is dependent on the relative success of the events and the actions and level of deductions taken by the Company’s customers for amounts they consider due to them. Final determination of the permissible deductions may take extended periods of time and could have a significant impact on the Company’s results of operations depending on how actual results of the programs compare to original estimates.
We offer coupons to consumers in the normal course of our business. Expenses associated with this activity, which we refer to as coupon redemption costs, are accrued in the period in which the coupons are offered. The initial estimates made for each coupon offering are based upon historical redemption experience rates for similar products or coupon amounts. We perform monthly evaluations of outstanding coupon accruals that compare actual redemption rates to the original estimates. We review the assumptions used in the valuation of the estimates and determine an appropriate accrual amount. Adjustments to our initial accrual may be required if actual redemption rates vary from estimated redemption rates.
Goodwill and Indefinite-Lived Intangibles—Carrying values of goodwill and intangible assets with indefinite lives are reviewed for impairment at least annually, or when circumstances indicate that a possible impairment may exist. Indicators such as unexpected adverse economic factors, unanticipated technological change or competitive activities, decline in expected cash flows, slowerlower growth rates, loss of key personnel, and acts by governments and courts,changes in regulation, may signal that an asset has become impaired.
28
All goodwill is assigned to reporting units, which are primarily one level below our operating segments. Goodwill is assigned to the reporting unit that benefits from the cash flows arising from each business combination. We perform ourThe Company performs its impairment tests of goodwill at the reporting unit level. The Company has 19 reporting units globally that have assigned goodwill and are thus required to be testedevaluated for impairment. The Company tests goodwill for impairment by either performing a qualitative evaluation or a two-step quantitative test. The qualitative evaluation is an assessment of factors, including reporting unit specific operating results as well as industry, market and general economic conditions, to determine whether it is more likely than not that the fair values of a reporting unit is less than its carrying amount, including goodwill. The Company may elect to bypass this qualitative assessment for some or all of its reporting units and perform a two-step quantitative test.
The Company’sCompany's estimates of fair value when testing for impairment of both goodwill and intangible assets with indefinite lives isunder the quantitative assessment are based on a discounted cash flow model as management believes forecasted cash flows are the best indicator of fair value. A number of significant assumptions and estimates are involved in the application of the discounted cash flow model, including future volume trends, revenue and expense growth rates, terminal growth rates, weighted-average cost of capital, tax rates, capital spending and working capital changes. The assumptions used in the discounted cash flow models were determined utilizing historical data, current and anticipated market conditions, product category growth rates, management plans, and market comparables.
32
Most of these assumptions vary significantly among the reporting units, but generally, higher assumed growth rates and discount rates were utilized infor tests of reporting units for which the principal market is an emerging markets whenmarket compared to those for which the principal market is a developed markets.market. For each of the reporting unit and indefinite-lived intangible asset,units tested quantitatively, we used a market-participant, risk-adjusted-weighted-average cost of capital to discount the projected cash flows of those operations or assets. Such discount rates ranged from 7-16%7% to 15% in Fiscal 2011.2013. Management believes the assumptions used for the impairment evaluation are consistent with those that would be utilized by market participants performing similar valuations of our reporting units. We validated our fair values for reasonableness by comparing the sum of the fair values for all of our reporting units, including those with no assigned goodwill, to our market capitalization and a reasonable control premium.
During the fourthsecond quarter of Fiscal 2011,2013, the Company changed its annual goodwill impairment testing date from the fourth quarter to the third quarter of each year. As such, the Company completed its annual review of goodwill and indefinite-lived intangible assets. No impairments were identified during the Company’s annualthird quarter of Fiscal 2013. We performed a qualitative assessment over nine of goodwillthe Company's 19 reporting units. The results of the quantitative tests performed for these nine reporting units in prior periods were considered, and indefinite-lived intangible assets. Thethese tests each indicated that the fair values of these reporting units significantly exceeded their carrying amounts. We concluded that there were no significant events in Fiscal 2013 which had a material impact on the fair values of these reporting units.
For the reporting units which were tested quantitatively, the fair values of each reporting unit significantly exceeded their carrying values, withvalues. No impairments related to continuing operations were identified during the exceptionCompany's annual assessment of one reporting unit,goodwill.
Indefinite-lived intangible assets are tested for impairment by either performing a qualitative evaluation or a quantitative calculation of fair value and comparison to carrying amount. The qualitative evaluation is an assessment of factors including, but not limited to, changes in which there was only a minor excess.management, overall financial performance, and other entity-specific events. The goodwill associated with this reporting unit was $57 million asobjective of April 27, 2011.the qualitative evaluation is to determine whether it is more likely than not that the fair value of an indefinite-lived intangible asset is less than its carrying amount. The Company can choose to perform the qualitative assessment on none, some, or all of its indefinite-lived intangible assets. During the fourth quarter of Fiscal 2013, the Company completed its annual review of indefinite-lived intangible assets. No impairments were identified during the Company's annual assessment of indefinite-lived intangible assets.
Retirement Benefits—The Company sponsors pension and other retirement plans in various forms covering substantially all employees who meet eligibility requirements. Several actuarial and other factors that attempt to anticipate future events are used in calculating the expense and obligations related to the plans. These factors include assumptions about the discount rate, expected return on plan assets, turnover rates and rate of future compensation increases as determined by the Company, within certain guidelines. In addition, the Company uses best estimate assumptions, provided by actuarial consultants, for withdrawal and mortality rates to estimate benefit expense. The financial and actuarial assumptions used by the Company may differ materially from actual results due to changing market and economic conditions, higher or lower withdrawal rates or longer or shorter life spans of participants. These differences may result in a significant impact to the amount of pension expense recorded by the Company.
The Company recognized pension (income)/expense related to defined benefit programs of $27$(4) million $25, $25 million, and $6$27 million for fiscal years 2011, 2010,2013, 2012, and 2009,2011, respectively, which reflected expected return on plan assets of $229$251 million $211, $235 million, and $208$229 million, respectively. The Company contributed $22$69 million to its pension plans in Fiscal 20112013 compared
29
to $540$23 million in Fiscal 20102012 and $134$22 million in Fiscal 2009.2011. The Company expects to contribute less than $40approximately $100 million to its pension plans in Fiscal 2012.2014.
One of the significant assumptions for pension plan accounting is the expected rate of return on pension plan assets. Over time, the expected rate of return on assets should approximate actual long-term returns. In developing the expected rate of return, the Company considers average real historic returns on asset classes, the investment mix of plan assets, investment manager performance and projected future returns of asset classes developed by respected advisors. When calculating the expected return on plan assets, the Company primarily uses a market-related-value of assets that spreads asset gains and losses (difference between actual return and expected return) uniformly over 3 years. The weighted average expected rate of return on plan assets used to calculate annual expense was 8.2%8.1% for the year ended April 28, 2013, and was 8.2% for the years ended April 29, 2012 and April 27, 2011 8.1% for the year end April 28, 2010, and 8.2% for year ended April 29, 2009.. For purposes of calculating Fiscal 20122014 expense, the weighted average rate of return will be approximately 8.2%8.1%.
Another significant assumption used to value benefit plans is the discount rate. The discount rate assumptions used to value pension and postretirement benefit obligations reflect the rates available on high quality fixed income investments available (in each country where the Company operates a benefit plan) as of the measurement date. The Company uses bond yields of appropriate duration for each country by matching it with the duration of plan liabilities. The weighted average discount rate used to measure the projected benefit obligation for the year ending April 27, 201128, 2013 decreased to 5.5%4.0% from 5.6%4.8% as of April 28, 2010.29, 2012.
33
Deferred gains and losses result from actual experience differing from expected financial and actuarial assumptions. The pension plans currently have a deferred loss amount of $910 million$1.35 billion at April 27, 2011.28, 2013. Deferred gains and losses are amortized through the actuarial calculation into annual expense over the estimated average remaining service period of plan participants, which is currently 910 years. However, if all or almost all of a plan’s participants are inactive, deferred gains and losses are amortized through the actuarial calculation into annual expense over the estimated average remaining life expectancy of the inactive participants.
The Company’s investment policy specifies the type of investment vehicles appropriate for the Plan, asset allocation guidelines, criteria for the selection of investment managers, procedures to monitor overall investment performance as well as investment manager performance. It also provides guidelines enabling Plan fiduciaries to fulfill their responsibilities.
The Company’s defined benefit pension plans’ weighted average actual and target asset allocation at April 27, 2011 and April 28, 20102013 and weighted average target allocationApril 29, 2012 were as follows:
| Target | ||||||||||||||||
| Plan Assets at | Allocation at | |||||||||||||||
| Asset Category | 2011 | 2010 | 2011 | 2010 | ||||||||||||
| Equity securities | 62 | % | 58 | % | 58 | % | 63 | % | ||||||||
| Debt securities | 32 | % | 29 | % | 32 | % | 35 | % | ||||||||
| Real estate | 3 | % | 1 | % | 9 | % | 1 | % | ||||||||
| Other(1) | 3 | % | 12 | % | 1 | % | 1 | % | ||||||||
| 100 | % | 100 | % | 100 | % | 100 | % | |||||||||
| Plan Assets at | Target Allocation at | |||||||||||
| Asset Category | 2013 | 2012 | 2013 | 2012 | ||||||||
| Equity securities | 62 | % | 61 | % | 58 | % | 59 | % | ||||
| Debt securities | 29 | % | 31 | % | 33 | % | 32 | % | ||||
| Real estate | 8 | % | 7 | % | 8 | % | 8 | % | ||||
| Other | 1 | % | 1 | % | 1 | % | 1 | % | ||||
| 100 | % | 100 | % | 100 | % | 100 | % | |||||
The Company also provides certain postretirement health care benefits. The postretirement health care benefit expense and obligation are determined using the Company’s assumptions regarding health care cost trend rates. The health care trend rates are developed based on historical cost data, the near-term outlook on health care trends and the likely long-term trends. The postretirement health care benefit obligation at April 27, 2011 as28, 2013 was determined using an average initial health care trend rate of 7.4%6.3% which gradually decreases to an average ultimate rate of 4.8% in 67 years. A one percentage point increase in the assumed health care cost trend rate would increase the service and interest cost components of annual expense by $2$2 million and increase the benefit obligation by $16 million.$19 million. A one percentage point decrease in the assumed health care cost trend rates would decrease the service and interest cost by $1$1 million and decrease the benefit obligation by $14 million.
$17 million.
The Patient Protection and Affordable Care Act (PPACA) was signed into law on March 23, 2010, and on March 30, 2010, the Health Care and Education Reconciliation Act of 2010 (HCERA) was signed into law, which amends certain aspects of the PPACA. Among other things, the PPACA reduces the tax benefits available to an employer that receives the Medicare Part D subsidy. As a result of the PPACA, the Company was required to recognize in Fiscal 2010 tax expense of $4 million (approximately $0.01 per share) related to reduced deductibility in future periods of the postretirement prescription drug coverage. The PPACA and HCERA (collectively referred to as the Act) will have both immediate and long-term ramifications for many employers, including the Company, that provide retiree health benefits.
30
Sensitivity of Assumptions
If we assumed a 100 basis point change in the following rates, the Company’s Fiscal 20112013 projected benefit obligation and expense would increase (decrease) by the following amounts (in millions):
| 100 Basis Point | ||||||||
| Increase | Decrease | |||||||
Pension benefits | ||||||||
| Discount rate used in determining projected benefit obligation | $ | (359 | ) | $ | 387 | |||
| Discount rate used in determining net pension expense | $ | (28 | ) | $ | 33 | |||
| Long-term rate of return on assets used in determining net pension expense | $ | (28 | ) | $ | 28 | |||
Other benefits | ||||||||
| Discount rate used in determining projected benefit obligation | $ | (20 | ) | $ | 21 | |||
| Discount rate used in determining net benefit expense | $ | (1 | ) | $ | 1 | |||
| 100 Basis Point | |||
| Increase | Decrease | ||
| Pension benefits | |||
| Discount rate used in determining projected benefit obligation | $(405) | $509 | |
| Discount rate used in determining net pension expense | $(27) | $30 | |
| Long-term rate of return on assets used in determining net pension expense | $(31) | $31 | |
| Other benefits | |||
| Discount rate used in determining projected benefit obligation | $(22) | $25 | |
| Discount rate used in determining net benefit expense | $(2) | $2 | |
Income Taxes—The Company computes its annual tax rate based on the statutory tax rates and tax planning opportunities available to it in the various jurisdictions in which it earns income. Significant judgment is required in determining the Company’s annual tax rate and in evaluating uncertainty in its tax positions. The Company recognizes a benefit for tax positions that it believes will more likely than not be sustained upon examination. The amount of benefit recognized is the largest amount of benefit that the Company believes has more than a 50% probability of being realized upon settlement. The Company regularly monitors its tax positions and adjusts the amount of recognized tax benefit based on its evaluation of information that has become available since the end of its last financial reporting period. The annual tax rate includes the impact of these changes in recognized tax benefits. When adjusting the amount of recognized tax benefits the Company does not consider information that has become available after the balance sheet date, but does disclose the effects of new information whenever those effects would be material to the Company’s financial statements. The difference between the amount of benefit taken or expected to be taken in a tax return and the amount of benefit recognized for financial reporting represents unrecognized tax benefits. These unrecognized tax benefits are presented in the balance sheet principally within other non-current liabilities.
The Company records valuation allowances to reduce deferred tax assets to the amount that is more likely than not to be realized. When assessing the need for valuation allowances, the Company considers future taxable income and ongoing prudent and feasible tax planning strategies. Should a change in circumstances lead to a change in judgment about the realizability of deferred tax assets in future years, the Company would adjust related valuation allowances in the period that the change in circumstances occurs, along with a corresponding increase or charge to income.
The Company has a significant amount of undistributed earnings of foreign subsidiaries that are considered to be indefinitely reinvested or which may be remitted tax free in certain situations.reinvested. Our intent is to continue to reinvest these earnings to support our priorities for growth in international markets and our current plans do not demonstrate a need to repatriate them to fund our U.S. operations. If we decided at a later date to repatriate these funds to the U.S., the Company would be required to provide taxes on these amounts based on the applicable U.S. tax rates net of credits for foreign taxes already paid. The Company has not determined the deferred tax liability associated with these undistributed earnings, as such determination is not practicable. The Company believes it is not practicable to calculate the deferred tax liability associated with these undistributed earnings as there is a significant amount of uncertainty with respect to the tax impact resulting from the significant judgment required to analyze the amount of foreign tax credits attributable to the earnings, the potential timing of any distributions, as well as the local withholding tax and other indirect tax consequences that may arise due to the potential distribution of these earnings.
Input Costs
In general, the effects of cost inflation may be experienced by the Company in future periods. During Fiscals 20102013, 2012, and 2011, the Company experienced wide-spread inflationary increases in commodity input costs, which is expected to continue in Fiscal 2012.2014. Price increases and continued productivity improvements have and are expected to continue to helpmore than offset these cost increases.
31
Stock Market Information
Prior to the Fiscal 2013 year end, H. J. Heinz Company common stock iswas traded principally on The New York Stock Exchange under the symbol HNZ. The number of shareholders of record of the Company’s common stock as of May 31, 2011June 20, 2013 approximated 34,400.31,300. The closing price of the common stock on The New York Stock Exchange composite listing on April 27, 201128, 2013 was $51.23.$72.45.
As a result of the Merger, the common stock of the Company is now privately held by a subsidiary of Parent, the sole shareholder of the Company. The Company's stock is no longer traded on The New York Stock Exchange or any other stock exchange or public market.
| Stock Price Range | ||||||||
| High | Low | |||||||
2011 | ||||||||
| First | $ | 47.48 | $ | 40.00 | ||||
| Second | 49.95 | 44.35 | ||||||
| Third | 50.77 | 47.51 | ||||||
| Fourth | 51.38 | 46.99 | ||||||
2010 | ||||||||
| First | $ | 38.85 | $ | 34.03 | ||||
| Second | 41.60 | 37.30 | ||||||
| Third | 43.75 | 39.69 | ||||||
| Fourth | 47.84 | 42.67 | ||||||
| Stock Price Range | |||||||
| High | Low | ||||||
| 2013 | |||||||
| First | $ | 55.48 | $ | 52.29 | |||
| Second | 58.56 | 54.37 | |||||
| Third | 60.96 | 56.77 | |||||
| Fourth | 72.70 | 59.20 | |||||
| 2012 | |||||||
| First | $ | 55.00 | $ | 50.95 | |||
| Second | 53.46 | 48.17 | |||||
| Third | 54.82 | 49.75 | |||||
| Fourth | 54.83 | 51.51 | |||||
Dividends
Historical information concerning dividends paid per share on our common stock by quarter follows:
| Fiscal Year Ended | |||||||
| April 28, 2013 | April 29, 2012 | ||||||
| First | $ | 0.515 | $ | 0.480 | |||
| Second | 0.515 | 0.480 | |||||
| Third | 0.515 | 0.480 | |||||
| Fourth | 0.515 | 0.480 | |||||
| Total | $ | 2.060 | $ | 1.920 | |||
Payments of dividends is restricted under our Senior Credit Facilities and the indenture governing our Notes, except for under limited circumstances. We do not expect for the foreseeable future to pay dividends on our common stock, other than to enable Parent to make certain dividend payments in respect of the 9% Cumulative Perpetual Series A Preferred Stock it issued to Berkshire Hathaway. Any future determination to pay additional dividends on our common stock will be at the discretion of our Board of Directors and will depend upon many factors, including our financial condition, earnings, capital requirements of our businesses, covenants associated with certain debt obligations, legal requirements, regulatory constraints, industry practice and other factors that the Board of Directors deems relevant.
32
Performance Graph
The following graph compares the cumulative total shareholder return on the Company's Common Stock over the five preceding fiscal years with the cumulative total shareholder return on the Standard & Poor's 500 Packaged Foods and Meats Index and the return on the Standard & Poor's 500 Index, assuming an investment of $100 in each at their closing prices on April 30, 2008 and reinvestment of dividends.
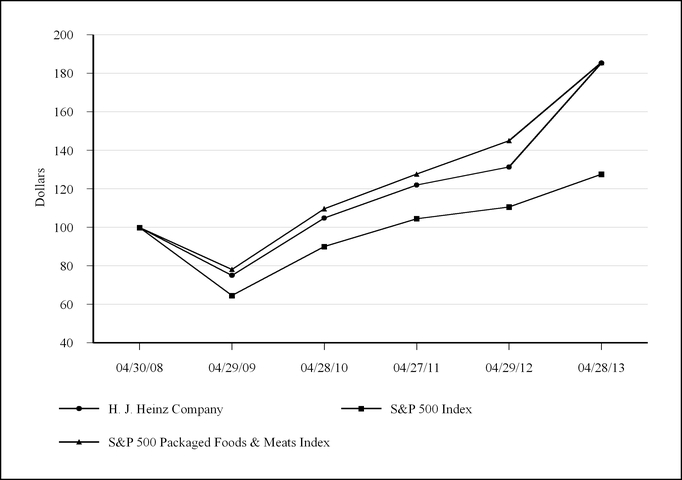
| 2008 | 2009 | 2010 | 2011 | 2012 | 2013 | ||||||||||||
| H.J. Heinz Company | 100.00 | 75.19 | 104.94 | 122.04 | 131.34 | 185.28 | |||||||||||
| S&P 500 | 100.00 | 64.74 | 90.14 | 104.63 | 110.69 | 127.65 | |||||||||||
| S&P 500 Packaged Foods & Meats Index | 100.00 | 78.32 | 109.77 | 127.72 | 145.05 | 185.55 | |||||||||||
| Item 7A. | Quantitative and Qualitative Disclosures About Market Risk. |
This information is set forth in this report in Item 7—“Management’s Discussion and Analysis of Financial Condition and Results of Operations” on pages 2723 through 29.25.
36
33
| Item 8. | Financial Statements and Supplementary Data. |
TABLE OF CONTENTS
37
34
Report of Management on Internal Control over Financial Reporting
Management is responsible for establishing and maintaining adequate internal control over financial reporting for the Company. Internal control over financial reporting refers to the process designed by, or under the supervision of, our Chief Executive Officer and Chief Financial Officer, and effected by our Board of Directors, management and other personnel, to provide reasonable assurance regarding the reliability of financial reporting and the preparation of financial statements for external purposes in accordance with generally accepted accounting principles in the United States of America, and includes those policies and procedures that:
(1) Pertain to the maintenance of records that, in reasonable detail, accurately and fairly reflect the transactions and dispositions of the assets of the Company;
(2) Provide reasonable assurance that transactions are recorded as necessary to permit preparation of financial statements in accordance with generally accepted accounting principles;
(3) Provide reasonable assurance that receipts and expenditures of the Company are being made only in accordance with authorizations of management and directors of the Company; and
(4) Provide reasonable assurance regarding prevention or timely detection of unauthorized acquisition, use or disposition of the Company’s assets that could have a material effect on the financial statements.
Because of its inherent limitations, internal control over financial reporting may not prevent or detect misstatements. Also, projections of any evaluation of effectiveness to future periods are subject to the risk that controls may become inadequate because of changes in conditions, or that the degree of compliance with the policies or procedures may deteriorate.
Management has used the framework set forth in the report entitled “Internal Control—Integrated Framework” published by the Committee of Sponsoring Organizations of the Treadway Commission to evaluate the effectiveness of the Company’s internal control over financial reporting, as required by Section 404 of the Sarbanes-Oxley Act. This evaluation excluded the business of Coniexpress S.A. Industrias Alimenticias (Coniexpress S.A.) which was acquired on April 1, 2011. As of April 27, 2011, Coniexpress S.A.’s total assets represented 6.6% of our total consolidated assets as of fiscal year end. Based on this evaluation, management has concluded that the Company’s internal control over financial reporting was effective as of the end of the most recent fiscal year. PricewaterhouseCoopers LLP, an independent registered public accounting firm, audited the effectiveness of the Company’s internal control over financial reporting as of April 27, 2011,28, 2013, as stated in their report which appears herein.
| /s/ Bernardo Hees |
| Chief Executive Officer |
| /s/ Paulo Basilio |
| Chief Financial Officer |
July 9, 2013
38
Report of Independent Registered Public Accounting Firm
To the Board of Directors and ShareholdersShareholder of
H. J. Heinz Company:
In our opinion, the consolidated financial statements listed in the index appearing under Item 15(a)(1) present fairly, in all material respects, the financial position of H. J. Heinz Company and its subsidiaries at April 27, 2011 and April 28, 2010,2013 and April 29, 2012, and the results of their operations and their cash flows for each of the three years in the period ended April 27, 201128, 2013 in conformity with accounting principles generally accepted in the United States of America. In addition, in our opinion, the financial statement schedule listed in the index appearing under Item 15(a)(2) presents fairly, in all material respects, the information set forth therein when read in conjunction with the related consolidated financial statements. Also in our opinion, the Company maintained, in all material respects, effective internal control over financial reporting as of April 27, 2011,28, 2013, based on criteria established inInternal Control—Integrated Frameworkissued by the Committee of Sponsoring Organizations of the Treadway Commission (COSO). The Company’s management is responsible for these financial statements and financial statement schedule, for maintaining effective internal control over financial reporting and for its assessment of the effectiveness of internal control over financial reporting, included in the Report of Management on Internal Control over Financial Reporting appearing under Item 8. Our responsibility is to express opinions on these financial statements, on the financial statement schedule, and on the Company’s internal control over financial reporting based on our integrated audits. We conducted our audits in accordance with the standards of the Public Company Accounting Oversight Board (United States). Those standards require that we plan and perform the audits to obtain reasonable assurance about whether the financial statements are free of material misstatement and whether effective internal control over financial reporting was maintained in all material respects. Our audits of the financial statements included examining, on a test basis, evidence supporting the amounts and disclosures in the financial statements, assessing the accounting principles used and significant estimates made by management, and evaluating the overall financial statement presentation. Our audit of internal control over financial reporting included obtaining an understanding of internal control over financial reporting, assessing the risk that a material weakness exists, and testing and evaluating the design and operating effectiveness of internal control based on the assessed risk. Our audits also included performing such other procedures as we considered necessary in the circumstances. We believe that our audits provide a reasonable basis for our opinions.
A company’s internal control over financial reporting is a process designed to provide reasonable assurance regarding the reliability of financial reporting and the preparation of financial statements for external purposes in accordance with generally accepted accounting principles. A company’s internal control over financial reporting includes those policies and procedures that (i) pertain to the maintenance of records that, in reasonable detail, accurately and fairly reflect the transactions and dispositions of the assets of the company; (ii) provide reasonable assurance that transactions are recorded as necessary to permit preparation of financial statements in accordance with generally accepted accounting principles, and that receipts and expenditures of the company are being made only in accordance with authorizations of management and directors of the company; and (iii) provide reasonable assurance regarding prevention or timely detection of unauthorized acquisition, use, or disposition of the company’s assets that could have a material effect on the financial statements.
Because of its inherent limitations, internal control over financial reporting may not prevent or detect misstatements. Also, projections of any evaluation of effectiveness to future periods are subject to the risk that controls may become inadequate because of changes in conditions, or that the degree of compliance with the policies or procedures may deteriorate.
/s/ PPricewaterhouseCoopersRICEWATERHOUSECOOPERS LLP
Pittsburgh, Pennsylvania
36
H. J. Heinz Company and Subsidiaries
| Fiscal Year Ended | ||||||||||||
| April 27, 2011 | April 28, 2010 | April 29, 2009 | ||||||||||
| (52 Weeks) | (52 Weeks) | (52 Weeks) | ||||||||||
| (In thousands, except per share amounts) | ||||||||||||
| Sales | $ | 10,706,588 | $ | 10,494,983 | $ | 10,011,331 | ||||||
| Cost of products sold | 6,754,048 | 6,700,677 | 6,442,075 | |||||||||
| Gross profit | 3,952,540 | 3,794,306 | 3,569,256 | |||||||||
| Selling, general and administrative expenses | 2,304,350 | 2,235,078 | 2,066,810 | |||||||||
| Operating income | 1,648,190 | 1,559,228 | 1,502,446 | |||||||||
| Interest income | 22,565 | 45,137 | 64,150 | |||||||||
| Interest expense | 275,398 | 295,711 | 339,635 | |||||||||
| Other (expense)/income, net | (21,188 | ) | (18,200 | ) | 92,922 | |||||||
| Income from continuing operations before income taxes | 1,374,169 | 1,290,454 | 1,319,883 | |||||||||
| Provision for income taxes | 368,221 | 358,514 | 375,483 | |||||||||
| Income from continuing operations | 1,005,948 | 931,940 | 944,400 | |||||||||
| Loss from discontinued operations, net of tax | — | (49,597 | ) | (6,439 | ) | |||||||
| Net income | 1,005,948 | 882,343 | 937,961 | |||||||||
| Less: Net income attributable to the noncontrolling interest | 16,438 | 17,451 | 14,889 | |||||||||
| Net income attributable to H. J. Heinz Company | $ | 989,510 | $ | 864,892 | $ | 923,072 | ||||||
| Income/(loss) per common share: | ||||||||||||
| Diluted | ||||||||||||
| Continuing operations attributable to H. J. Heinz Company common shareholders | $ | 3.06 | $ | 2.87 | $ | 2.91 | ||||||
| Discontinued operations attributable to H. J. Heinz Company common shareholders | — | (0.16 | ) | (0.02 | ) | |||||||
| Net income attributable to H. J. Heinz Company common shareholders | $ | 3.06 | $ | 2.71 | $ | 2.89 | ||||||
| Average common shares outstanding—diluted | 323,042 | 318,113 | 318,063 | |||||||||
| Basic | ||||||||||||
| Continuing operations attributable to H. J. Heinz Company common shareholders | $ | 3.09 | $ | 2.89 | $ | 2.95 | ||||||
| Discontinued operations attributable to H. J. Heinz Company common shareholders | — | (0.16 | ) | (0.02 | ) | |||||||
| Net income attributable to H. J. Heinz Company common shareholders | $ | 3.09 | $ | 2.73 | $ | 2.93 | ||||||
| Average common shares outstanding—basic | 320,118 | 315,948 | 313,747 | |||||||||
| Cash dividends per share | $ | 1.80 | $ | 1.68 | $ | 1.66 | ||||||
| Amounts attributable to H. J. Heinz Company common shareholders: | ||||||||||||
| Income from continuing operations, net of tax | $ | 989,510 | $ | 914,489 | $ | 929,511 | ||||||
| Loss from discontinued operations, net of tax | — | (49,597 | ) | (6,439 | ) | |||||||
| Net income | $ | 989,510 | $ | 864,892 | $ | 923,072 | ||||||
| Fiscal Year Ended | |||||||||||
| April 28, 2013 | April 29, 2012 | April 27, 2011 | |||||||||
| (52 Weeks) | (52 1/2 Weeks) | (52 Weeks) | |||||||||
| (In thousands, except per share amounts) | |||||||||||
| Sales | $ | 11,528,886 | $ | 11,507,572 | $ | 10,558,636 | |||||
| Cost of products sold | 7,333,416 | 7,512,783 | 6,614,259 | ||||||||
| Gross profit | 4,195,470 | 3,994,789 | 3,944,377 | ||||||||
| Selling, general and administrative expenses | 2,533,819 | 2,492,482 | 2,256,739 | ||||||||
| Operating income | 1,661,651 | 1,502,307 | 1,687,638 | ||||||||
| Interest income | 27,795 | 34,547 | 22,548 | ||||||||
| Interest expense | 283,607 | 293,009 | 272,660 | ||||||||
| Other expense, net | (62,196 | ) | (7,756 | ) | (21,204 | ) | |||||
| Income from continuing operations before income taxes | 1,343,643 | 1,236,089 | 1,416,322 | ||||||||
| Provision for income taxes | 241,598 | 244,966 | 370,817 | ||||||||
| Income from continuing operations | 1,102,045 | 991,123 | 1,045,505 | ||||||||
| Loss from discontinued operations, net of tax | (74,712 | ) | (51,215 | ) | (39,557 | ) | |||||
| Net income | 1,027,333 | 939,908 | 1,005,948 | ||||||||
| Less: Net income attributable to the noncontrolling interest | 14,430 | 16,749 | 16,438 | ||||||||
| Net income attributable to H. J. Heinz Company | $ | 1,012,903 | $ | 923,159 | $ | 989,510 | |||||
| Income/(loss) per common share: | |||||||||||
| Diluted | |||||||||||
| Continuing operations attributable to H. J. Heinz Company common shareholders | $ | 3.37 | $ | 3.01 | $ | 3.18 | |||||
| Discontinued operations attributable to H. J. Heinz Company common shareholders | (0.23 | ) | (0.16 | ) | (0.12 | ) | |||||
| Net income attributable to H. J. Heinz Company common shareholders | $ | 3.14 | $ | 2.85 | $ | 3.06 | |||||
| Average common shares outstanding—diluted | 323,172 | 323,321 | 323,042 | ||||||||
| Basic | |||||||||||
| Continuing operations attributable to H. J. Heinz Company common shareholders | $ | 3.39 | $ | 3.03 | $ | 3.21 | |||||
| Discontinued operations attributable to H. J. Heinz Company common shareholders | (0.23 | ) | (0.16 | ) | (0.12 | ) | |||||
| Net income attributable to H. J. Heinz Company common shareholders | $ | 3.16 | $ | 2.87 | $ | 3.09 | |||||
| Average common shares outstanding—basic | 320,662 | 320,686 | 320,118 | ||||||||
| Cash dividends per share | $ | 2.06 | $ | 1.92 | $ | 1.80 | |||||
| Amounts attributable to H. J. Heinz Company common shareholders: | |||||||||||
| Income from continuing operations, net of tax | $ | 1,087,615 | $ | 974,374 | $ | 1,029,067 | |||||
| Loss from discontinued operations, net of tax | (74,712 | ) | (51,215 | ) | (39,557 | ) | |||||
| Net income | $ | 1,012,903 | $ | 923,159 | $ | 989,510 | |||||
(Per share amounts may not add due to rounding)
See Notes to Consolidated Financial Statements
37
H. J. Heinz Company and Subsidiaries
Consolidated Balance SheetsStatements of Comprehensive Income
| April 27, | April 28, | |||||||
| 2011 | 2010 | |||||||
| (In thousands) | ||||||||
Assets | ||||||||
| Current assets: | ||||||||
| Cash and cash equivalents | $ | 724,311 | $ | 483,253 | ||||
| Trade receivables (net of allowances: 2011—$10,909 and 2010—$10,196) | 1,039,064 | 794,845 | ||||||
| Other receivables (net of allowances: 2011—$503 and 2010—$268) | 225,968 | 250,493 | ||||||
| Inventories: | ||||||||
Finished goods andwork-in-process | 1,165,069 | 979,543 | ||||||
| Packaging material and ingredients | 286,477 | 269,584 | ||||||
| Total inventories | 1,451,546 | 1,249,127 | ||||||
| Prepaid expenses | 159,521 | 130,819 | ||||||
| Other current assets | 153,132 | 142,588 | ||||||
| Total current assets | 3,753,542 | 3,051,125 | ||||||
| Property, plant and equipment: | ||||||||
| Land | 85,457 | 77,248 | ||||||
| Buildings and leasehold improvements | 1,019,311 | 842,346 | ||||||
| Equipment, furniture and other | 4,119,947 | 3,546,046 | ||||||
| 5,224,715 | 4,465,640 | |||||||
| Less accumulated depreciation | 2,719,632 | 2,373,844 | ||||||
| Total property, plant and equipment, net | 2,505,083 | 2,091,796 | ||||||
| Other non-current assets: | ||||||||
| Goodwill | 3,298,441 | 2,770,918 | ||||||
| Trademarks, net | 1,156,221 | 895,138 | ||||||
| Other intangibles, net | 442,563 | 402,576 | ||||||
| Other non-current assets | 1,074,795 | 864,158 | ||||||
| Total other non-current assets | 5,972,020 | 4,932,790 | ||||||
| Total assets | $ | 12,230,645 | $ | 10,075,711 | ||||
| Fiscal Year Ended | ||||||||||||
| April 28, 2013 | April 29, 2012 | April 27, 2011 | ||||||||||
| (52 Weeks) | (52 1/2 Weeks) | (52 Weeks) | ||||||||||
| (In thousands) | ||||||||||||
| Net income | $ | 1,027,333 | $ | 939,908 | $ | 1,005,948 | ||||||
| Other comprehensive income/(loss), net of tax: | ||||||||||||
| Foreign currency translation adjustments | (228,980 | ) | (377,491 | ) | 567,876 | |||||||
| Net pension and post-retirement benefit (losses)/gains | (189,302 | ) | (258,079 | ) | 77,298 | |||||||
| Reclassification of net pension and post-retirement benefit losses to net income | 54,833 | 56,813 | 53,353 | |||||||||
| Net deferred (losses)/gains on derivatives from periodic revaluations | (11,743 | ) | 30,377 | 9,395 | ||||||||
| Net deferred losses/(gains) on derivatives reclassified to earnings | 29,608 | (13,811 | ) | (20,794 | ) | |||||||
| Total comprehensive income | 681,749 | 377,717 | 1,693,076 | |||||||||
| Comprehensive loss/(income) attributable to the noncontrolling interest | 1,344 | 734 | (21,373 | ) | ||||||||
| Comprehensive income attributable to H.J. Heinz Company | $ | 683,093 | $ | 378,451 | $ | 1,671,703 | ||||||
See Notes to Consolidated Financial Statements
38
H. J. Heinz Company and Subsidiaries
Consolidated Balance Sheets
| April 27, | April 28, | |||||||
| 2011 | 2010 | |||||||
| (In thousands) | ||||||||
Liabilities and Equity | ||||||||
| Current liabilities: | ||||||||
| Short-term debt | $ | 87,800 | $ | 43,853 | ||||
| Portion of long-term debt due within one year | 1,447,132 | 15,167 | ||||||
| Trade payables | 1,337,620 | 1,007,517 | ||||||
| Other payables | 162,047 | 121,997 | ||||||
| Accrued marketing | 313,389 | 288,579 | ||||||
| Other accrued liabilities | 715,147 | 667,653 | ||||||
| Income taxes | 98,325 | 30,593 | ||||||
| Total current liabilities | 4,161,460 | 2,175,359 | ||||||
| Long-term debt and other non-current liabilities: | ||||||||
| Long-term debt | 3,078,128 | 4,559,152 | ||||||
| Deferred income taxes | 897,179 | 665,089 | ||||||
| Non-pension post-retirement benefits | 216,172 | 216,423 | ||||||
| Other non-current liabilities | 570,571 | 511,192 | ||||||
| Total long-term debt and other non-current liabilities | 4,762,050 | 5,951,856 | ||||||
| Redeemable noncontrolling interest | 124,669 | — | ||||||
| Equity: | ||||||||
| Capital stock: | ||||||||
| Third cumulative preferred, $1.70 first series, $10 par value(1) | 69 | 70 | ||||||
| Common stock, 431,096 shares issued, $0.25 par value | 107,774 | 107,774 | ||||||
| 107,843 | 107,844 | |||||||
| Additional capital | 629,367 | 657,596 | ||||||
| Retained earnings | 7,264,678 | 6,856,033 | ||||||
| 8,001,888 | 7,621,473 | |||||||
| Less: | ||||||||
| Treasury shares, at cost (109,818 shares at April 27, 2011 and 113,404 shares at April 28, 2010) | 4,593,362 | 4,750,547 | ||||||
| Accumulated other comprehensive loss | 299,564 | 979,581 | ||||||
| Total H.J. Heinz Company shareholders’ equity | 3,108,962 | 1,891,345 | ||||||
| Noncontrolling interest | 73,504 | 57,151 | ||||||
| Total equity | 3,182,466 | 1,948,496 | ||||||
| Total liabilities and equity | $ | 12,230,645 | $ | 10,075,711 | ||||
| April 28, 2013 | April 29, 2012 | ||||||
| (In thousands) | |||||||
| Assets | |||||||
| Current assets: | |||||||
| Cash and cash equivalents | $ | 2,476,699 | $ | 1,330,441 | |||
| Trade receivables (net of allowances: 2013—$7,957 and 2012—$10,680) | 872,864 | 815,600 | |||||
| Other receivables (net of allowances: 2013—$360 and 2012—$607) | 200,988 | 177,910 | |||||
| Inventories: | |||||||
| Finished goods and work-in-process | 1,076,779 | 1,082,317 | |||||
| Packaging material and ingredients | 255,918 | 247,034 | |||||
| Total inventories | 1,332,697 | 1,329,351 | |||||
| Prepaid expenses | 160,658 | 174,795 | |||||
| Other current assets | 91,656 | 54,139 | |||||
| Total current assets | 5,135,562 | 3,882,236 | |||||
| Property, plant and equipment: | |||||||
| Land | 78,800 | 81,185 | |||||
| Buildings and leasehold improvements | 996,719 | 1,009,379 | |||||
| Equipment, furniture and other | 4,283,570 | 4,175,997 | |||||
| 5,359,089 | 5,266,561 | ||||||
| Less accumulated depreciation | 2,900,288 | 2,782,423 | |||||
| Total property, plant and equipment, net | 2,458,801 | 2,484,138 | |||||
| Other non-current assets: | |||||||
| Goodwill | 3,079,250 | 3,185,527 | |||||
| Trademarks, net | 1,037,283 | 1,090,892 | |||||
| Other intangibles, net | 378,187 | 407,802 | |||||
| Other non-current assets | 849,924 | 932,698 | |||||
| Total other non-current assets | 5,344,644 | 5,616,919 | |||||
| Total assets | $ | 12,939,007 | $ | 11,983,293 | |||
See Notes to Consolidated Financial Statements
42
39
H. J. Heinz Company and Subsidiaries
Consolidated Balance Sheets
| April 28, 2013 | April 29, 2012 | ||||||
| (In thousands) | |||||||
| Liabilities and Equity | |||||||
| Current liabilities: | |||||||
| Short-term debt | $ | 1,137,181 | $ | 46,460 | |||
| Portion of long-term debt due within one year | 1,023,212 | 200,248 | |||||
| Trade payables | 1,310,009 | 1,202,398 | |||||
| Other payables | 182,828 | 146,414 | |||||
| Accrued marketing | 313,930 | 303,132 | |||||
| Other accrued liabilities | 705,482 | 647,769 | |||||
| Income taxes | 114,230 | 101,540 | |||||
| Total current liabilities | 4,786,872 | 2,647,961 | |||||
| Long-term debt and other non-current liabilities: | |||||||
| Long-term debt | 3,848,339 | 4,779,981 | |||||
| Deferred income taxes | 678,565 | 817,928 | |||||
| Non-pension post-retirement benefits | 240,319 | 231,452 | |||||
| Other non-current liabilities | 506,562 | 581,390 | |||||
| Total long-term debt and other non-current liabilities | 5,273,785 | 6,410,751 | |||||
| Commitments and contingent liabilities (See Note 18) | |||||||
| Redeemable noncontrolling interest | 29,529 | 113,759 | |||||
| Equity: | |||||||
| Capital stock: | |||||||
| Third cumulative preferred, $1.70 first series, $10 par value | — | 61 | |||||
| Common stock, 431,096 shares issued, $0.25 par value | 107,774 | 107,774 | |||||
| 107,774 | 107,835 | ||||||
| Additional capital | 608,504 | 594,608 | |||||
| Retained earnings | 7,907,033 | 7,567,278 | |||||
| 8,623,311 | 8,269,721 | ||||||
| Less: | |||||||
| Treasury shares, at cost (109,831 shares at April 28, 2013 and 110,870 shares at April 29, 2012) | 4,647,242 | 4,666,404 | |||||
| Accumulated other comprehensive loss | 1,174,538 | 844,728 | |||||
| Total H.J. Heinz Company shareholders’ equity | 2,801,531 | 2,758,589 | |||||
| Noncontrolling interest | 47,290 | 52,233 | |||||
| Total equity | 2,848,821 | 2,810,822 | |||||
| Total liabilities and equity | $ | 12,939,007 | $ | 11,983,293 | |||
See Notes to Consolidated Financial Statements
40
H. J. Heinz Company and Subsidiaries
Consolidated Statements of Equity
| April 27, 2011 | April 28, 2010 | April 29, 2009 | ||||||||||||||||||||||
| Shares | Dollars | Shares | Dollars | Shares | Dollars | |||||||||||||||||||
| (Amounts in thousands, expect per share amounts) | ||||||||||||||||||||||||
PREFERRED STOCK | ||||||||||||||||||||||||
| Balance at beginning of year | 7 | $ | 70 | 7 | $ | 70 | 7 | $ | 72 | |||||||||||||||
| Conversion of preferred into common stock | — | (1 | ) | — | — | — | (2 | ) | ||||||||||||||||
| Balance at end of year | 7 | 69 | 7 | 70 | 7 | 70 | ||||||||||||||||||
| Authorized shares- April 27, 2011 | 7 | |||||||||||||||||||||||
COMMON STOCK | ||||||||||||||||||||||||
| Balance at beginning of year | 431,096 | 107,774 | 431,096 | 107,774 | 431,096 | 107,774 | ||||||||||||||||||
| Balance at end of year | 431,096 | 107,774 | 431,096 | 107,774 | 431,096 | 107,774 | ||||||||||||||||||
| Authorized shares- April 27, 2011 | 600,000 | |||||||||||||||||||||||
ADDITIONAL CAPITAL | ||||||||||||||||||||||||
| Balance at beginning of year | 657,596 | 737,917 | 617,811 | |||||||||||||||||||||
| Conversion of preferred into common stock | (39 | ) | (29 | ) | (95 | ) | ||||||||||||||||||
| Stock options exercised, net of shares tendered for payment | (26,482 | )(4) | (21,717 | )(4) | 98,736 | (4) | ||||||||||||||||||
| Stock option expense | 9,447 | 7,897 | 9,405 | |||||||||||||||||||||
| Restricted stock unit activity | (8,119 | ) | (9,698 | ) | (538 | ) | ||||||||||||||||||
| Tax settlement(1) | — | — | 8,537 | |||||||||||||||||||||
| Purchase of subsidiary shares from noncontrolling interests(2) | (2,411 | ) | (54,209 | ) | — | |||||||||||||||||||
| Other, net(3) | (625 | ) | (2,565 | ) | 4,061 | |||||||||||||||||||
| Balance at end of year | 629,367 | 657,596 | 737,917 | |||||||||||||||||||||
RETAINED EARNINGS | ||||||||||||||||||||||||
| Balance at beginning of year | 6,856,033 | 6,525,719 | 6,129,008 | |||||||||||||||||||||
| Net income attributable to H.J. Heinz Company | 989,510 | 864,892 | 923,072 | |||||||||||||||||||||
| Cash dividends: | ||||||||||||||||||||||||
| Preferred (per share $1.70 per share in 2011, 2010 and 2009) | (12 | ) | (9 | ) | (12 | ) | ||||||||||||||||||
| Common (per share $1.80, $1.68, and $1.66 in 2011, 2010 and 2009, respectively) | (579,606 | ) | (533,543 | ) | (525,281 | ) | ||||||||||||||||||
| Other(5) | (1,247 | ) | (1,026 | ) | (1,068 | ) | ||||||||||||||||||
| Balance at end of year | 7,264,678 | 6,856,033 | 6,525,719 | |||||||||||||||||||||
TREASURY STOCK | ||||||||||||||||||||||||
| Balance at beginning of year | (113,404 | ) | (4,750,547 | ) | (116,237 | ) | (4,881,842 | ) | (119,628 | ) | (4,905,755 | ) | ||||||||||||
| Shares reacquired | (1,425 | ) | (70,003 | ) | — | — | (3,650 | ) | (181,431 | ) | ||||||||||||||
| Conversion of preferred into common stock | 1 | 40 | 1 | 29 | 3 | 97 | ||||||||||||||||||
| Stock options exercised, net of shares tendered for payment | 4,495 | 203,196 | 2,038 | 94,315 | 6,179 | 178,559 | ||||||||||||||||||
| Restricted stock unit activity | 296 | 13,756 | 470 | 21,864 | 485 | 15,026 | ||||||||||||||||||
| Other, net(3) | 218 | 10,196 | 324 | 15,087 | 374 | 11,662 | ||||||||||||||||||
| Balance at end of year | (109,819 | ) | $ | (4,593,362 | ) | (113,404 | ) | $ | (4,750,547 | ) | (116,237 | ) | $ | (4,881,842 | ) | |||||||||
| April 28, 2013 | April 29, 2012 | April 27, 2011 | |||||||||||||||||||
| Shares | Dollars | Shares | Dollars | Shares | Dollars | ||||||||||||||||
| (In thousands, except per share amounts) | |||||||||||||||||||||
| PREFERRED STOCK | |||||||||||||||||||||
| Balance at beginning of year | 6 | $ | 61 | 7 | $ | 69 | 7 | $ | 70 | ||||||||||||
| Conversion of preferred into common stock | (6 | ) | (61 | ) | (1 | ) | (8 | ) | — | (1 | ) | ||||||||||
| Balance at end of year | — | — | 6 | 61 | 7 | 69 | |||||||||||||||
| Authorized shares- April 28, 2013 | — | ||||||||||||||||||||
| COMMON STOCK | |||||||||||||||||||||
| Balance at beginning of year | 431,096 | 107,774 | 431,096 | 107,774 | 431,096 | 107,774 | |||||||||||||||
| Balance at end of year | 431,096 | 107,774 | 431,096 | 107,774 | 431,096 | 107,774 | |||||||||||||||
| Authorized shares- April 28, 2013 | 600,000 | ||||||||||||||||||||
| ADDITIONAL CAPITAL | |||||||||||||||||||||
| Balance at beginning of year | 594,608 | 629,367 | 657,596 | ||||||||||||||||||
| Conversion of preferred into common stock | (3,600 | ) | (539 | ) | (39 | ) | |||||||||||||||
| Stock options exercised, net of shares tendered for payment | (7,204 | ) | (3) | (15,220 | ) | (3) | (26,482 | ) | (3) | ||||||||||||
| Stock option expense | 10,088 | 10,864 | 9,447 | ||||||||||||||||||
| Restricted stock unit activity | (5,837 | ) | 4,305 | (8,119 | ) | ||||||||||||||||
Purchase of subsidiary shares from noncontrolling interests(1) | 18,956 | (34,483 | ) | (2,411 | ) | ||||||||||||||||
Other, net(2) | 1,493 | 314 | (625 | ) | |||||||||||||||||
| Balance at end of year | 608,504 | 594,608 | 629,367 | ||||||||||||||||||
| RETAINED EARNINGS | |||||||||||||||||||||
| Balance at beginning of year | 7,567,278 | 7,264,678 | 6,856,033 | ||||||||||||||||||
| Net income attributable to H.J. Heinz Company | 1,012,903 | 923,159 | 989,510 | ||||||||||||||||||
| Cash dividends: | |||||||||||||||||||||
| Preferred (per share $1.70 per share in 2013, 2012 and 2011) | (8 | ) | (9 | ) | (12 | ) | |||||||||||||||
| Common (per share $2.06, $1.92, and $1.80 in 2013, 2012 and 2011, respectively) | (665,683 | ) | (619,095 | ) | (579,606 | ) | |||||||||||||||
Purchase of subsidiary shares from noncontrolling interests(1) | (7,703 | ) | — | — | |||||||||||||||||
Other(4) | 246 | (1,455 | ) | (1,247 | ) | ||||||||||||||||
| Balance at end of year | 7,907,033 | 7,567,278 | 7,264,678 | ||||||||||||||||||
| TREASURY STOCK | |||||||||||||||||||||
| Balance at beginning of year | (110,871 | ) | (4,666,404 | ) | (109,819 | ) | (4,593,362 | ) | (113,404 | ) | (4,750,547 | ) | |||||||||
| Shares reacquired | (2,431 | ) | (139,069 | ) | (3,860 | ) | (201,904 | ) | (1,425 | ) | (70,003 | ) | |||||||||
| Conversion of preferred into common stock | 79 | 3,661 | 12 | 547 | 1 | 40 | |||||||||||||||
| Stock options exercised, net of shares tendered for payment | 2,802 | 127,084 | 2,298 | 105,144 | 4,495 | 203,196 | |||||||||||||||
| Restricted stock unit activity | 443 | 20,618 | 303 | 14,087 | 296 | 13,756 | |||||||||||||||
Other, net(2) | 148 | 6,868 | 195 | 9,084 | 218 | 10,196 | |||||||||||||||
| Balance at end of year | (109,830 | ) | $ | (4,647,242 | ) | (110,871 | ) | $ | (4,666,404 | ) | (109,819 | ) | $ | (4,593,362 | ) | ||||||
| (1) | See Note No. |
| (2) | ||
| Includes activity of the Global Stock Purchase Plan. |
| (3) | Includes income tax benefit resulting from exercised stock options. |
| (4) | Includes |
Comprised of unrealized translation adjustment of |
See Notes to Consolidated Financial Statements
41
H. J. Heinz Company and Subsidiaries
Consolidated Statements of Equity
| April 27, 2011 | April 28, 2010 | April 29, 2009 | ||||||||||||||||||||||
| Shares | Dollars | Shares | Dollars | Shares | Dollars | |||||||||||||||||||
| (Amounts in thousands, expect per share amounts) | ||||||||||||||||||||||||
OTHER COMPREHENSIVE (LOSS)/INCOME | ||||||||||||||||||||||||
| Balance at beginning of year | $ | (979,581 | ) | $ | (1,269,700 | ) | $ | (61,090 | ) | |||||||||||||||
| Net pension and post-retirement benefit gains/(losses) | 77,355 | 78,871 | (301,347 | ) | ||||||||||||||||||||
| Reclassification of net pension and post-retirement benefit losses to net income | 53,353 | 38,903 | 24,744 | |||||||||||||||||||||
| Unrealized translation adjustments | 563,060 | 193,600 | (944,439 | ) | ||||||||||||||||||||
| Net change in fair value of cash flow hedges | 9,790 | (32,488 | ) | 33,204 | ||||||||||||||||||||
| Net hedging (gains)/losses reclassified into earnings | (21,365 | ) | 13,431 | (20,772 | ) | |||||||||||||||||||
| Purchase of subsidiary shares from noncontrolling interests(2) | (2,176 | ) | (2,198 | ) | — | |||||||||||||||||||
| Balance at end of year | (299,564 | )(6) | (979,581 | ) | (1,269,700 | ) | ||||||||||||||||||
TOTAL H.J. HEINZ COMPANY SHAREHOLDERS’ EQUITY | 3,108,962 | 1,891,345 | 1,219,938 | |||||||||||||||||||||
NONCONTROLLING INTEREST | ||||||||||||||||||||||||
| Balance at beginning of year | 57,151 | 59,167 | 65,727 | |||||||||||||||||||||
| Net income attributable to the noncontrolling interest | 16,438 | 17,451 | 14,889 | |||||||||||||||||||||
| Other comprehensive income, net of tax: | ||||||||||||||||||||||||
| Net pension and post-retirement benefit losses | (57 | ) | (1,266 | ) | (464 | ) | ||||||||||||||||||
| Unrealized translation adjustments | 4,816 | 8,411 | (8,110 | ) | ||||||||||||||||||||
| Net change in fair value of cash flow hedges | (395 | ) | (788 | ) | 131 | |||||||||||||||||||
| Net hedging losses/(gains) reclassified into earnings | 571 | 254 | (56 | ) | ||||||||||||||||||||
| Purchase of subsidiary shares from noncontrolling interests(2) | (1,750 | ) | (5,467 | ) | — | |||||||||||||||||||
| Dividends paid to noncontrolling interest | (3,270 | ) | (20,611 | ) | (12,950 | ) | ||||||||||||||||||
| Balance at end of year | 73,504 | 57,151 | 59,167 | |||||||||||||||||||||
TOTAL EQUITY | $ | 3,182,466 | $ | 1,948,496 | $ | 1,279,105 | ||||||||||||||||||
COMPREHENSIVE INCOME | ||||||||||||||||||||||||
| Net income | $ | 1,005,948 | $ | 882,343 | $ | 937,961 | ||||||||||||||||||
| Other comprehensive income, net of tax: | ||||||||||||||||||||||||
| Net pension and post-retirement benefit gains/(losses) | 77,298 | 77,605 | (301,811 | ) | ||||||||||||||||||||
| Reclassification of net pension and post-retirement benefit losses to net income | 53,353 | 38,903 | 24,744 | |||||||||||||||||||||
| Unrealized translation adjustments | 567,876 | 202,011 | (952,549 | ) | ||||||||||||||||||||
| Net change in fair value of cash flow hedges | 9,395 | (33,276 | ) | 33,335 | ||||||||||||||||||||
| Net hedging (gains)/losses reclassified into earnings | (20,794 | ) | 13,685 | (20,828 | ) | |||||||||||||||||||
| Total comprehensive income/(loss) | 1,693,076 | 1,181,271 | (279,148 | ) | ||||||||||||||||||||
| Comprehensive income attributable to the noncontrolling interest | (21,373 | ) | (24,062 | ) | (6,390 | ) | ||||||||||||||||||
| Comprehensive income/(loss) attributable to H.J. Heinz Company | $ | 1,671,703 | $ | 1,157,209 | $ | (285,538 | ) | |||||||||||||||||
| Note: See Footnote explanations on Page 43. | ||||||||||||||||||||||||
| April 28, 2013 | April 29, 2012 | April 27, 2011 | ||||||||||||||||
| Shares | Dollars | Shares | Dollars | Shares | Dollars | |||||||||||||
| (In thousands, except per share amounts) | ||||||||||||||||||
| OTHER COMPREHENSIVE (LOSS)/INCOME | ||||||||||||||||||
| Balance at beginning of year | $ | (844,728 | ) | $ | (299,564 | ) | $ | (979,581 | ) | |||||||||
| Net pension and post-retirement benefit (losses)/gains | (189,294 | ) | (258,067 | ) | 77,355 | |||||||||||||
| Reclassification of net pension and post-retirement benefit losses to net income | 54,833 | 56,813 | 53,353 | |||||||||||||||
| Foreign currency translation adjustments | (197,126 | ) | (359,771 | ) | 563,060 | |||||||||||||
| Net deferred (losses)/gains on derivatives from periodic valuations | (11,736 | ) | 30,405 | 9,790 | ||||||||||||||
| Net deferred losses/(gains) on derivatives reclassified to earnings | 29,646 | (14,088 | ) | (21,365 | ) | |||||||||||||
Purchase of subsidiary shares from noncontrolling interests(1) | (16,133 | ) | (456 | ) | (2,176 | ) | ||||||||||||
| Balance at end of year | (1,174,538 | ) | (5) | (844,728 | ) | (299,564 | ) | |||||||||||
| TOTAL H.J. HEINZ COMPANY SHAREHOLDERS’ EQUITY | 2,801,531 | 2,758,589 | 3,108,962 | |||||||||||||||
| NONCONTROLLING INTEREST | ||||||||||||||||||
| Balance at beginning of year | 52,233 | 73,504 | 57,151 | |||||||||||||||
| Net income attributable to the noncontrolling interest | 12,925 | 15,884 | 16,438 | |||||||||||||||
| Other comprehensive income/(loss), net of tax: | ||||||||||||||||||
| Net pension and post-retirement benefit losses | (8 | ) | (12 | ) | (57 | ) | ||||||||||||
| Foreign currency translation adjustments | (5,232 | ) | (5,945 | ) | 4,816 | |||||||||||||
| Net deferred losses) on derivatives from periodic valuations | (7 | ) | (28 | ) | (395 | ) | ||||||||||||
| Net deferred losses on derivatives reclassified to earnings | (38 | ) | 277 | 571 | ||||||||||||||
Purchase of subsidiary shares from noncontrolling interests(1) | — | (19,885 | ) | (1,750 | ) | |||||||||||||
| Dividends paid to noncontrolling interest | (12,583 | ) | (11,562 | ) | (3,270 | ) | ||||||||||||
| Balance at end of year | 47,290 | 52,233 | 73,504 | |||||||||||||||
| TOTAL EQUITY | $ | 2,848,821 | $ | 2,810,822 | $ | 3,182,466 | ||||||||||||
| Note: See Footnote explanations on Page 41. | ||||||||||||||||||
See Notes to Consolidated Financial Statements
42
H. J. Heinz Company and Subsidiaries
| Fiscal Year Ended | ||||||||||||
| April 27, | April 28, | April 29, | ||||||||||
| 2011 | 2010 | 2009 | ||||||||||
| (52 Weeks) | (52 Weeks) | (52 Weeks) | ||||||||||
| (Dollars in thousands) | ||||||||||||
Operating activities: | ||||||||||||
| Net income | $ | 1,005,948 | $ | 882,343 | $ | 937,961 | ||||||
| Adjustments to reconcile net income to cash provided by operating activities: | ||||||||||||
| Depreciation | 255,227 | 254,528 | 241,294 | |||||||||
| Amortization | 43,433 | 48,308 | 40,081 | |||||||||
| Deferred tax provision | 153,725 | 220,528 | 108,950 | |||||||||
| Net losses/(gains) on disposals | — | 44,860 | (6,445 | ) | ||||||||
| Pension contributions | (22,411 | ) | (539,939 | ) | (133,714 | ) | ||||||
| Other items, net | 98,172 | 90,938 | (85,029 | ) | ||||||||
| Changes in current assets and liabilities, excluding effects of acquisitions and divestitures: | ||||||||||||
| Receivables (includes proceeds from securitization) | (91,057 | ) | 121,387 | (10,866 | ) | |||||||
| Inventories | (80,841 | ) | 48,537 | 50,731 | ||||||||
| Prepaid expenses and other current assets | (1,682 | ) | 2,113 | 996 | ||||||||
| Accounts payable | 233,339 | (2,805 | ) | (62,934 | ) | |||||||
| Accrued liabilities | (60,862 | ) | 96,533 | 24,641 | ||||||||
| Income taxes | 50,652 | (5,134 | ) | 61,216 | ||||||||
| Cash provided by operating activities | 1,583,643 | 1,262,197 | 1,166,882 | |||||||||
Investing activities: | ||||||||||||
| Capital expenditures | (335,646 | ) | (277,642 | ) | (292,121 | ) | ||||||
| Proceeds from disposals of property, plant and equipment | 13,158 | 96,493 | 5,407 | |||||||||
| Acquisitions, net of cash acquired | (618,302 | ) | (11,428 | ) | (293,898 | ) | ||||||
| Proceeds from divestitures | 1,939 | 18,637 | 13,351 | |||||||||
| Change in restricted cash | (5,000 | ) | 192,736 | (192,736 | ) | |||||||
| Other items, net | (5,781 | ) | (5,353 | ) | (1,197 | ) | ||||||
| Cash (used for)/provided by investing activities | (949,632 | ) | 13,443 | (761,194 | ) | |||||||
Financing activities: | ||||||||||||
| Payments on long-term debt | (45,766 | ) | (630,394 | ) | (427,417 | ) | ||||||
| Proceeds from long-term debt | 229,851 | 447,056 | 853,051 | |||||||||
| Net payments on commercial paper and short-term debt | (193,200 | ) | (427,232 | ) | (483,666 | ) | ||||||
| Dividends | (579,618 | ) | (533,552 | ) | (525,293 | ) | ||||||
| Purchases of treasury stock | (70,003 | ) | — | (181,431 | ) | |||||||
| Exercise of stock options | 154,774 | 67,369 | 264,898 | |||||||||
| Acquisition of subsidiary shares from noncontrolling interests | (6,338 | ) | (62,064 | ) | — | |||||||
| Other items, net | 27,791 | (9,099 | ) | (16,478 | ) | |||||||
| Cash used for financing activities | (482,509 | ) | (1,147,916 | ) | (516,336 | ) | ||||||
| Effect of exchange rate changes on cash and cash equivalents | 89,556 | (17,616 | ) | (133,894 | ) | |||||||
| Net increase/(decrease) in cash and cash equivalents | 241,058 | 110,108 | (244,542 | ) | ||||||||
| Cash and cash equivalents at beginning of year | 483,253 | 373,145 | 617,687 | |||||||||
| Cash and cash equivalents at end of year | $ | 724,311 | $ | 483,253 | $ | 373,145 | ||||||
| Fiscal Year Ended | |||||||||||
| April 28, 2013 | April 29, 2012 | April 27, 2011 | |||||||||
| (52 Weeks) | (52 1/2 Weeks) | (52 Weeks) | |||||||||
| Operating Activities | (In thousands) | ||||||||||
| Net income | $ | 1,027,333 | $ | 939,908 | $ | 1,005,948 | |||||
| Adjustments to reconcile net income to cash provided by operating activities: | |||||||||||
| Depreciation | 302,057 | 295,718 | 255,227 | ||||||||
| Amortization | 46,853 | 47,075 | 43,433 | ||||||||
| Deferred tax (benefit)/provision | (87,265 | ) | (94,816 | ) | 153,725 | ||||||
| Net losses on divestitures | 19,532 | — | — | ||||||||
| Impairment on assets held for sale | 36,000 | — | — | ||||||||
| Pension contributions | (69,388 | ) | (23,469 | ) | (22,411 | ) | |||||
| Asset write-downs from Fiscal 2012 productivity initiatives | — | 58,736 | — | ||||||||
| Other items, net | 84,834 | 75,375 | 98,172 | ||||||||
| Changes in current assets and liabilities, excluding effects of acquisitions and divestitures: | |||||||||||
| Receivables (includes proceeds from securitization) | (166,239 | ) | 171,832 | (91,057 | ) | ||||||
| Inventories | (49,468 | ) | 60,919 | (80,841 | ) | ||||||
| Prepaid expenses and other current assets | 14,111 | (11,584 | ) | (1,682 | ) | ||||||
| Accounts payable | 168,898 | (72,352 | ) | 233,339 | |||||||
| Accrued liabilities | 71,846 | (20,008 | ) | (60,862 | ) | ||||||
| Income taxes | (9,141 | ) | 65,783 | 50,652 | |||||||
| Cash provided by operating activities | 1,389,963 | 1,493,117 | 1,583,643 | ||||||||
| Investing activities: | |||||||||||
| Capital expenditures | (399,098 | ) | (418,734 | ) | (335,646 | ) | |||||
| Proceeds from disposals of property, plant and equipment | 18,986 | 9,817 | 13,158 | ||||||||
| Acquisitions, net of cash acquired | — | (3,250 | ) | (618,302 | ) | ||||||
| Proceeds from divestitures | 16,787 | 3,828 | 1,939 | ||||||||
| Sale of short-term investments | — | 56,780 | — | ||||||||
| Change in restricted cash | 3,994 | (39,052 | ) | (5,000 | ) | ||||||
| Other items, net | (13,789 | ) | (11,394 | ) | (5,781 | ) | |||||
| Cash used for by investing activities | (373,120 | ) | (402,005 | ) | (949,632 | ) | |||||
| Financing activities: | |||||||||||
| Payments on long-term debt | (224,079 | ) | (1,440,962 | ) | (45,766 | ) | |||||
| Proceeds from long-term debt | 205,350 | 1,912,467 | 229,851 | ||||||||
| Net proceeds/(payments) on commercial paper and short-term debt | 1,089,882 | (42,543 | ) | (193,200 | ) | ||||||
| Dividends | (665,691 | ) | (619,104 | ) | (579,618 | ) | |||||
| Purchases of treasury stock | (139,069 | ) | (201,904 | ) | (70,003 | ) | |||||
| Exercise of stock options | 113,477 | 82,714 | 154,774 | ||||||||
| Acquisition of subsidiary shares from noncontrolling interests | (80,132 | ) | (54,824 | ) | (6,338 | ) | |||||
| Earn-out settlement | (44,547 | ) | — | — | |||||||
| Other items, net | 1,736 | 1,321 | 27,791 | ||||||||
| Cash provided by/(used for) financing activities | 256,927 | (362,835 | ) | (482,509 | ) | ||||||
| Effect of exchange rate changes on cash and cash equivalents | (127,512 | ) | (122,147 | ) | 89,556 | ||||||
| Net increase in cash and cash equivalents | 1,146,258 | 606,130 | 241,058 | ||||||||
| Cash and cash equivalents at beginning of year | 1,330,441 | 724,311 | 483,253 | ||||||||
| Cash and cash equivalents at end of year | $ | 2,476,699 | $ | 1,330,441 | $ | 724,311 | |||||
See Notes to Consolidated Financial Statements
45
43
H. J. Heinz Company and Subsidiaries
| 1. | Significant Accounting Policies |
Merger Agreement with Berkshire Hathaway and 3G Capital:
On June 7, 2013, the Company was acquired by H.J. Heinz Holding Corporation (formerly known as Hawk Acquisition Holding Corporation) (“Parent”), a Delaware corporation controlled by 3G Special Situations Fund III, L.P. and Berkshire Hathaway, (together the “Sponsors”), pursuant to the Agreement and Plan of Merger, dated February 13, 2013 ("Merger Agreement"), as amended by the Amendment, by and among the Company, Parent and Hawk Acquisition Sub, Inc. ("Merger Subsidiary"), in a transaction hereinafter referred to as the “Merger.” As a result of the Merger, all issued and outstanding shares of our common stock outstanding immediately prior to the effective time of the Merger was converted into the right to receive $72.50 in cash, without interest and less applicable withholding taxes thereon, and the Company continued as the surviving corporation in the Merger, becoming an indirect wholly owned subsidiary of Parent. The total aggregate value of the acquisition consideration was approximately $28.75 billion, including the assumption of the Company's outstanding debt. See Note 21, “Subsequent Events” in Item 8 – “Financial Statements and Supplementary Data” for additional information.
Fiscal Year:
Principles of Consolidation:
The consolidated financial statements include the accounts of the Company, all wholly-owned and majority-owned subsidiaries, and any variable interest entities for which we are the primary beneficiary. Investments in certain companies over which the Company exerts significant influence, but does not control the financial and operating decisions, are accounted for as equity method investments. All intercompany accounts and transactions are eliminated. Certain prior year amounts have been reclassified to conform with the Fiscal 20112013 presentation.
Use of Estimates:
The preparation of financial statements, in conformity with accounting principles generally accepted in the United States of America, requires management to make estimates and assumptions that affect the reported amounts of assets and liabilities, the disclosure of contingent assets and liabilities at the date of the financial statements, and the reported amounts of revenues and expenses during the reporting period. Actual results could differ from these estimates.
Translation of Foreign Currencies:
For all significant foreign operations, the functional currency is the local currency. Assets and liabilities of these operations are translated at the exchange rate in effect at each year-end.year end. Income statement accounts are translated at the average rate of exchange prevailing during the year. Translation adjustments arising from the use of differing exchange rates from period to period are included as a component of other comprehensive income/(loss) within shareholders’ equity. Gains and losses from foreign currency transactions are included in net income for the period.
Highly Inflationary Accounting:
The Company applies highly inflationary accounting if the cumulative inflation rate in an economy for a three-year period meets or exceeds 100 percent.percent. Under highly inflationary accounting, the financial statements of a subsidiary are remeasured into the Company’s reporting currency (U.S. dollars) and exchange gains and losses from the remeasurement of monetary assets and liabilities are reflected in current earnings, rather than accumulated other comprehensive loss on the balance sheet, until such time as the economy is no longer considered highly inflationary. See Note 1920 for additional information.
Cash Equivalents:
Cash equivalents are defined as highly liquid investments with original maturities of 90 days or less.less.
46
44
H. J. Heinz Company and Subsidiaries
Notes to Consolidated Financial Statements — (Continued)
Inventories:
Inventories are stated at the lower of cost or market. Cost is determined principally under the average cost method.
Property, Plant and Equipment:
Land, buildings and equipment are recorded at cost. For financial reporting purposes, depreciation is provided on the straight-line method over the estimated useful lives of the assets, which generally have the following ranges: buildings—40 years or less, machinery and equipment—15 years or less, computer software—3 to 7 years, and leasehold improvements—over the life of the lease, not to exceed 15 years. Accelerated depreciation methods are generally used for income tax purposes. Expenditures for new facilities and improvements that substantially extend the capacity or useful life of an asset are capitalized. Ordinary repairs and maintenance are expensed as incurred. When property is retired or otherwise disposed, the cost and related accumulated depreciation are removed from the accounts and any related gains or losses are included in income. The Company reviews property, plant and equipment, whenever circumstances change such that the indicated recorded value of an asset may not be recoverable. Factors that may affect recoverability include changes in planned use of equipment or software,the asset and the closing of facilities. The Company’s impairment review is based on an undiscounted cash flow analysis at the lowest level for which identifiable cash flows exist and are largely independent. When the carrying value of the asset exceeds the future undiscounted cash flows, an impairment is indicated and the asset is written down to its fair value.
Goodwill and Intangibles:
Intangible assets with finite useful lives are amortized on a straight-line basis over the estimated periods benefited, and are reviewed when appropriate for possible impairment, similar to property, plant and equipment. Goodwill and intangible assets with indefinite useful lives are not amortized. The carrying values of goodwill and other intangible assets with indefinite useful lives are tested at least annually for impairment, or when circumstances indicate that a possible impairment may exist. TheIndefinite-lived intangible assets are tested annually during the fourth quarter of each fiscal year, while the annual impairment tests of goodwill are performed during the fourththird quarter of each fiscal year. All goodwill is assigned to reporting units, which are primarily one level below our operating segments. We perform ourThe Company performs its impairment tests of goodwill at the reporting unit level. The Company’sCompany tests goodwill for impairment by either performing a qualitative evaluation or a two-step quantitative test. The qualitative evaluation is an assessment of factors to determine whether it is more likely than not that the fair values of a reporting unit is less than its carrying amount, including goodwill. Factors considered as part of the qualitative assessment include entity-specific industry, market and general economic conditions. The Company may elect to bypass this qualitative assessment for some or all of its reporting units and perform a two-step quantitative test. This quantitative test involves estimating a reporting units fair value.
Indefinite-lived intangible assets are tested for impairment by either performing a qualitative evaluation or a quantitative calculation of fair value and comparison to carrying amount. The qualitative evaluation is an assessment of factors including, but not limited to, changes in management, overall financial performance, and other entity-specific events. The objective of the qualitative evaluation is to determine whether it is more likely than not that the fair value of an indefinite-lived intangible asset is less than its carrying amount. The Company can choose to perform the qualitative assessment on none, some, or all of its indefinite-lived intangible assets.
The Company's estimates of fair value when testing quantitatively for impairment of both goodwill and intangible assets with indefinite lives is based on a discounted cash flow model, using a market participant approach, that requires significant judgment and requires assumptions about future volume trends, revenue and expense growth rates, terminal growth rates, discount rates, tax rates, working capital changes and macroeconomic factors.
Revenue Recognition:
The Company recognizes revenue when title, ownership and risk of loss pass to the customer. This primarily occurs upon delivery of the product to the customer. For the most part, customers do not have the right to return products unless damaged or defective. Revenue is recorded, net of sales incentives, and includes shipping and handling charges billed to customers. Shipping and handling costs are primarily classified as part of selling, general and administrative expenses.
45
H. J. Heinz Company and Subsidiaries
Notes to Consolidated Financial Statements — (Continued)
Marketing Costs:
The Company promotes its products with advertising, consumer incentives and trade promotions. Such programs include, but are not limited to, discounts, coupons, rebates, in-store
47
display incentives and volume-based incentives. Advertising costs are expensed as incurred. Consumer incentive and trade promotion activities are primarily recorded as a reduction of revenue or as a component of cost of products sold based on amounts estimated as being due to customers and consumers at the end of a period, based principally on historical utilization and redemption rates. Advertising costs are recognized as an expense within selling, general and administrative expenses if the Company determines that it will receive an identifiable, separable benefit in return for the consideration paid and it can reasonably estimate the fair value of the benefit identified. Accruals for trade promotions are initially recorded at the time of sale of product to the customer based on an estimate of the expected levels of performance of the trade promotion, which is dependent upon factors such as historical trends with similar promotions, expectations regarding customer participation, and sales and payment trends with similar previously offered programs. We performThe Company performs monthly evaluations of ourits outstanding trade promotions, making adjustments where appropriate to reflect changes in estimates. Settlement of these liabilities typically occurs in subsequent periods primarily through an authorization process for deductions taken by a customer from amounts otherwise due to the Company. Expenses associated with coupons, which we refer to as couponCoupon redemption costs are accrued in the period in which the coupons are offered. The initial estimates made for each coupon offering are based upon historical redemption experience rates for similar products or coupon amounts. We performThe Company performs monthly evaluations of outstanding coupon accruals that compare actual redemption rates to the original estimates. For interim reporting purposes, advertising, consumer incentive and product placement expenses are charged to operations as a percentage of volume, based on estimated volume and related expense for the full year.
Income Taxes:
Deferred income taxes result primarily from temporary differences between financial and tax reporting. If it is more likely than not that some portion or all of a deferred tax asset will not be realized, a valuation allowance is recognized. When assessing the need for valuation allowances, the Company considers future taxable income and ongoing prudent and feasible tax planning strategies. Should a change in circumstances lead to a change in judgment about the realizability of deferred tax assets in future years, the Company would adjust related valuation allowances in the period that the change in circumstances occurs, along with a corresponding increase or charge to income.
The Company has not provided for possible U.S. taxes on the undistributed earnings of foreign subsidiaries that are considered to be reinvested indefinitely. Calculation of the unrecognized deferred tax liability for temporary differences related to these earnings is not practicable.
Stock-Based Employee Compensation Plans:
The Company recognizes the cost of all stock-based awards to employees, including grants of employee stock options, on a straight-line basis over their respective requisite service periods (generally equal to an award’s vesting period). A stock-based award is considered vested for expense attribution purposes when the employee’s retention of the award is no longer contingent on providing subsequent service. Accordingly, the Company recognizes compensation cost immediately for awards granted to retirement-eligible individuals or over the period from the grant date to the date retirement eligibility is achieved, if less than the stated vesting period. The vesting approach used does not affect the overall amount of compensation expense recognized, but could accelerate the recognition of expense. The Company follows its previous vesting approach for the remaining portion of those outstanding awards that were unvested and granted prior to May 4, 2006, and accordingly, will recognize expense from the grant date to the earlier of the actual date of retirement or the vesting date. Judgment is required in estimating the amount of stock-based awards expected to be forfeited prior to vesting. If actual forfeitures differ significantly from these estimates, stock-based compensation expense could be materially impacted.
48
Compensation cost related to all stock-based awards is determined using the grant date fair value. Determining the fair value of employee stock options at the grant date requires judgment in estimating the expected term that the stock options will be outstanding prior to exercise as well as the volatility and dividends over the expected term. Compensation cost for restricted stock units is determined based on the fair value of the Company’s stock at the grant date. The Company applies the modified-prospective transition method for stock options granted on or prior to, but not vested as of, May 3, 2006. Compensation cost related to these stock options is determined using the grant date fair value originally estimated and disclosed in a pro-forma manner in prior period financial statements in accordance with the original provisions of the Financial Accounting Standards Board’s (“FASB’s”) guidance for stock compensation.
46
H. J. Heinz Company and Subsidiaries
Notes to Consolidated Financial Statements — (Continued)
Financial Instruments:
The Company’s financial instruments consist primarily of cash and cash equivalents, receivables, accounts payable, short-term and long-term debt, swaps, forward contracts, and option contracts. The carrying values for the Company’s financial instruments approximate fair value, except as disclosed in Note 10.11. As a policy, the Company does not engage in speculative or leveraged transactions, nor does the Company hold or issue financial instruments for trading purposes.
The Company uses derivative financial instruments for the purpose of hedging foreign currency, debt and interest rate exposures, which exist as part of ongoing business operations. The Company carries derivative instruments on the balance sheet at fair value, determined using observable market data. Derivatives with scheduled maturities of less than one year are included in other receivables or other payables, based on the instrument’s fair value. Derivatives with scheduled maturities beyond one year are classified between current and long-term based on the timing of anticipated future cash flows. The current portion of these instruments is included in other receivables or other payables and the long-term portion is presented as a component of other non-current assets or other non-current liabilities, based on the instrument’s fair value.
The accounting for changes in the fair value of a derivative instrument depends on whether it has been designated and qualifies as part of a hedging relationship and, if so, the reason for holding it. Gains and losses on fair value hedges are recognized in current period earnings in the same line item as the underlying hedged item. The effective portion of gains and losses on cash flow hedges are deferred as a component of accumulated other comprehensive loss and are recognized in earnings at the time the hedged item affects earnings, in the same line item as the underlying hedged item. Hedge ineffectiveness related to cash flow hedges is reported in current period earnings within other income and expense. The income statement classification of gains and losses related to derivative contracts that do not qualify for hedge accounting is determined based on the underlying intent of the contracts. Cash flows related to the settlement of derivative instruments designated as net investment hedges of foreign operations are classified in the consolidated statements of cash flows within investing activities. Cash flows related to the termination of derivative instruments designated as fair value hedges of fixed rate debt obligations are classified in the consolidated statements of cash flows within financing activities. All other cash flows related to derivative instruments are generally classified in the consolidated statements of cash flows within operating activities.
| 2. | Recently Issued Accounting Standards |
In February 2013, the FASB issued an amendment to the comprehensive income standard to improve the transparency of reporting reclassifications out of accumulated other comprehensive income/loss. Other comprehensive income/loss includes gains and losses that are initially excluded from net income for an accounting period. Those gains and losses are later reclassified out of accumulated other comprehensive income/loss into net income. The amendments do not change the current requirements for reporting net income or other comprehensive income/loss in financial statements. The new amendments will require the Company to present the effects on income statement line items of certain significant amounts reclassified out of accumulated other comprehensive income/loss, and cross-reference to other disclosures currently required under U.S. generally accepted accounting principles for certain other reclassification items. The Company will adopt this revised standard in the first quarter of Fiscal 2014. The adoption of this revised standard will not impact our results of operations or financial position.
In July 2012, the FASB issued an amendment to the indefinite-lived intangibles impairment standard. This revised standard is intended to reduce the cost and complexity of testing indefinite-lived intangible assets other than goodwill for impairment by providing entities with the option to first assess qualitatively whether it is more likely than not that an indefinite-lived intangible asset is impaired. An entity is not required to calculate the fair value of an indefinite-lived intangible asset and perform the quantitative impairment test unless the entity determines that it is more likely than not that the asset is impaired. An entity can choose to perform the qualitative assessment on none, some, or all of its indefinite-lived intangible assets. Moreover, an entity can by-pass the qualitative assessment and perform the quantitative impairment test for any indefinite-lived intangible asset in any period. The Company early adopted this amendment in the fourth quarter of Fiscal 2013 for use in the Fiscal 2013 annual impairment testing. The adoption of this revised standard did not impact our results of operations or financial position.
In December 2011, the FASB issued an amendment on disclosures about offsetting assets and liabilities. The new disclosure requirements mandate that entities disclose both gross and net information about instruments and transactions eligible for offset in the statement of financial position as well as instruments and transactions subject to an agreement similar to a master netting arrangement. The Company is required to adopt this amendment on the first day of Fiscal 2014, and this adoption will only impact the notes to the financial statements and not the financial results. The Company did not expect a significant impact to its disclosure requirements from this amendment.
47
H. J. Heinz Company and Subsidiaries
Notes to Consolidated Financial Statements — (Continued)
In September 2011, the FASB issued an amendment to the disclosure requirements for multiemployer pension plans. This amendment requires an employer who participates in multiemployer pension plans to provide additional quantitative and qualitative disclosures to help financial statement users better understand the plans in which an employer participates, the level of the employer's participation in the plans, and the financial health of significant plans. The disclosures also will enable users of financial information to obtain additional information outside of the financial statements. The amendment does not change the current recognition and measurement guidance for an employer's participation in a multiemployer plan. The Company adopted this amendment in the fourth quarter of Fiscal 2012 and applied the provisions of this amendment retrospectively. The adoption of this amendment did not impact the notes to the consolidated financial statements or the financial results.
In September 2011, the FASB issued an amendment to the goodwill impairment standard. This amendment is intended to reduce the cost and complexity of the annual impairment test by providing entities with the option of performing a qualitative assessment to determine whether further impairment testing is necessary. An entity can choose to perform the qualitative assessment on none, some, or all of its reporting units. Moreover, an entity can bypass the qualitative assessment for any reporting unit in any period and proceed directly to step one of the impairment test, and then perform a qualitative assessment in any subsequent period. The Company adopted this amendment in Fiscal 2012. This amendment does not impact our results of operations or financial position.
In June 2011, the FASB issued an amendment on the presentation of comprehensive income. This amendment is intended to improve comparability, consistency, and transparency of financial reporting and to increase the prominence of items reported in other comprehensive income. This amendment eliminates the current option to report other comprehensive income and its components in the statement of changes in equity. Under this amendment, an entity can elect to present items of net income and other comprehensive income in one continuous statement or in two separate, but consecutive, statements. The statement(s) would need to be presented with equal prominence as the other primary financial statements. While the options for presenting other comprehensive income change under this amendment, many items will not change. Those items remaining the same include the items that constitute net income and other comprehensive income; when an item of other comprehensive income must be reclassified to net income; and the earnings-per-share computation. The Company adopted this amendment retrospectively on the first day of Fiscal 2013 by presenting other comprehensive income and its components as a separate financial statement. This adoption only impacted the presentation of the Company's financial statements, not the financial results.
In May 2011, the Financial Accounting Standards Board (“FASB”)FASB issued an amendment to revise the wording used to describe the requirements for measuring fair value and for disclosing information about fair value measurements. For many of the requirements, the FASB does not intend for the amendments to result in a change in the application of the current requirements. Some of the amendments clarify the FASB’s intent about the application of existing fair value measurement requirements, such as specifying that the concepts of highest and best use and valuation premise in a fair value measurement are relevant only when measuring the fair value of nonfinancial assets. Other amendments change a particular principle or requirement for measuring fair value or for disclosing information about fair value measurements such as specifying that, in the absence of a Level 1 input (refer to Note 1011 for additional information), a reporting entity should apply premiums or discounts when market participants would do so when pricing the asset or liability. The Company is required to adoptadopted this amendment on January 26, 2012, the first day of the fourth quarter of Fiscal 2012. The Company is currently evaluating2012 and this adoption did not have an impact on the impact this amendment will have, if any, on itsCompany's financial statements.
In December 2010, the FASB issued an amendment to the disclosure requirements for Business Combinations. This amendment clarifies that if a public entity is required to disclose pro forma information for business combinations, the entity should disclose such pro forma information as though the business combination(s) that occurred during the current year had occurred as of the beginning of the comparable prior annual reporting period only. This amendment also expands the supplemental pro forma disclosures for business combinations to include a description of the nature and amount of material nonrecurring pro forma adjustments directly attributable to the business combination included in reported pro forma revenue and earnings. The Company is required to adoptadopted this amendment on April 28, 2011, the first day of Fiscal 2012 and will apply such amendment for any business combinations that are material on an individual or aggregate basis.basis if and when they occur.
In December 2010, the FASB issued an amendment to the accounting requirements for Goodwill and Other Intangibles. This amendment modifies Step 1 of the goodwill impairment test for reporting units with zero or negative carrying amounts. For those reporting units, an entity is required to perform Step 2 of the goodwill impairment test if it is more likely than not that a goodwill impairment exists. In determining whether it is more likely than not that a goodwill impairment exists, an entity should consider whether there are any adverse qualitative factors indicating that impairment may exist. The Company is required to adoptadopted this amendment on April 28, 2011, the first day of Fiscal 2012 and this2012. This adoption isdid not expected to have an impact on the Company’s financial statements.
50
48
H. J. Heinz Company and Subsidiaries
Notes to Consolidated Financial Statements — (Continued)
| 3. | Discontinued Operations |
During the first quarter of Fiscal 2013, the Company completed the sale of its Appetizers And, Inc. frozen hors d’oeuvres business which was previously reported within the U.S. Foodservice segment,frozen desserts business, resulting in a $14.5$32.7 million pre-tax ($10.4($21.1 million after-tax) loss. Also during the third quarter of Fiscal 2010, the Company completed the sale of its private label frozen desserts business in the U.K., resulting in a $31.4 million pre-tax ($23.6 million after-tax) loss. During the second quarter of Fiscal 2010, the Company completed the sale of its Kabobs frozen hors d’oeuvres businessloss which was previously reported within the U.S. Foodservice segment, resulting in a $15.0 million pre-tax ($10.9 million after-tax) loss. The losses on each of these transactions havehas been recorded in discontinued operations.
| Fiscal Year Ended | |||||||||||
| April 28, 2010 | April 29, 2009 | ||||||||||
| FY 2010 | FY 2009 | Fiscal Year Ended | |||||||||
| (Millions of Dollars) | April 28, 2013 FY 2013 | April 29, 2012 FY 2012 | April 27, 2011 FY 2011 | ||||||||
| (In millions) | |||||||||||
| Sales | $ | 63.0 | $ | 136.8 | $47.7 | $141.5 | $148.0 | ||||
| Net after-tax losses | $ | (4.7 | ) | $ | (6.4 | ) | $(17.6) | $(51.2) | $(39.6) | ||
| Tax benefit on losses | $ | 2.0 | $ | 2.4 | $0.6 | $1.4 | $2.6 | ||||
4. Fiscal 2012 Productivity Initiatives
On May 26, 2011, the Company received cash proceedsannounced that it would invest in productivity initiatives during Fiscal 2012 designed to increase manufacturing effectiveness and efficiency as well as accelerate overall productivity on a global scale. The Company recorded costs related to these productivity initiatives of $94.6$205.4 million from pre-tax ($144.0 million after-tax or $0.45 per share) during Fiscal 2012, all of which were reported in the governmentNon-Operating segment. These pre-tax costs were comprised of the Netherlandsfollowing:
$50.9 million relating to asset write-downs and accelerated depreciation for property the government acquired through eminent domain proceedings. The transaction includes the purchase by the governmentclosure of the Company’s factory locatedsix factories, including two in Nijmegen, which produces soups, pasta and cereals. The cash proceeds are intended to compensate the Company for costs, both capital and expense, the Company will incur Europe, three years from the date of the transaction, which is the length of time the Company has to exit the current factory location and construct certain new facilities. Note, the Company will likely incur costs to rebuild an R&D facility in the Netherlands, costs to transfer a cereal line to another factory location, employee costsU.S. and one in Asia/Pacific,
$81.7 million for severance and otheremployee benefit costs directly relatedrelating to the closurereduction of the global workforce by approximately 1,400 positions, and
$72.9 million associated with other implementation costs, primarily for professional fees, contract termination and relocation costs for the establishment of the existing facilities. The Company also entered into a three-year leaseback on the Nijmegen factory. The Company will continue to operate in the leased factory while commencing to execute its plans for closure and relocation of the operations. The Company has accounted for the proceeds on a cost recovery basis. In doing so, the Company has made its estimates of cost, both of a capital and expense nature, to be incurred and recoveredEuropean supply chain hub and to which proceeds from the transaction will be applied. improve global manufacturing efficiencies.
Of the proceeds received, $81.2$205.4 million total pre-tax charges in Fiscal 2012, $129.9 million was deferred based on management’s total estimated future costs to be recovered and incurred and recorded in other non-current liabilities, other accrued liabilities and accumulated depreciation in the Company’s consolidated balance sheet as of April 28, 2010. These deferred amounts are recognized as the related costs are incurred. If estimated costs differ from what is actually incurred, these adjustments are reflected in earnings. As of April 27, 2011, the remaining deferred amount on the consolidated balance sheet was $63.2 million and was
51
49
The Company does not include productivity charges in the consolidated statementresults of incomeits reportable segments. The pre-tax impact of allocating such charges to segment results would have been as follows:
| Fiscal 2012 | ||||
| (In millions) | ||||
| North American Consumer Products | $ | 25.6 | ||
| Europe | 56.4 | |||
| Asia/Pacific | 65.7 | |||
| U.S. Foodservice | 52.8 | |||
| Rest of World | 4.4 | |||
| Non-Operating | 0.6 | |||
| Total productivity charges | $ | 205.4 | ||
(Totals may not add due to rounding)
Activity in other accrued liability balances for productivity charges were as follows:
| (In millions) | ||||
| Fiscal 2012 total company productivity charges | $ | 165.6 | ||
| Cash payments | (111.0 | ) | ||
| Reserve balance at April 29, 2012 | $ | 54.6 | ||
Cash payments against the year ended April 28, 2010.other accrued liabilities related to productivity initiatives of $44 million have been made during Fiscal 2013 and this Fiscal 2012 plan is now substantially complete.
| Acquisitions |
On April 1, 2011, the Company acquired an 80% stake in Coniexpress S.A. Industrias Alimenticias (“Coniexpress”), a leading Brazilian manufacturer of theQuero® brand of tomato-based sauces, tomato paste, ketchup, condiments and vegetables for $493.5$493.5 million in cash, which includes $10.6included $10.6 million of acquired cash and $60.1$60.1 million of short-term investments. The Company also incurred $11.3$11.3 million of pre-tax costs related to the acquisition, consisting primarily of professional fees, which have beenwere recorded in selling, general and administrative expenses in the Fiscal 2011 consolidated statement of income. The Company has the right to exercise a call option at any time requiring the minority partner to sell his 20% equity interest, while the minority partner has the right to exercise a put option requiringDuring Fiscal 2013, the Company to purchase his 20% equityacquired an additional 15% interest (seein Coniexpress for $80.1 million. See Note 1718 for additional explanation).further details regarding this redeemable noncontrolling interest. The Coniexpress acquisition has beenwas accounted for as a business combination and, accordingly, the purchase price has beenwas allocated to the assets and liabilities based upon their estimated fair values as of the acquisition date. The preliminary allocations of the purchase price resulted in goodwill of $300.2$301.6 million, which was assigned to the Rest of World segment and is not deductible for tax purposes. In addition, $161.9$161.9 million of intangible assets were acquired, $142.0$142.0 million of which relate to trademarks which are not subject to amortization. The remaining $19.9$19.9 million represents customer-related assets which will beare being amortized over 15 years. In addition, the stock purchase agreement provides the Company with rights to recover from the sellers a portion of the costs associated with certain contingent liabilities incurred pre-acquisition. Based on the Company’s assessment as of the acquisition date, a $26.3 million indemnification asset has been recorded in Other non-current assets related to a contingent liability of $52.6 million recorded in Other non-current liabilities.
On November 2, 2010, the Company acquired Foodstar Holding Pte (“Foodstar”), a manufacturer of soy sauces and fermented bean curd in China for $165.4$165.4 million in cash, which includes $30.0included $30.0 million of acquired cash, as well as a potential earn-out payment in Fiscal 2014 contingent upon certain net sales and EBITDA (earnings before interest, taxes, depreciation and amortization) targets during Fiscals 2013 and 2014. In accordance with accounting principles generally accepted in the United States of America, a liability of $44.5$44.5 million was recognized for an estimate of the acquisition date fair value of the earn-out and is included in Other non-current liabilitiesliabilities. The fair value of the earn-out was estimated using a discounted cash flow model and was based on significant inputs not observed in our consolidated balance sheet as of April 27, 2011. Any changethe market and thus represented a Level 3 measurement. Key assumptions in determining the fair value of the earn-out subsequent toincluded the acquisition date, including an increase resulting from the passage of time, isdiscount rate, and will be recognized in earnings in the period of the estimated fair value change. See Note 10revenue and EBITDA projections for further explanation. A change in fair value of the earn-out could have a material impact on the Company’s earnings in the period of the change in estimate.
Fiscals 2013 and 2014. The Foodstar acquisition has been accounted for as a business combination and, accordingly, the purchase price has been allocated to the assets and liabilities based upon their estimated fair values as of the acquisition date. The allocations of the purchase price resulted in goodwill of $77.3$77.3 million, which was assigned to the Asia/Pacific segment and is not deductible for tax purposes. In addition, $70.7$70.7 million of intangible assets were acquired, $42.4$42.4 million of which relate to trademarks and are not subject to amortization. The remaining $28.3$28.3 million will be are being amortized over a weighted average life of 31 years. During the third quarter of Fiscal 2013, the Company renegotiated the terms of the earn-out agreement in order to give the Company additional flexibility in the future for growing its business in China, one of its largest and most important emerging markets. This renegotiation resulted in the settlement of the earn-out for a cash payment of $60.0 million, of which $15.5 million was reported in cash from operating activities and $44.5 million was reported in cash from financing activities on the consolidated cash flow statement for the year ended April 28, 2013. In addition, the Company incurred a $12.1 million charge in the year ended April 28, 2013, which was recorded in SG&A on the consolidated income statement and in the Non-Operating segment, for the difference between the
52
50
H. J. Heinz Company and Subsidiaries
Notes to Consolidated Financial Statements — (Continued)
this transaction.
Operating results of the above-mentioned businesses acquired have been included in the consolidated statements of income from the respective acquisition dates forward. Pro forma results of the Company, assuming all of the acquisitions had occurred at the beginning of each period presented, would not be materially different from the results reported. There are no significant contingent payments, options or commitments associated with any of the acquisitions, except as disclosed above.
In Fiscal 2012, the Company acquired an additional 10% interest in P.T. Heinz ABC Indonesia for $54.8 million. P.T. Heinz ABC Indonesia is an Indonesian subsidiary of the Company that manufacturers Asian sauces and condiments as well as juices and syrups. Prior to the transaction, the Company owned 65% of this business. During Fiscal 2011, the Company acquired the remaining 21% interest in Heinz UFE Ltd., a Chinese subsidiary of the Company that manufactures infant feeding products, for $6.3 million. The purchase has been accounted for primarily as a reduction in additional capital and noncontrolling interest on the consolidated statements of equity.$6.3 million. Prior to the transaction, the Company was the owner of owned 79% of the business.
53
| Goodwill and Other Intangible Assets |
Changes in the carrying amount of goodwill for the fiscal year ended April 27, 2011,28, 2013, by reportable segment, are as follows:
| North | ||||||||||||||||||||||||
| American | ||||||||||||||||||||||||
| Consumer | Asia/ | U.S. | Rest of | |||||||||||||||||||||
| Products | Europe | Pacific | Foodservice | World | Total | |||||||||||||||||||
| (Thousands of Dollars) | ||||||||||||||||||||||||
| Balance at April 29, 2009 | $ | 1,074,841 | $ | 1,090,998 | $ | 248,222 | $ | 260,523 | $ | 13,204 | $ | 2,687,788 | ||||||||||||
| Acquisitions | 6,378 | — | — | — | — | 6,378 | ||||||||||||||||||
| Purchase accounting adjustments | — | (895 | ) | (3,030 | ) | — | — | (3,925 | ) | |||||||||||||||
| Disposals | — | (483 | ) | — | (2,849 | ) | — | (3,332 | ) | |||||||||||||||
| Translation adjustments | 21,672 | 17,124 | 44,233 | — | 980 | 84,009 | ||||||||||||||||||
| Balance at April 28, 2010 | 1,102,891 | 1,106,744 | 289,425 | 257,674 | 14,184 | 2,770,918 | ||||||||||||||||||
| Acquisitions | — | — | 77,345 | — | 300,227 | 377,572 | ||||||||||||||||||
| Purchase accounting adjustments | — | (278 | ) | (10,688 | ) | — | — | (10,966 | ) | |||||||||||||||
| Translation adjustments | 8,846 | 114,774 | 35,998 | — | 1,299 | 160,917 | ||||||||||||||||||
| Balance at April 27, 2011 | $ | 1,111,737 | $ | 1,221,240 | $ | 392,080 | $ | 257,674 | $ | 315,710 | $ | 3,298,441 | ||||||||||||
North American Consumer Products | Europe | Asia/ Pacific | U.S. Foodservice | Rest of World | Total | ||||||||||||||||||
| (In thousands) | |||||||||||||||||||||||
| Balance at April 27, 2011 | $ | 1,111,737 | $ | 1,221,240 | $ | 392,080 | $ | 257,674 | $ | 315,710 | $ | 3,298,441 | |||||||||||
| Purchase accounting adjustments | — | (600 | ) | — | — | 1,380 | 780 | ||||||||||||||||
| Disposals | — | (1,532 | ) | — | — | — | (1,532 | ) | |||||||||||||||
| Translation adjustments | (4,662 | ) | (73,820 | ) | 3,119 | — | (36,799 | ) | (112,162 | ) | |||||||||||||
| Balance at April 29, 2012 | 1,107,075 | 1,145,288 | 395,199 | 257,674 | 280,291 | 3,185,527 | |||||||||||||||||
| Disposals | — | (527 | ) | — | (899 | ) | — | (1,426 | ) | ||||||||||||||
| Impairment loss | — | — | (36,000 | ) | — | — | (36,000 | ) | |||||||||||||||
| Goodwill allocated to discontinued operations | — | — | (4,952 | ) | — | — | (4,952 | ) | |||||||||||||||
| Translation adjustments | (5,148 | ) | (39,300 | ) | 5,595 | — | (25,046 | ) | (63,899 | ) | |||||||||||||
| Balance at April 28, 2013 | $ | 1,101,927 | $ | 1,105,461 | $ | 359,842 | $ | 256,775 | $ | 255,245 | $ | 3,079,250 | |||||||||||
As a result of classifying the LongFong business as held for sale, the Company took a non-cash impairment charge of $36.0 million to goodwill based on the fair value of the business based on the anticipated sale. During the second quarter of Fiscal 2013, the Company changed its annual goodwill impairment testing date from the fourth quarter to the third quarter of each year. As such, the Company completed its annual impairment assessment of goodwill during the third quarter of Fiscal 2013. No additional impairments were identified during the Company's annual assessment of goodwill. Total goodwill accumulated impairment losses for the Company since Fiscal 2003 were $120.6 million consisting of $54.5 million for Europe, $38.7 million for Asia/Pacific and $27.4 million for Rest of World as of April 28, 2013. Total goodwill accumulated impairment losses for the Company since Fiscal 2003 were $84.7 million consisting of $54.5 million for Europe, $2.7 million for Asia/Pacific and $27.4 million for Rest of World as of April 29, 2012 and April 27, 2011.
During the fourth quarter of Fiscal 2011,2013, the Company completed its annual review of goodwill and indefinite-lived intangible assets. No impairments were identified during the Company’s annual assessment of goodwill and indefinite-lived intangible assets.
During the fourthsecond quarter of Fiscal 2011,2012, the Company finalized the purchase price allocation for the FoodstarConiexpress acquisition in Brazil resulting primarily in immaterial adjustments between goodwill, accrued liabilitiesincome taxes and income taxes. Also, during the fourth quarter of Fiscal 2011, the Company acquired Coniexpress and a preliminary purchase price allocation was recorded. The Company expects to finalize the purchase price allocation related to the Coniexpress acquisition upon completion of third party valuation procedures. All of the purchase accounting adjustments reflected in the above table relate to acquisitions completed prior to April 30, 2009, the first day of Fiscal 2010. Total goodwill accumulated impairment losses for the Company were $84.7 million consisting of $54.5 million for Europe, $2.7 million for Asia/Pacific and $27.4 million for Rest of World as of April 29, 2009, April 28, 2010 and April 27, 2011.non-pension postretirement benefits.
51
H. J. Heinz Company and Subsidiaries
Notes to Consolidated Financial Statements — (Continued)
Trademarks and other intangible assets at April 27, 2011 and April 28, 2010,2013 and April 29, 2012, subject to amortization expense, are as follows:
| April 27, 2011 | April 28, 2010 | |||||||||||||||||||||||
| Gross | Accum Amort | Net | Gross | Accum Amort | Net | |||||||||||||||||||
| (Thousands of dollars) | ||||||||||||||||||||||||
| Trademarks | $ | 297,020 | $ | (83,343 | ) | $ | 213,677 | $ | 267,435 | $ | (73,500 | ) | $ | 193,935 | ||||||||||
| Licenses | 208,186 | (158,228 | ) | 49,958 | 208,186 | (152,509 | ) | 55,677 | ||||||||||||||||
| Recipes/processes | 90,553 | (31,988 | ) | 58,565 | 78,080 | (26,714 | ) | 51,366 | ||||||||||||||||
| Customer-related assets | 224,173 | (57,555 | ) | 166,618 | 180,302 | (43,316 | ) | 136,986 | ||||||||||||||||
| Other | 79,045 | (54,833 | ) | 24,212 | 66,807 | (54,157 | ) | 12,650 | ||||||||||||||||
| $ | 898,977 | $ | (385,947 | ) | $ | 513,030 | $ | 800,810 | $ | (350,196 | ) | $ | 450,614 | |||||||||||
| April 28, 2013 | April 29, 2012 | ||||||||||||||||||||||
| Gross | Accum Amort | Net | Gross | Accum Amort | Net | ||||||||||||||||||
| (In thousands) | |||||||||||||||||||||||
| Trademarks | $ | 282,350 | $ | (91,923 | ) | $ | 190,427 | $ | 282,937 | $ | (87,925 | ) | $ | 195,012 | |||||||||
| Licenses | 208,186 | (169,666 | ) | 38,520 | 208,186 | (163,945 | ) | 44,241 | |||||||||||||||
| Recipes/processes | 86,686 | (37,907 | ) | 48,779 | 89,207 | (35,811 | ) | 53,396 | |||||||||||||||
| Customer-related assets | 209,428 | (77,310 | ) | 132,118 | 216,755 | (69,244 | ) | 147,511 | |||||||||||||||
| Other | 50,606 | (26,202 | ) | 24,404 | 48,643 | (25,442 | ) | 23,201 | |||||||||||||||
| $ | 837,256 | $ | (403,008 | ) | $ | 434,248 | $ | 845,728 | $ | (382,367 | ) | $ | 463,361 | ||||||||||
Amortization expense for trademarks and other intangible assets was $29.0$30.9 million $28.2, $31.8 million and $28.2$29.0 million for the fiscal years ended April 28, 2013, April 29, 2012 and April 27, 2011 April 28, 2010 and April 29, 2009,, respectively. Based upon the amortizable intangible assets recorded on the balance sheet as of April 27, 2011,28, 2013, amortization expense for each of the next five fiscal years is estimated to be approximately $29 million.$31 million.
Intangible assets not subject to amortization at April 27, 201128, 2013 totaled $1,085.7$981.3 million and consisted of $942.5$846.9 million of trademarks, $122.5$115.0 million of recipes/processes, and $20.7$19.4 million of licenses. Intangible assets not subject to amortization at April 28, 201029, 2012 totaled $847.1$1,035.3 million and consisted of $701.2$895.9 million of trademarks, $113.8$119.3 million of recipes/processes, and $32.1$20.1 million of licenses. The reduction in intangible assets, not subject to amortization expense, since April 29, 2012 is primarily due to translation adjustments and $14.6 million of intangible assets allocated to discontinued operations.
| Income Taxes |
The following table summarizes the provision/(benefit)/provision for U.S. federal, state and foreign taxes on income from continuing operations.
| 2011 | 2010 | 2009 | ||||||||||
| (Dollars in thousands) | ||||||||||||
| Current: | ||||||||||||
| U.S. federal | $ | 38,686 | $ | (24,446 | ) | $ | 73,490 | |||||
| State | 14,507 | (809 | ) | 1,855 | ||||||||
| Foreign | 161,304 | 163,241 | 192,765 | |||||||||
| 214,497 | 137,986 | 268,110 | ||||||||||
| Deferred: | ||||||||||||
| U.S. federal | 123,601 | 165,141 | 73,130 | |||||||||
| State | (4,318 | ) | 8,141 | 8,230 | ||||||||
| Foreign | 34,441 | 47,246 | 26,013 | |||||||||
| 153,724 | 220,528 | 107,373 | ||||||||||
| Provision for income taxes | $ | 368,221 | $ | 358,514 | $ | 375,483 | ||||||
| 2013 | 2012 | 2011 | |||||||||
| (In thousands) | |||||||||||
| Current: | |||||||||||
| U.S. federal | $ | 126,878 | $ | 112,064 | $ | 41,673 | |||||
| State | 14,622 | 12,326 | 14,992 | ||||||||
| Foreign | 187,363 | 216,076 | 161,355 | ||||||||
| 328,863 | 340,466 | 218,020 | |||||||||
| Deferred: | |||||||||||
| U.S. federal | (13,589 | ) | (16,884 | ) | 122,757 | ||||||
| State | 894 | 4,124 | (4,402 | ) | |||||||
| Foreign | (74,570 | ) | (82,740 | ) | 34,442 | ||||||
| (87,265 | ) | (95,500 | ) | 152,797 | |||||||
| Provision for income taxes | $ | 241,598 | $ | 244,966 | $ | 370,817 | |||||
Tax benefits related to stock options and other equity instruments recorded directly to additional capital totaled $21.4$20.8 million in Fiscal 2011, $9.32013, $16.8 million in Fiscal 20102012 and $17.6$21.4 million in Fiscal 2009.
55
2011
The components of income from continuing operations before income taxes consist of the following:
| 2011 | 2010 | 2009 | ||||||||||
| (Dollars in thousands) | ||||||||||||
| Domestic | $ | 565,831 | $ | 499,059 | $ | 534,217 | ||||||
| Foreign | 808,338 | 791,395 | 785,666 | |||||||||
| From continuing operations | $ | 1,374,169 | $ | 1,290,454 | $ | 1,319,883 | ||||||
| 2013 | 2012 | 2011 | |||||||||
| (In thousands) | |||||||||||
| Domestic | $ | 378,283 | $ | 315,741 | $ | 470,646 | |||||
| Foreign | 965,360 | 920,348 | 945,676 | ||||||||
| From continuing operations | $ | 1,343,643 | $ | 1,236,089 | $ | 1,416,322 | |||||
52
H. J. Heinz Company and Subsidiaries
Notes to Consolidated Financial Statements — (Continued)
The differences between the U.S. federal statutory tax rate and the Company’s consolidated effective tax rate on continuing operations are as follows:
| 2011 | 2010 | 2009 | ||||||||||
| U.S. federal statutory tax rate | 35.0 | % | 35.0 | % | 35.0 | % | ||||||
| Tax on income of foreign subsidiaries | (5.3 | ) | (3.5 | ) | (4.1 | ) | ||||||
| State income taxes (net of federal benefit) | 0.3 | 0.3 | 0.6 | |||||||||
| Earnings repatriation | 3.3 | 1.2 | 0.4 | |||||||||
| Tax free interest | (4.2 | ) | (4.6 | ) | (2.5 | ) | ||||||
| Effects of revaluation of tax basis of foreign assets | (1.6 | ) | (0.5 | ) | (0.7 | ) | ||||||
| Other | (0.7 | ) | (0.1 | ) | (0.3 | ) | ||||||
| Effective tax rate | 26.8 | % | 27.8 | % | 28.4 | % | ||||||
| 2013 | 2012 | 2011 | ||||||
| U.S. federal statutory tax rate | 35.0 | % | 35.0 | % | 35.0 | % | ||
| Tax on income of foreign subsidiaries | (7.7 | ) | (8.7 | ) | (5.6 | ) | ||
| Changes in valuation allowances | 0.9 | 1.5 | (0.8 | ) | ||||
| Earnings repatriation | 0.9 | 2.0 | 2.9 | |||||
| Tax free interest | (4.7 | ) | (5.4 | ) | (4.1 | ) | ||
| Effects of revaluation of tax basis of foreign assets | (6.2 | ) | (3.2 | ) | (1.6 | ) | ||
| Audit settlements and changes in uncertain tax positions | (0.3 | ) | (2.0 | ) | — | |||
| Other | 0.1 | 0.6 | 0.4 | |||||
| Effective tax rate | 18.0 | % | 19.8 | % | 26.2 | % | ||
The decrease in the effective tax rate is primarily the result of increased benefits from the revaluation of the tax basis of certain foreign assets, which includes our Fiscal 2013 reorganization, and reduced charges for the repatriation of current year foreign earnings. See below for further explanation of the revaluation. These amounts were partially offset by lower current year benefits from tax free interest and tax on income of foreign subsidiaries. The prior year also contained a benefit from the resolution of a foreign tax case. Both periods contained a benefit of approximately $15 million from the reversal of an uncertain tax position liability due to the expiration of the statute of limitations in a foreign tax jurisdiction as well as benefits in each year related to 200 basis point statutory tax rate reductions in the United Kingdom. The decrease in the effective tax rate in Fiscal 2011 is2012 was primarily the result of increased benefits from the revaluation of the tax basis of foreign assets, the reversal of an uncertain tax position liability due to the expiration of the statute of limitations in a foreign jurisdiction, the beneficial resolution of a foreign tax planningcase, and increasedlower tax exempton the income of foreign income,subsidiaries primarily resulting from a statutory tax rate reduction in the U.K. These benefits were partially offset by higher taxes on repatriation of earnings. The decreasechanges in the effective tax rate in Fiscal 2010 was primarily the result of tax efficient financing of the Company’s operations, partially offset by higher taxes on repatriation of earnings.valuation allowances. The effective tax rate in Fiscal 20092011 was impacted by a smaller benefitlower benefits from foreign tax free interestplanning and higher costs for repatriation of earnings, partially offset by lower earnings repatriation costs.a net benefit related to changes in valuation allowances.
During the second quarter of Fiscal 2013, the Company completed a tax-free reorganization in a foreign jurisdiction which resulted in an increase in the tax basis of both fixed and intangible assets. The increased tax basis resulted in a $63.0 million discrete tax benefit fully recognized in the second quarter and is expected to provide cash flow benefits of approximately $91 million over the next 10 years as a result of the tax deductions of the assets over their amortization periods.
During the first quarter of Fiscal 2013, a foreign subsidiary of the Company exercised a tax option under local law to revalue certain of its intangible assets, increasing the local tax basis by $82.1 million. This revaluation resulted in a reduction of tax expense in Fiscal 2013, fully recognized in the first quarter, of $12.9 million, reflecting the deferred tax benefit from the higher tax basis partially offset by the tax liability arising from this revaluation of $13.1 million.
During the second quarter of Fiscal 2012, a foreign subsidiary of the Company exercised a tax option under local law to revalue certain of its intangible assets, increasing the local tax basis by approximately $220.2 million. This revaluation resulted in a reduction in Fiscal 2012 tax expense, fully recognized in the second quarter of Fiscal 2012, of $34.9 million reflecting the deferred tax benefit from the higher tax basis partially offset by the current tax liability arising from this revaluation of $34.8 million.
The tax benefit from the higher basis amortization of both revaluations above will result in a reduction in cash taxes over the 20 year tax amortization period of approximately $95 million. Also, as a result of these taxable revaluations, the subsidiary made tax payments of $17.9 million and $10.4 million during the second quarters Fiscal 2013 and Fiscal 2012, respectively, and is expected to make additional payments of approximately $16 million and $4 million during Fiscals 2014 and 2015, respectively.
53
H. J. Heinz Company and Subsidiaries
Notes to Consolidated Financial Statements — (Continued)
The following table and note summarize deferred tax (assets) and deferred tax liabilities as of April 27, 2011 and April 28, 2010.2013 and April 29, 2012.
| 2011 | 2010 | |||||||
| (Dollars in thousands) | ||||||||
| Depreciation/amortization | $ | 939,545 | $ | 754,353 | ||||
| Benefit plans | 93,916 | 38,718 | ||||||
| Deferred income | 126,917 | 66,920 | ||||||
| Financing costs | 118,118 | 118,512 | ||||||
| Other | 48,839 | 102,663 | ||||||
Deferred tax liabilities | 1,327,335 | 1,081,166 | ||||||
| Operating loss carryforwards and carrybacks | (120,261 | ) | (159,519 | ) | ||||
| Benefit plans | (168,001 | ) | (178,363 | ) | ||||
| Depreciation/amortization | (108,873 | ) | (74,925 | ) | ||||
| Tax credit carryforwards | (41,850 | ) | (62,284 | ) | ||||
| Deferred income | (24,235 | ) | (36,373 | ) | ||||
| Other | (109,929 | ) | (123,681 | ) | ||||
Deferred tax assets | (573,149 | ) | (635,145 | ) | ||||
| Valuation allowance | 64,386 | 62,519 | ||||||
Net deferred tax liabilities | $ | 818,572 | $ | 508,540 | ||||
| 2013 | 2012 | ||||||
| (In thousands) | |||||||
| Depreciation/amortization | $ | 833,008 | $ | 910,987 | |||
| Benefit plans | 41,354 | 59,647 | |||||
| Deferred income | 97,482 | 96,472 | |||||
| Financing costs | 117,161 | 117,670 | |||||
| Other | 46,510 | 48,371 | |||||
| Deferred tax liabilities | 1,135,515 | 1,233,147 | |||||
| Operating loss carryforwards | (90,790 | ) | (141,358 | ) | |||
| Benefit plans | (211,658 | ) | (195,697 | ) | |||
| Depreciation/amortization | (158,194 | ) | (147,745 | ) | |||
| Tax credit carryforwards | (111,431 | ) | (81,703 | ) | |||
| Deferred income | (18,596 | ) | (20,286 | ) | |||
| Other | (97,894 | ) | (96,502 | ) | |||
| Deferred tax assets | (688,563 | ) | (683,291 | ) | |||
| Valuation allowance | 46,069 | 90,553 | |||||
| Net deferred tax liabilities | $ | 493,021 | $ | 640,409 | |||
The Company also has foreign deferred tax assets and valuation allowances of $135.1$117.9 million as of April 28, 2013, each related to statutory increases in the capital tax bases of certain internally generated intangible assets for which the probability of realization is remote.
The table above excludes foreign deferred tax assets of $55.1 million, deferred tax liabilities of $5.2 million and a valuation allowance of $54.3 million related to a business classified as held for sale as of April 28, 2013.
The Company records valuation allowances to reduce deferred tax assets to the amount that is more likely than not to be realized. When assessing the need for valuation allowances, the Company considers future taxable income and ongoing prudent and feasible tax planning strategies. Should a change in circumstances lead to a change in judgment about the realizability of deferred tax assets in future years, the Company would adjust related valuation allowances in the period that the change in circumstances occurs, along with a corresponding increase or charge to income.
The resolution of tax reserves and changes in valuation allowances could be material to the Company’s results of operations for any period, but is not expected to be material to the Company’s financial position.
At the end of Fiscal 2011,2013, foreign operating loss carryforwards totaled $419.2 million.$309.5 million. Of that amount, $288.8$86.6 million expire between 20122014 and 2031; the other $130.4$222.9 million do not expire. Deferred tax assets of $18.1$75.3 million have been recorded for foreign tax credit carryforwards. These credit carryforwards expire in 2020.between 2020 and 2023. Deferred tax assets of $12.6$9.7 million have been recorded for state operating loss carryforwards. These losses expire between 20122014 and 2031.2033. Additionally, the Company has incurred losses in a foreign jurisdiction where the realization of the future economica tax benefit is soconsidered remote that the benefit is not reflectedand, as a result, the Company has no deferred tax asset.asset recognized for such losses.
The net change in the Fiscal 20112013 valuation allowance shown above is a decrease of $44.5 million. The decrease was primarily due to the classification of a foreign business as held for sale. The net change in the Fiscal 2012 valuation allowance was an increase of $1.9 million.$26.2 million. The increase was primarily due to the recording of additional valuation allowance for foreign loss carryforwards that are not expected to be utilized, partially offset by the release of valuation allowance related to state tax loss and credit carryforwards resulting from a reorganization plan.that are now expected to be utilized. The net change in the Fiscal 20102011 valuation allowance was an increase of $3.4 million.$1.9 million. The increase was primarily due to the recording of additional valuation allowance for foreign loss carryforwards that are not expected to be utilized prior to their expiration date, partially offset by a reduction in unrealizable net state deferred tax assets.
54
H. J. Heinz Company and Subsidiaries
Notes to Consolidated Financial Statements — (Continued)
A reconciliation of the beginning and ending amount of gross unrecognized tax benefits is as follows:
| 2011 | 2010 | 2009 | ||||||||||
| (Dollars in millions) | ||||||||||||
| Balance at the beginning of the fiscal year | $ | 57.1 | $ | 86.6 | $ | 129.1 | ||||||
| Increases for tax positions of prior years | 13.5 | 3.7 | 9.4 | |||||||||
| Decreases for tax positions of prior years | (26.0 | ) | (35.4 | ) | (59.5 | ) | ||||||
| Increases based on tax positions related to the current year | 10.8 | 10.4 | 13.1 | |||||||||
| Increases due to business combinations | 26.9 | — | 3.8 | |||||||||
| Decreases due to settlements with taxing authorities | (5.4 | ) | (0.8 | ) | (0.8 | ) | ||||||
| Decreases due to lapse of statute of limitations | (6.2 | ) | (7.4 | ) | (8.5 | ) | ||||||
| Balance at the end of the fiscal year | $ | 70.7 | $ | 57.1 | $ | 86.6 | ||||||
| 2013 | 2012 | 2011 | |||||||||
| (In millions) | |||||||||||
| Balance at the beginning of the fiscal year | $ | 52.7 | $ | 70.7 | $ | 57.1 | |||||
| Increases for tax positions of prior years | 1.9 | 5.2 | 13.5 | ||||||||
| Decreases for tax positions of prior years | (8.6 | ) | (18.0 | ) | (26.0 | ) | |||||
| Increases based on tax positions related to the current year | 13.9 | 3.7 | 10.8 | ||||||||
| Increases due to business combinations | — | — | 26.9 | ||||||||
| Decreases due to settlements with taxing authorities | (4.1 | ) | (2.2 | ) | (5.4 | ) | |||||
| Decreases due to lapse of statute of limitations | (10.4 | ) | (6.7 | ) | (6.2 | ) | |||||
| Balance at the end of the fiscal year | $ | 45.4 | $ | 52.7 | $ | 70.7 | |||||
The amount of unrecognized tax benefits that, if recognized, would impact the effective tax rate was $56.5$38.3 million and $38.2$38.9 million, on April 27, 2011 and April 28, 2010,2013 and April 29, 2012, respectively.
The Company classifies interest and penalties on tax uncertainties as a component of the provision for income taxes. For Fiscal 2011,2013, the total amount of net interest and penalty expense included in the provision for income taxes was a benefit of $1.3$4.2 million and $0.1$6.3 million, respectively. For Fiscal 2010,2012, the total amount of net interest and penalty expense included in the provision for income taxes was a benefit of $5.2$9.5 million and $1.0$4.7 million, respectively. For Fiscal 2009,2011, the total amount of net interest and penalty expense included in the provision for income taxes was an expense of $3.1 million and a benefit of $0.6$1.3 million and $0.1 million, respectively. The total amount of interest and penalties accrued as of April 27, 201128, 2013 was $27.3$8.5 million and $21.1$6.9 million, respectively. The corresponding amounts of accrued interest and penalties at April 28, 201029, 2012 were $17.3$16.0 million and $1.2$13.8 million, respectively.
It is reasonably possible that the amount of unrecognized tax benefits will decrease by as much as $17.9$16.9 million in the next 12 months primarily due to the expiration of statutes in various foreign jurisdictions along with the progression of state and foreign audits in process.
The provision for income taxes consists of provisions for federal, state and foreign income taxes. The Company operates in an international environment with significant operations in various locations outside the U.S. Accordingly, the consolidated income tax rate is a composite rate reflecting the earnings in various locations and the applicable tax rates. In the normal course of business the Company is subject to examination by taxing authorities throughout the world, including such major jurisdictions as Australia, Canada, Italy, the United Kingdom and the United States. The Company has substantially concluded all national income tax matters for
58
years through Fiscal 20092010 for the U.S., through Fiscal 2008 for the and United Kingdom, through Fiscal 20072009 for Italy, and through Fiscal 20062008 for Australia and Canada.
Undistributed earnings of foreign subsidiaries considered to be indefinitely reinvested or which may be remitted tax free in certain situations, amounted to $4.4$5.7 billion at April 27, 2011.28, 2013. The Company has not determined the deferred tax liability associated with these undistributed earnings, as such determination is not practicable.
8.Debt and Financing Arrangements
Short-term debt consisted of bank debt and other borrowings of $87.8$1.14 billion and $46.5 million and $43.9 million as of April 27, 2011 and April 28, 2010,2013 and April 29, 2012, respectively. The weighted average interest rate was 3.4%1.4% and 4.7%5.1% for Fiscal 20112013 and Fiscal 2010,2012, respectively. See below for further discussion of a short-term credit agreement entered into in April 2013.
55
H. J. Heinz Company and Subsidiaries
Notes to Consolidated Financial Statements — (Continued)
Long-term debt was comprised of the following as of April 28, 2013 and April 29, 2012:
| 2013 | 2012 | ||||||
| (In thousands) | |||||||
| Japanese Yen Credit Agreement due October 2012 (variable rate) | — | 186,869 | |||||
| Other U.S. Dollar Debt due May 2013 — November 2034 (0.94%—7.96%) | 25,688 | 43,164 | |||||
| Other Non-U.S. Dollar Debt due May 2013 — May 2023 (3.50%—11.00%) | 56,293 | 64,060 | |||||
| 5.35% U.S. Dollar Notes due July 2013 | 499,993 | 499,958 | |||||
| 8.0% Heinz Finance Preferred Stock due July 2013 | 350,000 | 350,000 | |||||
| Japanese Yen Credit Agreement due December 2013 (variable rate) | 163,182 | 199,327 | |||||
| U.S. Dollar Private Placement Notes due May 2014 — May 2021 (2.11% - 4.23%) | 500,000 | 500,000 | |||||
| Japanese Yen Credit Agreement due October 2015 (variable rate) | 152,983 | — | |||||
| U.S. Dollar Private Placement Notes due July 2016 — July 2018 (2.86% - 3.55%) | 100,000 | 100,000 | |||||
| 2.00% U.S. Dollar Notes due September 2016 | 299,933 | 299,913 | |||||
| 1.50% U.S. Dollar Notes due March 2017 | 299,648 | 299,556 | |||||
| U.S. Dollar Remarketable Securities due December 2020 | 119,000 | 119,000 | |||||
| 3.125% U.S. Dollar Notes due September 2021 | 395,772 | 395,268 | |||||
| 2.85% U.S. Dollar Notes due March 2022 | 299,565 | 299,516 | |||||
| 6.375% U.S. Dollar Debentures due July 2028 | 231,396 | 231,137 | |||||
| 6.25% British Pound Notes due February 2030 | 192,376 | 202,158 | |||||
| 6.75% U.S. Dollar Notes due March 2032 | 435,185 | �� | 435,112 | ||||
| 7.125% U.S. Dollar Notes due August 2039 | 628,082 | 626,747 | |||||
| 4,749,096 | 4,851,785 | ||||||
| Hedge Accounting Adjustments (See Note 13) | 122,455 | 128,444 | |||||
| Less portion due within one year | (1,023,212 | ) | (200,248 | ) | |||
| Total long-term debt | $ | 3,848,339 | $ | 4,779,981 | |||
| Weighted-average interest rate on long-term debt, including the impact of applicable interest rate swaps | 4.07 | % | 4.28 | % | |||
During the first quarter of Fiscal 2013, the Company terminated its variable rate three year 15 billion Japanese yen denominated credit agreement that was due October 2012, and settled the associated swap, which had an immaterial impact to the Company's consolidated statement of income. In addition, the Company entered into a new variable rate three year 15 billion Japanese yen denominated credit agreement. The proceeds were swapped to $188.5 million U.S. dollars and the interest rate was fixed at 2.22%.
At April 27, 2011,28, 2013, the Company had a $1.2$1.5 billion credit agreement which expires in April 2012.June 2016. This credit agreement supportssupported the Company’sCompany's commercial paper borrowings. AsIn April 2013, the Company entered into a new $1.5 billion1.28% credit agreement under which it borrowed $1.1 billion primarily to pay off all of the outstanding commercial paper. Both credit agreements were terminated on June 7, 2013 in conjunction with the closing of the Merger Agreement. See Note 21 for further explanation of the financing implications on the Company's indebtedness as a result of this Merger Agreement. In addition, the Company has $438 million of foreign lines of credit available at April 28, 2013.
During the fourth quarter of Fiscal 2012, the Company issued $300 million1.50% Notes due 2017 and $300 million2.85% Notes due 2022. During the second quarter of Fiscal 2012, the Company issued $300 million2.00% Notes due 2016 and $400 million3.125% Notes due 2021. During the first quarter of Fiscal 2012, the Company issued $500 million of private placement notes at an average interest rate of 3.48% with maturities of three, five, seven and ten years. Additionally, during the first quarter of Fiscal 2012, the Company issued $100 million of private placement notes at an average interest rate of 3.38% with maturities of five and seven years. The prior year proceeds were used for the repayment of commercial paper borrowings at April 28, 2010 are classified as long-termand to pay off the Company's $750 million of notes which matured on July 15, 2011 and $600 million notes which matured on March 15, 2012.
Certain of the Company's debt based upon the Company’s intent and ability to refinance these borrowings on a long-term basis. There were no commercial paper borrowings outstanding at April 27, 2011. The credit agreement hasagreements contain customary covenants, including a leverage ratio covenant. The Company was in compliance with all of its covenants as of April 27, 2011 and April 28, 2010. In June 2011, the Company expects to modify the credit agreement to increase the available borrowings under the facility to $1.5 billion as well as to extend its maturity date to 2016. In anticipation of these modifications, the Company terminated a $500 million credit agreement during 2013 and April 2011. In addition, the Company has $439.2 million of foreign lines of credit available at April 27, 2011.29, 2012.
59
56
H. J. Heinz Company and Subsidiaries
Notes to Consolidated Financial Statements — (Continued)
| 2011 | 2010 | |||||||
| (Dollars in thousands) | ||||||||
| Commercial Paper (variable rate) | $ | — | $ | 232,829 | ||||
| 7.125% U.S. Dollar Notes due August 2039 | 625,569 | 624,531 | ||||||
| 8.0% Heinz Finance Preferred Stock due July 2013 | 350,000 | 350,000 | ||||||
| 5.35% U.S. Dollar Notes due July 2013 | 499,923 | 499,888 | ||||||
| 6.625% U.S. Dollar Notes due July 2011 | 749,982 | 749,878 | ||||||
| 6.00% U.S. Dollar Notes due March 2012 | 599,631 | 599,187 | ||||||
| U.S. Dollar Remarketable Securities due December 2020 | 119,000 | 119,000 | ||||||
| 6.375% U.S. Dollar Debentures due July 2028 | 230,878 | 230,619 | ||||||
| 6.25% British Pound Notes due February 2030 | 206,590 | 188,928 | ||||||
| 6.75% U.S. Dollar Notes due March 2032 | 435,038 | 440,942 | ||||||
| Japanese Yen Credit Agreement due October 2012 (variable rate) | 182,571 | 159,524 | ||||||
| Japanese Yen Credit Agreement due December 2013 (variable rate) | 194,742 | — | ||||||
| Other U.S. Dollar due May 2011—November 2034 (0.90—7.94)% | 112,829 | 110,339 | ||||||
OtherNon-U.S. Dollar due May 2011—May 2023 (3.50—11.25)% | 67,964 | 61,558 | ||||||
| 4,374,717 | 4,367,223 | |||||||
| Hedge Accounting Adjustments (See Note 12) | 150,543 | 207,096 | ||||||
| Less portion due within one year | (1,447,132 | ) | (15,167 | ) | ||||
| Total long-term debt | $ | 3,078,128 | $ | 4,559,152 | ||||
| Weighted-average interest rate on long-term debt, including the impact of applicable interest rate swaps | 4.23 | % | 4.45 | % | ||||
During the third quarter of Fiscal 2011,2012, the Company remarketed the remaining $119 million remarketable securities at a rate of 6.049%. The next remarketing is scheduled for December 1, 2014. On the same date, the Company entered into a variable rate, three-year 16 billion Japanese yen denominated credit agreement. The proceeds were used in the funding of the Foodstar acquisition and for general corporate purposes and were swapped to $193.2 million and the interest rate was fixed at 2.66%. See Note 12 for additional information.
60
HFC’s 3,500 mandatorily redeemable preferred shares are classified as long-term debt. Each share of preferred stock is entitled to annual cash dividends at a rate of 8% or $8,000$8,000 per share. On July 15, 2013, each share will be redeemed for $100,000$100,000 in cash for a total redemption price of $350 million.$350 million.
Annual maturities of long-term debt during the next five fiscal years are $1,447.1 million in 2012, $225.1 million in 2013, $1,082.9 million$1.02 billion in 2014, $5.4$73.7 million in 2015, $163.1 million in 2016, $738.2 million in 2017 and $5.6$2.6 million in 2016.2018.
During the first quarter of Fiscal 2013, the Company entered into an amendment of its $175 million accounts receivable securitization program that extended the term until June 7, 2013. For the sale of receivables under the program, the Company receives cash consideration of up to $175 million and a receivable for the remainder of the purchase price (the "Deferred Purchase Price"). The cash consideration and the carrying amount of receivables removed from the consolidated balance sheets were $158.7 million and $161.8 million as of April 28, 2013 and April 29, 2012, respectively, resulting in a decrease of $3.1 million in cash for sales under this program for Fiscal 2013 and an increase in cash of $132.8 million for Fiscal 2012. The fair value of the Deferred Purchase Price was $53.6 million and $56.8 million as of April 28, 2013 and April 29, 2012, respectively. The increase in cash proceeds related to the Deferred Purchase Price was $3.2 million and $117.1 million as of April 28, 2013 and April 29, 2012, respectively. This Deferred Purchase Price is included as a trade receivable on the consolidated balance sheets and has a carrying value which approximates fair value as of April 28, 2013 and April 29, 2012, due to the nature of the short-term underlying financial assets. On May 31, 2013, subsequent to the Fiscal 2013 year end, the Company entered into an amendment of the $175 million accounts receivables securitization program that extended the term until May 30, 2014. Prior to this amendment, the Company accounted for transfers of receivables pursuant to this program as a sale and removed them from the consolidated balance sheet. This amendment results in the transfers no longer qualifying for sale treatment under U.S. GAAP. As a result, all transfers will be accounted for subsequent to this amendment as secured borrowings and the receivables sold pursuant to this program will be included on the balance sheet as trade receivables, along with the Deferred Purchase Price.
| Supplemental Cash Flows Information |
| 2011 | 2010 | 2009 | ||||||||||
| (Dollars in thousands) | ||||||||||||
| Cash Paid During the Year For: | ||||||||||||
| Interest | $ | 268,131 | $ | 305,332 | $ | 310,047 | ||||||
| Income taxes | $ | 154,527 | $ | 138,953 | $ | 203,298 | ||||||
| Details of Acquisitions: | ||||||||||||
| Fair value of assets | $ | 1,057,870 | $ | 16,072 | $ | 478,440 | ||||||
| Liabilities(1) | 274,294 | 4,644 | 181,093 | |||||||||
| Redeemable noncontrolling interest(2) | 124,669 | — | — | |||||||||
| Cash paid | 658,907 | 11,428 | 297,347 | |||||||||
| Less cash acquired | 40,605 | — | 3,449 | |||||||||
| Net cash paid for acquisitions | $ | 618,302 | $ | 11,428 | $ | 293,898 | ||||||
| 2013 | 2012 | 2011 | |||||||||
| (In thousands) | |||||||||||
| Cash Paid During the Year For: | |||||||||||
| Interest | $ | 285,324 | $ | 277,954 | $ | 268,131 | |||||
| Income taxes | $ | 327,046 | $ | 265,547 | $ | 154,527 | |||||
| Details of Acquisitions: | |||||||||||
| Fair value of assets | $ | — | $ | — | $ | 1,057,870 | |||||
Liabilities(1) | — | (3,250 | ) | 274,294 | |||||||
Redeemable noncontrolling interest(2) | — | — | 124,669 | ||||||||
| Cash paid | — | 3,250 | 658,907 | ||||||||
| Less cash acquired | — | — | 40,605 | ||||||||
| Net cash paid for acquisitions | $ | — | $ | 3,250 | $ | 618,302 | |||||
| (1) | Includes contingent obligations to sellers of |
| (2) | See Note |
61
In addition, the Company acted as servicer for approximately $146$184.3 million and $126$205.6 million of trade receivables which were sold to unrelated third parties without recourse as of April 27, 2011 and April 28, 2010,2013 and April 29, 2012, respectively. These trade receivables are short-term in nature. The proceeds from these sales are also recognized on the statements of cash flows as a component of operating activities.
The Company has not recorded any servicing assets or liabilities as of April 27, 2011 or April 28, 20102013 or April 29, 2012 for the arrangements discussed above because the fair value of these servicing agreements as well as the fees earned were not material to the financial statements.
57
As of April 27, 2011,28, 2013, the Company had outstanding stock option awards, restricted stock units and restricted stock awards issued pursuant to various shareholder-approved plans and a shareholder-authorized employee stock purchase plan. The compensation cost related to these plans primarily recognized in selling, general and administrative expenses,SG&A and the related tax benefit was $32.7 millionare as follows:
| Fiscal Year Ended | |||||||||||
| April 28, 2013 | April 29, 2012 | April 27, 2011 | |||||||||
| (In millions) | |||||||||||
| Pre-tax compensation cost | $ | 33.7 | $ | 36.5 | $ | 32.7 | |||||
| Tax benefit | 10.8 | 12.0 | 10.4 | ||||||||
| After-tax compensation cost | $ | 22.9 | $ | 24.5 | $ | 22.3 | |||||
During Fiscals 2013 and $10.4 million for2012, the fiscal year ended April 27, 2011, $33.4 million and $10.3 million for the fiscal year ended April 28, 2010, and $37.9 million and $12.8 million for the fiscal year ended April 29, 2009, respectively.
On June 7, 2013, subsequent to the Fiscal 2013 year end and in connection with the Merger, all outstanding stock option awards, restricted stock units (except for certain retention RSUs which continue on their original terms) and restricted stock awards issued pursuant to various shareholder-approved plans and a shareholder-authorized employee stock purchase plan were automatically canceled and converted into the right to receive certain cash consideration.
In the Merger, (i) each outstanding share of Company common stock (other than shares owned by the Company, Parent, Merger Sub or any other direct or indirect wholly owned subsidiary of Parent, and in each case not held on behalf of third parties) was cancelled and automatically converted into the right to receive $72.50 in cash, without interest and less applicable withholding taxes thereon (the “Merger Consideration”), (ii) each outstanding stock option, whether vested or unvested, was cancelled and automatically converted into the right to receive, with respect to each share subject to the option, the Merger Consideration less the exercise price per share, (iii) each outstanding Company phantom unit, whether vested or unvested, was cancelled and automatically converted into the right to receive the Merger Consideration, and (iv) each outstanding Company restricted stock unit (other than retention restricted stock units, which will remain subject to the vesting schedule pursuant to the existing terms of the applicable award agreements and that the general timing of payment would be in accordance with such terms), whether vested or unvested, was cancelled and automatically converted into the right to receive, with respect to each share subject to the restricted stock unit, the Merger Consideration plus any accrued and unpaid dividend equivalents, except that payment in respect of Company restricted stock units that have been deferred will be made in accordance with the terms of the award and the applicable deferral election made by the holder.
There are currently no outstanding stock option awards, restricted stock units and restricted stock awards, other than the retention RSUs described above.
Stock Options:
Stock options generally vest over a period of one to four years after the date of grant. Awards granted prior to Fiscal 2006 generally had a maximum term of ten years. Awards granted between Fiscal 2006 and Fiscal 2012 have a maximum term of seven years. Beginning in Fiscal 2006,2013, awards have a maximum term of seventen years.
In accordance with their respective plans, stock option awards are forfeited if a holder voluntarily terminates employment prior to the vesting date. The Company estimates forfeitures based on an analysis of historical trends updated as discrete new
58
H. J. Heinz Company and Subsidiaries
Notes to Consolidated Financial Statements — (Continued)
information becomes available and will be re-evaluated on an annual basis. Compensation cost in any period is at least equal to the grant-date fair value of the vested portion of an award on that date.
The Company presents all benefits of tax deductions resulting from the exercise of stock-based compensation as operating cash flows in the consolidated statements of cash flows, except the benefit of tax deductions in excess of the compensation cost recognized for those options (“excess tax benefits”) which are classified as financing cash flows. For the fiscal year ended April 27, 2011, $12.428, 2013, $8.1 million of cash tax benefits was reported as an operating cash inflow and $8.6$10.3 million of excess
62
A summary of the Company’s 2003 Plan at April 27, 201128, 2013 is as follows:
| 2003 Plan | |||||
| ( | |||||
| In thousands) | |||||
| Number of shares authorized | 18,869 | ||||
| Number of stock option shares granted | ( | ) | |||
| Number of stock option shares cancelled/forfeited and returned to the plan | 1,113 | ||||
| Number of restricted stock units and restricted stock issued | ( | ) | |||
| Shares available for grant as stock options | 3,386 | ||||
During Fiscal 2011,2013, the Company granted 1,733,1351,540,340 option awards to employees sourced from the 2000 and 2003 Plans.Plan. The weighted average fair value per share of the options granted during the fiscal years ended April 28, 2013, April 29, 2012, and April 27, 2011 April 28, 2010 and April 29, 2009 as computed using the Black-Scholes pricing model was $5.36, $4.71,$5.79, $5.80, and $5.75,$5.36, respectively. The weighted average assumptions used to estimate these fair values are as follows:
| Fiscal Year Ended | ||||||||||||
| April 27, | April 28, | April 29, | ||||||||||
| 2011 | 2010 | 2009 | ||||||||||
| Dividend yield | 3.9 | % | 4.3 | % | 3.3 | % | ||||||
| Expected volatility | 20.5 | % | 20.2 | % | 14.9 | % | ||||||
| Expected term (years) | 5.5 | 5.5 | 5.5 | |||||||||
| Risk-free interest rate | 1.7 | % | 2.7 | % | 3.1 | % | ||||||
| Fiscal Year Ended | ||||||||
| April 28, 2013 | April 29, 2012 | April 27, 2011 | ||||||
| Dividend yield | 3.7 | % | 3.7 | % | 3.9 | % | ||
| Expected volatility | 19.4 | % | 20.9 | % | 20.5 | % | ||
| Expected term (years) | 7.0 | 5.0 | 5.5 | |||||
| Risk-free interest rate | 1.0 | % | 1.0 | % | 1.7 | % | ||
The dividend yield assumption is based on the current fiscal year dividend payouts. The expected volatility of the Company’s common stock at the date of grant is estimated based on a historic daily volatility rate over a period equal to the average life of an option. The weighted average expected life of options is based on consideration of historical exercise patterns adjusted for changes in the contractual term and exercise periods of current awards. The risk-free interest rate is based on the U.S. Treasury (constant maturity) rate in effect at the date of grant for periods corresponding with the expected term of the options.
63
59
H. J. Heinz Company and Subsidiaries
Notes to Consolidated Financial Statements — (Continued)
A summary of the Company’s stock option activity and related information is as follows:
| Weighted | ||||||||||||
| Average | ||||||||||||
| Number of | Exercise Price | Aggregate | ||||||||||
| Options | (per share) | Intrinsic Value | ||||||||||
| (Amounts in thousands, except per share data) | ||||||||||||
| Options outstanding at April 30, 2008 | 22,134 | $ | 40.06 | $ | 886,758 | |||||||
| Options granted | 1,551 | 50.91 | 78,978 | |||||||||
| Options exercised | (6,684 | ) | 42.35 | (283,064 | ) | |||||||
| Options cancelled/forfeited and returned to the plan | (2,901 | ) | 47.77 | (138,601 | ) | |||||||
| Options outstanding at April 29, 2009 | 14,100 | 38.59 | 544,071 | |||||||||
| Options granted | 1,768 | 39.12 | 69,166 | |||||||||
| Options exercised | (2,921 | ) | 35.46 | (103,558 | ) | |||||||
| Options cancelled/forfeited and returned to the plan | (26 | ) | 40.44 | (1,068 | ) | |||||||
| Options outstanding at April 28, 2010 | 12,921 | 39.36 | 508,611 | |||||||||
| Options granted | 1,733 | 46.42 | 80,460 | |||||||||
| Options exercised | (4,813 | ) | 35.73 | (171,980 | ) | |||||||
| Options cancelled/forfeited and returned to the plan | (73 | ) | 42.81 | (3,147 | ) | |||||||
| Options outstanding at April 27, 2011 | 9,768 | $ | 42.38 | $ | 413,944 | |||||||
| Options vested and exercisable at April 29, 2009 | 10,933 | $ | 36.18 | $ | 395,558 | |||||||
| Options vested and exercisable at April 28, 2010 | 9,300 | $ | 37.59 | $ | 349,600 | |||||||
| Options vested and exercisable at April 27, 2011 | 5,744 | $ | 40.65 | $ | 233,507 | |||||||
Number of Options | Weighted Average Exercise Price (per share) | Aggregate Intrinsic Value | ||||||||
| (In thousands, except per share data) | ||||||||||
| Options outstanding at April 28, 2010 | 12,921 | $ | 39.36 | $ | 508,611 | |||||
| Options granted | 1,733 | 46.42 | 80,460 | |||||||
| Options exercised | (4,813 | ) | 35.73 | (171,980 | ) | |||||
| Options cancelled/forfeited and returned to the plan | (73 | ) | 42.81 | (3,147 | ) | |||||
| Options outstanding at April 27, 2011 | 9,768 | 42.38 | 413,944 | |||||||
| Options granted | 1,649 | 52.19 | 86,068 | |||||||
| Options exercised | (2,798 | ) | 37.99 | (106,287 | ) | |||||
| Options cancelled/forfeited and returned to the plan | (11 | ) | 38.38 | (435 | ) | |||||
| Options outstanding at April 29, 2012 | 8,608 | 45.69 | 393,290 | |||||||
| Options granted | 1,540 | 55.72 | 85,828 | |||||||
| Options exercised | (3,504 | ) | 42.35 | (148,376 | ) | |||||
| Options cancelled/forfeited and returned to the plan | (110 | ) | 50.67 | (5,616 | ) | |||||
| Options outstanding at April 28, 2013 | 6,534 | $ | 49.76 | $ | 325,126 | |||||
| Options vested and exercisable at April 27, 2011 | 5,744 | $ | 40.65 | $ | 233,507 | |||||
| Options vested and exercisable at April 29, 2012 | 4,418 | $ | 43.90 | $ | 193,942 | |||||
| Options vested and exercisable at April 28, 2013 | 2,573 | $ | 48.01 | $ | 123,502 | |||||
The following summarizes information about shares under option in the respective exercise price ranges at April 27, 2011:28, 2013:
| Options Outstanding | Options Exercisable | |||||||||||||||||||||||
| Weighted- | Weighted- | Weighted- | ||||||||||||||||||||||
| Average | Average | Average | Weighted- | |||||||||||||||||||||
| Remaining | Remaining | Remaining | Average | |||||||||||||||||||||
| Range of Exercise | Number | Life | Exercise Price | Number | Life | Exercise Price | ||||||||||||||||||
| Price Per Share | Outstanding | (Years) | Per Share | Exercisable | (Years) | Per Share | ||||||||||||||||||
| (Options in thousands) | ||||||||||||||||||||||||
| $29.18-$35.38 | 1,280 | 2.0 | $ | 33.47 | 1,274 | 2.0 | $ | 33.47 | ||||||||||||||||
| $35.39-$42.42 | 3,964 | 3.5 | 39.09 | 2,647 | 2.6 | 39.11 | ||||||||||||||||||
| $42.43-$51.25 | 4,524 | 4.8 | 47.77 | 1,823 | 3.7 | 47.90 | ||||||||||||||||||
| 9,768 | 3.9 | $ | 42.38 | 5,744 | 2.8 | $ | 40.65 | |||||||||||||||||
| Options Outstanding | Options Exercisable | |||||||||||||||||
Weighted- Average Remaining | Weighted- Average Remaining | Weighted- Average Remaining | Weighted- Average | |||||||||||||||
| Range of Exercise | Number | Life | Exercise Price | Number | Life | Exercise Price | ||||||||||||
| Price Per Share | Outstanding | (Years) | Per Share | Exercisable | (Years) | Per Share | ||||||||||||
| (Options in thousands) | ||||||||||||||||||
| $31.95-$34.00 | 64 | 0.50 | $ | 33.86 | 64 | 0.50 | $ | 33.86 | ||||||||||
| $34.01-$42.42 | 716 | 3.15 | 38.98 | 290 | 2.96 | 38.85 | ||||||||||||
| $42.43-$55.72 | 5,754 | 5.45 | 51.28 | 2,219 | 3.40 | 49.61 | ||||||||||||
| 6,534 | 5.15 | $ | 49.76 | 2,573 | 3.28 | $ | 48.01 | |||||||||||
The Company received proceeds of $154.8$113.5 million $67.4, $82.7 million, and $264.9$154.8 million from the exercise of stock options during the fiscal years ended April 28, 2013, April 29, 2012 and April 27, 2011 April 28, 2010 and April 29, 2009,, respectively. The tax benefit recognized as a result of stock option exercises was $21.0$18.3 million $9.3, $15.1 million and $14.3$21.0 million for the fiscal years ended April 28, 2013, April 29, 2012, and April 27, 2011 April 28, 2010 and April 29, 2009,, respectively.
60
H. J. Heinz Company and Subsidiaries
Notes to Consolidated Financial Statements — (Continued)
A summary of the status of the Company’s unvested stock options is as follows:
| Weighted | ||||||||
| Average | ||||||||
| Grant Date | ||||||||
| Number of | Fair Value | |||||||
| Options | (per share) | |||||||
| (Amounts in thousands, except per share data) | ||||||||
| Unvested options at April 28, 2010 | 3,621 | $ | 5.36 | |||||
| Options granted | 1,733 | 5.36 | ||||||
| Options vested | (1,282 | ) | 5.64 | |||||
| Options forfeited | (48 | ) | 5.19 | |||||
| Unvested options at April 27, 2011 | 4,024 | $ | 5.27 | |||||
Number of Options | Weighted Average Grant Date Fair Value (per share) | |||||
| (In thousands, except per share data) | ||||||
| Unvested options at April 29, 2012 | 4,190 | $ | 5.43 | |||
| Options granted | 1,540 | 5.79 | ||||
| Options vested | (1,662 | ) | 5.39 | |||
| Options forfeited | (107 | ) | $ | 5.61 | ||
| Unvested options at April 28, 2013 | 3,961 | $ | 5.59 | |||
Unrecognized compensation cost related to unvested option awards under the 2000 and 2003 Plans totaled $7.7$4.6 million and $8.1$6.4 million as of April 27, 2011 and April 28, 2010,2013 and April 29, 2012, respectively. This cost is expected to be recognized over a weighted averageweighted-average period of 1.5 years.
Restricted Stock Units and Restricted Shares:
The 2003 Plan authorizes up to 9.4 million shares for issuance as restricted stock units (“RSUs”) or restricted stock with vesting periods from the first to the fifth anniversary of the grant date as set forth in the award agreements. Upon vesting, the RSUs are converted into shares of the Company’s stock on aone-for-one basis and issued to employees, subject to any deferral elections made by a recipient or required by the plan. Restricted stock is reserved in the recipients’ name at the grant date and issued upon vesting. The Company is entitled to an income tax deduction in an amount equal to the taxable income reported by the holder upon vesting of the award. RSUs generally vest over a period of one to four years after the date of grant.
Total compensation expense relating to RSUs and restricted stock was $23.2$23.6 million $24.8, $25.7 million and $26.6$23.2 million for the fiscal years ended April 28, 2013, April 29, 2012, and April 27, 2011 April 28, 2010 and April 29, 2009,, respectively. Unrecognized compensation cost in connection with RSU and restricted stock grants totaled $29.4$24.9 million $29.8, $27.6 million, and $31.8$29.4 million at April 28, 2013, April 29, 2012, and April 27, 2011 April 28, 2010 and April 29, 2009,, respectively. The cost is expected to be recognized over a weighted-average period of 1.7 years.
A summary of the Company’s RSU and restricted stock awards at April 27, 201128, 2013 is as follows:
| 2003 Plan | |||||
| ( | |||||
| Number of shares authorized | 9,440 | ||||
| Number of shares reserved for issuance | ( | ) | |||
| Number of shares | 1,779 | ||||
| Shares available for grant | 4,377 | ||||
65
61
H. J. Heinz Company and Subsidiaries
Notes to Consolidated Financial Statements — (Continued)
A summary of the activity of unvested RSU and restricted stock awards and related information is as follows:
| Weighted | ||||||||
| Average | ||||||||
| Grant Date | ||||||||
| Fair Value | ||||||||
| Number of Units | (Per Share) | |||||||
| (Amounts in thousands, | ||||||||
| except per share data) | ||||||||
| Unvested units and stock at April 30, 2008 | 2,087 | $ | 39.88 | |||||
| Units and stock granted | 577 | 49.69 | ||||||
| Units and stock vested | (910 | ) | 37.91 | |||||
| Units and stock cancelled/forfeited and returned to the plan | (32 | ) | 46.52 | |||||
| Unvested units and stock at April 29, 2009 | 1,722 | 44.08 | ||||||
| Units and stock granted | 628 | 39.55 | ||||||
| Units and stock vested | (834 | ) | 40.59 | |||||
| Units and stock cancelled/forfeited and returned to the plan | (20 | ) | 44.12 | |||||
| Unvested units and stock at April 28, 2010 | 1,496 | 44.13 | ||||||
| Units and stock granted | 574 | 46.74 | ||||||
| Units and stock vested | (725 | ) | 44.96 | |||||
| Units and stock cancelled/forfeited and returned to the plan | (49 | ) | 43.47 | |||||
| Unvested units and stock at April 27, 2011 | 1,296 | $ | 44.84 | |||||
| Number of Units | Weighted Average Grant Date Fair Value (Per Share) | |||||
(In thousands, except per share data) | ||||||
| Unvested units and stock at April 28, 2010 | 1,496 | $ | 44.13 | |||
| Units and stock granted | 574 | 46.74 | ||||
| Units and stock vested | (725 | ) | 44.96 | |||
| Units and stock cancelled/forfeited and returned to the plan | (49 | ) | 43.47 | |||
| Unvested units and stock at April 27, 2011 | 1,296 | 44.84 | ||||
| Units and stock granted | 526 | 52.31 | ||||
| Units and stock vested | (520 | ) | 45.27 | |||
| Units and stock cancelled/forfeited and returned to the plan | (32 | ) | 45.90 | |||
| Unvested units and stock at April 29, 2012 | 1,270 | 47.75 | ||||
| Units and stock granted | 464 | 55.88 | ||||
| Units and stock vested | (567 | ) | 47.33 | |||
| Units and stock cancelled/forfeited and returned to the plan | (53 | ) | 50.01 | |||
| Unvested units and stock at April 28, 2013 | 1,114 | $ | 51.24 | |||
Upon share option exercise or vesting of restricted stock and RSUs, the Company uses available treasury shares and maintains a repurchase program that anticipates exercises and vesting of awards so that shares are available for issuance. The Company records forfeitures of restricted stock as treasury share repurchases. The Company repurchased approximately 1.4 million shares during Fiscal 2011.
Global Stock Purchase Plan:
The Company hashad a shareholder-approved employee global stock purchase plan (the “GSPP”) that permitspermitted substantially all employees to purchase shares of the Company’s common stock at a discounted price through payroll deductions at the end of two six-month offering periods. Currently, theThe offering periods arewere February 16 to August 15 and August 16 to February 15. From the February 2006 to February 2009 offering periods, theThe purchase price of the option was equal to 85% of the fair market value of the Company’s common stock on the last day of the offering period. Commencing with the August 2009 offering period, the purchase price of the option is equal to 95% of the fair market value of the Company’s common stock on the last day of the offering period. The number of shares available for issuance under the GSPP iswas a total of five million shares. During the two offering periods from February 16, 20102012 to February 15, 2011,2013, employees purchased 185,716121,460 shares under the plan. During the two offering periods from February 16, 20092011 to February 15, 2010,2012, employees purchased 280,006165,635 shares under the plan.
As a result of the Merger Agreement, the Company's GSPP was terminated immediately following the scheduled purchases on the February 15, 2013 purchase date for the purchase period August 16, 2012 to February 15, 2013.
Annual Incentive Bonus:
The Company’s management incentive plans cover officers and other key employees. Participants may elect to be paid on a current or deferred basis. The aggregate amount of all awards may not exceed certain limits in any year. Compensation under the management incentive
66
plans was approximately $45$32 million $49, $34 million, and $38$45 million in fiscal years 2011, 2010Fiscals 2013, 2012 and 2009,2011, respectively.
Long-Term Performance Program:
In Fiscal 2011,2013, the Company granted performance awards as permitted in the Fiscal Year 2003 Stock Incentive Plan, subject to the achievement of certain performance goals. These performance awards are tied to the Company’s relative Total Shareholder Return (“Relative TSR”) Ranking within the defined Long-term Performance Program (“LTPP”) peer group and the2-year2-year average after-tax Return on Invested Capital (“ROIC”) metrics. The Relative TSR metric is based on the two-year cumulative return to shareholders from the change in stock price and dividends paid between the starting and ending dates. The starting value was based on the average of each LTPP peer group company stock price for the 60 trading days prior to and including April 29, 2010.2012. The ending value will be based on the average stock price for the 60 trading days prior to and including the close of the Fiscal 20122014 year end, plus dividends paid over the 2 year performance period. The Company also granted performance awards in Fiscal 20102012 under the2010-2011
62
H. J. Heinz Company and Subsidiaries
Notes to Consolidated Financial Statements — (Continued)
2012-2013 LTPP and in Fiscal 20092011 under the2009-2010 2011-2012 LTPP. The compensation cost related to LTPP awards primarily recognized in selling, general and administrative expenses (“SG&A”) was $21.5 million&A and the related tax benefit was $7.4 million for the fiscal year ended April 27, 2011. The compensation cost related to these plans, recognized in SG&A was $20.7 million, and the related tax benefit was $7.0 million for the fiscal year ended April 28, 2010. The compensation cost related to these plans, recognized in SG&A was $17.4 million, and the related tax benefit was $5.9 million for the fiscal year ended April 29, 2009.are as follows:
| Fiscal Year Ended | |||||||||||
| April 28, 2013 | April 29, 2012 | April 27, 2011 | |||||||||
| (In millions) | |||||||||||
| Pre-tax compensation cost | $ | 17.3 | $ | 18.4 | $ | 21.5 | |||||
| Tax benefit | 6.1 | 6.5 | 7.4 | ||||||||
| After-tax compensation cost | $ | 11.2 | $ | 11.9 | $ | 14.1 | |||||
| Fair Value Measurements |
Fair value is defined as the price that would be received to sell an asset or paid to transfer a liability in an orderly transaction between market participants at the measurement date. The fair value hierarchy consists of three levels to prioritize the inputs used in valuations, as defined below:
Level 1:1: Observable inputs that reflect unadjusted quoted prices for identical assets or liabilities in active markets.
Level 2:2: Inputs other than quoted prices included within Level 1 that are observable for the asset or liability, either directly or indirectly.
Level 3:3: Unobservable inputs for the asset or liability.
As of April 27, 2011 and April 28, 2010,2013 and April 29, 2012, the fair values of the Company’s assets and liabilities measured on a recurring basis are categorized as follows:
| April 27, 2011 | April 28, 2010 | |||||||||||||||||||||||||||||||
| Level 1 | Level 2 | Level 3 | Total | Level 1 | Level 2 | Level 3 | Total | |||||||||||||||||||||||||
| (Thousands of Dollars) | ||||||||||||||||||||||||||||||||
| Assets: | ||||||||||||||||||||||||||||||||
| Derivatives(a) | $ | — | $ | 115,705 | $ | — | $ | 115,705 | $ | — | $ | 133,773 | $ | — | $ | 133,773 | ||||||||||||||||
| Total assets at fair value | $ | — | $ | 115,705 | $ | — | $ | 115,705 | $ | — | $ | 133,773 | $ | — | $ | 133,773 | ||||||||||||||||
| Liabilities: | ||||||||||||||||||||||||||||||||
| Derivatives(a) | $ | — | $ | 43,007 | $ | — | $ | 43,007 | $ | — | $ | 36,036 | $ | — | $ | 36,036 | ||||||||||||||||
| Earn-out(b) | $ | — | $ | — | $ | 45,325 | $ | 45,325 | $ | — | $ | — | $ | — | $ | — | ||||||||||||||||
| Total liabilities at fair value | $ | — | $ | 43,007 | $ | 45,325 | $ | 88,332 | $ | — | $ | 36,036 | $ | — | $ | 36,036 | ||||||||||||||||
67
| April 28, 2013 | April 29, 2012 | ||||||||||||||||||||||||||||||
| Level 1 | Level 2 | Level 3 | Total | Level 1 | Level 2 | Level 3 | Total | ||||||||||||||||||||||||
| (In thousands) | |||||||||||||||||||||||||||||||
| Assets: | |||||||||||||||||||||||||||||||
| Derivatives(a) | $ | — | $ | 68,892 | $ | — | $ | 68,892 | $ | — | $ | 90,221 | $ | — | $ | 90,221 | |||||||||||||||
| Total assets at fair value | $ | — | $ | 68,892 | $ | — | $ | 68,892 | $ | — | $ | 90,221 | $ | — | $ | 90,221 | |||||||||||||||
| Liabilities: | |||||||||||||||||||||||||||||||
| Derivatives(a) | $ | — | $ | 79,871 | $ | — | $ | 79,871 | $ | — | $ | 15,379 | $ | — | $ | 15,379 | |||||||||||||||
| Earn-out(b) | $ | — | $ | — | $ | — | $ | — | $ | — | $ | — | $ | 46,881 | $ | 46,881 | |||||||||||||||
| Total liabilities at fair value | $ | — | $ | 79,871 | $ | — | $ | 79,871 | $ | — | $ | 15,379 | $ | 46,881 | $ | 62,260 | |||||||||||||||
| (a) | Foreign currency derivative contracts are valued based on observable market spot and forward rates, and are classified within Level 2 of the fair value hierarchy. Interest rate swaps are valued based on observable market swap rates, and are classified within Level 2 of the fair value hierarchy. Cross-currency interest rate swaps are valued based on observable market spot and swap rates, and are classified within Level 2 of the fair value hierarchy. The total rate of return swap is valued based on observable market swap rates and the Company's credit spread, and is classified within Level 2 of the fair value hierarchy. |
| (b) | The Company acquired Foodstar in China in Fiscal 2011. Consideration for this acquisition included a potential earn-out payment in Fiscal 2014 contingent upon certain net sales and EBITDA (earnings before interest, taxes, depreciation and amortization) targets during Fiscals 2013 and 2014. The fair value of the earn-out |
There have been no transfers between Levels 1, 2 and 3 in Fiscals 2013 and 2012.
63
H. J. Heinz Company and Subsidiaries
Notes to Consolidated Financial Statements — (Continued)
As a result of classifying the LongFong business as held for sale, the Company took a non-cash impairment charge of $36.0 million to goodwill during the third quarter Fiscal 2013. This charge reduced the Company's carrying value to the estimated fair value of the anticipated sale, which is based on unobservable inputs and thus represents a Level 3 measurement. The remaining carrying value is not material. See Note 3 for further information.
The Company recognized $12.6$50.9 million of non-cash asset write-offswrite-downs during Fiscal 20102012 related to twosix factory closures. These factory closures andare directly linked to the exit of a formula business in the U.K.Company's Fiscal 2012 productivity initiatives (see Note 4). These charges reduced the Company’sCompany's carrying value in the assets to net realizable value. Thethe estimated fair value, the remainder of the assets was determined based on observable inputs.which is not material.
| Pension and Other Postretirement Benefit Plans |
Pension Plans:
The Company maintains retirement plans for the majority of its employees. Current defined benefit plans are provided primarily for domestic union and foreign employees. Defined contribution plans are provided for the majority of its domestic non-union hourly and salaried employees as well as certain employees in foreign locations.
Other Postretirement Benefit Plans:
The Company and certain of its subsidiaries provideprovides health care and life insurance benefits for retired employees and their eligible dependents. Certain of the Company’s U.S. and Canadian employees may become eligible for such benefits. The Company currently does not fund these benefit arrangements until claims occur and may modify plan provisions or terminate plans at its discretion.
Measurement Date:
The Company uses the last day of its fiscal year as the measurement date for all of its defined benefit plans and other postretirement benefit plans.
68
64
H. J. Heinz Company and Subsidiaries
Notes to Consolidated Financial Statements — (Continued)
Obligations and Funded Status:
The following table sets forth the changes in benefit obligation, plan assets and funded status of the Company’s principal defined benefit plans and other postretirement benefit plans at April 27, 2011 and April 28, 2010.2013 and April 29, 2012.
| Pension Benefits | Other Retiree Benefits | |||||||||||||||
| 2011 | 2010 | 2011 | 2010 | |||||||||||||
| (Dollars in thousands) | ||||||||||||||||
| Change in Benefit Obligation: | ||||||||||||||||
| Benefit obligation at the beginning of the year | $ | 2,585,984 | $ | 2,230,102 | $ | 235,297 | $ | 234,175 | ||||||||
| Service cost | 32,329 | 30,486 | 6,311 | 5,999 | ||||||||||||
| Interest cost | 142,133 | 149,640 | 12,712 | 15,093 | ||||||||||||
| Participants’ contributions | 2,444 | 2,674 | 822 | 905 | ||||||||||||
| Amendments | 377 | 5,807 | (3,710 | ) | (21,115 | ) | ||||||||||
| Actuarial (gain)/loss | (8,457 | ) | 238,168 | (3,786 | ) | 9,672 | ||||||||||
| Divestitures | — | (413 | ) | — | — | |||||||||||
| Settlement | (3,275 | ) | (4,663 | ) | — | — | ||||||||||
| Curtailment | — | (3,959 | ) | — | — | |||||||||||
| Benefits paid | (159,307 | ) | (156,807 | ) | (16,986 | ) | (18,395 | ) | ||||||||
| Exchange/other | 173,088 | 94,949 | 3,770 | 8,963 | ||||||||||||
| Benefit obligation at the end of the year | $ | 2,765,316 | $ | 2,585,984 | $ | 234,430 | $ | 235,297 | ||||||||
| Change in Plan Assets: | ||||||||||||||||
| Fair value of plan assets at the beginning of the year | $ | 2,869,971 | $ | 1,874,702 | $ | — | $ | — | ||||||||
| Actual return on plan assets | 318,494 | 561,997 | — | — | ||||||||||||
| Divestitures | — | (413 | ) | — | — | |||||||||||
| Settlement | (3,275 | ) | (4,663 | ) | — | — | ||||||||||
| Employer contribution | 22,411 | 539,939 | 16,164 | 17,490 | ||||||||||||
| Participants’ contributions | 2,444 | 2,674 | 822 | 905 | ||||||||||||
| Benefits paid | (159,307 | ) | (156,807 | ) | (16,986 | ) | (18,395 | ) | ||||||||
| Exchange | 211,143 | 52,542 | — | — | ||||||||||||
| Fair value of plan assets at the end of the year | 3,261,881 | 2,869,971 | — | — | ||||||||||||
| Funded status | $ | 496,565 | $ | 283,987 | $ | (234,430 | ) | $ | (235,297 | ) | ||||||
| Pension Benefits | Other Retiree Benefits | ||||||||||||||
| 2013 | 2012 | 2013 | 2012 | ||||||||||||
| (In thousands) | |||||||||||||||
| Change in Benefit Obligation: | |||||||||||||||
| Benefit obligation at the beginning of the year | $ | 2,930,347 | $ | 2,765,316 | $ | 249,017 | $ | 234,431 | |||||||
| Service cost | 31,580 | 33,719 | 6,486 | 5,967 | |||||||||||
| Interest cost | 132,110 | 139,525 | 9,923 | 11,457 | |||||||||||
| Participants’ contributions | 2,294 | 2,281 | 659 | 712 | |||||||||||
| Amendments | (145 | ) | 3,396 | — | 735 | ||||||||||
| Actuarial loss | 428,881 | 196,606 | 9,153 | 17,278 | |||||||||||
| Settlement | (11,971 | ) | (1,854 | ) | — | — | |||||||||
| Benefits paid | (157,672 | ) | (152,342 | ) | (15,760 | ) | (19,574 | ) | |||||||
| Exchange/other | (83,858 | ) | (56,300 | ) | (2,161 | ) | (1,989 | ) | |||||||
| Benefit obligation at the end of the year | $ | 3,271,566 | $ | 2,930,347 | $ | 257,317 | $ | 249,017 | |||||||
| Change in Plan Assets: | |||||||||||||||
| Fair value of plan assets at the beginning of the year | $ | 3,140,834 | $ | 3,261,881 | $ | — | $ | — | |||||||
| Actual return on plan assets | 429,011 | 84,004 | — | — | |||||||||||
| Settlement | (11,971 | ) | (1,854 | ) | — | — | |||||||||
| Employer contribution | 69,388 | 23,469 | 15,101 | 18,862 | |||||||||||
| Participants’ contributions | 2,294 | 2,281 | 659 | 712 | |||||||||||
| Benefits paid | (157,672 | ) | (152,342 | ) | (15,760 | ) | (19,574 | ) | |||||||
| Exchange/other | (92,741 | ) | (76,605 | ) | — | — | |||||||||
| Fair value of plan assets at the end of the year | 3,379,143 | 3,140,834 | — | — | |||||||||||
| Funded status | $ | 107,577 | $ | 210,487 | $ | (257,317 | ) | $ | (249,017 | ) | |||||
Amounts recognized in the consolidated balance sheets consist of the following:
| Pension Benefits | Other Retiree Benefits | |||||||||||||||
| 2011 | 2010 | 2011 | 2010 | |||||||||||||
| (Dollars in thousands) | ||||||||||||||||
| Other non-current assets | $ | 644,598 | $ | 424,554 | $ | — | $ | — | ||||||||
| Other accrued liabilities | (31,589 | ) | (12,842 | ) | (18,259 | ) | (18,874 | ) | ||||||||
| Other non-current liabilities | (116,444 | ) | (127,725 | ) | (216,171 | ) | (216,423 | ) | ||||||||
| Net amount recognized | $ | 496,565 | $ | 283,987 | $ | (234,430 | ) | $ | (235,297 | ) | ||||||
69
| Pension Benefits | Other Retiree Benefits | ||||||||||||||
| 2013 | 2012 | 2013 | 2012 | ||||||||||||
| (In thousands) | |||||||||||||||
| Other non-current assets | $ | 287,467 | $ | 399,868 | $ | — | $ | — | |||||||
| Other accrued liabilities | (32,271 | ) | (15,943 | ) | (16,998 | ) | (17,565 | ) | |||||||
| Other non-current liabilities | (147,619 | ) | (173,438 | ) | (240,319 | ) | (231,452 | ) | |||||||
| Net asset/(liabilities) recognized | $ | 107,577 | $ | 210,487 | $ | (257,317 | ) | $ | (249,017 | ) | |||||
The accumulated benefit obligation for all defined benefit pension plans was $2,602.0 million$3.11 billion at April 27, 2011 and $2,414.3 million at April 28, 2010.2013 and $2.79 billion at April 29, 2012.
Certain of the Company’s pension plans have accumulated benefit obligations in excess of the fair value of plan assets. For these plans, the accumulated benefit obligations, projected benefit obligations and the fair value of plan assets at April 27, 201128, 2013 were $154.3$631.7 million $175.0, $640.8 million, and $27.0$460.9 million, respectively. For pension plans having accumulated benefit obligations in excess of the fair value of plan assets at April 28, 2010,29, 2012, the accumulated benefit obligations, projected benefit obligations and the fair value of plan assets were $137.0$630.3 million $160.9, $642.3 million and $20.3$452.9 million, respectively.
Certain of the Company's pension plans have projected benefit obligations in excess of the fair value of plan assets. For these plans, the projected benefit obligations and the fair value of the plan assets at April 28, 2013 were $900.3 million and $720.5 million, respectively. For pension plans having projected benefit obligations in excess of the fair value of plan assets at April 29, 2012, the projected benefit obligations and the fair value of plan assets were $642.3 million and $452.9 million, respectively.
65
H. J. Heinz Company and Subsidiaries
Notes to Consolidated Financial Statements — (Continued)
Components of Net Periodic Benefit Cost and Defined Contribution Plan Expense:
Total pension cost of the Company’s principal pension plans and postretirement plans consisted of the following:
| Pension Benefits | Other Retiree Benefits | |||||||||||||||||||||||
| 2011 | 2010 | 2009 | 2011 | 2010 | 2009 | |||||||||||||||||||
| (Dollars in thousands) | ||||||||||||||||||||||||
| Components of defined benefit net periodic benefit cost: | ||||||||||||||||||||||||
| Service cost | $ | 32,329 | $ | 30,486 | $ | 33,321 | $ | 6,311 | $ | 5,999 | $ | 6,501 | ||||||||||||
| Interest cost | 142,133 | 149,640 | 143,601 | 12,712 | 15,093 | 15,357 | ||||||||||||||||||
| Expected return on assets | (229,258 | ) | (211,408 | ) | (207,774 | ) | — | — | — | |||||||||||||||
| Amortization of: | ||||||||||||||||||||||||
| Prior service cost/(credit) | 2,455 | 2,173 | 3,182 | (5,155 | ) | (3,796 | ) | (3,812 | ) | |||||||||||||||
| Net actuarial loss | 77,687 | 53,882 | 33,206 | 1,604 | 540 | 3,681 | ||||||||||||||||||
| Loss due to curtailment, settlement and special termination benefits | 2,039 | 612 | 635 | — | — | — | ||||||||||||||||||
| Net periodic benefit cost | 27,385 | 25,385 | 6,171 | 15,472 | 17,836 | 21,727 | ||||||||||||||||||
| Defined contribution plans | 49,089 | 47,356 | 36,404 | — | — | — | ||||||||||||||||||
| Total cost | 76,474 | 72,741 | 42,575 | 15,472 | 17,836 | 21,727 | ||||||||||||||||||
| Less periodic benefit cost associated with discontinued operations | — | 618 | 1,376 | — | — | — | ||||||||||||||||||
| Periodic benefit cost associated with continuing operations | $ | 76,474 | $ | 72,123 | $ | 41,199 | $ | 15,472 | $ | 17,836 | $ | 21,727 | ||||||||||||
70
| Pension Benefits | Other Retiree Benefits | ||||||||||||||||||||||
| 2013 | 2012 | 2011 | 2013 | 2012 | 2011 | ||||||||||||||||||
| (In thousands) | |||||||||||||||||||||||
| Components of defined benefit net periodic benefit cost: | |||||||||||||||||||||||
| Service cost | $ | 31,580 | $ | 33,719 | $ | 32,329 | $ | 6,486 | $ | 5,967 | $ | 6,311 | |||||||||||
| Interest cost | 132,110 | 139,525 | 142,133 | 9,923 | 11,457 | 12,712 | |||||||||||||||||
| Expected return on assets | (250,660 | ) | (234,717 | ) | (229,258 | ) | — | — | — | ||||||||||||||
| Amortization of: | |||||||||||||||||||||||
| Prior service cost/(credit) | 2,495 | 1,995 | 2,455 | (6,178 | ) | (6,127 | ) | (5,155 | ) | ||||||||||||||
| Net actuarial loss | 75,897 | 83,800 | 77,687 | 1,803 | 1,095 | 1,604 | |||||||||||||||||
| Loss due to curtailment, settlement and special termination benefits | 4,524 | 1,120 | 2,039 | — | — | — | |||||||||||||||||
| Net periodic benefit (income)/cost | (4,054 | ) | 25,442 | 27,385 | 12,034 | 12,392 | 15,472 | ||||||||||||||||
| Defined contribution plans | 47,382 | 46,572 | 49,089 | — | — | — | |||||||||||||||||
| Total cost | $ | 43,328 | $ | 72,014 | $ | 76,474 | $ | 12,034 | $ | 12,392 | $ | 15,472 | |||||||||||
Accumulated Other Comprehensive Income:
Amounts recognized in accumulated other comprehensive loss, before tax, consist of the following:
| Pension Benefits | Other Retiree Benefits | |||||||||||||||
| 2011 | 2010 | 2011 | 2010 | |||||||||||||
| (Dollars in thousands) | ||||||||||||||||
| Net actuarial loss | $ | 909,796 | $ | 1,085,471 | $ | 11,816 | $ | 17,206 | ||||||||
| Prior service cost/(credit) | 28,649 | 30,683 | (20,335 | ) | (21,780 | ) | ||||||||||
| Net amount recognized | $ | 938,445 | $ | 1,116,154 | $ | (8,519 | ) | $ | (4,574 | ) | ||||||
| Pension Benefits | Other Retiree Benefits | ||||||||||||||
| 2013 | 2012 | 2013 | 2012 | ||||||||||||
| (In thousands) | |||||||||||||||
| Net actuarial loss | $ | 1,349,614 | $ | 1,174,199 | $ | 35,349 | $ | 28,000 | |||||||
| Prior service cost/(credit) | 27,410 | 30,051 | (7,296 | ) | (13,474 | ) | |||||||||
| Net amount recognized | $ | 1,377,024 | $ | 1,204,250 | $ | 28,053 | $ | 14,526 | |||||||
The change in other comprehensive loss related to pension benefit gainslosses arising during the period was $95.5$255.7 million and $106.6$353.1 million at April 27, 2011 and April 28, 2010,2013 and April 29, 2012, respectively. The change in other comprehensive loss related to the reclassification of pension benefit losses to net income was $82.2$82.9 million and $60.6$87.3 million at April 27, 2011 and April 28, 2010,2013 and April 29, 2012, respectively.
The change in other comprehensive loss related to postretirement benefit gainslosses arising during the period is $7.5$9.1 million and $11.4$18.0 million at April 27, 201128, 2013 and at April 28, 2010,29, 2012, respectively. The change in other comprehensive loss related to the reclassification of postretirement benefit gains to net income is $3.6$4.4 million and $3.2$5.0 million at April 27, 201128, 2013 and at April 28, 2010,29, 2012, respectively.
Amounts in accumulated other comprehensive loss (income) expected to be recognized as components of net periodic benefit costs/(credits)cost/(credit) in the following fiscal year are as follows:
| Pension Benefits | Other Retiree Benefits | |||||||||||||||
| 2011 | 2010 | 2011 | 2010 | |||||||||||||
| (Dollars in thousands) | ||||||||||||||||
| Net actuarial loss | $ | 85,932 | $ | 76,963 | $ | 1,095 | $ | 1,604 | ||||||||
| Prior service cost/(credit) | 2,020 | 2,373 | (6,116 | ) | (5,155 | ) | ||||||||||
| Net amount recognized | $ | 87,952 | $ | 79,336 | $ | (5,021 | ) | $ | (3,551 | ) | ||||||
| Pension Benefits | Other Retiree Benefits | ||||||||||||||
| 2013 | 2012 | 2013 | 2012 | ||||||||||||
| (In thousands) | |||||||||||||||
| Net actuarial loss | $ | 95,772 | $ | 77,238 | $ | 2,030 | $ | 1,803 | |||||||
| Prior service cost/(credit) | 2,253 | 2,569 | (6,180 | ) | (6,174 | ) | |||||||||
| Net amount recognized | $ | 98,025 | $ | 79,807 | $ | (4,150 | ) | $ | (4,371 | ) | |||||
66
H. J. Heinz Company and Subsidiaries
Notes to Consolidated Financial Statements — (Continued)
Assumptions:
The weighted-average rates used for the fiscal years ended April 27, 2011 and April 28, 20102013 and April 29, 2012 in determining the projected benefit obligations for defined benefit pension plans and the accumulated postretirement benefit obligation for other postretirement plans were as follows:
| Pension Benefits | Other Retiree Benefits | |||||||||||||||
| 2011 | 2010 | 2011 | 2010 | |||||||||||||
| Discount rate | 5.5 | % | 5.6 | % | 5.0 | % | 5.5 | % | ||||||||
| Compensation increase rate | 3.8 | % | 4.0 | % | — | — | ||||||||||
| Pension Benefits | Other Retiree Benefits | ||||||||||
| 2013 | 2012 | 2013 | 2012 | ||||||||
| Discount rate | 4.0 | % | 4.8 | % | 3.4 | % | 4.1 | % | |||
| Compensation increase rate | 3.5 | % | 3.4 | % | — | % | — | % | |||
The weighted-average rates used for the fiscal years ended April 28, 2013, April 29, 2012, and April 27, 2011 April 28, 2010 and April 29, 2009 in determining the defined benefit plans’ net pension costs and net postretirement benefit costs were as follows:
| Pension Benefits | Other Retiree Benefits | |||||||||||||||||||||||
| 2011 | 2010 | 2009 | 2011 | 2010 | 2009 | |||||||||||||||||||
| Expected rate of return | 8.2 | % | 8.1 | % | 8.2 | % | — | — | — | |||||||||||||||
| Discount rate | 5.6 | % | 6.5 | % | 6.1 | % | 5.5 | % | 6.4 | % | 5.9 | % | ||||||||||||
| Compensation increase rate | 4.0 | % | 4.3 | % | 4.5 | % | — | — | — | |||||||||||||||
71
| Pension Benefits | Other Retiree Benefits | ||||||||||||||||
| 2013 | 2012 | 2011 | 2013 | 2012 | 2011 | ||||||||||||
| Expected rate of return | 8.1 | % | 8.2 | % | 8.2 | % | — | % | — | % | — | % | |||||
| Discount rate | 4.0 | % | 4.8 | % | 5.6 | % | 3.4 | % | 4.1 | % | 5.5 | % | |||||
| Compensation increase rate | 3.5 | % | 3.4 | % | 4.0 | % | — | % | — | % | — | % | |||||
The Company’s expected rate of return is determined based on a methodology that considers investment real returns for certain asset classes over historic periods of various durations, in conjunction with the long-term outlook for inflation (i.e. “building block” approach). This methodology is applied to the actual asset allocation, which is in line with the investment policy guidelines for each plan. The Company also considers long-term rates of return for each asset class based on projections from consultants and investment advisors regarding the expectations of future investment performance of capital markets.
The weighted-average assumed annual composite rate of increase in the per capita cost of company-provided health care benefits begins at 7.4%6.3% for 2012,2014, gradually decreases to 4.8% by 20182021 and remains at that level thereafter. Assumed health care cost trend rates have a significant effect on the amounts reported for postretirement medical benefits. A one-percentage-point change in assumed health care cost trend rates would have the following effects:
| 1% Increase | 1% Decrease | |||||||
| (Dollars in thousands) | ||||||||
| Effect on total service and interest cost components | $ | 1,632 | $ | 1,472 | ||||
| Effect on postretirement benefit obligations | $ | 15,831 | $ | 14,417 | ||||
| 1% Increase | 1% Decrease | ||||||
| (In thousands) | |||||||
| Effect on total service and interest cost components | $ | 1,551 | $ | 1,389 | |||
| Effect on postretirement benefit obligations | $ | 18,881 | $ | 16,978 | |||
Pension Plan Assets:
The underlying basis of the investment strategy of the Company’s defined benefit plans is to ensure that pension funds are available to meet the plans’ benefit obligations when they are due. The Company’s investment objectives include: investing plan assets in a high-quality, diversified manner in order to maintain the security of the funds; achieving an optimal return on plan assets within specified risk tolerances; and investing according to local regulations and requirements specific to each country in which a defined benefit plan operates. The investment strategy expects equity investments to yield a higher return over the long term than fixed income securities, while fixed income securities are expected to provide certain matching characteristics to the plans’ benefit payment cash flow requirements. Company common stock held as part of the equity securities amounted to less than one percent of plan assets at April 27, 2011 and April 28, 2010.2013 and April 29, 2012. The Company’s investment policy specifies the type of investment vehicles appropriate for the Plan,applicable plan, asset allocation guidelines, criteria for the selection of investment managers, procedures to monitor overall investment performance as well as investment manager performance. It also provides guidelines enabling Planthe applicable plan fiduciaries to fulfill their responsibilities.
67
H. J. Heinz Company and Subsidiaries
Notes to Consolidated Financial Statements — (Continued)
The Company’s defined benefit pension plans’ weighted average actual and target asset allocation at April 27, 2011 and April 28, 20102013 and weighted average target allocationApril 29, 2012 were as follows:
| Target | ||||||||||||||||
| Plan Assets at | Allocation at | |||||||||||||||
| Asset Category | 2011 | 2010 | 2011 | 2010 | ||||||||||||
| Equity securities | 62 | % | 58 | % | 58 | % | 63 | % | ||||||||
| Debt securities | 32 | % | 29 | % | 32 | % | 35 | % | ||||||||
| Real estate | 3 | % | 1 | % | 9 | % | 1 | % | ||||||||
| Other(1) | 3 | % | 12 | % | 1 | % | 1 | % | ||||||||
| 100 | % | 100 | % | 100 | % | 100 | % | |||||||||
72
| Target | ||||||||||||
| Plan Assets at | Allocation at | |||||||||||
| Asset Category | 2013 | 2012 | 2013 | 2012 | ||||||||
| Equity securities | 62 | % | 61 | % | 58 | % | 59 | % | ||||
| Debt securities | 29 | % | 31 | % | 33 | % | 32 | % | ||||
| Real estate | 8 | % | 7 | % | 8 | % | 8 | % | ||||
| Other | 1 | % | 1 | % | 1 | % | 1 | % | ||||
| 100 | % | 100 | % | 100 | % | 100 | % | |||||
Equity Securities. These securities consist of direct investments in the stock of publicly traded companies. Such investments are valued based on the closing price reported in an active market on which the individual securities are traded. As such, the direct investments are classified as Level 1.1.
Equity Securities (mutual and pooled funds). Mutual funds are valued at the net asset value of shares held by the Planapplicable plan at year end. As such, these mutual fund investments are classified as Level 1.1. Pooled funds are similar in nature to retail mutual funds, but are more efficient for institutional investors than retail mutual funds. As pooled funds are only accessible by institutional investors, the net asset value is not readily observable by non-institutional investors; therefore, pooled funds are classified as Level 2.2.
Fixed Income Securities. These securities consist of publicly traded U.S. andnon-U.S. fixed interest obligations (principally corporate bonds and debentures). Such investments are valued through consultation and evaluation with brokers in the institutional market using quoted prices and other observable market data. As such, a portion of these securities are included in Levels 1, 2, and 3.3.
Other Investments. Primarily consist of real estate and private equity holdings and interest rate swaps.holdings. Direct investments of real estate and private equity are valued by investment managers based on the most recent financial information available, which typically represents significant observable data. As such, these investments are generally classified as Level 3. The fair value of interest rate swaps is determined through use of observable market swap rates and are classified as Level 2.3.
Cash and Cash Equivalents. This consists of direct cash holdings and institutional short-term investment vehicles. Direct cash holdings are valued based on cost, which approximates fair value and are classified as Level 1.1. Institutional short-term investment vehicles are valued daily and are classified as Level 2.2.
| April 27, 2011 | ||||||||||||||||
| Asset Category | Level 1 | Level 2 | Level 3 | Total | ||||||||||||
| (Dollars in thousands) | ||||||||||||||||
| Equity Securities | $ | 863,404 | $ | — | $ | — | $ | 863,404 | ||||||||
| Equity Securities (mutual and pooled funds) | 157,296 | 1,005,678 | — | 1,162,974 | ||||||||||||
| Fixed Income Securities | 53,381 | 966,157 | 9,649 | 1,029,187 | ||||||||||||
| Other Investments | — | — | 131,095 | 131,095 | ||||||||||||
| Cash and Cash Equivalents | 16,270 | 58,951 | — | 75,221 | ||||||||||||
| Total | $ | 1,090,351 | $ | 2,030,786 | $ | 140,744 | $ | 3,261,881 | ||||||||
| April 28, 2013 | ||||||||||||||||
| Asset Category | Level 1 | Level 2 | Level 3 | Total | ||||||||||||
| (In thousands) | ||||||||||||||||
| Equity Securities | $ | 882,081 | $ | — | $ | — | $ | 882,081 | ||||||||
| Equity Securities (mutual and pooled funds) | 182,723 | 1,057,111 | — | 1,239,834 | ||||||||||||
| Fixed Income Securities | 49,577 | 919,383 | 11,336 | 980,296 | ||||||||||||
| Other Investments | — | — | 256,781 | 256,781 | ||||||||||||
| Cash and Cash Equivalents | 6,787 | 13,364 | — | 20,151 | ||||||||||||
| Total | $ | 1,121,168 | $ | 1,989,858 | $ | 268,117 | $ | 3,379,143 | ||||||||
73