The financial section of the FedEx Corporation (“FedEx”) Annual Report on Form 10-K (“Annual Report”) consists of the following Management’s Discussion and Analysis of Results of Operations and Financial Condition (“MD&A”), the Consolidated Financial Statements and the notes to the Consolidated Financial Statements, and Other Financial Information, all of which include information about our significant accounting policies, practices and the transactions that underlie our financial results. The following MD&A describes the principal factors affecting the results of operations, liquidity, capital resources, contractual cash obligations and the critical accounting estimates of FedEx. The discussion in the financial section should be read in conjunction with the other sections of this Annual Report, particularly “Item 1: Business” and our detailed discussion of risk factors included in this MD&A.
ORGANIZATION OF INFORMATION
Our MD&A is composed of three major sections: Results of Operations, Financial Condition and Critical Accounting Estimates. These sections include the following information:
Results of Operationsoperations includes an overview of our consolidated 20112013 results compared to 2010,2012, and 20102012 results compared to 2009.2011. This section also includes a discussion of key actions and events that impacted our results, as well as our outlook for 2012.2014.
The overview is followed by a financial summary and analysis (including a discussion of both historical operating results and our outlook for 2012)2014) for each of our reportable transportation segments.
Our financial condition is reviewed through an analysis of key elements of our liquidity, capital resources and contractual cash obligations, including a discussion of our cash flows and our financial commitments.
Critical accounting estimates discusses those financial statement elements that we believe are important to understanding certain of the material judgments and assumptions incorporated in our reported financial results.
We conclude with a discussion of risks and uncertainties that may impact our financial and operating results.
DESCRIPTION OF BUSINESS
We provide a broad portfolio of transportation, e-commerce and business services through companies competing collectively, operating independently and managed collaboratively, under the respected FedEx brand. Our primary operating companies are Federal Express Corporation (“FedEx Express”), the world’s largest express transportation company; FedEx Ground Package System, Inc. (“FedEx Ground”), a leading North American provider of small-package ground delivery services; and FedEx Freight, Inc. (“FedEx Freight”), a leading U.S.North American provider of less-than-truckload (“LTL”) freight services. These companies represent our major service lines and, along with FedEx Corporate Services, Inc. (“FedEx Services”), form the core of our reportable segments. Our FedEx Services segment provides sales, marketing, and information technology, communications and back-office support to our transportation segments. In addition, the FedEx Services segment provides customers with retail access to FedEx Express and FedEx Ground shipping services through FedEx Office and Print Services, Inc. (“FedEx Office”) and provides customer service, technical support and billing and collection services through FedEx TechConnect, Inc. (“FedEx TechConnect”). See “Reportable Segments” for further discussion and refer to “Item 1: Business” for a more detailed description of each of our operating companies.
36
the overall customer demand for our various services;services based on macro-economic factors and the global economy;
the volumes of transportation services provided through our networks, primarily measured by our average daily volume and shipment weight;
the mix of services purchased by our customers;
the prices we obtain for our services, primarily measured by yield (revenue per package or pound or revenue per hundredweight for LTL freight shipments);
our ability to manage our cost structure (capital expenditures and operating expenses) to match shifting volume levels; and
the timing and amount of fluctuations in fuel prices and our ability to recover incremental fuel costs through our fuel surcharges.
The majority of our operating expenses are directly impacted by revenue and volume levels. Accordingly, we expect these operating expenses to fluctuate on a year-over-year basis consistent with the change in revenues and volumes. Therefore, the discussion of operating expense captions focuses on the key drivers and trends impacting expenses other than changes in revenues and volume.
Except as otherwise specified, references to years indicate our fiscal year ended May 31, 20112013 or ended May 31 of the year referenced and comparisons are to the prior year. References to our transportation segments include, collectively, our FedEx Express, FedEx Ground and FedEx Freight segments.
CONSOLIDATED RESULTS
The following table compares summary operating results (dollars in millions, except per share amounts) for the years ended May 31:
| Percent Change | ||||||||||||||||||||
| 2011(1) | 2010 | 2009(2) | 2011/2010 | 2010/2009 | ||||||||||||||||
| Revenues | $ | 39,304 | $ | 34,734 | $ | 35,497 | 13 | (2 | ) | |||||||||||
| Operating income | 2,378 | 1,998 | 747 | 19 | 167 | |||||||||||||||
| Operating margin | 6.1 | % | 5.8 | % | 2.1 | % | 30 | bp | 370 | bp | ||||||||||
| Net income | $ | 1,452 | $ | 1,184 | $ | 98 | 23 | NM | ||||||||||||
| Diluted earnings per share | $ | 4.57 | $ | 3.76 | $ | 0.31 | 22 | NM | ||||||||||||
| Percent Change | ||||||||||||||||||||
| 2013(1) | 2012(2) | 2011(3) | 2013/2012 | 2012/2011 | ||||||||||||||||
Revenues | $ | 44,287 | $ | 42,680 | $ | 39,304 | 4 | 9 | ||||||||||||
Operating income | 2,551 | 3,186 | 2,378 | (20 | ) | 34 | ||||||||||||||
Operating margin | 5.8 | % | 7.5 | % | 6.1 | % | (17 | 0)bp | 14 | 0bp | ||||||||||
Net income | $ | 1,561 | $ | 2,032 | $ | 1,452 | (23 | ) | 40 | |||||||||||
|
|
|
|
|
|
|
|
|
| |||||||||||
Diluted earnings per share | $ | 4.91 | $ | 6.41 | $ | 4.57 | (23 | ) | 40 | |||||||||||
|
|
|
|
|
|
|
|
|
| |||||||||||
| (1) | Operating expenses include $560 million for business realignment costs and a $100 million impairment charge resulting from the decision to retire ten aircraft and related engines at FedEx Express. |
| (2) | Operating expenses include an impairment charge of $134 million resulting from the decision to retire 24 aircraft and related engines at FedEx Express and the reversal of a $66 million legal reserve which was initially recorded in 2011 at FedEx Express. |
| (3) | Operating expenses include $133 million in costs associated with the combination of our FedEx Freight and FedEx National LTL operations, effective January 30, 2011, and a $66 million legal reserve | |
37
| Revenues | Operating Income | |||||||||||||||||||||||||||||||
| Dollar Change | Percent Change | Dollar Change | Percent Change | |||||||||||||||||||||||||||||
| 2011/ | 2010/ | 2011/ | 2010/ | 2011/ | 2010/ | 2011/ | 2010/ | |||||||||||||||||||||||||
| 2010 | 2009 | 2010 | 2009 | 2010 | 2009 | 2010 | 2009 | |||||||||||||||||||||||||
FedEx Express segment(1) | $ | 3,026 | $ | (809 | ) | 14 | (4 | ) | $ | 101 | $ | 333 | 9 | 42 | ||||||||||||||||||
| FedEx Ground segment | 1,046 | 392 | 14 | 6 | 301 | 217 | 29 | 27 | ||||||||||||||||||||||||
FedEx Freight segment(2) | 590 | (94 | ) | 14 | (2 | ) | (22 | ) | (109 | ) | (14 | ) | (248 | ) | ||||||||||||||||||
FedEx Services segment(3) | (86 | ) | (207 | ) | (5 | ) | (10 | ) | — | 810 | — | 100 | ||||||||||||||||||||
| Other and eliminations | (6 | ) | (45 | ) | NM | NM | — | — | — | — | ||||||||||||||||||||||
| $ | 4,570 | $ | (763 | ) | 13 | (2 | ) | $ | 380 | $ | 1,251 | 19 | 167 | |||||||||||||||||||
| Revenues | Operating Income | |||||||||||||||||||||||||||||||
| Dollar Change | Percent Change | Dollar Change | Percent Change | |||||||||||||||||||||||||||||
| 2013/ 2012 | 2012/ 2011 | 2013/ 2012 | 2012/ 2011 | 2013/ 2012 | 2012/ 2011 | 2013/ 2012 | 2012/ 2011 | |||||||||||||||||||||||||
FedEx Express segment(1) | $ | 656 | $ | 1,934 | 2 | 8 | $ | (705 | ) | $ | 32 | (56 | ) | 3 | ||||||||||||||||||
FedEx Ground segment(2) | 1,005 | 1,088 | 10 | 13 | 24 | 439 | 1 | 33 | ||||||||||||||||||||||||
FedEx Freight segment(3) | 119 | 371 | 2 | 8 | 46 | 337 | 28 | 193 | ||||||||||||||||||||||||
FedEx Services segment | (91 | ) | (13 | ) | (5 | ) | (1 | ) | — | — | — | — | ||||||||||||||||||||
Other and eliminations | (82 | ) | (4 | ) | NM | NM | — | — | — | — | ||||||||||||||||||||||
|
|
|
|
|
|
|
| |||||||||||||||||||||||||
| $ | 1,607 | $ | 3,376 | 4 | 9 | $ | (635 | ) | $ | 808 | (20 | ) | 34 | |||||||||||||||||||
|
|
|
|
|
|
|
| |||||||||||||||||||||||||
| (1) | FedEx Express segment |
| (2) | FedEx Ground segment 2013 operating expenses include |
| (3) | FedEx Freight segment 2013 operating expenses include $50 million | |
| of direct and allocated business realignment costs. Additionally, FedEx Freight segment 2011 operating expenses include $133 million in costs associated with the combination of our FedEx Freight and FedEx National LTL operations, effective January 30, | ||
-41-
Overview
Our results for 20112013 reflect a significant impact of certain charges (described below), which negatively impacted our earnings by $1.31 per diluted share. Beyond these factors, our results for 2013 benefited from the momentumstrong performance of improved global economic conditionsFedEx Ground, which continued to grow market share, and strongongoing profit improvement at FedEx Freight. However, a decline in profitability was experienced at our FedEx Express segment resulting from ongoing shifts in demand forfrom our priority international services to economy international services which drove yield growthcould not be fully offset by network cost and volume increasescapacity reductions in 2013.
Our 2013 results include business realignment costs of $560 million, primarily related to our voluntary cash buyout program (see “Business Realignment, Impairment and Other Charges” for additional information). Furthermore, in May 2013, we made the decision to retire from service 10 aircraft and related engines, which resulted in a noncash asset impairment charge of $100 million.
In addition, actions in 2012 at FedEx Express related to fleet modernization resulted in the accelerated retirement of certain aircraft which negatively impacted our 2013 results by $69 million due to additional depreciation recorded for the shortened lives of the aircraft.
Our 2012 revenues, operating income and operating margins reflected the exceptional performance of our FedEx Ground segment, improved profitability at FedEx Freight and increased yields across all our transportation segments duringoperating segments. Our results significantly benefited in 2012 from the timing lag that exists between when fuel prices change and when indexed fuel surcharges automatically adjust. Our 2012 results included the reversal of a $66 million legal reserve initially recorded in 2011 particularly in FedEx International Priority (“IP”) package shipmentsand an aircraft impairment charge of $134 million at FedEx Express. Our FedEx Ground segment continued its exceptional performance, increasing volume, yield and operating margins. The FedEx Freight segment returned to profitability in the fourth quarter of 2011 primarily due to higher LTL yield. All of our transportation segments benefited from our yield management initiatives in 2011. Despite the strength in our businesses and significantly improved results, we incurred increased retirement plans and medical costs, higher aircraft maintenance expenses, higher costs associated with the restoration of compensation programs curtailed during the recession and one-time costs associated with the combination of our LTL operations (described below) during 2011.
| 2011 | ||||
| Severance | $ | 40 | ||
| Lease terminations | 20 | |||
| Asset impairments | 29 | |||
| Impairment and other charges | 89 | |||
| Other program costs | 44 | |||
| Total program costs | $ | 133 | ||
38��
-42-

39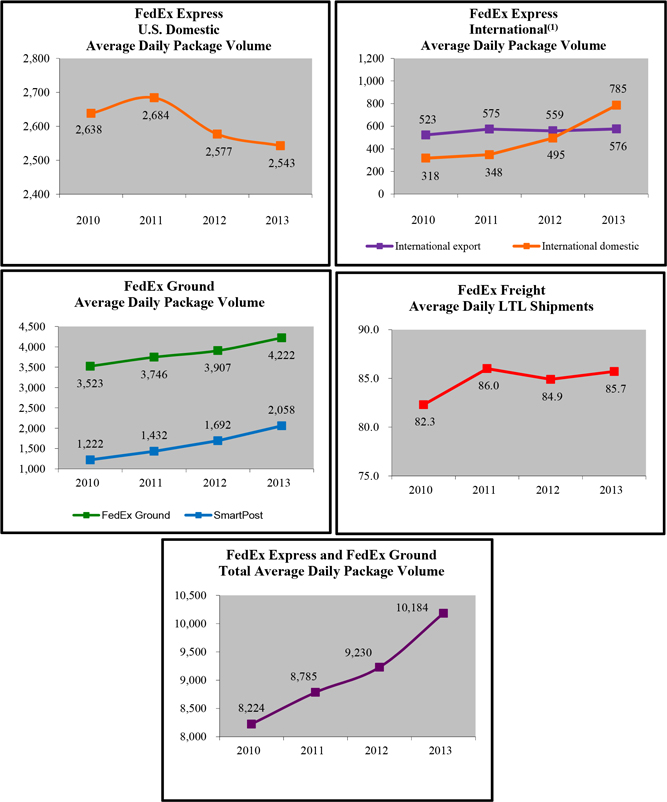
| (1) | International domestic average daily package volume includes our international intra-country express operations, including acquisitions in India (February 2011), Mexico (July 2011), Poland (June 2012), France (July 2012) and Brazil (July 2012). |
-43-

Revenue
Revenues increased 13% during 20114% in 2013 primarily driven by increases in international domestic revenue at FedEx Express and volume growth at FedEx Ground. At FedEx Ground, revenues increased 10% in 2013 primarily due to volume growth from market share gains. At FedEx Express, revenues increased 2% due to increases in international domestic revenues from recent acquisitions and growth in our freight-forwarding business at FedEx Trade Networks. Base revenue growth at FedEx Express in 2013 was constrained by global economic conditions as shifts in demand from our priority international services to our economy international services and lower rates resulted in declines in international export package yields. At FedEx Freight, revenues increased 2% as a result of higher yield and average daily LTL shipments.
During 2012, revenues increased 9% due to yield increases and volume growth across all our transportation segments. Yields improved due to higher fuel surcharges and increased base rates under our yield improvement programs, including our dimensional pricing changes for package shipments effective January 1, 2011. At FedEx Express, revenues increased 14%8% in 20112012 led by IP volume growth in Asia, as well ashigher U.S. domestic and IPinternational export package yield increases. At theyields. However, U.S. domestic package and international export package volumes declined due to weakening global economic conditions. Revenues increased 13% during 2012 at our FedEx Ground segment revenues increased 14% in 2011 due to continued volume growth driven by market share gainshigher yields and yield growth at both FedEx Ground and FedEx SmartPost.strong demand for all our major services. At FedEx Freight, yield increasesrevenues increased 8% during 2012 due to our yield management programs and higher LTL fuel surcharges, and higher average daily LTL volumes led to a 14% increase in revenues in 2011.
40
The following tables compare operating expenses expressed as dollar amounts (in millions) and as a percent of revenue for the years ended May 31:
| 2011 | 2010 | 2009 | ||||||||||
| Operating expenses: | ||||||||||||
| Salaries and employee benefits | $ | 15,276 | $ | 14,027 | $ | 13,767 | ||||||
| Purchased transportation | 5,674 | 4,728 | 4,534 | |||||||||
| Rentals and landing fees | 2,462 | 2,359 | 2,429 | |||||||||
| Depreciation and amortization | 1,973 | 1,958 | 1,975 | |||||||||
| Fuel | 4,151 | 3,106 | 3,811 | |||||||||
| Maintenance and repairs | 1,979 | 1,715 | 1,898 | |||||||||
| Impairment and other charges | 89 | (1) | 18 | 1,204 | (2) | |||||||
| Other | 5,322 | (3) | 4,825 | 5,132 | ||||||||
| Total operating expenses | $ | 36,926 | $ | 32,736 | $ | 34,750 | ||||||
| 2013 | 2012 | 2011 | ||||||||||
Operating expenses: | ||||||||||||
Salaries and employee benefits | $ | 16,570 | $ | 16,099 | $ | 15,276 | ||||||
Purchased transportation | 7,272 | 6,335 | 5,674 | |||||||||
Rentals and landing fees | 2,521 | 2,487 | 2,462 | |||||||||
Depreciation and amortization | 2,386 | 2,113 | 1,973 | |||||||||
Fuel | 4,746 | 4,956 | 4,151 | |||||||||
Maintenance and repairs | 1,909 | 1,980 | 1,979 | |||||||||
Business realignment, impairment and other charges | 660 | (1) | 134 | (2) | 89 | (3) | ||||||
Other (4) | 5,672 | 5,390 | 5,322 | |||||||||
|
|
|
|
|
| |||||||
Total operating expenses | $ | 41,736 | $ | 39,494 | $ | 36,926 | ||||||
|
|
|
|
|
| |||||||
| Percent of Revenue | ||||||||||||
| 2013 | 2012 | 2011 | ||||||||||
Operating expenses: | ||||||||||||
Salaries and employee benefits | 37.4 | % | 37.7 | % | 38.9 | % | ||||||
Purchased transportation | 16.4 | 14.9 | 14.4 | |||||||||
Rentals and landing fees | 5.7 | 5.8 | 6.3 | |||||||||
Depreciation and amortization | 5.4 | 5.0 | 5.0 | |||||||||
Fuel | 10.7 | 11.6 | 10.6 | |||||||||
Maintenance and repairs | 4.3 | 4.6 | 5.0 | |||||||||
Business realignment, impairment and other charges | 1.5 | (1) | 0.3 | (2) | 0.2 | (3) | ||||||
Other (4) | 12.8 | 12.6 | 13.5 | |||||||||
|
|
|
|
|
| |||||||
Total operating expenses | 94.2 | 92.5 | 93.9 | |||||||||
|
|
|
|
|
| |||||||
Operating margin | 5.8 | % | 7.5 | % | 6.1 | % | ||||||
|
|
|
|
|
| |||||||
| (1) | Includes predominantly severance costs associated with our voluntary buyout program and charges resulting from the decision to retire 10 aircraft and related engines at FedEx Express. |
| (2) | Represents charges resulting from the decision to retire 24 aircraft and related engines at FedEx Express. |
| (3) | Represents charges associated with the combination of our FedEx Freight and FedEx National LTL operations effective January 30, 2011. |
Includes | ||
41
| Percent of Revenue | ||||||||||||
| 2011 | 2010 | 2009 | ||||||||||
| Operating expenses: | ||||||||||||
| Salaries and employee benefits | 38.9 | % | 40.4 | % | 38.8 | % | ||||||
| Purchased transportation | 14.4 | 13.6 | 12.8 | |||||||||
| Rentals and landing fees | 6.3 | 6.8 | 6.8 | |||||||||
| Depreciation and amortization | 5.0 | 5.6 | 5.6 | |||||||||
| Fuel | 10.6 | 8.9 | 10.7 | |||||||||
| Maintenance and repairs | 5.0 | 4.9 | 5.3 | |||||||||
| Impairment and other charges | 0.2 | 0.1 | 3.4 | |||||||||
| Other | 13.5 | 13.9 | 14.5 | |||||||||
| Total operating expenses | 93.9 | 94.2 | 97.9 | |||||||||
| Operating margin | 6.1 | % | 5.8 | % | 2.1 | % | ||||||
Purchased transportation increased 20%15% in 20112013 due to volume growth higher fuel surcharges and higher rates paid to our independent contractors at FedEx Ground, as well as costs associated withrecent international business acquisitions and the expansion of our freight forwarding business at FedEx Trade Networks. MaintenanceSalaries and repairs expensebenefits increased 15%3% in 20112013 primarily due to an increaseincreases in maintenance events, as a result of timing,pension and higher utilization of our fleet drivengroup health insurance costs, partially offset by lower incentive compensation accruals. Other expenses increased volumes. Other operating expense increased 10%5% in 2013 primarily due to volume-the impact of business acquisitions and weather-related expenses.
-45-
The following graph for our transportation segments shows our average cost of jet and vehicle fuel per gallon for the years ended May 31:
42

Our analysis considers the estimated impact of the reduction in fuel surcharges included in the base rates charged for FedEx Express and FedEx Ground services. However, this analysis does not consider the negative effects that fuel surcharge levels may have on our business, including reduced demand and shifts by our customers to lower-yielding services. While fluctuations in fuel surcharge rates can be significant from period to period, fuel surcharges represent one of the many individual components of our pricing structure that impact our overall revenue and yield. Additional components include the mix of services sold, the base price and extra service charges we obtain for these services and the level of pricing discounts offered. In order to provide information about the impact of fuel surcharges on the trendstrend in revenue and yield growth, we have included the comparative fuel surcharge rates in effect for 2011, 20102013, 2012 and 20092011 in the accompanying discussions of each of our transportation segments.
In 2012, operating income increased 34% and operating margin increased in 2010 primarily as a result of the inclusion in 2009 of the impairment140 basis points driven by higher yields across all our transportation segments due to higher fuel surcharges and other charges described above. Volume increases at our package businesses, particularly in higher-margin IP package and freight services at FedEx Express,yield management programs. Our results also benefited our 2010 results. Additionally, wesignificantly benefited in 20102012 from several actions implementedthe timing lag that exists between when fuel prices change and when indexed fuel surcharges automatically adjust. FedEx Ground segment operating income increased $439 million in 2009 to lower2012 driven by higher yields and strong demand for all our cost structure, including reducing base salaries, optimizingmajor services. At our networks by adjusting routes and equipment types, permanently and temporarily idling certain equipment and consolidating facilities; however, these benefits were partially offset by increased costs in 2010 associated with our variable incentive compensation programs. An operating loss at the FedEx Freight segment, operating income increased $337 million due to continued weaknesshigher LTL yield and efficiencies gained from the combination of our LTL operations in the LTL freight market constrained the earnings increase.
Salaries and repairs expense decreased 10%benefits increased 5% in 20102012 primarily due to the timing of maintenance events. Other operating expense decreased 6% in 2010 due to actions to control spendinghigher incentive compensation costs and the inclusion in the prior yearfull reinstatement of higher self-insurance reserve requirements at FedEx Ground.401(k) company-matching contributions effective January 1, 2011. Purchased transportation costs increased 4%12% in 20102012 due to increasedvolume growth and higher fuel surcharges at FedEx Ground, costs associated with the expansion of our freight forwarding business at FedEx Trade Networks and higher utilization of third-party transportation providers associated primarily with our LTL freight service as a result of higher shipment volumes.
Fuel expense increased 19% during 2012 primarily due to price per gallon of fuel and fuel consumption, as we lowered flight hours and improved route efficiencies.increases. Based on a static analysis of the net impact to operating income of year-over-year changes in fuel prices compared to year-over-year changes in fuel surcharges, fuel had a significant negative impact to operating incomesurcharges significantly exceeded incremental fuel costs in 2010.
-46-
Other Income and Expense
Interest expense increased $7$30 million during 2011in 2013 primarily due to a decreasereduction in capitalized interest and increased interest expense from 2013 debt issuances. Other expense increased in 2013 driven by foreign currency translation due to global currency volatility. Interest expense decreased $34 million in 2012 due to debt maturities, an increase in capitalized interest related to the timing of construction projects and progress payments on aircraft purchases. Interest expense decreased $6 million during 2010 due to increased capitalized interest primarily related to progress payments on aircraft purchases. Interest income decreased $18 million during 2010 primarily due topurchases and lower interest rates and invested balances. Other expense increased $22 million during 2010 primarily due to higher amortization of financing fees and foreign currency losses.
Income Taxes
Our effective tax rate was 36.4% in 2013, 35.3% in 2012 and 35.9% in 2011, 37.5% in 2010 and 85.6% in 2009.2011. Our 20112012 rate was lower thanfavorably impacted by the conclusion of the Internal Revenue Service (“IRS”) audit of our 2010 rate primarily due to increased permanently reinvested foreign earnings and a lower state2007-2009 consolidated income tax rate driven principally by favorable audit and legislative developments. In 2011, ourreturns. Our permanent reinvestment strategy with respect to unremitted earnings of our foreign subsidiaries provided a 1.3%1.2% benefit to our 2013 effective tax rate. Our total permanently reinvested foreign earnings were $640 million$1.3 billion at the end of 20112013 and $325 million$1.0 billion at the end of 2010. Our 2009 rate was significantly impacted by goodwill impairment charges that were not deductible for income tax purposes.
2012.
43
The components of the provision for federal income taxes for the years ended May 31 were as follows (in millions):
| 2011 | 2010 | 2009 | ||||||||||
| Current | $ | 79 | $ | 36 | $ | (35 | ) | |||||
| Deferred | 485 | 408 | 327 | |||||||||
| Total Federal Provision | $ | 564 | $ | 444 | $ | 292 | ||||||
| 2013 | 2012 | 2011 | ||||||||||
Current | $ | 512 | $ | (120 | ) | $ | 79 | |||||
Deferred | 175 | 947 | 485 | |||||||||
|
|
|
|
|
| |||||||
Total Federal Provision | $ | 687 | $ | 827 | $ | 564 | ||||||
|
|
|
|
|
| |||||||
For 2012,2014, we expect our effective tax rate to be in the range of 36.0% to 38.0%between 36.5% and 37.0%. The actual rate, however, will depend on a number of factors, including the amount and source of operating income.
Additional information on income taxes, including our effective tax rate reconciliation, and liabilities for uncertain tax positions and our global tax profile can be found in Note 1112 of the accompanying consolidated financial statements.
-47-
Business Acquisitions
During 2013, we expanded the international service offerings of FedEx Express by completing the following business acquisitions:
Rapidão Cometa Logística e Transporte S.A., a Brazilian transportation and logistics company, for $398 million in cash from operations on July 4, 2012
TATEX, a French express transportation company, for $55 million in cash from operations on July 3, 2012
Opek Sp. z o.o., a Polish domestic express package delivery company, for $54 million in cash from operations on June 13, 2012
These acquisitions give us more robust transportation networks within these countries and added capabilities in these important international markets. See Note 3 of the accompanying consolidated financial statements for further discussion of these acquisitions.
In 2012, we completed our acquisition of Servicios Nacionales Mupa, S.A. de C.V. (MultiPack), a Mexican domestic express package delivery company, for $128 million in cash from operations on July 25, 2011. In 2011, FedEx Expresswe completed the acquisition of the Indian logistics, distribution and express businesses of AFL Pvt. Ltd. and its affiliate Unifreight India Pvt. Ltd. for $96 million in cash. cash from operations on February 22, 2011.
The financial results of thethese acquired businesses are included in the FedEx Express segment from the date of acquisition and were not material, individually or in the aggregate, to our results of operations orand therefore, pro forma financial condition.information has not been presented. Substantially all of the purchase price in each of these acquisitions was allocated to goodwill.
On December 15, 2010, FedEx entered into an agreementJune 20, 2013, we signed agreements to acquire Servicios Nacionales Mupa, S.A. de C.V. (MultiPack), a Mexican domestic express package delivery company. Thisthe businesses operated by our current service provider Supaswift (Pty) Ltd. in five countries in Southern Africa. The acquisition will be funded with cash from operations and is expected to be completed duringin the first quartersecond half of 2012,2014, subject to customary closing conditions. The financial results of the acquired companybusinesses will be included in the FedEx Express segment from the date of acquisition and will be immaterial to our 2014 results.
Business Realignment, Impairment and Other Charges
During 2013, we announced profit improvement programs primarily through initiatives at FedEx Express and FedEx Services that include the following:
Cost reductions in selling, general and administrative functions through headcount reductions, streamlining of processes and elimination of less essential work, as well as deriving greater value from strategic sourcing
Modernization of our aircraft fleet, transformation of the U.S. domestic operations and international profit improvements at FedEx Express
Improved efficiencies and lower costs of information technology at FedEx Services
During 2013, we conducted a program to offer voluntary cash buyouts to eligible U.S.-based employees in certain staff functions. The voluntary buyout program includes voluntary severance payments and funding to healthcare reimbursement accounts, with the voluntary severance calculated based on four weeks of gross base salary for every year of FedEx service up to a maximum payment of two years of pay. This program was completed in the fourth quarter and approximately 3,600 employees have left or will be voluntarily leaving the company by the end of 2014. Eligible employees are scheduled to vacate positions in phases to ensure a smooth transition in the impacted functions so that we maintain service levels to our customers. Of the total population leaving the
-48-
company, approximately 40% of the employees vacated positions on May 31, 2013. An additional 35% will depart throughout 2014 and approximately 25% of this population will remain until May 31, 2014. Costs of the benefits provided under the voluntary program were recognized as special termination benefits in the period that eligible employees accepted their offers.
We incurred costs of $560 million ($353 million, net of tax, or $1.11 per diluted share) during 2013 associated with our business realignment activities. These costs related primarily to severance for employees who accepted voluntary buyouts in the third and fourth quarters of 2013. Payments will be made at the time of departure. Approximately $180 million was paid under this program during 2013. The cost of the buyout program is included in the caption “Business realignment, impairment and other charges” in our consolidated statements of income. Also included in that caption are other external costs directly attributable to our business realignment activities, such as professional fees.
In addition, actions in 2012 results.
In May 2013, we made the decision to retire from service two Airbus A310-200 aircraft and four related engines, three Airbus A310-300 aircraft and two related engines, and five Boeing MD10-10 aircraft and 15 related engines. As a consequence of this decision, a noncash impairment charge of $100 million ($63 million, net of tax, or $0.20 per diluted share) was recorded in the fourth quarter. The decision to retire these importantaircraft, which were temporarily idled and not in revenue service, aligns with the plans of FedEx Express to modernize its aircraft fleet and improve its global markets.
In May 2012, we retired from service 24 aircraft and related engines, the majority of which were temporarily idled and not in revenue service. As a consequence of this decision, a noncash impairment charge of $134 million ($84 million, net of tax, or $0.26 per diluted share) was recorded in the fourth quarter of 2012.
See the “Long-lived Assets” section of our “Critical Accounting Estimates” for a discussion of our accounting for aircraft retirement decisions.
Outlook
We expectanticipate revenue and earnings growth in 2014 driven by the continued strong performance of our FedEx Ground and FedEx Freight businesses and improving performance at FedEx Express. Our expected results for 2014 will be constrained by moderate growth in the global economy combinedand continued challenges from the demand shift trend from our priority international services to our economy international services. In response to these trends, we will be evaluating additional capacity reductions and other actions in 2014. During 2014 we will incur incremental costs to transform our information technology operations at FedEx Services in connection with ongoing yieldour profit improvement actions,programs, which will increase the costs allocated to driveour transportation segments. In May 2013, in conjunction with the retirement of aircraft, FedEx Express shortened the depreciable lives of 76 aircraft and related engines. As a significantresult of this decision and the 2012 decision to shorten the depreciable lives of 54 aircraft, we expect to incur additional year-over-year accelerated depreciation expense of $74 million in 2014. However, lower pension expense in 2014 will positively impact our operating results.
In addition to continued profit improvements in the base businesses at FedEx Ground and FedEx Freight, our profit improvement programs announced in earnings in 2012. Results2013 are targeting annual profitability improvement of $1.6 billion at FedEx Express driven by international services,the end of 2016 (from the full year 2013 base business). Collectively, these initiatives are expected to beincrease margins, improve cash flows and increase our competitiveness. However, the primary driveramount of earnings growth during 2012. In addition, we expect our FedEx Freight segment to be profitable throughout 2012 and anticipate our FedEx Ground segment to continue to grow significantly. However, our outlook is dependent on continued strengthening in global economic conditions,benefit ultimately realized will vary depending upon future customer demand, particularly in industrial production, the pace of which is uncertain due to several factors, including the impact of higher fuel prices on demand.for priority international services. We expect growth in international trade to substantially outpace growth in the U.S. domestic economy, and our unmatched global network is uniquely positioned to service customer needs in this sector. While cost headwinds in pension plans and maintenance and repairs are expected to abate, we expect higher incentive compensation expense asbegin realizing a result of higher earnings and higher expenses related to the full restorationportion of the company-matching contributions onbenefits of these programs in 2014; however, the majority of the benefits, including those from our 401(k) programs.
44
Our outlook is dependent upon a stable pricing environment for fuel, as volatility in fuel prices impacts our fuel surcharge levels, fuel expense and demand for our services. Historically, our fuel surcharges have largely offset incremental fuel costs; however, volatility in fuel costs may impact earnings because adjustments to our fuel surcharges lag changes in actual fuel prices paid. Therefore, the trailing impact of adjustments to our fuel surcharges can significantly affect our earnings either positively or negatively in the short-term.
As described in Note 1718 of the accompanying consolidated financial statements and the “Independent Contractor Matters”Model” section of our FedEx Ground segment MD&A, we are involved in a number of lawsuits and other proceedings that challenge the status of FedEx Ground’s owner-operators as independent contractors. FedEx Ground anticipates continuing changes to its relationships with its contractors.owner-operators. The nature, timing and amount of any changes are dependent on the outcome of numerous future events. We cannot reasonably estimate the potential impact of any such changes or a meaningful range of potential outcomes, although they could be material. However, we do not believe that any such changes will impair our ability to operate and profitably grow our FedEx Ground business.
See “Risk Factors” for a discussion of these and other potential risks and uncertainties that could materially affect our future performance.
Seasonality of Business
Our businesses are cyclical in nature, as seasonal fluctuations affect volumes, revenues and earnings. Historically, the U.S. express package business experiences an increase in volumes in late November and December. International business, particularly in the Asia-to-U.S. market, peaks in October and November in advance of the U.S. holiday sales season. Our first and third fiscal quarters, because they are summer vacation and post winter-holiday seasons, have historically experienced lower volumes relative to other periods. Normally, the fall is the busiest shipping period for FedEx Ground, while late December, June and July are the slowest periods. For FedEx Freight, the spring and fall are the busiest periods and the latter part of December January andthrough February areis the slowest periods.period. For FedEx Office, the summer months are normally the slowest periods. Shipment levels, operating costs and earnings for each of our companies can also be adversely affected by inclement weather, particularly the impact of severe winter weather in our third fiscal quarter.
New accounting rules and disclosure requirements can significantly impact our reported results and the comparability of our financial statements. New accounting
On June 1, 2012, we adopted the authoritative guidance that has impacted our financial statements can be found in Note 2 of the accompanying consolidated financial statements.
-50-
In February 2013, the FASB issued new guidance requiring additional information about reclassification adjustments out of comprehensive income, including changes in comprehensive income balances by component and significant items reclassified out of comprehensive income. This new standard is effective for our fiscal year ending May 31, 2013.
In May 2013, the FASB issued a revised exposure draft outlining proposed changes to the accounting for leases. Under the revised exposure draft, the recognition, measurement and presentation of expenses and cash flows arising from a lease would depend primarily on whether the lessee is expected to consume more than an insignificant portion of the economic benefits embedded in the underlying asset. A right-of-use asset and a liability to make lease payments will be recognized on the balance sheet for all leases (except short-term leases). The enactment of this proposal will have a significant impact on our accounting and financial reporting. The FASB has not yet proposed an effective date of this proposal.
We believe there isthat no additionalother new accounting guidance was adopted but not yet effectiveor issued during 2013 that is relevant to the readers of our financial statements. However, there are numerous new proposals under development which, if and when enacted, may have a significant impact on our financial reporting.
45
FedEx Express, FedEx Ground and FedEx Freight represent our major service lines and, along with FedEx Services, form the core of our reportable segments. Our reportable segments include the following businesses:
| FedEx Express Segment | ||
FedEx Express (express transportation) | ||
FedEx Trade Networks | ||
| (air and ocean freight forwarding and customs brokerage) FedEx SupplyChain Systems (logistics services) | ||
| FedEx Ground Segment | ||
FedEx Ground (small-package ground delivery) | ||
FedEx SmartPost (small-parcel consolidator) | ||
| FedEx Freight Segment | ||
FedEx Freight (LTL freight transportation) | ||
FedEx Custom Critical (time-critical transportation) | ||
| FedEx Services Segment | ||
FedEx Services (sales, marketing, | ||
FedEx TechConnect (customer service, technical support, billings and collections) | ||
FedEx Office (document and business services and package acceptance) | ||
The FedEx Services segment operates combined sales, marketing, administrative and information technology functions in shared services operations that support our transportation businesses and allow us to obtain synergies from the combination of these functions. For the international regions of FedEx Express, some of these functions are performed on a regional basis by FedEx Express and reported in the FedEx Express segment in their natural expense line items. The FedEx Services segment includes: FedEx Services, which provides sales, marketing, and information technology, communications and back-office support to our other companies; FedEx TechConnect, which is responsible for customer service, technical support, billings and collections for U.S. customers of our major business units; and FedEx Office, which provides an array of document and business services and retail access to our customers for our package transportation businesses. Effective September 1, 2009, FedEx SupplyChain Systems, formerly included in the FedEx Services reporting segment, was realigned to become part of the FedEx Express reporting segment. Prior year amounts have not been reclassified to conform to the current year segment presentation because these reclassifications are immaterial.
-51-
The FedEx Services segment provides direct and indirect support to our transportation businesses, and we allocate all of the net operating costs of the FedEx Services segment (including the net operating results of FedEx Office) to reflect the full cost of operating our transportation businesses in the results of those segments. Within the FedEx Services segment allocation, the net operating results of FedEx Office, which are an immaterial component of our allocations, are allocated to FedEx Express and FedEx Ground. The allocations of net operating costs are based on metrics such as relative revenues or estimated services provided. We believe these allocations approximate the net cost of providing these functions. We review and evaluate the performance of our transportation segments based on operating income (inclusive of FedEx Services segment allocations). For the FedEx Services segment, performance is evaluated based on the impact of its total allocated net operating costs on our transportation segments.
The operating expenses line item “Intercompany charges” on the accompanying unaudited financial summaries of our transportation segments reflects the allocations from the FedEx Services segment to the respective transportation segments. The “Intercompany charges” caption also includes charges and credits for administrative services provided between operating companies and certain other costs such as corporate management fees related to services received for general corporate oversight, including executive officers and certain legal and finance functions. We believe these allocations approximate the net cost of providing these functions.
46
Certain FedEx operating companies provide transportation and related services for other FedEx companies outside their reportable segment. Billings for such services are based on negotiated rates, which we believe approximate fair value, and are reflected as revenues of the billing segment. These rates are adjusted from time to time based on market conditions. Such intersegment revenues and expenses are eliminated in our consolidated results and are not separately identified in the following segment information, because the amounts are not material.
47
FedEx Express offers a wide range of U.S. domestic and international shipping services for delivery of packages and freight including priority services, which provide time-definite delivery within one, two or three business days worldwide, and deferred or economy services, which provide time-definite delivery within five business days worldwide. The following tables compare revenues, operating expenses, operating expenses as a percent of revenue, operating income and operating margin (dollars in millions) for the years ended May 31:
| Percent Change | ||||||||||||||||||||
| 2011 | 2010 | 2009 | 2011/2010 | 2010/2009 | ||||||||||||||||
| Revenues: | ||||||||||||||||||||
| Package: | ||||||||||||||||||||
| U.S. overnight box | $ | 6,128 | $ | 5,602 | $ | 6,074 | 9 | (8 | ) | |||||||||||
| U.S. overnight envelope | 1,736 | 1,640 | 1,855 | 6 | (12 | ) | ||||||||||||||
| U.S. deferred | 2,805 | 2,589 | 2,789 | 8 | (7 | ) | ||||||||||||||
| Total U.S. domestic package revenue | 10,669 | 9,831 | 10,718 | 9 | (8 | ) | ||||||||||||||
| International priority | 8,228 | 7,087 | 6,978 | 16 | 2 | |||||||||||||||
International domestic (1) | 653 | 578 | 565 | 13 | 2 | |||||||||||||||
| Total package revenue | 19,550 | 17,496 | 18,261 | 12 | (4 | ) | ||||||||||||||
| Freight: | ||||||||||||||||||||
| U.S. | 2,188 | 1,980 | 2,165 | 11 | (9 | ) | ||||||||||||||
| International priority | 1,722 | 1,303 | 1,104 | 32 | 18 | |||||||||||||||
| International airfreight | 283 | 251 | 369 | 13 | (32 | ) | ||||||||||||||
| Total freight revenue | 4,193 | 3,534 | 3,638 | 19 | (3 | ) | ||||||||||||||
Other (2) | 838 | 525 | 465 | 60 | 13 | |||||||||||||||
| Total revenues | 24,581 | 21,555 | 22,364 | 14 | (4 | ) | ||||||||||||||
| Operating expenses: | ||||||||||||||||||||
| Salaries and employee benefits | 9,183 | 8,402 | 8,217 | 9 | 2 | |||||||||||||||
| Purchased transportation | 1,573 | 1,177 | 1,112 | 34 | 6 | |||||||||||||||
| Rentals and landing fees | 1,672 | 1,577 | 1,613 | 6 | (2 | ) | ||||||||||||||
| Depreciation and amortization | 1,059 | 1,016 | 961 | 4 | 6 | |||||||||||||||
| Fuel | 3,553 | 2,651 | 3,281 | 34 | (19 | ) | ||||||||||||||
| Maintenance and repairs | 1,353 | 1,131 | 1,351 | 20 | (16 | ) | ||||||||||||||
| Impairment and other charges | — | — | 260 | (3) | — | NM | ||||||||||||||
| Intercompany charges | 2,043 | 1,940 | 2,103 | 5 | (8 | ) | ||||||||||||||
| Other | 2,917 | (4) | 2,534 | 2,672 | 15 | (5 | ) | |||||||||||||
| Total operating expenses | 23,353 | 20,428 | 21,570 | 14 | (5 | ) | ||||||||||||||
| Operating income | $ | 1,228 | $ | 1,127 | $ | 794 | 9 | 42 | ||||||||||||
| Operating margin | 5.0 | % | 5.2 | % | 3.6 | % | (20 | )bp | 160 | bp | ||||||||||
| Percent Change | ||||||||||||||||||||
| 2013 | 2012 | 2011 | 2013/2012 | 2012/2011 | ||||||||||||||||
Revenues: | ||||||||||||||||||||
Package: | ||||||||||||||||||||
U.S. overnight box | $ | 6,513 | $ | 6,546 | $ | 6,128 | (1 | ) | 7 | |||||||||||
U.S. overnight envelope | 1,705 | 1,747 | 1,736 | (2 | ) | 1 | ||||||||||||||
U.S. deferred | 3,020 | 3,001 | 2,805 | 1 | 7 | |||||||||||||||
|
|
|
|
|
| |||||||||||||||
Total U.S. domestic package revenue | 11,238 | 11,294 | 10,669 | — | 6 | |||||||||||||||
International priority | 6,586 | 6,849 | 6,760 | (4 | ) | 1 | ||||||||||||||
International economy | 2,046 | 1,859 | 1,468 | 10 | 27 | |||||||||||||||
|
|
|
|
|
| |||||||||||||||
Total international export package revenue | 8,632 | 8,708 | 8,228 | (1 | ) | 6 | ||||||||||||||
International domestic (1) | 1,398 | 853 | 653 | 64 | 31 | |||||||||||||||
|
|
|
|
|
| |||||||||||||||
Total package revenue | 21,268 | 20,855 | 19,550 | 2 | 7 | |||||||||||||||
Freight: | ||||||||||||||||||||
U.S. | 2,562 | 2,498 | 2,188 | 3 | 14 | |||||||||||||||
International priority | 1,678 | 1,827 | 1,722 | (8 | ) | 6 | ||||||||||||||
International airfreight | 276 | 307 | 283 | (10 | ) | 8 | ||||||||||||||
|
|
|
|
|
| |||||||||||||||
Total freight revenue | 4,516 | 4,632 | 4,193 | (3 | ) | 10 | ||||||||||||||
Other (2) | 1,387 | 1,028 | 838 | 35 | 23 | |||||||||||||||
|
|
|
|
|
| |||||||||||||||
Total revenues | 27,171 | 26,515 | 24,581 | 2 | 8 | |||||||||||||||
Operating expenses: | ||||||||||||||||||||
Salaries and employee benefits | 10,045 | 9,657 | 9,183 | 4 | 5 | |||||||||||||||
Purchased transportation | 2,331 | 1,828 | 1,573 | 28 | 16 | |||||||||||||||
Rentals and landing fees | 1,684 | 1,680 | 1,672 | — | — | |||||||||||||||
Depreciation and amortization | 1,350 | 1,169 | 1,059 | 15 | 10 | |||||||||||||||
Fuel | 4,130 | 4,304 | 3,553 | (4 | ) | 21 | ||||||||||||||
Maintenance and repairs | 1,244 | 1,332 | 1,353 | (7 | ) | (2 | ) | |||||||||||||
Business realignment, impairment and other charges (3) | 243 | 134 | — | NM | NM | |||||||||||||||
Intercompany charges (4) | 2,379 | 2,193 | 2,043 | 8 | 7 | |||||||||||||||
Other (5) | 3,210 | 2,958 | 2,917 | 9 | 1 | |||||||||||||||
|
|
|
|
|
| |||||||||||||||
Total operating expenses | 26,616 | 25,255 | 23,353 | 5 | 8 | |||||||||||||||
|
|
|
|
|
| |||||||||||||||
Operating income | $ | 555 | $ | 1,260 | $ | 1,228 | (56 | ) | 3 | |||||||||||
|
|
|
|
|
| |||||||||||||||
Operating margin (6) | 2.0 | % | 4.8 | % | 5.0 | % | (280 | )bp | (20 | )bp | ||||||||||
-53-
| Percent of Revenue | ||||||||||||
| 2013 | 2012 | 2011 | ||||||||||
Operating expenses: | ||||||||||||
Salaries and employee benefits | 37.0 | % | 36.4 | % | 37.4 | % | ||||||
Purchased transportation | 8.6 | 6.9 | 6.4 | |||||||||
Rentals and landing fees | 6.2 | 6.3 | 6.8 | |||||||||
Depreciation and amortization | 5.0 | 4.4 | 4.3 | |||||||||
Fuel | 15.2 | 16.2 | 14.4 | |||||||||
Maintenance and repairs | 4.6 | 5.0 | 5.5 | |||||||||
Business realignment, impairment and other charges (3) | 0.9 | 0.5 | — | |||||||||
Intercompany charges (4) | 8.7 | 8.3 | 8.3 | |||||||||
Other (5) | 11.8 | 11.2 | 11.9 | |||||||||
|
|
|
|
|
| |||||||
Total operating expenses | 98.0 | 95.2 | 95.0 | |||||||||
|
| �� |
|
|
|
| ||||||
Operating margin (6) | 2.0 | % | 4.8 | % | 5.0 | % | ||||||
|
|
|
|
|
| |||||||
| (1) | International domestic revenues include our international intra-country |
| (2) | Includes FedEx Trade Networks and |
| (3) | 2013 includes $143 million of predominantly severance costs associated with |
| (4) | Includes allocations of $262 million in 2013 for business realignment costs. |
| (5) | Includes the 2012 reversal of a $66 million legal reserve |
| (6) | The direct and indirect charges described in notes (3) and (4) above reduced 2013 operating margin by 190 basis points. The charges and credit described in notes (3) and (5) above reduced 2012 operating margin by 20 basis points. |
48
-54-
| Percent of Revenue | ||||||||||||
| 2011 | 2010 | 2009 | ||||||||||
| Operating expenses: | ||||||||||||
| Salaries and employee benefits | 37.4 | % | 39.0 | % | 36.7 | % | ||||||
| Purchased transportation | 6.4 | 5.5 | 5.0 | |||||||||
| Rentals and landing fees | 6.8 | 7.3 | 7.2 | |||||||||
| Depreciation and amortization | 4.3 | 4.7 | 4.3 | |||||||||
| Fuel | 14.4 | 12.3 | 14.7 | |||||||||
| Maintenance and repairs | 5.5 | 5.2 | 6.0 | |||||||||
| Impairment and other charges | — | — | 1.2 | (1) | ||||||||
| Intercompany charges | 8.3 | 9.0 | 9.4 | |||||||||
| Other | 11.9 | (2) | 11.8 | 11.9 | ||||||||
| Total operating expenses | 95.0 | 94.8 | 96.4 | |||||||||
| Operating margin | 5.0 | % | 5.2 | % | 3.6 | % | ||||||
| Percent Change | ||||||||||||||||||||
| 2011 | 2010 | 2009 | 2011/2010 | 2010/2009 | ||||||||||||||||
Package Statistics(1) | ||||||||||||||||||||
| Average daily package volume (ADV): | ||||||||||||||||||||
| U.S. overnight box | 1,184 | 1,157 | 1,127 | 2 | 3 | |||||||||||||||
| U.S. overnight envelope | 627 | 614 | 627 | 2 | (2 | ) | ||||||||||||||
| U.S. deferred | 873 | 867 | 849 | 1 | 2 | |||||||||||||||
| Total U.S. domestic ADV | 2,684 | 2,638 | 2,603 | 2 | 1 | |||||||||||||||
| International priority | 575 | 523 | 475 | 10 | 10 | |||||||||||||||
International domestic(2) | 348 | 318 | 298 | 9 | 7 | |||||||||||||||
| Total ADV | 3,607 | 3,479 | 3,376 | 4 | 3 | |||||||||||||||
| Revenue per package (yield): | ||||||||||||||||||||
| U.S. overnight box | $ | 20.29 | $ | 19.00 | $ | 21.21 | 7 | (10 | ) | |||||||||||
| U.S. overnight envelope | 10.86 | 10.47 | 11.65 | 4 | (10 | ) | ||||||||||||||
| U.S. deferred | 12.60 | 11.70 | 12.94 | 8 | (10 | ) | ||||||||||||||
| U.S. domestic composite | 15.59 | 14.61 | 16.21 | 7 | (10 | ) | ||||||||||||||
| International priority | 56.08 | 53.10 | 57.81 | 6 | (8 | ) | ||||||||||||||
International domestic(2) | 7.38 | 7.14 | 7.50 | 3 | (5 | ) | ||||||||||||||
| Composite package yield | 21.25 | 19.72 | 21.30 | 8 | (7 | ) | ||||||||||||||
Freight Statistics(1) | ||||||||||||||||||||
| Average daily freight pounds: | ||||||||||||||||||||
| U.S. | 7,340 | 7,141 | 7,287 | 3 | (2 | ) | ||||||||||||||
| International priority | 3,184 | 2,544 | 1,959 | 25 | 30 | |||||||||||||||
| International airfreight | 1,235 | 1,222 | 1,475 | 1 | (17 | ) | ||||||||||||||
Total average daily freight pounds | 11,759 | 10,907 | 10,721 | 8 | 2 | |||||||||||||||
| �� | ||||||||||||||||||||
| Revenue per pound (yield): | ||||||||||||||||||||
| U.S. | $ | 1.17 | $ | 1.09 | $ | 1.17 | 7 | (7 | ) | |||||||||||
| International priority | 2.12 | 2.01 | 2.22 | 5 | (9 | ) | ||||||||||||||
| International airfreight | 0.90 | 0.81 | 0.99 | 11 | (18 | ) | ||||||||||||||
| Composite freight yield | 1.40 | 1.27 | 1.34 | 10 | (5 | ) | ||||||||||||||
| Percent Change | ||||||||||||||||||||
| 2013 | 2012 | 2011 | 2013/2012 | 2012/2011 | ||||||||||||||||
Package Statistics (1) | ||||||||||||||||||||
Average daily package volume (ADV): | ||||||||||||||||||||
U.S. overnight box | 1,134 | 1,146 | 1,184 | (1 | ) | (3 | ) | |||||||||||||
U.S. overnight envelope | 574 | 586 | 627 | (2 | ) | (7 | ) | |||||||||||||
U.S. deferred | 835 | 845 | 873 | (1 | ) | (3 | ) | |||||||||||||
|
|
|
|
|
| |||||||||||||||
Total U.S. domestic ADV | 2,543 | 2,577 | 2,684 | (1 | ) | (4 | ) | |||||||||||||
International priority | 421 | 421 | 459 | — | (8 | ) | ||||||||||||||
International economy | 155 | 138 | 116 | 12 | 19 | |||||||||||||||
|
|
|
|
|
| |||||||||||||||
Total international export ADV | 576 | 559 | 575 | 3 | (3 | ) | ||||||||||||||
International domestic (2) | 785 | 495 | 348 | 59 | 42 | |||||||||||||||
|
|
|
|
|
| |||||||||||||||
Total ADV | 3,904 | 3,631 | 3,607 | 8 | 1 | |||||||||||||||
|
|
|
|
|
| |||||||||||||||
Revenue per package (yield): | ||||||||||||||||||||
U.S. overnight box | $ | 22.52 | $ | 22.31 | $ | 20.29 | 1 | 10 | ||||||||||||
U.S. overnight envelope | 11.66 | 11.65 | 10.86 | — | 7 | |||||||||||||||
U.S. deferred | 14.18 | 13.87 | 12.60 | 2 | 10 | |||||||||||||||
U.S. domestic composite | 17.33 | 17.12 | 15.59 | 1 | 10 | |||||||||||||||
International priority | 61.28 | 63.47 | 57.68 | (3 | ) | 10 | ||||||||||||||
International economy | 51.77 | 52.77 | 49.76 | (2 | ) | 6 | ||||||||||||||
International export composite | 58.72 | 60.83 | 56.08 | (3 | ) | 8 | ||||||||||||||
International domestic (2) | 6.99 | 6.74 | 7.38 | 4 | (9 | ) | ||||||||||||||
Composite package yield | 21.36 | 22.44 | 21.25 | (5 | ) | 6 | ||||||||||||||
Freight Statistics (1) | ||||||||||||||||||||
Average daily freight pounds: | ||||||||||||||||||||
U.S. | 7,612 | 7,487 | 7,340 | 2 | 2 | |||||||||||||||
International priority | 3,048 | 3,303 | 3,184 | (8 | ) | 4 | ||||||||||||||
International airfreight | 1,066 | 1,171 | 1,235 | (9 | ) | (5 | ) | |||||||||||||
|
|
|
|
|
| |||||||||||||||
Total average daily freight pounds | 11,726 | 11,961 | 11,759 | (2 | ) | 2 | ||||||||||||||
|
|
|
|
|
| |||||||||||||||
Revenue per pound (yield): | ||||||||||||||||||||
U.S. | $ | 1.32 | $ | 1.30 | $ | 1.17 | 2 | 11 | ||||||||||||
International priority | 2.16 | 2.16 | 2.12 | — | 2 | |||||||||||||||
International airfreight | 1.01 | 1.02 | 0.90 | (1 | ) | 13 | ||||||||||||||
Composite freight yield | 1.51 | 1.51 | 1.40 | — | 8 | |||||||||||||||
| (1) | Package and freight statistics include only the operations of FedEx Express. |
| (2) | International domestic statistics include our international intra-country |
49
FedEx Express segment revenues increased 14%2% in 20112013 primarily due to the impact of new business acquisitions and growth in our freight-forwarding business at FedEx Trade Networks. Core revenue growth was constrained by global economic conditions as revenue growth from higher international export volume was offset by decreased yields due to shifts in demand from our priority international services to our economy international services, as well as lower rates. In 2013, international domestic revenues increased 64% due to recent acquisitions in Brazil, France and Poland. International export revenues were down in 2013 as revenue per package decreased 3% due to the demand shift to our lower-yielding economy services and lower rates, while volume increased 3% driven by higherour economy services. A decrease in U.S. domestic package volumes more than offset an increase in U.S. domestic package yield, resulting in slightly lower U.S. domestic package revenues in 2013. Total average daily freight pounds decreased 2% in 2013 due to weakness in economic global conditions.
-55-
FedEx Express segment revenues increased 8% in 2012 primarily due to an increase in U.S. domestic and international export package yields, partially offset by decreases in U.S. domestic and international export package volumes. In 2011, IP package volume increased 10% led by volume growth from Asia, Europe and the U.S. FedEx Express2012, U.S. domestic package yields increased 7%10% due to higher fuel surcharges rate increases and increased package weights. IPrate per pound. International export package yields increased 6%8% in 2012 due to higher fuel surcharges, increased package weights and favorable exchange rates. IP freight pounds increased 25% ledrate per pound. Continued softness in the global economy resulted in decreased demand for our U.S. domestic and international export package services in 2012. International export revenue growth was negatively impacted by volumea lower-yielding mix of services, consisting of growth in Europe.
Our fuel surcharges are indexed to the spot price for jet fuel. Using this index, the U.S. domestic and outbound fuel surcharge and the international fuel surcharges ranged as follows for the years ended May 31:
| 2011 | 2010 | 2009 | ||||||||||
| U.S. Domestic and Outbound Fuel Surcharge: | ||||||||||||
| Low | 7.00 | % | 1.00 | % | — | % | ||||||
| High | 15.50 | 8.50 | 34.50 | |||||||||
| Weighted-average | 9.77 | 6.20 | 17.45 | |||||||||
| International Fuel Surcharges: | ||||||||||||
| Low | 7.00 | 1.00 | — | |||||||||
| High | 21.00 | 13.50 | 34.50 | |||||||||
| Weighted-average | 12.36 | 9.47 | 16.75 | |||||||||
| 2013 | 2012 | 2011 | ||||||||||
U.S. Domestic and Outbound Fuel Surcharge: | ||||||||||||
Low | 10.00 | % | 11.50 | % | 7.00 | % | ||||||
High | 14.50 | 16.50 | 15.50 | |||||||||
Weighted-average | 11.84 | 14.23 | 9.77 | |||||||||
International Fuel Surcharges: | ||||||||||||
Low | 12.00 | 13.50 | 7.00 | |||||||||
High | 20.50 | 23.00 | 21.00 | |||||||||
Weighted-average | 17.02 | 17.45 | 12.36 | |||||||||
In both January 2011,2013 and 2012, we implemented a 5.9% average list price increase onfor FedEx Express U.S. domestic, U.S. export and U.S. outbound express package and freight shipments and made various changes to other surcharges,import services, while we lowered our fuel surcharge index by two percentage points. In January 2010, we implemented a 5.9% average list price increase on FedEx Express U.S. domestic and U.S. outbound express package and freight shipments and made various changes to other surcharges, while we lowered our fuel surcharge index by two percentage points.
FedEx Express Segment Operating Income
FedEx Express segment operating income increased in 2011 due to yieldresults were negatively impacted by $405 million of costs associated with our business realignment program, both directly and volume growth, particularly in our higher-margin IP package services, although operating margin was down slightly. Higher revenues in 2011through intercompany allocations. Additionally, results for 2013 were partially offset by higher retirement plans and medical expenses, increased aircraft maintenance costs, the reinstatement of certain employee compensation programs, and the negative impact of severe weather during the second half of the year. Results in 2011 were also negatively impacted by a $66$100 million impairment charge as a result of the decision to retire 10 aircraft and related engines from service. FedEx Express incurred $69 million in year-over-year incremental depreciation costs in 2013 due to the decision in 2012 to accelerate the retirement of certain aircraft. Operating income and operating margin also decreased in 2013 due to the demand shift toward lower-yielding international services. Operating comparisons were also impacted by an aircraft impairment charge in 2012 and a legal reserve associated with the ATA Airlines lawsuit (see Note 17 of the accompanying consolidated financial statements).
Purchased transportation costs increased 34%28% in 20112013 due to recent business acquisitions and costs associated with the expansion of our freight forwarding business at FedEx Trade NetworksNetworks. Salaries and IP packagebenefits increased 4% in 2013 due to recent acquisitions and freight volume growth.higher pension costs, partially offset by lower incentive compensation accruals. Other operating expenses increased 15%9% due to volume-related expensesthe impact of recent business acquisitions and the ATA Airlinesnegative year-over-year comparison of the legal reserve. Maintenancereserve accrual reversal in 2012. Depreciation and repairsamortization expense increased 20%15% in 2011 primarily due to an increase in aircraft maintenance expenses2013 as a result of timingaircraft recently placed into service and accelerated depreciation due to the shortened life of certain aircraft.
FedEx Express aircraft maintenance and repairs costs are largely driven by aircraft utilization and required periodic maintenance events. When newer aircraft are introduced into our operating fleet, less maintenance costs are incurred. As a part of our fleet modernization program, FedEx Express has retired older, less efficient aircraft prior to required periodic maintenance events and higher utilization of our fleet driven by increased volumes.
has introduced newly manufactured aircraft into the fleet. As a result, a decrease in maintenance and repairs costs was experienced in 2013 and 2012.
50
-56-
FedEx Express segment operating income and operating margin increased during 2010 due to volume growth, particularly3% in higher-margin IP package and freight services. Reductions in network operating costs driven by lower flight hours and improved route efficiencies, as well as other actions to control spending, positively impacted our results for 2010. Our 2010 year-over-year results were also positively impacted by a $260 million charge in 2009 for aircraft-related asset impairments and other charges primarily associated with aircraft-related lease and contract termination costs and employee severance.
Salaries and employee benefits increased 5% in 2012 due to higher incentive compensation accruals and the full reinstatement of 401(k) company-matching contributions effective January 1, 2011. Purchased transportation costs increased 6%16% in 2010 primarily2012 due to higher air transportation volume and costs inassociated with the expansion of our freight forwarding business at FedEx Trade Networks. Depreciation expenseNetworks, business acquisitions in India and Mexico and higher utilization of third-party transportation providers, primarily in Europe. Intercompany charges increased 6%7% in 2010 primarily2012 due to the addition of 21 aircraft placed into service during the year. Intercompany charges decreased 8%higher allocated variable incentive compensation expenses.
Fuel costs increased 21% in 2010 primarily2012 due to lower allocated information technology costs and lower net operating costs at FedEx Office.
FedEx Express Segment Outlook
We expect revenue growthrevenues and earnings to increase at FedEx Express during 2014 due to be driven by continuedslight growth in our international services aspackage and international economic conditions are expecteddomestic services. In addition, we expect operating income to improve at a faster rate than in the U.S. We also anticipate improvement in both domestic and international yields through ongoing yield management initiatives.
Capital expenditures at FedEx Express are expected to increase in 20122014 driven by replacement vehiclean increase in aircraft investment. We will continue to modernize our aircraft fleet at FedEx Express during 2014 by adding newer aircraft that are more reliable, fuel-efficient and equipment purchases. technologically advanced, and retiring older, less-efficient aircraft. Due to the accelerated retirement of certain aircraft and related engines to aid in modernizing our fleet and improving our global network, we expect an additional $74 million in year-over-year depreciation expense in 2014.
In 2012, capital expenditures will also include continued investmentsApril 2013, FedEx Express was selected as the sole awardee of the recent U.S. Postal Service air cargo solicitation, representing the majority of the United States Postal Service’s (“USPS”) air linehaul traffic. This new seven year agreement begins on October 1, 2013. The agreement provides reduced rates for the new B777FUSPS versus the prior FedEx Express agreement and B757 aircraft. These aircraft capital expenditures are necessary to achieve significant long-term operating savings and to support projected long-term international volume growth.
51
FedEx Ground service offerings include day-certain service delivery to businesses in the U.S. and Canada and to nearly 100% of U.S. residences. FedEx SmartPost consolidates high-volume, low-weight, less time-sensitive business-to-consumer packages and utilizes the USPS for final delivery. The following tables compare revenues, operating expenses, operating expenses as a percent of revenue, operating income and operating margin (dollars in millions) and selected package statistics (in thousands, except yield amounts) for the years ended May 31:
| Percent Change | ||||||||||||||||||||
| 2011 | 2010 | 2009 | 2011/2010 | 2010/2009 | ||||||||||||||||
| Revenues: | ||||||||||||||||||||
| FedEx Ground | $ | 7,855 | $ | 6,958 | $ | 6,670 | 13 | 4 | ||||||||||||
| FedEx SmartPost | 630 | 481 | 377 | 31 | 28 | |||||||||||||||
| Total revenues | 8,485 | 7,439 | 7,047 | 14 | 6 | |||||||||||||||
| Operating expenses: | ||||||||||||||||||||
| Salaries and employee benefits | 1,282 | 1,158 | 1,102 | 11 | 5 | |||||||||||||||
| Purchased transportation | 3,431 | 2,966 | 2,918 | 16 | 2 | |||||||||||||||
| Rentals | 263 | 244 | 222 | 8 | 10 | |||||||||||||||
| Depreciation and amortization | 337 | 334 | 337 | 1 | (1 | ) | ||||||||||||||
| Fuel | 12 | 8 | 9 | 50 | (11 | ) | ||||||||||||||
| Maintenance and repairs | 169 | 166 | 147 | 2 | 13 | |||||||||||||||
| Intercompany charges | 897 | 795 | 710 | 13 | 12 | |||||||||||||||
| Other | 769 | 744 | 795 | 3 | (6 | ) | ||||||||||||||
| Total operating expenses | 7,160 | 6,415 | 6,240 | 12 | 3 | |||||||||||||||
| Operating income | $ | 1,325 | $ | 1,024 | $ | 807 | 29 | 27 | ||||||||||||
| Operating margin | 15.6 | % | 13.8 | % | 11.5 | % | 180 | bp | 230 | bp | ||||||||||
| Average daily package volume: | ||||||||||||||||||||
| FedEx Ground | 3,746 | 3,523 | 3,404 | 6 | 3 | |||||||||||||||
| FedEx SmartPost | 1,432 | 1,222 | 827 | 17 | 48 | |||||||||||||||
| Revenue per package (yield): | ||||||||||||||||||||
| FedEx Ground | $ | 8.17 | $ | 7.73 | $ | 7.70 | 6 | — | ||||||||||||
| FedEx SmartPost | $ | 1.72 | $ | 1.56 | $ | 1.81 | 10 | (14 | ) | |||||||||||
| Percent of Revenue | ||||||||||||||||||||
| 2011 | 2010 | 2009 | ||||||||||||||||||
| Operating expenses: | ||||||||||||||||||||
| Salaries and employee benefits | 15.1 | % | 15.5 | % | 15.6 | % | ||||||||||||||
| Purchased transportation | 40.4 | 39.9 | 41.4 | |||||||||||||||||
| Rentals | 3.1 | 3.3 | 3.1 | |||||||||||||||||
| Depreciation and amortization | 4.0 | 4.5 | 4.8 | |||||||||||||||||
| Fuel | 0.1 | 0.1 | 0.1 | |||||||||||||||||
| Maintenance and repairs | 2.0 | 2.2 | 2.1 | |||||||||||||||||
| Intercompany charges | 10.6 | 10.7 | 10.1 | |||||||||||||||||
| Other | 9.1 | 10.0 | 11.3 | |||||||||||||||||
| Total operating expenses | 84.4 | 86.2 | 88.5 | |||||||||||||||||
| Operating margin | 15.6 | % | 13.8 | % | 11.5 | % | ||||||||||||||
| Percent Change | ||||||||||||||||||||
| 2013 | 2012 | 2011 | 2013/2012 | 2012/2011 | ||||||||||||||||
Revenues: | ||||||||||||||||||||
FedEx Ground | $ | 9,652 | $ | 8,791 | $ | 7,855 | 10 | 12 | ||||||||||||
FedEx SmartPost | 926 | 782 | 630 | 18 | 24 | |||||||||||||||
|
|
|
|
|
| |||||||||||||||
Total revenues | 10,578 | 9,573 | 8,485 | 10 | 13 | |||||||||||||||
Operating expenses: | ||||||||||||||||||||
Salaries and employee benefits | 1,586 | 1,451 | 1,282 | 9 | 13 | |||||||||||||||
Purchased transportation | 4,191 | 3,762 | 3,431 | 11 | 10 | |||||||||||||||
Rentals | 331 | 284 | 263 | 17 | 8 | |||||||||||||||
Depreciation and amortization | 434 | 389 | 337 | 12 | 15 | |||||||||||||||
Fuel | 17 | 14 | 12 | 21 | 17 | |||||||||||||||
Maintenance and repairs | 190 | 176 | 169 | 8 | 4 | |||||||||||||||
Intercompany charges(1) | 1,148 | 978 | 897 | 17 | 9 | |||||||||||||||
Other | 893 | 755 | 769 | 18 | (2 | ) | ||||||||||||||
|
|
|
|
|
| |||||||||||||||
Total operating expenses | 8,790 | 7,809 | 7,160 | 13 | 9 | |||||||||||||||
|
|
|
|
|
| |||||||||||||||
Operating income | $ | 1,788 | $ | 1,764 | $ | 1,325 | 1 | 33 | ||||||||||||
|
|
|
|
|
| |||||||||||||||
Operating margin(1) | 16.9 | % | 18.4 | % | 15.6 | % | (150 | )bp | 280 | bp | ||||||||||
Average daily package volume: | ||||||||||||||||||||
FedEx Ground | 4,222 | 3,907 | 3,746 | 8 | 4 | |||||||||||||||
FedEx SmartPost | 2,058 | 1,692 | 1,432 | 22 | 18 | |||||||||||||||
Revenue per package (yield): | ||||||||||||||||||||
FedEx Ground | $ | 8.94 | $ | 8.77 | $ | 8.17 | 2 | 7 | ||||||||||||
FedEx SmartPost | $ | 1.77 | $ | 1.81 | $ | 1.72 | (2 | ) | 5 | |||||||||||
| Percent of Revenue | ||||||||||||||||||||
| 2013 | 2012 | 2011 | ||||||||||||||||||
Operating expenses: | ||||||||||||||||||||
Salaries and employee benefits | 15.0 | % | 15.2 | % | 15.1 | % | ||||||||||||||
Purchased transportation | 39.6 | 39.3 | 40.4 | |||||||||||||||||
Rentals | 3.1 | 3.0 | 3.1 | |||||||||||||||||
Depreciation and amortization | 4.1 | 4.1 | 4.0 | |||||||||||||||||
Fuel | 0.2 | 0.1 | 0.1 | |||||||||||||||||
Maintenance and repairs | 1.8 | 1.8 | 2.0 | |||||||||||||||||
Intercompany charges(1) | 10.9 | 10.2 | 10.6 | |||||||||||||||||
Other | 8.4 | 7.9 | 9.1 | |||||||||||||||||
|
|
|
|
|
| |||||||||||||||
Total operating expenses | 83.1 | 81.6 | 84.4 | |||||||||||||||||
|
|
|
|
|
| |||||||||||||||
Operating margin(1) | 16.9 | % | 18.4 | % | 15.6 | % | ||||||||||||||
|
|
|
|
|
| |||||||||||||||
| (1) | Includes allocations of $105 million in 2013 for business realignment costs which reduced operating margin by 100 basis points. |
52
FedEx Ground segment revenues increased 14%10% during 20112013 due to volume and yield increases at both FedEx Ground and FedEx SmartPost.
FedEx Ground average daily package volume increased 6%8% during 20112013 due to market share gains from continued growth in our commercial business and our FedEx Home Delivery service. The 6%service and increases in our commercial business. FedEx Ground yield improvementincreased 2% in 2013 primarily due to increased rates and higher residential surcharge revenue, partially offset by lower fuel surcharges and package weights.
FedEx SmartPost average daily volume grew 22% during 2013 primarily as a result of growth in e-commerce. Yields at FedEx SmartPost decreased 2% during 2013 primarily due to higher postage costs, partially offset by increased rates. FedEx SmartPost yield represents the amount charged to customers net of postage paid to the USPS.
During 2012, FedEx Ground segment revenues increased 13% due to yield and volume growth at both FedEx Ground and FedEx SmartPost.
FedEx Ground yields increased 7% during 2011 was2012 primarily due to rate increases, higher fuel surcharges and higher extra service revenue, particularlyrevenue. Average daily package volume increased 4% at FedEx Ground in residential surcharges.
At FedEx SmartPost, averageyields increased 5% in 2012 primarily due to higher fuel surcharges and increased rates, partially offset by an unfavorable service mix. Average daily volume grew 17% during 2011 primarilyincreased 18% at FedEx SmartPost in 2012 as a result of growth in e-commerce business, gains in market share and the introduction of new service offerings. Yields increased 10% during 2011 primarily due to growth in higher yielding services, improved fuel surcharges and lower postage costs as a result of increased deliveries to United States Postal Service (“USPS”) final destination facilities.
The FedEx Ground fuel surcharge is based on a rounded average of the national U.S. on-highway average price for a gallon of diesel fuel, as published by the Department of Energy. Our fuel surcharge ranged as follows for the years ended May 31:
| 2011 | 2010 | 2009 | ||||||||||
| Low | 5.50 | % | 2.75 | % | 2.25 | % | ||||||
| High | 8.50 | 5.50 | 10.50 | |||||||||
| Weighted-average | 6.20 | 4.23 | 6.61 | |||||||||
| 2013 | 2012 | 2011 | ||||||||||
Low | 6.50 | % | 7.50 | % | 5.50 | % | ||||||
High | 8.50 | 9.50 | 8.50 | |||||||||
Weighted-average | 7.60 | 8.46 | 6.20 | |||||||||
In January 2011, we implemented a 4.9% list price increase for2013 and 2012, FedEx Ground and FedEx Home Delivery services.implemented a 4.9% average list price increase. The full average rate increase of 5.9% was partially offset by adjusting the fuel price threshold at which the fuel surcharge begins, reducing the fuel surcharge by one percentage point. Additional changes were made to other FedEx Ground surcharges and FedEx SmartPost rates. In January 2010, we implemented a 4.9% average list price increase and made various changes to other surcharges, including modifying the fuel surcharge table, on FedEx Ground shipments.
FedEx Ground Segment Operating Income
FedEx Ground segment operating income increased 29% and operating margin increased 180 basis points due to improved yield and higher volume resulting from market share growth. We have realized a higher retention of our annual rate increase this year as more customers recognize the competitive advantage that we maintain across many shipping lanes in the U.S. We have also improved our customers’ experience by dramatically reducing our package loss and damage claims while maintaining exceptional service levels. Purchased transportation costs increased 16% in 20111% during 2013 primarily due to volume growth and higher fuelyields. However, operating margin decreased as the benefit of higher volume and revenue per package was more than offset by intercompany charges of $105 million associated with the business realignment program and a favorable self-insurance true-up in the prior year. Purchased transportation costs increased 11% in 2013 primarily as a result of volume growth and higher rates paid to our independent contractors. Other operating expenses increased 18% primarily due to a favorable self-insurance true-up in the prior year and higher legal expenses in the current year. Salaries and employee benefits expense increased 11%9% in 20112013 primarily due primarily to increased staffing at to support volume growth.
-59-
FedEx Ground segment operating income increased 33% and operating margin increased 280 basis points during 2012 primarily due to higher yields and volume growth. FedEx SmartPostGround has continued to shorten transit times throughout 2012 by accelerating various lanes throughout the U.S. and Canada, while maintaining consistently high on-time service. Purchased transportation costs increased 10% in 2012 primarily as a result of volume growth and higher fuel surcharges. Salaries and employee benefits increased 13% primarily due to increased staffing to support volume growth and higher pension and medical costs.incentive compensation accruals. Intercompany charges increased 9% in 20112012 primarily due to higher allocated information technology costs.
53
Although FedEx Ground is involved in numerous lawsuits and other proceedings (such as state tax audits or other administrative challenges) where the classification of its independent contractors is at issue, a number of recent judicial decisions support our classification, and we believe our relationship with the contractors is generally excellent. For a description of these proceedings, see “Risk Factors” and Note 1718 of the accompanying consolidated financial statements.
For additional information on the FedEx Ground has made changes to its relationships with contractors that, among other things, provide incentives for improved service and enhanced regulatory and other compliance by the contractors. For example, FedEx Ground has implemented or is implementing its Independent Service Provider (“ISP”) model, in a number of states. The ISP model requires pickup-and-delivery contractors based in those states to, among other things: (i) assume responsibility forsee Part 1, Item 1 under the pickup-and-delivery operations of an entire geographic service area that includes multiple routes, and (ii) negotiate independent agreements with FedEx Ground, rather than agree to a standard contract.
FedEx Ground Segment Outlook
FedEx Ground segment revenue growth will be led by continued improvement in commercial, FedEx Home Deliveryrevenues and FedEx SmartPost volumes, resulting in additional market share gains. FedEx SmartPost isoperating income are expected to continue to strengthen itsgrow in 2014, led by volume growth across all our major services due to market position by continuingshare gains. We also anticipate yield growth in 2014 through yield management programs. We will continue to leverage themake investments to grow our highly profitable FedEx Ground network to enter the optimal USPS entry point. Yields for FedEx Ground are expected to improve in 2012 as a result of yield management initiatives and growth in our higher yielding FedEx Home Delivery service.
We will continue to vigorously defend various attacks against our independent contractor model and incur ongoing legal costs as a part of this process. While we believe that FedEx Ground’s owner-operators are properly classified as independent contractors, it is reasonably possible that we could incur a material loss in connection with one or more of these matters or be required to make material changes to our contractor model. However, we do not believe that any such changes will impair our ability to operate and profitably grow our FedEx Ground business.
54
FedEx Freight service offerings include priority services when speed is critical and economy services when time can be traded for savings. The following tables compare revenues, operating expenses, operating expenses as a percent of revenue, operating lossincome (loss) and operating margin (dollars in millions) and selected statistics for the years ended May 31:
| Percent Change | ||||||||||||||||||||
| 2011 | 2010 | 2009(3) | 2011/2010 | 2010/2009 | ||||||||||||||||
| Revenues | $ | 4,911 | $ | 4,321 | $ | 4,415 | 14 | (2 | ) | |||||||||||
| Operating expenses: | ||||||||||||||||||||
| Salaries and employee benefits | 2,303 | 2,128 | 2,247 | 8 | (5 | ) | ||||||||||||||
| Purchased transportation | 779 | 690 | 540 | 13 | 28 | |||||||||||||||
| Rentals | 122 | 116 | 139 | 5 | (17 | ) | ||||||||||||||
| Depreciation and amortization | 205 | 198 | 224 | 4 | (12 | ) | ||||||||||||||
| Fuel | 585 | 445 | 520 | 31 | (14 | ) | ||||||||||||||
| Maintenance and repairs | 182 | 148 | 153 | 23 | (3 | ) | ||||||||||||||
Impairment and other charges(1) | 89 | 18 | 100 | 394 | (82 | ) | ||||||||||||||
Intercompany charges(2) | 427 | 351 | 109 | 22 | 222 | |||||||||||||||
| Other | 394 | 380 | 427 | 4 | (11 | ) | ||||||||||||||
| Total operating expenses | 5,086 | 4,474 | 4,459 | 14 | — | |||||||||||||||
| Operating loss | $ | (175 | ) | $ | (153 | ) | $ | (44 | ) | (14 | ) | (248 | ) | |||||||
| Operating margin | (3.6 | )% | (3.5 | )% | (1.0 | )% | (10 | )bp | (250 | )bp | ||||||||||
| Average daily LTL shipments (in thousands) | 86.0 | 82.3 | 74.4 | 4 | 11 | |||||||||||||||
| Weight per LTL shipment (lbs) | 1,144 | 1,134 | 1,126 | 1 | 1 | |||||||||||||||
| LTL yield (revenue per hundredweight) | $ | 18.24 | $ | 17.07 | $ | 19.07 | 7 | (10 | ) | |||||||||||
| Percent Change | ||||||||||||||||||||
| 2013 | 2012 | 2011 | 2013/2012 | 2012/2011 | ||||||||||||||||
Revenues | $ | 5,401 | $ | 5,282 | $ | 4,911 | 2 | 8 | ||||||||||||
Operating expenses: | ||||||||||||||||||||
Salaries and employee benefits | 2,342 | 2,316 | 2,303 | 1 | 1 | |||||||||||||||
Purchased transportation | 865 | 851 | 779 | 2 | 9 | |||||||||||||||
Rentals | 118 | 114 | 122 | 4 | (7 | ) | ||||||||||||||
Depreciation and amortization | 217 | 185 | 205 | 17 | (10 | ) | ||||||||||||||
Fuel | 598 | 636 | 585 | (6 | ) | 9 | ||||||||||||||
Maintenance and repairs | 191 | 192 | 182 | (1 | ) | 5 | ||||||||||||||
Business realignment, impairment and other charges (1) | 3 | — | 89 | NM | NM | |||||||||||||||
Intercompany charges (2) | 484 | 433 | 427 | 12 | 1 | |||||||||||||||
Other | 375 | 393 | 394 | (5 | ) | — | ||||||||||||||
|
|
|
|
|
| |||||||||||||||
Total operating expenses | 5,193 | 5,120 | 5,086 | 1 | 1 | |||||||||||||||
|
|
|
|
|
| |||||||||||||||
Operating income (loss) | $ | 208 | $ | 162 | $ | (175 | ) | 28 | 193 | |||||||||||
|
|
|
|
|
| |||||||||||||||
Operating margin (3) | 3.9 | % | 3.1 | % | (3.6 | )% | 80 | bp | 670 | bp | ||||||||||
Average daily LTL shipments (in thousands) (4) | ||||||||||||||||||||
Priority | 59.3 | 60.4 | (2 | ) | ||||||||||||||||
Economy | 26.4 | 24.5 | 8 | |||||||||||||||||
|
|
|
| |||||||||||||||||
Total average daily LTL shipments | 85.7 | 84.9 | 86.0 | 1 | (1 | ) | ||||||||||||||
|
|
|
| |||||||||||||||||
Weight per LTL shipment (lbs) (4) | ||||||||||||||||||||
Priority | 1,237 | 1,202 | 3 | |||||||||||||||||
Economy | 990 | 1,045 | (5 | ) | ||||||||||||||||
Composite weight per LTL shipment | 1,161 | 1,156 | 1,144 | — | 1 | |||||||||||||||
LTL yield (revenue per hundredweight) (4) | ||||||||||||||||||||
Priority | $ | 17.80 | $ | 18.02 | (1 | ) | ||||||||||||||
Economy | 25.90 | 23.96 | 8 | |||||||||||||||||
Composite LTL yield | $ | 19.94 | $ | 19.57 | $ | 18.24 | 2 | 7 | ||||||||||||
-61-
| Percent of Revenue | ||||||||||||
| 2013 | 2012 | 2011 | ||||||||||
Operating expenses: | ||||||||||||
Salaries and employee benefits | 43.4 | % | 43.9 | % | 46.9 | % | ||||||
Purchased transportation | 16.0 | 16.1 | 15.9 | |||||||||
Rentals | 2.2 | 2.2 | 2.5 | |||||||||
Depreciation and amortization | 4.0 | 3.5 | 4.2 | |||||||||
Fuel | 11.1 | 12.0 | 11.9 | |||||||||
Maintenance and repairs | 3.5 | 3.6 | 3.7 | |||||||||
Business realignment, impairment and other charges (1) | — | — | 1.8 | |||||||||
Intercompany charges (2) | 9.0 | 8.2 | 8.7 | |||||||||
Other | 6.9 | 7.4 | 8.0 | |||||||||
|
|
|
|
|
| |||||||
Total operating expenses | 96.1 | 96.9 | 103.6 | |||||||||
|
|
|
|
|
| |||||||
Operating margin (3) | 3.9 | % | 3.1 | % | (3.6 | )% | ||||||
|
|
|
|
|
| |||||||
| (1) | 2013 includes severance costs associated with our voluntary buyout program. 2011 includes severance, impairment and other charges associated with the combination of our FedEx Freight and FedEx National LTL operations, effective January 30, 2011. | |
55
| Percent of Revenue | ||||||||||||
| 2011 | 2010 | 2009 | ||||||||||
| Operating expenses: | ||||||||||||
| Salaries and employee benefits | 46.9 | % | 49.2 | % | 50.9 | % | ||||||
| Purchased transportation | 15.9 | 16.0 | 12.2 | |||||||||
| Rentals | 2.5 | 2.7 | 3.1 | |||||||||
| Depreciation and amortization | 4.2 | 4.6 | 5.0 | |||||||||
| Fuel | 11.9 | 10.3 | 11.8 | |||||||||
| Maintenance and repairs | 3.7 | 3.4 | 3.5 | |||||||||
Impairment and other charges(1) | 1.8 | 0.4 | 2.3 | |||||||||
Intercompany charges(2) | 8.7 | 8.1 | 2.5 | |||||||||
| Other | 8.0 | 8.8 | 9.7 | |||||||||
| Total operating expenses | 103.6 | 103.5 | 101.0 | |||||||||
| Operating margin | (3.6 | )% | (3.5 | )% | (1.0) | % | ||||||
| (2) | Includes allocations of $47 million in 2013 for business realignment costs. |
| (3) | The direct and indirect charges disclosed in notes (1) and (2) above reduced 2013 operating margin by 90 basis points. |
FedEx Freight introduced Priority and | ||
FedEx Freight Segment Revenues
FedEx Freight segment revenues increased 14%2% in 20112013 due to higher LTL yield and average daily LTL shipments. LTL yieldsyield increased 7% during 20112% in 2013 due to ourimprovements in FedEx Freight Economy yield management programs, which began during the fourth quarter of 2010resulting from higher rates and continued throughout 2011, and higher fuel surcharges. Under these programs,lower weight per LTL yields have increased sequentially in each of the past four quarters, while averageshipment. Average daily LTL shipments fell duringincreased 1% in 2013 driven by our FedEx Freight Economy services offering, partially offset by transitional challenges encountered by some customers in the second half of 2011. For2013 while migrating FedEx Freight functionality to the full year, average dailyFedEx enterprise automated platform.
Revenue per hundredweight is a commonly-used indicator of pricing trends, but this metric can be influenced by many other factors, such as changes in fuel surcharges, weight per shipment, length of haul and the mix of freight. Generally, LTL shipmentsfreight is rated using a standard class system for the LTL industry and classes are assigned based on transportation characteristics including density, risk and handling. Under the class system, low-value freight that is easy to handle, unlikely to damage and dense will receive lower class ratings (and lower yields) than expensive, light, bulky freight which is highly susceptible to damage (and produces higher yields). As a result, changes in revenue per hundredweight do not necessarily indicate actual changes in underlying base rates.
During 2012, FedEx Freight revenues increased 4% in 2011 primarily8% due to volume increases during the first half of 2011 resulting from the impact of discounted pricing in contracts signed during 2010.
-62-
The indexed LTL fuel surcharge is based on the average of the national U.S. on-highway average price for a gallon of diesel fuel, as published by the Department of Energy. The indexed LTL fuel surcharge ranged as follows for the years ended May 31:
| 2011 | 2010 | 2009 | ||||||||||
| Low | 15.10 | % | 10.80 | % | 8.30 | % | ||||||
| High | 20.70 | 16.10 | 23.90 | |||||||||
| Weighted-average | 17.00 | 14.00 | 15.70 | |||||||||
| 2013 | 2012 | 2011 | ||||||||||
Low | 21.80 | % | 19.80 | % | 15.10 | % | ||||||
High | 24.40 | 24.30 | 20.70 | |||||||||
Weighted-average | 23.38 | 22.90 | 17.00 | |||||||||
On June 10, 2013, FedEx Freight announced it will increase U.S. and certain other shipping rates by an average of 4.5% effective on July 1, 2013. In November 2010, weJuly 2012, FedEx Freight implemented a 6.9% general rate increase of 6.9% for LTL shipments. In June 2011, FedEx Freight shipments. In February 2010, we implemented 5.9% generalincreased the fuel surcharge rate increases for FedEx Freight and FedEx National LTL shipments.
to a maximum of 3.6 percentage points above previous levels.
56
The FedEx Freight segment operating lossresults for 2013 improved as a result of LTL yield growth and increased average daily LTL shipments, along with ongoing improvement in 2011 includedoperational efficiencies in our integrated network. However, operating results for 2013 were negatively impacted by $50 million of costs associated with the combination of our FedEx Freightbusiness realignment program both directly and FedEx National LTL operationsthrough intercompany allocations.
Depreciation and the significant impact from severe weatheramortization expense increased 17% due to continued investment in the second half of the year. We incurred costs associated with the combination of $133 million in 2011, including $89 million recorded in the “Impairment and other charges” caption of the consolidated income statement (see “Overview” above for additional information).
Fuel costs increased 31%decreased 6% in 20112013 due to a higher average price per gallonincreased utilization of dieselrail and fuel and increased fuel consumption as a result of higher shipment volumes.efficiency improvements. Based on a static analysis of the net impact of year-over-year changes in fuel prices compared to year-over-year changes in fuel surcharges, fuel had a slightly favorableminimal impact toon operating income in 2011. Maintenance and repairs expense increased 23% in 2011 due to higher volumes and the aging of our fleet. Also, higher intercompany charges in 2011 reflect the transfer of sales and customer service employees from2013.
In 2012, the FedEx Freight segment entitiesoperating income increased significantly as a result of higher fuel surcharges, yield growth and ongoing improvements in operational efficiencies due to the first quartercombination of 2010 (described below).
Purchased transportation costs increased 28%9% in 20102012 due to higher rates and the increased utilization of third-partyrail, partially offset by a lower cost per mile due to our ability to optimize mode of transportation providers, which were required to support higher shipment volumes.while meeting service standards. Fuel costs decreased 14% during 2010increased 9% in 2012 due to a lowerhigher average price per gallon of diesel fuel, partially offset by the increased fuel consumption as a resultutilization of higher shipment volumes.rail. Based on a static analysis of the net impact of year-over-year changes in fuel prices compared to year-over-year changes in fuel surcharges, fuel had a negativepositive impact to operating income in 2010. Rent expense decreased 17% and other operating expense decreased 11% in 2010 due to the merger of Caribbean Transportation Services into FedEx Express effective June 1, 2009.2012. Depreciation and amortization expense decreased 12%10% in 20102012 primarily due to accelerated depreciation in 2011 associated with the impactcombination of the transfer of employees from the FedEx Freight segment to FedEx Services and FedEx TechConnect during the first quarter of 2010.
FedEx Freight Segment Outlook
We expect modest revenue growth at the FedEx Freight segment to bein 2014 driven by continued growth inyield and volume initiatives from our Priority and Economy service lines as customers increase their utilization of our new integrateddifferentiated LTL network. We expect yield improvement across all service and customer segments due to our unique value proposition and yield management initiatives.
FedEx Freight segmentoperating income and operating margin are expected to be profitable throughout 2012 due toincrease in 2014 driven by improvements in yields and volume, as well as continued yield management initiatives and the successful integration of our operations and optimization of our LTL network. In addition, we will continue to improveimprovement in productivity and efficiency across our integrated network throughnetwork. We will continue to use investments in technology, investments focused on network and equipment planning and customer automation. These investments willautomation, to further enhance our already outstanding customer service levels.
-63-
Capital expenditures in 2014 are expected to increase significantly in 2012be comparable to 2013, with the majority of our spending for replacement of vehicles and freight handling equipment.
57
Cash and cash equivalents totaled $2.3$4.9 billion at May 31, 2011,2013, compared to $2.0$2.8 billion at May 31, 2010.2012. The following table provides a summary of our cash flows for the periods ended May 31 (in millions):
| 2011 | 2010 | 2009 | ||||||||||
| Operating activities: | ||||||||||||
| Net income | $ | 1,452 | $ | 1,184 | $ | 98 | ||||||
| Noncash impairment and other charges | 29 | 18 | 1,103 | |||||||||
| Other noncash charges and credits | 2,892 | 2,514 | 2,554 | |||||||||
| Changes in assets and liabilities | (332 | ) | (578 | ) | (1,002 | ) | ||||||
| Cash provided by operating activities | 4,041 | 3,138 | 2,753 | |||||||||
| Investing activities: | ||||||||||||
| Capital expenditures | (3,434 | ) | (2,816 | ) | (2,459 | ) | ||||||
| Business acquisition, net of cash acquired | (96 | ) | — | — | ||||||||
| Proceeds from asset dispositions and other | 111 | 35 | 76 | |||||||||
| Cash used in investing activities | (3,419 | ) | (2,781 | ) | (2,383 | ) | ||||||
| Financing activities: | ||||||||||||
| Proceeds from debt issuance | — | — | 1,000 | |||||||||
| Principal payments on debt | (262 | ) | (653 | ) | (501 | ) | ||||||
| Dividends paid | (151 | ) | (138 | ) | (137 | ) | ||||||
| Other | 126 | 99 | 38 | |||||||||
| Cash (used in) provided by financing activities | (287 | ) | (692 | ) | 400 | |||||||
| Effect of exchange rate changes on cash | 41 | (5 | ) | (17 | ) | |||||||
| Net increase (decrease) in cash and cash equivalents | $ | 376 | $ | (340 | ) | $ | 753 | |||||
| 2013 | 2012 | 2011 | ||||||||||
Operating activities: | ||||||||||||
Net income | $ | 1,561 | $ | 2,032 | $ | 1,452 | ||||||
Business realignment, impairment and other charges | 479 | 134 | 29 | |||||||||
Other noncash charges and credits | 3,183 | 3,504 | 2,892 | |||||||||
Changes in assets and liabilities | (535 | ) | (835 | ) | (332 | ) | ||||||
|
|
|
|
|
| |||||||
Cash provided by operating activities | 4,688 | 4,835 | 4,041 | |||||||||
|
|
|
|
|
| |||||||
Investing activities: | ||||||||||||
Capital expenditures | (3,375 | ) | (4,007 | ) | (3,434 | ) | ||||||
Business acquisitions, net of cash acquired | (483 | ) | (116 | ) | (96 | ) | ||||||
Proceeds from asset dispositions and other | 55 | 74 | 111 | |||||||||
|
|
|
|
|
| |||||||
Cash used in investing activities | (3,803 | ) | (4,049 | ) | (3,419 | ) | ||||||
|
|
|
|
|
| |||||||
Financing activities: | ||||||||||||
Purchase of treasury stock | (246 | ) | (197 | ) | — | |||||||
Principal payments on debt | (417 | ) | (29 | ) | (262 | ) | ||||||
Proceeds from debt issuance | 1,739 | — | — | |||||||||
Dividends paid | (177 | ) | (164 | ) | (151 | ) | ||||||
Other | 285 | 146 | 126 | |||||||||
|
|
|
|
|
| |||||||
Cash provided by (used in) financing activities | 1,184 | (244 | ) | (287 | ) | |||||||
Effect of exchange rate changes on cash | 5 | (27 | ) | 41 | ||||||||
|
|
|
|
|
| |||||||
Net increase in cash and cash equivalents | $ | 2,074 | $ | 515 | $ | 376 | ||||||
|
|
|
|
|
| |||||||
Cash Provided by Operating Activities.Cash flows from operating activities increased $903decreased $147 million in 20112013 primarily due to increaseddecreased earnings in 2011 and lowerhigher tax, variable compensation and voluntary buyout payments, partially offset by a decrease in pension contributions. Cash flows from operating activities increased $385$794 million in 20102012 primarily due to the receipt of income tax refunds of $279 million and increased income.earnings, partially offset by higher pension contributions. We made contributions of $480$560 million to our tax-qualified U.S. domestic pension plans (“U.S. Pension Plans”) during 2011, including $121 million in voluntary contributions2013 and contributions of $848$722 million to our U.S. Pension Plans during 2010, including $495 million in voluntary contributions.2012. We made contributions of $1.1 billion$480 million to our U.S. Pension Plans during 2009.
Cash Used in Investing Activities. Capital expenditures were 22%16% lower in 2013 largely due to decreased spending at FedEx Express and 17% higher in 2011 and 15% higher in 2010 largely2012 primarily due to increased spending at FedEx Express.Express and FedEx Freight. See “Capital Resources” for a discussion of capital expenditures during 20112013 and 2010.
Financing Activities. In April 2013, we issued $750 million of senior unsecured debt under our current shelf registration statement, comprised of $250 million of 2.70% fixed-rate notes due in April 2023 and $500 million of 4.10% fixed rate notes due in April 2043. Interest on these notes is payable semi-annually. We utilized the net proceeds for working capital and general corporate purposes. In July 2012, we issued $1 billion of senior unsecured debt under a then current shelf registration statement, comprised of $500 million of 2.625% fixed-rate notes due in August 2022 and $500 million of 3.875% fixed-rate notes due in August 2042. Interest on these notes is payable semi-annually. We utilized the net proceeds for working capital and general corporate purposes.
-64-
During 2013, we made principal payments of $116 million related to capital lease obligations and repaid our $300 million 9.65% unsecured notes that matured in June 2012 using cash from operations.
During 2013, we repurchased 2.7 million shares of FedEx common stock at an average price of $91 per share for a total of $246 million. In March 2013, our Board of Directors authorized the repurchase of up to 10 million shares of common stock. It is expected that the additional share authorization will primarily be utilized to offset the effects of equity compensation dilution over the next several years. As of May 31, 2013, 10,188,000 shares remained under existing share repurchase authorizations. During 2012, we repurchased 2.8 million FedEx common shares at an average price of $70 per share for a total of $197 million.
Our operations are capital intensive, characterized by significant investments in aircraft, vehicles, technology, facilities, and package-handling and sort equipment. The amount and timing of capital additions depend on various factors, including pre-existing contractual commitments, anticipated volume growth, domestic and international economic conditions, new or enhanced services, geographical expansion of services and actions of regulatory authorities.
The following table compares capital expenditures by asset category and reportable segment for the years ended May 31 (in millions):
| Percent Change | ||||||||||||||||||||
| 2013 | 2012 | 2011 | 2013/2012 | 2012/2011 | ||||||||||||||||
Aircraft and related equipment | $ | 1,190 | $ | 1,875 | $ | 1,988 | (37 | ) | (6 | ) | ||||||||||
Facilities and sort equipment | 727 | 638 | 555 | 14 | 15 | |||||||||||||||
Vehicles | 734 | 723 | 282 | 2 | 156 | |||||||||||||||
Information and technology investments | 452 | 541 | 455 | (16 | ) | 19 | ||||||||||||||
Other equipment | 272 | 230 | 154 | 18 | 49 | |||||||||||||||
|
|
|
|
|
| |||||||||||||||
Total capital expenditures | $ | 3,375 | $ | 4,007 | $ | 3,434 | (16 | ) | 17 | |||||||||||
|
|
|
|
|
| |||||||||||||||
FedEx Express segment | $ | 2,067 | $ | 2,689 | $ | 2,467 | (23 | ) | 9 | |||||||||||
FedEx Ground segment | 555 | 536 | 426 | 4 | 26 | |||||||||||||||
FedEx Freight segment | 326 | 340 | 153 | (4 | ) | 122 | ||||||||||||||
FedEx Services segment | 424 | 437 | 387 | (3 | ) | 13 | ||||||||||||||
Other | 3 | 5 | 1 | NM | NM | |||||||||||||||
|
|
|
|
|
| |||||||||||||||
Total capital expenditures | $ | 3,375 | $ | 4,007 | $ | 3,434 | (16 | ) | 17 | |||||||||||
|
|
|
|
|
| |||||||||||||||
Capital expenditures during 2013 were lower than the prior year primarily due to decreased spending for aircraft and related equipment at FedEx Express. Aircraft and aircraft-related equipment purchases at FedEx Express during 2013 included the delivery of 16 Boeing 757s (“B757”) to be modified for cargo transport and four B777Fs. Capital expenditures during 2012 were higher than the prior year primarily due to increased spending for vehicles at FedEx Express, FedEx Freight and FedEx Ground, although spending for aircraft and related equipment at FedEx Express decreased. Aircraft and aircraft-related equipment purchases at FedEx Express during 2012 included delivery of seven B777Fs and 15 B757s.
We believe that our cash and cash equivalents, which totaled $4.9 billion in 2013, cash flow from operations and available financing sources will be adequate to meet our liquidity needs, including working capital, capital expenditure requirements and debt payment obligations. Our cash and cash equivalents balance at May 31, 2013 includes $420 million of cash in offshore jurisdictions associated with our permanent reinvestment strategy. We do not believe that the indefinite reinvestment of these funds offshore impairs our ability to meet our domestic debt or working capital obligations.
-65-
We have a shelf registration statement filed with the Securities and Exchange Commission (“SEC”) that allows us to sell, in one or more future offerings, any combination of our unsecured debt securities and common stock. During 2011, we repaid our $250 million 7.25% unsecured notes that matured on February 15, 2011. During 2010, we repaid our $500 million 5.50% notes that matured on August 15, 2009 using cash from operations and a portion of the proceeds of our January 2009 $1 billion senior unsecured debt offering. During 2011, we made principal payments in the amount of $12 million related to capital lease obligations. During 2010, we made principal payments in the amount of $153 million related to capital lease obligations.
58
| Percent Change | ||||||||||||||||||||
| 2011 | 2010 | 2009 | 2011/2010 | 2010/2009 | ||||||||||||||||
| Aircraft and related equipment | $ | 1,988 | $ | 1,537 | $ | 925 | 29 | 66 | ||||||||||||
| Facilities and sort equipment | 555 | 630 | 742 | (12 | ) | (15 | ) | |||||||||||||
| Vehicles | 282 | 220 | 319 | 28 | (31 | ) | ||||||||||||||
| Information and technology investments | 455 | 289 | 298 | 57 | (3 | ) | ||||||||||||||
| Other equipment | 154 | 140 | 175 | 10 | (20 | ) | ||||||||||||||
| Total capital expenditures | $ | 3,434 | $ | 2,816 | $ | 2,459 | 22 | 15 | ||||||||||||
| FedEx Express segment | 2,467 | 1,864 | 1,348 | 32 | 38 | |||||||||||||||
| FedEx Ground segment | 426 | 400 | 636 | 7 | (37 | ) | ||||||||||||||
| FedEx Freight segment | 153 | 212 | 240 | (28 | ) | (12 | ) | |||||||||||||
| FedEx Services segment | 387 | 340 | 235 | 14 | 45 | |||||||||||||||
| Other | 1 | — | — | — | — | |||||||||||||||
| Total capital expenditures | $ | 3,434 | $ | 2,816 | $ | 2,459 | 22 | 15 | ||||||||||||
59
Our capital expenditures are expected to be $4.0 billion in 2014. We anticipate that our cash flow from operations will be sufficient to fund our increased capital expenditures in 2014, which will include spending for aircraft and aircraft-related equipment at FedEx Express, sort facility expansion, primarily at FedEx Ground, and vehicle replacement at all our transportation segments. We expect approximately 50% of capital expenditures in 2014 will be designated for growth initiatives, predominantly at FedEx Ground and 50% dedicated to maintaining our existing operations. Our expected capital expenditures for 2014 include $1.4 billion in investments for delivery of aircraft, as well as progress payments toward future aircraft deliveries at FedEx Express. For 2014, we anticipate making required contributions totaling approximately $650 million to our U.S. Pension Plans. Our U.S. Pension Plans have ample funds to meet expected benefit payments.
We have several aircraft modernization programs underway which are supported by the purchase of B777F, Boeing 767-300 Freighter (“B767F”) and B757 aircraft. These aircraft are significantly more fuel-efficient per unit than the aircraft types previously utilized, and these expenditures are necessary to achieve significant long-term operating savings and to replace older aircraft. Our ability to delay the timing of these aircraft-related expenditures is limited without incurring significant costs to modify existing purchase agreements. During 2013, FedEx Express entered into an agreement to purchase 14 additional B757 aircraft, the delivery of which began in 2013 and will continue through 2014. The agreement provides the option to purchase up to 16 additional B757 aircraft, subject to the satisfaction of certain conditions. In addition, FedEx Express entered into agreements to purchase an additional 23 B767F aircraft, the delivery of which will occur between 2014 and 2019. The delivery of two firm B777F aircraft orders were also deferred from 2015 to 2016.
Effective as of June 14, 2013, FedEx Express entered into a supplemental agreement to purchase 13 of the 16 B757 option aircraft noted above. Delivery of the aircraft will occur during 2014 and 2015.
60
The following table sets forth a summary of our contractual cash obligations as of May 31, 2011.2013. Certain of these contractual obligations are reflected in our balance sheet, while others are disclosed as future obligations under accounting principles generally accepted in the United States. Except for the current portion of long-term debt, and capital lease obligations, this table does not include amounts already recorded in our balance sheet as current liabilities at May 31, 2011. Accordingly, this table is not meant to represent a forecast of our total cash expenditures for any of the periods presented.
| Payments Due by Fiscal Year (Undiscounted) | ||||||||||||||||||||||||||||
| (in millions) | ||||||||||||||||||||||||||||
| 2012 | 2013 | 2014 | 2015 | 2016 | Thereafter | Total | ||||||||||||||||||||||
| Operating activities: | ||||||||||||||||||||||||||||
| Operating leases | $ | 1,794 | $ | 1,654 | $ | 1,465 | $ | 1,354 | $ | 1,192 | $ | 6,533 | $ | 13,992 | ||||||||||||||
| Non-capital purchase obligations and other | 209 | 97 | 35 | 24 | 11 | 132 | 508 | |||||||||||||||||||||
| Interest on long-term debt | 126 | 98 | 97 | 78 | 78 | 1,659 | 2,136 | |||||||||||||||||||||
| Quarterly contributions to our U.S. Pension Plans | 500 | — | — | — | — | — | 500 | |||||||||||||||||||||
| Investing activities: | ||||||||||||||||||||||||||||
| Aircraft and aircraft-related capital commitments | 1,480 | 1,086 | 781 | 569 | 584 | 1,470 | 5,970 | |||||||||||||||||||||
| Other capital purchase obligations | 210 | 8 | 8 | 6 | — | — | 232 | |||||||||||||||||||||
| Financing activities: | ||||||||||||||||||||||||||||
| Debt | �� | 300 | 250 | — | — | 989 | 1,539 | |||||||||||||||||||||
| Capital lease obligations | 25 | 119 | 2 | 2 | 2 | 13 | 163 | |||||||||||||||||||||
| Total | $ | 4,344 | $ | 3,362 | $ | 2,638 | $ | 2,033 | $ | 1,867 | $ | 10,796 | $ | 25,040 | ||||||||||||||
| Payments Due by Fiscal Year (Undiscounted) (in millions) | ||||||||||||||||||||||||||||
| 2014 | 2015 | 2016 | 2017 | 2018 | Thereafter | Total | ||||||||||||||||||||||
Operating activities: | ||||||||||||||||||||||||||||
Operating leases | $ | 1,936 | $ | 1,834 | $ | 1,636 | $ | 1,689 | $ | 1,230 | $ | 6,650 | $ | 14,975 | ||||||||||||||
Non-capital purchase obligations and other | 285 | 183 | 123 | 101 | 44 | 109 | 845 | |||||||||||||||||||||
Interest on long-term debt | 157 | 138 | 138 | 138 | 138 | 2,582 | 3,291 | |||||||||||||||||||||
Contributions to our U.S. Pension Plans | 650 | — | — | — | — | — | 650 | |||||||||||||||||||||
Investing activities: | ||||||||||||||||||||||||||||
Aircraft and aircraft-related capital commitments | 968 | 1,054 | 1,140 | 959 | 1,382 | 4,492 | 9,995 | |||||||||||||||||||||
Other capital purchase obligations | 249 | 1 | — | — | — | — | 250 | |||||||||||||||||||||
Financing activities: | ||||||||||||||||||||||||||||
Debt | 250 | — | — | — | — | 2,740 | 2,990 | |||||||||||||||||||||
|
|
|
|
|
|
|
|
|
|
|
|
|
| |||||||||||||||
Total | $ | 4,495 | $ | 3,210 | $ | 3,037 | $ | 2,887 | $ | 2,794 | $ | 16,573 | $ | 32,996 | ||||||||||||||
|
|
|
|
|
|
|
|
|
|
|
|
|
| |||||||||||||||
Open purchase orders that are cancelable are not considered unconditional purchase obligations for financial reporting purposes and are not included in the table above. Such purchase orders often represent authorizations to purchase rather than binding agreements. See Note 1617 of the accompanying consolidated financial statements for more information.
Operating Activities
In accordance with accounting principles generally accepted in the United States, future contractual payments under our operating leases (totaling $14.0$15 billion on an undiscounted basis) are not recorded in our balance sheet. Credit rating agencies routinely use information concerning minimum lease payments required for our operating leases to calculate our debt capacity. The amounts reflected in the table above for operating leases represent future minimum lease payments under noncancelable operating leases (principally aircraft and facilities) with an initial or remaining term in excess of one year at May 31, 2011.2013. Under the proposed new lease accounting rules, the majority of these leases will be required to be recognized on the balance sheet as a liability with an offsetting right-to-use asset. In the past, we financed a significant portion of our aircraft needs (and certain other equipment needs) using operating leases (a type of “off-balance sheet financing”). At the time that the decision to lease was made, we determined that these operating leases would provide economic benefits favorable to ownership with respect to market values, liquidity or after-tax cash flows.
The amounts reflected for purchase obligations represent noncancelable agreements to purchase goods or services that are not capital-related. Such contracts include those for printing and advertising and promotions contracts.
61
The amounts reflected in the table above for interest on long-term debt represent future interest payments due on our long-term debt, all of which are fixed rate.
Investing Activities
The amounts reflected in the table above for capital purchase obligations represent noncancelable agreements to purchase capital-related equipment. Such contracts include those for certain purchases of aircraft, aircraft modifications, vehicles, facilities, computers and other equipment. Commitments to purchase aircraft in passenger configuration do not include the attendant costs to modify these aircraft for cargo transport unless we have entered into noncancelable commitments to modify such aircraft.
Financing Activities
We have certain financial instruments representing potential commitments, not reflected in the table above, that were incurred in the normal course of business to support our operations, including surety bonds and standby letters of credit.credit and surety bonds. These instruments are required under certain U.S. self-insurance programs and are also used in the normal course of international operations. The underlying liabilities insured by these instruments are reflected in our balance sheets, where applicable. Therefore, no additional liability is reflected for the surety bonds and letters of credit and surety bonds themselves.
The amounts reflected in the table above for long-term debt represent future scheduled payments on our long-term debt. We currentlyIn 2014, we have no scheduled debt payments in 2012.
The preparation of financial statements in accordance with accounting principles generally accepted in the United States requires management to make significant judgments and estimates to develop amounts reflected and disclosed in the financial statements. In many cases, there are alternative policies or estimation techniques that could be used. We maintain a thorough process to review the application of our accounting policies and to evaluate the appropriateness of the many estimates that are required to prepare the financial statements of a complex, global corporation. However, even under optimal circumstances, estimates routinely require adjustment based on changing circumstances and new or better information.
The estimates discussed below include the financial statement elements that are either the most judgmental or involve the selection or application of alternative accounting policies and are material to our financial statements. Management has discussed the development and selection of these critical accounting estimates with the Audit Committee of our Board of Directors and with our independent registered public accounting firm.
OVERVIEW. We sponsor programs that provide retirement benefits to most of our employees. These programs include defined benefit pension plans, defined contribution plans and postretirement healthcare plans.
Pension benefits for most employees are accrued under a cash balance formula we call the Portable Pension Account. Under the Portable Pension Account, the retirement benefit is expressed as a dollar amount in a notional account that grows with annual credits based on pay, age and years of credited service, and interest on the notional account balance. The Portable Pension Account benefit is payable as a lump sum or an annuity at retirement at the election of the employee. The plan interest credit rate varies from year to year based on a U.S. Treasury index.index and corporate bond rates. Prior to 2009, certain employees earned benefits using a traditional pension formula (based on average earnings and years of service); however, benefits. Benefits under this formula were capped on May 31, 2008.
62
In addition to expense volatility, we are required to record year-end adjustments to our balance sheet on an annual basis for the net funded status of our pension and postretirement healthcare plans. These adjustments have fluctuated significantly over the past several years and like our pension expense, are a result of the discount rate and value of our plan assets at the measurement date. The funded status of our plans also impacts our liquidity, as current funding laws require increasingly aggressive funding levels for our pension plans. However, the cash funding rules operate under a completely different set of assumptions and standards than those used for financial reporting purposes, so our actual cash funding requirements can differ materially from our reported funded status.
Our retirement plans cost is included in the “Salaries and Employee Benefits” caption in our consolidated income statements. A summary of our retirement plans costs over the past three years is as follows (in millions):
| 2011 | 2010 | 2009 | ||||||||||
| U.S. domestic and international pension plans | $ | 543 | $ | 308 | $ | 177 | ||||||
| U.S. domestic and international defined contribution plans | 257 | 136 | 237 | |||||||||
| Postretirement healthcare plans | 60 | 42 | 57 | |||||||||
| $ | 860 | $ | 486 | $ | 471 | |||||||
| 2013 | 2012 | 2011 | ||||||||||||||
U.S. domestic and international pension plans | $ | 679 | $ | 524 | $ | 543 | ||||||||||
U.S. domestic and international defined contribution plans | 354 | 338 | 257 | |||||||||||||
U.S. domestic and international postretirement healthcare plans | 78 | 70 | 60 | |||||||||||||
|
|
|
|
|
| |||||||||||
| $ | 1,111 | $ | 932 | $ | 860 | |||||||||||
|
|
|
|
|
| |||||||||||
Total retirement plans cost for 2011 increased $374$179 million due to a significantlyin 2013 driven by lower discount raterates used to measure our benefit obligations at our May 31, 20102012 measurement date. Additionally, we incurredTotal retirement plans cost increased $72 million in 2012 primarily due to higher expenses for our 401(k) plans due to the partial reinstatementfull restoration of the company-matchingcompany matching contributions on January 1, 2010,2011.
Amounts recognized in our balance sheet reflect a snapshot of the state of our long-term pension liabilities at the plan measurement date and the full restorationeffect of company-matching contributionsyear-end accounting on January 1, 2011 (previously suspendedplan assets. Cumulative unrecognized actuarial losses were $7.0 billion through May 31, 2013, compared to $8.9 billion through May 31, 2012. These unrecognized losses reflect changes in February 2009). Total retirement plans cost increased $15the discount rates and differences between expected and actual asset returns, which are being amortized over future periods. These unrecognized losses may be recovered in future periods through actuarial gains. However, unless they are below a corridor amount, these unrecognized actuarial losses are required to be amortized and recognized in future periods. Our pension expense includes amortization of these actuarial losses of $506 million in 2010, primarily due to the negative impact of market conditions on our pension plan assets at our May 31, 2009 measurement date, mostly offset by lower expenses for our 401(k) plans due to the temporary suspension of the company-matching contributions.
PENSION COST.The accounting for pension and postretirement healthcare plans includes numerous assumptions, such as:including the discount rates;rate and expected long-term investment returns on plan assets; future salary increases; employee turnover; mortality; and retirement ages.assets. These assumptions most significantly impact our U.S. Pension Plans. The components of pension cost for all pension plans are as follows (in millions):
| 2011 | 2010 | 2009 | ||||||||||
| Service cost | $ | 521 | $ | 417 | $ | 499 | ||||||
| Interest cost | 900 | 823 | 798 | |||||||||
| Expected return on plan assets | (1,062 | ) | (955 | ) | (1,059 | ) | ||||||
| Recognized actuarial losses (gains) and other | 184 | 23 | (61 | ) | ||||||||
| Net periodic benefit cost | $ | 543 | $ | 308 | $ | 177 | ||||||
63
DISCOUNT RATE. This is the interest rate used to discount the estimated future benefit payments that have been accrued to date (the projected benefit obligation, or “PBO”) to their net present value and to determine the succeeding year’s pension expense. The discount rate is determined each year at the plan measurement date. A decrease in the discount rate increases pension expense. The discount rate affects the PBO and pension expense based on the measurement dates, as described below.
Measurement Date | Discount Rate | |||||||
Amounts Determined by Measurement Date and Discount Rate | ||||||||
5/31/2013 | ||||||||
5/31/ | 4.44 | 2012 PBO and 2013 expense | ||||||
5/31/2011 | 5.76 | 2011 PBO and 2012 expense | ||||||
5/31/2010 | 6.37 | 2010 PBO and 2011 expense | ||||||
We determine the discount rate with the assistance of actuaries, who calculate the yield on a theoretical portfolio of high-grade corporate bonds (rated Aa or better) with cash flows designed to match our expected benefit payments in future years.. In developing this theoretical portfolio, we select bonds that match cash flows to benefit payments, limit our concentration by industry and issuer, and apply screening criteria to ensure bonds with a call feature have a low probability of being called. To the extent scheduled bond proceeds exceed the estimated benefit payments in a given period, the calculation assumes those excess proceeds are reinvested at one-year forward rates.
The discount rate assumption is highly sensitive, as the following table illustrates for our largest tax-qualified U.S. domestic pension plan:
| Sensitivity (in millions) | ||||||||
| Effect on 2012 | Effect on 2011 | |||||||
| Pension | Pension | |||||||
| Expense | Expense | |||||||
| One-basis-point change in discount rate | $ | 1.9 | $ | 1.7 | ||||
| Sensitivity (in millions) | ||||||||
| Effect on 2014 Pension Expense | Effect on 2013 Pension Expense | |||||||
One-basis-point change in discount rate | $ | 2.1 | $ | 2.3 | ||||
At our May 31, 20112013 measurement date, a 50-basis-point increase in the discount rate would have decreased our 20112013 PBO by approximately $1.1$1.4 billion and a 50-basis-point decrease in the discount rate would have increased our 20112013 PBO by approximately $1.2$1.5 billion. From 20092010 to 2011,2013, the discount rate used to value our liabilities has declined by nearly 200over 150 basis points, which increased the valuation of our liabilities by over $4$3.8 billion.
PLAN ASSETS.The estimated average rate of return on plan assets is a long-term, forward-looking assumption that also materially affects our pension cost. It is required to be the expected future long-term rate of earnings on plan assets. Our pension plan assets are invested primarily in listedpublicly tradeable securities, and our pension plans hold only a minimal investment in FedEx common stock that is entirely at the discretion of third-party pension fund investment managers. As part of our strategy to manage future pension costs and net funded status volatility, we have transitioned to a liability-driven investment strategy with a greater concentration of fixed-income securities to better align plan assets with liabilities. We review the expected long-term rate of return on an annual basis and revise it as appropriate.
64
the duration of our pension plan liabilities, which drives the investment strategy we can employ with our pension plan assets;
the types of investment classes in which we invest our pension plan assets and the expected compound geometric return we can reasonably expect those investment classes to earn over time; and
the investment returns we can reasonably expect our investment management program to achieve in excess of the returns we could expect if investments were made strictly in indexed funds.
| Plan Assets at Measurement Date | ||||||||||||||||||||||||
| 2011 | 2010 | |||||||||||||||||||||||
| Asset Class | Actual | Actual % | Target % | Actual | Actual % | Target % | ||||||||||||||||||
| Domestic equities | $ | 5,761 | 37 | % | 33 | % | $ | 4,569 | 35 | % | 33 | % | ||||||||||||
| International equities | 2,013 | 13 | 12 | 1,502 | 12 | 12 | ||||||||||||||||||
| Private equities | 403 | 3 | 5 | 399 | 3 | 5 | ||||||||||||||||||
| Total equities | 8,177 | 53 | 50 | 6,470 | 50 | 50 | ||||||||||||||||||
| Fixed-income securities | 6,995 | 45 | 49 | 6,205 | 47 | 49 | ||||||||||||||||||
| Cash and other | 346 | 2 | 1 | 380 | 3 | 1 | ||||||||||||||||||
| $ | 15,518 | 100 | % | 100 | % | $ | 13,055 | 100 | % | 100 | % | |||||||||||||
We have assumed an 8.0% compound geometricexpected long-term rate of return on our U.S. Pension Plan assets for 2013, 2012 2011 and 2010, as described in Note 122011. The actual returns during each of the accompanying consolidated financial statements. A one-basis-point change in our expected return on plan assets impacts our pension expense by $1.5 million.
-70-
and liability management strategy. In lowering this assumption we considered our historical returns, our investment strategy for our plan assets, including the impacts of the long duration of our plan liability and the relatively low annual draw on plan assets on that investment strategy. A one-basis-point change in our expected return on plan assets impacts our pension expense by $1.9 million.
Pension expense is also affected by the accounting policy used to determine the value of plan assets at the measurement date. We use a calculated-value method to determine the value of plan assets, which helps mitigate short-term volatility in market performance (both increases and decreases) by amortizing certain actuarial gains or losses over a period no longer than four years. Another method used in practice applies the market value of plan assets at the measurement date. For purposes of valuing plan assets for determining 20122014 pension expense, we used the calculated-value method, as our actual returns on plan assets significantly exceeded our assumptions. However, as previously indicated, our pension costs in 2012 are expected to remain flat. The calculated-valuecalculated value method resulted in the same value as the market value in 2011. The calculated-value method significantly mitigated the impact of asset value declines in the determination of our 2010 pension expense, reducing our 2010 expense by approximately $135 million.
value.
65
| 2011 | 2010 | |||||||
Funded Status of Plans: | ||||||||
| Projected benefit obligation (PBO) | $ | 17,372 | $ | 14,484 | ||||
| Fair value of plan assets | 15,841 | 13,295 | ||||||
| Funded status of the plans | $ | (1,531 | ) | $ | (1,189 | ) | ||
Components of Funded Status by Plans: | ||||||||
| U.S. qualified plans | $ | (927 | ) | $ | (580 | ) | ||
| U.S. nonqualified plans | (339 | ) | (348 | ) | ||||
| International plans | (265 | ) | (261 | ) | ||||
| Net funded status | $ | (1,531 | ) | $ | (1,189 | ) | ||
Components of Amounts Included in Balance Sheets: | ||||||||
| Current pension and other benefit obligations | (33 | ) | (30 | ) | ||||
| Noncurrent pension and other benefit obligations | (1,498 | ) | (1,159 | ) | ||||
| Net amount recognized | $ | (1,531 | ) | $ | (1,189 | ) | ||
Cash Amounts: | ||||||||
| Cash contributions during the year | $ | 557 | $ | 900 | ||||
| Benefit payments during the year | $ | 468 | $ | 391 | ||||
| 2013 | 2012 | |||||||
Funded Status of Plans: | ||||||||
Projected benefit obligation (PBO) | $ | 22,600 | $ | 22,187 | ||||
Fair value of plan assets | 19,433 | 17,334 | ||||||
|
|
|
| |||||
Funded status of the plans | $ | (3,167 | ) | $ | (4,853 | ) | ||
|
|
|
| |||||
Cash Amounts: | ||||||||
Cash contributions during the year | $ | 615 | $ | 780 | ||||
Benefit payments during the year | $ | 589 | $ | 502 | ||||
Our retirement plans costs are expected to decrease approximately $190 million in 2014 due to significant increases in the balance sheet reflect a snapshot of the statevalue of our long-term pension liabilitiesplan assets in 2013 and an increase in our discount rates at the plan measurement date and the effect of year-end accounting on plan assets. Atour May 31, 2011, we recorded a decrease to equity through OCI of $350 million (net of tax) to reflect unrealized actuarial losses during 2011 related to a decline in the discount rate. Those losses are subject to amortization over future years and may be reflected in future income statements unless they are recovered. At May 31, 2010, we recorded a decrease to equity through OCI of $1.0 billion (net of tax) attributable to our pension plans.
FUNDING.The funding requirements for our U.S. Pension Plans are governed by the Pension Protection Act of 2006, which has aggressive funding requirements in order to avoid benefit payment restrictions that become effective if the funded status determined under Internal Revenue ServiceIRS rules falls below 80% at the beginning of a plan year. All of our U.S. Pension Plans have funded status levels in excess of 80% and our plans remain adequately funded to provide benefits to our employees as they come due. Additionally, current benefit payments are nominal compared to our total plan assets (benefit payments for our U.S. Pension Plans for 20112013 were approximately $411$572 million or 3% of plan assets).
During 2011,2013, we made $480$560 million in required contributions to our U.S. Pension Plans, including $121 million in voluntary contributions.Plans. Over the past several years, we have made voluntary contributions to our U.S. Pension Plans in excess of the minimum required contributions. Amounts contributed in excess of the minimum required can result in a credit balance for funding purposes that can be used to meetreduce minimum contribution requirements in future years. Our current credit balance exceeds $2 billion at May 31, 2013. For 2012,2014, we anticipate making required contributions to our U.S. Pension Plans totaling approximately $500$650 million.
See Note 13 of the discount rates and differences between expected and actual asset returns, which are being amortized over future periods. These unrecognized losses may be recovered in future periods through actuarial gains. However, unless they are below a corridor amount, these unrecognized actuarial losses are required to be amortized and recognized in future periods. Our pension expense includes amortization of these actuarial losses of $276 million in 2011, $125 million in 2010 and $44 million in 2009.
accompanying consolidated financial statements for further information about our retirement plans.
66
We are self-insured up to certain limits for costs associated with workers’ compensation claims, vehicle accidents and general business liabilities, and benefits paid under employee healthcare and long-term disability programs. Our reserves are established for estimates of loss on reported claims, including incurred-but-not-reported claims. At May 31, 2011 and 2010, there were $1.6 billion of self-insurance
-71-
Self-insurance accruals reflected in our balance sheet.sheet were $1.7 billion at May 31, 2013, and $1.6 billion at May 31, 2012. Approximately 40%41% of these accruals were classified as current liabilities.
Our self-insurance accruals are primarily based on the actuarially estimated, undiscounted cost of claims to provide us with estimates of future claim costs based on claims incurred as of the balance sheet date. These estimates include consideration of factors such as severity of claims, frequency of claims and future healthcare costs. Cost trends on material accruals are updated each quarter. We self-insure up to certain limits that vary by operating company and type of risk. Periodically, we evaluate the level of insurance coverage and adjust insurance levels based on risk tolerance and premium expense. Historically, it has been infrequent that incurred claims exceeded our self-insured limits. Other acceptable methods of accounting for these accruals include measurement of claims outstanding and projected payments based on historical development factors.
We believe the use of actuarial methods to account for these liabilities provides a consistent and effective way to measure these highly judgmental accruals. However, the use of any estimation technique in this area is inherently sensitive given the magnitude of claims involved and the length of time until the ultimate cost is known. We believe our recorded obligations for these expenses are consistently measured on a conservative basis. Nevertheless, changes in healthcare costs, accident frequency and severity, insurance retention levels and other factors can materially affect the estimates for these liabilities.
PROPERTY AND EQUIPMENT. Our key businesses are capital intensive, with approximately 57%55% of our total assets invested in our transportation and information systems infrastructures. We capitalize only those costs that meet the definition of capital assets under accounting standards. Accordingly, repair and maintenance costs that do not extend the useful life of an asset or are not part of the cost of acquiring the asset are expensed as incurred.
The depreciation or amortization of our capital assets over their estimated useful lives, and the determination of any salvage values, requires management to make judgments about future events. Because we utilize many of our capital assets over relatively long periods (the majority of aircraft costs are depreciated over 15 to 1830 years), we periodically evaluate whether adjustments to our estimated service lives or salvage values are necessary to ensure these estimates properly match the economic use of the asset. This evaluation may result in changes in the estimated lives and residual values used to depreciate our aircraft and other equipment. For our aircraft, we typically assign no residual value due to the utilization of these assets in cargo configuration, which results in little to no value at the end of their useful life. These estimates affect the amount of depreciation expense recognized in a period and, ultimately, the gain or loss on the disposal of the asset. Changes in the estimated lives of assets will result in an increase or decrease in the amount of depreciation recognized in future periods and could have a material impact on our results of operations. Historically, gains and losses on disposals of operating equipment have not been material (typically aggregating less than $10 million annually).material. However, such amounts may differ materially in the future due to changes in business levels, technological obsolescence, accident frequency, regulatory changes and other factors beyond our control.
In May 2013, FedEx Express made the decision to accelerate the retirement of 76 aircraft and related engines to aid in our fleet modernization and improve our global network. In May 2012, we shortened the depreciable lives for 54 aircraft and related engines to accelerate the retirement of these aircraft, resulting in a depreciation expense increase of $69 million in 2013. As a result of these accelerated retirements, we expect an additional $74 million in year-over-year accelerated depreciation expense in 2014.
Because of the lengthy lead times for aircraft manufacture and modifications, we must anticipate volume levels and plan our fleet requirements years in advance, and make commitments for aircraft based on those projections. Furthermore, the timing and availability of certain used aircraft types (particularly those with better fuel efficiency) may create limited opportunities to acquire these aircraft at favorable prices in advance of our capacity needs. These activities create risks that asset capacity may exceed demand and that an impairment of our assets may occur. Aircraft purchases (primarily aircraft in passenger configuration) that have not been placed in service totaled $173$129 million at May 31, 20112013 and $101$127 million at May 31, 2010.2012. We plan to modify these assets in the future and place them into operations.
67
In the normal management of our aircraft fleet, we routinely idle aircraft and equipmentengines temporarily due to maintenance cycles and adjustments of our network capacity to match seasonality and overall customer demand levels. Temporarily idled assets are classified as available-for-use, and we continue to record depreciation expense associated with these assets. These temporarily idled assets are assessed for impairment charges recognized in 2011 (see “Overview” for additional information on certain asset impairmentsa quarterly basis. Factors which could cause impairment include, but are not limited to, adverse changes in our global economic outlook and the impact of our outlook on our current and projected volume levels, including lower capacity needs during our peak shipping seasons; the introduction of new fleet types or decisions to permanently retire an aircraft fleet from operations; or changes to planned service expansion activities. We currently have one aircraft temporarily idled. This aircraft has been idled for 15 months and is expected to return to revenue service.
In May 2013, we made the decision to retire from service two Airbus A310-200 aircraft and four related engines, three Airbus A310-300 aircraft and two related engines and five Boeing MD10-10 aircraft and 15 related engines, to align with the plans of FedEx Freight segmentExpress to modernize its aircraft fleet and improve its global network. As a consequence of this decision, a noncash impairment charge of $100 million ($63 million, net of tax, or $0.20 per diluted share) was recorded in 2011)the fourth quarter. All of these aircraft were temporarily idled and not in revenue service.
In 2012, we incurred a noncash impairment charge of $134 million ($84 million, net of tax, or 2010. However, during 2009, we recorded $202 million in property and equipment impairment charges. These charges were primarily$0.26 per diluted share). This charge related to our May 2012 decision to permanently remove from service certainretire 24 aircraft along with certain excessand 43 related engines to better align the U.S. domestic air network capacity of FedEx Express to match current and anticipated shipment volumes. The majority of these aircraft engines, at FedEx Express.
LEASES. We utilize operating leases to finance certain of our aircraft, facilities and equipment. Such arrangements typically shift the risk of loss on the residual value of the assets at the end of the lease period to the lessor. As disclosed in “Contractual Cash Obligations” and Note 7 of the accompanying consolidated financial statements, at May 31, 20112013 we had approximately $14$15 billion (on an undiscounted basis) of future commitments for payments under operating leases. The weighted-average remaining lease term of all operating leases outstanding at May 31, 20112013 was approximately six years. The future commitments for operating leases are not reflected as a liability in our balance sheet under current U.S. accounting rules.
The determination of whether a lease is accounted for as a capital lease or an operating lease requires management to make estimates primarily about the fair value of the asset and its estimated economic useful life. In addition, our evaluation includes ensuring we properly account for build-to-suit lease arrangements and making judgments about whether various forms of lessee involvement during the construction period make the lessee an agent for the owner-lessor or, in substance, the owner of the asset during the construction period. We believe we have well-defined and controlled processes for making these evaluations, including obtaining third-party appraisals for material transactions to assist us in making these evaluations.
Under a proposed revision to the accounting standards for leases, we would be required to record an asset and a liability for our outstanding operating leases similar to the current accounting for capital leases. Notably, the amount we record in the future would be the net present value of our future lease commitments at the date of adoption. This proposed guidance has not been issued and has been subjected to numerous revisions since the proposal was issued, most recently in May 2013. While we are not required to quantify the effects of the proposed rule changes until these rules are finalized, we believe that a majority of the operating lease
-73-
obligations reflected in the contractual cash obligations table would be required to be reflected in our balance sheet were the proposed rules to be adopted. Furthermore, our existing financing agreements and the rating agencies that evaluate our creditworthiness already take our operating leases into account.
GOODWILL. We have $2.3As of May 31, 2013, we had $2.8 billion of recorded goodwill from our acquisitions, representing the excess of costthe purchase price over the fair value of the net assets we have acquired. Several factors give rise to goodwill in our acquisitions, such as the expected benefit from synergies of the combination and the existing workforce of the acquired entity.
In our evaluation of goodwill impairment, we perform a qualitative assessment which requires management judgment and the use of estimates and assumptions to determine if it is more likely than not that the fair value of oura reporting units.unit is less than its carrying amount. If the qualitative assessment is not conclusive, we proceed to a two-step process to test goodwill for impairment, including comparing the fair value of each reporting unit with its carrying value (including attributable goodwill). Fair value is estimated using standard valuation methodologies (principally the income or market approach) incorporating market participant considerations and management’s assumptions on revenue growth rates, operating margins, discount rates and expected capital expenditures. Estimates used by management can significantly affect the outcome of the impairment test. Changes in forecasted operating results and other assumptions could materially affect these estimates. We perform our annual impairment tests in the fourth quarter unless circumstances indicate the need to accelerate the timing of the test.
tests.
68
Goodwill Impairment Charges — 2010
We are subject to various loss contingencies, including tax proceedings and litigation, in connection with our operations. Contingent liabilities are difficult to measure, as their measurement is subject to multiple factors that are not easily predicted or projected. Further, additional complexity in measuring these liabilities arises due to the various jurisdictions in which these matters occur, which makes our ability to predict their outcome highly uncertain. Moreover, different accounting rules must be employed to account for these items based on the nature of the contingency. Accordingly, significant management judgment is required to assess these matters and to make determinations about the measurement of a liability, if any. Our material pending loss contingencies are described in Note 1718 of the accompanying consolidated financial statements. In the opinion of management, the aggregate liability, if any, of individual matters or groups of matters not specifically described in Note 1718 is not expected to be material to our financial position, results of operations or cash flows. The following describes our methods and associated processes for evaluating these matters.
69
Tax contingencies arise from uncertainty in the application of tax rules throughout the many jurisdictions in which we operate and are impacted by several factors, including tax audits, appeals, litigation, changes in tax laws and other rules and their interpretations, and changes in our business. We regularly assess the potential impact of these factors for the current and prior years to determine the adequacy of our tax provisions. We continually evaluate the likelihood and amount of potential adjustments and adjust our tax positions, including the current and deferred tax liabilities, in the period in which the facts that give rise to a revision become known. In addition, management considers the advice of third parties in making conclusions regarding tax consequences.
-74-
We recognize liabilities for uncertain income tax positions based on a two-step process. The first step is to evaluate the tax position for recognition by determining if the weight of available evidence indicates that it is more likely than not that the position will be sustained on audit, including resolution of related appeals or litigation processes, if any. The second step requires us to estimate and measure the tax benefit as the largest amount that is more than 50% likely to be realized upon ultimate settlement. It is inherently difficult and subjective to estimate such amounts, as we must determine the probability of various possible outcomes. We reevaluate these uncertain tax positions on a quarterly basis or when new information becomes available to management. These reevaluations are based on factors including, but not limited to, changes in facts or circumstances, changes in tax law, successfully settled issues under audit and new audit activity. Such a change in recognition or measurement could result in the recognition of a tax benefit or an increase to the related provision.
We classify interest related to income tax liabilities as interest expense, and if applicable, penalties are recognized as a component of income tax expense. The income tax liabilities and accrued interest and penalties that are due within one year of the balance sheet date are presented as current liabilities. The remaining portion of our income tax liabilities and accrued interest and penalties are presented as noncurrent liabilities.liabilities because payment of cash is not anticipated within one year of the balance sheet date. These noncurrent income tax liabilities are recorded in the caption “Other liabilities” in the accompanying consolidated balance sheets.
We account for operating taxes based on multi-state, local and foreign taxing jurisdiction rules in those areas in which we operate. Provisions for operating taxes are estimated based upon these rules, asset acquisitions and disposals, historical spend and other variables. These provisions are consistently evaluated for reasonableness against compliance and risk factors.
We measure and record operating tax contingency accruals in accordance with accounting guidance for contingencies. As discussed below, this guidance requires an accrual of estimated loss from a contingency, such as a tax or other legal proceeding or claim, when it is probable that a loss will be incurred and the amount of the loss can be reasonably estimated.
OTHER CONTINGENCIES. Because of the complex environment in which we operate, we are subject to other legal proceedings and claims, including those relating to general commercial matters, employment-related claims and FedEx Ground’s owner-operators. Accounting guidance for contingencies requires an accrual of estimated loss from a contingency, such as a tax or other legal proceeding or claim, when it is probable (i.e., the future event or events are likely to occur) that a loss will behas been incurred and the amount of the loss can be reasonably estimated. This guidance also requires disclosure of a loss contingency matter when, in management’s judgment, a material loss is reasonably possible or probable.
During the preparation of our financial statements, we evaluate our contingencies to determine whether it is probable, reasonably possible or remote that a liability has been incurred. A loss is recognized for all contingencies deemed probable and estimable, regardless of amount. For unresolved contingencies with potentially material exposure that are deemed reasonably possible, we evaluate whether a potential loss or range of loss can be reasonably estimated.
70
-75-
In determining whether a loss should be accrued or a loss contingency disclosed, we evaluate, among other factors:
the current status of each matter within the scope and context of the entire lawsuit (i.e., the lengthy and complex nature of class-action matters);
the procedural status of each lawsuit;
any opportunities to dispose of the lawsuit on its merits before trial (i.e., motion to dismiss or for summary judgment);
the amount of time remaining before the trial date;
the status of discovery;
the status of settlement, arbitration or mediation proceedings, and;
our judgment regarding the likelihood of success prior to or at trial.
In reaching our conclusions with respect to accrual of a loss or loss contingency disclosure, we take a holistic view of each matter based on these factors and the information available prior to the issuance of our financial statements. Uncertainty with respect to an individual factor or combination of these factors may impact our decisions related to accrual or disclosure of a loss contingency, including a conclusion that we are unable to establish an estimate of possible loss or a meaningful range of possible loss. We update our disclosures to reflect our most current understanding of the contingencies at the time we issue our financial statements. However, events may arise that were not anticipated and the outcome of a contingency may result in a loss to us that differs materially from our previously estimated liability or range of possible loss.
Despite the inherent complexity in the accounting and disclosure of contingencies, we believe that our processes are robust and thorough and provide a consistent framework for management in evaluating the potential outcome of contingencies for proper accounting recognition and disclosure.
Our financial and operating results are subject to many risks and uncertainties, as described below.
We are directly affected by the state of the economy.While macro-economic risks apply to most companies, we are particularly vulnerable. The transportation industry is highly cyclical and especially susceptible to trends in economic activity, such as the recent global recession.activity. Our primary business is to transport goods, so our business levels are directly tied to the purchase and production of goods — key macro-economic measurements. When individuals and companies purchase and produce fewer goods, we transport fewer goods.goods, and as companies expand the number of distribution centers and move manufacturing closer to consumer markets, we transport goods shorter distances. In addition, we have a relatively high fixed-cost structure, which is difficult to quickly adjust to match shifting volume levels. Moreover, as we continue to grow our international business, we are increasingly affected by the health of the global economy. Aseconomy and the typically more volatile economies of emerging markets. In 2013, slower than expected economic growth resulted in a result, the recent global recessioncontinued customer preference for slower, less costly shipping services, which had a disproportionately negative impact on us and our recent financial results.
profitability.
71
-76-
We rely heavily on information and technology to operate our transportation and business networks, and any disruption to our technology infrastructure or the Internet could harm our operations and our reputation among customers.Our ability to attract and retain customers and to compete effectively depends in part upon the sophistication and reliability of our technology network, including our ability to provide features of service that are important to our customers. External and internal risks, such as malware, insecure coding,code anomalies, “Acts of God,” attempts to penetrate our networks, transitional challenges in migrating operating company functionality to our FedEx enterprise automation platform, data leakage and human error, pose a direct threat to our products, services and data. Any disruption to the Internet or our complex, global technology infrastructure, including those impacting our computer systems and customer Web sites, could adversely impact our customer service, volumes, and revenues and result in increased costs. These types of adverse impacts could also occur in the event the confidentiality, integrity, or availability of company and customer information was compromised due to a data loss by FedEx or a trusted third party. While we have invested and continue to invest in technology security initiatives, information technology risk management and disaster recovery plans, these measures cannot fully insulate us from technology disruptions or data loss and the resulting adverse effect on our operations and financial results.
Our transportation businesses may beare impacted by the price and availability of fuel.We must purchase large quantities of fuel to operate our aircraft and vehicles, and the price and availability of fuel can be unpredictable and beyond our control. To date, we have been mostly successful in mitigating over time the expense impact of higher fuel costs through our indexed fuel surcharges, as the amount of the surcharges is closely linked to the market prices for fuel. If we are unable to maintain or increase our fuel surcharges because of competitive pricing pressures or some other reason, fuel costs could adversely impact our operating results. Even if we are able to offset the cost of fuel with our surcharges, high fuel surcharges could move our customers especially in the U.S. domestic market, away from our higher-yielding express services to our lower-yielding deferred or ground services or even reduce customer demand for our services altogether. In addition, disruptions in the supply of fuel could have a negative impact on our ability to operate our transportation networks.
Our businesses are capital intensive, and we must make capital expendituresdecisions based upon projected volume levels.We make significant investments in aircraft, vehicles, technology, package handling facilities, sort equipment, copy equipment and other assets to support our transportation and business networks. We also make significant investments to rebrand, integrate and grow the companies that we acquire. The amount and timing of capital investments depend on various factors, including our anticipated volume growth. For example, weWe must make commitments to purchase or modify aircraft years before the aircraft are actually needed. We must predict volume levels and fleet requirements and make commitments for aircraft based on those projections. Missing our projections could result in too much or too little capacity relative to our shipping volumes. Overcapacity could lead to asset dispositions or write-downs and undercapacity could negatively impact service levels.
We face intense competition.The transportation and business services markets are both highly competitive and sensitive to price and service, especially in periods of little or no macro-economic growth. Some of our competitors have more financial resources than we do, or they are controlled or subsidized by foreign governments, which enables them to raise capital more easily. We believe we compete effectively with these companies — for example, by providing more reliable service at compensatory prices. However, an irrational pricing environment can limit our ability not only to maintain or increase our prices (including our fuel surcharges in response to rising fuel costs), but also to maintain or grow our market share. In addition, maintaining a broad portfolio of services is important to keepinghigh volume package shippers could develop in-house ground delivery capabilities, which would in turn reduce our revenues and attracting customers.market share. While we believe we compete effectively through our current service offerings, if our current competitors or potential future competitors offer a broader range of services or more effectively bundle their services or our current customers become competitors, it could impede our ability to maintain or grow our market share.
72
If we do not effectively operate, integrate, leverage and grow acquired businesses, our financial results and reputation may suffer. Our strategy for long-term growth, productivity and profitability depends in part on our ability to make prudent strategic acquisitions and to realize the benefits we expect when we make those acquisitions. In furtherance of this strategy, in 2013, we made strategic acquisitions in Poland, France and Brazil. While we expect our past and future acquisitions to enhance our value proposition to customers and improve our long-term profitability, there can be no assurance that we will realize our expectations within the time frame we have established, if at all, or that we can continue to support the value we allocate to these acquired businesses, including their goodwill or other intangible assets.
FedEx Ground relies on owner-operators to conduct its linehaul and pickup-and-delivery operations, and the status of these owner-operators as independent contractors, rather than employees, is being challenged.FedEx Ground’s use of independent contractors is well suited to the needs of the ground delivery business and its customers, as evidenced by the strong growth of this business segment. We are involved in numerous lawsuits and state tax and other administrative proceedings that claim that the company’s owner-operators or their drivers should be treated as our employees, rather than independent contractors. We incur certain costs, including legal fees, in defending the status of FedEx Ground’s owner-operators as independent contractors. We believe that FedEx Ground’s owner-operators are properly classified as independent contractors and that FedEx Ground is not an employer of the drivers of the company’s independent contractors. However, adverse determinations in these matters could, among other things, entitle certain of our contractorsowner-operators and their drivers to the reimbursement of certain expenses and to the benefit of wage-and-hour laws and result in employment and withholding tax and benefit liability for FedEx Ground, and could result in changes to the independent contractor status of FedEx Ground’s owner-operators. Changes to state laws governing the definition of independent contractors could impact the status of FedEx Ground’s owner-operators. If FedEx Ground is compelled to convert its independent contractors to employees, labor organizations could more easily organize these individuals, our operating costs could increase materially and we could incur significant capital outlays.
Increased security or pilot safety requirements could impose substantialFailure to execute on our business realignment program will cause our future financial results to suffer.In 2013, we announced profit improvement programs primarily through initiatives at FedEx Express and FedEx Services that include cost reductions, modernization of our aircraft fleet, transformation of the U.S. domestic operations and international profit improvements at FedEx Express, and improved efficiencies and lower costs on us.of information technology at FedEx Services. To this end, during 2013, we conducted a program to offer voluntary cash buyouts to eligible U.S.-based employees in certain staff functions. Additionally, we announced in May 2013 our decision to retire from service 10 aircraft and related engines, as well as to shorten the depreciable lives of an additional 76 aircraft and related engines, in an effort to modernize our aircraft fleet and improve our global network. We will continue to work towards the plan of annual profitability improvement of $1.6 billion by the end of 2016, but if we are not able to reach this goal in the face of challenging economic conditions, our future financial results may suffer.
-78-
The transportation infrastructure continues to be a target of terrorist activities.As Because transportation assets continue to be a resulttarget of concerns about global terrorism and homeland security,terrorist activities, governments around the world are adopting or are considering adopting stricter security requirements that will increase operating costs and potentially slow service for businesses, including those in the transportation industry. For example, the U.S. Transportation Security Administration has issuedcontinues to usrequire FedEx Express to comply with a Full All-Cargo Aircraft Operator Standard Security Plan, which contains many newevolving and enhancedstrict security requirements. These requirements are not static, but will change periodically as the result of regulatory and legislative requirements, imposing additional security costs and to respond to evolving threats. The Federal Aviation Administration, in September 2010, proposed rules that would significantly reduce the maximum numbercreating a level of hours on duty and increase the minimum amount of rest timeuncertainty for our pilots, and thus require us to hire additional pilots and modify certain of our aircraft. Until these requirements are adopted, we cannot determine the effect that these new rules will have on our cost structure or our operating results. Itoperations. Thus, it is reasonably possible however, that these rules or other future security or flight safety requirements could impose material costs on us.
Moreover, a terrorist attack directed at FedEx or other aspects of the transportation infrastructure could disrupt our operations and adversely impact demand for our services.
73
We may be affected by global climate change or by legal, regulatory or market responses to such change.Concern over climate change, including the impact of global warming, has led to significant U.S. and international legislative and regulatory efforts to limit greenhouse gas (“GHG”) emissions, including our aircraft and diesel engine emissions. For example, during 2009, the European Commission approved the extension of the European Union Emissions Trading Scheme (“ETS”) for GHG emissions, to the airline industry. Under this decision, all FedEx Express flights to and from any airport in any member state of the European Union will beare now covered by the ETS requirements, beginning in 2012, and each year we will beare required to submit emission allowances in an amount equal to the carbon dioxide emissions from such flights. Because the European Union ETS is being contested by many countries on a number of fronts, and the effective date for parts of the ETS has been delayed until next year, the future impact on us is unclear. In addition, the U.S. Congress has, in the past, considered bills that would regulate GHG emissions, and some form of federal climate change legislation is possible in the future. Increased regulation regarding GHG emissions, especially aircraft or diesel engine emissions, could impose substantial costs on us, especially at FedEx Express. These costs include an increase in the cost of the fuel and other energy we purchase and capital costs associated with updating or replacing our aircraft or vehicles prematurely. Until the timing, scope and extent of such regulation becomes known, we cannot predict its effect on our cost structure or our operating results. It is reasonably possible, however, that it could impose material costs on us. Moreover, even without such regulation, increased awareness and any adverse publicity in the global marketplace about the GHGs emitted by companies in the airline and transportation industries could harm our reputation and reduce customer demand for our services, especially our air express services. Finally, given the broad and global scope of our operations and our susceptibility to global macro-economic trends, we are particularly vulnerable to the physical risks of climate change that could affect all of humankind, such as shifts in weather patterns and world ecosystems.
A localized disaster in a key geography could adversely impact our business.While we operate several integrated networks with assets distributed throughout the world, there are concentrations of key assets within our networks that are exposed to localized risks from natural or manmade disasters such as tornados, floods, earthquakes or terrorist attacks. The loss of a key location such as our Memphis super hub or one of our information technology centers could cause a significant disruption to our operations and cause us to incur significant costs to relocatereestablish or reestablishrelocate these functions. Moreover, resulting economic dislocations, including supply chain and fuel disruptions, could adversely impact demand for our services.
74
Our business may be adversely impacted by disruptions or modifications in service by the USPS.The USPS is a significant customer and vendor of FedEx, and thus, disruptions or modifications in services by the USPS as a consequence of the USPS’s current financial difficulties or any resulting structural changes to its operations, network, service offerings or pricing could have an adverse effect on our operations and financial results.
increasing costs, the volatility of costs and funding requirements and other legal mandates for employee benefits, especially pension and healthcare benefits;
the increasing costs of compliance with federal and state governmental agency mandates and defending against inappropriate or unjustified enforcement or other actions by such agencies;
the impact of any international conflicts or terrorist activities on the United States and global economies in general, the transportation industry or us in particular, and what effects these events will have on our costs or the demand for our services;
any impacts on our businesses resulting from new domestic or international government laws and regulation;
changes in foreign currency exchange rates, especially in the euro, Chinese yuan, euro, Brazilian real, Canadian dollar and the British pound, and Japanese yen, which can affect our sales levels and foreign currency sales prices;
market acceptance of our new service and growth initiatives;
any liability resulting from and the costs of defending against class-action litigation, such as wage-and-hour and discrimination and retaliation claims, and any other legal or governmental proceedings;
the outcome of future negotiations to reach new collective bargaining agreements — including with the union that represents the pilots of FedEx Express (the current pilot contract is scheduled to becomebecame amendable in March 2013, unlessand the union exercises its option to shorten the contract,parties are currently in which case the agreement would be amendable in March 2012)negotiations);
the impact of technology developments on our operations and on demand for our services, and our ability to continue to identify and eliminate unnecessary information technology redundancy and complexity throughout the organization;
widespread outbreak of an illness or any other communicable disease, or any other public health crisis; and
availability of financing on terms acceptable to us and our ability to maintain our current credit ratings, especially given the capital intensity of our operations.
75
Certain statements in this report, including (but not limited to) those contained in “Outlook“Outlook” (including segment outlooks),” “Liquidity,” “Capital Resources,” “Liquidity Outlook,” “Contractual Cash Obligations” and “Critical Accounting Estimates,” and the “Retirement Plans” and “Contingencies” notes to the consolidated financial statements, are “forward-looking” statements within the meaning of the Private Securities Litigation Reform Act of 1995 with respect to our financial condition, results of operations, cash flows, plans, objectives, future performance and business. Forward-looking statements include those preceded by, followed by or that include the words “may,” “could,” “would,” “should,” “believes,” “expects,” “anticipates,” “plans,” “estimates,” “targets,” “projects,” “intends” or similar expressions. These forward-looking statements involve risks and uncertainties. Actual results may differ materially from those contemplated (expressed or implied) by such forward-looking statements, because of, among other things, the risk factors identified above and the other risks and uncertainties you can find in our press releases and other SEC filings.
-80-
As a result of these and other factors, no assurance can be given as to our future results and achievements. Accordingly, a forward-looking statement is neither a prediction nor a guarantee of future events or circumstances and those future events or circumstances may not occur. You should not place undue reliance on the forward-looking statements, which speak only as of the date of this report. We are under no obligation, and we expressly disclaim any obligation, to update or alter any forward-looking statements, whether as a result of new information, future events or otherwise.
76
Our management is responsible for establishing and maintaining adequate internal control over financial reporting (as defined in Rules 13a-15(f) and 15d-15(f) under the Securities Exchange Act of 1934, as amended). Our internal control over financial reporting includes, among other things, defined policies and procedures for conducting and governing our business, sophisticated information systems for processing transactions and a properly staffed, professional internal audit department. Mechanisms are in place to monitor the effectiveness of our internal control over financial reporting and actions are taken to correct all identified deficiencies. Our procedures for financial reporting include the active involvement of senior management, our Audit Committee and our staff of highly qualified financial and legal professionals.
Management, with the participation of our principal executive and financial officers, assessed our internal control over financial reporting as of May 31, 2011,2013, the end of our fiscal year. Management based its assessment on criteria established in Internal Control-IntegratedControl–Integrated Framework issued by the Committee of Sponsoring Organizations of the Treadway Commission (the COSO criteria).
Based on this assessment, management has concluded that our internal control over financial reporting was effective as of May 31, 2011.
The effectiveness of our internal control over financial reporting as of May 31, 2011,2013, has been audited by Ernst & Young LLP, the independent registered public accounting firm who also audited the Company’s consolidated financial statements included in this Annual Report on Form 10-K. Ernst & Young LLP’s report on the Company’s internal control over financial reporting is included in this Annual Report on Form 10-K.
77
PUBLIC ACCOUNTING FIRM
The Board of Directors and Stockholders
FedEx Corporation
We have audited FedEx Corporation’s internal control over financial reporting as of May 31, 2011,2013, based on criteria established in Internal Control—Control — Integrated Framework issued by the Committee of Sponsoring Organizations of the Treadway Commission (the COSO criteria). FedEx Corporation’s management is responsible for maintaining effective internal control over financial reporting, and for its assessment of the effectiveness of internal control over financial reporting included in the accompanying Management’s Report on Internal Control over Financial Reporting. Our responsibility is to express an opinion on the company’s internal control over financial reporting based on our audit.
We conducted our audit in accordance with the standards of the Public Company Accounting Oversight Board (United States). Those standards require that we plan and perform the audit to obtain reasonable assurance about whether effective internal control over financial reporting was maintained in all material respects. Our audit included obtaining an understanding of internal control over financial reporting, assessing the risk that a material weakness exists, testing and evaluating the design and operating effectiveness of internal control based on the assessed risk, and performing such other procedures as we considered necessary in the circumstances. We believe that our audit provides a reasonable basis for our opinion.
A company’s internal control over financial reporting is a process designed to provide reasonable assurance regarding the reliability of financial reporting and the preparation of financial statements for external purposes in accordance with generally accepted accounting principles. A company’s internal control over financial reporting includes those policies and procedures that (1) pertain to the maintenance of records that, in reasonable detail, accurately and fairly reflect the transactions and dispositions of the assets of the company; (2) provide reasonable assurance that transactions are recorded as necessary to permit preparation of financial statements in accordance with generally accepted accounting principles, and that receipts and expenditures of the company are being made only in accordance with authorizations of management and directors of the company; and (3) provide reasonable assurance regarding prevention or timely detection of unauthorized acquisition, use, or disposition of the company’s assets that could have a material effect on the financial statements.
Because of its inherent limitations, internal control over financial reporting may not prevent or detect misstatements. Also, projections of any evaluation of effectiveness to future periods are subject to the risk that controls may become inadequate because of changes in conditions, or that the degree of compliance with the policies or procedures may deteriorate.
In our opinion, FedEx Corporation maintained, in all material respects, effective internal control over financial reporting as of May 31, 2011,2013, based on the COSO criteria.
We also have audited, in accordance with the standards of the Public Company Accounting Oversight Board (United States), the consolidated balance sheets of FedEx Corporation as of May 31, 20112013 and 2010,2012, and the related consolidated statements of income, comprehensive income (loss), changes in stockholders’ investment, and comprehensive income, and cash flows for each of the three years in the period ended May 31, 20112013 of FedEx Corporation and our report dated July 12, 201115, 2013 expressed an unqualified opinion thereon.
/s/ Ernst & Young LLP
Memphis, Tennessee
July 12, 2011
78
PUBLIC ACCOUNTING FIRM
The Board of Directors and Stockholders
FedEx Corporation
We have audited the accompanying consolidated balance sheets of FedEx Corporation as of May 31, 20112013 and 2010,2012, and the related consolidated statements of income, comprehensive income (loss), changes in stockholders’ investment, and comprehensive income, and cash flows for each of the three years in the period ended May 31, 2011.2013. These financial statements are the responsibility of the Company’s management. Our responsibility is to express an opinion on these financial statements based on our audits.
We conducted our audits in accordance with the standards of the Public Company Accounting Oversight Board (United States). Those standards require that we plan and perform the audit to obtain reasonable assurance about whether the financial statements are free of material misstatement. An audit includes examining, on a test basis, evidence supporting the amounts and disclosures in the financial statements. An audit also includes assessing the accounting principles used and significant estimates made by management, as well as evaluating the overall financial statement presentation. We believe that our audits provide a reasonable basis for our opinion.
In our opinion, the financial statements referred to above present fairly, in all material respects, the consolidated financial position of FedEx Corporation at May 31, 20112013 and 2010,2012, and the consolidated results of its operations and its cash flows for each of the three years in the period ended May 31, 2011,2013, in conformity with U.S. generally accepted accounting principles.
We also have audited, in accordance with the standards of the Public Company Accounting Oversight Board (United States), FedEx Corporation’s internal control over financial reporting as of May 31, 2011,2013, based on criteria established in Internal Control-Integrated Framework issued by the Committee of Sponsoring Organizations of the Treadway Commission and our report dated July 12, 201115, 2013 expressed an unqualified opinion thereon.
/s/ Ernst & Young LLP
Memphis, Tennessee
July 12, 2011
79
CONSOLIDATED BALANCE SHEETS
(IN MILLIONS)
| May 31, | ||||||||
| 2011 | 2010 | |||||||
| ASSETS | ||||||||
| CURRENT ASSETS | ||||||||
| Cash and cash equivalents | $ | 2,328 | $ | 1,952 | ||||
| Receivables, less allowances of $182 and $166 | 4,581 | 4,163 | ||||||
| Spare parts, supplies and fuel, less allowances of $169 and $170 | 437 | 389 | ||||||
| Deferred income taxes | 610 | 529 | ||||||
| Prepaid expenses and other | 329 | 251 | ||||||
| Total current assets | 8,285 | 7,284 | ||||||
| PROPERTY AND EQUIPMENT, AT COST | ||||||||
| Aircraft and related equipment | 13,146 | 11,640 | ||||||
| Package handling and ground support equipment | 5,591 | 5,193 | ||||||
| Computer and electronic equipment | 4,408 | 4,218 | ||||||
| Vehicles | 3,294 | 3,170 | ||||||
| Facilities and other | 7,247 | 7,081 | ||||||
| 33,686 | 31,302 | |||||||
| Less accumulated depreciation and amortization | 18,143 | 16,917 | ||||||
| Net property and equipment | 15,543 | 14,385 | ||||||
| OTHER LONG-TERM ASSETS | ||||||||
| Goodwill | 2,326 | 2,200 | ||||||
| Other assets | 1,231 | 1,033 | ||||||
| Total other long-term assets | 3,557 | 3,233 | ||||||
| $ | 27,385 | $ | 24,902 | |||||
| May 31, | ||||||||
| 2013 | 2012 | |||||||
ASSETS | ||||||||
CURRENT ASSETS | ||||||||
Cash and cash equivalents | $ | 4,917 | $ | 2,843 | ||||
Receivables, less allowances of $176 and $178 | 5,044 | 4,704 | ||||||
Spare parts, supplies and fuel, less allowances of $205 and $184 | 457 | 440 | ||||||
Deferred income taxes | 533 | 533 | ||||||
Prepaid expenses and other | 323 | 536 | ||||||
|
|
|
| |||||
Total current assets | 11,274 | 9,056 | ||||||
PROPERTY AND EQUIPMENT, AT COST | ||||||||
Aircraft and related equipment | 14,716 | 14,360 | ||||||
Package handling and ground support equipment | 6,452 | 5,912 | ||||||
Computer and electronic equipment | 4,958 | 4,646 | ||||||
Vehicles | 4,080 | 3,654 | ||||||
Facilities and other | 7,903 | 7,592 | ||||||
|
|
|
| |||||
| 38,109 | 36,164 | |||||||
Less accumulated depreciation and amortization | 19,625 | 18,916 | ||||||
|
|
|
| |||||
Net property and equipment | 18,484 | 17,248 | ||||||
OTHER LONG-TERM ASSETS | ||||||||
Goodwill | 2,755 | 2,387 | ||||||
Other assets | 1,054 | 1,212 | ||||||
|
|
|
| |||||
Total other long-term assets | 3,809 | 3,599 | ||||||
|
|
|
| |||||
| $ | 33,567 | $ | 29,903 | |||||
|
|
|
| |||||
The accompanying notes are an integral part of these consolidated financial statements.
80
CONSOLIDATED BALANCE SHEETS
(IN MILLIONS, EXCEPT SHARE DATA)
| May 31, | ||||||||
| 2011 | 2010 | |||||||
| LIABILITIES AND STOCKHOLDERS’ INVESTMENT | ||||||||
| CURRENT LIABILITIES | ||||||||
| Current portion of long-term debt | $ | 18 | $ | 262 | ||||
| Accrued salaries and employee benefits | 1,268 | 1,146 | ||||||
| Accounts payable | 1,702 | 1,522 | ||||||
| Accrued expenses | 1,894 | 1,715 | ||||||
| Total current liabilities | 4,882 | 4,645 | ||||||
| LONG-TERM DEBT, LESS CURRENT PORTION | 1,667 | 1,668 | ||||||
| OTHER LONG-TERM LIABILITIES | ||||||||
| Deferred income taxes | 1,336 | 891 | ||||||
| Pension, postretirement healthcare and other benefit obligations | 2,124 | 1,705 | ||||||
| Self-insurance accruals | 977 | 960 | ||||||
| Deferred lease obligations | 779 | 804 | ||||||
| Deferred gains, principally related to aircraft transactions | 246 | 267 | ||||||
| Other liabilities | 154 | 151 | ||||||
| Total other long-term liabilities | 5,616 | 4,778 | ||||||
| COMMITMENTS AND CONTINGENCIES | ||||||||
| COMMON STOCKHOLDERS’ INVESTMENT | ||||||||
| Common stock, $0.10 par value; 800 million shares authorized; 317 million shares issued as of May 31, 2011 and 314 million shares issued as of May 31, 2010 | 32 | 31 | ||||||
| Additional paid-in capital | 2,484 | 2,261 | ||||||
| Retained earnings | 15,266 | 13,966 | ||||||
| Accumulated other comprehensive loss | (2,550 | ) | (2,440 | ) | ||||
| Treasury stock, at cost | (12 | ) | (7 | ) | ||||
| Total common stockholders’ investment | 15,220 | 13,811 | ||||||
| $ | 27,385 | $ | 24,902 | |||||
| May 31, | ||||||||
| 2013 | 2012 | |||||||
LIABILITIES AND STOCKHOLDERS’ INVESTMENT | ||||||||
CURRENT LIABILITIES | ||||||||
Current portion of long-term debt | $ | 251 | $ | 417 | ||||
Accrued salaries and employee benefits | 1,688 | 1,635 | ||||||
Accounts payable | 1,879 | 1,613 | ||||||
Accrued expenses | 1,932 | 1,709 | ||||||
|
|
|
| |||||
Total current liabilities | 5,750 | 5,374 | ||||||
LONG-TERM DEBT, LESS CURRENT PORTION | 2,739 | 1,250 | ||||||
OTHER LONG-TERM LIABILITIES | ||||||||
Deferred income taxes | 1,652 | 836 | ||||||
Pension, postretirement healthcare and other benefit obligations | 3,916 | 5,582 | ||||||
Self-insurance accruals | 987 | 963 | ||||||
Deferred lease obligations | 778 | 784 | ||||||
Deferred gains, principally related to aircraft transactions | 227 | 251 | ||||||
Other liabilities | 120 | 136 | ||||||
|
|
|
| |||||
Total other long-term liabilities | 7,680 | 8,552 | ||||||
COMMITMENTS AND CONTINGENCIES | ||||||||
COMMON STOCKHOLDERS’ INVESTMENT | ||||||||
Common stock, $0.10 par value; 800 million shares authorized; 318 million shares issued as of May 31, 2013 and 317 million shares issued as of May 31, 2012 | 32 | 32 | ||||||
Additional paid-in capital | 2,668 | 2,595 | ||||||
Retained earnings | 18,519 | 17,134 | ||||||
Accumulated other comprehensive loss | (3,820 | ) | (4,953 | ) | ||||
Treasury stock, at cost | (1 | ) | (81 | ) | ||||
|
|
|
| |||||
Total common stockholders’ investment | 17,398 | 14,727 | ||||||
|
|
|
| |||||
| $ | 33,567 | $ | 29,903 | |||||
|
|
|
| |||||
The accompanying notes are an integral part of these consolidated financial statements.
81
CONSOLIDATED STATEMENTS OF INCOME
(IN MILLIONS, EXCEPT PER SHARE AMOUNTS)
| Years ended May 31, | ||||||||||||
| 2011 | 2010 | 2009 | ||||||||||
| REVENUES | $ | 39,304 | $ | 34,734 | $ | 35,497 | ||||||
| OPERATING EXPENSES: | ||||||||||||
| Salaries and employee benefits | 15,276 | 14,027 | 13,767 | |||||||||
| Purchased transportation | 5,674 | 4,728 | 4,534 | |||||||||
| Rentals and landing fees | 2,462 | 2,359 | 2,429 | |||||||||
| Depreciation and amortization | 1,973 | 1,958 | 1,975 | |||||||||
| Fuel | 4,151 | 3,106 | 3,811 | |||||||||
| Maintenance and repairs | 1,979 | 1,715 | 1,898 | |||||||||
| Impairment and other charges | 89 | 18 | 1,204 | |||||||||
| Other | 5,322 | 4,825 | 5,132 | |||||||||
| 36,926 | 32,736 | 34,750 | ||||||||||
| OPERATING INCOME | 2,378 | 1,998 | 747 | |||||||||
| OTHER INCOME (EXPENSE): | ||||||||||||
| Interest expense | (86 | ) | (79 | ) | (85 | ) | ||||||
| Interest income | 9 | 8 | 26 | |||||||||
| Other, net | (36 | ) | (33 | ) | (11 | ) | ||||||
| (113 | ) | (104 | ) | (70 | ) | |||||||
| INCOME BEFORE INCOME TAXES | 2,265 | 1,894 | 677 | |||||||||
| PROVISION FOR INCOME TAXES | 813 | 710 | 579 | |||||||||
| NET INCOME | $ | 1,452 | $ | 1,184 | $ | 98 | ||||||
| BASIC EARNINGS PER COMMON SHARE | $ | 4.61 | $ | 3.78 | $ | 0.31 | ||||||
| DILUTED EARNINGS PER COMMON SHARE | $ | 4.57 | $ | 3.76 | $ | 0.31 | ||||||
| Years ended May 31, | ||||||||||||
| 2013 | 2012 | 2011 | ||||||||||
REVENUES | $ | 44,287 | $ | 42,680 | $ | 39,304 | ||||||
OPERATING EXPENSES: | ||||||||||||
Salaries and employee benefits | 16,570 | 16,099 | 15,276 | |||||||||
Purchased transportation | 7,272 | 6,335 | 5,674 | |||||||||
Rentals and landing fees | 2,521 | 2,487 | 2,462 | |||||||||
Depreciation and amortization | 2,386 | 2,113 | 1,973 | |||||||||
Fuel | 4,746 | 4,956 | 4,151 | |||||||||
Maintenance and repairs | 1,909 | 1,980 | 1,979 | |||||||||
Business realignment, impairment and other charges | 660 | 134 | 89 | |||||||||
Other | 5,672 | 5,390 | 5,322 | |||||||||
|
|
|
|
|
| |||||||
| 41,736 | 39,494 | 36,926 | ||||||||||
|
|
|
|
|
| |||||||
OPERATING INCOME | 2,551 | 3,186 | 2,378 | |||||||||
OTHER INCOME (EXPENSE): | ||||||||||||
Interest expense | (82 | ) | (52 | ) | (86 | ) | ||||||
Interest income | 21 | 13 | 9 | |||||||||
Other, net | (35 | ) | (6 | ) | (36 | ) | ||||||
|
|
|
|
|
| |||||||
| (96 | ) | (45 | ) | (113 | ) | |||||||
|
|
|
|
|
| |||||||
INCOME BEFORE INCOME TAXES | 2,455 | 3,141 | 2,265 | |||||||||
PROVISION FOR INCOME TAXES | 894 | 1,109 | 813 | |||||||||
|
|
|
|
|
| |||||||
NET INCOME | $ | 1,561 | $ | 2,032 | $ | 1,452 | ||||||
|
|
|
|
|
| |||||||
BASIC EARNINGS PER COMMON SHARE | $ | 4.95 | $ | 6.44 | $ | 4.61 | ||||||
|
|
|
|
|
| |||||||
DILUTED EARNINGS PER COMMON SHARE | $ | 4.91 | $ | 6.41 | $ | 4.57 | ||||||
|
|
|
|
|
| |||||||
The accompanying notes are an integral part of these consolidated financial statements.
82
CONSOLIDATED STATEMENTS OF CASH FLOWS
(IN MILLIONS)
| Years ended May 31, | ||||||||||||
| 2011 | 2010 | 2009 | ||||||||||
| OPERATING ACTIVITIES | ||||||||||||
| Net income | $ | 1,452 | $ | 1,184 | $ | 98 | ||||||
| Adjustments to reconcile net income to cash provided by operating activities: | ||||||||||||
| Depreciation and amortization | 1,973 | 1,958 | 1,975 | |||||||||
| Provision for uncollectible accounts | 152 | 124 | 181 | |||||||||
| Deferred income taxes and other noncash items | 669 | 331 | 299 | |||||||||
| Impairment and other charges | 29 | 18 | 1,103 | |||||||||
| Stock-based compensation | 98 | 101 | 99 | |||||||||
| Changes in assets and liabilities: | ||||||||||||
| Receivables | (400 | ) | (906 | ) | 762 | |||||||
| Other assets | (114 | ) | 276 | (196 | ) | |||||||
| Pension assets and liabilities, net | (169 | ) | (611 | ) | (913 | ) | ||||||
| Accounts payable and other liabilities | 370 | 710 | (628 | ) | ||||||||
| Other, net | (19 | ) | (47 | ) | (27 | ) | ||||||
| Cash provided by operating activities | 4,041 | 3,138 | 2,753 | |||||||||
| INVESTING ACTIVITIES | ||||||||||||
| Capital expenditures | (3,434 | ) | (2,816 | ) | (2,459 | ) | ||||||
| Business acquisition, net of cash acquired | (96 | ) | — | — | ||||||||
| Proceeds from asset dispositions and other | 111 | 35 | 76 | |||||||||
| Cash used in investing activities | (3,419 | ) | (2,781 | ) | (2,383 | ) | ||||||
| FINANCING ACTIVITIES | ||||||||||||
| Principal payments on debt | (262 | ) | (653 | ) | (501 | ) | ||||||
| Proceeds from debt issuance | — | — | 1,000 | |||||||||
| Proceeds from stock issuances | 108 | 94 | 41 | |||||||||
| Excess tax benefit on the exercise of stock options | 23 | 25 | 4 | |||||||||
| Dividends paid | (151 | ) | (138 | ) | (137 | ) | ||||||
| Other, net | (5 | ) | (20 | ) | (7 | ) | ||||||
| Cash (used in) provided by financing activities | (287 | ) | (692 | ) | 400 | |||||||
| Effect of exchange rate changes on cash | 41 | (5 | ) | (17 | ) | |||||||
| Net increase (decrease) in cash and cash equivalents | 376 | (340 | ) | 753 | ||||||||
| Cash and cash equivalents at beginning of period | 1,952 | 2,292 | 1,539 | |||||||||
| Cash and cash equivalents at end of period | $ | 2,328 | $ | 1,952 | $ | 2,292 | ||||||
| Years Ended May 31, | ||||||||||||
| 2013 | 2012 | 2011 | ||||||||||
NET INCOME | $ | 1,561 | $ | 2,032 | $ | 1,452 | ||||||
OTHER COMPREHENSIVE INCOME (LOSS): | ||||||||||||
Foreign currency translation adjustments, net of tax benefit of $12 and $26 in 2013 and 2012 and tax expense of $27 in 2011 | 41 | (95 | ) | 125 | ||||||||
Amortization of unrealized pension actuarial gains/losses and other, net of tax expense of $677 in 2013 and tax benefit of $1,369 and $141 in 2012 and 2011 | 1,092 | (2,308 | ) | (235 | ) | |||||||
|
|
|
|
|
| |||||||
| 1,133 | (2,403 | ) | (110 | ) | ||||||||
|
|
|
|
|
| |||||||
COMPREHENSIVE INCOME (LOSS) | $ | 2,694 | $ | (371 | ) | $ | 1,342 | |||||
|
|
|
|
|
| |||||||
The accompanying notes are an integral part of these consolidated financial statements.
83
CONSOLIDATED STATEMENTS OF CHANGES IN STOCKHOLDERS’INVESTMENT AND COMPREHENSIVE INCOME
(IN MILLIONS, EXCEPT SHARE DATA)
| Accumulated | ||||||||||||||||||||||||
| Additional | Other | |||||||||||||||||||||||
| Common | Paid-in | Retained | Comprehensive | Treasury | ||||||||||||||||||||
| Stock | Capital | Earnings | Income (Loss) | Stock | Total | |||||||||||||||||||
Balance at May 31, 2008 | $ | 31 | $ | 1,922 | $ | 13,002 | $ | (425 | ) | $ | (4 | ) | $ | 14,526 | ||||||||||
| Adjustment to opening balances for retirement plans measurement date transition, net of tax benefit of $26 and expense of $220, respectively | — | — | (44 | ) | 369 | — | 325 | |||||||||||||||||
Balance at June 1, 2008 | 31 | 1,922 | 12,958 | (56 | ) | (4 | ) | 14,851 | ||||||||||||||||
| Net income | — | — | 98 | — | — | 98 | ||||||||||||||||||
| Foreign currency translation adjustment, net of tax of $28 | — | — | — | (112 | ) | — | (112 | ) | ||||||||||||||||
| Retirement plans adjustments, net of tax of $718 | — | — | — | (1,205 | ) | — | (1,205 | ) | ||||||||||||||||
| Total comprehensive loss | (1,219 | ) | ||||||||||||||||||||||
| Cash dividends declared ($0.44 per share) | — | — | (137 | ) | — | — | (137 | ) | ||||||||||||||||
| Employee incentive plans and other (995,271 shares issued) | — | 131 | — | — | — | 131 | ||||||||||||||||||
Balance at May 31, 2009 | 31 | 2,053 | 12,919 | (1,373 | ) | (4 | ) | 13,626 | ||||||||||||||||
| Net income | — | — | 1,184 | — | — | 1,184 | ||||||||||||||||||
| Foreign currency translation adjustment, net of tax of $2 | — | — | — | (25 | ) | — | (25 | ) | ||||||||||||||||
| Retirement plans adjustments, net of tax of $617 | — | — | — | (1,042 | ) | — | (1,042 | ) | ||||||||||||||||
| Total comprehensive income | 117 | |||||||||||||||||||||||
| Purchase of treasury stock | — | — | — | — | (3 | ) | (3 | ) | ||||||||||||||||
| Cash dividends declared ($0.44 per share) | — | — | (137 | ) | — | — | (137 | ) | ||||||||||||||||
| Employee incentive plans and other (2,375,753 shares issued) | — | 208 | — | — | — | 208 | ||||||||||||||||||
Balance at May 31, 2010 | 31 | 2,261 | 13,966 | (2,440 | ) | (7 | ) | 13,811 | ||||||||||||||||
| Net income | — | — | 1,452 | — | — | 1,452 | ||||||||||||||||||
| Foreign currency translation adjustment, net of tax of $27 | — | — | — | 125 | — | 125 | ||||||||||||||||||
| Retirement plans adjustments, net of tax of $141 | — | — | — | (235 | ) | — | (235 | ) | ||||||||||||||||
| Total comprehensive income | 1,342 | |||||||||||||||||||||||
| Purchase of treasury stock | — | — | — | — | (5 | ) | (5 | ) | ||||||||||||||||
| Cash dividends declared ($0.48 per share) | — | — | (152 | ) | — | — | (152 | ) | ||||||||||||||||
| Employee incentive plans and other (2,229,051 shares issued) | 1 | 223 | — | — | — | 224 | ||||||||||||||||||
Balance at May 31, 2011 | $ | 32 | $ | 2,484 | $ | 15,266 | $ | (2,550 | ) | $ | (12 | ) | $ | 15,220 | ||||||||||
| Years ended May 31, | ||||||||||||
| 2013 | 2012 | 2011 | ||||||||||
OPERATING ACTIVITIES | ||||||||||||
Net income | $ | 1,561 | $ | 2,032 | $ | 1,452 | ||||||
Adjustments to reconcile net income to cash provided by operating activities: | ||||||||||||
Depreciation and amortization | 2,386 | 2,113 | 1,973 | |||||||||
Provision for uncollectible accounts | 167 | 160 | 152 | |||||||||
Deferred income taxes and other noncash items | 521 | 1,126 | 669 | |||||||||
Business realignment, impairment and other charges | 479 | 134 | 29 | |||||||||
Stock-based compensation | 109 | 105 | 98 | |||||||||
Changes in assets and liabilities: | ||||||||||||
Receivables | (451 | ) | (254 | ) | (400 | ) | ||||||
Other current assets | 257 | (231 | ) | (114 | ) | |||||||
Pension assets and liabilities, net | (335 | ) | (453 | ) | (169 | ) | ||||||
Accounts payable and other liabilities | 10 | 144 | 370 | |||||||||
Other, net | (16 | ) | (41 | ) | (19 | ) | ||||||
|
|
|
|
|
| |||||||
Cash provided by operating activities | 4,688 | 4,835 | 4,041 | |||||||||
INVESTING ACTIVITIES | ||||||||||||
Capital expenditures | (3,375 | ) | (4,007 | ) | (3,434 | ) | ||||||
Business acquisitions, net of cash acquired | (483 | ) | (116 | ) | (96 | ) | ||||||
Proceeds from asset dispositions and other | 55 | 74 | 111 | |||||||||
|
|
|
|
|
| |||||||
Cash used in investing activities | (3,803 | ) | (4,049 | ) | (3,419 | ) | ||||||
FINANCING ACTIVITIES | ||||||||||||
Principal payments on debt | (417 | ) | (29 | ) | (262 | ) | ||||||
Proceeds from debt issuances | 1,739 | — | — | |||||||||
Proceeds from stock issuances | 280 | 128 | 108 | |||||||||
Excess tax benefit on the exercise of stock options | 23 | 18 | 23 | |||||||||
Dividends paid | (177 | ) | (164 | ) | (151 | ) | ||||||
Purchase of treasury stock | (246 | ) | (197 | ) | — | |||||||
Other, net | (18 | ) | — | (5 | ) | |||||||
|
|
|
|
|
| |||||||
Cash provided by (used in) financing activities | 1,184 | (244 | ) | (287 | ) | |||||||
|
|
|
|
|
| |||||||
Effect of exchange rate changes on cash | 5 | (27 | ) | 41 | ||||||||
|
|
|
|
|
| |||||||
Net increase in cash and cash equivalents | 2,074 | 515 | 376 | |||||||||
Cash and cash equivalents at beginning of period | 2,843 | 2,328 | 1,952 | |||||||||
|
|
|
|
|
| |||||||
Cash and cash equivalents at end of period | $ | 4,917 | $ | 2,843 | $ | 2,328 | ||||||
|
|
|
|
|
| |||||||
The accompanying notes are an integral part of these consolidated financial statements.
84
CONSOLIDATED STATEMENTS OF CHANGES IN STOCKHOLDERS’ INVESTMENT
(IN MILLIONS, EXCEPT SHARE DATA)
| Common Stock | Additional Paid-in Capital | Retained Earnings | Accumulated Other Comprehensive Income (Loss) | Treasury Stock | Total | |||||||||||||||||||
Balance at May 31, 2010 | $ | 31 | $ | 2,261 | $ | 13,966 | $ | (2,440 | ) | $ | (7 | ) | $ | 13,811 | ||||||||||
Net income | — | — | 1,452 | — | — | 1,452 | ||||||||||||||||||
Other comprehensive loss, net of tax of $114 | — | — | — | (110 | ) | — | (110 | ) | ||||||||||||||||
Purchase of treasury stock | — | — | — | — | (5 | ) | (5 | ) | ||||||||||||||||
Cash dividends declared ($0.48 per share) | — | — | (152 | ) | — | — | (152 | ) | ||||||||||||||||
Employee incentive plans and other (2,229,051 shares issued) | 1 | 223 | — | — | — | 224 | ||||||||||||||||||
|
|
|
|
|
|
|
|
|
|
|
| |||||||||||||
Balance at May 31, 2011 | 32 | 2,484 | 15,266 | (2,550 | ) | (12 | ) | 15,220 | ||||||||||||||||
Net income | — | — | 2,032 | — | — | 2,032 | ||||||||||||||||||
Other comprehensive loss, net of tax of $1,395 | — | — | — | (2,403 | ) | — | (2,403 | ) | ||||||||||||||||
Purchase of treasury stock | — | — | — | — | (197 | ) | (197 | ) | ||||||||||||||||
Cash dividends declared ($0.52 per share) | — | — | (164 | ) | — | — | (164 | ) | ||||||||||||||||
Employee incentive plans and other (2,359,659 shares issued) | — | 111 | — | — | 128 | 239 | ||||||||||||||||||
|
|
|
|
|
|
|
|
|
|
|
| |||||||||||||
Balance at May 31, 2012 | 32 | 2,595 | 17,134 | (4,953 | ) | (81 | ) | 14,727 | ||||||||||||||||
Net income | — | — | 1,561 | — | — | 1,561 | ||||||||||||||||||
Other comprehensive gain, net of tax of $665 | — | — | — | 1,133 | — | 1,133 | ||||||||||||||||||
Purchase of treasury stock | — | — | — | — | (246 | ) | (246 | ) | ||||||||||||||||
Cash dividends declared ($0.56 per share) | — | — | (176 | ) | — | — | (176 | ) | ||||||||||||||||
Employee incentive plans and other (4,172,976 shares issued) | — | 73 | — | — | 326 | 399 | ||||||||||||||||||
|
|
|
|
|
|
|
|
|
|
|
| |||||||||||||
Balance at May 31, 2013 | $ | 32 | $ | 2,668 | $ | 18,519 | $ | (3,820 | ) | $ | (1 | ) | $ | 17,398 | ||||||||||
|
|
|
|
|
|
|
|
|
|
|
| |||||||||||||
The accompanying notes are an integral part of these consolidated financial statements.
- 90 -
NOTES TO CONSOLIDATED FINANCIAL STATEMENTS
NOTE 1: DESCRIPTION OF BUSINESS AND SUMMARY OF SIGNIFICANT ACCOUNTING POLICIES
DESCRIPTION OF BUSINESS.FedEx Corporation (“FedEx”) provides a broad portfolio of transportation, e-commerce and business services through companies competing collectively, operating independently and managed collaboratively, under the respected FedEx brand. Our primary operating companies are Federal Express Corporation (“FedEx Express”), the world’s largest express transportation company; FedEx Ground Package System, Inc. (“FedEx Ground”), a leading North American provider of small-package ground delivery services; and FedEx Freight, Inc. (“FedEx Freight”), a leading U.S.North American provider of less-than-truckload (“LTL”) freight services. These companies represent our major service lines and, along with FedEx Corporate Services, Inc. (“FedEx Services”), form the core of our reportable segments. Our FedEx Services segment provides sales, marketing, and information technology, communications and back-office support to our transportation segments. In addition, the FedEx Services segment provides customers with retail access to FedEx Express and FedEx Ground shipping services through FedEx Office and Print Services, Inc. (“FedEx Office”) and provides customer service, technical support and billing and collection services through FedEx TechConnect, Inc. (“FedEx TechConnect”).
FISCAL YEARS. Except as otherwise specified, references to years indicate our fiscal year ended May 31, 20112013 or ended May 31 of the year referenced.
PRINCIPLES OF CONSOLIDATION. The consolidated financial statements include the accounts of FedEx and its subsidiaries, substantially all of which are wholly owned. All significant intercompany accounts and transactions have been eliminated in consolidation.
REVENUE RECOGNITION. We recognize revenue upon delivery of shipments for our transportation businesses and upon completion of services for our business services, logistics and trade services businesses. Certain of our transportationTransportation services are provided with the use of employees and independent contractors. FedEx is the principal to the transaction infor most instancesof these services and in those cases revenue from these transactions is recognized on a gross basis. Costs associated with independent contractor settlements are recognized as incurred and included in the caption “Purchased transportation” in the accompanying consolidated statements of income. For shipments in transit, revenue is recorded based on the percentage of service completed at the balance sheet date. Estimates for future billing adjustments to revenue and accounts receivable are recognized at the time of shipment for money-back service guarantees and billing corrections. Delivery costs are accrued as incurred.
Our contract logistics, global trade services and certain transportation businesses, such as FedEx SmartPost, engage in some transactions wherein they act as agents. Revenue from these transactions is recorded on a net basis. Net revenue includes billings to customers less third-party charges, including transportation or handling costs, fees, commissions, and taxes and duties.
Certain of our revenue-producing transactions are subject to taxes, such as sales tax, assessed by governmental authorities. We present these revenues net of tax.
CREDIT RISK.We routinely grant credit to many of our customers for transportation and business services without collateral. The risk of credit loss in our trade receivables is substantially mitigated by our credit evaluation process, short collection terms and sales to a large number of customers, as well as the low revenue per transaction for most of our services. Allowances for potential credit losses are determined based on historical experience and the impact of current economic factors on the composition of accounts receivable. Historically, credit losses have been within management’s expectations.
- 91 -
FEDEX CORPORATION
NOTES TO CONSOLIDATED FINANCIAL STATEMENTS (Continued)
ADVERTISING.Advertising and promotion costs are expensed as incurred and are classified in other operating expenses. Advertising and promotion expenses were $424 million in 2013, $421 million in 2012 and $375 million in 2011, $374 million in 2010 and $379 million in 2009.
2011.
85
SPARE PARTS, SUPPLIES AND FUEL.Spare parts (principally aircraft-related) are reported at weighted-average cost. Allowances for obsolescence are provided for spare parts expected to be on hand at the date the aircraft are retired from service. These allowances are provided over the estimated useful life of the related aircraft and engines. Additionally, allowances for obsolescence are provided for spare parts currently identified as excess or obsolete. These allowances are based on management estimates, which are subject to change. SuppliesThe majority of our supplies and our fuel are reported at weighted average cost.
PROPERTY AND EQUIPMENT. Expenditures for major additions, improvements and flight equipment modifications and certain equipment overhaul costs are capitalized when such costs are determined to extend the useful life of the asset or are part of the cost of acquiring the asset. Expenditures for equipment overhaul costs of engines or airframes prior to their operational use are capitalized as part of the cost of such assets as they are costs required to ready the asset for its intended use. Maintenance and repairs are charged to expense as incurred. We capitalize certain direct internal and external costs associated with the development of internal-use software. Gains and losses on sales of property used in operations are classified within operating expenses.
For financial reporting purposes, we record depreciation and amortization of property and equipment on a straight-line basis over the asset’s service life or related lease term, if shorter. For income tax purposes, depreciation is computed using accelerated methods when applicable. The depreciable lives and net book value of our property and equipment are as follows (dollars in millions):
| Net Book Value at May 31, | ||||||||||
| Range | 2011 | 2010 | ||||||||
| Wide-body aircraft and related equipment | 15 to 30 years | $ | 6,536 | $ | 5,897 | |||||
| Narrow-body and feeder aircraft and related equipment | 5 to 18 years | 1,517 | 1,049 | |||||||
| Package handling and ground support equipment | 3 to 30 years | 1,985 | 1,895 | |||||||
| Vehicles | 3 to 15 years | 1,076 | 1,095 | |||||||
| Computer and electronic equipment | 2 to 10 years | 776 | 649 | |||||||
| Facilities and other | 2 to 40 years | 3,653 | 3,800 | |||||||
Range | Net Book Value at May 31, | |||||||||
| 2013 | 2012 | |||||||||
Wide-body aircraft and related equipment | 15 to 30 years | $ | 7,191 | $ | 7,161 | |||||
Narrow-body and feeder aircraft and related equipment | 5 to 18 years | 2,284 | 1,881 | |||||||
Package handling and ground support equipment | 3 to 30 years | 2,311 | 2,101 | |||||||
Vehicles | 3 to 15 years | 1,748 | 1,411 | |||||||
Computer and electronic equipment | 2 to 10 years | 993 | 930 | |||||||
Facilities and other | 2 to 40 years | 3,957 | 3,764 | |||||||
Substantially all property and equipment have no material residual values. The majority of aircraft costs are depreciated on a straight-line basis over 15 to 1830 years. We periodically evaluate the estimated service lives and residual values used to depreciate our property and equipment. This evaluation may result in changes in the estimated lives and residual values. Such changesvalues as it did not materially affectin 2013 and 2012 with certain aircraft. In May 2013, FedEx Express made the decision to accelerate the retirement of 76 aircraft and related engines to aid in our fleet modernization and improve our global network. In May 2012, we shortened the depreciable lives for 54 aircraft and related engines to accelerate the retirement of these aircraft, resulting in a depreciation expense increase of $69 million in 2013. As a result of these accelerated retirements, we expect an additional $74 million in year-over-year depreciation expense in any period presented. 2014.
Depreciation expense, excluding gains and losses on sales of property and equipment used in operations, was $2.3 billion in 2013, $2.1 billion in 2012 and $1.9 billion in 2011 and 2010, and $1.8 billion in 2009.2011. Depreciation and amortization expense includes amortization of assets under capital lease.
- 92 -
FEDEX CORPORATION
NOTES TO CONSOLIDATED FINANCIAL STATEMENTS (Continued)
CAPITALIZED INTEREST. Interest on funds used to finance the acquisition and modification of aircraft, including purchase deposits, construction of certain facilities, and development of certain software up to the date the asset is ready for its intended use is capitalized and included in the cost of the asset if the asset is actively under construction. Capitalized interest was $71$45 million in 2011, $802013, $85 million in 20102012 and $71 million in 2009.
IMPAIRMENT OF LONG-LIVED ASSETS.Long-lived assets are reviewed for impairment when circumstances indicate the carrying value of an asset may not be recoverable. For assets that are to be held and used, an impairment is recognized when the estimated undiscounted cash flows associated with the asset or group of assets is less than their carrying value. If impairment exists, an adjustment is made to write the asset down to its fair value, and a loss is recorded as the difference between the carrying value and fair value. Fair values are determined based on quoted market values, discounted cash flows or internal and external appraisals, as applicable. Assets to be disposed of are carried at the lower of carrying value or estimated net realizable value.
86
In 2011,the normal management of our aircraft fleet, we incurred assetroutinely idle aircraft and engines temporarily due to maintenance cycles and adjustments of our network capacity to match seasonality and overall customer demand levels. Temporarily idled assets are classified as available-for-use, and we continue to record depreciation expense associated with these assets. These temporarily idled assets are assessed for impairment chargeson a quarterly basis. Factors which could cause impairment include, but are not limited to, adverse changes in our global economic outlook and the impact of $29our outlook on our current and projected volume levels, including lower capacity needs during our peak shipping seasons; the introduction of new fleet types or decisions to permanently retire an aircraft fleet from operations; or changes to planned service expansion activities. We currently have one aircraft temporarily idled. This aircraft has been idled for 15 months and is expected to return to revenue service.
In May 2013, we made the decision to retire from service two Airbus A310-200 aircraft and four related engines, three Airbus A310-300 aircraft and two related engines and five Boeing MD10-10 aircraft and 15 related engines to align with the plans of FedEx Express to modernize its aircraft fleet and improve its global network. As a consequence of this decision, a noncash impairment charge of $100 million ($63 million, net of tax, or $0.20 per diluted share) was recorded in the FedEx Express segment in the fourth quarter. All of these aircraft were temporarily idled and not in revenue service.
In May 2012, we made the decision to retire from service 18 Airbus A310-200 aircraft and 26 related engines, as well as six Boeing MD10-10 aircraft and 17 related engines. As a consequence of this decision, a noncash impairment charge of $134 million ($84 million, net of tax, or $0.26 per diluted share) was recorded in the FedEx Express segment in the fourth quarter. The decision to retire these aircraft, the majority of which were temporarily idled and not in revenue service, better aligns the U.S. domestic air network capacity of FedEx Express to match current and anticipated shipment volumes.
The combination of our FedEx Freight and FedEx National LTL operations at FedEx Freight (see “FedEx Freight Network Combination” below for additional information).
GOODWILL.Goodwill is recognized for the excess of the purchase price over the fair value of tangible and identifiable intangible net assets of businesses acquired. Several factors give rise to goodwill in our acquisitions, such as the expected benefit from synergies of the combination and the existing workforce of the acquired entity. Goodwill is reviewed at least annually for impairment. In our evaluation of goodwill impairment, bywe perform a qualitative assessment to determine if it is more likely than not that the fair value of a reporting unit is less than its carrying amount. If the qualitative assessment is not conclusive, we would proceed to a two-step process to test goodwill for impairment including comparing the fair value of each reporting unit with its carrying value (including
- 93 -
FEDEX CORPORATION
NOTES TO CONSOLIDATED FINANCIAL STATEMENTS (Continued)
(including attributable goodwill). Fair value for our reporting units is determined using an income or market approach incorporating market participant considerations and management’s assumptions on revenue growth rates, operating margins, discount rates and expected capital expenditures. Fair value determinations may include both internal and third-party valuations. Unless circumstances otherwise dictate, we perform our annual impairment testing in the fourth quarter.
PENSION AND POSTRETIREMENT HEALTHCARE PLANSPLANS.. Our defined benefit plans are measured using actuarial techniques that reflect management’s assumptions for discount rate, expected long-term investment returns on plan assets, salary increases, expected retirement, mortality, employee turnover and future increases in healthcare costs. We determine the discount rate (which is required to be the rate at which the projected benefit obligation could be effectively settled as of the measurement date) with the assistance of actuaries, who calculate the yield on a theoretical portfolio of high-grade corporate bonds (rated Aa or better) with cash flows that are designed to match our expected benefit payments in future years. A calculated-value method is employed for purposes of determining the expected return on the plan asset component of net periodic pension costvalues for our tax-qualified U.S. domestic pension plans (“U.S. Pension Plans”).
The accounting guidance related to employers’ accounting for defined benefit pension and other postretirement plans requires recognition in the balance sheet of the funded status of defined benefit pension and other postretirement benefit plans, and the recognition in other comprehensive income (“OCI”) of unrecognized gains or losses and prior service costs or credits. Additionally, the guidance requires the measurement date for plan assets and liabilities to coincide with the plan sponsor’s year end.
At May 31, 2011,2013, we recorded a decreasean increase to equity through OCI of $350$861 million (net of tax) based primarily on year-end adjustments related to increasesan increase in the value of our projected benefit obligation due to a decreaseplan assets and an increase in the discount rate used to measure the liabilityliabilities at May 31, 2011.2013. At May 31, 2010,2012, we recorded a decrease to equity through OCI of $1.0$2.4 billion (net of tax) based primarily on year-end adjustments related to increases in our projected benefit obligation due to a decrease in the discount rate used to measure the liabilityliabilities at May 31, 2010.
INCOME TAXESTAXES.. Deferred income taxes are provided for the tax effect of temporary differences between the tax basis of assets and liabilities and their reported amounts in the financial statements. The liability method is used to account for income taxes, which requires deferred taxes to be recorded at the statutory rate expected to be in effect when the taxes are paid.
87
We classify interest related to income tax liabilities as interest expense, and if applicable, penalties are recognized as a component of income tax expense. The income tax liabilities and accrued interest and penalties that are due within one year of the balance sheet date are presented as current liabilities. The remaining portion of our income tax liabilities and accrued interest and penalties are presented as noncurrent liabilities because payment of cash is not anticipated within one year of the balance sheet date. These noncurrent income tax liabilities are recorded in the caption “Other liabilities” in the accompanying consolidated balance sheets.
- 94 -
FEDEX CORPORATION
NOTES TO CONSOLIDATED FINANCIAL STATEMENTS (Continued)
SELF-INSURANCE ACCRUALSACCRUALS.. We are self-insured for costs associated with workers’ compensation claims, vehicle accidents and general business liabilities, and benefits paid under employee healthcare programs and long-term disability benefits.programs. Accruals are primarily based on the actuarially estimated, undiscounted cost of claims, which includes incurred-but-not-reported claims. Current workers’ compensation claims, vehicle and general liability, employee healthcare claims and long-term disability are included in accrued expenses. We self-insure up to certain limits that vary by operating company and type of risk. Periodically, we evaluate the level of insurance coverage and adjust insurance levels based on risk tolerance and premium expense.
LEASESLEASES.. We lease certain aircraft, facilities, equipment and vehicles under capital and operating leases. The commencement date of all leases is the earlier of the date we become legally obligated to make rent payments or the date we may exercise control over the use of the property. In addition to minimum rental payments, certain leases provide for contingent rentals based on equipment usage principally related to aircraft leases at FedEx Express and copier usage at FedEx Office. Rent expense associated with contingent rentals is recorded as incurred. Certain of our leases contain fluctuating or escalating payments and rent holiday periods. The related rent expense is recorded on a straight-line basis over the lease term. The cumulative excess of rent payments over rent expense is accounted for as a deferred lease asset and recorded in “Other assets” in the accompanying consolidated balance sheets. The cumulative excess of rent expense over rent payments is accounted for as a deferred lease obligation. Leasehold improvements associated with assets utilized under capital or operating leases are amortized over the shorter of the asset’s useful life or the lease term.
DEFERRED GAINSGAINS.. Gains on the sale and leaseback of aircraft and other property and equipment are deferred and amortized ratably over the life of the lease as a reduction of rent expense. Substantially all of these deferred gains are related to aircraft transactions.
FOREIGN CURRENCY TRANSLATIONTRANSLATION.. Translation gains and losses of foreign operations that use local currencies as the functional currency are accumulated and reported, net of applicable deferred income taxes, as a component of accumulated other comprehensive income within common stockholders’ investment. Transaction gains and losses that arise from exchange rate fluctuations on transactions denominated in a currency other than the local currency are included in the caption “Other, net” in the accompanying consolidated statements of income and were immaterial for each period presented. Cumulative net foreign currency translation gains in accumulated other comprehensive income were $156 million at May 31, 2011, $30 million at May 31, 2010 and $56 million at May 31, 2009.
88
STOCK-BASED COMPENSATIONCOMPENSATION.. We recognize compensation expense for stock-based awards under the provisions of the accounting guidance related to share-based payments. This guidance requires recognition of compensation expense for stock-based awards using a fair value method.
TREASURY SHARES.During 2013, we repurchased 2.7 million shares of FedEx common stock at an average price of $91 per share for a total of $246 million. In March 2013, our Board of Directors authorized the repurchase of up to 10 million shares of common stock. It is expected that the additional share authorization will primarily be utilized to offset the effects of equity compensation dilution over the next several years. As of May 31, 2013, 10,188,000 shares remained under existing share repurchase authorizations.
DIVIDENDS DECLARED PER COMMON SHARESHARE.. On June 6, 2011,3, 2013, our Board of Directors declared a quarterly dividend of $0.13$0.15 per share of common stock. The dividend was paid on July 1, 20112013 to stockholders of record as of the close of business on June 17, 2011.2013. Each quarterly dividend payment is subject to review and approval by our Board of Directors, and we evaluate our dividend payment amount on an annual basis at the end of each fiscal year.
- 95 -
FEDEX FREIGHT NETWORK COMBINATION.CORPORATION
NOTES TO CONSOLIDATED FINANCIAL STATEMENTS (Continued)
BUSINESS REALIGNMENT COSTS. During 2013, we announced profit improvement programs including reducing our selling, general and administrative cost functions through a voluntary employee separation program.
During 2013, we conducted a program to offer voluntary cash buyouts to eligible U.S.-based employees in certain staff functions. The previously announced combinationvoluntary buyout program includes voluntary severance payments and funding to healthcare reimbursement accounts, with the voluntary severance calculated based on four weeks of ourgross base salary for every year of FedEx Freight and FedEx National LTL operationsservice up to a maximum payment of two years of pay. This program was completed on January 30, 2011. Our combined LTL network will increase efficiencies, reduce operational costs and provide customers both Priority and Economy LTL freight services across all lengths of haul from one integrated company. These actions resulted in the following incremental costs, including an impairment charge recorded during 2011. Charges for the year ended May 31, 2011 include the following (in millions):
| 2011 | ||||
| Severance | $ | 40 | ||
| Lease terminations | 20 | |||
| Asset impairments | 29 | |||
| Impairment and other charges | 89 | |||
| Other program costs | 44 | |||
| Total program costs | $ | 133 | ||
We incurred costs of $560 million ($353 million, net of tax, or $1.11 per diluted share) during 2013 associated with our business realignment activities. These costs related primarily to severance for employees who accepted voluntary buyouts in the third and fourth quarters of 2013. Payments will be made at the time of departure. Approximately $180 million was paid under this program during 2013. The cost of the buyout program is included in the caption “Business realignment, impairment and other charges” in our consolidated statements of income. Also included in that caption are not subjectother external costs directly attributable to any material risk of change.
USE OF ESTIMATES. The preparation of our consolidated financial statements requires the use of estimates and assumptions that affect the reported amounts of assets and liabilities, the reported amounts of revenues and expenses and the disclosure of contingent liabilities. Management makes its best estimate of the ultimate outcome for these items based on historical trends and other information available when the financial statements are prepared. Changes in estimates are recognized in accordance with the accounting rules for the estimate, which is typically in the period when new information becomes available to management. Areas where the nature of the estimate makes it reasonably possible that actual results could materially differ from amounts estimated include: self-insurance accruals; retirement plan obligations; long-term incentive accruals; tax liabilities; accounts receivable allowances; obsolescence of spare parts; contingent liabilities; loss contingencies, such as litigation and other claims; and impairment assessments on long-lived assets (including goodwill).
89
New accounting rules and disclosure requirements can significantly impact our reported results and the comparability of our financial statements. We believe the following new accounting guidance is relevant to the readers of our financial statements.
On June 1, 2008,2012, we adopted the authoritative guidance issued by the Financial Accounting Standards Board (“FASB”) on the presentation of comprehensive income. The new guidance requires companies to report components of comprehensive income by including comprehensive income on the face of the income statement or in a separate statement of comprehensive income. We have adopted this guidance by including a separate statement of comprehensive income (loss) for the three years ending May 31, 2013 and by including expanded accumulated other comprehensive income disclosure requirements in the notes to our consolidated financial statements. In addition on June 1, 2012, we adopted the FASB’s amendments to the fair value measurements and disclosure requirements, which provides a common definition of fair value, establishes a uniform framework for measuring fair value and requires expanded disclosures about fair value measurements. On June 1, 2009, we implemented the previously deferred provisions of this guidance for nonfinancial assets and liabilities recorded at fair value, as required. The adoption of this new guidance had no impact on our financial statements.
In June 2011,February 2013, the FASB issued new guidance to make the presentationrequiring additional information about reclassification adjustments out of items within OCI more prominent. The new standard will require companies to present items of net income, items of OCI and total comprehensive income, including changes in one continuous statement or two separate consecutive statements,comprehensive income balances by component and companies will no longer be allowed to presentsignificant items reclassified out of OCI in the statement of stockholders’ equity. Reclassification adjustments between OCI and net income will be presented separately on the face of the financial statements.comprehensive income. This new standard is effective for our fiscal year ending May 31, 2013.
- 96 -
FEDEX CORPORATION
NOTES TO CONSOLIDATED FINANCIAL STATEMENTS (Continued)
In May 2013, the FASB issued a revised exposure draft outlining proposed changes to the accounting for leases. Under the revised exposure draft, the recognition, measurement and presentation of expenses and cash flows arising from a lease would depend primarily on whether the lessee is expected to consume more than an insignificant portion of the economic benefits embedded in the underlying asset. A right-of-use asset and a liability to make lease payments will be recognized on the balance sheet for all leases (except short-term leases). The enactment of this proposal will have a significant impact on our accounting and financial reporting. The FASB has not yet proposed an effective date of this proposal.
We believe there isthat no additionalother new accounting guidance was adopted but not yet effectiveor issued during 2013 that is relevant to the readers of our financial statements. However, there are numerous new proposals under development which, if and when enacted, may have a significant impact on our financial reporting.
NOTE 3: BUSINESS COMBINATIONS
During 2013, we expanded the international service offerings of FedEx Express by completing the following business acquisitions:
Rapidão Cometa Logística e Transporte S.A., a Brazilian transportation and logistics company, for $398 million in cash from operations on July 4, 2012
TATEX, a French express transportation company, for $55 million in cash from operations on July 3, 2012
Opek Sp. z o.o., a Polish domestic express package delivery company, for $54 million in cash from operations on June 13, 2012
These acquisitions give us more robust transportation networks within these countries and added capabilities in these important international markets.
The financial results of these acquired businesses are included in the FedEx Express segment from the date of acquisition and were not material, individually or in the aggregate, to our results of operations and therefore, pro forma financial information has not been presented.
The estimated fair values of the assets and liabilities related to these acquisitions have been recorded in the FedEx Express segment and are included in the accompanying consolidated balance sheet based on an allocation of the purchase prices (summarized in the table below in millions).
Current assets | $ | 145 | ||
Property and equipment | 91 | |||
Goodwill | 351 | |||
Intangible assets | 60 | |||
Other non-current assets | 70 | |||
Current liabilities | (174 | ) | ||
Long-term liabilities | (36 | ) | ||
|
| |||
Total purchase price | $ | 507 | ||
|
|
The goodwill of $351 million is primarily attributable to expected benefits from synergies of the combinations with the existing FedEx Express business and other acquired entities. The portion of the purchase price allocated to goodwill is not deductible for U.S. income tax purposes. The intangible assets acquired consist primarily of customer-related intangible assets, which will be amortized on an accelerated basis over their average estimated useful lives of nine years, with the majority of the amortization recognized during the first five years.
- 97 -
FEDEX CORPORATION
NOTES TO CONSOLIDATED FINANCIAL STATEMENTS (Continued)
On February 22,June 20, 2013, we signed agreements to acquire the businesses operated by our current service provider Supaswift (Pty) Ltd. in five countries in Southern Africa. The acquisition will be funded with cash from operations and is expected to be completed in the second half of 2014, subject to customary closing conditions. The financial results of the acquired businesses will be included in the FedEx Express segment from the date of acquisition and will be immaterial to our 2014 results.
In 2012, we completed our acquisition of Servicios Nacionales Mupa, S.A. de C.V. (MultiPack), a Mexican domestic express package delivery company, for $128 million in cash from operations on July 25, 2011. In 2011, FedEx Express completed the acquisition of the Indian logistics, distribution and express businesses of AFL Pvt. Ltd. and its affiliate Unifreight India Pvt. Ltd. for $96 million in cash.cash from operations on February 22, 2011. The financial results of thethese acquired businesses are included in the FedEx Express segment from the date of acquisition and were not material, individually or in the aggregate, to our results of operations or financial condition.condition and therefore, pro forma financial information has not been presented. Substantially all of the purchase price was allocated to goodwill.
reporting unit.
90
GOODWILL.The carrying amount of goodwill attributable to each reportable operating segment and changes therein are as follows (in millions):
| FedEx Express | FedEx Ground | FedEx Freight | FedEx Services | |||||||||||||||||
| Segment | Segment | Segment | Segment | Total | ||||||||||||||||
| Goodwill at May 31, 2009 | $ | 1,090 | $ | 90 | $ | 802 | $ | 1,539 | $ | 3,521 | ||||||||||
| Accumulated impairment charges | — | — | (115 | ) | (1,177 | ) | (1,292 | ) | ||||||||||||
Balance as of May 31, 2009 | 1,090 | 90 | 687 | 362 | 2,229 | |||||||||||||||
| Impairment charge | — | — | (18 | ) | — | (18 | ) | |||||||||||||
Purchase adjustments and other(1) | (11 | ) | — | — | — | (11 | ) | |||||||||||||
Transfer between segments(2) | 66 | — | (66 | ) | — | — | ||||||||||||||
Balance as of May 31, 2010 | 1,145 | 90 | 603 | 362 | 2,200 | |||||||||||||||
Goodwill acquired(3) | 89 | — | — | — | 89 | |||||||||||||||
Purchase adjustments and other(1) | 38 | — | (1 | ) | — | 37 | ||||||||||||||
Balance as of May 31, 2011 | $ | 1,272 | $ | 90 | $ | 602 | $ | 362 | $ | 2,326 | ||||||||||
Accumulated goodwill impairment charges as of May 31, 2011 | $ | — | $ | — | $ | (133 | ) | $ | (1,177 | ) | $ | (1,310 | ) | |||||||
| FedEx Express Segment | FedEx Ground Segment | FedEx Freight Segment | FedEx Services Segment | Total | ||||||||||||||||
Goodwill at May 31, 2011 | $ | 1,272 | $ | 90 | $ | 735 | $ | 1,539 | $ | 3,636 | ||||||||||
Accumulated impairment charges | — | — | (133 | ) | (1,177 | ) | (1,310 | ) | ||||||||||||
|
|
|
|
|
|
|
|
|
| |||||||||||
Balance as of May 31, 2011 | 1,272 | 90 | 602 | 362 | 2,326 | |||||||||||||||
Goodwill acquired(1) | 104 | — | — | — | 104 | |||||||||||||||
Purchase adjustments and other(2) | (32 | ) | — | — | (11 | ) | (43 | ) | ||||||||||||
|
|
|
|
|
|
|
|
|
| |||||||||||
Balance as of May 31, 2012 | 1,344 | 90 | 602 | 351 | 2,387 | |||||||||||||||
Goodwill acquired(3) | 351 | — | — | — | 351 | |||||||||||||||
Purchase adjustments and other(2) | 20 | — | — | (3 | ) | 17 | ||||||||||||||
|
|
|
|
|
|
|
|
|
| |||||||||||
Balance as of May 31, 2013 | $ | 1,715 | $ | 90 | $ | 602 | $ | 348 | $ | 2,755 | ||||||||||
|
|
|
|
|
|
|
|
|
| |||||||||||
Accumulated goodwill impairment charges as of May 31, 2013 | $ | — | $ | — | $ | (133 | ) | $ | (1,177 | ) | $ | (1,310 | ) | |||||||
|
|
|
|
|
|
|
|
|
| |||||||||||
| (1) | ||
Goodwill acquired in |
| (2) | Primarily currency translation adjustments. |
| (3) | Goodwill acquired in 2013 relates to the acquisitions of transportation companies in Poland, France and Brazil. See Note 3 for related disclosures. |
Our reporting units with significant recorded goodwill include our FedEx Express, FedEx Freight and FedEx Office (reported in the FedEx Services segment) reporting units. We evaluated these reporting units during the fourth quarter of 2011.2013. The estimated fair value of each of these reporting units exceeded their carrying values in 2011,2013 and 2012, and we do not believe that any of these reporting units arewere at risk as of May 31, 2011.
2013.
91
- 98 -
FEDEX CORPORATION
NOTES TO CONSOLIDATED FINANCIAL STATEMENTS (Continued)
NOTE 5: SELECTED CURRENT LIABILITIES
The components of selected current liability captions were as follows (in millions):
| May 31, | ||||||||
| 2011 | 2010 | |||||||
| Accrued Salaries and Employee Benefits | ||||||||
| Salaries | $ | 256 | $ | 230 | ||||
| Employee benefits, including variable compensation | 468 | 386 | ||||||
| Compensated absences | 544 | 530 | ||||||
| $ | 1,268 | $ | 1,146 | |||||
| Accrued Expenses | ||||||||
| Self-insurance accruals | $ | 696 | $ | 675 | ||||
| Taxes other than income taxes | 357 | 347 | ||||||
| Other | 841 | 693 | ||||||
| $ | 1,894 | $ | 1,715 | |||||
| May 31, | ||||||||
| 2013 | 2012 | |||||||
Accrued Salaries and Employee Benefits | ||||||||
Salaries | $ | 489 | $ | 280 | ||||
Employee benefits, including variable compensation | 615 | 803 | ||||||
Compensated absences | 584 | 552 | ||||||
|
|
|
| |||||
| $ | 1,688 | $ | 1,635 | |||||
|
|
|
| |||||
Accrued Expenses | ||||||||
Self-insurance accruals | $ | 796 | $ | 678 | ||||
Taxes other than income taxes | 368 | 386 | ||||||
Other | 768 | 645 | ||||||
|
|
|
| |||||
| $ | 1,932 | $ | 1,709 | |||||
|
|
|
| |||||
92
The components of long-term debt (net of discounts), along with maturity dates for the years subsequent to May 31, 2011,2013, are as follows (in millions):
| May 31, | ||||||||
| 2011 | 2010 | |||||||
| Senior unsecured debt | ||||||||
| Interest rate of 7.25%, due in 2011 | $ | — | $ | 250 | ||||
| Interest rate of 9.65%, due in 2013 | 300 | 300 | ||||||
| Interest rate of 7.38%, due in 2014 | 250 | 250 | ||||||
| Interest rate of 8.00%, due in 2019 | 750 | 750 | ||||||
| Interest rate of 7.60%, due in 2098 | 239 | 239 | ||||||
| 1,539 | 1,789 | |||||||
| Capital lease obligations | 146 | 141 | ||||||
| 1,685 | 1,930 | |||||||
| Less current portion | 18 | 262 | ||||||
| $ | 1,667 | $ | 1,668 | |||||
| May 31, | ||||||||||||
| 2013 | 2012 | |||||||||||
Senior unsecured debt: | ||||||||||||
| Interest Rate % | Maturity | |||||||||||
9.65 | 2013 | $ | — | $ | 300 | |||||||
7.38 | 2014 | 250 | 250 | |||||||||
8.00 | 2019 | 750 | 750 | |||||||||
2.625 | 2023 | 499 | — | |||||||||
2.70 | 2023 | 249 | — | |||||||||
3.875 | 2043 | 493 | — | |||||||||
4.10 | 2043 | 499 | — | |||||||||
7.60 | 2098 | 239 | 239 | |||||||||
|
|
|
| |||||||||
Total senior unsecured debt | 2,979 | 1,539 | ||||||||||
Capital lease obligations | 11 | 128 | ||||||||||
|
|
|
| |||||||||
| 2,990 | 1,667 | |||||||||||
Less current portion | 251 | 417 | ||||||||||
|
|
|
| |||||||||
| $ | 2,739 | $ | 1,250 | |||||||||
|
|
|
| |||||||||
Interest on our fixed-rate notes is paid semi-annually. Long-term debt, exclusive of capital leases, had carrying values of $1.5 billion compared with estimated fair values of $1.9$3.2 billion at May 31, 2011,2013 and $1.8 billion compared with estimated fair values of $2.1$2.0 billion at May 31, 2010.2012. The estimated fair values were determined based on quoted market prices or onand the current rates offered for debt with similar terms and maturities.
- 99 -
FEDEX CORPORATION
NOTES TO CONSOLIDATED FINANCIAL STATEMENTS (Continued)
We have a shelf registration statement filed with the Securities and Exchange Commission that allows us to sell, in one or more future offerings, any combination of our unsecured debt securities and common stock.
In April 2013, we repaid our $250issued $750 million 7.25% unsecured notes that matured on February 15, 2011. During 2010, we repaid our $500 million 5.50% notes that matured on August 15, 2009 using cash from operations and a portion of the proceeds of our January 2009 $1 billion senior unsecured debt offering. under our current shelf registration statement, comprised of $250 million of 2.70% fixed-rate notes due in April 2023 and $500 million of 4.10% fixed-rate notes due in April 2043. We utilized the net proceeds for working capital and general corporate purposes. In July 2012, we issued $1 billion of senior unsecured debt under a then current shelf registration statement, comprised of $500 million of 2.625% fixed-rate notes due in August 2022 and $500 million of 3.875% fixed-rate notes due in August 2042. We utilized the net proceeds for working capital and general corporate purposes.
During 2011,2013, we made principal payments in the amount of $12$116 million related to capital lease obligations. During 2010, we made principal paymentsobligations and repaid our $300 million 9.65% unsecured notes that matured in the amount of $153 million related to capital lease obligations.
A $1 billion revolving credit facility is available to finance our operations and other cash flow needs and to provide support for the issuance of commercial paper. This five-yearOn March 1, 2013, we entered into an amendment to our credit agreement was entered into onto, among other things, extend its maturity date from April 26, 2011, and replaced the $1 billion three-year credit agreement dated July 22, 2009.2016 to March 1, 2018. The agreement contains a financial covenant, which requires us to maintain a leverage ratio of adjusted debt (long-term debt, including the current portion of such debt, plus six times our last four fiscal quarters’ rentals and landing fees) to capital (adjusted debt plus total common stockholders’ investment) that does not exceed 0.7 to 1.0.70%. Our leverage ratio of adjusted debt to capital was 0.551% at May 31, 2011. Under this financial2013. We believe the leverage ratio covenant is our additional borrowing capacity is capped, although thisonly significant restrictive covenant continues to provide us with ample liquidity, if needed.in our revolving credit agreement. Our revolving credit agreement contains other customary covenants that do not, individually or in the aggregate, materially restrict the conduct of our business. We are in compliance with thisthe leverage ratio covenant and all other restrictive covenants of our revolving credit agreement and do not expect the covenants to affect our operations, including our liquidity or borrowing capacity.expected funding needs. As of May 31, 2011,2013, no commercial paper was outstanding, and the entire $1 billion under the revolving credit facility was available for future borrowings.
We issue other financial instruments in the normal course of business to support our operations, including standby letters of credit and surety bonds. We had a total of $619$538 million in letters of credit outstanding at May 31, 2011,2013, with $93$128 million unused under our primary $500 million letter of credit facility, and $460$539 million in outstanding surety bonds placed by third-party insurance providers. These instruments are required under certain U.S. self-insurance programs and are also used in the normal course of international operations. The underlying liabilities insured by these instruments are reflected in our balance sheets, where applicable. Therefore, no additional liability is reflected for the letters of credit and surety bonds themselves.
93
We utilize certain aircraft, land, facilities, retail locations and equipment under capital and operating leases that expire at various dates through 2046. We leased 11%10% of our total aircraft fleet under operating leases as of May 31, 2013 and 10% of our total aircraft fleet under capital orand operating leases as of May 31, 2011 as compared to 12% as of May 31, 2010.2012. A portion of our supplemental aircraft are leased by us under agreements that provide for cancellation upon 30 days’ notice. Our leased facilities include national, regional and metropolitan sorting facilities, retail facilities and administrative buildings.
| May 31, | ||||||||
| 2011 | 2010 | |||||||
| Aircraft | $ | 8 | $ | 15 | ||||
| Package handling and ground support equipment | 165 | 165 | ||||||
| Vehicles | 17 | 17 | ||||||
| Other, principally facilities | 145 | 146 | ||||||
| 335 | 343 | |||||||
| Less accumulated amortization | 307 | 312 | ||||||
| $ | 28 | $ | 31 | |||||
Rent expense under operating leases for the years ended May 31 was as follows (in millions):
| 2011 | 2010 | 2009 | ||||||||||
| Minimum rentals | $ | 2,025 | $ | 2,001 | $ | 2,047 | ||||||
Contingent rentals(1) | 193 | 152 | 181 | |||||||||
| $ | 2,218 | $ | 2,153 | $ | 2,228 | |||||||
| 2013 | 2012 | 2011 | ||||||||||
Minimum rentals | $ | 2,061 | $ | 2,018 | $ | 2,025 | ||||||
Contingent rentals(1) | 192 | 210 | 193 | |||||||||
|
|
|
|
|
| |||||||
| $ | 2,253 | $ | 2,228 | $ | 2,218 | |||||||
|
|
|
|
|
| |||||||
| (1) | Contingent rentals are based on equipment usage. |
94
FEDEX CORPORATION
NOTES TO CONSOLIDATED FINANCIAL STATEMENTS (Continued)
A summary of future minimum lease payments under capital leases and noncancelable operating leases with an initial or remaining term in excess of one year at May 31, 20112013 is as follows (in millions):
| Operating Leases | ||||||||||||||||
| Aircraft | Total | |||||||||||||||
| Capital | and Related | Facilities | Operating | |||||||||||||
| Leases | Equipment | and Other | Leases | |||||||||||||
| 2012 | $ | 25 | $ | 494 | $ | 1,300 | $ | 1,794 | ||||||||
| 2013 | 119 | 499 | 1,155 | 1,654 | ||||||||||||
| 2014 | 2 | 473 | 992 | 1,465 | ||||||||||||
| 2015 | 2 | 455 | 899 | 1,354 | ||||||||||||
| 2016 | 2 | 458 | 734 | 1,192 | ||||||||||||
| Thereafter | 13 | 1,545 | 4,988 | 6,533 | ||||||||||||
| Total | 163 | $ | 3,924 | $ | 10,068 | $ | 13,992 | |||||||||
| Less amount representing interest | 17 | |||||||||||||||
| Present value of net minimum lease payments | $ | 146 | ||||||||||||||
| Operating Leases | ||||||||||||
| Aircraft and Related Equipment | Facilities and Other | Total Operating Leases | ||||||||||
2014 | $ | 462 | $ | 1,474 | $ | 1,936 | ||||||
2015 | 448 | 1,386 | 1,834 | |||||||||
2016 | 453 | 1,183 | 1,636 | |||||||||
2017 | 391 | 1,298 | 1,689 | |||||||||
2018 | 326 | 904 | 1,230 | |||||||||
Thereafter | 824 | 5,826 | 6,650 | |||||||||
|
|
|
|
|
| |||||||
Total | $ | 2,904 | $ | 12,071 | $ | 14,975 | ||||||
|
|
|
|
|
| |||||||
Property and equipment recorded under capital leases and future minimum lease payments under capital leases were immaterial at May 31, 2013. The weighted-average remaining lease term of all operating leases outstanding at May 31, 20112013 was approximately six years. While certain of our lease agreements contain covenants governing the use of the leased assets or require us to maintain certain levels of insurance, none of our lease agreements include material financial covenants or limitations.
FedEx Express makes payments under certain leveraged operating leases that are sufficient to pay principal and interest on certain pass-through certificates. The pass-through certificates are not direct obligations of, or guaranteed by, FedEx or FedEx Express.
We are the lessee in a series of operating leases covering a portion of our leased aircraft. The lessors are trusts established specifically to purchase, finance and lease aircraft to us. These leasing entities meet the criteria for variable interest entities. We are not the primary beneficiary of the leasing entities, as the lease terms are consistent with market terms at the inception of the lease and do not include a residual value guarantee, fixed-price purchase option or similar feature that obligates us to absorb decreases in value or entitles us to participate in increases in the value of the aircraft. As such, we are not required to consolidate the entity as the primary beneficiary. Our maximum exposure under these leases is included in the summary of future minimum lease payments shown above.
NOTE 8: PREFERRED STOCK
Our Certificate of Incorporation authorizes the Board of Directors, at its discretion, to issue up to 4,000,000 shares of preferred stock. The stock is issuable in series, which may vary as to certain rights and preferences, and has no par value. As of May 31, 2011,2013, none of these shares had been issued.
- 101 -
FEDEX CORPORATION
NOTES TO CONSOLIDATED FINANCIAL STATEMENTS (Continued)
NOTE 9: ACCUMULATED OTHER COMPREHENSIVE INCOME (LOSS)
The following table provides changes in accumulated other comprehensive income (loss), net of tax, reported in our financial statements (in millions):
| Foreign currency translation adjustment | Retirement plans adjustments | Accumulated other comprehensive income (loss) | ||||||||||
Balance at May 31, 2010 | $ | 31 | $ | (2,471 | ) | $ | (2,440 | ) | ||||
Other comprehensive gain (loss) | 125 | (235 | ) | (110 | ) | |||||||
|
|
|
|
|
| |||||||
Balance at May 31, 2011 | 156 | (2,706 | ) | (2,550 | ) | |||||||
Other comprehensive gain (loss) | (95 | ) | (2,308 | ) | (2,403 | ) | ||||||
|
|
|
|
|
| |||||||
Balance at May 31, 2012 | 61 | (5,014 | ) | (4,953 | ) | |||||||
Other comprehensive gain (loss) | 41 | 1,092 | 1,133 | |||||||||
|
|
|
|
|
| |||||||
Balance at May 31, 2013 | $ | 102 | $ | (3,922 | ) | $ | (3,820 | ) | ||||
|
|
|
|
|
| |||||||
NOTE 10: STOCK-BASED COMPENSATION
Our total stock-based compensation expense for the years ended May 31 was as follows (in millions):
| 2011 | 2010 | 2009 | ||||||||||
| Stock-based compensation expense | $ | 98 | $ | 101 | $ | 99 | ||||||
| 2013 | 2012 | 2011 | ||||||||||
Stock-based compensation expense | $ | 109 | $ | 105 | $ | 98 | ||||||
95
STOCK OPTIONS. Under the provisions of our incentive stock plans, key employees and non-employee directors may be granted options to purchase shares of our common stock at a price not less than its fair market value on the date of grant. Vesting requirements are determined at the discretion of the Compensation Committee of our Board of Directors. Option-vesting periods range from one to four years, with 83% of our options vesting ratably over four years. Compensation expense associated with these awards is recognized on a straight-line basis over the requisite service period of the award.
RESTRICTED STOCK.Under the terms of our incentive stock plans, restricted shares of our common stock are awarded to key employees. All restrictions on the shares expire ratably over a four-year period. Shares are valued at the market price on the date of award. The terms of our restricted stock provide for continued vesting subsequent to the employee’s retirement. Compensation expense associated with these awards is recognized on a straight-line basis over the shorter of the remaining service or vesting period.
VALUATION AND ASSUMPTIONS. We use the Black-Scholes option pricing model to calculate the fair value of stock options. The value of restricted stock awards is based on the stock price of the award on the grant date. We record stock-based compensation expense in the “Salaries and employee benefits” caption in the accompanying consolidated statements of income.
- 102 -
FEDEX CORPORATION
NOTES TO CONSOLIDATED FINANCIAL STATEMENTS (Continued)
The key assumptions for the Black-Scholes valuation method include the expected life of the option, stock price volatility, a risk-free interest rate, and dividend yield. Many of these assumptions are judgmental and highly sensitive. Following is a table of the weighted-average Black-Scholes value of our stock option grants, the intrinsic value of options exercised (in millions), and the key weighted-average assumptions used in the valuation calculations for the options granted during the years ended May 31, and then a discussion of our methodology for developing each of the assumptions used in the valuation model:
| 2011 | 2010 | 2009 | ||||||||||
| Weighted-average Black-Scholes value | $ | 28.12 | $ | 20.47 | $ | 23.66 | ||||||
| Intrinsic value of options exercised | $ | 80 | $ | 77 | $ | 7 | ||||||
| Black-Scholes Assumptions: | ||||||||||||
| Expected lives | 5.9 years | 5.7 years | 5.5 years | |||||||||
| Expected volatility | 34 | % | 32 | % | 23 | % | ||||||
| Risk-free interest rate | 2.36 | % | 3.24 | % | 3.28 | % | ||||||
| Dividend yield | 0.558 | % | 0.742 | % | 0.492 | % | ||||||
| 2013 | 2012 | 2011 | ||||||||||
Weighted-average Black-Scholes value | $ | 29.20 | $ | 29.92 | $ | 28.12 | ||||||
Intrinsic value of options exercised | $ | 107 | $ | 67 | $ | 80 | ||||||
Black-Scholes Assumptions: | ||||||||||||
Expected lives | 6.1 years | 6.0 years | 5.9 years | |||||||||
Expected volatility | 35 | % | 34 | % | 34 | % | ||||||
Risk-free interest rate | 0.94 | % | 1.79 | % | 2.36 | % | ||||||
Dividend yield | 0.609 | % | 0.563 | % | 0.558 | % | ||||||
The expected life represents an estimate of the period of time over which the options granted are expected to remain outstanding. Options granted have a maximum term of 10 years. Weoutstanding, and we examine actual stock option exercises to determine the expected life of the options. An increase inOptions granted have a maximum term of 10 years. Expected volatilities are based on the expected term will increase compensation expense.
96
| Stock Options | ||||||||||||||||
| Weighted- | ||||||||||||||||
| Weighted- | Average | |||||||||||||||
| Average | Remaining | Aggregate | ||||||||||||||
| Exercise | Contractual | Intrinsic Value | ||||||||||||||
| Shares | Price | Term | (in millions)(1) | |||||||||||||
| Outstanding at June 1, 2010 | 20,238,056 | $ | 78.32 | |||||||||||||
| Granted | 2,474,603 | 81.86 | ||||||||||||||
| Exercised | (2,043,050 | ) | 53.13 | |||||||||||||
| Forfeited | (506,446 | ) | 104.38 | |||||||||||||
| Outstanding at May 31, 2011 | 20,163,163 | $ | 81.20 | 5.7 years | $ | 327 | ||||||||||
| Exercisable | 12,968,690 | $ | 84.74 | 4.3 years | $ | 181 | ||||||||||
| Expected to vest | 6,618,915 | $ | 74.83 | 8.2 years | $ | 135 | ||||||||||
| Available for future grants | 11,928,567 | |||||||||||||||
| Stock Options | ||||||||||||||||
| Shares | Weighted- Average Exercise Price | Weighted- Average Remaining Contractual Term | Aggregate Intrinsic Value (in millions)(1) | |||||||||||||
Outstanding at June 1, 2012 | 21,031,538 | $ | 84.39 | |||||||||||||
|
| |||||||||||||||
Granted | 2,547,290 | 88.08 | ||||||||||||||
Exercised | (3,979,359 | ) | 70.41 | |||||||||||||
Forfeited | (464,035 | ) | 91.44 | |||||||||||||
|
| |||||||||||||||
Outstanding at May 31, 2013 | 19,135,434 | $ | 87.62 | 5.5 years | $ | 229 | ||||||||||
|
|
|
| |||||||||||||
Exercisable | 12,447,517 | $ | 90.23 | 4.2 years | $ | 137 | ||||||||||
|
|
|
| |||||||||||||
Expected to vest | 6,288,642 | $ | 82.77 | 8.1 years | $ | 87 | ||||||||||
|
|
|
| |||||||||||||
Available for future grants | 6,482,410 | |||||||||||||||
|
| |||||||||||||||
| (1) | Only presented for options with market value at May 31, |
The options granted during the year ended May 31, 20112013 are primarily related to our principal annual stock option grant in June 2010.
- 103 -
FEDEX CORPORATION
NOTES TO CONSOLIDATED FINANCIAL STATEMENTS (Continued)
The following table summarizes information about vested and unvested restricted stock for the year ended May 31, 2011:
| Restricted Stock | ||||||||
| Weighted- | ||||||||
| Average | ||||||||
| Grant Date | ||||||||
| Shares | Fair Value | |||||||
| Unvested at June 1, 2010 | 637,296 | $ | 74.02 | |||||
| Granted | 235,998 | 78.74 | ||||||
| Vested | (234,716 | ) | 81.11 | |||||
| Forfeited | (12,198 | ) | 70.91 | |||||
| Unvested at May 31, 2011 | 626,380 | $ | 73.20 | |||||
| Restricted Stock | ||||||||
| Shares | Weighted- Average Grant Date Fair Value | |||||||
Unvested at June 1, 2012 | 589,872 | $ | 76.79 | |||||
|
| |||||||
Granted | 220,391 | 85.45 | ||||||
Vested | (253,423 | ) | 75.46 | |||||
Forfeited | (27,506 | ) | 80.13 | |||||
|
| |||||||
Unvested at May 31, 2013 | 529,334 | $ | 80.86 | |||||
|
| |||||||
During the year ended May 31, 2010,2012, there were 391,786214,435 shares of restricted stock granted with a weighted-average fair value of $57.07.$88.95. During the year ended May 31, 2009,2011, there were 197,180235,998 shares of restricted stock granted with a weighted-average fair value of $90.57.
$78.74.
97
| Stock Options | ||||||||
| Vested during | Fair value | |||||||
| the year | (in millions) | |||||||
| 2009 | 2,414,815 | $ | 64 | |||||
| 2010 | 2,296,211 | 63 | ||||||
| 2011 | 2,721,602 | 67 | ||||||
| Stock Options | ||||||||
| Vested during the year | Fair value (in millions) | |||||||
2013 | 2,824,757 | $ | 81 | |||||
2012 | 2,807,809 | 70 | ||||||
2011 | 2,721,602 | 67 | ||||||
As of May 31, 2011,2013, there was $132$133 million of total unrecognized compensation cost, net of estimated forfeitures, related to unvested share-based compensation arrangements. This compensation expense is expected to be recognized on a straight-line basis over the remaining weighted-average vesting period of approximately two years.
Total shares outstanding or available for grant related to equity compensation at May 31, 20112013 represented 10%8% of the total outstanding common and equity compensation shares and equity compensation shares available for grant.
- 104 -
FEDEX CORPORATION
NOTES TO CONSOLIDATED FINANCIAL STATEMENTS (Continued)
NOTE 10:11: COMPUTATION OF EARNINGS PER SHARE
The calculation of basic and diluted earnings per common share for the years ended May 31 was as follows (in millions, except per share amounts):
| 2011 | 2010 | 2009 | ||||||||||
Basic earnings per common share: | ||||||||||||
Net earnings allocable to common shares(1) | $ | 1,449 | $ | 1,182 | $ | 97 | ||||||
| Weighted-average common shares | 315 | 312 | 311 | |||||||||
Basic earnings per common share | $ | 4.61 | $ | 3.78 | $ | 0.31 | ||||||
Diluted earnings per common share: | ||||||||||||
Net earnings allocable to common shares(1) | $ | 1,449 | $ | 1,182 | $ | 97 | ||||||
| Weighted-average common shares | 315 | 312 | 311 | |||||||||
| Dilutive effect of share-based awards | 2 | 2 | 1 | |||||||||
| Weighted-average diluted shares | 317 | 314 | 312 | |||||||||
Diluted earnings per common share | $ | 4.57 | $ | 3.76 | $ | 0.31 | ||||||
| Anti-dilutive options excluded from diluted earnings per common share | 9.3 | 11.5 | 12.6 | |||||||||
| 2013 | 2012 | 2011 | ||||||||||
Basic earnings per common share: | ||||||||||||
Net earnings allocable to common shares(1) | $ | 1,558 | $ | 2,029 | $ | 1,449 | ||||||
Weighted-average common shares | 315 | 315 | 315 | |||||||||
|
|
|
|
|
| |||||||
Basic earnings per common share | $ | 4.95 | $ | 6.44 | $ | 4.61 | ||||||
|
|
|
|
|
| |||||||
Diluted earnings per common share: | ||||||||||||
Net earnings allocable to common shares(1) | $ | 1,558 | $ | 2,029 | $ | 1,449 | ||||||
|
|
|
|
|
| |||||||
Weighted-average common shares | 315 | 315 | 315 | |||||||||
Dilutive effect of share-based awards | 2 | 2 | 2 | |||||||||
|
|
|
|
|
| |||||||
Weighted-average diluted shares | 317 | 317 | 317 | |||||||||
Diluted earnings per common share | $ | 4.91 | $ | 6.41 | $ | 4.57 | ||||||
|
|
|
|
|
| |||||||
Anti-dilutive options excluded from diluted earnings per common share | 11.1 | 12.6 | 9.3 | |||||||||
|
|
|
|
|
| |||||||
| (1) | Net earnings available to participating securities were immaterial in all periods presented. |
98
The components of the provision for income taxes for the years ended May 31 were as follows (in millions):
| 2011 | 2010 | 2009 | ||||||||||
| Current provision (benefit) | ||||||||||||
| Domestic: | ||||||||||||
| Federal | $ | 79 | $ | 36 | $ | (35 | ) | |||||
| State and local | 48 | 54 | 18 | |||||||||
| Foreign | 198 | 207 | 214 | |||||||||
| 325 | 297 | 197 | ||||||||||
| Deferred provision (benefit) | ||||||||||||
| Domestic: | ||||||||||||
| Federal | 485 | 408 | 327 | |||||||||
| State and local | 12 | 15 | 48 | |||||||||
| Foreign | (9 | ) | (10 | ) | 7 | |||||||
| 488 | 413 | 382 | ||||||||||
| $ | 813 | $ | 710 | $ | 579 | |||||||
| 2013 | 2012 | 2011 | ||||||||||
Current provision (benefit) | ||||||||||||
Domestic: | ||||||||||||
Federal | $ | 512 | $ | (120 | ) | $ | 79 | |||||
State and local | 86 | 80 | 48 | |||||||||
Foreign | 170 | 181 | 198 | |||||||||
|
|
|
|
|
| |||||||
| 768 | 141 | 325 | ||||||||||
|
|
|
|
|
| |||||||
Deferred provision (benefit) | ||||||||||||
Domestic: | ||||||||||||
Federal | 175 | 947 | 485 | |||||||||
State and local | (7 | ) | 21 | 12 | ||||||||
Foreign | (42 | ) | — | (9 | ) | |||||||
|
|
|
|
|
| |||||||
| 126 | 968 | 488 | ||||||||||
|
|
|
|
|
| |||||||
| $ | 894 | $ | 1,109 | $ | 813 | |||||||
|
|
|
|
|
| |||||||
Our current federal income tax expenses in 2011, 2010,2013, 2012 and 20092011 were significantly reduced by accelerated depreciation deductions we claimed under provisions of the American Taxpayer Relief Act of 2013 and the Tax Relief and the Small Business Jobs Acts of 2010, the American Recovery and Reinvestment Tax Act of 2009, and the Economic Stimulus Act of 2008.2010. Those acts,Acts, designed to stimulate new business investment in the U.S., accelerated our depreciation deductions for new qualifying investments, such as our new Boeing 777 freighterFreighter (“B777F”) aircraft. These arewere timing benefits only, in that the depreciation would have otherwise been recognizedaccelerated into an earlier year is foregone in later years.
- 105 -
FEDEX CORPORATION
NOTES TO CONSOLIDATED FINANCIAL STATEMENTS (Continued)
Pre-tax (loss) earnings of foreign operations for 2013, 2012 and 2011 2010were $(55) million, $358 million and 2009 were $472 million, $555 million and $106 million, respectively, whichrespectively. These amounts represent only a portion of total results associated with international shipments.
A reconciliation of the statutory federal income tax rate to the effective income tax rate for the years ended May 31 was as follows:
| 2011 | 2010 | 2009 | ||||||||||
| Statutory U.S. income tax rate | 35.0 | % | 35.0 | % | 35.0 | % | ||||||
| Increase resulting from: | ||||||||||||
| Goodwill impairment | — | — | 48.0 | |||||||||
| State and local income taxes, net of federal benefit | 1.7 | 2.4 | 1.9 | |||||||||
| Other, net | (0.8 | ) | 0.1 | 0.7 | ||||||||
| Effective tax rate | 35.9 | % | 37.5 | % | 85.6 | % | ||||||
| 2013 | 2012 | 2011 | ||||||||||
Statutory U.S. income tax rate | 35.0 | % | 35.0 | % | 35.0 | % | ||||||
Increase (decrease) resulting from: | ||||||||||||
State and local income taxes, net of federal benefit | 2.1 | 2.1 | 1.7 | |||||||||
Other, net | (0.7 | ) | (1.8 | ) | (0.8 | ) | ||||||
|
|
|
|
|
| |||||||
Effective tax rate | 36.4 | % | 35.3 | % | 35.9 | % | ||||||
|
|
|
|
|
| |||||||
Our 20112012 rate was lower than our 2010 rate primarily due to increased permanently reinvested foreign earnings and a lower state tax rate driven principally by favorable audit and legislative developments. Our 2009 rate was significantlyfavorably impacted by goodwill impairment charges that are not deductible forthe conclusion of the IRS audit of our 2007-2009 consolidated income tax purposes.
returns.
99
| 2011 | 2010 | |||||||||||||||
| Deferred Tax | Deferred Tax | Deferred Tax | Deferred Tax | |||||||||||||
| Assets | Liabilities | Assets | Liabilities | |||||||||||||
| Property, equipment, leases and intangibles | $ | 274 | $ | 2,675 | $ | 377 | $ | 2,157 | ||||||||
| Employee benefits | 1,016 | 34 | 783 | 36 | ||||||||||||
| Self-insurance accruals | 519 | — | 416 | — | ||||||||||||
| Other | 422 | 269 | 490 | 238 | ||||||||||||
| Net operating loss/credit carryforwards | 172 | — | 142 | — | ||||||||||||
| Valuation allowances | (151 | ) | — | (139 | ) | — | ||||||||||
| $ | 2,252 | $ | 2,978 | $ | 2,069 | $ | 2,431 | |||||||||
| 2013 | 2012 | |||||||||||||||
| Deferred Tax Assets | Deferred Tax Liabilities | Deferred Tax Assets | Deferred Tax Liabilities | |||||||||||||
Property, equipment, leases and intangibles | $ | 157 | $ | 3,676 | $ | 248 | $ | 3,436 | ||||||||
Employee benefits | 1,771 | 11 | 2,300 | 11 | ||||||||||||
Self-insurance accruals | 533 | — | 495 | — | ||||||||||||
Other | 251 | 238 | 338 | 271 | ||||||||||||
Net operating loss/credit carryforwards | 298 | — | 179 | — | ||||||||||||
Valuation allowances | (204 | ) | — | (145 | ) | — | ||||||||||
|
|
|
|
|
|
|
| |||||||||
| $ | 2,806 | $ | 3,925 | $ | 3,415 | $ | 3,718 | |||||||||
|
|
|
|
|
|
|
| |||||||||
The net deferred tax liabilities as of May 31 have been classified in the balance sheets as follows (in millions):
| 2011 | 2010 | |||||||
| Current deferred tax asset | $ | 610 | $ | 529 | ||||
| Noncurrent deferred tax liability | (1,336 | ) | (891 | ) | ||||
| $ | (726 | ) | $ | (362 | ) | |||
| 2013 | 2012 | |||||||
Current deferred tax asset | $ | 533 | $ | 533 | ||||
Noncurrent deferred tax liability | (1,652 | ) | (836 | ) | ||||
|
|
|
| |||||
| $ | (1,119 | ) | $ | (303 | ) | |||
|
|
|
| |||||
We have $484$940 million of net operating loss carryovers in various foreign jurisdictions and $524$500 million of state operating loss carryovers. The valuation allowances primarily represent amounts reserved for operating loss and tax credit carryforwards, which expire over varying periods starting in 2012.2014. As a result of this and other factors, we believe that a substantial portion of these deferred tax assets may not be realized.
Permanently reinvested earnings of our foreign subsidiaries amounted to $640 million$1.3 billion at the end of 20112013 and $325 million$1 billion at the end of 2010.2012. We have not recognized deferred taxes for U.S. federal income tax purposes on the unremitted earnings of our foreign subsidiaries that are permanently reinvested.those earnings. In 2011,2013, our permanent reinvestment strategy with respect to unremitted earnings of our foreign subsidiaries provided a 1.3%1.2% benefit to our effective tax rate. Were the earnings to be distributed, in the form of dividends or otherwise, these unremitted earnings wouldcould be subject to U.S. federal income tax and non-U.S. withholding taxes. Unrecognized foreign tax credits potentially wouldcould be available to reduce a portion of the any
- 106 -
FEDEX CORPORATION
NOTES TO CONSOLIDATED FINANCIAL STATEMENTS (Continued)
U.S. tax liability. Determination of the amount of unrecognized deferred U.S. income tax liability is not practicable due to uncertainties related to the timing and source of any potential distribution of such funds, along with other important factors such as the amount of associated foreign tax credits. As of May 31, 2011, we had $300 million of cashCash in offshore jurisdictions associated with our permanent reinvestment strategy.
In 2013, more than 85% of our total enterprise-wide income tax returnswas earned in U.S. companies of FedEx that are taxable in the United States. As a U.S., airline, our FedEx Express unit is required by Federal Aviation Administration and other rules to conduct its air operations, domestic and international, through a U.S. company. However, we serve more than 220 countries and territories around the world, and are required to establish legal entities in many of them. Most of our entities in those countries are operating entities, engaged in picking up and delivering packages and performing other transportation services. In the meantime, we are continually expanding our global network to meet our customers’ needs, which requires increasing investment outside the U.S. We typically use cash generated overseas to fund these investments and have a foreign holding company which manages our investments in several foreign operating companies, including new acquisitions made in 2013 in Poland, France and Brazil.
We are subject to taxation in the U.S. and various U.S. state and local jurisdictions, and various foreign jurisdictions. The Internal Revenue Service is currently auditing our consolidated U.S. income tax returns for the 2007 through 2009 tax years. We are no longer subject to U.S. federal income tax examination for years through 2006 except for specific U.S. federal income tax positions that are in various stages of appeal and/or litigation. No resolution date can be reasonably estimated at this time for these appeals and litigation, but their resolution is not expected to have a material effect on our consolidated financial statements. We are also subject to ongoing audits in state, local and foreign jurisdictions. We are currently under examination by the IRS for the 2010 and 2011 tax jurisdictions throughoutyears. It is reasonably possible that certain income tax return proceedings will be completed during the world.
next 12 months and could result in a change in our balance of unrecognized tax benefits. The expected impact of any changes would not be material to our consolidated financial statements.
100
| 2011 | 2010 | 2009 | ||||||||||
| Balance at beginning of year | $ | 82 | $ | 72 | $ | 88 | ||||||
| Increases for tax positions taken in the current year | 2 | 3 | 7 | |||||||||
| Increases for tax positions taken in prior years | 6 | 14 | 10 | |||||||||
| Decreases for tax positions taken in prior years | (10 | ) | (4 | ) | (30 | ) | ||||||
| Settlements | (11 | ) | (3 | ) | (3 | ) | ||||||
| Balance at end of year | $ | 69 | $ | 82 | $ | 72 | ||||||
| 2013 | 2012 | 2011 | ||||||||||
Balance at beginning of year | $ | 51 | $ | 69 | $ | 82 | ||||||
Increases for tax positions taken in the current year | 1 | 2 | 2 | |||||||||
Increases for tax positions taken in prior years | 3 | 4 | 6 | |||||||||
Decreases for tax positions taken in prior years | (3 | ) | (35 | ) | (10 | ) | ||||||
Settlements | (9 | ) | (3 | ) | (11 | ) | ||||||
Increases due to acquisitions | 4 | 15 | — | |||||||||
Decrease from lapse of statute of limitations | (2 | ) | — | — | ||||||||
Changes due to currency translation | 2 | (1 | ) | — | ||||||||
|
|
|
|
|
| |||||||
Balance at end of year | $ | 47 | $ | 51 | $ | 69 | ||||||
|
|
|
|
|
| |||||||
Our liabilities recorded for uncertain tax positions include $56$42 million at May 31, 20112013 and $67$47 million at May 31, 20102012 associated with positions that if favorably resolved would provide a benefit to our effective tax rate. We classify interest related to income tax liabilities as interest expense, and if applicable, penalties are recognized as a component of income tax expense. The balance of accrued interest and penalties was $18$29 million on both May 31, 20112013 and $20 million on May 31, 2010.2012. Total interest and penalties included in our consolidated statements of income are immaterial. Included in the 2011 and 2010 balances are $9 million of tax positions for which the ultimate deductibility or income inclusion is certain but for which there may be uncertainty about the timing of such deductibility or income inclusion.
It is difficult to predict the ultimate outcome or the timing of resolution for tax positions. Changes may result from the conclusion of ongoing audits, appeals or litigation in state, local, federal and foreign tax jurisdictions, or from the resolution of various proceedings between the U.S. and foreign tax authorities. Our liability for uncertain tax positions includes no matters that are individually or collectively material to us. It is reasonably possible that the amount of the benefit with respect to certain of our unrecognized tax positions will increase or decrease within the next 12 months, but an estimate of the range of the reasonably possible changes cannot be made. However, we do not expect that the resolution of any of our uncertain tax positions will be material.
- 107 -
FEDEX CORPORATION
NOTES TO CONSOLIDATED FINANCIAL STATEMENTS (Continued)
NOTE 12:13: RETIREMENT PLANS
We sponsor programs that provide retirement benefits to most of our employees. These programs include defined benefit pension plans, defined contribution plans and postretirement healthcare plans. The accounting for pension and postretirement healthcare plans includes numerous assumptions, such as: discount rates; expected long-term investment returns on plan assets; future salary increases; employee turnover; mortality; and retirement ages. These assumptions most significantly impact our U.S. Pension Plans.
The accounting guidance related to postretirement benefits requires recognition in the balance sheet of the funded status of defined benefit pension and other postretirement benefit plans, and the recognition in accumulated other comprehensive income (“AOCI”) of unrecognized gains or losses and prior service costs or credits. The funded status is measured as the difference between the fair value of the plan’s assets and the projected benefit obligation (“PBO”) of the plan. AtWe recorded an increase to equity of $861 million (net of tax) at May 31, 2011, we recorded2013, and a decrease to equity of $350 million (net of tax) attributable to our plans. At May 31, 2010, we recorded a decrease to equity of $1$2.4 billion (net of tax) at May 31, 2012, attributable to reflect unrealized actuarial losses during 2010.
A summary of our retirement plans costs over the past three years is as follows (in millions):
| 2011 | 2010 | 2009 | ||||||||||
| U.S. domestic and international pension plans | $ | 543 | $ | 308 | $ | 177 | ||||||
| U.S. domestic and international defined contribution plans | 257 | 136 | 237 | |||||||||
| Postretirement healthcare plans | 60 | 42 | 57 | |||||||||
| $ | 860 | $ | 486 | $ | 471 | |||||||
| 2013 | 2012 | 2011 | ||||||||||
U.S. domestic and international pension plans | $ | 679 | $ | 524 | $ | 543 | ||||||
U.S. domestic and international defined contribution plans | 354 | 338 | 257 | |||||||||
U.S. domestic and international postretirement healthcare plans | 78 | 70 | 60 | |||||||||
|
|
|
|
|
| |||||||
| $ | 1,111 | $ | 932 | $ | 860 | |||||||
|
|
|
|
|
| |||||||
101
POSTRETIREMENT HEALTHCARE PLANS. Certain of our subsidiaries offer medical, dental and vision coverage to eligible U.S. retirees and their eligible dependents. U.S. employees covered by the principal plan become eligible for these benefits at age 55 and older, if they have permanent, continuous service of at least 10 years after attainment of age 45 if hired prior to January 1, 1988, or at least 20 years after attainment of age 35 if hired on or after January 1, 1988. Postretirement healthcare benefits are capped at 150% of the 1993 per capita projected employer cost, which has been reached and, therefore, these benefits are not subject to additional future inflation.
PENSION PLAN ASSUMPTIONS.Our pension cost is materially affected by the discount rate used to measure pension obligations, the level of plan assets available to fund those obligations and the expected long-term rate of return on plan assets.
- 108 -
FEDEX CORPORATION
NOTES TO CONSOLIDATED FINANCIAL STATEMENTS (Continued)
We use a measurement date of May 31 for our pension and postretirement healthcare plans. Management reviews the assumptions used to measure pension costs on an annual basis. Economic and market conditions at the measurement date impact these assumptions from year to year and it is reasonably possible that material changes in pension cost may be experienced in the future.year. Actuarial gains or losses are generated for changes in assumptions and to the extent that actual results differ from those assumed. These actuarial gains and losses are amortized over the remaining average service lives of our active employees if they exceed a corridor amount in the aggregate. Additional information about our pension plans can be found in the Critical Accounting Estimates section of Management’s Discussion and Analysis of Results of Operations and Financial Condition (“MD&A”) in this Annual Report on Form 10-K (“Annual Report”).
Weighted-average actuarial assumptions for our primary U.S. retirement plans, which represent substantially all of our PBO and accumulated postretirement benefit obligation (“APBO”), are as follows:
| Pension Plans | Postretirement Healthcare Plans | |||||||||||||||||||||||
| 2011 | 2010 | 2009 | 2011 | 2010 | 2009 | |||||||||||||||||||
| Discount rate used to determine benefit obligation | 5.76 | % | 6.37 | % | 7.68 | % | 5.67 | % | 6.11 | % | 7.27 | % | ||||||||||||
| Discount rate used to determine net periodic benefit cost | 6.37 | 7.68 | 7.15 | 6.11 | 7.27 | 7.13 | ||||||||||||||||||
| Rate of increase in future compensation levels used to determine benefit obligation | 4.58 | 4.63 | 4.42 | — | — | — | ||||||||||||||||||
| Rate of increase in future compensation levels used to determine net periodic benefit cost | 4.63 | 4.42 | 4.49 | — | — | — | ||||||||||||||||||
| Expected long-term rate of return on assets | 8.00 | 8.00 | 8.50 | — | — | — | ||||||||||||||||||
| Pension Plans | Postretirement Healthcare Plans | |||||||||||||||||||||||
| 2013 | 2012 | 2011 | 2013 | 2012 | 2011 | |||||||||||||||||||
Discount rate used to determine benefit obligation | 4.79 | % | 4.44 | % | 5.76 | % | 4.91 | % | 4.55 | % | 5.67 | % | ||||||||||||
Discount rate used to determine net periodic benefit cost | 4.44 | 5.76 | 6.37 | 4.55 | 5.67 | 6.11 | ||||||||||||||||||
Rate of increase in future compensation levels used to determine benefit obligation | 4.54 | 4.62 | 4.58 | — | — | — | ||||||||||||||||||
Rate of increase in future compensation levels used to determine net periodic benefit cost | 4.62 | 4.58 | 4.63 | — | — | — | ||||||||||||||||||
Expected long-term rate of return on assets | 8.00 | 8.00 | 8.00 | — | — | — | ||||||||||||||||||
102
the duration of our pension plan liabilities, which drives the investment strategy we can employ with our pension plan assets;
the types of investment classes in which we invest our pension plan assets and the expected compound geometric return we can reasonably expect those investment classes to earn over time; and
the investment returns we can reasonably expect our investment management program to achieve in excess of the returns we could expect if investments were made strictly in indexed funds.
Our estimatedexpected long-term rate of return on plan assets remains atwas 8% for 2013, 2012 consistent with our expected rate ofand 2011. Our actual return in 2011 and 2010.each of the past three years exceeded that amount for our principal U.S. domestic pension plan. For the 15-year period ended May 31, 2011,2013, our actual returns were 7.8%6.9%.
Pension expense is also affected by the accounting policy used to determine the value of plan assets at the measurement date. We use a calculated-value method to determine the value of plan assets, which helps mitigate short-term volatility in market performance (both increases and decreases) by amortizing certain actuarial gains or losses over a period no longer than four years. Another method used in practice applies the market value of plan assets at the measurement date. For purposes of valuing plan assets for determining 2014 pension expense, the calculated value method resulted in the same value as the market value, as it did in 2013. For determining 2012 pension expense, we used the calculated-valuecalculated value method aswhich resulted in a portion of the asset gain in 2011 being deferred to future years because our actual returns on plan assets significantly exceeded our assumptions. However, as previously indicated, our pension costs in 2012 are expected to remain flat. The calculated-value method resulted in the same value as the market value in 2011. The calculated-value method significantly mitigated the impact of asset value declines in the determination of our 2010 pension expense, reducing our 2010 expense by approximately $135 million.
- 109 -
FEDEX CORPORATION
NOTES TO CONSOLIDATED FINANCIAL STATEMENTS (Continued)
The investment strategy for pension plan assets is to utilize a diversified mix of global public and private equity portfolios, together with fixed-income portfolios, to earn a long-term investment return that meets our pension plan obligations. Our pension plan assets are invested primarily in listedpublicly tradeable securities, and our pension plans hold only a minimal investment in FedEx common stock that is entirely at the discretion of third-party pension fund investment managers. Our largest holding classes are U.S. Large Cap Equities, which is indexed to anthe S&P 500 fund,Index, Corporate Fixed Income Securities and Corporate and U.S. Government Fixed Income Securities. Accordingly, we do not have any significant concentrations of risk. Active management strategies are utilized within the plan in an effort to realize investment returns in excess of market indices. As part of our strategy to manage future pension costs and net funded status volatility, we have transitioned to a liability-driven investment strategy with a greater concentration of fixed-income securities to better align plan assets with liabilities. Our investment strategy also includes the limited use of derivative financial instruments on a discretionary basis to improve investment returns and manage exposure to market risk. In all cases, our investment managers are prohibited from using derivatives for speculative purposes and are not permitted to use derivatives to leverage a portfolio.
103
| • | Cash and cash equivalents. These Level 1 investments include cash, cash equivalents and foreign currency valued using exchange rates. The Level 2 investments include commingled funds valued using the net asset value. |
| • | Domestic and international equities. These Level 1 investments are valued at the closing price or last trade reported on the major market on which the individual securities are traded. The Level 2 investments are commingled funds valued using the net asset value. |
| • | Private equity. The valuation of these Level 3 investments requires significant judgment due to the absence of quoted market prices, the inherent lack of liquidity and the long-term nature of such assets. Investments are valued based upon recommendations of our investment managers incorporating factors such as contributions and distributions, market transactions, market comparables and performance multiples. |
| • | Fixed income. We determine the fair value of these Level 2 corporate bonds, U.S. and non-U.S. government securities and other fixed income securities by using bid evaluation pricing models or quoted prices of securities with similar characteristics. |
104
FEDEX CORPORATION
NOTES TO CONSOLIDATED FINANCIAL STATEMENTS (Continued)
The fair values of investments by level and asset category and the weighted-average asset allocations for our domestic pension plans at the measurement date are presented in the following table (in millions):
| Plan Assets at Measurement Date | ||||||||||||||||||||||||
| 2011 | ||||||||||||||||||||||||
| Quoted Prices in | Other Observable | Unobservable | ||||||||||||||||||||||
| Active Markets | Inputs | Inputs | ||||||||||||||||||||||
| Asset Class | Fair Value | Actual % | Target % | Level 1 | Level 2 | Level 3 | ||||||||||||||||||
| Cash and cash equivalents | $ | 409 | 3 | % | 1 | % | $ | 107 | $ | 302 | ||||||||||||||
| Domestic equities | ||||||||||||||||||||||||
| U.S. large cap equity | 4,280 | 27 | 24 | 26 | 4,254 | |||||||||||||||||||
| U.S. SMID cap equity | 1,481 | 10 | 9 | 1,481 | ||||||||||||||||||||
| International equities | 2,013 | 13 | 12 | 1,702 | 311 | |||||||||||||||||||
| Private equities | 403 | 3 | 5 | $ | 403 | |||||||||||||||||||
| Fixed income securities | 49 | |||||||||||||||||||||||
| Corporate | 3,794 | 24 | 3,794 | |||||||||||||||||||||
| U.S. government | 3,135 | 20 | 3,135 | |||||||||||||||||||||
| Mortgage backed and other | 66 | — | 66 | |||||||||||||||||||||
| Other | (63 | ) | — | — | (59 | ) | (4 | ) | ||||||||||||||||
| $ | 15,518 | 100 | % | 100 | % | $ | 3,257 | $ | 11,858 | $ | 403 | |||||||||||||
| 2010 | ||||||||||||||||||||||||
| Quoted Prices in | Other Observable | Unobservable | ||||||||||||||||||||||
| Active Markets | Inputs | Inputs | ||||||||||||||||||||||
| Asset Class | Fair Value | Actual % | Target % | Level 1 | Level 2 | Level 3 | ||||||||||||||||||
| Cash and cash equivalents | $ | 427 | 3 | % | 1 | % | $ | 145 | $ | 282 | ||||||||||||||
| Domestic equities | ||||||||||||||||||||||||
| U.S. large cap equity | 3,374 | 26 | 24 | 3,374 | ||||||||||||||||||||
| U.S. SMID cap equity | 1,195 | 9 | 9 | 1,195 | ||||||||||||||||||||
| International equities | 1,502 | 12 | 12 | 1,262 | 240 | |||||||||||||||||||
| Private equities | 399 | 3 | 5 | $ | 399 | |||||||||||||||||||
| Fixed income securities | 49 | |||||||||||||||||||||||
| Corporate | 3,546 | 27 | 3,546 | |||||||||||||||||||||
| U.S. government | 2,537 | 19 | 2,537 | |||||||||||||||||||||
| Mortgage backed and other | 122 | 1 | 122 | |||||||||||||||||||||
| Other | (47 | ) | — | — | (46 | ) | (1 | ) | ||||||||||||||||
| $ | 13,055 | 100 | % | 100 | % | $ | 2,556 | $ | 10,100 | $ | 399 | |||||||||||||
| Plan Assets at Measurement Date | ||||||||||||||||||||||
| 2013 | ||||||||||||||||||||||
Asset Class | Fair Value | Actual % | Target Range % | Quoted Prices in Active Markets Level 1 | Other Observable Inputs Level 2 | Unobservable Inputs Level 3 | ||||||||||||||||
Cash and cash equivalents | $ | 456 | 2 | % | 0 - 5% | $ | 15 | $ | 441 | |||||||||||||
Equities | 35 - 55 | |||||||||||||||||||||
U.S. large cap equity | 5,264 | 28 | 37 | 5,227 | ||||||||||||||||||
U.S. SMID cap equity | 1,741 | 9 | 1,741 | |||||||||||||||||||
International equities | 2,271 | 12 | 1,904 | 367 | ||||||||||||||||||
Private equities | 332 | 2 | $ | 332 | ||||||||||||||||||
Fixed income securities | 45 - 65 | |||||||||||||||||||||
Corporate | 4,972 | 26 | 4,972 | |||||||||||||||||||
Government | 3,888 | 20 | 3,888 | |||||||||||||||||||
Mortgage backed and other | 200 | 1 | 200 | |||||||||||||||||||
Other | (77 | ) | — | (83 | ) | 6 | ||||||||||||||||
|
|
|
|
|
|
|
|
|
| |||||||||||||
| $ | 19,047 | 100 | % | $ | 3,614 | $ | 15,101 | $ | 332 | |||||||||||||
|
|
|
|
|
|
|
|
|
| |||||||||||||
| 2012 | ||||||||||||||||||||||
Asset Class | Fair Value | Actual % | Target Range % | Quoted Prices in Active Markets Level 1 | Other Observable Inputs Level 2 | Unobservable Inputs Level 3 | ||||||||||||||||
Cash and cash equivalents | $ | 618 | 4 | % | 0 - 3% | $ | 8 | $ | 610 | |||||||||||||
Equities | 45 - 55 | |||||||||||||||||||||
U.S. large cap equity | 4,248 | 25 | 9 | 4,239 | ||||||||||||||||||
U.S. SMID cap equity | 1,368 | 8 | 1,368 | |||||||||||||||||||
International equities | 1,657 | 10 | 1,395 | 262 | ||||||||||||||||||
Private equities | 402 | 2 | $ | 402 | ||||||||||||||||||
Fixed income securities | 45 - 55 | |||||||||||||||||||||
Corporate | 4,565 | 27 | 4,565 | |||||||||||||||||||
Government | 4,175 | 24 | 4,175 | |||||||||||||||||||
Mortgage backed and other | 59 | — | 59 | |||||||||||||||||||
Other | (79 | ) | — | (85 | ) | 6 | ||||||||||||||||
|
|
|
|
|
|
|
|
|
| |||||||||||||
| $ | 17,013 | 100 | % | $ | 2,695 | $ | 13,916 | $ | 402 | |||||||||||||
|
|
|
|
|
|
|
|
|
| |||||||||||||
105
| Beginning balance May 31, 2009 | $ | 341 | ||
| Actual return on plan assets: | ||||
| Assets held at May 31, 2010 | 38 | |||
| Assets sold during the year | 24 | |||
| Purchases, sales and settlements | (4 | ) | ||
| Balance at May 31, 2010 | 399 | |||
| Actual return on plan assets: | ||||
| Assets held at May 31, 2011 | 27 | |||
| Assets sold during the year | 36 | |||
| Purchases, sales and settlements | (59 | ) | ||
| Ending balance May 31, 2011 | $ | 403 | ||
| 2013 | 2012 | |||||||
Balance at beginning of year | $ | 402 | $ | 403 | ||||
Actual return on plan assets: | ||||||||
Assets held during current year | (29 | ) | 3 | |||||
Assets sold during the year | 55 | 38 | ||||||
Purchases, sales and settlements | (96 | ) | (42 | ) | ||||
|
|
|
| |||||
Balance at end of the year | $ | 332 | $ | 402 | ||||
|
|
|
| |||||
106
FEDEX CORPORATION
NOTES TO CONSOLIDATED FINANCIAL STATEMENTS (Continued)
The following table provides a reconciliation of the changes in the pension and postretirement healthcare plans’ benefit obligations and fair value of assets over the two-year period ended May 31, 20112013 and a statement of the funded status as of May 31, 20112013 and 20102012 (in millions):
| Pension Plans | Postretirement Healthcare Plans | |||||||||||||||
| 2011 | 2010 | 2011 | 2010 | |||||||||||||
Accumulated Benefit Obligation (“ABO”) | $ | 16,806 | $ | 14,041 | ||||||||||||
Changes in Projected Benefit Obligation (“PBO”) and Accumulated Postretirement Benefit Obligation (“APBO”) | ||||||||||||||||
| PBO/APBO at the beginning of year | $ | 14,484 | $ | 11,050 | $ | 565 | $ | 433 | ||||||||
| Service cost | 521 | 417 | 31 | 24 | ||||||||||||
| Interest cost | 900 | 823 | 34 | 30 | ||||||||||||
| Actuarial loss | 1,875 | 2,607 | 44 | 102 | ||||||||||||
| Benefits paid | (468 | ) | (391 | ) | (48 | ) | (45 | ) | ||||||||
| Other | 60 | (22 | ) | 22 | 21 | |||||||||||
| PBO/APBO at the end of year | $ | 17,372 | $ | 14,484 | $ | 648 | $ | 565 | ||||||||
Change in Plan Assets | ||||||||||||||||
| Fair value of plan assets at the beginning of year | $ | 13,295 | $ | 10,812 | $ | — | $ | — | ||||||||
| Actual return on plan assets | 2,425 | 1,994 | — | — | ||||||||||||
| Company contributions | 557 | 900 | 26 | 24 | ||||||||||||
| Benefits paid | (468 | ) | (391 | ) | (48 | ) | (45 | ) | ||||||||
| Other | 32 | (20 | ) | 22 | 21 | |||||||||||
| Fair value of plan assets at the end of year | $ | 15,841 | $ | 13,295 | $ | — | $ | — | ||||||||
Funded Status of the Plans | $ | (1,531 | ) | $ | (1,189 | ) | $ | (648 | ) | $ | (565 | ) | ||||
Amount Recognized in the Balance Sheet at May 31: | ||||||||||||||||
| Current pension, postretirement healthcare and other benefit obligations | $ | (33 | ) | $ | (30 | ) | $ | (31 | ) | $ | (28 | ) | ||||
| Noncurrent pension, postretirement healthcare and other benefit obligations | (1,498 | ) | (1,159 | ) | (617 | ) | (537 | ) | ||||||||
| Net amount recognized | $ | (1,531 | ) | $ | (1,189 | ) | $ | (648 | ) | $ | (565 | ) | ||||
Amounts Recognized in AOCI and not yet reflected in Net Periodic Benefit Cost: | ||||||||||||||||
| Net actuarial loss (gain) | $ | 5,386 | $ | 5,157 | $ | (85 | ) | $ | (134 | ) | ||||||
| Prior service (credit) cost and other | (993 | ) | (1,106 | ) | 2 | 2 | ||||||||||
| Total | $ | 4,393 | $ | 4,051 | $ | (83 | ) | $ | (132 | ) | ||||||
Amounts Recognized in AOCI and not yet reflected in Net Periodic Benefit Cost expected to be amortized in next year’s Net Periodic Benefit Cost: | ||||||||||||||||
| Net actuarial loss (gain) | $ | 307 | $ | 284 | $ | (1 | ) | $ | (5 | ) | ||||||
| Prior service credit and other | (112 | ) | (113 | ) | — | — | ||||||||||
| Total | $ | 195 | $ | 171 | $ | (1 | ) | $ | (5 | ) | ||||||
| Pension Plans | Postretirement Healthcare Plans | |||||||||||||||
| 2013 | 2012 | 2013 | 2012 | |||||||||||||
Accumulated Benefit Obligation (“ABO”) | $ | 21,958 | $ | 21,556 | ||||||||||||
|
|
|
| |||||||||||||
Changes in Projected Benefit Obligation (“PBO”) and Accumulated Postretirement Benefit Obligation (“APBO”) | ||||||||||||||||
PBO/APBO at the beginning of year | $ | 22,187 | $ | 17,372 | $ | 790 | $ | 648 | ||||||||
Service cost | 692 | 593 | 42 | 35 | ||||||||||||
Interest cost | 968 | 976 | 36 | 36 | ||||||||||||
Actuarial loss (gain) | (652 | ) | 3,789 | (17 | ) | 98 | ||||||||||
Benefits paid | (589 | ) | (502 | ) | (54 | ) | (51 | ) | ||||||||
Other | (6 | ) | (41 | ) | 31 | 24 | ||||||||||
|
|
|
|
|
|
|
| |||||||||
PBO/APBO at the end of year | $ | 22,600 | $ | 22,187 | $ | 828 | $ | 790 | ||||||||
|
|
|
|
|
|
|
| |||||||||
Change in Plan Assets | ||||||||||||||||
Fair value of plan assets at the beginning of year | $ | 17,334 | $ | 15,841 | $ | — | $ | — | ||||||||
Actual return on plan assets | 2,081 | 1,235 | — | — | ||||||||||||
Company contributions | 615 | 780 | 27 | 27 | ||||||||||||
Benefits paid | (589 | ) | (502 | ) | (54 | ) | (51 | ) | ||||||||
Other | (8 | ) | (20 | ) | 27 | 24 | ||||||||||
|
|
|
|
|
|
|
| |||||||||
Fair value of plan assets at the end of year | $ | 19,433 | $ | 17,334 | $ | — | $ | — | ||||||||
|
|
|
|
|
|
|
| |||||||||
Funded Status of the Plans | $ | (3,167 | ) | $ | (4,853 | ) | $ | (828 | ) | $ | (790 | ) | ||||
|
|
|
|
|
|
|
| |||||||||
Amount Recognized in the Balance Sheet at May 31: | ||||||||||||||||
Current pension, postretirement healthcare and other benefit obligations | $ | (48 | ) | $ | (35 | ) | $ | (39 | ) | $ | (33 | ) | ||||
Noncurrent pension, postretirement healthcare and other benefit obligations | (3,119 | ) | (4,818 | ) | (789 | ) | (757 | ) | ||||||||
|
|
|
|
|
|
|
| |||||||||
Net amount recognized | $ | (3,167 | ) | $ | (4,853 | ) | $ | (828 | ) | $ | (790 | ) | ||||
|
|
|
|
|
|
|
| |||||||||
Amounts Recognized in AOCI and not yet reflected in Net Periodic Benefit Cost: | ||||||||||||||||
Net actuarial loss (gain) | $ | 6,993 | $ | 8,866 | $ | (4 | ) | $ | 13 | |||||||
Prior service (credit) cost and other | (781 | ) | (897 | ) | 2 | 2 | ||||||||||
|
|
|
|
|
|
|
| |||||||||
Total | $ | 6,212 | $ | 7,969 | $ | (2 | ) | $ | 15 | |||||||
|
|
|
|
|
|
|
| |||||||||
Amounts Recognized in AOCI and not yet reflected in Net Periodic Benefit Cost expected to be amortized in next year’s Net Periodic Benefit Cost: | ||||||||||||||||
Net actuarial loss (gain) | $ | 378 | $ | 516 | $ | — | $ | — | ||||||||
Prior service credit and other | (114 | ) | (114 | ) | — | — | ||||||||||
|
|
|
|
|
|
|
| |||||||||
Total | $ | 264 | $ | 402 | $ | — | $ | — | ||||||||
|
|
|
|
|
|
|
| |||||||||
107
FEDEX CORPORATION
NOTES TO CONSOLIDATED FINANCIAL STATEMENTS (Continued)
Our pension plans included the following components at May 31, 20112013 and 20102012 (in millions):
| Fair Value of | ||||||||||||||||
| ABO | PBO | Plan Assets | Funded Status | |||||||||||||
| 2011 | ||||||||||||||||
| Qualified | $ | 16,024 | $ | 16,445 | $ | 15,518 | $ | (927 | ) | |||||||
| Nonqualified | 335 | 339 | — | (339 | ) | |||||||||||
| International Plans | 447 | 588 | 323 | (265 | ) | |||||||||||
| Total | $ | 16,806 | $ | 17,372 | $ | 15,841 | $ | (1,531 | ) | |||||||
| 2010 | ||||||||||||||||
| Qualified | $ | 13,311 | $ | 13,635 | $ | 13,055 | $ | (580 | ) | |||||||
| Nonqualified | 346 | 348 | — | (348 | ) | |||||||||||
| International Plans | 384 | 501 | 240 | (261 | ) | |||||||||||
| Total | $ | 14,041 | $ | 14,484 | $ | 13,295 | $ | (1,189 | ) | |||||||
| PBO | Fair Value of Plan Assets | Funded Status | ||||||||||
2013 | ||||||||||||
Qualified | $ | 21,532 | $ | 19,047 | $ | (2,485 | ) | |||||
Nonqualified | 322 | — | (322 | ) | ||||||||
International Plans | 746 | 386 | (360 | ) | ||||||||
|
|
|
|
|
| |||||||
Total | $ | 22,600 | $ | 19,433 | $ | (3,167 | ) | |||||
|
|
|
|
|
| |||||||
2012 | ||||||||||||
Qualified | $ | 21,192 | $ | 17,013 | $ | (4,179 | ) | |||||
Nonqualified | 355 | — | (355 | ) | ||||||||
International Plans | 640 | 321 | (319 | ) | ||||||||
|
|
|
|
|
| |||||||
Total | $ | 22,187 | $ | 17,334 | $ | (4,853 | ) | |||||
|
|
|
|
|
| |||||||
The table above provides the ABO, PBO, fair value of plan assets and funded status of our pension plans on an aggregated basis. The following table presents our plans on a disaggregated basis to show those plans (as a group) whose assets did not exceed their liabilities. These plans are comprised of our unfunded nonqualified plans, certain international plans and our U.S. Pension Plans. At May 31, 20112013 and 2010,2012, the fair value of plan assets for pension plans with a PBO or ABO in excess of plan assets were as follows (in millions):
| PBO Exceeds the Fair Value | ||||||||
| of Plan Assets | ||||||||
| 2011 | 2010 | |||||||
Pension Benefits | ||||||||
| Fair value of plan assets | $ | 15,815 | $ | 13,295 | ||||
| PBO | (17,346 | ) | (14,484 | ) | ||||
| Net funded status | $ | (1,531 | ) | $ | (1,189 | ) | ||
| ABO Exceeds the Fair Value | ||||||||
| of Plan Assets | ||||||||
| 2011 | 2010 | |||||||
Pension Benefits | ||||||||
ABO(1) | $ | (16,530 | ) | $ | (14,014 | ) | ||
| Fair value of plan assets | 15,538 | 13,263 | ||||||
| PBO | (17,014 | ) | (14,441 | ) | ||||
| Net funded status | $ | (1,476 | ) | $ | (1,178 | ) | ||
| PBO Exceeds the Fair Value of Plan Assets | ||||||||
| 2013 | 2012 | |||||||
Pension Benefits | ||||||||
Fair value of plan assets | $ | 19,433 | $ | 17,334 | ||||
PBO | (22,600 | ) | (22,187 | ) | ||||
|
|
|
| |||||
Net funded status | $ | (3,167 | ) | $ | (4,853 | ) | ||
|
|
|
| |||||
| ABO Exceeds the Fair Value of Plan Assets | ||||||||
| 2013 | 2012 | |||||||
Pension Benefits | ||||||||
ABO(1) | $ | (21,930 | ) | $ | (21,555 | ) | ||
Fair value of plan assets | 19,404 | 17,333 | ||||||
PBO | (22,570 | ) | (22,185 | ) | ||||
|
|
|
| |||||
Net funded status | $ | (3,166 | ) | $ | (4,852 | ) | ||
|
|
|
| |||||
| (1) | ABO not used in determination of funded status. |
108
FEDEX CORPORATION
NOTES TO CONSOLIDATED FINANCIAL STATEMENTS (Continued)
Contributions to our U.S. Pension Plans for the years ended May 31 were as follows (in millions):
| 2011 | 2010 | |||||||
| Required | $ | 359 | $ | 353 | ||||
| Voluntary | 121 | 495 | ||||||
| $ | 480 | $ | 848 | |||||
| 2013 | 2012 | |||||||
Required | $ | 560 | $ | 496 | ||||
Voluntary | — | 226 | ||||||
|
|
|
| |||||
| $ | 560 | $ | 722 | |||||
|
|
|
| |||||
For 2014, we anticipate making required contributions to our U.S. Pension Plans totaling approximately $650 million.
Net periodic benefit cost for the three years ended May 31 were as follows (in millions):
| Pension Plans | Postretirement Healthcare Plans | |||||||||||||||||||||||
| 2011 | 2010 | 2009 | 2011 | 2010 | 2009 | |||||||||||||||||||
| Service cost | $ | 521 | $ | 417 | $ | 499 | $ | 31 | $ | 24 | $ | 31 | ||||||||||||
| Interest cost | 900 | 823 | 798 | 34 | 30 | 33 | ||||||||||||||||||
| Expected return on plan assets | (1,062 | ) | (955 | ) | (1,059 | ) | — | — | — | |||||||||||||||
| Recognized actuarial losses (gains) and other | 184 | 23 | (61 | ) | (5 | ) | (12 | ) | (7 | ) | ||||||||||||||
| Net periodic benefit cost | $ | 543 | $ | 308 | $ | 177 | $ | 60 | $ | 42 | $ | 57 | ||||||||||||
| Pension Plans | Postretirement Healthcare Plans | |||||||||||||||||||||||
| 2013 | 2012 | 2011 | 2013 | 2012 | 2011 | |||||||||||||||||||
Service cost | $ | 692 | $ | 593 | $ | 521 | $ | 42 | $ | 35 | $ | 31 | ||||||||||||
Interest cost | 968 | 976 | 900 | 36 | 36 | 34 | ||||||||||||||||||
Expected return on plan assets | (1,383 | ) | (1,240 | ) | (1,062 | ) | — | — | — | |||||||||||||||
Recognized actuarial losses (gains) and other | 402 | 195 | 184 | — | (1 | ) | (5 | ) | ||||||||||||||||
|
|
|
|
|
|
|
|
|
|
|
| |||||||||||||
Net periodic benefit cost | $ | 679 | $ | 524 | $ | 543 | $ | 78 | $ | 70 | $ | 60 | ||||||||||||
|
|
|
|
|
|
|
|
|
|
|
| |||||||||||||
Pension costs in pension costs from 20102013 were higher than 2012 due to 2011 was due tothe negative impact of a significantly lower discount rate used to measure our benefit obligations at our May 31, 20102012 measurement date.
Amounts recognized in OCI for all plans were as follows (in millions):
| 2011 | 2010 | |||||||||||||||||||||||||||||||
| Postretirement Healthcare | Postretirement Healthcare | |||||||||||||||||||||||||||||||
| Pension Plans | Plans | Pension Plans | Plans | |||||||||||||||||||||||||||||
| Gross | Net of Tax | Gross | Net of Tax | Gross | Net of Tax | Gross | Net of Tax | |||||||||||||||||||||||||
| Amount | Amount | Amount | Amount | Amount | Amount | Amount | Amount | |||||||||||||||||||||||||
| Net loss and other arising during period | $ | 511 | $ | 321 | $ | 44 | $ | 26 | $ | 1,562 | $ | 986 | $ | 102 | $ | 59 | ||||||||||||||||
| Loss from settlements and curtailments | (13 | ) | (8 | ) | — | — | — | — | — | — | ||||||||||||||||||||||
| Amortizations: | ||||||||||||||||||||||||||||||||
| Prior services credit | 113 | 71 | — | — | 113 | 99 | — | — | ||||||||||||||||||||||||
| Actuarial (losses) gains and other | (284 | ) | (178 | ) | 5 | 3 | (130 | ) | (114 | ) | 12 | 12 | ||||||||||||||||||||
| Total recognized in OCI | $ | 327 | $ | 206 | $ | 49 | $ | 29 | $ | 1,545 | $ | 971 | $ | 114 | $ | 71 | ||||||||||||||||
| 2013 | 2012 | |||||||||||||||||||||||||||||||
| Pension Plans | Postretirement Healthcare Plans | Pension Plans | Postretirement Healthcare Plans | |||||||||||||||||||||||||||||
| Gross Amount | Net of Tax Amount | Gross Amount | Net of Tax Amount | Gross Amount | Net of Tax Amount | Gross Amount | Net of Tax Amount | |||||||||||||||||||||||||
Net (gain) loss and other arising during period | $ | (1,350 | ) | $ | (840 | ) | $ | (17 | ) | $ | (21 | ) | $ | 3,777 | $ | 2,371 | $ | 97 | $ | 61 | ||||||||||||
Amortizations: | ||||||||||||||||||||||||||||||||
Prior services credit | 114 | 66 | — | — | 113 | 71 | — | — | ||||||||||||||||||||||||
Actuarial (losses) gains and other | (516 | ) | (297 | ) | — | — | (311 | ) | (195 | ) | 1 | — | ||||||||||||||||||||
|
|
|
|
|
|
|
|
|
|
|
|
|
|
|
| |||||||||||||||||
Total recognized in OCI | $ | (1,752 | ) | $ | (1,071 | ) | $ | (17 | ) | $ | (21 | ) | $ | 3,579 | $ | 2,247 | $ | 98 | $ | 61 | ||||||||||||
|
|
|
|
|
|
|
|
|
|
|
|
|
|
|
| |||||||||||||||||
- 114 -
FEDEX CORPORATION
NOTES TO CONSOLIDATED FINANCIAL STATEMENTS (Continued)
Benefit payments, which reflect expected future service, are expected to be paid as follows for the years ending May 31 (millions):
| Postretirement | ||||||||
| Pension Plans | Healthcare Plans | |||||||
| 2012 | $ | 562 | $ | 31 | ||||
| 2013 | 633 | 31 | ||||||
| 2014 | 694 | 33 | ||||||
| 2015 | 754 | 35 | ||||||
| 2016 | 843 | 37 | ||||||
| 2017-2021 | 5,667 | 225 | ||||||
| Pension Plans | Postretirement Healthcare Plans | |||||||
2014 | $ | 821 | $ | 39 | ||||
2015 | 956 | 42 | ||||||
2016 | 896 | 44 | ||||||
2017 | 961 | 45 | ||||||
2018 | 1,049 | 47 | ||||||
2019-2023 | 6,974 | 274 | ||||||
109
Future medical benefit claims costs are estimated to increase at an annual rate of 8.3%7.7% during 2012,2014, decreasing to an annual growth rate of 4.5% in 2029 and thereafter. Future dental benefit costs are estimated to increase at an annual rate of 7.0%6.9% during 2012,2014, decreasing to an annual growth rate of 4.5% in 2029 and thereafter. A 1% change in these annual trend rates would not have a significant impact on the APBO at May 31, 20112013 or 20112013 benefit expense because the level of these benefits is capped.
NOTE 13:14: BUSINESS SEGMENT INFORMATION
FedEx Express, FedEx Ground and FedEx Freight represent our major service lines and, along with FedEx Services, form the core of our reportable segments. Our reportable segments include the following businesses:
FedEx Express Segment | FedEx Express (express transportation) | ||
FedEx Trade Networks | |||
| FedEx SupplyChain Systems (logistics services) | |||
FedEx Ground Segment | FedEx Ground (small-package ground delivery) | ||
| FedEx SmartPost (small-parcel consolidator) | |||
FedEx Freight Segment | FedEx Freight (LTL freight transportation) | ||
| FedEx Custom Critical (time-critical transportation) | |||
| FedEx Services Segment | |||
FedEx Services (sales, marketing, | |||
FedEx TechConnect (customer service, technical support, billings and collections) | |||
FedEx Office (document and business services and package acceptance) | |||
FedEx Services Segment
The FedEx Services segment operates combined sales, marketing, administrative and information technology functions in shared services operations that support our transportation businesses and allow us to obtain synergies from the combination of these functions. For the international regions of FedEx Express, some of these functions are performed on a regional basis by FedEx Express and reported in the FedEx Express segment in their natural expense line items. The FedEx Services segment includes: FedEx Services, which provides sales, marketing, and information technology, communications and back-office support to our other companies; FedEx TechConnect, which is responsible for customer service, technical support, billings and collections for U.S. customers of our major business units; and FedEx Office, which provides an array of document and business services and retail access to our customers for our package transportation businesses. Effective September 1, 2009, FedEx SupplyChain Systems, formerly included in the FedEx Services reporting segment, was realigned to become part of the FedEx Express reporting segment. Prior year amounts have not been reclassified to conform to the current year segment presentation because these reclassifications are immaterial.
110
- 115 -
FEDEX CORPORATION
NOTES TO CONSOLIDATED FINANCIAL STATEMENTS (Continued)
The FedEx Services segment provides direct and indirect support to our transportation businesses, and we allocate all of the net operating costs of the FedEx Services segment (including the net operating results of FedEx Office) to reflect the full cost of operating our transportation businesses in the results of those segments. Within the FedEx Services segment allocation, the net operating results of FedEx Office, which are an immaterial component of our allocations, are allocated to FedEx Express and FedEx Ground. The allocations of net operating costs are based on metrics such as relative revenues or estimated services provided. We believe these allocations approximate the net cost of providing these functions. We review and evaluate the performance of our transportation segments based on operating income (inclusive of FedEx Services segment allocations). For the FedEx Services segment, performance is evaluated based on the impact of its total allocated net operating costs on our transportation segments.
The operating expenses line item “Intercompany charges” on the accompanying unaudited financial summaries of our transportation segments in MD&A reflects the allocations from the FedEx Services segment to the respective transportation segments. The “Intercompany charges” caption also includes charges and credits for administrative services provided between operating companies and certain other costs such as corporate management fees related to services received for general corporate oversight, including executive officers and certain legal and finance functions. We believe these allocations approximate the net cost of providing these functions.
Other Intersegment Transactions
Certain FedEx operating companies provide transportation and related services for other FedEx companies outside their reportable segment. Billings for such services are based on negotiated rates, which we believe approximate fair value, and are reflected as revenues of the billing segment. These rates are adjusted from time to time based on market conditions. Such intersegment revenues and expenses are eliminated in our consolidated results and are not separately identified in the following segment information, asbecause the amounts are not material.
111
FEDEX CORPORATION
NOTES TO CONSOLIDATED FINANCIAL STATEMENTS (Continued)
The following table provides a reconciliation of reportable segment revenues, depreciation and amortization, operating income (loss) and segment assets to consolidated financial statement totals for the years ended or as of May 31 (in millions):
| FedEx | FedEx | FedEx | FedEx | |||||||||||||||||||||
| Express | Ground | Freight | Services | Other and | Consolidated | |||||||||||||||||||
| Segment(1) | Segment | Segment(2) | Segment(3) | Eliminations | Total | |||||||||||||||||||
| Revenues | ||||||||||||||||||||||||
| 2011 | $ | 24,581 | $ | 8,485 | $ | 4,911 | $ | 1,684 | $ | (357 | ) | $ | 39,304 | |||||||||||
| 2010 | 21,555 | 7,439 | 4,321 | 1,770 | (351 | ) | 34,734 | |||||||||||||||||
| 2009 | 22,364 | 7,047 | 4,415 | 1,977 | (306 | ) | 35,497 | |||||||||||||||||
| Depreciation and amortization | ||||||||||||||||||||||||
| 2011 | $ | 1,059 | $ | 337 | $ | 205 | $ | 371 | $ | 1 | $ | 1,973 | ||||||||||||
| 2010 | 1,016 | 334 | 198 | 408 | 2 | 1,958 | ||||||||||||||||||
| 2009 | 961 | 337 | 224 | 451 | 2 | 1,975 | ||||||||||||||||||
| Operating income (loss) | ||||||||||||||||||||||||
| 2011 | $ | 1,228 | $ | 1,325 | $ | (175 | ) | $ | — | $ | — | $ | 2,378 | |||||||||||
| 2010 | 1,127 | 1,024 | (153 | ) | — | — | 1,998 | |||||||||||||||||
| 2009 | 794 | 807 | (44 | ) | (810 | ) | — | 747 | ||||||||||||||||
Segment assets(4) | ||||||||||||||||||||||||
| 2011 | $ | 16,463 | $ | 5,048 | $ | 2,664 | $ | 4,278 | $ | (1,068 | ) | $ | 27,385 | |||||||||||
| 2010 | 14,819 | 4,118 | 2,786 | 4,079 | (900 | ) | 24,902 | |||||||||||||||||
| 2009 | 13,483 | 3,291 | 3,044 | 3,240 | 1,186 | 24,244 | ||||||||||||||||||
| FedEx Express Segment(1) | FedEx Ground Segment(2) | FedEx Freight Segment(3) | FedEx Services Segment | Other and Eliminations | Consolidated Total | |||||||||||||||||||
Revenues | ||||||||||||||||||||||||
2013 | $ | 27,171 | $ | 10,578 | $ | 5,401 | $ | 1,580 | $ | (443 | ) | $ | 44,287 | |||||||||||
2012 | 26,515 | 9,573 | 5,282 | 1,671 | (361 | ) | 42,680 | |||||||||||||||||
2011 | 24,581 | 8,485 | 4,911 | 1,684 | (357 | ) | 39,304 | |||||||||||||||||
Depreciation and amortization | ||||||||||||||||||||||||
2013 | $ | 1,350 | $ | 434 | $ | 217 | $ | 384 | $ | 1 | $ | 2,386 | ||||||||||||
2012 | 1,169 | 389 | 185 | 369 | 1 | 2,113 | ||||||||||||||||||
2011 | 1,059 | 337 | 205 | 371 | 1 | 1,973 | ||||||||||||||||||
Operating income (loss) | ||||||||||||||||||||||||
2013 | $ | 555 | $ | 1,788 | $ | 208 | $ | — | $ | — | $ | 2,551 | ||||||||||||
2012 | 1,260 | 1,764 | 162 | — | — | 3,186 | ||||||||||||||||||
2011 | 1,228 | 1,325 | (175 | ) | — | — | 2,378 | |||||||||||||||||
Segment assets(4) | ||||||||||||||||||||||||
2013 | $ | 18,935 | $ | 7,353 | $ | 2,953 | $ | 4,879 | $ | (553 | ) | $ | 33,567 | |||||||||||
2012 | 17,981 | 6,154 | 2,807 | 4,546 | (1,585 | ) | 29,903 | |||||||||||||||||
2011 | 16,463 | 5,048 | 2,664 | 4,278 | (1,068 | ) | 27,385 | |||||||||||||||||
| (1) | FedEx Express segment |
| (2) | FedEx Ground segment 2013 operating expenses include |
| (3) | FedEx Freight segment 2013 operating expenses include $50 million | |
| in direct and allocated business realignment costs. FedEx Freight segment 2011 operating expenses include $133 million in costs associated with the combination of our FedEx Freight and FedEx National LTL operations, effective January 30, |
| (4) | Segment assets include intercompany receivables. |
The following table provides a reconciliation of reportable segment capital expenditures to consolidated totals for the years ended May 31 (in millions):
| FedEx | FedEx | FedEx | FedEx | |||||||||||||||||||||
| Express | Ground | Freight | Services | Consolidated | ||||||||||||||||||||
| Segment | Segment | Segment | Segment | Other | Total | |||||||||||||||||||
| 2011 | $ | 2,467 | $ | 426 | $ | 153 | $ | 387 | $ | 1 | $ | 3,434 | ||||||||||||
| 2010 | 1,864 | 400 | 212 | 340 | — | 2,816 | ||||||||||||||||||
| 2009 | 1,348 | 636 | 240 | 235 | — | 2,459 | ||||||||||||||||||
| FedEx Express Segment | FedEx Ground Segment | FedEx Freight Segment | FedEx Services Segment | Other | Consolidated Total | |||||||||||||||||||
2013 | $ | 2,067 | $ | 555 | $ | 326 | $ | 424 | $ | 3 | $ | 3,375 | ||||||||||||
2012 | 2,689 | 536 | 340 | 437 | 5 | 4,007 | ||||||||||||||||||
2011 | 2,467 | 426 | 153 | 387 | 1 | 3,434 | ||||||||||||||||||
112
FEDEX CORPORATION
NOTES TO CONSOLIDATED FINANCIAL STATEMENTS (Continued)
The following table presents revenue by service type and geographic information for the years ended or as of May 31 (in millions):
| 2011 | 2010 | 2009 | ||||||||||
REVENUE BY SERVICE TYPE | ||||||||||||
| FedEx Express segment: | ||||||||||||
| Package: | ||||||||||||
| U.S. overnight box | $ | 6,128 | $ | 5,602 | $ | 6,074 | ||||||
| U.S. overnight envelope | 1,736 | 1,640 | 1,855 | |||||||||
| U.S. deferred | 2,805 | 2,589 | 2,789 | |||||||||
| Total domestic package revenue | 10,669 | 9,831 | 10,718 | |||||||||
| International Priority (IP) | 8,228 | 7,087 | 6,978 | |||||||||
International domestic(1) | 653 | 578 | 565 | |||||||||
| Total package revenue | 19,550 | �� | 17,496 | 18,261 | ||||||||
| Freight: | ||||||||||||
| U.S. | 2,188 | 1,980 | 2,165 | |||||||||
| International priority | 1,722 | 1,303 | 1,104 | |||||||||
| International airfreight | 283 | 251 | 369 | |||||||||
| Total freight revenue | 4,193 | 3,534 | 3,638 | |||||||||
Other(2) | 838 | 525 | 465 | |||||||||
| Total FedEx Express segment | 24,581 | 21,555 | 22,364 | |||||||||
| FedEx Ground segment | 8,485 | 7,439 | 7,047 | |||||||||
| FedEx Freight segment | 4,911 | 4,321 | 4,415 | |||||||||
| FedEx Services segment | 1,684 | 1,770 | 1,977 | |||||||||
| Other and eliminations | (357 | ) | (351 | ) | (306 | ) | ||||||
| $ | 39,304 | $ | 34,734 | $ | 35,497 | |||||||
GEOGRAPHICAL INFORMATION(3) | ||||||||||||
| Revenues: | ||||||||||||
| U.S. | $ | 27,461 | $ | 24,852 | $ | 25,819 | ||||||
| International: | ||||||||||||
| FedEx Express segment | 11,437 | 9,547 | 9,363 | |||||||||
| FedEx Ground segment | 177 | 140 | 124 | |||||||||
| FedEx Freight segment | 84 | 60 | 39 | |||||||||
| FedEx Services segment | 145 | 135 | 152 | |||||||||
| Total international revenue | 11,843 | 9,882 | 9,678 | |||||||||
| $ | 39,304 | $ | 34,734 | $ | 35,497 | |||||||
| Noncurrent assets: | ||||||||||||
| U.S. | $ | 17,235 | $ | 16,089 | $ | 15,615 | ||||||
| International | 1,865 | 1,529 | 1,513 | |||||||||
| $ | 19,100 | $ | 17,618 | $ | 17,128 | |||||||
REVENUE BY SERVICE TYPE
| 2013 | 2012 | 2011 | ||||||||||
FedEx Express segment: | ||||||||||||
Package: | ||||||||||||
U.S. overnight box | $ | 6,513 | $ | 6,546 | $ | 6,128 | ||||||
U.S. overnight envelope | 1,705 | 1,747 | 1,736 | |||||||||
U.S. deferred | 3,020 | 3,001 | 2,805 | |||||||||
|
|
|
|
|
| |||||||
Total U.S. domestic package revenue | 11,238 | 11,294 | 10,669 | |||||||||
International priority | 6,586 | 6,849 | 6,760 | |||||||||
International economy | 2,046 | 1,859 | 1,468 | |||||||||
|
|
|
|
|
| |||||||
Total international export package revenue | 8,632 | 8,708 | 8,228 | |||||||||
|
|
|
|
|
| |||||||
International domestic(1) | 1,398 | 853 | 653 | |||||||||
|
|
|
|
|
| |||||||
Total package revenue | 21,268 | 20,855 | 19,550 | |||||||||
Freight: | ||||||||||||
U.S. | 2,562 | 2,498 | 2,188 | |||||||||
International priority | 1,678 | 1,827 | 1,722 | |||||||||
International airfreight | 276 | 307 | 283 | |||||||||
|
|
|
|
|
| |||||||
Total freight revenue | 4,516 | 4,632 | 4,193 | |||||||||
Other | 1,387 | 1,028 | 838 | |||||||||
|
|
|
|
|
| |||||||
Total FedEx Express segment | 27,171 | 26,515 | 24,581 | |||||||||
FedEx Ground segment: | ||||||||||||
FedEx Ground | 9,652 | 8,791 | 7,855 | |||||||||
FedEx SmartPost | 926 | 782 | 630 | |||||||||
|
|
|
|
|
| |||||||
Total FedEx Ground segment | 10,578 | 9,573 | 8,485 | |||||||||
FedEx Freight segment | 5,401 | 5,282 | 4,911 | |||||||||
FedEx Services segment | 1,580 | 1,671 | 1,684 | |||||||||
Other and eliminations(2) | (443 | ) | (361 | ) | (357 | ) | ||||||
|
|
|
|
|
| |||||||
| $ | 44,287 | $ | 42,680 | $ | 39,304 | |||||||
|
|
|
|
|
| |||||||
GEOGRAPHICAL INFORMATION(3) | ||||||||||||
Revenues: | ||||||||||||
U.S. | $ | 31,550 | $ | 29,837 | $ | 27,461 | ||||||
International: | ||||||||||||
FedEx Express segment | 12,357 | 12,370 | 11,437 | |||||||||
FedEx Ground segment | 234 | 216 | 177 | |||||||||
FedEx Freight segment | 112 | 101 | 84 | |||||||||
FedEx Services segment | 34 | 156 | 145 | |||||||||
|
|
|
|
|
| |||||||
Total international revenue | 12,737 | 12,843 | 11,843 | |||||||||
|
|
|
|
|
| |||||||
| $ | 44,287 | $ | 42,680 | $ | 39,304 | |||||||
|
|
|
|
|
| |||||||
Noncurrent assets: | ||||||||||||
U.S. | $ | 19,637 | $ | 18,874 | $ | 17,235 | ||||||
International | 2,656 | 1,973 | 1,865 | |||||||||
|
|
|
|
|
| |||||||
| $ | 22,293 | $ | 20,847 | $ | 19,100 | |||||||
|
|
|
|
|
| |||||||
| (1) | International domestic revenues include our international intra-country domestic express |
| (2) | Includes FedEx Trade Networks and |
| (3) | International revenue includes shipments that either originate in or are destined to locations outside the United States. Noncurrent assets include property and equipment, goodwill and other long-term assets. Our flight equipment registered in the U.S. is included as U.S. assets; however, many of our aircraft operate internationally. |
113
FEDEX CORPORATION
NOTES TO CONSOLIDATED FINANCIAL STATEMENTS (Continued)
NOTE 14:15: SUPPLEMENTAL CASH FLOW INFORMATION
Cash paid for interest expense and income taxes for the years ended May 31 was as follows (in millions):
| 2011 | 2010 | 2009 | ||||||||||
| Cash payments for: | ||||||||||||
| Interest (net of capitalized interest) | $ | 93 | $ | 88 | $ | 61 | ||||||
| Income taxes | $ | 493 | $ | 322 | $ | 517 | ||||||
| Income tax refunds received | (106 | ) | (279 | ) | (8 | ) | ||||||
| Cash tax payments, net | $ | 387 | $ | 43 | $ | 509 | ||||||
| 2013 | 2012 | 2011 | ||||||||||
Cash payments for: | ||||||||||||
Interest (net of capitalized interest) | $ | 80 | $ | 52 | $ | 93 | ||||||
|
|
|
|
|
| |||||||
Income taxes | $ | 687 | $ | 403 | $ | 493 | ||||||
Income tax refunds received | (219 | ) | (146 | ) | (106 | ) | ||||||
|
|
|
|
|
| |||||||
Cash tax payments, net | $ | 468 | $ | 257 | $ | 387 | ||||||
|
|
|
|
|
| |||||||
NOTE 15:16: GUARANTEES AND INDEMNIFICATIONS
In conjunction with certain transactions, primarily the lease, sale or purchase of operating assets or services in the ordinary course of business, we may provide routine guarantees or indemnifications (e.g., environmental, fuel, tax and software infringement), the terms of which range in duration, and often they are not limited and have no specified maximum obligation. As a result, the overall maximum potential amount of the obligation under such guarantees and indemnifications cannot be reasonably estimated. Historically, we have not been required to make significant payments under our guarantee or indemnification obligations and no amounts have been recognized in our financial statements for the underlying fair value of these obligations.
Special facility revenue bonds have been issued by certain municipalities primarily to finance the acquisition and construction of various airport facilities and equipment. These facilities were leased to us and are accounted for as either capital leases or operating leases. FedEx Express has unconditionally guaranteed $667$551 million in principal of these bonds (with total future principal and interest payments of approximately $886$708 million as of May 31, 2011)2013) through these leases. Of the $667 million bond principal guaranteed, $116 million was included in capital lease obligations in our balance sheet at May 31, 2011. The remaining $551 million has been accounted for as operating leases.
NOTE 16:17: COMMITMENTS
Annual purchase commitments under various contracts as of May 31, 20112013 were as follows (in millions):
| Aircraft and | Facilities | |||||||||||
| Aircraft Related | and Other(1) | Total | ||||||||||
| 2012 | $ | 1,480 | $ | 918 | $ | 2,398 | ||||||
| 2013 | 1,086 | 105 | 1,191 | |||||||||
| 2014 | 781 | 43 | 824 | |||||||||
| 2015 | 569 | 30 | 599 | |||||||||
| 2016 | 584 | 11 | 595 | |||||||||
| Thereafter | 1,470 | 132 | 1,602 | |||||||||
| Aircraft and Aircraft Related | Facilities and Other(1) | Total | ||||||||||
2014 | $ | 968 | $ | 1,183 | $ | 2,151 | ||||||
2015 | 1,054 | 184 | 1,238 | |||||||||
2016 | 1,140 | 123 | 1,263 | |||||||||
2017 | 959 | 101 | 1,060 | |||||||||
2018 | 1,382 | 44 | 1,426 | |||||||||
Thereafter | 4,492 | 109 | 4,601 | |||||||||
|
|
|
|
|
| |||||||
Total | $ | 9,995 | $ | 1,744 | $ | 11,739 | ||||||
|
|
|
|
|
| |||||||
| (1) | Primarily vehicles, facilities, advertising contracts and |
The amounts reflected in the table above for purchase commitments represent noncancelable agreements to purchase goods or services. OurAs of May 31, 2013, our obligation to purchase 15 of thesefour Boeing 767-300 Freighter (“B767F”) aircraft and nine B777F aircraft is conditioned upon there being no event that causes FedEx Express or its employees not to be covered by the Railway Labor Act of 1926, as amended. Commitments to purchase aircraft in passenger configuration do not include the attendant costs to modify these aircraft for cargo transport unless we have entered into noncancelable commitments to modify such aircraft. Open purchase orders that are cancelable are not considered unconditional purchase obligations for financial reporting purposes and are not included in the table above.
114
FEDEX CORPORATION
NOTES TO CONSOLIDATED FINANCIAL STATEMENTS (Continued)
We have several aircraft modernization programs underway which are supported by the purchase of B777F, B767F and Boeing 757 (“B757”) aircraft. These aircraft are significantly more fuel-efficient per unit than the aircraft types previously utilized, and these expenditures are necessary to achieve significant long-term operating savings and to replace older aircraft. Our ability to delay the timing of these aircraft-related expenditures is limited without incurring significant costs to modify existing purchase agreements. During 2013, FedEx Express entered into an agreement to purchase 14 additional B757 aircraft, the delivery of which began in 2013 and will continue through 2014. The agreement provides the option to purchase up to 16 additional B757 aircraft, subject to the satisfaction of certain conditions. In addition, FedEx Express entered into agreements to purchase an additional 23 B767F aircraft, the delivery of which will occur between 2014 and 2019. The delivery of two firm B777F aircraft orders were also deferred from 2015 to 2016.
We had $604$414 million in deposits and progress payments as of May 31, 2011 (an increase of $167 million from May 31, 2010)2013 on aircraft purchases and other planned aircraft-related transactions. These deposits are classified in the “Other assets” caption of our consolidated balance sheets. In addition to our commitment to purchase B777Fs and B767Fs, our aircraft purchase commitments include the Boeing 757 (“B757”)B757 aircraft in passenger configuration, which will require additional costs to modify for cargo transport. Aircraft and aircraft-related contracts are subject to price escalations. The following table is a summary of the number and type ofkey aircraft we are committed to purchase as of May 31, 2011,2013, with the year of expected delivery:
| B757 | B777F | Total | ||||||||||
| 2012 | 16 | 7 | 23 | |||||||||
| 2013 | 4 | 6 | 10 | |||||||||
| 2014 | — | 7 | 7 | |||||||||
| 2015 | — | 3 | 3 | |||||||||
| 2016 | — | 3 | 3 | |||||||||
| Thereafter | — | 7 | 7 | |||||||||
| Total | 20 | 33 | 53 | |||||||||
| B757 | B767F | B777F | Total | |||||||||||||
2014 | 13 | 4 | 2 | 19 | ||||||||||||
2015 | — | 12 | — | 12 | ||||||||||||
2016 | — | 10 | 2 | 12 | ||||||||||||
2017 | — | 10 | — | 10 | ||||||||||||
2018 | — | 10 | 2 | 12 | ||||||||||||
Thereafter | — | 4 | 14 | 18 | ||||||||||||
|
|
|
|
|
|
|
| |||||||||
Total | 13 | 50 | 20 | 83 | ||||||||||||
|
|
|
|
|
|
|
| |||||||||
Effective as of June 14, 2013, we entered into a supplemental agreement to purchase 13 of the 16 B757 option aircraft noted above. Delivery of the aircraft will occur during 2014 and 2015. This aircraft transaction is not included in the table above, as it occurred subsequent to May 31, 2013.
NOTE 17:18: CONTINGENCIES
Wage-and-Hour.We are a defendant in a number of lawsuits containing various class-action allegations of wage-and-hour violations. The plaintiffs in these lawsuits allege, among other things, that they were forced to work “off the clock,” were not paid overtime or were not provided work breaks or other benefits. The complaints generally seek unspecified monetary damages, injunctive relief, or both. The following describes the wage-and-hour matters that have been certified as class actions.
matters.
115
Most of the class-action lawsuits were consolidated for administration of the pre-trial proceedings by a single federal court, the U.S. District Court for the Northern District of Indiana. The multidistrict litigation court granted class certification in 28 cases and denied it in 14 cases. On December 13, 2010, the court entered an opinion and order addressing all outstanding motions for summary judgment on the status of the owner-operators (i.e.,independent contractor vs. employee). In sum, the court has now ruled on our summary judgment motions and entered judgment in favor of FedEx Ground on all claims in 20 of the 28 multidistrict litigation cases that had been certified as class actions, finding that the owner-operators in those cases were contractors as a matter of the law of the following states: Alabama, Arizona, Georgia, Indiana, Kansas (the court previously dismissed without prejudice the nationwide class claim under the Employee Retirement Income Security Act of 1974 based on the plaintiffs’ failure to exhaust administrative remedies), Louisiana, Maryland, Minnesota, New Jersey, New York, North Carolina, Ohio, Pennsylvania, Rhode Island, South Carolina, Tennessee, Texas, Utah, West Virginia and Wisconsin.20 states. The plaintiffs filed notices of appeal in all of these 20 cases.
- 120 -
FEDEX CORPORATION
NOTES TO CONSOLIDATED FINANCIAL STATEMENTS (Continued)
The multidistrict litigation court remanded the other eight certified class actions inback to the multidistrict litigation, the court ruled in favordistrict courts where they were originally filed because its summary judgment ruling did not completely dispose of FedEx Ground on someall of the claims and against FedEx Groundin those lawsuits. Three of those cases are now on at least one claim in three ofappeal with the cases (filed in Kentucky, Nevada and New Hampshire) and then remanded all eight cases back to district court in the following states for resolution of the remaining claims: Arkansas, California, Florida, Kentucky, Nevada, New Hampshire and Oregon (two certified classes). In January 2011, we asked the court to issue final judgments in these eight cases, and the court denied our motion. In July 2011, we filed a petition for mandamus to the Seventh Circuit asking the appeals court to require these cases to be returned to the multidistrict litigation court for issuance of a final judgment so that all appeals of the December 2010 summary judgment rulings would be heard by the Seventh Circuit.
their respective district courts.
116
In Octoberaddition, we are defending contractor-model cases that are not or are no longer part of the multidistrict litigation, three of which have been certified as class actions. These cases are in varying stages of litigation, and we do not expect to incur a material loss in any of these matters.
Other Matters. In August 2010, a jury returnedthird-party consultant who works with shipping customers to negotiate lower rates filed a verdictlawsuit in favor of ATA Airlinesfederal district court in its lawsuitCalifornia against FedEx Express and awarded damagesUnited Parcel Service, Inc. (“UPS”) alleging violations of $66 million, andU.S. antitrust law. This matter was dismissed in JanuaryMay 2011, but the court granted the plaintiff permission to file an amended complaint, which FedEx received in June 2011. In November 2011, the court awarded ATA pre-judgment interest of $5 million.granted our motion to dismiss this complaint, but again allowed the plaintiff to file an amended complaint. The suitplaintiff filed a new complaint in December 2011, and the matter remains pending before the court. In February 2011, shortly after the initial lawsuit was filed, we received a demand for the production of information and documents in Indiana federal courtconnection with a civil investigation by the U.S. Department of Justice (“DOJ”) into the policies and allegedpractices of FedEx and UPS for dealing with third-party consultants who work with shipping customers to negotiate lower rates. In November 2012, the DOJ served a civil investigative demand on the third-party consultant seeking all pleadings, depositions and documents produced in the lawsuit. We are cooperating with the investigation, do not believe that we had breachedhave engaged in any anti-competitive activities and will vigorously defend ourselves in any action that may result from the investigation. While the litigation proceedings and the DOJ investigation move forward, and the amount of loss, if any, is dependent on a contract bynumber of factors that are not including ATA on our 2009 Civil Reserve Air Fleet (CRAF)/Air Mobility Command (AMC) team, which provides cargo and passenger service to the U.S. military. Whileyet fully developed or resolved, we do not agreebelieve that a material loss is reasonably possible.
We have received requests for information from the DOJ in the Northern District of California in connection with a criminal investigation relating to the transportation of packages for online pharmacies that may have shipped pharmaceuticals in violation of federal law. We responded to grand jury subpoenas issued in June 2008 and August 2009 and to additional requests for information pursuant to those subpoenas, and we continue to respond and cooperate with the verdict orinvestigation. We believe that our employees have acted in good faith at all times. We do not believe that we have engaged in any illegal activities and will vigorously defend ourselves in any action that may result from the investigation. The DOJ may pursue a criminal indictment and, if we are convicted, remedies could include fines, penalties, financial forfeiture and compliance conditions. We cannot estimate the amount or range of damages awardedloss, if any, as such analysis would depend on facts and have appealed the matter to the U.S. Court of Appeals for the Seventh Circuit, accounting standards required an accrual of a $66 million loss in the second quarter of 2011. We did not accrue the $5 million of interest as a loss because we have additional arguments on appeallaw that lead us to believe that loss of that amount is not probable.
- 121 -
FEDEX CORPORATION
NOTES TO CONSOLIDATED FINANCIAL STATEMENTS (Continued)
FedEx and its subsidiaries are subject to other legal proceedings that arise in the ordinary course of their business. In the opinion of management, the aggregate liability, if any, with respect to these other actions will not have a material adverse effect on our financial position, results of operations or cash flows.
NOTE 18:19: RELATED PARTY TRANSACTIONS
Our Chairman, President and Chief Executive Officer, Frederick W. Smith, currently holds an approximate 10% ownership interest in the National Football League Washington Redskins professional football team (“Redskins”) and is a member of its board of directors. FedEx has a multi-year naming rights agreement with the Redskins granting us certain marketing rights, including the right to name the Redskins’ stadium “FedExField.”
117
| First | Second | Third | Fourth | |||||||||||||
| (in millions, except per share amounts) | Quarter | Quarter | Quarter | Quarter | ||||||||||||
| 2011 | ||||||||||||||||
| Revenues | $ | 9,457 | $ | 9,632 | $ | 9,663 | $ | 10,552 | ||||||||
| Operating income | 628 | 469 | 393 | 888 | ||||||||||||
| Net income | 380 | 283 | 231 | 558 | ||||||||||||
Basic earnings per common share(1) | 1.21 | 0.90 | 0.73 | 1.76 | ||||||||||||
| Diluted earnings per common share | 1.20 | 0.89 | 0.73 | 1.75 | ||||||||||||
| 2010 | ||||||||||||||||
| Revenues | $ | 8,009 | $ | 8,596 | $ | 8,701 | $ | 9,428 | ||||||||
| Operating income | 315 | 571 | 416 | 696 | ||||||||||||
| Net income | 181 | 345 | 239 | 419 | ||||||||||||
| Basic earnings per common share | 0.58 | 1.10 | 0.76 | 1.34 | ||||||||||||
Diluted earnings per common share(1) | 0.58 | 1.10 | 0.76 | 1.33 | ||||||||||||
(in millions, except per share amounts) | First Quarter | Second Quarter | Third Quarter | Fourth Quarter | ||||||||||||
2013(1) | ||||||||||||||||
Revenues | $ | 10,792 | $ | 11,107 | $ | 10,953 | $ | 11,435 | ||||||||
Operating income | 742 | 718 | 589 | 502 | ||||||||||||
Net income | 459 | 438 | 361 | 303 | ||||||||||||
Basic earnings per common share(2) | 1.46 | 1.39 | 1.14 | 0.96 | ||||||||||||
Diluted earnings per common share(2) | 1.45 | 1.39 | 1.13 | 0.95 | ||||||||||||
2012(3) | ||||||||||||||||
Revenues | $ | 10,521 | $ | 10,587 | $ | 10,564 | $ | 11,008 | ||||||||
Operating income | 737 | 780 | 813 | 856 | ||||||||||||
Net income | 464 | 497 | 521 | 550 | ||||||||||||
Basic earnings per common share(2) | 1.46 | 1.57 | 1.66 | 1.74 | ||||||||||||
Diluted earnings per common share(2) | 1.46 | 1.57 | 1.65 | 1.73 | ||||||||||||
| (1) | The fourth quarter of 2013 includes $496 million of business realignment costs and an impairment charge of $100 million resulting from the decision to retire 10 aircraft and related engines at FedEx Express. The third quarter of 2013 includes $47 million of business realignment costs. The second quarter of 2013 includes $13 million of business realignment costs. |
| (2) | The sum of the quarterly earnings per share may not equal annual amounts due to differences in the weighted-average number of shares outstanding during the respective period. |
| (3) | The fourth quarter of 2012 includes an impairment charge of $134 million resulting from the decision to retire 24 aircraft and related engines at FedEx Express. The third quarter of 2012 includes the reversal of a $66 million legal reserve. |
118
FEDEX CORPORATION
NOTES TO CONSOLIDATED FINANCIAL STATEMENTS (Continued)
NOTE 20:21: CONDENSED CONSOLIDATING FINANCIAL STATEMENTS
We are required to present condensed consolidating financial information in order for the subsidiary guarantors (other than FedEx Express) of our public debt to continue to be exempt from reporting under the Securities Exchange Act of 1934, as amended.
The guarantor subsidiaries, which are wholly owned by FedEx, guarantee $1$2.75 billion of our debt. The guarantees are full and unconditional and joint and several. Our guarantor subsidiaries were not determined using geographic, service line or other similar criteria, and as a result, the “Guarantor Subsidiaries” and “Non-guarantor Subsidiaries” columns each include portions of our domestic and international operations. Accordingly, this basis of presentation is not intended to present our financial condition, results of operations or cash flows for any purpose other than to comply with the specific requirements for subsidiary guarantor reporting.
119
FEDEX CORPORATION
NOTES TO CONSOLIDATED FINANCIAL STATEMENTS (Continued)
Condensed consolidating financial statements for our guarantor subsidiaries and non-guarantor subsidiaries are presented in the following tables (in millions):
CONDENSED CONSOLIDATING BALANCE SHEETS
May 31, 2011
| Guarantor | Non-guarantor | |||||||||||||||||||
| Parent | Subsidiaries | Subsidiaries | Eliminations | Consolidated | ||||||||||||||||
| ASSETS | ||||||||||||||||||||
| CURRENT ASSETS | ||||||||||||||||||||
| Cash and cash equivalents | $ | 1,589 | $ | 279 | $ | 546 | $ | (86 | ) | $ | 2,328 | |||||||||
| Receivables, less allowances | — | 3,696 | 912 | (27 | ) | 4,581 | ||||||||||||||
| Spare parts, supplies, fuel, prepaid expenses and other, less allowances | 77 | 645 | 44 | — | 766 | |||||||||||||||
| Deferred income taxes | — | 598 | 12 | — | 610 | |||||||||||||||
| Total current assets | 1,666 | 5,218 | 1,514 | (113 | ) | 8,285 | ||||||||||||||
| PROPERTY AND EQUIPMENT, AT COST | 24 | 31,916 | 1,746 | — | 33,686 | |||||||||||||||
| Less accumulated depreciation and amortization | 18 | 17,071 | 1,054 | — | 18,143 | |||||||||||||||
| Net property and equipment | 6 | 14,845 | 692 | — | 15,543 | |||||||||||||||
| INTERCOMPANY RECEIVABLE | — | — | 1,317 | (1,317 | ) | — | ||||||||||||||
| GOODWILL | — | 1,564 | 762 | — | 2,326 | |||||||||||||||
| INVESTMENT IN SUBSIDIARIES | 15,404 | 2,705 | — | (18,109 | ) | — | ||||||||||||||
| OTHER ASSETS | 1,652 | 1,039 | 63 | (1,523 | ) | 1,231 | ||||||||||||||
| $ | 18,728 | $ | 25,371 | $ | 4,348 | $ | (21,062 | ) | $ | 27,385 | ||||||||||
| LIABILITIES AND STOCKHOLDERS’ INVESTMENT | ||||||||||||||||||||
| CURRENT LIABILITIES | ||||||||||||||||||||
| Current portion of long-term debt | $ | — | $ | 18 | $ | — | $ | — | $ | 18 | ||||||||||
| Accrued salaries and employee benefits | 50 | 1,071 | 147 | — | 1,268 | |||||||||||||||
| Accounts payable | — | 1,385 | 430 | (113 | ) | 1,702 | ||||||||||||||
| Accrued expenses | 198 | 1,563 | 133 | — | 1,894 | |||||||||||||||
| Total current liabilities | 248 | 4,037 | 710 | (113 | ) | 4,882 | ||||||||||||||
| LONG-TERM DEBT, LESS CURRENT PORTION | 1,000 | 667 | — | — | 1,667 | |||||||||||||||
| INTERCOMPANY PAYABLE | 1,095 | 222 | — | (1,317 | ) | — | ||||||||||||||
| OTHER LONG-TERM LIABILITIES | ||||||||||||||||||||
| Deferred income taxes | — | 2,842 | 17 | (1,523 | ) | 1,336 | ||||||||||||||
| Other liabilities | 1,165 | 3,001 | 114 | — | 4,280 | |||||||||||||||
| Total other long-term liabilities | 1,165 | 5,843 | 131 | (1,523 | ) | 5,616 | ||||||||||||||
| STOCKHOLDERS’ INVESTMENT | 15,220 | 14,602 | 3,507 | (18,109 | ) | 15,220 | ||||||||||||||
| $ | 18,728 | $ | 25,371 | $ | 4,348 | $ | (21,062 | ) | $ | 27,385 | ||||||||||
| Parent | Guarantor Subsidiaries | Non-guarantor Subsidiaries | Eliminations | Consolidated | ||||||||||||||||
ASSETS | ||||||||||||||||||||
CURRENT ASSETS | ||||||||||||||||||||
Cash and cash equivalents | $ | 3,892 | $ | 405 | $ | 717 | $ | (97 | ) | $ | 4,917 | |||||||||
Receivables, less allowances | — | 3,989 | 1,084 | (29 | ) | 5,044 | ||||||||||||||
Spare parts, supplies, fuel, prepaid expenses and other, less allowances | 45 | 681 | 54 | — | 780 | |||||||||||||||
Deferred income taxes | — | 518 | 15 | — | 533 | |||||||||||||||
|
|
|
|
|
|
|
|
|
| |||||||||||
Total current assets | 3,937 | 5,593 | 1,870 | (126 | ) | 11,274 | ||||||||||||||
PROPERTY AND EQUIPMENT, AT COST | 27 | 35,915 | 2,167 | — | 38,109 | |||||||||||||||
Less accumulated depreciation and amortization | 21 | 18,469 | 1,135 | — | 19,625 | |||||||||||||||
|
|
|
|
|
|
|
|
|
| |||||||||||
Net property and equipment | 6 | 17,446 | 1,032 | — | 18,484 | |||||||||||||||
INTERCOMPANY RECEIVABLE | — | 439 | 1,203 | (1,642 | ) | — | ||||||||||||||
GOODWILL | — | 1,552 | 1,203 | — | 2,755 | |||||||||||||||
INVESTMENT IN SUBSIDIARIES | 18,739 | 3,347 | — | (22,086 | ) | — | ||||||||||||||
OTHER ASSETS | 2,187 | 822 | 191 | (2,146 | ) | 1,054 | ||||||||||||||
|
|
|
|
|
|
|
|
|
| |||||||||||
| $ | 24,869 | $ | 29,199 | $ | 5,499 | $ | (26,000 | ) | $ | 33,567 | ||||||||||
|
|
|
|
|
|
|
|
|
| |||||||||||
LIABILITIES AND STOCKHOLDERS’ INVESTMENT CURRENT LIABILITIES | ||||||||||||||||||||
Current portion of long-term debt | $ | 250 | $ | 1 | $ | — | $ | — | $ | 251 | ||||||||||
Accrued salaries and employee benefits | 82 | 1,402 | 204 | — | 1,688 | |||||||||||||||
Accounts payable | 4 | 1,392 | 609 | (126 | ) | 1,879 | ||||||||||||||
Accrued expenses | 355 | 1,366 | 211 | — | 1,932 | |||||||||||||||
|
|
|
|
|
|
|
|
|
| |||||||||||
Total current liabilities | 691 | 4,161 | 1,024 | (126 | ) | 5,750 | ||||||||||||||
LONG-TERM DEBT, LESS CURRENT PORTION | 2,489 | 250 | — | — | 2,739 | |||||||||||||||
INTERCOMPANY PAYABLE | 1,642 | — | — | (1,642 | ) | — | ||||||||||||||
OTHER LONG-TERM LIABILITIES | ||||||||||||||||||||
Deferred income taxes | — | 3,798 | — | (2,146 | ) | 1,652 | ||||||||||||||
Other liabilities | 2,649 | 3,133 | 246 | — | 6,028 | |||||||||||||||
|
|
|
|
|
|
|
|
|
| |||||||||||
Total other long-term liabilities | 2,649 | 6,931 | 246 | (2,146 | ) | 7,680 | ||||||||||||||
STOCKHOLDERS’ INVESTMENT | 17,398 | 17,857 | 4,229 | (22,086 | ) | 17,398 | ||||||||||||||
|
|
|
|
|
|
|
|
|
| |||||||||||
| $ | 24,869 | $ | 29,199 | $ | 5,499 | $ | (26,000 | ) | $ | 33,567 | ||||||||||
|
|
|
|
|
|
|
|
|
| |||||||||||
120
FEDEX CORPORATION
NOTES TO CONSOLIDATED FINANCIAL STATEMENTS (Continued)
CONDENSED CONSOLIDATING BALANCE SHEETS
May 31, 2010
| Guarantor | Non-guarantor | |||||||||||||||||||
| Parent | Subsidiaries | Subsidiaries | Eliminations | Consolidated | ||||||||||||||||
| ASSETS | ||||||||||||||||||||
| CURRENT ASSETS | ||||||||||||||||||||
| Cash and cash equivalents | $ | 1,310 | $ | 258 | $ | 443 | $ | (59 | ) | $ | 1,952 | |||||||||
| Receivables, less allowances | 1 | 3,425 | 782 | (45 | ) | 4,163 | ||||||||||||||
| Spare parts, supplies, fuel, prepaid expenses and other, less allowances | 5 | 581 | 54 | — | 640 | |||||||||||||||
| Deferred income taxes | — | 492 | 37 | — | 529 | |||||||||||||||
| Total current assets | 1,316 | 4,756 | 1,316 | (104 | ) | 7,284 | ||||||||||||||
| PROPERTY AND EQUIPMENT, AT COST | 23 | 29,193 | 2,086 | — | 31,302 | |||||||||||||||
| Less accumulated depreciation and amortization | 18 | 15,801 | 1,098 | — | 16,917 | |||||||||||||||
| Net property and equipment | 5 | 13,392 | 988 | — | 14,385 | |||||||||||||||
| INTERCOMPANY RECEIVABLE | — | — | 1,132 | (1,132 | ) | — | ||||||||||||||
| GOODWILL | — | 1,551 | 649 | — | 2,200 | |||||||||||||||
| INVESTMENT IN SUBSIDIARIES | 13,850 | 2,619 | — | (16,469 | ) | — | ||||||||||||||
| OTHER ASSETS | 1,527 | 801 | 99 | (1,394 | ) | 1,033 | ||||||||||||||
| $ | 16,698 | $ | 23,119 | $ | 4,184 | $ | (19,099 | ) | $ | 24,902 | ||||||||||
| LIABILITIES AND STOCKHOLDERS’ INVESTMENT | ||||||||||||||||||||
| CURRENT LIABILITIES | ||||||||||||||||||||
| Current portion of long-term debt | $ | 250 | $ | 12 | $ | — | $ | — | $ | 262 | ||||||||||
| Accrued salaries and employee benefits | 36 | 955 | 155 | — | 1,146 | |||||||||||||||
| Accounts payable | 8 | 1,196 | 422 | (104 | ) | 1,522 | ||||||||||||||
| Accrued expenses | 47 | 1,488 | 180 | — | 1,715 | |||||||||||||||
| Total current liabilities | 341 | 3,651 | 757 | (104 | ) | 4,645 | ||||||||||||||
| LONG-TERM DEBT, LESS CURRENT PORTION | 1,000 | 668 | — | — | 1,668 | |||||||||||||||
| INTERCOMPANY PAYABLE | 702 | 430 | — | (1,132 | ) | — | ||||||||||||||
| OTHER LONG-TERM LIABILITIES | ||||||||||||||||||||
| Deferred income taxes | — | 2,253 | 32 | (1,394 | ) | 891 | ||||||||||||||
| Other liabilities | 844 | 2,921 | 122 | — | 3,887 | |||||||||||||||
| Total other long-term liabilities | 844 | 5,174 | 154 | (1,394 | ) | 4,778 | ||||||||||||||
| STOCKHOLDERS’ INVESTMENT | 13,811 | 13,196 | 3,273 | (16,469 | ) | 13,811 | ||||||||||||||
| $ | 16,698 | $ | 23,119 | $ | 4,184 | $ | (19,099 | ) | $ | 24,902 | ||||||||||
| Parent | Guarantor Subsidiaries | Non-guarantor Subsidiaries | Eliminations | Consolidated | ||||||||||||||||
ASSETS | ||||||||||||||||||||
CURRENT ASSETS | ||||||||||||||||||||
Cash and cash equivalents | $ | 1,906 | $ | 417 | $ | 636 | $ | (116 | ) | $ | 2,843 | |||||||||
Receivables, less allowances | 3 | 3,793 | 943 | (35 | ) | 4,704 | ||||||||||||||
Spare parts, supplies, fuel, prepaid expenses and other, less allowances | 261 | 671 | 44 | — | 976 | |||||||||||||||
Deferred income taxes | — | 514 | 19 | — | 533 | |||||||||||||||
|
|
|
|
|
|
|
|
|
| |||||||||||
Total current assets | 2,170 | 5,395 | 1,642 | (151 | ) | 9,056 | ||||||||||||||
PROPERTY AND EQUIPMENT, AT COST | 29 | 34,301 | 1,834 | — | 36,164 | |||||||||||||||
Less accumulated depreciation and amortization | 20 | 17,822 | 1,074 | — | 18,916 | |||||||||||||||
|
|
|
|
|
|
|
|
|
| |||||||||||
Net property and equipment | 9 | 16,479 | 760 | — | 17,248 | |||||||||||||||
INTERCOMPANY RECEIVABLE | — | 323 | 1,524 | (1,847 | ) | — | ||||||||||||||
GOODWILL | — | 1,553 | 834 | — | 2,387 | |||||||||||||||
INVESTMENT IN SUBSIDIARIES | 17,163 | 2,978 | — | (20,141 | ) | — | ||||||||||||||
OTHER ASSETS | 2,845 | 1,099 | 86 | (2,818 | ) | 1,212 | ||||||||||||||
|
|
|
|
|
|
|
|
|
| |||||||||||
| $ | 22,187 | $ | 27,827 | $ | 4,846 | $ | (24,957 | ) | $ | 29,903 | ||||||||||
|
|
|
|
|
|
|
|
|
| |||||||||||
LIABILITIES AND STOCKHOLDERS’ INVESTMENT | ||||||||||||||||||||
CURRENT LIABILITIES | ||||||||||||||||||||
Current portion of long-term debt | $ | — | $ | 417 | $ | — | $ | — | $ | 417 | ||||||||||
Accrued salaries and employee benefits | 83 | 1,365 | 187 | — | 1,635 | |||||||||||||||
Accounts payable | 6 | 1,276 | 482 | (151 | ) | 1,613 | ||||||||||||||
Accrued expenses | 184 | 1,406 | 119 | — | 1,709 | |||||||||||||||
|
|
|
|
|
|
|
|
|
| |||||||||||
Total current liabilities | 273 | 4,464 | 788 | (151 | ) | 5,374 | ||||||||||||||
LONG-TERM DEBT, LESS CURRENT PORTION | 1,000 | 250 | — | — | 1,250 | |||||||||||||||
INTERCOMPANY PAYABLE | 1,847 | — | — | (1,847 | ) | — | ||||||||||||||
OTHER LONG-TERM LIABILITIES | ||||||||||||||||||||
Deferred income taxes | — | 3,649 | 5 | (2,818 | ) | 836 | ||||||||||||||
Other liabilities | 4,340 | 3,193 | 183 | — | 7,716 | |||||||||||||||
|
|
|
|
|
|
|
|
|
| |||||||||||
Total other long-term liabilities | 4,340 | 6,842 | 188 | (2,818 | ) | 8,552 | ||||||||||||||
STOCKHOLDERS’ INVESTMENT | 14,727 | 16,271 | 3,870 | (20,141 | ) | 14,727 | ||||||||||||||
|
|
|
|
|
|
|
|
|
| |||||||||||
| $ | 22,187 | $ | 27,827 | $ | 4,846 | $ | (24,957 | ) | $ | 29,903 | ||||||||||
|
|
|
|
|
|
|
|
|
| |||||||||||
121
FEDEX CORPORATION
NOTES TO CONSOLIDATED FINANCIAL STATEMENTS (Continued)
CONDENSED CONSOLIDATING STATEMENTS OF COMPREHENSIVE INCOME
Year Ended May 31, 2013
| Parent | Guarantor Subsidiaries | Non-guarantor Subsidiaries | Eliminations | Consolidated | ||||||||||||||||
REVENUES | $ | — | $ | 37,073 | $ | 7,543 | $ | (329 | ) | $ | 44,287 | |||||||||
OPERATING EXPENSES: | ||||||||||||||||||||
Salaries and employee benefits | 103 | 14,375 | 2,092 | — | 16,570 | |||||||||||||||
Purchased transportation | — | 4,839 | 2,574 | (141 | ) | 7,272 | ||||||||||||||
Rentals and landing fees | 5 | 2,198 | 324 | (6 | ) | 2,521 | ||||||||||||||
Depreciation and amortization | 1 | 2,200 | 185 | — | 2,386 | |||||||||||||||
Fuel | — | 4,650 | 96 | — | 4,746 | |||||||||||||||
Maintenance and repairs | 1 | 1,791 | 117 | — | 1,909 | |||||||||||||||
Business realignment, impairment and other charges | 21 | 639 | — | — | 660 | |||||||||||||||
Intercompany charges, net | (227 | ) | (329 | ) | 556 | — | — | |||||||||||||
Other | 96 | 4,565 | 1,193 | (182 | ) | 5,672 | ||||||||||||||
|
|
|
|
|
|
|
|
|
| |||||||||||
| — | 34,928 | 7,137 | (329 | ) | 41,736 | |||||||||||||||
|
|
|
|
|
|
|
|
|
| |||||||||||
OPERATING INCOME | — | 2,145 | 406 | — | 2,551 | |||||||||||||||
OTHER INCOME (EXPENSE): | ||||||||||||||||||||
Equity in earnings of subsidiaries | 1,561 | 253 | — | (1,814 | ) | — | ||||||||||||||
Interest, net | (108 | ) | 42 | 5 | — | (61 | ) | |||||||||||||
Intercompany charges, net | 113 | (131 | ) | 18 | — | — | ||||||||||||||
Other, net | (5 | ) | (20 | ) | (10 | ) | — | (35 | ) | |||||||||||
|
|
|
|
|
|
|
|
|
| |||||||||||
INCOME BEFORE INCOME TAXES | 1,561 | 2,289 | 419 | (1,814 | ) | 2,455 | ||||||||||||||
Provision for income taxes | — | 710 | 184 | — | 894 | |||||||||||||||
|
|
|
|
|
|
|
|
|
| |||||||||||
NET INCOME | $ | 1,561 | $ | 1,579 | $ | 235 | $ | (1,814 | ) | $ | 1,561 | |||||||||
|
|
|
|
|
|
|
|
|
| |||||||||||
COMPREHENSIVE INCOME | $ | 2,622 | $ | 1,618 | $ | 268 | $ | (1,814 | ) | $ | 2,694 | |||||||||
|
|
|
|
|
|
|
|
|
| |||||||||||
- 126 -
FEDEX CORPORATION
NOTES TO CONSOLIDATED FINANCIAL STATEMENTS (Continued)
CONDENSED CONSOLIDATING STATEMENTS OF COMPREHENSIVE INCOME (LOSS)
Year Ended May 31, 2012
| Parent | Guarantor Subsidiaries | Non-guarantor Subsidiaries | Eliminations | Consolidated | ||||||||||||||||
REVENUES | $ | — | $ | 36,412 | $ | 6,569 | $ | (301 | ) | $ | 42,680 | |||||||||
OPERATING EXPENSES: | ||||||||||||||||||||
Salaries and employee benefits | 114 | 14,153 | 1,832 | — | 16,099 | |||||||||||||||
Purchased transportation | — | 4,509 | 1,944 | (118 | ) | 6,335 | ||||||||||||||
Rentals and landing fees | 5 | 2,221 | 267 | (6 | ) | 2,487 | ||||||||||||||
Depreciation and amortization | 1 | 1,962 | 150 | — | 2,113 | |||||||||||||||
Fuel | — | 4,877 | 79 | — | 4,956 | |||||||||||||||
Maintenance and repairs | 1 | 1,882 | 97 | — | 1,980 | |||||||||||||||
Impairment and other charges | — | 134 | — | — | 134 | |||||||||||||||
Intercompany charges, net | (218 | ) | (323 | ) | 541 | — | — | |||||||||||||
Other | 97 | 4,482 | 988 | (177 | ) | 5,390 | ||||||||||||||
|
|
|
|
|
|
|
|
|
| |||||||||||
| — | 33,897 | 5,898 | (301 | ) | 39,494 | |||||||||||||||
|
|
|
|
|
|
|
|
|
| |||||||||||
OPERATING INCOME | — | 2,515 | 671 | — | 3,186 | |||||||||||||||
OTHER INCOME (EXPENSE): | ||||||||||||||||||||
Equity in earnings of subsidiaries | 2,032 | 395 | — | (2,427 | ) | — | ||||||||||||||
Interest, net | (75 | ) | 31 | 5 | — | (39 | ) | |||||||||||||
Intercompany charges, net | 80 | (102 | ) | 22 | — | — | ||||||||||||||
Other, net | (5 | ) | (10 | ) | 9 | — | (6 | ) | ||||||||||||
|
|
|
|
|
|
|
|
|
| |||||||||||
INCOME BEFORE INCOME TAXES | 2,032 | 2,829 | 707 | (2,427 | ) | 3,141 | ||||||||||||||
Provision for income taxes | — | 875 | 234 | — | 1,109 | |||||||||||||||
|
|
|
|
|
|
|
|
|
| |||||||||||
NET INCOME | $ | 2,032 | $ | 1,954 | $ | 473 | $ | (2,427 | ) | $ | 2,032 | |||||||||
|
|
|
|
|
|
|
|
|
| |||||||||||
COMPREHENSIVE (LOSS) INCOME | $ | (120 | ) | $ | 1,796 | $ | 380 | $ | (2,427 | ) | $ | (371 | ) | |||||||
|
|
|
|
|
|
|
|
|
| |||||||||||
- 127 -
FEDEX CORPORATION
NOTES TO CONSOLIDATED FINANCIAL STATEMENTS (Continued)
CONDENSED CONSOLIDATING STATEMENTS OF COMPREHENSIVE INCOME
Year Ended May 31, 2011
| Guarantor | Non-guarantor | |||||||||||||||||||
| Parent | Subsidiaries | Subsidiaries | Eliminations | Consolidated | ||||||||||||||||
| REVENUES | $ | — | $ | 33,124 | $ | 6,498 | $ | (318 | ) | $ | 39,304 | |||||||||
| OPERATING EXPENSES: | ||||||||||||||||||||
| Salaries and employee benefits | 109 | 13,206 | 1,961 | — | 15,276 | |||||||||||||||
| Purchased transportation | — | 4,034 | 1,745 | (105 | ) | 5,674 | ||||||||||||||
| Rentals and landing fees | 4 | 2,209 | 253 | (4 | ) | 2,462 | ||||||||||||||
| Depreciation and amortization | 1 | 1,784 | 188 | — | 1,973 | |||||||||||||||
| Fuel | — | 4,003 | 148 | — | 4,151 | |||||||||||||||
| Maintenance and repairs | 1 | 1,862 | 116 | — | 1,979 | |||||||||||||||
| Impairment and other charges | — | 28 | 61 | — | 89 | |||||||||||||||
| Intercompany charges, net | (222 | ) | (317 | ) | 539 | — | — | |||||||||||||
| Other | 107 | 4,392 | 1,032 | (209 | ) | 5,322 | ||||||||||||||
| — | 31,201 | 6,043 | (318 | ) | 36,926 | |||||||||||||||
| OPERATING INCOME | — | 1,923 | 455 | — | 2,378 | |||||||||||||||
| OTHER INCOME (EXPENSE): | ||||||||||||||||||||
| Equity in earnings of subsidiaries | 1,452 | 200 | — | (1,652 | ) | — | ||||||||||||||
| Interest, net | (88 | ) | 13 | (2 | ) | — | (77 | ) | ||||||||||||
| Intercompany charges, net | 104 | (135 | ) | 31 | — | — | ||||||||||||||
| Other, net | (16 | ) | (14 | ) | (6 | ) | — | (36 | ) | |||||||||||
| INCOME BEFORE INCOME TAXES | 1,452 | 1,987 | 478 | (1,652 | ) | 2,265 | ||||||||||||||
| Provision for income taxes | — | 677 | 136 | — | 813 | |||||||||||||||
| NET INCOME | $ | 1,452 | $ | 1,310 | $ | 342 | $ | (1,652 | ) | $ | 1,452 | |||||||||
| Guarantor | Non-guarantor | |||||||||||||||||||
| Parent | Subsidiaries | Subsidiaries | Eliminations | Consolidated | ||||||||||||||||
| REVENUES | $ | — | $ | 29,360 | $ | 5,700 | $ | (326 | ) | $ | 34,734 | |||||||||
| OPERATING EXPENSES: | ||||||||||||||||||||
| Salaries and employee benefits | 91 | 12,026 | 1,910 | — | 14,027 | |||||||||||||||
| Purchased transportation | — | 3,424 | 1,392 | (88 | ) | 4,728 | ||||||||||||||
| Rentals and landing fees | 4 | 2,118 | 240 | (3 | ) | 2,359 | ||||||||||||||
| Depreciation and amortization | 1 | 1,751 | 206 | — | 1,958 | |||||||||||||||
| Fuel | — | 2,946 | 160 | — | 3,106 | |||||||||||||||
| Maintenance and repairs | 1 | 1,589 | 125 | — | 1,715 | |||||||||||||||
| Impairment and other charges | — | — | 18 | — | 18 | |||||||||||||||
| Intercompany charges, net | (202 | ) | (109 | ) | 311 | — | — | |||||||||||||
| Other | 105 | 3,950 | 1,005 | (235 | ) | 4,825 | ||||||||||||||
| — | 27,695 | 5,367 | (326 | ) | 32,736 | |||||||||||||||
| OPERATING INCOME | — | 1,665 | 333 | — | 1,998 | |||||||||||||||
| OTHER INCOME (EXPENSE): | ||||||||||||||||||||
| Equity in earnings of subsidiaries | 1,184 | 161 | — | (1,345 | ) | — | ||||||||||||||
| Interest, net | (100 | ) | 41 | (12 | ) | — | (71 | ) | ||||||||||||
| Intercompany charges, net | 114 | (147 | ) | 33 | — | — | ||||||||||||||
| Other, net | (14 | ) | (18 | ) | (1 | ) | — | (33 | ) | |||||||||||
| INCOME BEFORE INCOME TAXES | 1,184 | 1,702 | 353 | (1,345 | ) | 1,894 | ||||||||||||||
| Provision for income taxes | — | 625 | 85 | — | 710 | |||||||||||||||
| NET INCOME | $ | 1,184 | $ | 1,077 | $ | 268 | $ | (1,345 | ) | $ | 1,184 | |||||||||
| Parent | Guarantor Subsidiaries | Non-guarantor Subsidiaries | Eliminations | Consolidated | ||||||||||||||||
REVENUES | $ | — | $ | 33,124 | $ | 6,498 | $ | (318 | ) | $ | 39,304 | |||||||||
OPERATING EXPENSES: | ||||||||||||||||||||
Salaries and employee benefits | 109 | 13,206 | 1,961 | — | 15,276 | |||||||||||||||
Purchased transportation | — | 4,034 | 1,745 | (105 | ) | 5,674 | ||||||||||||||
Rentals and landing fees | 4 | 2,209 | 253 | (4 | ) | 2,462 | ||||||||||||||
Depreciation and amortization | 1 | 1,784 | 188 | — | 1,973 | |||||||||||||||
Fuel | — | 4,003 | 148 | — | 4,151 | |||||||||||||||
Maintenance and repairs | 1 | 1,862 | 116 | — | 1,979 | |||||||||||||||
Impairment and other charges | — | 28 | 61 | — | 89 | |||||||||||||||
Intercompany charges, net | (222 | ) | (317 | ) | 539 | — | — | |||||||||||||
Other | 107 | 4,392 | 1,032 | (209 | ) | 5,322 | ||||||||||||||
|
|
|
|
|
|
|
|
|
| |||||||||||
| — | 31,201 | 6,043 | (318 | ) | 36,926 | |||||||||||||||
|
|
|
|
|
|
|
|
|
| |||||||||||
OPERATING INCOME | — | 1,923 | 455 | — | 2,378 | |||||||||||||||
OTHER INCOME (EXPENSE): | ||||||||||||||||||||
Equity in earnings of subsidiaries | 1,452 | 200 | — | (1,652 | ) | — | ||||||||||||||
Interest, net | (88 | ) | 13 | (2 | ) | — | (77 | ) | ||||||||||||
Intercompany charges, net | 104 | (135 | ) | 31 | — | — | ||||||||||||||
Other, net | (16 | ) | (14 | ) | (6 | ) | — | (36 | ) | |||||||||||
|
|
|
|
|
|
|
|
|
| |||||||||||
INCOME BEFORE INCOME TAXES | 1,452 | 1,987 | 478 | (1,652 | ) | 2,265 | ||||||||||||||
Provision for income taxes | — | 677 | 136 | — | 813 | |||||||||||||||
|
|
|
|
|
|
|
|
|
| |||||||||||
NET INCOME | $ | 1,452 | $ | 1,310 | $ | 342 | $ | (1,652 | ) | $ | 1,452 | |||||||||
|
|
|
|
|
|
|
|
|
| |||||||||||
COMPREHENSIVE INCOME | $ | 1,240 | $ | 1,329 | $ | 425 | $ | (1,652 | ) | $ | 1,342 | |||||||||
|
|
|
|
|
|
|
|
|
| |||||||||||
122
FEDEX CORPORATION
| Guarantor | Non-guarantor | |||||||||||||||||||
| Parent | Subsidiaries | Subsidiaries | Eliminations | Consolidated | ||||||||||||||||
| REVENUES | $ | — | $ | 29,923 | $ | 5,851 | $ | (277 | ) | $ | 35,497 | |||||||||
| OPERATING EXPENSES: | ||||||||||||||||||||
| Salaries and employee benefits | 82 | 11,483 | 2,202 | — | 13,767 | |||||||||||||||
| Purchased transportation | — | 3,362 | 1,211 | (39 | ) | 4,534 | ||||||||||||||
| Rentals and landing fees | 4 | 2,134 | 296 | (5 | ) | 2,429 | ||||||||||||||
| Depreciation and amortization | 2 | 1,706 | 267 | — | 1,975 | |||||||||||||||
| Fuel | — | 3,554 | 257 | — | 3,811 | |||||||||||||||
| Maintenance and repairs | 1 | 1,755 | 142 | — | 1,898 | |||||||||||||||
| Impairment and other charges | — | 1,098 | 106 | — | 1,204 | |||||||||||||||
| Intercompany charges, net | (193 | ) | 81 | 112 | — | — | ||||||||||||||
| Other | 104 | 4,198 | 1,063 | (233 | ) | 5,132 | ||||||||||||||
| — | 29,371 | 5,656 | (277 | ) | 34,750 | |||||||||||||||
| OPERATING INCOME | — | 552 | 195 | — | 747 | |||||||||||||||
| OTHER INCOME (EXPENSE): | ||||||||||||||||||||
| Equity in earnings of subsidiaries | 98 | 103 | — | (201 | ) | — | ||||||||||||||
| Interest, net | (73 | ) | 28 | (14 | ) | — | (59 | ) | ||||||||||||
| Intercompany charges, net | 90 | (118 | ) | 28 | — | — | ||||||||||||||
| Other, net | (17 | ) | (3 | ) | 9 | — | (11 | ) | ||||||||||||
| INCOME BEFORE INCOME TAXES | 98 | 562 | 218 | (201 | ) | 677 | ||||||||||||||
| Provision for income taxes | — | 514 | 65 | — | 579 | |||||||||||||||
| NET INCOME | $ | 98 | $ | 48 | $ | 153 | $ | (201 | ) | $ | 98 | |||||||||
123
Year Ended May 31, 2011
| Guarantor | Non-guarantor | |||||||||||||||||||
| Parent | Subsidiaries | Subsidiaries | Eliminations | Consolidated | ||||||||||||||||
| CASH PROVIDED BY (USED IN) OPERATING ACTIVITIES | $ | 25 | $ | 3,978 | $ | 65 | $ | (27 | ) | $ | 4,041 | |||||||||
| INVESTING ACTIVITIES | ||||||||||||||||||||
| Capital expenditures | (1 | ) | (3,263 | ) | (170 | ) | — | (3,434 | ) | |||||||||||
| Business acquisition, net of cash acquired | — | (96 | ) | — | — | (96 | ) | |||||||||||||
| Proceeds from asset dispositions and other | — | 110 | 1 | — | 111 | |||||||||||||||
| CASH USED IN INVESTING ACTIVITIES | (1 | ) | (3,249 | ) | (169 | ) | — | (3,419 | ) | |||||||||||
| FINANCING ACTIVITIES | ||||||||||||||||||||
| Net transfers from (to) Parent | 530 | (994 | ) | 464 | — | — | ||||||||||||||
| Payment on loan between subsidiaries | — | 235 | (235 | ) | — | — | ||||||||||||||
| Intercompany dividends | — | 61 | (61 | ) | — | — | ||||||||||||||
| Principal payments on debt | (250 | ) | (12 | ) | — | — | (262 | ) | ||||||||||||
| Proceeds from stock issuances | 108 | — | — | — | 108 | |||||||||||||||
| Excess tax benefit on the exercise of stock options | 23 | — | — | — | 23 | |||||||||||||||
| Dividends paid | (151 | ) | — | — | — | (151 | ) | |||||||||||||
| Other, net | (5 | ) | (9 | ) | 9 | — | (5 | ) | ||||||||||||
| CASH (USED IN) PROVIDED BY FINANCING ACTIVITIES | 255 | (719 | ) | 177 | — | (287 | ) | |||||||||||||
| Effect of exchange rate changes on cash | — | 11 | 30 | — | 41 | |||||||||||||||
| Net increase (decrease) in cash and cash equivalents | 279 | 21 | 103 | (27 | ) | 376 | ||||||||||||||
| Cash and cash equivalents at beginning of period | 1,310 | 258 | 443 | (59 | ) | 1,952 | ||||||||||||||
| Cash and cash equivalents at end of period | $ | 1,589 | $ | 279 | $ | 546 | $ | (86 | ) | $ | 2,328 | |||||||||
| Guarantor | Non- guarantor | |||||||||||||||||||
| Parent | Subsidiaries | Subsidiaries | Eliminations | Consolidated | ||||||||||||||||
CASH PROVIDED BY OPERATING ACTIVITIES | $ | 247 | $ | 3,936 | $ | 486 | $ | 19 | $ | 4,688 | ||||||||||
INVESTING ACTIVITIES | ||||||||||||||||||||
Capital expenditures | (3 | ) | (3,029 | ) | (343 | ) | — | (3,375 | ) | |||||||||||
Business acquisitions, net of cash acquired | — | — | (483 | ) | — | (483 | ) | |||||||||||||
Proceeds from asset dispositions and other | — | 49 | 6 | — | 55 | |||||||||||||||
|
|
|
|
|
|
|
|
|
| |||||||||||
CASH USED IN INVESTING ACTIVITIES | (3 | ) | (2,980 | ) | (820 | ) | — | (3,803 | ) | |||||||||||
FINANCING ACTIVITIES | ||||||||||||||||||||
Net transfers from (to) Parent | 141 | (58 | ) | (83 | ) | — | — | |||||||||||||
Payment on loan between subsidiaries | — | (385 | ) | 385 | — | — | ||||||||||||||
Intercompany dividends | — | 21 | (21 | ) | — | — | ||||||||||||||
Principal payments on debt | — | (417 | ) | — | — | (417 | ) | |||||||||||||
Proceeds from debt issuances | 1,739 | — | — | — | 1,739 | |||||||||||||||
Proceeds from stock issuances | 280 | — | — | — | 280 | |||||||||||||||
Excess tax benefit on the exercise of stock options | 23 | — | — | — | 23 | |||||||||||||||
Dividends paid | (177 | ) | — | — | — | (177 | ) | |||||||||||||
Purchase of treasury stock | (246 | ) | — | — | — | (246 | ) | |||||||||||||
Other, net | (18 | ) | (119 | ) | 119 | — | (18 | ) | ||||||||||||
|
|
|
|
|
|
|
|
|
| |||||||||||
CASH PROVIDED BY (USED IN) FINANCING ACTIVITIES | 1,742 | (958 | ) | 400 | — | 1,184 | ||||||||||||||
|
|
|
|
|
|
|
|
|
| |||||||||||
Effect of exchange rate changes on cash | — | (10 | ) | 15 | — | 5 | ||||||||||||||
Net increase (decrease) in cash and cash equivalents | 1,986 | (12 | ) | 81 | 19 | 2,074 | ||||||||||||||
Cash and cash equivalents at beginning of period | 1,906 | 417 | 636 | (116 | ) | 2,843 | ||||||||||||||
|
|
|
|
|
|
|
|
|
| |||||||||||
Cash and cash equivalents at end of period | $ | 3,892 | $ | 405 | $ | 717 | $ | (97 | ) | $ | 4,917 | |||||||||
|
|
|
|
|
|
|
|
|
| |||||||||||
- 129 -
FEDEX CORPORATION
NOTES TO CONSOLIDATED FINANCIAL STATEMENTS (Continued)
CONDENSED CONSOLIDATING STATEMENTS OF CASH FLOWS
Year Ended May 31, 2010
| Guarantor | Non-guarantor | |||||||||||||||||||
| Parent | Subsidiaries | Subsidiaries | Eliminations | Consolidated | ||||||||||||||||
| CASH PROVIDED BY (USED IN) OPERATING ACTIVITIES | $ | (450 | ) | $ | 2,942 | $ | 653 | $ | (7 | ) | $ | 3,138 | ||||||||
| INVESTING ACTIVITIES | ||||||||||||||||||||
| Capital expenditures | — | (2,661 | ) | (155 | ) | — | (2,816 | ) | ||||||||||||
| Proceeds from asset dispositions and other | — | 38 | (3 | ) | — | 35 | ||||||||||||||
| CASH USED IN INVESTING ACTIVITIES | — | (2,623 | ) | (158 | ) | — | (2,781 | ) | ||||||||||||
| FINANCING ACTIVITIES | ||||||||||||||||||||
| Net transfers from (to) Parent | 531 | (397 | ) | (134 | ) | — | — | |||||||||||||
| Payment on loan between subsidiaries | — | 72 | (72 | ) | — | — | ||||||||||||||
| Intercompany dividends | — | 158 | (158 | ) | — | — | ||||||||||||||
| Principal payments on debt | (500 | ) | (153 | ) | — | — | (653 | ) | ||||||||||||
| Proceeds from stock issuances | 94 | — | — | — | 94 | |||||||||||||||
| Excess tax benefit on the exercise of stock options | 25 | — | — | — | 25 | |||||||||||||||
| Dividends paid | (138 | ) | — | — | — | (138 | ) | |||||||||||||
| Other, net | (20 | ) | (5 | ) | 5 | — | (20 | ) | ||||||||||||
| CASH USED IN FINANCING ACTIVITIES | (8 | ) | (325 | ) | (359 | ) | — | (692 | ) | |||||||||||
| Effect of exchange rate changes on cash | — | (8 | ) | 3 | — | (5 | ) | |||||||||||||
| Net (decrease) increase in cash and cash equivalents | (458 | ) | (14 | ) | 139 | (7 | ) | (340 | ) | |||||||||||
| Cash and cash equivalents at beginning of period | 1,768 | 272 | 304 | (52 | ) | 2,292 | ||||||||||||||
| Cash and cash equivalents at end of period | $ | 1,310 | $ | 258 | $ | 443 | $ | (59 | ) | $ | 1,952 | |||||||||
| Guarantor | Non- guarantor | |||||||||||||||||||
| Parent | Subsidiaries | Subsidiaries | Eliminations | Consolidated | ||||||||||||||||
CASH PROVIDED BY (USED IN) OPERATING ACTIVITIES | $ | (88 | ) | $ | 4,383 | $ | 570 | $ | (30 | ) | $ | 4,835 | ||||||||
INVESTING ACTIVITIES | ||||||||||||||||||||
Capital expenditures | (5 | ) | (3,792 | ) | (210 | ) | — | (4,007 | ) | |||||||||||
Business acquisition, net of cash acquired | — | — | (116 | ) | — | (116 | ) | |||||||||||||
Proceeds from asset dispositions and other | — | 74 | — | — | 74 | |||||||||||||||
|
|
|
|
|
|
|
|
|
| |||||||||||
CASH USED IN INVESTING ACTIVITIES | (5 | ) | (3,718 | ) | (326 | ) | — | (4,049 | ) | |||||||||||
FINANCING ACTIVITIES | ||||||||||||||||||||
Net transfers from (to) Parent | 625 | (550 | ) | (75 | ) | — | — | |||||||||||||
Intercompany dividends | — | 76 | (76 | ) | — | — | ||||||||||||||
Principal payments on debt | — | (29 | ) | — | — | (29 | ) | |||||||||||||
Proceeds from stock issuances | 128 | — | — | — | 128 | |||||||||||||||
Excess tax benefit on the exercise of stock options | 18 | — | — | — | 18 | |||||||||||||||
Dividends paid | (164 | ) | — | — | — | (164 | ) | |||||||||||||
Purchase of treasury stock | (197 | ) | — | (197 | ) | |||||||||||||||
Other, net | — | (19 | ) | 19 | — | — | ||||||||||||||
|
|
|
|
|
|
|
|
|
| |||||||||||
CASH (USED IN) PROVIDED BY FINANCING ACTIVITIES | 410 | (522 | ) | (132 | ) | — | (244 | ) | ||||||||||||
|
|
|
|
|
|
|
|
|
| |||||||||||
Effect of exchange rate changes on cash | — | (5 | ) | (22 | ) | — | (27 | ) | ||||||||||||
Net increase (decrease) in cash and cash equivalents | 317 | 138 | 90 | (30 | ) | 515 | ||||||||||||||
Cash and cash equivalents at beginning of period | 1,589 | 279 | 546 | (86 | ) | 2,328 | ||||||||||||||
|
|
|
|
|
|
|
|
|
| |||||||||||
Cash and cash equivalents at end of period | $ | 1,906 | $ | 417 | $ | 636 | $ | (116 | ) | $ | 2,843 | |||||||||
|
|
|
|
|
|
|
|
|
| |||||||||||
124
FEDEX CORPORATION
NOTES TO CONSOLIDATED FINANCIAL STATEMENTS (Continued)
CONDENSED CONSOLIDATING STATEMENTS OF CASH FLOWS
Year Ended May 31, 2009
| Guarantor | Non-guarantor | |||||||||||||||||||
| Parent | Subsidiaries | Subsidiaries | Eliminations | Consolidated | ||||||||||||||||
| CASH PROVIDED BY (USED IN) OPERATING ACTIVITIES | $ | (924 | ) | $ | 3,156 | $ | 573 | $ | (52 | ) | $ | 2,753 | ||||||||
| INVESTING ACTIVITIES | ||||||||||||||||||||
| Capital expenditures | — | (2,248 | ) | (211 | ) | — | (2,459 | ) | ||||||||||||
| Proceeds from asset dispositions and other | — | 69 | 7 | — | 76 | |||||||||||||||
| CASH USED IN INVESTING ACTIVITIES | — | (2,179 | ) | (204 | ) | — | (2,383 | ) | ||||||||||||
| FINANCING ACTIVITIES | ||||||||||||||||||||
| Net transfers from (to) Parent | 1,173 | (1,066 | ) | (107 | ) | — | — | |||||||||||||
| Payment on loan from Parent | 17 | — | (17 | ) | — | — | ||||||||||||||
| Payment on loan between subsidiaries | — | 36 | (36 | ) | — | — | ||||||||||||||
| Intercompany dividends | — | 165 | (165 | ) | — | — | ||||||||||||||
| Principal payments on debt | (500 | ) | — | (1 | ) | — | (501 | ) | ||||||||||||
| Proceeds from debt issuance | 1,000 | — | — | — | 1,000 | |||||||||||||||
| Proceeds from stock issuances | 41 | — | — | — | 41 | |||||||||||||||
| Excess tax benefit on the exercise of stock options | 4 | — | — | — | 4 | |||||||||||||||
| Dividends paid | (137 | ) | — | — | — | (137 | ) | |||||||||||||
| Other, net | (7 | ) | — | — | — | (7 | ) | |||||||||||||
| CASH PROVIDED BY (USED IN) FINANCING ACTIVITIES | 1,591 | (865 | ) | (326 | ) | — | 400 | |||||||||||||
| Effect of exchange rate changes on cash | — | (6 | ) | (11 | ) | — | (17 | ) | ||||||||||||
| Net increase (decrease) in cash and cash equivalents | 667 | 106 | 32 | (52 | ) | 753 | ||||||||||||||
| Cash and cash equivalents at beginning of period | 1,101 | 166 | 272 | — | 1,539 | |||||||||||||||
| Cash and cash equivalents at end of period | $ | 1,768 | $ | 272 | $ | 304 | $ | (52 | ) | $ | 2,292 | |||||||||
| Guarantor | Non- guarantor | |||||||||||||||||||
| Parent | Subsidiaries | Subsidiaries | Eliminations | Consolidated | ||||||||||||||||
CASH PROVIDED BY (USED IN) OPERATING ACTIVITIES | $ | 25 | $ | 3,978 | $ | 65 | $ | (27 | ) | $ | 4,041 | |||||||||
INVESTING ACTIVITIES | ||||||||||||||||||||
Capital expenditures | (1 | ) | (3,263 | ) | (170 | ) | — | (3,434 | ) | |||||||||||
Business acquisition, net of cash acquired | — | (96 | ) | — | — | (96 | ) | |||||||||||||
Proceeds from asset dispositions and other | — | 110 | 1 | — | 111 | |||||||||||||||
|
|
|
|
|
|
|
|
|
| |||||||||||
CASH USED IN INVESTING ACTIVITIES | (1 | ) | (3,249 | ) | (169 | ) | — | (3,419 | ) | |||||||||||
FINANCING ACTIVITIES | ||||||||||||||||||||
Net transfers from (to) Parent | 530 | (994 | ) | 464 | — | — | ||||||||||||||
Payment on loan between subsidiaries | — | 235 | (235 | ) | — | — | ||||||||||||||
Intercompany dividends | — | 61 | (61 | ) | — | — | ||||||||||||||
Principal payments on debt | (250 | ) | (12 | ) | — | — | (262 | ) | ||||||||||||
Proceeds from stock issuances | 108 | — | — | — | 108 | |||||||||||||||
Excess tax benefit on the exercise of stock options | 23 | — | — | — | 23 | |||||||||||||||
Dividends paid | (151 | ) | — | — | — | (151 | ) | |||||||||||||
Other, net | (5 | ) | (9 | ) | 9 | — | (5 | ) | ||||||||||||
|
|
|
|
|
|
|
|
|
| |||||||||||
CASH (USED IN) PROVIDED BY FINANCING ACTIVITIES | 255 | (719 | ) | 177 | — | (287 | ) | |||||||||||||
|
|
|
|
|
|
|
|
|
| |||||||||||
Effect of exchange rate changes on cash | — | 11 | 30 | — | 41 | |||||||||||||||
Net increase (decrease) in cash and cash equivalents | 279 | 21 | 103 | (27 | ) | 376 | ||||||||||||||
Cash and cash equivalents at beginning of period | 1,310 | 258 | 443 | (59 | ) | 1,952 | ||||||||||||||
|
|
|
|
|
|
|
|
|
| |||||||||||
Cash and cash equivalents at end of period | $ | 1,589 | $ | 279 | $ | 546 | $ | (86 | ) | $ | 2,328 | |||||||||
|
|
|
|
|
|
|
|
|
| |||||||||||
125
INTEREST RATES.While we currently have market risk sensitive instruments related to interest rates, we have no significant exposure to changing interest rates on our long-term debt because the interest rates are fixed on all of our long-term debt. As disclosed in Note 6 to the accompanying consolidated financial statements, we had outstanding fixed-rate, long-term debt (exclusive of capital leases) with estimated fair values of $1.9$3.2 billion at May 31, 20112013 and $2.1$2.0 billion at May 31, 2010.2012. Market risk for fixed-rate, long-term debt is estimated as the potential decrease in fair value resulting from a hypothetical 10% increase in interest rates and amounts to $36$77 million as of May 31, 20112013 and $41$30 million as of May 31, 2010.2012. The underlying fair values of our long-term debt were estimated based on quoted market prices or on the current rates offered for debt with similar terms and maturities.
We have interest rate risk with respect to our pension and postretirement benefit obligations. Changes in interest rates impact our liabilities associated with these benefit plans as well as the amount of pension and postretirement benefit expense recognized. Declines in the value of plan assets could diminish the funded status of our pension plans and potentially increase our requirement to make contributions to the plans. Substantial investment losses on plan assets will also increase pension and postretirement benefit expense in the years following the losses.
FOREIGN CURRENCY.While we are a global provider of transportation, e-commerce and business services, the substantial majority of our transactions are denominated in U.S. dollars. The principal foreign currency exchange rate risks to which we are exposed are in the euro, Chinese yuan, euro, Brazilian real, Canadian dollar and the British pound and Japanese yen.pound. Historically, our exposure to foreign currency fluctuations is more significant with respect to our revenues than our expenses, as a significant portion of our expenses are denominated in U.S. dollars, such as aircraft and fuel expenses. During 20112013 and 2010, operating income was positively impacted due to2012, foreign currency fluctuations.fluctuations had a slightly positive impact on operating income. However, favorable foreign currency fluctuations also may have had an offsetting impact on the price we obtained or the demand for our services, which is not quantifiable. At May 31, 2011,2013, the result of a uniform 10% strengthening in the value of the dollar relative to the currencies in which our transactions are denominated would result in a decrease in operating income of $38$132 million for 2012.2014. This theoretical calculation required under SEC guidelines assumes that each exchange rate would change in the same direction relative to the U.S. dollar. This calculationdollar, which is not indicative ofconsistent with our actual experience in foreign currency transactions. In addition to the direct effects of changes in exchange rates, fluctuations in exchange rates also affect the volume of sales or the foreign currency sales price as competitors’ services become more or less attractive. The sensitivity analysis of the effects of changes in foreign currency exchange rates does not factor in a potential change in sales levels or local currency prices.
COMMODITY.While we have market risk for changes in the price of jet and vehicle fuel, this risk is largely mitigated by our fuel surcharges because our fuel surcharges are closely linked to market prices for fuel. Therefore, a hypothetical 10% change in the price of fuel would not be expected to materially affect our earnings.
However, our fuel surcharges have a timing lag (approximately six to eight weeks for FedEx Express and FedEx Ground) before they are adjusted for changes in fuel prices. Our fuel surcharge index also allows fuel prices to fluctuate approximately 2% for FedEx Express and approximately 4% for FedEx Ground before an adjustment to the fuel surcharge occurs. Accordingly, our operating income in a specific period may be significantly affected should the spot price of fuel suddenly change by a substantial amount or change by amounts that do not result in an adjustment in our fuel surcharges.
OTHER.We do not purchase or hold any derivative financial instruments for trading purposes.
126
The following table sets forth (in millions, except per share amounts and other operating data) certain selected consolidated financial and operating data for FedEx as of and for the five years ended May 31, 2011.2013. This information should be read in conjunction with the Consolidated Financial Statements, MD&A and other financial data appearing elsewhere in this Annual Report.
| 2011(1) | 2010 | 2009(2) | 2008(3) | 2007(4) | ||||||||||||||||
Operating Results | ||||||||||||||||||||
| Revenues | $ | 39,304 | $ | 34,734 | $ | 35,497 | $ | 37,953 | $ | 35,214 | ||||||||||
| Operating income | 2,378 | 1,998 | 747 | 2,075 | 3,276 | |||||||||||||||
| Income before income taxes | 2,265 | 1,894 | 677 | 2,016 | 3,215 | |||||||||||||||
| Net income | 1,452 | 1,184 | 98 | 1,125 | 2,016 | |||||||||||||||
Per Share Data | ||||||||||||||||||||
| Earnings per share: | ||||||||||||||||||||
| Basic | $ | 4.61 | $ | 3.78 | $ | 0.31 | $ | 3.64 | $ | 6.57 | ||||||||||
| Diluted | $ | 4.57 | $ | 3.76 | $ | 0.31 | $ | 3.60 | $ | 6.48 | ||||||||||
| Average shares of common stock outstanding | 315 | 312 | 311 | 309 | 307 | |||||||||||||||
| Average common and common equivalent shares outstanding | 317 | 314 | 312 | 312 | 311 | |||||||||||||||
| Cash dividends declared | $ | 0.48 | $ | 0.44 | $ | 0.44 | $ | 0.30 | $ | 0.37 | ||||||||||
Financial Position | ||||||||||||||||||||
| Property and equipment, net | $ | 15,543 | $ | 14,385 | $ | 13,417 | $ | 13,478 | $ | 12,636 | ||||||||||
| Total assets | 27,385 | 24,902 | 24,244 | 25,633 | 24,000 | |||||||||||||||
| Long-term debt, less current portion | 1,667 | 1,668 | 1,930 | 1,506 | 2,007 | |||||||||||||||
| Common stockholders’ investment | 15,220 | 13,811 | 13,626 | 14,526 | 12,656 | |||||||||||||||
Other Operating Data | ||||||||||||||||||||
| FedEx Express aircraft fleet | 688 | 667 | 654 | 677 | 669 | |||||||||||||||
| Average full-time equivalent employees and contractors | 255,573 | 245,109 | 247,908 | 254,142 | 241,903 | |||||||||||||||
| 2013(1) | 2012(2) | 2011(3) | 2010(4) | 2009(5) | ||||||||||||||||
Operating Results | ||||||||||||||||||||
Revenues | $ | 44,287 | $ | 42,680 | $ | 39,304 | $ | 34,734 | $ | 35,497 | ||||||||||
Operating income | 2,551 | 3,186 | 2,378 | 1,998 | 747 | |||||||||||||||
Income before income taxes | 2,455 | 3,141 | 2,265 | 1,894 | 677 | |||||||||||||||
Net income | 1,561 | 2,032 | 1,452 | 1,184 | 98 | |||||||||||||||
Per Share Data | ||||||||||||||||||||
Earnings per share: | ||||||||||||||||||||
Basic | $ | 4.95 | $ | 6.44 | $ | 4.61 | $ | 3.78 | $ | 0.31 | ||||||||||
Diluted | $ | 4.91 | $ | 6.41 | $ | 4.57 | $ | 3.76 | $ | 0.31 | ||||||||||
Average shares of common stock outstanding | 315 | 315 | 315 | 312 | 311 | |||||||||||||||
Average common and common equivalent shares outstanding | 317 | 317 | 317 | 314 | 312 | |||||||||||||||
Cash dividends declared | $ | 0.56 | $ | 0.52 | $ | 0.48 | $ | 0.44 | $ | 0.44 | ||||||||||
Financial Position | ||||||||||||||||||||
Property and equipment, net | $ | 18,484 | $ | 17,248 | $ | 15,543 | $ | 14,385 | $ | 13,417 | ||||||||||
Total assets | 33,567 | 29,903 | 27,385 | 24,902 | 24,244 | |||||||||||||||
Long-term debt, less current portion | 2,739 | 1,250 | 1,667 | 1,668 | 1,930 | |||||||||||||||
Common stockholders’ investment | 17,398 | 14,727 | 15,220 | 13,811 | 13,626 | |||||||||||||||
Other Operating Data | ||||||||||||||||||||
FedEx Express aircraft fleet | 647 | 660 | 688 | 667 | 654 | |||||||||||||||
| (1) | Results for 2013 include $560 million ($353 million, net of tax, or $1.11 per diluted share) of business realignment costs and a $100 million ($63 million, net of tax, or $0.20 per diluted share) impairment charge resulting from the decision to retire 10 aircraft and related engines at FedEx Express. See Note 1 to the accompanying consolidated financial statements. Additionally, common stockholders’ investment includes an other comprehensive income increase of $861 million, net of tax, for the funded status of our retirement plans at May 31, 2013. |
| (2) | Results for 2012 include a $134 million ($84 million, net of tax or $0.26 per diluted share) impairment charge resulting from the decision to retire 24 aircraft and related engines at FedEx Express and the reversal of a $66 million legal reserve initially recorded in 2011. See Note 1 to the accompanying consolidated financial statements. Additionally, common stockholders’ investment includes an other comprehensive income charge of $2.4 billion, net of tax, for the funded status of our retirement plans at May 31, 2012. |
| (3) | Results for 2011 include charges of approximately $199 million ($104 million, net of tax and applicable variable incentive compensation impacts, or $0.33 per diluted share) for the combination of our FedEx Freight and FedEx National LTL operations and a $66 million reserve associated with a legal matter at FedEx Express. See |
| (4) | Common stockholders’ investment includes an other comprehensive income charge of $1.0 billion, net of tax, for the funded status of our retirement plans at May 31, 2010. |
Results for 2009 include a charge of $1.2 billion ($1.1 billion, net of tax, or $3.45 per diluted share) primarily for impairment charges associated with goodwill and aircraft. | ||
127
PUBLIC ACCOUNTING FIRM
The Board of Directors and Stockholders
FedEx Corporation
We have audited the consolidated financial statements of FedEx Corporation as of May 31, 20112013 and 2010,2012, and for each of the three years in the period ended May 31, 2011,2013, and have issued our report thereon dated July 12, 201115, 2013 (included elsewhere in this Annual Report on Form 10-K). Our audits also included the financial statement schedule listed in Item 15(a) in this Annual Report on Form 10-K. This schedule is the responsibility of the Company’s management. Our responsibility is to express an opinion based on our audits.
In our opinion, the financial statement schedule referred to above, when considered in relation to the basic financial statements taken as a whole, presents fairly in all material respects the information set forth therein.
/s/ Ernst & Young LLP
Memphis, Tennessee
July 12, 2011
128
FEDEX CORPORATION
VALUATION AND QUALIFYING ACCOUNTS
FOR THE YEARS ENDED MAY 31, 2011, 2010,2013, 2012, AND 2009
(IN MILLIONS)
| ADDITIONS | ||||||||||||||||||||
| BALANCE | CHARGED | BALANCE | ||||||||||||||||||
| AT | CHARGED | TO | AT | |||||||||||||||||
| BEGINNING | TO | OTHER | END OF | |||||||||||||||||
| DESCRIPTION | OF YEAR | EXPENSES | ACCOUNTS | DEDUCTIONS | YEAR | |||||||||||||||
Accounts Receivable Reserves: | ||||||||||||||||||||
Allowance for Doubtful Accounts | ||||||||||||||||||||
| 2011 | $ | 93 | $ | 152 | $ | — | $ | 148 | (a) | $ | 97 | |||||||||
| 2010 | 114 | 124 | — | 145 | (a) | 93 | ||||||||||||||
| 2009 | 88 | 181 | — | 155 | (a) | 114 | ||||||||||||||
Allowance for Revenue Adjustments | ||||||||||||||||||||
| 2011 | $ | 73 | $ | — | $ | 532 | (b) | $ | 520 | (c) | $ | 85 | ||||||||
| 2010 | 82 | — | 430 | (b) | 439 | (c) | 73 | |||||||||||||
| 2009 | 70 | — | 466 | (b) | 454 | (c) | 82 | |||||||||||||
Inventory Valuation Allowance: | ||||||||||||||||||||
| 2011 | $ | 170 | $ | 13 | $ | — | $ | 14 | $ | 169 | ||||||||||
| 2010 | 175 | 12 | — | 17 | 170 | |||||||||||||||
| 2009 | 163 | 15 | — | 3 | 175 | |||||||||||||||
| ADDITIONS | ||||||||||||||||||||
DESCRIPTION | BALANCE AT BEGINNING OF YEAR | CHARGED TO EXPENSES | CHARGED TO OTHER ACCOUNTS | DEDUCTIONS | BALANCE AT END OF YEAR | |||||||||||||||
Accounts Receivable Reserves: | ||||||||||||||||||||
Allowance for Doubtful Accounts | ||||||||||||||||||||
2013 | $ | 94 | $ | 167 | $ | — | $ | 167 | (a) | $ | 94 | |||||||||
|
|
|
|
|
|
|
|
|
| |||||||||||
2012 | 97 | 160 | — | 163 | (a) | 94 | ||||||||||||||
|
|
|
|
|
|
|
|
|
| |||||||||||
2011 | 93 | 152 | — | 148 | (a) | 97 | ||||||||||||||
|
|
|
|
|
|
|
|
|
| |||||||||||
Allowance for Revenue Adjustments | ||||||||||||||||||||
2013 | $ | 84 | $ | — | $ | 573 | (b) | $ | 575 | (c) | $ | 82 | ||||||||
|
|
|
|
|
|
|
|
|
| |||||||||||
2012 | 85 | — | 570 | (b) | 571 | (c) | 84 | |||||||||||||
|
|
|
|
|
|
|
|
|
| |||||||||||
2011 | 73 | — | 532 | (b) | 520 | (c) | 85 | |||||||||||||
|
|
|
|
|
|
|
|
|
| |||||||||||
Inventory Valuation Allowance: | ||||||||||||||||||||
2013 | $ | 184 | $ | 24 | $ | — | $ | 3 | $ | 205 | ||||||||||
|
|
|
|
|
|
|
|
|
| |||||||||||
2012 | 169 | 15 | — | — | 184 | |||||||||||||||
|
|
|
|
|
|
|
|
|
| |||||||||||
2011 | 170 | 13 | — | 14 | 169 | |||||||||||||||
|
|
|
|
|
|
|
|
|
| |||||||||||
| (a) | Uncollectible accounts written off, net of recoveries. | |
| (b) | Principally charged against revenue. | |
| (c) | Service failures, rebills and other. |
129
COMPUTATION OF RATIO OF EARNINGS TO FIXED CHARGES
(UNAUDITED)
(IN MILLIONS, EXCEPT RATIOS)
| Year Ended May 31, | ||||||||||||||||||||
| 2011 | 2010 | 2009 | 2008 | 2007 | ||||||||||||||||
| Earnings: | ||||||||||||||||||||
| Income before income taxes | $ | 2,265 | $ | 1,894 | $ | 677 | $ | 2,016 | $ | 3,215 | ||||||||||
| Add back: | ||||||||||||||||||||
| Interest expense, net of capitalized interest | 86 | 79 | 85 | 98 | 136 | |||||||||||||||
| Amortization of debt issuance costs | 16 | 14 | 5 | 5 | 6 | |||||||||||||||
| Portion of rent expense representative of interest factor | 852 | 806 | 795 | 784 | 766 | |||||||||||||||
| Earnings as adjusted | $ | 3,219 | $ | 2,793 | $ | 1,562 | $ | 2,903 | $ | 4,123 | ||||||||||
| Fixed Charges: | ||||||||||||||||||||
| Interest expense, net of capitalized interest | $ | 86 | $ | 79 | $ | 85 | $ | 98 | $ | 136 | ||||||||||
| Capitalized interest | 71 | 80 | 71 | 50 | 34 | |||||||||||||||
| Amortization of debt issuance costs | 16 | 14 | 5 | 5 | 6 | |||||||||||||||
| Portion of rent expense representative of interest factor | 852 | 806 | 795 | 784 | 766 | |||||||||||||||
| $ | 1,025 | $ | 979 | $ | 956 | $ | 937 | $ | 942 | |||||||||||
| Ratio of Earnings to Fixed Charges | 3.1 | 2.9 | 1.6 | 3.1 | 4.4 | |||||||||||||||
| Year Ended May 31, | ||||||||||||||||||||
| 2013 | 2012 | 2011 | 2010 | 2009 | ||||||||||||||||
Earnings: | ||||||||||||||||||||
Income before income taxes | $ | 2,455 | $ | 3,141 | $ | 2,265 | $ | 1,894 | $ | 677 | ||||||||||
Add back: | ||||||||||||||||||||
Interest expense, net of capitalized interest | 82 | 52 | 86 | 79 | 85 | |||||||||||||||
Amortization of debt issuance costs | 5 | 5 | 16 | 14 | 5 | |||||||||||||||
Portion of rent expense representative of interest factor | 864 | 797 | 852 | 806 | 795 | |||||||||||||||
|
|
|
|
|
|
|
|
|
| |||||||||||
Earnings as adjusted | $ | 3,406 | $ | 3,995 | $ | 3,219 | $ | 2,793 | $ | 1,562 | ||||||||||
|
|
|
|
|
|
|
|
|
| |||||||||||
Fixed Charges: | ||||||||||||||||||||
Interest expense, net of capitalized interest | $ | 82 | $ | 52 | $ | 86 | $ | 79 | $ | 85 | ||||||||||
Capitalized interest | 45 | 85 | 71 | 80 | 71 | |||||||||||||||
Amortization of debt issuance costs | 5 | 5 | 16 | 14 | 5 | |||||||||||||||
Portion of rent expense representative of interest factor | 864 | 797 | 852 | 806 | 795 | |||||||||||||||
|
|
|
|
|
|
|
|
|
| |||||||||||
| $ | 996 | $ | 939 | $ | 1,025 | $ | 979 | $ | 956 | |||||||||||
|
|
|
|
|
|
|
|
|
| |||||||||||
Ratio of Earnings to Fixed Charges | 3.4 | 4.3 | 3.1 | 2.9 | 1.6 | |||||||||||||||
|
|
|
|
|
|
|
|
|
| |||||||||||
130
Exhibit Number | Description of Exhibit | ||||
Certificate of Incorporation and Bylaws | |||||
| 3.1 | |||||
| 3.2 | Amended and Restated Bylaws of FedEx. (Filed as Exhibit | ||||
Facility Lease Agreements | |||||
| 10.1 | Composite Lease Agreement dated May 21, 2007 (but effective as of January 1, 2007) between the Memphis-Shelby County Airport Authority (the “Authority”) and FedEx Express. (Filed as Exhibit 10.1 to FedEx’s FY07 Annual Report on Form 10-K, and incorporated herein by reference.) | ||||
| 10.2 | First Amendment dated December 29, 2009 (but effective as of September 1, 2008) to the Composite Lease Agreement dated May 21, 2007 (but effective as of January 1, 2007) between the Authority and FedEx Express. (Filed as Exhibit 10.1 to FedEx’s FY10 Third Quarter Report on Form 10-Q, and incorporated herein by reference.) | ||||
| 10.3 | Second Amendment dated March 30, 2010 (but effective as of June 1, 2009) and Third Amendment dated April 27, 2010 (but effective as of July 1, 2009), each amending the Composite Lease Agreement dated May 21, 2007 (but effective as of January 1, 2007) between the Authority and FedEx Express. (Filed as Exhibit 10.3 to FedEx’s FY10 Annual Report on Form 10-K, and incorporated herein by reference.) | ||||
| 10.4 | Fourth Amendment dated December 22, 2011 (but effective as of December 15, 2011) to the Composite Lease Agreement dated May 21, 2007 (but effective as of January 1, 2007) between the Authority and FedEx Express. (Filed as Exhibit 10.4 to FedEx’s FY12 Third Quarter Report on Form 10-Q, and incorporated herein by reference.) | ||||
| 10.5 | Fifth Amendment dated December 19, 2012 (but effective as of January 1, 2013) to the Composite Lease Agreement dated May 21, 2007 (but effective as of January 1, 2007) between the Authority and FedEx Express. (Filed as Exhibit 10.5 to FedEx’s FY13 Third Quarter Report on Form 10-Q, and incorporated herein by reference.) | ||||
| 10.6 | Special Facility Lease Agreement dated as of August 1, 1979 between the Authority and FedEx Express. (Filed as Exhibit 10.15 to FedEx Express’s FY90 Annual Report on Form 10-K, and incorporated herein by reference.) | ||||
| 10.7 | First Special Facility Supplemental Lease Agreement dated as of May 1, 1982 between the Authority and FedEx Express. (Filed as Exhibit 10.25 to FedEx Express’s FY93 Annual Report on Form 10-K, and incorporated herein by reference.) | ||||
| 10.8 | Second Special Facility Supplemental Lease Agreement dated as of November 1, 1982 between the Authority and FedEx Express. (Filed as Exhibit 10.26 to FedEx Express’s FY93 Annual Report on Form 10-K, and incorporated herein by reference.) | ||||
Exhibit Number | Description of Exhibit | ||||
| 10.9 | Third Special Facility Supplemental Lease Agreement dated as of December 1, 1984 between the Authority and FedEx Express. (Filed as Exhibit 10.25 to FedEx Express’s FY95 Annual Report on Form 10-K, and incorporated herein by reference.) | ||||
| 10.10 | Fourth Special Facility Supplemental Lease Agreement dated as of July 1, 1992 between the Authority and FedEx Express. (Filed as Exhibit 10.20 to FedEx Express’s FY92 Annual Report on Form 10-K, and incorporated herein by reference.) | ||||
E-1
| 10.11 | Fifth Special Facility Supplemental Lease Agreement dated as of July 1, 1997 between the Authority and FedEx Express. (Filed as Exhibit 10.35 to FedEx Express’s FY97 Annual Report on Form 10-K, and incorporated herein by reference.) | ||||
| 10.12 | Sixth Special Facility Supplemental Lease Agreement dated as of December 1, 2001 between the Authority and FedEx Express. (Filed as Exhibit 10.28 to FedEx’s FY02 Annual Report on Form 10-K, and incorporated herein by reference.) | ||||
| 10.13 | Seventh Special Facility Supplemental Lease Agreement dated as of June 1, 2002 between the Authority and FedEx Express. (Filed as Exhibit 10.3 to FedEx’s FY03 First Quarter Report on Form 10-Q, and incorporated herein by reference.) | ||||
| 10.14 | Special Facility Lease Agreement dated as of July 1, 1993 between the Authority and FedEx Express. (Filed as Exhibit 10.29 to FedEx Express’s FY93 Annual Report on Form 10-K, and incorporated herein by reference.) | ||||
| 10.15 | Special Facility Ground Lease Agreement dated as of July 1, 1993 between the Authority and FedEx Express. (Filed as Exhibit 10.30 to FedEx Express’s FY93 Annual Report on Form 10-K, and incorporated herein by reference.) | ||||
| 10.16 | First Amendment dated December 29, 2009 (but effective as of September 1, 2008) to the Special Facility Ground Lease Agreement dated as of July 1, 1993 between the Authority and FedEx Express. (Filed as Exhibit 10.2 to FedEx’s FY10 Third Quarter Report on Form 10-Q, and incorporated herein by reference.) | ||||
| Aircraft-Related Agreements | |||||
| 10.17 | Boeing 777 Freighter Purchase Agreement dated as of November 7, 2006 between The Boeing Company and FedEx Express. Confidential treatment has been granted for confidential commercial and financial information, pursuant to Rule 24b-2 under the Securities Exchange Act of 1934, as amended. (Filed as Exhibit 10.1 to FedEx’s FY07 Second Quarter Report on Form 10-Q, and incorporated herein by reference.) | ||||
| 10.18 | Supplemental Agreement No. 1 dated as of June 16, 2008 to the Boeing 777 Freighter Purchase Agreement dated as of November 7, 2006 between The Boeing Company and FedEx Express. (Filed as Exhibit 10.13 to FedEx’s FY08 Annual Report on Form 10-K, and incorporated herein by reference.) | ||||
| 10.19 | Supplemental Agreement No. 2 dated as of July 14, 2008 to the Boeing 777 Freighter Purchase Agreement dated as of November 7, 2006 between The Boeing Company and FedEx Express. (Filed as Exhibit 10.3 to FedEx’s FY09 Second Quarter Report on Form 10-Q, and incorporated herein by reference.) | ||||
Exhibit Number | Description of Exhibit | |||
| 10.20 | Supplemental Agreement No. 3 dated as of December 15, 2008 (and related side letters) to the Boeing 777 Freighter Purchase Agreement dated as of November 7, 2006 between The Boeing Company and FedEx Express. Confidential treatment has been granted for confidential commercial and financial information, pursuant to Rule 24b-2 under the Securities Exchange Act of 1934, as amended. (Filed as Exhibit 10.4 to FedEx’s FY09 Second Quarter Report on Form 10-Q, and incorporated herein by reference.) | |||
E-2
| 10.21 | Supplemental Agreement No. 4 dated as of January 9, 2009 (and related side letters) to the Boeing 777 Freighter Purchase Agreement dated as of November 7, 2006 between The Boeing Company and FedEx Express. Confidential treatment has been granted for confidential commercial and financial information, pursuant to Rule 24b-2 under the Securities Exchange Act of 1934, as amended. (Filed as Exhibit 10.1 to FedEx’s FY09 Third Quarter Report on Form 10-Q, and incorporated herein by reference.) | ||||
| 10.22 | Side letters dated May 29, 2009 and May 19, 2009, amending the Boeing 777 Freighter Purchase Agreement dated as of November 7, 2006 between The Boeing Company and FedEx Express. Confidential treatment has been granted for confidential commercial and financial information, pursuant to Rule 24b-2 under the Securities Exchange Act of 1934, as amended. (Filed as Exhibit 10.17 to FedEx’s FY09 Annual Report on Form 10-K, and incorporated herein by reference.) | ||||
| 10.23 | Supplemental Agreement No. 5 dated as of January 11, 2010 to the Boeing 777 Freighter Purchase Agreement dated as of November 7, 2006 between The Boeing Company and FedEx Express. Confidential treatment has been granted for confidential commercial and financial information, pursuant to Rule 24b-2 under the Securities Exchange Act of 1934, as amended. (Filed as Exhibit 10.3 to FedEx’s FY10 Third Quarter Report on Form 10-Q, and incorporated herein by reference.) | ||||
| 10.24 | Supplemental Agreement No. 6 dated as of March 17, 2010, Supplemental Agreement No. 7 dated as of March 17, 2010, and Supplemental Agreement No. 8 (and related side letters) dated as of April 30, 2010, each amending the Boeing 777 Freighter Purchase Agreement dated as of November 7, 2006 between The Boeing Company and FedEx Express. Confidential treatment has been granted for confidential commercial and financial information, pursuant to Rule 24b-2 under the Securities Exchange Act of 1934, as amended. (Filed as Exhibit 10.22 to FedEx’s FY10 Annual Report on Form 10-K, and incorporated herein by reference). | ||||
| 10.25 | Supplemental Agreement No. 9 dated as of June 18, 2010, Supplemental Agreement No. 10 dated as of June 18, 2010, Supplemental Agreement No. 11 (and related side letter) dated as of August 19, 2010, and Supplemental Agreement No. 13 (and related side letter) dated as of August 27, 2010, each amending the Boeing 777 Freighter Purchase Agreement dated as of November 7, 2006 between The Boeing Company and FedEx Express. Confidential treatment has been granted for confidential commercial and financial information, pursuant to Rule 24b-2 under the Securities Exchange Act of 1934, as amended. (Filed as Exhibit 10.1 to FedEx’s FY11 First Quarter Report on Form 10-Q, and incorporated herein by reference.) | ||||
| 10.26 | Supplemental Agreement No. 12 (and related side letter) dated as of September 3, 2010, Supplemental Agreement No. 14 (and related side letter) dated as of October 25, 2010, and Supplemental Agreement No. 15 (and related side letter) dated as of October 29, 2010, each amending the Boeing 777 Freighter Purchase Agreement dated as of November 7, 2006 between The Boeing Company and FedEx Express. Confidential treatment has been granted for confidential commercial and financial information, pursuant to Rule 24b-2 under the Securities Exchange Act of 1934, as amended. (Filed as Exhibit 10.2 to FedEx’s FY11 Second Quarter Report on Form 10-Q, and incorporated herein by reference.) | ||||
E-3
Exhibit Number | |||||
Description of Exhibit | |||||
| 10.27 | Supplemental Agreement No. 16 (and related side letters) dated as of January 31, 2011, and Supplemental Agreement No. 17 dated as of February 14, 2011, each amending the Boeing 777 Freighter Purchase Agreement dated as of November 7, 2006 between The Boeing Company and FedEx Express. Confidential treatment has been granted for confidential commercial and financial information, pursuant to Rule 24b-2 under the Securities Exchange Act of 1934, as amended. (Filed as Exhibit 10.1 to FedEx’s FY11 Third Quarter Report on Form 10-Q, and incorporated herein by reference.) | ||||
| 10.28 | Supplemental Agreement No. 18 (and related side letter) dated as of March 30, 2011 to the Boeing 777 Freighter Purchase Agreement dated as of November 7, 2006 between The Boeing Company and FedEx Express. Confidential treatment has been | ||||
| 10.29 | Supplemental Agreement No. 19 (and related side letter) dated as of October 27, 2011, amending the Boeing 777 Freighter Purchase Agreement dated as of November 7, 2006 between The Boeing Company and FedEx Express. Confidential treatment has been granted for confidential commercial and financial information, pursuant to Rule 24b-2 under the Securities Exchange Act of 1934, as amended. (Filed as Exhibit 10.2 to FedEx’s FY12 Second Quarter Report on Form 10-Q, and incorporated herein by reference.) | ||||
| 10.30 | Supplemental Agreement No. 20 (and related side letters) dated as of December 14, 2011, amending the Boeing 777 Freighter Purchase Agreement dated as of November 7, 2006 between The Boeing Company and FedEx Express. Confidential treatment has been granted for confidential commercial and financial information, pursuant to Rule 24b-2 under the Securities Exchange Act of 1934, as amended. (Filed as Exhibit 10.2 to FedEx’s FY12 Third Quarter Report on Form 10-Q, and incorporated herein by reference.) | ||||
| 10.31 | Boeing 767-3S2 Freighter Purchase Agreement dated as of December 14, 2011 between The Boeing Company and FedEx Express. Confidential treatment has been granted for confidential commercial and financial information, pursuant to Rule 24b-2 under the Securities Exchange Act of 1934, as amended. (Filed as Exhibit 10.1 to FedEx’s FY12 Third Quarter Report on Form 10-Q, and incorporated herein by reference.) | ||||
| 10.32 | Supplemental Agreement No. 1 (and related side letters) dated as of June 29, 2012, amending the Boeing 767-3S2 Freighter Purchase Agreement dated as of December 14, 2011 between The Boeing Company and Federal Express. Confidential treatment has been granted for confidential commercial and financial information, pursuant to Rule 24b-2 under the Securities Exchange Act of 1934, as amended. (Filed as Exhibit 10.1 to FedEx’s FY13 First Quarter Report on Form 10-Q, and incorporated herein by reference.) | ||||
| 10.33 | Supplemental Agreement No. 21 dated as of June 29, 2012, amending the Boeing 777 Freighter Purchase Agreement dated November 7, 2006 between The Boeing Company and Federal Express. Confidential treatment has been granted for confidential commercial and financial information, pursuant to Rule 24b-2 under the Securities Exchange Act of 1934, as amended. (Filed as Exhibit 10.2 to FedEx’s FY13 First Quarter Report on Form 10-Q, and incorporated herein by reference.) | ||||
Exhibit Number | Description of Exhibit | ||||
| 10.34 | Supplemental Agreement No. 2 dated as of October 8, 2012, amending the Boeing 767-3S2 Freighter Purchase Agreement dated as of December 14, 2011 between The Boeing Company and Federal Express. Confidential treatment has been granted for confidential commercial and financial information, pursuant to Rule 24b-2 under the Securities Exchange Act of 1934, as amended. (Filed as Exhibit 10.2 to FedEx’s FY13 Second Quarter Report on Form 10-Q, and incorporated herein by reference.) | ||||
| 10.35 | Supplemental Agreement No. 3 (and related side letters) dated as of December 11, 2012, amending the Boeing 767-3S2 Freighter Purchase Agreement dated as of December 14, 2011 between The Boeing Company and Federal Express. Confidential treatment has been granted for confidential commercial and financial information, pursuant to Rule 24b-2 under the Securities Exchange Act of 1934, as amended. (Filed as Exhibit 10.1 to FedEx’s FY13 Third Quarter Report on Form 10-Q, and incorporated herein by reference.) | ||||
| 10.36 | Supplemental Agreement No. 22 (and related side letters) dated as of December 11, 2012, amending the Boeing 777 Freighter Purchase Agreement dated November 7, 2006 between The Boeing Company and Federal Express. Confidential treatment has been granted for confidential commercial and financial information, pursuant to Rule 24b-2 under the Securities Exchange Act of 1934, as amended. (Filed as Exhibit 10.2 to FedEx’s FY13 Third Quarter Report on Form 10-Q, and incorporated herein by reference.) | ||||
| U.S. Postal Service | |||||
| 10.37 | Transportation Agreement dated July 31, 2006 between the United States Postal Service (the “USPS”) and FedEx Express. Confidential treatment has been granted for confidential commercial and financial information, pursuant to Rule 24b-2 under the Securities Exchange Act of 1934, as amended. (Filed as Exhibit 10.2 to FedEx’s FY07 First Quarter Report on Form 10-Q, and incorporated herein by reference.) | ||||
| 10.38 | Amendment dated November 30, 2006 to the Transportation Agreement dated July 31, 2006 between the | ||||
| 10.39 | Letter Agreement dated March 8, 2007 and Letter Agreement dated May 14, 2007, each amending the Transportation Agreement dated July 31, 2006 between the | ||||
| 10.40 | Amendment dated June 20, 2007 and Amendment dated July 31, 2007, each amending the Transportation Agreement dated July 31, 2006 between the | ||||
| 10.41 | Amendment dated December 4, 2007 to the Transportation Agreement dated July 31, 2006 between the | ||||
Exhibit Number | Description of Exhibit | |||
| 10.42 | Letter Agreement dated October 23, 2008 and Amendment dated October 23, 2008, each amending the Transportation Agreement dated July 31, 2006 between the | |||
E-4
| 10.43 | Letter Agreement dated March 4, 2009, amending the Transportation Agreement dated July 31, 2006 between the | ||||
| 10.44 | Letter Agreement dated September 29, 2009, amending the Transportation Agreement dated July 31, 2006 between the | ||||
| 10.45 | Amendment dated December 8, 2009 to the Transportation Agreement dated July 31, 2006 between the | ||||
| 10.46 | Letter Agreement dated August 30, 2010, amending the Transportation Agreement dated July 31, 2006 between the | ||||
| 10.47 | Amendment dated November 22, 2010 to the Transportation Agreement dated July 31, 2006 between the | ||||
| 10.48 | Letter Agreement dated September 9, 2011, amending the Transportation Agreement dated July 31, 2006 between the USPS and FedEx Express. Confidential treatment has been granted for confidential commercial and financial information, pursuant to Rule 24b-2 under the Securities Exchange Act of 1934, as amended. (Filed as Exhibit 10.3 to FedEx’s FY12 Second Quarter Report on Form 10-Q, and incorporated herein by reference.) | ||||
| 10.49 | Amendment dated December 5, 2011 to the Transportation Agreement dated July 31, 2006 between the USPS and FedEx Express. Confidential treatment has been granted for confidential commercial and financial information, pursuant to Rule 24b-2 under the Securities Exchange Act of 1934, as amended. (Filed as Exhibit 10.3 to FedEx’s FY12 Third Quarter Report on Form 10-Q, and incorporated herein by reference.) | ||||
| 10.50 | Amendment dated December 3, 2012 to the Transportation Agreement dated July 31, 2006 between the USPS and FedEx Express. Confidential treatment has been granted for confidential commercial and financial information, pursuant to Rule 24b-2 under the Securities Exchange Act of 1934, as amended. (Filed as Exhibit 10.3 to FedEx’s FY13 Third Quarter Report on Form 10-Q, and incorporated herein by reference.) | ||||
Exhibit Number | Description of Exhibit | ||||
| 10.51 | Letter Agreement dated January 25, 2013, amending the Transportation Agreement dated July 31, 2006 between the USPS and FedEx Express. Confidential treatment has been granted for confidential commercial and financial information, pursuant to Rule 24b-2 under the Securities Exchange Act of 1934, as amended. (Filed as Exhibit 10.4 to FedEx’s FY13 Third Quarter Report on Form 10-Q, and incorporated herein by reference.) | ||||
| *10.52 | Transportation Agreement dated April 23, 2013 between the USPS and FedEx Express. Confidential treatment has been requested for confidential commercial and financial information, pursuant to Rule 24b-2 under the Securities Exchange Act of 1934, as amended. | ||||
| *10.53 | Amendment dated May 28, 2013, amending the Transportation Agreement dated April 23, 2013 between the USPS and FedEx Express. Confidential treatment has been requested for confidential commercial and financial information, pursuant to Rule 24b-2 under the Securities Exchange Act of 1934, as amended. | ||||
| Financing Agreement | |||||
| 10.54 | Five-Year Credit Agreement dated as of April 26, 2011, among FedEx, JPMorgan Chase Bank, N.A., individually and as administrative agent, and certain lenders. (Filed as Exhibit 99.1 to FedEx’s Current Report on Form 8-K dated April 26, 2011 and filed April 29, 2011, and incorporated herein by reference.) | ||||
| 10.55 | First Amendment dated March 1, 2013 amending the Five-Year Credit Agreement dated April 26, 2011, among FedEx, JPMorgan Chase Bank, N.A., individually and as administrative agent, and certain lenders. (Filed as Exhibit 10.6 to FedEx’s FY13 Third Quarter Report on Form 10-Q, and incorporated herein by reference.) FedEx is not filing any other instruments evidencing any indebtedness because the total amount of securities authorized under any single such instrument does not exceed 10% of the total assets of FedEx and its subsidiaries on a consolidated basis. Copies of such instruments will be furnished to the Securities and Exchange Commission upon request. | ||||
Management Contracts/Compensatory Plans or Arrangements | |||||
| 10.56 | Amendment to 1993 Stock Incentive Plan. (Filed as Exhibit 10.63 to FedEx Express’s FY94 Annual Report on Form 10-K, and incorporated herein by reference.) | ||||
E-5
| 10.57 | ||||
1995 Stock Incentive Plan and Form of Stock Option Agreement pursuant to 1995 Stock Incentive Plan. (The 1995 Stock Incentive Plan was filed as Exhibit A to FedEx Express’s FY95 Definitive Proxy Statement, and is incorporated herein by reference, and the form of stock option agreement was filed as Exhibit 99.2 to FedEx Express’s Registration Statement No. 333-03443 on Form S-8, and is incorporated herein by reference.) | ||||
| 10.58 | ||||
Amendment to 1993 and 1995 Stock Incentive Plans. (Filed as Exhibit 10.79 to FedEx | ||||
| 10.59 | ||||
1997 Stock Incentive Plan, as amended, and Form of Stock Option Agreement pursuant to 1997 Stock Incentive Plan. (The 1997 Stock Incentive Plan was filed as Exhibit 4.3 to FedEx’s Registration Statement on Form S-8, Registration No. 333-71065, and is incorporated herein by reference, and the form of stock option agreement was filed as Exhibit 4.4 to FedEx’s Registration Statement No. 333-71065 on Form S-8, and is incorporated herein by reference.) | ||||
Exhibit Number | Description of Exhibit | ||||
| 10.60 | Amendment to 1997 Stock Incentive Plan. (Filed as Exhibit A to FedEx’s FY98 Definitive Proxy Statement, and incorporated herein by reference.) | ||||
| 10.61 | |||||
1999 Stock Incentive Plan and Form of Stock Option Agreement pursuant to 1999 Stock Incentive Plan. (The 1999 Stock Incentive Plan was filed as Exhibit 4.3 to FedEx’s Registration Statement No. 333-34934 on Form S-8, and is incorporated herein by reference, and the form of stock option agreement was filed as Exhibit 4.4 to FedEx’s Registration Statement No. 333-34934 on Form S-8, and is incorporated herein by reference.) | |||||
| 10.62 | |||||
2002 Stock Incentive Plan and Form of Stock Option Agreement pursuant to 2002 Stock Incentive Plan. (The 2002 Stock Incentive Plan was filed as Exhibit 4.3 to FedEx’s Registration Statement No. 333-100572 on Form S-8, and is incorporated herein by reference, and the form of stock option agreement was filed as Exhibit 4.4 to FedEx’s Registration Statement No. 333-100572 on Form S-8, and is incorporated herein by reference.) | |||||
| 10.63 | |||||
2001 Restricted Stock Plan and Form of Restricted Stock Agreement pursuant to 2001 Restricted Stock Plan. (Filed as Exhibit 10.60 to FedEx’s FY01 Annual Report on Form 10-K, and incorporated herein by reference.) | |||||
| 10.64 | |||||
Amendment to 2001 Restricted Stock Plan. (Filed as Exhibit 10.67 to FedEx’s FY02 Annual Report on Form 10-K, and incorporated herein by reference.) | |||||
| 10.65 | Amendment to 1995, 1997, 1999 and 2002 Stock Incentive Plans and 2001 Restricted Stock Plan. (Filed as Exhibit 10.3 to FedEx’s FY04 Second Quarter Report on Form 10-Q, and incorporated herein by reference.) | ||||
E-6
| 10.66 | |||||
FedEx Corporation Incentive Stock Plan, as amended; Amendment to FedEx Corporation Incentive Stock Plan, as amended, and 1997, 1999 and 2002 Stock Incentive Plans; Form of Terms and Conditions of stock option grant pursuant to FedEx Corporation Incentive Stock Plan, as amended; and Form of Restricted Stock Agreement pursuant to FedEx Corporation Incentive Stock Plan, as amended. (The FedEx Corporation Incentive Stock Plan, as amended, was filed as Exhibit 4.1 to FedEx’s Registration Statement No. 333-156333 on Form S-8, and is incorporated herein by reference; the Amendment to FedEx Corporation Incentive Stock Plan, as amended, and 1997, 1999 and 2002 Stock Incentive Plans was filed as Exhibit 4.2 to FedEx’s Registration Statement No. 333-156333 on Form S-8, and is incorporated herein by reference; the Form of Terms and Conditions of stock option grant pursuant to FedEx Corporation Incentive Stock Plan, as amended, was filed as Exhibit 4.3 to FedEx’s Registration Statement No. 333-156333 on Form S-8, and is incorporated herein by reference; and the Form of Restricted Stock Agreement pursuant to FedEx Corporation Incentive Stock Plan, as amended, was filed as Exhibit 4.4 to FedEx’s Registration Statement No. 333-156333 on Form S-8, and is incorporated herein by reference.) | |||||
| 10.67 | FedEx Corporation Incentive Stock Plan 2005 Inland Revenue Approved Sub-Plan for the United Kingdom and Form of Share Option Agreement pursuant to the FedEx Corporation Incentive Stock Plan 2005 Inland Revenue Approved Sub-Plan for the United Kingdom. (The United Kingdom Sub-Plan was filed as Exhibit 4.2 to FedEx’s Registration Statement No. 333-130619 on Form S-8, and is incorporated herein by reference, and the form of share option agreement pursuant to the UK Sub-Plan was filed as Exhibit 4.3 to FedEx’s Registration Statement No. 333-130619 on Form S-8, and is incorporated herein by reference.) | ||||
Exhibit Number | Description of Exhibit | ||||
| 10.68 | Amendments to 1993, 1995, 1997, 1999 and 2002 Stock Incentive Plans, as amended, 2001 Restricted Stock Plan, as amended, and FedEx Corporation Incentive Stock Plan, as amended. (Filed as Exhibit 10.48 to FedEx’s FY10 Annual Report on Form 10-K, and incorporated herein by reference.) | ||||
| 10.69 | Amendments to 1993, 1995, 1997, 1999 and 2002 Stock Incentive Plans, 2001 Restricted Stock Plan and FedEx Corporation Incentive Stock Plan. (Filed as Exhibit 10.2 to FedEx’s FY11 Third Quarter Report on Form 10-Q, and incorporated herein by reference.) | ||||
| 10.70 | FedEx Corporation 2010 Omnibus Stock Incentive Plan; Form of Terms and Conditions of stock option grant pursuant to FedEx Corporation 2010 Omnibus Stock Incentive Plan; and Form of Terms and Conditions of restricted stock grant pursuant to FedEx Corporation 2010 Omnibus Stock Incentive Plan. (The FedEx Corporation 2010 Omnibus Stock Incentive Plan was filed as Exhibit 4.3 to FedEx’s Registration Statement No. 333-171232 on Form S-8, and is incorporated herein by reference; the Form of Terms and Conditions of stock option grant pursuant to FedEx Corporation 2010 Omnibus Stock Incentive Plan was filed as Exhibit 4.4 to FedEx’s Registration Statement No. 333-171232 on Form S-8, and is incorporated herein by reference; and the Form of Terms and Conditions of restricted stock grant pursuant to FedEx Corporation 2010 Omnibus Stock Incentive Plan was filed as Exhibit 4.5 to FedEx’s Registration Statement No. 333-171232 on Form S-8, and is incorporated herein by reference.) | ||||
| 10.71 | Amended and Restated FedEx Corporation Retirement Parity Pension Plan. (Filed as Exhibit 10.35 to FedEx’s FY08 Annual Report on Form 10-K, and incorporated herein by reference.) | ||||
| 10.72 | FedEx Express Supplemental Long Term Disability Plan and Amendment to the Plan. (Filed as Exhibit 10.56 to FedEx’s FY11 Annual Report on Form 10-K, and incorporated herein by reference.) | ||||
| * | 10.73 | Compensation Arrangements with Named Executive Officers. | |||
E-7
| 10.74 | Compensation Arrangements with Outside Directors. (Filed as Exhibit 10.1 to FedEx’s | ||||
| 10.75 | FedEx’s Amended and Restated Retirement Plan for Outside Directors. (Filed as Exhibit 10.2 to FedEx’s FY09 Second Quarter Report on Form 10-Q, and incorporated herein by reference.) | ||||
| 10.76 | Form of revised Management Retention Agreement, dated March 18, 2010, entered into between FedEx and each of Frederick W. Smith, David J. Bronczek, Robert B. Carter, T. Michael Glenn, Alan B. Graf, Jr., William J. Logue, David F. Rebholz and Christine P. Richards. (Filed as Exhibit 10.5 to FedEx’s FY10 Third Quarter Report on Form 10-Q, and incorporated herein by reference.) | ||||
| Other Exhibits | |||||
| *12 | Statement re Computation of Ratio of Earnings to Fixed Charges (presented on page | ||||
| *21 | Subsidiaries of Registrant. | ||||
| *23 | Consent of Ernst & Young LLP, Independent Registered Public Accounting Firm. | ||||
Exhibit Number | Description of Exhibit | ||||
| *24 | Powers of Attorney. | ||||
| *31.1 | Certification of Principal Executive Officer Pursuant to Rules 13a-14(a) and 15d-14(a) under the Securities Exchange Act of 1934, as Adopted Pursuant to Section 302 of the Sarbanes-Oxley Act of 2002. | ||||
| *31.2 | Certification of Principal Financial Officer Pursuant to Rules 13a-14(a) and 15d-14(a) under the Securities Exchange Act of 1934, as Adopted Pursuant to Section 302 of the Sarbanes-Oxley Act of 2002. | ||||
| *32.1 | Certification of Principal Executive Officer Pursuant to 18 U.S.C. Section 1350, as Adopted Pursuant to Section 906 of the Sarbanes-Oxley Act of 2002. | ||||
| *32.2 | Certification of Principal Financial Officer Pursuant to 18 U.S.C. Section 1350, as Adopted Pursuant to Section 906 of the Sarbanes-Oxley Act of 2002. | ||||
| *101.1 | Interactive Data Files. | ||||
| * | Filed herewith. |
E-8E-10