UNITED STATES SECURITIES AND EXCHANGE COMMISSION
Washington, D.C. 20549
Form 10-K
Form 10-K
|
| | |
| þ | | ANNUAL REPORT PURSUANT TO SECTION 13 OR 15(d) OF THE SECURITIES EXCHANGE ACT OF 1934 |
For the fiscal year ended July 2, 2011June 29, 2013
or
|
| | |
| o | | TRANSITION REPORT PURSUANT TO SECTION 13 OR 15(d) OF THE SECURITIES EXCHANGE ACT OF 1934 |
For the transition period fromto
Commission file number 1-4224
Avnet, Inc.
(Exact name of registrant as specified in its charter)
| | |
| |
New York
(State or other jurisdiction of
incorporation or organization) | | 11-1890605
(I.R.S. Employer
Identification No.) |
| | |
2211 South 47th Street,
Phoenix, Arizona
(Address of principal executive offices) | | 85034
(Zip Code) |
Registrant’s telephone number, including area code (480) 643-2000
Securities registered pursuant to Section 12(b) of the Act:
| | |
| | |
| Title of Each Class | | Name of Each Exchange on Which Registered |
| Common Stock | | New York Stock Exchange |
Securities registered pursuant to Section 12(g) of the Act:
None
None
Indicate by check mark if the registrant is a well-known seasoned issuer, as defined in Rule 405 of the Securities Act. Yesþ Noo
Indicate by check mark if the registrant is not required to file reports pursuant to Section 13 or Section 15(d) of the Act. Yeso Noþ
Indicate by check mark whether the registrant (1) has filed all reports required to be filed by Section 13 or 15(d) of the Securities Exchange Act of 1934 during the preceding 12 months (or for such shorter period that the registrant was required to file such reports), and (2) has been subject to such filing requirements for the past 90 days. Yesþ Noo
Indicate by check mark whether the registrant has submitted electronically and posted on its corporate Web site, if any, every Interactive Data File required to be submitted and posted pursuant to Rule 405 of Regulation S-T during the preceding 12 months (or for such shorter period that the registrant was required to submit and post such files). Yesþ Noo
Indicate by check mark if disclosure of delinquent filers pursuant to Item 405 of Regulation S-K is not contained herein, and will not be contained, to the best of registrant’s knowledge, in definitive proxy or information statements incorporated by reference in Part III of this Form 10-K or any amendment to this Form 10-K.oþ
Indicate by check mark whether the registrant is a large accelerated filer, an accelerated filer, a non-accelerated filer, or a smaller reporting company. See the definitions of “large accelerated filer,” “accelerated filer” and “smaller reporting company” in Rule 12b-2 of the Exchange Act.:
| | | | | | |
| | | |
Large accelerated filerþ | | Accelerated filero | | Non-accelerated filero | | Smaller reporting companyo |
| | | | (Do not check if a smaller reporting company) | | Smaller reporting company o |
Indicate by checkmarkcheck mark whether the registrant is a shell company (as defined in Rule 12b-2 of the Exchange Act). Yeso Noþ
The aggregate market value (approximate) of the registrant’s common equity held by non-affiliates based on the closing price of a share of the registrant’s common stock for New York Stock Exchange composite transactions on January 1, 2011December 28, 2012 (the last business day of the registrant’s most recently completed second fiscal quarter) was $4,995,335,220.$4,058,517,453.
As of July 29, 2011,26, 2013, the total number of shares outstanding of the registrant’s Common Stock was 152,807,450137,153,362 shares, net of treasury shares.
DOCUMENTS INCORPORATED BY REFERENCE
Portions of the registrant’s definitive proxy statement (to be filed pursuant to Reg. 14A) relating to the Annual Meeting of Shareholders anticipated to be held on November 4, 20118, 2013 are incorporated herein by reference in Part III of this Report.
TABLE OF CONTENTS
PART I
Avnet, Inc., incorporated in New York in 1955, together with its consolidated subsidiaries (the “Company” or “Avnet”), is one of the world’s largest industrialvalue-added distributors, based on sales, of electronic components, enterprise computer and storage products, IT services and embedded subsystems. Avnet creates a vital link in the technology supply chain that connects more than 300 of the world’s leading electronic component and computer product manufacturers and software developers with a global customer base of more than 100,000 original equipment manufacturers (“OEMs”), electronic manufacturing services (“EMS”) providers, original design manufacturers (“ODMs”), and value-added resellers (“VARs”). Avnet distributes electronic components, computer products and software, as received from its suppliers or withthrough a customized solution, and offers assembly orand other value added by Avnet. Additionally,value-added services. In addition, Avnet provides engineering design, materials management and logistics services, system integration and configuration, and supply chain services that can be customized to meet thespecific requirements of both customers and suppliers.
Organizational Structure
Avnet has two primary operating groups — Electronics Marketing (“EM”) and Technology Solutions (“TS”). Both operating groups have operations in each of the three major economic regions of the world: the Americas; Europe, the Middle East and Africa (“EMEA”); and Asia/Pacific, consisting of Asia, Australia and New Zealand (“Asia” or “Asia/Pac”). Each operating group has its own management team led by a group president and includes regional presidents and senior executives within the operating group who manage the various functions within the businesses. Each operating group also has distinct financial reporting that is evaluated at the corporate level on which operating decisions and strategic planning for the Company as a whole are made. Divisions exist within each operating group that serve primarily as sales and marketing units to further streamline the sales and marketing efforts within each operating group and enhance each operating group’s ability to work with its customers and suppliers, generally along more specific product lines or geographies. However, each division relies heavily on the support services provided by the operating group as well as centralized support at the corporate level.
Avnet’s operating groups and their sales are as follows:
| | | | | | | | | |
| | | Fiscal 2011 | | Percentage |
| Region | | Sales | | of Sales |
| | | (Millions) | | | | | |
| EM Americas | | $ | 5,113.8 | | | | 19.3 | % |
| EM EMEA | | | 4,816.3 | | | | 18.1 | |
| EM Asia | | | 5,136.1 | | | | 19.4 | |
| | | | | | | |
| Total EM | | | 15,066.2 | | | | 56.8 | |
| | | | | | | |
| TS Americas | | | 6,404.7 | | | | 24.1 | |
| TS EMEA | | | 3,577.1 | | | | 13.5 | |
| TS Asia | | | 1,486.4 | | | | 5.6 | |
| | | | | | | |
| Total TS | | | 11,468.2 | | | | 43.2 | |
| | | | | | | |
| Total Avnet | | $ | 26,534.4 | | | | 100.0 | % |
| | | | | | | |
|
| | | | | | |
| Region | Fiscal 2013 Sales | | Percentage of Sales |
| | (Millions) | | |
| EM Americas | $ | 5,263.8 |
| | 20.7 | % |
| EM EMEA | 4,096.0 |
| | 16.1 |
|
| EM Asia | 5,734.6 |
| | 22.5 |
|
| Total EM | 15,094.4 |
| | 59.3 |
|
| TS Americas | 5,452.8 |
| | 21.4 |
|
| TS EMEA | 3,181.9 |
| | 12.5 |
|
| TS Asia | 1,729.8 |
| | 6.8 |
|
| Total TS | 10,364.5 |
| | 40.7 |
|
| Total Avnet | $ | 25,458.9 |
| | 100.0 | % |
A description of each operating group and its businesses is presented below. Further financial information by operating group and geography is provided in Note 16 to the consolidated financial statements appearing in Item 15 of this Report.
Electronics Marketing
EM markets and sells semiconductors, and interconnect, passive and electromechanical devices (“IP&E”) and embedded products for more than 300 of the world’s leading electronic component manufacturers. EM markets and sells its products and services to a diverse customer base serving many end-markets including automotive, communications, computer hardware and peripheral,peripherals, industrial and manufacturing, medical equipment, militaryand defense and aerospace. EM also offers an array of value-added services that help customers evaluate, design-in and procure electronic components throughout the lifecycle of their technology products and systems. By working with EM, from the design phase through new product introduction and throughout the product lifecycle, customers and suppliers can accelerate their time to market and realize cost efficiencies in both the design and manufacturing process.
3
EM Design Chain Services3
EM Design Chain Services
EM offers design chain services that provide engineers a host of technical design solutions in support of the sales process of complex products and technologies. With access to a suite of design tools and engineering services from any point in the design cycle, customers can get product specifications along with evaluation kits and reference designs that enable a broad range of applications from concept through detailed design including new product introduction. EM also offers engineering and technical resources deployed globally to support product design, bill of materials development, design services and technical education and training. By utilizing EM’s Design Chain Services,design chain services, customers can optimize their component selection and accelerate their time to market.
EM Supply Chain Services
EM Supply Chain Services providessupply chain services provide end-to-end solutions focused on OEMs, EMS providers and electronic component manufacturers, enabling them to optimize supply chains on a local, regional or global basis. By combining internal competencies in global warehousing and logistics, finance, information technology and asset management with its global footprint and extensive partner relationships, EM’s Supply Chain Services developssupply chain services develop a deeper level of engagement with its customers. These customers can continuously manage their supply chains to meet the demands of a competitive environment globally without a commensurate investment in physical assets. With proprietary planning tools and a variety of inventory management solutions, EM can provide unique solutions that meet a customer’s just-in-time requirements in a variety of scenarios including lean manufacturing, demand flow and outsourcing.
Embedded Solutions
In the Americas, Avnet Electronics MarketingEmbedded provides embedded computing solutions including technical design, integration and assembly to developers of application-specific computing solutions in the non-PC market. Customers include OEMs targeting the medical, telecommunications, industrial and digital editing markets. The Embedded Solutions group represents the combination of the EM Americas existing embedded business, the acquired Bell Microproducts Inc. embedded business and the TS Americas embedded business that was transferred to EM Americas in the first quarter of fiscal 2011.
EM Sales and Marketing Divisions
Each of EM’s regions has sales and marketing divisions that generally focus on a specific customer segment, particular product lines or a specific geography. The divisions offer access to one of the industry’s broadest line cards and convenient one-stop shopping with an emphasis on responsiveness, engineering support, on-time delivery and quality. Certain specialty services are made available to the individual divisions through common support service units. Customers are further supported by a sophisticated e-commercee-Commerce platform, Avnet Express, thatwhich includes a host of powerful functions such as parametric parts searches,search capabilities for component part selection, bill of material optimization and partscomponent cross-referencing. The site enables end-to-end online service from part and inventory searches, price checking and ordering to online payment. EM Americas addresses the needs of its customers and suppliers through focused channels to service small- to medium-sized customers, global customers, defense and aerospace customers and contract manufacturers. In EMEA, divisions, which are organized by semiconductors, IP&E products and supply chain services, address customers on both a pan-European and regional basis. EM EMEA does business in over 40 European countries, and over 10 countries in the Middle East and Africa. EM Asia goes to market with sales and marketing divisions within China, South Asia, TaiwanAustralia, New Zealand and Japan.Taiwan. EM Japan has sales and marketing divisions to serve Japanese OEMs in Japan, Southeast Asia and China. All regions within EM provide the Design Chain Servicesdesign chain services and Supply Chain Servicessupply chain services described above.
Technology Solutions
As a leading global IT solutions distributor, TS collaborates with its customers and suppliers to create and deliver services, software and hardware solutions that address the business needs of end-user customers locally and around the world. TS focuses on the global value-added distribution of enterprise computing servers and systems, software, storage, services and complex solutions from the world’s foremost technology manufacturers, marketingmanufacturers. TS partners with its customers and selling themsuppliers to create and throughdeliver effective data center and IT lifecycle solutions that solve the VAR channel.business challenges of end-user customers locally and around the world. TS also serves a number of customer segments, from VARs, system integrators ("SIs") and independent software vendors ("ISVs") to the worldwide OEM market for computing technology system integrators and non-PC OEMs that requirerequiring embedded systems and solutions including engineering, product prototyping, integration and other value-added services. The operating groupTS also provides the latest hard disk drives, microprocessor, motherboard and DRAM module technologies to manufacturers of general-purpose computers and system builders. TS has dedicated sales and marketing divisions dedicated toteams serving these customer segmentssegments.
Customers rely on TS' supplier relationships and experienced sales, marketing, technical and financial experts to help them identify and capitalize on business opportunities in high-growth technology, vertical markets and geographic services to close deals quickly and profitably. Suppliers rely on TS' technology expertise and global scale and scope to broaden their customer base and grow sales in markets around the world. TS has built an ecosystem of highly-trained and knowledgeable VARs who serve as well as independent software vendors.
4
TS enables VARsextensions of suppliers' sales forces to grow faster by helping them understand their customers’ unique business requirements so that they can tailor a completedeliver complex IT solution spanning supplier lines and delivering a higher return on investment.solutions. Unique to Avnet SolutionsPath®is its proven SolutionsPath® methodology, which offers a proven methodology comprisingmarket-specific business analysis and planning, training and enablement, and ongoing support to help partners quickly
and cost effectively attain solution-selling expertise they can use to develop and deploy an array of data center solutions for high-growth market segments. Avnet SolutionsPath® includes practices dedicated to vertical markets such as healthcare, government, energy, banking and retail, as well as technology practices focused on virtualization, storage, networking, security, unified communications, mobility and cloud computing.
TS also provides logistics, sales, marketing, financiala robust portfolio of software, IT lifecycle and technicaleducational service offerings that expand customers' solution delivery capabilities, extend their reach and resources, and enhance project success and return on investment for deployments throughout the IT lifecycle. The TS team sells and delivers complex IT solutions to a variety of channel partners, including VARs, ISVs, SIs and OEMs. Areas of expertise include infrastructure and application management, business commerce and analytics, cloud enablement, aftermarket and IT lifecycle services, including engineering support, systems integration and configurations.multilingual vendor accredited training. To continue to meet customer expectations in an evolving IT ecosystem, TS is also focused on delivering single and multi-vendor converged systems.
In EMEATS continues to invest in geographic, technology and Asia/Pacific,vertical markets with high growth potential via strategic, value-creating acquisitions and organic local market development. These investments ensure that TS provides embedded computing solutions including technical design, integrationhas the critical scale and assemblylocal market expertise in place when and where its customers and suppliers want to developers of application-specific computing solutions in the non-PC market. Developers include OEMs targeting the medical, telecommunications, industrialdo business so that they can capture opportunities quickly and digital editing markets. In these regions, TS also provides the latest hard disk drives, microprocessor, motherboardwith less risk and DRAM module technologies to manufacturers of general-purpose computers and system builders.cost.
Foreign Operations
As noted in the operating group discussions, Avnet has significant operations in all three major economic regions of the world: the Americas, EMEA and Asia/Pacific. The percentage of Avnet’s consolidated sales by region is presented in the following table:
| | | | | | | | | | | | | |
| | | Percentage of Sales for Fiscal Year |
| Region | | 2011 | | 2010 | | 2009 |
| Americas | | | 43 | % | | | 44 | % | | | 47 | % |
| EMEA | | | 32 | | | | 31 | | | | 32 | |
| Asia/Pac | | | 25 | | | | 25 | | | | 21 | |
| | | | | | | | | | | | | |
| | | | 100 | % | | | 100 | % | | | 100 | % |
| | | | | | | | | | | | | |
|
| | | | | |
| | Percentage of Sales for Fiscal Year |
| Region | 2013 | | 2012 | | 2011 |
| Americas | 42% | | 45% | | 43% |
| EMEA | 29 | | 29 | | 32 |
| Asia/Pac | 29 | | 26 | | 25 |
| | 100% | | 100% | | 100% |
Avnet’s foreign operations are subject to a variety of risks. These risks are discussed further underRisk Factorsin Item 1A and underQuantitative and Qualitative Disclosures About Market Riskin Item 7A of this Report. Additionally, the specific translation impacts of foreign currency fluctuations, most notably the Euro, on the Company’s consolidated financial statements are further discussed inManagement’s Discussion and Analysis of Financial Condition and Results of Operationsin Item 7 of this Report.
Acquisitions
Avnet has historically pursued a strategic acquisition program to growfurther its geographicstrategic objectives and market coverage in world markets for electronic components and computer products and solutions.support key business initiatives. This program was a significant factor in Avnet becoming one of the largest industrialvalue-added distributors of suchelectronic components, enterprise computer and storage products, IT services and services worldwide.embedded subsystems. Avnet expects to continue to pursue strategic acquisitions as part of its overall growth strategy, with its focus likely directed primarily at smaller targets in markets where the Company is seeking to expand its market presence, increase its scale and scope, and/orand increase its product or service offerings.
During fiscal 2011,2013, the Company completed seven12 acquisitions the most significant of which was the acquisition of Bell Microproducts Inc. (“Bell”), a value-added distributor of storage and server products and solutions and computer components products, providing integration and support services to OEMs, VARs, system builders and end users in the U.S., Canada, EMEA and Latin America. Bell operated both a distribution and single tier reseller business and generated saleswith aggregate annualized revenue of approximately $3.0$1.18 billion in calendar 2009, of which 42%, 41% and 17% was generated in North America, EMEA and Latin America, respectively. The consideration for the transaction totaled $255 million for the equity of Bell which consisted of $7.00 in cash for each share of Bell common stock outstanding, cash payment for Bell equity awards, and cash payments required under existing Bell change of control agreements, plus the assumption of $323 million of Bell net debt. Of the debt acquired, Avnet repaid approximately $210 million of debt (including associated fees) immediately after closing. As of the end of fiscal 2011, the Company has completed the integration of Bell into both the EM and TS operating groups and expects the full impact of the cost synergies to be realized in the first quarter of fiscal 2012.
5
. See Item 7.Management’s Discussion and Analysis of Financial Condition and Results of Operationsin Part II of this Form 10-K for additional information on acquisitions completed during fiscal 2011, 20102013, 2012 and 2009.2011.
Major Products
One of Avnet’s competitive strengths is the breadth and quality of the suppliers whose products it distributes. IBM products accounted for approximately 12%, 15%11% and 15%12% of the Company’s consolidated sales during fiscal 2011, 20102013, 2012 and 2009, 2011,
respectively, and was the only supplier from which sales of its products exceeded 10% of consolidated sales. Listed in the table below are the major product categories and the Company’s approximate sales of each during the past three fiscal years:
| | | | | | | | | | | | | |
| | | Years Ended | |
| | | July 2, | | | July 3, | | | June 27, | |
| | | 2011 | | | 2010 | | | 2009 | |
| | | (Millions) | |
| Semiconductors | | $ | 14,149.3 | | | $ | 10,098.7 | | | $ | 8,324.0 | |
| Computer products | | | 10,284.6 | | | | 7,302.8 | | | | 6,393.4 | |
| Connectors | | | 1,041.4 | | | | 841.4 | | | | 735.2 | |
| Passives, electromechanical and other | | | 1,059.1 | | | | 917.3 | | | | 777.3 | |
| | | | | | | | | | |
| | | $ | 26,534.4 | | | $ | 19,160.2 | | | $ | 16,229.9 | |
| | | | | | | | | | |
|
| | | | | | | | | | | |
| | Years Ended |
| | June 29, 2013 | | June 30, 2012 | | July 2, 2011 |
| | (Millions) |
| Semiconductors | $ | 13,720.8 |
| | $ | 13,461.6 |
| | $ | 14,149.3 |
|
| Computer products | 9,346.0 |
| | 9,984.4 |
| | 10,284.6 |
|
| Connectors | 687.6 |
| | 667.5 |
| | 1,041.4 |
|
| Passives, electromechanical and other | 1,704.5 |
| | 1,594.0 |
| | 1,059.1 |
|
| | $ | 25,458.9 |
| | $ | 25,707.5 |
| | $ | 26,534.4 |
|
Competition & Markets
Avnet is one of the world’s largest industrial distributors, based on sales, of electronic components and computer products and services. The Company has more than 300 locations worldwide as well as a limited number of instances where Avnet-owned product is stored in customer facilities. Some of these locations contain sales, warehousing and administrative functions for multiple sales and marketing units.
The electronic components and computer products industries continue to be extremely competitive and are subject to rapid technological advances. The Company’s major competitors include Arrow Electronics, Inc., Future Electronics and World Peace Group.Group, and, to a lesser extent, Ingram Micro, Inc. and Tech Data Corp. There are also certain smaller, specialized competitors who generally focus on narrower markets, products or particular sectors. As a result of these factors, Avnet must remain competitive in its pricing of goods and services.
AnotherA key competitive factor in the electronic component and computer product distribution industry is the need to carry a sufficient amount of inventory to meet customers’ rapid delivery requirements. However, toTo minimize its exposure related to valuation of inventory on hand, the majority of the Company’s products are purchased pursuant to non-exclusive distributor agreements. These agreements, which typically provide certain protections for product obsolescence and price erosion anderosion. These agreements are generally cancelable upon 30 to 180 days’ notice. Innotice and, in most cases, these agreements provide for inventory return privileges upon cancellation. In addition, the Company enhances its competitive position by offering a variety of value-added services, which entail the performance of services and/or processes tailored to individual customer specifications and business needs such as point of use replenishment, testing, assembly, supply chain management and materials management. For the year ended June 29, 2013, sales of services constituted less than 10% of our total revenues.
AnotherA competitive advantage is the size of the supplier base. Because of the number of Avnet’s suppliers, many customers can simplify their procurement process and make all of their required purchases from Avnet, rather than purchasing from several different vendors.
Seasonality
Historically, Avnet’s business has not been materially impacted by seasonality, with the exception of a relatively minor impact on consolidated results from the growth in revenues in the Technology SolutionsTS business during the December quarter primarily driven by the fiscalcalendar year end of a key supplier.suppliers and customers.
6
Number of Employees
At July 2, 2011,June 29, 2013, Avnet had approximately 17,60018,500 employees.
Available Information
The Company files its annual report on Form 10-K, quarterly reports on Form 10-Q, current reports on Form 8-K, proxy statements and other documents with the U.S. Securities and Exchange Commission (“SEC”) under the Securities Exchange Act of 1934. A copy of any document the Company files with the SEC is available for review at the SEC’s public reference room, 100 F Street, N.E., Washington, D.C. 20549. The public may obtain information on the public reference room by calling the SEC at 1-800-SEC-0330. The Company’s SEC filings are also available to the public on the SEC’s website athttp://www.sec.gov and through the New York Stock Exchange (“NYSE”), 20 Broad Street, New York, New York 10005, on which the Company’s common stock is listed.
A copy of any of the Company’s filings with the SEC, or any of the agreements or other documents that constitute exhibits to those filings, can be obtained by request directed to the Company at the following address and telephone number:
Avnet, Inc.
2211 South 47th Street
Phoenix, Arizona 85034
(480) 643-2000
Attention: Corporate Secretary
The Company also makes these filings available, free of charge, through its website (see “Avnet Website” below).
Avnet Website
In addition to the information about Avnet contained in this Report, extensive information about the Company can be found atwww.avnet.com, including information about its management team, products and services and corporate governance practices.
The corporate governance information on the website includes the Company’s Corporate Governance Guidelines, the Code of Conduct and the charters for each of the committees of Avnet’s Board of Directors. In addition, amendments to the Code of Conduct, committee charters and waivers granted to directors and executive officers under the Code of Conduct, if any, will be posted in this area of the website. These documents can be accessed atwww.avnet.com under the “Investor Relations — Corporate Governance” caption. Printed versions of the Corporate Governance Guidelines, Code of Conduct and charters of the Board committees can be obtained, free of charge, by writing to the Company at the address listed above in “Available Information.”
In addition, the Company’s Annual Report on Form 10-K, Quarterly Reports on Form 10-Q, Current Reports on Form 8-K and amendments to those reports, if any, filed or furnished pursuant to Section 13(a) or 15(d) of Securities Exchange Act of 1934, as well as Section 16 filings made by any of the Company’s executive officers or directors with respect to Avnet common stock, are available on the Company’s website (www.avnet.com under the “Investor Relations — SEC Filings” caption) as soon as reasonably practicable after the report is electronically filed with, or furnished to, the Securities and Exchange Commission.
These details about Avnet’s website and its content are only for information. The contents of the Company’s website are not, nor shall they be deemed to be, incorporated by reference in this Report.
Item 1A. Risk Factors
Forward-Looking Statements Andand Risk Factors
This Report contains forward-looking statements with respect to the financial condition, results of operations and business of Avnet. These statements are generally identified by words like “believes,” “expects,” “anticipates,” “should,” “will,” “may,” “estimates” or similar expressions. Forward-looking statements are subject to numerous assumptions, risks and uncertainties.
7
Except as required by law, Avnet does not undertake any obligation to update any forward-looking statements, whether as a result of new information, future events or otherwise. Factors that may cause actual results to differ materially from those contained in the forward-looking statements include the following:
Economic weakness and uncertainty could adversely affect our revenuesresults and gross margins.prospects.
The Company’s revenuesCompany's results, operations and gross profit marginsprospects depend significantly on worldwide economic conditions, the demand for its products and services, and the financial condition of its customers.customers and suppliers. Economic weakness and uncertainty, including ongoing macroeconomic issues in many countries, have in the past resulted, and may result in the future, in decreased revenues, margins, earnings and gross profit margins.impairments to long-lived assets, including goodwill and other intangible assets. Economic weakness and uncertainty also make it more difficult for the Company to forecast with a great deal of confidence the overall supplymanage inventory levels and/or collect customer receivables, which may result in reduced access to liquidity and demand throughout the IT supply chain.higher financing costs.
While the Company’s operating results over the past four quarters would suggest that the business has experienced a significant recovery, there can be no assurance that the recovery to date will continue at the current pace or at all; nor can there be any assurance that such economic volatility experienced recently will not reoccur or continue.
The electronics component and computer industries are highly competitive and if the Company fails to compete effectively, its revenues, gross profit margins and prospects may decline.
The market for the Company’sCompany's products and services is very competitive and subject to rapid technological advances.advances, new market entrants, changes in industry standards and changes in customer needs. Not only does the Company compete with other global distributors, it also competes for customers with regional distributors and some of the Company’sCompany's own suppliers.suppliers that maintain direct sales efforts. The Company’sCompany's failure to maintain and enhance its competitive position could adversely affect its business and prospects. Furthermore, the Company’sCompany's efforts to compete in the marketplace could cause deterioration of gross profit margins and, thus, overall profitability.
The size of the Company’sCompany's competitors vary across market sectors, as do the resources the Company has allocated to the sectors and geographic areas in which it does business. Therefore, some of the competitors may have greater financial, personnel, capacity and other resources or a more extensive customer base than the Company has in one or more of its market sectors and geographic areas.areas, which may result in the Company not being able to effectively compete in certain markets which could impact the Company's profitability and prospects.
An industry down-cycle in semiconductors could significantly affect the Company’sCompany's operating results as a large portion of revenues comescome from sales of semiconductors, which is a highly cyclical industry.
The semiconductor industry historically has experienced periodic fluctuations in product supply and demand, often associated with changes in technology and manufacturing capacity, and is generally considered to be highly cyclical. During each of the last three fiscal years, sales of semiconductors represented over 50% of the Company’sCompany's consolidated sales, and the Company’sCompany's revenues, particularly those of EM, closely follow the strength or weakness of the semiconductor market. Future downturns in the technology industry, particularly in the semiconductor sector, could negatively affect the Company’sCompany's operating results and negatively impact the Company’sCompany's ability to maintain its current profitability levels.
Failure to maintain its relationships with key suppliers could adversely affect the Company’s sales.
One of the Company’sCompany's competitive strengths is the breadth and quality of the suppliers whose products the Company distributes. However, sales of products and services from one of the Company’sCompany's suppliers, IBM, accounted for approximately 12% of the Company’sCompany's consolidated sales in fiscal year 2011.2013. Management expects IBM products and services to continue to account for roughly a similar percentage of the Company’sCompany's consolidated sales in fiscal year 2012.2014. The Company’sCompany's contracts with its suppliers, including those with IBM, vary in duration and are generally terminable by either party at will upon notice. To the extent IBM or other primary suppliers significantly reduce their volume of business with the Company in the future, because of a product shortage, an unwillingness to do business with Avnet, or otherwise, the Company’sCompany's business and relationships with its customers could be materially and adversely affected because its customers depend on the Company’sCompany's distribution of electronic components and computer products from the industry’sindustry's leading suppliers. In addition, to the extent that any of the Company’sCompany's key suppliers modify the terms of their contracts including, without limitation, the terms regarding price protection, rights of return, rebates or other terms that protect or enhance the Company’sCompany's gross margins, it could materially and adversely affect the Company’sCompany's results of operations, financial condition or liquidity.
8
The Company's non-U.S. locations represent a significant portion of its revenue, and consequently, the Company is increasingly exposed to risks associated with operating internationally.
During fiscal year 2013, 2012 and 2011, approximately 63%, 61% and 62%, respectively, of the Company's sales came from its operations outside the United States. As a result of the Company's foreign sales and locations, in particular those in emerging and developing economies, the Company's operations are subject to a variety of risks that are specific to international operations, including, but not limited to, the following:
potential restrictions on the Company's ability to repatriate funds from its foreign subsidiaries;
foreign currency and interest rate fluctuations and the impact on the Company's reported results of operations;
import and export duties and value-added taxes;
compliance with foreign and domestic import and export regulations, data privacy regulations, business licensing requirements, environmental regulations and anti-corruption laws, the failure of which could result in severe penalties including monetary fines, criminal proceedings and suspension of import or export privileges;
changing tax laws and regulations;
regulatory requirements and prohibitions that differ between jurisdictions;
economic and political instability, terrorism and potential military conflicts or civilian unrest;
fluctuations in freight costs, limitations on shipping and receiving capacity, and other disruptions in the transportation and shipping infrastructure;
natural disasters and health concerns;
differing environmental regulations and employment practices and labor issues; and
the risk of non-compliance with local laws.
In addition to the cost of compliance, the potential criminal penalties for violations of export regulations and anti-corruption laws by the Company or its third-party agents create heightened risks for the Company's international operations. In the event that a governing regulatory body determined that the Company had violated applicable import or export regulations or anti-corruption laws, the Company could be fined significant sums, incur sizable legal defense costs and/or its import or export capabilities could be restricted, which could have a material and adverse effect on the Company's business. Additionally, allegations that the Company has violated a governmental regulation may negatively impact the Company's reputation, which may result in customers or suppliers being unwilling to do business with the Company. While the Company has adopted measures designed to ensure compliance with these laws, the Company cannot be assured that such measures will be adequate or that its business will not be materially and adversely impacted in the event of an alleged violation.
The Company's acquisition strategy may not produce the expected benefits, which may adversely affect the Company's results of operations.
Avnet has made, and expects to continue to make, strategic acquisitions or investments in companies around the world to further its strategic objectives and support key business initiatives. Acquisitions and investments involve risks and uncertainties, some of which may differ from those associated with Avnet's historical operations. The risks relating to such transactions include, but are not limited to, risks relating to expanding into emerging markets and business areas, adding additional product lines and services, incurring unanticipated costs or liabilities associated with the companies acquired and diverting management's attention from existing business operations. As a result, the Company's profitability may be negatively impacted. In addition, the Company may not be successful in integrating the acquired businesses or the integration may be more difficult, costly or time-consuming than anticipated. Further, any litigation relating to a potential acquisition will result in an increase in the expenses associated with the acquisition or cause a delay in completing the acquisition, thereby impacting the Company's profitability. The Company may experience disruptions that could, depending on the size of the acquisition, have a material adverse effect on its business, especially where an acquisition target may have pre-existing non-compliance or pre-existing deficiencies or material weaknesses in internal controls as those terms are defined under relevant SEC rules and regulations. Furthermore, the Company may not realize all of the anticipated benefits from its acquisitions, which could materially and adversely affect the Company's financial performance.
Major disruptions to the Company’s logistics capability could have a material adverse impact on the Company’s operations.
The Company's global logistics services are operated through specialized, centralized or outsourced distribution centers around the globe. The Company also depends almost entirely on third-party transportation service providers for the delivery of products to its customers. A major interruption or disruption in service at one or more of its distribution centers for any reason (such as natural disasters, pandemics, or significant disruptions of services from our third-party providers) could cause cancellations or delays in a significant number of shipments to customers and, as a result, could have a severe impact on the Company's business, operations and financial performance.
If the Company’s internal information systems fail to function properly, or if the Company is unsuccessful in the integration or upgrade of information systems, its business operations could suffer.
The Company's expanding operations put increasing pressure on the Company's information systems to facilitate the day-to-day operations of the business and to produce timely, accurate and reliable reports on financial and operational results. Currently, the Company's global operations are tracked with multiple information systems, some of which are subject to ongoing IT projects designed to streamline or optimize the Company's global information systems. There is no guarantee that the Company will be successful at all times in these efforts or that there will not be integration difficulties that will adversely affect the Company's ability to complete business transactions timely or the accurate and timely recording and reporting of financial data. In addition, the Company's information technology is subject to cybersecurity breaches, computer hacking or other general system failures. Maintaining and operating these systems requires continuous investments. A security breach could result in sensitive data being manipulated or exposed to unauthorized persons or to the public. A failure of any of these information systems in a way described above or material difficulties in upgrading these information systems could have material adverse effects on the Company's business and its compliance with reporting obligations under federal securities laws.
Declines in the value of the Company’sCompany's inventory or unexpected order cancellations by the Company’sCompany's customers could materially and adversely affect its business, results of operations, financial condition and liquidity.
The electronic components and computer products industries are subject to rapid technological change, new and enhanced products, changes in customer needs and evolvingchanges in industry standards, which can contribute to a decline in value or obsolescence of inventory. Regardless of the general economic environment, it is possible that prices will decline due to a decrease in demand or an oversupply of products and, as a result of the price declines, there may be greater risk of declines in inventory value. Although
it is the policy of many of the Company’sCompany's suppliers to offer distributors like Avnet certain protections from the loss in value of inventory (such as price protection and limited rights of return), the Company cannot be assured that such policies will fully compensate for the loss in value, or that the vendors will choose to, or be able to, honor such agreements, some of which are not documented and, therefore, subject to the discretion of the vendor. In addition, the Company’smajority of the Company's sales are typically made pursuant to individual purchase orders, and the Company generally does not have long-term supply arrangements with its customers. Generally, the Company’sCompany's customers may cancel orders 30 days prior to shipment with minimal penalties. The Company cannot be assured that unforeseen new product developments, declines in the value of the Company’sCompany's inventory or unforeseen order cancellations by its customers will not materially and adversely affect the Company’sCompany's business, results of operations, financial condition or liquidity.
Substantial defaults by the Company’sCompany's customers on its accounts receivable or the loss of significant customers could have a significant negative impact on the Company’sCompany's business, results of operations, financial condition or liquidity.
A significant portion of the Company’sCompany's working capital consists of accounts receivable from customers. If customers responsible for a significant amount of accounts receivable were to become insolvent or otherwise unable to pay for products and services,the amount they owe the Company, or were to become unwilling or unable to make such payments in a timely manner, the Company’sCompany's business, results of operations, financial condition or liquidity could be adversely affected. An economic or industry downturn could adversely and materially affect the servicing of these accounts receivable, which could result in longer payment cycles, increased collection costs and defaults in excess of management’smanagement's expectations. A significant deterioration in the Company’sCompany's ability to collect on accounts receivable could also impact the cost or availability of financing under its accounts receivable securitization program (seeFinancingTransactionsappearing in Item 7 of this Report).
The Company’s non-U.S. locations represent a significantCompany may not have adequate or cost-effective liquidity or capital resources.
The Company's ability to satisfy its cash needs depends on its ability to generate cash from operations and growing portionto access the financial markets, both of its revenue, and consequently, the Company is increasingly exposed to risks associated with operating internationally.
During fiscal year 2011, 2010 and 2009, approximately 62%, 60% and 58%, respectively, of the Company’s sales came from its operations outside the United States. As a result of the Company’s foreign sales and locations, in particular those in emerging and developing economies, the Company’s operationswhich are subject to a variety of risksgeneral economic, financial, competitive, legislative, regulatory and other factors that are specificbeyond the Company's control.
The Company may need to international operations, including, but not limited to, the following:
potential restrictions on the Company’s ability to repatriate funds fromsatisfy its foreign subsidiaries;
foreign currency and interest rate fluctuations and the impact on the Company’s reported results of operations;
import and export duties and value-added taxes;
compliance with foreign and domestic import and export regulations, business licensing requirements and anti-corruption laws, the failure of which could result in severe penalties including monetary fines, criminal proceedings and suspension of export privileges;
changing tax laws and regulations;
regulatory requirements and prohibitions that differ between jurisdictions;
political instability, terrorism and potential military conflicts or civilian unrest;
fluctuations in freight costs, limitations on shipping and receiving capacity, and other disruptions in the transportation and shipping infrastructure;
| • | | differing environmental regulations and employment practices and labor issues; and |
|
| • | | the risk of non-compliance with local laws. |
9
The potential criminal penalties for violations of export regulations and anti-corruption laws, particularly anti-bribery, data privacy laws and environmental laws and regulations in many jurisdictions, create heightened risks for the Company’s international operations. In the event that a governing regulatory body determined that the Company had violated applicable export regulations or anti-corruption laws, the Company could be fined significant sums, incur sizable legal defense costs and/or its export capabilities could be restricted, which could have a material and adverse effect on the Company’s business. While the Company has and will continue to adopt measures designed to ensure compliance with these laws, the Company cannot be assured that such measures will be adequate or that its business willcash needs through external financing. However, external financing may not be materiallyavailable on acceptable terms or at all. As of June 29, 2013, Avnet had total debt outstanding of approximately $2.05 billion under various notes and adversely impacted in the eventcommitted and uncommitted lines of an alleged violation.
credit with financial institutions. The Company’s acquisition strategy may not produce the expected benefits, which may adversely affect the Company’s results of operations.
Avnet historically has pursued a strategic acquisition programCompany needs cash to grow its global businessmake interest payments on, and to refinance, this indebtedness and for electronic and computer products, thereby enabling Avnet to solidify and maintain its leadership position in the marketplace. Acquisitions involve risks and uncertaintiesgeneral corporate purposes, such as expansion into new geographic marketsfunding its ongoing working capital and business areas and diversioncapital expenditure needs. Under the terms of management’s attention from existing business operations. In addition,any external financing, the Company may not be successfulincur higher than expected financing expenses and become subject to additional restrictions and covenants. Any material increase in integrating the acquired businesses or the integration may be more difficult, costly or time-consuming than anticipated. Consequently, the Company may experience disruptions thatCompany's financing costs could depending on the size of the acquisition, have a material adverse effect on its profitability.
Under certain of its credit facilities, the Company is required to maintain certain specified financial ratios and meet certain tests. If the Company fails to meet these financial ratios and/or tests, it may be unable to continue to utilize these facilities. If the Company is unable to utilize these facilities, it may not have sufficient cash available to make interest payments on and refinance indebtedness and for general corporate needs. General economic or business especially where an acquisition targetconditions, domestic and foreign, may have pre-existing non-compliancebe less favorable than management expects and could adversely impact the Company's sales or pre-existing deficienciesits ability to collect receivables from its customers, which may impact access to the Company's securitization program.
The agreements governing some of the Company's financings contain various covenantsand restrictions that limit the discretion of management in operating its businessand could prevent us from engaging in some activities that may be beneficial to theCompany's business.
The agreements governing the Company's financing, including its credit facility and the indentures governing the Company's outstanding notes, contain various covenants and restrictions that, in certain circumstances, limit the Company's ability, and the ability of certain subsidiaries, to:
grant liens on assets;
make restricted payments (including paying dividends on capital stock or material weaknesses as those terms are defined under relevant SEC rulesredeeming or repurchasing capital stock);
make investments;
merge, consolidate or transfer all or substantially all of the Company’s assets;
incur additional debt; or
engage in certain transactions with affiliates.
As a result of these covenants and regulations. Furthermore,restrictions, the Company may be limited in the future in how it conducts its business and may be unable to raise additional debt, compete effectively or make further investments.
The Company may become involved in intellectual property disputes that could cause it to incur substantial costs, divert the efforts of management or require it to pay substantial damages or licensing fees.
From time to time, the Company receives notifications alleging infringements of intellectual property rights allegedly held by others relating to the Company's business or the products or services it sells. Litigation with respect to patents or other intellectual property matters could result in substantial costs and diversion of management and other resources and could have an adverse effect on the Company's operations. Further, the Company may be obligated to indemnify and defend its customers if the products or services the Company sells are alleged to infringe any third-party's intellectual property rights. While the Company may be able to seek indemnification from its suppliers for itself and its customers against such claims, there is no assurance that it will be successful in obtaining such indemnification or that the Company will be fully protected against such claims. If an infringement claim is successful, the Company may be required to pay damages or seek royalty or license arrangements, which may not realizebe available on commercially reasonable terms. The Company may have to stop selling certain products or services, which could affect its ability to compete effectively.
Failure to comply with the requirements of environmental regulations could adversely affect its business.
The Company is subject to various federal, state, local and foreign laws and regulations addressing environmental and other impacts from product disposal, use of hazardous materials in products, recycling of products at the end of their useful life and other related matters. While the Company strives to ensure it is in full compliance with all applicable regulations, certain of these regulations impose liability without fault. Additionally, the Company may be held responsible for the prior activities of an entity it acquired. Failure to comply with these regulations could result in substantial costs, fines and civil or criminal sanctions, as well as third-party claims for property damage or personal injury. Further, environmental laws may become more stringent over time, imposing greater compliance costs and increasing risks and penalties associated with violations.
Tax legislation initiatives or challenges to the Company's tax positions could impact the Company's results of operations and financial condition.
As a multinational corporation, the Company is subject to the tax laws and regulations of the anticipated benefits from its acquisitions, whichUnited States federal, state and local governments and of many international jurisdictions. From time to time, legislation may be enacted that could materially and adversely affect the Company’s financial performance.Company's tax positions. There can be no assurance that our effective tax rate and the resulting cash flow will not be adversely affected by these potential changes in regulations. The tax laws and regulations of the various countries where the Company has operations are extremely complex and subject to varying interpretations. Although the Company believes that its historical tax positions are sound and consistent with applicable laws, regulations and existing precedent, there can be no assurance that these tax positions will not be challenged by relevant tax authorities or that the Company would be successful in any such challenge.
If the Company fails to maintain effective internal controls, it may not be able to report its financial results accurately or timely or prevent or detect fraud, which could have a material adverse effect on the Company’s business or stock price.the market price of the Company's securities.
Effective internal controls are necessary for the Company to provide reasonable assurance with respect to its financial reports and to effectively prevent or detect fraud. If the Company cannot provide reasonable assurance with respect to its financial reports and effectively prevent or detect fraud, its brand and operating results could be harmed. Pursuant to the Sarbanes-Oxley Act of 2002, the Company is required to furnish a report by management on internal control over financial reporting, including management’smanagement's assessment of the effectiveness of such control. Internal control over financial reporting may not prevent or detect misstatements because of its inherent limitations, including the possibility of human error, the circumvention or overriding of controls, or fraud. Therefore, even effective internal controls cannot provide absolute assurance with respect to the preparation and fair presentation of financial statements. In addition, projections of any evaluation of effectiveness of internal control over financial reporting to future periods are subject to the risk that the control may become inadequate because of changes in conditions, or that the degree of compliance with the policies or procedures may deteriorate. If the Company fails to maintain the adequacy of its internal controls, including any failure to implement required new or improved controls, or if the Company experiences difficulties in their implementation, the Company’sCompany's business and operating results could be harmed, and the Company could fail to meet its reporting obligations, which could have a material adverse effect on its business andor the market price of the Company’sCompany's securities.
If the Company’s internal information systems fail to function properly, or if the Company is unsuccessful in the integration or upgrade11
The Company’s expanding operations put increasing pressure on the Company’s information systems to produce timely, accurate and reliable reports on financial and operational results. Currently, the Company’s global operations are tracked with multiple information systems, some of which are subject to on-going IT projects designed to streamline or optimize its global information systems. There is no guarantee that the Company will be successful at all times in these efforts or that there will not be integration difficulties that will adversely affect the Company’s operations or the accurate and timely recording and reporting of financial data. In addition, these systems are subject to computer hacking or other general system failure. Maintaining and operating these systems requires continuous investments. Failure of any of these information systems or material difficulties in upgrading these information systems could have material adverse effects on the Company’s business and its compliance with reporting obligations under federal securities laws.
10
Major disruptions to the Company’s logistics capability could have a material adverse impact on the Company’s operations.
The Company’s global logistics services are operated through specialized and centralized distribution centers around the globe. The Company also depends almost entirely on third party transportation service providers for the delivery of products to its customers. A major interruption or disruption in service at one or more of our distribution centers for any reason (such as natural disasters, pandemics, or significant disruptions of services from our third party providers) could cause cancellations or delays in a significant number of shipments to customers and, as a result, could have a severe impact on the Company’s business, operations and financial performance.
The Company may not have adequate or cost-effective liquidity or capital resources.
The Company’s ability to satisfy its cash needs depends on its ability to generate cash from operations and to access the financial markets, both of which are subject to general economic, financial, competitive, legislative, regulatory and other factors that are beyond the Company’s control.
The Company may need to satisfy its cash needs through external financing. However, external financing may not be available on acceptable terms or at all. As of July 2, 2011, Avnet had total debt outstanding of $1.517 billion under various notes and committed and uncommitted lines of credit with financial institutions. The Company needs cash to make interest payments on, and to refinance, this indebtedness and for general corporate purposes, such as funding its ongoing working capital and capital expenditure needs. Under the terms of any external financing, the Company may incur higher than expected financing expenses and become subject to additional restrictions and covenants. Any material increase in the Company’s financing costs could have a material adverse effect on its profitability.
Under some of its credit facilities, the Company is required to maintain certain specified financial ratios and meet certain tests. If the Company fails to meet these financial ratios and tests, it may be unable to continue to utilize these facilities. If the Company is unable to utilize these facilities, it may not have sufficient cash available to make interest payments on and refinance indebtedness and for general corporate needs.
The agreements governing some of the Company’s financings contain various covenants and restrictions that limit the discretion of management in operating its business and could prevent us from engaging in some activities that may be beneficial to the Company’s business.
The agreements governing the Company’s financing, including its credit facility and the indentures governing the Company’s outstanding notes, contain various covenants and restrictions that, in certain circumstances, limit the Company’s ability and the ability of certain subsidiaries to:
grant liens on assets;Contents
make restricted payments (including paying dividends on capital stock or redeeming or repurchasing capital stock);
merge, consolidate or transfer all or substantially all of the Company’s assets;
incur additional debt; or
engage in certain transactions with affiliates.
As a result of these covenants and restrictions, the Company may be limited in the future in how it conducts its business and may be unable to raise additional debt, compete effectively or make further investments.
In addition to the specific factors described above, general economic or business conditions, domestic and foreign, may be less favorable than management expected and, if such conditions persist for a sustained period of time, could eventually adversely impact the Company’s sales or its ability to collect receivables from some of its customers.
11
| | |
Item 1B. | | Unresolved Staff Comments
|
Item 1B. Unresolved Staff CommentsNot applicable.
Item 2. Properties
The Company owns and leases approximately 1,151,0001,558,000 and 5,523,0006,391,000 square feet of space, respectively, of which approximately 36%42% is located in the United States. The following table summarizes certain of the Company’s key facilities.
| | | | | | | | |
| | Sq. | | | Leased or | | |
| Location | | Sq. Footage | | | Leased or Owned | | Primary Use |
| Poing, Germany | | 423,000 | 427,000 |
| | Leased | | EM warehousing, value-added operations and offices |
| Chandler, Arizona | | | 399,000 |
| | Owned | | EM warehousing and value-added operations |
| Tongeren, Belgium | | | 388,000 |
| | Owned | | EM and TS warehousing and value-added operations |
Chandler, ArizonaGrove City, Ohio | | 297,000 | 231,000
| | Leased | | EM warehousing, integration and value-added operations |
| Poing, Germany | | 296,000 |
| | Owned | | EM warehousing, value-added operations and offices |
| Groveport, Ohio | | 266,000 |
| | Leased | | TS warehousing, integration and value-added operations |
Tsuen Wan, Chandler, Arizona | | 231,000 |
| | Leased | | EM warehousing, integration and value-added operations |
| Atlanta, Georgia | | 195,000 |
| | Leased | | TS warehousing, integration and value-added operations |
| Hong Kong, | China | | 181,000 |
| | Leased | | EM warehousing and value-added operations |
| Phoenix, Arizona | | | 176,000 |
| | Leased | | Corporate and EM headquarters |
| Coppell, Texas | | 174,000 |
| | Leased | | EM warehousing, integration and value-added operations |
| Nettetal, Germany | | 137,000 |
| | Owned | | EM warehousing, value-added operations and offices |
| Tempe, Arizona | | | 132,000 |
| | Leased | | TS headquarters |
| Nettetal, Germany | | 126,000 |
| | Owned | | TS warehousing, value-added operations and offices |
| Nogales, Mexico | | | 124,000 |
| | Leased | | EM warehousing and value-added operations |
Doral, Florida | | | 120,000 | | | Leased | | TS warehousing and value-added operations |
Loyang, Singapore | | | 116,000 | | | Leased | | TS warehousing and value-added operations |
| | |
Item 3. | | Item 3. Legal Proceedings |
As a result primarily of certain former manufacturing operations, Avnet has incurred and may have future liability under various federal, state and local environmental laws and regulations, including those governing pollution and exposure to, and the handling, storage and disposal of, hazardous substances. For example, under the Comprehensive Environmental Response, Compensation and Liability Act of 1980, as amended (“CERCLA”) and similar state laws, Avnet is and may be liable for the costs of cleaning up environmental contamination on or from certain of its current or former properties, and at off-site locations where the Company disposed of wastes in the past. Such laws may impose joint and several liability. Typically, however, the costs for cleanup at such sites are allocated among potentially responsible parties based upon each party’s relative contribution to the contamination, and other factors.
Pursuant to SEC regulations, including but not limited to Item 103 of Regulation S-K, the Company regularly assesses the status of and developments in pending environmental legal proceedings to determine whether any such proceedings should be identified specifically in this discussion of legal proceedings, and has concluded that no particular pending environmental legal proceeding requires public disclosure. Based on the information known to date, management believes that the Company has appropriately accrued in its consolidated financial statements for its share of the estimated costs associated with theof environmental clean-up of sites in which the Company is participating.matters.
The Company and/or its subsidiaries areis also partiesparty to various other lawsuits, claims, investigations and other legal proceedings arising from time to time in the normal course of business. While litigation is subject to inherent uncertainties, management currently believes that the ultimate outcome of these proceedings, individually and in the aggregate, will not have a material adverse effect on the Company’s financial position, cash flowliquidity or results of operations.
Item 4. Mine Safety Disclosures
Not applicable.
PART II
Item 5. Market for Registrant’s Common Equity, Related Stockholder Matters and Issuer Purchases of Equity Securities
| | |
Item 5. | | Market for Registrant’s Common Equity, Related Stockholder Matters and Issuer Purchases of Equity Securities
|
Market price per share
The Company’s common stock is listed on the New York Stock Exchange under the symbol AVT. Quarterly high and low sales closing prices (as reported for the New York Stock Exchange composite transactions) for the last two fiscal years were:
| | | | | | | | | | | | | | | | | |
| | | 2011 | | | 2010 | |
| Fiscal Quarters | | High | | | Low | | | High | | | Low | |
| 1st | | $ | 27.08 | | | $ | 22.86 | | | $ | 27.33 | | | $ | 20.31 | |
| 2nd | | | 33.34 | | | | 26.61 | | | | 30.42 | | | | 23.67 | |
| 3rd | | | 36.97 | | | | 31.88 | | | | 30.53 | | | | 26.35 | |
| 4th | | | 37.81 | | | | 29.97 | | | | 33.49 | | | | 23.93 | |
|
| | | | | | | | | | | | | | | |
| | 2013 | | 2012 |
| Fiscal Quarters | High | | Low | | High | | Low |
| 1st | $ | 33.51 |
| | $ | 28.91 |
| | $ | 32.86 |
| | $ | 24.19 |
|
| 2nd | 31.62 |
| | 27.01 |
| | 31.73 |
| | 24.77 |
|
| 3rd | 36.86 |
| | 30.61 |
| | 36.83 |
| | 31.02 |
|
| 4th | 35.39 |
| | 31.54 |
| | 36.65 |
| | 29.23 |
|
The Company hasdid not paidpay any dividends sinceon its common stock during the last two fiscal 2002years. Any future decision to declare or pay dividends will be at the discretion of the Board of Directors and does not currently contemplate any future dividend payments.will be dependent upon the Company's financial condition, results of operations, capital requirements, and such other factors as the Board of Directors deems relevant. In addition, certain of the Company's debt facilities contain restrictions on the declaration and payment of dividends.
Record Holders
As of July 29, 2011,26, 2013, there were 3,1523,330 registered holders of record of Avnet’s common stock.
Equity Compensation Plan Information as of July 2, 2011
| | | | | | | | | | | | |
| | | | | | | | | | | Number of Securities | |
| | | Number of Securities | | | | | | | | Remaining Available for | |
| | | to be Issued Upon | | | | Weighted-Average | | | Future Issuance Under Equity | |
| | | Exercise of | | | | Exercise Price of | | | Compensation Plans | |
| | | Outstanding Options, | | | | Outstanding Options, | | | (Excluding Securities | |
| Plan Category | | Warrants and Rights | | | | Warrants and Rights | | | Reflected in Column (a)) | |
| | | (a) | | | | (b) | | | (c) | |
| Equity compensation plans approved by security holders | | 5,320,709 | (1) | | | $ | 21.79 | | | 6,694,816 | (2) |
|
| | | | | | | | |
| Plan Category | Number of Securities
to be Issued Upon
Exercise of
Outstanding Options, Warrants and Rights | | Weighted-Average
Exercise Price of
Outstanding Options, Warrants and Rights | | Number of Securities
Remaining Available for
Future Issuance Under Equity
Compensation Plans
(Excluding Securities Reflected in Column (a)) | |
| | (a) | | (b) | | (c) | |
| Equity compensation plans approved by security holders | 5,559,753 |
| (1) | $26.65 | | 2,995,588 |
| (2) |
______________________
| | |
| (1) | | Includes 3,059,2152,579,188 shares subject to options outstanding and 1,414,7842,009,510 stock incentive shares and 846,710971,055 performance shares awarded but not yet delivered. Included in the performance shares is the number of shares anticipated to be issued in the first quarter of fiscal 20122014 relating to the level of achievement reached under the 2009 performance share program, whichthat ended July 2, 2011on June 29, 2013 (see Note 12 in theNotes to Consolidated Financial Statementsincluded in Item 15 of this Report) |
| |
|
| (2) | | Does not include 58,707432,789 shares available for future issuance under the Employee Stock Purchase Plan, which is a non-compensatory plan. |
13
Stock Performance Graphs and Cumulative Total Returns
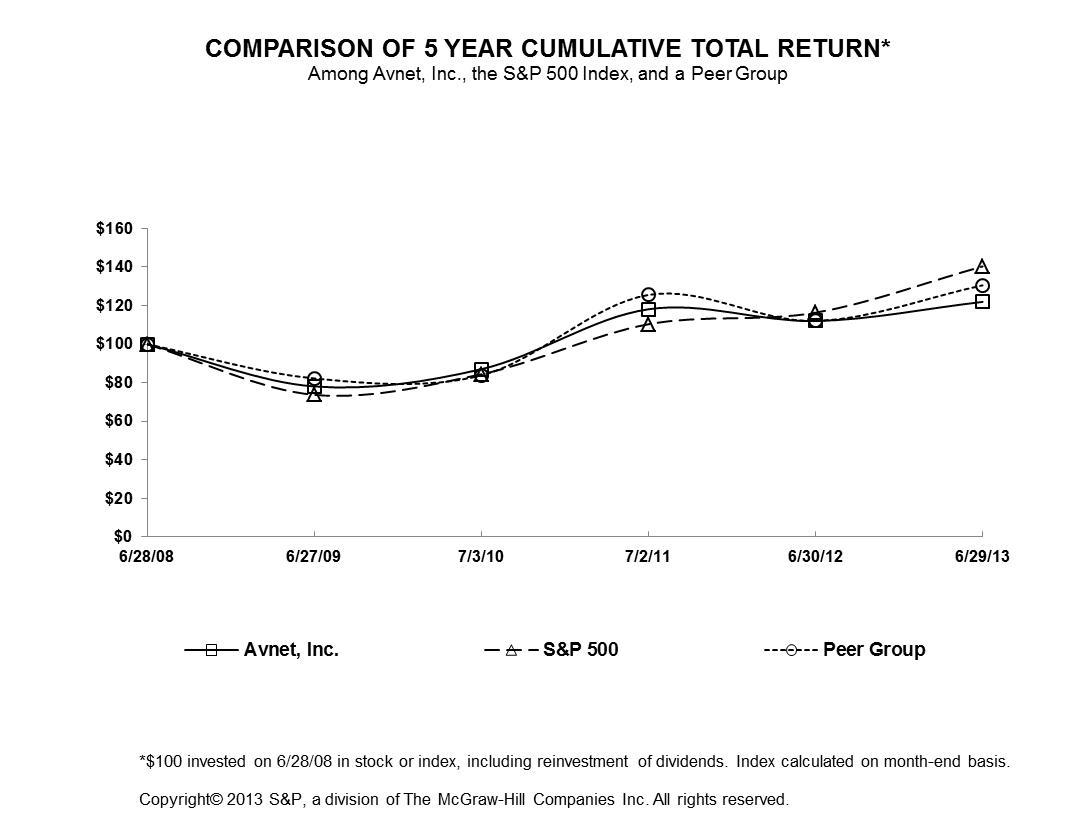
The graph below compares the cumulative 5-year total return of holders of Avnet, Inc.’s common stock with the cumulative total returns of the S&P 500 index and certain of Avnet’s peer companies in the electronics distribution industry. The graph tracks the performance of a $100 investment in Avnet’s common stock, in the peer group, and the index (with the reinvestment of all dividends) from July 1, 2006June 28, 2008 to July 2, 2011. During fiscal 2011, two ofJune 29, 2013. The companies comprising the companies included in the Company’s fiscal 2010 peer group (Bell Microproducts Inc. and Nu Horizons Electronics Corp) terminated their respective registrations with the SEC. The Company’s new peer group consists ofthat Avnet has historically used are: Agilysys, Inc., Anixter International, Inc., Arrow Electronics, Inc., Brightpoint, Inc., Ingram Micro, Inc., Insight Enterprises, Inc., Scansource, Inc., Synnex Corp. and Tech Data Corp. The Company’s old peer group, whichBrightpoint, Inc. terminated its registration with the SEC as a result of it being acquired and, therefore, is also included below for comparative purposes, consisted of Arrow Electronics, Inc., Ingram Micro, Inc., and Tech Data Corp. Bell Microproducts Inc. and Nu Horizons Electronics Corp are not included in the old peer groupgraph below.
| | | | | | | | | | | | | | | | | | | | | | | | | | | | | | | | | | | | | |
| | | 07/1/06 | | 06/30/07 | | 06/28/08 | | 06/27/09 | | 07/3/10 | | 07/2/11 | | 6/28/2008 | | 6/27/2009 | | 7/3/2010 | | 7/2/2011 | | 6/30/2012 | | 6/29/2013 |
| Avnet, Inc. | | 100.00 | | 198.00 | | 137.61 | | 107.49 | | 119.78 | | 162.59 | | 100.00 | | 78.11 | | 87.04 | | 118.15 | | 112.01 | | 121.96 |
| S&P 500 | | 100.00 | | 120.59 | | 104.77 | | 77.30 | | 88.46 | | 115.61 | | 100.00 | | 73.79 | | 84.43 | | 110.35 | | 116.36 | | 140.32 |
| Old Peer Group | | 100.00 | | 115.02 | | 94.26 | | 80.93 | | 79.40 | | 119.43 | | |
| New Peer Group | | 100.00 | | 120.11 | | 94.66 | | 78.10 | | 79.95 | | 118.59 | | |
| Peer Group | | 100.00 | | 82.26 | | 83.84 | | 125.55 | | 112.07 | | 130.55 |
The stock price performance included in this graph is not necessarily indicative of future stock price performance. The Company does not make or endorse any predictions as to future stock performance. The performance graph is furnished solely to accompany this Report and is not being filed for purposes of the Securities Exchange Act of 1934, as amended, and is not to be incorporated by reference into any filing of the Company, whether made before or after the date hereof, regardless of any general incorporation language in such filing.
14
Issuer Purchases of Equity Securities
In August 2011, the Company's Board of Directors (the "Board") approved the repurchase of up to $500.0 million of the Company's common stock through a share repurchase program. During August 2012, the Board approved an additional $250.0 million for the share repurchase program. With this increase, the Company may repurchase up to a total of $750.0 million of the Company's common stock under the share repurchase program. The following table presentsincludes, if any, the Company’sCompany's monthly purchases of Avnet's common stock during the fourth quarter ended June 29, 2013 under the share repurchase program, which is
| | | | | | | | | | | | | | | | | |
| | | | | | | | | | | | | | | Maximum Number (or | |
| | | | | | | | | | | Total Number of | | | Approximate Dollar | |
| | | Total | | | | | | | Shares Purchased as | | | Value) of Shares That | |
| | | Number of | | | | | | | Part of Publicly | | | may yet be Purchased | |
| | | Shares | | | Average Price | | | Announced Plans or | | | Under the Plans or | |
| Period | | Purchased | | | Paid per Share | | | Programs | | | Programs | |
| April | | | 4,100 | | | $ | 34.80 | | | | — | | | | — | |
| May | | | 6,700 | | | $ | 37.07 | | | | — | | | | — | |
| June | | | 4,300 | | | $ | 31.74 | | | | — | | | | — | |
The purchasespart of Avnet common stock noted above werea publicly announced plan, and purchases made on the open market to obtain shares for purchase under the Company’sCompany's Employee Stock Purchase Plan.Plan (“ESPP”), which is not part of a publicly announced plan:
In August 2011, the Board of Directors approved the repurchase of up to an aggregate of $500 million of shares of the Company’s common stock through a share repurchase program. The Company plans to repurchase stock from time to time at the discretion of management in open market or privately negotiated transactions or otherwise, subject to applicable laws, regulations and approvals, strategic considerations, market conditions and other factors. The Company may terminate or limit the stock repurchase program at any time without prior notice. |
| | | | | | | | | | |
| Period | | Total Number of Shares Purchased(1) | | Average Price Paid per Share | | Total Number of Shares Purchased as Part of Publicly Announced Plans or Programs | | Approximate Dollar Value of Shares That May Yet Be Purchased Under the Plans or Programs |
| | | |
| April | | 5,600 |
| | $33.86 | | — |
| | $224,475,000 |
| May | | 5,500 |
| | $32.82 | | — |
| | $224,475,000 |
| June | | 4,400 |
| | $33.05 | | — |
| | $224,475,000 |
______________________
| | |
Item 6.(1) | | Selected Financial Data
Consists entirely of purchases of Avnet’s common stock associated with the Company’s ESPP. |
Item 6. Selected Financial Data
| | | | | | | | | | | | | | | | | | | | | |
| | | Years Ended | |
| | | July 2, | | | July 3, | | | June 27, | | | June 28, | | | June 30, | |
| | | 2011 | | | 2010 | | | 2009 (a) | | | 2008 (a) | | | 2007 (a) | |
| | | (Millions, except for per share and ratio data) | |
| Income: | | | | | | | | | | | | | | | | | | | | |
| Sales | | $ | 26,534.4 | | | $ | 19,160.2 | | | $ | 16,229.9 | | | $ | 17,952.7 | | | $ | 15,681.1 | |
| Gross profit | | | 3,107.8 | | | | 2,280.2 | | | | 2,023.0 | | | | 2,313.7 | | | | 2,048.6 | |
| Operating income (loss) | | | 930.0 | (b) | | | 635.6 | (c) | | | (1,019.0 | )(d) | | | 710.8 | (e) | | | 678.7 | (f) |
| Income tax provision | | | 201.9 | (b) | | | 174.7 | (c) | | | 34.7 | (d) | | | 203.8 | (e) | | | 187.9 | (f) |
| Net income (loss) | | | 669.1 | (b) | | | 410.4 | (c) | | | (1,129.7 | )(d) | | | 489.6 | (e) | | | 384.4 | (f) |
| Financial Position: | | | | | | | | | | | | | | | | | | | | |
| Working capital(g) | | | 3,749.5 | | | | 3,190.6 | | | | 2,688.4 | | | | 3,191.3 | | | | 2,711.2 | |
| Total assets | | | 9,905.6 | | | | 7,782.4 | | | | 6,273.5 | | | | 8,195.2 | | | | 7,343.7 | |
| Long-term debt | | | 1,273.5 | | | | 1,243.7 | | | | 946.6 | | | | 1,169.3 | | | | 1,127.9 | |
| Shareholders’ equity | | | 4,056.1 | | | | 3,009.1 | | | | 2,760.9 | | | | 4,141.9 | | | | 3,417.4 | |
| Per Share: | | | | | | | | | | | | | | | | | | | | |
| Basic earnings (loss) | | | 4.39 | (b) | | | 2.71 | (c) | | | (7.49 | )(d) | | | 3.26 | (e) | | | 2.60 | (f) |
| Diluted earnings (loss) | | | 4.34 | (b) | | | 2.68 | (c) | | | (7.49 | )(d) | | | 3.21 | (e) | | | 2.57 | (f) |
| Book value per diluted share | | | 26.28 | | | | 19.66 | | | | 18.30 | | | | 27.17 | | | | 22.84 | |
| Ratios: | | | | | | | | | | | | | | | | | | | | |
| Operating income (loss) margin on sales | | | 3.5 | %(b) | | | 3.3 | %(c) | | | (6.3) | %(d) | | | 4.0 | %(e) | | | 4.3 | %(f) |
| Net income (loss) margin on sales | | | 2.5 | %(b) | | | 2.1 | %(c) | | | (7.0) | %(d) | | | 2.7 | %(e) | | | 2.5 | %(f) |
| Return on capital | | | 15.2 | %(b) | | | 14.0 | %(c) | | | (26.6) | %(d) | | | 11.0 | %(e) | | | 11.2 | %(f) |
| Quick | | | 1.2:1 | | | | 1.4:1 | | | | 1.5:1 | | | | 1.4:1 | | | | 1.3:1 | |
| Working capital | | | 1.8:1 | | | | 1.9:1 | | | | 2.1:1 | | | | 2.1:1 | | | | 2.0:1 | |
| Total debt to capital | | | 27.2 | % | | | 29.8 | % | | | 26.0 | % | | | 22.7 | % | | | 25.7 | % |
15
|
| | | | | | | | | | | | | | | | | | | | |
| | Years Ended | |
| | June 29, 2013 | | June 30, 2012 | | July 2, 2011 | | July 3, 2010 | | June 27, 2009(a) |
| |
| | (Millions, except for per share and ratio data) | |
| Income: | | | | | | | | | | |
| Sales | $ | 25,458.9 |
| | $ | 25,707.5 |
| | $ | 26,534.4 |
| | $ | 19,160.2 |
| | $ | 16,229.9 |
| |
| Gross profit | 2,979.8 |
| | 3,050.6 |
| | 3,107.8 |
| | 2,280.2 |
| | 2,023.0 |
| |
| Operating income (loss) | 626.0 |
| (b) | 884.2 |
| (c) | 930.0 |
| (d) | 635.6 |
| (e) | (1,019.0 | ) | (f) |
| Income tax provision | 99.2 |
| (b) | 223.8 |
| (c) | 201.9 |
| (d) | 174.7 |
| (e) | 34.7 |
| (f) |
| Net income (loss) | 450.1 |
| (b) | 567.0 |
| (c) | 669.1 |
| (d) | 410.4 |
| (e) | (1,129.7 | ) | (f) |
| Financial Position: | | | | | | | | | | |
Working capital(g) | 3,535.4 |
| | 3,455.7 |
| | 3,749.5 |
| | 3,190.6 |
| | 2,688.4 |
| |
| Total assets | 10,474.7 |
| | 10,167.9 |
| | 9,905.6 |
| | 7,782.4 |
| | 6,273.5 |
| |
| Long-term debt | 1,207.0 |
| | 1,272.0 |
| | 1,273.5 |
| | 1,243.7 |
| | 946.6 |
| |
| Shareholders’ equity | 4,289.1 |
| | 3,905.7 |
| | 4,056.1 |
| | 3,009.1 |
| | 2,760.9 |
| |
| Per Share: | | | | | | | | | | |
| Basic earnings (loss) | 3.26 |
| (b) | 3.85 |
| (c) | 4.39 |
| (d) | 2.71 |
| (e) | (7.49 | ) | (f) |
| Diluted earnings (loss) | 3.21 |
| (b) | 3.79 |
| (c) | 4.34 |
| (d) | 2.68 |
| (e) | (7.49 | ) | (f) |
| Book value per diluted share | 30.64 |
| | 26.12 |
| | 26.28 |
| | 19.66 |
| | 18.30 |
| |
| Ratios: | | | | | | | | | | |
| Operating income (loss) margin on sales | 2.5 | % | (b) | 3.4 | % | (c) | 3.5 | % | (d) | 3.3 | % | (e) | (6.3 | )% | (f) |
| Net income (loss) margin on sales | 1.8 | % | (b) | 2.2 | % | (c) | 2.5 | % | (d) | 2.1 | % | (e) | (7.0 | )% | (f) |
| Return on capital | 10.6 | % | (b) | 12.9 | % | (c) | 15.2 | % | (d) | 14.0 | % | (e) | (26.6 | )% | (f) |
| Quick | 1.2:1 |
| | 1.2:1 |
| | 1.2:1 |
| | 1.4:1 |
| | 1.5:1 |
| |
| Working capital | 1.7:1 |
| | 1.7:1 |
| | 1.8:1 |
| | 1.9:1 |
| | 2.1:1 |
| |
| Total debt to capital | 32.3 | % | | 35.4 | % | | 27.2 | % | | 29.8 | % | | 26.0 | % | |
| | |
| (a) | | As adjusted for the retrospective application of an accounting standard. The Financial Accounting Standards Board issued authoritative guidance whichthat requires the issuer of certain convertible debt instruments that may be settled in cash (or other assets) on conversion to separately account for the debt and equity (conversion option) components of the instrument. The standard requires the convertible debt to be recognized at the present value of its cash flows discounted using the non-convertible debt borrowing rate at the date of issuance. The resulting debt discount from this present value calculation is to be recognized as the value of the equity component and recorded to additional paid in capital. The discounted convertible debt is then required to be accreted up to its face value and recorded as non-cash interest expense over the expected life of the convertible debt. In addition, deferred financing costs associated with the convertible debt are required to be allocated between the debt and equity components based upon relative values. During the first quarter of fiscal 2010, the Company adopted this standard, however, there was no impact to the fiscal 2010 consolidated financial statements because the Company’s 2% Convertible Senior Debentures, to which this standard applied, were extinguished in fiscal 2009. Due to the required retrospective application of this standard to prior periods, the Company adjusted the prior period comparative consolidated financial statements. The following table summarizes the adjustments to increase (decrease) previously reported balances. |
| | | | | | | | | | | | | |
| | | June 27, | | | June 28, | | | June 30, | |
| Adjustments-increase (decrease) | | 2009 | | | 2008 | | | 2007 | |
| | | (Millions, except per share data) | |
| Selling, general and adminstrative expenses | | $ | (0.3 | ) | | $ | (0.4 | ) | | $ | (0.4 | ) |
| Interest expense | | | 12.2 | | | | 15.9 | | | | 14.8 | |
| Income tax provision | | | (4.6 | ) | | | (6.0 | ) | | | (5.7 | ) |
| Net income | | | (7.3 | ) | | | (9.5 | ) | | | (8.7 | ) |
| Basic EPS | | $ | (0.05 | ) | | $ | (0.06 | ) | | $ | (0.05 | ) |
| Diluted EPS | | $ | (0.05 | ) | | $ | (0.06 | ) | | $ | (0.06 | ) |
| | | | | | | | | | | | | |
| Prepaid and other current assets | | $ | — | | | $ | (0.3 | ) | | $ | (0.7 | ) |
| Other assets | | | — | | | | (4.6 | ) | | | (10.7 | ) |
| Long term debt | | | — | | | | (12.2 | ) | | | (28.1 | ) |
| Shareholders’ equity | | $ | — | | | $ | 7.3 | | | $ | 16.8 | |
15
adopted this standard; however, there was no impact to the fiscal 2010 consolidated financial statements because the Company’s 2% Convertible Senior Debentures, to which this standard applied, were extinguished in fiscal 2009. Due to the required retrospective application of this standard to prior periods, the Company adjusted the prior period comparative consolidated financial statements. The following table summarizes the adjustments to increase (decrease) previously reported balances.
|
| | | | |
| Adjustments-increase (decrease) | | June 27,
2009 |
| | | (Millions, except per share data) |
| Selling, general and administrative expenses | | $ | (0.3 | ) |
| Interest expense | | 12.2 |
|
| Income tax provision | | (4.6 | ) |
| Net income | | (7.3 | ) |
| Basic EPS | | $ | (0.05 | ) |
| Diluted EPS | | $ | (0.05 | ) |
______________________
| | |
| (b) | | Includes the impact of (i) restructuring, integration and other itemscharges, which totaled $77.2$149.5 million pre-tax, $56.2$116.4 million after tax and $0.36$0.83 per share on a diluted basis,basis; (ii) a gain on bargain purchase and other, which totaled $22.7$31.0 million pre-tax $25.7 millionand after tax and $0.17$0.22 per share on a diluted basis,basis; and (iii) a tax benefit of $32.9$50.4 million and $0.21$0.36 per share on a diluted basis primarily due to the release of certain tax valuation allowances net of additional tax reserves (see Note 189 and 17 in theNotes to the Consolidated Financial Statementscontained in Item 15 of this Report for further discussion of these items). |
| |
| (c) | | Includes the impact of (i) restructuring, integration and other itemscharges, which totaled $25.4$73.6 million pre-tax, $18.8$53.0 million after tax and $0.12$0.35 per share on a diluted basis; (ii) a gain on bargain purchase and other, which totaled $2.9 million pre-tax, $3.5 million after tax and $0.02 per share on a diluted basis; and (iii) a tax benefit of $8.6 million and $0.06 per share on a diluted basis and includes gain on saleprimarily due to the release of assets which totaled $8.8 million pre-tax, $5.4 million aftercertain tax and $0.03 per share on a diluted basisvaluation allowances net of additional tax reserves (see Note 189 and 17 in theNotes to the Consolidated Financial Statementscontained in Item 15 of this Report for further discussion of these items). |
| |
| (d) | | Includes goodwill and intangible asset impairment charges of $1.41 billion pre-tax, $1.38 billion after tax and $9.13 per share and includes the impact of (i) restructuring, integration and other itemscharges, which totaled $99.3$77.2 million pre-tax, $34.9$56.2 million after tax and $0.23$0.36 per share on a diluted basis; (ii) a gain on bargain purchase and other which totaled $22.7 million pre-tax, $25.7 million after tax and $0.17 per share on a diluted basis; and (iii) a tax benefit of $32.9 million and $0.21 per share on a diluted basis primarily due to the release of certain tax valuation allowances net of additional tax reserves (see Note 189 and 17 in theNotes to the Consolidated Financial Statementscontained in Item 15 of this Report for further discussion of these items). |
| |
| (e) | Includes the impact of (i) restructuring, integration and other charges, which totaled $25.4 million pre-tax, $18.8 million after tax and $0.12 per share on a diluted basis; and (ii) a gain on sale of assets, which totaled $8.8 million pre-tax, $5.4 million after tax and $0.03 per share on a diluted basis. |
| |
| (f) | Includes (i) goodwill and intangible asset impairment charges of $1.41 billion pre-tax, $1.38 billion after tax and $9.13 per share; and (ii) the impact of restructuring, integration and other items, gain on sale of assets and other itemscharges, which totaled to a gain of $11.0$99.3 million pre-tax, $14.7$34.9 million after tax and $0.09$0.23 per share on a diluted basis.share. |
|
(f) | | Includes the impact of restructuring, integration and other items, gain on sale of assets, debt extinguishment costs and other items which amounted to charges of $31.7 million pre-tax, $20.0 million after tax and $0.13 per share on a diluted basis. |
|
| (g) | | This calculation of working capital is defined as current assets less current liabilities. |
| | |
Item 7. | | Management’s Discussion and Analysis of Financial Condition and Results of Operations
|
Item 7. Management’s Discussion and Analysis of Financial Condition and Results of OperationsFor an understanding of Avnet and the significant factors that influenced the Company’s performance during the past three fiscal years, the following discussion should be read in conjunction with the description of the business appearing in Item 1 of this Report and the consolidated financial statements, including the related notes and schedule, and other information appearing in Item 15 of this Report. The Company operates on a “52/53 week” fiscal year. Fiscal 20112013, 2012 and 20092011 all contained 52 weeks while fiscal 2010 contained 53 weeks. This extra week, which occurred in the first quarter of fiscal 2010, impacts the year-over-year analysis in this MD&A.
There are references to the impact of foreign currency translation in the discussion of the Company’s results of operations. Results for the full fiscal year 2011 or 2010 were not significantly impacted by the movement of foreign currency exchanges rates as, for example, the U.S. Dollar strengthened against the Euro by approximately 2% during fiscal 2011 and the U.S. Dollar weakened against the Euro by approximately 1% during fiscal 2010. However, fluctuations during the quarters of fiscal 2011 had a more pronounced impact on the Company’s comparative results as described in the Company’s Form 10-Q’s filed with the SEC. When the stronger U.S. Dollar exchange rates of the current year are used to translate the results of operations of Avnet’s subsidiaries denominated in foreign currencies, the resulting impact is a decrease in U.S. Dollars of reported results as compared with the prior period. When the U.S. Dollar weakens, the resulting impact is an increase in U.S. Dollars of reported results as compared with the prior period. In the discussion that follows, this is referred to as the “translation impact of changes in foreign currency exchange rates.”
In addition to disclosing financial results that are determined in accordance with U.S. generally accepted accounting principles (“GAAP”), the Company also discloses certain non-GAAP financial information, including:
| • | | Income or expense items as adjusted for the translation impact of changes in foreign currency exchange rates, as discussed above. |
|
| • | | Sales adjusted for certain items that impact the year-over-year analysis, which included the impact of acquisitions by adjusting Avnet’s prior periods to include the sales of businesses acquired as if the acquisitions had occurred at the beginning of the period presented. In addition, for fiscal 2011 sales are adjusted for: (i) a divestiture by adjusting Avnet’s prior periods to exclude the sales of the business divested as if the divestiture had occurred at the beginning of the period presented; (ii) the impact of the extra week of sales in the prior year first quarter due to the “52/53 week” fiscal year, and (iii) the transfer of the existing embedded business from TS Americas to EM Americas that occurred in the first quarter of fiscal 2011. Sales taking into account the combination of these adjustments are referred to as “pro forma sales” or “organic sales.” |
|
| • | | Operating income excluding restructuring, integration and other charges incurred in fiscal 2011, 2010 and 2009 as well as the non-cash goodwill and intangible asset impairment charges recognized during fiscal 2009. The reconciliation to GAAP is presented in the following table. |
| | | | | | | | | | | | | |
| | | Years Ended | |
| | | July 2, | | | July 3, | | | June 27, | |
| | | 2011 | | | 2010 | | | 2009 | |
| | | (Thousands) |
| GAAP operating income (loss) | | $ | 929,979 | | | $ | 635,600 | | | $ | (1,018,998 | ) |
| Impairment charges | | | — | | | | — | | | | 1,411,127 | |
| Restructuring, integration and other | | | 77,176 | | | | 25,419 | | | | 99,342 | |
| | | | | | | | | | |
| Adjusted operating income | | $ | 1,007,155 | | | $ | 661,019 | | | $ | 491,471 | |
| | | | | | | | | | |
Operating income excluding restructuring, integration and other charges incurred in fiscal 2013, 2012 and 2011. The reconciliation to GAAP is presented in the following table:
|
| | | | | | | | | | | |
| | Years Ended |
| | June 29,
2013 | | June 30,
2012 | | July 2,
2011 |
| | (Thousands) |
| GAAP operating income | $ | 625,981 |
| | $ | 884,165 |
| | $ | 929,979 |
|
| Restructuring, integration and other | 149,501 |
| | 73,585 |
| | 77,176 |
|
| Adjusted operating income | $ | 775,482 |
| | $ | 957,750 |
| | $ | 1,007,155 |
|
Management believes that providing this additional information is useful for the reader to better assess and understand operating performance, especially when comparing results with previous periods or forecasting performance for future periods. Furthermore, management typically monitors the business both including and excluding these items and uses these non-GAAP measures to establish operational goals and, in some cases, for measuring performance for compensation purposes. However, analysis of results and outlook on a non-GAAP basis should be used as a complement to, and in conjunction with, data presented in accordance with GAAP.
17
Results of Operations
Executive Summary
At the beginningRevenue for fiscal 2013 was $25.46 billion, a decrease of 1.0% from fiscal 2011, the Company completed three significant acquisitions that, when combined with strong2012 revenue of $25.71 billion, and revenue on an organic growth, delivered $7.4 billionbasis was down 5.3% year over year. This decrease in revenue growth, or 38.5%,reflects weakness in the western regions at both operating groups due primarily to the global macroeconomic environment, partially offset by strength in Asia. EM revenue of $15.09 billion increased 1.1% over the prior year and organic revenue decreased 1.2% year over year in constant currency. This decrease in organic revenue was primarily related to a record $26.5 billion. Although the acquired businesses have product lines withAmericas region, which (i) experienced weaker demand and (ii) exited the lower operating margins than Avnet’s other product lines, operating income grew faster thanmargin commercial components business. TS revenue with 46.3% growthof $10.36 billion decreased 3.8% over the prior year and its organic revenue decreased 8.3% in constant currency over the prior year. This decrease in organic revenue was also attributable to weakness in the western regions.
Gross profit margin of 11.7% declined 17 basis points over the prior year. EM gross profit margin declined 52 basis points year over year driven by operating leverage and synergies as a result of integration activities that were on-going through the fiscal year. Finally, earnings per share on a diluted basis grew faster than revenue and operating income with an increase of 63% year over year.
Year-over-year organic revenue growth for EM was 21.9% and was strongestdue to competitive pressures most notably in the EMEA region due to demandand a higher mix of lower margin Asia revenue. TS gross profit margin improved 24 basis points year over year primarily driven by the Americas and EMEA offset by a decrease in the industrial markets. Year-over-year organic revenue growth for TS was 11.3% and wasAsia. These increases were driven primarily by demand for storagethe revenue mix of higher margin products and servers. Gross profitservices.
Consolidated operating income margin was down 192.5% as compared with 3.4% in the prior year. Both periods included restructuring, integration and other charges. Excluding these charges from both periods, operating income margin was 3.0% of sales in fiscal 2013 as compared to 3.7% of sales in the prior year. EM operating income margin decreased 90 basis points year over year to 11.7% as4.1%. The decline in EM operating income margin was primarily due to lower profitability in the acquired Bell business haswestern regions due to lower gross profit margins, than the Company’s legacy businesses due to its product mix. EM gross profit margin was up 10 basis points year over year which was impacted by the combination of improvement in the EM core business, partially offset by the lower gross profit margin embedded business acquired from Bell and the embedded business that was transferred frombenefit of cost reduction actions taken. TS Americas. TS gross profit margin declined 52 basis points year over year primarily attributable to the EMEA region which was impacted by the integration of the Bell business because of its lower gross profit margin profile than the other TS EMEA product lines.
Operatingoperating income margin was up 19decreased 27 basis points year over year to 3.5%. EM operating income margins improved 105 basis points year over year2.7% due primarily to 5.5%. The improvement was attributable to operating leverage primarilyrecent acquisitions as the related cost synergies have not yet been attained, in EMEA which was due to strong revenue growth and continued expense efficiencies. TS operating income margin declined 57 basis points year over year primarily due to lower operating income margins of the acquired Bell business. The integrations of the acquired businesses have been completed as of the end of fiscal 2011. The businesses acquired during fiscal 2011 impacted both operating groups and, as a result of integration activities that occurred during the fiscal year, the fiscal 2011 results were positively impacted by synergies to the extent actions were completed. In particular the expected synergies for the Bell acquisition were estimated to be over $60 million in annualized cost savings, however, the full benefit of the synergies is expected to be realized in the first quarter of fiscal 2012.EMEA.
Three-Year Analysis of Sales: By Operating Group and Geography | | | | | | | | | | | | | | | | | | | |
| | | Years Ended | | Percent Change | | | | | | | | | | | | | | | | | | |
| | | July 2, | | % of | | July 3, | | % of | | June 27, | | % of | | 2011 to | | 2010 to | | Years Ended | | Percent Change |
| | | 2011 | | Total | | 2010 | | Total | | 2009 | | Total | | 2010 | | 2009 | | June 29,
2013 | | % of Total | | June 30,
2012 | | % of Total | | July 2,
2011 | | % of Total | | 2013 to 2012 | | 2012 to 2011 |
| | | (Dollars in millions) | | (Dollars in millions) |
Sales by Operating Group: | | | | | | | | | | | | | | | | |
| EM Americas | | $ | 5,113.8 | | | 19.3 | % | | $ | 3,434.6 | | | 17.9 | % | | $ | 3,288.3 | | | 20.3 | % | | | 48.9 | % | | | 4.5 | % | $ | 5,263.8 |
| | 20.7 | % | | $ | 5,678.7 |
| | 22.1 | % | | $ | 5,113.8 |
| | 19.3 | % | | (7.3 | )% | | 11.0 | % |
| EM EMEA | | 4,816.3 | | 18.1 | | 3,651.1 | | 19.0 | | 3,026.5 | | 18.6 | | 31.9 | | 20.6 | | 4,096.0 |
| | 16.1 |
| | 4,203.3 |
| | 16.4 |
| | 4,816.3 |
| | 18.1 |
| | (2.6 | ) | | (12.7 | ) |
| EM Asia | | 5,136.1 | | 19.4 | | 3,881.1 | | 20.3 | | 2,878.0 | | 17.7 | | 32.3 | | 34.9 | | 5,734.6 |
| | 22.5 |
| | 5,051.1 |
| | 19.6 |
| | 5,136.1 |
| | 19.4 |
| | 13.5 |
| | (1.7 | ) |
| | | | | | | | | |
| Total EM | | 15,066.2 | | 56.8 | | 10,966.8 | | 57.2 | | 9,192.8 | | 56.6 | | 37.4 | | 19.3 | | 15,094.4 |
| | 59.3 |
| | 14,933.1 |
| | 58.1 |
| | 15,066.2 |
| | 56.8 |
| | 1.1 |
| | (0.9 | ) |
| | | | | | | | | |
| | | |
| TS Americas | | 6,404.7 | | 24.1 | | 4,932.7 | | 25.8 | | 4,283.9 | | 26.4 | | 29.8 | | 15.2 | | 5,452.8 |
| | 21.4 |
| | 5,820.6 |
| | 22.6 |
| | 6,404.7 |
| | 24.1 |
| | (6.3 | ) | | (9.1 | ) |
| TS EMEA | | 3,577.1 | | 13.5 | | 2,297.2 | | 12.0 | | 2,241.9 | | 13.8 | | 55.7 | | 2.5 | | 3,181.9 |
| | 12.5 |
| | 3,205.6 |
| | 12.5 |
| | 3,577.1 |
| | 13.5 |
| | (0.7 | ) | | (10.4 | ) |
| TS Asia | | 1,486.4 | | 5.6 | | 963.5 | | 5.0 | | 511.3 | | 3.2 | | 54.3 | | 88.4 | | 1,729.8 |
| | 6.8 |
| | 1,748.2 |
| | 6.8 |
| | 1,486.4 |
| | 5.6 |
| | (1.1 | ) | | 17.6 |
|
| | | | | | | | | |
| Total TS | | 11,468.2 | | 43.2 | | 8,193.4 | | 42.8 | | 7,037.1 | | 43.4 | | 40.0 | | 16.4 | | 10,364.5 |
| | 40.7 |
| | 10,774.4 |
| | 41.9 |
| | 11,468.2 |
| | 43.2 |
| | (3.8 | ) | | (6.0 | ) |
| | | | | | | | | |
| Total Avnet, Inc. | | $ | 26,534.4 | | $ | 19,160.2 | | $ | 16,229.9 | | | 38.5 | % | | | 18.1 | % | $ | 25,458.9 |
| | | | $ | 25,707.5 |
| | | | $ | 26,534.4 |
| | | | (1.0 | )% | | (3.1 | )% |
| | | | | | | | | |
| | | |
Sales by Geographic Area: | | | | | | | | | | | | | | | | |
| Americas | | $ | 11,518.5 | | | 43.4 | % | | $ | 8,367.3 | | | 43.7 | % | | $ | 7,572.2 | | | 46.7 | % | | | 37.7 | % | | | 10.5 | % | $ | 10,716.6 |
| | 42.1 | % | | $ | 11,499.3 |
| | 44.8 | % | | $ | 11,518.5 |
| | 43.4 | % | | (6.8 | )% | | (0.2 | )% |
| EMEA | | 8,393.4 | | 31.6 | | 5,948.3 | | 31.0 | | 5,268.4 | | 32.4 | | 41.1 | | 12.9 | | 7,277.9 |
| | 28.6 |
| | 7,408.9 |
| | 28.8 |
| | 8,393.4 |
| | 31.6 |
| | (1.8 | ) | | (11.7 | ) |
| Asia/Pacific | | 6,622.5 | | 25.0 | | 4,844.6 | | 25.3 | | 3,389.3 | | 20.9 | | 36.7 | | 42.9 | | 7,464.4 |
| | 29.3 |
| | 6,799.3 |
| | 26.4 |
| | 6,622.5 |
| | 25.0 |
| | 9.8 |
| | 2.7 |
|
| | | | | | | | | $ | 25,458.9 |
| | | | $ | 25,707.5 |
| | | | $ | 26,534.4 |
| | | | | | |
| | | $ | 26,534.4 | | $ | 19,160.2 | | $ | 16,229.9 | | |
| | | | | | | | | |
18
Sales
Items Impacting Year-over-Year Sales Comparisons
During the past three fiscal years, the Company acquired several businesses impacting both operating groups, as presented in the following table. To facilitate easier and more meaningful year-over-year comparisons, the discussions that follow include sales on a pro formaan organic basis as well as on a reported basis.
| | | | | | | | | |
| | | | | Approximate | | | |
| | | | | Annualized | | | Acquisition |
| Acquired Business | | Group & Region | | Revenues(1) | | | Date |
| | | (Millions) |
Fiscal 2011 | | | | | | | | |
| itX Group Ltd | | TS Asia/Pac | | $ | 160 | | | January 2011 |
| Center Cell | | EM Americas | | | 5 | | | November 2010 |
| Eurotone | | EM Asia/Pac | | | 30 | | | October 2010 |
| Broadband | | EM Americas | | | 8 | | | October 2010 |
| Unidux | | EM Asia/Pac | | | 370 | | | July 2010 |
| Tallard Technologies | | TS Americas | | | 250 | | | July 2010 |
| Bell Microproducts Inc. | | EM & TS Americas | | | 3,021 | | | July 2010 |
| | | TS EMEA | | | | | | |
| | | | | | | | | |
Fiscal 2010 | | | | | | | | |
| Servodata HP Division | | TS EMEA | | $ | 20 | | | April 2010 |
| PT Datamation | | TS Asia/Pac | | | 90 | | | April 2010 |
| Sunshine Joint Stock Company | | TS Asia/Pac | | | 30 | | | November 2009 |
| Vanda Group | | TS Asia/Pac | | | 30 | | | October 2009 |
| | | | | | | | | |
Fiscal 2009 | | | | | | | | |
| Abacus Group plc | | EM EMEA | | $ | 400 | | | January 2009 |
| Nippon Denso Industry Co., Ltd. | | EM Asia/Pac | | | 140 | | | December 2008 |
| Ontrack Solutions Pvt. Ltd. | | TS Asia/Pac | | | 13 | | | July 2008 |
| Horizon Technology Group plc | | TS EMEA | | | 400 | | | June 2008 |
| Source Electronics Corporation | | EM Americas | | | 82 | | | June 2008 |
|
| | | | | | | | |
| Acquired Business | | Group & Region | | Approximate
Annualized Revenues (1) | | Acquisition Date |
| | | | | (Millions) | | |
| Fiscal 2013 | | | | | | |
| RTI Holdings | | EM Asia | | $ | 78 |
| | April 2013 |
| TSSLink, Inc. | | TS Americas | | 10 |
| | December 2012 |
| Universal Semiconductor, Inc. | | EM Americas | | 75 |
| | December 2012 |
| Genilogix | | TS Americas | | 23 |
| | November 2012 |
| Brightstar Partners, Inc. | | TS Americas | | 14 |
| | November 2012 |
| Magirus AG | | TS EMEA | | 633 |
| | October 2012 |
| Tekdata Interconnections, Limited | | EM EMEA | | 10 |
| | October 2012 |
| Internix, Inc. | | EM Asia | | 264 |
| | August 2012 |
| C.R.G. Electronics, Ltd. | | EM EMEA | | 24 |
| | August 2012 |
| Pepperweed Consulting | | TS Americas | | 12 |
| | August 2012 |
| Mattelli Limited | | TS EMEA | | 1 |
| | July 2012 |
| Altron GmbH & Co KG | | EM EMEA | | 34 |
| | July 2012 |
| Total | | | | $ | 1,178 |
| | |
| | | | | | | |
| Fiscal 2012 | | | | | | |
| Ascendant Technology | | TS Americas & TS EMEA | | $ | 86 |
| | April 2012 |
| Nexicore Services | | EM Americas | | 85 |
| | April 2012 |
| Controlling interest in a non-wholly owned entity | | EM Americas | | 62 |
| | January 2012 |
| Pinnacle Data Systems | | EM Americas | | 27 |
| | January 2012 |
| Canvas Systems | | TS Americas & TS EMEA | | 118 |
| | January 2012 |
| Unidux Electronics Limited (Singapore) | | EM Asia | | 145 |
| | January 2012 |
| Round 2 Tech | | EM Americas | | 54 |
| | January 2012 |
| DE2 SAS | | EM EMEA | | 11 |
| | November 2011 |
| JC Tally Trading Co. & Shanghai FR International Trading | | EM Asia | | 99 |
| | August 2011 |
| Prospect Technology | | EM Asia | | 142 |
| | August 2011 |
| Amosdec SAS | | TS EMEA | | 83 |
| | July 2011 |
| Total | | | | $ | 912 |
| | |
|
| | | | | | | | |
| Acquired Business | | Group & Region | | Approximate
Annualized Revenues (1) | | Acquisition Date |
| | | | | (Millions) | | |
| Fiscal 2011 | | | | |
| | |
| itX Group Ltd. | | TS Asia | | $ | 160 |
| | January 2011 |
| Center Cell | | EM Americas | | 5 |
| | November 2010 |
| Eurotone | | EM Asia | | 30 |
| | October 2010 |
| Broadband | | EM Americas | | 8 |
| | October 2010 |
| Unidux | | EM Asia | | 370 |
| | July 2010 |
| Tallard Technologies | | TS Americas | | 250 |
| | July 2010 |
| Bell Microproducts Inc. | | EM & TS Americas TS EMEA | | 3,021 |
| | July 2010 |
| Total | | | | $ | 3,844 |
| | |
______________________
| | |
| (1) | | Represents the approximate annual revenue for the acquired businesses’ most recent fiscal year prior to acquisition by Avnet and based upon average foreign currency exchange rates for those periods. |
Sales on an organic basis also include the effects of a divestiture of a small business in TS Asia in December 2012 and the exit of a small business in EM Americas in April 2013 that generated combined annual revenues of approximately $20 million.
Fiscal 20112013 Comparison to Fiscal 20102012
The table below provides the comparison of reported fiscal 20112013 and 20102012 sales for the Company and its operating groups to pro forma (or organic)organic sales (as defined earlier in this MD&A) to allow readers to better assess and understand the Company’s revenue performance by operating group.
|
| | | | | | | | | | | | | | |
| | Sales as Reported | | Acquisition/Divested Revenue | | Organic Sales | | 2013 to 2012 Change |
| | (Dollars in millions) | | |
| EM | $ | 15,094.4 |
| | $ | 148.4 |
| | $ | 15,242.8 |
| | (2.5 | )% |
| TS | 10,364.5 |
| | 153.8 |
| | 10,518.3 |
| | (9.0 | ) |
| Fiscal 2013 | $ | 25,458.9 |
| | $ | 302.2 |
| | $ | 25,761.1 |
| | (5.3 | ) |
EM | $ | 14,933.1 |
| | $ | 707.6 |
| | $ | 15,640.7 |
| | |
| TS | 10,774.4 |
| | 789.2 |
| | 11,563.6 |
| | |
| Fiscal 2012 | $ | 25,707.5 |
| | $ | 1,496.8 |
| | $ | 27,204.3 |
| | |
Consolidated sales for fiscal 2013 were $25.46 billion, a decrease of 1.0%, or $248.6 million, from the prior year consolidated sales of $25.71 billion. Organic sales (as defined earlier in this MD&A) decreased 5.3% year over year and declined 4.2% excluding the translation impact of changes in foreign currency exchange rates. The organic revenue decline was primarily due to the revenue decline at TS.
EM sales of $15.09 billion for fiscal 2013 increased 1.1% from the prior year sales of $14.93 billion. EM organic revenue in constant currency decreased 1.2% year over year primarily related to the Americas region, which (i) experienced weaker demand and (ii) exited the lower margin commercial components business. On a regional basis, the Americas organic revenue decreased 10.0% year over year primarily due to the decision to exit the lower margin commercial components business. For EMEA, despite the ongoing recessionary trends in the region organic revenue was relatively flat year over year in constant currency. Asia organic revenue increased 6.5% year over year, which was primarily due to higher revenue in the lower gross margin fulfillment business. The higher growth rate in Asia resulted in a regional shift in the mix of sales between the lower-margin Asia region and the higher-margin western regions, which negatively impacted both EM's consolidated gross profit and operating income margins.
TS sales of $10.36 billion for fiscal 2013 decreased 3.8% from the prior year sales of $10.77 billion. Organic revenue declined 8.3% year over year in constant dollars primarily due to weaker sales in the western regions. In the Americas region, year-over-year organic sales decreased 8.5%, and sales in EMEA decreased 11.7% in constant currency. On a product level, declines in servers and hardware were partially offset by growth in storage, services, and software.
Fiscal 2012 Comparison to Fiscal 2011
The table below provides the comparison of reported fiscal 2012 and 2011sales for the Company and its operating groups to organic sales (as defined previously) to allow readers to better assess and understand the Company’s revenue performance by operating group.
| | | | | | | | | | | | | | | | | | | | | |
| | | | | | | Acquisition/ | | | Extra Week | | | | | | | 2011 to 2010 |
| | | Sales as | | | Divested | | | in | | | Pro Forma | | | Pro Forma |
| | | Reported | | | Revenue | | | Q1 FY10 | | | Sales | | | Change |
| | | (Dollars in millions) | |
| EM | | $ | 15,066.2 | | | $ | 44.9 | | | $ | — | | | $ | 15,111.1 | | | | 21.9 | % |
| TS | | | 11,468.2 | | | | (188.5 | ) | | | — | | | | 11,279.7 | | | | 11.3 | |
| | | | | | | | | | | | | | | | | |
| Fiscal 2011 | | $ | 26,534.4 | | | $ | (143.6 | ) | | $ | — | | | $ | 26,390.8 | | | | 17.1 | |
| | | | | | | | | | | | | | | | | |
| | | | | | | | | | | | | | | | | | | | | |
| EM | | $ | 10,966.8 | | | $ | 1,605.5 | | | $ | (174.3 | ) | | $ | 12,398.0 | | | | | |
| TS | | | 8,193.4 | | | | 2,188.0 | | | | (243.5 | ) | | | 10,137.9 | | | | | |
| | | | | | | | | | | | | | | | | |
| Fiscal 2010 | | $ | 19,160.2 | | | $ | 3,793.5 | | | $ | (417.8 | ) | | $ | 22,535.9 | | | | | |
| | | | | | | | | | | | | | | | | |
19
|
| | | | | | | | | | | | | | |
| | Sales as Reported | | Acquisition Sales | | Organic Sales | | 2012 to 2011 Change |
| | (Dollars in millions) | | |
| EM | $ | 14,933.1 |
| | $ | 211.2 |
| | $ | 15,144.3 |
| | (6.3 | )% |
| TS | 10,774.4 |
| | 137.8 |
| | 10,912.2 |
| | (1.7 | ) |
| Fiscal 2012 | $ | 25,707.5 |
| | $ | 349.0 |
| | $ | 26,056.5 |
| | (4.4 | ) |
EM | $ | 15,066.2 |
| | $ | 1,092.3 |
| | $ | 16,158.5 |
| | |
| TS | 11,468.2 |
| | (365.4 | ) | | 11,102.8 |
| | |
| Fiscal 2011 | $ | 26,534.4 |
| | $ | 726.9 |
| | $ | 27,261.3 |
| | |
Consolidated sales infor fiscal 20112012 were $26.53$25.71 billion an increase, a decrease of 38.5%3.1%, or $7.37 billion,$826.9 million, from fiscal 2010the prior year consolidated sales of $19.16 billion. This increase was due to the combination of growth through acquisitions and organic growth of 17.1%$26.53 billion. EM sales of $15.07 billion in fiscal 2011 increased 37.4% over fiscal 2010 sales of $10.97 billion. The year-over-year comparisons were impacted by acquisitions and the transfer of the TS Americas embedded business to EM Americas. Organic sales increased 21.9% year over year and all three regions contributed with organic growth of 14.2%, 34.4% and 19.5% in the Americas, EMEA and Asia, respectively, largely attributable to the continued strong end demand across the technology industry. TS sales of $11.47 billion in fiscal 2011 increased 40.0% over fiscal 2010 sales of $8.19 billion. The year-over-year comparisons were positively impacted by recent acquisitions, and partially offset by the transfer of the TS Americas embedded business to EM and a divestiture. Organic sales increased 11.3% year over year driven by the Americas and Asia regions with increased organic sales of 13.0% and 31.4%, respectively. In the EMEA region, organic sales increased 1.7%. On a product level, year-over-year sales growth was driven primarily by demand for storage and servers.
Fiscal 2010 Comparison to Fiscal 2009
The table below provides the comparison of reported fiscal 2010 and 2009 sales for the Company and its operating groups to pro forma (or organic) sales as previously(as defined to allow readers to better assess and understand the Company’s revenue performance by operating group.
| | | | | | | | | | | | | | | | | |
| | | | | | | | | | | | | | | 2010 to 2009 |
| | | Sales as | | | Acquisition | | | Pro Forma | | | Pro Forma |
| | | Reported | | | Sales | | | Sales | | | Change |
| | | (Dollars in millions) |
| EM | | $ | 10,966.8 | | | $ | — | | | $ | 10,966.8 | | | | 15.6 | % |
| TS | | | 8,193.4 | | | | 119.1 | | | | 8,312.5 | | | | 15.2 | |
| | | | | | | | | | | | | | |
| Fiscal 2010 | | $ | 19,160.2 | | | $ | 119.1 | | | $ | 19,279.3 | | | | 15.5 | |
| | | | | | | | | | | | | | |
| | | | | | | | | | | | | | | | | |
| EM | | $ | 9,192.8 | | | $ | 291.8 | | | $ | 9,484.6 | | | | | |
| TS | | | 7,037.1 | | | | 177.9 | | | | 7,215.0 | | | | | |
| | | | | | | | | | | | | | |
| Fiscal 2009 | | $ | 16,229.9 | | | $ | 469.7 | | | $ | 16,699.6 | | | | | |
| | | | | | | | | | | | | | |
Consolidated sales in fiscal 2010 were $19.16 billion, up 18.1%, or $2.93 billion, over consolidated sales of $16.23 billion in fiscal 2009. The continued growth throughout fiscal 2010 exceeded management’s expectations as the technology markets recovered faster than anticipated following the rapid declines experienced in fiscal 2009. As mentioned earlier in this MD&A, fiscal 2010 included an extra week when compared with fiscal 2009,&A) decreased 4.4%, which management estimates added approximately $400 million in sales. Acquisitions also positively impacted fiscal 2010 results as organic growth was 15.5%.
EM sales of $10.97 billion increased 19.3%, or $1.77 billion, over sales of $9.19 billion in fiscal 2009. Organic sales increased 15.6% year over year. All three regions contributed to the year-over-year increase in EM sales led by the Asia region where sales increased 34.9%. The EMEA region sales increased 20.6% year over year and organic revenue growth was 12.5%. Excluding the translation impact of changes in foreign currency exchange rates, EM EMEA sales increased 19.9% year over year and organic sales increased 11.8%. Sales increased 4.5% from prior year in the Americas region, which had initially been slower to recover than the other EM regions; however, the Americas sales increased 17.8% and 39.5% year over year in the third and fourth quarters, respectively.
TS sales of $8.19 billion in fiscal 2010 were up 16.4%, or $1.16 billion, over sales of $7.04 billion in fiscal 2009. Organic sales increased 15.2% year over year. TS Asia sales increased 88.4% year over year and 59.8% on an organic sales basis as the Asia region was positively impacted by investments and acquisitions made in China. Sales increased 15.2% and 2.5% year over year in TS Americas and TS EMEA, respectively. Excluding the translation impact of changes in foreign currency exchange rates, TS EMEA sales increased 1.8% year over year. The EMEA region continues to lag in the economic recovery as compared with the other TS regions, although it did see robust year-over-year organic growth of approximately 13.8% in the fourth quarter.
20
Gross Profit and Gross Profit Margins
Consolidated gross profit in fiscal 2011 was $3.11 billion, an increase of $827.6 million, or 36.3%, from fiscal 2010 due primarily to strong organic sales growth and the increase in sales related to acquisitions. Gross profit margin of 11.7% declined 19 basis points year over year due primarily to the impact of businesses acquired, which had product lines with lower gross margins than Avnet’s other product lines. EM gross profit margin increased 10 basis points where the addition of the lower margin embedded business acquired from Bell and the embedded business transferred from TS mostly offset the margin increase that occurred in the legacy EM business and geographic mix shift. TS gross profit margin declined 52 basis points year over year primarily attributable to the EMEA region and the impact of the integration of the Bell business, which has a lower gross profit margin profile than the other TS EMEA product lines. Although the Bell business has a lower gross profit margin profile due to its product mix, the Company expects to realize the full impact of over $60 million in annualized synergies in the first quarter of fiscal 2012. However, portions of the synergies have been realized incrementally as cost actions have been taken during fiscal 2011.
Consolidated gross profit for fiscal 2010 was $2.28 billion, up $257.2 million, or 12.7%, over the prior year primarily due to the increase in sales volume. Gross profit margin of 11.9% declined 56 basis points over the prior year with all regions in each operating group experiencing declines in margins. The gross profit margin at EM declined 63 basis points year over year partially due to geographic mix changes as the Asia region, which has a lower gross profit margin than the Americas or EMEA regions, represented 35% of EM sales in fiscal 2010 as compared with 31% in fiscal 2009. In addition, the EMEA region gross profit margins had been slower to recover than those in the Americas or Asia regions. The negative effects of the recession began laterdouble-digit decline in the EMEA region than in the Americas and, as a result, the region’s recovery also occurred later than the other regions. However, the quarterly gross profit margin at both operating groups.
EM improved sequentially during the last three quarterssales of $14.93 billion for fiscal 2010 in all three regions with the largest improvement in the EMEA region where gross profit margin increased over 100 basis points2012 decreased 0.9% from the March to June quarter. TS gross profit margin was down 54 basis pointsprior year sales of $15.07 billion. EM organic revenue in constant currency decreased 6.0% year over year due to the combination of (i) geographicexceptionally high growth in fiscal 2011 driven by the V-shaped recovery in electronic components, which led to negative organic growth in EM for fiscal 2012. On a regional basis, EMEA experienced double-digit, year-over-year revenue declines for both organic and reported revenue, as a result of weaker demand amid concerns surrounding economic conditions in Europe. Asia organic revenue declined 7.5 %, primarily due to slowing growth in China, and sales in the Americas were flat as compared with fiscal 2011.
TS sales of $10.77 billion for fiscal 2012 decreased 6.1% from the prior year sales of $11.47 billion. The year-over-year revenue decrease was due primarily to the Americas and EMEA regions, which were down 9.1% and 10.4%, respectively, partially offset by growth of 17.6% in Asia. Organic revenue decreased 1.7% year over year primarily due to EMEA, which decreased 12.7% and 11.4% in constant currency. The double-digit decline in EMEA was due to weaker demand in Europe due primarily to the macroeconomic environment previously mentioned. The organic decline in EMEA was mostly offset by an increase of 11.5% in Asia and 1.7% in the Americas. On a product level, software and services experienced strong double-digit growth year over year and storage, processors and other hardware also grew year over year.
Gross Profit and Gross Profit Margins
Consolidated gross profit in fiscal 2013 was $2.98 billion, a decrease of $70.8 million, or 2.3%, from the prior year and a decrease of 7.0% on an adjusted basis in constant currency. Gross profit margin of 11.7% decreased 17 basis points over the prior year. EM gross profit margin declined 52 basis points year over year primarily related to declines in gross margins in the EMEA region and a higher mix changes asof revenues from the lower gross profit margin Asia region. The decline in EMEA gross margin was primarily due to the effects of market pressures associated with relatively short product lead times. With respect to regional mix, the Asia region which hascontributed 38% of EM sales in the current year from 34% in the prior year, attributable to higher growth rates in Asia, the effects of the acquisition of Internix, Inc. in Japan, and lower growth rates in the western regions.TS gross profit margin improved 24 basis points year over year, primarily driven by the Americas and EMEA offset by a decrease in Asia. These increases were driven primarily by the revenue mix of higher margin products and services.
Consolidated gross profit in fiscal 2012 was $3.05 billion, a decrease of $57.2 million, or 1.8%, from the prior year and decreased 4.0% on an adjusted basis in constant currency. Gross profit margin of 11.9% improved 16 basis points over the prior year. EM gross profit margin was down 38 basis points year over year, with all three regions experiencing declines. The Americas region was impacted by the transfer of the lower gross profit margins thanmargin Latin America commercial components business from TS Americas to EM Americas at the Americas orbeginning of fiscal 2012. In addition, the regional mix of business was slightly more skewed to the lower
margin regions in the current fiscal year as the higher gross margin EMEA regions,region represented 12%28% of TS salesthe overall EM revenue mix as compared with 7%32% in fiscal 2009, (ii) lowerthe prior year. TS gross profit margins in Asia and (iii) lowermargin improved 73 basis points year over year. The year-over-year improvement was driven by the western regions, particularly EMEA. The Americas region's gross profit margins inmargin benefited from the Americas region.transfer of the Latin America business to EM as mentioned previously.
Selling, General and Administrative Expenses
Selling, general and administrative expenses (“SG&A expenses”) were $2.10$2.20 billion in fiscal 2011, which was2013, an increase of $481.5$111.5 million, or 29.7%5.3%, from fiscal 2010. Thethe prior year. This increase inconsisted of (i) an increase of approximately $184.4 million related to expenses from businesses acquired and (ii) the effects of inflation and other factors, which increased the Company's SG&A expenses was primarilyby an estimated $61.0 million, partially offset by (iii) a resultdecrease of approximately $304$100.0 million related to recent cost reduction actions, and (iv) a decrease of additional SG&A expenses associated with acquisitions, $170approximately $33.9 million of incremental costs necessary to support the 17.1% year-over-year organic sales growth, net of incremental cost savings from integration activity and the additional week of expenses in fiscal 2010 and $7 million due related to the translation impact of changes in foreign currency exchange rates. Metrics that management monitors with respect to its operating expenses are SG&A expenses as a percentage of sales and as a percentage of gross profit. In fiscal 2011,2013, SG&A expenses were 7.9%as a percentage of sales were 8.7%and 67.6%were 74.0% as a percentage of gross profit as compared with 8.5%8.1% and 71.0%68.6%, respectively, in fiscal 2010. This continued year-over-year improvement reflects2012. SG&A expenses as a percentage of gross profit at EM increased 541 basis points year over year, also due to the effects of recent acquisitions as the related cost savings have not yet been fully attained and due to declines in total gross profit dollars relative to operating leverageexpenses. SG&A expenses as a percentage of gross profit at TS increased 360 basis points year over year due primarily to the effects of the decrease in revenues as previously described and, to a lesser extent, the business model realized fromeffects of recent revenue growthacquisitions as certain cost synergies have not yet been attained, in particular in EMEA, and effective expense management.which are not expected to be fully achieved for several quarters while the integration work is in process.
SG&A expenses were $1.62$2.09 billion in fiscal 2010, an increase of $87.72012, essentially flat from the prior year, decreasing $7.8 million or 5.7%, as compared with $1.53 billion in fiscal 2009.. The increasedecrease in SG&A expenses was primarily attributablea result of (i) approximately $51 million related to supportinga decrease in expenses for the increased sales volume, an additional week in fiscal 2010 and additional expenses associated with businesses acquired, partially offset by the impact of cost reduction actions. Theexisting business due primarily to cost reduction actions taken duringand a decrease in variable expenses related to the revenue decline; (ii) approximately $6 million related to a decrease due to the translation impact of changes in foreign currency exchange rates, partially offset by (iii) an increase of approximately $49.0 million related to expenses from businesses acquired. In fiscal 2009, as described in further detail below, were completed during the first quarter of fiscal 2010 and the full benefit of the actions were realized beginning in the second quarter of fiscal 2010.2012, SG&A expenses were 8.5%as a percentage of sales were 8.1%and 71.0%were 68.6% as a percentage of gross profit in fiscal 2010 as compared with 9.4% of sales7.9% and 75.7% of gross profit67.6%, respectively, in fiscal 2009. The year-over-year improvement in these metrics is primarily the result of effective cost management, including the impact of cost reduction actions taken during fiscal 2009, as sales increased 18.1% year over year as compared with only a 5.7% increase in SG&A expenses.2011.
Due to the decline in sales and gross profit margin that began in late fiscal 2008 and accelerated further during fiscal 2009, the Company initiated significant cost reduction actions to realign its expense structure with market conditions (seeRestructuring, Integration and Other Chargesfor a discussion of charges associated with the actions undertaken). In the third quarter of
Fiscal 2013
During fiscal 2008,2013, the Company began to experience demand weakness and organic sales growth at both EM and TS continued to slow through the first quarter of fiscal 2009. In the second quarter of fiscal 2009, the Company experienced continued sales decelerationtake certain actions to reduce costs in both operating groups particularly in November in the Asia region and in December in the Americas region. During the third quarter of fiscal 2009, end demand in the EM business deteriorated even further, in particular in EM Americas and EM EMEA, which have been the
21
Company’s most profitable regions. As a result of the poorresponse to market conditions through mid-March of fiscal 2009, the Company took actions to reduceand incurred acquisition and integration costs by approximately $200 million on an annualized basis and had expected such actions to be completed by the end of the June quarter of fiscal 2009. However, based upon third quarter of fiscal 2009 results, the Company announced further actions to reduce annualized costs by an additional $25 million, bringing the aggregate annual cost reductions announced to approximately $225 million since March 2008. As of the end of the fourth quarter of fiscal 2009, management estimated that approximately $200 million in annualized cost savings had been achieved and the remaining cost reduction actions were completed at the end of September 2009; therefore, the full benefit of the annualized cost savings of $225 million were reflected in the December quarter of fiscal 2010. In addition, the December quarter of 2010 included cost synergies of approximately $40 million as a result of acquisition integration activities most of which were completed by the end of fiscal 2009.
Impairment Charges
During fiscal 2009, the Company recognized non-cash goodwill and intangible asset impairment charges totaling $1.41 billion pre-tax, $1.38 billion after tax and $9.13 per share.
During the second quarter of fiscal 2009, due to a steady decline in the Company’s market capitalization due primarily to the global economic downturn’s impact on the Company’s performance and the turmoil in the equity markets, the Company determined an interim goodwill impairment test was necessary and performed the interim test on all six of its reporting units as of December 27, 2008. Based on the test results, the Company determined that goodwill at four of its reporting units was impaired. Accordingly,associated with acquired businesses during the second quarter of fiscal 2009, the Company recognized a non-cash goodwill impairment charge of $1.32 billion pre-tax, $1.28 billion after tax and $8.51 per share to write off all goodwill related to its EM Americas, EM Asia, TS EMEA and TS Asia reporting units.
During the fourth quarter of fiscal 2009, the Company performed its annual goodwill impairment test which indicated that three of its six reporting units, including EM Asia and TS EMEA, continued to have fair values below their carrying values.year. As a result, the Company was required to recognize the impairment of additional goodwill which arose subsequent to the second quarter of fiscal 2009 in the EM Asia and TS EMEA reporting units. Of the non-cash goodwill impairment charges of $62.3 million pre- and after tax and $0.41 per share recognized in the fourth quarter of fiscal 2009, $41.4 million related to the recently acquired business in Japan, which was assigned to the EM Asia reporting unit. Accounting standards require goodwill from an acquisition to be assigned to a reporting unit and also require goodwill to be tested on a reporting unit level, not by individual acquisition. As noted above, the annual impairment analysis indicated that the fair value of the EM Asia reporting unit continued to be below its carrying value. As a result, the goodwill from the recent acquisition was required to be impaired. The remaining $20.8 million of the impairment charges related to additional goodwill in the TS EMEA reporting unit primarily as a result of final acquisition adjustments during the purchase price allocation period related to an acquisition for which the goodwill had been fully impaired in the second quarter of fiscal 2009.
During fiscal 2009, the Company also evaluated the recoverability of its long-lived assets at each of the reporting units where goodwill was deemed to be impaired. Based upon this evaluation, the Company determined that certain of its amortizable intangible assets were impaired. As a result, the Company recognized a non-cash intangible asset impairment charge of $31.4 million pre- and after tax and $0.21 per share during the second quarter of fiscal 2009. In conjunction with the annual goodwill impairment test, the Company again evaluated the recoverability of its long-lived assets during the fourth quarter of fiscal 2009 and determined that no impairment had occurred.
The non-cash impairment charges had no impact on the Company’s compliance with debt covenants, its cash flows or available liquidity, but did have a material impact on its consolidated financial statements.
Restructuring, Integration and Other Charges
Fiscal 2011
During fiscal 2011, the Company recognizedrecorded restructuring, integration and other charges of $77.2$149.5 million pre-tax, $56.2. Restructuring charges of $120.0 million after tax consisted of $73.3 million for severance, $34.4 million for facility exit costs and $0.36fixed asset write-downs, and $12.3 million for other restructuring charges, including a $6.6 million loss related to the write-down of the net assets and goodwill related to the exit of a non-integrated business in the EM Americas region. Integration costs were $35.7 million, of which $8.8 million related to the exit of two multi-employer pension plans associated with acquired entities in Japan. Acquisition related charges and adjustments were a credit of $3.2 million, consisting primarily of the reversal of an earn-out liability of $11.2 million for which payment is no longer expected to be incurred. The Company recorded a credit of $3.1 million to adjust reserves related to prior year restructuring activity that were no longer required. The tax-effected impact of restructuring, integration, and other charges was $116.4 million and $0.83 per share on a diluted basis associated primarilybasis.
Severance charges recorded in fiscal 2013 related to the reduction of over 1,600 employees in sales and business support functions in connection with the cost reduction actions taken in all three regions in both operating groups with employee reductions of approximately 1,100 in EM, 400 in TS and 150 in business support functions. Facility exit costs for vacated facilities related to 32 facilities in the Americas, 26 in EMEA and 11 in the Asia region, and consisted of reserves for remaining lease liabilities for exited facilities and the write-down of the related fixed assets.
Integration costs incurred were related to the integration of acquired businesses and incremental costs incurred as part of the acquired Bell business. Restructuringconsolidation and closure of certain office and warehouse locations. Integration costs included $28.6 million pre-tax for severance and $17.3 million pre-tax for facility exitIT consulting costs for lease liabilities, fixed asset write downs and other related charges associated with vacated facilities and $1.8 million for other charges. Integration costs of $25.1 million pre-tax included professional fees associated with legal and IT consulting,system integration assistance, facility moving costs, legal fees, travel, meeting, marketing and communication costs that were incrementally incurred as a result of the integration activity. Also, included in integration costs are incremental salary costs associated with the consolidation and employee benefitsclosure activities, as well as costs associated with acquisition activity, primarily ofrelated to the acquired businesses’businesses' personnel who were retained by Avnet for
22
extended periods following the close of the acquisitions solely to assist in the integration of the acquired businesses’businesses' IT systems and administrative and logistics operations into those of Avnet. These identified personnel have no other meaningful day-to-day operational responsibilities outside of the integration effort. TransactionAcquisition transaction costs consisted
primarily of professional fees for brokering the deals, due diligence work and other legal costs.costs associated with the transaction, along with the gain from the reversal earn-out liability previously described.
Fiscal 2012
During fiscal 2012, the Company took certain actions to reduce costs in both operating groups in response to market conditions and incurred acquisition and integration costs associated with acquired businesses during the fiscal year. As a result, the Company recorded restructuring, integration and other charges of $73.6 million. Restructuring charges of $50.3 million consisted of $33.2 million for severance, $12.0 million for facility exit costs and fixed asset write-downs, and $5.1 million for other restructuring charges, primarily other lease obligations that have no ongoing benefit to the Company. Integration costs and acquisition transaction costs were $9.4 million and $10.6 million, respectively. The Company recorded a credit of $3.3 million to adjust reserves related to prior year restructuring activity that were no longer required. In addition, the Company recorded $6.7 million for (i) a legal claim associated with an acquired business and a potential royalty claim related to periods prior to acquisition by Avnet and (ii) a legal claim associated with an indemnification of a prior divested business. The tax-effected impact of restructuring, integration and other charges was $53.0 million and $0.35 per share on a diluted basis
Severance charges recorded in fiscal 2012 related to the reduction of over 800 employees in sales, administrative and finance functions in connection with the cost reduction actions taken in all three regions in both operating groups with employee reductions of approximately 480 in EM and 320 in TS. Facility exit costs for vacated facilities related to 12 facilities in the Americas, 5 in EMEA and 13 in the Asia region and consisted of reserves for remaining lease liabilities and the write-down of leasehold improvements and other fixed assets.
Fiscal 2011
During fiscal 2011, the Company recognized restructuring, integration and other charges of $77.2 million associated primarily with the integration of the acquired Bell business. Restructuring costs included $28.6 million for severance and $17.3 million for facility exit costs for lease liabilities, fixed asset write-downs and other related charges associated with vacated facilities and $1.8 million for other charges. Integration costs were $25.1 million and acquisition transactions costs were $15.6 million. In addition, the Company recorded a reversal of $11.3$11.3 million pre-tax related to (i) the reversal of restructuring reserves established in prior years that were deemed to be no longer required, (ii) acquisition adjustments for which the purchase allocation period had closed and (iii) exit-related reserves originally established through goodwill in prior years that were deemed no longer required and were credited to the consolidated statement of operations rather than to goodwill because the associated goodwill was impaired in fiscal 2009. The tax-effected impact of restructuring, integration, and other charges was $56.2 million and $0.36 per share on a diluted basis
Severance charges recorded in fiscal 2011 related to personnel reductions of over 550 employees in administrative, finance and sales functions primarily in connection with the integration of the acquired Bell business into the existing EM Americas, TS Americas and TS EMEA regions and, to a lesser extent, other cost reduction actions in other regions. Facility exit costs consisted of lease liabilities, fixed asset write-downs and other related charges associated with 50 vacated facilities: 23 in the Americas, 25 in EMEA and two in the Asia/PacAsia region. Total amounts utilized during fiscal 20112012 consisted of $25.6$12.1 million in cash payments $3.3and $3.2 million in non-cash asset write downs and $0.3 million related to adjustments to reserves and foreign currency translation. As of July 2, 2011, management expects the majority of the remaining severance reserves to be utilized by the end of fiscal 2012 and the remaining facility exit cost reserves to be utilized by the end of fiscal 2015.
Fiscal 2010Operating Income
During fiscal 2010, the Company recognized restructuring, integration and other charges of $25.4 million pre-tax, $18.8 million after tax and $0.12 per share on a diluted basis. The Company recognized restructuring charges of $16.0 million pre-tax for the remaining cost reduction actions announced during fiscal 2009 which included severance costs, facility exit costs and other charges related to contract termination costs and fixed asset write-downs. The Company also recognized integration costs of $2.9 million pre-tax for professional fees, facility moving costs and travel, meeting, marketing and communication costs that were incrementally incurred as a result of the integration efforts of the recently acquired businesses, $6.5 million pre-tax for a value-added tax exposure in Europe related to an audit of prior years, and $3.2 million pre-tax of other charges including acquisition-related costs which would have been capitalized under the prior accounting rules. The Company also recorded a credit of $3.2 million pre-tax to adjust reserves related to prior restructuring activity which were determined to be no longer required.
Severance charges recorded in fiscal 2010 of $9.7 million related to personnel reductions of over 150 employees in administrative, finance and sales functions in connection with the cost reduction actions in all three regions. Facility exit costs of $3.7 million consisted of lease liabilities and fixed asset write-downs associated with seven vacated facilities in the Americas, one in EMEA and four in the Asia/Pac region. Other charges of $2.6 million consisted primarily of contractual obligations with no on-going benefit to the Company. The total amounts utilized during fiscal 2011 consisted of $1.1 million in cash payments, and $0.4 million related to adjustments to reserves and foreign currency translation. As of July 2, 2011, the remaining reserves totaled $2.2 million, of which $0.2 million related to remaining facility exit cost and severance reserves which are expected to be utilized by the end of fiscal 2013 and $2.0 million related to other contractual obligations which are expected to be utilized by the end of fiscal 2012.
Fiscal 2009
In response to the decline in sales and gross profit margin due to weaker market conditions, the Company initiated significant cost reduction actions during fiscal 2009 to realign its expense structure with market conditions. As a result, the Company incurred restructuring, integration and other charges totaling $99.3 million pre-tax, $65.3 million after tax and $0.43 per share during fiscal 2009 related to the cost reductions as well as integration costs associated with recently acquired businesses. Restructuring charges included severance of $50.8 million, facility exit-costs of $29.6 million and other charges of $4.5 million related to contract termination costs, fixed asset write-downs and other charges. The Company also recorded a reversal of $2.5 million to adjust estimated costs for severance, lease and other reserves related to prior year restructuring activity which were deemed excessive and that reversal was credited to restructuring, integration and other charges. Integration costs of $11.2 million included professional fees, facility moving costs, travel, meeting, marketing and communication costs that were incrementally incurred as a result of the acquisition integration efforts. Other items recorded to restructuring, integration and other charges included a net credit of $1.2 million related to acquisition adjustments for which the purchase allocation period had closed, a loss of $3.1 million resulting from a decline in the market value of certain small investments that the Company liquidated, and $3.8 million of incremental intangible asset amortization.
23
Severance charges recorded in fiscal 2009 related to personnel reductions of approximately 1,900 employees in administrative, finance and sales functions in connection with the cost reduction actions in all three regions of both operating groups with employee reductions of approximately 1,400 in EM, 400 in TS and the remaining from centralized support functions. Exit costs for vacated facilities related to 29 facilities in the Americas, 13 in EMEA and three in Asia/Pac and consisted of reserves for remaining lease liabilities and the write-down of leasehold improvements and other fixed assets. The total amounts utilized during fiscal 2011 consisted of $9.4 million in cash payments and $5.4 million related to adjustments to reserves and foreign currency translation. As of July 2, 2011, the remaining reserves totaled $5.9 million, of which $0.3 million related to severance reserves which are expected to be utilized by the end of fiscal 2012 and $5.6 million related to remaining facility exit cost reserves which are expected to be utilized by the end of fiscal 2015.
Operating Income (Loss)
During fiscal 2011,, the Company generated operating income of $930.0$626.0 million an increase of 46.3%, representing a 29.2% decline as compared with prior year operating income of $635.6$884.2 million in fiscal 2010. The increase in operating income was attributable to the impact of acquisitions and the growth in gross profit dollars associated with the 17.1% organic sales growth.. Consolidated operating income margin was 3.5% and 3.3%2.5% as compared with 3.4% in fiscal 2011 and 2010, respectively.the prior year. Both periods included restructuring, integration and other charges as described inRestructuring, Integration and Other Charges,above. Excluding these charges from both periods, operating income forwas $775.5 million, or 3.0% of sales, in fiscal 2011 was $1.01 billion, or 3.8% of consolidated sales,2013 as compared with operating income$957.8 million, or 3.7% of $661.0 million, or 3.5% of consolidated sales, for fiscal 2010.in the prior year. EM operating income of $832.4$624.0 million decreased 17.0% year over year and operating income margin decreased 90 basis points year over year to 4.1%. The decline in EM operating income margin was primarily due to lower gross profit margin as previously mentioned, resulting in lower profitability in the western regions, offset partially by the benefits of cost reduction actions taken. TS operating income of $278.4 million decreased 12.8% year over year and operating income margin decreased 27 basis points to 2.7% due primarily to the effects of the decline in revenue, as previously described and, to a lesser extent, the effects of recent acquisitions as certain cost synergies have not yet been attained, in particular in EMEA, and which are not expected to be fully achieved for several quarters while the integration work is in process. Corporate operating expenses were $126.9 million in fiscal 2013 as compared with $112.9 million in fiscal 2012.
During fiscal 2012, the Company generated operating income of $884.2 million, down 4.9%, as compared with $930.0 million in the prior year. Consolidated operating income margin was 3.4% as compared with 3.5% in the prior year. Both periods
included restructuring, integration and other charges as described in Restructuring, Integration and Other Charges above. Excluding these charges from both periods, operating income was $957.8 million, or 3.7% of sales, in fiscal 2012 as compared with $1.01 billion, or 3.8% of sales, in the prior year. EM operating income of $751.4 million was down 9.7% year over year. While EM's operating income margin remained within management's target range of 5.0% to 5.5%, it declined 50 basis points year over year to 5.0%. This decline in EM operating income margin was primarily due to the negative operating leverage, particularly in EMEA related to the year-over-year decline in sales in fiscal 2012 due to macroeconomic conditions in the region as compared with the positive operating leverage during fiscal 2011 due to the particularly strong sales growth in fiscal 2011. In addition, lower operating income margin in EM Asia, due to economic slowing in China, also contributed to EM's overall decline in operating income margin. The decline at EM was somewhat mitigated by the benefits from cost reduction actions taken in response to business conditions. TS operating income of $319.3 million increased 69.3%11.4% year over year and operating income margin increased 10546 basis points to 5.5%. All three3.0% primarily due to improvement in the western regions, within EM contributed, but the improvementwhich was primarily driven by the operating leverage in the EMEA region with its 31.9% year-over-year revenue growth. TS operating incomecombination of $286.7 million increased 13.9% year over year while operating income margin declined 57 basis points year over year to 2.5% due primarily to lowerhigher gross profit margins inand the EMEA region which includes lower operating margins of the acquired businesses as compared with the other TS businesses.benefits from restructuring initiatives. Corporate operating expenses were $112.0$112.9 million in fiscal 20112012 as compared with $82.3$112.0 million in fiscal 2010 primarily due to net periodic pension expense recognized in fiscal 2011 compared with pension income recognized in fiscal 2010..
Operating income for fiscal 2010 was $635.6 million, or 3.3% of consolidated sales, as compared with an operating loss of $1.02 billion for fiscal 2009. Both periods included restructuring, integration and other charges and the prior year included impairment charges as was previously mentioned in this MD&A. Excluding these charges, operating income for fiscal 2010 was $661.0 million, or 3.5% of consolidated sales, as compared with operating income of $491.5 million, or 3.0% of consolidated sales, for fiscal 2009. EM operating income increased 38.7% to $491.6 million for fiscal 2010 and its operating income margin improved 62 basis points to 4.5% as compared with fiscal 2009 as all three regions contributed to the improvement. EM’s operating income margin improved year over year in each respective quarter of fiscal 2010 and ended the June quarter at 5.6% which was the first time in two years that EM’s operating income margin reached that level and was within the target range as established by management. TS operating income increased 25.0% to $251.7 million for fiscal 2010 and operating income margin improved 21 basis points to 3.1% as compared with fiscal 2009. TS continued to incur incremental expenses as it made additional investments in Asia, particularly in China. Corporate operating expenses were $82.3 million in fiscal 2010 as compared with $64.5 million in fiscal 2009. The prior year corporate operating expenses were unusually low due to the economic downturn and its impact on the accrual for equity compensation which is based upon performance targets. Conversely, corporate expenses in the fiscal 2010 are higher than typical primarily due to an increase in incentive compensation driven by the Company’s financial results for fiscal 2010 which exceeded established targets and were significantly higher as compared with fiscal 2009.
Interest Expense and Other Income (Expense), net
Interest expense for fiscal 20112013 was $92.5$107.7 million up $30.7, an increase of $16.8 million, or 49.7% from interest expense of $61.7 million in fiscal 2010.18.5%, compared with the prior year. The year-over-year increase in interest expense was primarily due to an increase inhigher average debt balances and incremental interest expense related to the 4.875% Notes issued during the second quarter of fiscal 2013, the proceeds of which were used to fundrepay the acquisitionsshort-term debt, which had lower interest rates. See Financing Transactions for further discussion of businesses and the increase in working capital to support the significant growth in sales.Company's outstanding debt.
Interest expense for fiscal 20102012 was $61.7$90.9 million, down $16.9$1.6 million, or 21.5%1.7%, from interest expense of $78.7 million in fiscal 2009. Duringcompared with the first quarter of fiscal 2010, the Company adopted an accounting standard which required retrospective application of the standard’s provisions to prior years which resulted in recognizing incremental non-cash interest expense of $12.2 million in addition to the previously reported interest expense of $66.5 million in fiscal 2009 (see footnote (a) to Item 6.Selected Financial Datain this Form 10-K). Excluding the non-cash interest expense, theyear. The year-over-year decrease in interest expense was due primarily to (i) the eliminationpay off of interest on the Company’s $300.0$104.4 million 2% Convertible Senior Debentures which were extinguishedof 3.75% convertible debt in March 2009. SeeFinancing Transactionsfor further discussion of the Company’s outstanding debt.
24
Other income, net, was $10.7 million in fiscal 2011 as compared with otherand (ii) lower interest expense net, of $2.5 million in fiscal 2010 due primarily toincurred under foreign currency exchange gains compared with losses in the prior year and higher interest income earnedbank credit facilities as compared with the prior year. Other
During fiscal 2013, the Company recognized $0.1 million of other expense as compared with $5.4 million in the prior year. The year-over-year increase in other income net, was $2.5is attributable to a reduction in foreign currency exchange losses in the current year. Included in other income for fiscal 2013 is a gain on sale of marketable securities partially offset by a loss due to the devaluation of the Venezuelan currency.
During fiscal 2012, the Company recognized $5.4 million in fiscal 2010 of other expense as compared with other income of $10.7 million in the prior year. The year-over-year increase in other expense net, of $11.6 millionwas due primarily to foreign exchange losses in fiscal 2009 primarily related to the negative impacts of2012 compared with foreign currency exchange losses.gains in the prior year.
Gain on Bargain Purchase and Other
During fiscal 2013, the Company recognized a gain on bargain purchase and other of $31.0 million pre-tax, which consisted of (i) a gain on bargain purchase related to the acquisition of Internix of $32.7 million pre- and after tax and $0.23 per share on a diluted basis, which was partially offset by (ii) a loss of $1.7 million pre-tax and after tax and $0.01 per share on a diluted basis as a result of the divestiture of a small business in the TS Asia region.
During fiscal 2012, the Company recognized a gain on bargain purchase of $4.3 million pre- and after tax and $0.03 per share on a diluted basis. In January 2012, the Company acquired Unidux Electronics Limited, a Singapore publicly traded company, through a tender offer. After assessing the assets acquired and liabilities assumed, the consideration paid was below the fair value of the acquired net assets and, as a result, the Company recognized the gain. In addition, the Company recognized other charges of $1.4 million pre-tax, $0.9 million after tax and $0.01 per share on a diluted basis related to the write-down of an investment in a small technology company and the write-off of certain deferred financing costs associated with the early termination of a credit facility (see Financing Transactions for further discussion).
During the first quarter of fiscal 2011, the Company acquired Unidux, a Japanese publicly traded company, through a tender offer in which the Company obtained over 95% of the controlling interest.offer. After reassessing all assets acquired and liabilities assumed, the consideration paid was below the fair value of the acquired net assets and, as a result, the Company recognized a gain on bargain purchase of $31.0 million pre- and after tax and $0.20 per share on a diluted basis. In addition, the Company recognized other charges of $2.0 million pre-tax, $1.4 million after tax and $0.01 per share on a diluted basis primarily related to an impairment of buildings in EMEA and recognized a loss of $6.3 million pre-tax, $3.9 million after tax and $0.02 per share on a diluted basis related to the write downwrite-down of prior investments in smaller technology start-up companies.
During fiscal 2010 and 2009, the Company recognized a gain on sale of assets as a result of certain earn-out provisions associated with the prior sale of the Company’s equity investment in Calence LLC. The gain amounted to $8.8 million pre-tax, $5.4 million after tax and $0.03 per share on a diluted basis in fiscal 2010 and $14.3 million pre-tax, $8.7 million after tax and $0.06 per share in fiscal 2009.
Income Tax Provision
Avnet’s effective tax rate on income before income taxes was 23.2%18.1% in fiscal 20112013 as compared with 29.9% in fiscal 2010. The fiscal 2011an effective tax rate wasof 28.3% in fiscal 2012. Included in the fiscal 2013 effective tax rate is a net tax benefit of $50.4 million, which is comprised of (i) a tax benefit of $41.6 million for the reversal of previously established valuation allowances against deferred tax assets that were now determined to be realizable, a portion of which related to a legal entity in EMEA (discussed further below), (ii) net favorable audit settlements resulting in a benefit of $33.2 million, partially offset by (iii) a tax provision of $24.4 million primarily impacted byrelated to the releaseestablishment of a tax reserve (valuation allowance) on certainvaluation allowance against deferred tax assets that were determined to be realizable as discussed further below,unrealizable during fiscal 2013. The fiscal 2013 effective tax rate is lower than the fiscal 2012 effective tax rate primarily due to a favorable impact from audit settlements and, to a lesser extent, net favorablethe amount of the valuation allowance released in fiscal 2013 (as discussed further below) as compared with the amount released in fiscal 2012 due to the reduced level of income and mix of income in the current year. In fiscal 2012, withholding tax audit settlements, partially offset by changes to existing tax positions. Excluding the benefit related to legal entity reorganization resulted in an increase to the release of a tax reserve, the effective tax rate for fiscal 2011 would have been 30.6%. Going forward, the Company expects its fiscal year 2012 effective tax rate to be morethat does not exist in the range of this adjusted rate rather than the effective tax rate experienced in fiscal 2011. The fiscal 2010 effective tax rate was impacted primarily by changes to estimates for existing tax positions and net favorable tax audit settlements, offset by a reserve established against certain deferred tax assets.current year.
Prior to fiscal 2011, the Company hadestablished a full reservevaluation allowance against significant deferred tax assets related to a legal entity in EMEA due to, among several other factors, a history of losses in that entity. Recently, the legal entity has been experiencing improved earnings which required the partial release of the reserve to the extent the entity had taxable income during each of the first three quarters of fiscal 2011 and, therefore, positively impacted (decreased) the Company’s effective tax rate. During the fourth quarter ofSince fiscal 2011, the Company determined a portion of the tax reservevaluation allowance related to this entity was no longer required due to the expected continuation of improved earnings in the foreseeable future and, as a result, the Company’sCompany's effective tax rate was positively impacted (decreased) upon the release of the valuation allowance. In fiscal 2013 and 2012, the valuation allowance released associated with this EMEA legal entity was $27.1 million and $22.1 million, respectively, net of the U.S. tax reserves.expense associated with the release. The Company will continue to evaluate the need for a reservevaluation allowance against these tax assets and will adjust the valuation allowance as deemed appropriate which, when adjusted, will result in an impact to the effective tax rate. Factors that are considered in such an evaluation include historic levels of income, expectations and risk associated with estimates of future taxable income and ongoing prudent and feasible tax planning strategies. Excluding the benefit in both fiscal years related to the release of the tax assetsvaluation allowance associated with thisthe EMEA legal entity, and may release additional reserve in the future.effective tax rate for fiscal 2013 would have been 23.0% as compared with 31.1% for fiscal 2012.
Avnet’s effective tax rate on income before income taxes was 29.9%28.3% in fiscal 2010 as2012; compared with an effective tax rate on the loss before taxes of 3.2%23.2% in fiscal 2009.2011. The fiscal 20102012 effective tax rate was impacted by changes to estimates for existing tax positions, net favorable tax audit settlements, offset by a charge to establish a reserve against certain deferred tax assets. Theis higher than the fiscal 2011 effective tax rate primarily due to a lower amount of valuation allowance released in fiscal 2009 was negatively impacted by the non-deductibility of substantially all of the impairment charges2012 as compared with fiscal 2011, and, to a lesser extent, a more favorable impact from audit settlements and changes to existing tax positions in fiscal 2012 as compared with fiscal 2011. These favorable impacts were partially offset by a netwithholding tax benefit of $21.7 million, or $0.14 per share, related primarily to the release of tax reserves due to the settlement of certain tax audits in Europe. Excluding these items, the effective tax rate for fiscal 2009 would have been 28.6%.2012.
Avnet’sAvnet's effective tax rate is primarily a function of the tax rates in the numerous jurisdictions in which it does business applied to the mix of pre-tax book income. The effective tax rate may vary year over year as a result of changes in tax requirements in thethese jurisdictions, in which the Company does business and management’smanagement's evaluation of its ability to generate sufficient taxable income to offset net operating loss carry-forwards as well asand the establishment of reserves for unfavorable outcomes of tax positions taken on certain matters that are common to multinational enterprises and the actual outcome of those matters.
25
Net Income (Loss)
As a result of the factors described in the preceding sections of this MD&A, the Company’s net income in fiscal 2013was $669.1$450.1 million, or $4.34$3.21 per share on a diluted basis, as compared with net income of $410.4$567.0 million, or $2.68$3.79 per share on a diluted basis, in fiscal 20102012 and a net loss of $1.13 billion,$669.1 million, or $7.49$4.34 per share on a diluted basis, in fiscal 2009. 2011.
Fiscal 2011, 20102013, 2012 and 20092011 results were impacted by certain items as presented in the following tables:
| | | | | | | | | | | | | | | | | |
| | | Year Ended July 2, 2011 | |
| | | Operating | | | Pre-tax | | | Net | | | Diluted | |
| | | Income (Loss) | | | Income (Loss) | | | Income (Loss) | | | EPS | |
| | | (Thousands, except per share data) | |
| Restructuring, integration and other charges | | $ | (77,176 | ) | | $ | (77,176 | ) | | $ | (56,169 | ) | | $ | (0.36 | ) |
| Gain on bargain purchase and other | | | — | | | | 22,715 | | | | 25,720 | | | | 0.17 | |
| Release of tax valuation allowance, net of tax reserves adjustments | | | — | | | | — | | | | 32,901 | | | | 0.21 | |
| | | | | | | | | | | | | |
| Total | | $ | (77,176 | ) | | $ | (54,461 | ) | | $ | 2,452 | | | $ | 0.02 | |
| | | | | | | | | | | | | |
| | | | | | | | | | | | | | | | | |
| | | Year Ended July 3, 2010 | |
| | | Operating | | | Pre-tax | | | Net | | | Diluted | |
| | | Income (Loss) | | | Income (Loss) | | | Income (Loss) | | | EPS * | |
| | | (Thousands, except per share data) | |
| Restructuring, integration and other charges | | $ | (25,419 | ) | | $ | (25,419 | ) | | $ | (18,789 | ) | | $ | (0.12 | ) |
| Gain on sale of assets | | | — | | | | 8,751 | | | | 5,370 | | | | 0.03 | |
| Net increase in tax reserves | | | — | | | | — | | | | (842 | ) | | | (0.01 | ) |
| | | | | | | | | | | | | |
| Total | | $ | (25,419 | ) | | $ | (16,668 | ) | | $ | (14,261 | ) | | $ | (0.09 | ) |
| | | | | | | | | | | | | |
|
| | | | | | | | | | | | | | | |
| | Year Ended June 29, 2013 |
| | Operating Income (Loss) | | Pre-tax Income (Loss) | | Net Income (Loss) | | Diluted EPS |
| | (Thousands, except per share data) |
| Restructuring, integration and other charges | $ | (149,501 | ) | | $ | (149,501 | ) | | $ | (116,382 | ) | | $ | (0.83 | ) |
| Gain on bargain purchase and other | — |
| | 31,011 |
| | 30,974 |
| | 0.22 |
|
| Net tax benefit | — |
| | — |
| | 50,376 |
| | 0.36 |
|
| Total | $ | (149,501 | ) | | $ | (118,490 | ) | | $ | (35,032 | ) | | $ | (0.25 | ) |
|
| | | | | | | | | | | | | | | |
| | Year Ended June 30, 2012 |
| | Operating Income (Loss) | | Pre-tax Income (Loss) | | Net Income (Loss) | | Diluted EPS |
| | (Thousands, except per share data) |
| Restructuring, integration and other charges | $ | (73,585 | ) | | $ | (73,585 | ) | | $ | (52,963 | ) | | $ | (0.35 | ) |
| Gain on bargain purchase and other | — |
| | 2,918 |
| | 3,463 |
| | 0.02 |
|
| Net tax benefit | — |
| | — |
| | 8,616 |
| | 0.06 |
|
| Total | $ | (73,585 | ) | | $ | (70,667 | ) | | $ | (40,884 | ) | | $ | (0.27 | ) |
|
| | | | | | | | | | | | | | | |
| | Year Ended July 2, 2011 |
| | Operating Income (Loss) | | Pre-tax Income (Loss) | | Net Income (Loss) | | Diluted EPS |
| | (Thousands, except per share data) |
| Restructuring, integration and other charges | $ | (77,176 | ) | | $ | (77,176 | ) | | $ | (56,169 | ) | | $ | (0.36 | ) |
| Gain on sale of assets | — |
| | 22,715 |
| | 25,720 |
| | 0.17 |
|
Release of tax valuation allowance, net of tax reserves adjustments | — |
| | — |
| | 32,901 |
| | 0.21 |
|
| Total | $ | (77,176 | ) | | $ | (54,461 | ) | | $ | 2,452 |
| | $ | 0.02 |
|
Liquidity and Capital Resources
Cash Flows
Cash Flows from Operating Activities
The Company generated $696.2 million of cash from operating activities in fiscal 2013 as compared with $528.7 million in fiscal 2012. These results are comprised of: (i) cash flow generated from net income excluding non-cash and other reconciling items, which includes the add-back to net income of depreciation and amortization, deferred income taxes, stock-based compensation and other non-cash items (primarily the provision for doubtful accounts and periodic pension costs) and (ii) cash flow used for working capital, excluding cash and cash equivalents. Cash generated by working capital changes was $47.5 million during fiscal 2013, resulting from a decrease in inventory of $225.7 million, partially offset by a decrease in accounts payable and accrued expenses and other of $78.8 million and $5.2 million, respectively, and an increase in accounts receivable of $94.2 million. Net days outstanding, in particular, receivable days, has not changed significantly as there has not been any significant change in terms provided to customers nor are customers changing their payment patterns.
During fiscal 2012, the Company generated $528.7 million of cash from operating activities as compared with $278.1 million in fiscal 2011. Cash generated by working capital in fiscal 2012 resulted from a decrease in accounts receivable and inventory of $72.3 million and $133.2 million, respectively, offset by a decrease in accounts payable of $319.1 million and in accrued expenses and other of $136.9 million. Cash used for working capital during fiscal 2011 consisted of growth in accounts receivable and inventory of $421.5 million and $321.9 million, respectively, partially offset by an increase in accounts payable of $165.2 million.
Cash Flows from Financing Activities
During fiscal 2013, the Company repaid $490.9 million under the accounts receivable securitization program and its revolving credit facility, a portion of which was funded by the issuance of $350 million of 4.875% Notes due December 1, 2022. In addition, during fiscal 2013, the Company used $207.2 million of cash to repurchase common stock under the $750.0 million share repurchase program authorized by the Board of Directors in August 2012 (see Item 5. Market for Registrants' Common Equity, Related Stockholder Matters and Issuer Purchases of Equity Securities in this Form 10-K).
During fiscal 2012, the Company received proceeds of $595.8 million, primarily from borrowings under the accounts receivable securitization program and bank credit facilities. In addition, during fiscal 2012, the Company used $318.3 million of cash to repurchase common stock under the Company's share repurchase program.
During fiscal 2011, the Company received proceeds of $160.0 million from borrowings under the accounts receivable securitization program and repaid $109.6 million for the 3.75% Notes acquired in the Bell acquisition which were tendered during fiscal 2011. The Company also received proceeds of $8.9 million, net of repayments, related to its revolving credit facility and other debt.
Other financing activities, net, during fiscal 2013, 2012 and 2011 were primarily a result of cash received for the exercise of stock options and the associated excess tax benefit.
Cash Flows from Investing Activities
During fiscal 2013, the Company used $262.3 million of cash for acquisitions, net of cash acquired, and $97.4 million for capital expenditures primarily related to system development costs and computer hardware and software purchases. Also during fiscal 2013, the Company received $3.6 million, net of cash divested, for an earn-out payment associated with a divestiture completed in a prior year and a small divestiture in TS Asia.
During fiscal 2012, the Company used $313.2 million of cash for acquisitions, net of cash acquired, and $128.7 million for capital expenditures primarily related to system development costs and computer hardware and software purchases.
During fiscal 2011, the Company used $691.0 million of cash for acquisitions, net of cash acquired, and $148.7 million for capital expenditures primarily related to system development costs and computer hardware and software expenditures. Also during fiscal 2011, the Company received $19.1 million of proceeds associated with a divestiture and $10.6 million of proceeds from the sale of fixed assets.
Capital Structure
The Company uses a variety of financing arrangements, both short-term and long-term, to fund its operations in addition to funds generated from cash flow from operations. The Company also uses diversified sources of funding so that it does not become overly dependent on one source and to achieve lower cost of funding through these different alternatives. These financing arrangements include public bonds, short-term and long-term bank loans and an accounts receivable securitization program. For a detailed description of the Company’s external financing arrangements outstanding at June 29, 2013, refer to Note 7 to the consolidated financial statements appearing in Item 15 of this Report.
The following table summarizes the Company’s capital structure as of the end of fiscal 2013 with a comparison with the end of fiscal 2012:
|
| | | | | | | | | | | |
| | June 29,
2013 | | % of Total Capitalization | | June 30,
2012 | | % of Total Capitalization |
| | (Dollars in thousands) |
| Short-term debt | $ | 838,190 |
| | 13.2% | | $ | 872,404 |
| | 14.4% |
| Long-term debt | 1,206,993 |
| | 19.1 | | 1,271,985 |
| | 21.0 |
| Total debt | 2,045,183 |
| | 32.3 | | 2,144,389 |
| | 35.4 |
| Shareholders’ equity | 4,289,125 |
| | 67.7 | | 3,905,732 |
| | 64.6 |
| Total capitalization | $ | 6,334,308 |
| | 100.0 | | $ | 6,050,121 |
| | 100.0 |
Financing Transactions
The Company has a five-year $1.0 billion senior unsecured revolving credit facility (the "2012 Credit Facility") with a syndicate of banks, which expires in November 2016. In connection with the 2012 Credit Facility, the Company terminated its existing unsecured $500.0 million credit facility (the "2008 Credit Facility"), which was to expire in September 2012. Under the 2012 Credit Facility, the Company may elect from various interest rate options, currencies and maturities. As of the end of fiscal 2013, there were $6.7 million in borrowings outstanding under the 2012 Credit Facility included in “long-term debt” in the consolidated financial statements. In addition, there were $2.3 million in letters of credit issued under the 2012 Credit Facility, which represents a utilization of the 2012 Credit Facility capacity but is not recorded in the consolidated balance sheet as the letters of credit are not debt. As of June 30, 2012, there were $110.1 million in borrowings outstanding included in “long-term debt” in the consolidated financial statements and $17.2 million in letters of credit issued.
In August 2012, the Company amended its accounts receivable securitization program (the "Securitization Program" or “Program”) with a group of financial institutions to allow the Company to sell, on a revolving basis, an undivided interest of up to $800.0 million ($750.0 million prior to the amendment) in eligible receivables while retaining a subordinated interest in a portion
of the receivables. The Program does not qualify for sale treatment and, as a result, any borrowings under the Program are recorded as debt on the consolidated balance sheet. The Program contains certain covenants, all of which the Company was in compliance with as of June 29, 2013. The Program has a one-year term that expires at the end of August 2013, which is expected to be renewed for another year on comparable terms. There were $360.0 million in borrowings outstanding under the Program at June 29, 2013 and $670.0 million outstanding at June 30, 2012.
Notes outstanding at June 29, 2013 consisted of:
$300.0 million of 5.875% Notes due March 15, 2014 (reflected as short-term debt)
$250.0 million of 6.00% Notes due September 1, 2015
$300.0 million of 6.625% Notes due September 15, 2016
$300.0 million of 5.875% Notes due June 15, 2020
$350.0 million of 4.875% Notes due December 1, 2022
In addition to its primary financing arrangements, the Company has $180.3 million of debt outstanding with foreign financial institutions and several small lines of credit in various locations to fund the short-term working capital, foreign exchange, overdraft and letter of credit needs of its wholly owned subsidiaries in EMEA, Asia and Canada. Avnet generally guarantees its subsidiaries' obligations under these facilities.
Covenants and Conditions
The Securitization Program requires the Company to maintain certain minimum interest coverage and leverage ratios in order to continue utilizing the Program. The Program also contains certain covenants relating to the quality of the receivables sold. If these conditions are not met, the Company may not be able to borrow any additional funds and the financial institutions may consider this an amortization event, as defined in the agreement, which would permit the financial institutions to liquidate the accounts receivables sold to cover any outstanding borrowings. Circumstances that could affect the Company’s ability to meet the required covenants and conditions of the Program include the Company’s ongoing profitability and various other economic, market and industry factors. Management does not believe that the covenants under the Program limit the Company’s ability to pursue its intended business strategy or its future financing needs. The Company was in compliance with all covenants of the Program as of June 29, 2013.
The 2012 Credit Facility contains certain covenants with various limitations on debt incurrence, dividends, investments and capital expenditures and also includes financial covenants requiring the Company to maintain minimum interest coverage and leverage ratios. Management does not believe that the covenants in the 2012 Credit Facility limit the Company’s ability to pursue its intended business strategy or its future financing needs. The Company was in compliance with all covenants of the Credit Facility as of June 29, 2013.
See Liquidity below for further discussion of the Company’s availability under these various facilities.
Liquidity
As of June 29, 2013, the Company had total borrowing capacity of $1.80 billion under the 2012 Credit Facility and the Program. There were $6.7 million in borrowings outstanding and $2.3 million in letters of credit issued under the 2012 Credit Facility and $360.0 million outstanding under the Securitization Program resulting in $1.4 billion of net availability at the end of fiscal 2013. During fiscal 2013, the Company had an average daily balance outstanding under the 2012 Credit Facility of approximately $5.0 million and $570.0 million under the Securitization Program. During fiscal 2012, the Company had an average daily balance outstanding under the 2012 Credit Facility of approximately $115.0 million and $620.0 million under the Securitization Program.
The Company had cash and cash equivalents of $1.01 billion as of June 29, 2013, of which $918.4 million was held outside the U.S. As of June 30, 2012, the Company had cash and cash equivalents of $1.01 billion, of which $874.0 million was held outside of the U.S. Liquidity is subject to many factors, such as normal business operations as well as general economic, financial, competitive, legislative, and regulatory factors that are beyond the Company’s control. Cash balances generated and held in foreign locations are used for ongoing working capital, capital expenditures and to support acquisitions. These balances are currently expected to be permanently reinvested outside the U.S. If these funds were needed in the U.S., the Company would incur significant income taxes to repatriate cash held in foreign locations to the extent they are in excess of outstanding intercompany loans due to Avnet, Inc. from the foreign subsidiaries. In addition, local government regulations may restrict the Company’s ability to move
funds among various locations under certain circumstances. Management does not believe such restrictions would limit the Company’s ability to pursue its intended business strategy.
During fiscal 2013, the Company utilized $262.3 million of cash, net of cash acquired, for acquisitions. The Company expects to continue to make strategic investments through acquisition activity to the extent the investments strengthen Avnet’s competitive position and meet management’s return on capital thresholds.
In addition to continuing to make investments in acquisitions, the Company may repurchase up to an aggregate of $750.0 million of the Company’s common stock through a share repurchase program approved by the Board of Directors (as amended in August 2012). The Company plans to repurchase stock from time to time at the discretion of management, subject to strategic considerations, market conditions and other factors. The Company may terminate or limit the stock repurchase program at any time without prior notice. The timing and actual number of shares purchased will depend on a variety of factors such as price, corporate and regulatory requirements, and prevailing market conditions. Since the beginning of the repurchase program through the end of fiscal 2013, the Company repurchased 17.9 million shares at an average market price of $29.38 per share for total cost of $525.5 million. Shares repurchased were retired.
During periods of weakening demand in the electronic component and enterprise computer solutions industry, the Company typically generates cash from operating activities. Conversely, the Company is more likely to use operating cash flows for working capital requirements during periods of higher growth. During fiscal 2013, the Company generated $696.2 million in cash from operations as revenue declined 1.0% over the prior year. Management believes that Avnet’s borrowing capacity, its current cash availability and the Company’s expected ability to generate operating cash flows are sufficient to meet its projected financing needs.
The following table highlights the Company’s liquidity and related ratios for the past two fiscal years:
COMPARATIVE ANALYSIS — LIQUIDITY
|
| | | | | | | | | | |
| | Years Ended |
| | June 29,
2013 | | June 30,
2012 | | Percentage Change |
| | (Dollars in millions) |
| Current Assets | $ | 8,356.9 |
| | $ | 8,254.4 |
| | 1.2 | % |
| Quick Assets | 5,878.3 |
| | 5,614.2 |
| | 4.7 |
|
| Current Liabilities | 4,821.4 |
| | 4,798.7 |
| | 0.5 |
|
Working Capital(1) | 3,535.4 |
| | 3,455.7 |
| | 2.3 |
|
| Total Debt | 2,045.2 |
| | 2,144.4 |
| | (4.6 | ) |
| Total Capital (total debt plus total shareholders’ equity) | 6,334.3 |
| | 6,050.1 |
| | 4.7 |
|
| Quick Ratio | 1.2:1 |
| | 1.2:1 |
| | |
| Working Capital Ratio | 1.7:1 |
| | 1.7:1 |
| | |
| Debt to Total Capital | 32.3 | % | | 35.4 | % | | |
______________________
| | |
*(1) | | EPS does not foot due to rounding.This calculation of working capital is defined as current assets less current liabilities. |
| | | | | | | | | | | | | | | | | |
| | | Year Ended June 27, 2009 | |
| | | Operating | | | Pre-tax | | | Net | | | | |
| | | Income (Loss) | | | Income (Loss) | | | Income (Loss) | | | EPS | |
| | | (Thousands, except per share data) | |
| Impairment charges | | $ | (1,411,127 | ) | | $ | (1,411,127 | ) | | $ | (1,376,983 | ) | | $ | (9.13 | ) |
| Restructuring, integration and other charges | | | (99,342 | ) | | | (99,342 | ) | | | (65,310 | ) | | | (0.43 | ) |
| Retrospective application of accounting standard | | | 291 | | | | (11,894 | ) | | | (7,250 | ) | | | (0.05 | ) |
| Gain on sale of assets | | | — | | | | 14,318 | | | | 8,727 | | | | 0.06 | |
| Net reduction in tax reserves | | | — | | | | — | | | | 21,672 | | | | 0.14 | |
| | | | | | | | | | | | | |
| Total | | $ | (1,510,178 | ) | | $ | (1,508,045 | ) | | $ | (1,419,144 | ) | | $ | (9.41 | ) |
| | | | | | | | | | | | | |
Long-Term Contractual Obligations
The Company has the following contractual obligations outstanding as of June 29, 2013 (in millions):
|
| | | | | | | | | | | | | | | | | | | |
| | Total | | Due in Less Than 1 Year | | Due in 1-3 Years | | Due in 4-5 Years | | Due After 5 Years |
Long-term debt, including amounts due within one year(1) | $ | 2,047.8 |
| | $ | 838.2 |
| | $ | 258.8 |
| | $ | 300.4 |
| | $ | 650.4 |
|
Interest expense on long-term notes(2) | $ | 378.5 |
| | $ | 84.0 |
| | $ | 127.3 |
| | $ | 73.5 |
| | $ | 93.7 |
|
| Operating leases | $ | 272.2 |
| | $ | 86.1 |
| | $ | 100.1 |
| | $ | 47.6 |
| | $ | 38.4 |
|
______________________
| |
| (1) | Excludes discount on long-term notes. |
| |
| (2) | Represents interest expense due on long-term notes with fixed interest rates and variable debt assuming the same interest rate as at June 29, 2013. |
At June 29, 2013, the Company had a liability for income tax contingencies of $123.9 million, which is not included in the above table. Cash payments associated with the settlement of these liabilities that are expected to be paid within the next 12 months is $16.3 million. The Company does not currently have any material commitments for capital expenditures.
Critical Accounting Policies
The Company’s consolidated financial statements have been prepared in accordance with U.S. GAAP. The preparation of these consolidated financial statements requires the Company to make estimates and assumptions that affect the reported amounts of assets, liabilities, revenues and expenses during the reporting period. These estimates and assumptions are based upon the Company’s continuous evaluation of historical results and anticipated future events. Actual results may differ from these estimates under different assumptions or conditions.
The Securities and Exchange Commission defines critical accounting policies as those that are, in management’s view, most important to the portrayal of the Company’s financial condition and results of operations and that require significant judgments and estimates. Management believes the Company’s most critical accounting policies relate to:
26
Valuation of Receivables
The Company maintains an allowance for doubtful accounts for estimated losses resulting from customer defaults. Bad debt reserves are recorded based upon historic default averages as well as the Company’s regular assessment of the financial condition of its customers. Therefore, if collection experience or the financial condition of specific customers were to deteriorate,change, management would evaluate whether additional allowances and corresponding charges to the consolidated statement of operationsadjustments are required.
Valuation of Inventories
Inventories are recorded at the lower of cost (first in — first out) or estimated market value. The Company’s inventories include high-technology components, embedded systems and computing technologies sold into rapidly changing, cyclical and competitive markets wherein such inventories may be subject to early technological obsolescence.
The Company regularly evaluates inventories for excess, obsolescence or other factors that may render inventories less marketable. Write-downs are recorded so that inventories reflect the approximate net realizable value and take into account the Company’s contractual provisions with its suppliers, which may provide certain protections to the Company for product obsolescence and price erosion in the form of rights of return and price protection. Because of the large number of transactions and the complexity of managing the process around price protections and stock rotations, estimates are made regarding adjustments to the carrying amount of inventories. Additionally, assumptions about future demand, market conditions and decisions to discontinue certain product lines can impact the decision to write downwrite-down inventories. If assumptions about future demand change or actual market conditions are less favorable than those projected by management, management would evaluate whether additional write-downs of inventories are required. In any case, actual values could be different from those currently estimated.
Accounting for Income Taxes
Management
Management's judgment is required in determining the provision for income taxes, deferred tax assets and liabilities and the valuation allowance recorded against net deferred tax assets. The carrying value of the Company’sCompany's net operating loss carry-forwards is dependent upon its ability to generate sufficient future taxable income in certain tax jurisdictions. In addition, the Company
considers historic levels of income, expectations and risk associated with estimates of future taxable income and ongoing prudent and feasible tax planning strategies in assessing a tax valuation allowance. Should the Company determine that it is not able to realize all or part of its deferred tax assets in the future, an additional valuation allowance may be recorded against the deferred tax assets with a corresponding charge to income in the period such determination is made. Similarly, should the Company determine that it is able to realize all or part of its deferred tax assets that have been reserved for, the Company may release a valuation allowance with a corresponding benefit to income in the period such determination is made.
The Company establishes reserves for potentially unfavorable outcomes of positions taken on certain tax matters. These reserves are based on management’smanagement's assessment of whether a tax benefit is more likely than not to be sustained upon examination by tax authorities. There may be differences between the anticipated and actual outcomes of these matters that may result in reversals of reserves or additional tax liabilities in excess of the reserved amounts. To the extent such adjustments are warranted, the Company’sCompany's effective tax rate may potentially fluctuate as a result. In accordance with the Company's accounting policy, accrued interest and penalties, if any, related to unrecognized tax benefits are recorded as a component of income tax expense.
In determining the Company’sCompany's effective tax rate, management considers current tax regulations in the numerous jurisdictions in which it operates, and requires management’sexercises judgment for interpretation and application. Changes to such tax regulations or disagreements with the Company’sCompany's interpretation or application by tax authorities in any of the Company’sCompany's major jurisdictions may have a significant impact on the Company’sCompany's provision for income taxes.
Restructuring, Integration and Impairment Charges
The Company has been subject to the financial impact of integrating acquired businesses and charges related to business reorganizations. In connection with such events, management is required to make estimates about the financial impact of such matters that are inherently uncertain. Accrued liabilities and reserves are established to cover the cost of severance, facility consolidation and closure, lease termination fees, inventory adjustments based upon acquisition-related termination of supplier agreements and/or the re-evaluation of the acquired working capital assets (inventory and accounts receivable), and write-down of other acquired assets including goodwill. Actual amounts incurred could be different from those estimated.
27
Additionally, in assessing the Company’s goodwill for impairment, the Company is required to make significant assumptions about the future cash flows and overall performance of its reporting units. The Company is also required to make judgments regarding the evaluation of changes in events or circumstances that would more likely than not reduce the fair value of any of its reporting units below its carrying value, the results of which would determine whether an interim impairment test must be performed. Should these assumptions or judgments change in the future based upon market conditions or should the structure of the Company’s reporting units change based upon changes in business strategy, the Company may be required to perform an interim impairment test which may result in a goodwill impairment charge.
During fiscal 20112013, 2012 and 2010,2011, the Company performed its annual goodwill impairment test and determined there was no goodwill impairment andin any of its reporting units. The Company does not believe there are nowere any reporting units with material goodwill that arewere at risk of failing “step 1”"step 1" of the goodwill impairment test. DuringHowever, in fiscal 2009,2013 there was one reporting unit for which the estimated fair value was not substantially in excess of the carrying value of the reporting unit. The percentage by which the estimated fair value exceeded carrying value was approximately 23% for TS Asia. As of June 29, 2013, TS Asia had approximately $54 million of allocated goodwill.
In order to estimate the fair value of its reporting units, the Company performeduses a combination of an interimincome approach, specifically a discounted cash flow methodology, and a market approach. The discounted cash flow methodology includes assumptions for, among others, forecasted revenues, gross profit margins, operating profit margins, working capital cash flow, perpetual growth rates and long-term discount rates, all of which require significant judgments and estimates by management which are inherently uncertain. These assumptions, judgments and estimates may change in the future based upon market conditions or other events and could result in a goodwill impairment test and recognized goodwill and intangible asset impairments. SeeImpairment Chargesin this MD&A for further discussion of the Company’s evaluation of goodwill impairment in fiscal 2009.charge.
Contingencies and Litigation
From time to time, the Company may become a party to, or otherwise involved in, pending and threatened litigation, tax, environmentalvarious lawsuits, claims, investigations and other matterslegal proceedings in the ordinary course of conducting its business. ManagementWhile litigation is subject to inherent uncertainties, management does not anticipate that any contingentcurrent matters will have a material adverse impact on the Company’s financial condition, liquidity or results of operations.
Revenue Recognition
The Company does not consider revenue recognition to be a critical accounting policy due to the nature of its business because revenues are generally recognized when persuasive evidence of an arrangement exists, delivery has occurred or services have been rendered, the sales price is fixed or determinable and collectability is reasonably assured. Generally, these criteria are met upon the actual shipment of product to the customer. Accordingly, other than for estimates related to possible returns of products from customers, discounts or rebates, the recording of revenue does not require significant judgments or estimates.
Provisions for returns are estimated based on historical sales returns, credit memo analysis and other known factors. Provisions are made for discounts and rebates, which are primarily volume-based, and are generally based on historical trends and anticipated customer buying patterns. Finally, revenues from maintenance contracts, which are deferred and recognized in income over the life of the agreement, are not material to the consolidated results of operations of the Company.
The Company evaluates the criteria outlined in ASC Topic 605-45, Principal Agent Considerations, in determining whether it is appropriate to record the gross amount of revenue and related costs or the net amount (gross fees less related cost of sales or services) earned when acting as an agent for certain customers and suppliers. Generally, transactions that qualify for net accounting treatment consist of the sale of supplier service contracts for which the Company has no continuing involvement or the performance of logistics services to deliver product for which the Company is not the primary obligor.
Recently Issued Accounting Pronouncements
See Note 1 in theNotes to Consolidated Financial Statementscontained in Item 15 of this Report for the discussion of recently issued accounting pronouncements.
Liquidity and Capital Resources
Cash Flows
Cash Flows from Operating Activities
The Company generated $278.1 million of cash from operating activities in fiscal 2011 as compared with cash usage of $30.4 million in fiscal 2010. These results are comprised of: (1) cash flow generated from net income excluding non-cash and other reconciling items, which includes the add-back of depreciation and amortization, deferred income taxes, stock-based compensation and other non-cash items (primarily the provision for doubtful accounts and periodic pension costs) and (2) cash flow used for working capital, excluding cash and cash equivalents. Cash used for working capital in fiscal 2011 consisted of growth in accounts receivable and inventory of $421.5 million and $321.9 million, respectively, partially offset by an increase in payables of $165.2 million. For EM, inventory and receivables grew year over year due to the strong growth in sales. For TS, growth in receivables was partially offset by an increase in accounts payables. Net days outstanding, in particular, receivable days, are above pre-recession levels as there has not been any significant change in terms provided to customers.
During fiscal 2010, the Company used $30.4 million of cash from operating activities as compared with cash generated in fiscal 2009 of $1.1 billion. Cash used for working capital during fiscal 2010 consisted of growth in accounts receivable and inventory of $1.07 billion and $459.9 million, respectively, partially offset by an increase in accounts payable of $963.3 million. For fiscal 2010, sales increased 18.1%; however, the Company used only $30.4 million of cash from operating activities to fund that growth as a result of the significant improvement in working capital velocity which increased to a record 7.8 times. Cash generated from working capital during fiscal 2009 was the result of a $709.9 million reduction in receivables, a $483.5 million reduction in inventory; both of which were partially offset by a $375.5 million reduction in accounts payable.
28
Cash Flows from Financing Activities
During fiscal 2011, the Company received proceeds of $160.0 million from borrowings under the accounts receivable securitization program and repaid $109.6 million for the 3.75% Notes acquired in the Bell acquisition which were tendered during fiscal 2011. The Company also received proceeds of $8.9 million, net of repayments, related to bank credit facilities and other debt.
During fiscal 2010, the Company received proceeds of $291.9 million from the issuance of notes, net of repayments for bank and other debt. In June 2010, the Company issued $300.0 million 5.875% Notes due June 2020 and received proceeds of $296.5 million, net of discount and underwriting fees.
During fiscal 2009, the Company utilized cash of $406.8 million related to net repayments of notes and bank credit facilities, $300 million of which related to the extinguishment of the 2% Convertible Senior Debentures due March 15, 2034 (the “Debentures”). In March 2009, $298.1 million of the Debentures were put back to the Company and the remaining $1.9 million was repaid in April 2009. As a result of the substantial cash generation from operating activities during fiscal 2009, the Company was able to use cash on hand to settle the $300 million of Debentures’ principal plus accrued interest.
Other financing activities, net, in fiscal 2011, 2010 and 2009 were primarily a result of cash received for the exercise of stock options and the associated excess tax benefit.
Cash Flows from Investing Activities
During fiscal 2011, the Company used $691.0 million of cash for acquisitions, net of cash acquired, and $148.7 million for capital expenditures primarily related to system development costs and computer hardware and software expenditures. Also during fiscal 2011, the Company received $19.1 million of proceeds associated with a divestiture and $10.6 million of proceeds from the sale of fixed assets.
During fiscal 2010, the Company used $112.4 million of cash for investing activities, of which $69.3 million related to acquisitions and investments. The Company also received proceeds of $11.8 million related to earn-out provisions from the prior sale of an equity method investment as well as the sale of a small cost method investment. The Company used $66.9 million for capital expenditures related to building and leasehold improvements, system development costs, computer hardware and software and received $12.0 million in proceeds primarily related to the sale of properties.
The Company used $314.9 million of cash related to acquisitions during fiscal 2009. The Company also received $14.3 million in proceeds related to earn-out provisions associated with the prior sale of the Company’s equity investment (seeResults of Operations — Gain on Sale of Assets).In addition, the Company utilized $110.2 million of cash for capital expenditures related to system development costs, computer hardware and software as well as expenditures related to warehouse construction costs.
Capital Structure
The Company uses a variety of financing arrangements, both short-term and long-term, to fund its operations in addition to funds generated from cash flow from operations. The Company also uses diversified sources of funding so that it does not become overly dependent on one source and to achieve lower cost of funding through these different alternatives. These financing arrangements include public bonds, short-term and long-term bank loans and an accounts receivable securitization program. For a detailed description of the Company’s external financing arrangements outstanding at July 2, 2011, refer to Note 7 to the consolidated financial statements appearing in Item 15 of this Report.
29
The following table summarizes the Company’s capital structure as of the end of fiscal 2011 with a comparison with the end of fiscal 2010:
| | | | | | | | | | | | | | | | | |
| | | July 2, | | | % of Total | | | July 3, | | | % of Total | |
| | | 2011 | | | Capitalization | | | 2010 | | | Capitalization | |
| | | (Dollars in thousands) | |
| Short-term debt | | $ | 243,079 | | | | 4.4% | | | $ | 36,549 | | | | 0.8% | |
| Long-term debt | | | 1,273,509 | | | | 22.8 | | | | 1,243,681 | | | | 29.0 | |
| | | | | | | | | | | | | | | |
| Total debt | | | 1,516,588 | | | | 27.2 | | | | 1,280,230 | | | | 29.8 | |
| Shareholders’ equity | | | 4,056,070 | | | | 72.8 | | | | 3,009,117 | | | | 70.2 | |
| | | | | | | | | | | | | | | |
| Total capitalization | | $ | 5,572,658 | | | | 100.0 | | | $ | 4,289,347 | | | | 100.0 | |
| | | | | | | | | | | | | | | |
Financing Transactions
The Company has a five-year $500.0 million unsecured revolving credit facility (the “Credit Agreement”) with a syndicate of banks that expires in September 2012. Under the Credit Agreement, the Company may elect from various interest rate options, currencies and maturities. As of the end of fiscal 2011, there were $122.1 million in borrowings outstanding under the Credit Agreement included in “other long-term debt” in the consolidated financial statements. In addition, there were $16.6 million in letters of credit issued under the Credit Agreement which represent a utilization of the Credit Agreement capacity but are not recorded in the consolidated balance sheet as the letters of credit are not debt. As of the end of fiscal 2010, there were $93.7 million in borrowings outstanding and $8.6 million in letters of credit issued under the Credit Agreement.
The Company has an accounts receivable securitization program (the “Securitization Program”) with a group of financial institutions that allows the Company to sell, on a revolving basis, an undivided interest of up to $600.0 million ($450.0 million prior to the amendment in August 2010) in eligible receivables while retaining a subordinated interest in a portion of the receivables. The Securitization Program does not qualify for sale accounting and has a one year term that expires at the end of August 2011 which is expected to be renewed for another year on comparable terms. There were $160.0 million in borrowings outstanding under the Securitization Program at July 2, 2011 and no borrowings outstanding at July 3, 2010. Interest on borrowings is calculated using a base rate or a commercial paper rate plus a spread of 0.425%. The facility fee is 0.50%.
As a result of acquisitions during fiscal 2011, the Company acquired debt of $420.3 million, of which $211.9 million was repaid (including associated fees) at the acquisition dates. As of July 2, 2011, the outstanding balances associated with the acquired debt and credit facilities consisted of $16.6 million in bank credit facilities and other debt primarily used to support the acquired foreign operations.
Notes outstanding as of the end of fiscal 2011 consisted of:
$300.0 million of 5.875% Notes due March 15, 2014
$250.0 million of 6.00% Notes due September 1, 2015
$300.0 million of 6.625% Notes due September 15, 2016
$300.0 million of 5.875% Notes due June 15, 2020
The Company assumed 3.75% Notes due March 5, 2024 in the Bell acquisition which had a fair value of $110.0 million. Prior to the Bell acquisition, the 3.75% Notes were convertible into Bell common stock; however, as a result of the acquisition, the debt was no longer convertible into shares. Under the terms of the 3.75% Notes, the Company could have redeemed some or all of the 3.75% Notes for cash anytime on or after March 5, 2011 and the note holders could have required the Company to purchase for cash some or all of the 3.75% Notes on March 5, 2011 March 5, 2014 or March 5, 2019 at a redemption price equal to 100% of the principal amount plus interest. During the first quarter of fiscal 2011, the Company issued a tender offer for the 3.75% Notes for which approximately $5.2 million was tendered and paid in September 2010. During the third quarter of fiscal 2011, the note holders tendered substantially all of the remaining notes for which $104.4 million was paid in March 2011.
In addition to its primary financing arrangements, the Company has several small lines of credit in various locations to fund the short-term working capital, foreign exchange, overdraft and letter of credit needs of its wholly-owned subsidiaries in Europe, Asia and Canada. Avnet generally guarantees its subsidiaries’ debt under these facilities.
30
Covenants and Conditions
The Securitization Program discussed previously requires the Company to maintain certain minimum interest coverage and leverage ratios as defined in the securitization agreement in order to continue utilizing the Securitization Program. The Securitization Program also contains certain covenants relating to the quality of the receivables sold. If these conditions are not met, the Company may not be able to borrow any additional funds and the financial institutions may consider this an amortization event, as defined in the agreement, which would permit the financial institutions to liquidate the accounts receivables sold to cover any outstanding borrowings. Circumstances that could affect the Company’s ability to meet the required covenants and conditions of the Securitization Program include the Company’s ongoing profitability and various other economic, market and industry factors. Management does not believe that the covenants under the Securitization Program limit the Company’s ability to pursue its intended business strategy or its future financing needs. The Company was in compliance with all covenants of the Securitization Program at July 2, 2011.
The Credit Agreement discussed inFinancing Transactionscontains certain covenants with various limitations on debt incurrence, dividends, investments and capital expenditures and also includes financial covenants requiring the Company to maintain minimum interest coverage and leverage ratios, as defined in the Credit Agreement. Management does not believe that the covenants in the Credit Agreement limit the Company’s ability to pursue its intended business strategy or its future financing needs. The Company was in compliance with all covenants of the Credit Agreement as of July 2, 2011.
SeeLiquiditybelow for further discussion of the Company’s availability under these various facilities.
Liquidity
The Company had total borrowing capacity of $1.1 billion at July 2, 2011 under the Credit Agreement and the Securitization Program. There were $122.1 million in borrowings outstanding and $16.6 million in letters of credit issued under the Credit Agreement and $160.0 million outstanding under the Securitization Program resulting in $801.3 million of net availability at the end of fiscal 2011. During fiscal 2011, the Company had an average daily balance outstanding under the Credit Agreement of $142.4 million and $405.4 million under the Securitization Program. During fiscal 2010, the Company had an average daily balance outstanding under the Credit Agreement of $92.7 million. The Company had no borrowings outstanding under the Securitization Program during fiscal 2010.
The Company had cash and cash equivalents of $675.3 million as of July 2, 2011, of which $613.2 million was held outside the U.S. As of July 3, 2010, the Company had cash and cash equivalents of $1.09 billion, of which $507.9 million was held outside of the U.S. Liquidity is subject to many factors, such as normal business operations as well as general economic, financial, competitive, legislative, and regulatory factors that are beyond the Company’s control. Cash balances generated and held in foreign locations are used for on-going working capital, capital expenditure needs and to support acquisitions. These balances are currently expected to be permanently reinvested outside the U.S. If these funds were needed for general corporate use in the U.S., the Company would incur significant income taxes to repatriate cash held in foreign locations to the extent they are in excess of outstanding intercompany loans due to Avnet, Inc. from the foreign subsidiaries. In addition, local government regulations may restrict the Company’s ability to move funds among various locations under certain circumstances. Management does not believe such restrictions would limit the Company’s ability to pursue its intended business strategy.
During fiscal 2011, the Company utilized $691.0 million of cash, net of cash acquired, for acquisitions, which included repayments of certain debt assumed in the acquisitions. The Company assumed a total of $420.3 million of debt as a result of the acquisitions and repaid $211.9 million of assumed debt (including associated fees) at the acquisition dates. The Company has been making and expects to continue to make strategic investments through acquisition activity to the extent the investments strengthen Avnet’s competitive position and meet management’s return on capital thresholds.
In addition to continuing to make investments in acquisitions, the Company may repurchase up to an aggregate of $500 million of shares of the Company’s common stock through a share repurchase program approved by the Board of Directors in August 2011. The Company plans to repurchase stock from time to time at the discretion of management, subject to strategic considerations, market conditions and other factors. The Company may terminate or limit the stock repurchase program at any time without prior notice.
During periods of weakening demand in the electronic component and enterprise computer solutions industry, the Company typically generates cash from operating activities. Conversely, the Company is more likely to use operating cash flows for working capital requirements during periods of higher growth. However, during fiscal 2011, revenue was up 38.5% year over year, yet the Company generated $278.1 million in cash from operations as a result of significant growth in operating income which was in excess of cash required for working capital purposes. Management believes that Avnet’s borrowing capacity, its current cash availability and the Company’s expected ability to generate operating cash flows are sufficient to meet its projected financing needs.
31
The following table highlights the Company’s liquidity and related ratios for the past two fiscal years:
COMPARATIVE ANALYSIS — LIQUIDITY
| | | | | | | | | | | | | |
| | | Years Ended |
| | | July 2, | | | July 3, | | | Percentage |
| | | 2011 | | | 2010 | | | Change |
| | | (Dollars in millions) |
| Current Assets | | $ | 8,227.2 | | | $ | 6,630.2 | | | | 24.1 | % |
| Quick Assets | | | 5,439.6 | | | | 4,666.6 | | | | 16.6 | |
| Current Liabilities | | | 4,477.7 | | | | 3,439.6 | | | | 30.2 | |
Working Capital(1) | | | 3,749.5 | | | | 3,190.6 | | | | 17.5 | |
| Total Debt | | | 1,516.6 | | | | 1,280.2 | | | | 18.5 | |
| Total Capital (total debt plus total shareholders’ equity) | | | 5,572.7 | | | | 4,289.3 | | | | 29.9 | |
| Quick Ratio | | | 1.2:1 | | | | 1.4:1 | | | | | |
| Working Capital Ratio | | | 1.8:1 | | | | 1.9:1 | | | | | |
| Debt to Total Capital | | | 27.2 | % | | | 29.8 | % | | | | |
| | |
(1) | | This calculation of working capital is defined as current assets less current liabilities. |
The Company’s quick assets (consisting of cash and cash equivalents and receivables) increased 16.6% from July 3, 2010 to July 2, 2011 primarily due to the increase in receivables resulting from the increased volume of business associated with acquisitions since the prior fiscal year end, significant organic sales growth and the impact of the change in foreign currency exchange spot rates at July 2, 2011 as compared with July 3, 2010. Current assets increased 24.1% due to the increase in receivables and inventory, also a result of the recent acquisitions, the impact of the change in foreign currency exchange spot rates and the double-digit growth in sales. Current liabilities increased 30.2% primarily due to the increase in short-term borrowings used to support the growth in sales. In addition, current liabilities increased due to growth in accounts payable, which was impacted by acquisitions and the exchange rate changes mentioned previously. As a result of the factors noted above, total working capital increased by 17.5% during fiscal 2011. Total debt increased by 18.5%, primarily due to the increase in short-term borrowings, total capital increased 29.9% and the debt to capital ratio decreased as compared with July 3, 2010 to 27.2%.
Long-Term Contractual Obligations
The Company has the following contractual obligations outstanding as of July 2, 2011 (in millions):
| | | | | | | | | | | | | | | | | | | | | |
| | | | | | | Due in Less | | | Due in | | | Due in | | | Due After | |
| | | Total | | | Than 1 Year | | | 1-3 Years | | | 4-5 Years | | | 5 Years | |
Long-term debt, including amounts due within one year(1) | | $ | 1,519.6 | | | $ | 243.1 | | | $ | 426.2 | | | $ | 250.3 | | | $ | 600.0 | |
Interest expense on long-term notes(2) | | $ | 372.5 | | | $ | 70.3 | | | $ | 135.4 | | | $ | 92.8 | | | $ | 74.0 | |
| Operating leases | | $ | 304.6 | | | $ | 92.4 | | | $ | 120.3 | | | $ | 49.5 | | | $ | 42.4 | |
| | |
(1) | | Excludes discount on long-term notes. |
|
(2) | | Represents interest expense due on long-term notes with fixed interest rates. |
At July 2, 2011, the Company had a liability for income tax contingencies of $175.2 million, which is not included in the above table. Cash payments associated with the remaining liability cannot reasonably be estimated as it is difficult to estimate the timing and amount of tax settlements. The Company does not currently have any material commitments for capital expenditures.
32
| | |
Item 7A. | | 7A. Quantitative and Qualitative Disclosures About Market Risk |
The Company seeks to reduce earnings and cash flow volatility associated with changes in interest rates and foreign currency exchange rates by entering into financial arrangements, from time to time, which are intended to provide a hedge against all or a portion of the risks associated with such volatility. The Company continues to have exposure to such risks to the extent they are not hedged.
The following table sets forth the scheduled maturities of the Company’s debt outstanding at July 2, 2011June 29, 2013 (dollars in millions):
| | | | | | | | | | | | | | | | | | | | | | | | | | | | | |
| | | Fiscal Year | |
| | | 2012 | | | 2013 | | | 2014 | | | 2015 | | | 2016 | | | Thereafter | | | Total | |
Liabilities: | | | | | | | | | | | | | | | | | | | | | | | | | | | | |
| Fixed rate debt (1) | | $ | 1.2 | | | $ | 1.2 | | | $ | 301.6 | | | $ | 0.3 | | | $ | 250.0 | | | $ | 600.0 | | | $ | 1,154.3 | |
| Floating rate debt | | $ | 241.9 | | | $ | 123.4 | | | $ | — | | | $ | — | | | $ | — | | | $ | — | | | $ | 365.3 | |
|
| | | | | | | | | | | | | | | | | | | | | | | | | | | |
| | Fiscal Year |
| | 2014 | | 2015 | | 2016 | | 2017 | | 2018 | | Thereafter | | Total |
| Liabilities: | | | | | | | | | | | | | |
Fixed rate debt(1) | $ | 361.2 |
| | $ | 0.4 |
| | $ | 250.4 |
| | $ | 300.2 |
| | $ | — |
| | $ | 650.4 |
| | $ | 1,562.6 |
|
| Floating rate debt | $ | 477.0 |
| | $ | 0.8 |
| | $ | 7.2 |
| | $ | 0.2 |
| | $ | — |
| | $ | — |
| | $ | 485.2 |
|
______________________
| | |
| (1) | | Excludes discounts on long-term notes. |
The following table sets forth the carrying value and fair value of the Company’s debt at July 2, 2011June 29, 2013 (dollars in millions):
| | | | | | | | | | | | | | | | | |
| | | Carrying Value at | | | Fair Value at | | | Carrying Value at | | | Fair Value at | |
| | | July 2, 2011 | | | July 2, 2011 | | | July 3, 2010 | | | July 3, 2010 | |
Liabilities: | | | | | | | | | | | | | | | | |
| Fixed rate debt (1) | | $ | 1,154.3 | | | $ | 1,261.1 | | | $ | 1,154.3 | | | $ | 1,220.7 | |
| Average interest rate | | | 6.1 | % | | | | | | | 6.1 | % | | | | |
| Floating rate debt | | $ | 365.3 | | | $ | 365.3 | | | $ | 129.5 | | | $ | 129.5 | |
| Average interest rate | | | 2.2 | % | | | | | | | 1.5 | % | | | | |
|
| | | | | | | | | | | | | | | |
| | Carrying Value at June 29, 2013 | | Fair Value at June 29, 2013 | | Carrying Value at June 30, 2012 | | Fair Value at June 30, 2012 |
| Liabilities: | | | | | | | |
Fixed rate debt(1) | $ | 1,562.6 |
| | $ | 1,645.1 |
| | $ | 1,152.8 |
| | $ | 1,285.6 |
|
| Average interest rate | 5.8 | % | | | | 6.1 | % | | |
| Floating rate debt | $ | 485.2 |
| | $ | 485.2 |
| | $ | 994.1 |
| | $ | 994.1 |
|
| Average interest rate | 1.1 | % | | | | 1.5 | % | | |
______________________
| | |
| (1) | | Excludes discounts on long-term notes. Fair value was estimated primarily based upon quoted market prices for the Company's long-term notes. |
Many of the Company’s subsidiaries, on occasion, purchase and sell products in currencies other than their functional currencies. This subjects the Company to the risks associated with fluctuations in foreign currency exchange rates. The Company reduces this risk by utilizing natural hedging (offsetting receivables and payables) as well as by creating offsetting positions through the use of derivative financial instruments, primarily forward foreign exchange contracts with maturities of less than sixty days. The Company continues to have exposure to foreign currency risks to the extent they are not hedged. The Company adjusts all foreign denominated balances and any outstanding foreign exchange contracts to fair market value through the consolidated statements of operations. Therefore, the market risk related to foreign exchange contracts is offset by changes in valuation of the underlying items being hedged. The asset or liability representing the fair value of foreign exchange contracts is classified in the captions “other current assets” or “accrued expenses and other,” as applicable, in the accompanying consolidated balance sheets. A hypothetical 10% change in currency exchange rates under the contracts outstanding at July 2, 2011June 29, 2013 would result in an increase or decrease of approximately $25.7$20.6 million to the fair value of the forward foreign exchange contracts, which would generally be offset by an opposite effect on the related hedged positions.
| | |
Item 8. | | Item 8. Financial Statements and Supplementary Data |
The financial statements and supplementary data are listed under Item 15 of this Report.
| | |
Item 9. | | Item 9. Changes in and Disagreements with Accountants on Accounting and Financial Disclosure |
None.
33
Item 9A. Controls and Procedures
| | |
Item 9A. | | Controls and Procedures
|
Disclosure Controls and Procedures
The Company’s management, including its Chief Executive Officer and Chief Financial Officer, have evaluated the effectiveness of the Company’s disclosure controls and procedures (as such term is defined in Rules 13a-15(e) and 15d-15(e) under the Securities Exchange Act of 1934 (the “Exchange Act”)) as of the end of the reporting period covered by this report on Form 10-K. Based on such evaluation, the Chief Executive Officer and Chief Financial Officer have concluded that, as of the end of the period covered by this report on Form 10-K, the Company’s disclosure controls and procedures are effective such that material information required to be disclosed by the Company in the reports that it files or submits under the Exchange Act is recorded, processed, summarized and reported, within the time periods specified by the Securities and Exchange Commission’s rules and forms and is accumulated and communicated to management, including the Company’s principal executive officer and principal financial officer, as appropriate to allow timely decisions regarding required disclosure.
During the fourth quarter of fiscal 2011,2013, there were no changes to the Company’s internal control over financial reporting (as defined in Rule 13a-15(f) of the Exchange Act) that have materially affected, or are reasonably likely to materially affect, the Company’s internal control over financial reporting.
Management’s Report on Internal Control Over Financial Reporting
The Company’s management, including its Chief Executive Officer and Chief Financial Officer, is responsible for establishing and maintaining adequate internal control over financial reporting as defined in Rules 13a-15(f) and 15(d)-15(f) under the Exchange Act. The Company’s internal control over financial reporting is designed to provide reasonable assurance regarding the reliability of financial reporting and the preparation of financial statements for external purposes in accordance with generally accepted accounting principles in the United States of America. Because of inherent limitations, internal control over financial reporting may not prevent or detect misstatements. Also, controls may become inadequate because of changes in conditions, or the degree of compliance with the policies or procedures may deteriorate. Management conducted an evaluation of the effectiveness of the Company’s internal control over financial reporting as of July 2, 2011.June 29, 2013. In making this assessment, management used the 1992 framework established inInternal Control — Integrated Frameworkissued by the Committee of Sponsoring Organizations of the Treadway Commission and concluded that the Company maintained effective internal control over financial reporting as of July 2, 2011.June 29, 2013.
The Company’s independent registered public accounting firm, KPMG LLP, has audited the effectiveness of the Company’s internal controls over financial reporting as of July 2, 2011,June 29, 2013, as stated in its audit report which is included herein.
| | |
Item 9B. | | Item 9B. Other Information |
Not applicable.
34
PART III
Item 10. Directors, Executive Officers and Corporate Governance
| | |
Item 10. | | Directors, Executive Officers and Corporate Governance
|
The information called for by Item 10 is incorporated in this Report by reference to the Company’s definitive proxy statement relating to the Annual Meeting of Stockholders anticipated to be held on November 4, 2011.8, 2013.
Item 11. Executive Compensation
| | |
Item 11. | | Executive Compensation
|
The information called for by Item 11 is incorporated in this Report by reference to the Company’s definitive proxy statement relating to the Annual Meeting of Stockholders anticipated to be held on November 4, 2011.8, 2013.
Item 12. Security Ownership of Certain Beneficial Owners and Management and Related Stockholder Matters
| | |
Item 12. | | Security Ownership of Certain Beneficial Owners and Management and Related Stockholder Matters
|
The information called for by Item 12 is incorporated in this Report by reference to the Company’s definitive proxy statement relating to the Annual Meeting of Stockholders anticipated to be held on November 4, 2011.8, 2013.
Item 13. Certain Relationships and Related Transactions, and Director Independence
| | |
Item 13. | | Certain Relationships and Related Transactions, and Director Independence
|
The information called for by Item 13 is incorporated in this Report by reference to the Company’s definitive proxy statement relating to the Annual Meeting of Shareholders anticipated to be held on November 4, 2011.8, 2013.
Item 14. Principal Accounting Fees and Services
| | |
Item 14. | | Principal Accounting Fees and Services
|
The information called for by Item 14 is incorporated in this Report by reference to the Company’s definitive proxy statement relating to the Annual Meeting of Stockholders anticipated to be held on November 4, 2011.8, 2013.
35
PART IV
| | |
Item 15. | | Exhibits and Financial Statement Schedules
|
Item 15. Exhibits and Financial Statement Schedulesa. The following documents are filed as part of this Report:
| | | | |
| | Page | |
1. Consolidated Financial Statements: | | | | |
| | | | |
| | | | | | | Page | | 1. | Consolidated Financial Statements: | | | | | | | | | | | | | | | | Avnet, Inc. and Subsidiaries Consolidated Financial Statements: | | | | | | | | | | | | | | | | | | | | | | | | | | | | | | | | | | | | | | | | | | | | | | | | | | | | | | | 2. | Financial Statement Schedule: | | | | | | | | | | | | | | | | Schedules other than that above have been omitted because they are not applicable or the required information is shown in the financial statements or notes thereto | | | | | | | 3. | Exhibits | |
Report of Independent Registered Public Accounting Firm | | | 38 | |
| | | | |
Avnet, Inc. and Subsidiaries Consolidated Financial Statements: | | | | |
| | | | |
| | | 39 | |
| | | | |
| | | 40 | |
| | | | |
| | | 41 | |
| | | | |
| | | 42 | |
| | | | |
| | | 43 | |
| | | | |
2. Financial Statement Schedule: | | | | |
| | | | |
| | | 73 | |
| | | | |
Schedules other than that above have been omitted because they are not applicable or the required information is shown in the financial statements or notes thereto | | | | |
| | | | |
3. Exhibits — The exhibit index for this Report can be found beginning on page | | | 74 | |
| | | | |
36
SIGNATURES
Pursuant to the requirements of Section 13 or 15(d) of the Securities Exchange Act of 1934, the Registrant has duly caused this Report to be signed on its behalf by the undersigned, thereunto duly authorized.
|
| | | | |
| | AVNET, INC.
(Registrant)
| |
| | By: | /s/ RICHARD HAMADA | |
| | | Richard Hamada | |
| | | Chief Executive Officer and Director | |
Date: August 12, 20119, 2013
KNOW ALL MEN BY THESE PRESENTS, that each person whose signature appears below hereby authorizes and appoints each of Richard Hamada and Raymond SadowskiKevin Moriarty his or her attorneys-in-fact, for him or her in any and all capacities, to sign any amendments to this Report, and to file the same, with exhibits thereto, and other documents in connection therewith, with the Securities and Exchange Commission, hereby ratifying and confirming all that said attorneys-in-fact, or their substitute, may do or cause to be done by virtue hereof.
Pursuant to the requirements of the Securities Exchange Act of 1934, this Report has been signed below by the following persons on behalf of the Registrant and in the capacities indicated on August 12, 2011.9, 2013.
|
| | |
| Signature | | Title |
| | | |
/s/ RICHARD HAMADA Richard Hamada | | Chief Executive Officer and Director
(Principal Executive Officer) |
| Richard Hamada | |
| | | |
| WILLIAM H. SCHUMANN, III | | Chairman of the Board and Director |
| William H. Schumann, III | | |
/s/ ELEANOR BAUMEleanor Baum | | Director |
| | | |
/s/ J. VERONICA BIGGINS J. Veronica Biggins | | Director |
| J. Veronica Biggins | |
| | | |
/s/ EHUD HOUMINEREhud Houminer | | Director |
| Michael A. Bradley | |
| | | |
/s/ JAMES A. LAWRENCEJames A. Lawrence | | Director |
| R. Kerry Clark | |
| | | |
/s/ FRANK R. NOONANFrank R. Noonan | | Director |
| James A. Lawrence | |
| | | |
/s/ RAY M. ROBINSONRay M. Robinson | | Director |
| Frank R. Noonan | |
| | | |
/s/ WILLIAM H. SCHUMANN, IIIWilliam H. Schumann, III | | Director |
| Ray M. Robinson | |
| | | |
/s/ WILLIAM P. SULLIVAN William P. Sullivan | | Director |
| William P. Sullivan | |
| | | |
/s/ GARY L. TOOKERGary L. Tooker | | Director |
| | |
/s/ RAYMOND SADOWSKIRaymond Sadowski | | Senior Vice President and Chief Financial Officer
(Principal Financial and Accounting Officer)
|
| Kevin Moriarty | |
37
Report of Independent Registered Public Accounting Firm
The Board of Directors and Shareholders
Avnet, Inc.:
We have audited the accompanying consolidated balance sheets of Avnet, Inc. and subsidiaries (the Company) as of July 2, 2011June 29, 2013 and July 3, 2010,June 30, 2012, and the related consolidated statements of operations, shareholders’comprehensive income, shareholders' equity, and cash flows for each of the years in the three-year period ended July 2, 2011.June 29, 2013. In connection with our audits of the consolidated financial statements, we have also audited the financial statement schedule for each of the years in the three-year period ended July 2, 2011,June 29, 2013, as listed in the accompanying index. We also have audited the Company’sCompany's internal control over financial reporting as of July 2, 2011,June 29, 2013, based on the 1992 criteria established inInternal Control —- Integrated Frameworkissued by the Committee of Sponsoring Organizations of the Treadway Commission (COSO). The Company’sCompany's management is responsible for these consolidated financial statements, for maintaining effective internal control over financial reporting, and for its assessment of the effectiveness of internal control over financial reporting, included in the accompanyingManagement’s Management's Report on Internal Control over Financial Reporting.Reporting. Our responsibility is to express an opinion on these consolidated financial statements, an opinion on the financial statement schedule and an opinion on the Company’sCompany's internal control over financial reporting based on our audits.
We conducted our audits in accordance with the standards of the Public Company Accounting Oversight Board (United States). Those standards require that we plan and perform the audits to obtain reasonable assurance about whether the financial statements are free of material misstatement and whether effective internal control over financial reporting was maintained in all material respects. Our audits of the consolidated financial statements included examining, on a test basis, evidence supporting the amounts and disclosures in the financial statements, assessing the accounting principles used and significant estimates made by management, and evaluating the overall financial statement presentation. Our audit of internal control over financial reporting included obtaining an understanding of internal control over financial reporting, assessing the risk that a material weakness exists, and testing and evaluating the design and operating effectiveness of internal control based on the assessed risk. Our audits also included performing such other procedures as we considered necessary in the circumstances. We believe that our audits provide a reasonable basis for our opinions.
A company’scompany's internal control over financial reporting is a process designed to provide reasonable assurance regarding the reliability of financial reporting and the preparation of financial statements for external purposes in accordance with generally accepted accounting principles. A company’scompany's internal control over financial reporting includes those policies and procedures that (1) pertain to the maintenance of records that, in reasonable detail, accurately and fairly reflect the transactions and dispositions of the assets of the company; (2) provide reasonable assurance that transactions are recorded as necessary to permit preparation of financial statements in accordance with generally accepted accounting principles, and that receipts and expenditures of the company are being made only in accordance with authorizations of management and directors of the company; and (3) provide reasonable assurance regarding prevention or timely detection of unauthorized acquisition, use, or disposition of the company’scompany's assets that could have a material effect on the financial statements.
Because of its inherent limitations, internal control over financial reporting may not prevent or detect misstatements. Also, projections of any evaluation of effectiveness to future periods are subject to the risk that controls may become inadequate because of changes in conditions, or that the degree of compliance with the policies or procedures may deteriorate.
In our opinion, the consolidated financial statements referred to above present fairly, in all material respects, the financial position of Avnet, Inc. and subsidiaries as of July 2, 2011June 29, 2013 and July 3, 2010,June 30, 2012, and the results of their operations and their cash flows for each of the years in the three-year period ended July 2, 2011,June 29, 2013, in conformity with U.S. generally accepted accounting principles. Also in our opinion, the related financial statement schedule for each of the years in the three-year period ended July 2, 2011,June 29, 2013, when considered in relation to the basic consolidated financial statementstatements taken as a whole, presents fairly, in all material respects, the information set forth therein. Furthermore, in our opinion, Avnet, Inc. maintained, in all material respects, effective internal control over financial reporting as of July 2, 2011,June 29, 2013, based on the 1992 criteria established inInternal Control —- Integrated Frameworkissued by the Committee of Sponsoring Organizations of the Treadway Commission.
As discussed in note 1 to the consolidated financial statements, effective June 28, 2009, the Company adopted FASB ASC 470-20,Debt with Conversion and Other Options(formerly FSP APB 14-1).
/s/ KPMG LLP
Phoenix, Arizona
August 11, 20119, 2013
38
AVNET, INC. AND SUBSIDIARIES
CONSOLIDATED BALANCE SHEETS
| | | | | | | | | |
| | | July 2, | | | July 3, | |
| | | 2011 | | | 2010 | |
| | | (Thousands, except share amounts) | |
ASSETS | | | | | | | | |
| Current assets: | | | | | | | | |
| Cash and cash equivalents | | $ | 675,334 | | | $ | 1,092,102 | |
| Receivables, less allowances of $107,739 and $81,197, respectively (Note 3) | | | 4,764,293 | | | | 3,574,541 | |
| Inventories | | | 2,596,470 | | | | 1,812,766 | |
| Prepaid and other current assets | | | 191,110 | | | | 150,759 | |
| | | | | | | |
| Total current assets | | | 8,227,207 | | | | 6,630,168 | |
| Property, plant and equipment, net (Note 5) | | | 419,173 | | | | 302,583 | |
| Goodwill (Notes 2 and 6) | | | 885,072 | | | | 566,309 | |
| Other assets | | | 374,117 | | | | 283,322 | |
| | | | | | | |
| Total assets | | $ | 9,905,569 | | | $ | 7,782,382 | |
| | | | | | | |
LIABILITIES AND SHAREHOLDERS’ EQUITY | | | | | | | | |
| Current liabilities: | | | | | | | | |
| Borrowings due within one year (Note 7) | | $ | 243,079 | | | $ | 36,549 | |
| Accounts payable | | | 3,561,633 | | | | 2,862,290 | |
| Accrued expenses and other (Note 8) | | | 673,016 | | | | 540,776 | |
| | | | | | | |
| Total current liabilities | | | 4,477,728 | | | | 3,439,615 | |
| Long-term debt (Note 7) | | | 1,273,509 | | | | 1,243,681 | |
| Other long-term liabilities (Notes 9 and 10) | | | 98,262 | | | | 89,969 | |
| | | | | | | |
| Total liabilities | | | 5,849,499 | | | | 4,773,265 | |
| | | | | | | |
| Commitments and contingencies (Notes 11 and 13) | | | | | | | | |
| Shareholders’ equity (Notes 4, 12 and 14): | | | | | | | | |
| Common stock $1.00 par; authorized 300,000,000 shares; issued 152,835,000 shares and 151,874 ,000 shares, respectively | | | 152,835 | | | | 151,874 | |
| Additional paid-in capital | | | 1,233,209 | | | | 1,206,132 | |
| Retained earnings | | | 2,293,510 | | | | 1,624,441 | |
| Accumulated other comprehensive income (Note 4) | | | 377,211 | | | | 27,362 | |
| Treasury stock at cost, 37,802 shares and 37,769 shares, respectively | | | (695 | ) | | | (692 | ) |
| | | | | | | |
| Total shareholders’ equity | | | 4,056,070 | | | | 3,009,117 | |
| | | | | | | |
| Total liabilities and shareholders’ equity | | $ | 9,905,569 | | | $ | 7,782,382 | |
| | | | | | | |
|
| | | | | | | |
| | June 29, 2013 | | June 30, 2012 |
| | (Thousands, except share amounts) |
| ASSETS | | | |
| Current assets: | | | |
| Cash and cash equivalents | $ | 1,009,343 |
| | $ | 1,006,864 |
|
| Receivables, less allowances of $95,656 and $106,319, respectively (Note 3) | 4,868,973 |
| | 4,607,324 |
|
| Inventories | 2,264,341 |
| | 2,388,642 |
|
| Prepaid and other current assets | 214,221 |
| | 251,609 |
|
| Total current assets | 8,356,878 |
| | 8,254,439 |
|
| Property, plant and equipment, net (Note 5) | 492,606 |
| | 461,230 |
|
| Goodwill (Notes 2 and 6) | 1,261,288 |
| | 1,100,621 |
|
| Other assets | 363,908 |
| | 351,576 |
|
| Total assets | $ | 10,474,680 |
| | $ | 10,167,866 |
|
| LIABILITIES AND SHAREHOLDERS’ EQUITY | | | |
| Current liabilities: | | | |
| Borrowings due within one year (Notes 3 and 7) | $ | 838,190 |
| | $ | 872,404 |
|
| Accounts payable | 3,278,152 |
| | 3,230,765 |
|
| Accrued expenses and other (Note 8) | 705,102 |
| | 695,483 |
|
| Total current liabilities | 4,821,444 |
| | 4,798,652 |
|
| Long-term debt (Note 7) | 1,206,993 |
| | 1,271,985 |
|
| Other long-term liabilities (Notes 9 and 10) | 157,118 |
| | 191,497 |
|
| Total liabilities | 6,185,555 |
| | 6,262,134 |
|
| Commitments and contingencies (Notes 11 and 13) |
| |
|
| Shareholders’ equity (Notes 4, 12 and 14): | | | |
Common stock $1.00 par; authorized 300,000,000 shares; issued 137,127,000 shares and 142,586,000 shares, respectively | 137,127 |
| | 142,586 |
|
| Additional paid-in capital | 1,320,901 |
| | 1,263,817 |
|
| Retained earnings | 2,802,966 |
| | 2,545,858 |
|
| Accumulated other comprehensive income (loss) (Note 4) | 28,895 |
| | (45,832 | ) |
| Treasury stock at cost, 38,238 shares and 37,872 shares, respectively | (764 | ) | | (697 | ) |
| Total shareholders’ equity | 4,289,125 |
| | 3,905,732 |
|
| Total liabilities and shareholders’ equity | $ | 10,474,680 |
| | $ | 10,167,866 |
|
See notes to consolidated financial statementsstatements.
39
AVNET, INC. AND SUBSIDIARIES
CONSOLIDATED STATEMENTS OF OPERATIONS
| | | | | | | | | | | | | |
| | | Years Ended | |
| | | July 2, | | | July 3, | | | June 27, | |
| | | 2011 | | | 2010 | | | 2009 | |
| | | (Thousands, except share amounts) | |
| Sales | | $ | 26,534,413 | | | $ | 19,160,172 | | | $ | 16,229,896 | |
| Cost of sales | | | 23,426,608 | | | | 16,879,955 | | | | 14,206,903 | |
| | | | | | | | | | |
| Gross profit | | | 3,107,805 | | | | 2,280,217 | | | | 2,022,993 | |
| Selling, general and administrative expenses | | | 2,100,650 | | | | 1,619,198 | | | | 1,531,522 | |
| Impairment charges (Note 6) | | | — | | | | — | | | | 1,411,127 | |
| Restructuring, integration and other charges (Note 17) | | | 77,176 | | | | 25,419 | | | | 99,342 | |
| | | | | | | | | | |
| | | | | | | | | | | | | |
| Operating income (loss) | | | 929,979 | | | | 635,600 | | | | (1,018,998 | ) |
| Other income (expense), net | | | 10,724 | | | | 2,480 | | | | (11,622 | ) |
| Interest expense | | | (92,452 | ) | | | (61,748 | ) | | | (78,666 | ) |
| Gain on bargain purchase and other (Note 2) | | | 22,715 | | | | — | | | | — | |
| Gain on sale of assets (Note 2) | | | — | | | | 8,751 | | | | 14,318 | |
| | | | | | | | | | |
| Income (loss) before income taxes | | | 870,966 | | | | 585,083 | | | | (1,094,968 | ) |
| Income tax provision (Note 9) | | | 201,897 | | | | 174,713 | | | | 34,744 | |
| | | | | | | | | | |
| Net income (loss) | | $ | 669,069 | | | $ | 410,370 | | | $ | (1,129,712 | ) |
| | | | | | | | | | |
| | | | | | | | | | | | | |
| Net earnings (loss) per share (Note 14): | | | | | | | | | | | | |
| Basic | | $ | 4.39 | | | $ | 2.71 | | | $ | (7.49 | )(1) |
| | | | | | | | | | |
| Diluted | | $ | 4.34 | | | $ | 2.68 | | | $ | (7.49 | )(1) |
| | | | | | | | | | |
| | | | | | | | | | | | | |
| Shares used to compute earnings (loss) per share (Note 14): | | | | | | | | | | | | |
| Basic | | | 152,481 | | | | 151,629 | | | | 150,898 | |
| | | | | | | | | | |
| Diluted | | | 154,337 | | | | 153,093 | | | | 150,898 | |
| | | | | | | | | | |
| | |
(1) | | As adjusted for the retrospective application of an accounting standard. See Note 1 to the consolidated financial statements. |
See notes to consolidated financial statements
40
AVNET, INC. AND SUBSIDIARIES |
| | | | | | | | | | | |
| | Years Ended |
| | June 29, 2013 | | June 30, 2012 | | July 2, 2011 |
| | (Thousands, except share amounts) |
| Sales | $ | 25,458,924 |
| | $ | 25,707,522 |
| | $ | 26,534,413 |
|
| Cost of sales | 22,479,123 |
| | 22,656,965 |
| | 23,426,608 |
|
| Gross profit | 2,979,801 |
| | 3,050,557 |
| | 3,107,805 |
|
| Selling, general and administrative expenses | 2,204,319 |
| | 2,092,807 |
| | 2,100,650 |
|
| Restructuring, integration and other charges (Note 17) | 149,501 |
| | 73,585 |
| | 77,176 |
|
| Operating income | 625,981 |
| | 884,165 |
| | 929,979 |
|
| Other income (expense), net | (74 | ) | | (5,442 | ) | | 10,724 |
|
| Interest expense | (107,653 | ) | | (90,859 | ) | | (92,452 | ) |
| Gain on bargain purchase and other (Note 2) | 31,011 |
| | 2,918 |
| | 22,715 |
|
| Income before income taxes | 549,265 |
| | 790,782 |
| | 870,966 |
|
| Income tax provision (Note 9) | 99,192 |
| | 223,763 |
| | 201,897 |
|
| Net income | $ | 450,073 |
| | $ | 567,019 |
| | $ | 669,069 |
|
| Net earnings per share (Note 14): | | | | | |
| Basic | $ | 3.26 |
| | $ | 3.85 |
| | $ | 4.39 |
|
| Diluted | $ | 3.21 |
| | $ | 3.79 |
| | $ | 4.34 |
|
| Shares used to compute earnings per share (Note 14): | | | | | |
| Basic | 137,951 |
| | 147,278 |
| | 152,481 |
|
| Diluted | 140,003 |
| | 149,553 |
| | 154,337 |
|
CONSOLIDATED STATEMENTS OF SHAREHOLDERS’ EQUITY
Years Ended July 2, 2011, July 3, 2010 and June 27, 2009
| | | | | | | | | | | | | | | | | | | | | | | | | |
| | | | | | | | | | | | | | | Accumulated | | | | | | | | |
| | | | | | | Additional | | | | | | | Other | | | | | | | Total | |
| | | Common | | | Paid-In | | | Retained | | | Comprehensive | | | Treasury | | | Shareholders’ | |
| | | Stock | | | Capital | | | Earnings | | | Income | | | Stock | | | Equity | |
| | | (Thousands) | |
Balance, June 28, 2008 (as adjusted —see Note 1) | | | 150,417 | | | $ | 1,166,042 | | | $ | 2,343,783 | | | $ | 482,178 | | | $ | (479 | ) | | $ | 4,141,941 | |
| Net loss | | | — | | | | — | | | | (1,129,712 | ) | | | — | | | | — | | | | (1,129,712 | ) |
| Translation adjustments (Note 4) | | | — | | | | — | | | | — | | | | (237,903 | ) | | | — | | | | (237,903 | ) |
| Pension liability adjustment, net of tax of $16,767 (Notes 4, 10 and 15) | | | — | | | | — | | | | — | | | | (26,181 | ) | | | — | | | | (26,181 | ) |
| | | | | | | | | | | | | | | | | | | | | | | | |
| Comprehensive loss (Note 4) | | | | | | | | | | | | | | | | | | | | | | | (1,393,796 | ) |
| | | | | | | | | | | | | | | | | | | | | | | | |
| Stock option and incentive programs, including related tax benefits of $653 | | | 682 | | | | 12,482 | | | | — | | | | — | | | | (452 | ) | | | 12,712 | |
| | | | | | | | | | | | | | | | | | | |
| | | | | | | | | | | | | | | | | | | | | | | | | |
Balance, June 27, 2009 | | | 151,099 | | | | 1,178,524 | | | | 1,214,071 | | | | 218,094 | | | | (931 | ) | | | 2,760,857 | |
| Net income | | | — | | | | — | | | | 410,370 | | | | — | | | | — | | | | 410,370 | |
| Translation adjustments (Note 4) | | | — | | | | — | | | | — | | | | (159,517 | ) | | | — | | | | (159,517 | ) |
| Pension liability adjustment, net of tax of $19,287 (Notes 4, 10 and 15) | | | — | | | | — | | | | — | | | | (31,215 | ) | | | — | | | | (31,215 | ) |
| | | | | | | | | | | | | | | | | | | | | | | | |
| Comprehensive income (Note 4) | | | | | | | | | | | | | | | | | | | | | | | 219,638 | |
| | | | | | | | | | | | | | | | | | | | | | | | |
| Stock option and incentive programs, including related tax benefits of $2,100 | | | 775 | | | | 27,608 | | | | — | | | | — | | | | 239 | | | | 28,622 | |
| | | | | | | | | | | | | | | | | | | |
| | | | | | | | | | | | | | | | | | | | | | | | | |
Balance, July 3, 2010 | | | 151,874 | | | | 1,206,132 | | | | 1,624,441 | | | | 27,362 | | | | (692 | ) | | | 3,009,117 | |
| Net income | | | — | | | | — | | | | 669,069 | | | | — | | | | — | | | | 669,069 | |
| Translation adjustments (Note 4) | | | — | | | | — | | | | — | | | | 329,884 | | | | — | | | | 329,884 | |
| Pension liability adjustment, net of tax of $12,022 (Notes 4, 10 and 15) | | | — | | | | — | | | | — | | | | 19,965 | | | | — | | | | 19,965 | |
| | | | | | | | | | | | | | | | | | | | | | | | |
| Comprehensive income (Note 4) | | | | | | | | | | | | | | | | | | | | | | | 1,018,918 | |
| | | | | | | | | | | | | | | | | | | | | | | | |
| Stock option and incentive programs, including related tax benefits of $4,689 | | | 961 | | | | 27,077 | | | | — | | | | — | | | | (3 | ) | | | 28,035 | |
| | | | | | | | | | | | | | | | | | | |
| | | | | | | | | | | | | | | | | | | | | | | | | |
Balance, July 2, 2011 | | | 152,835 | | | $ | 1,233,209 | | | $ | 2,293,510 | | | $ | 377,211 | | | $ | (695 | ) | | $ | 4,056,070 | |
| | | | | | | | | | | | | | | | | | | |
See notes to consolidated financial statementsstatements.
41
AVNET, INC. AND SUBSIDIARIES
CONSOLIDATED STATEMENTS OF CASH FLOWSCOMPREHENSIVE INCOME
| | | | | | | | | | | | | |
| | | Years Ended | |
| | | July 2, | | | July 3, | | | June 27, | |
| | | 2011 | | | 2010 | | | 2009 | |
| | | (Thousands) | |
| Cash flows from operating activities: | | | | | | | | | | | | |
| Net income (loss) | | $ | 669,069 | | | $ | 410,370 | | | $ | (1,129,712 | ) |
| Non-cash and other reconciling items: | | | | | | | | | | | | |
| Depreciation and amortization | | | 81,389 | | | | 60,643 | | | | 65,781 | |
| Deferred income taxes (Note 9) | | | 15,966 | | | | 46,424 | | | | (92,787 | ) |
| Stock-based compensation (Note 12) | | | 28,931 | | | | 28,363 | | | | 18,269 | |
| Gain on sale of assets (Note 2) | | | — | | | | (8,751 | ) | | | (14,318 | ) |
| Gain on bargain purchase and other (Note 2) | | | (22,715 | ) | | | — | | | | — | |
| Impairment charges (Note 6) | | | — | | | | — | | | | 1,411,127 | |
| Other, net (Note 15) | | | 56,846 | | | | 15,385 | | | | 38,414 | |
| Changes in (net of effects from businesses acquired): | | | | | | | | | | | | |
| Receivables | | | (421,457 | ) | | | (1,070,302 | ) | | | 709,908 | |
| Inventories | | | (321,939 | ) | | | (459,917 | ) | | | 483,453 | |
| Accounts payable | | | 165,185 | | | | 963,332 | | | | (375,509 | ) |
| Accrued expenses and other, net | | | 26,804 | | | | (15,962 | ) | | | 3,409 | |
| | | | | | | | | | |
| Net cash flows provided by (used for) operating activities | | | 278,079 | | | | (30,415 | ) | | | 1,118,035 | |
| | | | | | | | | | |
| |
| Cash flows from financing activities: | | | | | | | | | | | | |
Borrowings under accounts receivable securitization program, net (Note 7) | | | 160,000 | | | | — | | | | — | |
| Issuance of notes in a public offering, net of issuance costs (Note 7) | | | — | | | | 296,469 | | | | — | |
| Repayment of notes (Note 7) | | | (109,600 | ) | | | — | | | | (300,000 | ) |
| Proceeds from (repayments of) bank debt, net (Note 7) | | | 1,644 | | | | (1,732 | ) | | | (90,444 | ) |
| Proceeds from (repayments of) other debt, net (Note 7) | | | 7,238 | | | | (2,803 | ) | | | (16,361 | ) |
| Other, net (Note 12) | | | 3,930 | | | | 4,838 | | | | 1,564 | |
| | | | | | | | | | |
| Net cash flows provided by (used for) financing activities | | | 63,212 | | | | 296,772 | | | | (405,241 | ) |
| | | | | | | | | | |
| | | | | | | | | | | | | |
| Cash flows from investing activities: | | | | | | | | | | | | |
| Purchases of property, plant and equipment | | | (148,707 | ) | | | (66,888 | ) | | | (110,219 | ) |
| Cash proceeds from sales of property, plant and equipment | | | 10,621 | | | | 12,015 | | | | 13,157 | |
| Acquisitions of operations and investments, net of cash acquired (Note 2) | | | (690,997 | ) | | | (69,333 | ) | | | (314,941 | ) |
| Cash proceeds from divestiture activities (Note 2) | | | 19,108 | | | | 11,785 | | | | 14,318 | |
| | | | | | | | | | |
| Net cash flows used for investing activities | | | (809,975 | ) | | | (112,421 | ) | | | (397,685 | ) |
| | | | | | | | | | |
| Effect of exchange rate changes on cash and cash equivalents | | | 51,916 | | | | (5,755 | ) | | | (11,637 | ) |
| | | | | | | | | | |
| Cash and cash equivalents: | | | | | | | | | | | | |
| — (decrease) increase | | | (416,768 | ) | | | 148,181 | | | | 303,472 | |
| — at beginning of year | | | 1,092,102 | | | | 943,921 | | | | 640,449 | |
| | | | | | | | | | |
| — at end of year | | $ | 675,334 | | | $ | 1,092,102 | | | $ | 943,921 | |
| | | | | | | | | | |
| |
| Additional cash flow information (Note 15) | | | | | | | | | | | | |
|
| | | | | | | | | | | |
| | Years Ended |
| | June 29, 2013 | | June 30, 2012 | | July 2, 2011 |
| | (Thousands) |
| Net income | $ | 450,073 |
| | $ | 567,019 |
| | $ | 669,069 |
|
| Other comprehensive income, net of tax: | | | | | |
| Foreign currency translation adjustments | 44,597 |
| | (370,415 | ) | | 329,884 |
|
| Pension liability adjustments | $ | 30,130 |
| | $ | (52,628 | ) | | $ | 19,965 |
|
| Total comprehensive income | $ | 524,800 |
| | $ | 143,976 |
| | $ | 1,018,918 |
|
See notes to consolidated financial statementsstatements.
42
AVNET, INC. AND SUBSIDIARIES
CONSOLIDATED STATEMENTS OF SHAREHOLDERS’ EQUITY
Years Ended June 29, 2013, June 30, 2012 and July 2, 2011
|
| | | | | | | | | | | | | | | | | | | | | | | |
| | Common Stock | | Additional Paid-In Capital | | Retained Earnings | | Accumulated Other Comprehensive Income (Loss) | | Treasury Stock | | Total Shareholders’ Equity |
| | (Thousands) |
| Balance, July 3, 2010 | $ | 151,874 |
| | $ | 1,206,132 |
| | $ | 1,624,441 |
| | $ | 27,362 |
| | $ | (692 | ) | | $ | 3,009,117 |
|
| Net income | — |
| | — |
| | 669,069 |
| | — |
| | — |
| | 669,069 |
|
| Translation adjustments (Note 4) | — |
| | — |
| | — |
| | 329,884 |
| | — |
| | 329,884 |
|
| Pension liability adjustment, net of tax of $12,022 (Notes 4,10 and 15) | — |
| | — |
| | — |
| | 19,965 |
| | — |
| | 19,965 |
|
| Stock option and incentive programs, including related tax benefits of $4,689 | 961 |
| | 27,077 |
| | — |
| | — |
| | (3 | ) | | 28,035 |
|
| Balance, July 2, 2011 | 152,835 |
| | 1,233,209 |
| | 2,293,510 |
| | 377,211 |
| | (695 | ) | | 4,056,070 |
|
| Net income | — |
| | — |
| | 567,019 |
| | — |
| | — |
| | 567,019 |
|
| Translation adjustments (Note 4) | — |
| | — |
| | — |
| | (370,415 | ) | | — |
| | (370,415 | ) |
| Pension liability adjustment, net of tax of $32,382 (Notes 4,10 and 15) | — |
| | — |
| | — |
| | (52,628 | ) | | — |
| | (52,628 | ) |
| Repurchase of common stock (Note 4) | (11,270 | ) | | — |
| | (314,671 | ) | | — |
| | — |
| | (325,941 | ) |
| Stock option and incentive programs, including related tax benefits of $4,442 | 1,021 |
| | 30,608 |
| | — |
| | — |
| | (2 | ) | | 31,627 |
|
| Balance, June 30, 2012 | 142,586 |
| | 1,263,817 |
| | 2,545,858 |
| | (45,832 | ) | | (697 | ) | | 3,905,732 |
|
| Net income | — |
| | — |
| | 450,073 |
| | — |
| | — |
| | 450,073 |
|
| Translation adjustments (Note 4) | — |
| | — |
| | — |
| | 44,597 |
| | — |
| | 44,597 |
|
| Pension liability adjustment, net of tax of $19,062 (Notes 4,10 and 15) | — |
| | — |
| | — |
| | 30,130 |
| | — |
| | 30,130 |
|
| Repurchases of common stock (Note 4) | (6,620 | ) | | | | (192,965 | ) | | | | | | (199,585 | ) |
| Stock option and incentive programs, including related tax benefits of $4,110 | 1,161 |
| | 33,291 |
| | — |
| | — |
| | (67 | ) | | 34,385 |
|
| Acquisition of non-controlling interest (Note 2) | — |
| | 23,793 |
| | — |
| | — |
| | — |
| | 23,793 |
|
| Balance, June 29, 2013 | $ | 137,127 |
| | $ | 1,320,901 |
| | $ | 2,802,966 |
| | $ | 28,895 |
| | $ | (764 | ) | | $ | 4,289,125 |
|
See notes to consolidated financial statements.
AVNET, INC. AND SUBSIDIARIES
CONSOLIDATED STATEMENTS OF CASH FLOWS
|
| | | | | | | | | | | |
| | Years Ended |
| | June 29, 2013 | | June 30, 2012 | | July 2, 2011 |
| | (Thousands) |
| Cash flows from operating activities: | | | | | |
| Net income | $ | 450,073 |
| | $ | 567,019 |
| | $ | 669,069 |
|
| Non-cash and other reconciling items: | | | | | |
| Depreciation and amortization | 120,676 |
| | 101,336 |
| | 81,389 |
|
| Deferred income taxes (Note 9) | (10,019 | ) | | 11,782 |
| | 15,966 |
|
| Stock-based compensation (Note 12) | 43,677 |
| | 35,737 |
| | 28,931 |
|
| Gain on bargain purchase and other (Note 2) | (31,011 | ) | | (2,918 | ) | | (22,715 | ) |
| Other, net (Note 15) | 75,327 |
| | 66,263 |
| | 56,846 |
|
| Changes in (net of effects from businesses acquired): | | | | | |
| Receivables | (94,203 | ) | | 72,267 |
| | (421,457 | ) |
| Inventories | 225,667 |
| | 133,178 |
| | (321,939 | ) |
| Accounts payable | (78,834 | ) | | (319,094 | ) | | 165,185 |
|
| Accrued expenses and other, net | (5,156 | ) | | (136,852 | ) | | 26,804 |
|
| Net cash flows provided by operating activities | 696,197 |
| | 528,718 |
| | 278,079 |
|
| Cash flows from financing activities: | | | | | |
(Repayments of) borrowings under accounts receivable securitization program, net (Note 3) | (310,000 | ) | | 510,000 |
| | 160,000 |
|
| Issuance of notes in a public offering, net of issuance costs (Note 7) | 349,258 |
| | — |
| | — |
|
| Repayment of notes (Note 7) | — |
| | — |
| | (109,600 | ) |
| (Repayments of) proceeds from bank debt, net (Note 7) | (179,861 | ) | | 86,823 |
| | 1,644 |
|
| (Repayments of) proceeds from other debt, net (Note 7) | (1,080 | ) | | (1,007 | ) | | 7,238 |
|
| Repurchases of common stock (Note 4) | (207,192 | ) | | (318,333 | ) | | — |
|
| Other, net (Note 12) | 4,792 |
| | 5,590 |
| | 3,930 |
|
| Net cash flows (used for) provided by financing activities | (344,083 | ) | | 283,073 |
| | 63,212 |
|
| Cash flows from investing activities: | | | | | |
| Purchases of property, plant and equipment | (97,379 | ) | | (128,652 | ) | | (148,707 | ) |
| Cash proceeds from sales of property, plant and equipment | 3,018 |
| | 1,046 |
| | 10,621 |
|
| Acquisitions of operations and investments, net of cash acquired (Note 2) | (262,306 | ) | | (313,218 | ) | | (690,997 | ) |
| Cash proceeds from divestiture activities (Note 2) | 3,613 |
| | — |
| | 19,108 |
|
| Net cash flows used for investing activities | (353,054 | ) | | (440,824 | ) | | (809,975 | ) |
| Effect of exchange rate changes on cash and cash equivalents | 3,419 |
| | (39,437 | ) | | 51,916 |
|
| Cash and cash equivalents: | | | | | |
| — increase (decrease) | 2,479 |
| | 331,530 |
| | (416,768 | ) |
| — at beginning of year | 1,006,864 |
| | 675,334 |
| | 1,092,102 |
|
| — at end of year | $ | 1,009,343 |
| | $ | 1,006,864 |
| | $ | 675,334 |
|
______________________
Additional cash flow information (Note 15)
See notes to consolidated financial statements.
AVNET, INC. AND SUBSIDIARIES
NOTES TO CONSOLIDATED FINANCIAL STATEMENTS
1. Summary of significant accounting policies
Principles of consolidation— The accompanying consolidated financial statements include the accounts of the Company and all of its majority-owned and controlled subsidiaries. All intercompany accounts and transactions have been eliminated.
Cash and cash equivalents— The Company considers all highly liquid investments with an original maturity of three months or less to be cash equivalents.
Inventories— Inventories, comprised principally of finished goods, are stated at cost (first-in, first-out) or market, whichever is lower.
Investments— Investments in joint ventures and entities in which the Company has an ownership interest greater than 50% and exercises control over the venture are consolidated in the accompanying consolidated financial statements. Non-controlling interests in the years presented are not material and, as a result, are included in the caption “accrued expenses and other” in the accompanying consolidated balance sheets. Investments in joint ventures and entities in which the Company exercises significant influence but not control are accounted for using the equity method. The Company invests from time to time in ventures in which the Company’s ownership interest is less than 20% and over which the Company does not exercise significant influence. Such investments are accounted for using the cost method. The fair values for investments not traded on a quoted exchange are estimated based upon the historical performance of the ventures, the ventures’ forecasted financial performance and management’s evaluation of the ventures’ viability and business models. To the extent the book value of an investment exceeds its assessed fair value, the Company will record an appropriate impairment charge. Thus, the carrying value of the Company’s investments approximates fair value.
Depreciation and amortization— Depreciation and amortization is generally provided for by the straight-line method over the estimated useful lives of the assets. The estimated useful lives for depreciation and amortization are typically as follows: buildings — 30 years; machinery, fixtures and equipment — 2-102-10 years; and leasehold improvements — over the applicable remaining lease term or useful life if shorter.shorter.
Long-lived assets— Long-lived assets are reviewed for impairment whenever events or changes in circumstances indicate that the carrying amount of the assets may not be recoverable. An impairment is recognized when the estimated undiscounted cash flows expected to result from the use of the asset and its eventual disposition is less than its carrying amount. An impairment is measured as the amount by which an asset’s net book value exceeds its estimated fair value. The Company continually evaluates the carrying value and the remaining economic useful life of all long-lived assets and will adjust the carrying value and the related depreciation and amortization period if and when appropriate.
Goodwill— Goodwill represents the excess of the purchase price over the fair value of net assets acquired. Annual tests for goodwill impairment are performed by applying a fair-value based test to Avnet’s six reporting units, defined as each of the three regional businesses, which are the Americas, EMEA (Europe, Middle East and Africa), and Asia, within each of the Company’s operating groups. The Company conducts its periodic test for goodwill impairment annually, on the first day of the fiscal fourth quarter. A two-step process is used to evaluate goodwill for impairment. The first step is to determine if there is an indication of impairment by comparing the estimated fair value of each reporting unit to its carrying value including existing goodwill. Goodwill is considered impaired if the carrying value of a reporting unit exceeds the estimated fair value. The second step, which is performed only if there is an indication of impairment, determines the amount of the impairment by comparing the implied fair value of the reporting unit’s goodwill with its carrying value. To estimate fair value of each reporting unit, the Company uses a combination of present value and market valuation techniques whichthat utilizes Level 3 criteria under the fair value measurement standards. The estimated fair values could change in the future due to changes in market and business conditions that could affect the assumptions and estimates used in these valuation techniques.
Foreign currency translation— The assets and liabilities of foreign operations are translated into U.S. Dollars at the exchange rates in effect at the balance sheet date, with the related translation adjustments reported as a separate component of shareholders’ equity and comprehensive income. Results of operations are translated using the average exchange rates prevailing throughout the period. Transactions denominated in currencies other than the functional currency of the Avnet business unit that is party to the transaction (primarily trade receivables and payables) are translated at exchange rates in effect at the balance sheet date or upon settlement of the transaction. Gains and losses from such translation are recorded in the consolidated statements of operations as a component of “other income (expense), net.” In fiscal 2011, 20102013, 2012 and 2009,2011, gains or losses on foreign currency translation were not material.
43
AVNET, INC. AND SUBSIDIARIES
NOTES TO CONSOLIDATED FINANCIAL STATEMENTS — (Continued)
Income taxes— The Company follows the asset and liability method of accounting for income taxes. Deferred income tax assets and liabilities are recognized for the estimated future tax impact of differences between the financial statement carrying amounts of assets and liabilities and their respective tax bases. Deferred income tax assets and liabilities are measured using enacted tax rates in effect for the year in which those temporary differences are expected to be recovered or settled. The effect on deferred income tax assets and liabilities of a change in tax rates is recognized in earnings in the period in which the new rate is enacted. Based upon historical and projected levels of taxable income and analysis of other key factors, the Company may record a valuation allowance against its deferred tax assets, as deemed necessary, to state such assets at their estimated net realizable value.
The Company establishes reserves for potentially unfavorable outcomes of positions taken on certain tax matters. These reserves are based on management’s assessment of whether a tax benefit is more likely than not to be sustained upon examination by tax authorities. There may be differences between the anticipated and actual outcomes of these matters that may result in reversals of reserves or additional tax liabilities in excess of the reserved amounts. To the extent such adjustments are warranted, the Company’s effective tax rate may potentially fluctuate as a result. In accordance with the Company's accounting policy, accrued interest and penalties, if any, related to unrecognized tax benefits are recorded as a component of income tax expense.
No provision for U.S. income taxes has been made for approximately $2.0$2.7 billion of cumulative unremitted earnings of foreign subsidiaries at July 2, 2011June 29, 2013 because those earnings are expected to be permanently reinvested outside the U.S. A hypothetical calculation of the deferred tax liability, assuming those earnings were remitted, is not practicable.
Self-insurance— The Company is primarily self-insured for workers’ compensation, medical, and general, product and automobile liability costs; however, the Company also has a stop-loss insurance policy in place to limit the Company’s exposure to individual and aggregate claims made. Liabilities for these programs are estimated based upon outstanding claims and claims estimated to have been incurred but not yet reported based upon historical loss experience. These estimates are subject to variability due to changes in trends of losses for outstanding claims and incurred but not recorded claims, including external factors such as future inflation rates, benefit level changes and claim settlement patterns.
Revenue recognition—Revenue —Revenue from product sales is recognized when persuasive evidence of an arrangement exists, delivery has occurred or services have been rendered, the sales price is fixed or determinable and collectibilitycollectability is reasonably assured. Generally, these criteria are met upon shipment to customers. Most of the Company’s product sales come from product Avnet purchases from a supplier and holds in inventory. A portion of the Company’s sales are shipments of product directly from its suppliers to its customers. In such circumstances, Avnet negotiates the price with the customer, pays the supplier directly for the product shipped and bears credit risk of collecting payment from its customers. Furthermore, in such drop-shipment arrangements, Avnet bears responsibility for accepting returns of product from the customer even if Avnet, in turn, has a right to return the product to the original supplier if the product is defective. Under these terms, the Company serves as the principal with the customer and, therefore, recognizes the sale and cost of sale of the product upon receiving notification from the supplier that the product has shipped.
In addition, the Company has more limited contractual relationships with certain of its customers and suppliers whereby Avnet assumes an agency relationship in the transaction. In such arrangements, the Company recognizes the fee associated with serving as an agent in sales with no associated cost of sales.
Revenues from maintenance contracts are recognized ratably over the life of the contracts, generally ranging from one to three years.
Revenues are recorded net of discounts, rebates and estimated returns. Provisions are made for discounts and rebates, which are primarily volume-based, and are based on historical trends and anticipated customer buying patterns. Provisions for returns are estimated based on historical sales returns, credit memo analysis and other known factors.
44
AVNET, INC. AND SUBSIDIARIES
NOTES TO CONSOLIDATED FINANCIAL STATEMENTS — (Continued)
Comprehensive income (loss)— Comprehensive income (loss) represents net income (loss) for the year adjusted for changes in shareholders’ equity from non-shareholder sources. Accumulated comprehensive income items typically include currency translation and the impact of the Company’s pension liability adjustment, net of tax (see Note 4).
Stock-based compensation—The —The Company measures share-based payments, including grants of employee stock options, at fair value and recognizes the associated expense in the consolidated statement of operations over the requisite service period (see Note 12).
AVNET, INC. AND SUBSIDIARIES
NOTES TO CONSOLIDATED FINANCIAL STATEMENTS — (Continued)
Concentration of credit risk— Financial instruments that potentially subject the Company to a concentration of credit risk principally consist of cash and cash equivalents and trade accounts receivable. The Company invests its excess cash primarily in overnight Eurodollar time deposits and institutional money market funds with quality financial institutions. The Company sells electronic components and computer products primarily to original equipment and contract manufacturers, including the military and military contractors, throughout the world. To reduce credit risk, management performs ongoing credit evaluations of its customers’ financial condition and, in some instances, has obtained insurance coverage to reduce such risk. The Company maintains reserves for potential credit losses, but has not experienced any material losses related to individual customers or groups of customers in any particular industry or geographic area.
Fair value of financial instruments— The Company measures financial assets and liabilities at fair value based upon exit price, representing the amount that would be received on the sale of an asset or paid to transfer a liability, in an orderly transaction between market participants. Accounting standards require inputs used in valuation techniques for measuring fair value on a recurring or non-recurring basis be assigned to a hierarchical level as follows: Level 1 are observable inputs that reflect quoted prices for identical assets or liabilities in active markets. Level 2 are observable market-based inputs or unobservable inputs that are corroborated by market data and Level 3 are unobservable inputs that are not corroborated by market data. All transfers between fair value hierarchy levels are recognized by the Company at the end of each reporting period. During 2013, 2012, and 2011, there were no transfers of assets measured at fair value between the three levels of fair value hierarchy. The carrying amounts of the Company’s financial instruments, including cash and cash equivalents, receivables and accounts payable approximate their fair values at July 2, 2011June 29, 2013 due to the short-term nature of these instruments. At July 2, 2011June 29, 2013 and July 3, 2010,June 30, 2012, the Company had $164,157,000$2,089,000 and $643,281,000,$337,405,000, respectively, of cash equivalents which were recorded based upon Level 1 criteria. See Note 7 for further discussion of the fair value of the Company’s fixed rate long-term debt instruments and seeNote 10 for a discussion of the fair value of the Company's Pension plan assets. See also Investmentsin this Note 1 for further discussion of the fair value of the Company’s investments in unconsolidated entities.
Derivative financial instruments— Many of the Company’s subsidiaries, on occasion, purchase and sell products in currencies other than their functional currencies. This subjects the Company to the risks associated with fluctuations in foreign currency exchange rates. The Company reduces this risk by utilizing natural hedging (offsetting receivables and payables) as well as by creating offsetting positions through the use of derivative financial instruments, primarily forward foreign exchange contracts with maturities of less than sixty days. The Company continues to have exposure to foreign currency risks to the extent they are not hedged. The Company adjusts all foreign denominated balances and any outstanding foreign exchange contracts to fair market value through the consolidated statements of operations. Therefore, the market risk related to the foreign exchange contracts is offset by the changes in valuation of the underlying items being hedged. The asset or liability representing the fair value of foreign exchange contracts, based upon Level 2 criteria under the fair value measurements standards, is classified in the captions “other current assets” or “accrued expenses and other,” as applicable, in the accompanying consolidated balance sheets and were not material. In addition, the Company did not have material gains or losses related to the forward contracts which are recorded in “other income (expense), net” in the accompanying consolidated statements of operations.
The Company has, from time to time, entered into hedge transactions that convert certain fixed rate debt to variable rate debt. To the extent the Company enters into such hedge transactions, those fair value hedges and the hedged debt are adjusted to current market values through interest expense.
The Company generally does not hedge its investment in its foreign operations. The Company does not enter into derivative financial instruments for trading or speculative purposes and monitors the financial stability and credit standing of its counterparties.
Accounts receivable securitization— The Company has an accounts receivable securitization program whereby the Company may sell receivables in securitization transactions and retain a subordinated interest and servicing rights to those receivables. The securitization program is accounted for as an on-balance sheet financing through the securitization of accounts receivable (see Note 3).
45
AVNET, INC. AND SUBSIDIARIES
NOTES TO CONSOLIDATED FINANCIAL STATEMENTS — (Continued)
Fiscal year— The Company operates on a “52/53 week” fiscal year, which ends on the Saturday closest to June 30th. Fiscal 20112013, 2012, and 20092011 all contained 52 weeks while fiscal 2010 contained 53 weeks. Unless otherwise noted, all references to “fiscal 2011”2013” or any other “year” shall mean the Company’s fiscal year.
Management estimates— The preparation of financial statements in conformity with U.S. generally accepted accounting principles requires management to make estimates and assumptions that affect certain reported amounts of assets and liabilities, disclosure of contingent assets and liabilities at the date of the financial statements and the reported amounts of revenues and expenses during the reporting period. Actual results could differ from those estimates.
Adoption ofRecently issued accounting standardpronouncements —The In December 2011, the Financial Accounting Standards Board (“FASB”("FASB") issued authoritative guidance whichASU No. 2011-11, Disclosures about Offsetting Assets and Liabilities, (“ASU 2011-11”). ASU 2011-11 requires the issueran entity
As a result of the adoption of this accounting standard, the Company recognized the cumulative effect of the change on certain components of equity as of the beginning of the earliest fiscal year presented in the consolidated statements of shareholders’ equity as presented in the following table:
| | | | | | | | | | | | | |
| | | June 28, 2008 | |
| | | As Reported | | | Adjustments | | | As Adjusted | |
| | | (Thousands) | |
Additional paid in capital(1) | | $ | 1,122,852 | | | $ | 43,190 | | | $ | 1,166,042 | |
Retained earnings(2) | | $ | 2,379,723 | | | $ | (35,940 | ) | | $ | 2,343,783 | |
| | |
(1) | | Adjustment represents the value of the equity component of the Debentures, net of deferred taxes. |
|
(2) | | Adjustment represents the accretion of the debt discount, net of tax, over the expected life of the Debentures, which was five years from the date of issuance, or March 2009, because this was the earliest date the holders had a right to exercise their put option. |
| | | | | |
| | | Fiscal Year Ended | |
| Adjustments-increase (decrease) | | June 27, 2009 | |
| | | (Thousands, except | |
| | | per share data) | |
Selling, general and adminstrative expenses(3) | | $ | (291 | ) |
Interest expense(4) | | | 12,185 | |
| Income tax provision | | | (4,644 | ) |
| Net income | | | (7,250 | ) |
| Basic EPS | | $ | (0.05 | ) |
| Diluted EPS | | $ | (0.05 | ) |
| | |
(3) | | Adjustment represents a reduction to deferred financing cost amortization expense as a result of allocating a portion of such costs to the equity component of the Debentures. |
|
(4) | | Adjustment represents incremental non-cash interest expense as a result of accreting the Debenture debt discount. |
46
AVNET, INC. AND SUBSIDIARIES
NOTES TO CONSOLIDATED FINANCIAL STATEMENTS — (Continued)
Recently issued accounting pronouncements— In June 2011, the FASB amended its guidance on the presentation of comprehensive income in financial statements. The amended guidance eliminates the option to present components of other comprehensive income (“OCI”) as part ofdisclose both gross information and net information about both instruments and transactions eligible for offset in the statement of changes in equity. Instead, entities can electfinancial position and instruments and transactions subject to present items of net income and OCI in one continuous statement (a “statement of comprehensive income”), or can electan agreement similar to present these items in two separate but consecutive statements. The guidance, which is effective beginning the Company’s fiscal yeara master netting arrangement. In January 2013, will not have an impact on the Company’s consolidated financial statements as the guidance only relates to changes in financial statement presentation.
In April 2011, the FASB issued ASU No. 2013-01, Scope Clarification of Disclosures about Offsetting Assets and Liabilities, ("ASU 2013-01"), which was issued to limit the scope of the new guidance to achieve common fair value measurement andbalance sheet offsetting disclosure requirements between U.S. generally accepted accounting principles (“U.S. GAAP”)as prescribed by ASU 2011-11. ASU 2011-11 and International Financial Reporting Standards (“IFRS”). This new guidance, whichASU 2013-01 are effective for annual reporting periods beginning on or after January 1, 2013, and interim periods within those annual periods. Retrospective disclosure is effective beginning the Company’s fiscal year 2012, amends current U.S. GAAP fair value measurement and disclosure requirements to include increased transparency around valuation inputs and investment categorization.required for all comparative periods presented. The adoption of this new guidance isASU 2011-11 and ASU 2013-01 are not expected to have a material impact on the Company’s consolidated financial statements.
In February 2013, the FASB issued ASU No. 2013-02, Comprehensive Income (Topic 220), Reporting of Amounts Reclassified Out of Accumulated Other Comprehensive Income, (“ASU 2013-02”). ASU 2013-02 requires entities to report information about reclassifications out of accumulated other comprehensive income ("AOCI") and changes in AOCI balances by component. For significant items reclassified out of AOCI to net income in their entirety in the same reporting period, reporting is required about the effect of the reclassifications on the respective line items in the statement where net income is presented (either on the face of the statement where net income is presented or in the notes). For items that are not reclassified to net income in their entirety in the same reporting period (e.g., pension amounts that are included in inventory), a cross reference to other disclosures is required in the notes. ASU 2013-02 is effective for annual periods and interim periods within those annual periods beginning after December 15, 2012. This ASU is to be applied prospectively and early adoption is permitted. The adoption of ASU 2013-02 will not have a material impact on the Company’s consolidated financial statements, as it only represents a modification of disclosure requirements within the financial statements.
In February 2013, the FASB issued ASU No. 2013-04, Liabilities (Topic 405): Obligations Resulting from Joint and Several Liability Arrangements for Which the Total Amount of the Obligation Is Fixed at the Reporting Date (“ASU 2013-04”). ASU 2013-04 provides guidance for the recognition, measurement and disclosure of obligations resulting from joint and several liability arrangements for which the total amount of the obligation within the scope of this ASU is fixed at the reporting date. The guidance requires an entity to measure those obligations as the sum of the amount the reporting entity agreed to pay on the basis of its arrangement among its co-obligors as well as any additional amount the reporting entity expects to pay on behalf of its co-obligors. ASU 2013-04 also requires an entity to disclose the nature and amount of those obligations. The amendments in this ASU are effective for reporting periods beginning after December 15, 2013, with early adoption permitted. Retrospective application is required. The adoption of ASU 2013-04 is not expected to have a material impact on the Company's consolidated financial statements.
In March 2013, the FASB issued Accounting Standards Update No. 2013-05, Parent's Accounting for the Cumulative Translation Adjustment upon Derecognition of Certain Subsidiaries or Groups of Assets within a Foreign Entity or of an Investment in a Foreign Entity ("ASU No. 2013-05"), which clarifies preexisting guidance regarding the treatment of cumulative translation adjustments when a parent either sells a part or all of its investment in a foreign entity. ASU No. 2013-05 is effective for fiscal years beginning after December 2014, and interim and annual periods thereafter. The Company has reviewed the main provisions of ASU No. 2013-05 and believes that adoption of this update will not have a material impact on the Company's financial position or results of operations.
2. Acquisitions and divestitures
2013Acquisitions
During fiscal 2011, 2010 and 2009,2013, the Company acquired sixteen12 businesses with aggregate annualized revenue of approximately $1.18 billion for a total consideration of $308,951,000, which are presentedconsisted of the following (in thousands):
|
| | | | |
| Cash | | $ | 297,484 |
|
| Contingent consideration | | 11,467 |
|
| Total | | $ | 308,951 |
|
The contingent consideration arrangements stipulate the Company pay up to a maximum of approximately $22,150,000 of additional consideration to the former shareholders of the acquired businesses upon the achievement of certain operating results. The Company estimated the fair value of the contingent consideration using an income approach which is based on significant inputs not observable in the following table.market and thus represents a Level 3 measurement as defined in ASC 820. The Company adjusts the contingent consideration periodically based on changes to the inputs used in the income approach and the accretion of interest associated with the discounted liability.
| | | | | | | | | |
| | | | | Approximate | | | |
| | | | | Annualized | | | Acquisition |
| Acquired Business | | Group & Region | | Revenues (1) | | | Date |
| | | | | (Millions) | | | |
Fiscal 2011 | | | | | | | | |
| itX Group Ltd. | | TS Asia/Pac | | $ | 160 | | | January 2011 |
| Center Cell | | EM Americas | | | 5 | | | November 2010 |
| Eurotone | | EM Asia/Pac | | | 30 | | | October 2010 |
| Broadband | | EM Americas | | | 8 | | | October 2010 |
| Unidux | | EM Asia/Pac | | | 370 | | | July 2010 |
| Tallard Technologies | | TS Americas | | | 250 | | | July 2010 |
| Bell Microproducts Inc. | | EM & TS Americas | | | 3,021 | | | July 2010 |
| | | TS EMEA | | | | | | |
| | | | | | | | | |
Fiscal 2010 | | | | | | | | |
| Servodata HP Division | | TS EMEA | | $ | 20 | | | April 2010 |
| PT Datamation | | TS Asia/Pac | | | 90 | | | April 2010 |
| Sunshine Joint Stock Company | | TS Asia/Pac | | | 30 | | | November 2009 |
| Vanda Group | | TS Asia/Pac | | | 30 | | | October 2009 |
| | | | | | | | | |
Fiscal 2009 | | | | | | | | |
| Abacus Group plc | | EM EMEA | | $ | 400 | | | January 2009 |
| Nippon Denso Industry Co., Ltd. | | EM Asia/Pac | | | 140 | | | December 2008 |
| Ontrack Solutions Pvt. Ltd. | | TS Asia/Pac | | | 13 | | | July 2008 |
| Horizon Technology Group plc | | TS EMEA | | | 400 | | | June 2008 |
| Source Electronics Corporation | | EM Americas | | | 82 | | | June 2008 |
| | |
(1) | | Represents the approximate annual revenue from the acquired businesses’ most recent fiscal year end prior to acquisition by Avnet and based upon average foreign currency exchange rates for those periods. |
47
AVNET, INC. AND SUBSIDIARIES
NOTES TO CONSOLIDATED FINANCIAL STATEMENTS — (Continued)
The Bell and UniduxCash paid for acquisitions and purchase price are described further below. The remaining acquisitions completed during fiscal 2011 were acquired for an aggregate purchase price of $124,678,000,2013 was $262,306,000, net of cash acquired.acquired and holdback reserves.
AlsoThe following table summarizes the estimated fair values of the assets acquired and liabilities assumed at the respective acquisition dates (in thousands):
|
| | | | |
| Cash | | $ | 29,276 |
|
| Accounts receivable, net | | 226,743 |
|
| Inventory | | 91,791 |
|
| Other current assets | | 33,689 |
|
| Property, plant and equipment | | 25,311 |
|
| Other assets | | 47,292 |
|
| Total identifiable assets acquired | | 454,102 |
|
| | | |
| Current liabilities | | (157,986 | ) |
| Long term debt | | (66,367 | ) |
| Other long term liabilities | | (45,640 | ) |
| Total liabilities assumed | | (269,993 | ) |
| Net identifiable assets acquired | | 184,109 |
|
| Goodwill | | 157,521 |
|
| Bargain purchase recognized | | (32,679 | ) |
| Net assets acquired | | $ | 308,951 |
|
The $157,521,000 of goodwill was assigned to the Electronics Marketing and Technology Solutions reportable segments in the amounts of $62,039,000 and $95,482,000, respectively. The goodwill recognized is attributable primarily to expected synergies and the assembled workforce of the acquired businesses. The amount of goodwill that is expected to be deductible for income tax purposes is not significant. The Company periodically adjusts the value of goodwill to reflect changes that occur as a result of adjustments during fiscal 2011, the measurement period following the date of acquisition.
Included in "Other assets" in the above table is $35,248,000 of identifiable intangible assets (see Note 6) related to customer relationships.
The Company acquired accounts receivable, which were recorded at the estimated fair value amounts; however, adjustments to acquired amounts were not significant as book value approximated fair value due to the short nature of accounts receivables. The gross amount of accounts receivable acquired was $228,980,000 and the fair value recorded was $226,743,000, which is expected to be collected.
The Company recognized restructuring and integration charges, and transaction and other costs associated with the2013 acquisitions, all of which were recognized in the consolidated statement of operations and are described further in Note 17.
Supplemental information on an unaudited pro forma basis, as if the acquisitions had been consummated as of July 3, 2011, is presented as follows:
|
| | | | | | | | |
| | | Pro Forma Results For Years Ended |
| | | June 29, 2013 | | June 30, 2012 |
| | | (Thousands) |
| Sales | | $ | 25,771,000 |
| | $ | 26,872,000 |
|
| Net income | | $ | 454,000 |
| | $ | 587,000 |
|
With respect to the businesses acquired during fiscal 2013, the Company is unable to determine the amount of revenue and earnings of each business subsequent to their respective acquisition dates as each business has been integrated with Company entities and operations.
AVNET, INC. AND SUBSIDIARIES
NOTES TO CONSOLIDATED FINANCIAL STATEMENTS — (Continued)
Internix, Inc., a company publicly traded on the Tokyo Stock Exchange, was acquired in the first quarter of fiscal 2013 through a tender offer. After assessing the assets acquired and liabilities assumed, the consideration paid was below book value even though the price paid per share represented a premium to the trading levels at that time. During fiscal 2013, the Company recognized a total gain on bargain purchase related to Internix of $32,679,000 pre- and after tax and $0.23 per share on a diluted basis (inclusive of adjustments occurring subsequent to the acquisition date).
In addition to the acquisitions described above, during fiscal 2013, the Company acquired the remaining non-controlling interest in a consolidated subsidiary for a purchase price that was less than its carrying value. The Company has reflected the difference between the purchase price and the carrying value of the non-controlling interest as additional paid-in capital in the accompanying consolidated statement of shareholders' equity for fiscal 2013.
2012 Acquisitions
During fiscal 2012, the Company acquired 11 businesses for total consideration of $413,585,000, which consisted of the following (in thousands):
|
| | | | |
| Cash | | $ | 390,410 |
|
| Contingent consideration | | 23,175 |
|
| Total | | $ | 413,585 |
|
The contingent consideration arrangements stipulate the Company pay up to a maximum of approximately $124,419,000 of additional consideration to the former shareholders of the acquired businesses upon the achievement of certain operating results. The Company estimated the fair value of the contingent consideration using an income approach which is based on significant inputs not observable in the market and thus represents a Level 3 measurement as defined in ASC 820. The Company adjusts the contingent consideration periodically based on changes to the inputs used in the income approach and the accretion of interest associated with the discounted liability. During fiscal 2013, the Company reversed an earn-out liability related to a 2012 acquisition for which payment is no longer expected to be incurred and recorded a charge of $11,172,000 that is included in "Restructuring, integration and other charges" in the accompanying consolidated statement of operations.
Cash paid for acquisitions during fiscal 2012 was $313,218,000, net of cash acquired and holdback reserves.
The following table summarizes the estimated fair values of the assets acquired and liabilities assumed at the respective acquisition dates (in thousands):
|
| | | | |
| Cash | | $ | 75,016 |
|
| Accounts receivable, net | | 132,195 |
|
| Inventory | | 59,463 |
|
| Other current assets | | 23,936 |
|
| Property, plant and equipment | | 9,729 |
|
| Other assets | | 104,368 |
|
| Total identifiable assets acquired | | 404,707 |
|
| | | |
| Current liabilities | | (230,747 | ) |
| Other long term liabilities | | (2,483 | ) |
| Total liabilities assumed | | (233,230 | ) |
| Net identifiable assets acquired | | 171,477 |
|
| Goodwill | | 246,425 |
|
| Bargain purchase recognized | | (4,317 | ) |
| Net assets acquired | | $ | 413,585 |
|
The $246,425,000 of goodwill was assigned to the Electronics Marketing and Technology Solutions reportable segments in the amounts of $179,989,000 and $66,436,000, respectively. The goodwill recognized is attributable primarily to expected synergies and the assembled workforce of the acquired businesses. The amount of goodwill that is expected to be deductible for income
AVNET, INC. AND SUBSIDIARIES
NOTES TO CONSOLIDATED FINANCIAL STATEMENTS — (Continued)
tax purposes is not significant. The Company periodically adjusts the value of goodwill to reflect changes that occur as a result of adjustments during the measurement period following the date of acquisition.
Included in "Other assets" in the above table is $93,291,000 of identifiable intangible assets (see Note 6).
The Company acquired accounts receivable, which were recorded at the estimated fair value amounts; however, adjustments to acquired amounts were not significant as book value approximated fair value due to the short nature of accounts receivables. The gross amount of accounts receivable acquired was $134,337,000 and the fair value recorded was $132,195,000.
The Company recognized restructuring and integration charges, and transaction and other costs associated with the 2012 acquisitions, all of which were recognized in the consolidated statement of operations and are described further in Note 17.
Supplemental information on an unaudited pro forma basis, as if the acquisitions had been consummated as of July 4, 2010, is presented as follows:
|
| | | | | | | | |
| | | Pro Forma Results For Years Ended |
| | | June 30, 2012 | | July 2, 2011 |
| | | (Thousands) |
| Sales | | $ | 26,052,000 |
| | $ | 27,404,000 |
|
| Net income | | $ | 568,000 |
| | $ | 700,300 |
|
With respect to the businesses acquired during fiscal 2012, the Company is unable to determine the amount of revenue and earnings of each business subsequent to their respective acquisition dates as each business has been integrated with Company entities and operations.
Unidux Electronic Limited, a Singapore publicly traded company, was acquired in January 2012 through a tender offer. After assessing the assets acquired and liabilities assumed, the consideration paid was below book value even though the price paid per share represented a premium to the trading levels at that time. Accordingly, the Company recognized a gain on bargain purchase of $4,317,000 pre- and after tax and $0.03 per share on a diluted basis.
2011 Acquisitions
The Bell Microproducts Inc. ("Bell") and Unidux, Inc. ("Unidux") acquisitions and purchase price are described further below. The remaining acquisitions completed during fiscal 2011 were acquired for an aggregate purchase price of $124,678,000 net of cash acquired. Pro forma financial information is not presented for fiscal 2011 as the Bell acquisition occurred on July 6, 2010, which was three days after the beginning of the Company's fiscal 2011, and the revenue and earnings of the remaining acquisitions are not significant to the consolidated results of operations of the Company.
The Company recognized restructuring and integration charges, and transaction and other costs associated with the 2011 acquisitions, all of which were recognized in the consolidated statement of operations and are described further in Note 17.
Unidux
Unidux, a Japanese publicly traded company, was acquired through a tender offer in whichoffer. At the Company obtained over 95% controlling interest. The non-controlling interest was recorded at fair value but was not material. Thetime of the Company's acquisition of the non-controlling interest in Unidux, was completed during the second quarter of fiscal 2011. As mentioned, Unidux was a publicly traded company whichUnidux's shares were trading below its book value for a period of time. In a tender offer, Avnetvalue. The Company offered a purchase price per share for Unidux that was above the prevailing trading price thereby representing a premium to the then recent trading levels. Even though the purchase price was below book value, 95% of the Unidux shareholders tendered their shares. As a result, the Company acquired Unidux net assets excluding cash of $163,770,000$163,770,000 for a purchase price of $132,780,000,$132,780,000, net of cash acquired, and recognized a gain on bargain purchase of $30,990,000$30,990,000 pre- and after tax and $0.20$0.20 per share on a diluted basis. Prior to recognizing the gain, the Company reassessed the assets acquired and liabilities assumed in the acquisition.
Bell
On July 6, 2010, subsequent to fiscal year 2010, the Company completed its acquisition of Bell, a value-added distributor of storage and server products and solutions and computer components products, providing integration and support services to OEMs, VARs, system builders and end users in the U.S., Canada, EMEA and Latin America. Bell operated both a distribution and single tier reseller business and generated sales of approximately $3.0 billion in calendar 2009, of which 42%, 41% and 17% was generated in North America, EMEA and Latin America, respectively. The consideration for the transaction totaled $255,691,000$255,691,000, which consisted of $7.00$7.00 in cash for each share of Bell common stock outstanding, cash payment for Bell equity awards, and cash
AVNET, INC. AND SUBSIDIARIES
NOTES TO CONSOLIDATED FINANCIAL STATEMENTS — (Continued)
payments required under existing Bell change of control agreements, plus the assumption of $323,321,000$323,321,000 of Bell net debt. Of the debt acquired, Avnetthe Company repaid approximately $209,651,000$209,651,000 of debt (including associated fees) immediately after closing. As of the end of
Divestitures
During fiscal 2011,2013, the Company had completed the integration of Bell into both the EM anddivested a small business in TS operating groups and has achieved its anticipated cost saving synergies,Asia for which the full impactit recognized a loss of the cost savings benefit is expected to be$1,667,000 pre-tax, $1,704,000 after tax and $0.01 per share on a diluted basis, which was reflected in the first quarter of fiscal 2012."Gain on bargain purchase and other."
Preliminary allocation of purchase price
The Bell acquisition was accounted for as a purchase business combination. Assets acquired and liabilities assumed are recordedIncluded in the accompanying consolidated balance sheetcash flows from investing activities for fiscal 2013 were proceeds of $3,613,000, net of cash divested, related to the divestiture that occurred during fiscal 2013 and the receipt of an earn-out payment associated with a divestiture completed in the prior fiscal year, for which there was no gain or loss as the proceeds were applied against the earn-out receivable that was established at their estimated fair values, using management’s estimates and assumptions, asthe time of July 6, 2010 (see following table).sale.
As a result of the evaluation of the fair value of the acquired assets and assumed liabilities, the Company recognized $60,000,000 for an identifiable amortizable intangible asset (see Note 6).
During the second quarter of fiscal 2011,2012, the Company recognized a contingent liabilityloss of $18,000,000 for potential unpaid import duties associated with the former Bell Latin America business. Prior to the acquisition of Bell by Avnet, U.S. Customs and Border Protection (“CBP”) initiated a review of the importing process at one of Bell’s subsidiaries and identified compliance deficiencies. Subsequent to the acquisition of Bell by Avnet, CBP began a compliance audit to identify any duty owed as a result of the prior non-compliance. As of July 2, 2011, the Company continued to evaluate the potential exposure based upon further activities associated with the audit and the Company’s ability to obtain appropriate documentation for certain transactions under audit. The Company has evaluated projected duties, interest and penalties that potentially may be imposed as a result of the audit and, as further information has become available during the fourth quarter of fiscal 2011, the Company reduced the contingent liability from $18,000,000 to $10,000,000, which was recorded to goodwill. Depending on the ultimate resolution of the matter with CBP, the Company estimates the range of the potential exposure associated with this liability may be up to $73 million; however, the Company believes the contingent liability recorded is a reasonable estimate of the liability based upon facts available at this time.
48
AVNET, INC. AND SUBSIDIARIES
NOTES TO CONSOLIDATED FINANCIAL STATEMENTS — (Continued)
The Company acquired accounts receivable which were recorded at the estimated fair value amounts; however, adjustments to acquired amounts were not significant as book value approximated fair value due to the short term nature of accounts receivables. The gross amount of accounts receivable acquired was $381,805,000 and the fair value recorded was $363,589,000, which is expected to be collected.
| | | | | |
| | | July 6, 2010 | |
| | | (Thousands) | |
| Current assets | | $ | 705,986 | |
| Property, plant and equipment | | | 13,022 | |
| Goodwill | | | 224,265 | |
| Identifiable intangible asset | | | 60,000 | |
| Other assets | | | 37,964 | |
| | | | |
| Total assets acquired | | | 1,041,237 | |
| | | | |
| Current liabilities, excluding current portion of long-term debt | | | 396,875 | |
| Long-term liabilities | | | 30,218 | |
| Total debt | | | 358,453 | |
| | | | |
| Total liabilities assumed | | | 785,546 | |
| | | | |
| Net assets acquired | | $ | 255,691 | |
| | | | |
The amount of goodwill associated with the Bell acquisition that is expected to be deductible for tax purposes is not significant.
Significant synergies related to the integration of the acquired Bell business have resulted in operating cost reductions; such expense synergy savings were a primary driver of the excess of purchase price paid over the value of assets and liabilities acquired.
Pro forma results
Unaudited pro forma financial information is presented below as if the acquisition of Bell occurred at the beginning of fiscal 2010. The pro forma information presented below does not purport to present what actual results would have been had the acquisition in fact occurred at the beginning of fiscal 2010, nor does the information project results for any future period. In addition, the pro forma results exclude the impact of any synergies realized as a result of integration activity.
| | | | | |
| | | Pro Forma Results | |
| | | Twelve Months Ended | |
| | | July 3, 2010 | |
| | | (Thousands, except per | |
| | | share data) | |
| Pro forma sales | | $ | 22,291,579 | |
| Pro forma operating income | | | 660,769 | |
| Pro forma net income | | | 404,249 | |
| | | | | |
| Pro forma diluted earnings per share | | $ | 2.64 | |
In order to create the pro forma results in the table above, the combined results for Avnet and Bell for the twelve months ended fiscal 2010 were adjusted for the following:
$8,571,0001,399,000 pre-tax, $6,074,000$854,000 after tax or $0.04and $0.01 per diluted share for fiscal 2010 of intangible asset amortization associated withincluded in "Gain on bargain purchase and other" in the Bell acquisition; and
$5,181,000 pre-tax, $3,168,000 after tax, or $0.02 per diluted share for fiscal 2010 for Bell transaction costs that were expensed upon closing.
Pro forma financial information is not presented for fiscal 2011 because the Bell acquisition occurred on July 6, 2010, which is three days after the beginning of the Company’s fiscal year 2011. The accompanying consolidated statementstatements of operations for the first quarter of fiscal 2011 included sales of $781,135,000 related to a write-down of an investment in a small technology company and the acquired Bell business. Aswrite-off of the end of the second quarter of fiscal 2011, the Company was in the process of integrating the Bell business into the Avnet existing business, which included IT systems integration, and administrative, sales and logistics operations integrations. As a result, after the first quarter of fiscal 2011, the Company was no longer able to identify the acquired Bell business separately from the on-going Avnet business.
49
AVNET, INC. AND SUBSIDIARIES
NOTES TO CONSOLIDATED FINANCIAL STATEMENTS — (Continued)
Prior year acquisition-related exit activity accounted for in purchase accounting
Prior to fiscal 2010, certain restructuring charges were recognized as part of purchase accounting under previous accounting standards. During fiscal 2007 and 2006, the Company recorded certain exit-related liabilities through purchase accounting which consisted of severance for workforce reductions, non-cancelable lease commitments and lease termination charges for leased facilities, and other contract terminationdeferred financing costs associated with the exit activities. early termination of a credit facility.
During fiscal 2011, the Company paid $462,000 in cash associated with these reserves. In addition,completed the Company released $2,258,000 of lease reserves that were determined to be no longer required and recorded the credit to “restructuring, integration and other charges” rather than as a credit to goodwill because the goodwill was impaired in fiscal 2009 (see Note 6). As of July 2, 2011, the total remaining reserve was $2,827,000 which related primarily to facility exit costs and other contractual lease obligations which management expects to be substantially utilized by the end of fiscal 2013.
Investments and divestitures
The Company completed its divestiture of New ProSys Corp. (“ProSys”), a value-added reseller and provider of IT infrastructure solutions. Avnet acquired ProSys as part of the Bell acquisition on July 6, 2010, and announced its intention to sell this business at that time.acquisition. Total consideration included a cash payment at closing, a short-term receivable and a three-year earn-out based upon ProSys’ anticipated results. As a result of the divestiture, the Company received cash proceeds of $19,108,000$19,108,000 and wrote off goodwill associated with the ProSys business (see Note 6).business. No gain or loss was recorded as a result of the divestiture.
Also during fiscal 2011, the Company recognized a loss of $6,308,000$6,308,000 pre-tax, $3,857,000$3,857,000 after tax and $0.02$0.02 per share on a diluted basis included in “Gain on bargain purchase and other” related to the write downwrite-down of prior investments in smaller technology start-up companies (see NotesNote 5 and 6 for other amounts included in “Gain on bargain purchase and other”).
During fiscal 2010, the Company recognized a gain on the sale of assets as a result of certain earn-out provisions associated with the prior sale of the Company’s equity investment in Calence LLC. The gain on sale of assets was $8,751,000 pre-tax, $5,370,000 after tax and $0.03 per share on a diluted basis. In addition, the Company sold a cost method investment and received proceeds of approximately $3,034,000 in the second quarter of fiscal 2010.
During fiscal 2009, the Company recognized a gain on the sale of assets amounting to $14,318,000 pre-tax, $8,727,000 after tax and $0.06 per share as a result of certain earn-out provisions associated with the prior sale of the Company’s equity investment in Calence LLC.
3. Accounts receivable securitization
In August 2010,Pursuant to the Company amended itsCompany's accounts receivable securitization program (the “Program”) with a group of financial institutions, to allowas amended, the Company tomay sell, on a revolving basis, an undivided interest of up to $600,000,000 ($450,000,000 prior to the amendment)$800,000,000 in eligible U.S. receivables while retaining a subordinated interest in a portion of the receivables. The eligible receivables are sold through a wholly-owned bankruptcy-remote special purpose entity that is consolidated for financial reporting purposes. Such eligible receivables are not directly available to satisfy claims of the Company’s creditors. FinancingBecause financing under the Program does not qualify as off-balance sheet financing, as a result, the receivables and related debt obligation remain on the Company’s consolidated balance sheet as amounts are drawn on the Program. The Program has a one yearone-year term that expires at the end of August 20112013, at which time it is expected to be renewed for another year on comparable terms. The Program contains certain covenants, all of which the Company was in compliance with as of June 29, 2013. There were $160,000,000$360,000,000 in borrowings outstanding under the Program at July 2, 2011June 29, 2013 and no amounts outstanding$670,000,000 as of July 3, 2010.June 30, 2012. (See Note 7 for discussion of other short-term and long-term debt outstanding). Interest on borrowings is calculated using a base rate or a commercial paper rate plus a spread of 0.425%0.35%. The facility fee is 0.50%0.35%. Expenses associated with the Program, which were not material in the past three fiscal years, consisted of program, facility and professional fees recorded in selling,"Selling, general and administrative expensesexpenses" in the accompanying consolidated statements of operations.
50
AVNET, INC. AND SUBSIDIARIES4. Shareholders' equity
NOTES TO CONSOLIDATED FINANCIAL STATEMENTS — (Continued)
4. ComprehensiveAccumulated comprehensive income (loss)
The following table illustrates the accumulated balances of comprehensive income (loss) items at June 29, 2013, June 30, 2012, and July 2, 2011 July 3, 2010:
|
| | | | | | | | | | | |
| | June 29,
2013 | | June 30,
2012 | | July 2,
2011 |
| | (Thousands) |
| Accumulated translation adjustments, net | $ | 135,395 |
| | $ | 90,798 |
| | $ | 461,213 |
|
| Accumulated pension liability adjustments, net of income taxes | (106,500 | ) | | (136,630 | ) | | (84,002 | ) |
| Total | $ | 28,895 |
| | $ | (45,832 | ) | | $ | 377,211 |
|
AVNET, INC. AND SUBSIDIARIES
NOTES TO CONSOLIDATED FINANCIAL STATEMENTS — (Continued)
Share repurchase program
In August 2012, the Company's Board of Directors amended the Company's existing share repurchase program to authorize the repurchase of up to $750,000,000 of common stock in the open market or through privately negotiated transactions. The timing and June 27, 2009:actual number of shares purchased will depend on a variety of factors such as price, corporate and regulatory requirements, and prevailing market conditions. During fiscal 2013, the Company repurchased 6,620,000 shares under this program at an average market price of $30.15 per share for a total cost of $199,585,000. This amount differs from the cash used for repurchases of common stock on the consolidated statement of cash flows to the extent repurchases at the end of the fourth quarter of fiscal 2012 were not settled until the first quarter of fiscal 2013. Repurchased shares were retired. Since the beginning of the repurchase program through the end of fiscal 2013, the Company has repurchased 17,890,000 shares of stock at an aggregate cost of $525,525,000, and $224,475,000 remains available for future purchases under the share repurchase program.
| | | | | | | | | | | | | |
| | | July 2, | | | July 3, | | | June 27, | |
| | | 2011 | | | 2010 | | | 2009 | |
| | | (Thousands) | |
| Accumulated translation adjustments, net | | $ | 461,213 | | | $ | 131,329 | | | $ | 290,846 | |
| Accumulated pension liability adjustments, net of income taxes | | | (84,002 | ) | | | (103,967 | ) | | | (72,752 | ) |
| | | | | | | | | | |
| Total | | $ | 377,211 | | | $ | 27,362 | | | $ | 218,094 | |
| | | | | | | | | | |
5. Property, plant and equipment, net
Property, plant and equipment are recorded at cost and consist of the following:
| | | | | | | | | |
| | | July 2, | | | July 3, | |
| | | 2011 | | | 2010 | |
| | | (Thousands) | |
| Land | | $ | 22,467 | | | $ | 20,697 | |
| Buildings | | | 112,072 | | | | 102,875 | |
| Machinery, fixtures and equipment | | | 805,093 | | | | 663,915 | |
| Leasehold improvements | | | 92,728 | | | | 56,686 | |
| | | | | | | |
| | | | 1,032,360 | | | | 844,173 | |
| Less — accumulated depreciation and amortization | | | (613,187 | ) | | | (541,590 | ) |
| | | | | | | |
| | | $ | 419,173 | | | $ | 302,583 | |
| | | | | | | |
|
| | | | | | | |
| | June 29, 2013 | | June 30, 2012 |
| | (Thousands) |
| Land | $ | 24,834 |
| | $ | 19,912 |
|
| Buildings | 124,186 |
| | 102,395 |
|
| Machinery, fixtures and equipment | 933,188 |
| | 865,198 |
|
| Leasehold improvements | 102,378 |
| | 92,131 |
|
| | 1,184,586 |
| | 1,079,636 |
|
| Less — accumulated depreciation and amortization | (691,980 | ) | | (618,406 | ) |
| | $ | 492,606 |
| | $ | 461,230 |
|
Depreciation and amortization expense related to property, plant and equipment was $57,516,000, $49,692,000$88,303,000, $70,645,000 and $50,653,000$57,516,000 in fiscal 2011, 20102013, 2012 and 2009,2011, respectively. In addition,fiscal 2011, the Company recognized other charges of $1,968,000$1,968,000 pre-tax, $1,413,000$1,413,000 after tax and $0.01 $0.01per share on a diluted basis primarily related to an impairment of buildings in EMEA and recorded in "Gain on bargain purchase and other" in the accompanying consolidated statements of operations (see NotesNote 2 and 6 for other amounts included in “Gain on bargain purchase and other”).
6. Goodwill and intangible assets
The following table presents the carrying amount ofchange in the goodwill balances by reportable segment for the periods presented:
| | | | | | | | | | | | | |
| | | Electronics | | | Technology | | | | |
| | | Marketing | | | Solutions | | | Total | |
| | | (Thousands) | |
| Carrying value at July 3, 2010 | | $ | 242,626 | | | $ | 323,683 | | | $ | 566,309 | |
| Additions | | | 100,356 | | | | 244,173 | | | | 344,529 | |
| Adjustments | | | — | | | | (53,565 | ) | | | (53,565 | ) |
| Foreign currency translation | | | 9,888 | | | | 17,911 | | | | 27,799 | |
| | | | | | | | | | |
| Carrying value at July 2, 2011 | | $ | 352,870 | | | $ | 532,202 | | | $ | 885,072 | |
| | | | | | | | | | |
The goodwill additions are a result of the Bell acquisition as well as other businesses that were acquired during fiscal 2011 (see Note 2)year 2013. The Unidux acquisition resulted in $30,990,000 of negative goodwill which was included in “Gain on bargain purchase and other” on the consolidated statement of operations (see Notes 2 and 5 for other amounts included in “Gain on bargain purchase and other”). The adjustments to goodwill resulted from the write off of goodwill as a result of the sale of ProSys (see Note 2) and the recognition of intangible assets associated with an acquisition completed during fiscal 2011 (seeIntangible assetsin this Note 6).
51
AVNET, INC. AND SUBSIDIARIES
NOTES TO CONSOLIDATED FINANCIAL STATEMENTS — (Continued)
The following table presents the gross amount of goodwill and accumulated impairment since fiscal 2009 as of July 3, 2010 and July 2, 2011. All of the accumulated impairment was recognized in fiscal 2009.
| | | | | | | | | | | | | |
| | | Electronics | | | Technology | | | | |
| | | Marketing | | | Solutions | | | Total | |
| | | (Thousands) | |
| Gross goodwill at July 3, 2010 | | $ | 1,287,736 | | | $ | 658,307 | | | $ | 1,946,043 | |
| Accumulated impairment | | | (1,045,110 | ) | | | (334,624 | ) | | | (1,379,734 | ) |
| | | | | | | | | | |
| Carrying value at July 3, 2010 | | $ | 242,626 | | | $ | 323,683 | | | $ | 566,309 | |
| | | | | | | | | | |
| | | | | | | | | | | | | |
| Gross goodwill at July 2, 2011 | | $ | 1,397,980 | | | $ | 866,826 | | | $ | 2,264,806 | |
| Accumulated impairment | | | (1,045,110 | ) | | | (334,624 | ) | | | (1,379,734 | ) |
| | | | | | | | | | |
| Carrying value at July 2, 2011 | | $ | 352,870 | | | $ | 532,202 | | | $ | 885,072 | |
| | | | | | | | | | |
|
| | | | | | | | | | | |
| | Electronics Marketing | | Technology Solutions | | Total |
| | (Thousands) |
| Gross goodwill | $ | 1,590,419 |
| | $ | 889,936 |
| | $ | 2,480,355 |
|
| Accumulated impairment | (1,045,110 | ) | | (334,624 | ) | | (1,379,734 | ) |
| Carrying value at June 30, 2012 | $ | 545,309 |
| | $ | 555,312 |
| | $ | 1,100,621 |
|
| Additions | 55,486 |
| | 109,627 |
| | 165,113 |
|
| Adjustments | 7,185 |
| | (7,185 | ) | | — |
|
| Write-down due to exit of business | (5,408 | ) | | — |
| | (5,408 | ) |
| Foreign currency translation | (742 | ) | | 1,704 |
| | 962 |
|
| Carrying value at June 29, 2013 | $ | 601,830 |
| | $ | 659,458 |
| | $ | 1,261,288 |
|
| | | | | | |
| Gross goodwill | $ | 1,646,940 |
| | $ | 994,082 |
| | $ | 2,641,022 |
|
| Accumulated impairment | (1,045,110 | ) | | (334,624 | ) | | (1,379,734 | ) |
| Carrying value at June 29, 2013 | $ | 601,830 |
| | $ | 659,458 |
| | $ | 1,261,288 |
|
AVNET, INC. AND SUBSIDIARIES
NOTES TO CONSOLIDATED FINANCIAL STATEMENTS — (Continued)
The goodwill additions are a result of businesses acquired during fiscal 2013 (see Note 2) and purchase accounting adjustments to prior year acquisitions that occurred during the purchase price allocation period. The adjustment to goodwill is a result of the transfer of a business unit from TS to EM. During fiscal 2013, the Company recorded a write-down of goodwill of $5,408,000 associated with the exit of a non-integrated business in the EM Americas region that is included in "Restructuring, integration and other expenses" in the accompanying consolidated statement of operations.
The Company performs its annual goodwill impairment test on the first day of its fiscal fourth quarter. In addition, if and when events or circumstances change that would more likely than not reduce the fair value of any of its reporting units below its carrying value, an interim test would be performed. Based upon the Company’s annual impairment tests performed for fiscal 20112013, 2012 and 2010,2011, there was no impairment of goodwill in the respective fiscal years. During fiscal 2009,
The following table presents the Company recognized goodwill and intangible asset impairment charges of $1,411,127,000 pre-tax, $1,376,983,000 after tax and $9.13 per share resulting from an interim impairment test performed at the end of the second quarter and from the annual impairment test performed during the fourth quarter of fiscal 2009. The non-cash charge had no impact on the Company’s compliance with debt covenants, its cash flows or available liquidity, but did have a material impact on its consolidated financial statements.
Fiscal 2009 impairment charges
In the second quarter of fiscal 2009, due to the steady decline in the Company’s market capitalization primarily related to the global economic downturn, the Company determined an interim impairment test was necessary. Based upon the test results, it was determined that the fair values of four of the Company’s six reporting units were below their carrying values as of the end of the second quarter of fiscal 2009. Accordingly, the Company recognized a non-cash goodwill impairment charge of $1,317,452,000 pre-tax, $1,283,308,000 after-tax and $8.51 per share in its second quarter of fiscal 2009 results.
A two step process is used to test for goodwill impairment. The first step is to determine if there is an indication of impairment by comparing the estimated fair value of each reporting unit to its carrying value including existing goodwill. Goodwill is considered impaired if the carrying value of a reporting unit exceeds the estimated fair value. Upon an indication of impairment, a second step is performed to determine the amount of the impairment by determining the implied fair value of all of the reporting unit’s assets and liabilities, including identifiable intangible assets at June 29, 2013and comparing the implied fair value of goodwill with its carrying value. The determination of fair valueJune 30, 2012, respectively. These balances are included in both step one"other assets" and step two utilized Level 3 criteria under fair value measurement standards.
To estimate the fair value of its reporting units for step one, the Company utilized a combination of income and market approaches. The income approach, specifically a discounted cash flow methodology, included assumptions for, among others, forecasted revenues, gross profit margins, operating profit margins, working capital cash flow, perpetual growth rates and long term discount rates, all of which require significant judgments by management. These assumptions took into account the recessionary environment at the time the test was being performed and its impact on the Company’s business. In addition, the Company utilized a discount rate appropriate to compensate for the additional risk in the equity markets regarding the Company’s future cash flows in order to arrive at a control premium considered supportable based upon historical comparable transactions.
52
AVNET, INC. AND SUBSIDIARIES
NOTES TO CONSOLIDATED FINANCIAL STATEMENTS — (Continued)
The results of step one indicated that the goodwill related to the EM Asia, TS EMEA and TS Asia reporting units was fully impaired. Therefore, the Company only performed step two of the impairment analysis for its EM Americas reporting unit. Step two of the impairment test required the Company to fair value all of the reporting unit’s assets and liabilities, including identifiable intangible assets, and compare the implied fair value of goodwill to its carrying value. The results of step two indicated that the goodwill in the EM Americas reporting unit was also fully impaired.
During the fourth quarter of fiscal 2009, the Company performed its annual goodwill impairment test which indicated that three of its six reporting units, including EM Asia and TS EMEA, continued to have fair values below their carrying values. As a result, the Company was required to recognize the impairment of additional goodwill which arose subsequent to the second quarter of fiscal 2009 in the EM Asia and TS EMEA reporting units. Of the non-cash goodwill impairment charges of $62,282,000 pre- and after tax and $0.41 per share recognized in the fourth quarter, $41,433,000 related to the business acquired in Japan in the third quarter of fiscal 2009, which was assigned to the EM Asia reporting unit. Accounting standards require goodwill from an acquisition to be assigned to a reporting unit and also requires goodwill to be tested on a reporting unit level, not by individual acquisition. As noted above, the annual impairment analysis indicated that the fair value of the EM Asia reporting unit continued to be below its carrying value. As a result, the goodwill from the acquisition was required to be impaired. The remaining $20,849,000 of the impairment charges related to additional goodwill in the TS EMEA reporting unit primarily as a result of final acquisition adjustments during the purchase price allocation period related to an acquisition for which the goodwill had been fully impaired in the second quarter of fiscal 2009.
Intangible assets
As of July 2, 2011, “Other assets” included customer relationship intangible assets with a carrying value of $124,662,000; consisting of $170,417,000 in original cost value and $45,755,000 of accumulated amortization and foreign currency translation. These assets are being amortized over a weighted average life of eight8 years. During fiscal 2011, the Company recognized $89,372,000 in intangible assets associated with acquisitions completed during fiscal 2011.
|
| | | | | | | | | | | | | | | | | | | | | | | |
| | June 29, 2013 | | June 30, 2012 |
| | Gross Carrying Amount | | Accumulated Amortization | | Net Book Value | | Gross Carrying Amount | | Accumulated Amortization | | Net Book Value |
| | (Thousands) |
| Customer relationships | $ | 272,312 |
| | $ | (107,636 | ) | | $ | 164,676 |
| | $ | 248,105 |
| | $ | (76,645 | ) | | $ | 171,460 |
|
| Customer lists | 3,795 |
| | (2,310 | ) | | 1,485 |
| | 3,690 |
| | (1,279 | ) | | 2,411 |
|
| Trade name | 3,320 |
| | (480 | ) | | 2,840 |
| | 3,820 |
| | (970 | ) | | 2,850 |
|
| Other | 4,177 |
| | (966 | ) | | 3,211 |
| | 5,052 |
| | (434 | ) | | 4,618 |
|
| | $ | 283,604 |
| | $ | (111,392 | ) | | $ | 172,212 |
| | $ | 260,667 |
| | $ | (79,328 | ) | | $ | 181,339 |
|
Intangible asset amortization expense was $21,240,000, $8,629,000$32,343,000, $27,717,000 and $12,272,000 in$21,240,000 for fiscal 2011, 20102013, 2012 and 2009,2011 respectively. AmortizationThe following table presents the estimated future amortization expense for the next five fiscal years is expected to be approximately $21,000,000 each year for fiscal 2012 through 2015 and $16,000,000 for 2016.(in thousands):
During fiscal 2009, the Company evaluated the recoverability of its long-lived assets at each of the reporting units where goodwill was deemed to be impaired. Based upon this evaluation, which utilized Level 3 criteria under fair value measurement standards, the Company determined that certain of its amortizable intangible assets were impaired. As a result, the Company recognized a non-cash intangible asset impairment charge of $31,393,000 pre- and after tax and $0.21 per share during the second quarter of fiscal 2009. In conjunction with the annual goodwill impairment test, the Company again evaluated the recoverability of its long-lived assets during the fourth quarter of fiscal 2009 and determined that no impairment had occurred. |
| | | |
| Fiscal Year | |
| 2014 | $ | 35,564 |
|
| 2015 | 34,294 |
|
| 2016 | 28,647 |
|
| 2017 | 26,479 |
|
| 2018 | 15,278 |
|
7. External financing
Short-term debt consists of the following:
| | | | | | | | | |
| | | July 2, | | | July 3, | |
| | | 2011 | | | 2010 | |
| | | (Thousands) | |
| Bank credit facilities | | $ | 81,951 | | | $ | 35,617 | |
| Borrowings under the accounts receivable securitization program | | | 160,000 | | | | — | |
| Other debt due within one year | | | 1,128 | | | | 932 | |
| | | | | | | |
| Short-term debt | | $ | 243,079 | | | $ | 36,549 | |
| | | | | | | |
|
| | | | | | | |
| | June 29, 2013 | | June 30, 2012 |
| | (Thousands) |
| Bank credit facilities | $ | 177,118 |
| | $ | 201,390 |
|
| Borrowings under the accounts receivable securitization program (see Note 3) | 360,000 |
| | 670,000 |
|
| Current portion of long-term debt | 299,950 |
| | — |
|
| Other debt due within one year | 1,122 |
| | 1,014 |
|
| Short-term debt | $ | 838,190 |
| | $ | 872,404 |
|
Bank credit facilities consist of various committed and uncommitted lines of credit with financial institutions utilized primarily to support the working capital requirements of foreign operations. The weighted average interest rate on the bank credit facilities was 7.8%4.3% and 4.0%6.1% at the end of fiscal 20112013 and 2010,2012, respectively. In connection with acquisitions completed in fiscal 2011 (see Note 2), the Company assumed debt
Table of $420,259,000, of which $211,933,000 was repaid (including associated fees) at the acquisition dates. As of the end of the fiscal 2011, the outstanding balances associated with the assumed debt and credit facilities consisted of $16,627,000 in bank credit facilities and other debt primarly used to support the acquired foreign operations. The total debt assumed during fiscal 2011 included the 3.75% Notes due March 2024 acquired from Bell which had a fair value of $110,000,000 and that has substantially been repaid as is discussed further below.Contents 53
AVNET, INC. AND SUBSIDIARIES
NOTES TO CONSOLIDATED FINANCIAL STATEMENTS — (Continued)
In August 2010,See Note 3 for the Company amended itsdiscussion of the accounts receivable securitization program (the “Program”) with a group of financial institutions to allow the Company to sell, on a revolving basis, an undivided interest of up to $600,000,000 ($450,000,000 prior to the amendment) in eligible receivables while retaining a subordinated interest in a portion of the receivables. The Program does not qualify for sale treatment and as a result, anyassociated borrowings under the Program are recorded as debt on the consolidated balance sheet. The Program contains certain covenants, all of which the Company was in compliance with as of July 2, 2011. The Program has a one year term that expires in August 2011 which is expected to be renewed for another year on comparable terms. There were $160,000,000 in borrowings outstanding under the Program at July 2, 2011 and no amounts outstanding at July 3, 2010. Interest on borrowings is calculated using a base rate or a commercial paper rate plus a spread of 0.425%. The facility fee is 0.50%.outstanding.
Long-term debt consists of the following:
| | | | | | | | | |
| | | July 2, | | | July 3, | |
| | | 2011 | | | 2010 | |
| | | (Thousands) | |
| 5.875% Notes due March 15, 2014 | | $ | 300,000 | | | $ | 300,000 | |
| 6.00% Notes due September 1, 2015 | | | 250,000 | | | | 250,000 | |
| 6.625% Notes due September 15, 2016 | | | 300,000 | | | | 300,000 | |
| 5.875% Notes due June 15, 2020 | | | 300,000 | | | | 300,000 | |
| Other long-term debt | | | 126,512 | | | | 97,217 | |
| | | | | | | |
| Subtotal | | | 1,276,512 | | | | 1,247,217 | |
| Discount on notes | | | (3,003 | ) | | | (3,536 | ) |
| | | | | | | |
| Long-term debt | | $ | 1,273,509 | | | $ | 1,243,681 | |
| | | | | | | |
|
| | | | | | | |
| | June 29, 2013 | | June 30, 2012 |
| | (Thousands) |
| 5.875% Notes due March 15, 2014 | $ | — |
| | $ | 300,000 |
|
| 6.00% Notes due September 1, 2015 | 250,000 |
| | 250,000 |
|
| 6.625% Notes due September 15, 2016 | 300,000 |
| | 300,000 |
|
| 5.875% Notes due June 15, 2020 | 300,000 |
| | 300,000 |
|
| 4.875% Notes due December 1, 2022 | 350,000 |
| | — |
|
| Other long-term debt | 9,579 |
| | 124,456 |
|
| Subtotal | 1,209,579 |
| | 1,274,456 |
|
| Discount on notes | (2,586 | ) | | (2,471 | ) |
| Long-term debt net of current portion | $ | 1,206,993 |
| | $ | 1,271,985 |
|
In June 2010,November 2012, the Company issued $300,000,000$350,000,000 of 5.875%4.875% Notes due June 15, 2020.December 1, 2022. The Company received proceeds of $296,469,000$349,258,000 from the offering, net of discount, and paid $2,275,000 in underwriting fees. The 5.875%4.875% Notes due 20202022 rank equally in right of payment with all existing and future senior unsecured debt and interest iswill be payable in cash semi-annually in arrears on June 151 and December 15.1.
The Company has a five-year $500,000,000$1.0 billion senior unsecured revolving credit facility (the “Credit Agreement”"2012 Credit Facility") with a syndicate of banks, which expires in September 2012.November 2016. Under the 2012 Credit Agreement,Facility, the Company may electselect from various interest rate options, currencies and maturities. The 2012 Credit AgreementFacility contains certain covenants, all of which the Company was in compliance with as of July 2, 2011. As of the end of fiscal 2011,June 29, 2013. At June 29, 2013, there were $122,093,000 in borrowings outstandingof $6,700,000 under the 2012 Credit AgreementFacility included in “other“Other long-term debt” in the consolidated financial statements.preceding table. In addition, there were $16,602,000 in letters of credit aggregating $2,309,000issued under the 2012 Credit AgreementFacility, which representrepresents a utilization of the 2012 Credit AgreementFacility capacity but are not recorded in the consolidated balance sheet as the letters of credit are not debt. At July 3, 2010,June 30, 2012, there were $93,682,000 in borrowings of $110,072,000 outstanding under the 2012 Credit Agreement and $8,597,000 in letters of credit issued under the Credit Agreement.
As a result of the acquisition of Bell, the Company assumed 3.75% Notes due March 2024 which had a fair value of $110,000,000 and that were convertible into Bell common stock; however, as of the acquisition completion date, the debt was no longer convertible into shares. Under the terms of the 3.75% Notes, the Company could have redeemed some or all of the 3.75% Notes for cash anytime on or after March 5, 2011 and the note holders could have required the Company to purchase for cash some or all of the 3.75% Notes on March 5, 2011, March 5, 2014 or March 5, 2019 at a redemption price equal to 100% of the principal amount plus interest. During the first quarter of fiscal 2011, the Company issued a tender offer for the 3.75% Notes for which $5,205,000 was tendered and paid in September 2010. During the third quarter of fiscal 2011, the note holders tendered substantially all of the remaining notes for which $104,395,000 was paid in March 2011. The remaining $400,000 that was not tendered wereFacility included in “other“Other long-term debt” in the preceeding table.
54
AVNET, INC. AND SUBSIDIARIESpreceding table and there were letters of credit aggregating $17,202,000 issued.
NOTES TO CONSOLIDATED FINANCIAL STATEMENTS — (Continued)
Aggregate debt maturities for fiscal 20122014 through 20162018 and thereafter are as follows (in thousands):
| | | | | |
|
| 2012 | | $ | 243,079 | |
| 2013 | | | 124,545 | |
| 2014 | | | 301,646 | |
| 2015 | | | 321 | |
| 2016 | | | 250,000 | |
| Thereafter | | | 600,000 | |
| | | | |
| Subtotal | | | 1,519,591 | |
| Discount on notes | | | (3,003 | ) |
| | | | |
| Total debt | | $ | 1,516,588 | |
| | | | |
|
| | | |
| 2014 | $ | 838,240 |
|
| 2015 | 1,193 |
|
| 2016 | 257,552 |
|
| 2017 | 300,434 |
|
| 2018 | — |
|
| Thereafter | 650,400 |
|
| Subtotal | 2,047,819 |
|
| Discount on notes | (2,636 | ) |
| Total debt | $ | 2,045,183 |
|
At July 2, 2011,June 29, 2013, the carrying value and fair value of the Company’s debt was $1,516,588,000$2,045,183,000 and $1,626,394,000,$2,130,294,000, respectively. Fair value was estimated primarily based upon quoted market prices.prices for the Company's long-term notes.
AVNET, INC. AND SUBSIDIARIES
NOTES TO CONSOLIDATED FINANCIAL STATEMENTS — (Continued)
8. Accrued expenses and other
Accrued expenses and other consist of the following:
| | | | | | | | | |
| | | July 2, | | | July 3, | |
| | | 2011 | | | 2010 | |
| | | (Thousands) | |
| Payroll, commissions and related accruals | | $ | 320,958 | | | $ | 212,830 | |
| Income taxes (Note 9) | | | 72,495 | | | | 100,422 | |
Other(1) | | | 279,563 | | | | 227,524 | |
| | | | | | | |
| | | $ | 673,016 | | | $ | 540,776 | |
| | | | | | | |
|
| | | | | | | |
| | June 29, 2013 | | June 30, 2012 |
| | (Thousands) |
| Payroll, commissions and related accruals | $ | 291,561 |
| | $ | 279,454 |
|
| Income taxes (Note 9) | 54,039 |
| | 85,025 |
|
Other(1) | 359,502 |
| | 331,004 |
|
| | $ | 705,102 |
| | $ | 695,483 |
|
| | |
| (1) | | Includes restructuring reserves recorded through purchase accounting and through “restructuring,related to restructuring, integration and other charges”charges (see Notes 2 andNote 17). Amounts presented in this caption were individually not significant. |
55
AVNET, INC. AND SUBSIDIARIES
NOTES TO CONSOLIDATED FINANCIAL STATEMENTS — (Continued)
9. Income taxes
The components of the provision for income taxes are indicated in the table below. The tax provision for deferred income taxes results from temporary differences arising principally from inventory valuation, accounts receivable valuation, net operating losses, certain accruals and depreciation, net of any changes to the valuation allowance.
| | | | | | | | | | | | | |
| | | Years Ended | |
| | | July 2, | | | July 3, | | | June 27, | |
| | | 2011 | | | 2010 | | | 2009 | |
| | | (Thousands) | |
| Current: | | | | | | | | | | | | |
| Federal | | $ | 64,476 | | | $ | 61,892 | | | $ | 69,835 | |
| State and local | | | 11,724 | | | | 9,789 | | | | 7,689 | |
| Foreign | | | 109,731 | | | | 56,608 | | | | 50,007 | |
| | | | | | | | | | |
| Total current taxes | | | 185,931 | | | | 128,289 | | | | 127,531 | |
| | | | | | | | | | |
| Deferred: | | | | | | | | | | | | |
| Federal | | | 41,029 | | | | 24,251 | | | | (55,743 | ) |
| State and local | | | 5,273 | | | | 1,290 | | | | (5,250 | ) |
| Foreign | | | (30,336 | ) | | | 20,883 | | | | (31,794 | ) |
| | | | | | | | | | |
| Total deferred taxes | | | 15,966 | | | | 46,424 | | | | (92,787 | ) |
| | | | | | | | | | |
| Provision for income taxes | | $ | 201,897 | | | $ | 174,713 | | | $ | 34,744 | |
| | | | | | | | | | |
|
| | | | | | | | | | | |
| | Years Ended |
| | June 29, 2013 | | June 30, 2012 | | July 2, 2011 |
| | (Thousands) |
| Current: | | | | | |
| Federal | $ | 17,212 |
| | $ | 94,237 |
| | $ | 64,476 |
|
| State and local | 7,034 |
| | 19,466 |
| | 11,724 |
|
| Foreign | 84,965 |
| | 98,278 |
| | 109,731 |
|
| Total current taxes | 109,211 |
| | 211,981 |
| | 185,931 |
|
| Deferred: | | | | | |
| Federal | 2,619 |
| | 6,896 |
| | 41,029 |
|
| State and local | 2,390 |
| | 758 |
| | 5,273 |
|
| Foreign | (15,028 | ) | | 4,128 |
| | (30,336 | ) |
| Total deferred taxes | (10,019 | ) | | 11,782 |
| | 15,966 |
|
| Provision for income taxes | $ | 99,192 |
| | $ | 223,763 |
| | $ | 201,897 |
|
The provision for income taxes noted above is computed based upon the split of income (loss) before income taxes from U.S. and foreign operations. U.S. income (loss) before income taxes was $273,287,000, $241,029,000$174,000,000, $320,333,000 and ($733,915,000)$273,287,000 and foreign income (loss) before income taxes was $597,679,000, $344,054,000$375,265,000, $470,449,000 and ($361,053,000)$597,679,000 in fiscal 2011, 20102013, 2012 and 2009,2011, respectively.
A reconciliation betweenAVNET, INC. AND SUBSIDIARIES
NOTES TO CONSOLIDATED FINANCIAL STATEMENTS — (Continued)
Reconciliations of the federal statutory tax rate andto the effective tax rate isrates are as follows:
| | | | | | | | | | | | | |
| | | Years Ended |
| | | July 2, | | July 3, | | June 27, |
| | | 2011 | | 2010 | | 2009 |
| Federal statutory rate | | | 35.0 | % | | | 35.0 | % | | | (35.0 | )% |
| State and local income taxes, net of federal benefit | | | 1.5 | | | | 1.2 | | | | 0.3 | |
| Foreign tax rates, net of valuation allowances | | | (5.3 | ) | | | (6.6 | ) | | | (2.0 | ) |
| Release of valuation allowance, net of U.S. tax expense (as discussed below) | | | (7.4 | ) | | | — | | | | — | |
| Change in contingency reserves | | | 1.4 | | | | 2.6 | | | | 1.1 | |
| Tax audit settlements | | | (0.4 | ) | | | (1.6 | ) | | | (2.9 | ) |
| Impairment charges | | | — | | | | — | | | | 41.9 | |
| Other, net | | | (1.6 | ) | | | (0.7 | ) | | | (0.2 | ) |
| | | | | | | | | | | | | |
| Effective tax rate | | | 23.2 | % | | | 29.9 | % | | | 3.2 | % |
| | | | | | | | | | | | | |
|
| | | | | | | | |
| | Years Ended |
| | June 29, 2013 | | June 30, 2012 | | July 2, 2011 |
| Federal statutory rate | 35.0 | % | | 35.0 | % | | 35.0 | % |
| State and local income taxes, net of federal benefit | 1.1 |
| | 1.8 |
| | 1.5 |
|
| Foreign tax rates, net of valuation allowances | (7.2 | ) | | (5.4 | ) | | (5.3 | ) |
| Release of valuation allowance, net of U.S. tax expense (as discussed below) | (6.4 | ) | | (2.8 | ) | | (7.4 | ) |
| Change in contingency reserves | 0.4 |
| | 0.5 |
| | 1.4 |
|
| Tax audit settlements | (6.0 | ) | | (1.0 | ) | | (0.4 | ) |
| Other, net | 1.2 |
| | 0.2 |
| | (1.6 | ) |
| Effective tax rate | 18.1 | % | | 28.3 | % | | 23.2 | % |
Foreign tax rates generally consist of the impact of the difference between foreign and federal statutory rates applied to foreign income (losses)or loss and also include the impact of valuation allowances against the Company’sCompany's otherwise realizable foreign loss carry-forwards.
Avnet’s effective tax rate on income before income taxes was 23.2%18.1% in fiscal 20112013 as compared with an effective tax rate of 29.9%28.3% in fiscal 2010. As compared to fiscal 2010,2012. Included in the fiscal 20112013 effective tax rate was primarily impacted byis a net tax benefit related toof $50,376,000, which is comprised of (i) a tax benefit of $41,572,000 for the release of a tax valuation allowance (reserve) on certainagainst deferred tax assets whichthat were determined to be realizable, primarily related to a legal entity in EMEA (discussed further below), (ii) net favorable audit settlements resulting in a benefit of $33,182,000, partially offset by (iii) a tax provision of $24,378,000 primarily related to the establishment of a valuation allowance against deferred tax assets that were determined to be unrealizable during fiscal 2013. The fiscal 2013 effective tax rate is lower than the fiscal 2012 effective tax rate primarily due to a favorable impact from audit settlements and, to a lesser extent, net favorablea greater impact to the rate from the valuation allowance released in fiscal 2013 (as discussed further below) as compared with the amount released in fiscal 2012 due to the reduced level of income and mix of income in the current year. In fiscal 2012, withholding tax audit settlements, partially offset by changes to existing tax positions. Excluding the benefit related to legal entity reorganization resulted in an increase to the release ofrate that does not exist in the tax valuation allowance, the effective tax rate for fiscal 2011 would have been 30.6%.
56
AVNET, INC. AND SUBSIDIARIEScurrent year.
NOTES TO CONSOLIDATED FINANCIAL STATEMENTS — (Continued)
During fiscal 2011,2013, the Company had a full taxpartial valuation allowance against significant tax assets related to a legal entity in EMEA due to, among several other factors, a history of losses in that entity. Recently,Since fiscal 2010, the entity has been experiencing improved earnings, which has required the partial release of the valuation allowance to the extent the entity hadhas projected taxable income duringincome. In each of the first three quarters of fiscal 2011. Therefore, the release of valuation allowance, net of the U.S. tax expense, positively impacted the Company’s effective tax rate. In addition, during the fourth quarter of fiscal 2011,2013 and 2012, the Company determined a portion of the tax valuation allowance for this legal entity was no longer required due to the expected continuation of improved earnings in the foreseeable future and, as a result, the Company’sCompany's effective tax rate was positively impacted (decreased) upon the release of the tax valuation allowance, net of the U.S. tax expense. In fiscal 2013 and 2012, the valuation allowance released associated with this EMEA legal entity was $27,055,000 and $22,127,000, respectively, net of the U.S. tax expense associated with the release. The Company will continue to evaluate the need for a valuation allowance against these tax assets and may release additionalwill adjust the valuation allowance associated with this entityas deemed appropriate which, when adjusted, will result in an impact to the future.effective tax rate. Factors that are considered in such an evaluation include historic levels of income, expectations and risk associated with estimates of future taxable income and ongoing prudent and feasible tax planning strategies. Excluding the benefit in both fiscal years related to the release of the tax valuation allowance associated with the EMEA legal entity, the effective tax rate for fiscal 2013 would have been 23.0% as compared with 31.1% for fiscal 2012.
During fiscal 2013, the Company's effective tax rate was favorably impacted primarily by the settlement of two audits by the U.S. Internal Revenue Service ("IRS") for the Company and an acquired company. As a result, the Company recognized a tax benefit of $33,005,000 in fiscal 2013.
Avnet’s effective tax rate on income before income taxes was 29.9%28.3% in fiscal 20102012 as compared with an effective tax rate of 3.2%23.2% in fiscal 2009. The2011. As compared with fiscal 20092011, the fiscal 2012 effective tax rate was impacted by non-deductible impairment chargesis higher than the fiscal 2011 effective tax rate primarily due to a lower amount of valuation allowance released in fiscal 2012 as compared with the amount released in fiscal 2011, and, to a changelesser extent, a more favorable impact from audit settlements and changes to estimates for existing tax positions netin fiscal 2012 as compared with fiscal 2011. These favorable impacts were partially offset by withholding tax in fiscal 2012.
AVNET, INC. AND SUBSIDIARIES
NOTES TO CONSOLIDATED FINANCIAL STATEMENTS — (Continued)
The significant components of deferred tax assets and liabilities, included primarily in “other assets” on the consolidated balance sheets, are as follows:
| | | | | | | | | |
| | | July 2, | | | July 3, | |
| | | 2011 | | | 2010 | |
| | | (Thousands) | |
| Deferred tax assets: | | | | | | | | |
| Inventory valuation | | $ | 13,680 | | | $ | 8,276 | |
| Accounts receivable valuation | | | 27,916 | | | | 24,264 | |
| Federal, state and foreign tax loss carry-forwards | | | 394,093 | | | | 361,988 | |
| Various accrued liabilities and other | | | 57,686 | | | | 101,254 | |
| | | | | | | |
| | | | 493,375 | | | | 495,782 | |
| Less — valuation allowance | | | (310,772 | ) | | | (331,423 | ) |
| | | | | | | |
| | | | 182,603 | | | | 164,359 | |
| |
| Deferred tax liabilities: | | | | | | | | |
| Depreciation and amortization of property, plant and equipment | | | (43,302 | ) | | | (23,177 | ) |
| | | | | | | |
| Net deferred tax assets | | $ | 139,301 | | | $ | 141,182 | |
| | | | | | | |
|
| | | | | | | |
| | June 29, 2013 | | June 30, 2012 |
| | (Thousands) |
| Deferred tax assets: | | | |
| Inventory valuation | $ | 19,509 |
| | $ | 13,298 |
|
| Accounts receivable valuation | 27,185 |
| | 29,984 |
|
| Federal, state and foreign tax loss carry-forwards | 333,940 |
| | 304,410 |
|
| Various accrued liabilities and other | 33,031 |
| | 88,792 |
|
| | 413,665 |
| | 436,484 |
|
| Less — valuation allowance | (230,821 | ) | | (244,093 | ) |
| | 182,844 |
| | 192,391 |
|
| Deferred tax liabilities: | | | |
| Depreciation and amortization of property, plant and equipment | (50,469 | ) | | (54,745 | ) |
| Net deferred tax assets | $ | 132,375 |
| | $ | 137,646 |
|
The change in the valuation allowance from fiscal 20102012 to fiscal 20112013 was a combination of (i) a net reduction of $76,055,000$41,572,000 primarily due to the previously mentioned release of valuation allowance in EMEA, $31,867,000of which $64,215,000 impacted the effective tax rate and $11,840,000 did not impactwhile the effective tax rate becauseremainder was offset in deferred income taxes, and income tax payables associated with the release of the valuation allowance were recorded which offset(ii) a portion of the benefit as a result of the release and (ii) annet increase of $55,404,000$28,300,000 primarily related primarily to the translation impactadditional valuation allowances for newly acquired companies and companies with a history of foreign currency exchange rates and acquired valuation allowances.losses.
As of July 2, 2011,June 29, 2013, the Company had foreign net operating loss carry-forwards of approximately $1,333,787,000,$1,186,832,000, of which $37,065,000$43,463,000 will expire during fiscal 20122014 and 2013,2015, substantially all of which have full valuation allowances, $289,220,000$238,701,000 have expiration dates ranging from fiscal 20142016 to 20312033 and the remaining $1,007,502,000$904,668,000 have no expiration date. The carrying value of the Company’s net operating loss carry-forwards is dependent upon the Company’s ability to generate sufficient future taxable income in certain tax jurisdictions. In addition, the Company considers historic levels of income, expectations and risk associated with estimates of future taxable income and on-goingongoing prudent and feasible tax planning strategies in assessing a tax valuation allowance.
57
AVNET, INC. AND SUBSIDIARIES
NOTES TO CONSOLIDATED FINANCIAL STATEMENTS — (Continued)
Accruals for income tax contingencies (or accruals for unrecognized tax benefits)benefits are included in “accrued expenses and other” and “other long term liabilities” on the consolidated balance sheet. These contingency reserves relate to various tax matters that result from uncertainties in the application of complex income tax regulations in the numerous jurisdictions in which the Company operates. The change to contingency reserves during fiscal 20112013 is primarily due to the addition of acquired reserves as a result of fiscal 2011 acquisitions and favorable non-cash audit settlements, both of which are included in the “additions/reductions“reductions for tax positions taken in prior periods” captions in the following table. The change to contingency reserves during fiscal 2010 is primarily due to the recognition of uncertainties in current year tax positions. In addition, the change to reserves in fiscal 2010 was also impacted by a change to estimates for existing tax positions and favorable non-cash audit settlements, both of which are included in the “additions/reductions for tax positions taken in prior periods” captionscaption in the following table. As of July 2, 2011,June 29, 2013, unrecognized tax benefits were $175,151,000,$123,930,000, of which approximately $111,299,000,$117,708,000, if recognized, would favorably impact the effective tax rate and the remaining balance would be substantially offset by valuation allowances. As of July 3, 2010,June 30, 2012, unrecognized tax benefits were $132,828,000,$146,626,000, of which approximately $88,811,000,$126,933,000, if recognized, would favorably impact the effective tax rate, and the remaining balance would be substantially offset by valuation allowances. In accordance with the Company’s accounting policy, accrued interest and penalties, if any, related to unrecognized tax benefits are recorded as a component of income tax expense. The accrual for unrecognized tax benefits included accrued interest expense and penalties of $24,640,000$24,979,000 and $18,308,000,$24,664,000, net of applicable state tax benefit, as of the end of fiscal 20112013 and 2010,2012, respectively.
A reconciliation
AVNET, INC. AND SUBSIDIARIES
NOTES TO CONSOLIDATED FINANCIAL STATEMENTS — (Continued)
Reconciliations of the beginning and ending accrual balancebalances for unrecognized tax benefits isare as follows:
| | | | | | | | | |
| | | July 2, 2011 | | | July 3, 2010 | |
| | | (Thousands) | |
| Balance at beginning of year | | $ | 132,828 | | | $ | 135,891 | |
| Additions for tax positions taken in prior periods, including interest | | | 40,218 | | | | 32,723 | |
| Reductions for tax positions taken in prior periods, including interest | | | (16,837 | ) | | | (33,168 | ) |
| Additions for tax positions taken in current period | | | 11,041 | | | | 4,970 | |
| Reductions related to cash settlements with taxing authorities | | | (616 | ) | | | (96 | ) |
| Reductions related to the lapse of statute of limitations | | | (1,565 | ) | | | (2,006 | ) |
| Additions (reductions) related to foreign currency translation | | | 10,082 | | | | (5,486 | ) |
| | | | | | | |
| Balance at end of year | | $ | 175,151 | | | $ | 132,828 | |
| | | | | | | |
|
| | | | | | | |
| | June 29, 2013 | | June 30, 2012 |
| | (Thousands) |
| Balance at beginning of year | $ | 146,626 |
| | $ | 175,151 |
|
| Additions for tax positions taken in prior periods, including interest | 11,732 |
| | 19,262 |
|
| Reductions for tax positions taken in prior periods, including interest | (33,776 | ) | | (35,898 | ) |
| Additions for tax positions taken in current period | 7,445 |
| | 8,179 |
|
| Reductions related to cash settlements with taxing authorities | (9,064 | ) | | (7,460 | ) |
| Reductions related to the lapse of statute of limitations | (2,812 | ) | | (3,810 | ) |
| Additions (reductions) related to foreign currency translation | 3,779 |
| | (8,798 | ) |
| Balance at end of year | $ | 123,930 |
| | $ | 146,626 |
|
The evaluation of income tax positions requires management to estimate the ability of the Company to sustain its position and estimate the final benefit to the Company. To the extent that these estimates do not reflect the actual outcome there could be an impact on the consolidated financial statements in the period in which the position is settled, the statute of limitations expire or new information becomes available as the impact of these events are recognized in the period in which they occur. It is difficult to estimate the period in which the amount of a tax position will change as settlement may include administrative and legal proceedings whose timing the Company cannot control. The effects of settling tax positions with tax authorities and statute expirations may significantly impact the accrual for income tax contingencies. Within the next twelve months, management estimates that approximately $23,000,000$23,884,000 of tax contingencies will be settled primarily through agreement with the tax authorities for tax positions related to valuation matters;matters and positions related to acquired entities; such matters are common to multinational companies. The expected cash payment related to the settlement of these contingencies is not significant.$16,303,000.
The Company conducts business globally and consequently files income tax returns in numerous jurisdictions including those listed in the following table. It is also routinely subject to audit in these and other countries. The Company is no longer subject to audit in its major jurisdictions for periods prior to fiscal year 1999.2006. The open years remaining subject to audit, by major jurisdiction, are as follows:
|
| | | | |
| Jurisdiction | | Fiscal Year | |
| Belgium, | | | 1999 – 2011 | |
Germany and United States (federal and state) and Singapore | | 2010-2013 |
2004 – 2011United Kingdom | | 2009-2013 |
| Hong Kong | | 2007-2013 |
2005 – 2011Singapore | | 2006-2013 |
GermanyNetherlands and Taiwan | | | 2006 – 2011 | |
United Kingdom | | | 2007 – 2011 | |
Netherlands | | | 2008 – 2011 | 2008-2013 |
58
AVNET, INC. AND SUBSIDIARIES
NOTES TO CONSOLIDATED FINANCIAL STATEMENTS — (Continued)
10. Pension and retirement plans
Pension Plan
The Company’s noncontributory defined benefit pension plan (the “Plan”) covers substantially all domestic employees. Employees are eligible to participate in the Plan following the first year of service during which they worked at least 1,000 hours. The Plan provides defined benefits pursuant to a cash balance feature whereby a participant accumulates a benefit based upon a percentage of current salary, which varies with age, and interest credits. The Company uses June 30 as the measurement date for determining pension expense and benefit obligations for each fiscal year. Not included in the tabulations and discussions that follow are pension plans of certain non-U.S. subsidiaries whichand other small pension plans that are not material.
The following tables outline changes in benefit obligations, plan assets and the funded status of the Plan as of the end of fiscal 20112013 and 2010:2012:
| | | | | | | | | |
| | | July 2, | | | July 3, | |
| | | 2011 | | | 2010 | |
| | | (Thousands) | |
| Changes in benefit obligations: | | | | | | | | |
| Benefit obligations at beginning of year | | $ | 276,938 | | | $ | 263,324 | |
| Service cost | | | 23,874 | | | | — | |
| Interest cost | | | 13,918 | | | | 15,748 | |
| Plan amendments | | | — | | | | 34,000 | |
| Actuarial loss | | | 5,168 | | | | 19,591 | |
| Benefits paid | | | (22,371 | ) | | | (55,725 | ) |
| | | | | | | |
| Benefit obligations at end of year | | $ | 297,527 | | | $ | 276,938 | |
| | | | | | | |
| Change in plan assets: | | | | | | | | |
| Fair value of plan assets at beginning of year | | $ | 278,964 | | | $ | 258,931 | |
| Actual return on plan assets | | | 67,659 | | | | 34,008 | |
| Benefits paid | | | (22,371 | ) | | | (55,725 | ) |
| Contributions | | | 500 | | | | 41,750 | |
| | | | | | | |
| Fair value of plan assets at end of year | | $ | 324,752 | | | $ | 278,964 | |
| | | | | | | |
| | | | | | | | | |
| Funded status of the plan recognized as a non-current asset | | $ | 27,225 | | | $ | 2,026 | |
| | | | | | | |
| |
| Amounts recognized in accumulated other comprehensive income: | | | | | | | | |
| Unrecognized net actuarial loss | | $ | 147,311 | | | $ | 191,180 | |
| Unamortized prior service credit | | | (14,431 | ) | | | (16,306 | ) |
| | | | | | | |
| | | $ | 132,880 | | | $ | 174,874 | |
| | | | | | | |
| | | | | | | | | |
| Other changes in plan assets and benefit obligations recognized in other comprehensive income: | | | | | | | | |
| Net actuarial (gain) loss | | $ | (34,931 | ) | | $ | 15,720 | |
| Prior service cost | | | — | | | | 34,000 | |
| Amortization of net actuarial loss | | | (8,938 | ) | | | (5,687 | ) |
| Amortization of prior service credit | | | 1,875 | | | | 4,884 | |
| | | | | | | |
| | | $ | (41,994 | ) | | $ | 48,917 | |
| | | | | | | |
59
AVNET, INC. AND SUBSIDIARIES
NOTES TO CONSOLIDATED FINANCIAL STATEMENTS — (Continued)
|
| | | | | | | |
| | June 29,
2013 | | June 30,
2012 |
| | (Thousands) |
| Changes in benefit obligations: | | | |
| Benefit obligations at beginning of year | $ | 375,156 |
| | $ | 297,527 |
|
| Service cost | 36,920 |
| | 28,380 |
|
| Interest cost | 14,653 |
| | 14,925 |
|
| Plan amendments | — |
| | 3,360 |
|
| Actuarial (gain) loss | (13,545 | ) | | 48,620 |
|
| Benefits paid | (21,304 | ) | | (17,656 | ) |
| Benefit obligations at end of year | $ | 391,880 |
| | $ | 375,156 |
|
| Change in plan assets: | | | |
| Fair value of plan assets at beginning of year | $ | 301,449 |
| | $ | 324,752 |
|
| Actual return on plan assets | 45,228 |
| | (5,647 | ) |
| Benefits paid | (21,304 | ) | | (17,656 | ) |
| Contributions | 40,000 |
| | — |
|
| Fair value of plan assets at end of year | $ | 365,373 |
| | $ | 301,449 |
|
| Funded status of the plan recognized as a non-current liability | $ | (26,507 | ) | | $ | (73,707 | ) |
| Amounts recognized in accumulated other comprehensive income: | | | |
| Unrecognized net actuarial loss | $ | 173,069 |
| | $ | 218,837 |
|
| Unamortized prior service credit | (7,623 | ) | | (9,196 | ) |
| | $ | 165,446 |
| | $ | 209,641 |
|
| Other changes in plan assets and benefit obligations recognized in other comprehensive income: | | | |
| Net actuarial (gain) loss | $ | (30,870 | ) | | $ | 81,206 |
|
| Prior service cost | — |
| | 3,360 |
|
| Amortization of net actuarial loss | (14,898 | ) | | (9,680 | ) |
| Amortization of prior service credit | 1,573 |
| | 1,875 |
|
| | $ | (44,195 | ) | | $ | 76,761 |
|
The Plan was amended effective JulyJune 1, 20102012 to resume future accruals for compensation paid byimprove pre-retirement death benefits so that the Companypre-retirement death benefits will be payable without regard to marital status, and will be based on or after July 1, 2010. The pension accrual formula was similar in structure to the formula that was frozen as of July 1, 2009. The Plan changes effected by this amendment were as follows:
an age-related contribution crediting schedule ranging from 4% to 16% of pension-eligible compensation
interest credits on post-July 1, 2010 pension accruals of 4% per year
inclusion of overtime pay in pension-eligible compensation
increase100% of the cap on pension-eligible compensation from $100,000 to the statutory limit
changeparticipant's vested cash account. The increase in the actuarial factor basis used to convert account balances to annuity payment forms.
In October 2009, the Company agreed to settle a pension litigation matter, which was approved by the court in April 2010. As a result, the Plan was amended to increase benefits to certain former employees. This amendment, effective May 21, 2010, increased the benefit obligation by $34,000,000 and results inliability is recognized as a prior service cost base which will be amortized over 11 years. To fund this additional liability, the Company made a voluntary contribution of $34,000,000and amortization began in June 2010. The impacts of the amendment described above are reflected in the preceding table.fiscal year 2013.
Included in “accumulated other comprehensive income” at July 2, 2011June 29, 2013 is a pre-tax charge of $147,311,000$173,069,000 of net actuarial losses which have not yet been recognized in net periodic pension cost, of which $9,680,000$12,686,000 is expected to be recognized as a component of net periodic benefit cost during fiscal 2012.2014. Also included is a pre-tax credit of $14,431,000$7,623,000 of prior service credit which has not yet been recognized in net periodic pension costs, of which $1,875,000$1,573,000 is expected to be recognized as a component of net periodic benefit costs during fiscal 2012.2014.
Weighted average assumptions used to calculate actuarial present values of benefit obligations are as follows:
| | | | | | | | | |
| | | 2011 | | 2010 |
| Discount rate | | | 5.25 | % | | | 5.25 | % |
|
| | | |
| | 2013 | | 2012 |
| Discount rate | 4.50% | | 4.00% |
AVNET, INC. AND SUBSIDIARIES
NOTES TO CONSOLIDATED FINANCIAL STATEMENTS — (Continued)
Weighted average assumptions used to determine net benefit costs are as follows:
| | | | | | | | | |
| | | 2011 | | 2010 |
| Discount rate | | | 5.25 | % | | | 6.25 | % |
| Expected return on plan assets | | | 8.50 | % | | | 9.00 | % |
|
| | | |
| | 2013 | | 2012 |
| Discount rate | 4.00% | | 5.25% |
| Expected return on plan assets | 8.50% | | 8.50% |
The Company bases its discount rate on a hypothetical portfolio of bonds rated Aa by Moody’s Investor Services or AA by Standard & Poors.Poor's. The bonds selected for this determination are based upon the estimated amount and timing of services of the pension plan.
Components of net periodic pension costs during the last three fiscal years are as follows:
| | | | | | | | | | | | | |
| | | Years Ended | |
| | | July 2, | | | July 3, | | | June 27, | |
| | | 2011 | | | 2010 | | | 2009 | |
| | | (Thousands) | |
| Service cost | | $ | 23,874 | | | $ | — | | | $ | 16,205 | |
| Interest cost | | | 13,918 | | | | 15,748 | | | | 18,175 | |
| Expected return on plan assets | | | (27,560 | ) | | | (30,137 | ) | | | (26,539 | ) |
| Recognized net actuarial loss | | | 8,938 | | | | 5,687 | | | | 2,325 | |
| Amortization of prior service credit | | | (1,875 | ) | | | (4,884 | ) | | | — | |
| | | | | | | | | | |
| Net periodic pension cost | | $ | 17,295 | | | $ | (13,586 | ) | | $ | 10,166 | |
| | | | | | | | | | |
|
| | | | | | | | | | | |
| | Years Ended |
| | June 29,
2013 | | June 30,
2012 | | July 2,
2011 |
| | (Thousands) |
| Service cost | $ | 36,920 |
| | $ | 28,380 |
| | $ | 23,874 |
|
| Interest cost | 14,653 |
| | 14,925 |
| | 13,918 |
|
| Expected return on plan assets | (27,905 | ) | | (26,938 | ) | | (27,560 | ) |
| Recognized net actuarial loss | 14,898 |
| | 9,680 |
| | 8,938 |
|
| Amortization of prior service credit | (1,573 | ) | | (1,875 | ) | | (1,875 | ) |
| Net periodic pension cost | $ | 36,993 |
| | $ | 24,172 |
| | $ | 17,295 |
|
The Company made contributions$40,000,000 of $500,000 and $41,750,000contributions in fiscal 20112013 and 2010, respectively.
60
AVNET, INC. AND SUBSIDIARIES
NOTES TO CONSOLIDATED FINANCIAL STATEMENTS — (Continued)none in 2012.
Benefit payments are expected to be paid to participants as follows for the next five fiscal years and the aggregate for the five years thereafter (in thousands):
| | | | | |
|
| 2012 | | $ | 26,463 | |
| 2013 | | | 20,405 | |
| 2014 | | | 20,619 | |
| 2015 | | | 19,258 | |
| 2016 | | | 20,625 | |
| 2016 through 2021 | | | 112,041 | |
|
| | | |
| 2014 | $ | 28,436 |
|
| 2015 | 23,802 |
|
| 2016 | 27,310 |
|
| 2017 | 30,627 |
|
| 2018 | 34,448 |
|
| 2019 through 2023 | 240,710 |
|
The Plan’s assets are held in trust and were allocated as follows as of the June 30 measurement date for fiscal 20112013 and 2010:2012:
| | | | | | | | | |
| | | 2011 | | 2010 |
| Equity securities | | | 76 | % | | | 74 | % |
| Debt securities | | | 24 | | | | 25 | |
| Cash and receivables | | | — | | | | 1 | |
|
| | | | | |
| | 2013 | | 2012 |
| Equity securities | 75 | % | | 75 | % |
| Fixed income | 24 |
| | 24 |
|
| Cash and cash equivalents | 1 |
| | 1 |
|
The general investment objectives of the Plan are to maximize returns through a diversified investment portfolio in order to earn annualized returns that meet the long-term cost of funding the Plan’s pension obligations while maintaining reasonable and prudent levels of risk. The target rate of return on Plan assets is currently 8.5%, which represents the average rate of earnings expected on the funds invested or to be invested to provide for the benefits included in the benefit obligation. This assumption has been determined by combining expectations regarding future rates of return for the investment portfolio along with the historical and expected distribution of investments by asset class and the historical rates of return for each of those asset classes. The mix of equity securities is typically diversified to obtain a blend of domestic and international investments covering multiple industries. The Plan assets do not include any material investments in Avnet common stock. The Plan’s investments in debt securities are also diversified across both public and private fixed income securities. The Company’s current target allocation for the investment portfolio is for equity securities, both domestic and international, to represent approximately 76% of the
AVNET, INC. AND SUBSIDIARIES
NOTES TO CONSOLIDATED FINANCIAL STATEMENTS — (Continued)
portfolio with a policy for minimum investment in equity securities of 60% of the portfolio and a maximum of 92%. The majority of the remaining portfolio of investments is to be invested in fixed income securities.
AsFASB ASC 820, Fair Value Measurements and Disclosures, establishes a fair value hierarchy that prioritizes the inputs to valuation techniques used to measure fair value. The hierarchy gives the highest priority to unadjusted quoted prices in active markets for identical assets or liabilities (Level 1 measurements) and the lowest priority to unobservable inputs (Level 3 measurements). The three levels of the fair value hierarchy under FASB ASC 820 are described below:
Level 1: Inputs to the valuation methodology are unadjusted quoted prices for identical assets or liabilities in active markets.
Level 2: Inputs to the valuation methodology include quoted prices for similar assets and liabilities in active markets, and inputs that are observable for the asset or liability, either directly or indirectly, for substantially the full term of the financial instrument.
Level 3: Inputs to the valuation methodology are unobservable and significant to the fair value measurement.
A financial instrument's level within the fair value hierarchy is based on the lowest level of any input that is significant to the fair value measurement.
The following table sets forth by level, within the fair value hierarchy, the Plan's investments at fair value as of June 29, 2013.
|
| | | | | | | | | | | | | | | | |
| | | Level 1 | | Level 2 | | Level 3 | | Total |
| | | (Thousands) |
| Cash and cash equivalents | | $ | 3,032 |
| | $ | — |
| | $ | — |
| | $ | 3,032 |
|
| Equities: | | | | | | | | |
| U.S. common stocks | | — |
| | 219,225 |
| | — |
| | 219,225 |
|
| International common stocks | | — |
| | 56,458 |
| | — |
| | 56,458 |
|
| Fixed Income: | | | | | | | | |
| U.S. government agencies | | — |
| | 10,004 |
| | — |
| | 10,004 |
|
| U.S. corporate bonds | | — |
| | 76,654 |
| | — |
| | 76,654 |
|
| Total | | $ | 3,032 |
| | $ | 362,341 |
| | $ | — |
| | $ | 365,373 |
|
The following table sets forth by level, within the fair value hierarchy, the Plan's investments at fair value as of June 30, 2011,2012.
|
| | | | | | | | | | | | | | | | |
| | | Level 1 | | Level 2 | | Level 3 | | Total |
| | | (Thousands) |
| Cash and cash equivalents | | $ | 3,045 |
| | $ | — |
| | $ | — |
| | $ | 3,045 |
|
| Equities: | | | | | | | | |
| U.S. common stocks | | — |
| | 178,857 |
| | — |
| | 178,857 |
|
| International common stocks | | — |
| | 46,897 |
| | — |
| | 46,897 |
|
| Fixed Income: | | | | | | | | |
| U.S. government agencies | | — |
| | 10,087 |
| | — |
| | 10,087 |
|
| U.S. corporate bonds | | — |
| | 62,563 |
| | — |
| | 62,563 |
|
| Total | | $ | 3,045 |
| | $ | 298,404 |
| | $ | — |
| | $ | 301,449 |
|
The Plan’s investments in equity and fixed income investments are stated at unit value, or the marketequivalent of net asset value, of plan assets by investment category was: U.S. Equity ($194.3 million); U.S. Bonds ($76.5 million); International Equity ($51.9 million) and cash and receivables ($2.0 million). Asset values are Level 1which is a practical expedient for all asset categories asestimating the fair values are based upon quoted market prices for identical assets. of those investments. Each of these investments may be redeemed daily without notice and had no unfunded commitments as of June 29, 2013.
AVNET, INC. AND SUBSIDIARIES
NOTES TO CONSOLIDATED FINANCIAL STATEMENTS — (Continued)
The pension assets were highly diversified to reducefixed income investments provide a steady return with medium volatility and assist with capital preservation and income generation. The equity investments have higher expected volatility and return than the potential risk of significant concentrations of credit risk.fixed income investments.
11. Long-termOperating leases
The Company leases many of its operating facilities and is also committed under lease agreements for transportation and operating equipment. Rent expense charged to operations during the last three years is as follows:
| | | | | | | | | | | | | |
| | | Years Ended | |
| | | July 2, | | | July 3, | | | June 27, | |
| | | 2011 | | | 2010 | | | 2009 | |
| | | (Thousands) | |
| Buildings | | $ | 78,371 | | | $ | 59,047 | | | $ | 58,213 | |
| Equipment | | | 8,332 | | | | 5,440 | | | | 6,169 | |
| | | | | | | | | | |
| | | $ | 86,703 | | | $ | 64,487 | | | $ | 64,382 | |
| | | | | | | | | | |
61
AVNET, INC. AND SUBSIDIARIES
NOTES TO CONSOLIDATED FINANCIAL STATEMENTS — (Continued) |
| | | | | | | | | | | |
| | Years Ended |
| | June 29, 2013 | | June 30, 2012 | | July 2, 2011 |
| | (Thousands) |
| Buildings | $ | 86,884 |
| | $ | 84,531 |
| | $ | 78,371 |
|
| Equipment | 7,203 |
| | 8,093 |
| | 8,332 |
|
| | $ | 94,087 |
| | $ | 92,624 |
| | $ | 86,703 |
|
The aggregate future minimum operating lease commitments, principally for buildings, in fiscal 20122014 through 20162018 and thereafter (through 2028)2029), are as follows (in thousands):
| | | | | |
|
| 2012 | | $ | 92,376 | |
| 2013 | | | 73,517 | |
| 2014 | | | 46,800 | |
| 2015 | | | 28,933 | |
| 2016 | | | 20,560 | |
| Thereafter | | | 42,421 | |
| | | | |
| Total | | $ | 304,607 | |
| | | | |
|
| | | |
| 2014 | $ | 86,100 |
|
| 2015 | 58,165 |
|
| 2016 | 41,901 |
|
| 2107 | 29,088 |
|
| 2018 | 18,468 |
|
| Thereafter | 38,514 |
|
| Total | $ | 272,236 |
|
The preceding table includes operating lease commitments that have been reserved for as part of the Company’s restructuring activities (see Note 17).
12. Stock-based compensation plans
The Company measures all share-based payments, including grants of employee stock options, at fair value and recognizes related expense in the consolidated statement of operations over the service period (generally the vesting period). During fiscal 2013, 2012, 2011 2010, 2009,, the Company expensed $28,931,000, $28,363,000$43,677,000, $35,737,000 and $18,269,000,$28,931,000, respectively, for all stock-based compensation awards.
In August 2011, the Board of Directors approved the repurchase of up to an aggregate of $500 million of shares of the Company’s common stock through a share repurchase program.
Stock plan
The Company currently has one stock compensation plan pursuant to which it can issue new awards. The 2010 Stock Compensation Plan (“2010 Plan”) was approved by the shareholders in fiscal 2011. The 2010 Plan has a termination date of November 4, 2020 and 6,694,816 shares were available for grant at July 2, 2011. At July 2, 2011,June 29, 2013, the Company had 12,074,2328,988,130 shares of common stock reserved for stock option andequity awards, which consisted of 2,579,188 for options granted that have not yet been exercised, 2,995,588 available for future awards under plans approved by shareholders, 2,980,565 for stock incentive programs.and performance shares granted but not yet vested, and 432,789 shares available for future award under the Company's Employee Stock Purchase Plan ("ESPP").
Stock options
Option grants under the 2010 Plan have a contractual life of ten years, vest 25% on each anniversary of the grant date, commencing with the first anniversary, and provide for a minimum exercise price of 100% of fair market value at the date of grant. Compensation expense associated with stock options during fiscal 2011, 20102013, 2012 and 2009 were $3,499,000, $3,558,0002011 was $3,989,000, $3,147,000 and $4,245,000,$3,499,000, respectively.
The fair value of options granted is estimated on the date of grant using the Black-Scholes model based on the assumptions in the following table. The assumption for the expected term is based on evaluations of historical and expected future employee exercise behavior. The risk-free interest rate is based on the U.S. Treasury rates at the date of grant with maturity dates approximately equal to the expected term at the grant date. The historical volatility of Avnet’s stock is used as the basis for the volatility assumption.
| | | | | | | | | | | | | |
| | | Years Ended |
| | | July 2, | | July 3, | | June 27, |
| | | 2011 | | 2010 | | 2009 |
| Expected term (years) | | | 6.0 | | | | 6.0 | | | | 5.75 | |
| Risk-free interest rate | | | 1.8 | % | | | 3.0 | % | | | 3.4 | % |
| Weighted average volatility | | | 33.7 | % | | | 34.3 | % | | | 30.7 | % |
| Dividend yield | | | — | | | | — | | | | — | |
62
AVNET, INC. AND SUBSIDIARIES
NOTES TO CONSOLIDATED FINANCIAL STATEMENTS — (Continued)
|
| | | | | | | | |
| | Years Ended |
| | June 29, 2013 | | June 30, 2012 | | July 2, 2011 |
| Expected term (years) | 6.00 |
| | 6.00 |
| | 6.00 |
|
| Risk-free interest rate | 0.9 | % | | 1.2 | % | | 1.8 | % |
| Weighted average volatility | 35.0 | % | | 33.7 | % | | 33.7 | % |
| Dividend yield | — |
| | — |
| | — |
|
The following is a summary of the changes in outstanding options for fiscal 2011:2013:
| | | | | | | | | | | | | |
| | | | | | | | | | | Weighted | |
| | | | | | | Weighted | | | Average | |
| | | | | | | Average | | | Remaining | |
| | | | | | | Exercise | | | Contractual | |
| | | Shares | | | Price | | | Life | |
| Outstanding at July 3, 2010 | | | 3,530,118 | | | $ | 21.06 | | | 56 Months | |
| Granted | | | 382,612 | | | $ | 24.41 | | | 109 Months | |
| Exercised | | | (751,396 | ) | | $ | 18.69 | | | 20 Months | |
| Forfeited or expired | | | (102,119 | ) | | $ | 29.35 | | | 18 Months | |
| | | | | | | | | | | | |
| Outstanding at July 2, 2011 | | | 3,059,215 | | | $ | 21.79 | | | 59 Months | |
| | | | | | | | | | | | |
| Exercisable at July 2, 2011 | | | 2,139,921 | | | $ | 19.99 | | | 42 Months | |
| | | | | | | | | | | | |
|
| | | | | | | | |
| | Shares | | Weighted Average Exercise Price | | Weighted Average
Remaining
Contractual Life |
| Outstanding at June 30, 2012 | 2,881,918 |
| | $ | 23.78 |
| | 61 Months |
| Granted | 416,128 |
| | $ | 32.34 |
| | 110 Months |
| Exercised | (708,421 | ) | | $ | 18.25 |
| | 12 Months |
| Forfeited or expired | (10,437 | ) | | $ | 30.50 |
| | 40 Months |
| Outstanding at June 29, 2013 | 2,579,188 |
| | $ | 26.65 |
| | 70 Months |
| Exercisable at June 29, 2013 | 1,634,898 |
| | $ | 25.37 |
| | 53 Months |
The weighted-average grant-date fair values of stock options granted during fiscal 2011, 2010,2013, 2012 and 20092011 were $8.72, $9.58$11.33, $9.67 and $10.21,$8.72, respectively. There were no
At June 29, 2013, the aggregate intrinsic valuesvalue of shareall outstanding stock option awards was $18,089,000 and all exercisable stock options outstanding or exercisable at July 2, 2011 and July 3, 2010. The total intrinsic values of share options exercised during fiscal 2009awards was $3,000.$13,624,000.
The following is a summary of the changes in non-vested stock options for the fiscal year ended July 2, 2011:June 29, 2013:
| | | | | | | | | |
| | | | | | | Weighted | |
| | | | | | | Average | |
| | | | | | | Grant-Date | |
| | | Shares | | | Fair Value | |
| Non-vested stock options at July 3, 2010 | | | 881,556 | | | $ | 10.40 | |
| Granted | | | 382,612 | | | $ | 8.72 | |
| Vested | | | (330,200 | ) | | $ | 10.37 | |
| Forfeited | | | (14,674 | ) | | $ | 11.67 | |
| | | | | | | | |
| Non-vested stock options at July 2, 2011 | | | 919,294 | | | $ | 9.69 | |
| | | | | | | | |
|
| | | | | | |
| | Shares | | Weighted Average Grant-Date Fair Value |
| Non-vested stock options at June 30, 2012 | 887,295 |
| | $ | 9.41 |
|
| Granted | 416,128 |
| | $ | 11.33 |
|
| Vested | (359,133 | ) | | $ | 9.53 |
|
| Forfeited | — |
| | $ | — |
|
| Non-vested stock options at June 29, 2013 | 944,290 |
| | $ | 10.21 |
|
As of July 2, 2011,June 29, 2013, there was $8,910,000$2,534,000 of total unrecognized compensation cost related to non-vested stock options, which is expected to be recognized over a weighted-average period of 3.22.2 years. The total fair values of shares vested during fiscal 2011, 20102013, 2012 and 20092011 were $3,425,000, $3,293,000, $5,555,000,$3,424,000, $3,599,000, $3,425,000, respectively.
Cash received from option exercises during fiscal 2011, 20102013, 2012 and 20092011 totaled $3,506,000, $4,134,000,$2,053,000, $2,405,000, and $563,000,$3,506,000, respectively. The impact of these cash receipts is included in “Other, net” in financing activities in the accompanying consolidated statements of cash flows.
Incentive shares
Delivery of incentive shares, and the associated compensation expense, is spread equally over a five-year period and is generally subject to the employee’s continued employment by the Company. As of July 2, 2011, 1,414,784June 29, 2013, 2,009,510 shares previously awarded have not yet been delivered. Compensation expense associated with this program was $17,008,000, $14,614,000$26,788,000, $20,978,000 and $14,883,000$17,008,000 for fiscal years 2011, 20102013, 2012 and 2009,2011, respectively.
63
AVNET, INC. AND SUBSIDIARIES
NOTES TO CONSOLIDATED FINANCIAL STATEMENTS — (Continued)
The following is a summary of the changes in non-vested incentive shares for the fiscal year ended July 2, 2011:June 29, 2013:
| | | | | | | | | |
| | | | | | | Weighted | |
| | | | | | | Average | |
| | | | | | | Grant-Date | |
| | | Shares | | | Fair Value | |
| Non-vested incentive shares at July 3, 2010 | | | 1,258,054 | | | $ | 26.57 | |
| Granted | | | 817,965 | | | $ | 25.40 | |
| Vested | | | (623,333 | ) | | $ | 25.53 | |
| Forfeited | | | (37,902 | ) | | $ | 26.24 | |
| | | | | | | | |
| Non-vested incentive shares at July 2, 2011 | | | 1,414,784 | | | $ | 26.47 | |
| | | | | | | | |
|
| | | | | | |
| | Shares | | Weighted Average Grant-Date Fair Value |
| Non-vested incentive shares at June 30, 2012 | 1,749,519 |
| | $ | 26.82 |
|
| Granted | 1,292,030 |
| | $ | 32.42 |
|
| Vested | (900,701 | ) | | $ | 28.24 |
|
| Forfeited | (131,338 | ) | | $ | 28.64 |
|
| Non-vested incentive shares at June 29, 2013 | 2,009,510 |
| | $ | 29.62 |
|
As of July 2, 2011,June 29, 2013, there was $33,961,000$47,413,000 of total unrecognized compensation cost related to non-vested incentive shares, which is expected to be recognized over a weighted-average period of 2.72.9 years. The total fair values of shares vested during fiscal 2011, 20102013, 2012 and 20092011 were $15,916,000, $14,301,000, $12,588,000,$25,439,000, $19,516,000, $15,916,000, respectively.
Performance shares
Eligible employees, including Avnet’s executive officers, may receive a portion of their long-term equity-based incentive compensation through the performance share program, which allows for the award of shares of stock against performance-based criteria (“Performance Share Program”). The Performance Share Program provides for the issuance to each grantee of a number of shares of Avnet’s common stock at the end of a three-year period based upon the Company’s achievement of performance goals established by the Compensation Committee of the Board of Directors for each three-year period. For the Performance Share Program granted in fiscal 2009, theThe performance goals were initially based upon a three-year cumulative increase in the Company’s absolutehave recently consisted of measures of economic profit as defined, over the prior three-year period and the increase in the Company’s economic profit relative to the increase in the economic profit of a group of specific technology companies. total shareholder return.
During fiscal 2010, these performance goals were modified to eliminate the absolute economic profit goal; in addition, the fiscal 2009 program was modified to limit the percentage of performance stock units vesting to a maximum of 100%.
For the Performance Share Program granted in fiscal 20112013, 2012 and 2010, the performance goals are based upon a three-year cumulative increase in the Company’s economic profit relative to the increase in the economic profit of a group of specific technology companies.
During fiscal 2011 2010 and 2009,, the Company granted 380,200, 242,390252,185, 349,070 and 246,650380,200 performance shares, respectively, to be awarded to participants in the Performance Share Program, of which 22,53010,400 cumulatively have been forfeited. For the Performance Share Program granted in fiscal 2011 and 2010, theThe actual amount of performance shares issued at the end of the three-year period is determined based upon the level of achievement of the defined performance goals and can range from 0% to 200% of the initial award. As previously mentioned, the Performance Share Program granted in fiscal 2009 was limited to 100% of the initial award. The Company anticipates issuing 227,285 shares in the first quarter of fiscal 2012 based upon the goals achieved during the three-year performance period which ended July 2, 2011. During fiscal 20112013, 2012 and 2010,2011, the Company recognized compensation expense associated with the Performance Share Programs of $7,374,000$11,902,000, $10,502,000 and $9,171,000,$7,374,000, respectively. During fiscal 2009, the Company recorded a credit of $1,819,000 in selling, general and administrative expenses associated with the Performance Share Programs based upon actual performance under the 2007 Performance Share Program and based upon the probability assessment of the remaining plans.
Outside director equity compensation
Non-employee directors are awarded shares equal to a fixed dollar amount of Avnet common stock upon their re-election each year, as part of their director compensation package. Directors may elect to receive this compensation in the form of common stock or they may elect to defer their compensation to be paid in common stock at a later date. During fiscal 2011, 20102013, 2012 and 2009,2011, compensation cost associated with the outside director stock bonus plan was $1,050,000, $1,020,000, $960,000,$999,000, $1,110,000, $1,050,000, respectively.
64
AVNET, INC. AND SUBSIDIARIES
NOTES TO CONSOLIDATED FINANCIAL STATEMENTS — (Continued)
Employee stock purchase plan
The Company has an Employee Stock Purchase Plan (“ESPP”)ESPP under the terms of which eligible employees of the Company are offered options to purchase shares of Avnet common stock at a price equal to 95% of the fair market value on the last day of each monthly offering period. Based on the terms of theThe ESPP Avnet is not required to record expense in the consolidated statements of operations related to the ESPP.compensatory based on its terms.
The Company has a policy of repurchasing shares on the open market to satisfy shares purchased under the ESPP, and expects future repurchases during fiscal 20122014 to be similar to the number of shares repurchased during fiscal 2011,2013, based on current estimates of participation in the program. During fiscal 2011, 20102013, 2012 and 2009,2011, there were 62,329, 67,16861,731, 64,187 and 100,20662,329 shares, respectively, of common stock issued under the ESPP program.
13. Commitments and contingencies
Bell
During fiscal 2011, the Company recognized a contingent liability for potential unpaid import duties associated with the acquisition of Bell. Prior to the acquisition of Bell by Avnet, Customs and Border Protection (“CBP”) initiated a review of the importing process at one of Bell’s subsidiaries and identified compliance deficiencies. Subsequent to the acquisition of Bell by
AVNET, INC. AND SUBSIDIARIES
NOTES TO CONSOLIDATED FINANCIAL STATEMENTS — (Continued)
Avnet, CBP began a compliance audit. The Company evaluated projected duties, interest and penalties that potentially may be imposed as a result of the audit and recognized a contingent liability of $10,000,000 which was recorded to goodwill in fiscal 2011. Depending on the ultimate resolution of the matter with CBP, the Company estimates that the range of the potential exposure associated with the liability may be up to $73,000,000; however, the Company believes the contingent liability recorded is a reasonable estimate of the liability based upon the facts currently available at this time.
Other
During fiscal 2012, the Company recorded $6,665,000 for (i) a legal claim associated with an acquired business for a potential royalty claim related to periods prior to acquisition by Avnet and (ii) a legal claim associated with an indemnification of a prior divested business.
From time to time, the Company may become a party to, or otherwise involved in other pending and threatened litigation, tax, environmentalvarious lawsuits, claims, investigations and other matterslegal proceedings arising in the ordinary course of conducting its business. ManagementWhile litigation is subject to inherent uncertainties, management does not anticipate that any contingentongoing matters will have a material adverse effect on the Company’s financial condition, liquidity or results of operations.
14. Earnings per share
Basic earnings per share is computed based on the weighted average number of common shares outstanding and excludes any potential dilution. Diluted earnings per share reflect potential dilution from the exercise or conversion of securities into common stock.
| | | | | | | | | | | | | |
| | | Years Ended | |
| | | July 2, | | | July 3, | | | June 27, | |
| | | 2011 | | | 2010 | | | 2009 | |
| | | (Thousands, except per share data) | |
| Numerator: | | | | | | | | | | | | |
| Net income (loss) for basic and diluted earnings per share | | $ | 669,069 | | | $ | 410,370 | | | $ | (1,129,712 | ) |
| | | | | | | | | | |
| | | | | | | | | | | | | |
| Denominator: | | | | | | | | | | | | |
| Weighted average common shares for basic earnings (loss) per share | | | 152,481 | | | | 151,629 | | | | 150,898 | |
| Net effect of dilutive stock options and performance share awards | | | 1,856 | | | | 1,464 | | | | — | |
| | | | | | | | | | |
| Weighted average common shares for diluted earnings per share | | | 154,337 | | | | 153,093 | | | | 150,898 | |
| | | | | | | | | | |
| | | | | | | | | | | | | |
| Basic earnings (loss) per share | | $ | 4.39 | | | $ | 2.71 | | | $ | (7.49 | ) |
| | | | | | | | | | |
| Diluted earnings (loss) per share | | $ | 4.34 | | | $ | 2.68 | | | $ | (7.49 | ) |
| | | | | | | | | | |
|
| | | | | | | | | | | |
| | Years Ended |
| | June 29, 2013 | | June 30, 2012 | | July 2, 2011 |
| | (Thousands, except per share data) |
| Numerator: | | | | | |
| Net income for basic and diluted earnings per share | $ | 450,073 |
| | $ | 567,019 |
| | $ | 669,069 |
|
| Denominator: | | | | | |
| Weighted average common shares for basic earnings per share | 137,951 |
| | 147,278 |
| | 152,481 |
|
| Net effect of dilutive stock options and performance share awards | 2,052 |
| | 2,275 |
| | 1,856 |
|
| Weighted average common shares for diluted earnings per share | 140,003 |
| | 149,553 |
| | 154,337 |
|
| Basic earnings per share | $ | 3.26 |
| | $ | 3.85 |
| | $ | 4.39 |
|
| Diluted earnings per share | $ | 3.21 |
| | $ | 3.79 |
| | $ | 4.34 |
|
Options to purchase 238,000 and 700,000565,840 shares of the Company’sCompany's stock for fiscal 2013 and 238,000 shares for both fiscal 2012 and 2011, were excluded from the calculations of diluted earnings per shares in fiscal 2011 and 2010, respectively, because the exercise price for those options was above the average market price of the Company’s stock during those periods. Inclusion of these options in the diluted earnings per share calculation would have had an anti-dilutive effect.
For fiscal 2009, dilutive effects of stock options, stock awards and shares issuable upon conversion of the Company’s 2% Convertible Debentures were excluded from the computation of earnings per diluted share because the Company recognized a net loss and inclusion of these items would have had an anti-dilutive effect. The Convertible Debentures were repaid in March 2009.
65
AVNET, INC. AND SUBSIDIARIES
NOTES TO CONSOLIDATED FINANCIAL STATEMENTS — (Continued)
15. Additional cash flow information
Other non-cash and reconciling items consist of the following:
| | | | | | | | | | | | | |
| | | Years Ended | |
| | | July 2, | | | July 3, | | | June 27, | |
| | | 2011 | | | 2010 | | | 2009 | |
| | | (Thousands) | |
| Provision for doubtful accounts | | $ | 39,255 | | | $ | 33,825 | | | $ | 32,777 | |
| Periodic pension (income) costs (Note 10) | | | 17,295 | | | | (13,586 | ) | | | 10,166 | |
| Other, net | | | 296 | | | | (4,854 | ) | | | (4,529 | ) |
| | | | | | | | | | |
| Total | | $ | 56,846 | | | $ | 15,385 | | | $ | 38,414 | |
| | | | | | | | | | |
|
| | | | | | | | | | | |
| | Years Ended |
| | June 29,
2013 | | June 30,
2012 | | July 2,
2011 |
| | (Thousands) |
| Provision for doubtful accounts | $ | 30,802 |
| | $ | 35,632 |
| | $ | 39,255 |
|
| Periodic pension costs (Note 10) | 36,993 |
| | 24,172 |
| | 17,295 |
|
| Other, net | 7,532 |
| | 6,459 |
| | 296 |
|
| Total | $ | 75,327 |
| | $ | 66,263 |
| | $ | 56,846 |
|
AVNET, INC. AND SUBSIDIARIES
NOTES TO CONSOLIDATED FINANCIAL STATEMENTS — (Continued)
Interest and income taxes paid during the last three years were as follows:
| | | | | | | | | | | | | |
| | | Years Ended | |
| | | July 2, | | | July 3, | | | June 27, | |
| | | 2011 | | | 2010 | | | 2009 | |
| | | (Thousands) | |
| Interest | | $ | 91,946 | | | $ | 60,556 | | | $ | 66,895 | |
| Income taxes | | $ | 158,372 | | | $ | 92,565 | | | $ | 126,010 | |
|
| | | | | | | | | | | |
| | Years Ended |
| | June 29,
2013 | | June 30,
2012 | | July 2,
2011 |
| | (Thousands) |
| Interest | $ | 106,735 |
| | $ | 89,529 |
| | $ | 91,946 |
|
| Income taxes | $ | 141,196 |
| | $ | 192,717 |
| | $ | 158,372 |
|
The Company includes bank overdrafts as part of accounts payable on its consolidated balance sheets and reflects changes in such balances as part of cash flows from operating activities in its consolidated statements of cash flows.
Non-cash activity during fiscal 2013, 2012 and 2011 included amounts recorded through comprehensive income and, therefore, are not included in the consolidated statement of cash flows. Fiscal 20112013 included an adjustment to pension liabilities (including non-U.S. pension liabilities) of $31,987,000$49,192,000 , which was recorded net of related deferred tax benefit of $12,022,000$19,062,000 in other comprehensive income (see Notes 4 and 10). Other non-cash activities included assumed debt of $420,259,000$66,367,000 and assumed liabilities of $509,812,000$203,626,000 as a result of the acquisitions completed in fiscal 20112013 (see Note 2)., divestitures, and purchase accounting adjustments to prior year acquisitions that occurred during the purchase price allocation period.
Non-cash activity during fiscal 2010 included amounts recorded through comprehensive income and, therefore, are not included in the consolidated statement of cash flows. Fiscal 20102012 included an adjustment to increase pension liabilities (including non-U.S. pension liabilities) of $50,502,000$85,010,000 which was recorded net of related deferred tax benefit of $19,287,000$32,382,000 in other comprehensive income (see Notes 4 and 10). Other non-cash activities included assumed debt of $5,858,000$34,765,000 and assumed liabilities of $35,913,000$214,325,000 as a result of the acquisitions completed in fiscal 20102012 (see Note 2).
Non-cash activity during fiscal 2009 included amounts recorded through comprehensive income and, therefore, are not included in the consolidated statement of cash flows. Fiscal 20092011 included an adjustment to increase pension liabilities (including non-U.S. pension liabilities) of $42,948,000$31,987,000 which was recorded net of related deferred tax benefit of $16,767,000$12,022,000 in other comprehensive income (see Notes 4 and 10). Other non-cash activities included assumed debt of $146,831,000$420,259,000 and assumed liabilities of $261,434,000$509,812,000 as a result of the acquisitions completed in fiscal 20092011 (see Note 2).
16. Segment information
Electronics Marketing and Technology Solutions are the overall segments upon which management primarily evaluates the operations of the Company and upon which management bases its operating decisions. Therefore, the segment data that follows reflects these two segments.
EM markets and sells semiconductors and interconnect, passive and electromechanical devices and embedded products. EM markets and sells its products and services to a diverse customer base serving many end-markets including automotive, communications, computer hardware and peripheral, industrial and manufacturing, medical equipment, military and aerospace. EM also offers an array of value-added services that help customers evaluate, design-in and procure electronic components throughout the lifecycle of their technology products and systems, including supply-chain management, engineering design, inventory replenishment systems, connector and cable assembly and semiconductor programming.
66
AVNET, INC. AND SUBSIDIARIES
NOTES TO CONSOLIDATED FINANCIAL STATEMENTS — (Continued)
TS markets and sells mid- to high-end servers, data storage, software, and the services required to implement these products and solutions to the value-added reseller channel. TS also focuses on the worldwide original equipment manufacturers (“OEM”) market for computing technology, system integrators and non-PC OEMs that require embedded systems and solutions including engineering, product prototyping, integration and other value-added services.
| | | | | | | | | | | | | |
| | | Years Ended | |
| | | July 2, | | | July 3, | | | June 27, | |
| | | 2011 | | | 2010 | | | 2009 | |
| | | (Millions) | |
| Sales: | | | | | | | | | | | | |
| Electronics Marketing | | $ | 15,066.2 | | | $ | 10,966.8 | | | $ | 9,192.8 | |
| Technology Solutions | | | 11,468.2 | | | | 8,193.4 | | | | 7,037.1 | |
| | | | | | | | | | |
| | | $ | 26,534.4 | | | $ | 19,160.2 | | | $ | 16,229.9 | |
| | | | | | | | | | |
| Operating income (loss): | | | | | | | | | | | | |
| Electronics Marketing | | $ | 832.5 | | | $ | 491.6 | | | $ | 354.5 | |
| Technology Solutions | | | 286.7 | | | | 251.7 | | | | 201.4 | |
| Corporate | | | (112.0 | ) | | | (82.3 | ) | | | (64.5 | ) |
| | | | | | | | | | |
| | | | 1,007.2 | | | | 661.0 | | | | 491.4 | |
| Impairment charges (Note 6) | | | — | | | | — | | | | (1,411.1 | ) |
| Restructuring, integration and other charges (Note 17) | | | (77.2 | ) | | | (25.4 | ) | | | (99.3 | ) |
| | | | | | | | | | |
| | | $ | 930.0 | | | $ | 635.6 | | | $ | (1,019.0 | ) |
| | | | | | | | | | |
| Assets: | | | | | | | | | | | | |
| Electronics Marketing | | $ | 5,890.9 | | | $ | 4,441.8 | | | $ | 3,783.4 | |
| Technology Solutions | | | 3,765.2 | | | | 2,553.8 | | | | 2,036.8 | |
| Corporate | | | 249.5 | | | | 786.8 | | | | 453.3 | |
| | | | | | | | | | |
| | | $ | 9,905.6 | | | $ | 7,782.4 | | | $ | 6,273.5 | |
| | | | | | | | | | |
| Capital expenditures: | | | | | | | | | | | | |
| Electronics Marketing | | $ | 69.8 | | | $ | 30.1 | | | $ | 61.1 | |
| Technology Solutions | | | 57.4 | | | | 17.2 | | | | 38.5 | |
| Corporate | | | 21.5 | | | | 19.6 | | | | 10.6 | |
| | | | | | | | | | |
| | | $ | 148.7 | | | $ | 66.9 | | | $ | 110.2 | |
| | | | | | | | | | |
| Depreciation & amortization expense: | | | | | | | | | | | | |
| Electronics Marketing | | $ | 28.3 | | | $ | 24.6 | | | $ | 26.8 | |
| Technology Solutions | | | 30.0 | | | | 15.7 | | | | 18.3 | |
| Corporate | | | 23.1 | | | | 20.3 | | | | 20.7 | |
| | | | | | | | | | |
| | | $ | 81.4 | | | $ | 60.6 | | | $ | 65.8 | |
| | | | | | | | | | |
| Sales, by geographic area, are as follows: | | | | | | | | | | | | |
Americas(1) | | $ | 11,518.5 | | | $ | 8,367.3 | | | $ | 7,572.2 | |
EMEA(2) | | | 8,393.4 | | | | 5,948.3 | | | | 5,268.4 | |
Asia/Pacific(3) | | | 6,622.5 | | | | 4,844.6 | | | | 3,389.3 | |
| | | | | | | | | | |
| | | $ | 26,534.4 | | | $ | 19,160.2 | | | $ | 16,229.9 | |
| | | | | | | | | | |
| Property, plant and equipment, net, by geographic area: | | | | | | | | | | | | |
Americas(4) | | $ | 242.5 | | | $ | 182.2 | | | $ | 183.9 | |
EMEA(5) | | | 150.6 | | | | 98.5 | | | | 101.3 | |
| Asia/Pacific | | | 26.1 | | | | 21.9 | | | | 20.5 | |
| | | | | | | | | | |
| | | $ | 419.2 | | | $ | 302.6 | | | $ | 305.7 | |
| | | | | | | | | | |
67
AVNET, INC. AND SUBSIDIARIES
NOTES TO CONSOLIDATED FINANCIAL STATEMENTS — (Continued)
|
| | | | | | | | | | | |
| | Years Ended |
| | June 29,
2013 | | June 30,
2012 | | July 2,
2011 |
| | (Millions) |
| Sales: | | | | | |
| Electronics Marketing | $ | 15,094.4 |
| | $ | 14,933.1 |
| | $ | 15,066.2 |
|
| Technology Solutions | 10,364.5 |
| | 10,774.4 |
| | 11,468.2 |
|
| | $ | 25,458.9 |
| | $ | 25,707.5 |
| | $ | 26,534.4 |
|
| Operating income (loss): | | | | | |
| Electronics Marketing | $ | 624.0 |
| | $ | 751.4 |
| | $ | 832.5 |
|
| Technology Solutions | 278.4 |
| | 319.3 |
| | 286.7 |
|
| Corporate | (126.9 | ) | | (112.9 | ) | | (112.0 | ) |
| | 775.5 |
| | 957.8 |
| | 1,007.2 |
|
| Restructuring, integration and other charges (Note 17) | (149.5 | ) | | (73.6 | ) | | (77.2 | ) |
| | $ | 626.0 |
| | $ | 884.2 |
| | $ | 930.0 |
|
| Assets: | | | | | |
| Electronics Marketing | $ | 6,316.3 |
| | $ | 6,024.3 |
| | $ | 5,890.9 |
|
| Technology Solutions | 3,838.4 |
| | 3,738.5 |
| | 3,765.2 |
|
| Corporate | 320.0 |
| | 405.1 |
| | 249.5 |
|
| | $ | 10,474.7 |
| | $ | 10,167.9 |
| | $ | 9,905.6 |
|
| Capital expenditures: | | | | | |
| Electronics Marketing | $ | 24.1 |
| | $ | 58.5 |
| | $ | 69.8 |
|
| Technology Solutions | 26.6 |
| | 41.3 |
| | 57.4 |
|
| Corporate | 46.7 |
| | 28.8 |
| | 21.5 |
|
| | $ | 97.4 |
| | $ | 128.6 |
| | $ | 148.7 |
|
| Depreciation & amortization expense: | | | | | |
| Electronics Marketing | $ | 51.8 |
| | $ | 38.9 |
| | $ | 28.3 |
|
| Technology Solutions | 47.3 |
| | 39.2 |
| | 30.0 |
|
| Corporate | 21.6 |
| | 23.2 |
| | 23.1 |
|
| | $ | 120.7 |
| | $ | 101.3 |
| | $ | 81.4 |
|
| Sales, by geographic area, are as follows: | | | | | |
Americas (1) | $ | 10,716.6 |
| | $ | 11,499.3 |
| | $ | 11,518.5 |
|
EMEA (2) | 7,277.9 |
| | 7,408.9 |
| | 8,393.4 |
|
Asia/Pacific (3) | 7,464.4 |
| | 6,799.3 |
| | 6,622.5 |
|
| | $ | 25,458.9 |
| | $ | 25,707.5 |
| | $ | 26,534.4 |
|
| Property, plant and equipment, net, by geographic area: | | | | | |
Americas (4) | $ | 283.0 |
| | $ | 278.5 |
| | $ | 242.5 |
|
EMEA (5) | 177.9 |
| | 150.8 |
| | 150.6 |
|
| Asia/Pacific | 31.7 |
| | 31.9 |
| | 26.1 |
|
| | $ | 492.6 |
| | $ | 461.2 |
| | $ | 419.2 |
|
| | |
| (1) | | Includes sales in the United States of $10.0$9.4 billion $7.6, $10.0 billion and $6.8$10.0 billion for fiscal year 2011, 20102013, 2012 and 2009,2011, respectively. |
| |
|
| (2) | | Includes sales in Germany and the United Kingdom of $3.1$2.8 billion and $1.7$1.2 billion, respectively, for fiscal 2011.2013. Includes sales in Germany and the United Kingdom of $2.1$2.6 billion and $1.1$1.4 billion, respectively, for fiscal 2010.2012. Includes sales in Germany and the United Kingdom of $1.8$3.1 billion and $1.0$1.7 billion, respectively, for fiscal 2009.2011. |
AVNET, INC. AND SUBSIDIARIES
NOTES TO CONSOLIDATED FINANCIAL STATEMENTS — (Continued)
| |
|
| (3) | | Includes sales of $1.8$2.3 billion $2.4, $2.4 billion and $1.2$1.2 billion in Taiwan, China (including Hong Kong) and Singapore, respectively, for fiscal 2011.2013. Includes sales of $1.3$1.9 billion $2.0, $2.3 billion and $1.0$1.2 billion in Taiwan, China (including Hong Kong) and Singapore, respectively, for fiscal 2010.2012. Includes sales of $966.9 million, $1.3$1.8 billion, $2.4 billion and $752.9 million$1.2 billion in Taiwan, China (including Hong Kong) and Singapore, respectively, for fiscal 2009.2011. |
| |
|
| (4) | | Includes property, plant and equipment, net, of $231.3$273.4 million $178.2, $266.7 million and $179.6$231.3 million in the United States for fiscal 2011, 20102013, 2012 and 2009,2011, respectively. |
| |
|
| (5) | | Includes property, plant and equipment, net, of $92.8$92.7 million $23.4, $45.1 million, and $16.4$13.1 million in Germany, Belgium and the United Kingdom, respectively, for fiscal 2011.2013. Fiscal 20102012 includes property, plant and equipment, net, of $48.0$90.6 million in Germany, $20.4$26.4 million in Belgium and $13.4$17.3 million in the United Kingdom. Fiscal 20092011 includes property, plant and equipment, net, of $41.4$92.8 million in Germany, $24.2$23.4 million in Belgium and $26.8$16.4 million in the United Kingdom. |
The Company manages its business based upon the operating results of its two operating groups before impairment charges (see Note 6) and restructuring, integration and other charges (see Note 17). In fiscal 2011, 2010 and 2009, presented above, the unallocated pre-tax impairment charges and restructuring, integration and other items related to EM and TS, respectively, were $27,879,000 and $38,146,000 in fiscal 2011, $14,701,000 and $10,579,000 in fiscal 2010 and $1,116,335,000 and $389,561,000 in fiscal 2009, respectively. The remaining restructuring, integration and other items in each year relate to corporate activities.
Listed in the table below are the major product categories and the Company’s approximate sales of each during the past three fiscal years:
| | | | | | | | | | | | | |
| | | Years Ended | |
| | | July 2, | | | July 3, | | | June 27, | |
| | | 2011 | | | 2010 | | | 2009 | |
| | | (Millions) | |
| Semiconductors | | $ | 14,149.3 | | | $ | 10,098.7 | | | $ | 8,324.0 | |
| Computer products | | | 10,284.6 | | | | 7,302.8 | | | | 6,393.4 | |
| Connectors | | | 1,041.4 | | | | 841.4 | | | | 735.2 | |
| Passives, electromechanical and other | | | 1,059.1 | | | | 917.3 | | | | 777.3 | |
| | | | | | | | | | |
| | | $ | 26,534.4 | | | $ | 19,160.2 | | | $ | 16,229.9 | |
| | | | | | | | | | |
68
|
| | | | | | | | | | | |
| | Years Ended |
| | June 29,
2013 | | June 30,
2012 | | July 2,
2011 |
| | (Millions) |
| Semiconductors | $ | 13,720.8 |
| | $ | 13,461.6 |
| | $ | 14,149.3 |
|
| Computer products | 9,346.0 |
| | 9,984.4 |
| | 10,284.6 |
|
| Connectors | 687.6 |
| | 667.5 |
| | 1,041.4 |
|
| Passives, electromechanical and other | 1,704.5 |
| | 1,594.0 |
| | 1,059.1 |
|
| | $ | 25,458.9 |
| | $ | 25,707.5 |
| | $ | 26,534.4 |
|
17. Restructuring, integration and other charges
Fiscal 2013
During fiscal 2013, the Company initiated actions to reduce costs in both operating groups in response to current market conditions and incurred acquisition and integration costs associated with acquired businesses. As a result, the Company incurred restructuring, integration and other charges as presented in the following table.
|
| | | |
| | Year Ended |
| | June 29, 2013 |
| | (Thousands) |
| Restructuring charges | $ | 120,048 |
|
| Integration costs | 35,742 |
|
| Acquisition costs and adjustments | (3,224 | ) |
| Reversal of excess prior year restructuring reserves | (3,065 | ) |
| Pre-tax restructuring, integration and other charges | $ | 149,501 |
|
| After tax restructuring, integration and other charges | $ | 116,382 |
|
| Restructuring, integration and other charges per share on a diluted basis | $ | 0.83 |
|
AVNET, INC. AND SUBSIDIARIES
NOTES TO CONSOLIDATED FINANCIAL STATEMENTS — (Continued)
The activity related to the restructuring charges incurred during fiscal 2013 is presented in the following table:
|
| | | | | | | | | | | | | | | |
| | Severance Reserves | | Facility Exit Costs | | Other | | Total |
| | (Thousands) |
| Fiscal 2013 pre-tax charges | $ | 73,337 |
| | $ | 34,373 |
| | $ | 12,338 |
| | $ | 120,048 |
|
| Cash payments | (47,930 | ) | | (3,421 | ) | | (2,116 | ) | | (53,467 | ) |
| Non-cash write-downs | — |
| | (14,550 | ) | | (9,765 | ) | | (24,315 | ) |
| Other, principally foreign currency translation | (153 | ) | | (191 | ) | | (87 | ) | | (431 | ) |
| Balance at June 29, 2013 | $ | 25,254 |
| | $ | 16,211 |
| | $ | 370 |
| | $ | 41,835 |
|
Severance charges recorded in fiscal 2013 related to the reduction of over 1,600 employees in sales and business support functions in connection with the cost reduction actions taken in all three regions in both operating groups with employee reductions of 1,100 in EM, 400 in TS and 150 in business support functions. Facility exit costs for vacated facilities related to 32 facilities in the Americas, 26 in EMEA and 11 in the Asia region and consisted of reserves for remaining lease liabilities and the write-down of fixed assets. Other restructuring charges related primarily to other onerous lease obligations that have no ongoing benefit to the Company as well as a loss of $6,634,000 recognized in the third quarter of fiscal 2013 from the write-down of the net assets and goodwill associated with the planned exit of a non-integrated business in the EM Americas region that occurred in the fourth quarter of fiscal 2013. Of the $120,048,000 pre-tax restructuring charges recorded during fiscal 2013, $68,873,000 related to EM, $47,965,000 related to TS and $3,209,000 related to business support functions. As of June 29, 2013, management expects the majority of the remaining severance reserves to be utilized by the end of fiscal 2015, facility exit cost reserves to be utilized by the end of fiscal 2018, and other to be utilized by 2014.
Integration costs incurred related to the integration of acquired businesses and incremental costs incurred as part of the consolidation and closure of certain office and warehouse locations. Integration costs included IT consulting costs for system integration assistance, facility moving costs, legal fees, and travel, meeting, marketing and communication costs that were incrementally incurred as a result of the integration activity. Also included in integration costs are incremental salary costs associated with the consolidation and closure activities as well as costs associated with acquisition activity, primarily related to the acquired businesses' personnel who were retained by Avnet following the close of the acquisitions solely to assist in the integration of the acquired businesses' IT systems and administrative and logistics operations into those of Avnet. These identified personnel have no other meaningful day-to-day operational responsibilities outside of the integration effort. Included in integration costs during the third quarter of fiscal 2013 is a loss of $8,789,000 related to the exit of two multi-employer pension plans associated with acquired entities in Japan.
Acquisition costs incurred during fiscal 2013 related primarily to professional fees for advisory services and legal and accounting due diligence procedures and other legal costs associated with acquisitions.
During fiscal 2013, the Company recorded credits to restructuring, integration and other charges related to the reversal of restructuring reserves established in prior years that were deemed to be no longer required. Included in acquisition related costs is a credit of $11,172,000 related to the reversal of an earn-out liability for which payment is no longer expected to be incurred.
AVNET, INC. AND SUBSIDIARIES
NOTES TO CONSOLIDATED FINANCIAL STATEMENTS — (Continued)
Fiscal 2012
During fiscal 2012, the Company incurred charges related primarily to the acquisition and integration activities associated with acquired businesses (see Note 2) and also recorded credits related to prior restructuring reserves and acquisition adjustments. |
| | | |
| | Year Ended |
| | June 30, 2012 |
| | (Thousands) |
| Restructuring charges | $ | 50,253 |
|
| Integration costs | 9,392 |
|
| Acquisition costs | 10,561 |
|
| Reversal of excess prior year restructuring reserves | (3,286 | ) |
| Prior year acquisition adjustments | 6,665 |
|
| Pre-tax restructuring, integration and other charges | $ | 73,585 |
|
| After tax restructuring, integration and other charges | $ | 52,963 |
|
| Restructuring, integration and other charges per share on a diluted basis | $ | 0.35 |
|
The fiscal 2013 activity related to the remaining restructuring reserves from fiscal 2012 is presented in the following table:
|
| | | | | | | | | | | | | | | |
| | Severance Reserves | | Facility Exit Costs | | Other | | Total |
| | (Thousands) |
| Balance at June 30, 2012 | $ | 9,746 |
| | $ | 4,544 |
| | $ | 1,347 |
| | $ | 15,637 |
|
| Cash payments | (7,899 | ) | | (2,495 | ) | | (939 | ) | | (11,333 | ) |
| Adjustments | (1,091 | ) | | (1,019 | ) | | (153 | ) | | (2,263 | ) |
| Other, principally foreign currency translation | 183 |
| | 14 |
| | 33 |
| | 230 |
|
| Balance at June 29, 2013 | $ | 939 |
| | $ | 1,044 |
| | $ | 288 |
| | $ | 2,271 |
|
Severance charges recorded in fiscal 2012 related to over 800 employees in sales, administrative and finance functions in connection with the cost reduction actions taken in all three regions in both operating groups with employee reductions of approximately 480 in EM and 320 in TS. Facility exit costs for vacated facilities related to 12 facilities in the Americas, 5 in EMEA and 13 in the Asia/Pac region and consisted of reserves for remaining lease liabilities and the write-down of leasehold improvements and other fixed assets. Other restructuring charges related primarily to other onerous lease obligations that have no ongoing benefit to the Company. Of the $50,253,000 pre-tax restructuring charges recorded during fiscal 2012, $27,537,000 related to EM and $22,716,000 related to TS and the remaining related to corporate charges. As of June 29, 2013, management expects the majority of the remaining severance reserves to be utilized by the end of fiscal 2016 and the remaining facility exit cost and other reserves to be utilized by the end of fiscal 2014.
Integration costs incurred related to the integration of acquired businesses and incremental costs incurred as part of the consolidation and closure of certain office and warehouse locations. Integration costs included IT consulting costs for system integration assistance, facility moving costs, legal fees, and travel, meeting, marketing and communication costs that were incrementally incurred as a result of the integration activity. Also included in integration costs are incremental salary costs associated with the consolidation and closure activities as well as costs associated with acquisition activity, primarily related to the acquired businesses' personnel who were retained by Avnet following the close of the acquisitions solely to assist in the integration of the acquired businesses' IT systems and administrative and logistics operations into those of Avnet. These identified personnel have no other meaningful day-to-day operational responsibilities outside of the integration effort.
Acquisition transaction costs incurred during fiscal 2012 related primarily to professional fees for advisory services and legal and accounting due diligence procedures and other legal costs associated with acquisitions.
During fiscal 2012, the Company recorded credits to restructuring, integration and other charges related to the reversal of restructuring reserves established in prior years that were deemed to be no longer required.
AVNET, INC. AND SUBSIDIARIES
NOTES TO CONSOLIDATED FINANCIAL STATEMENTS — (Continued)
In addition, the Company recorded $6,665,000 for (i) a legal claim associated with an acquired business and a potential royalty claim related to periods prior to acquisition by Avnet and (ii) a legal claim associated with an indemnification of a prior divested business.
Fiscal 2011
During fiscal 2011, the Company incurred charges related primarily to the acquisition and integration activities associated with acquired businesses (see Note 2) and also recorded credits related to prior restructuring reserves and acquisition adjustments. | | | | | | | | | |
| | | Year Ended | | Year Ended |
| | | July 2, 2011 | | July 2, 2011 |
| | | (Thousands) | | (Thousands) |
| Restructuring charges | | $ | 47,763 | | $ | 47,763 |
|
| Integration costs | | 25,068 | | 25,068 |
|
| Acquisition costs | | 15,597 | | 15,597 |
|
| Reversal of excess prior year restructuring reserves | | | (6,076 | ) | (6,076 | ) |
| Prior year acquisition adjustments | | | (5,176 | ) | (5,176 | ) |
| | | | | |
| Pre-tax restructuring, integration and other charges | | $ | 77,176 | | $ | 77,176 |
|
| | | | | |
| After tax restructuring, integration and other charges | | $ | 56,169 | | $ | 56,169 |
|
| | | | | |
| Restructuring, integration and other charges per share on a diluted basis | | $ | 0.36 | | $ | 0.36 |
|
| | | | | |
The activity related to the restructuring reserves established during fiscal 2011 is presented in the following table:
| | | | | | | | | | | | | | | | | |
| | | Severance | | | Facility | | | | | | | |
| | | Reserves | | | Exit Costs | | | Other | | | Total | |
| | | (Thousands) | |
| Fiscal 2011 pre-tax charges | | $ | 28,584 | | | $ | 17,331 | | | $ | 1,848 | | | $ | 47,673 | |
| Cash payments | | | (19,142 | ) | | | (5,651 | ) | | | (787 | ) | | | (25,580 | ) |
| Non-cash write downs | | | — | | | | (3,278 | ) | | | (51 | ) | | | (3,329 | ) |
| Adjustments | | | (293 | ) | | | (349 | ) | | | (223 | ) | | | (865 | ) |
| Other, principally foreign currency translation | | | 654 | | | | 241 | | | | 251 | | | | 1,146 | |
| | | | | | | | | | | | | |
| Balance at July 2, 2011 | | $ | 9,803 | | | $ | 8,294 | | | $ | 1,038 | | | $ | 19,135 | |
| | | | | | | | | | | | | |
Severance charges recorded in fiscal 2011 related to personnel reductions of over 550 employees in administrative, finance and sales functions primarily in connection with the integration of the acquired Bell business into the existing EM Americas, TS Americas and TS EMEA regions and, to a lesser extent, other cost reduction actions. Facility exit costs consisted of lease liabilities, fixed asset write-downs and other related charges associated with 50 vacated facilities: 23 in the Americas, 25 in EMEA and two2 in the Asia/Pac region. As of July 2, 2011, management expects the majority of the remaining severance reserves to be utilized by the end of fiscal 2012 and the remaining facility exit cost reserves to be utilized by the end of fiscal 2014.
Integration costs incurred related to the integration of acquired businesses and incremental costs incurred as part of the consolidation and closure of certain office and warehouse locations. Integration costs included professional fees associated with legal and IT consulting costs for system integration assistance, facility moving costs, legal fees, travel, meeting, marketing and communication costs that were incrementally incurred as a result of the integration efforts of acquired businesses.activity. Also included in integration costs are incremental salary costs associated with the consolidation and employee benefitclosure activities as well as costs associated with acquisition activity, primarily ofrelated to the acquired businesses’businesses' personnel who were retained by Avnet for extended periods following the close of the acquisitions solely to assist in the integration of the acquired business’businesses' IT systems and administrative and logistics operations into those of Avnet. These identified personnel have no other meaningful day-to-day operational responsibilities outside of the integration effort.
Acquisition costs incurred during fiscal 2011 related primarily to professional fees for advisory and broker services, legal and accounting due diligence, and other legal costs associated with the acquisition.
During fiscal 2011, the Company recorded credits to restructuring, integration and other charges related to (i) the reversal of restructuring reserves established in prior years that were deemed to be no longer required, (ii) acquisition adjustments for which the purchase allocation period had closed and (iii) exit-related reserves originally established through goodwill in prior years that were deemed no longer required, which were credited to the consolidated statementrequired.
AVNET, INC. AND SUBSIDIARIES
NOTES TO CONSOLIDATED FINANCIAL STATEMENTS — (Continued)
Fiscal 2011 and prior reserve activity
Fiscal 2010
During fiscal 2010, the Company recognized restructuring, integration and other charges related to remaining cost reduction actions announced in fiscal 2009 which were taken in response to market conditions as well as integration costs associated with acquired businesses inIn addition to a value-added tax exposure and acquisition-related costs partially offset by a credit related to priorthe fiscal 2011 restructuring reserves.
| | | | | |
| | | Year Ended | |
| | | July 3, 2010 | |
| | | (Thousands) | |
| Restructuring charges | | $ | 15,991 | |
| Integration costs | | | 2,931 | |
| Value-added tax exposure | | | 6,477 | |
| Other | | | 3,261 | |
| Reversal of excess restructuring reserves recorded in prior periods | | | (3,241 | ) |
| | | | |
| Pre-tax restructuring, integration and other charges | | $ | 25,419 | |
| | | | |
| After tax restructuring, integration and other charges | | $ | 18,789 | |
| | | | |
| Restructuring, integration and other charges per share on a diluted basis | | $ | 0.12 | |
| | | | |
Restructuring charges incurred in fiscal 2010 consisted of severance, facility exit costs and other charges. Severance charges were related to personnel reductions of over 150 employees in administrative, finance and sales functions in connection with the cost reduction actions in all three regions. Facility exit costs consisted of lease liabilities and fixed asset write-downs associated with seven vacated facilities in the Americas, one in EMEA and four in the Asia/Pac region. Other charges consisted primarily of contractual obligations with no on-going benefit to the Company.
During fiscal 2010,activity, the Company incurred integration costs for professional fees, facility moving costs and travel, meeting, marketing and communication costs that were incrementally incurred as a result of the integration efforts of previously acquired businesses.
Also during fiscal 2010, the Company recognized a charge for a value-added tax exposure in Europe related to an audit of prior years and otherrestructuring charges related primarily to acquisition-related costs which would have been capitalized under prior accounting rules. In addition, the Company recognized a credit to reverse restructuring reserves which were determined to be no longer necessary.
plans. The fiscal 20112013 activity related to the remaining reserves associated with these restructuring chargesactions is presented in the following table:
| | | | | | | | | | | | | | | | | |
| | | Severance | | | Facility | | | | | | | |
| | | Reserves | | | Exit Costs | | | Other | | | Total | |
| | | (Thousands) | |
| Balance at July 3, 2010 | | $ | 539 | | | $ | 1,405 | | | $ | 1,836 | | | $ | 3,780 | |
| Cash payments | | | (400 | ) | | | (279 | ) | | | (443 | ) | | | (1,122 | ) |
| Adjustments | | | (144 | ) | | | (903 | ) | | | 421 | | | | (626 | ) |
| Other, principally foreign currency translation | | | 22 | | | | 9 | | | | 152 | | | | 183 | |
| | | | | | | | | | | | | |
| Balance at July 2, 2011 | | $ | 17 | | | $ | 232 | | | $ | 1,966 | | | $ | 2,215 | |
| | | | | | | | | | | | | |
|
| | | | | | | | | | | | | | | |
| | Severance Reserves | | Facility Exit Costs | | Other | | Total |
| | (Thousands) |
| Balance at June 30, 2012 | $ | 443 |
| | $ | 4,977 |
| | $ | 905 |
| | $ | 6,325 |
|
| Cash payments | (138 | ) | | (2,791 | ) | | (120 | ) | | (3,049 | ) |
| Adjustments | (158 | ) | | (616 | ) | | (117 | ) | | (891 | ) |
| Other, principally foreign currency translation | 20 |
| | 12 |
| | (1 | ) | | 31 |
|
| Balance at June 29, 2013 | $ | 167 |
| | $ | 1,582 |
| | $ | 667 |
| | $ | 2,416 |
|
As of July 2, 2011,June 29, 2013, management expects the majority of the remaining severance and other reserves to be utilized by the end of fiscal 20122020 and the remaining facility exit cost reserves to be utilized by the end of fiscal 2013.2016.
70
AVNET, INC. AND SUBSIDIARIES
NOTES TO CONSOLIDATED FINANCIAL STATEMENTS — (Continued)
Fiscal 2009
In response to the decline in sales and gross profit margin due to weaker market conditions, the Company initiated significant cost reduction actions during fiscal 2009 in order to realign its expense structure with market conditions. As a result, the Company incurred restructuring, integration and other charges during fiscal 2009 related to the cost reductions as well as integration costs associated with recently acquired businesses as presented in the following table.
| | | | | |
| | | Year Ended | |
| | | June 27, 2009 | |
| | | (Thousands) | |
| Restructuring charges | | $ | 84,976 | |
| Integration costs | | | 11,160 | |
| Reversal of excess prior year restructuring reserves | | | (2,514 | ) |
| Prior year acquisition adjustments | | | (1,201 | ) |
| Loss on investment | | | 3,091 | |
| Incremental amortization | | | 3,830 | |
| | | | |
| Pre-tax restructuring, integration and other charges | | $ | 99,342 | |
| | | | |
| After tax restructuring, integration and other charges | | $ | 65,310 | |
| | | | |
| Restructuring, integration and other charges per share on a diluted basis | | $ | 0.43 | |
| | | | |
Restructuring charges included severance, facility exit costs and other charges. Severance charges related to personnel reductions of approximately 1,900 employees in administrative, finance and sales functions in connection with the cost reduction actions in all three regions of both operating groups with employee reductions of approximately 1,400 in EM, 400 in TS and the remaining from centralized support functions. Exit costs for vacated facilities related to 29 facilities in the Americas, 13 in EMEA and three in Asia/Pac. Other charges included fixed asset write-downs and contractual obligations with no on-going benefit to the Company. The Company also recorded a reversal for severance, lease and other reserves that were deemed excessive and was credited to restructuring, integration and other charges. Integration costs included professional fees, facility moving costs, travel, meeting, marketing and communication costs that were incrementally incurred as a result of the acquisition integration efforts. Other items recorded to restructuring, integration and other charges included a net credit related to acquisition adjustments for which the purchase allocation period had closed, a loss resulting from a decline in the market value of certain small investments that the Company liquidated, and incremental intangible asset amortization.
The following table presents the activity during fiscal 2011 related to restructuring reserves established as part of this plan:
| | | | | | | | | | | | | | | | | |
| | | Severance | | | Facility | | | | | | | |
| | | Reserves | | | Exit Costs | | | Other | | | Total | |
| | | (Thousands) | |
| Balance at July 3, 2010 | | $ | 1,920 | | | $ | 17,136 | | | $ | 1,634 | | | $ | 20,690 | |
| Cash payments | | | (1,432 | ) | | | (7,551 | ) | | | (414 | ) | | | (9,397 | ) |
| Adjustments | | | (319 | ) | | | (4,161 | ) | | | (1,703 | ) | | | (6,183 | ) |
| Other, principally foreign currency translation | | | 130 | | | | 175 | | | | 483 | | | | 788 | |
| | | | | | | | | | | | | |
| Balance at July 2, 2011 | | $ | 299 | | | $ | 5,599 | | | $ | — | | | $ | 5,898 | |
| | | | | | | | | | | | | |
As of July 2, 2011, management expects the majority of the remaining severance reserves to be utilized by the end of fiscal 2012 and the remaining facility exit cost reserves to be utilized by the end of fiscal 2015.
Fiscal 2008 and prior restructuring reserves
In fiscal 2008 and prior, the Company incurred restructuring charges under four separate restructuring plans of which two are remaining. As of July 2, 2011, the remaining reserves associated with these actions totaled $801,000 which are expected to be fully utilized by the end of fiscal 2012.
71
AVNET, INC. AND SUBSIDIARIES
NOTES TO CONSOLIDATED FINANCIAL STATEMENTS — (Continued)
18. Summary of quarterly results (unaudited):
| | | | | | | | | | | | | | | | | | | | | |
| | | First | | | Second | | | Third | | | Fourth | | | | |
| | | Quarter | | | Quarter | | | Quarter | | | Quarter | | | Year(a) | |
| | | (Millions, except per share amounts) | |
2011(b) | | | | | | | | | | | | | | | | | | | | |
| Sales | | $ | 6,182.4 | | | $ | 6,767.5 | | | $ | 6,672.4 | | | $ | 6,912.1 | | | $ | 26,534.4 | |
| Gross profit | | | 723.1 | | | | 773.2 | | | | 786.6 | | | | 824.9 | | | | 3,107.8 | |
| Net income | | | 138.2 | | | | 141.0 | | | | 151.0 | | | | 238.8 | | | | 669.1 | |
| Diluted earnings per share | | | 0.90 | | | | 0.91 | | | | 0.98 | | | | 1.54 | | | | 4.34 | |
2010(c) | | | | | | | | | | | | | | | | | | | | |
| Sales | | $ | 4,355.0 | | | $ | 4,834.5 | | | $ | 4,756.8 | | | $ | 5,213.8 | | | $ | 19,160.2 | |
| Gross profit | | | 499.7 | | | | 551.9 | | | | 582.8 | | | | 645.8 | | | | 2,280.2 | |
| Net income | | | 50.9 | | | | 103.9 | | | | 114.5 | | | | 141.1 | | | | 410.4 | |
| Diluted earnings per share | | | 0.33 | | | | 0.68 | | | | 0.75 | | | | 0.92 | | | | 2.68 | |
|
| | | | | | | | | | | | | | | | | | | | |
| | | First Quarter | | Second Quarter | | Third Quarter | | Fourth Quarter | | Year(a) |
| | | (Millions, except per share amounts) |
| (b) | 2013 | | | | | | | | | |
| | Sales | $ | 5,870.1 |
| | $ | 6,699.5 |
| | $ | 6,298.7 |
| | $ | 6,590.7 |
| | $ | 25,459.0 |
|
| | Gross profit | 684.4 |
| | 768.5 |
| | 756.0 |
| | 770.9 |
| | 2,979.8 |
|
| | Net income | 100.3 |
| | 137.5 |
| | 86.2 |
| | 126.1 |
| | 450.1 |
|
| | Diluted earnings per share | 0.70 |
| | 0.99 |
| | 0.62 |
| | 0.91 |
| | 3.21 |
|
| (c) | 2012 | | | | | | | | | |
| | Sales | $ | 6,426.0 |
| | $ | 6,693.6 |
| | $ | 6,280.5 |
| | $ | 6,307.4 |
| | $ | 25,707.5 |
|
| | Gross profit | 753.6 |
| | 784.1 |
| | 753.8 |
| | 759.0 |
| | 3,050.5 |
|
| | Net income | 139.0 |
| | 147.0 |
| | 147.6 |
| | 133.4 |
| | 567.0 |
|
| | Diluted earnings per share | 0.90 |
| | 0.98 |
| | 1.00 |
| | 0.91 |
| | 3.79 |
|
______________________
| | |
| (a) | | Quarters may not add to the year due to rounding. |
| |
| (b) | | First quarter of fiscal 20112013, results were impacted by restructuring, integration and other charges which totaled $28.1of $37.4 million pre-tax, $20.2$27.1 million after tax and $0.13$0.19 per share on a diluted basis. RestructuringThe charges consisted of severance, costs, facility exit costs, integration costs, transaction costs, other restructuring charges, and other charges resulting from acquisition related integration activities. Integration costs included professional fees and salary and benefit costs related primarilya credit to the acquired businesses’ personnel retained by the Company for extended periods to assist with integrations. Other charges consisted of broker fees, professional fees for legal and accounting and due diligence, and other related costs associated with the Bell, Tallard and Unidux acquisitions. In addition, theadjust prior year restructuring reserves. The Company recognized a gain on bargain purchase of $31.0$31.3 million pre- and after tax and $0.20$0.22 per share on a diluted basis in connection with its Unidux acquisition.related to the acquisition of Internix, Inc., and an income tax adjustment of $12.2 million primarily related to a favorable settlement of an income tax audit. Second quarter results were impacted by restructuring, integration and other charges which totaled $29.1of $24.9 million pre-tax, $20.8$19.9 million after tax and $0.14 per share on a diluted basis incurred primarily in connection with the acquisitions and integrations of acquired businesses. The Company also recorded a reversal of $3.5 million pre-tax primary related to the reversal of restructuring reserves established in prior years which were no longer needed. Third quarter of fiscal 2011 results were impacted by restructuring, integration and other charges which totaled $16.3 million pre-tax, $11.9 million after tax and $0.08 per share on a diluted basis incurred primarily in connection with the acquisitions and integrations of acquired businesses. In addition, the Company recognized a loss of $6.3 million pre-tax, $3.9 million after tax and $0.02 per share on a diluted basis related to the write down of investments in smaller technology start-up companies. Fourth quarter of fiscal 2011 results were impacted by restructuring, integration and other charges which totaled $7.3 million pre-tax, $5.8 million after tax and $0.04$0.14 per share on a diluted basis. The Company also reversed $3.6 million pre-tax, $2.5 million after tax and $0.02 per share on a diluted basis for restructuring and purchase accounting reserves determined not to be needed. In addition, fourth quarter results included a tax benefit of $52.7 million, or $0.34 per share on a diluted basis, primarily related to the release of a tax valuation allowance for which the tax asset was determined to be realizable. |
|
(c) | | First quarter of fiscal 2010 results were impacted by restructuring, integration and other charges which totaled $18.1 million pre-tax, $13.2 million after tax and $0.09 per share on a diluted basis. Restructuring charges consisted of severance, costs, facility exit costs and fixed asset write-downs, related to previously announced cost reduction actions. The Company recognizedintegration costs, transaction costs, other charges, and a reversal of excessto adjust prior year restructuring reserves and also recognized integration costs associated with acquired businesses and other charges. In addition, thereserves. The Company recognizedrecorded a net gain of $0.1 million pre- and after tax share consisting of an adjustment of $1.7 million pre-and after tax to increase the gain on bargain purchase recorded in taxesthe first quarter of $3.1 million and $0.02 per share2013 offset by a loss on a diluted basisdivestiture related to a small business in TS Asia. The Company also recorded an income tax adjustment forof $17.4 million related to a prior year tax return and additional tax reserves, netfavorable audit settlement of a benefit from a favorableU.S. income tax audit settlement. Second quarter results were impacted by a gain on the sale of assets of $5.5 million pre-tax, $3.4 million after tax and $0.02 per share on a diluted basis as a result of certain earn-out provisions associated with the earlier sale of the Company’s equity investment in Calence LLC.for an acquired company. Third quarter of fiscal 2010 results were impacted by restructuring, integration and other charges of $7.3$27.3 million pre-tax, $5.6$25.8 million after tax and $0.04$0.18 per share on a diluted basis which included (i) $6.5basis. The charges consisted of severance, facility exit costs, integration costs, transaction costs, other restructuring charges, and a credit to adjust prior year restructuring reserves. The Company recorded a loss of $8.8 million pre-tax for a value-added tax exposure in Europe relatedintegration-related costs due to an auditthe exit of prior years, (ii) $2.1 million pre-tax related to acquisition-related costs, and (iii)two multi-employer pension plans associated with acquired entities in Japan, a credit of $1.3$11.2 million pre-tax in acquisition charges related to reversalsthe reversal of an earn-out liability, and $6.6 million in other charges related to the write- |
AVNET, INC. AND SUBSIDIARIES
NOTES TO CONSOLIDATED FINANCIAL STATEMENTS — (Continued)
down of the net assets and goodwill associated with the planned exit of a non-integrated business in the EM Americas region. The Company also recorded an income tax adjustment of $13.4 million primarily related to the increase to a valuation allowance against existing deferred tax assets and increases to tax reserves. Fourth quarter results were impacted by restructuring, integration and other charges of $59.8 million pre-tax, $43.6 million after tax and $0.31 per share on a diluted basis. These charges included severance, facility exit costs, integration costs, transaction costs, other restructuring charges and other charges related to legal claims. The Company recorded a small adjustment to the gain on bargain purchase related to the business in Japan acquired in the third quarter. The Company also recorded a net tax benefit of $34.2 million, which is comprised of (i) a tax benefit of $41.6 million for the release of valuation allowances against deferred tax assets that were determined to be realizable during the fourth quarter of fiscal 2013, (ii) a tax benefit of $6.7 million related to the release of existing reserves due to audit settlement and statute expiration, partially offset by (iii) a tax provision of $14.1 million primarily related to the establishment of tax reserves against deferred tax assets that were determined to be unrealizable during the fourth quarter of fiscal 2013.
| |
| (c) | Second quarter of fiscal 2012 included restructuring, reserves no longer deemed necessary. In addition, third quarter results were impacted by a gain on the saleintegration and other charges of assets of $3.2$34.5 million pre-tax, $1.9$23.6 million after tax and $0.01$0.16 per share on a diluted basis asbasis. The charges consisted of severance, facility exit costs, integration costs, transaction costs, other restructuring charges, and a result of a final earn-out payment associated with the earlier sale of the Company’s equity investment in Calence LLCcredit to adjust prior year restructuring reserves. The Company also recorded $1.4 million pre-tax, $0.9 million after tax and were impacted by a net tax benefit of $2.3 million and $0.02$0.01 per share on a diluted basis related to adjustmentsthe write-down of a small investment and the write-off of deferred financing costs associated with the early retirement of a credit facility, and an income tax adjustment of $0.5 million primarily related to the combination of a favorable audit settlement and release of a valuation allowance on certain deferred tax assets which were determined to be realizable, mostly offset by changes to existing tax positions primarily for transfer pricing. Third quarter results were impacted by restructuring, integration and other charges of $18.6 million pre-tax, $13.7 million after tax and $0.10 per share on a diluted basis. The charges consisted of severance, facility exit costs, fixed asset write-downs, integration costs, transaction costs, other charges, and a reversal to adjust prior year restructuring reserves. The Company also recognized a gain on bargain purchase of $4.5 million pre- and after tax returnand $0.03 per share on a diluted basis related to the acquisition of Unidux Electronics Limited (Singapore), and an income tax adjustment of $5.2 million and $0.04 per share on a diluted basis related primarily to the combination of favorable audit settlements, certain reserve releases and the release of a valuation allowance on deferred tax assets which were determined to be realizable. Fourth quarter results were impacted by restructuring, integration and other charges of $20.5 million pre-tax, $15.7 million after tax and $0.11 per share on a diluted basis. These charges included severance, facility exit costs, integration costs, transaction costs, other restructuring charges and other charges related to legal claims. During the fourth quarter, the Company recognized a small adjustment to the gain on bargain purchase related to the business in Japan acquired in the third quarter; and a net tax benefit fromof $4.0 million and $0.03 per share on a favorable incomediluted basis which is comprised of (i) a tax audit settlementbenefit of $26.3 million for the release of tax reserves against deferred tax assets that were determined to be realizable during the fourth quarter of fiscal 2012, partially offset by additional(ii) a tax provision of $22.3 million primarily related to the impact of withholding tax related to legal entity reorganizations and the establishment of tax reserves for existingagainst deferred tax positions.assets that were determined to be unrealizable during the fourth quarter of fiscal 2012. |
72
SCHEDULE II
AVNET, INC. AND SUBSIDIARIES
VALUATION AND QUALIFYING ACCOUNTS
Years Ended June 29, 2013, June 30, 2012 and July 2, 2011 July 3, 2010 and June 27, 2009
| | | | | | | | | | | | | | | | | | | | | |
| Column A | | Column B | | | Column C | | | Column D | | | Column E | |
| | | | | | | Additions | | | | | | | | |
| | | Balance at | | | Charged to | | | Charged to | | | | | | | Balance at | |
| | | Beginning | | | Costs and | | | Other Accounts — | | | Deductions — | | | End of | |
| Description | | of Period | | | Expenses | | | Describe | | | Describe | | | Period | |
| | | (Thousands) | |
Fiscal 2011 | | | | | | | | | | | | | | | | | | | | |
| Allowance for doubtful accounts | | $ | 81,197 | | | $ | 39,255 | | | $ | — | | | $ | (12,713 | )(a) | | $ | 107,739 | |
| Valuation allowance on foreign tax loss carry-forwards (Note 9) | | | 331,423 | | | | (76,055 | )(b) | | | 55,404 | (c) | | | — | | | | 310,772 | |
Fiscal 2010 | | | | | | | | | | | | | | | | | | | | |
| Allowance for doubtful accounts | | | 85,477 | | | | 33,825 | | | | — | | | | (38,105 | )(a) | | | 81,197 | |
| Valuation allowance on foreign tax loss carry-forwards (Note 9) | | | 315,020 | | | | (1,338 | ) | | | 17,741 | (d) | | | — | | | | 331,423 | |
Fiscal 2009 | | | | | | | | | | | | | | | | | | | | |
| Allowance for doubtful accounts | | | 76,690 | | | | 32,777 | | | | 2,841 | (e) | | | (26,831 | )(a) | | | 85,477 | |
| Valuation allowance on foreign tax loss carry-forwards (Note 9) | | | 344,034 | | | | 5,697 | | | | (34,711 | )(f) | | | — | | | | 315,020 | |
|
| | | | | | | | | | | | | | | | | | | | |
| Column A | | Column B | | Column C | | Column D | | Column E |
| | | | | Additions | | | | |
| Description | | Balance at Beginning of Period | | Charged to Costs and Expenses | | Charged to Other Accounts — Describe | | Deductions — Describe | | Balance at End of Period |
| | | (Thousands) |
| Fiscal 2013 | | | | | | | | | | |
| Allowance for doubtful accounts | | $ | 106,319 |
| | $ | 30,802 |
| | $ | — |
| | $ | (41,465 | ) | (a) | $ | 95,656 |
|
| Valuation allowance on foreign tax loss carry-forwards (Note 9) | | 244,093 |
| | (41,572 | ) | (b) | 28,300 |
| (c) | — |
| | 230,821 |
|
| Fiscal 2012 | | | | | | | | | | |
| Allowance for doubtful accounts | | 107,739 |
| | 35,632 |
| | — |
| | (37,052 | ) | (a) | 106,319 |
|
| Valuation allowance on foreign tax loss carry-forwards (Note 9) | | 310,772 |
| | (30,785 | ) | (d) | (35,894 | ) | (e) | — |
| | 244,093 |
|
| Fiscal 2011 | | | | | | | | | | |
| Allowance for doubtful accounts | | 81,197 |
| | 39,255 |
| | — |
| | (12,713 | ) | (a) | 107,739 |
|
| Valuation allowance on foreign tax loss carry-forwards (Note 9) | | 331,423 |
| | (76,055 | ) | | 55,404 |
| (f) | — |
| | 310,772 |
|
______________________
| | |
| (a) | | Uncollectible accounts written off. |
| |
| (b) | | Represents a reduction primarily due to the release of valuation allowance in EMEA, of which $64,215,000$31,867,000 impacted the effective tax rate and $11,840,000 ofoffset by $4,812,000 , which did not impact the effective tax rate becauseimpacted deferred taxes and income tax payables associated with the release of the valuation allowance were recorded which offset a portion of the benefit as a result of the release (see Note 9). |
| |
| (c) | Primarily related to additional valuation allowances for newly acquired companies and companies with a history of losses. |
| |
| (d) | Represents a reduction primarily due to the release of valuation allowance in EMEA, of which $26,231,000 impacted the effective tax rate offset by $4,554,000 , which impacted deferred taxes associated with the release of the valuation allowance. |
| |
| (e) | Primarily relates to the translation impact of changes in foreign currency exchange rates and acquired valuation allowances. |
| |
(d) | (f) | Includes the impact of deferred tax rate changes, the translation impact of changes in foreign currency exchange rates and the increase of valuation allowance against associated deferred tax benefits as it was determined the related operating tax loss carry-forward cannot be utilized. |
|
(e) | | Includes allowance for doubtful accounts as a result of acquisitions. |
|
(f) | | Includes the impact of deferred tax rate changes and the translation impact of changes in foreign currency exchange rates. |
INDEX TO EXHIBITS
| | | | |
Exhibit | | |
Exhibit Number | | Exhibit |
| | | | | |
| 2.1 | * | | Agreement and Plan of Merger dated as of March 28, 2010, by and among Avnet, Inc., AVT Acquisition Corp. and Bell Microproducts Inc. (incorporated herein by reference to the Company’s Current Report on Form 8-K dated March 28, 2010, Exhibit 2.1). |
| | | | |
| 3.1 | | | Restated Certificate of Incorporation of the Company (incorporated herein by reference to the Company’sCompany's Current Report on Form 8-K dated February 12, 2001, Exhibit 3(i)).
|
| | | | | |
| 3.2 | | | By-laws of the Company, effective August 10, 200711, 2011 (incorporated herein by reference to the Company’sCompany's Current Report on Form 8-K dated August 15, 200716, 2011 Exhibit 3.1).
|
| | | | | |
| 4.1 | | | Indenture dated as of March 5, 2004, by and between the Company and JP Morgan Trust Company, National Association (incorporated herein by reference to the Company’s Current Report on Form 8-K dated March 8, 2004, Exhibit 4.1). |
| | | | | |
| 4.2 | | | Officers’Officers' Certificate dated August 19, 2005, establishing the terms of the 6.00% Notes due 2015 (incorporated herein by reference to the Company’sCompany's Current Report on Form 8-K dated August 19, 2005, Exhibit 4.2).
|
| | | | | |
| 4.3 | | | Officers’Officers' Certificate dated September 12, 2006, establishing the terms of the 6.625% Notes due 2016 (incorporated herein by reference to the Company’sCompany's Current Report on Form 8-K dated September 12, 2006, Exhibit 4.2).
|
| | | | | |
| 4.4 | | | Officers’ Certificate dated March 7, 2007, establishing the terms of the 5 7/8% Notes due 2014 (incorporated herein by reference to the Company’s Current Report on Form 8-K dated March 7, 2007, Exhibit 4.2). |
| | | | | |
| 4.5 | | | Indenture dated as of June 22, 2010, between the Company and Wells Fargo Bank, National Association, as Trustee, providing for the issuance of Debt Securities in one or more series (incorporated herein by reference to the Company’s Current Report on Form 8-K dated June 22, 2010, Exhibit 4.1). |
| | | | | |
| 4.6 | | | Officers’ Certificate establishing the terms of the 5.875% Notes due 2020 (incorporated herein by reference to the Company’s Current Report on Form 8-K dated June 22, 2010, Exhibit 4.2). |
| | | |
| 4.7 | | Officers' Certificate establishing the terms of the 4.875% Notes due 2022 (incorporated herein by reference to the Company's Current Report on Form 8-K dated November 21, 2012, Exhibit 4.1).
|
| | | |
| | | Note: The total amount of securities authorized under any other instrument that defines the rights of holders of the Company’s long-term debt does not exceed 10% of the total assets of the Company and its subsidiaries on a consolidated basis. Therefore, these instruments are not required to be filed as exhibits to this Report. The Company agrees to furnish copies of such instruments to the Commission upon request. |
| | | |
| | | Executive Compensation Plans and Arrangements |
| | | | | Executive Compensation Plans and Arrangements
|
| | | | |
| 10.1 | | | 2011 Amended and Restated Employment Agreement dated February 11, 2011 between the Company and Roy Vallee (incorporated herein by reference to the Company’s Current Report on Form 8-K dated February 14, 2011, Exhibit 10.1). |
| | | | |
| 10.2 | | | 2011 Amended and Restated Employment Agreement dated February 11, 2011 between the Company and Richard Hamada (incorporated herein by reference to the Company’s Current Report on Form 8-K dated February 14, 2011, Exhibit 10.2). |
| | | | | |
| 10.3 | 10.2 | | Form of Change of Control Agreement dated February 11, 2011 between the Company and each of Roy Vallee and Richard Hamada, Gerry Fay, Erin Lewin and Steve Phillips (incorporated herein by reference to the Company’s Current Report on Form 8-K dated February 14, 2011, Exhibit 10.3). |
| | | |
| 10.3 | * | Form of Employment Agreement by and between the Company and Erin Lewin.
|
| | |
| 10.4 | | | Form of Employment Agreement dated December 19, 2008 between the Company and each of its Executive Officers (other than Roy ValleePhillip Gallagher, Steve Phillips and Richard Hamada)Ray Sadowski (incorporated herein by reference to the Company’sCompany's Current Report on Form 8-K dated December 22, 2008, Exhibit 10.2).
|
| | | |
| 10.5 | * | Form of Employment Agreement between the Company and each of Gerry Fay and Harley Feldberg.
|
| | |
| 10.510.6 | | | Form of Change of Control Agreement dated December 19, 2008 between the Company and each of the Executive Officers (other than Roy ValleeHarley Feldberg, Phillip Gallagher, MaryAnn Miller, and Richard Hamada)Ray Sadowski (incorporated herein by reference to the Company’sCompany's Current Report on Form 8-K dated December 22, 2008, Exhibit 10.3).
|
74
| | | | |
Exhibit10.7 | | |
Number | | Letter Agreement by and between Kevin Moriarty and the Company (incorporated by reference to the Company's Current Report on Form 8-K dated December 12, 2012, Exhibit 10.1).
|
| | | | | |
| 10.6 | 10.8 | | Avnet 1995 Stock Option Plan (incorporated herein by reference to the Company’s Current Report on Form 8-K dated February 12, 1996, Exhibit 10). |
| | | |
|
| | |
Exhibit Number | | Exhibit |
| 10.7 | 10.9 | | Avnet 1996 Incentive Stock Option Plan (incorporated herein by reference to the Company’s Registration Statement on Form S-8, Registration No. 333-17271, Exhibit 99). |
| | | | | |
| 10.8 | 10.10 | | Amended and Restated Avnet 1997 Stock Option Plan (incorporated herein by reference to the Company’s Current Report on Form 8-K dated August 29, 2006, Exhibit 10.1). |
| | | | | |
| 10.9 | 10.11 | | Retirement Plan for Outside Directors of Avnet, Inc., (Amended and Restated Effective Generally as of January 1, 2009) (incorporated herein by reference to the Company’s Current Report on Form 8-K dated August 13, 2010, Exhibit 10.1). |
| | | | | |
| 10.10 | 10.12 | | Avnet, Inc. Deferred Compensation Plan for Outside Directors (Amended and Restated Effective Generally as of January 1, 2009) (incorporated herein by reference to the Company’s Current Report on Form 8-K dated August 13, 2010, Exhibit 10.2). |
| | | | | |
| 10.13 | 10.11 | | * | Avnet Supplemental Executive Officers’ Retirement Plan (Amended and Restated Effective Generally as of January 1, 2009) (incorporated herein by reference to the Company’s Current Report on Form 8-K dated August 13, 2010, Exhibit 10.3)(2013 Restatement). |
| | | |
| 10.14 | * | Avnet Restoration Plan (2013 Restatement). |
| | |
| 10.12 | 10.15 | | Avnet 1999 Stock Option Plan (incorporated herein by reference to the Company’s Current Report on Form 8-K dated August 29, 2006 Exhibit 10.2). |
| | | | | |
| 10.13 | 10.16 | | Avnet, Inc. Executive Incentive Plan (incorporated herein by reference to Appendix A to the Company’s Proxy Statement dated September 28, 2007)November 2, 2012, Exhibit 10.1). |
| | | | | |
| 10.14 | 10.17 | | Avnet, Inc. 2003 Stock Compensation Plan (Amended and Restated Effective Generally as of January 1, 2009) (incorporated herein by reference to the Company’s Current Report on Form 8-K dated August 13, 2010, Exhibit 10.4). |
| | | | | |
| 10.15 | 10.18 | | Avnet, Inc. 2003 Stock Compensation Plan: |
| | | | | (a) Form of nonqualified stock option agreement |
| | | | (b) Form of nonqualified stock option agreement for non-employee director |
| | | | | (c) Form of incentive stock option agreement |
| | | | (d) Form of performance stock unit term sheet |
| | | | | |
| | | | (incorporated herein by reference to the Company’s Current Report on Form 8-K dated August 29, 2006, Exhibit 10.3). |
| | | | | |
| 10.16 | 10.19 | | Avnet, Inc. 2006 Stock Compensation Plan (Amended and Restated Effective Generally as of January 1, 2009) (incorporated herein by reference to the Company’s Current Report on Form 8-K dated August 13, 2010, Exhibit 10.5). |
| | | | | |
| 10.17 | 10.20 | | Avnet, Inc. 2006 Stock Compensation Plan: |
| | | | (a) Form of nonqualified stock option agreement |
| | | | | (b) Form of nonqualified stock option agreement for non-employee director |
| | | | (c) Form of performance stock unit term sheet (revised effective August 13, 2009 by (f) below) |
| | | | | (d) Form of incentive stock option agreement |
| | | | (e) Long Term Incentive Letter |
| | | | | |
| | | | (incorporated herein by reference to the Company’s Current Report on Form 8-K dated May 16, 2007, Exhibit 99.1). |
| | | | | |
| | | | | (f) Form of performance stock unit term sheet (incorporated herein by reference to the Company’s Current Report on Form 8-K dated August 19, 2009, Exhibit 99.1). |
| | | | | |
| 10.18 | 10.21 | | Avnet, Inc. 2010 Stock Compensation Plan (incorporated herein by reference to Exhibit 10.1 to the Company’s Registration Statement on Form S-8, Registration No. 333-171291). |
75
| | | | |
Exhibit | | |
Number | | Exhibit |
| | | | |
| 10.19 | 10.22 | | Avnet, Inc. 2010 Stock Compensation Plan: |
| | | | (a) Form of nonqualified stock option agreement |
| | | | | (b) Form of incentive stock option agreement |
| | | | (c) Form of performance stock unit term sheet |
| | | | | (d) Form of Long Term Incentive Letterrestricted stock unit term sheet |
| | | |
|
| | |
Exhibit Number | | Exhibit |
| | | | (incorporated herein by reference to the Company’s Current Report on Form 8-K dated January 3, 2011,August 10, 2012, Exhibit 10.1). |
| | | | | |
| 10.20 | 10.23 | | Avnet Deferred Compensation Plan (Amended and Restated Effective Generally as of January 1, 2009) (incorporated herein by reference to the Company’s Current Report on Form 8-K dated August 13, 2010, Exhibit 10.6). |
| | | | | |
| 10.21 | **10.24 | | Amendment No. 1 to Avnet Deferred Compensation Plan (Amended and Restated Effective Generally as of January 1, 2009) (incorporated herein by reference to the Company's Annual Report on Form 10-K dated August 12, 2011, Exhibit 10.21). |
| | | | | |
| 10.22 | 10.25 | | Form of Indemnity Agreement. The Company enters into this form of agreement with each of its directors and officers (incorporated herein by reference to the Company’s Quarterly Report on Form 10-Q dated May 8, 2006, Exhibit 10.1). |
| | | | | |
| 10.23 | 10.26 | | Form option agreements for stock option plans (incorporated herein by reference to the Company’s Current Report on Form 8-K dated September 8, 2004, Exhibit 10.4). |
| | | | | (a) Non-Qualified stock option agreement for 1999 Stock Option Plan |
| | | | (b) Incentive stock option agreement for 1999 Stock Option Plan |
| | | | | (c) Incentive stock option agreement for 1996 Stock Option Plan |
| | | | (d) Non-Qualified stock option agreement for 1995 Stock Option Plan |
| | | |
| | | Bank Agreements |
| | | | | Bank Agreements
|
| | | | |
| 10.24 | 10.27 | | Securitization Program |
| | | | | |
| | | | | (a) Receivables Sale Agreement, dated as of June 28, 2001 between Avnet, Inc., as Originator, and Avnet Receivables Corporation as Buyer (incorporated herein by reference to the Company’s Current Report on Form 8-K dated September 26, 2002, Exhibit 10J). |
| | | | |
| | | | | (b) Amendment No. 1, dated as of February 6, 2002, to Receivables Sale Agreement in 10.24(a)10.27(a) above (incorporated herein by reference to the Company’s Current Report on Form 8-K dated September 26, 2002, Exhibit 10K). |
| | | | |
| | | | | (c) Amendment No. 2, dated as of June 26, 2002, to Receivables Sale Agreement in 10.24(a)10.27(a) above (incorporated herein by reference to the Company’s Current Report on Form 8-K dated September 26, 2002, Exhibit 10L). |
| | | | |
| | | | | (d) Amendment No. 3, dated as of November 25, 2002, to Receivables Sale Agreement in 10.24(a)10.27(a) above (incorporated herein by reference to the Company’s Current Report on Form 8-K dated December 17, 2002, Exhibit 10B). |
| | | | |
| | | | | (e) Amendment No. 4, dated as of December 12, 2002, to Receivables Sale Agreement in 10.24(a)10.27(a) above (incorporated herein by reference to the Company’s Current Report on Form 8-K dated December 17, 2002, Exhibit 10E). |
| | | | |
| | | | | (f) Amendment No. 5, dated as of August 15, 2003, to Receivables Sale Agreement in 10.24(a)10.27(a) above (incorporated herein by reference to the Company’s Current Report on Form 8-K dated September 15, 2003, Exhibit 10C). |
| | | | |
| | | | | (g) Amendment No. 6, dated as of August 3, 2005, to Receivables Sale Agreement in 10.24(a)10.27(a) above (incorporated herein by reference to the Company’s Current Report on Form 8-K dated September 13, 2005, Exhibit 10.1). |
| | | | |
| | | | | (h) Amendment No. 7, dated as of August 29, 2007, to Receivables Sale Agreement in 10.24(a)10.27(a) above (incorporated herein by reference to the Company’s Current Report on Form 8-K dated August 13, 2010, Exhibit 10.7). |
| | | | |
| | | | | (i) Amendment No. 8, dated as of August 26, 2010, to Receivables Sale Agreement in 10.24(a)10.27(a) above (incorporated herein by reference to the Company’s Current Report on Form 8-K dated September 1, 2010, Exhibit 10.2). |
76
| | | | |
Exhibit | | |
Number | | Exhibit |
| | | | |
| | | | | (j) Second Amended and Restated Receivables Purchase Agreement dated as of August 26, 2010 among Avnet Receivables Corporation, as Seller, Avnet, Inc., as Servicer, the Financial Institutions party thereto and JPMorgan Chase Bank, N.A. as Agent (incorporated herein by reference to the Company’s Current Report on Form 8-K dated September 1, 2010, Exhibit 10.1). |
| | | |
|
| | |
Exhibit Number | | Exhibit |
| | | | | (k) Amendment No. 1, dated as of December 28, 2010, to the Second Amended and Restated Receivables Purchase Agreement in 10.24(j)10.27(j) above (incorporated herein by reference to the Company’s Quarterly Report on Form 10-Q dated January 28, 2011, Exhibit 10.2). |
| | | | |
| | 10.25 | (l) Amendment No. 2, dated as of August 25, 2011, to the Second Amended and Restated Receivables Purchase Agreement in 10.27(j) above (incorporated herein by reference to the Company's Current Report on Form 8-K dated August 26, 2011, Exhibit 10.1). |
| | |
| | (m) Amendment No. 3 dated as of March 7, 2012, to the Second Amended and Restated Receivables Purchase Agreement in 10.27(j) above (incorporated herein by reference to the Company's Quarterly Report on Form 10-Q dated April 27, 2012, Exhibit 10.1). |
| | |
| | (n) Amendment No. 4 dated as of August 23, 2012, to the Second Amended and Restated Receivables Purchase Agreement in 10.27(j) above (incorporated herein by reference to the Company's Current Report on Form 8-K dated August 24, 2012, Exhibit 10.1).
|
| | |
| 10.28 | | Credit Agreement dated September 27, 2007as of November 18, 2011 among Avnet, Inc., Avnet Japan Co., Ltd., certain other subsidiaries, BancBank of America, Securities LLC,N.A., as administrative agent,Administrative Agent, and each lender thereto (incorporated herein by reference to the Company’s Current Report on Form 8-K dated September 28, 2007,November 22, 2011, Exhibit 10.1). |
| | | | | |
| 10.26 | | | Guaranty dated as of September 27, 2007 made by Avnet, Inc. to Bank of America, N.A., as administrative agent, and each of the lenders (incorporated herein by reference to the Company’s Current Report on Form 8-K dated September 28, 2007, Exhibit 10.2). |
| | | | |
| 12.1 | ** | | Ratio of Earnings to Fixed Charges. |
| | | | | |
| 21 | ** | | List of subsidiaries of the Company as of July 2, 2011.June 29, 2013. |
| | | | | |
| 23.1 | ** | | Consent of KPMG LLP. |
| | | | | |
| 31.1 | ** | | Certification pursuant to Section 302 of the Sarbanes-Oxley Act of 2002. |
| | | | | |
| 31.2 | ** | | Certification pursuant to Section 302 of the Sarbanes-Oxley Act of 2002. |
| | | | | |
| 32.1 | *** | | Certification pursuant to Section 906 of the Sarbanes-Oxley Act of 2002. |
| | | | | |
| 32.2 | *** | | Certification pursuant to Section 906 of the Sarbanes-Oxley Act of 2002. |
| | | | | |
| 101.INS | **** | | XBRL Instance Document. |
| | | | | |
| 101.SCH | **** | | XBRL Taxonomy Extension Schema Document. |
| | | | | |
| 101.CAL | **** | | XBRL Taxonomy Extension Calculation Linkbase Document. |
| | | | | |
| 101.LAB | **** | | XBRL Taxonomy Extension Label Linkbase Document. |
| | | | | |
| 101.PRE | **** | | XBRL Taxonomy Extension Presentation Linkbase Document. |
| | | | | |
| 101.DEF | **** | | XBRL Taxonomy Extension Definition Linkbase Document. |
|
| | |
| * | | This Exhibit does not include the Exhibits and Schedules thereto as listed in its table of contents. The Company undertakes to furnish any such Exhibits and Schedules to the Securities and Exchange Commission upon its request. |
|
** | | Filed herewith. |
| |
*** | | Furnished herewith. |
| |
**** | | To be filed within 30 days in accordance with Rule 405(a)(2) of Regulation S-T.Furnished herewith. |