


 |  |

| |
| U.S. Bank lapel pin signifying This year, we At U.S. Bancorp, we value and recognize the expertise and energy of our employees, especially their commitment to providing outstanding customer service and contributing to the corporation’s financial results. Each employee wears a our customer service guarantee. will acknowledge employees’ milestone service anniversaries with special gemstone lapel pins for service at five, 10, 15, 20 and 25 years. |


c o r p o r a t ep r o f i l e
U.S. Bancorp, headquartered in Minneapolis, is the 8th largest financial services holding company in the United States with total assets exceeding $189 billion at year-end 2003.
Through U.S. Bank® and other subsidiaries, U.S. Bancorp serves 11.6 million customers, primarily through 2,243 full-service branch offices in 24 states. Customers also access their accounts and conduct all or part of their banking transactions through 4,425 U.S. Bank ATMs, U.S. Bank Internet Banking and telephone banking. In addition, a network of specialized U.S. Bancorp offices and representatives across the nation serves customers inside and outside our 24-state footprint through comprehensive product sets that meet the financial needs of customers beyond basic core banking. Backed by expertise and advanced technology, these sophisticated U.S. Bancorp products and services include large corporate services, payment services, private banking, personal and institutional trust services, corporate trust services, specialized large-scale government banking services, mortgage, commercial credit vehicles, and financial and asset management services.
Major lines of business provided by U.S. Bancorp through U.S. Bank and other subsidiaries include Consumer Banking; Payment Services; Private Client, Trust & Asset Management; and Wholesale Banking. U.S. Bank is home of the exclusive U.S. Bank Five Star Service Guarantee.


At year-end 2004 | ||||
U.S. BANCORP AT A GLANCE | ||||
| Ranking | ||||
| Asset size | $ | |||
| Deposits | $ | |||
| $ | ||||
| Earnings per share (diluted) | $ | |||
| Return on average assets | ||||
| Return on average equity | ||||
| Tangible common equity | ||||
| Efficiency ratio | ||||
| Customers | ||||
| Primary banking region | 24 states | |||
| Bank branches | ||||
| ATMs | ||||
| NYSE symbol | USB | |||


| 2 | ||||
| 3 | ||||
| 4 |
in Action U.S. Bancorp employees deliver on our promise to provide the outstanding service our customers expect and deserve. | ||||||
| 6 | ||||||
 | Business Mix We help our customers achieve their financial goals by offering an extensive scope of strategic services through specialized lines of business. | 10 | ||||
 | Initiatives for Success We are increasing our ability to provide the highest quality service and the most innova- tive products through new investments and initiatives for future growth and service. | 14 |
| 64 | ||||||||
| 68 | ||||||||
| 105 | ||||||||
| 108 | ||||||||
| 110 | ||||||||
| 111 | ||||||||
| 114 | ||||||||
| 121 | ||||||||
| 124 | ||||||||
| 125 | ||||||||
| inside back cover | ||||||||
| | ||||||||
| | ||||||||
| Statement Re: Computation of Ratio of Earnings to Fixed Charges | ||||||||
| Subsidiaries of the Registrant | ||||||||
| Consent of Ernst & Young LLP | ||||||||
| Consent of PricewaterhouseCoopers LLP | ||||||||
| Certification of CEO Pursuant to Rule 13a-14(a) | ||||||||
| Certification of CFO Pursuant to Rule 13a-14(a) | ||||||||
| Certification of CEO and CFO Pursuant to | ||||||||

Statements in this report regarding U.S. Bancorp’s business which are not historical facts are “forward-looking statements” that involve risks and uncertainties. For a discussion of such risks and uncertainties, which could cause actual results to differ from those contained in the forward-looking statements, see the “Forward-Looking Statements” disclosure on page 17 of this report.
CORPORATE PROFILE
U.S. Bancorp, headquartered in Minneapolis, is the 6th largest financial holding company in the United States, with total assets exceeding $195 billion at year-end 2004. U.S. Bancorp, the parent company of U.S. Bank, serves 13.1 million customers and operates 2,370 branch offices in 24 states. U.S. Bancorp customers also access their accounts through 4,620 U.S. Bank ATMs, U.S. Bank Internet Banking and telephone banking. A network of specialized U.S. Bancorp offices across the nation, inside and outside our 24-state footprint, provides a comprehensive
line of banking, brokerage, insurance, investment, mortgage, trust and payment services products to consumers, businesses, governments and institutions.
Major lines of business provided by U.S. Bancorp through U.S. Bank and other subsidiaries include Wholesale Banking; Payment Services; Private Client, Trust & Asset Management; and Consumer Banking. U.S. Bank is home of the exclusive Five Star Service Guarantee. Visit U.S. Bancorp on the web at usbank.com.
U.S. BANCORP1


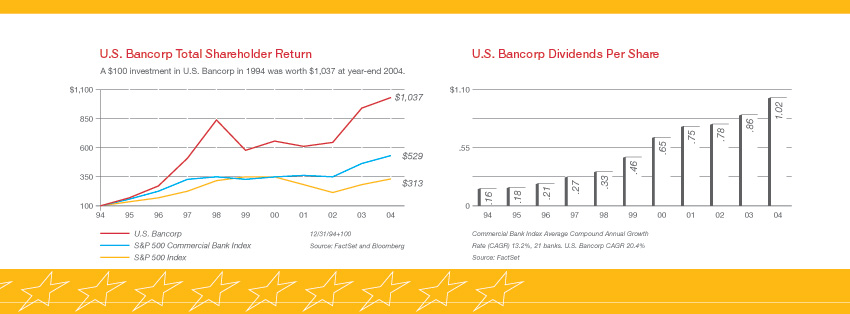
g r a p h sSELECTED FINANCIAL HIGHLIGHTSo fs e l e c t e df i n a n c i a lh i g h l i g h t s
(a) | Dividends per share have not been restated for the 2001 Firstar/USBM merger. | ||
(b) | Computed as noninterest expense divided by the sum of net interest income on a taxable-equivalent basis and noninterest income excluding securities gains (losses), net. |
2U.S. BANCORP

FINANCIAL SUMMARY
| Year Ended December 31 | 2004 | 2003 | ||||||||||||||||||
| (Dollars and Shares in Millions, Except Per Share Data) | 2004 | 2003 | 2002 | v 2003 | v 2002 | |||||||||||||||
| Total net revenue (taxable-equivalent basis) | $ | 12,659.1 | $ | 12,530.5 | $ | 12,057.9 | 1.0 | % | 3.9 | % | ||||||||||
| Noninterest expense | 5,784.5 | 5,596.9 | 5,740.5 | 3.4 | (2.5 | ) | ||||||||||||||
| Provision for credit losses | 669.6 | 1,254.0 | 1,349.0 | |||||||||||||||||
| Income taxes and taxable-equivalent adjustments | 2,038.2 | 1,969.5 | 1,740.4 | |||||||||||||||||
| Income from continuing operations | 4,166.8 | 3,710.1 | 3,228.0 | 12.3 | 14.9 | |||||||||||||||
| Discontinued operations (after-tax) | — | 22.5 | (22.7 | ) | ||||||||||||||||
| Cumulative effect of accounting change (after-tax) | — | — | (37.2 | ) | ||||||||||||||||
| Net income | $ | 4,166.8 | $ | 3,732.6 | $ | 3,168.1 | 11.6 | 17.8 | ||||||||||||
Per Common Share | ||||||||||||||||||||
| Earnings per share from continuing operations | $ | 2.21 | $ | 1.93 | $ | 1.68 | 14.5 | % | 14.9 | % | ||||||||||
| Diluted earnings per share from continuing operations | 2.18 | 1.92 | 1.68 | 13.5 | 14.3 | |||||||||||||||
| Earnings per share | 2.21 | 1.94 | 1.65 | 13.9 | 17.6 | |||||||||||||||
| Diluted earnings per share | 2.18 | 1.93 | 1.65 | 13.0 | 17.0 | |||||||||||||||
| Dividends declared per share | 1.020 | .855 | .780 | 19.3 | 9.6 | |||||||||||||||
| Book value per share | 10.52 | 10.01 | 9.62 | 5.1 | 4.1 | |||||||||||||||
| Market value per share | 31.32 | 29.78 | 21.22 | 5.2 | 40.3 | |||||||||||||||
| Average common shares outstanding | 1,887.1 | 1,923.7 | 1,916.0 | (1.9 | ) | .4 | ||||||||||||||
| Average diluted common shares outstanding | 1,912.9 | 1,936.2 | 1,924.8 | (1.2 | ) | .6 | ||||||||||||||
Financial Ratios | ||||||||||||||||||||
| Return on average assets | 2.17 | % | 1.99 | % | 1.84 | % | ||||||||||||||
| Return on average equity | 21.4 | 19.2 | 18.3 | |||||||||||||||||
| Net interest margin (taxable-equivalent basis) | 4.25 | 4.49 | 4.65 | |||||||||||||||||
| Efficiency ratio | 45.3 | 45.6 | 48.8 | |||||||||||||||||
Average Balances | ||||||||||||||||||||
| Loans | $ | 122,141 | $ | 118,362 | $ | 114,453 | 3.2 | % | 3.4 | % | ||||||||||
| Investment securities | 43,009 | 37,248 | 28,829 | 15.5 | 29.2 | |||||||||||||||
| Earning assets | 168,123 | 160,808 | 147,410 | 4.5 | 9.1 | |||||||||||||||
| Assets | 191,593 | 187,630 | 171,948 | 2.1 | 9.1 | |||||||||||||||
| Deposits | 116,222 | 116,553 | 105,124 | (.3 | ) | 10.9 | ||||||||||||||
| Shareholders’ equity | 19,459 | 19,393 | 17,273 | .3 | 12.3 | |||||||||||||||
Period End Balances | ||||||||||||||||||||
| Loans | $ | 126,315 | $ | 118,235 | $ | 116,251 | 6.8 | % | 1.7 | % | ||||||||||
| Allowance for credit losses | 2,269 | 2,369 | 2,422 | (4.2 | ) | (2.2 | ) | |||||||||||||
| Investment securities | 41,481 | 43,334 | 28,488 | (4.3 | ) | 52.1 | ||||||||||||||
| Assets | 195,104 | 189,471 | 180,027 | 3.0 | 5.2 | |||||||||||||||
| Deposits | 120,741 | 119,052 | 115,534 | 1.4 | 3.0 | |||||||||||||||
| Shareholders’ equity | 19,539 | 19,242 | 18,436 | 1.5 | 4.4 | |||||||||||||||
| Regulatory capital ratios | ||||||||||||||||||||
| Tangible common equity | 6.4 | % | 6.5 | % | 5.7 | % | ||||||||||||||
| Tier 1 capital | 8.6 | 9.1 | 8.0 | |||||||||||||||||
| Total risk-based capital | 13.1 | 13.6 | 12.4 | |||||||||||||||||
| Leverage | 7.9 | 8.0 | 7.7 | |||||||||||||||||
U.S. BANCORP3

| LETTER TO SHAREHOLDERS 2004 was a year that it all came together for U.S. Bancorp. Service quality levels have never been higher. Financial results are strong and lead the industry in key measurements. All lines of business are contributing to revenue and growth. |
Fellow Shareholders:
I am pleased to tell you that in 2004, U.S. Bancorp achieved its goals for the year and delivered on its promises to you.
STRONG FINANCIAL RESULTS WITH A
FOCUS ON REVENUE GROWTH
During the coming year, we will act to sustain those successes. Revenue growth is our primary focus, particularly net interest income from improved commercial lending results. Our consumer lending business continues to grow, and we have made a number of changes surrounding our commercial banking and small business banking lines of business to increase commercial loan growth. We saw middle market commercial loan balances move upward in fourth quarter 2004.
We are very disciplined in our acquisitions, focusing only on those which will enhance revenue growth, create operating scale, build a more profitable business line or strengthen a critical competitive advantage. This strategy has proved very successful, most notably in our payments business, which reported 10.6 percent net revenue growth in 2004.
Our capital position remains strong, and we repurchased 93.8 million shares during 2004.
INVESTING FOR GROWTH AND SERVICE
We continue to support our pledge of guaranteed high levels of customer service. Investments in delivery and operational systems allowed us to unify systems, simplify procedures, streamline processes and increase the ease of numerous customer transactions and communications. These investments improved customer service and increased customer satisfaction and loyalty, contributing significantly to our ability to attract and retain customers. We have also improved hiring and training practices, and service quality is an integral part of our employees’ performance evaluation and incentive programs.
RATING AGENCIES VIEW
U.S. BANK FAVORABLY
4U.S. BANCORP


upgrade was Moody’s view that the corporation’s business model will generate strong profitability, and the consistency of that profitability performance is supported by improving risk management and maintenance of very good liquidity.
We were also pleased that on September 27, 2004, Fitch’s rating agency upgraded U.S. Bank’s ratings. Long- and short-term senior debt at the holding company, U.S. Bancorp, were upgraded to AA- and F1+, respectively, from A+ and F1, respectively. The long-term ratings of its subsidiary bank, U.S. Bank National Association, were upgraded to AA from AA-. The main driver behind the upgrade was Fitch’s view of the corporation’s solid net interest margin, diverse sources of non-interest income, disciplined expense management and improved asset quality.
The debt ratings established for U.S. Bank by Moody’s, Standard and Poor’s, and Fitch reflect the ratings agencies’ recognition of the strong, consistent financial performance of the company and the quality of the balance sheet.
U.S. BANCORP IS A CORPORATION
BUILT ON INTEGRITY
CREATING SHAREHOLDER VALUE
IS OUR PRIORITY
This corporation has paid a cash dividend for 142 consecutive years, and we have increased the dividend for 33 consecutive years. That long-time record of dividend increases earned U.S. Bancorp the designation of one of the S&P’s 58 “Dividend Aristocrats.” Only nine other issues have paid a dividend longer than U.S. Bancorp, which first paid a dividend in 1863.
We manage this corporation to increase the value of your investment in U.S. Bancorp. It’s the reason we come to work each day.
Sincerely,

Jerry A. Grundhofer
Chairman and Chief Executive Officer
U.S. Bancorp
February 28, 2005

U.S. BANCORP5

| FIVE STAR SERVICE IN ACTION THE VALUES OF FIVE STAR SERVICE Take Ownership Make it Personal Add Value to Every Interaction Make Customer Courtesy Common Share Knowledge SHE TAKES OWNERSHIP. May Li, Manager Factoria Office, Bellevue, WA When Terrie Nixdorff needed help obtaining a debit card after experiencing an unsettling fraud situation, May Li stepped right in. With unyielding determination and extensive follow-through, May Li ensured that Terrie's situation was completely resolved. 6 U.S. BANCORP |

| Teshan Lewis, Account Coordinator Corporate Payment Systems, Minneapolis, MN Teshan Lewis went above and beyond to secure a Government Purchase Card for a staff member of the United States Air Force who was preparing for a short-notice deployment to Iraq. Teshan's personal commitment and persistence ensured the staff member received the card in time to carry out his mission. Teshan is pictured with Lt. Col. Todd Pospisil and Government Purchase Card Program Managers Laura Ball and Marie D'Angelo. HE MAKES IT PERSONAL. |


| SHE ADDS VALUE. Pam Paley, Relationship Manager The Private Client Group, Cincinnati, OH Pam Paley partners with Frederic H. Mayerson, Chairman and Managing General Partner of The Walnut Group, a diversified private equity investment company. Pam adds value to every interaction by consistently finding the right specialized, competitive products and services designed to meet the needs of The Walnut Group's principals. Ann Vazquez, Manager Broker Dealer Division, St. Louis, MO Since 1989, Ann Vazquez has provided unparalleled expertise and professional, courteous service to Rodger Riney, Founder, President and CEO of Scottrade. Recently, Ann was instrumental in finding a creative credit facility solution. Coupled with her consistently personalized attention, Ann makes sure that what matters most to Scottrade matters most to U.S. Bank. SHE MAKES CUSTOMER COURTESY COMMON. |

| Andrew Eberhardy, Project Manager Elan Financial Services, Milwaukee, WI Andrew Eberhardy's skilled support made all the difference to Oregon-based Umpqua Bank during a recent credit card portfolio conversion. Drawing on his vast knowledge of conversion processes, Andrew offered Umpqua flexible, efficient and reliable options to guarantee their satisfaction. Andrew is pictured with Susie McEuin and Laura Schaeffer of Umpqua. HE SHARES HIS KNOWLEDGE. |


| ADVANTAGEOUS BUSINESS MIX 13.1 million customers rely on U.S. Bancorp as their financial partner. From a simple personal checking account to sophisticated corporate transactions, U.S. Bancorp has the products and services, the talent, the technologies and the expertise to help our customers achieve their goals. |
f i n a n c i a lWHOLESALE
s u m m a r yBANKING
With relationship managers who understand the companies, the markets and the industries of our commercial, corporate and correspondent customers, no bank brings more to the table than U.S. Bank.
| Year Ended December 31 | 2003 | 2002 | ||||||||||||||||||
| (Dollars and Shares in Millions, Except Per Share Data) | 2003 | 2002 | 2001 | v 2002 | v 2001 | |||||||||||||||
| Total net revenue (taxable-equivalent basis) | $ | 12,530.5 | $ | 12,057.9 | $ | 11,074.6 | 3.9 | % | 8.9 | % | ||||||||||
| Noninterest expense | 5,596.9 | 5,740.5 | 6,149.0 | (2.5 | ) | (6.6 | ) | |||||||||||||
| Provision for credit losses | 1,254.0 | 1,349.0 | 2,528.8 | |||||||||||||||||
| Income taxes and taxable-equivalent adjustments | 1,969.5 | 1,740.4 | 872.8 | |||||||||||||||||
| Income from continuing operations | $ | 3,710.1 | $ | 3,228.0 | $ | 1,524.0 | 14.9 | 111.8 | ||||||||||||
| Discontinued operations (after-tax) | 22.5 | (22.7 | ) | (45.2 | ) | |||||||||||||||
| Cumulative effect of accounting change (after-tax) | — | (37.2 | ) | — | ||||||||||||||||
| Net income | $ | 3,732.6 | $ | 3,168.1 | $ | 1,478.8 | 17.8 | 114.2 | ||||||||||||
Per Common Share | ||||||||||||||||||||
| Earnings per share from continuing operations | $ | 1.93 | $ | 1.68 | $ | .79 | 14.9 | % | 112.7 | % | ||||||||||
| Diluted earnings per share from continuing operations | 1.92 | 1.68 | .79 | 14.3 | 112.7 | |||||||||||||||
| Earnings per share | 1.94 | 1.65 | .77 | 17.6 | 114.3 | |||||||||||||||
| Diluted earnings per share | 1.93 | 1.65 | .76 | 17.0 | 117.1 | |||||||||||||||
| Dividends declared per share | .855 | .780 | .750 | 9.6 | 4.0 | |||||||||||||||
| Book value per share | 10.01 | 9.62 | 8.58 | 4.1 | 12.1 | |||||||||||||||
| Market value per share | 29.78 | 21.22 | 20.93 | 40.3 | 1.4 | |||||||||||||||
| Average shares outstanding | 1,923.7 | 1,916.0 | 1,927.9 | .4 | (.6 | ) | ||||||||||||||
| Average diluted shares outstanding | 1,936.2 | 1,924.8 | 1,940.3 | .6 | (.8 | ) | ||||||||||||||
Financial Ratios | ||||||||||||||||||||
| Return on average assets | 1.99 | % | 1.84 | % | .89 | % | ||||||||||||||
| Return on average equity | 19.2 | 18.3 | 9.0 | |||||||||||||||||
| Net interest margin (taxable-equivalent basis) | 4.49 | 4.65 | 4.46 | |||||||||||||||||
| Efficiency ratio | 45.6 | 48.8 | 57.2 | |||||||||||||||||
Average Balances | ||||||||||||||||||||
| Loans | $ | 118,362 | $ | 114,453 | $ | 118,177 | 3.4 | % | (3.2 | )% | ||||||||||
| Investment securities | 37,248 | 28,829 | 21,916 | 29.2 | 31.5 | |||||||||||||||
| Earning assets | 160,808 | 147,410 | 143,501 | 9.1 | 2.7 | |||||||||||||||
| Assets | 187,630 | 171,948 | 165,944 | 9.1 | 3.6 | |||||||||||||||
| Deposits | 116,553 | 105,124 | 104,956 | 10.9 | .2 | |||||||||||||||
| Total shareholders’ equity | 19,393 | 17,273 | 16,426 | 12.3 | 5.2 | |||||||||||||||
Period End Balances | ||||||||||||||||||||
| Loans | $ | 118,235 | $ | 116,251 | $ | 114,405 | 1.7 | % | 1.6 | % | ||||||||||
| Allowance for credit losses | 2,369 | 2,422 | 2,457 | (2.2 | ) | (1.4 | ) | |||||||||||||
| Investment securities | 43,334 | 28,488 | 26,608 | 52.1 | 7.1 | |||||||||||||||
| Assets | 189,286 | 180,027 | 171,390 | 5.1 | 5.0 | |||||||||||||||
| Deposits | 119,052 | 115,534 | 105,219 | 3.0 | 9.8 | |||||||||||||||
| Total shareholders’ equity | 19,242 | 18,436 | 16,745 | 4.4 | 10.1 | |||||||||||||||
| Regulatory capital ratios | ||||||||||||||||||||
| Tangible common equity | 6.5 | % | 5.7 | % | 5.9 | % | ||||||||||||||
| Tier 1 capital | 9.1 | 8.0 | 7.8 | |||||||||||||||||
| Total risk-based capital | 13.6 | 12.4 | 11.9 | |||||||||||||||||
| Leverage | 8.0 | 7.7 | 7.9 | |||||||||||||||||
Whether it’s finding the right financing and capital for growth and expansion, accelerating receivables, expediting transactions, managing employee benefits programs or structuring transactions to finance foreign trade, U.S. Bank has the business solutions that build businesses and futures.
After several years of lackluster demand, in 2004 we saw an increase, albeit modest, in commercial and corporate lending, particularly in the areas of commercial and industrial lending and commercial real estate. Economic trends across most markets are positive overall and we expect to see continued improvement in 2005. Interest rates, while rising, are affordable, and companies appear more ready than at any time in the past several years to invest in their businesses.
Significant changes within our organization position us well to be more visible and active in every market, with more streamlined procedures and more competitive pricing. These changes augment the high level of customer service and industry expertise already provided to our customers.
KEY BUSINESS UNITS
• | Middle Market Commercial Banking | |
• | Commercial Real Estate | |
• | Corporate Banking | |
• | Correspondent Banking | |
• | Dealer Commercial Services | |
• | Equipment Leasing | |
• | Foreign Exchange | |
• | Government Banking | |
• | International Banking | |
• | Specialized Industries | |
• | Specialized Lending | |
• | Treasury Management |
10U.S. BANCORP

PAYMENT
SERVICES
U.S. Bancorp is a recognized leader in the rapidly growing payments business, with customers ranging from individual credit and debit cardholders and ATM users to local and global merchants, fleet enterprises and multinational corporations with complex payment and payment processing needs.
KEY BUSINESS UNITS
•Corporate Payment Systems |
•Merchant Payment Services |
•NOVA Information Systems, Inc. |
•Retail Payment Solutions (card services) |
•Transaction Services |
We provide innovative card-based programs, internet-based reporting tools, fully integrated payment solutions and electronic payments settlement answers across the country and around the world.
Payment Services is a higher growth, higher return line of business for U.S. Bancorp. We will continue to invest in the technology, acquisitions, product development and sales promotion needed to support its continued growth.
There is strong momentum in merchant processing, especially related to our new NOVA processing capabilities in Europe. Both our retail payments and corporate payments businesses are focusing on the expansion of existing relationships with current
customers. Additionally, corporate payment products and merchant processing can provide valuable benefits to middle market and small business companies, and we are increasing penetration of those customer segments for payments and processing services.
We are also investing in the hardware and technology to expand and enhance our network of U.S. Bank ATMs. Our newest generation of ATMs are among the most highly functional in the industry, with vivid, striking graphics and transaction screens and customization capabilities so that customers’ transactions are faster, easier and individualized.


THE PRIVATE CLIENT GROUP,
TRUST & ASSET MANAGEMENT
U.S. Bancorp understands what it takes to build, manage and preserve our clients’ wealth. From sensitive and personalized family financial management and estate planning to sophisticated corporate trust transactions to expert advice on investments, we prepare clients for today’s realities and tomorrow’s goals.
KEY BUSINESS UNITS
•The Private Client Group |
•Corporate Trust Services |
•Institutional Trust & Custody |
•U.S. Bancorp Asset Management, Inc. |
•U.S. Bancorp Fund Services, LLC |
The Private Client Group works with affluent individuals and families, professional service corporations and non-profit organizations as a bank within a bank, providing tailored programs to meet specialized needs. Recognizing that many more U.S. Bank customers could benefit from the financial planning, investment management, personal trust and private banking expertise of The Private Client Group, this group is building stronger bank-wide partnerships with other U.S. Bank lines of business to identify Private Client Group referral opportunities.
Built on our strong technology platform and superior management, Corporate Trust Services is leveraging its distribution and scale following our two most recent acquisitions. We reported to you last year about our acquisition of the State Street corporate trust business, and in June 2004 we completed the acquisition of National City’s corporate trust division, a transaction that brought
the bank $34 billion in assets under administration and 3,800 corporate clients throughout the Midwest. It is our sixth corporate trust acquisition since 1999, reflecting our approach of acquisitions to grow revenue and businesses capable of competing with anyone.
U.S. Bancorp Asset Management, Inc., a subsidiary of U.S. Bank National Association, serves as the investment advisor to the First American Funds. It provides investment management services to individuals and institutions including corporations, foundations, pension funds, public funds, and retirement plans. The firm has offices in 24 states. Asset Management distribution is expanding through increased penetration of the Institutional Market and third-party distribution. In 2004, U.S. Bancorp Asset Management launched two new mutual funds—the First American Inflation Protected Securities Fund and the First American U.S. Treasury Money Market Fund. A retirement (R) share class was also added to a number of funds in the fund family.


CONSUMER
BANKING
Our customers want convenience, accessibility, quality products and outstanding service. Our distribution channels—full-service banking offices, ATMs, telephone banking, and internet banking—deliver the deposit, credit, mortgage, investment and insurance products that support the goals and visions of personal and small business customers.
Business momentum in Consumer Banking is strong, and we continue to invest in technologies and initiatives that enhance distribution and deliver on customer expectations.
Customer satisfaction remains our top priority, and new Consumer Banking product initiatives are positively impacting customer satisfaction. Enhancements to internet banking on usbank.com, again ranked number one by Speer and Associates, provide even greater flexibility, customization and functionality.
Significant investment in innovative image technology enables U.S. Bank Internet Banking customers to instantly view more than 3.5 million check and deposit slip images per month on their computer screens. A wide range of operational procedures have also been simplified and streamlined.

KEY BUSINESS UNITS
•24-Hour Banking & | •Investments and | |||||
| Financial Sales | Insurance | |||||
| • | Business Equipment Finance | • | Metropolitan Branch Banking | |||
| • | Community Banking | • | Small Business Banking | |||
| • | Consumer Lending | • | SBA Division | |||
| • | Home Mortgage | • | Workplace and Student Banking | |||
| • | In-store and Corporate | |||||
| On-site Banking | ||||||
We continue to expand our unique Checking That Pays® rewards program, which gives customers who use their U.S. Bank Visa® Check Card the choice of four different reward options. In 2004, U.S. Bank rewarded customers more than $26 million in annual cash rebates, five times the $5 million rewarded in 2000.

| OUR IN-STORE BANKING NETWORK CONTINUES TO GROW |
| Our in-store branch network—the third largest in the industry—delivers all the access of traditional branches to our customers inside grocery and convenience stores. Building on the tremendous success of this lower cost distribution channel, last year U.S. Bank began a major expansion of in-store branches in fast-growing markets such as Arizona, California, Nevada and Utah. These new branches continue to exceed expectations for profitability. |
| In 2003, we opened six new Nashville Publix and 32 new Safeway, Vons, Smith’s, Pak N Save and Pavilion branches, plus additional branches with other valued partners. We continued to grow in 2004, opening 112 new in-store branches. By the end of 2005, U.S. Bank will have opened 185 new in-store branches as part of the newest expansion initiative, for a total overall of 478 in-store branches in 19 states. |

| INITIATIVES FOR SUCCESS |
| INVESTING |
| IN OUR COMPANY FOR GROWTH AND SERVICE Increasing our ability to provide better customer service, offer new customer options, and develop and deliver new products keeps us ahead of the curve and ahead of the competition. |

MARKET PENETRATION
In Consumer Banking, we have improved our automated capability to identify product recommendation and customer service opportunities at the individual customer level so we can provide more personalized service and recommend the most appropriate products.
In Corporate Payment Systems, we are dedicating resources to build middle market relationships. We have redesigned and simplified processes, applications and contracts and have been pursuing new client categories among companies with annual sales between $20 and $500 million. Our new One Card for the middle market combines the best features from our corporate and purchasing cards into one easy-to-manage program.
NOVA’s new Electronic Check Service processing streamlines check acceptance and mitigates risk for our customers so they can accept checks as safely and easily as card payment alternatives.
Gift card industry sales reached $45 billion in 2003 and are forecast to double by 2007. NOVA’s growing gift card program meets the needs of merchants in a cost-effective manner, and NOVA gift cards are processed using the same point-of-sale systems used for credit and debit card processing, further controlling costs.
14U.S. BANCORP
The Private Client Group has several initiatives in progress which leverage the franchise to develop new client relationships. Our focus is on building stronger internal partnerships with other U.S. Bancorp lines of business. We recognize that many customers already doing business with U.S. Bank could benefit from the comprehensive and specialized expertise of our Financial Planning, Private Banking, Personal Trust, Investment and Insurance experts in The Private Client Group.
Retail Payment Solutions has increased penetration of personal and small business checking account customers with U.S. Bank-branded credit and debit cards by investing in sales and training opportunities with our expanded branch network.
services. SinglePointSM allows business customers to access information and reports, initiate and manage ACH transactions and wires, view check and deposit images and manage check fraud programs at one source.
We have upgraded and image-enabled key lockbox sites for both wholesale and retail payment processing, and introduced a suite of check conversion products and services including On-Site Electronic Deposit and Electronic Cash Letter.
Institutional Trust has launched Health Savings Accounts (HSA) to client companies. HSAs are tax-exempt trust or custodial accounts to be used exclusively for future medical expenses. Similar to IRAs, they are special tax-sheltered savings accounts for medical bills for those employees who qualify.
| Our new generation of ATMs integrates customization and information delivery with ATM transactions. Customers will have access to personalized messages, customized “fast cash” preferences, and more. These ATMs provide a faster, easier to use, and more personal experience. |


| We are leveraging our expertise in Commercial Real Estate financing and capitalizing on an improving economy by opening new Commercial Real Estate offices in Phoenix, Dallas and Washington, D.C. Offering our clients greater investment choice, The Private Client Group launched Mutual Fund Open Architecture in 2004, allowing clients to access investments that complement our proprietary funds. We will continue to strategically expand Open Architecture. Retail Payment Solutions successfully entered the affinity debit and credit card market in June 2004. With a potential partner base of 7,000 or more across the country, growth prospects are excellent. U.S. Bancorp’s Elan Financial Services division now offers prepaid card processing for its financial institution clients, providing the ability for these clients to offer payroll cards and to offer or purchase gifts cards. MARKET DEVELOPMENT Our Asset Management business is performance driven, and on this foundation, we have created investment products attractive not only to our own investors, but also products that will be competitive and attractive in third party retail and institutional distribution. We will expand into these new distribution channels in 2005. U.S. Bancorp Fund Services (USBFS), long a recognized administrator for U.S.-based mutual funds, is gaining name recognition and reputation as a third party outsourcing administrator in the alternative investment industry as well. USBFS has made investments in the specialized technology and accounting systems to support servicing both the simple and complex investments held by hedge funds. NOVA continues its merchant processing expansion in Europe through its EuroConex business, headquartered in Ireland. Growing through acquisitions and alliances, EuroConex now supports more than 100,000 merchants across eight European countries. As a specialized business with notable competitive advantages, and one that benefits from economies of scale, we see considerable potential for further European expansion. NOVA also launched a Canadian merchant processing product in October 2004. We anticipate that many current U.S. customers will consolidate their U.S. and Canadian merchant processing with NOVA and that Canadian merchants will switch from fragmented processing systems to NOVA as a single source of top-rated processing and customer service. |
FORWARD-LOOKING STATEMENTSThis Annual Report and Form 10-K contains forward-looking statements. Statements that are not historical or current facts, including statements about beliefs and expectations, are forward-looking statements. These statements often include the words “may,” “could,” “would,” “should,” “believes,” “expects,” “anticipates,” “estimates,” “intends,” “plans,” “targets,” “potentially,” “probably,” “projects,” “outlook” or similar expressions. These forward-looking statements cover, among other things, anticipated future revenue and expenses and the future prospects of U.S. Bancorp. Forward-looking statements involve inherent risks and uncertainties, and important factors could cause actual results to differ materially from those anticipated, including the following, in addition to those contained in U.S. Bancorp’s reports on file with the SEC: (i) general economic or industry conditions could be less favorable than expected, resulting in a deterioration in credit quality, a change in the allowance for credit losses, or a reduced demand for credit or fee-based products and services; (ii) changes in the domestic interest rate environment could reduce net interest income and could increase credit losses; (iii) inflation, changes in securities market conditions and monetary fluctuations could adversely affect the value or credit quality of our assets, or the availability and terms of funding necessary to meet our liquidity needs; (iv) changes in the extensive laws, regulations and policies governing financial services companies could alter our business environment or affect operations; (v) the potential need to adapt to industry changes in information technology systems, on which we are highly dependent, could present operational issues or require significant capital spending; (vi) competitive pressures could intensify and affect our profitability, including as a result of continued industry consolidation, the increased availability of financial services from non-banks, technological developments or bank regulatory reform; (vii) changes in consumer spending and savings habits could adversely affect our results of operations; (viii) changes in the financial performance and condition of our borrowers could negatively affect repayment of such borrowers’ loans; (ix) acquisitions may not produce revenue enhancements or cost savings at levels or within time frames originally anticipated, or may result in unforeseen integration difficulties; (x) capital investments in our businesses may not produce expected growth in earnings anticipated at the time of the expenditure; and (xi) acts or threats of terrorism, and/or political and military actions taken by the U.S. or other governments in response to acts or threats of terrorism or otherwise could adversely affect general economic or industry conditions. Forward-looking statements speak only as of the date they are made, and U.S. Bancorp undertakes no obligation to update them in light of new information or future events.
U.S. BANCORP17

“We are pleased to tell you that in 2003, we reported record earnings and also achieved the financial results to which we had committed.”MANAGEMENT’S DISCUSSION AND ANALYSIS
f e l l o ws h a r e h o l d e r s :
Strong financial results. U.S. Bancorp delivered strong financial results in 2003, the culmination of five years of transformation and integration, during which we forged a company uniquely positioned to generate consistent earnings and revenue growth.
Growing U.S. Bancorp. With virtually all integration and merger-related activities behind us, we are now focused solely on growing U.S. Bancorp by leveraging the breadth and depth of the powerful franchise we have built. Our five-year transformation allowed us to gain access to high-growth markets, to solidify strong regional positions and to build a national platform. During our integration process, we accelerated our cost control leadership. We are now extending that cost and execution leadership, as well as making significant strategic investments in our highest-potential businesses, and reaffirming our focus on delivering high-quality service.
Achieving our goals to build a stronger corporation. I am pleased to tell you that U.S. Bancorp accomplished the performance, credit quality and other goals we had previously committed to achieving. We met financial objectives — in particular, revenue growth, expense management, net interest margin and earnings per share.
In addition, and perhaps most importantly, we continue to show improvement in overall credit quality, a direct result of all we have done in the past two years to reduce this corporation’s risk profile. We also completed the spin-off of Piper Jaffray, further reducing risk and volatility in our business. Finally, we began a major expansion of our distribution channels in fast-growing markets within our franchise through the previously announced in-store branch partnerships with Safeway/Vons, Smith’s and Publix.
140 years of creating value for shareholders. We have targeted returning 80 percent of our earnings to shareholders through a combination of dividends and share repurchases.
The 17 percent common stock dividend increase approved by our Board of Directors and announced in December 2003 is a continuation of a long history of paying significant dividends, as well as a reflection of the Board’s confidence in this corporation’s future success.
U.S. Bancorp, through its predecessor companies, has increased its dividend in each of the past 32 years and has paid a dividend for 140 consecutive years.
In addition to the common stock dividend discussed above, as part of the December 2003 spin-off of Piper Jaffray, U.S. Bancorp distributed common shares of the new Piper Jaffray Companies in the form of a special dividend to eligible U.S. Bancorp shareholders.
Also in December 2003, our Board of Directors approved authorization to repurchase 150 million shares of outstanding U.S. Bancorp common stock during the next two years.
These specific steps were undertaken to increase the value of your shares; in addition, we manage this corporation with the long-term value of your investment as our paramount objective. It’s the reason we come to work each day.
Sincerely,

Jerry A. GrundhoferChairman, President and Chief Executive OfficerU.S. BancorpFebruary 27, 2004

c o r p o r a t eg o v e r n a n c e
Good corporate governance promotes ethical business practices, demands meticulous accounting policies and procedures and includes a structure with effective checks and balances. Corporate governance is vital to the continued success of U.S. Bancorp and the entire financial services industry. Our ethical standards have rewarded us with an enviable reputation in today’s marketplace — a marketplace where trust is hard to earn. Our shareholders, customers, communities and employees demand — and deserve — to do business with companies they can trust. U.S. Bancorp operates with uncompromising honesty and integrity. Our Board of Directors has had a Corporate Governance Committee for many years. We have implemented Corporate Governance Guidelines in response to today’s heightened concern. Our Corporate Governance Guidelines are available for you to view on our Internet web site at usbank.com. Following are some of the important elements of our Corporate Governance practices.
Independent oversight. Each of our Audit Committee, Compensation Committee and Governance Committee is composed entirely of independent outside directors. In fact, following our annual meeting, our Chairman, President and Chief Executive Officer will be the only member of our Board of Directors who is not independent. In addition, our Board of Directors and the committees of the Board meet in “executive session” without management in attendance at every meeting. The presiding director at every executive session of the Board is an independent director. The Board and each committee also have express authority to engage outside advisors to provide additional independent expertise for their deliberations.
Board of Directors’ focus on U.S. Bancorp.To ensure that our directors are able to focus effectively on our business, we limit the number of other public company boards a director may serve on to three. The Chairman, President and Chief Executive Officer of U.S. Bancorp serves on only two other public company boards. Audit Committee members may serve on no more than three other public company audit committees, and the chairman of the Audit Committee serves on no other audit committees.
Board of Directors’ knowledge and expertise.All of our directors are skilled business leaders. Directors are encouraged to attend continuing director education seminars in order to keep a sharp focus on current good governance practices. In addition, the Board and each committee may use outside advisors to add expertise on specific issues. Our directors have full and
unrestricted access to our management and employees. Additionally, key members of management attend Board meetings from time to time to present information about the results, plans and operations of their business segments. The Board and each committee perform annual self-evaluations in order to assess their performance and to ensure that the Board and committee structure is providing effective oversight of corporate management. You may review the charters of each of our Board committees on our Internet web site at usbank.com.
Management’s ownership commitment. We understand clearly that U.S. Bancorp shareholders are the primary beneficiaries of management’s actions. All U.S. Bancorp executive officers and directors own shares of company stock, and in order to tightly align management’s interests with those of our shareholders, we have established stock ownership guidelines for our executive officers.
Disclosure controls.We have established rigorous procedures to ensure that we provide complete and accurate disclosure in our publicly filed documents. We have also established a telephone hotline for employees to anonymously submit any concern they may have regarding corporate controls or ethical breaches. Management investigates all complaints and directs to our Audit Committee any issues relating to concerns about our financial statements or public disclosures.
U.S. Bancorp Code of Ethics and Business Conduct.Each year, we reiterate the vital importance of our Code of Ethics and Business Conduct. The Code applies to directors, officers and all employees, who must certify annually their compliance with the standards of the Code. The content of the Code is based not solely on what we have the right to do, but, even more importantly, on what is the right thing to do. Our standards are higher than any legal minimum because our business is built on trust. You may review our Code of Ethics and Business Conduct on our Internet web site at usbank.com.
Communications with our Board of Directors.Shareholders can communicate with our Board of Directors by sending a letter addressed to the Board of Directors, the independent outside directors or specified individual directors, to:
The Office of the Corporate SecretaryU.S. Bancorp800 Nicollet MallMinneapolis, MN 55402


s e r v i c ee x c e l l e n c e
Great service is more than our goal; it’s the way we do business. Every U.S. Bancorp employee in every U.S. Bancorp line of business is committed to providing responsive, prompt and helpful service - every transaction, every relationship, every day. And our exclusive Five Star Service Guarantee backs up our promise to deliver the outstanding service our customers expect and deserve.
Five Star Service Guarantee ensures highest level of service. Exceptional service is the single most important thing U.S. Bank offers our customers. We make a promise to deliver the highest level of customer service and we boldly back up this pledge with the U.S. Bank Five Star Service Guarantee, which ensures the core service standards most important to our customers — such as availability, accuracy, timeliness and responsiveness — are met and exceeded. Every U.S. Bank customer is covered by one or more guarantees. If we fall short in keeping our service guarantees, and our customer tells us they did not get the service they expected and deserved, we pay the customer for the inconvenience.
Taking ownership of our business one employee at a time. Each line of business has developed and adapted its own Five Star Service Guarantee, defining the quality standards that are expected and demanded of every employee — standards that are based on meeting the diverse financial needs of all our customers. U.S. Bank has created an environment in which employees understand how their individual service and sales performance contributes to revenue growth and


shareholder value. It is an environment where employees take ownership of their business, where they are held accountable for the company’s success and where they are compensated for measurable performance results.
Service is foundation of success.U.S. Bank employees are recognized and rewarded for their outstanding service. Our Pay for Performance compensation program rewards employees financially and personally for their achievements in meeting service and sales goals and for their contributions to company earnings. Customized line of business incentive programs drive employees to generate revenue while fulfilling customers’ needs. Each quarter, 20 selected employees who exemplify our high service standards are inducted into the prestigious Circle of Service Excellence.
The Service Advantage puts customers at center of everything we do.To deepen our commitment to superior service, in 2003, we launched The Service Advantage, an innovative internal initiative designed to increase customer access and convenience; simplify customer issue solutions; make quality service central to hiring, orientation and training; and improve the common customer experience. Our Service Council is the driving force behind The Service Advantage; it is comprised of senior managers from every line of business who identify areas of improvement, analyze customer satisfaction measurements and implement resolutions that create greater customer satisfaction and loyalty. We are enhancing existing and creating new internal service techniques and processes, as well, so that our frontline employees have the tools and support they need to better meet customer expectations. By the end of first quarter 2004, every U.S. Bank employee will have received personalized training on the core principles of The Service Advantage.
Cacique® is the #1 selling brand of Hispanic-style cheeses and creams in the world. For over three decades, the family owned and operated company has produced authentic cheeses, creams and chorizos, growing from a small, abandoned facility to one of the world’s most sophisticated cheese manufacturing facilities. Cacique is committed to quality, heritage and tradition, sharing this legacy with the community through a long history of philanthropy, including Fighting Diabetes Together, a recent collaboration with City of Hope®. U.S. Bank Commercial Banking partners with Cacique to provide flexible, competitive products to meet the financial needs of this unique company.


U.S. Bancorp meets the diverse financial needs of our customers by providing innovative, creative answers through specialized lines of business. Across 24 states and beyond, our experienced bankers share ideas, best practices, capabilities and cross-sell opportunities, supported by advanced technology and operating systems. The results are competitive benefits for our customers and competitive advantages for U.S. Bancorp.
l i n e so fb u s i n e s s
KEY BUSINESS UNITS
Wholesale Banking offers strategic lending, depository, treasury management and other financial services to middle market, large corporate, financial institution and public sector customers. Experienced, accessible relationship managers serve as our customers’ link to all the products, credit, support and resources that the extensive scope of U.S. Bancorp provides.
S U C C E S S E S
 |

KEY BUSINESS UNITS
Our uniquePayment Servicesbusiness specializes in credit and debit cards, commercial card services, business-to-business payment and ATM and merchant processing. Customized products delivered through leading-edge technology channels equip consumers, small businesses, merchants of every size, government entities, large corporations, financial institutions and co-brand partners with the most advanced payment services tools available.
S U C C E S S E S
KEY BUSINESS UNITS
Private Client, Trust & Asset Managementmeets diverse wealth management needs through best-in-class personal trust, corporate trust, institutional trust and custody, private banking, financial advisory, investment management and mutual fund and alternative investment product services. Expert advisers and relationship managers offering sophisticated knowledge and personalized service give U.S. Bank a competitive advantage.
S U C C E S S E S

Our industry-leadingConsumer Bankingdelivers a full range of products and services to the broad consumer market and small businesses through full-service banking offices, ATMs, telephone customer service and telesales, online banking and direct mail. A disciplined sales culture, optimal distribution channel convenience and a mandate for quality service are the hallmarks of Consumer Banking.
S U C C E S S E S
KEY BUSINESS UNITS


U.S. Bancorp strategically invests in the distribution channels, lines of business and markets with high potential for growth. These investments take full advantage of the existing resources, capabilities and national platforms we have built, enhancing our core geography and increasing customer convenience with moderate expenditure and low risk to the company.
i n v e s t i n gi nd i s t r i b u t i o na n ds c a l e
Distribution channels deliver anytime access. Our distribution channels — including 2,243 branch banking offices in 24 states, 4,425 U.S. Bank ATMs, 24-hour call center service, U.S. Bank Internet Banking and specialized trust, brokerage and home mortgage offices — form the foundation of our powerful presence in many of the country’s high-growth, diversified markets. Our growing branch network operates in three strategically segmented formats. Community Banking delivers our full range of products and services in smaller, non-urban communities through the local office. Metropolitan Banking serves branch customers in larger and urban locations as a separate line of business through partnerships with all businesses of the bank. Our highly successful In-store Banking operates branches inside grocery stores, colleges and universities, workplaces, retirement centers and other high-traffic locations.


Expanding in-store banking office distribution.In 2003, we began a major expansion of our in-store network — the third largest in the country — by partnering with supermarket retailers Safeway Inc., Publix and Smith’s Food & Drug Stores. Beginning with six new Nashville Publix branches in 2003, by the end of 2004, U.S. Bank will have opened 15 new Smith’s in-store branches in Utah, and by the end of 2005 we will have opened a total of 163 new full-service in-store locations in Safeway and Vons stores throughout California, Arizona and Nevada.
Strategic investments solidify our position in high-growth markets and businesses.In 2003, U.S. Bank completed system conversions resulting from the 2002 purchase and deposit assumption of 57 Bay View Bank branches in California. This transaction strengthened the U.S. Bank geographic footprint in California, adding to existing U.S. Bank branches to create an integrated network offering complete coverage of the fast-growing Greater Bay area- San Francisco, San Jose, Alameda County, Contra Costa County, Santa Rosa, Vallejo-Fairfield-Sonoma and Santa Cruz.
In 2003, U.S. Bank also completed system conversions resulting from the purchase of State Street Corporate Trust in 2002. This transaction strongly complemented our existing corporate trust business, making U.S. Bank the leading corporate trust provider in New England in addition to our current lead status in the Northwest, West and Central regions of the country.
With over thirty-five years of experience, Millennium Development Corp. has invested in and developed a wide variety of real estate projects ranging from agricultural land to office buildings to shopping centers. As an equity participant in each project, Millennium Development Corp. is committed to preserving capital and producing an attractive return on investment. For more than 10 years, U.S. Bank Small Business Banking has provided the cash flow management, credit and financing resources that support Millennium Development’s business vision.


a t t r a c t i v eb u s i n e s sm i x
The sports, educational and cultural programs of the Mathews-Dickey Boys’ & Girls’ Club in St. Louis instill “The Three R’s: Respect, Restraint & Responsibility” within more than 40,000 deserving young men and women each year. In 1982, President Ronald Reagan recognized the Club’s neighbor-helping neighbor concept by declaring it a model for the country. Numerous other government, media, sports and civic luminaries have applauded the 44-year-old organization’s impact in keeping more than one million youth on the fields, in the classroom and off the streets. We’ve enjoyed a successful relationship with Mathews-Dickey, a long-time client of the U.S. Bank Private Client Group. We are proud to manage the Endowment Fund for Mathews- Dickey to support its youth-enrichment programs for years to come.
U.S. Bancorp serves multiple customer segments in our 24-state footprint through a broad, attractive business mix with scale, resulting in competitive advantages, operating economies, reduced risk, diversified revenue streams and a wide range of ways to satisfy every customer.
U.S. Bancorp has a very attractive growth franchise.Our core regional businesses operate in our 24-state footprint and benefit from the geographic density of our banking locations and franchise support in terms of cross-sell, crossservicing and back-office support. Our top-performing regional businesses, combined with our specialized national-scale businesses, create a diversified and advantaged revenue mix of both spread and fee income from discrete sources. With challenge, opportunity, risk and reward spread across all geographic markets and a wide range of customer and business segments, we are positioned to capitalize on a recovering economy, while tolerating individual market or industry weaknesses.


Improving business unit trends. We see strong business momentum in Consumer Banking; we opened nearly a quarter of a million more checking accounts than were closed in 2003. A checking account is our retail customers’ primary link to U.S. Bank and is the basis for our 11.7 percent compound annual growth rate in branch-generated average low-cost core deposits. More importantly, checking is the starting point for expanded consumer relationships, reflected in a 12 percent compound annual growth rate in branch-generated average retail loans. Small business loans and branch-based investment product fee income also showed double-digit growth rates.
Our investment in distribution in high-growth markets continues, most particularly our current in-store branch expansion and our extension of mortgage banking origination capabilities in western markets.
In our Wholesale Banking business, the timing of commercial loan growth is still uncertain; however, we expect credit improvement trends to continue, a key driver of future growth. Along with loan generation, our relationship managers are putting renewed focus on providing appropriate supplementary services and deposit products to our commercial customers.
Improving equity markets are driving growth in our Private Client, Trust & Asset Management business units, as are outstanding service and our exceptional personal attention to each customer. Deposits, total loans and noninterest income are on upward trends. We strive to increase the level and breadth of services we provide to corporate executives, business owners, legal and healthcare professionals, professional athletes and non-profit organizations with their specialized and complex financial needs. Private Client Group earns an increasing share of wallet through expert investment management, financial planning, personal trust and private banking services. Institutional investment needs are met with high-performing securities lending, equity, fixed income and cash products.
Revenue byBusiness Segment
15.1% Metropolitan Banking11.9% Community Banking10.3% Retail Payment Solutions 6.7% Corporate Banking 6.2% NOVA Information Systems 5.5% Middle Market Banking 4.9% Mortgage Banking 4.3% Consumer Lending 3.9% Private Client Group 3.4% Commercial Real Estate 2.5% Corporate Trust 2.0% Government Banking 1.9% Asset Management 1.9% Corporate Payment Systems 1.1% Institutional Trust .7% Fund Services
DiversifiedRegional Businesses
Consumer Banking
Institutional Trust
Middle Market Banking
Private Client Group


With top-ranked payment services, expertise in highly specialized businesses, advanced technological capabilities and financial products and services not limited by location, U.S. Bancorp has built a national standing in a number of high-growth businesses.
h i g h — v a l u en a t i o n a lb u s i n e s s e s
Lockheed Martin Corporation, the world’s premier advanced technology systems integrator, has partnered with U.S. Bank Corporate Payment Systems for ten years, adopting a full range of Corporate Payment Systems services, including corporate travel card and purchasing card programs. As a result of U.S. Bank Corporate Payment Systems’ flexibility and client-focus, Lockheed Martin recently extended its purchasing card commitment with a new five-year contract
Connie Mearkle (left), Assistant Treasurer,and Molly Chung (right), Director,Global Treasury OperationsLockheed Martin CorporationBethesda, MD
Payment Services is a high-value, growth business without boundaries.U.S. Bank has developed innovative payment services to meet the rapidly expanding needs of consumers, businesses, financial institutions, government entities and millions of merchants throughout the world. This line of business has unlimited potential, and we utilize our expertise, technology and reputation for service to seize a growing share of business within this burgeoning arena.
We are the Number 3 merchant processor (NOVA), the Number 1 Visa commercial card issuer, the Number 2 small business card issuer, the Number 7 Visa and MasterCard® consumer card issuer, the Number 2 bank-owned ATM network, the Number 2 universal fleet card (Voyager) and the Number 2 freight payment provider (PowerTrack®).
Through NOVA Information Systems, recognized for superlative customer service and technical proficiency, ourMerchant Processingbusiness ranks third in the nation and serves more than 600,000 merchant locations in the United States and in Europe. We continue to expand this business through penetration of the U.S. Bank customer base of merchants and through ongoing activities, backed by the full resources of U.S. Bancorp, to gain additional merchant customers.


OurRetail Payment Solutions business is unique among large issuers in that we build this business in large part on relationship-based efforts among our retail and small business customers, among our growing network of correspondent financial institutions and with a star-studded roster of co-brand partners. There is enormous potential in the further penetration of our existing customer base and in our ability to stay at the leading edge of new product introductions.
Corporate Payment Systems is at the forefront of payment providers, using leading technology and expertise to automate the entire payment continuum for commercial buyers and sellers. Card solutions like One Card, Corporate Card, Purchasing Card and Fleet Card provide flexible solutions for classic payables, while PowerTrack adds increased control and sophisticated pre-payment audits for complex business-to-business procurement processes.
With a compelling investment in the industry’s best technology, ourTransaction Services is the hub of electronic payments transactions for all U.S. Bancorp ATMs, as well as ATMs, credit and debit cards, merchant processing, and the electronic funds transfer network gateway for other financial institutions, through Elan Financial Services. With expertise, technology, economy of scale and existing potential still within our markets, this is a full-service, start-to-finish business with growth expectation.
Diverse U.S. Bancorp national businesses serve customers coast to coast. U.S. Bank is a leading financial resource for local and state government, political sub-divisions and the federal government through ourGovernment Banking business. We are one of the largest tax payment processors for the U.S. Government, and we provide a wide range of financial services for the Department of Defense, as well as web and lockbox collection services for the U.S. Department of Homeland Security.Mortgage Banking originates loans in all 50 states. We are targeting becoming a Top 10 mortgage provider through expanded sales efforts nationally and also the extension of our Mortgage Banking as a primary line of business into our western markets.
With expertise to support the nation’s largest corporations, specialized industries and our middle market customers,Corporate Banking provides services to meet the most complex transactional, credit, financial management, international financing and exchange, and risk mitigation needs. We are also a national leader in treasury management services. Our relationship-based model succeeds on the experience of our managers, the economies of scope and scale derived from our size and geography and our commitment to cost management. As the leading provider of municipal trust services and a top provider of corporate, escrow and structured finance services,Corporate Trust Services brings an unrelenting commitment to exceeding expectations by providing the right solutions at the right time for customers nationwide.
U.S. Bancorp Asset Management leverages the multiple distribution channels and broad geographic range of U.S. Bank to deliver the First American family of mutual funds, which encompasses a full range of equity and fixed income investment strategies. We are a performance-driven culture of expanding non-proprietary distribution, and we continue to promote U.S. Bancorp Asset Management to prospective customers nationwide.
NationalBusinesses


c o m m u n i t yp a r t n e r s h i p s


Our commitment to helping build strong communities begins with local market leadership and dedicated community involvement. U.S. Bancorp and our employees are committed to giving and volunteerism in the markets we serve. We make this investment proudly, promoting powerful partnerships and fostering economic development in communities, small and large, across the country.
Creating stronger communities for a stronger company. U.S. Bancorp is not just part of the community — we’re a partner in all the communities we serve across the country. Working with people, businesses and non-profit organizations in these local markets, we assist with economic, educational and cultural development. As an active partner, U.S. Bancorp provides superior, competitive products and services to every customer we serve, while offering customized financial solutions to customers and businesses who need assistance overcoming challenging financial situations. By helping to create strong, vibrant communities, U.S. Bancorp is building a healthy marketplace for our company - one community at a time.
Sponsorships support quality of life.The enduring vitality of a community is ultimately in the hands of its artists, athletes, performers, scholars, musicians and the institutions that train, educate, nurture and promote them. We extend sponsorship support to a variety of music, arts, sports and education programs, in addition to many other civic and cultural activities. From county fairs to the performing arts to professional, minor league, collegiate and high school sports, U.S. Bancorp supports a diverse range of opportunities and interests of our customers.

Empowering local leaders. To meet the unique needs of the communities we serve, local leaders are empowered with the autonomy to customize all the resources of U.S. Bancorp for their individual markets. Coupled with the valuable insight of local market leaders, local boards provide further knowledge, expertise and insight into each community’s businesses, industries and important causes. Together, this leadership team is equipped with the first-hand knowledge needed to make strategic pricing and business development decisions that strengthen both U.S. Bancorp and the community.
Investing in our employees. The U.S. Bancorp Development Network promotes the personal and professional development of our employees by enhancing leadership, management and communication skills; organizing networking opportunities; providing community involvement opportunities; and encouraging and capitalizing on the diversity of our employees. The Development Network is composed of 42 geographically based chapters, which share these objectives and fulfill the program’s mission by organizing professional and community service activities, such as financial and leadership seminars for employees, mentoring opportunities, charitable fundraising drives and more.
U.S. Bank gives “Back 2 Schools in Minnesota.” U.S. Bank is investing nearly $500,000 in programs that support Minnesota teachers, high schools and students during the 2003-2004 school year. Designed to enrich student learning, recognize outstanding high school students and assist school athletic programs, Back 2 Schools is part of the ongoing investment U.S. Bank makes in Minnesota schools. Cynthia Welsh, teacher at Cloquet High School, has developed an interactive science discovery class using the funds she received from a U.S. Bank Back 2 Schools grant. Cynthia and her students collaborate with the Fond du Lac Band of Lake Superior Chippewa and other local scientists conducting environmental research that benefits the entire community.


OVERVIEW
In 2003,2004, U.S. Bancorp and its subsidiaries (the “Company”) achieved each of the goals outlined for the year despite challenging economic conditions in early 2003.continued to demonstrate its financial strength and shareholder focus. We began the year with several specific financial objectives. The first goal was toa focus on organic revenue growth. In 2003,While growth in net interest income has been challenging for the Company’sbanking industry due to rising interest rates and sluggish commercial loan growth, the Company experienced strong growth in its fee-based revenues, particularly in payment processing services. The Company generated fee-based revenue growth of 3.911.0 percent included 3.7 percentin 2004. By year-end, commercial loan balances also displayed encouraging trends as the Company experienced its first year-over-year growth in quarterly average balances since mid-2001. Retail loans continued to display strong growth in 2004. In 2005, the Company will continue to focus on revenue from baselinegrowth driven by disciplined strategic business productsinitiatives, customer service and services.an emphasis on payment processing, retail banking and commercial lending. The second goal was to continue improving our operating leverage. During 2003, our efficiency ratio improved to 45.6 percent compared with 48.8 percent in 2002. Third, the Company was determined to continue improving its credit quality and reduceof our loan portfolios. During the overall risk profile of the organization. Nonperformingyear nonperforming assets have declined 16.434.8 percent from a year ago and total net charge-offs decreased to 1.06.63 percent of average loans outstanding in 20032004, compared with 1.201.06 percent in 2002. Finally, despite2003. By year end 2004, the challengescredit risk profile of 2003, the Company had improved to pre-2001 levels. In 2005, the Company will continue to focus on credit quality and minimizing volatility of credit-related losses. Finally, effectively managing costs is always desiresa goal for the Company. During 2004, our efficiency ratio (the ratio of noninterest expense to grow revenues faster than expenses.taxable-equivalent net revenue excluding net securities gains or losses) improved to 45.3 percent, compared with 45.6 percent in 2003, and continues to be a leader in the banking industry. The Company’s results for 20032004 reflect the achievement of this objective.these operating objectives and help to position the Company to achieve its long-term goal of 10 percent or greater growth in earnings per diluted share.
Earnings SummaryThe Company reported net income of $3.7$4.2 billion in 2003,2004, or $2.18 per diluted share, compared with $3.7 billion, or $1.93 per diluted share, compared with $3.2 billion, or $1.65in 2003. The 13.0 percent increase in earnings per diluted share principally reflected growth in 2002.fee-based revenues and lower credit costs. Return on average assets and return on average equity were 2.17 percent and 21.4 percent, respectively, in 2004, compared with returns of 1.99 percent and 19.2 percent, respectively, in 2003, compared with returns of 1.84 percent and 18.3 percent, respectively, in 2002.2003. Net income in 2003 included after-tax income from discontinued operations of $22.5 million, or $.01 per diluted share, compared with an after-tax loss of $22.7 million, or $.01 per diluted share, in 2002. Included in net income for 2002 was an after-tax goodwill impairment charge of $37.2 million, or $.02 per diluted share, primarily related to the purchase of a transportation leasing company in 1998 by the equipment leasing business. This charge was taken at the time of adopting new accounting standards related to goodwill and other intangible assets and was recognized as a “cumulative effect of accounting change” in the income statement. Refer to Note 2 of the Notes to Consolidated Financial Statements for further discussion of the impact of changes in accounting principles.share.
changes in interest rates and related prepayments. Refer to “Merger and Restructuring-Related Items” for further discussion on merger and restructuring-related items and the related earnings impact.
| Table 1 | Selected Financial Data |
| Year Ended December 31 | Year Ended December 31 | Year Ended December 31 | ||||||||||||||||||||||||||||||||||||||||
| (Dollars and Shares in Millions, Except Per Share Data) | (Dollars and Shares in Millions, Except Per Share Data) | 2003 | 2002 | 2001 | 2000 | 1999 | (Dollars and Shares in Millions, Except Per Share Data) | 2004 | 2003 | 2002 | 2001 | 2000 | ||||||||||||||||||||||||||||||
Condensed Income Statement | Condensed Income Statement | Condensed Income Statement | ||||||||||||||||||||||||||||||||||||||||
| Net interest income (taxable-equivalent basis) (a) | Net interest income (taxable-equivalent basis) (a) | $ | 7,217.5 | $ | 6,847.2 | $ | 6,405.2 | $ | 6,072.4 | $ | 5,875.7 | Net interest income (taxable-equivalent basis) (a) | $ | 7,139.9 | $ | 7,217.5 | $ | 6,847.2 | $ | 6,405.2 | $ | 6,072.4 | ||||||||||||||||||||
| Noninterest income | Noninterest income | 5,068.2 | 4,910.8 | 4,340.3 | 3,958.9 | 3,501.9 | Noninterest income | 5,624.1 | 5,068.2 | 4,910.8 | 4,340.3 | 3,958.9 | ||||||||||||||||||||||||||||||
| Securities gains, net | 244.8 | 299.9 | 329.1 | 8.1 | 13.2 | |||||||||||||||||||||||||||||||||||||
| Securities gains (losses), net | Securities gains (losses), net | (104.9 | ) | 244.8 | 299.9 | 329.1 | 8.1 | |||||||||||||||||||||||||||||||||||
| Total net revenue | 12,530.5 | 12,057.9 | 11,074.6 | 10,039.4 | 9,390.8 | Total net revenue | 12,659.1 | 12,530.5 | 12,057.9 | 11,074.6 | 10,039.4 | |||||||||||||||||||||||||||||||
| Noninterest expense | Noninterest expense | 5,596.9 | 5,740.5 | 6,149.0 | 4,982.9 | 5,131.8 | Noninterest expense | 5,784.5 | 5,596.9 | 5,740.5 | 6,149.0 | 4,982.9 | ||||||||||||||||||||||||||||||
| Provision for credit losses | Provision for credit losses | 1,254.0 | 1,349.0 | 2,528.8 | 828.0 | 646.0 | Provision for credit losses | 669.6 | 1,254.0 | 1,349.0 | 2,528.8 | 828.0 | ||||||||||||||||||||||||||||||
| Income from continuing operations before taxes | 5,679.6 | 4,968.4 | 2,396.8 | 4,228.5 | 3,613.0 | Income from continuing operations before taxes | 6,205.0 | 5,679.6 | 4,968.4 | 2,396.8 | 4,228.5 | |||||||||||||||||||||||||||||||
| Taxable-equivalent adjustment | Taxable-equivalent adjustment | 28.2 | 32.9 | 54.5 | 82.0 | 94.2 | Taxable-equivalent adjustment | 28.6 | 28.2 | 32.9 | 54.5 | 82.0 | ||||||||||||||||||||||||||||||
| Applicable income taxes | Applicable income taxes | 1,941.3 | 1,707.5 | 818.3 | 1,422.0 | 1,296.3 | Applicable income taxes | 2,009.6 | 1,941.3 | 1,707.5 | 818.3 | 1,422.0 | ||||||||||||||||||||||||||||||
| Income from continuing operations | 3,710.1 | 3,228.0 | 1,524.0 | 2,724.5 | 2,222.5 | Income from continuing operations | 4,166.8 | 3,710.1 | 3,228.0 | 1,524.0 | 2,724.5 | |||||||||||||||||||||||||||||||
| Discontinued operations (after-tax) | Discontinued operations (after-tax) | 22.5 | (22.7 | ) | (45.2 | ) | 27.6 | 17.9 | Discontinued operations (after-tax) | — | 22.5 | (22.7 | ) | (45.2 | ) | 27.6 | ||||||||||||||||||||||||||
| Cumulative effect of accounting change (after-tax) | Cumulative effect of accounting change (after-tax) | — | (37.2 | ) | — | — | — | Cumulative effect of accounting change (after-tax) | — | — | (37.2 | ) | — | — | ||||||||||||||||||||||||||||
| Net income | $ | 3,732.6 | $ | 3,168.1 | $ | 1,478.8 | $ | 2,752.1 | $ | 2,240.4 | Net income | $ | 4,166.8 | $ | 3,732.6 | $ | 3,168.1 | $ | 1,478.8 | $ | 2,752.1 | |||||||||||||||||||||
Per Common Share | Per Common Share | Per Common Share | ||||||||||||||||||||||||||||||||||||||||
| Earnings per share from continuing operations | Earnings per share from continuing operations | $ | 1.93 | $ | 1.68 | $ | .79 | $ | 1.43 | $ | 1.16 | Earnings per share from continuing operations | $ | 2.21 | $ | 1.93 | $ | 1.68 | $ | .79 | $ | 1.43 | ||||||||||||||||||||
| Diluted earnings per share from continuing operations | Diluted earnings per share from continuing operations | 1.92 | 1.68 | .79 | 1.42 | 1.15 | Diluted earnings per share from continuing operations | 2.18 | 1.92 | 1.68 | .79 | 1.42 | ||||||||||||||||||||||||||||||
| Earnings per share | Earnings per share | 1.94 | 1.65 | .77 | 1.44 | 1.17 | Earnings per share | 2.21 | 1.94 | 1.65 | .77 | 1.44 | ||||||||||||||||||||||||||||||
| Diluted earnings per share | Diluted earnings per share | 1.93 | 1.65 | .76 | 1.43 | 1.16 | Diluted earnings per share | 2.18 | 1.93 | 1.65 | .76 | 1.43 | ||||||||||||||||||||||||||||||
| Dividends declared per share (b) | Dividends declared per share (b) | .855 | .780 | .750 | .650 | .460 | Dividends declared per share (b) | 1.020 | .855 | .780 | .750 | .650 | ||||||||||||||||||||||||||||||
| Book value per share | Book value per share | 10.01 | 9.62 | 8.58 | 8.06 | 7.29 | Book value per share | 10.52 | 10.01 | 9.62 | 8.58 | 8.06 | ||||||||||||||||||||||||||||||
| Market value per share | Market value per share | 29.78 | 21.22 | 20.93 | 23.25 | 21.13 | Market value per share | 31.32 | 29.78 | 21.22 | 20.93 | 23.25 | ||||||||||||||||||||||||||||||
| Average shares outstanding | 1,923.7 | 1,916.0 | 1,927.9 | 1,906.0 | 1,907.8 | |||||||||||||||||||||||||||||||||||||
| Average diluted shares outstanding | 1,936.2 | 1,924.8 | 1,940.3 | 1,918.5 | 1,930.0 | |||||||||||||||||||||||||||||||||||||
| Average common shares outstanding | Average common shares outstanding | 1,887.1 | 1,923.7 | 1,916.0 | 1,927.9 | 1,906.0 | ||||||||||||||||||||||||||||||||||||
| Average diluted common shares outstanding | Average diluted common shares outstanding | 1,912.9 | 1,936.2 | 1,924.8 | 1,940.3 | 1,918.5 | ||||||||||||||||||||||||||||||||||||
Financial Ratios | Financial Ratios | Financial Ratios | ||||||||||||||||||||||||||||||||||||||||
| Return on average assets | Return on average assets | 1.99 | % | 1.84 | % | .89 | % | 1.74 | % | 1.49 | % | Return on average assets | 2.17 | % | 1.99 | % | 1.84 | % | .89 | % | 1.74 | % | ||||||||||||||||||||
| Return on average equity | Return on average equity | 19.2 | 18.3 | 9.0 | 19.0 | 16.9 | Return on average equity | 21.4 | 19.2 | 18.3 | 9.0 | 19.0 | ||||||||||||||||||||||||||||||
| Net interest margin (taxable-equivalent basis) | Net interest margin (taxable-equivalent basis) | 4.49 | 4.65 | 4.46 | 4.38 | 4.43 | Net interest margin (taxable-equivalent basis) | 4.25 | 4.49 | 4.65 | 4.46 | 4.38 | ||||||||||||||||||||||||||||||
| Efficiency ratio (c) | Efficiency ratio (c) | 45.6 | 48.8 | 57.2 | 49.7 | 54.7 | Efficiency ratio (c) | 45.3 | 45.6 | 48.8 | 57.2 | 49.7 | ||||||||||||||||||||||||||||||
Average Balances | Average Balances | Average Balances | ||||||||||||||||||||||||||||||||||||||||
| Loans | Loans | $ | 118,362 | $ | 114,453 | $ | 118,177 | $ | 118,317 | $ | 109,638 | Loans | $ | 122,141 | $ | 118,362 | $ | 114,453 | $ | 118,177 | $ | 118,317 | ||||||||||||||||||||
| Loans held for sale | Loans held for sale | 3,616 | 2,644 | 1,911 | 1,303 | 1,450 | Loans held for sale | 1,608 | 3,616 | 2,644 | 1,911 | 1,303 | ||||||||||||||||||||||||||||||
| Investment securities | Investment securities | 37,248 | 28,829 | 21,916 | 17,311 | 19,271 | Investment securities | 43,009 | 37,248 | 28,829 | 21,916 | 17,311 | ||||||||||||||||||||||||||||||
| Earning assets | Earning assets | 160,808 | 147,410 | 143,501 | 138,636 | 132,685 | Earning assets | 168,123 | 160,808 | 147,410 | 143,501 | 138,636 | ||||||||||||||||||||||||||||||
| Assets | Assets | 187,630 | 171,948 | 165,944 | 158,481 | 150,167 | Assets | 191,593 | 187,630 | 171,948 | 165,944 | 158,481 | ||||||||||||||||||||||||||||||
| Noninterest-bearing deposits | Noninterest-bearing deposits | 31,715 | 28,715 | 25,109 | 23,820 | 23,556 | Noninterest-bearing deposits | 29,816 | 31,715 | 28,715 | 25,109 | 23,820 | ||||||||||||||||||||||||||||||
| Deposits | Deposits | 116,553 | 105,124 | 104,956 | 103,426 | 99,920 | Deposits | 116,222 | 116,553 | 105,124 | 104,956 | 103,426 | ||||||||||||||||||||||||||||||
| Short-term borrowings | Short-term borrowings | 10,503 | 10,116 | 11,679 | 11,008 | 10,883 | Short-term borrowings | 14,534 | 10,503 | 10,116 | 11,679 | 11,008 | ||||||||||||||||||||||||||||||
| Long-term debt | Long-term debt | 30,965 | 29,268 | 24,133 | 21,916 | 19,873 | Long-term debt | 35,115 | 33,663 | 32,172 | 26,088 | 23,316 | ||||||||||||||||||||||||||||||
| Total shareholders’ equity | 19,393 | 17,273 | 16,426 | 14,499 | 13,273 | |||||||||||||||||||||||||||||||||||||
| Shareholders’ equity | Shareholders’ equity | 19,459 | 19,393 | 17,273 | 16,426 | 14,499 | ||||||||||||||||||||||||||||||||||||
Period End Balances | Period End Balances | Period End Balances | ||||||||||||||||||||||||||||||||||||||||
| Loans | Loans | $ | 118,235 | $ | 116,251 | $ | 114,405 | $ | 122,365 | $ | 113,229 | Loans | $ | 126,315 | $ | 118,235 | $ | 116,251 | $ | 114,405 | $ | 122,365 | ||||||||||||||||||||
| Allowance for credit losses | Allowance for credit losses | 2,369 | 2,422 | 2,457 | 1,787 | 1,710 | Allowance for credit losses | 2,269 | 2,369 | 2,422 | 2,457 | 1,787 | ||||||||||||||||||||||||||||||
| Investment securities | Investment securities | 43,334 | 28,488 | 26,608 | 17,642 | 17,449 | Investment securities | 41,481 | 43,334 | 28,488 | 26,608 | 17,642 | ||||||||||||||||||||||||||||||
| Assets | Assets | 189,286 | 180,027 | 171,390 | 164,921 | 154,318 | Assets | 195,104 | 189,471 | 180,027 | 171,390 | 164,921 | ||||||||||||||||||||||||||||||
| Deposits | Deposits | 119,052 | 115,534 | 105,219 | 109,535 | 103,417 | Deposits | 120,741 | 119,052 | 115,534 | 105,219 | 109,535 | ||||||||||||||||||||||||||||||
| Long-term debt | Long-term debt | 31,215 | 28,588 | 25,716 | 21,876 | 21,027 | Long-term debt | 34,739 | 33,816 | 31,582 | 28,542 | 23,276 | ||||||||||||||||||||||||||||||
| Total shareholders’ equity | 19,242 | 18,436 | 16,745 | 15,333 | 14,051 | |||||||||||||||||||||||||||||||||||||
| Shareholders’ equity | Shareholders’ equity | 19,539 | 19,242 | 18,436 | 16,745 | 15,333 | ||||||||||||||||||||||||||||||||||||
| Regulatory capital ratios | Regulatory capital ratios | Regulatory capital ratios | ||||||||||||||||||||||||||||||||||||||||
| Tangible common equity | 6.5 | % | 5.7 | % | 5.9 | % | 6.4 | % | * | % | Tangible common equity | 6.4 | % | 6.5 | % | 5.7 | % | 5.9 | % | 6.4 | % | |||||||||||||||||||||
| Tier 1 capital | 9.1 | 8.0 | 7.8 | 7.3 | 7.4 | Tier 1 capital | 8.6 | 9.1 | 8.0 | 7.8 | 7.3 | |||||||||||||||||||||||||||||||
| Total risk-based capital | 13.6 | 12.4 | 11.9 | 10.7 | 11.1 | Total risk-based capital | 13.1 | 13.6 | 12.4 | 11.9 | 10.7 | |||||||||||||||||||||||||||||||
| Leverage | 8.0 | 7.7 | 7.9 | 7.5 | 7.6 | Leverage | 7.9 | 8.0 | 7.7 | 7.9 | 7.5 | |||||||||||||||||||||||||||||||
| (a) | Interest and rates are presented on a fully taxable-equivalent basis utilizing a tax rate of 35 percent. |
| (b) | Dividends per share have not been restated for the 2001 Firstar/ |
| (c) | Computed as noninterest expense divided by the sum of net interest income on a taxable-equivalent basis and noninterest income excluding securities gains (losses), net. |
Acquisition and Divestiture ActivityOn December 31, 2003, the Company announced that it had completed the tax-free distribution of Piper Jaffray Companies representing substantially all of the Company’s capital markets business line. The Company distributed to our shareholders one share of Piper Jaffray common stock for every 100 shares of U.S. Bancorp common stock, by means of a special dividend of $685 million. This distribution did not include brokerage, financial advisory or asset management services offered to customers through other business units. The Company will continuecontinues to provide asset management services to its customers through the Private Client, Trust and Asset Management business segment and access to investment products and services through its extensive network of licensed financial advisors within the retail brokerage platform of the Consumer Banking business segment.
STATEMENT OF INCOME ANALYSIS
Net Interest IncomeNet interest income, on a taxable-equivalent basis, was $7.1 billion in 2004, compared with $7.2 billion in 2003 compared withand $6.8 billion in 2002 and $6.4 billion in 2001.2002. The increasedecline in net interest income in 2003 was driven by an increase2004 reflected modest growth in average earning assets, growth in averagemore than offset by lower net free funds and favorable changes in the Company’s average funding mix.interest margins. Also contributing to the year-over-year increasedecline in net interest income were recent acquisitions, including Leader, State Street Corporate Trust and Bay View, which accounted for approximately $71.9was a $37.6 million reduction in loan fees, the result of the increase during 2003.fewer loan prepayments in a rising rate environment. Average earning assets were $168.1 billion for 2004, compared with $160.8 billion and $147.4 billion for 2003 compared with $147.4 billion and $143.5 billion for 2002, and 2001, respectively. The $13.4$7.3 billion (9.1(4.5 percent) increase in average earning assets for 2003,2004, compared with 2002,2003, was primarily driven by increases in investment securities, loans held for sale, residential mortgages, and retail loans and investment securities, partially offset by a decline in commercial loans.loans and loans held for sale related to mortgage banking activities. The net interest margindecline in average commercial loans from a year ago reflected soft loan demand in 2003 was 4.49 percent, compared with 4.65 percent and 4.46 percentthrough the third quarter of 2004. The Company began to experience growth in 2002 and 2001, respectively. The 16 basis point decline in 2003 net interest margin, compared with 2002, primarily reflectedcommercial
| Table 2 | Analysis of Net Interest Income |
| 2003 | 2002 | 2004 | 2003 | |||||||||||||||||||||||||||||||||||||||
| (Dollars in Millions) | (Dollars in Millions) | 2003 | 2002 | 2001 | v 2002 | v 2001 | (Dollars in Millions) | 2004 | 2003 | 2002 | v 2003 | v 2002 | ||||||||||||||||||||||||||||||
Components of net interest income | Components of net interest income | Components of net interest income | ||||||||||||||||||||||||||||||||||||||||
| Income on earning assets (taxable-equivalent basis) (a) | $ | 9,286.2 | $ | 9,526.8 | $ | 11,000.9 | $ | (240.6 | ) | $ | (1,474.1 | ) | Income on earning assets (taxable-equivalent basis) (a) | $ | 9,215.1 | $ | 9,286.2 | $ | 9,526.8 | $ | (71.1 | ) | $ | (240.6 | ) | |||||||||||||||||
| Expense on interest-bearing liabilities | 2,068.7 | 2,679.6 | 4,595.7 | (610.9 | ) | (1,916.1 | ) | Expense on interest-bearing liabilities | 2,075.2 | 2,068.7 | 2,679.6 | 6.5 | (610.9 | ) | ||||||||||||||||||||||||||||
| Net interest income (taxable-equivalent basis) | Net interest income (taxable-equivalent basis) | $ | 7,217.5 | $ | 6,847.2 | $ | 6,405.2 | $ | 370.3 | $ | 442.0 | Net interest income (taxable-equivalent basis) | $ | 7,139.9 | $ | 7,217.5 | $ | 6,847.2 | $ | (77.6 | ) | $ | 370.3 | |||||||||||||||||||
| Net interest income, as reported | Net interest income, as reported | $ | 7,189.3 | $ | 6,814.3 | $ | 6,350.7 | $ | 375.0 | $ | 463.6 | Net interest income, as reported | $ | 7,111.3 | $ | 7,189.3 | $ | 6,814.3 | $ | (78.0 | ) | $ | 375.0 | |||||||||||||||||||
Average yields and rates paid | Average yields and rates paid | Average yields and rates paid | ||||||||||||||||||||||||||||||||||||||||
| Earning assets yield (taxable-equivalent basis) | 5.77 | % | 6.46 | % | 7.67 | % | (.69 | )% | (1.21 | )% | Earning assets yield (taxable-equivalent basis) | 5.48 | % | 5.77 | % | 6.46 | % | (.29 | )% | (.69 | )% | |||||||||||||||||||||
| Rate paid on interest-bearing liabilities | 1.60 | 2.26 | 3.91 | (.66 | ) | (1.65 | ) | Rate paid on interest-bearing liabilities | 1.53 | 1.60 | 2.26 | (.07 | ) | (.66 | ) | |||||||||||||||||||||||||||
| Gross interest margin (taxable-equivalent basis) | Gross interest margin (taxable-equivalent basis) | 4.17 | % | 4.20 | % | 3.76 | % | (.03 | )% | .44% | Gross interest margin (taxable-equivalent basis) | 3.95 | % | 4.17 | % | 4.20 | % | (.22 | )% | (.03 | )% | |||||||||||||||||||||
| Net interest margin (taxable-equivalent basis) | Net interest margin (taxable-equivalent basis) | 4.49 | % | 4.65 | % | 4.46 | % | (.16 | )% | .19% | Net interest margin (taxable-equivalent basis) | 4.25 | % | 4.49 | % | 4.65 | % | (.24 | )% | (.16 | )% | |||||||||||||||||||||
Average balances | Average balances | Average balances | ||||||||||||||||||||||||||||||||||||||||
| Investment securities | $ | 37,248 | $ | 28,829 | $ | 21,916 | $ | 8,419 | $ | 6,913 | Investment securities | $ | 43,009 | $ | 37,248 | $ | 28,829 | $ | 5,761 | $ | 8,419 | |||||||||||||||||||||
| Loans | 118,362 | 114,453 | 118,177 | 3,909 | (3,724 | ) | Loans | 122,141 | 118,362 | 114,453 | 3,779 | 3,909 | ||||||||||||||||||||||||||||||
| Earning assets | 160,808 | 147,410 | 143,501 | 13,398 | 3,909 | Earning assets | 168,123 | 160,808 | 147,410 | 7,315 | 13,398 | |||||||||||||||||||||||||||||||
| Interest-bearing liabilities | 129,004 | 118,697 | 117,614 | 10,307 | 1,083 | Interest-bearing liabilities | 136,055 | 129,004 | 118,697 | 7,051 | 10,307 | |||||||||||||||||||||||||||||||
| Net free funds (b) | 31,804 | 28,713 | 25,887 | 3,091 | 2,826 | Net free funds (b) | 32,068 | 31,804 | 28,713 | 264 | 3,091 | |||||||||||||||||||||||||||||||
| (a) | Interest and rates are presented on a fully taxable-equivalent basis utilizing a tax rate of 35 percent. |
| (b) | Represents noninterest-bearing deposits, allowance for |
| Table 3 | Net Interest Income — Changes Due to Rate and Volume (a) |
| 2003 v 2002 | 2002 v 2001 | 2004 v 2003 | 2003 v 2002 | ||||||||||||||||||||||||||||||||||||||||||||||||||
| (Dollars in Millions) | (Dollars in Millions) | Volume | Yield/Rate | Total | Volume | Yield/Rate | Total | (Dollars in Millions) | Volume | Yield/Rate | Total | Volume | Yield/Rate | Total | |||||||||||||||||||||||||||||||||||||||
| Increase (decrease) in | Increase (decrease) in | Increase (decrease) in | |||||||||||||||||||||||||||||||||||||||||||||||||||
Interest income | Interest income | ||||||||||||||||||||||||||||||||||||||||||||||||||||
| Investment securities | $ | 254.3 | $ | (115.5 | ) | $ | 138.8 | $ | 428.4 | $ | (235.2 | ) | $ | 193.2 | |||||||||||||||||||||||||||||||||||||||
| Loans held for sale | (112.2 | ) | 1.5 | (110.7 | ) | 62.7 | (31.1 | ) | 31.6 | ||||||||||||||||||||||||||||||||||||||||||||
| Commercial loans | (110.8 | ) | 8.3 | (102.5 | ) | (149.0 | ) | (157.8 | ) | (306.8 | ) | ||||||||||||||||||||||||||||||||||||||||||
| Commercial real estate | 7.3 | (48.6 | ) | (41.3 | ) | 90.2 | (141.9 | ) | (51.7 | ) | |||||||||||||||||||||||||||||||||||||||||||
| Residential mortgage | 160.2 | (61.5 | ) | 98.7 | 232.5 | (114.4 | ) | 118.1 | |||||||||||||||||||||||||||||||||||||||||||||
| Retail loans | 210.4 | (264.5 | ) | (54.1 | ) | 134.9 | (363.9 | ) | (229.0 | ) | |||||||||||||||||||||||||||||||||||||||||||
| Total loans | 267.1 | (366.3 | ) | (99.2 | ) | 308.6 | (778.0 | ) | (469.4 | ) | |||||||||||||||||||||||||||||||||||||||||||
| Other earning assets | (13.7 | ) | 13.7 | — | 6.4 | (2.4 | ) | 4.0 | |||||||||||||||||||||||||||||||||||||||||||||
| Total | 395.5 | (466.6 | ) | (71.1 | ) | 806.1 | (1,046.7 | ) | (240.6 | ) | |||||||||||||||||||||||||||||||||||||||||||
Interest expense | Interest expense | ||||||||||||||||||||||||||||||||||||||||||||||||||||
Interest income | Interest checking | 8.0 | (21.5 | ) | (13.5 | ) | 22.6 | (40.6 | ) | (18.0 | ) | ||||||||||||||||||||||||||||||||||||||||||
| Investment securities | $ | 428.4 | $ | (235.2 | ) | $ | 193.2 | $ | 403.7 | $ | (235.2 | ) | $ | 168.5 | Money market accounts | 5.3 | (87.8 | ) | (82.5 | ) | 87.7 | (82.8 | ) | 4.9 | |||||||||||||||||||||||||||||
| Loans held for sale | 62.7 | (31.1 | ) | 31.6 | 56.4 | (32.7 | ) | 23.7 | Savings accounts | 1.0 | (6.8 | ) | (5.8 | ) | 3.5 | (7.4 | ) | (3.9 | ) | ||||||||||||||||||||||||||||||||||
| Commercial loans | (149.0 | ) | (157.8 | ) | (306.8 | ) | (451.0 | ) | (536.1 | ) | (987.1 | ) | Time certificates of deposit less than $100,000 | (70.4 | ) | (39.2 | ) | (109.6 | ) | (146.3 | ) | (146.2 | ) | (292.5 | ) | ||||||||||||||||||||||||||||
| Commercial real estate | 90.2 | (141.9 | ) | (51.7 | ) | (27.5 | ) | (338.9 | ) | (366.4 | ) | Time deposits greater than $100,000 | 24.6 | (5.5 | ) | 19.1 | 26.3 | (105.5 | ) | (79.2 | ) | ||||||||||||||||||||||||||||||||
| Residential mortgages | 232.5 | (114.4 | ) | 118.1 | (12.6 | ) | (50.3 | ) | (62.9 | ) | |||||||||||||||||||||||||||||||||||||||||||
| Retail loans | 134.9 | (363.9 | ) | (229.0 | ) | 288.2 | (543.6 | ) | (255.4 | ) | Total interest-bearing deposits | (31.5 | ) | (160.8 | ) | (192.3 | ) | (6.2 | ) | (382.5 | ) | (388.7 | ) | ||||||||||||||||||||||||||||||
| Short-term borrowings | 64.1 | 31.8 | 95.9 | 8.5 | (64.6 | ) | (56.1 | ) | |||||||||||||||||||||||||||||||||||||||||||||
| Total loans | 308.6 | (778.0 | ) | (469.4 | ) | (202.9 | ) | (1,468.9 | ) | (1,671.8 | ) | Long-term debt | 34.7 | 68.2 | 102.9 | 45.0 | (211.1 | ) | (166.1 | ) | |||||||||||||||||||||||||||||||||
| Other earning assets | 6.4 | (2.4 | ) | 4.0 | (.8 | ) | 6.3 | 5.5 | |||||||||||||||||||||||||||||||||||||||||||||
| Total | 67.3 | (60.8 | ) | 6.5 | 47.3 | (658.2 | ) | (610.9 | ) | ||||||||||||||||||||||||||||||||||||||||||||
| Total | 806.1 | (1,046.7 | ) | (240.6 | ) | 256.4 | (1,730.5 | ) | (1,474.1 | ) | |||||||||||||||||||||||||||||||||||||||||||
Interest expense | Increase (decrease) in net interest income | $ | 328.2 | $ | (405.8 | ) | $ | (77.6 | ) | $ | 758.8 | $ | (388.5 | ) | $ | 370.3 | |||||||||||||||||||||||||||||||||||||
| Interest checking | 22.6 | (40.6 | ) | (18.0 | ) | 24.4 | (125.7 | ) | (101.3 | ) | |||||||||||||||||||||||||||||||||||||||||||
| Money market accounts | 87.7 | (82.8 | ) | 4.9 | 8.7 | (406.9 | ) | (398.2 | ) | ||||||||||||||||||||||||||||||||||||||||||||
| Savings accounts | 3.5 | (7.4 | ) | (3.9 | ) | 3.3 | (20.7 | ) | (17.4 | ) | |||||||||||||||||||||||||||||||||||||||||||
| Time certificates of deposit less than $100,000 | (146.3 | ) | (146.2 | ) | (292.5 | ) | (215.2 | ) | (282.8 | ) | (498.0 | ) | |||||||||||||||||||||||||||||||||||||||||
| Time deposits greater than $100,000 | 26.3 | (105.5 | ) | (79.2 | ) | (83.1 | ) | (244.8 | ) | (327.9 | ) | ||||||||||||||||||||||||||||||||||||||||||
| Total interest-bearing deposits | (6.2 | ) | (382.5 | ) | (388.7 | ) | (261.9 | ) | (1,080.9 | ) | (1,342.8 | ) | |||||||||||||||||||||||||||||||||||||||||
| Short-term borrowings | 8.5 | (64.6 | ) | (56.1 | ) | (63.6 | ) | (189.1 | ) | (252.7 | ) | ||||||||||||||||||||||||||||||||||||||||||
| Long-term debt | 48.4 | (181.0 | ) | (132.6 | ) | 247.5 | (576.9 | ) | (329.4 | ) | |||||||||||||||||||||||||||||||||||||||||||
| Company-obligated mandatorily redeemable preferred securities | (9.7 | ) | (23.8 | ) | (33.5 | ) | 62.1 | (53.3 | ) | 8.8 | |||||||||||||||||||||||||||||||||||||||||||
| Total | 41.0 | (651.9 | ) | (610.9 | ) | (15.9 | ) | (1,900.2 | ) | (1,916.1 | ) | ||||||||||||||||||||||||||||||||||||||||||
| Increase (decrease) in net interest income | $ | 765.1 | $ | (394.8 | ) | $ | 370.3 | $ | 272.3 | $ | 169.7 | $ | 442.0 | ||||||||||||||||||||||||||||||||||||||||
| (a) | This table shows the components of the change in net interest income by volume and rate on a taxable-equivalent basis utilizing a tax rate of 35 percent. This table does not take into account the level of noninterest-bearing funding, nor does it fully reflect changes in the mix of assets and liabilities. The change in interest not solely due to changes in volume or rates has been allocated on a pro-rata basis to volume and yield/rate. |
Provision for Credit LossesThe provision for credit losses is recorded to bring the allowance for credit losses to a level deemed appropriate by management based on factors discussed in the “Analysis and Determination of Allowance for Credit Losses” section. The provision for credit losses was $669.6 million in 2004, compared with $1,254.0 million and $1,349.0 million in 2003 compared with $1,349.0 million and $2,528.82002, respectively.
Noninterest IncomeNoninterest income in 20032004 was $5.3$5.5 billion, compared with $5.3 billion in 2003 and $5.2 billion in 2002 and $4.7 billion in 2001.2002. The increase in noninterest income of $206.2 million (3.9 percent) in 2004, compared with 2003, was driven by strong organic growth in most fee-based products and services categories (11.0 percent), particularly in payment processing revenue. Partially offsetting the increase in fee-based revenue growth in 2004 was a year-over-year reduction in net securities gains (losses) of $349.7 million.
| Table 4 | Noninterest Income |
| 2004 | 2003 | ||||||||||||||||||||
| (Dollars in Millions) | 2004 | 2003 | 2002 | v 2003 | v 2002 | ||||||||||||||||
| Credit and debit card revenue | $ | 649.3 | $ | 560.7 | $ | 517.0 | 15.8 | % | 8.5 | % | |||||||||||
| Corporate payment products revenue | 406.8 | 361.3 | 325.7 | 12.6 | 10.9 | ||||||||||||||||
| ATM processing services | 175.3 | 165.9 | 160.6 | 5.7 | 3.3 | ||||||||||||||||
| Merchant processing services | 674.6 | 561.4 | 567.3 | 20.2 | (1.0 | ) | |||||||||||||||
| Trust and investment management fees | 981.2 | 953.9 | 892.1 | 2.9 | 6.9 | ||||||||||||||||
| Deposit service charges | 806.4 | 715.8 | 690.3 | 12.7 | 3.7 | ||||||||||||||||
| Treasury management fees | 466.7 | 466.3 | 416.9 | .1 | 11.8 | ||||||||||||||||
| Commercial products revenue | 432.2 | 400.5 | 479.2 | 7.9 | (16.4 | ) | |||||||||||||||
| Mortgage banking revenue | 397.3 | 367.1 | 330.2 | 8.2 | 11.2 | ||||||||||||||||
| Investment products fees and commissions | 156.0 | 144.9 | 132.7 | 7.7 | 9.2 | ||||||||||||||||
| Securities gains (losses), net | (104.9 | ) | 244.8 | 299.9 | * | (18.4 | ) | ||||||||||||||
| Other | 478.3 | 370.4 | 398.8 | 29.1 | (7.1 | ) | |||||||||||||||
| Total noninterest income | $ | 5,519.2 | $ | 5,313.0 | $ | 5,210.7 | 3.9 | % | 2.0 | % | |||||||||||
| 2003 | 2002 | ||||||||||||||||||||
| (Dollars in Millions) | 2003 | 2002 | 2001 | v 2002 | v 2001 | ||||||||||||||||
| Credit and debit card revenue | $ | 560.7 | $ | 517.0 | $ | 465.9 | 8.5 | % | 11.0 | % | |||||||||||
| Corporate payment products revenue | 361.3 | 325.7 | 297.7 | 10.9 | 9.4 | ||||||||||||||||
| ATM processing services | 165.9 | 160.6 | 153.0 | 3.3 | 5.0 | ||||||||||||||||
| Merchant processing services | 561.4 | 567.3 | 308.9 | (1.0 | ) | 83.7 | |||||||||||||||
| Trust and investment management fees | 953.9 | 892.1 | 887.8 | 6.9 | .5 | ||||||||||||||||
| Deposit service charges | 715.8 | 690.3 | 644.9 | 3.7 | 7.0 | ||||||||||||||||
| Treasury management fees | 466.3 | 416.9 | 347.3 | 11.8 | 20.0 | ||||||||||||||||
| Commercial products revenue | 400.5 | 479.2 | 437.4 | (16.4 | ) | 9.6 | |||||||||||||||
| Mortgage banking revenue | 367.1 | 330.2 | 234.0 | 11.2 | 41.1 | ||||||||||||||||
| Investment products fees and commissions | 144.9 | 132.7 | 130.8 | 9.2 | 1.5 | ||||||||||||||||
| Securities gains, net | 244.8 | 299.9 | 329.1 | (18.4 | ) | (8.9 | ) | ||||||||||||||
| Merger and restructuring-related gains | — | — | 62.2 | — | * | ||||||||||||||||
| Other | 370.4 | 398.8 | 370.4 | (7.1 | ) | 7.7 | |||||||||||||||
| Total noninterest income | $ | 5,313.0 | $ | 5,210.7 | $ | 4,669.4 | 2.0 | % | 11.6 | % | |||||||||||
* Not meaningful
Noninterest ExpenseNoninterest expense in 20032004 was $5.6$5.8 billion, compared with $5.6 billion and $5.7 billion in 2003 and $6.1 billion in 2002, and 2001, respectively. The Company’s efficiency ratio improved to 45.6 percentincrease of $187.6 million (3.4 percent) in 2003,2004, compared with 48.8 percent2003, principally reflected a $154.8 million charge related to the prepayment of a portion of the Company’s long-term debt, costs related to business initiatives and incremental expenses of $62.8 million due to the expansion of EuroConex. These increases were offset somewhat by a net reduction in 2002MSR impairments of $151.9 million and 57.2 percentlower merger and restructuring-related charges. In 2003, noninterest expense included $46.2 million of merger and restructuring-related costs related to acquisitions completed in 2001.prior years. Compensation expense increased in 2004, compared with 2003, due to increases in salaries and stock-based compensation. The improved operating leverageincrease in salaries reflected business
| 2003 | 2002 | ||||||||||||||||||||
| (Dollars in Millions) | 2003 | 2002 | 2001 | v 2002 | v 2001 | ||||||||||||||||
| Compensation | $ | 2,176.8 | $ | 2,167.5 | $ | 2,036.6 | .4 | % | 6.4 | % | |||||||||||
| Employee benefits | 328.4 | 317.5 | 285.5 | 3.4 | 11.2 | ||||||||||||||||
| Net occupancy and equipment | 643.7 | 658.7 | 666.6 | (2.3 | ) | (1.2 | ) | ||||||||||||||
| Professional services | 143.4 | 129.7 | 116.4 | 10.6 | 11.4 | ||||||||||||||||
| Marketing and business development | 180.3 | 171.4 | 178.0 | 5.2 | (3.7 | ) | |||||||||||||||
| Technology and communications | 417.4 | 392.1 | 353.9 | 6.5 | 10.8 | ||||||||||||||||
| Postage, printing and supplies | 245.6 | 243.2 | 241.9 | 1.0 | .5 | ||||||||||||||||
| Goodwill | — | — | 236.7 | — | * | ||||||||||||||||
| Other intangibles | 682.4 | 553.0 | 278.4 | 23.4 | 98.6 | ||||||||||||||||
| Merger and restructuring-related charges | 46.2 | 321.2 | 1,044.8 | (85.6 | ) | (69.3 | ) | ||||||||||||||
| Other | 732.7 | 786.2 | 710.2 | (6.8 | ) | 10.7 | |||||||||||||||
| Total noninterest expense | $ | 5,596.9 | $ | 5,740.5 | $ | 6,149.0 | (2.5 | )% | (6.6 | )% | |||||||||||
| Efficiency ratio (a) | 45.6 | % | 48.8 | % | 57.2 | % | |||||||||||||||
Pension PlansBecause of the long-term nature of pension plans, the administration and accounting for pensions is complex and can be impacted by several factors, including investment and funding policies, accounting methods and the plan’s actuarial assumptions. The Company and its Compensation Committee have an established process for evaluating the plans, their performance and significant plan assumptions, including the assumed discount rate and the long-term rate of return (“LTROR”). At least annually, an independent consultant is engaged to assist U.S. Bancorp’s Compensation Committee in evaluating plan objectives, funding policies and investment policies considering its long-term investment time horizon and asset allocation strategies. Note 1819 of the Notes to Consolidated Financial Statements provides further information on funding practices, investment policies and asset allocation strategies.
| Table 5 | Noninterest Expense |
| 2004 | 2003 | ||||||||||||||||||||
| (Dollars in Millions) | 2004 | 2003 | 2002 | v 2003 | v 2002 | ||||||||||||||||
| Compensation | $ | 2,252.2 | $ | 2,176.8 | $ | 2,167.5 | 3.5 | % | .4 | % | |||||||||||
| Employee benefits | 389.4 | 328.4 | 317.5 | 18.6 | 3.4 | ||||||||||||||||
| Net occupancy and equipment | 630.8 | 643.7 | 658.7 | (2.0 | ) | (2.3 | ) | ||||||||||||||
| Professional services | 148.9 | 143.4 | 129.7 | 3.8 | 10.6 | ||||||||||||||||
| Marketing and business development | 193.5 | 180.3 | 171.4 | 7.3 | 5.2 | ||||||||||||||||
| Technology and communications | 429.6 | 417.4 | 392.1 | 2.9 | 6.5 | ||||||||||||||||
| Postage, printing and supplies | 248.4 | 245.6 | 243.2 | 1.1 | 1.0 | ||||||||||||||||
| Other intangibles | 550.1 | 682.4 | 553.0 | (19.4 | ) | 23.4 | |||||||||||||||
| Merger and restructuring-related charges | — | 46.2 | 321.2 | * | (85.6 | ) | |||||||||||||||
| Debt prepayment | 154.8 | — | (.2 | ) | * | * | |||||||||||||||
| Other | 786.8 | 732.7 | 786.4 | 7.4 | (6.8 | ) | |||||||||||||||
| Total noninterest expense | $ | 5,784.5 | $ | 5,596.9 | $ | 5,740.5 | 3.4 | % | (2.5 | )% | |||||||||||
| Efficiency ratio (a) | 45.3 | % | 45.6 | % | 48.8 | % | |||||||||||||||
| (a) | Computed as noninterest expense divided by the sum of net interest income on a taxable-equivalent basis and noninterest income excluding securities gains (losses), net. |
| * | Not meaningful |
Note 1819 of the Notes to Consolidated Financial Statements provides a summary of the significant pension plan assumptions. Because of the subjective nature of plan assumptions, a sensitivity analysis to hypothetical changes in the LTROR and the discount rate is provided below:
| Base | Base | |||||||||||||||||||||||||||||||||||||||
| LTROR | 6.9% | 7.9% | 8.9% | 9.9% | 10.9% | 6.9% | 7.9% | 8.9% | 9.9% | 10.9% | ||||||||||||||||||||||||||||||
| Incremental benefit (cost) | $ | (45.8 | ) | $ | (22.9 | ) | $ | — | $ | 22.9 | $ | 45.8 | $ | (43.8 | ) | $ | (21.9 | ) | $ | — | $ | 21.9 | $ | 43.7 | ||||||||||||||||
| Percent of 2003 net income | (.76 | )% | (.38 | )% | — | % | .38 | % | .76 | % | ||||||||||||||||||||||||||||||
| Percent of 2004 net income | (.65 | )% | (.33 | )% | — | % | .33 | % | .65 | % | ||||||||||||||||||||||||||||||
| Base | Base | |||||||||||||||||||||||||||||||||||||||
| Discount rate | 4.2% | 5.2% | 6.2% | 7.2% | 8.2% | 4.0% | 5.0% | 6.0% | 7.0% | 8.0% | ||||||||||||||||||||||||||||||
| Incremental benefit (cost) | $ | (51.6 | ) | $ | (27.9 | ) | $ | — | $ | 31.6 | $ | 52.2 | $ | (57.0 | ) | $ | (30.9 | ) | $ | — | $ | 35.4 | $ | 73.5 | ||||||||||||||||
| Percent of 2003 net income | (.86 | )% | (.46 | )% | — | % | .52 | % | .87 | % | ||||||||||||||||||||||||||||||
| Percent of 2004 net income | (.85 | )% | (.46 | )% | — | % | .53 | % | 1.09 | % | ||||||||||||||||||||||||||||||
Due to the complexity of forecasting pension plan activities, the accounting method utilized for pension plans, management’s ability to respond to factors impacting the plans and the hypothetical nature of this information, the actual changes in periodic pension costs could be significantly different than the information provided in the sensitivity analysis.
Merger and Restructuring-Related ItemsThe Company incurred merger and restructuring-related items in each of the last three years in conjunction with its acquisitions. Merger and restructuring-related items included in pre-tax earnings were $46.2 million ($30.4 million after-tax) in 2003, compared with $321.2 million ($209.3 million after-tax) and $1,364.8 million ($904.5 million after-tax) for 2002 and 2001, respectively.
Income Tax ExpenseThe provision for income taxes was $2,009.6 million (an effective rate of 32.5 percent) in 2004, compared with $1,941.3 million (an effective rate of 34.4 percent) in 2003 compared withand $1,707.5 million (an effective rate of 34.6 percent) in 20022002. The improvement in the effective tax rate in 2004, compared with 2003, was primarily due to changes in estimated tax liabilities of $90.0 million related to the resolution of federal tax examinations covering substantially all of the Company’s legal entities for the years 1995 through 1999 and $818.3$16.3 million (an effective raterelated to the resolution of 34.9 percent) in 2001.a state tax examination for tax years through 2000. The improvement in the effective tax rate in 2003, compared with 2002, was primarily reflecteddriven by a change in unitary state tax apportionment factors driven by a shift in business mix as a result of the impact of acquisitions, market demographics, the mix of product revenue and an increase in federal and state tax credits. The improvement in the effective tax rate in 2002, compared with 2001, was primarily driven by a change in unitary state tax apportionment factors, a decrease in non-deductible merger and restructuring-related charges and the change in accounting for goodwill.
BALANCE SHEET ANALYSIS
Average earning assets were $168.1 billion in 2004, compared with $160.8 billion in 2003, compared with $147.4 billion in 2002.2003. The increase in average earning assets of $13.4$7.3 billion (9.1(4.5 percent) was primarily driven by growth in investment securities,
| 2003 | 2002 | 2001 | 2000 | 1999 | |||||||||||||||||||||||||||||||||||||||
| Percent | Percent | Percent | Percent | Percent | |||||||||||||||||||||||||||||||||||||||
| At December 31 (Dollars in Millions) | Amount | of Total | Amount | of Total | Amount | of Total | Amount | of Total | Amount | of Total | |||||||||||||||||||||||||||||||||
Commercial | |||||||||||||||||||||||||||||||||||||||||||
| Commercial | $ | 33,536 | 28.4 | % | $ | 36,584 | 31.5 | % | $ | 40,472 | 35.4 | % | $ | 47,041 | 38.5 | % | $ | 42,021 | 37.1 | % | |||||||||||||||||||||||
| Lease financing | 4,990 | 4.2 | 5,360 | 4.6 | 5,858 | 5.1 | 5,776 | 4.7 | 3,835 | 3.4 | |||||||||||||||||||||||||||||||||
| Total commercial | 38,526 | 32.6 | 41,944 | 36.1 | 46,330 | 40.5 | 52,817 | 43.2 | 45,856 | 40.5 | |||||||||||||||||||||||||||||||||
Commercial real estate | |||||||||||||||||||||||||||||||||||||||||||
| Commercial mortgages | 20,624 | 17.4 | 20,325 | 17.5 | 18,765 | 16.4 | 19,466 | 15.9 | 18,636 | 16.5 | |||||||||||||||||||||||||||||||||
| Construction and development | 6,618 | 5.6 | 6,542 | 5.6 | 6,608 | 5.8 | 6,977 | 5.7 | 6,506 | 5.7 | |||||||||||||||||||||||||||||||||
| Total commercial real estate | 27,242 | 23.0 | 26,867 | 23.1 | 25,373 | 22.2 | 26,443 | 21.6 | 25,142 | 22.2 | |||||||||||||||||||||||||||||||||
Residential mortgages | |||||||||||||||||||||||||||||||||||||||||||
| Residential mortgages | 7,332 | 6.2 | 6,446 | 5.6 | 5,746 | 5.0 | * | * | * | * | |||||||||||||||||||||||||||||||||
| Home equity loans, first liens | 6,125 | 5.2 | 3,300 | 2.8 | 2,083 | 1.8 | * | * | * | * | |||||||||||||||||||||||||||||||||
| Total residential mortgages | 13,457 | 11.4 | 9,746 | 8.4 | 7,829 | 6.8 | 9,397 | 7.7 | 12,760 | 11.3 | |||||||||||||||||||||||||||||||||
Retail | |||||||||||||||||||||||||||||||||||||||||||
| Credit card | 5,933 | 5.0 | 5,665 | 4.9 | 5,889 | 5.1 | 6,012 | 4.9 | 5,004 | 4.4 | |||||||||||||||||||||||||||||||||
| Retail leasing | 6,029 | 5.1 | 5,680 | 4.9 | 4,906 | 4.3 | 4,153 | 3.4 | 2,123 | 1.9 | |||||||||||||||||||||||||||||||||
| Home equity and second mortgages (a) | 13,210 | 11.2 | 13,572 | 11.6 | 12,235 | 10.7 | 11,956 | 9.7 | * | * | |||||||||||||||||||||||||||||||||
| Other retail | |||||||||||||||||||||||||||||||||||||||||||
| Revolving credit | 2,540 | 2.1 | 2,650 | 2.3 | 2,673 | 2.3 | 2,750 | 2.2 | * | * | |||||||||||||||||||||||||||||||||
| Installment | 2,380 | 2.0 | 2,258 | 1.9 | 2,292 | 2.0 | 2,186 | 1.8 | * | * | |||||||||||||||||||||||||||||||||
| Automobile | 7,165 | 6.1 | 6,343 | 5.5 | 5,660 | 5.0 | 5,609 | 4.6 | * | * | |||||||||||||||||||||||||||||||||
| Student | 1,753 | 1.5 | 1,526 | 1.3 | 1,218 | 1.1 | 1,042 | .9 | * | * | |||||||||||||||||||||||||||||||||
| Total other retail (a) | 13,838 | 11.7 | 12,777 | 11.0 | 11,843 | 10.4 | 11,587 | 9.5 | 22,344 | 19.7 | |||||||||||||||||||||||||||||||||
| Total retail | 39,010 | 33.0 | 37,694 | 32.4 | 34,873 | 30.5 | 33,708 | 27.5 | 29,471 | 26.0 | |||||||||||||||||||||||||||||||||
| Total loans | $ | 118,235 | 100.0 | % | $ | 116,251 | 100.0 | % | $ | 114,405 | 100.0 | % | $ | 122,365 | 100.0 | % | $ | 113,229 | 100.0 | % | |||||||||||||||||||||||
LoansThe Company’s total loan portfolio was $118.2$126.3 billion at December 31, 2003,2004, an increase of $2.0$8.1 billion (1.7(6.8 percent) from December 31, 2002.2003. The increase in total loans was driven by strong growth in retail loans (10.7 percent) and residential mortgages (14.2 percent) and to a lesser extent by commercial loans (4.3 percent) and commercial real estate loans (1.3 percent). The increase in retail loans partially offset by a decline in commercial loans due to soft commercialwas across most loan demand. Thecategories while the increase in residential mortgages reflectswas primarily the result of asset/liability management decisions to retain a greater portion of the Company’s decision to retain adjustable-rate mortgage production in connection with asset/liability management activities and strong growth in first lien home equity loans within the branch network and consumer finance.loan production. Table 6 provides a summary of the loan distribution by product type. Table 8 provides a summary of selected loan maturity distribution by loan category. Average total loans increased $3.9$3.8 billion (3.4(3.2 percent) in 2003,2004, compared with 2002. The increase2003. Growth in total average loans in 2003, compared with 2002, was driven by similar factors discussed above including the growth of residential mortgages, retail loans and commercial real estate loans,residential mortgages, compared to 2003, was partially offset by thea decline in average commercial loans.
| Table 6 | Loan Portfolio Distribution |
| 2004 | 2003 | 2002 | 2001 | 2000 | |||||||||||||||||||||||||||||||||||||||
| Percent | Percent | Percent | Percent | Percent | |||||||||||||||||||||||||||||||||||||||
| At December 31 (Dollars in Millions) | Amount | of Total | Amount | of Total | Amount | of Total | Amount | of Total | Amount | of Total | |||||||||||||||||||||||||||||||||
Commercial | |||||||||||||||||||||||||||||||||||||||||||
| Commercial | $ | 35,210 | 27.9 | % | $ | 33,536 | 28.4 | % | $ | 36,584 | 31.5 | % | $ | 40,472 | 35.4 | % | $ | 47,041 | 38.5 | % | |||||||||||||||||||||||
| Lease financing | 4,963 | 3.9 | 4,990 | 4.2 | 5,360 | 4.6 | 5,858 | 5.1 | 5,776 | 4.7 | |||||||||||||||||||||||||||||||||
| Total commercial | 40,173 | 31.8 | 38,526 | 32.6 | 41,944 | 36.1 | 46,330 | 40.5 | 52,817 | 43.2 | |||||||||||||||||||||||||||||||||
Commercial real estate | |||||||||||||||||||||||||||||||||||||||||||
| Commercial mortgages | 20,315 | 16.1 | 20,624 | 17.4 | 20,325 | 17.5 | 18,765 | 16.4 | 19,466 | 15.9 | |||||||||||||||||||||||||||||||||
| Construction and development | 7,270 | 5.7 | 6,618 | 5.6 | 6,542 | 5.6 | 6,608 | 5.8 | 6,977 | 5.7 | |||||||||||||||||||||||||||||||||
| Total commercial real estate | 27,585 | 21.8 | 27,242 | 23.0 | 26,867 | 23.1 | 25,373 | 22.2 | 26,443 | 21.6 | |||||||||||||||||||||||||||||||||
Residential mortgages | |||||||||||||||||||||||||||||||||||||||||||
| Residential mortgages | 9,722 | 7.7 | 7,332 | 6.2 | 6,446 | 5.6 | 5,746 | 5.0 | * | * | |||||||||||||||||||||||||||||||||
| Home equity loans, first liens | 5,645 | 4.5 | 6,125 | 5.2 | 3,300 | 2.8 | 2,083 | 1.8 | * | * | |||||||||||||||||||||||||||||||||
| Total residential mortgages | 15,367 | 12.2 | 13,457 | 11.4 | 9,746 | 8.4 | 7,829 | 6.8 | 9,397 | 7.7 | |||||||||||||||||||||||||||||||||
Retail | |||||||||||||||||||||||||||||||||||||||||||
| Credit card | 6,603 | 5.2 | 5,933 | 5.0 | 5,665 | 4.9 | 5,889 | 5.1 | 6,012 | 4.9 | |||||||||||||||||||||||||||||||||
| Retail leasing | 7,166 | 5.7 | 6,029 | 5.1 | 5,680 | 4.9 | 4,906 | 4.3 | 4,153 | 3.4 | |||||||||||||||||||||||||||||||||
| Home equity and second mortgages | 14,851 | 11.8 | 13,210 | 11.2 | 13,572 | 11.6 | 12,235 | 10.7 | 11,956 | 9.7 | |||||||||||||||||||||||||||||||||
| Other retail | |||||||||||||||||||||||||||||||||||||||||||
| Revolving credit | 2,541 | 2.0 | 2,540 | 2.1 | 2,650 | 2.3 | 2,673 | 2.3 | 2,750 | 2.2 | |||||||||||||||||||||||||||||||||
| Installment | 2,767 | 2.2 | 2,380 | 2.0 | 2,258 | 1.9 | 2,292 | 2.0 | 2,186 | 1.8 | |||||||||||||||||||||||||||||||||
| Automobile | 7,419 | 5.9 | 7,165 | 6.1 | 6,343 | 5.5 | 5,660 | 5.0 | 5,609 | 4.6 | |||||||||||||||||||||||||||||||||
| Student | 1,843 | 1.4 | 1,753 | 1.5 | 1,526 | 1.3 | 1,218 | 1.1 | 1,042 | .9 | |||||||||||||||||||||||||||||||||
| Total other retail | 14,570 | 11.5 | 13,838 | 11.7 | 12,777 | 11.0 | 11,843 | 10.4 | 11,587 | 9.5 | |||||||||||||||||||||||||||||||||
| Total retail | 43,190 | 34.2 | 39,010 | 33.0 | 37,694 | 32.4 | 34,873 | 30.5 | 33,708 | 27.5 | |||||||||||||||||||||||||||||||||
| Total loans | $ | 126,315 | 100.0 | % | $ | 118,235 | 100.0 | % | $ | 116,251 | 100.0 | % | $ | 114,405 | 100.0 | % | $ | 122,365 | 100.0 | % | |||||||||||||||||||||||
| * | Information not available |
CommercialCommercial loans, including lease financing, totaled $40.2 billion at December 31, 2004, compared with $38.5 billion at December 31, 2003, compared with $41.9an increase of
| Table 7 | Commercial Loans by Industry Group and Geography |
| December 31, 2003 | December 31, 2002 | December 31, 2004 | December 31, 2003 | |||||||||||||||||||||||||||||||
| Industry Group (Dollars in Millions) | Industry Group (Dollars in Millions) | Loans | Percent | Loans | Percent | Industry Group (Dollars in Millions) | Loans | Percent | Loans | Percent | ||||||||||||||||||||||||
| Consumer products and services | Consumer products and services | $ | 6,858 | 17.8 | % | $ | 7,206 | 17.2 | % | Consumer products and services | $ | 8,073 | 20.1 | % | $ | 6,858 | 17.8 | % | ||||||||||||||||
| Capital goods | 4,598 | 11.9 | 5,486 | 13.1 | ||||||||||||||||||||||||||||||
| Financial services | Financial services | 4,469 | 11.6 | 5,769 | 13.7 | Financial services | 4,784 | 11.9 | 4,469 | 11.6 | ||||||||||||||||||||||||
| Commercial services and supplies | Commercial services and supplies | 3,785 | 9.8 | 3,853 | 9.2 | Commercial services and supplies | 3,870 | 9.6 | 3,785 | 9.8 | ||||||||||||||||||||||||
| Capital goods | Capital goods | 3,825 | 9.5 | 4,598 | 11.9 | |||||||||||||||||||||||||||||
| Agriculture | Agriculture | 2,907 | 7.6 | 3,153 | 7.5 | Agriculture | 2,601 | 6.5 | 2,907 | 7.6 | ||||||||||||||||||||||||
| Property management and development | Property management and development | 2,334 | 5.8 | 1,653 | 4.3 | |||||||||||||||||||||||||||||
| Paper and forestry products, mining and basic materials | Paper and forestry products, mining and basic materials | 1,905 | 4.7 | 1,415 | 3.7 | |||||||||||||||||||||||||||||
| Consumer staples | Consumer staples | 1,817 | 4.7 | 1,924 | 4.6 | Consumer staples | 1,887 | 4.7 | 1,817 | 4.7 | ||||||||||||||||||||||||
| Health care | Health care | 1,826 | 4.6 | 1,532 | 4.0 | |||||||||||||||||||||||||||||
| Private investors | Private investors | 1,630 | 4.1 | 1,629 | 4.2 | |||||||||||||||||||||||||||||
| Transportation | Transportation | 1,758 | 4.6 | 2,231 | 5.3 | Transportation | 1,592 | 4.0 | 1,758 | 4.6 | ||||||||||||||||||||||||
| Property management and development | 1,653 | 4.3 | 1,266 | 3.0 | ||||||||||||||||||||||||||||||
| Private investors | 1,629 | 4.2 | 1,759 | 4.2 | ||||||||||||||||||||||||||||||
| Health care | 1,532 | 4.0 | 1,475 | 3.5 | ||||||||||||||||||||||||||||||
| Paper and forestry products, mining and basic materials | 1,415 | 3.7 | 1,664 | 4.0 | ||||||||||||||||||||||||||||||
| Energy | Energy | 730 | 1.8 | 708 | 1.8 | |||||||||||||||||||||||||||||
| Information technology | Information technology | 729 | 1.9 | 797 | 1.9 | Information technology | 644 | 1.6 | 729 | 1.9 | ||||||||||||||||||||||||
| Energy | 708 | 1.8 | 575 | 1.4 | ||||||||||||||||||||||||||||||
| Other | Other | 4,668 | 12.1 | 4,786 | 11.4 | Other | 4,472 | 11.1 | 4,668 | 12.1 | ||||||||||||||||||||||||
| Total | $ | 38,526 | 100.0 | % | $ | 41,944 | 100.0 | % | Total | $ | 40,173 | 100.0 | % | $ | 38,526 | 100.0 | % | |||||||||||||||||
Geography | Geography | Geography | ||||||||||||||||||||||||||||||||
| California | California | $ | 4,091 | 10.6 | % | $ | 4,127 | 9.8 | % | California | $ | 3,786 | 9.4 | % | $ | 4,091 | 10.6 | % | ||||||||||||||||
| Colorado | Colorado | 1,820 | 4.7 | 1,796 | 4.3 | Colorado | 2,064 | 5.1 | 1,820 | 4.7 | ||||||||||||||||||||||||
| Illinois | Illinois | 2,121 | 5.5 | 2,214 | 5.3 | Illinois | 2,549 | 6.3 | 2,121 | 5.5 | ||||||||||||||||||||||||
| Minnesota | Minnesota | 6,527 | 16.9 | 6,605 | 15.7 | Minnesota | 6,649 | 16.6 | 6,527 | 16.9 | ||||||||||||||||||||||||
| Missouri | Missouri | 2,742 | 7.1 | 2,895 | 6.9 | Missouri | 2,525 | 6.3 | 2,742 | 7.1 | ||||||||||||||||||||||||
| Ohio | Ohio | 2,361 | 6.1 | 2,455 | 5.9 | Ohio | 2,528 | 6.3 | 2,361 | 6.1 | ||||||||||||||||||||||||
| Oregon | Oregon | 1,500 | 3.9 | 1,604 | 3.8 | Oregon | 1,441 | 3.6 | 1,500 | 3.9 | ||||||||||||||||||||||||
| Washington | Washington | 2,767 | 7.2 | 3,129 | 7.5 | Washington | 2,695 | 6.7 | 2,767 | 7.2 | ||||||||||||||||||||||||
| Wisconsin | Wisconsin | 2,874 | 7.5 | 3,052 | 7.3 | Wisconsin | 2,604 | 6.5 | 2,874 | 7.5 | ||||||||||||||||||||||||
| Iowa, Kansas, Nebraska, North Dakota, South Dakota | Iowa, Kansas, Nebraska, North Dakota, South Dakota | 3,760 | 9.8 | 4,421 | 10.5 | Iowa, Kansas, Nebraska, North Dakota, South Dakota | 3,455 | 8.6 | 3,760 | 9.8 | ||||||||||||||||||||||||
| Arkansas, Indiana, Kentucky, Tennessee | Arkansas, Indiana, Kentucky, Tennessee | 1,549 | 4.0 | 1,865 | 4.4 | Arkansas, Indiana, Kentucky, Tennessee | 1,747 | 4.3 | 1,549 | 4.0 | ||||||||||||||||||||||||
| Idaho, Montana, Wyoming | Idaho, Montana, Wyoming | 744 | 1.9 | 996 | 2.4 | Idaho, Montana, Wyoming | 830 | 2.1 | 744 | 1.9 | ||||||||||||||||||||||||
| Arizona, Nevada, Utah | Arizona, Nevada, Utah | 829 | 2.2 | 986 | 2.4 | Arizona, Nevada, Utah | 926 | 2.3 | 829 | 2.2 | ||||||||||||||||||||||||
| Total banking region | 33,685 | 87.4 | 36,145 | 86.2 | Total banking region | 33,799 | 84.1 | 33,685 | 87.4 | |||||||||||||||||||||||||
| Outside the Company’s banking region | Outside the Company’s banking region | 4,841 | 12.6 | 5,799 | 13.8 | Outside the Company’s banking region | 6,374 | 15.9 | 4,841 | 12.6 | ||||||||||||||||||||||||
| Total | $ | 38,526 | 100.0 | % | $ | 41,944 | 100.0 | % | Total | $ | 40,173 | 100.0 | % | $ | 38,526 | 100.0 | % | |||||||||||||||||
| Table 8 | Selected Loan Maturity Distribution |
| Over One | |||||||||||||||||
| One Year | Through | Over Five | |||||||||||||||
| December 31, 2004 (Dollars in Millions) | or Less | Five Years | Years | Total | |||||||||||||
| Commercial | $ | 19,283 | $ | 18,141 | $ | 2,749 | $ | 40,173 | |||||||||
| Commercial real estate | 7,378 | 14,280 | 5,927 | 27,585 | |||||||||||||
| Residential mortgages | 974 | 2,698 | 11,695 | 15,367 | |||||||||||||
| Retail | 13,312 | 19,619 | 10,259 | 43,190 | |||||||||||||
| Total loans | $ | 40,947 | $ | 54,738 | $ | 30,630 | $ | 126,315 | |||||||||
| Total of loans due after one year with | |||||||||||||||||
| Predetermined interest rates | $ | 40,042 | |||||||||||||||
| Floating interest rates | $ | 45,326 | |||||||||||||||
Commercial Real EstateThe Company’s portfolio of commercial real estate loans, which includes commercial mortgages and construction loans, was $27.6 billion at December 31, 2004, compared with $27.2 billion at December 31, 2003, compared with $26.9 billion at December 31, 2002, a slightmodest increase of $375$343 million (1.4(1.3 percent). Specifically, commercial mortgages outstanding and real estate construction and development loans increased modestly by $299$652 million (1.5(9.9 percent) and $76 million (1.2 percent), respectively, as business owners and real estate investorsdevelopers continued to take advantage of the currentrelatively low interest rate environment.rates. Commercial mortgages outstanding decreased modestly by $309 million (1.5 percent) as growth in Small Business Administration (“SBA”) real estate mortgages was more than offset by reductions in traditional commercial real estate mortgages. Average commercial real estate loans increased by $1.4 billion (5.5$125 million (.5 percent) in 2003,2004, compared with 2002,2003, primarily driven by increasedgrowth in SBA commercial real estate mortgage activity.loans. Table 9 provides a summary of commercial real estate by property type and geographical locations.
Residential MortgagesResidential mortgages held in the loan portfolio were $13.5$15.4 billion at December 31, 2003,2004, an increase of $3.7$1.9 billion (38.1(14.2 percent) from December 31, 2002.
| Table 9 | Commercial Real Estate by Property Type and Geography |
| December 31, 2004 | December 31, 2003 | ||||||||||||||||
| Property Type (Dollars in Millions) | Loans | Percent | Loans | Percent | |||||||||||||
| Business owner occupied | $ | 8,551 | 31.0 | % | $ | 8,037 | 29.5 | % | |||||||||
| Multi-family | 3,903 | 14.1 | 3,868 | 14.2 | |||||||||||||
| Commercial property | |||||||||||||||||
| Industrial | 1,103 | 4.0 | 1,280 | 4.7 | |||||||||||||
| Office | 2,676 | 9.7 | 3,078 | 11.3 | |||||||||||||
| Retail | 3,586 | 13.0 | 3,487 | 12.8 | |||||||||||||
| Other | 2,359 | 8.6 | 2,452 | 9.0 | |||||||||||||
| Homebuilders | 2,952 | 10.7 | 2,098 | 7.7 | |||||||||||||
| Hotel/motel | 1,848 | 6.7 | 2,234 | 8.2 | |||||||||||||
| Health care facilities | 607 | 2.2 | 708 | 2.6 | |||||||||||||
| Total | $ | 27,585 | 100.0 | % | $ | 27,242 | 100.0 | % | |||||||||
Geography | |||||||||||||||||
| California | $ | 5,252 | 19.0 | % | $ | 4,380 | 16.1 | % | |||||||||
| Colorado | 1,181 | 4.3 | 1,139 | 4.2 | |||||||||||||
| Illinois | 996 | 3.6 | 1,095 | 4.0 | |||||||||||||
| Minnesota | 1,721 | 6.2 | 1,536 | 5.6 | |||||||||||||
| Missouri | 1,525 | 5.5 | 1,741 | 6.4 | |||||||||||||
| Ohio | 1,975 | 7.2 | 2,193 | 8.0 | |||||||||||||
| Oregon | 1,730 | 6.3 | 1,771 | 6.5 | |||||||||||||
| Washington | 2,855 | 10.3 | 2,956 | 10.9 | |||||||||||||
| Wisconsin | 1,768 | 6.4 | 1,921 | 7.1 | |||||||||||||
| Iowa, Kansas, Nebraska, North Dakota, South Dakota | 2,003 | 7.3 | 2,138 | 7.8 | |||||||||||||
| Arkansas, Indiana, Kentucky, Tennessee | 1,710 | 6.2 | 1,817 | 6.7 | |||||||||||||
| Idaho, Montana, Wyoming | 880 | 3.2 | 874 | 3.2 | |||||||||||||
| Arizona, Nevada, Utah | 1,948 | 7.1 | 1,722 | 6.3 | |||||||||||||
| Total banking region | 25,544 | 92.6 | 25,283 | 92.8 | |||||||||||||
| Outside the Company’s banking region | 2,041 | 7.4 | 1,959 | 7.2 | |||||||||||||
| Total | $ | 27,585 | 100.0 | % | $ | 27,242 | 100.0 | % | |||||||||
RetailTotal retail loans outstanding, which include credit card, retail leasing, home equity and second mortgages and other retail loans, were $43.2 billion at December 31, 2004, compared with $39.0 billion at December 31, 2003, compared with $37.7 billion at December 31, 2002.2003. The increase of $1.3$4.2 billion (3.5(10.7 percent) was driven by an increase in home equity lines of credit, credit cards, retail leasing, automobile loans retail leasing, credit card lending and studentinstallment loans, which increased $822$2,275 million, $349$670 million, $268$1,137 million, $254 million and $227$387 million, respectively, during 2003. This growth was partially2004. The increases in these loan categories were offset somewhat by declinesa reduction in home equity and second mortgage loans as consumers refinanced with first lien home equity products classified as residential mortgages.of $634 million during the year. Average retail loans increased $1.7$3.0 billion (4.6(7.9 percent) to $38.2$41.2 billion in 2003,2004, reflecting growth in home equity lines, retail leasing, installment loans and home equity lines. Growth in these retail products was offset somewhat by a 1.9 percent decline in average credit card balances primarily due to portfolio sales in late 2002 and lower
| Over One | |||||||||||||||||
| One Year | Through | Over Five | |||||||||||||||
| December 31, 2003 (Dollars in Millions) | or Less | Five Years | Years | Total | |||||||||||||
| Commercial | $ | 19,028 | $ | 17,008 | $ | 2,490 | $ | 38,526 | |||||||||
| Commercial real estate | 7,162 | 13,699 | 6,381 | 27,242 | |||||||||||||
| Residential mortgages | 914 | 2,382 | 10,161 | 13,457 | |||||||||||||
| Retail | 11,977 | 17,373 | 9,660 | 39,010 | |||||||||||||
| Total loans | $ | 39,081 | $ | 50,462 | $ | 28,692 | $ | 118,235 | |||||||||
| Total of loans due after one year with | |||||||||||||||||
| Predetermined interest rates | $ | 40,339 | |||||||||||||||
| Floating interest rates | $ | 38,815 | |||||||||||||||
Loans Held for SaleAt December 31, 2003,2004, loans held for sale, consisting of residential mortgages to be sold in the secondary markets,market, were $1.4 billion. The $2.7 billion (65.5 percent) decrease fromThis asset category was essentially unchanged relative to loans held for sale at December 31, 2002,2003, despite strong$4.4 billion of mortgage banking activities in early 2003, was the result of a 56.3 percent decline in mortgageloan production volumes during the fourth quarter of 2004, compared with $3.9 billion in fourth quarter 2003. Average loans held for sale declined to $1.6 billion in 2004, compared with $3.6 billion in 2003, relativedue to the same periodimpact of 2002.rising interest rates on mortgage loan production.
Investment SecuritiesThe Company uses its investment securities portfolio for several purposes. It serves as a vehicle to manage interest rate and prepayment risk, generates interest and dividend income from the investment of excess funds depending on loan demand, provides liquidity and is used as collateral for public deposits and wholesale funding sources. While it is the Company’s intent to hold its investment securities indefinitely, the Company may take actions in response to structural changes in interest rate risks and to meet liquidity requirements.
| December 31, 2003 | December 31, 2002 | ||||||||||||||||
| Property Type(Dollars in Millions) | Loans | Percent | Loans | Percent | |||||||||||||
| Business owner occupied | $ | 8,037 | 29.5 | % | $ | 6,513 | 24.2 | % | |||||||||
| Multi-family | 3,868 | 14.2 | 3,258 | 12.1 | |||||||||||||
| Commercial property | |||||||||||||||||
| Industrial | 1,280 | 4.7 | 1,227 | 4.6 | |||||||||||||
| Office | 3,078 | 11.3 | 3,564 | 13.3 | |||||||||||||
| Retail | 3,487 | 12.8 | 3,832 | 14.3 | |||||||||||||
| Other | 2,452 | 9.0 | 1,447 | 5.4 | |||||||||||||
| Homebuilders | 2,098 | 7.7 | 2,142 | 8.0 | |||||||||||||
| Hotel/motel | 2,234 | 8.2 | 2,585 | 9.6 | |||||||||||||
| Health care facilities | 708 | 2.6 | 1,290 | 4.8 | |||||||||||||
| Other (a) | — | — | 1,009 | 3.7 | |||||||||||||
| Total | $ | 27,242 | 100.0 | % | $ | 26,867 | 100.0 | % | |||||||||
Geography | |||||||||||||||||
| California | $ | 4,380 | 16.1 | % | $ | 4,277 | 15.9 | % | |||||||||
| Colorado | 1,139 | 4.2 | 1,190 | 4.4 | |||||||||||||
| Illinois | 1,095 | 4.0 | 1,140 | 4.2 | |||||||||||||
| Minnesota | 1,536 | 5.6 | 1,508 | 5.6 | |||||||||||||
| Missouri | 1,741 | 6.4 | 2,297 | 8.6 | |||||||||||||
| Ohio | 2,193 | 8.0 | 2,264 | 8.4 | |||||||||||||
| Oregon | 1,771 | 6.5 | 1,614 | 6.0 | |||||||||||||
| Washington | 2,956 | 10.9 | 3,242 | 12.1 | |||||||||||||
| Wisconsin | 1,921 | 7.1 | 2,040 | 7.6 | |||||||||||||
| Iowa, Kansas, Nebraska, North Dakota, South Dakota | 2,138 | 7.8 | 1,895 | 7.1 | |||||||||||||
| Arkansas, Indiana, Kentucky, Tennessee | 1,817 | 6.7 | 1,679 | 6.2 | |||||||||||||
| Idaho, Montana, Wyoming | 874 | 3.2 | 682 | 2.5 | |||||||||||||
| Arizona, Nevada, Utah | 1,722 | 6.3 | 1,439 | 5.4 | |||||||||||||
| Total banking region | 25,283 | 92.8 | 25,267 | 94.0 | |||||||||||||
| Outside the Company’s banking region | 1,959 | 7.2 | 1,600 | 6.0 | |||||||||||||
| Total | $ | 27,242 | 100.0 | % | $ | 26,867 | 100.0 | % | |||||||||
DepositsTotal deposits were $119.1$120.7 billion at December 31, 2004, an increase of $1.7 billion (1.4 percent) from December 31, 2003. The increase in total deposits was primarily the result of an increase in time deposits greater than $100,000, partially offset by decreases in noninterest-bearing deposits, savings deposits and time certificates of deposit less than $100,000. Average total deposits were $116.2 billion in 2004, declining $331 million from $116.6 billion in 2003. The decline in average total deposits was primarily due to lower average noninterest-bearing deposits and time certificates of deposit less than $100,000. The reductions in these categories were offset somewhat by growth in average savings deposits and time deposits greater than $100,000.
| Table 10 | Investment Securities |
| Available-for-Sale | Held-to-Maturity | Available-for-Sale | Held-to-Maturity | |||||||||||||||||||||||||||||||||||||||||||||||||||||||||||||||||
| Weighted | Weighted | Weighted- | Weighted- | |||||||||||||||||||||||||||||||||||||||||||||||||||||||||||||||||
| Average | Weighted | Average | Weighted | Average | Weighted- | Average | Weighted- | |||||||||||||||||||||||||||||||||||||||||||||||||||||||||||||
| Amortized | Fair | Maturity in | Average | Amortized | Fair | Maturity in | Average | Amortized | Fair | Maturity in | Average | Amortized | Fair | Maturity in | Average | |||||||||||||||||||||||||||||||||||||||||||||||||||||
| December 31, 2003 (Dollars in Millions) | Cost | Value | Years | Yield | Cost | Value | Years | Yield | ||||||||||||||||||||||||||||||||||||||||||||||||||||||||||||
| December 31, 2004 (Dollars in Millions) | December 31, 2004 (Dollars in Millions) | Cost | Value | Years | Yield (d) | Cost | Value | Years | Yield (d) | |||||||||||||||||||||||||||||||||||||||||||||||||||||||||||
U.S. Treasury and agencies | U.S. Treasury and agencies | U.S. Treasury and agencies | ||||||||||||||||||||||||||||||||||||||||||||||||||||||||||||||||||
| Maturing in one year or less | $ | 57 | $ | 57 | .57 | 2.88 | % | $ | — | $ | — | — | — | % | Maturing in one year or less (a) | $ | 601 | $ | 593 | .19 | 3.24 | % | $ | — | $ | — | — | — | % | |||||||||||||||||||||||||||||||||||||||
| Maturing after one year through five years | 190 | 199 | 2.66 | 4.33 | — | — | — | — | Maturing after one year through five years | 56 | 58 | 3.09 | 4.98 | — | — | — | — | |||||||||||||||||||||||||||||||||||||||||||||||||||
| Maturing after five years through ten years | 237 | 225 | 9.08 | 3.93 | — | — | — | — | Maturing after five years through ten years | 27 | 28 | 7.52 | 4.47 | — | — | — | — | |||||||||||||||||||||||||||||||||||||||||||||||||||
| Maturing after ten years | 1,150 | 1,094 | 19.50 | 2.38 | — | — | — | — | Maturing after ten years (a) | — | — | — | — | — | — | — | — | |||||||||||||||||||||||||||||||||||||||||||||||||||
| Total | $ | 1,634 | $ | 1,575 | 15.37 | 2.85 | % | $ | — | $ | — | — | — | % | Total | $ | 684 | $ | 679 | .72 | 3.43 | % | $ | — | $ | — | — | — | % | |||||||||||||||||||||||||||||||||||||||
Mortgage-backed securities | Mortgage-backed securities | Mortgage-backed securities | ||||||||||||||||||||||||||||||||||||||||||||||||||||||||||||||||||
| Maturing in one year or less | $ | 2,355 | $ | 2,358 | .63 | 3.15 | % | $ | — | $ | — | — | — | % | Maturing in one year or less | $ | 1,716 | $ | 1,721 | .57 | 4.01 | % | $ | — | $ | — | — | — | % | |||||||||||||||||||||||||||||||||||||||
| Maturing after one year through five years | 22,516 | 22,542 | 3.66 | 4.30 | 14 | 14 | 3.08 | 5.38 | Maturing after one year through five years | 24,849 | 24,724 | 3.25 | 4.34 | 11 | 11 | 3.07 | 5.30 | |||||||||||||||||||||||||||||||||||||||||||||||||||
| Maturing after five years through ten years | 15,016 | 14,785 | 6.50 | 4.50 | — | — | — | — | Maturing after five years through ten years | 12,742 | 12,588 | 6.51 | 4.70 | — | — | — | — | |||||||||||||||||||||||||||||||||||||||||||||||||||
| Maturing after ten years | 342 | 340 | 13.26 | 2.66 | — | — | — | — | Maturing after ten years | 502 | 504 | 14.06 | 3.85 | — | — | — | — | |||||||||||||||||||||||||||||||||||||||||||||||||||
| Total | $ | 40,229 | $ | 40,025 | 4.62 | 4.30 | % | $ | 14 | $ | 14 | 3.08 | 5.38 | % | Total | $ | 39,809 | $ | 39,537 | 4.31 | 4.43 | % | $ | 11 | $ | 11 | 3.07 | 5.30 | % | |||||||||||||||||||||||||||||||||||||||
Asset-backed securities | Asset-backed securities | Asset-backed securities | ||||||||||||||||||||||||||||||||||||||||||||||||||||||||||||||||||
| Maturing in one year or less | $ | 100 | $ | 101 | .70 | 4.74 | % | $ | — | $ | — | — | — | % | Maturing in one year or less | $ | 39 | $ | 39 | .65 | 5.61 | % | $ | — | $ | — | — | — | % | |||||||||||||||||||||||||||||||||||||||
| Maturing after one year through five years | 130 | 130 | 2.54 | 5.89 | — | — | — | — | Maturing after one year through five years | 25 | 25 | 2.36 | 5.26 | — | — | — | — | |||||||||||||||||||||||||||||||||||||||||||||||||||
| Maturing after five years through ten years | 20 | 21 | 5.08 | 5.55 | — | — | — | — | Maturing after five years through ten years | — | — | — | — | — | — | — | — | |||||||||||||||||||||||||||||||||||||||||||||||||||
| Maturing after ten years | — | — | — | — | — | — | — | — | Maturing after ten years | — | — | — | — | — | — | — | — | |||||||||||||||||||||||||||||||||||||||||||||||||||
| Total | $ | 250 | $ | 252 | 2.00 | 5.40 | % | $ | — | $ | — | — | — | % | Total | $ | 64 | $ | 64 | 1.31 | 5.47 | % | $ | — | $ | — | — | — | % | |||||||||||||||||||||||||||||||||||||||
Obligations of states and political subdivisions | ||||||||||||||||||||||||||||||||||||||||||||||||||||||||||||||||||||
Obligations of state and political subdivisions | Obligations of state and political subdivisions | |||||||||||||||||||||||||||||||||||||||||||||||||||||||||||||||||||
| Maturing in one year or less | $ | 70 | $ | 71 | .40 | 7.32 | % | $ | 33 | $ | 33 | .35 | 3.93 | % | Maturing in one year or less | $ | 101 | $ | 102 | .39 | 7.38 | % | $ | 10 | $ | 10 | .25 | 6.44 | % | |||||||||||||||||||||||||||||||||||||||
| Maturing after one year through five years | 171 | 178 | 2.71 | 7.34 | 39 | 42 | 2.93 | 6.54 | Maturing after one year through five years | 97 | 101 | 2.49 | 7.24 | 35 | 37 | 2.66 | 6.55 | |||||||||||||||||||||||||||||||||||||||||||||||||||
| Maturing after five years through ten years | 79 | 84 | 6.88 | 7.43 | 26 | 28 | 6.84 | 6.92 | Maturing after five years through ten years | 6 | 7 | 6.38 | 7.82 | 19 | 20 | 6.90 | 6.57 | |||||||||||||||||||||||||||||||||||||||||||||||||||
| Maturing after ten years | 15 | 15 | 14.60 | 8.32 | 40 | 44 | 14.66 | 6.97 | Maturing after ten years | 1 | 1 | 16.77 | 5.33 | 34 | 36 | 13.66 | 6.68 | |||||||||||||||||||||||||||||||||||||||||||||||||||
| Total | $ | 335 | $ | 348 | 3.74 | 7.40 | % | $ | 138 | $ | 147 | 6.47 | 6.12 | % | Total | $ | 205 | $ | 211 | 1.65 | 7.32 | % | $ | 98 | $ | 103 | 7.09 | 6.59 | % | |||||||||||||||||||||||||||||||||||||||
Other debt securities | Other debt securities | Other debt securities | ||||||||||||||||||||||||||||||||||||||||||||||||||||||||||||||||||
| Maturing in one year or less | $ | 3 | $ | 3 | .42 | 3.35 | % | $ | — | $ | — | — | — | % | Maturing in one year or less | $ | 8 | $ | 8 | 1.11 | 3.10 | % | $ | — | $ | — | — | — | % | |||||||||||||||||||||||||||||||||||||||
| Maturing after one year through five years | 128 | 128 | 2.51 | 10.42 | — | — | — | — | Maturing after one year through five years | 86 | 86 | 2.35 | 11.00 | 18 | 18 | 3.23 | 5.20 | |||||||||||||||||||||||||||||||||||||||||||||||||||
| Maturing after five years through ten years | 8 | 8 | 6.09 | 3.21 | — | — | — | — | Maturing after five years through ten years | — | — | — | — | — | — | — | — | |||||||||||||||||||||||||||||||||||||||||||||||||||
| Maturing after ten years | 260 | 246 | 23.45 | 1.84 | — | — | — | — | Maturing after ten years | 499 | 490 | 22.35 | 2.98 | — | — | — | — | |||||||||||||||||||||||||||||||||||||||||||||||||||
| Total | $ | 399 | $ | 385 | 16.21 | 4.64 | % | $ | — | $ | — | — | — | % | Total | $ | 593 | $ | 584 | 19.16 | 4.15 | % | $ | 18 | $ | 18 | 3.23 | 5.20 | % | |||||||||||||||||||||||||||||||||||||||
Other investments | Other investments | $ | 594 | $ | 597 | — | — | % | $ | — | $ | — | — | — | % | Other investments | $ | 270 | $ | 279 | — | — | % | $ | — | $ | — | — | — | % | ||||||||||||||||||||||||||||||||||||||
| Total investment securities | Total investment securities | $ | 43,441 | $ | 43,182 | 5.12 | 4.27 | % | $ | 152 | $ | 161 | 6.16 | 6.05 | % | Total investment securities | $ | 41,625 | $ | 41,354 | 4.45 | 4.43 | % | $ | 127 | $ | 132 | 6.19 | 6.28 | % | ||||||||||||||||||||||||||||||||||||||
| In January 2005, approximately $450 million of floating-rate agency notes with an original maturity of June 2023 were called by the issuer. These notes are classified in the table as maturing in one year or less. | |
| (b) | Information related to asset and mortgage-backed securities included above is presented based upon |
| (c) | The weighted-average maturity of the available-for-sale investment securities was 5.12 years at December 31, 2003 with a corresponding weighted-average yield of 4.27%. The weighted- average maturity of the held-to-maturity investment securities was 6.16 years at December 31, 2003 with a corresponding weighted-average yield of 6.05%. |
| (d) | Average yields are presented on a fully-taxable equivalent basis. Yields on available-for-sale and held-to-maturity securities are computed based on historical cost balances. Average yield and maturity calculations exclude equity securities that have no stated yield or maturity. |
| 2003 | 2002 | 2004 | 2003 | |||||||||||||||||||||||||||||||
| Amortized | Percent | Amortized | Percent | Amortized | Percent | Amortized | Percent | |||||||||||||||||||||||||||
| At December 31 (Dollars in Millions) | At December 31 (Dollars in Millions) | Cost | of Total | Cost | of Total | At December 31 (Dollars in Millions) | Cost | of Total | Cost | of Total | ||||||||||||||||||||||||
| U.S. Treasury and agencies | U.S. Treasury and agencies | $ | 1,634 | 3.7 | % | $ | 421 | 1.5 | % | U.S. Treasury and agencies | $ | 684 | 1.6 | % | $ | 1,634 | 3.7 | % | ||||||||||||||||
| Mortgage-backed securities | Mortgage-backed securities | 40,243 | 92.3 | 24,987 | 90.0 | Mortgage-backed securities | 39,820 | 95.4 | 40,243 | 92.3 | ||||||||||||||||||||||||
| Asset-backed securities | Asset-backed securities | 250 | .6 | 646 | 2.3 | Asset-backed securities | 64 | .2 | 250 | .6 | ||||||||||||||||||||||||
| Obligations of states and political subdivisions | 473 | 1.1 | 771 | 2.8 | ||||||||||||||||||||||||||||||
| Obligations of state and political subdivisions | Obligations of state and political subdivisions | 303 | .7 | 473 | 1.1 | |||||||||||||||||||||||||||||
| Other securities and investments | Other securities and investments | 993 | 2.3 | 949 | 3.4 | Other securities and investments | 881 | 2.1 | 993 | 2.3 | ||||||||||||||||||||||||
| Total investment securities | $ | 43,593 | 100.0 | % | $ | 27,774 | 100.0 | % | Total investment securities | $ | 41,752 | 100.0 | % | $ | 43,593 | 100.0 | % | |||||||||||||||||
The composition of deposits was as follows:
| 2003 | 2002 | 2001 | 2000 | 1999 | ||||||||||||||||||||||||||||||||||||||
| Percent | Percent | Percent | Percent | Percent | ||||||||||||||||||||||||||||||||||||||
| December 31 (Dollars in Millions) | Amount | of Total | Amount | of Total | Amount | of Total | Amount | of Total | Amount | of Total | ||||||||||||||||||||||||||||||||
| Noninterest-bearing deposits | $ | 32,470 | 27.3 | % | $ | 35,106 | 30.4 | % | $ | 31,212 | 29.7 | % | $ | 26,633 | 24.3 | % | $ | 26,350 | 25.5 | % | ||||||||||||||||||||||
| Interest-bearing deposits | ||||||||||||||||||||||||||||||||||||||||||
| Interest checking | 21,404 | 18.0 | 17,467 | 15.1 | 15,251 | 14.5 | 13,982 | 12.8 | 13,141 | 12.7 | ||||||||||||||||||||||||||||||||
| Money market accounts | 34,025 | 28.6 | 27,753 | 24.0 | 24,835 | 23.6 | 23,899 | 21.8 | 22,751 | 22.0 | ||||||||||||||||||||||||||||||||
| Savings accounts | 5,630 | 4.7 | 5,021 | 4.4 | 4,637 | 4.4 | 4,516 | 4.1 | 5,445 | 5.3 | ||||||||||||||||||||||||||||||||
| Total of savings deposits | 61,059 | 51.3 | 50,241 | 43.5 | 44,723 | 42.5 | 42,397 | 38.7 | 41,337 | 40.0 | ||||||||||||||||||||||||||||||||
| Time certificates of deposit less than $100,000 | 13,690 | 11.5 | 17,973 | 15.5 | 20,724 | 19.7 | 25,780 | 23.5 | 25,394 | 24.5 | ||||||||||||||||||||||||||||||||
| Time deposits greater than $100,000 | ||||||||||||||||||||||||||||||||||||||||||
| Domestic | 5,902 | 4.9 | 9,427 | 8.2 | 7,286 | 6.9 | 11,221 | 10.3 | 9,348 | 9.0 | ||||||||||||||||||||||||||||||||
| Foreign | 5,931 | 5.0 | 2,787 | 2.4 | 1,274 | 1.2 | 3,504 | 3.2 | 988 | 1.0 | ||||||||||||||||||||||||||||||||
| Total interest-bearing deposits | 86,582 | 72.7 | 80,428 | 69.6 | 74,007 | 70.3 | 82,902 | 75.7 | 77,067 | 74.5 | ||||||||||||||||||||||||||||||||
| Total deposits | $ | 119,052 | 100.0 | % | $ | 115,534 | 100.0 | % | $ | 105,219 | 100.0 | % | $ | 109,535 | 100.0 | % | $ | 103,417 | 100.0 | % | ||||||||||||||||||||||
The maturity of time certificates of deposit less than $100,000 and time deposits greater than $100,000 was as follows:
| Time Certificates of | Time Deposits | ||||||||||||
| December 31, 2003 (Dollars in Millions) | Deposit Less Than $100,000 | Greater Than $100,000 | Total | ||||||||||
| Three months or less | $ | 2,747 | $ | 8,610 | $ | 11,357 | |||||||
| Three months through six months | 2,237 | 831 | 3,068 | ||||||||||
| Six months through one year | 2,778 | 745 | 3,523 | ||||||||||
| One year through three years | 4,179 | 1,128 | 5,307 | ||||||||||
| Three years through five years | 1,733 | 508 | 2,241 | ||||||||||
| Thereafter | 16 | 11 | 27 | ||||||||||
| Total | $ | 13,690 | $ | 11,833 | $ | 25,523 | |||||||
BorrowingsThe Company utilizes both short-term and long-term borrowings to fund growth of earning assets in excess of deposit growth. Short-term borrowings, which include federal funds purchased, securities sold under agreements to repurchase and other short-term borrowings, were $13.1 billion at December 31, 2004, compared with $10.9 billion at December 31, 2003, up $3.1 billion (39.0 percent) from $7.8 billion at year-end 2002.2003. Short-term funding is managed to levels deemed appropriate given alternative funding sources. The increase of $2.2 billion in short-term borrowings reflected wholesale funding associated with the impact of funding growth inCompany’s earning assets, partially offset by the growth in deposits.asset growth.
| Table 11 | Deposits |
The composition of deposits was as follows:
| 2004 | 2003 | 2002 | 2001 | 2000 | ||||||||||||||||||||||||||||||||||||||
| Percent | Percent | Percent | Percent | Percent | ||||||||||||||||||||||||||||||||||||||
| December 31 (Dollars in Millions) | Amount | of Total | Amount | of Total | Amount | of Total | Amount | of Total | Amount | of Total | ||||||||||||||||||||||||||||||||
| Noninterest-bearing deposits | $ | 30,756 | 25.5 | % | $ | 32,470 | 27.3 | % | $ | 35,106 | 30.4 | % | $ | 31,212 | 29.7 | % | $ | 26,633 | 24.3 | % | ||||||||||||||||||||||
| Interest-bearing deposits | ||||||||||||||||||||||||||||||||||||||||||
| Interest checking | 23,186 | 19.2 | 21,404 | 18.0 | 17,467 | 15.1 | 15,251 | 14.5 | 13,982 | 12.8 | ||||||||||||||||||||||||||||||||
| Money market accounts | 30,478 | 25.2 | 34,025 | 28.6 | 27,753 | 24.0 | 24,835 | 23.6 | 23,899 | 21.8 | ||||||||||||||||||||||||||||||||
| Savings accounts | 5,728 | 4.8 | 5,630 | 4.7 | 5,021 | 4.4 | 4,637 | 4.4 | 4,516 | 4.1 | ||||||||||||||||||||||||||||||||
| Total of savings deposits | 59,392 | 49.2 | 61,059 | 51.3 | 50,241 | 43.5 | 44,723 | 42.5 | 42,397 | 38.7 | ||||||||||||||||||||||||||||||||
| Time certificates of deposit less than $100,000 | 12,544 | 10.4 | 13,690 | 11.5 | 17,973 | 15.5 | 20,724 | 19.7 | 25,780 | 23.5 | ||||||||||||||||||||||||||||||||
| Time deposits greater than $100,000 | ||||||||||||||||||||||||||||||||||||||||||
| Domestic | 11,956 | 9.9 | 5,902 | 4.9 | 9,427 | 8.2 | 7,286 | 6.9 | 11,221 | 10.3 | ||||||||||||||||||||||||||||||||
| Foreign | 6,093 | 5.0 | 5,931 | 5.0 | 2,787 | 2.4 | 1,274 | 1.2 | 3,504 | 3.2 | ||||||||||||||||||||||||||||||||
| Total interest-bearing deposits | 89,985 | 74.5 | 86,582 | 72.7 | 80,428 | 69.6 | 74,007 | 70.3 | 82,902 | 75.7 | ||||||||||||||||||||||||||||||||
| Total deposits | $ | 120,741 | 100.0 | % | $ | 119,052 | 100.0 | % | $ | 115,534 | 100.0 | % | $ | 105,219 | 100.0 | % | $ | 109,535 | 100.0 | % | ||||||||||||||||||||||
The maturity of time certificates of deposit less than $100,000 and time deposits greater than $100,000 was as follows:
| Time Certificates of | Time Deposits | ||||||||||||
| December 31, 2004 (Dollars in Millions) | Deposit Less Than $100,000 | Greater Than $100,000 | Total | ||||||||||
| Three months or less | $ | 2,324 | $ | 14,097 | $ | 16,421 | |||||||
| Three months through six months | 1,961 | 1,325 | 3,286 | ||||||||||
| Six months through one year | 2,536 | 940 | 3,476 | ||||||||||
| 2006 | 2,998 | 825 | 3,823 | ||||||||||
| 2007 | 1,579 | 445 | 2,024 | ||||||||||
| 2008 | 614 | 188 | 802 | ||||||||||
| 2009 | 521 | 220 | 741 | ||||||||||
| Thereafter | 11 | 9 | 20 | ||||||||||
| Total | $ | 12,544 | $ | 18,049 | $ | 30,593 | |||||||
CORPORATE RISK PROFILE
OverviewManaging risks is an essential part of successfully operating a financial services company. The most prominent risk exposures are credit, residual, operational, interest rate, market and liquidity risk. Credit risk is the risk of not collecting the interest and/or the principal balance of a loan or investment when it is due. Residual risk is the potential reduction in the end-of-term value of leased assets or the residual cash flows related to asset securitization and other off-balance sheet structures. Operational risk includes risks related to fraud, legal and compliance risk, processing errors, technology, breaches of internal controls and business continuation and disaster recovery risk. Interest rate risk is the potential reduction of net interest income as a result of changes in interest rates. Rate movements can affect the repricing of assets and liabilities differently, as well as their market value. Market risk arises from fluctuations in interest rates, foreign exchange rates, and equity prices that may result in changes in the values of financial instruments, such as trading and available-for-sale securities that are accounted for on a mark-to-market basis. Liquidity risk is the possible inability to fund obligations to depositors, investors or borrowers. In addition, corporate strategic decisions, as well as the risks described above, could give rise to reputation risk. Reputation risk is the risk that negative publicity or press, whether true or not, could result in costly litigation or cause a decline in the Company’s stock value, customer base or revenue.
Credit Risk ManagementThe Company’s strategy for credit risk management includes well-defined, centralized credit policies, uniform underwriting criteria, and ongoing risk monitoring and review processes for all commercial and consumer credit exposures. The strategy also emphasizes diversification on a geographic, industry and customer level, regular credit examinations and management reviews of loans experiencing deterioration of credit quality. The credit risk management strategy also includes a credit risk assessment process, independent of business line managers, that performs assessments of compliance with commercial and consumer credit policies, risk ratings, and other critical credit information. The Company strives to identify potential problem loans early, take any necessary charge-offs promptly and maintain adequate reserve levels for probable loan losses inherent in the portfolio. Commercial banking operations rely on a strong credit culture that combines prudent credit policies and individual lender accountability. Lenders are assigned lending grades based on their level of experience and customer service requirements. Lending grades represent the level of approval authority for the amount of credit exposure and level of risk. Credit officers reporting independently to Credit Administrationan independent credit administration function have higher levels of lending grades and support the business units in their credit decision process. Loan decisions are documented as to the borrower’s business, purpose of the loan, evaluation of the repayment source and the associated risks, evaluation of collateral, covenants and monitoring requirements, and risk rating rationale. The Company utilizes a credit risk rating system to measure the credit quality of individual commercial loan transactions. The Company uses the risk rating system for regulatory reporting, determining the frequency of review of the credit exposures, and evaluation and determination of the adequacy of thespecific allowance for commercial credit losses. The Company regularly forecasts potential changes in risk ratings, nonperforming status and potential for loss and the estimated impact on the allowance for credit losses. In the Company’s retail banking operations, standard credit scoring systems are used to assess consumer credit risks of consumer, small business and small-ticket leasing customers and to price consumer products accordingly. The Company conducts the underwriting and collections of its retail products in loan underwriting and servicing centers specializing in certain retail products. Forecasts of delinquency levels, bankruptcies and losses in conjunction with projection of estimated losses by delinquency categories and vintage information are regularly prepared and are used to evaluate underwriting and collection and determine the adequacy of thespecific allowance for credit losses for these products. Because business processes and credit risks associated with unfunded credit commitments are essentially the same as for loans, the Company utilizes similar processes to estimate its liability for unfunded credit commitments. The Company also engages in non-lending activities that may give rise to credit risk, including interest rate swap and option contracts for balance sheet hedging
Economic OverviewIn evaluating its credit risk, the Company considers changes, if any, in underwriting activities, the loan portfolio composition (including product mix and geographic, industry or customer-specific concentrations), trends in loan performance, the level of allowance coverage relative to similar banking institutions and macroeconomic factors. Since lateBeginning in 2000, the domestic economy experienced slower growth. During 2001, corporate earnings weakened and credit quality indicators among certain industry sectors deteriorated. The stagnant economic growth was evidenced by the Federal Reserve Board’s (“FRB”) actions to stimulate economic growth through a series of interest rate reductions from mid-2001 through late 2002. In addition, events of September 11, 2001, had a profound impact on credit quality due to changes in consumer confidence and related spending, governmental priorities and business activities. In response to declining economic conditions, company-specific portfolio trends, and the Firstar/ USBM merger, the Company initiated several actions during 2001 including aligning the risk management practices and charge-off policies of the companies and restructuring and disposing of certain portfolios that did not align with the credit risk profile of the combined company. The Company also implemented accelerated loan workout strategies for certain commercial credits and increased the provision for credit losses above anticipated levels by approximately $1,025 million in the third quarter of 2001.
Credit DiversificationThe Company manages its credit risk, in part, through diversification of its loan portfolio. As part of its normal business activities, it offers a broad array of traditional commercial lending products and specialized products such as asset-based lending, commercial lease financing, agricultural credit, warehouse mortgage lending, commercial real estate, health care and correspondent banking. The Company also offers an array of retail lending products including credit cards, retail leases, home equity, revolving credit, lending to students and other consumer loans. These retail credit products are primarily offered through the branch office network, specialized trust, home mortgage and loan production offices, indirect distribution channels, such as automobile dealers and a consumer finance division. The Company monitors and manages the portfolio diversification by industry, customer and geography. Table 6 provides information with respect to the overall product diversification and changes in the mix during 2003.2004.
Analysis of Nonperforming AssetsNonperformingThe level of nonperforming assets represents a key indicator, among other considerations, of the potential for future credit losses. Nonperforming assets include nonaccrual loans, restructured loans not performing in accordance with modified terms and other real estate and other nonperforming assets owned by the Company. Interest payments collected from assets on nonaccrual status are typically applied against the principal balance and not recorded as income. At December 31, 2003,2004, total nonperforming assets were $1,148.1$748.4 million, compared with $1,148.1 million at year-end 2003 and $1,373.5 million at year-end 2002 and $1,120.0 million at year-end 2001.2002. The ratio of total nonperforming assets to total loans and other real estate decreased to .97.59 percent at December 31, 2003,2004, compared with 1.18.97 percent and .981.18 percent at the end of 2003 and 2002, respectively.
| Table 12 | Nonperforming Assets (a) |
| At December 31, (Dollars in Millions) | At December 31, (Dollars in Millions) | 2003 | 2002 | 2001 | 2000 | 1999 | At December 31, (Dollars in Millions) | 2004 | 2003 | 2002 | 2001 | 2000 | ||||||||||||||||||||||||||||||||||
Commercial | Commercial | Commercial | ||||||||||||||||||||||||||||||||||||||||||||
| Commercial | $ | 623.5 | $ | 760.4 | $ | 526.6 | $ | 470.4 | $ | 219.0 | Commercial | $ | 289.5 | $ | 623.5 | $ | 760.4 | $ | 526.6 | $ | 470.4 | |||||||||||||||||||||||||
| Lease financing | 113.3 | 166.7 | 180.8 | 70.5 | 31.5 | Lease financing | 90.6 | 113.3 | 166.7 | 180.8 | 70.5 | |||||||||||||||||||||||||||||||||||
| Total commercial | 736.8 | 927.1 | 707.4 | 540.9 | 250.5 | Total commercial | 380.1 | 736.8 | 927.1 | 707.4 | 540.9 | |||||||||||||||||||||||||||||||||||
Commercial real estate | Commercial real estate | Commercial real estate | ||||||||||||||||||||||||||||||||||||||||||||
| Commercial mortgages | 177.6 | 174.6 | 131.3 | 105.5 | 138.2 | Commercial mortgages | 174.6 | 177.6 | 174.6 | 131.3 | 105.5 | |||||||||||||||||||||||||||||||||||
| Construction and development | 39.9 | 57.5 | 35.9 | 38.2 | 31.6 | Construction and development | 25.3 | 39.9 | 57.5 | 35.9 | 38.2 | |||||||||||||||||||||||||||||||||||
| Total commercial real estate | 217.5 | 232.1 | 167.2 | 143.7 | 169.8 | Total commercial real estate | 199.9 | 217.5 | 232.1 | 167.2 | 143.7 | |||||||||||||||||||||||||||||||||||
Residential mortgages | Residential mortgages | 40.5 | 52.0 | 79.1 | 56.9 | 72.8 | Residential mortgages | 43.3 | 40.5 | 52.0 | 79.1 | 56.9 | ||||||||||||||||||||||||||||||||||
Retail | Retail | Retail | ||||||||||||||||||||||||||||||||||||||||||||
| Credit card | — | — | — | 8.8 | 5.0 | Credit card | — | — | — | — | 8.8 | |||||||||||||||||||||||||||||||||||
| Retail leasing | .4 | 1.0 | 6.5 | — | .4 | Retail leasing | — | .4 | 1.0 | 6.5 | — | |||||||||||||||||||||||||||||||||||
| Other retail | 24.8 | 25.1 | 41.1 | 15.0 | 21.1 | Other retail | 17.2 | 24.8 | 25.1 | 41.1 | 15.0 | |||||||||||||||||||||||||||||||||||
| Total retail | 25.2 | 26.1 | 47.6 | 23.8 | 26.5 | Total retail | 17.2 | 25.2 | 26.1 | 47.6 | 23.8 | |||||||||||||||||||||||||||||||||||
| Total nonperforming loans | 1,020.0 | 1,237.3 | 1,001.3 | 765.3 | 519.6 | Total nonperforming loans | 640.5 | 1,020.0 | 1,237.3 | 1,001.3 | 765.3 | |||||||||||||||||||||||||||||||||||
Other real estate | Other real estate | 72.6 | 59.5 | 43.8 | 61.1 | 40.0 | Other real estate | 72.2 | 72.6 | 59.5 | 43.8 | 61.1 | ||||||||||||||||||||||||||||||||||
Other assets | Other assets | 55.5 | 76.7 | 74.9 | 40.6 | 28.9 | Other assets | 35.7 | 55.5 | 76.7 | 74.9 | 40.6 | ||||||||||||||||||||||||||||||||||
| Total nonperforming assets | $ | 1,148.1 | $ | 1,373.5 | $ | 1,120.0 | $ | 867.0 | $ | 588.5 | Total nonperforming assets | $ | 748.4 | $ | 1,148.1 | $ | 1,373.5 | $ | 1,120.0 | $ | 867.0 | |||||||||||||||||||||||||
| Restructured loans accruing interest (b) | Restructured loans accruing interest (b) | $ | 18.0 | $ | 1.4 | $ | — | $ | — | $ | — | Restructured loans accruing interest (b) | $ | 10.2 | $ | 18.0 | $ | 1.4 | $ | — | $ | — | ||||||||||||||||||||||||
| Accruing loans 90 days or more past due (c) | $ | 329.4 | $ | 426.4 | $ | 462.9 | $ | 385.2 | $ | 248.6 | ||||||||||||||||||||||||||||||||||||
| Accruing loans 90 days or more past due | Accruing loans 90 days or more past due | $ | 294.0 | $ | 329.4 | $ | 426.4 | $ | 462.9 | $ | 385.2 | |||||||||||||||||||||||||||||||||||
| Nonperforming loans to total loans | Nonperforming loans to total loans | .86 | % | 1.06 | % | .88 | % | .63 | % | .46 | % | Nonperforming loans to total loans | .51 | % | .86 | % | 1.06 | % | .88 | % | .63 | % | ||||||||||||||||||||||||
| Nonperforming assets to total loans plus other real estate | Nonperforming assets to total loans plus other real estate | .97 | % | 1.18 | % | .98 | % | .71 | % | .52 | % | Nonperforming assets to total loans plus other real estate | .59 | % | .97 | % | 1.18 | % | .98 | % | .71 | % | ||||||||||||||||||||||||
| Net interest lost on nonperforming loans | Net interest lost on nonperforming loans | $ | 67.4 | $ | 65.4 | $ | 63.0 | $ | 50.8 | $ | 29.5 | Net interest lost on nonperforming loans | $ | 42.1 | $ | 67.4 | $ | 65.4 | $ | 63.0 | $ | 50.8 | ||||||||||||||||||||||||
Changes in Nonperforming Assets
| Commercial and | Retail and | Commercial and | Retail and | |||||||||||||||||||||||||||||
| (Dollars in Millions) | (Dollars in Millions) | Commercial Real Estate | Residential Mortgages(e) | Total | (Dollars in Millions) | Commercial Real Estate | Residential Mortgages (d) | Total | ||||||||||||||||||||||||
Balance December 31, 2002 | $ | 1,295.4 | $ | 78.1 | $ | 1,373.5 | ||||||||||||||||||||||||||
Balance December 31, 2003 | Balance December 31, 2003 | $ | 1,013.3 | $ | 134.8 | $ | 1,148.1 | |||||||||||||||||||||||||
| Additions to nonperforming assets | Additions to nonperforming assets | |||||||||||||||||||||||||||||||
| New nonaccrual loans and foreclosed properties | 1,303.5 | 41.4 | 1,344.9 | New nonaccrual loans and foreclosed properties | 650.7 | 41.5 | 692.2 | |||||||||||||||||||||||||
| Advances on loans | 58.9 | — | 58.9 | Advances on loans | 39.0 | — | 39.0 | |||||||||||||||||||||||||
| Total additions | 1,362.4 | 41.4 | 1,403.8 | Total additions | 689.7 | 41.5 | 731.2 | |||||||||||||||||||||||||
| Reductions in nonperforming assets | Reductions in nonperforming assets | |||||||||||||||||||||||||||||||
| Paydowns, payoffs | (501.1 | ) | (36.0 | ) | (537.1 | ) | Paydowns, payoffs | (498.3 | ) | (24.1 | ) | (522.4 | ) | |||||||||||||||||||
| Net sales | (288.8 | ) | — | (288.8 | ) | Net sales | (132.0 | ) | — | (132.0 | ) | |||||||||||||||||||||
| Return to performing status | (118.7 | ) | (9.1 | ) | (127.8 | ) | Return to performing status | (106.1 | ) | (15.3 | ) | (121.4 | ) | |||||||||||||||||||
| Charge-offs (d) | (666.8 | ) | (8.7 | ) | (675.5 | ) | Charge-offs (c) | (347.3 | ) | (7.8 | ) | (355.1 | ) | |||||||||||||||||||
| Total reductions | (1,575.4 | ) | (53.8 | ) | (1,629.2 | ) | Total reductions | (1,083.7 | ) | (47.2 | ) | (1,130.9 | ) | |||||||||||||||||||
| Net additions (reductions) to nonperforming assets | (213.0 | ) | (12.4 | ) | (225.4 | ) | ||||||||||||||||||||||||||
| Net reductions in nonperforming assets | (394.0 | ) | (5.7 | ) | (399.7 | ) | ||||||||||||||||||||||||||
Balance December 31, 2003 | $ | 1,082.4 | $ | 65.7 | $ | 1,148.1 | ||||||||||||||||||||||||||
Balance December 31, 2004 | Balance December 31, 2004 | $ | 619.3 | $ | 129.1 | $ | 748.4 | |||||||||||||||||||||||||
| (a) | Throughout this document, nonperforming assets and related ratios do not include accruing loans 90 days or more past due. |
| (b) | Nonaccrual restructured loans are included in the respective nonperforming loan categories and excluded from restructured loans accruing interest. |
| (c) | |
| Charge-offs exclude actions for certain card products and loan sales that were not classified as nonperforming at the time the charge-off occurred. | |
| Residential mortgage information excludes changes related to residential mortgages serviced by others. |
| Table 13 | Delinquent Loan Ratios as a Percent of Ending Loan Balances |
| At December 31, | |||||||||||||||||||||||
| 90 days or more past dueexcludingnonperforming loans | 2004 | 2003 | 2002 | 2001 | 2000 | ||||||||||||||||||
Commercial | |||||||||||||||||||||||
| Commercial | .05 | % | .06 | % | .14 | % | .14 | % | .11 | % | |||||||||||||
| Lease financing | .02 | .04 | .10 | .45 | .02 | ||||||||||||||||||
| Total commercial | .05 | .06 | .14 | .18 | .10 | ||||||||||||||||||
Commercial real estate | |||||||||||||||||||||||
| Commercial mortgages | — | .02 | .03 | .03 | .07 | ||||||||||||||||||
| Construction and development | — | .03 | .07 | .02 | .03 | ||||||||||||||||||
| Total commercial real estate | — | .02 | .04 | .02 | .06 | ||||||||||||||||||
Residential mortgages | .46 | .61 | .90 | .78 | .62 | ||||||||||||||||||
Retail | |||||||||||||||||||||||
| Credit card | 1.74 | 1.68 | 2.09 | 2.18 | 1.70 | ||||||||||||||||||
| Retail leasing | .08 | .14 | .19 | .11 | .20 | ||||||||||||||||||
| Other retail | .29 | .41 | .54 | .74 | .62 | ||||||||||||||||||
| Total retail | .47 | .56 | .72 | .90 | .76 | ||||||||||||||||||
| Total loans | .23 | % | .28 | % | .37 | % | .40 | % | .31 | % | |||||||||||||
| At December 31, | |||||||||||||||||||||
| 90 days or more past dueincludingnonperforming loans | 2004 | 2003 | 2002 | 2001 | 2000 | ||||||||||||||||
| Commercial | .99 | % | 1.97 | % | 2.35 | % | 1.71 | % | 1.13 | % | |||||||||||
| Commercial real estate | .73 | .82 | .90 | .68 | .60 | ||||||||||||||||
| Residential mortgages (a) | .74 | .91 | 1.44 | 1.79 | 1.23 | ||||||||||||||||
| Retail | .51 | .62 | .79 | 1.03 | .83 | ||||||||||||||||
| Total loans | .74 | % | 1.14 | % | 1.43 | % | 1.28 | % | .94 | % | |||||||||||
| (a) | Delinquent loan ratios exclude advances made pursuant to servicing agreements to Government National Mortgage Association (“GNMA”) mortgage pools whose repayments are insured by the Federal Housing Administration or guaranteed by the Department of Veterans Affairs. Including the guaranteed amounts, the ratio of residential mortgages 90 days or more past due was 5.19 percent and 6.07 percent at December 31, 2004 and 2003, respectively. Information prior to 2003 is not available. |
| As a Percent | ||||||||||||||||||||||||||||||||||||||
| As a Percent | of Ending Loan | |||||||||||||||||||||||||||||||||||||
| Amount | of Loans | Amount | Balances | |||||||||||||||||||||||||||||||||||
| December 31 | December 31 | December 31 | ||||||||||||||||||||||||||||||||||||
| (Dollars in Millions) | (Dollars in Millions) | 2003 | 2002 | 2003 | 2002 | (Dollars in Millions) | 2004 | 2003 | 2004 | 2003 | ||||||||||||||||||||||||||||
Residential Mortgages | Residential Mortgages | Residential Mortgages | ||||||||||||||||||||||||||||||||||||
| 30-89 days | $ | 102.9 | $ | 137.5 | .76 | % | 1.41 | % | 30-89 days | $ | 108.3 | $ | 102.9 | .70 | % | .76 | % | |||||||||||||||||||||
| 90 days or more | 82.5 | 87.9 | .61 | .90 | 90 days or more | 70.2 | 82.5 | .46 | .61 | |||||||||||||||||||||||||||||
| Nonperforming | 40.5 | 52.0 | .30 | .53 | Nonperforming | 43.3 | 40.5 | .28 | .30 | |||||||||||||||||||||||||||||
Total | $ | 225.9 | $ | 277.4 | 1.68 | % | 2.85 | % | Total | $ | 221.8 | $ | 225.9 | 1.44 | % | 1.68 | % | |||||||||||||||||||||
Retail Loans | ||||||||||||||||||||||||||||||||||||||
Retail | Retail | |||||||||||||||||||||||||||||||||||||
Credit Card | Credit Card | |||||||||||||||||||||||||||||||||||||
| 30-89 days | $ | 150.9 | $ | 145.7 | 2.54 | % | 2.57 | % | 30-89 days | $ | 142.4 | $ | 150.9 | 2.16 | % | 2.54 | % | |||||||||||||||||||||
| 90 days or more | 99.5 | 118.3 | 1.68 | 2.09 | 90 days or more | 114.8 | 99.5 | 1.74 | 1.68 | |||||||||||||||||||||||||||||
| Nonperforming | — | — | — | — | Nonperforming | — | — | — | — | |||||||||||||||||||||||||||||
Total | $ | 250.4 | $ | 264.0 | 4.22 | % | 4.66 | % | Total | $ | 257.2 | $ | 250.4 | 3.90 | % | 4.22 | % | |||||||||||||||||||||
Retail Leasing | Retail Leasing | |||||||||||||||||||||||||||||||||||||
| 30-89 days | $ | 78.8 | $ | 89.7 | 1.31 | % | 1.58 | % | 30-89 days | $ | 59.4 | $ | 78.8 | .83 | % | 1.31 | % | |||||||||||||||||||||
| 90 days or more | 8.2 | 10.7 | .14 | .19 | 90 days or more | 5.6 | 8.2 | .08 | .14 | |||||||||||||||||||||||||||||
| Nonperforming | .4 | 1.0 | .01 | .02 | Nonperforming | — | .4 | — | .01 | |||||||||||||||||||||||||||||
Total | $ | 87.4 | $ | 101.4 | 1.45 | % | 1.78 | % | Total | $ | 65.0 | $ | 87.4 | .91 | % | 1.45 | % | |||||||||||||||||||||
Other Retail | Other Retail | |||||||||||||||||||||||||||||||||||||
| 30-89 days | $ | 311.9 | $ | 395.3 | 1.15 | % | 1.50 | % | 30-89 days | $ | 223.6 | $ | 311.9 | .76 | % | 1.15 | % | |||||||||||||||||||||
| 90 days or more | 110.2 | 141.2 | .41 | .54 | 90 days or more | 84.3 | 110.2 | .29 | .41 | |||||||||||||||||||||||||||||
| Nonperforming | 24.8 | 25.1 | .09 | .10 | Nonperforming | 17.2 | 24.8 | .05 | .09 | |||||||||||||||||||||||||||||
Total | $ | 446.9 | $ | 561.6 | 1.65 | % | 2.13 | % | Total | $ | 325.1 | $ | 446.9 | 1.10 | % | 1.65 | % | |||||||||||||||||||||
| At December 31, | |||||||||||||||||||||||
| 90 days or more past dueexcludingnonperforming loans | 2003 | 2002 | 2001 | 2000 | 1999 | ||||||||||||||||||
Commercial | |||||||||||||||||||||||
| Commercial | .06 | % | .14 | % | .14 | % | .11 | % | .05 | % | |||||||||||||
| Lease financing | .04 | .10 | .45 | .02 | — | ||||||||||||||||||
| Total commercial | .06 | .14 | .18 | .10 | .05 | ||||||||||||||||||
Commercial real estate | |||||||||||||||||||||||
| Commercial mortgages | .02 | .03 | .03 | .07 | .08 | ||||||||||||||||||
| Construction and development | .03 | .07 | .02 | .03 | .05 | ||||||||||||||||||
| Total commercial real estate | .02 | .04 | .02 | .06 | .07 | ||||||||||||||||||
Residential mortgages | .61 | .90 | .78 | .62 | .42 | ||||||||||||||||||
Retail | |||||||||||||||||||||||
| Credit card | 1.68 | 2.09 | 2.18 | 1.70 | 1.23 | ||||||||||||||||||
| Retail leasing | .14 | .19 | .11 | .20 | .12 | ||||||||||||||||||
| Other retail | .41 | .54 | .74 | .62 | .41 | ||||||||||||||||||
| Total retail | .56 | .72 | .90 | .76 | .53 | ||||||||||||||||||
| Total loans | .28 | % | .37 | % | .40 | % | .31 | % | .22 | % | |||||||||||||
| At December 31, | |||||||||||||||||||||
| 90 days or more past dueincludingnonperforming loans | 2003 | 2002 | 2001 | 2000 | 1999 | ||||||||||||||||
| Commercial | 1.97 | % | 2.35 | % | 1.71 | % | 1.13 | % | .59 | % | |||||||||||
| Commercial real estate | .82 | .90 | .68 | .60 | .74 | ||||||||||||||||
| Residential mortgages | .91 | 1.44 | 1.79 | 1.23 | .99 | ||||||||||||||||
| Retail | .62 | .79 | 1.03 | .83 | .62 | ||||||||||||||||
| Total loans | 1.14 | % | 1.43 | % | 1.28 | % | .94 | % | .68 | % | |||||||||||
Analysis of Loan Net Charge-OffsTotal loan net charge-offs decreased $121.3$484.6 million to $767.1 million in 2004, compared with $1,251.7 million in 2003 compared withand $1,373.0 million in 2002 and $1,546.5 million in 2001.2002. The ratio of total loan net charge-offs to average loans was .63 percent in 2004, compared with 1.06 percent in 2003 compared withand 1.20 percent in 20022002. The overall level of net charge-offs in 2004 reflected the Company’s ongoing efforts to reduce the overall risk profile of the organization, improved economic conditions, higher commercial loan recoveries, refinancing by higher risk customers with other companies and 1.31 percenthigher asset valuations. Net charge-offs are expected to increase modestly as the level of commercial loan recoveries declines to more normalized levels in 2001.2005. The improvement in net charge-offs in 2003, compared with 2002, was due to credit risk management initiatives taken by the Company during the past two years that have improved the credit risk profile of the loan portfolio. These initiatives along with better economic conditions resulted in improving credit risk classifications and lower levels of nonperforming assets. The level ofassets and consumer loan net charge-offs during 2002 reflected the impact of soft economic conditions at that time and weakness in the communications, transportation and manufacturing sectors, as well as the impact of the economy on highly leveraged enterprise-value financings. The decline during 2002 reflected net charge-offs taken in 2001 related to several credit initiatives taken by management in that year. Due to the Company’s ongoing workout, collection and risk management efforts and expected improvement in the economy, net charge-offs are anticipated to trend lower in 2004.delinquencies.
| Table 14 | Net Charge-offs as a Percent of Average Loans Outstanding |
| Year Ended December 31 | Year Ended December 31 | 2003 | 2002 | 2001 | 2000 | 1999 | Year Ended December 31 | 2004 | 2003 | 2002 | 2001 | 2000 | ||||||||||||||||||||||||||||||||||
Commercial | Commercial | Commercial | ||||||||||||||||||||||||||||||||||||||||||||
| Commercial | 1.34 | % | 1.29 | % | 1.62 | % | .56 | % | .41 | % | Commercial | .29 | % | 1.34 | % | 1.29 | % | 1.62 | % | .56 | % | |||||||||||||||||||||||||
| Lease financing | 1.65 | 2.67 | 1.95 | .46 | .24 | Lease financing | 1.42 | 1.65 | 2.67 | 1.95 | .46 | |||||||||||||||||||||||||||||||||||
| Total commercial | 1.38 | 1.46 | 1.66 | .55 | .40 | Total commercial | .43 | 1.38 | 1.46 | 1.66 | .55 | |||||||||||||||||||||||||||||||||||
Commercial real estate | Commercial real estate | Commercial real estate | ||||||||||||||||||||||||||||||||||||||||||||
| Commercial mortgages | .14 | .17 | .21 | .03 | .02 | |||||||||||||||||||||||||||||||||||||||||
| Construction and development | .16 | .11 | .17 | .11 | .03 | Commercial mortgages | .09 | .14 | .17 | .21 | .03 | |||||||||||||||||||||||||||||||||||
| Construction and development | .13 | .16 | .11 | .17 | .11 | |||||||||||||||||||||||||||||||||||||||||
| Total commercial real estate | .14 | .15 | .20 | .05 | .02 | |||||||||||||||||||||||||||||||||||||||||
| Total commercial real estate | .10 | .14 | .15 | .20 | .05 | |||||||||||||||||||||||||||||||||||||||||
Residential mortgages | Residential mortgages | .23 | .23 | .15 | .11 | .11 | Residential mortgages | .20 | .23 | .23 | .15 | .11 | ||||||||||||||||||||||||||||||||||
Retail | Retail | Retail | ||||||||||||||||||||||||||||||||||||||||||||
| Credit card | 4.61 | 4.98 | 4.80 | 4.18 | 4.00 | Credit card | 4.14 | 4.61 | 4.98 | 4.80 | 4.18 | |||||||||||||||||||||||||||||||||||
| Retail leasing | .86 | .72 | .65 | .41 | .28 | Retail leasing | .59 | .86 | .72 | .65 | .41 | |||||||||||||||||||||||||||||||||||
| Home equity and second mortgages | .70 | .74 | .85 | * | * | Home equity and second mortgages | .54 | .70 | .74 | .85 | * | |||||||||||||||||||||||||||||||||||
| Other retail | 1.60 | 2.10 | 2.16 | 1.32 | 1.26 | Other retail | 1.22 | 1.60 | 2.10 | 2.16 | 1.32 | |||||||||||||||||||||||||||||||||||
| Total retail | 1.61 | 1.85 | 1.94 | 1.69 | 1.63 | Total retail | 1.32 | 1.61 | 1.85 | 1.94 | 1.69 | |||||||||||||||||||||||||||||||||||
| Total loans (a) | 1.06 | % | 1.20 | % | 1.31 | % | .70 | % | .61 | % | Total loans (a) | .63 | % | 1.06 | % | 1.20 | % | 1.31 | % | .70 | % | |||||||||||||||||||||||||
| (a) | In accordance with guidance provided in the Interagency Guidance on Certain Loans Held for Sale, loans held with the intent to sell are transferred to the Loans Held for Sale category based on the lower of cost or fair value. At the time of transfer, the portion of the mark-to-market losses representing probable credit losses determined in accordance with policies and methods utilized to determine the allowance for credit losses is included in net charge-offs. The remaining portion of the losses was reported separately as a reduction of the allowance for credit losses under “Losses from loan sales/transfers.” Had the entire amount of the loss been reported as charge-offs, total net charge-offs would have been $1,875.8 million (1.59 percent of average loans) for the year ended December 31, 2001. |
| * | Information not available |
| Average Loan | Percent of | Average Loan | Percent of | |||||||||||||||||||||||||||||||
| Amount | Average Loans | Amount | Average Loans | |||||||||||||||||||||||||||||||
| Year Ended December 31 | Year Ended December 31 | Year Ended December 31 | ||||||||||||||||||||||||||||||||
| (Dollars in Millions) | (Dollars in Millions) | 2003 | 2002 | 2003 | 2002 | (Dollars in Millions) | 2004 | 2003 | 2004 | 2003 | ||||||||||||||||||||||||
Consumer finance (a) | Consumer finance (a) | Consumer finance (a) | ||||||||||||||||||||||||||||||||
| Residential mortgages | $ | 3,499 | $ | 2,447 | .44 | % | .57 | % | Residential mortgages | $ | 4,531 | $ | 3,499 | .44 | % | .44 | % | |||||||||||||||||
| Home equity and second mortgages | 2,350 | 2,570 | 2.38 | 1.95 | Home equity and second mortgages | 2,412 | 2,350 | 2.07 | 2.38 | |||||||||||||||||||||||||
| Other retail | 360 | 237 | 4.76 | 3.90 | Other retail | 414 | 360 | 5.04 | 4.76 | |||||||||||||||||||||||||
Traditional branch | Traditional branch | Traditional branch | ||||||||||||||||||||||||||||||||
| Residential mortgages | $ | 8,197 | $ | 5,965 | .14 | % | .09 | % | Residential mortgages | $ | 9,791 | $ | 8,197 | .09 | % | .14 | % | |||||||||||||||||
| Home equity and second mortgages | 10,889 | 10,662 | .34 | .44 | Home equity and second mortgages | 11,628 | 10,889 | .22 | .34 | |||||||||||||||||||||||||
| Other retail | 13,270 | 12,010 | 1.52 | 2.07 | Other retail | 14,007 | 13,270 | 1.10 | 1.52 | |||||||||||||||||||||||||
Total Company | Total Company | Total Company | ||||||||||||||||||||||||||||||||
| Residential mortgages | $ | 11,696 | $ | 8,412 | .23 | % | .23 | % | Residential mortgages | $ | 14,322 | $ | 11,696 | .20 | % | .23 | % | |||||||||||||||||
| Home equity and second mortgages | 13,239 | 13,232 | .70 | .74 | Home equity and second mortgages | 14,040 | 13,239 | .54 | .70 | |||||||||||||||||||||||||
| Other retail | 13,630 | 12,247 | 1.60 | 2.10 | Other retail | 14,421 | 13,630 | 1.22 | 1.60 | |||||||||||||||||||||||||
| (a) | Consumer finance category included credit originated and managed by USBCF, as well as home equity loans and second mortgages with a loan-to-value greater than 100 percent that were originated in the branches. |
Analysis and Determination of the Allowance for Credit LossesThe allowance for creditloan losses provides coverage for probable and estimable losses inherent in the Company’s loan and lease portfolio. Management evaluates the allowance each quarter to determine that it is adequate to cover these inherent losses. The evaluation of each element and the overall allowance is based on a continuing assessment of problem loans, and related off-balance sheet items, recent loss experience and other factors, including regulatory guidance and economic conditions. Because business processes and credit risks associated with unfunded credit commitments are essentially the same as for loans, the Company utilizes similar processes to estimate its liability for unfunded credit commitments, which is included in other liabilities in the Consolidated Balance Sheet. Both the allowance for loan losses and the liability for unfunded credit commitments are included in the Company’s analysis of credit losses.
| Table 15 | Summary of Allowance for Credit Losses |
| (Dollars in Millions) | 2004 | 2003 | 2002 | 2001 | 2000 | |||||||||||||||||||
| Balance at beginning of year | $ | 2,368.6 | $ | 2,422.0 | $ | 2,457.3 | $ | 1,786.9 | $ | 1,710.3 | ||||||||||||||
Charge-offs | ||||||||||||||||||||||||
| Commercial | ||||||||||||||||||||||||
| Commercial | 243.5 | 555.6 | 559.2 | 779.0 | 319.8 | |||||||||||||||||||
| Lease financing | 110.6 | 139.3 | 188.8 | 144.4 | 27.9 | |||||||||||||||||||
| Total commercial | 354.1 | 694.9 | 748.0 | 923.4 | 347.7 | |||||||||||||||||||
| Commercial real estate | ||||||||||||||||||||||||
| Commercial mortgages | 29.1 | 43.9 | 40.9 | 49.5 | 15.8 | |||||||||||||||||||
| Construction and development | 12.5 | 13.0 | 8.8 | 12.6 | 10.3 | |||||||||||||||||||
| Total commercial real estate | 41.6 | 56.9 | 49.7 | 62.1 | 26.1 | |||||||||||||||||||
| Residential mortgages | 32.5 | 30.3 | 23.1 | 15.8 | 13.7 | |||||||||||||||||||
| Retail | ||||||||||||||||||||||||
| Credit card | 281.5 | 282.1 | 304.9 | 294.1 | 235.8 | |||||||||||||||||||
| Retail leasing | 49.0 | 57.0 | 45.2 | 34.2 | 14.8 | |||||||||||||||||||
| Home equity and second mortgages | 89.6 | 105.0 | 107.9 | 112.7 | * | |||||||||||||||||||
| Other retail | 225.2 | 267.9 | 311.9 | 329.1 | 379.5 | |||||||||||||||||||
| Total retail | 645.3 | 712.0 | 769.9 | 770.1 | 630.1 | |||||||||||||||||||
| Total charge-offs | 1,073.5 | 1,494.1 | 1,590.7 | 1,771.4 | 1,017.6 | |||||||||||||||||||
Recoveries | ||||||||||||||||||||||||
| Commercial | ||||||||||||||||||||||||
| Commercial | 143.9 | 70.0 | 67.4 | 60.6 | 64.0 | |||||||||||||||||||
| Lease financing | 41.5 | 55.3 | 39.9 | 30.4 | 7.2 | |||||||||||||||||||
| Total commercial | 185.4 | 125.3 | 107.3 | 91.0 | 71.2 | |||||||||||||||||||
| Commercial real estate | ||||||||||||||||||||||||
| Commercial mortgages | 11.1 | 15.8 | 9.1 | 9.1 | 10.8 | |||||||||||||||||||
| Construction and development | 3.5 | 2.0 | 1.4 | .8 | 2.6 | |||||||||||||||||||
| Total commercial real estate | 14.6 | 17.8 | 10.5 | 9.9 | 13.4 | |||||||||||||||||||
| Residential mortgages | 3.8 | 3.4 | 4.0 | 3.2 | 1.3 | |||||||||||||||||||
| Retail | ||||||||||||||||||||||||
| Credit card | 29.6 | 27.3 | 24.6 | 23.4 | 27.5 | |||||||||||||||||||
| Retail leasing | 9.6 | 7.0 | 6.3 | 4.5 | 2.0 | |||||||||||||||||||
| Home equity and second mortgages | 13.8 | 12.1 | 10.6 | 12.9 | * | |||||||||||||||||||
| Other retail | 49.6 | 49.5 | 54.4 | 80.0 | 76.8 | |||||||||||||||||||
| Total retail | 102.6 | 95.9 | 95.9 | 120.8 | 106.3 | |||||||||||||||||||
| Total recoveries | 306.4 | 242.4 | 217.7 | 224.9 | 192.2 | |||||||||||||||||||
Net Charge-offs | ||||||||||||||||||||||||
| Commercial | ||||||||||||||||||||||||
| Commercial | 99.6 | 485.6 | 491.8 | 718.4 | 255.8 | |||||||||||||||||||
| Lease financing | 69.1 | 84.0 | 148.9 | 114.0 | 20.7 | |||||||||||||||||||
| Total commercial | 168.7 | 569.6 | 640.7 | 832.4 | 276.5 | |||||||||||||||||||
| Commercial real estate | ||||||||||||||||||||||||
| Commercial mortgages | 18.0 | 28.1 | 31.8 | 40.4 | 5.0 | |||||||||||||||||||
| Construction and development | 9.0 | 11.0 | 7.4 | 11.8 | 7.7 | |||||||||||||||||||
| Total commercial real estate | 27.0 | 39.1 | 39.2 | 52.2 | 12.7 | |||||||||||||||||||
| Residential mortgages | 28.7 | 26.9 | 19.1 | 12.6 | 12.4 | |||||||||||||||||||
| Retail | ||||||||||||||||||||||||
| Credit card | 251.9 | 254.8 | 280.3 | 270.7 | 208.3 | |||||||||||||||||||
| Retail leasing | 39.4 | 50.0 | 38.9 | 29.7 | 12.8 | |||||||||||||||||||
| Home equity and second mortgages | 75.8 | 92.9 | 97.3 | 99.8 | * | |||||||||||||||||||
| Other retail | 175.6 | 218.4 | 257.5 | 249.1 | 302.7 | |||||||||||||||||||
| Total retail | 542.7 | 616.1 | 674.0 | 649.3 | 523.8 | |||||||||||||||||||
| Total net charge-offs | 767.1 | 1,251.7 | 1,373.0 | 1,546.5 | 825.4 | |||||||||||||||||||
| Provision for credit losses | 669.6 | 1,254.0 | 1,349.0 | 2,528.8 | 828.0 | |||||||||||||||||||
| Losses from loan sales/transfers (a) | — | — | — | (329.3 | ) | — | ||||||||||||||||||
| Acquisitions and other changes | (1.8 | ) | (55.7 | ) | (11.3 | ) | 17.4 | 74.0 | ||||||||||||||||
| Balance at end of year | $ | 2,269.3 | $ | 2,368.6 | $ | 2,422.0 | $ | 2,457.3 | $ | 1,786.9 | ||||||||||||||
Components | ||||||||||||||||||||||||
| Allowance for loan losses | $ | 2,080.4 | $ | 2,183.6 | ||||||||||||||||||||
| Liability for unfunded credit commitments (b) | 188.9 | 185.0 | ||||||||||||||||||||||
| Total allowance for credit losses | $ | 2,269.3 | $ | 2,368.6 | ||||||||||||||||||||
| Allowance for credit losses as a percentage of | ||||||||||||||||||||||||
| Period-end loans | 1.80 | % | 2.00 | % | 2.08 | % | 2.15 | % | 1.46 | % | ||||||||||||||
| Nonperforming loans | 354 | 232 | 196 | 245 | 233 | |||||||||||||||||||
| Nonperforming assets | 303 | 206 | 176 | 219 | 206 | |||||||||||||||||||
| Net charge-offs (a) | 296 | 189 | 176 | 159 | 216 | |||||||||||||||||||
| (a) | In accordance with guidance provided in the Interagency Guidance on Certain Loans Held for Sale, loans held with the intent to sell are transferred to the Loans Held for Sale category based on the lower of cost or fair value. At the time of the transfer, the portion of the mark-to-market losses representing probable credit losses determined in accordance with policies and methods utilized to determine the allowance for credit losses is included in net charge-offs. The remaining portion of the losses was reported separately as a reduction of the allowance for credit losses under “Losses from loan sales/transfers.” Had the entire amount of the loss been reported as charge-offs, total net charge-offs would have been $1,875.8 million for the year ended 2001. Additionally, the allowance as a percent of net charge-offs would have been 131 percent for the year ended December 31, 2001. |
| (b) | During 2004, the Company reclassified the portion of its allowance for credit losses related to commercial off-balance sheet loan commitments and letters of credit to a separate liability account included in other liabilities in the Consolidated Balance Sheet. Amounts for 2003 have been restated. |
| * | Information not available |
| Table 16 | Elements of the Allowance for Credit Losses |
| Allowance Amount | Allowance as a Percent of Loans | |||||||||||||||||||||||||||||||||||||||||
| December 31 (Dollars in Millions) | 2004 | 2003 | 2002 | 2001 | 2000 | 2004 | 2003 | 2002 | 2001 | 2000 | ||||||||||||||||||||||||||||||||
Commercial | ||||||||||||||||||||||||||||||||||||||||||
| Commercial | $ | 663.6 | $ | 696.1 | $ | 776.4 | $ | 1,068.1 | $ | 418.8 | 1.88 | % | 2.08 | % | 2.12 | % | 2.64 | % | .89 | % | ||||||||||||||||||||||
| Lease financing | 105.8 | 90.4 | 107.6 | 107.5 | 17.7 | 2.13 | 1.81 | 2.01 | 1.84 | .31 | ||||||||||||||||||||||||||||||||
| Total commercial | 769.4 | 786.5 | 884.0 | 1,175.6 | 436.5 | 1.92 | 2.04 | 2.11 | 2.54 | .83 | ||||||||||||||||||||||||||||||||
Commercial real estate | ||||||||||||||||||||||||||||||||||||||||||
| Commercial mortgages | 131.1 | 169.7 | 152.9 | 176.6 | 42.7 | .65 | .82 | .75 | .94 | .22 | ||||||||||||||||||||||||||||||||
| Construction and development | 40.2 | 58.8 | 53.5 | 76.4 | 17.7 | .55 | .89 | .82 | 1.16 | .25 | ||||||||||||||||||||||||||||||||
| Total commercial real estate | 171.3 | 228.5 | 206.4 | 253.0 | 60.4 | .62 | .84 | .77 | 1.00 | .23 | ||||||||||||||||||||||||||||||||
Residential mortgages | 33.1 | 33.3 | 34.2 | 21.9 | 11.6 | .22 | .25 | .35 | .28 | .12 | ||||||||||||||||||||||||||||||||
Retail | ||||||||||||||||||||||||||||||||||||||||||
| Credit card | 283.2 | 267.9 | 272.4 | 295.2 | 265.6 | 4.29 | 4.52 | 4.81 | 5.01 | 4.42 | ||||||||||||||||||||||||||||||||
| Retail leasing | 43.8 | 47.1 | 44.0 | 38.7 | 27.2 | .61 | .78 | .77 | .79 | .65 | ||||||||||||||||||||||||||||||||
| Home equity and second mortgages | 87.9 | 100.5 | 114.7 | 88.6 | 107.7 | .59 | .76 | .85 | .72 | .90 | ||||||||||||||||||||||||||||||||
| Other retail | 195.4 | 234.8 | 268.6 | 282.8 | 250.3 | 1.34 | 1.70 | 2.10 | 2.39 | 2.16 | ||||||||||||||||||||||||||||||||
| Total retail | 610.3 | 650.3 | 699.7 | 705.3 | 650.8 | 1.41 | 1.67 | 1.86 | 2.02 | 1.93 | ||||||||||||||||||||||||||||||||
| Total allocated allowance | 1,584.1 | 1,698.6 | 1,824.3 | 2,155.8 | 1,159.3 | 1.25 | 1.43 | 1.57 | 1.89 | .95 | ||||||||||||||||||||||||||||||||
| Available for other factors | 685.2 | 670.0 | 597.7 | 301.5 | 627.6 | .54 | .57 | .51 | .26 | .51 | ||||||||||||||||||||||||||||||||
| Total allowance | $ | 2,269.3 | $ | 2,368.6 | $ | 2,422.0 | $ | 2,457.3 | $ | 1,786.9 | 1.80 | % | 2.00 | % | 2.08 | % | 2.15 | % | 1.46 | % | ||||||||||||||||||||||
At December 31, 2003,2004, the allowance for credit losses was $2,368.6$2,269.3 million (2.00(1.80 percent of loans). This compares with an allowance of $2,368.6 million (2.00 percent of loans) at December 31, 2003, and $2,422.0 million (2.08 percent of loans) at December 31, 2002, and $2,457.3 million (2.15 percent of loans) at December 31, 2001.2002. The ratio of the allowance for credit losses to nonperforming loans was 354 percent at year-end 2004, compared with 232 percent at year-end 2003 compared withand 196 percent at year-end 2002 and 245 percent at year-end 2001.2002. The ratio of the allowance for credit losses to loan net charge-offs was 296 percent at year-end 2004, compared with 189 percent at year-end 2003 compared withand 176 percent at year-end 2002 and 159 percent at year-end 2001.2002. Management determined that the allowance for credit losses was adequate at December 31, 2003.
| Allowance Amount | Allowance as a Percent of Loans | ||||||||||||||||||||||||||||||||||||||||||
| December 31 (Dollars in Millions) | 2003 | 2002 | 2001 | 2000 | 1999 | 2003 | 2002 | 2001 | 2000 | 1999 | |||||||||||||||||||||||||||||||||
Commercial | |||||||||||||||||||||||||||||||||||||||||||
| Commercial | $ | 696.1 | $ | 776.4 | $ | 1,068.1 | $ | 418.8 | $ | 408.3 | 2.08 | % | 2.12 | % | 2.64 | % | .89 | % | .97 | % | |||||||||||||||||||||||
| Lease financing | 90.4 | 107.6 | 107.5 | 17.7 | 20.2 | 1.81 | 2.01 | 1.84 | .31 | .53 | |||||||||||||||||||||||||||||||||
| Total commercial | 786.5 | 884.0 | 1,175.6 | 436.5 | 428.5 | 2.04 | 2.11 | 2.54 | .83 | .93 | |||||||||||||||||||||||||||||||||
Commercial real estate | |||||||||||||||||||||||||||||||||||||||||||
| Commercial mortgages | 169.7 | 152.9 | 176.6 | 42.7 | 110.4 | .82 | .75 | .94 | .22 | .59 | |||||||||||||||||||||||||||||||||
| Construction and development | 58.8 | 53.5 | 76.4 | 17.7 | 22.5 | .89 | .82 | 1.16 | .25 | .35 | |||||||||||||||||||||||||||||||||
| Total commercial real estate | 228.5 | 206.4 | 253.0 | 60.4 | 132.9 | .84 | .77 | 1.00 | .23 | .53 | |||||||||||||||||||||||||||||||||
Residential mortgages | 33.3 | 34.2 | 21.9 | 11.6 | 18.6 | .25 | .35 | .28 | .12 | .15 | |||||||||||||||||||||||||||||||||
Retail | |||||||||||||||||||||||||||||||||||||||||||
| Credit card | 267.9 | 272.4 | 295.2 | 265.6 | 320.8 | 4.52 | 4.81 | 5.01 | 4.42 | 6.41 | |||||||||||||||||||||||||||||||||
| Retail leasing | 47.1 | 44.0 | 38.7 | 27.2 | 18.6 | .78 | .77 | .79 | .65 | .88 | |||||||||||||||||||||||||||||||||
| Home equity and second mortgages | 100.5 | 114.7 | 88.6 | 107.7 | * | .76 | .85 | .72 | .90 | * | |||||||||||||||||||||||||||||||||
| Other retail | 234.8 | 268.6 | 282.8 | 250.3 | 389.2 | 1.70 | 2.10 | 2.39 | 2.16 | 1.74 | |||||||||||||||||||||||||||||||||
| Total retail | 650.3 | 699.7 | 705.3 | 650.8 | 728.6 | 1.67 | 1.86 | 2.02 | 1.93 | 2.47 | |||||||||||||||||||||||||||||||||
| Total allocated allowance | 1,698.6 | 1,824.3 | 2,155.8 | 1,159.3 | 1,308.6 | 1.43 | 1.57 | 1.89 | .95 | 1.16 | |||||||||||||||||||||||||||||||||
| Available for other factors | 670.0 | 597.7 | 301.5 | 627.6 | 401.7 | .57 | .51 | .26 | .51 | .35 | |||||||||||||||||||||||||||||||||
| Total allowance | $ | 2,368.6 | $ | 2,422.0 | $ | 2,457.3 | $ | 1,786.9 | $ | 1,710.3 | 2.00 | % | 2.08 | % | 2.15 | % | 1.46 | % | 1.51 | % | |||||||||||||||||||||||
| (Dollars in Millions) | 2003 | 2002 | 2001 | 2000 | 1999 | |||||||||||||||||||
| Balance at beginning of year | $ | 2,422.0 | $ | 2,457.3 | $ | 1,786.9 | $ | 1,710.3 | $ | 1,705.7 | ||||||||||||||
Charge-offs | ||||||||||||||||||||||||
| Commercial | ||||||||||||||||||||||||
| Commercial | 555.6 | 559.2 | 779.0 | 319.8 | 250.1 | |||||||||||||||||||
| Lease financing | 139.3 | 188.8 | 144.4 | 27.9 | 12.4 | |||||||||||||||||||
| Total commercial | 694.9 | 748.0 | 923.4 | 347.7 | 262.5 | |||||||||||||||||||
| Commercial real estate | ||||||||||||||||||||||||
| Commercial mortgages | 43.9 | 40.9 | 49.5 | 15.8 | 19.1 | |||||||||||||||||||
| Construction and development | 13.0 | 8.8 | 12.6 | 10.3 | 2.6 | |||||||||||||||||||
| Total commercial real estate | 56.9 | 49.7 | 62.1 | 26.1 | 21.7 | |||||||||||||||||||
| Residential mortgages | 30.3 | 23.1 | 15.8 | 13.7 | 16.2 | |||||||||||||||||||
| Retail | ||||||||||||||||||||||||
| Credit card | 282.1 | 304.9 | 294.1 | 235.8 | 220.2 | |||||||||||||||||||
| Retail leasing | 57.0 | 45.2 | 34.2 | 14.8 | 6.2 | |||||||||||||||||||
| Home equity and second mortgages | 105.0 | 107.9 | 112.7 | * | * | |||||||||||||||||||
| Other retail | 267.9 | 311.9 | 329.1 | 379.5 | 376.0 | |||||||||||||||||||
| Total retail | 712.0 | 769.9 | 770.1 | 630.1 | 602.4 | |||||||||||||||||||
| Total charge-offs | 1,494.1 | 1,590.7 | 1,771.4 | 1,017.6 | 902.8 | |||||||||||||||||||
Recoveries | ||||||||||||||||||||||||
| Commercial | ||||||||||||||||||||||||
| Commercial | 70.0 | 67.4 | 60.6 | 64.0 | 84.8 | |||||||||||||||||||
| Lease financing | 55.3 | 39.9 | 30.4 | 7.2 | 4.0 | |||||||||||||||||||
| Total commercial | 125.3 | 107.3 | 91.0 | 71.2 | 88.8 | |||||||||||||||||||
| Commercial real estate | ||||||||||||||||||||||||
| Commercial mortgages | 15.8 | 9.1 | 9.1 | 10.8 | 15.1 | |||||||||||||||||||
| Construction and development | 2.0 | 1.4 | .8 | 2.6 | 1.0 | |||||||||||||||||||
| Total commercial real estate | 17.8 | 10.5 | 9.9 | 13.4 | 16.1 | |||||||||||||||||||
| Residential mortgages | 3.4 | 4.0 | 3.2 | 1.3 | 1.4 | |||||||||||||||||||
| Retail | ||||||||||||||||||||||||
| Credit card | 27.3 | 24.6 | 23.4 | 27.5 | 34.6 | |||||||||||||||||||
| Retail leasing | 7.0 | 6.3 | 4.5 | 2.0 | 1.1 | |||||||||||||||||||
| Home equity and second mortgages | 12.1 | 10.6 | 12.9 | * | * | |||||||||||||||||||
| Other retail | 49.5 | 54.4 | 80.0 | 76.8 | 88.2 | |||||||||||||||||||
| Total retail | 95.9 | 95.9 | 120.8 | 106.3 | 123.9 | |||||||||||||||||||
| Total recoveries | 242.4 | 217.7 | 224.9 | 192.2 | 230.2 | |||||||||||||||||||
Net Charge-offs | ||||||||||||||||||||||||
| Commercial | ||||||||||||||||||||||||
| Commercial | 485.6 | 491.8 | 718.4 | 255.8 | 165.3 | |||||||||||||||||||
| Lease financing | 84.0 | 148.9 | 114.0 | 20.7 | 8.4 | |||||||||||||||||||
| Total commercial | 569.6 | 640.7 | 832.4 | 276.5 | 173.7 | |||||||||||||||||||
| Commercial real estate | ||||||||||||||||||||||||
| Commercial mortgages | 28.1 | 31.8 | 40.4 | 5.0 | 4.0 | |||||||||||||||||||
| Construction and development | 11.0 | 7.4 | 11.8 | 7.7 | 1.6 | |||||||||||||||||||
| Total commercial real estate | 39.1 | 39.2 | 52.2 | 12.7 | 5.6 | |||||||||||||||||||
| Residential mortgages | 26.9 | 19.1 | 12.6 | 12.4 | 14.8 | |||||||||||||||||||
| Retail | ||||||||||||||||||||||||
| Credit card | 254.8 | 280.3 | 270.7 | 208.3 | 185.6 | |||||||||||||||||||
| Retail leasing | 50.0 | 38.9 | 29.7 | 12.8 | 5.1 | |||||||||||||||||||
| Home equity and second mortgages | 92.9 | 97.3 | 99.8 | * | * | |||||||||||||||||||
| Other retail | 218.4 | 257.5 | 249.1 | 302.7 | 287.8 | |||||||||||||||||||
| Total retail | 616.1 | 674.0 | 649.3 | 523.8 | 478.5 | |||||||||||||||||||
| Total net charge-offs | 1,251.7 | 1,373.0 | 1,546.5 | 825.4 | 672.6 | |||||||||||||||||||
| Provision for credit losses | 1,254.0 | 1,349.0 | 2,528.8 | 828.0 | 646.0 | |||||||||||||||||||
| Losses from loan sales/transfers (a) | — | — | (329.3 | ) | — | — | ||||||||||||||||||
| Acquisitions and other changes | (55.7 | ) | (11.3 | ) | 17.4 | 74.0 | 31.2 | |||||||||||||||||
| Balance at end of year | $ | 2,368.6 | $ | 2,422.0 | $ | 2,457.3 | $ | 1,786.9 | $ | 1,710.3 | ||||||||||||||
| Allowance as a percent of | ||||||||||||||||||||||||
| Period-end loans | 2.00 | % | 2.08 | % | 2.15 | % | 1.46 | % | 1.51 | % | ||||||||||||||
| Nonperforming loans | 232 | 196 | 245 | 233 | 329 | |||||||||||||||||||
| Nonperforming assets | 206 | 176 | 219 | 206 | 291 | |||||||||||||||||||
| Net charge-offs (a) | 189 | 176 | 159 | 216 | 254 | |||||||||||||||||||
Residual Risk ManagementThe Company manages its risk to changes in the residual value of lease residualleased assets through disciplined residual valuation setting at the inception of a
Operational Risk ManagementOperational risk represents the risk of loss resulting from the Company’s operations, including, but not limited to, the risk of fraud by employees or persons outside the Company, the execution of unauthorized transactions by employees, errors relating to transaction processing and technology, breaches of the internal control system and compliance requirements and business continuation and disaster recovery. This risk of loss also includes the potential legal actions that could arise as a result of an operational deficiency or as a result of noncompliance with applicable regulatory standards, adverse business decisions or their implementation, and customer attrition due to potential negative publicity.
Interest Rate Risk ManagementIn the banking industry, a significant risk exists related to changes in interest rates. To minimize the volatility of net interest income and of the market value of assets and liabilities, the Company manages its exposure to changes in interest rates through asset and liability management activities within guidelines established by its Asset Liability Policy Committee (“ALPC”) and approved by the Board of Directors. ALPC has the responsibility for approving and ensuring compliance with ALPC management policies, including interest rate risk exposure. The Company uses Net Interest Income Simulation Analysis and Market Value of Equity Modeling for measuring and analyzing consolidated interest rate risk.
Net Interest Income Simulation AnalysisOne of the primary tools used to measure interest rate risk and the effect of interest rate changes on rate sensitive income and net interest income is simulation analysis. The monthly analysis incorporates substantially all of the Company’s assets and liabilities and off-balance sheet instruments, together with forecasted changes in the balance sheet and assumptions that reflect the current interest rate environment. Through these simulations, management estimates the impact on interest rate sensitive income of a 300 basis point upward or downward gradual change of market interest rates over a one-year period. The simulations also estimate the effect of immediate and sustained parallel shifts in the yield curve of 50 basis points as well as the effect of immediate and sustained flattening
Sensitivity of Net Interest Income and Rate Sensitive Income
| December 31, 2004 | December 31, 2003 | |||||||||||||||||||||||||||||||
| Down 50 | Up 50 | Down 300 | Up 300 | Down 50 | Up 50 | Down 300 | Up 300 | |||||||||||||||||||||||||
| Immediate | Immediate | Gradual | Gradual | Immediate | Immediate | Gradual | Gradual | |||||||||||||||||||||||||
| Net interest income | (.49 | )% | .04 | % | *% | (.19 | )% | 1.30 | % | .19 | % | *% | (.02 | )% | ||||||||||||||||||
| Rate sensitive income | (.40 | )% | (.13 | )% | *% | (.69 | )% | .74 | % | .01 | % | *% | (.54 | )% | ||||||||||||||||||
| * | Given the current level of interest rates, a downward 300 basis point scenario can not be computed. |
Sensitivity of Net Interest Income and Rate Sensitive Income:
| December 31, 2003 | December 31, 2002 | |||||||||||||||||||||||||||||||
| Down 50 | Up 50 | Down 300 | Up 300 | Down 50 | Up 50 | Down 300 | Up 300 | |||||||||||||||||||||||||
| Immediate | Immediate | Gradual | Gradual | Immediate | Immediate | Gradual | Gradual | |||||||||||||||||||||||||
| Net interest income | 1.30 | % | .19% | * | % | (.02 | )% | .08 | % | (.34 | )% | * | % | (1.91 | )% | |||||||||||||||||
| Rate sensitive income | .74 | % | .01% | * | % | (.54 | )% | .20 | % | (.55 | )% | * | % | (2.57 | )% | |||||||||||||||||
Market Value of Equity ModelingThe Company also utilizes the market value of equity as a measurement tool in managing interest rate sensitivity. The market value of equity measures the degree to which the market values of the Company’s assets and liabilities and off-balance sheet instruments will change given a change in interest rates. ALPC guidelines limit the change in market value of equity in a 200 basis point parallel rate shock to 15 percent of the market value of equity assuming interest rates at December 31, 2003. Given the low level of current interest rates, the down 200 basis point scenario cannot be computed.2004. The up 200 basis point scenario resulted in a 3.12.7 percent decrease in the market value of equity at December 31, 2003,2004, compared with a 2.53.1 percent decrease at December 31, 2002.2003. The down 200 basis point scenario resulted in a 4.2 percent decrease in the market value of equity at December 31, 2004. Given the low level of interest rates, the down 200 basis point scenario was not computed for December 31, 2003. ALPC reviews other down rate scenarios to evaluate the impact of falling interest rates. The down 100 basis point scenario resulted in a ..7 percent decrease at December 31, 2004, and a 1.3 percent increase at December 31, 2003, and a 1.0 percent decrease at December 31, 2002.2003. At December 31, 20032004 and 2002,2003, the Company was within its policy guidelines.
Use of Derivatives to Manage Interest Rate RiskIn the ordinary course of business, the Company enters into derivative transactions to manage its interest rate, prepayment and prepayment riskforeign currency risks (“asset and liability management positions”) and to accommodate the business requirements of its customers (“customer-related positions”). To manage its interest rate risk, the Company may enter into interest rate swap agreements and interest rate options such as caps and floors. Interest rate swaps involve the exchange of fixed-rate and variable-rate payments without the exchange of the underlying notional amount on which the interest payments are calculated. Interest rate caps protect against rising interest rates while
| Table 17 | Derivative Positions |
Asset and Liability Management Positions
| Weighted- | |||||||||||||||||||||||||||||||||||||||
| Maturing | Average | ||||||||||||||||||||||||||||||||||||||
| Remaining | |||||||||||||||||||||||||||||||||||||||
| December 31, 2004 | Fair | Maturity | |||||||||||||||||||||||||||||||||||||
| (Dollars in Millions) | 2005 | 2006 | 2007 | 2008 | 2009 | Thereafter | Total | Value | In Years | ||||||||||||||||||||||||||||||
Interest rate contracts | |||||||||||||||||||||||||||||||||||||||
| Receive fixed/pay floating swaps | |||||||||||||||||||||||||||||||||||||||
| Notional amount | $ | 2,750 | $ | 2,750 | $ | 3,520 | $ | 5,000 | $ | 1,750 | $ | 4,300 | $ | 20,070 | $ | 379 | 5.25 | ||||||||||||||||||||||
| Weighted-average | |||||||||||||||||||||||||||||||||||||||
| Receive rate | 3.75 | % | 3.67 | % | 3.76 | % | 3.78 | % | 4.62 | % | 6.29 | % | 4.37 | % | |||||||||||||||||||||||||
| Pay rate | 2.28 | 2.36 | 2.39 | 2.31 | 2.39 | 2.74 | 2.42 | ||||||||||||||||||||||||||||||||
| Pay fixed/receive floating swaps | |||||||||||||||||||||||||||||||||||||||
| Notional amount | $ | 5,425 | $ | 2,950 | $ | 2,400 | $ | — | $ | — | $ | — | $ | 10,775 | $ | 56 | 1.42 | ||||||||||||||||||||||
| Weighted-average | |||||||||||||||||||||||||||||||||||||||
| Receive rate | 2.38 | % | 2.24 | % | 2.47 | % | — | % | — | % | — | % | 2.36 | % | |||||||||||||||||||||||||
| Pay rate | 2.21 | 2.64 | 3.36 | — | — | — | 2.58 | ||||||||||||||||||||||||||||||||
| Futures and forwards | $ | 2,262 | $ | — | $ | — | $ | — | $ | — | $ | — | $ | 2,262 | $ | (4 | ) | .12 | |||||||||||||||||||||
| Options | |||||||||||||||||||||||||||||||||||||||
| Written | 1,039 | 20 | — | — | — | — | 1,059 | $ | 1 | .15 | |||||||||||||||||||||||||||||
Foreign exchange forward contracts | $ | 314 | $ | — | $ | — | $ | — | $ | — | $ | — | $ | 314 | $ | (12 | ) | .04 | |||||||||||||||||||||
Equity contracts | $ | — | $ | — | $ | — | $ | — | $ | 53 | $ | — | $ | 53 | $ | 4 | 4.29 | ||||||||||||||||||||||
Customer-related Positions
| Weighted- | ||||||||||||||||||||||||||||||||||||||
| Maturing | Average | |||||||||||||||||||||||||||||||||||||
| Remaining | ||||||||||||||||||||||||||||||||||||||
| December 31, 2004 | Fair | Maturity | ||||||||||||||||||||||||||||||||||||
| (Dollars in Millions) | 2005 | 2006 | 2007 | 2008 | 2009 | Thereafter | Total | Value | In Years | |||||||||||||||||||||||||||||
Interest rate contracts | ||||||||||||||||||||||||||||||||||||||
| Receive fixed/pay floating swaps | ||||||||||||||||||||||||||||||||||||||
| Notional amount | $ | 671 | $ | 1,069 | $ | 1,018 | $ | 1,171 | $ | 613 | $ | 2,166 | $ | 6,708 | $ | 76 | 4.67 | |||||||||||||||||||||
| Pay fixed/receive floating swaps | ||||||||||||||||||||||||||||||||||||||
| Notional amount | 671 | 1,067 | 1,006 | 1,159 | 613 | 2,166 | 6,682 | (40 | ) | 4.67 | ||||||||||||||||||||||||||||
| Options | ||||||||||||||||||||||||||||||||||||||
| Purchased | 91 | 242 | 362 | 157 | 72 | 175 | 1,099 | 7 | 3.00 | |||||||||||||||||||||||||||||
| Written | 91 | 242 | 362 | 157 | 72 | 175 | 1,099 | (7 | ) | 3.00 | ||||||||||||||||||||||||||||
| Risk participation agreements | ||||||||||||||||||||||||||||||||||||||
| Purchased | 27 | 5 | 32 | 9 | 21 | 43 | 137 | — | 7.13 | |||||||||||||||||||||||||||||
| Written | 16 | 22 | — | 25 | 17 | 4 | 84 | — | 2.93 | |||||||||||||||||||||||||||||
Foreign exchange rate contracts | ||||||||||||||||||||||||||||||||||||||
| Swaps and forwards | ||||||||||||||||||||||||||||||||||||||
| Buy | $ | 1,957 | $ | 47 | $ | 34 | $ | 7 | $ | 2 | $ | — | $ | 2,047 | $ | 80 | .31 | |||||||||||||||||||||
| Sell | 1,917 | 54 | 35 | 8 | 1 | — | 2,015 | (76 | ) | .33 | ||||||||||||||||||||||||||||
| Options | ||||||||||||||||||||||||||||||||||||||
| Purchased | 77 | — | — | — | — | — | 77 | 1 | .59 | |||||||||||||||||||||||||||||
| Written | 77 | — | — | — | — | — | 77 | (1 | ) | .59 | ||||||||||||||||||||||||||||
Asset and Liability Management Positions
| Weighted- | |||||||||||||||||||||||||||||||||||||||
| Maturing | Average | ||||||||||||||||||||||||||||||||||||||
| Remaining | |||||||||||||||||||||||||||||||||||||||
| December 31, 2003 | Fair | Maturity | |||||||||||||||||||||||||||||||||||||
| (Dollars in Millions) | 2004 | 2005 | 2006 | 2007 | 2008 | Thereafter | Total | Value | In Years | ||||||||||||||||||||||||||||||
Interest rate contracts | |||||||||||||||||||||||||||||||||||||||
| Receive fixed/pay floating swaps | |||||||||||||||||||||||||||||||||||||||
| Notional amount | $ | 13,073 | $ | — | $ | 500 | $ | 1,720 | $ | 3,750 | $ | 4,150 | $ | 23,193 | $ | 691 | 4.17 | ||||||||||||||||||||||
| Weighted-average | |||||||||||||||||||||||||||||||||||||||
| Receive rate | 4.22 | % | — | 2.37 | % | 3.96 | % | 3.90 | % | 6.60 | % | 4.54 | % | ||||||||||||||||||||||||||
| Pay rate | 1.19 | — | 1.17 | 1.20 | 1.16 | 1.67 | 1.27 | ||||||||||||||||||||||||||||||||
| Pay fixed/receive floating swaps | |||||||||||||||||||||||||||||||||||||||
| Notional amount | $ | 2,700 | $ | 2,390 | $ | 250 | $ | — | $ | — | $ | — | $ | 5,340 | $ | (60 | ) | 1.25 | |||||||||||||||||||||
| Weighted-average | |||||||||||||||||||||||||||||||||||||||
| Receive rate | 1.13 | % | 1.17 | % | 1.19 | % | — | — | — | 1.15 | % | ||||||||||||||||||||||||||||
| Pay rate | 3.15 | 2.56 | 2.73 | — | — | — | 2.86 | ||||||||||||||||||||||||||||||||
| Futures and forwards | $ | 2,229 | $ | — | $ | — | $ | — | $ | — | $ | — | $ | 2,229 | $ | — | .16 | ||||||||||||||||||||||
| Options | |||||||||||||||||||||||||||||||||||||||
| Written | 995 | — | 20 | — | — | — | 1,015 | 1 | .21 | ||||||||||||||||||||||||||||||
Equity contracts | $ | — | $ | 3 | $ | — | $ | — | $ | — | $ | — | $ | 3 | $ | — | 1.92 | ||||||||||||||||||||||
Customer-related Positions
| Weighted- | ||||||||||||||||||||||||||||||||||||||
| Maturing | Average | |||||||||||||||||||||||||||||||||||||
| Remaining | ||||||||||||||||||||||||||||||||||||||
| December 31, 2003 | Fair | Maturity | ||||||||||||||||||||||||||||||||||||
| (Dollars in Millions) | 2004 | 2005 | 2006 | 2007 | 2008 | Thereafter | Total | Value | in Years | |||||||||||||||||||||||||||||
Interest rate contracts | ||||||||||||||||||||||||||||||||||||||
| Receive fixed/pay floating swaps | ||||||||||||||||||||||||||||||||||||||
| Notional amount | $ | 615 | $ | 871 | $ | 1,195 | $ | 628 | $ | 1,083 | $ | 1,434 | $ | 5,826 | $ | 155 | 4.50 | |||||||||||||||||||||
| Pay fixed/receive floating swaps | ||||||||||||||||||||||||||||||||||||||
| Notional amount | 615 | 871 | 1,195 | 628 | 1,083 | 1,434 | 5,826 | (124 | ) | 4.50 | ||||||||||||||||||||||||||||
| Basis swaps | 1 | — | — | — | — | — | 1 | — | .67 | |||||||||||||||||||||||||||||
| Options | ||||||||||||||||||||||||||||||||||||||
| Purchased | 30 | 40 | 42 | 62 | 161 | 42 | 377 | 9 | 3.75 | |||||||||||||||||||||||||||||
| Written | 30 | 40 | 42 | 62 | 161 | 42 | 377 | (9 | ) | 3.75 | ||||||||||||||||||||||||||||
| Risk participation agreements | ||||||||||||||||||||||||||||||||||||||
| Purchased | 15 | 62 | 1 | 3 | 11 | 35 | 127 | — | 7.08 | |||||||||||||||||||||||||||||
| Written | — | 17 | 22 | — | 25 | — | 64 | — | 3.14 | |||||||||||||||||||||||||||||
Foreign exchange rate contracts | ||||||||||||||||||||||||||||||||||||||
| Swaps and forwards | ||||||||||||||||||||||||||||||||||||||
| Buy | $ | 1,868 | $ | 104 | $ | — | $ | — | $ | — | $ | — | $ | 1,972 | $ | 95 | .55 | |||||||||||||||||||||
| Sell | 1,902 | 106 | — | — | — | — | 2,008 | (93 | ) | .55 | ||||||||||||||||||||||||||||
| Options | ||||||||||||||||||||||||||||||||||||||
| Purchased | 20 | — | — | — | — | — | 20 | — | .29 | |||||||||||||||||||||||||||||
| Written | 20 | — | — | — | — | — | 20 | — | .29 | |||||||||||||||||||||||||||||
Market Risk ManagementIn addition to interest rate risk, the Company is exposed to other forms of market risk as a consequence of conducting normal trading activities. Business activities that contribute to market risk include, among other things, proprietary trading and foreign exchange positions. Value at Risk (“VaR”) is a key measure of market risk for the Company. Theoretically, VaR represents the maximum amount that the Company has placed at risk of loss, with a ninety-ninth percentile degree of confidence, to adverse market movements in the course of its risk taking activities.
| Table 18 | Debt Ratings |
| Standard & | |||||||||||||
| Moody’s | Poor’s | Fitch | |||||||||||
U.S. Bancorp | |||||||||||||
| Short-term borrowings | F1+ | ||||||||||||
| Senior debt and medium-term notes | Aa2 | A+ | AA- | ||||||||||
| Subordinated debt | Aa3 | A | A+ | ||||||||||
| Preferred stock | A1 | A- | A+ | ||||||||||
| Commercial paper | P-1 | A-1 | F1+ | ||||||||||
U.S. Bank National Association | |||||||||||||
| Short-term time deposits | P-1 | A-1+ | F1+ | ||||||||||
| Long-term time deposits | Aa1 | AA- | AA | ||||||||||
| Bank notes | Aa1/P-1 | AA-/A-1+ | AA-/F1+ | ||||||||||
| Subordinated debt | Aa2 | A+ | A+ | ||||||||||
| Commercial paper | P-1 | A-1+ | F1+ | ||||||||||
Liquidity Risk ManagementALPC establishes policies, as well as analyzes and manages liquidity, to ensure that adequate funds are available to meet normal operating requirements in addition to unexpected customer demands for funds, such as high levels of deposit withdrawals or loan demand, in a timely and cost-effective manner. The most important factor in the preservation of liquidity is maintaining public confidence that facilitates the retention and growth of a large, stable supply of core deposits and wholesale funds. Ultimately, public confidence is generated through profitable operations, sound credit quality and a strong capital position. The Company’s performance in these areas has enabled it to develop a large and reliable base of core funding within its market areas and in domestic and global capital markets. Liquidity management is viewed from long-term and short-term perspectives, as well as from an asset and liability perspective. Management monitors liquidity through a regular review of maturity profiles, funding sources, and loan and deposit forecasts to minimize funding risk.
Off-Balance Sheet ArrangementsOff-balance sheet arrangements include any contractual arrangement to which an unconsolidated entity is a party, under which the Company has an obligation to provide credit or liquidity enhancements or market risk support. Off-balance sheet arrangements include certain defined guarantees, asset securitization trusts and conduits. Off-balance sheet arrangements also include any obligation under a variable interest held by an unconsolidated entity that provides financing, liquidity, or credit enhancement or market risk support to the Company.support.
| Table 19 | Contractual Obligations |
| Payments Due By Period | Payments Due By Period | |||||||||||||||||||||||||||||||||||||||||
| Over One | Over Three | Over One | Over Three | |||||||||||||||||||||||||||||||||||||||
| One Year | Through | Through | Over Five | One Year | Through | Through | Over Five | |||||||||||||||||||||||||||||||||||
| (Dollars in Millions) | (Dollars in Millions) | or Less | Three Years | Five Years | Years | Total | (Dollars in Millions) | or Less | Three Years | Five Years | Years | Total | ||||||||||||||||||||||||||||||
Contractual Obligations | Contractual Obligations | Contractual Obligations | ||||||||||||||||||||||||||||||||||||||||
| Long-term debt (a) | $ | 9,989 | $ | 10,932 | $ | 5,876 | $ | 4,418 | $ | 31,215 | Long-term debt (a) | $ | 11,932 | $ | 12,128 | $ | 3,239 | $ | 7,440 | $ | 34,739 | |||||||||||||||||||||
| Trust preferred securities (a) | — | — | — | 2,601 | 2,601 | Capital leases | 8 | 14 | 12 | 33 | 67 | |||||||||||||||||||||||||||||||
| Capital leases | 9 | 15 | 13 | 38 | 75 | Operating leases | 198 | 351 | 273 | 596 | 1,418 | |||||||||||||||||||||||||||||||
| Operating leases | 182 | 308 | 242 | 516 | 1,248 | Purchase obligations | 146 | 125 | 28 | — | 299 | |||||||||||||||||||||||||||||||
| Purchase obligations | 166 | 227 | 36 | 4 | 433 | Benefit obligations (b) | 43 | 85 | 89 | 223 | 440 | |||||||||||||||||||||||||||||||
| Benefit obligations (b) | 47 | 101 | 109 | 308 | 565 | |||||||||||||||||||||||||||||||||||||
| (a) | In the banking industry, interest-bearing obligations are principally utilized to fund interest-bearing assets. As such, interest charges on related contractual obligations were excluded from reported amounts as the potential cash outflows would have corresponding cash inflows from interest-bearing assets. |
| (b) | Amounts only include obligations related to the unfunded non-qualified pension plan and post-retirement medical plans. |
Capital ManagementThe Company is committed to managing capital for maximum shareholder benefit and maintaining strong protection for depositors and creditors. The Company has targeted returning 80 percent of earnings to our shareholders through a combination of dividends and share repurchases. In keeping with this target, the Company returned 109 percent of earnings in 2004. The Company continually assesses its business risks and capital position. The Company also manages its capital to exceed regulatory capital requirements for well-capitalized bank holding companies. To achieve these capital goals, the Company employs a variety of capital management tools including dividends, common share repurchases, and the issuance of subordinated debt and other capital instruments. Total shareholders’ equity was $19.5 billion at December 31, 2004, compared with $19.2 billion at December 31, 2003, compared with $18.4 billion at December 31, 2002.2003. The increase was the result of corporate earnings and option exercises, offset primarily by the payment of dividends including the special dividend of $685 million related to the spin-off of Piper Jaffray, and the repurchase of common stock.
| Table 20 | Regulatory Capital Ratios |
| At December 31 (Dollars in millions) | 2003 | 2002 | ||||||||||||||||||
| At December 31 (Dollars in Millions) | At December 31 (Dollars in Millions) | 2004 | 2003 | |||||||||||||||||
U.S. Bancorp | U.S. Bancorp | U.S. Bancorp | ||||||||||||||||||
| Tangible common equity | Tangible common equity | $ | 11,858 | $ | 9,824 | Tangible common equity | $ | 11,950 | $ | 11,858 | ||||||||||
| As a percent of tangible assets | 6.5 | % | 5.7 | % | As a percent of tangible assets | 6.4 | % | 6.5 | % | |||||||||||
| Tier 1 capital | Tier 1 capital | $ | 14,623 | $ | 12,941 | Tier 1 capital | $ | 14,720 | $ | 14,623 | ||||||||||
| As a percent of risk-weighted assets | 9.1 | % | 8.0 | % | As a percent of risk-weighted assets | 8.6 | % | 9.1 | % | |||||||||||
| As a percent of adjusted quarterly average assets (leverage ratio) | 8.0 | % | 7.7 | % | As a percent of adjusted quarterly average assets (leverage ratio) | 7.9 | % | 8.0 | % | |||||||||||
| Total risk-based capital | Total risk-based capital | $ | 21,710 | $ | 20,088 | Total risk-based capital | $ | 22,352 | $ | 21,710 | ||||||||||
| As a percent of risk-weighted assets | 13.6 | % | 12.4 | % | As a percent of risk-weighted assets | 13.1 | % | 13.6 | % | |||||||||||
Bank Subsidiaries | Bank Subsidiaries | Bank Subsidiaries | ||||||||||||||||||
U.S. Bank National Association | U.S. Bank National Association | |||||||||||||||||||
| Tier 1 capital | 6.6 | % | 6.7 | % | Tier 1 capital | 6.5 | % | 6.6 | % | |||||||||||
| Total risk-based capital | 10.8 | 10.8 | Total risk-based capital | 10.9 | 10.8 | |||||||||||||||
| Leverage | 6.3 | 6.7 | Leverage | 5.9 | 6.3 | |||||||||||||||
U.S. Bank National Association ND | U.S. Bank National Association ND | |||||||||||||||||||
| Tier 1 capital | 13.1 | % | 13.4 | % | Tier 1 capital | 12.7 | % | 13.1 | % | |||||||||||
| Total risk-based capital | 18.0 | 18.9 | Total risk-based capital | 17.2 | 18.0 | |||||||||||||||
| Leverage | 11.0 | 12.1 | Leverage | 10.8 | 11.0 | |||||||||||||||
Bank Regulatory Capital Requirements | Bank Regulatory Capital Requirements | Minimum | Well- Capitalized | Bank Regulatory Capital Requirements | Minimum | Well- Capitalized | ||||||||||||||
| Tier 1 capital | 4.0 | % | 6.0 | % | Tier 1 capital | 4.0 | % | 6.0 | % | |||||||||||
| Total risk-based capital | 8.0 | 10.0 | Total risk-based capital | 8.0 | 10.0 | |||||||||||||||
| Leverage | 4.0 | 5.0 | Leverage | 4.0 | 5.0 | |||||||||||||||
| Number of | Average | Remaining Shares | ||||||||||
| Shares | Price Paid | Available to be | ||||||||||
| Time Period | Purchased | per Share | Purchased | |||||||||
| October (a) | 4,316,098 | $ | 28.74 | 63,615,584 | ||||||||
| November (a) | 6,044,285 | 29.74 | 57,571,299 | |||||||||
| December (b) | 9,345,786 | 30.53 | 144,959,788 | |||||||||
| Total | 19,706,169 | $ | 29.90 | 144,959,788 | ||||||||
| (a) | |
| (b) | For the |
FOURTH QUARTER SUMMARY
The Company reported net income of $977.0$1,056.0 million for the fourth quarter of 2003,2004, or $.50$.56 per diluted share, compared with $819.7$977.0 million, or $.43$.50 per diluted share, for the fourth quarter of 2002.2003. Return on average assets and return on average equity were 2.16 percent and 21.2 percent, respectively, for the fourth quarter of 2004, compared with returns of 2.05 percent and 19.4 percent, respectively, for the fourth quarter of 2003, compared with returns of 1.83 percent and 17.8 percent, respectively, for the fourth quarter of 2002.2003. The Company’s results for the fourth quarter of 20032004 improved over the fourth quarter of 2002,2003, primarily due to lower credit costs and growth in net interest income and fee-based products and services, as well as controlled operating expense and lower credit costs.services. Net income from continuing operations was $970.3$1,056.0 million, or $.50$.56 per diluted share, compared with $858.6$970.3 million, or $.45$.50 per diluted share for the fourth quarter of 2002,2003, representing an 11.18.8 percent annual growth rate. Net income for the fourth quarter of 2003 also included after-tax merger and restructuring-related items of $5.0 million ($7.6 million on a pre-tax basis), compared with after-tax merger and restructuring-related items of $69.9 million ($107.3 million on a pre-tax basis) for the fourth quarter of 2002. The $99.7 million decline in pre-tax merger and restructuring-related charges was primarily due to the completion of integration activities associated with the merger of Firstar and USBM at the end of 2002..
| Table 21 | Fourth Quarter Summary |
| Three Months Ended | Three Months Ended | |||||||||||||||||
| December 31, | December 31, | |||||||||||||||||
| (In Millions, Except Per Share Data) | (In Millions, Except Per Share Data) | 2003 | 2002 | (In Millions, Except Per Share Data) | 2004 | 2003 | ||||||||||||
Condensed Income Statement | Condensed Income Statement | Condensed Income Statement | ||||||||||||||||
| Net interest income (taxable-equivalent basis) (a) | Net interest income (taxable-equivalent basis) (a) | $ | 1,816.7 | $ | 1,765.3 | Net interest income (taxable-equivalent basis) (a) | $ | 1,799.8 | $ | 1,816.7 | ||||||||
| Noninterest income | Noninterest income | 1,296.7 | 1,279.5 | Noninterest income | 1,455.7 | 1,296.7 | ||||||||||||
| Securities gains (losses), net | Securities gains (losses), net | (.1 | ) | 106.2 | Securities gains (losses), net | (20.5 | ) | (.1 | ) | |||||||||
| Total net revenue | 3,113.3 | 3,151.0 | Total net revenue | 3,235.0 | 3,113.3 | |||||||||||||
| Noninterest expense | Noninterest expense | 1,342.4 | 1,486.6 | Noninterest expense | 1,578.0 | 1,342.4 | ||||||||||||
| Provision for credit losses | Provision for credit losses | 286.0 | 349.0 | Provision for credit losses | 65.0 | 286.0 | ||||||||||||
| Income from continuing operations before taxes | 1,484.9 | 1,315.4 | Income from continuing operations before taxes | 1,592.0 | 1,484.9 | |||||||||||||
| Taxable-equivalent adjustment | Taxable-equivalent adjustment | 7.2 | 7.7 | Taxable-equivalent adjustment | 7.3 | 7.2 | ||||||||||||
| Applicable income taxes | Applicable income taxes | 507.4 | 449.1 | Applicable income taxes | 528.7 | 507.4 | ||||||||||||
| Income from continuing operations | 970.3 | 858.6 | Income from continuing operations | 1,056.0 | 970.3 | |||||||||||||
| Discontinued operations (after-tax) | Discontinued operations (after-tax) | 6.7 | (38.9 | ) | Discontinued operations (after-tax) | — | 6.7 | |||||||||||
| Net income | $ | 977.0 | $ | 819.7 | Net income | $ | 1,056.0 | $ | 977.0 | |||||||||
Per Common Share | Per Common Share | Per Common Share | ||||||||||||||||
| Earnings per share | Earnings per share | $ | .51 | $ | .43 | Earnings per share | $ | .57 | $ | .51 | ||||||||
| Diluted earnings per share | Diluted earnings per share | .50 | .43 | Diluted earnings per share | .56 | .50 | ||||||||||||
| Dividends declared per share | Dividends declared per share | .240 | .195 | Dividends declared per share | .30 | .24 | ||||||||||||
| Average shares outstanding | 1,927.3 | 1,916.2 | ||||||||||||||||
| Average diluted shares outstanding | 1,950.8 | 1,923.6 | ||||||||||||||||
| Average common shares outstanding | Average common shares outstanding | 1,865.0 | 1,927.3 | |||||||||||||||
| Average diluted common shares outstanding | Average diluted common shares outstanding | 1,893.8 | 1,950.8 | |||||||||||||||
Financial Ratios | Financial Ratios | Financial Ratios | ||||||||||||||||
| Return on average assets | Return on average assets | 2.05 | % | 1.83 | % | Return on average assets | 2.16 | % | 2.05 | % | ||||||||
| Return on average equity | Return on average equity | 19.4 | 17.8 | Return on average equity | 21.2 | 19.4 | ||||||||||||
| Net interest margin (taxable-equivalent basis) | Net interest margin (taxable-equivalent basis) | 4.42 | 4.65 | Net interest margin (taxable-equivalent basis) | 4.20 | 4.42 | ||||||||||||
| Efficiency ratio (b) | Efficiency ratio (b) | 43.1 | 48.8 | Efficiency ratio (b) | 48.5 | 43.1 | ||||||||||||
| (a) | Interest and rates are presented on a fully taxable-equivalent basis utilizing a tax rate of 35 percent. |
| (b) | Computed as noninterest expense divided by the sum of net interest income on a taxable-equivalent basis and noninterest income excluding securities gains (losses), net. |
LINE OF BUSINESS FINANCIAL REVIEW
Within the Company, financial performance is measured by major lines of business, which include Wholesale Banking, Consumer Banking, Private Client, Trust and Asset Management, Payment Services, and Treasury and Corporate Support. These operating segments are components of the Company about which financial information is available and is evaluated regularly in deciding how to allocate resources and assess performance.
Basis for Financial PresentationBusiness line results are derived from the Company’s business unit profitability reporting systems by specifically attributing managed balance sheet assets, deposits and other liabilities and their related income or expense. Funds transfer-pricing methodologies are utilized to allocate a cost of funds used or credit for funds provided to all business line assets and liabilities using a matched funding concept. Also, the business unit is allocated the taxable-equivalent benefit of tax-exempt products. Noninterest income and expenses directly managed by each business line, including fees, service charges, salaries and benefits, and other direct costs are accounted for within each segment’s financial results in a manner similar to the consolidated financial statements. Occupancy costs are allocated based on utilization of facilities by the lines of business. Noninterest expenses incurred by centrally managed operations or business lines that directly support another business line’s operations are not charged to the applicable business line.line based on its utilization of those services primarily measured by the volume of customer activities. These allocated expenses are reported as net shared services expense. Certain corporate activities that do not directly support the operations of the lines of business are not charged to the lines of business. Goodwill and other intangible assets are assigned to the lines of business based on the mix of business of the acquired entity. The provision for credit losses within the Wholesale Banking, Consumer Banking, Private Client, Trust and Asset Management and Payment Services lines of business is based on net charge-offs, while Treasury and Corporate Support reflects the residual component of the Company’s total consolidated provision for credit losses determined in accordance with accounting principles generally accepted in the United States. Income taxes are assessed to each line of business at a standard tax rate with the residual tax expense or benefit to arrive at the consolidated effective tax rate included in Treasury and Corporate Support. Merger and restructuring-related charges, discontinued operations and cumulative effects of changes in accounting principles are not identified by or allocated to lines of business. Within the Company, capital levels are evaluated and managed centrally; however, capital is allocated to the operating segments to support evaluation of business performance. Capital allocations to the business lines are based on the amount of goodwill and other intangibles, the extent of off-balance sheet managed assets and lending commitments and the ratio of on-balance sheet assets relative to the total Company. Certain lines of business, such as trust, asset managementTrust and capital markets,Asset Management, have no significant balance sheet components. For these business
Wholesale Bankingoffers lending, depository, treasury management and other financial services to middle market, large corporate and public sector clients. Wholesale Banking contributed $1,195.3$1,079.6 million of the Company’s operating earnings in 20032004 and $1,115.7$850.3 million in 2002.2003. The increase in operating earnings in 20032004 was driven by slightly higher net revenue and reductions in noninterest expense andthe provision for credit losses and total noninterest expense, partially offset by a decline in total net revenue, compared with 2002.2003.
Consumer Bankingdelivers products and services to the broad consumer market and small businesses through banking offices, telemarketing, on-line services, direct mail and automated teller machines (“ATMs”). It encompasses community banking, metropolitan banking, small business banking, including lending guaranteed by the Small Business Administration, small-ticket leasing, consumer lending, mortgage banking, workplace banking, student banking, 24-hour banking and investment product and insurance sales. Consumer Banking contributed $1,688.4$1,465.0 million of the Company’s operating earnings for 20032004 and $1,521.0$1,333.7 million for 2002, an 11.02003, a 9.8 percent increase over 2002.2003. The increase in operating earnings in 20032004 was driven by higher net revenuestrong fee-based revenues, lower noninterest expense and reductions in the provision for credit losses, offset by increases in noninterest expense, compared with 2002.2003. Within Consumer Banking, the retail banking business grew operating earnings by 23.1 percent, offset somewhat by a lower contribution from the mortgage banking business, compared with the same periods of 2003.
| Table 22 | Line of Business Financial Performance |
| Wholesale | Consumer | |||||||||||||||||||||||||
| Banking | Banking | |||||||||||||||||||||||||
| Percent | Percent | |||||||||||||||||||||||||
| Year Ended December 31 (Dollars in Millions) | 2004 | 2003 | Change | 2004 | 2003 | Change | ||||||||||||||||||||
Condensed Income Statement | ||||||||||||||||||||||||||
| Net interest income (taxable-equivalent basis) | $ | 1,611.6 | $ | 1,667.5 | (3.4 | )% | $ | 3,636.5 | $ | 3,578.7 | 1.6 | % | ||||||||||||||
| Noninterest income | 750.1 | 760.9 | (1.4 | ) | 1,794.2 | 1,550.4 | 15.7 | |||||||||||||||||||
| Securities gains (losses), net | 1.5 | — | * | (83.8 | ) | 193.4 | * | |||||||||||||||||||
| Total net revenue | 2,363.2 | 2,428.4 | (2.7 | ) | 5,346.9 | 5,322.5 | .5 | |||||||||||||||||||
| Noninterest expense | 625.2 | 666.6 | (6.2 | ) | 2,364.4 | 2,361.9 | .1 | |||||||||||||||||||
| Other intangibles | 18.3 | 19.5 | (6.2 | ) | 304.4 | 432.7 | (29.7 | ) | ||||||||||||||||||
| Total noninterest expense | 643.5 | 686.1 | (6.2 | ) | 2,668.8 | 2,794.6 | (4.5 | ) | ||||||||||||||||||
| Operating earnings before provision and income taxes | 1,719.7 | 1,742.3 | (1.3 | ) | 2,678.1 | 2,527.9 | 5.9 | |||||||||||||||||||
| Provision for credit losses | 22.6 | 405.5 | (94.4 | ) | 375.1 | 431.1 | (13.0 | ) | ||||||||||||||||||
| Operating earnings before income taxes | 1,697.1 | 1,336.8 | 27.0 | 2,303.0 | 2,096.8 | 9.8 | ||||||||||||||||||||
| Income taxes and taxable-equivalent adjustment | 617.5 | 486.5 | 26.9 | 838.0 | 763.1 | 9.8 | ||||||||||||||||||||
| Operating earnings | $ | 1,079.6 | $ | 850.3 | 27.0 | $ | 1,465.0 | $ | 1,333.7 | 9.8 | ||||||||||||||||
| Merger and restructuring-related items (after-tax) | ||||||||||||||||||||||||||
| Discontinued operations (after-tax) | ||||||||||||||||||||||||||
| Net income | ||||||||||||||||||||||||||
Average Balance Sheet Data | ||||||||||||||||||||||||||
| Commercial | $ | 26,674 | $ | 28,195 | (5.4) | % | $ | 7,774 | $ | 8,220 | (5.4 | )% | ||||||||||||||
| Commercial real estate | 15,918 | 16,393 | (2.9 | ) | 10,603 | 9,974 | 6.3 | |||||||||||||||||||
| Residential mortgages | 72 | 116 | (37.9 | ) | 13,918 | 11,315 | 23.0 | |||||||||||||||||||
| Retail | 52 | 52 | — | 31,327 | 29,005 | 8.0 | ||||||||||||||||||||
| Total loans | 42,716 | 44,756 | (4.6 | ) | 63,622 | 58,514 | 8.7 | |||||||||||||||||||
| Goodwill | 1,225 | 1,227 | (.2 | ) | 2,242 | 2,242 | — | |||||||||||||||||||
| Other intangible assets | 88 | 107 | (17.8 | ) | 1,073 | 936 | 14.6 | |||||||||||||||||||
| Assets | 49,045 | 51,696 | (5.1 | ) | 71,581 | 68,373 | 4.7 | |||||||||||||||||||
| Noninterest-bearing deposits | 12,722 | 14,775 | (13.9 | ) | 13,977 | 13,756 | 1.6 | |||||||||||||||||||
| Savings products | 9,830 | 11,057 | (11.1 | ) | 41,929 | 40,107 | 4.5 | |||||||||||||||||||
| Time deposits | 7,518 | 3,976 | 89.1 | 16,010 | 18,512 | (13.5 | ) | |||||||||||||||||||
| Total deposits | 30,070 | 29,808 | .9 | 71,916 | 72,375 | (.6 | ) | |||||||||||||||||||
| Shareholders’ equity | 5,081 | 5,046 | .7 | 6,225 | 5,878 | 5.9 | ||||||||||||||||||||
| Private Client, Trust | Payment | Treasury and | Consolidated | |||||||||||||||||||||||||||||||||||||||||||||
| and Asset Management | Services | Corporate Support | Company | |||||||||||||||||||||||||||||||||||||||||||||
| Percent | Percent | Percent | Percent | |||||||||||||||||||||||||||||||||||||||||||||
| 2004 | 2003 | Change | 2004 | 2003 | Change | 2004 | 2003 | Change | 2004 | 2003 | Change | |||||||||||||||||||||||||||||||||||||
| $ | 361.0 | $ | 311.9 | 15.7 | % | $ | 573.1 | $ | 605.1 | (5.3) | % | $ | 957.7 | $ | 1,054.3 | (9.2) | % | $ | 7,139.9 | $ | 7,217.5 | (1.1) | % | |||||||||||||||||||||||||
| 987.1 | 957.0 | 3.1 | 1,873.2 | 1,606.9 | 16.6 | 219.5 | 193.0 | 13.7 | 5,624.1 | 5,068.2 | 11.0 | |||||||||||||||||||||||||||||||||||||
| — | — | — | — | — | — | (22.6 | ) | 51.4 | * | (104.9 | ) | 244.8 | * | |||||||||||||||||||||||||||||||||||
| 1,348.1 | 1,268.9 | 6.2 | 2,446.3 | 2,212.0 | 10.6 | 1,154.6 | 1,298.7 | (11.1 | ) | 12,659.1 | 12,530.5 | 1.0 | ||||||||||||||||||||||||||||||||||||
| 585.0 | 585.3 | (.1 | ) | 797.3 | 704.1 | 13.2 | 862.5 | 550.4 | 56.7 | 5,234.4 | 4,868.3 | 7.5 | ||||||||||||||||||||||||||||||||||||
| 62.0 | 66.2 | (6.3 | ) | 159.9 | 158.2 | 1.1 | 5.5 | 5.8 | (5.2 | ) | 550.1 | 682.4 | (19.4 | ) | ||||||||||||||||||||||||||||||||||
| 647.0 | 651.5 | (.7 | ) | 957.2 | 862.3 | 11.0 | 868.0 | 556.2 | 56.1 | 5,784.5 | 5,550.7 | 4.2 | ||||||||||||||||||||||||||||||||||||
| 701.1 | 617.4 | 13.6 | 1,489.1 | 1,349.7 | 10.3 | 286.6 | 742.5 | (61.4 | ) | 6,874.6 | 6,979.8 | (1.5 | ) | |||||||||||||||||||||||||||||||||||
| 10.2 | 6.5 | 56.9 | 362.6 | 412.7 | (12.1 | ) | (100.9 | ) | (1.8 | ) | * | 669.6 | 1,254.0 | (46.6 | ) | |||||||||||||||||||||||||||||||||
| 690.9 | 610.9 | 13.1 | 1,126.5 | 937.0 | 20.2 | 387.5 | 744.3 | (47.9 | ) | 6,205.0 | 5,725.8 | 8.4 | ||||||||||||||||||||||||||||||||||||
| 251.4 | 222.3 | 13.1 | 410.0 | 341.0 | 20.2 | (78.7 | ) | 172.4 | * | 2,038.2 | 1,985.3 | 2.7 | ||||||||||||||||||||||||||||||||||||
| $ | 439.5 | $ | 388.6 | 13.1 | $ | 716.5 | $ | 596.0 | 20.2 | $ | 466.2 | $ | 571.9 | (18.5 | ) | 4,166.8 | 3,740.5 | 11.4 | ||||||||||||||||||||||||||||||
| — | (30.4 | ) | ||||||||||||||||||||||||||||||||||||||||||||||
| — | 22.5 | |||||||||||||||||||||||||||||||||||||||||||||||
| $ | 4,166.8 | $ | 3,732.6 | |||||||||||||||||||||||||||||||||||||||||||||
| $ | 1,641 | $ | 1,804 | (9.0 | )% | $ | 3,068 | $ | 2,898 | 5.9 | % | $ | 191 | $ | 209 | (8.6 | )% | $ | 39,348 | $ | 41,326 | (4.8 | )% | |||||||||||||||||||||||||
| 611 | 576 | 6.1 | — | — | — | 135 | 199 | (32.2 | ) | 27,267 | 27,142 | .5 | ||||||||||||||||||||||||||||||||||||
| 322 | 252 | 27.8 | — | — | — | 10 | 13 | (23.1 | ) | 14,322 | 11,696 | 22.5 | ||||||||||||||||||||||||||||||||||||
| 2,224 | 1,990 | 11.8 | 7,548 | 7,103 | 6.3 | 53 | 48 | 10.4 | 41,204 | 38,198 | 7.9 | |||||||||||||||||||||||||||||||||||||
| 4,798 | 4,622 | 3.8 | 10,616 | 10,001 | 6.1 | 389 | 469 | (17.1 | ) | 122,141 | 118,362 | 3.2 | ||||||||||||||||||||||||||||||||||||
| 818 | 740 | 10.5 | 1,868 | 1,814 | 3.0 | — | 305 | * | 6,153 | 6,328 | (2.8 | ) | ||||||||||||||||||||||||||||||||||||
| 352 | 399 | (11.8 | ) | 776 | 675 | 15.0 | 7 | 12 | (41.7 | ) | 2,296 | 2,129 | 7.8 | |||||||||||||||||||||||||||||||||||
| 6,563 | 6,407 | 2.4 | 13,764 | 13,397 | 2.7 | 50,640 | 47,757 | 6.0 | 191,593 | 187,630 | 2.1 | |||||||||||||||||||||||||||||||||||||
| 3,251 | 3,006 | 8.2 | 108 | 276 | (60.9 | ) | (242 | ) | (98 | ) | * | 29,816 | 31,715 | (6.0 | ) | |||||||||||||||||||||||||||||||||
| 7,861 | 5,852 | 34.3 | 11 | 10 | 10.0 | 22 | — | * | 59,653 | 57,026 | 4.6 | |||||||||||||||||||||||||||||||||||||
| 591 | 474 | 24.7 | — | — | — | 2,634 | 4,850 | (45.7 | ) | 26,753 | 27,812 | (3.8 | ) | |||||||||||||||||||||||||||||||||||
| 11,703 | 9,332 | 25.4 | 119 | 286 | (58.4 | ) | 2,414 | 4,752 | (49.2 | ) | 116,222 | 116,553 | (.3 | ) | ||||||||||||||||||||||||||||||||||
| 2,077 | 1,991 | 4.3 | 3,198 | 3,008 | 6.3 | 2,878 | 3,470 | (17.1 | ) | 19,459 | 19,393 | .3 | ||||||||||||||||||||||||||||||||||||
| Wholesale | Consumer | |||||||||||||||||||||||||
| Banking | Banking | |||||||||||||||||||||||||
| Percent | Percent | |||||||||||||||||||||||||
| Year Ended December 31 (Dollars in Millions) | 2003 | 2002 | Change | 2003 | 2002 | Change | ||||||||||||||||||||
Condensed Income Statement | ||||||||||||||||||||||||||
| Net interest income (taxable-equivalent basis) | $ | 1,877.9 | $ | 1,850.2 | 1.5 | % | $ | 3,634.7 | $ | 3,404.3 | 6.8 | % | ||||||||||||||
| Noninterest income | 753.0 | 731.8 | 2.9 | 1,460.1 | 1,417.7 | 3.0 | ||||||||||||||||||||
| Securities gains, net | — | — | — | 193.4 | 107.8 | 79.4 | ||||||||||||||||||||
| Total net revenue | 2,630.9 | 2,582.0 | 1.9 | 5,288.2 | 4,929.8 | 7.3 | ||||||||||||||||||||
| Noninterest expense | 331.1 | 362.9 | (8.8 | ) | 1,765.4 | 1,735.7 | 1.7 | |||||||||||||||||||
| Other intangibles | 19.5 | 20.6 | (5.3 | ) | 432.8 | 339.0 | 27.7 | |||||||||||||||||||
| Total noninterest expense | 350.6 | 383.5 | (8.6 | ) | 2,198.2 | 2,074.7 | 6.0 | |||||||||||||||||||
| Operating income (loss) | 2,280.3 | 2,198.5 | 3.7 | 3,090.0 | 2,855.1 | 8.2 | ||||||||||||||||||||
| Provision for credit losses | 401.1 | 444.5 | (9.8 | ) | 435.8 | 463.8 | (6.0 | ) | ||||||||||||||||||
| Operating earnings (loss), before income taxes | 1,879.2 | 1,754.0 | 7.1 | 2,654.2 | 2,391.3 | 11.0 | ||||||||||||||||||||
| Income taxes and taxable-equivalent adjustment | 683.9 | 638.3 | 7.1 | 965.8 | 870.3 | 11.0 | ||||||||||||||||||||
| Operating earnings (loss) | $ | 1,195.3 | $ | 1,115.7 | 7.1 | $ | 1,688.4 | $ | 1,521.0 | 11.0 | ||||||||||||||||
| Merger and restructuring-related items (after-tax) | ||||||||||||||||||||||||||
| Discontinued operations (after-tax) | ||||||||||||||||||||||||||
| Cumulative effect of accounting change (after-tax) | ||||||||||||||||||||||||||
| Net income | ||||||||||||||||||||||||||
Average Balance Sheet Data | ||||||||||||||||||||||||||
| Commercial | $ | 28,337 | $ | 30,015 | (5.6 | )% | $ | 8,100 | $ | 8,795 | (7.9 | )% | ||||||||||||||
| Commercial real estate | 16,414 | 15,908 | 3.2 | 9,936 | 9,010 | 10.3 | ||||||||||||||||||||
| Residential mortgages | 119 | 160 | (25.6 | ) | 11,265 | 8,013 | 40.6 | |||||||||||||||||||
| Retail | 57 | 130 | (56.2 | ) | 28,832 | 26,960 | 6.9 | |||||||||||||||||||
| Total loans | 44,927 | 46,213 | (2.8 | ) | 58,133 | 52,778 | 10.1 | |||||||||||||||||||
| Goodwill | 1,227 | 1,226 | .1 | 2,242 | 1,892 | 18.5 | ||||||||||||||||||||
| Other intangible assets | 107 | 127 | (15.7 | ) | 928 | 946 | (1.9 | ) | ||||||||||||||||||
| Assets | 51,775 | 52,572 | (1.5 | ) | 67,831 | 61,403 | 10.5 | |||||||||||||||||||
| Noninterest-bearing deposits | 14,738 | 12,993 | 13.4 | 13,748 | 12,939 | 6.3 | ||||||||||||||||||||
| Savings products | 10,227 | 5,556 | 84.1 | 40,769 | 35,803 | 13.9 | ||||||||||||||||||||
| Time deposits | 3,901 | 2,592 | 50.5 | 18,587 | 22,632 | (17.9 | ) | |||||||||||||||||||
| Total deposits | 28,866 | 21,141 | 36.5 | 73,104 | 71,374 | 2.4 | ||||||||||||||||||||
| Shareholders’ equity | 5,058 | 5,049 | .2 | 6,022 | 5,128 | 17.4 | ||||||||||||||||||||
* Not meaningful
Private Client, Trust and Asset Managementprovides trust, private banking, financial advisory, investment management and mutual fund and alternative investment product servicesservicing through five businesses: Private Client Group, Corporate Trust, Asset Management, Institutional Trust and Custody and Fund Services, LLC. Private Client, Trust and Asset Management contributed $506.5$439.5 million of the Company’s operating earnings in 2003,2004 and increase of 10.9 percent compared with 2002.
| Private Client, Trust | Payment | Treasury and | Consolidated | |||||||||||||||||||||||||||||||||||||||||||||
| and Asset Management | Services | Corporate Support | Company | |||||||||||||||||||||||||||||||||||||||||||||
| Percent | Percent | Percent | Percent | |||||||||||||||||||||||||||||||||||||||||||||
| 2003 | 2002 | Change | 2003 | 2002 | Change | 2003 | 2002 | Change | 2003 | 2002 | Change | |||||||||||||||||||||||||||||||||||||
| $ | 383.6 | $ | 323.0 | 18.8 | % | $ | 624.4 | $ | 675.6 | (7.6 | )% | $ | 696.9 | $ | 594.1 | 17.3 | % | $ | 7,217.5 | $ | 6,847.2 | 5.4 | % | |||||||||||||||||||||||||
| 968.4 | 901.5 | 7.4 | 1,692.3 | 1,676.8 | .9 | 194.4 | 183.0 | 6.2 | 5,068.2 | 4,910.8 | 3.2 | |||||||||||||||||||||||||||||||||||||
| — | — | — | — | — | — | 51.4 | 192.1 | (73.2 | ) | 244.8 | 299.9 | (18.4 | ) | |||||||||||||||||||||||||||||||||||
| 1,352.0 | 1,224.5 | 10.4 | 2,316.7 | 2,352.4 | (1.5 | ) | 942.7 | 969.2 | (2.7 | ) | 12,530.5 | 12,057.9 | 3.9 | |||||||||||||||||||||||||||||||||||
| 483.3 | 464.5 | 4.0 | 593.9 | 627.3 | (5.3 | ) | 1,694.6 | 1,675.9 | 1.1 | 4,868.3 | 4,866.3 | — | ||||||||||||||||||||||||||||||||||||
| 66.2 | 31.1 | * | 158.1 | 161.1 | (1.9 | ) | 5.8 | 1.2 | * | 682.4 | 553.0 | 23.4 | ||||||||||||||||||||||||||||||||||||
| 549.5 | 495.6 | 10.9 | 752.0 | 788.4 | (4.6 | ) | 1,700.4 | 1,677.1 | 1.4 | 5,550.7 | 5,419.3 | 2.4 | ||||||||||||||||||||||||||||||||||||
| 802.5 | 728.9 | 10.1 | 1,564.7 | 1,564.0 | — | (757.7 | ) | (707.9 | ) | (7.0 | ) | 6,979.8 | 6,638.6 | 5.1 | ||||||||||||||||||||||||||||||||||
| 6.2 | 11.0 | (43.6 | ) | 412.7 | 456.4 | (9.6 | ) | (1.8 | ) | (26.7 | ) | 93.3 | 1,254.0 | 1,349.0 | (7.0 | ) | ||||||||||||||||||||||||||||||||
| 796.3 | 717.9 | 10.9 | 1,152.0 | 1,107.6 | 4.0 | (755.9 | ) | (681.2 | ) | (11.0 | ) | 5,725.8 | 5,289.6 | 8.2 | ||||||||||||||||||||||||||||||||||
| 289.8 | 261.2 | 10.9 | 419.2 | 403.0 | 4.0 | (373.4 | ) | (320.5 | ) | (16.5 | ) | 1,985.3 | 1,852.3 | 7.2 | ||||||||||||||||||||||||||||||||||
| $ | 506.5 | $ | 456.7 | 10.9 | $ | 732.8 | $ | 704.6 | 4.0 | $ | (382.5 | ) | $ | (360.7 | ) | (6.0 | ) | 3,740.5 | 3,437.3 | 8.8 | ||||||||||||||||||||||||||||
| (30.4 | ) | (209.3 | ) | |||||||||||||||||||||||||||||||||||||||||||||
| 22.5 | (22.7 | ) | ||||||||||||||||||||||||||||||||||||||||||||||
| — | (37.2 | ) | ||||||||||||||||||||||||||||||||||||||||||||||
| $ | 3,732.6 | $ | 3,168.1 | |||||||||||||||||||||||||||||||||||||||||||||
| $ | 1,784 | $ | 1,819 | (1.9 | )% | $ | 2,887 | $ | 2,803 | 3.0 | % | $ | 218 | $ | 385 | (43.4 | )% | $ | 41,326 | $ | 43,817 | (5.7 | )% | |||||||||||||||||||||||||
| 594 | 591 | .5 | — | — | — | 198 | 214 | (7.5 | ) | 27,142 | 25,723 | 5.5 | ||||||||||||||||||||||||||||||||||||
| 299 | 231 | 29.4 | — | — | — | 13 | 8 | 62.5 | 11,696 | 8,412 | 39.0 | |||||||||||||||||||||||||||||||||||||
| 2,159 | 2,056 | 5.0 | 7,103 | 7,304 | (2.8 | ) | 47 | 51 | (7.8 | ) | 38,198 | 36,501 | 4.6 | |||||||||||||||||||||||||||||||||||
| 4,836 | 4,697 | 3.0 | 9,990 | 10,107 | (1.2 | ) | 476 | 658 | (27.7 | ) | 118,362 | 114,453 | 3.4 | |||||||||||||||||||||||||||||||||||
| 740 | 290 | * | 1,814 | 1,814 | — | 305 | 306 | (.3 | ) | 6,328 | 5,528 | 14.5 | ||||||||||||||||||||||||||||||||||||
| 399 | 227 | 75.8 | 675 | 769 | (12.2 | ) | 20 | 11 | 81.8 | 2,129 | 2,080 | 2.4 | ||||||||||||||||||||||||||||||||||||
| 6,624 | 5,771 | 14.8 | 13,564 | 13,350 | 1.6 | 47,836 | 38,852 | 23.1 | 187,630 | 171,948 | 9.1 | |||||||||||||||||||||||||||||||||||||
| 3,031 | 2,333 | 29.9 | 278 | 258 | 7.8 | (80 | ) | 192 | * | 31,715 | 28,715 | 10.4 | ||||||||||||||||||||||||||||||||||||
| 6,019 | 4,301 | 39.9 | 10 | 7 | 42.9 | 1 | 129 | (99.2 | ) | 57,026 | 45,796 | 24.5 | ||||||||||||||||||||||||||||||||||||
| 474 | 448 | 5.8 | — | — | — | 4,850 | 4,941 | (1.8 | ) | 27,812 | 30,613 | (9.1 | ) | |||||||||||||||||||||||||||||||||||
| 9,524 | 7,082 | 34.5 | 288 | 265 | 8.7 | 4,771 | 5,262 | (9.3 | ) | 116,553 | 105,124 | 10.9 | ||||||||||||||||||||||||||||||||||||
| 2,169 | 1,405 | 54.4 | 3,010 | 3,059 | (1.6 | ) | 3,134 | 2,632 | 19.1 | 19,393 | 17,273 | 12.3 | ||||||||||||||||||||||||||||||||||||
Payment Servicesincludes consumer and business credit cards, debit cards, corporate and purchasing card services, consumer lines of credit, ATM processing and merchant processing and debit cards.processing. Payment Services contributed $732.8$716.5 million of the Company’s operating earnings in 2004 and $596.0 million in 2003, a 4.020.2 percent increase over 2002.2003. The increases were due to growth in total net revenue driven by higher transaction volumes and reductions in the provision for credit losses, partially offset by increases in total noninterest expense.
Treasury and Corporate Supportincludes the Company’s investment portfolios, funding, capital management and asset securitization activities, interest rate risk management, the net effect of transfer pricing related to average balances and the residual aggregate of expenses associated with business activities managed on a corporate basis, including enterprise-wide operations and administrative support functions. Operational expenses incurred by Treasury and Corporate Support on behalf of the other business lines are allocated back primarily based on customer transaction volume and account activities to the appropriate business unit and are identified as net shared services expense. Treasury and Corporate Support recorded operating lossesearnings of $382.5$466.2 million in 2003, an increase2004, a decrease of 6.018.5 percent, compared with 2002.2003.
ACCOUNTING CHANGES
Note 2 of the Notes to Consolidated Financial Statements discusses accounting standards recently issued or proposed but not yet required to be adopted and the expected impact of the changes in accounting standards. To the extent the adoption of new accounting standards affects the Company’s financial condition, results of operations or liquidity, the impacts are discussed in the applicable section(s) of the Management’s Discussion and Analysis and the Notes to Consolidated Financial Statements.
CRITICAL ACCOUNTING POLICIES
The accounting and reporting policies of the Company comply with accounting principles generally accepted in the United States and conform to general practices within the banking industry. The preparation of financial statements in conformity with generally accepted accounting principles requires management to make estimates and assumptions. The financial position and results of operations can be affected by these estimates and assumptions, which are integral to understanding the Company’s financial statements. Critical accounting policies are those policies that management believes are the most important to the portrayal of the Company’s financial condition and results, and require management to make estimates that are difficult, subjective or complex. Most accounting policies are not considered by management to be critical accounting policies. Several factors are considered in determining whether or not a policy is critical in the preparation of financial statements. These factors include, among other things, whether the estimates are significant to the financial statements, the nature of the estimates, the ability to readily validate the estimates with other information including third-parties or available prices, and sensitivity of the estimates to changes in economic conditions and whether alternative accounting methods may be utilized under generally accepted accounting principles. Management has discussed the development and the selection of critical accounting policies with the Company’s Audit Committee.
Allowance for Credit LossesThe allowance for credit losses is established to provide for probable losses inherent in the Company’s credit portfolio. The methods utilized to estimate the allowance for credit losses, key assumptions and quantitative and qualitative information considered by management in determining the adequacy of the allowance for credit losses are discussed in the “Credit Risk Management” section.
analysis and historical performance, the amount of the allowance for commercial and commercial real estate loans might decline. However, it is likely thatdecline; however, the degree of change differs somewhat from the level of changes in nonperforming loans and net charge-offs. Also, management would maintain an adequate allowance for credit losses by increasing the allowance for other factors at a stageduring period of economic uncertainty or changes in the business cycle that is uncertain and when nonperforming asset levels remain elevated.cycle.
Asset ImpairmentIn the ordinary course of business, the Company evaluates the carrying value of its assets for potential impairment. Generally, potential impairment is determined based on a comparison of fair value to the carrying value. The determination of fair value can be highly subjective, especially for assets that are not actively traded or when market-based prices are not available. The Company estimates fair value based on the present value of estimated future cash flows. The initial valuation and subsequent impairment tests may require the use of significant management estimates. Additionally, determining the amount, if any, of an impairment may require an assessment of whether or not a decline in an asset’s estimated fair value below the recorded value is temporary in nature. While impairment assessments impact most asset categories, the following areas are considered to be critical accounting matters in relation to the financial statements.
Mortgage Servicing RightsMSRs are capitalized as separate assets when loans are sold and servicing is retained. The total cost of loans sold is allocated between the loans sold and the servicing assets retained based on their relative fair values. MSRs that are purchased from others are initially recorded at cost. The carrying value of the MSRs is amortized in proportion to and over the period of estimated net servicing revenue and recorded in noninterest expense as amortization of intangible assets. The carrying value of these assets is periodically reviewed for impairment using a lower of carrying value or fair value methodology. For purposes of measuring impairment, the servicing rights are stratified based on the underlying loan type and note rate and the carrying value for each stratum is compared to fair value based on a discounted cash flow analysis, utilizing current prepayment speeds and discount rates. Events that may significantly affect the estimates used are changes in interest rates and the related impact on mortgage loan prepayment speeds and the payment performance of the underlying loans. If the carrying value is greater than fair value, impairment is recognized through a valuation allowance for each impaired stratum and recorded as amortization of intangible assets. The changesreduction in the fair value of MSRs at December 31, 2003,2004, to immediate 25 and 50 basis point adverse changes in interest rates would be approximately $78$133 million and $127$258 million, respectively. An upward movement in interest rates at December 31, 2003,2004, of 25 and 50 basis points would increase the value of the MSRs by approximately $75$109 million and $133$177 million, respectively. Refer to Note 1112 of the Notes to Consolidated Financial Statements for additional information regarding MSRs.
Goodwill and Other IntangiblesThe Company records all assets and liabilities acquired in purchase acquisitions, including goodwill and other intangibles, at fair value as required by Statement of Financial Accounting Standards No. 141, “Goodwill and Other Intangible Assets.” Goodwill and indefinite-lived assets are no longer amortized but are subject, at a minimum, to annual tests for impairment. Under certain situations, interim impairment tests may be required if events occur or circumstances change that would more likely than not reduce the fair value of a reporting segment below its carrying amount. Other intangible assets are amortized over their estimated useful lives using straight-line and accelerated methods and are subject to impairment if events or circumstances indicate a possible inability to realize the carrying amount.
DISCLOSURE Income TaxesThe Company estimates income tax expense based on amounts expected to be owed to various tax jurisdictions. Currently, the Company files tax returns in approximately 140 federal, state and local domestic jurisdictions and 6 foreign jurisdictions. The estimated income tax expense is reported in the Consolidated Statement of Income. Accrued taxes represent the net estimated amount due or to be received from taxing jurisdictions either currently or in the future and are reported in other assets or other liabilities on the Consolidated Balance Sheet. In estimating accrued taxes, the Company assesses the relative merits and risks of the appropriate tax treatment considering statutory, judicial and regulatory guidance in the context of the tax position. Because of the complexity of tax laws and regulations, interpretation can be difficult and subject to legal judgment given specific facts and circumstances. It is possible that others, given the same information, may at any point in time reach different reasonable conclusions regarding the estimated amounts of accrued taxes.
CONTROLS AND PROCEDURES
Under the supervision and with the participation of the Company’s management, including its principal executive officer and principal financial officer, the Company has evaluated the effectiveness of the design and operation of its disclosure controls and procedures (as defined in Rules 13a-15(e) and 15d-15(e) under the Securities Exchange Act of 1934 (the “Exchange Act”)). Based upon this evaluation, the principal executive officer and principal financial officer have concluded that, as of the end of the period covered by this report, the Company’s disclosure controls and procedures were effective to ensure that information required to be disclosed by the Company in reports that it files or submits under the Exchange Act is recorded, processed, summarized and reported within the time periods specified in Securities and Exchange Commission rules and forms.
| At December 31 (Dollars in Millions) | At December 31 (Dollars in Millions) | 2003 | 2002 | At December 31 (Dollars in Millions) | 2004 | 2003 | ||||||||||||||||
Assets | Assets | Assets | ||||||||||||||||||||
| Cash and due from banks | Cash and due from banks | $ | 8,630 | $ | 10,758 | Cash and due from banks | $ | 6,336 | $ | 8,630 | ||||||||||||
| Investment securities | Investment securities | Investment securities | ||||||||||||||||||||
| Held-to-maturity (fair value $161 and $240, respectively) | 152 | 233 | Held-to-maturity (fair value $132 and $161, respectively) | 127 | 152 | |||||||||||||||||
| Available-for-sale | 43,182 | 28,255 | Available-for-sale | 41,354 | 43,182 | |||||||||||||||||
| Loans held for sale | Loans held for sale | 1,433 | 4,159 | Loans held for sale | 1,439 | 1,433 | ||||||||||||||||
| Loans | Loans | Loans | ||||||||||||||||||||
| Commercial | 38,526 | 41,944 | Commercial | 40,173 | 38,526 | |||||||||||||||||
| Commercial real estate | 27,242 | 26,867 | Commercial real estate | 27,585 | 27,242 | |||||||||||||||||
| Residential mortgages | 13,457 | 9,746 | Residential mortgages | 15,367 | 13,457 | |||||||||||||||||
| Retail | 39,010 | 37,694 | Retail | 43,190 | 39,010 | |||||||||||||||||
| Total loans | 118,235 | 116,251 | Total loans | 126,315 | 118,235 | |||||||||||||||||
| Less allowance for credit losses | (2,369 | ) | (2,422 | ) | Less allowance for loan losses | (2,080 | ) | (2,184 | ) | |||||||||||||
| Net loans | 115,866 | 113,829 | Net loans | 124,235 | 116,051 | |||||||||||||||||
| Premises and equipment | Premises and equipment | 1,957 | 1,697 | Premises and equipment | 1,890 | 1,957 | ||||||||||||||||
| Customers’ liability on acceptances | Customers’ liability on acceptances | 121 | 140 | Customers’ liability on acceptances | 95 | 121 | ||||||||||||||||
| Goodwill | Goodwill | 6,025 | 6,325 | Goodwill | 6,241 | 6,025 | ||||||||||||||||
| Other intangible assets | Other intangible assets | 2,124 | 2,321 | Other intangible assets | 2,387 | 2,124 | ||||||||||||||||
| Other assets | Other assets | 9,796 | 12,310 | Other assets | 11,000 | 9,796 | ||||||||||||||||
| Total assets | $ | 189,286 | $ | 180,027 | Total assets | $ | 195,104 | $ | 189,471 | |||||||||||||
Liabilities and Shareholders’ Equity | Liabilities and Shareholders’ Equity | Liabilities and Shareholders’ Equity | ||||||||||||||||||||
| Deposits | Deposits | Deposits | ||||||||||||||||||||
| Noninterest-bearing | $ | 32,470 | $ | 35,106 | Noninterest-bearing | $ | 30,756 | $ | 32,470 | |||||||||||||
| Interest-bearing | 74,749 | 68,214 | Interest-bearing | 71,936 | 74,749 | |||||||||||||||||
| Time deposits greater than $100,000 | 11,833 | 12,214 | Time deposits greater than $100,000 | 18,049 | 11,833 | |||||||||||||||||
| Total deposits | 119,052 | 115,534 | Total deposits | 120,741 | 119,052 | |||||||||||||||||
| Short-term borrowings | Short-term borrowings | 10,850 | 7,806 | Short-term borrowings | 13,084 | 10,850 | ||||||||||||||||
| Long-term debt | Long-term debt | 31,215 | 28,588 | Long-term debt | 34,739 | 33,816 | ||||||||||||||||
| Company-obligated mandatorily redeemable preferred securities of subsidiary trusts holding solely the junior subordinated debentures of the parent company | 2,601 | 2,994 | ||||||||||||||||||||
| Acceptances outstanding | Acceptances outstanding | 121 | 140 | Acceptances outstanding | 95 | 121 | ||||||||||||||||
| Other liabilities | Other liabilities | 6,205 | 6,529 | Other liabilities | 6,906 | 6,390 | ||||||||||||||||
| Total liabilities | 170,044 | 161,591 | Total liabilities | 175,565 | 170,229 | |||||||||||||||||
| Shareholders’ equity | Shareholders’ equity | Shareholders’ equity | ||||||||||||||||||||
| Common stock, par value $0.01 a share — authorized: 4,000,000,000 shares issued: 2003 — 1,972,643,007 shares; 2002 — 1,972,643,060 shares | 20 | 20 | Common stock, par value $0.01 a share — authorized: 4,000,000,000 shares issued: 2004 and 2003 — 1,972,643,007 shares | 20 | 20 | |||||||||||||||||
| Capital surplus | 5,851 | 5,799 | Capital surplus | 5,902 | 5,851 | |||||||||||||||||
| Retained earnings | 14,508 | 13,105 | Retained earnings | 16,758 | 14,508 | |||||||||||||||||
| Less cost of common stock in treasury: 2003 — 49,722,856 shares; 2002 — 55,686,500 shares | (1,205 | ) | (1,272 | ) | Less cost of common stock in treasury: 2004 — 115,020,064 shares; 2003 — 49,722,856 shares | (3,125 | ) | (1,205 | ) | |||||||||||||
| Other comprehensive income | 68 | 784 | Other comprehensive income | (16 | ) | 68 | ||||||||||||||||
| Total shareholders’ equity | 19,242 | 18,436 | Total shareholders’ equity | 19,539 | 19,242 | |||||||||||||||||
| Total liabilities and shareholders’ equity | $ | 189,286 | $ | 180,027 | Total liabilities and shareholders’ equity | $ | 195,104 | $ | 189,471 | |||||||||||||
| Year Ended December 31 (Dollars and Shares in Millions, Except Per Share Data) | Year Ended December 31 (Dollars and Shares in Millions, Except Per Share Data) | 2003 | 2002 | 2001 | Year Ended December 31 (Dollars and Shares in Millions, Except Per Share Data) | 2004 | 2003 | 2002 | ||||||||||||||||||||
Interest Income | Interest Income | Interest Income | ||||||||||||||||||||||||||
| Loans | Loans | $ | 7,272.0 | $ | 7,743.0 | $ | 9,413.7 | Loans | $ | 7,168.1 | $ | 7,272.0 | $ | 7,743.0 | ||||||||||||||
| Loans held for sale | Loans held for sale | 202.2 | 170.6 | 146.9 | Loans held for sale | 91.5 | 202.2 | 170.6 | ||||||||||||||||||||
| Investment securities | Investment securities | Investment securities | 1,827.1 | 1,684.0 | 1,484.3 | |||||||||||||||||||||||
| Other interest income | Other interest income | 99.8 | 99.8 | 96.0 | ||||||||||||||||||||||||
| Taxable | 1,654.6 | 1,438.2 | 1,206.1 | |||||||||||||||||||||||||
| Non-taxable | 29.4 | 46.1 | 89.5 | |||||||||||||||||||||||||
| Other interest income | 99.8 | 96.0 | 90.2 | |||||||||||||||||||||||||
| Total interest income | 9,186.5 | 9,258.0 | 9,493.9 | |||||||||||||||||||||||||
| Total interest income | 9,258.0 | 9,493.9 | 10,946.4 | |||||||||||||||||||||||||
Interest Expense | Interest Expense | Interest Expense | ||||||||||||||||||||||||||
| Deposits | Deposits | 1,096.6 | 1,485.3 | 2,828.1 | Deposits | 904.3 | 1,096.6 | 1,485.3 | ||||||||||||||||||||
| Short-term borrowings | Short-term borrowings | 166.8 | 222.9 | 475.6 | Short-term borrowings | 262.7 | 166.8 | 222.9 | ||||||||||||||||||||
| Long-term debt | Long-term debt | 702.2 | 834.8 | 1,164.2 | Long-term debt | 908.2 | 805.3 | 971.4 | ||||||||||||||||||||
| Company-obligated mandatorily redeemable preferred securities | 103.1 | 136.6 | 127.8 | |||||||||||||||||||||||||
| Total interest expense | 2,068.7 | 2,679.6 | 4,595.7 | Total interest expense | 2,075.2 | 2,068.7 | 2,679.6 | |||||||||||||||||||||
| Net interest income | Net interest income | 7,189.3 | 6,814.3 | 6,350.7 | Net interest income | 7,111.3 | 7,189.3 | 6,814.3 | ||||||||||||||||||||
| Provision for credit losses | Provision for credit losses | 1,254.0 | 1,349.0 | 2,528.8 | Provision for credit losses | 669.6 | 1,254.0 | 1,349.0 | ||||||||||||||||||||
| Net interest income after provision for credit losses | Net interest income after provision for credit losses | 5,935.3 | 5,465.3 | 3,821.9 | Net interest income after provision for credit losses | 6,441.7 | 5,935.3 | 5,465.3 | ||||||||||||||||||||
Noninterest Income | Noninterest Income | Noninterest Income | ||||||||||||||||||||||||||
| Credit and debit card revenue | Credit and debit card revenue | 560.7 | 517.0 | 465.9 | Credit and debit card revenue | 649.3 | 560.7 | 517.0 | ||||||||||||||||||||
| Corporate payment products revenue | Corporate payment products revenue | 361.3 | 325.7 | 297.7 | Corporate payment products revenue | 406.8 | 361.3 | 325.7 | ||||||||||||||||||||
| ATM processing services | ATM processing services | 165.9 | 160.6 | 153.0 | ATM processing services | 175.3 | 165.9 | 160.6 | ||||||||||||||||||||
| Merchant processing services | Merchant processing services | 561.4 | 567.3 | 308.9 | Merchant processing services | 674.6 | 561.4 | 567.3 | ||||||||||||||||||||
| Trust and investment management fees | Trust and investment management fees | 953.9 | 892.1 | 887.8 | Trust and investment management fees | 981.2 | 953.9 | 892.1 | ||||||||||||||||||||
| Deposit service charges | Deposit service charges | 715.8 | 690.3 | 644.9 | Deposit service charges | 806.4 | 715.8 | 690.3 | ||||||||||||||||||||
| Treasury management fees | Treasury management fees | 466.3 | 416.9 | 347.3 | Treasury management fees | 466.7 | 466.3 | 416.9 | ||||||||||||||||||||
| Commercial products revenue | Commercial products revenue | 400.5 | 479.2 | 437.4 | Commercial products revenue | 432.2 | 400.5 | 479.2 | ||||||||||||||||||||
| Mortgage banking revenue | Mortgage banking revenue | 367.1 | 330.2 | 234.0 | Mortgage banking revenue | 397.3 | 367.1 | 330.2 | ||||||||||||||||||||
| Investment products fees and commissions | Investment products fees and commissions | 144.9 | 132.7 | 130.8 | Investment products fees and commissions | 156.0 | 144.9 | 132.7 | ||||||||||||||||||||
| Securities gains, net | 244.8 | 299.9 | 329.1 | |||||||||||||||||||||||||
| Merger and restructuring-related gains | — | — | 62.2 | |||||||||||||||||||||||||
| Securities gains (losses), net | Securities gains (losses), net | (104.9 | ) | 244.8 | 299.9 | |||||||||||||||||||||||
| Other | Other | 370.4 | 398.8 | 370.4 | Other | 478.3 | 370.4 | 398.8 | ||||||||||||||||||||
| Total noninterest income | 5,313.0 | 5,210.7 | 4,669.4 | |||||||||||||||||||||||||
| Total noninterest income | 5,519.2 | 5,313.0 | 5,210.7 | |||||||||||||||||||||||||
Noninterest Expense | Noninterest Expense | Noninterest Expense | ||||||||||||||||||||||||||
| Compensation | Compensation | 2,176.8 | 2,167.5 | 2,036.6 | Compensation | 2,252.2 | 2,176.8 | 2,167.5 | ||||||||||||||||||||
| Employee benefits | Employee benefits | 328.4 | 317.5 | 285.5 | Employee benefits | 389.4 | 328.4 | 317.5 | ||||||||||||||||||||
| Net occupancy and equipment | Net occupancy and equipment | 643.7 | 658.7 | 666.6 | Net occupancy and equipment | 630.8 | 643.7 | 658.7 | ||||||||||||||||||||
| Professional services | Professional services | 143.4 | 129.7 | 116.4 | Professional services | 148.9 | 143.4 | 129.7 | ||||||||||||||||||||
| Marketing and business development | Marketing and business development | 180.3 | 171.4 | 178.0 | Marketing and business development | 193.5 | 180.3 | 171.4 | ||||||||||||||||||||
| Technology and communications | Technology and communications | 417.4 | 392.1 | 353.9 | Technology and communications | 429.6 | 417.4 | 392.1 | ||||||||||||||||||||
| Postage, printing and supplies | Postage, printing and supplies | 245.6 | 243.2 | 241.9 | Postage, printing and supplies | 248.4 | 245.6 | 243.2 | ||||||||||||||||||||
| Goodwill | — | — | 236.7 | |||||||||||||||||||||||||
| Other intangibles | Other intangibles | 682.4 | 553.0 | 278.4 | Other intangibles | 550.1 | 682.4 | 553.0 | ||||||||||||||||||||
| Merger and restructuring-related charges | Merger and restructuring-related charges | 46.2 | 321.2 | 1,044.8 | Merger and restructuring-related charges | — | 46.2 | 321.2 | ||||||||||||||||||||
| Debt prepayment | Debt prepayment | 154.8 | — | (.2 | ) | |||||||||||||||||||||||
| Other | Other | 732.7 | 786.2 | 710.2 | Other | 786.8 | 732.7 | 786.4 | ||||||||||||||||||||
| Total noninterest expense | 5,596.9 | 5,740.5 | 6,149.0 | Total noninterest expense | 5,784.5 | 5,596.9 | 5,740.5 | |||||||||||||||||||||
| Income from continuing operations before income taxes | Income from continuing operations before income taxes | 5,651.4 | 4,935.5 | 2,342.3 | Income from continuing operations before income taxes | 6,176.4 | 5,651.4 | 4,935.5 | ||||||||||||||||||||
| Applicable income taxes | Applicable income taxes | 1,941.3 | 1,707.5 | 818.3 | Applicable income taxes | 2,009.6 | 1,941.3 | 1,707.5 | ||||||||||||||||||||
| Income from continuing operations | Income from continuing operations | 3,710.1 | 3,228.0 | 1,524.0 | Income from continuing operations | 4,166.8 | 3,710.1 | 3,228.0 | ||||||||||||||||||||
| Income (loss) from discontinued operations (after-tax) | 22.5 | (22.7 | ) | (45.2 | ) | |||||||||||||||||||||||
| Cumulative effect of accounting change (after-tax) | — | (37.2 | ) | — | ||||||||||||||||||||||||
| Income (loss) from discontinued operations (after-tax) | Income (loss) from discontinued operations (after-tax) | — | 22.5 | (22.7 | ) | |||||||||||||||||||||||
| Cumulative effect of accounting change (after-tax) | Cumulative effect of accounting change (after-tax) | — | — | (37.2 | ) | |||||||||||||||||||||||
| Net income | Net income | $ | 3,732.6 | $ | 3,168.1 | $ | 1,478.8 | Net income | $ | 4,166.8 | $ | 3,732.6 | $ | 3,168.1 | ||||||||||||||
Earnings Per Share | Earnings Per Share | Earnings Per Share | ||||||||||||||||||||||||||
| Income from continuing operations | $ | 1.93 | $ | 1.68 | $ | .79 | Income from continuing operations | $ | 2.21 | $ | 1.93 | $ | 1.68 | |||||||||||||||
| Discontinued operations | .01 | (.01 | ) | (.02 | ) | Discontinued operations | — | .01 | (.01 | ) | ||||||||||||||||||
| Cumulative effect of accounting change | — | (.02 | ) | — | Cumulative effect of accounting change | — | — | (.02 | ) | |||||||||||||||||||
| Net income | $ | 1.94 | $ | 1.65 | $ | .77 | Net income | $ | 2.21 | $ | 1.94 | $ | 1.65 | |||||||||||||||
Diluted Earnings Per Share | Diluted Earnings Per Share | Diluted Earnings Per Share | ||||||||||||||||||||||||||
| Income from continuing operations | $ | 1.92 | $ | 1.68 | $ | .79 | Income from continuing operations | $ | 2.18 | $ | 1.92 | $ | 1.68 | |||||||||||||||
| Discontinued operations | .01 | (.01 | ) | (.03 | ) | Discontinued operations | — | .01 | (.01 | ) | ||||||||||||||||||
| Cumulative effect of accounting change | — | (.02 | ) | — | Cumulative effect of accounting change | — | — | (.02 | ) | |||||||||||||||||||
| Net income | $ | 1.93 | $ | 1.65 | $ | .76 | Net income | $ | 2.18 | $ | 1.93 | $ | 1.65 | |||||||||||||||
| Dividends declared per share | Dividends declared per share | $ | .855 | $ | .780 | $ | .750 | Dividends declared per share | $ | 1.020 | $ | .855 | $ | .780 | ||||||||||||||
| Average common shares | 1,923.7 | 1,916.0 | 1,927.9 | |||||||||||||||||||||||||
| Average diluted common shares | 1,936.2 | 1,924.8 | 1,940.3 | |||||||||||||||||||||||||
| Average common shares outstanding | Average common shares outstanding | 1,887.1 | 1,923.7 | 1,916.0 | ||||||||||||||||||||||||
| Average diluted common shares outstanding | Average diluted common shares outstanding | 1,912.9 | 1,936.2 | 1,924.8 | ||||||||||||||||||||||||
| Common | Other | Total | ||||||||||||||||||||||||||||||||||||||||||||||||||||||||
| Shares | Common | Capital | Retained | Treasury | Comprehensive | Shareholders’ | Common | Other | Total | |||||||||||||||||||||||||||||||||||||||||||||||||
| (Dollars in Millions) | (Dollars in Millions) | Outstanding | Stock | Surplus | Earnings | Stock | Income | Equity | (Dollars in Millions) | Shares | Common | Capital | Retained | Treasury | Comprehensive | Shareholders’ | ||||||||||||||||||||||||||||||||||||||||||
| (Unaudited) | Outstanding | Stock | Surplus | Earnings | Stock | Income | Equity | |||||||||||||||||||||||||||||||||||||||||||||||||||
Balance December 31, 2000 | 1,902,083,434 | $19 | $ | 4,275 | $ | 11,658 | $ | (880 | ) | $ | 96 | $ | 15,168 | |||||||||||||||||||||||||||||||||||||||||||||
| Cumulative impact of retroactive restatement | 430 | (265 | ) | 165 | ||||||||||||||||||||||||||||||||||||||||||||||||||||||
Balance December 31, 2001 | Balance December 31, 2001 | 1,951,709,512 | $20 | $ | 5,683 | $ | 11,425 | $ | (478 | ) | $ | 95 | $ | 16,745 | ||||||||||||||||||||||||||||||||||||||||||||
| Net income | Net income | 1,479 | 1,479 | Net income | 3,168 | 3,168 | ||||||||||||||||||||||||||||||||||||||||||||||||||||
| Unrealized gain on securities available for sale | 194 | 194 | ||||||||||||||||||||||||||||||||||||||||||||||||||||||||
| Unrealized gain on securities available-for-sale | Unrealized gain on securities available-for-sale | 1,048 | 1,048 | |||||||||||||||||||||||||||||||||||||||||||||||||||||||
| Unrealized gain on derivatives | Unrealized gain on derivatives | 106 | 106 | Unrealized gain on derivatives | 324 | 324 | ||||||||||||||||||||||||||||||||||||||||||||||||||||
| Foreign currency translation adjustment | Foreign currency translation adjustment | (4 | ) | (4 | ) | Foreign currency translation adjustment | �� | 7 | 7 | |||||||||||||||||||||||||||||||||||||||||||||||||
| Realized gain on derivatives | Realized gain on derivatives | 42 | 42 | Realized gain on derivatives | 64 | 64 | ||||||||||||||||||||||||||||||||||||||||||||||||||||
| Reclassification adjustment for gains realized in net income | Reclassification adjustment for gains realized in net income | (333 | ) | (333 | ) | Reclassification adjustment for gains realized in net income | (332 | ) | (332 | ) | ||||||||||||||||||||||||||||||||||||||||||||||||
| Income taxes | Income taxes | (6 | ) | (6 | ) | Income taxes | (422 | ) | (422 | ) | ||||||||||||||||||||||||||||||||||||||||||||||||
| Total comprehensive income | 1,478 | Total comprehensive income | 3,857 | |||||||||||||||||||||||||||||||||||||||||||||||||||||||
| Cash dividends declared on common stock | Cash dividends declared on common stock | (1,447 | ) | (1,447 | ) | Cash dividends declared on common stock | (1,488 | ) | (1,488 | ) | ||||||||||||||||||||||||||||||||||||||||||||||||
| Issuance of common stock and treasury shares | 69,502,689 | 1 | 1,384 | 49 | 1,434 | |||||||||||||||||||||||||||||||||||||||||||||||||||||
| Issuance of common and treasury stock | Issuance of common and treasury stock | 10,589,034 | (75 | ) | 249 | 174 | ||||||||||||||||||||||||||||||||||||||||||||||||||||
| Purchase of treasury stock | Purchase of treasury stock | (19,743,672 | ) | (468 | ) | (468 | ) | Purchase of treasury stock | (45,256,736 | ) | (1,040 | ) | (1,040 | ) | ||||||||||||||||||||||||||||||||||||||||||||
| Retirement of treasury stock | (824 | ) | 824 | — | ||||||||||||||||||||||||||||||||||||||||||||||||||||||
| Stock option grants and restricted stock amortization | 415 | 415 | ||||||||||||||||||||||||||||||||||||||||||||||||||||||||
| Shares reserved to meet deferred compensation obligations | (132,939 | ) | 3 | (3 | ) | — | ||||||||||||||||||||||||||||||||||||||||||||||||||||
Balance December 31, 2001 | 1,951,709,512 | $20 | $ | 5,683 | $ | 11,425 | $ | (478 | ) | $ | 95 | $ | 16,745 | |||||||||||||||||||||||||||||||||||||||||||||
| Net income | 3,168 | 3,168 | ||||||||||||||||||||||||||||||||||||||||||||||||||||||||
| Unrealized gain on securities available for sale | 1,048 | 1,048 | ||||||||||||||||||||||||||||||||||||||||||||||||||||||||
| Unrealized gain on derivatives | 324 | 324 | ||||||||||||||||||||||||||||||||||||||||||||||||||||||||
| Foreign currency translation adjustment | 7 | 7 | ||||||||||||||||||||||||||||||||||||||||||||||||||||||||
| Realized gain on derivatives | 64 | 64 | ||||||||||||||||||||||||||||||||||||||||||||||||||||||||
| Reclassification adjustment for gains realized in net income | (332 | ) | (332 | ) | ||||||||||||||||||||||||||||||||||||||||||||||||||||||
| Income taxes | (422 | ) | (422 | ) | ||||||||||||||||||||||||||||||||||||||||||||||||||||||
| Total comprehensive income | 3,857 | |||||||||||||||||||||||||||||||||||||||||||||||||||||||||
| Cash dividends declared on common stock | (1,488 | ) | (1,488 | ) | ||||||||||||||||||||||||||||||||||||||||||||||||||||||
| Issuance of common stock and treasury shares | 10,589,034 | (75 | ) | 249 | 174 | |||||||||||||||||||||||||||||||||||||||||||||||||||||
| Purchase of treasury stock | (45,256,736 | ) | (1,040 | ) | (1,040 | ) | ||||||||||||||||||||||||||||||||||||||||||||||||||||
| Stock option grants and restricted stock amortization | 188 | 188 | ||||||||||||||||||||||||||||||||||||||||||||||||||||||||
| Stock option and restricted stock grants | Stock option and restricted stock grants | 188 | 188 | |||||||||||||||||||||||||||||||||||||||||||||||||||||||
| Shares reserved to meet deferred compensation obligations | Shares reserved to meet deferred compensation obligations | (85,250 | ) | 3 | (3 | ) | — | Shares reserved to meet deferred compensation obligations | (85,250 | ) | 3 | (3 | ) | — | ||||||||||||||||||||||||||||||||||||||||||||
Balance December 31, 2002 | Balance December 31, 2002 | 1,916,956,560 | $20 | $ | 5,799 | $ | 13,105 | $ | (1,272 | ) | $ | 784 | $ | 18,436 | Balance December 31, 2002 | 1,916,956,560 | $20 | $ | 5,799 | $ | 13,105 | $ | (1,272 | ) | $ | 784 | $ | 18,436 | ||||||||||||||||||||||||||||||
| Net income | Net income | 3,733 | 3,733 | Net income | 3,733 | 3,733 | ||||||||||||||||||||||||||||||||||||||||||||||||||||
| Unrealized loss on securities available for sale | (716 | ) | (716 | ) | ||||||||||||||||||||||||||||||||||||||||||||||||||||||
| Unrealized loss on securities available-for-sale | Unrealized loss on securities available-for-sale | (716 | ) | (716 | ) | |||||||||||||||||||||||||||||||||||||||||||||||||||||
| Unrealized loss on derivatives | Unrealized loss on derivatives | (373 | ) | (373 | ) | Unrealized loss on derivatives | (373 | ) | (373 | ) | ||||||||||||||||||||||||||||||||||||||||||||||||
| Foreign currency translation adjustment | Foreign currency translation adjustment | 23 | 23 | Foreign currency translation adjustment | 23 | 23 | ||||||||||||||||||||||||||||||||||||||||||||||||||||
| Realized gain on derivatives | Realized gain on derivatives | 199 | 199 | Realized gain on derivatives | 199 | 199 | ||||||||||||||||||||||||||||||||||||||||||||||||||||
| Reclassification adjustment for gains realized in net income | Reclassification adjustment for gains realized in net income | (288 | ) | (288 | ) | Reclassification adjustment for gains realized in net income | (288 | ) | (288 | ) | ||||||||||||||||||||||||||||||||||||||||||||||||
| Income taxes | Income taxes | 439 | 439 | Income taxes | 439 | 439 | ||||||||||||||||||||||||||||||||||||||||||||||||||||
| Total comprehensive income | 3,017 | Total comprehensive income | 3,017 | |||||||||||||||||||||||||||||||||||||||||||||||||||||||
| Cash dividends declared on common stock | Cash dividends declared on common stock | (1,645 | ) | (1,645 | ) | Cash dividends declared on common stock | (1,645 | ) | (1,645 | ) | ||||||||||||||||||||||||||||||||||||||||||||||||
| Special dividend-Piper Jaffray spin-off | (685 | ) | (685 | ) | ||||||||||||||||||||||||||||||||||||||||||||||||||||||
| Issuance of common stock and treasury shares | 21,709,297 | (51 | ) | 502 | 451 | |||||||||||||||||||||||||||||||||||||||||||||||||||||
| Special dividends declared on common stock | Special dividends declared on common stock | (685 | ) | (685 | ) | |||||||||||||||||||||||||||||||||||||||||||||||||||||
| Issuance of common and treasury stock | Issuance of common and treasury stock | 21,709,297 | (51 | ) | 502 | 451 | ||||||||||||||||||||||||||||||||||||||||||||||||||||
| Purchase of treasury stock | Purchase of treasury stock | (14,971,000 | ) | (417 | ) | (417 | ) | Purchase of treasury stock | (14,971,000 | ) | (417 | ) | (417 | ) | ||||||||||||||||||||||||||||||||||||||||||||
| Stock option grants and restricted stock amortization | 111 | 111 | ||||||||||||||||||||||||||||||||||||||||||||||||||||||||
| Stock option and restricted stock grants | Stock option and restricted stock grants | 111 | 111 | |||||||||||||||||||||||||||||||||||||||||||||||||||||||
| Shares reserved to meet deferred compensation obligations | Shares reserved to meet deferred compensation obligations | (774,706 | ) | (8 | ) | (18 | ) | (26 | ) | Shares reserved to meet deferred compensation obligations | (774,706 | ) | (8 | ) | (18 | ) | (26 | ) | ||||||||||||||||||||||||||||||||||||||||
Balance December 31, 2003 | Balance December 31, 2003 | 1,922,920,151 | $20 | $ | 5,851 | $ | 14,508 | $ | (1,205 | ) | $ | 68 | $ | 19,242 | Balance December 31, 2003 | 1,922,920,151 | $20 | $ | 5,851 | $ | 14,508 | $ | (1,205 | ) | $ | 68 | $ | 19,242 | ||||||||||||||||||||||||||||||
| Net income | Net income | 4,167 | 4,167 | |||||||||||||||||||||||||||||||||||||||||||||||||||||||
| Unrealized loss on securities available-for-sale | Unrealized loss on securities available-for-sale | (123 | ) | (123 | ) | |||||||||||||||||||||||||||||||||||||||||||||||||||||
| Unrealized loss on derivatives | Unrealized loss on derivatives | (43 | ) | (43 | ) | |||||||||||||||||||||||||||||||||||||||||||||||||||||
| Foreign currency translation adjustment | Foreign currency translation adjustment | (17 | ) | (17 | ) | |||||||||||||||||||||||||||||||||||||||||||||||||||||
| Realized gain on derivatives | Realized gain on derivatives | 16 | 16 | |||||||||||||||||||||||||||||||||||||||||||||||||||||||
| Reclassification adjustment for losses realized in net income | Reclassification adjustment for losses realized in net income | 32 | 32 | |||||||||||||||||||||||||||||||||||||||||||||||||||||||
| Income taxes | Income taxes | 51 | 51 | |||||||||||||||||||||||||||||||||||||||||||||||||||||||
| Total comprehensive income | 4,083 | |||||||||||||||||||||||||||||||||||||||||||||||||||||||||
| Cash dividends declared on common stock | Cash dividends declared on common stock | (1,917 | ) | (1,917 | ) | |||||||||||||||||||||||||||||||||||||||||||||||||||||
| Issuance of common and treasury stock | Issuance of common and treasury stock | 29,758,496 | (96 | ) | 772 | 676 | ||||||||||||||||||||||||||||||||||||||||||||||||||||
| Purchase of treasury stock | Purchase of treasury stock | (93,773,487 | ) | (2,656 | ) | (2,656 | ) | |||||||||||||||||||||||||||||||||||||||||||||||||||
| Stock option and restricted stock grants | Stock option and restricted stock grants | 116 | 116 | |||||||||||||||||||||||||||||||||||||||||||||||||||||||
| Shares reserved to meet deferred compensation obligations | Shares reserved to meet deferred compensation obligations | (1,282,217 | ) | 31 | (36 | ) | (5 | ) | ||||||||||||||||||||||||||||||||||||||||||||||||||
Balance December 31, 2004 | Balance December 31, 2004 | 1,857,622,943 | $20 | $ | 5,902 | $ | 16,758 | $ | (3,125 | ) | $ | (16 | ) | $ | 19,539 | |||||||||||||||||||||||||||||||||||||||||||
| Year Ended December 31 (Dollars in Millions) | Year Ended December 31 (Dollars in Millions) | 2003 | 2002 | 2001 | Year Ended December 31 (Dollars in Millions) | 2004 | 2003 | 2002 | ||||||||||||||||||||
Operating Activities | Operating Activities | Operating Activities | ||||||||||||||||||||||||||
| Net income | Net income | $ | 3,732.6 | $ | 3,168.1 | $ | 1,478.8 | Net income | $ | 4,166.8 | $ | 3,732.6 | $ | 3,168.1 | ||||||||||||||
| Adjustments to reconcile net income to net cash provided by operating activities | Adjustments to reconcile net income to net cash provided by operating activities | Adjustments to reconcile net income to net cash provided by operating activities | ||||||||||||||||||||||||||
| Provision for credit losses | 1,254.0 | 1,349.0 | 2,528.8 | Provision for credit losses | 669.6 | 1,254.0 | 1,349.0 | |||||||||||||||||||||
| Depreciation and amortization of premises and equipment | 275.2 | 285.3 | 284.0 | Depreciation and amortization of premises and equipment | 244.4 | 275.2 | 285.3 | |||||||||||||||||||||
| Amortization of goodwill and other intangibles | 682.4 | 553.0 | 515.1 | Amortization of intangibles | 550.1 | 682.4 | 553.0 | |||||||||||||||||||||
| Provision for deferred income taxes | 272.7 | 291.7 | (296.1 | ) | Provision for deferred income taxes | 281.3 | 272.7 | 291.7 | ||||||||||||||||||||
| (Gain) loss on sales of securities and other assets, net | (300.4 | ) | (411.1 | ) | (428.7 | ) | (Gain) loss on sales of securities and other assets, net | (104.0 | ) | (300.4 | ) | (411.1 | ) | |||||||||||||||
| Mortgage loans originated for sale in the secondary market, net of repayments | (27,665.8 | ) | (22,567.9 | ) | (15,500.2 | ) | Mortgage loans originated for sale in the secondary market, net of repayments | (16,007.2 | ) | (27,665.8 | ) | (22,567.9 | ) | |||||||||||||||
| Proceeds from sales of mortgage loans | 30,228.4 | 20,756.6 | 13,483.0 | Proceeds from sales of mortgage loans | 15,777.8 | 30,228.4 | 20,756.6 | |||||||||||||||||||||
| Stock-based compensation | 123.4 | 113.3 | 227.7 | Stock-based compensation | 138.5 | 123.4 | 113.3 | |||||||||||||||||||||
| Other, net | 79.7 | 248.3 | (110.5 | ) | Other, net | (492.5 | ) | 79.7 | 248.3 | |||||||||||||||||||
| Net cash provided by (used in) operating activities | 8,682.2 | 3,786.3 | 2,181.9 | Net cash provided by (used in) operating activities | 5,224.8 | 8,682.2 | 3,786.3 | |||||||||||||||||||||
Investing Activities | Investing Activities | Investing Activities | ||||||||||||||||||||||||||
| Proceeds from sales of investment securities | 17,383.3 | 14,386.9 | 19,240.2 | |||||||||||||||||||||||||
| Proceeds from sales of available-for-sale investment securities | Proceeds from sales of available-for-sale investment securities | 8,216.2 | 17,383.3 | 14,386.9 | ||||||||||||||||||||||||
| Proceeds from maturities of investment securities | Proceeds from maturities of investment securities | 18,139.9 | 11,246.5 | 4,572.2 | Proceeds from maturities of investment securities | 12,260.8 | 18,139.9 | 11,246.5 | ||||||||||||||||||||
| Purchases of investment securities | Purchases of investment securities | (51,127.3 | ) | (26,469.8 | ) | (32,278.6 | ) | Purchases of investment securities | (19,623.9 | ) | (51,127.3 | ) | (26,469.8 | ) | ||||||||||||||
| Net (increase) decrease in loans outstanding | Net (increase) decrease in loans outstanding | (4,193.3 | ) | (4,111.3 | ) | 2,532.3 | Net (increase) decrease in loans outstanding | (7,680.1 | ) | (4,193.3 | ) | (4,111.3 | ) | |||||||||||||||
| Proceeds from sales of loans | Proceeds from sales of loans | 2,203.7 | 2,219.1 | 3,729.1 | Proceeds from sales of loans | 1,803.5 | 2,203.7 | 2,219.1 | ||||||||||||||||||||
| Purchases of loans | Purchases of loans | (944.3 | ) | (240.2 | ) | (87.5 | ) | Purchases of loans | (2,718.8 | ) | (944.3 | ) | (240.2 | ) | ||||||||||||||
| Proceeds from sales of premises and equipment | Proceeds from sales of premises and equipment | 39.7 | 211.8 | 166.3 | Proceeds from sales of premises and equipment | 50.6 | 39.7 | 211.8 | ||||||||||||||||||||
| Purchases of premises and equipment | Purchases of premises and equipment | (670.1 | ) | (429.8 | ) | (299.2 | ) | Purchases of premises and equipment | (192.0 | ) | (670.1 | ) | (429.8 | ) | ||||||||||||||
| Acquisitions, net of cash acquired | Acquisitions, net of cash acquired | — | 1,368.8 | (741.4 | ) | Acquisitions, net of cash acquired | (322.1 | ) | — | 1,368.8 | ||||||||||||||||||
| Divestitures | Divestitures | (381.8 | ) | — | (340.0 | ) | Divestitures | — | (381.8 | ) | — | |||||||||||||||||
| Other, net | Other, net | 124.7 | (126.1 | ) | (143.9 | ) | Other, net | (309.8 | ) | 124.7 | (126.1 | ) | ||||||||||||||||
| Net cash provided by (used in) investing activities | (19,425.5 | ) | (1,944.1 | ) | (3,650.5 | ) | Net cash provided by (used in) investing activities | (8,515.6 | ) | (19,425.5 | ) | (1,944.1 | ) | |||||||||||||||
Financing Activities | Financing Activities | Financing Activities | ||||||||||||||||||||||||||
| Net increase (decrease) in deposits | Net increase (decrease) in deposits | 3,449.0 | 7,002.3 | (4,258.1 | ) | Net increase (decrease) in deposits | 1,688.8 | 3,449.0 | 7,002.3 | |||||||||||||||||||
| Net increase (decrease) in short-term borrowings | Net increase (decrease) in short-term borrowings | 3,869.5 | (7,307.0 | ) | 5,244.3 | Net increase (decrease) in short-term borrowings | 2,234.3 | 3,869.5 | (7,307.0 | ) | ||||||||||||||||||
| Principal payments on long-term debt | (8,617.9 | ) | (8,367.5 | ) | (10,539.6 | ) | ||||||||||||||||||||||
| Principal payments or redemption of long-term debt | Principal payments or redemption of long-term debt | (12,682.8 | ) | (8,967.9 | ) | (8,367.5 | ) | |||||||||||||||||||||
| Proceeds from issuance of long-term debt | Proceeds from issuance of long-term debt | 11,467.5 | 10,650.9 | 11,702.3 | Proceeds from issuance of long-term debt | 13,704.3 | 11,467.5 | 10,650.9 | ||||||||||||||||||||
| Proceeds from issuance of Company-obligated mandatorily redeemable preferred securities | — | — | 1,500.0 | |||||||||||||||||||||||||
| Redemption of Company-obligated mandatorily redeemable preferred securities | (350.0 | ) | — | — | ||||||||||||||||||||||||
| Proceeds from issuance of common stock | Proceeds from issuance of common stock | 398.4 | 147.0 | 136.4 | Proceeds from issuance of common stock | 580.6 | 398.4 | 147.0 | ||||||||||||||||||||
| Repurchase of common stock | Repurchase of common stock | (326.3 | ) | (1,040.4 | ) | (467.9 | ) | Repurchase of common stock | (2,659.6 | ) | (326.3 | ) | (1,040.4 | ) | ||||||||||||||
| Cash dividends paid | Cash dividends paid | (1,556.8 | ) | (1,480.7 | ) | (1,235.1 | ) | Cash dividends paid | (1,820.5 | ) | (1,556.8 | ) | (1,480.7 | ) | ||||||||||||||
| Net cash provided by (used in) financing activities | 8,333.4 | (395.4 | ) | 2,082.3 | Net cash provided by (used in) financing activities | 1,045.1 | 8,333.4 | (395.4 | ) | |||||||||||||||||||
| Change in cash and cash equivalents | (2,409.9 | ) | 1,446.8 | 613.7 | Change in cash and cash equivalents | (2,245.7 | ) | (2,409.9 | ) | 1,446.8 | ||||||||||||||||||
| Cash and cash equivalents at beginning of year | Cash and cash equivalents at beginning of year | 11,192.1 | 9,745.3 | 9,131.6 | Cash and cash equivalents at beginning of year | 8,782.2 | 11,192.1 | 9,745.3 | ||||||||||||||||||||
| Cash and cash equivalents at end of year | $ | 8,782.2 | $ | 11,192.1 | $ | 9,745.3 | Cash and cash equivalents at end of year | $ | 6,536.5 | $ | 8,782.2 | $ | 11,192.1 | |||||||||||||||
Supplemental Cash Flow Disclosures | Supplemental Cash Flow Disclosures | |||||||||||||||||||||||||||
| Cash paid for income taxes | Cash paid for income taxes | $ | 1,767.7 | $ | 1,257.8 | $ | 1,129.5 | |||||||||||||||||||||
| Cash paid for interest | Cash paid for interest | 2,029.8 | 2,077.0 | 2,890.1 | ||||||||||||||||||||||||
| Net noncash transfers to foreclosed property | Net noncash transfers to foreclosed property | 104.5 | 110.0 | 89.5 | ||||||||||||||||||||||||
| Acquisitions | Acquisitions | |||||||||||||||||||||||||||
| Assets acquired | $ | 436.9 | $ | — | $ | 2,068.9 | ||||||||||||||||||||||
| Liabilities assumed | (113.9 | ) | — | (3,821.9 | ) | |||||||||||||||||||||||
| Net | $ | 323.0 | $ | — | $ | (1,753.0 | ) | |||||||||||||||||||||
| Note 1 | Significant Accounting Policies |
U.S. Bancorp and its subsidiaries (the “Company”) is a multi-state financial services holding company headquartered in Minneapolis, Minnesota. The Company provides a full range of financial services including lending and depository services through banking offices principally in 24 states. The Company also engages in credit card, merchant, and ATM processing, mortgage banking, insurance, trust and investment management, brokerage, and leasing activities principally in domestic markets.
Basis of PresentationThe consolidated financial statements include the accounts of the Company and its subsidiaries. The consolidation eliminates all significant intercompany accounts and transactions. Certain items in prior periods have been reclassified to conform to the current presentation. The consolidated financial statements have been retroactively restated due to the adoption of the fair value method of accounting for stock-based compensation as described in Note 2 and to report the results of Piper Jaffray Companies as discontinued operations as described in Note 4 of the Notes to Consolidated Financial Statements.
Uses of EstimatesThe preparation of financial statements in conformity with generally accepted accounting principles requires management to make estimates and assumptions that affect the amounts reported in the financial statements and accompanying notes. Actual experience could differ from those estimates.
BUSINESS SEGMENTS
Within the Company, financial performance is measured by major lines of business based on the products and services provided to customers through its distribution channels. The Company has five reportable operating segments:
Wholesale Bankingoffers lending, depository, treasury management and other financial services to middle market, large corporate and public sector clients.
Consumer Bankingdelivers products and services to the broad consumer market and small businesses through banking offices, telemarketing, on-line services, direct mail and automated teller machines (“ATMs”).
Private Client, Trust and Asset Managementprovides trust, private banking, financial advisory, investment management and mutual fund processing servicesservicing to affluent individuals, businesses, institutions and mutual funds.
Payment Servicesincludes consumer and business credit cards, debit cards, corporate and purchasing card services, consumer lines of credit, ATM processing and merchant processing and debit cards.processing. Customized products and services, coupled with cutting-edge technology are provided to consumer and business customers, government clients, correspondent financial institutions, merchants and co-brand partners.
Treasury and Corporate Supportincludes the Company’s investment portfolios, funding, capital management and asset securitization activities, interest rate risk management, the net effect of transfer pricing related to average balances, and the change in residual allocationsaggregate of expenses associated with the provision for loan losses. It also includes business activities managed on a corporate basis, including income and expense of enterprise-wide operations and administrative support functions.
Segment ResultsAccounting policies for the lines of business are the same as those used in preparation of the consolidated financial statements with respect to activities specifically attributable to each business line. However, the preparation of business line results requires management to establish methodologies to allocate funding costs and benefits, expenses and other financial elements to each line of business. For details of these methodologies and segment results, see “Basis for Financial Presentation” and Table 22 “Line of Business Financial Performance” included in Management’s Discussion and Analysis which is incorporated by reference into these Notes to Consolidated Financial Statements.
SECURITIES
Realized gains or losses on securities are determined on a trade date basis based on the specific carrying value of the investments being sold.
Trading SecuritiesDebt and equity securities held for resale are classified as trading securities and reported at fair value. Realized gains or losses are reported in noninterest income.
Available-for-sale SecuritiesThese securities are not trading securities but may be sold before maturity in response to changes in the Company’s interest rate risk profile, funding needs or demand for collateralized deposits by public entities. Available-for-sale securities are carried at fair value with unrealized net gains or losses reported within other comprehensive income in shareholders’ equity. When sold, the amortized cost of the specific securities is used to compute the gain or loss. Declines in fair value that
Held-to-maturity SecuritiesDebt securities for which the Company has the positive intent and ability to hold to maturity are reported at historical cost adjusted for amortization of premiums and accretion of discounts.
Securities Purchased Under Agreements to Resell and Securities Sold Under Agreements to RepurchaseSecurities purchased under agreements to resell and securities sold under agreements to repurchase are generally accounted for as collateralized financing transactions and are recorded at the amounts at which the securities were acquired or sold, plus accrued interest. Securities pledged as collateral under these financing arrangements cannot be sold or repledged by the secured party. The fair value of collateral received is continually monitored and additional collateral obtained or requested to be returned to the Company as deemed appropriate.
EQUITY INVESTMENTS IN OPERATING ENTITIES
Equity investments in public entities in which ownership is less than 20 percent are accounted for as available-for-sale securities and carried at fair value. Similar investments in private entities are accounted for using the cost method. Investments in entities where ownership interest is between 20 percent and 50 percent are accounted for using the equity method with the exception of limited partnerships and limited liability companies where an ownership interest of greater than 5 percent requires the use of the equity method. If the Company has a voting interest greater than 50 percent, the consolidation method is used. All equity investments are evaluated for impairment at least annually and more frequently if certain criteria are met.
LOANS
Loans are reported net of unearned income. Interest income is accrued on the unpaid principal balances as earned. Loan and commitment fees and certain direct loan origination costs are deferred and recognized over the life of the loan and/or commitment period as yield adjustments.
Commitments to Extend CreditUnfunded residential mortgage loan commitments entered into in connection with mortgage banking activities are considered derivatives and recorded on the balance sheet at fair value with changes in fair value recorded in income. All other unfunded loan commitments are generally related to providing credit facilities to customers of the bank and are not actively traded financial instruments. These unfunded commitments are disclosed as off-balance sheet financial instruments in Note 2324 in the Notes to Consolidated Financial Statements.
Allowance for Credit LossesManagement determines the adequacy of the allowance based on evaluations of the loan portfolio, recent loss experience, and other pertinent factors, including economic conditions. This evaluation is inherently subjective as it requires estimates, including amounts of future cash collections expected on nonaccrual loans, which may be susceptible to significant change. The allowance for credit losses relating to impaired loans is based on the loan’s observable market price, the collateral for certain collateral-dependent loans, or the discounted cash flows using the loan’s effective interest rate.
Nonaccrual LoansGenerally commercial loans (including impaired loans) are placed on nonaccrual status when the collection of interest or principal has become 90 days past due or is otherwise considered doubtful. When a loan is placed on nonaccrual status, unpaid accrued interest is reversed. Future interest payments are generally applied against principal. Revolving consumer lines and credit cards are charged off by 180 days past due and closed-end consumer loans other than loans secured by 1-4 family properties are charged off at 120 days past due and are, therefore, generally not placed on nonaccrual status.
Impaired LoansA loan is considered to be impaired when, based on current information and events, it is probable that the Company will be unable to collect all amounts due (both interest and principal) according to the contractual terms of the loan agreement.
Restructured LoansIn cases where a borrower experiences financial difficulties and the Company makes certain concessionary modifications to contractual terms, the loan is
LeasesThe Company engages in both direct and leveraged lease financing. The net investment in direct financing leases is the sum of all minimum lease payments and estimated residual values, less unearned income. Unearned income is added to interest income over the terms of the leases to produce a level yield.
Loans Held for SaleLoans held for sale (“LHFS”) represent mortgage loan originations intended to be sold in the secondary market and other loans that management has an active plan to sell. LHFS are carried at the lower of cost or market value as determined on an aggregate basis by type of loan. In the event management decides to sell loans receivable, the loans are transferred at the lower of cost or fair value. The Interagency Guidance on Certain Loans Held for Sale, dated March 26, 2001, requires loans transferred to LHFS to be marked-to-market (“MTM”) at the time of transfer. MTM losses related to the sale/transfer of non-homogeneous loans that are predominantly credit-related are reflected in charge-offs. With respect to homogeneous loans, the amount of “probable” credit loss determined in accordance with Statement of Financial Accounting Standards No. 5, (“SFAS 5”), “Accounting for Contingencies,” methodologies utilized to determine the specific allowance allocation for the portfolio is also included in charge-offs. Any incremental loss determined in accordance with MTM accounting, that includes consideration of other factors such as estimates of futureinherent losses, is reported separately from charge-offs as a reduction to the allowance for credit losses. Subsequent decreases in fair value are recognized in noninterest income.
Other Real EstateOther real estate (“ORE”), which is included in other assets, is property acquired through foreclosure or other proceedings. ORE is carried at fair value, less estimated selling costs. The property is evaluated regularly and any decreases in the carrying amount are included in noninterest expense.
DERIVATIVE FINANCIAL INSTRUMENTS
In the ordinary course of business, the Company enters into derivative transactions to manage its interest rate, foreign currency and prepayment risk and to accommodate the business requirements of its customers. All derivative instruments are recorded as either other assets, other liabilities or liabilitiesshort-term borrowings at fair value. Subsequent changes in a derivative’s fair value are recognized currently in earnings unless specific hedge accounting criteria are met.
OTHER SIGNIFICANT POLICIES
Intangible AssetsThe price paid over the net fair value of the acquired businesses (“goodwill”) is not amortized. Other intangible assets are amortized over their estimated useful lives, using straight-line and accelerated methods. The recoverability of goodwill and other intangible assets is evaluated annually, at a minimum, or on an interim basis if events or circumstances indicate a possible inability to realize the carrying amount. The evaluation includes assessing the estimated fair value of the intangible asset based on market prices for similar assets, where available, and the present value of the estimated future cash flows associated with the intangible asset.
Income TaxesDeferred taxes are recorded to reflect the tax consequences on future years of differences between the tax basesbasis of assets and liabilities and the financial reporting amounts at each year-end.
Mortgage Servicing RightsMortgage servicing rights (“MSRs”) are capitalized as separate intangible assets when loans are sold and servicing is retained. The total cost of loans sold is allocated between the loans sold and the servicing assets retained based on their relative fair values. MSRs that are purchased from others are initially recorded at cost. The carrying value of the MSRs is amortized in proportion to, and over the period of, estimated net servicing revenue and recorded in noninterest expense as amortization of intangible assets. The carrying value of these assets is periodically reviewed for impairment using a lower of carrying value or fair value methodology. For purposes of measuring impairment, the servicing rights are stratified based on the underlying loan type and note rate and the carrying value of each stratum is compared to fair value based on a discounted cash flow analysis, utilizing current prepayment speeds and discount rates. Events that may significantly affect the estimates used are changes in interest rates and the related impact on mortgage loan prepayment speed and the payment performance of the underlying loans. If the carrying value is greater than fair value, impairment is recognized through a valuation allowance for each impaired stratum and recorded as amortization of intangible assets. The valuation allowance is adjusted each subsequent period to reflect any increase or decrease in the indicated impairment. The Company reviews mortgage servicing rights for other-than-temporary impairment each quarter and recognizes a direct write-down when the recoverability of a recorded valuation allowance is determined to be remote. In determining whether other-than-temporary impairment has taken place, the Company considers both historical and projected trends in pay off activity and the potential for impairment recovery. Unlike a valuation allowance, a direct write-down permanently reduces the carrying value of the mortgage servicing rights, precluding subsequent reversals.
PensionsFor purposes of its retirement plans, the Company utilizes a measurement date of September 30. At the measurement date, plan assets are determined based on fair value, generally representing observable market prices. The actuarial cost method used to compute the pension liabilities and related expense is the projected unit credit method. In essence, theThe projected benefit obligation is principally determined based on the present value of projected benefit distributions at an assumed discount rate. The discount rate utilized is based on match-funding maturities and interest payments of high quality corporate bonds available in the market place to projected cash flows as of the measurement date for future benefit payments. Periodic pension expense (or credits) includes service costs, interest costs based on the assumed discount rate, the expected return on plan assets based on an actuarially derived market-related value and amortization of actuarial gains and losses. Pension accounting reflects the long-term nature of benefit obligations and the investment horizon of plan assets and can have the effect of reducing earnings volatility related to short-term changes in interest rates and market valuations. Actuarial gains and losses include the impact of plan amendments and various unrecognized gains and losses which are deferred and amortized over the future service periods of active employees. The market-related value utilized to determine the expected return on plan assets is based on fair value adjusted for the difference between expected returns and actual performance of plan assets. The unrealized difference between actual experience and expected returns is included in the market-related value ratably over a five-year period.
Premises and EquipmentPremises and equipment are stated at cost less accumulated depreciation and depreciated primarily on a straight-line basis over the estimated life of the assets. Estimated useful lives range up to 40 years for newly constructed buildings and from 3 to 20 years for furniture and equipment.
Statement of Cash FlowsFor purposes of reporting cash flows, cash and cash equivalents include cash and money market investments, defined as interest-bearing amounts due
Stock-Based CompensationThe Company grants stock awards including restricted stock and options to purchase common stock of the Company. Stock option grants are for a fixed number of shares to employees and directors with an exercise price equal to the fair value of the shares at the date of grant. The Company recognizes stock-based compensation in its results of operations utilizing the fair value method under Statement of Financial Accounting Standard No. 123, “Accounting for Stock-BasedStock-based Compensation” (“SFAS 123”). Stock-based compensation is recognized using an accelerated method of amortization for awards with graded vesting features and on a straight-line basis for awards with cliff vesting. The amortization of stock-based compensation reflects estimated forfeitures adjusted for actual forfeiture experience. As compensation expense is recognized, a deferred tax asset is recorded that represents an estimate of the future tax deduction from exercise or release of restrictions. At the time stock options are exercised, cancelled or expire, the Company may be required to recognize an adjustment to tax expense.
Per Share CalculationsEarnings per share is calculated by dividing net income by the weighted average number of common shares outstanding during the year. Diluted earnings per share is calculated by adjusting income and outstanding shares, assuming conversion of all potentially dilutive securities, using the treasury stock method. All per share amounts have been restated for stock splits.
| Note 2 | Accounting Changes |
Accounting for Certain Financial Instruments with Characteristics of Both Liabilities and EquityIn May 2003, the Financial Accounting Standards Board issued Statement of Financial Accounting Standards No. 150 (“SFAS 150”), “Accounting for Certain Financial Instruments with Characteristics of Both Liabilities and Equity,” which establishes standards for how an issuer classifies and measures certain financial instruments with characteristics of both liabilities and equity. The Company adopted SFAS 150 for financial instruments entered into or modified after May 31, 2003, and adopted for all other financial instruments as of July 1, 2003. The adoption of SFAS 150 did not have a material impact on the Company’s financial instruments.
Derivative Instruments and Hedging ActivitiesIn April 2003, the Financial Accounting Standards Board issued Statement of Financial Accounting Standards No. 149 (“SFAS 149”), “Amendment of Statement 133 on Derivative Instruments and Hedging Activities,” which amends and clarifies accounting and reporting standards for derivative instruments, including certain derivative instruments embedded in other contracts and for hedging activities under Statement of Financial Accounting Standards No. 133 (“SFAS 133”), “Accounting for Derivative Instruments and Hedging Activities.” In particular, SFAS 149 clarifies under what circumstances a contract with an initial net investment meets the characteristic of a derivative and clarifies when a derivative contains a financing component. SFAS 149 is generally effective for contracts entered into or modified after June 30, 2003. The adoption of SFAS 149 did not have a material impact on the Company’s financial statements.
Consolidation of Variable Interest EntitiesIn January 2003, the Financial Accounting Standards Board issued Interpretation No. 46 (revised December 2003) (“FIN 46”), “Consolidation of Variable Interest Entities” (“VIEs”), an interpretation of Accounting Research Bulletin No. 51, “Consolidated Financial Statements,” to improve financial reporting of special purpose and other entities. The interpretation requires the consolidation of entities in which an enterprise absorbs a majority of the entity’s expected losses, receives a majority of the entity’s expected residual returns, or both, as a result of ownership, contractual or other financial interests in the entity. Prior to the issuance of FIN 46, consolidation generally occurred when an enterprise controlled another entity through voting interests. Certain VIEs that are qualifying special purpose entities (“QSPEs”) subject to the reporting requirements of Statement of Financial Accounting Standards No. 140 (“SFAS 140”), “Accounting for Transfers and Servicing of Financial Assets and Extinguishment of Liabilities,” are not required to be consolidated under the provisions of FIN 46. The consolidation provisions of FIN 46 apply to VIEs created or entered into after January 31, 2003. For VIEs created before February 1, 2003, the provisions of FIN 46 were effective for entities commonly referred to as special purpose entities (“SPEs”) for periods ending after December 15, 2003, and for all other types of entities was deferred to periods ending after March 15, 2004.
Stock-Based CompensationIn December 2002, the Financial Accounting Standards Board issued Statement of Financial Accounting Standards No. 148 (“SFAS 148”), “Accounting for Stock-Based Compensation — Transition and Disclosure,” an amendment of SFAS 123. SFAS 148 provides alternative methods of transition for a voluntary change to the fair value based method of accounting for stock-based employee compensation. In previous years, the Company accounted for stock-based employee compensation under the intrinsic based method and provided disclosure of the impact of the fair value based method on reported income. For its 2003 financial statements, the Company elected to adopt the fair value method using the retroactive restatement approach. All prior periods presented have been restated to reflect the compensation cost that would have been recognized had the recognition provisions of SFAS 123 been applied to all awards granted to employees after January 1, 1995, that remained unvested at the beginning of the first period presented.
Loan CommitmentsOn March 9, 2004, the Securities and Exchange Commission staff issued Staff Accounting Bulletin No. 105 (“SAB 105”), “Application of Guarantees In November 2002, the Financial Accounting Standards Board issued Interpretation No. 45 (“FIN 45”), “Guarantor’s Accounting and Disclosure Requirements for Guarantees, Including Indirect Guarantees of Indebtedness of Others,” to clarify accounting and disclosure requirements relating to a guarantor’s issuance of certain types of guarantees. FIN 45 requires entities to disclose additional information about certain guarantees, or group of similar guarantees, even if the likelihood of the guarantor’s having to make any payments under the guarantee is remote. The disclosure provisions are effective for interim and annual financial statements for the first reporting period ending after December 15, 2002. For certain guarantees, the interpretation also requires that guarantors recognize a liability equal to the fair value of the guarantee upon its issuance. The Company adopted the initial recognition and measurement provision effective January 1, 2003, which did not have a material impact on the Company’s financial statements.Business Combinations and Goodwill and Other Intangible AssetsIn June 2001,2004, the Financial Accounting Standards Board issued Statement of Financial Accounting Standards No. 141123 (revised 2004) (“SFAS 141”123R”), “Business Combinations,” and Statement“Share-Based Payment” a revision of Financial Accounting Standards No. 142 (“SFAS 142”), “Goodwill and Other Intangible Assets.”123. SFAS 141 mandates that123R requires companies to measure the purchasecost of employee services in exchange for an award of equity instruments based on the grant-date fair value of the award. This statement eliminates the use of the alternative intrinsic value method of accounting be used for all business combinations initiated after June 30, 2001, and established specific criteria for the recognition of intangible assets separately from goodwill.that was allowed when SFAS 142 addresses the accounting for goodwill and intangible assets subsequent to their acquisition.123 was originally issued. The Company adopted SFAS 142 on January 1, 2002. The most significant changes made by SFAS 142 are that goodwill and indefinite lived intangible assets are no longer amortized and are to be tested for impairment at least annually. The amortization provisions of SFAS 142 apply to goodwill and intangible assets acquired after June 30, 2001. With respect to goodwill and intangible assets acquired prior to July 1, 2001, the amortization provisions of SFAS 142 werethis statement are effective upon adoption of SFAS 142. Applying the provisions of SFAS 141 to recent acquisitions and the provisions of SFAS 142 to purchase acquisitions completed prior to July 1, 2001, increased after-tax income for the year ended December 31, 2002, by $205.6 million, or $.11 per diluted share. During the first quarter of 2002, the Company completed its initial impairment test as required by SFAS 142. As a result of this initial impairment test, the Company recognized an after-tax goodwill impairment charge of $37.2 million as a “cumulative effect of accounting change” in the income statement in the first quarterinterim reporting period beginning after June 15, 2005. Because the Company retroactively adopted the fair value method in 2003, the revised statement will not have a significant impact on the Company’s financial statements.2002.Accounting Principles to Loan Commitments,” which provides guidance regarding loan commitments accounted for as derivative instruments and is effective for commitments entered into after March 31, 2004. The impairment was primarilyguidance clarifies that expected future cash flows related to the purchaseservicing of a transportation leasingU.S. Bancorp 71
| Note 3 | Business Combinations |
On July 24, 2001,June 29, 2004, the Company acquired NOVA Corporationpurchased the remaining 50 percent ownership interest of EuroConex Technologies Ltd (“NOVA”EuroConex”), a from the Bank of Ireland. In addition, during the second and fourth quarter of 2004, the Company completed three separate transactions to acquire merchant processor,processing businesses in a stockPoland, the United Kingdom and cash transaction valued at approximately $2.1 billion. The transactionNorway. In connection with these transactions, EuroConex and its affiliates provide debit and credit card processing services to merchants, directly and through alliances with banking partners in these European markets. These transactions represented total assets acquired of $2.9 billion$377 million and total liabilities assumed of $773 million.$115 million at the closing date. Included in total assets were merchant contractscontract and other intangibles of $650 million and the excess of purchase price over thewith a fair value of identifiable net assets (“goodwill”)$163 million and goodwill of $1.6 billion.$105 million. The goodwill reflected NOVA’s leadership position in the strategic value of these businesses to the Company’s European merchant processing marketbusiness and its ability to provide a technologically superior productanticipated economies of scale that is enhanced by a high level of customer service. The Company believes thatwill result from these factors, among others, will allow NOVA to generate sufficient positive cash flows from new business in future periods to support the goodwill recorded in connection with the acquisition.transactions.
The following table summarizes significant acquisitions by the Company completed since January 1, 2001, treating Firstar Corporation as the original acquiring company:2002:
| Goodwill | ||||||||||||||||||||||||||||
| and Other | Cash Paid / | Accounting | ||||||||||||||||||||||||||
| (Dollars and Shares in Millions) | Date | Assets (a) | Deposits | Intangibles | (Received) | Shares Issued | Method | |||||||||||||||||||||
| Corporate Trust business of State Street Bank and Trust Company | December 2002 | $ | 13 | $ | — | $ | 667 | $ | 643 | — | Purchase | |||||||||||||||||
| Bay View Bank branches | November 2002 | 362 | 3,305 | 483 | (2,494 | ) | — | Purchase | ||||||||||||||||||||
| The Leader Mortgage Company, LLC | April 2002 | 517 | — | 191 | 85 | — | Purchase | |||||||||||||||||||||
| Pacific Century Bank | September 2001 | 570 | 712 | 134 | (43 | ) | — | Purchase | ||||||||||||||||||||
| NOVA Corporation | July 2001 | 949 | — | 2,231 | 842 | 57.0 | Purchase | |||||||||||||||||||||
| U.S. Bancorp | February 2001 | 86,602 | 51,335 | — | — | 952.4 | Pooling | |||||||||||||||||||||
| Goodwill | ||||||||||||||||||||||||
| and Other | Cash Paid / | Accounting | ||||||||||||||||||||||
| (Dollars in Millions) | Date | Assets (a) | Deposits | Intangibles | (Received) | Method | ||||||||||||||||||
| Nova European acquisitions | April 2004- November 2004 | $ | 109 | $ | — | $ | 268 | $ | 259 | Purchase | ||||||||||||||
| Corporate trust business of State Street Bank and Trust Company | December 2002 | 13 | — | 738 | 638 | Purchase | ||||||||||||||||||
| Bay View Bank branches | November 2002 | 362 | 3,305 | 483 | (2,494 | ) | Purchase | |||||||||||||||||
| The Leader Mortgage Company, LLC | April 2002 | 517 | — | 191 | 85 | Purchase | ||||||||||||||||||
| (a) | Assets acquired do not include purchase accounting adjustments. |
| Note 4 | Discontinued Operations |
On February 19, 2003, the Company announced that its Board of Directors approved a plan to effect a distribution of its capital markets business unit, including the investment banking and brokerage activities primarily conducted by its wholly-owned subsidiary, Piper Jaffray Companies. On December 31, 2003, the Company completed the distribution of all the outstanding shares of common stock of Piper Jaffray Companies to its shareholders. This non-cash distribution was tax-free to the Company, its shareholders and Piper Jaffray Companies.
The following table represents the condensed results of operations for discontinued operations:
| Year Ended December 31 (Dollars in Millions) | Year Ended December 31 (Dollars in Millions) | 2003 | 2002 | 2001 | Year Ended December 31 (Dollars in Millions) | 2003 | 2002 | |||||||||||||||
| Revenue | Revenue | $ | 783.4 | $ | 729.0 | $ | 800.8 | Revenue | $ | 783.4 | $ | 729.0 | ||||||||||
| Noninterest expense | Noninterest expense | 716.5 | 760.3 | 870.3 | Noninterest expense | 716.5 | 760.3 | |||||||||||||||
| Income (loss) from discontinued operations | Income (loss) from discontinued operations | 66.9 | (31.3 | ) | (69.5 | ) | Income (loss) from discontinued operations | 66.9 | (31.3 | ) | ||||||||||||
| Costs of disposal (a) | Costs of disposal (a) | 27.6 | — | — | Costs of disposal (a) | 27.6 | — | |||||||||||||||
| Income taxes (benefit) | Income taxes (benefit) | 16.8 | (8.6 | ) | (24.3 | ) | Income taxes (benefit) | 16.8 | (8.6 | ) | ||||||||||||
| Discontinued operations, net of tax | $ | 22.5 | $ | (22.7 | ) | $ | (45.2 | ) | Discontinued operations, net of tax | $ | 22.5 | $ | (22.7 | ) | ||||||||
| (a) | The $27.6 million of disposal costs related to discontinued operations primarily represents legal, investment banking and other costs directly related to the distribution. |
| December 31 (Dollars in Millions) | December 31 (Dollars in Millions) | 2003 | 2002 | December 31 (Dollars in Millions) | 2003 | |||||||||
Assets | Assets | Assets | ||||||||||||
| Cash and cash equivalents | Cash and cash equivalents | $ | 382 | $ | 271 | Cash and cash equivalents | $ | 382 | ||||||
| Trading securities | Trading securities | 656 | 463 | Trading securities | 656 | |||||||||
| Loans | — | 2 | ||||||||||||
| Goodwill | Goodwill | 306 | 306 | Goodwill | 306 | |||||||||
| Other assets (a) | Other assets (a) | 1,025 | 954 | Other assets (a) | 1,025 | |||||||||
| Total assets | $ | 2,369 | $ | 1,996 | Total assets | $ | 2,369 | |||||||
Liabilities | Liabilities | Liabilities | ||||||||||||
| Deposits | Deposits | $ | 6 | $ | 7 | Deposits | $ | 6 | ||||||
| Short-term borrowings | Short-term borrowings | 905 | 707 | Short-term borrowings | 905 | |||||||||
| Long-term debt | Long-term debt | 180 | 215 | Long-term debt | 180 | |||||||||
| Other liabilities (b) | Other liabilities (b) | 593 | 458 | Other liabilities (b) | 593 | |||||||||
| Total liabilities | $ | 1,684 | $ | 1,387 | Total liabilities | $ | 1,684 | |||||||
| (a) | Includes customer margin account receivables, due from brokers/dealers and other assets. |
| (b) | Includes accrued expenses, due to brokers/dealers and other liabilities. |
Following the distribution, the Company’s wholly-owned subsidiary, USB Holdings, Inc. holds a $180 million subordinated debt facility with Piper Jaffray & Co., a broker-dealer subsidiary of Piper Jaffray Companies. In addition, the Company provides an indemnification in an amount up to $17.5 million with respect to certain specified liabilities primarily resulting from third-party claims relating to research analyst independence and from certain regulatory investigations, as defined in the separation and distribution agreement entered into with Piper Jaffray Companies at the time of the distribution. Through December 31, 2004, the Company has paid approximately $3.3 million to Piper Jaffray Companies under this indemnification agreement.
| Note 5 | Merger and Restructuring-Related Items |
The Company recorded pre-tax merger and restructuring-related itemscharges of $46.2 million $321.2 million, and $1,364.8$321.2 million in 2003 2002, and 2001,2002, respectively. In 2003, merger-related items were primarily incurred in connection with the NOVA Corporation acquisition and the Company’s various other acquisitions, including BayViewprimarily Bay View and State Street Corporate Trust. In 2002, and 2001, merger-related items included costs associated with the Firstar/USBM former U.S. Bancorp of Minneapolis (“USBM”) merger, NOVA and other smaller acquisitions noted below and in Note 3 — Business Combinations.acquisitions.
The components of the merger and restructuring-related items are shown below:
| (Dollars in Millions) | (Dollars in Millions) | USBM | NOVA | Other (a) | Total | (Dollars in Millions) | USBM | NOVA | Other (a) | Total | ||||||||||||||||||||||||
2003 | 2003 | 2003 | ||||||||||||||||||||||||||||||||
| Severance and employee-related | Severance and employee-related | $ | — | $ | .8 | $ | — | $ | .8 | Severance and employee-related | $ | — | $ | .8 | $ | — | $ | .8 | ||||||||||||||||
| Systems conversions and integration | Systems conversions and integration | — | 25.9 | 6.9 | 32.8 | Systems conversions and integration | — | 25.9 | 6.9 | 32.8 | ||||||||||||||||||||||||
| Asset write-downs and lease terminations | Asset write-downs and lease terminations | — | 6.8 | 3.0 | 9.8 | Asset write-downs and lease terminations | — | 6.8 | 3.0 | 9.8 | ||||||||||||||||||||||||
| Other merger-related items | Other merger-related items | — | — | 1.4 | 1.4 | Other merger-related items | — | — | 1.4 | 1.4 | ||||||||||||||||||||||||
| Total 2003 | Total 2003 | $ | — | $ | 33.5 | $ | 11.3 | $ | 44.8 | Total 2003 | $ | — | $ | 33.5 | $ | 11.3 | $ | 44.8 | ||||||||||||||||
| Noninterest expense | Noninterest expense | $ | — | $ | 33.5 | $ | 12.7 | $ | 46.2 | Noninterest expense | $ | — | $ | 33.5 | $ | 12.7 | $ | 46.2 | ||||||||||||||||
| Balance sheet recognition | Balance sheet recognition | — | — | (1.4 | ) | (1.4 | ) | Balance sheet recognition | — | — | (1.4 | ) | (1.4 | ) | ||||||||||||||||||||
| Merger-related items — 2003 | $ | — | $ | 33.5 | $ | 11.3 | $ | 44.8 | Merger-related items — 2003 | $ | — | $ | 33.5 | $ | 11.3 | $ | 44.8 | |||||||||||||||||
2002 | 2002 | 2002 | ||||||||||||||||||||||||||||||||
| Severance and employee-related | Severance and employee-related | $ | 4.1 | $ | (3.8 | ) | $ | 9.1 | $ | 9.4 | Severance and employee-related | $ | 4.1 | $ | (3.8 | ) | $ | 9.1 | $ | 9.4 | ||||||||||||||
| Systems conversions and integration | Systems conversions and integration | 194.9 | 29.4 | 17.3 | 241.6 | Systems conversions and integration | 194.9 | 29.4 | 17.3 | 241.6 | ||||||||||||||||||||||||
| Asset write-downs and lease terminations | Asset write-downs and lease terminations | 104.0 | 14.2 | 6.0 | 124.2 | Asset write-downs and lease terminations | 104.0 | 14.2 | 6.0 | 124.2 | ||||||||||||||||||||||||
| Balance sheet restructurings | (38.8 | ) | — | — | (38.8 | ) | ||||||||||||||||||||||||||||
| Other merger-related items | Other merger-related items | 4.8 | (1.1 | ) | 3.5 | 7.2 | Other merger-related items | (34.0 | ) | (1.1 | ) | 3.5 | (31.6 | ) | ||||||||||||||||||||
| Total 2002 | Total 2002 | $ | 269.0 | $ | 38.7 | $ | 35.9 | $ | 343.6 | Total 2002 | $ | 269.0 | $ | 38.7 | $ | 35.9 | $ | 343.6 | ||||||||||||||||
| Noninterest expense | Noninterest expense | $ | 269.0 | $ | 34.9 | $ | 17.3 | $ | 321.2 | Noninterest expense | $ | 269.0 | $ | 34.9 | $ | 17.3 | $ | 321.2 | ||||||||||||||||
| Balance sheet recognition | Balance sheet recognition | — | 3.8 | 18.6 | 22.4 | Balance sheet recognition | — | 3.8 | 18.6 | 22.4 | ||||||||||||||||||||||||
| Merger-related items — 2002 | $ | 269.0 | $ | 38.7 | $ | 35.9 | $ | 343.6 | Merger-related items — 2002 | $ | 269.0 | $ | 38.7 | $ | 35.9 | $ | 343.6 | |||||||||||||||||
2001 | ||||||||||||||||||||||||||||||||||
| Severance and employee-related | $ | 238.6 | $ | 23.3 | $ | 17.8 | $ | 279.7 | ||||||||||||||||||||||||||
| Stock-based compensation | 190.5 | — | — | 190.5 | ||||||||||||||||||||||||||||||
| Systems conversions and integration | 207.1 | 1.6 | 15.2 | 223.9 | ||||||||||||||||||||||||||||||
| Asset write-downs and lease terminations | 130.4 | 34.7 | 5.7 | 170.8 | ||||||||||||||||||||||||||||||
| Charitable contributions | 76.0 | — | — | 76.0 | ||||||||||||||||||||||||||||||
| Balance sheet restructurings | 457.6 | — | — | 457.6 | ||||||||||||||||||||||||||||||
| Branch sale gain | (62.2 | ) | — | — | (62.2 | ) | ||||||||||||||||||||||||||||
| Branch consolidations | 20.0 | — | — | 20.0 | ||||||||||||||||||||||||||||||
| Other merger-related items | 69.1 | 24.2 | 4.8 | 98.1 | ||||||||||||||||||||||||||||||
| Total 2001 | $ | 1,327.1 | $ | 83.8 | $ | 43.5 | $ | 1,454.4 | ||||||||||||||||||||||||||
| Provision for credit losses | $ | 382.2 | $ | — | $ | — | $ | 382.2 | ||||||||||||||||||||||||||
| Noninterest income | (62.2 | ) | — | — | (62.2 | ) | ||||||||||||||||||||||||||||
| Noninterest expense | 1,007.1 | 1.6 | 36.1 | 1,044.8 | ||||||||||||||||||||||||||||||
| Merger-related items | $ | 1,327.1 | $ | 1.6 | $ | 36.1 | $ | 1,364.8 | ||||||||||||||||||||||||||
| Balance sheet recognition | — | 82.2 | 7.4 | 89.6 | ||||||||||||||||||||||||||||||
| Merger-related items — 2001 | $ | 1,327.1 | $ | 83.8 | $ | 43.5 | $ | 1,454.4 | ||||||||||||||||||||||||||
| (a) | In 2003 and 2002, “Other” primarily included merger and restructuring-related items pertaining to the Bay View acquisition, State Street Corporate Trust and the Lyon Financial acquisition. |
The Company determines merger and restructuring-related items and related accruals based on its integration strategy and formulated plans. These plans are established as of the acquisition date and are regularly evaluated during the integration process.
The following table presents a summary of activity with respect to the merger and restructuring-related accruals:
| (Dollars in Millions) | USBM | NOVA | Other (a) | Total | |||||||||||||
| Balance at December 31, 2000 | �� | $ | — | $ | — | $ | 46.6 | $ | 46.6 | ||||||||
| Provision charged to operating expense | 1,327.1 | 1.6 | 36.1 | 1,364.8 | |||||||||||||
| Additions related to purchase acquisitions | — | 82.2 | 7.4 | 89.6 | |||||||||||||
| Cash outlays | (532.2 | ) | (32.4 | ) | (66.3 | ) | (630.9 | ) | |||||||||
| Noncash write-downs and other | (670.6 | ) | (3.0 | ) | (11.0 | ) | (684.6 | ) | |||||||||
| Balance at December 31, 2001 | 124.3 | 48.4 | 12.8 | 185.5 | |||||||||||||
| Provision charged to operating expense | 269.0 | 34.9 | 17.3 | 321.2 | |||||||||||||
| Additions related to purchase acquisitions | — | 3.8 | 18.6 | 22.4 | |||||||||||||
| Cash outlays | (325.8 | ) | (36.2 | ) | (24.6 | ) | (386.6 | ) | |||||||||
| Noncash write-downs and others | (48.9 | ) | (35.8 | ) | (5.7 | ) | (90.4 | ) | |||||||||
| Balance at December 31, 2002 | 18.6 | 15.1 | 18.4 | 52.1 | |||||||||||||
| Provision charged to operating expense | — | 33.5 | 12.7 | 46.2 | |||||||||||||
| Additions (adjustments) related to purchase acquisitions | — | — | (1.4 | ) | (1.4 | ) | |||||||||||
| Cash outlays | (16.2 | ) | (29.1 | ) | (14.1 | ) | (59.4 | ) | |||||||||
| Noncash write-downs and others | — | (1.4 | ) | (11.5 | ) | (12.9 | ) | ||||||||||
| Balance at December 31, 2003 | $ | 2.4 | $ | 18.1 | $ | 4.1 | $ | 24.6 | |||||||||
The adequacy of the accrued liabilities is reviewed regularly taking into consideration actual and projected payments. Adjustments are made to increase or decrease these accruals as needed. Reversals of expenses can reflect a lower utilization of benefits by affected staff, changes in initial assumptions as a result of subsequent mergers and alterations of business plans.
| December 31, | December 31, | December 31, | ||||||||||||
| (Dollars in Millions) | (Dollars in Millions) | 2003 | 2002 | (Dollars in Millions) | 2003 | |||||||||
| Severance | Severance | $ | 3.4 | $ | 30.2 | Severance | $ | 3.4 | ||||||
| Other employee-related costs | Other employee-related costs | 1.1 | 3.1 | Other employee-related costs | 1.1 | |||||||||
| Lease termination and facility costs | Lease termination and facility costs | 14.4 | 17.2 | Lease termination and facility costs | 14.4 | |||||||||
| Contracts and system write-offs | Contracts and system write-offs | 2.4 | .5 | Contracts and system write-offs | 2.4 | |||||||||
| Other | Other | 3.3 | 1.1 | Other | 3.3 | |||||||||
| Total | $ | 24.6 | $ | 52.1 | Total | $ | 24.6 | |||||||
The merger and restructuring-related accruals by significant acquisition or business restructuring was as follows:
| December 31, | December 31, | December 31, | ||||||||||||
| (Dollars in Millions) | (Dollars in Millions) | 2003 | 2002 | (Dollars in Millions) | 2003 | |||||||||
| NOVA | NOVA | $ | 18.1 | $ | 15.1 | NOVA | $ | 18.1 | ||||||
| State Street Corporate Trust | State Street Corporate Trust | 4.1 | 7.8 | State Street Corporate Trust | 4.1 | |||||||||
| USBM | USBM | 2.4 | 18.6 | USBM | 2.4 | |||||||||
| Bay View | — | 5.8 | ||||||||||||
| Other acquisitions | — | 4.8 | ||||||||||||
| Total | $ | 24.6 | $ | 52.1 | Total | $ | 24.6 | |||||||
At December 31, 2002, the integration of Firstar and USBM was completed, and no additional merger and restructuring related charges occurred in 2003.completed. The only activity in the USBM accrualliability during 20032004 was related to the payout of severance costs that continue to be paid through the period provided for in the Company’s severance plans.costs. In 2003, the integration of merchant processing platforms and business processes of U.S.U.S Bank National Association and NOVA, as well as systems conversions for the acquisitions of the State Street Corporate Trust business and Bay View were completed. The Company does not anticipate any merger or restructuring-related expenses in 2004 related to completed acquisitions.
| Note 6 | Restrictions on Cash and Due from Banks |
Bank subsidiaries are required to maintain minimum average reserve balances with the Federal Reserve Bank. The amount of those reserve balances was approximately $243$169 million at December 31, 2003.2004.
| Note 7 | Investment Securities |
The detail of the amortized cost, gross unrealized holding gains and losses, and fair value of held-to-maturity and available-for-sale securities at December 31 was as follows:
| 2003 | 2002 | ||||||||||||||||||||||||||||||||||||||||||||||||||||||||||||||||||
| 2004 | 2003 | ||||||||||||||||||||||||||||||||||||||||||||||||||||||||||||||||||
| Gross | Gross | Gross | Gross | ||||||||||||||||||||||||||||||||||||||||||||||||||||||||||||||||
| Unrealized | Unrealized | Unrealized | Unrealized | ||||||||||||||||||||||||||||||||||||||||||||||||||||||||||||||||
| Amortized | Holding | Holding | Fair | Amortized | Holding | Holding | Fair | Amortized | Unrealized | Unrealized | Fair | Amortized | Unrealized | Unrealized | Fair | ||||||||||||||||||||||||||||||||||||||||||||||||||||
| (Dollars in Millions) | (Dollars in Millions) | Cost | Gains | Losses | Value | Cost | Gains | Losses | Value | (Dollars in Millions) | Cost | Gains | Losses | Value | Cost | Gains | Losses | Value | |||||||||||||||||||||||||||||||||||||||||||||||||
Held-to-maturity (a) | Held-to-maturity (a) | Held-to-maturity (a) | |||||||||||||||||||||||||||||||||||||||||||||||||||||||||||||||||
| Mortgage-backed securities | $ | 14 | $ | — | $ | — | $ | 14 | $ | 20 | $ | — | $ | — | $ | 20 | Mortgage-backed securities | $ | 11 | $ | — | $ | — | $ | 11 | $ | 14 | $ | — | $ | — | $ | 14 | ||||||||||||||||||||||||||||||||||
| Obligations of state and political subdivisions | 138 | 11 | (2 | ) | 147 | 213 | 14 | (7 | ) | 220 | Obligations of state and political subdivisions | 98 | 7 | (2 | ) | 103 | 138 | 11 | (2 | ) | 147 | ||||||||||||||||||||||||||||||||||||||||||||||
| Other debt securities | 18 | — | — | 18 | — | — | — | — | |||||||||||||||||||||||||||||||||||||||||||||||||||||||||||
| Total held-to-maturity securities | $ | 152 | $ | 11 | $ | (2 | ) | $ | 161 | $ | 233 | $ | 14 | $ | (7 | ) | $ | 240 | |||||||||||||||||||||||||||||||||||||||||||||||||
| Total held-to-maturity securities | $ | 127 | $ | 7 | $ | (2 | ) | $ | 132 | $ | 152 | $ | 11 | $ | (2 | ) | $ | 161 | |||||||||||||||||||||||||||||||||||||||||||||||||
Available-for-sale (b) | Available-for-sale (b) | Available-for-sale (b) | |||||||||||||||||||||||||||||||||||||||||||||||||||||||||||||||||
| U.S. Treasury and agencies | $ | 1,634 | $ | 10 | $ | (69 | ) | $ | 1,575 | $ | 421 | $ | 15 | $ | — | $ | 436 | U.S. Treasury and agencies | $ | 684 | $ | 3 | $ | (8 | ) | $ | 679 | $ | 1,634 | $ | 10 | $ | (69 | ) | $ | 1,575 | |||||||||||||||||||||||||||||||
| Mortgage-backed securities | 40,229 | 203 | (407 | ) | 40,025 | 24,967 | 699 | — | 25,666 | Mortgage-backed securities | 39,809 | 65 | (337 | ) | 39,537 | 40,229 | 203 | (407 | ) | 40,025 | |||||||||||||||||||||||||||||||||||||||||||||||
| Asset-backed securities | 250 | 5 | (3 | ) | 252 | 646 | 28 | (4 | ) | 670 | Asset-backed securities | 64 | — | — | 64 | 250 | 5 | (3 | ) | 252 | |||||||||||||||||||||||||||||||||||||||||||||||
| Obligations of state and political subdivisions | 335 | 13 | — | 348 | 558 | 22 | (1 | ) | 579 | Obligations of state and political subdivisions | 205 | 6 | — | 211 | 335 | 13 | — | 348 | |||||||||||||||||||||||||||||||||||||||||||||||||
| Other securities and investments | 993 | 9 | (20 | ) | 982 | 949 | 2 | (47 | ) | 904 | Other securities and investments | 863 | 11 | (11 | ) | 863 | 993 | 9 | (20 | ) | 982 | ||||||||||||||||||||||||||||||||||||||||||||||
| Total available-for-sale securities | $ | 43,441 | $ | 240 | $ | (499 | ) | $ | 43,182 | $ | 27,541 | $ | 766 | $ | (52 | ) | $ | 28,255 | Total available-for-sale securities | $ | 41,625 | $ | 85 | $ | (356 | ) | $ | 41,354 | $ | 43,441 | $ | 240 | $ | (499 | ) | $ | 43,182 | ||||||||||||||||||||||||||||||
| (a) | Held-to-maturity securities are carried at historical cost adjusted for amortization of premiums and accretion of discounts. |
| (b) | Available-for-sale securities are carried at fair value with unrealized net gains or losses reported within other comprehensive income in shareholders’ equity. |
The fair value of available-for-sale investmentssecurities shown above includes investmentssecurities totaling $266.1 million$4.8 billion with unrealized losses of $19.8$148.8 million which have been in an unrealized loss position for greater than 12 months. The investments primarily represent 43 trust preferred securities from 13 bank issuers. All principal and interest payments on available-for-sale debt securities in an unrealized loss position for greater than 12 months are expected to be collected given the high credit quality of the U.S. government agency debt securities and
The following table provides information as to the amount of interest income from taxable and non-taxable investment securities:
| (Dollars in Millions) | 2004 | 2003 | 2002 | ||||||||||
| Taxable | $ | 1,808.6 | $ | 1,654.6 | $ | 1,438.2 | |||||||
| Non-taxable | 18.5 | 29.4 | 46.1 | ||||||||||
| Total interest income from investment securities | $ | 1,827.1 | $ | 1,684.0 | $ | 1,484.3 | |||||||
The following table provides information as to the amount of gross gains and losses realized through the sales of available-for-sale investment securities.
| (Dollars in Millions) | (Dollars in Millions) | 2003 | 2002 | 2001 | (Dollars in Millions) | 2004 | 2003 | 2002 | ||||||||||||||||||
| Realized gains | Realized gains | $ | 363.9 | $ | 316.5 | $ | 333.0 | Realized gains | $ | 104.5 | $ | 363.9 | $ | 316.5 | ||||||||||||
| Realized losses | Realized losses | (119.1 | ) | (16.6 | ) | (3.9 | ) | Realized losses | (209.4 | ) | (119.1 | ) | (16.6 | ) | ||||||||||||
| Net realized gains (losses) | $ | 244.8 | $ | 299.9 | $ | 329.1 | Net realized gains (losses) | $ | (104.9 | ) | $ | 244.8 | $ | 299.9 | ||||||||||||
| Income tax (benefit) on realized gains (losses) | Income tax (benefit) on realized gains (losses) | $ | 93.0 | $ | 114.0 | $ | 115.2 | Income tax (benefit) on realized gains (losses) | $ | (39.9 | ) | $ | 93.0 | $ | 114.0 | |||||||||||
For amortized cost, fair value and yield by maturity date of held-to-maturity and available-for-sale securities outstanding as ofat December 31, 2003, see2004, refer to Table 10 included in Management’s Discussion and Analysis which is incorporated by reference into these Notes to Consolidated Financial Statements.
| Note 8 | Loans and Allowance for Credit Losses |
The composition of the loan portfolio at December 31 was as follows:
| (Dollars in millions) | 2003 | 2002 | ||||||||||||||||||||
| (Dollars in Millions) | (Dollars in Millions) | 2004 | 2003 | |||||||||||||||||||
Commercial | Commercial | Commercial | ||||||||||||||||||||
| Commercial | $ | 33,536 | $ | 36,584 | Commercial | $ | 35,210 | $ | 33,536 | |||||||||||||
| Lease financing | 4,990 | 5,360 | Lease financing | 4,963 | 4,990 | |||||||||||||||||
| Total commercial | 38,526 | 41,944 | Total commercial | 40,173 | 38,526 | |||||||||||||||||
Commercial real estate | Commercial real estate | Commercial real estate | ||||||||||||||||||||
| Commercial mortgages | 20,624 | 20,325 | Commercial mortgages | 20,315 | 20,624 | |||||||||||||||||
| Construction and development | 6,618 | 6,542 | Construction and development | 7,270 | 6,618 | |||||||||||||||||
| Total commercial real estate | 27,242 | 26,867 | Total commercial real estate | 27,585 | 27,242 | |||||||||||||||||
Residential mortgages | Residential mortgages | 13,457 | 9,746 | Residential mortgages | 15,367 | 13,457 | ||||||||||||||||
Retail | Retail | Retail | ||||||||||||||||||||
| Credit card | 5,933 | 5,665 | Credit card | 6,603 | 5,933 | |||||||||||||||||
| Retail leasing | 6,029 | 5,680 | Retail leasing | 7,166 | 6,029 | |||||||||||||||||
| Home equity and second mortgage | 13,210 | 13,572 | Home equity and second mortgages | 14,851 | 13,210 | |||||||||||||||||
| Other retail | Other retail | |||||||||||||||||||||
| Revolving credit | 2,540 | 2,650 | Revolving credit | 2,541 | 2,540 | |||||||||||||||||
| Installment | 2,380 | 2,258 | Installment | 2,767 | 2,380 | |||||||||||||||||
| Automobile | 7,165 | 6,343 | Automobile | 7,419 | 7,165 | |||||||||||||||||
| Student | 1,753 | 1,526 | Student | 1,843 | 1,753 | |||||||||||||||||
| Total other retail | 13,838 | 12,777 | Total other retail | 14,570 | 13,838 | |||||||||||||||||
| Total retail | 39,010 | 37,694 | Total retail | 43,190 | 39,010 | |||||||||||||||||
| Total loans | $ | 118,235 | $ | 116,251 | Total loans | $ | 126,315 | $ | 118,235 | |||||||||||||
Loans are presented net of unearned interest and deferred fees and costs, which amounted to $1.5$1.4 billion and $1.8$1.5 billion at December 31, 20032004 and 2002,2003, respectively. The Company had loans of $38.3 billion at December 31, 2004, and $28.7 billion at December 31, 2003, and $26.1 billion at December 31, 2002, pledged at the Federal Home Loan Bank. Loans of $10.3 billion at December 31, 2004, and $12.1 billion at December 31, 2003, and $12.7 billion at December 31, 2002, were pledged at the Federal Reserve Bank.
The following table lists information related to nonperforming loans as of December 31:
| (Dollars in Millions) | 2003 | 2002 | 2004 | 2003 | ||||||||||||
| Loans on nonaccrual status | $ | 979.5 | $ | 1,188.7 | $ | 582.5 | $ | 979.5 | ||||||||
| Restructured loans | 40.5 | 48.6 | 58.0 | 40.5 | ||||||||||||
| Total nonperforming loans | $ | 1,020.0 | $ | 1,237.3 | $ | 640.5 | $ | 1,020.0 | ||||||||
| Interest income that would have been recognized at original contractual terms | $ | 94.1 | $ | 102.1 | $ | 64.4 | $ | 94.1 | ||||||||
| Amount recognized as interest income | 26.7 | 36.7 | 22.3 | 26.7 | ||||||||||||
| Forgone revenue | $ | 67.4 | $ | 65.4 | $ | 42.1 | $ | 67.4 | ||||||||
Activity in the allowance for credit losses was as follows:
| (Dollars in Millions) | (Dollars in Millions) | 2003 | 2002 | 2001 | (Dollars in Millions) | 2004 | 2003 | 2002 | |||||||||||||||||||
| Balance at beginning of year | Balance at beginning of year | $ | 2,422.0 | $ | 2,457.3 | $ | 1,786.9 | Balance at beginning of year | $ | 2,368.6 | $ | 2,422.0 | $ | 2,457.3 | |||||||||||||
| Add | Add | Add | |||||||||||||||||||||||||
| Provision charged to operating expense (a) | 1,254.0 | 1,349.0 | 2,528.8 | Provision charged to operating expense | 669.6 | 1,254.0 | 1,349.0 | ||||||||||||||||||||
| Deduct | Deduct | Deduct | |||||||||||||||||||||||||
| Loans charged off | 1,494.1 | 1,590.7 | 1,771.4 | Loans charged off | 1,073.5 | 1,494.1 | 1,590.7 | ||||||||||||||||||||
| Less recoveries of loans charged off | 242.4 | 217.7 | 224.9 | Less recoveries of loans charged off | 306.4 | 242.4 | 217.7 | ||||||||||||||||||||
| Net loans charged off | 1,251.7 | 1,373.0 | 1,546.5 | Net loans charged off | 767.1 | 1,251.7 | 1,373.0 | ||||||||||||||||||||
| Losses from loan sales/ transfers | — | — | (329.3 | ) | |||||||||||||||||||||||
| Acquisitions and other changes | Acquisitions and other changes | (55.7 | ) | (11.3 | ) | 17.4 | Acquisitions and other changes | (1.8 | ) | (55.7 | ) | (11.3 | ) | ||||||||||||||
| Balance at end of year | $ | 2,368.6 | $ | 2,422.0 | $ | 2,457.3 | |||||||||||||||||||||
| Balance at end of year (a) | Balance at end of year (a) | $ | 2,269.3 | $ | 2,368.6 | $ | 2,422.0 | ||||||||||||||||||||
| Components | Components | ||||||||||||||||||||||||||
| Allowance for loan losses | $ | 2,080.4 | $ | 2,183.6 | |||||||||||||||||||||||
| Liability for unfunded credit commitments | 188.9 | 185.0 | |||||||||||||||||||||||||
| Total allowance for credit losses | $ | 2,269.3 | $ | 2,368.6 | |||||||||||||||||||||||
| (a) |
A portion of the allowance for credit losses is allocated to loans deemed impaired. All impaired loans are included in non-performingnonperforming assets. A summary of these loans and their related allowance for loancredit losses is as follows:
| 2003 | 2002 | 2001 | 2004 | 2003 | 2002 | |||||||||||||||||||||||||||||||||||||||||||||
| Recorded | Valuation | Recorded | Valuation | Recorded | Valuation | Recorded | Valuation | Recorded | Valuation | Recorded | Valuation | |||||||||||||||||||||||||||||||||||||||
| (Dollars in Millions) | (Dollars in Millions) | Investment | Allowance | Investment | Allowance | Investment | Allowance | (Dollars in Millions) | Investment | Allowance | Investment | Allowance | Investment | Allowance | ||||||||||||||||||||||||||||||||||||
| Impaired loans | Impaired loans | Impaired loans | ||||||||||||||||||||||||||||||||||||||||||||||||
| Valuation allowance required | $ | 841 | $ | 108 | $ | 992 | $ | 157 | $ | 694 | $ | 125 | Valuation allowance required | $ | 489 | $ | 64 | $ | 841 | $ | 108 | $ | 992 | $ | 157 | |||||||||||||||||||||||||
| No valuation allowance required | — | — | — | — | — | — | No valuation allowance required | — | — | — | — | — | — | |||||||||||||||||||||||||||||||||||||
| Total impaired loans | Total impaired loans | $ | 841 | $ | 108 | $ | 992 | $ | 157 | $ | 694 | $ | 125 | Total impaired loans | $ | 489 | $ | 64 | $ | 841 | $ | 108 | $ | 992 | $ | 157 | ||||||||||||||||||||||||
| Average balance of impaired loans during the year | Average balance of impaired loans during the year | $ | 970 | $ | 839 | $ | 780 | Average balance of impaired loans during the year | $ | 600 | $ | 970 | $ | 839 | ||||||||||||||||||||||||||||||||||||
| Interest income recognized on impaired loans during the year | Interest income recognized on impaired loans during the year | — | — | — | Interest income recognized on impaired loans during the year | 1 | — | — | ||||||||||||||||||||||||||||||||||||||||||
Commitments to lend additional funds to customers whose loans were classified as nonaccrual or restructured at December 31, 2003,2004, totaled $107.9$61.2 million. During 20032004 there were $18.0$10.2 million of loans that were restructured at market interest rates and returned to an accruing status.
| Note 9 | Leases |
The components of the net investment in sales-type and direct financing leases at December 31 were as follows:
| (Dollars in Millions) | 2004 | 2003 | |||||||
| Aggregate future minimum lease payments to be received | $ | 12,436 | $ | 11,293 | |||||
| Unguaranteed residual values accruing to the lessor’s benefit | 615 | 652 | |||||||
| Unearned income | (1,560 | ) | (1,533 | ) | |||||
| Initial direct costs | 264 | 226 | |||||||
| Total net investment in sales-type and direct financing leases | $ | 11,755 | $ | 10,638 | |||||
The amount of future minimum lease payments included the following at December 31:
| (Dollars in Millions) | 2004 | 2003 | ||||||
| Accumulated allowance for uncollectible minimum lease payments | $ | 141 | $ | 131 | ||||
The minimum future lease payments to be received from sales-type and direct financing leases were as follows at December 31, 2004:
| (Dollars in Millions) | ||||
| 2005 | $ | 2,272 | ||
| 2006 | 2,468 | |||
| 2007 | 3,192 | |||
| 2008 | 2,893 | |||
| 2009 | 1,394 | |||
| Thereafter | 217 | |||
| Note 10 | Accounting for Transfers and Servicing of Financial Assets and Extinguishments of Liabilities |
FINANCIAL ASSET SALES
When the Company sells financial assets, it may retain interest-only strips, servicing rights, residual rights to a cash reserve account, and/or other retained interests in the sold financial assets. The gain or loss on sale depends in part on the previous carrying amount of the financial assets involved in the transfer and is allocated between the assets sold and the retained interests based on their relative fair values at the date of transfer. Quoted market prices are used to determine retained interest fair values when readily available. Since quotes are generally not available for retained interests, the Company estimates fair value based on the present value of future expected cash flows using management’s best estimates of the key assumptions including credit losses, prepayment speeds, forward yield curves, and discount rates commensurate with the risks involved. Retained interests and liabilities are recorded at fair value using a discounted cash flow methodology at inception and are evaluated at least quarterly thereafter.
Conduits and SecuritizationThe Company sponsors an off-balance sheet conduit to which it transferred high-grade investment securities, funded by the issuance of commercial paper. The conduit, a qualifying special purpose entity, held assets of $7.3$5.7 billion at December 31, 2003,2004 and $9.5$7.3 billion in assets at December 31, 2002.2003. These investment securities include primarily (i) private label asset-backed securities, which are insurance “wrapped” by AAA/Aaa-rated monoline insurance companies and (ii) government agency mortgage-backed securities and collateralized mortgage obligations. The conduit had commercial paper liabilities of $5.7 billion at December 31, 2004 and $7.3 billion at December 31, 2003, and $9.5 billion at December 31, 2002.2003. The Company benefits by transferring the investment securities into a conduit that provides diversification of funding sources in a capital-efficient manner and the generation of income.
The Company also has an asset-backed securitization to fund an unsecured small business credit product. The unsecured small business credit securitization trust held assets of $375.3 million at December 31, 2004, of which the Company retained $85.0 million of subordinated securities and a residual interest-only strip of $36.1 million. This compared with $497.5 million in assets at December 31, 2003, of which the Company retained $112.4 million of subordinated securities transferor’s interest of $12.4 million and a residual interest-only strip of $34.4 million. This compared with $652.4 million in assets at December 31, 2002, of which the Company retained $150.1 million of subordinated securities, transferor’s interest of $16.3 million and a residual interest-only strip of $53.3 million. The qualifying special purpose entity issued asset-backed variable funding notes in various tranches. The Company provides credit enhancement in the form of subordinated securities and reserve accounts. The Company’s risk, primarily from losses in the underlying assets, was considered in determining the fair value of the Company’s retained interests in this securitization. The Company recognized income from subordinated securities, an interest-only strip and servicing fees from this securitization of $33.2 million during 2004 and $29.8 million during 2003 and $52.8 million during 2002.2003. The unsecured small business credit securitization held average assets of $438.9 million in 2004, and $571.4 million in 2003, and $700.6 million in 2002.
During 2003, the Company undertook several actions with respect to off-balance sheet structures. In January 2003, the Company exercised a cleanup call option on an indirect automobile loan securitization, with the remaining assets from the securitization recorded on the Company’s balance sheet at fair value. The indirect automobile securitization held $156.1 million in assets at December 31, 2002.
Sensitivity AnalysisAt December 31, 2003,2004, key economic assumptions and the sensitivity of the current fair value of residual cash flows to immediate 10 percent and 20 percent adverse changes in those assumptions were as follows:
| Unsecured | Unsecured | |||||||||||||||||
| Small | Small | |||||||||||||||||
| Business | Investment | Business | Investment | |||||||||||||||
| December 31, 2003 (Dollars in Millions) | Receivables | Securities | ||||||||||||||||
| December 31, 2004 (Dollars in Millions) | December 31, 2004 (Dollars in Millions) | Receivables | Securities | |||||||||||||||
Current Economic Assumptions Sensitivity Analysis | ||||||||||||||||||
Current economic assumptions sensitivity analysis | Current economic assumptions sensitivity analysis | |||||||||||||||||
| Carrying value (fair value) of retained interests | $ | 146.8 | $ | 89.5 | Carrying value (fair value) of retained interests | $ | 121.0 | $ | 56.8 | |||||||||
| Weighted average life (in years) | .9 | 2.6 | Weighted average life (in years) | .9 | 2.1 | |||||||||||||
Expected remaining life (a) | Expected remaining life (a) | 2.5 years | 4.9 years | Expected remaining life (a) | 2.3 years | 4.1 years | ||||||||||||
| Impact of 10% adverse change | $ | (2.6 | ) | $ | (8.9 | ) | Impact of 10% adverse change | $ | (.7 | ) | $ | (5.6 | ) | |||||
| Impact of 20% adverse change | (5.6 | ) | (16.3 | ) | Impact of 20% adverse change | (3.0 | ) | (10.3 | ) | |||||||||
Expected credit losses (annual) (b) | Expected credit losses (annual) (b) | 9.5%-11.4 | % | NA | Expected credit losses (annual) (b) | 6.3%-9.5 | % | NA | ||||||||||
| Impact of 10% adverse change | $ | (3.0 | ) | $ | — | Impact of 10% adverse change | $ | (1.4 | ) | $ | — | |||||||
| Impact of 20% adverse change | (13.6 | ) | — | Impact of 20% adverse change | (3.9 | ) | — | |||||||||||
Residual cash flow discount rate | Residual cash flow discount rate | 11.0 | % | 3.6 | % | Residual cash flow discount rate | 11.0 | % | 7.5 | % | ||||||||
| Impact of 10% adverse change | $ | (.5 | ) | $ | (1.0 | ) | Impact of 10% adverse change | $ | (.2 | ) | $ | (.4 | ) | |||||
| Impact of 20% adverse change | (2.2 | ) | (1.2 | ) | Impact of 20% adverse change | (1.5 | ) | (.7 | ) | |||||||||
Interest rate on variable rate loans and bonds (c)(d) | Interest rate on variable rate loans and bonds (c)(d) | Prime | LIBOR | Interest rate on variable rate loans and bonds (c)(d) | Prime | LIBOR | ||||||||||||
| Impact of 10% adverse change | $ | — | $ | — | Impact of 10% adverse change | $ | — | $ | — | |||||||||
| Impact of 20% adverse change | (1.4 | ) | — | Impact of 20% adverse change | (1.1 | ) | — | |||||||||||
| (a) | For the small business receivables a monthly principal payment rate assumption is used to value the residual interests. |
| (b) | Credit losses are zero for the investment securities conduit as the investments are all AAA/Aaa rated or insured investments. |
| (c) | For the small business receivables interest income is |
| (d) | The investment securities conduit is mostly match funded. Therefore, interest rate movements create no material impact to the value of the residual interest. |
Cash Flow InformationThe table below summarizes certain cash flows received from and paid to conduitsconduit or structured entities for the asset sales described above:
| Unsecured | Unsecured | |||||||||||||||||||||||||||||||||||
| Indirect | Small | Indirect | Small | |||||||||||||||||||||||||||||||||
| Commercial | Automobile | Business | Investment | Commercial | Automobile | Business | Investment | |||||||||||||||||||||||||||||
| Year Ended December 31 (Dollars in Millions) | Year Ended December 31 (Dollars in Millions) | Loans | Loans | Receivables (a) | Securities | Year Ended December 31 (Dollars in Millions) | Loans | Loans | Receivables (a) | Securities | ||||||||||||||||||||||||||
2004 | 2004 | |||||||||||||||||||||||||||||||||||
| Proceeds from | ||||||||||||||||||||||||||||||||||||
| New sales and securitizations | $ | — | $ | — | $ | — | $ | — | ||||||||||||||||||||||||||||
| Collections used by trust to purchase new receivables in revolving securitizations | — | — | 328.7 | — | ||||||||||||||||||||||||||||||||
| Servicing and other fees received and cash flows on retained interests | — | — | 73.7 | 35.5 | ||||||||||||||||||||||||||||||||
2003 | 2003 | 2003 | ||||||||||||||||||||||||||||||||||
| Proceeds from | Proceeds from | |||||||||||||||||||||||||||||||||||
| New sales and securitizations | $ | — | $ | — | $ | — | $ | — | New sales and securitizations | $ | — | $ | — | $ | — | $ | — | |||||||||||||||||||
| Collections used by trust to purchase new receivables in revolving securitizations | — | — | 420.6 | — | Collections used by trust to purchase new receivables in revolving securitizations | — | — | 420.6 | — | |||||||||||||||||||||||||||
| Servicing and other fees received and cash flows on retained interests | 23.9 | 24.3 | 85.3 | 51.8 | Servicing and other fees received and cash flows on retained interests | 23.9 | 24.3 | 85.3 | 51.8 | |||||||||||||||||||||||||||
| Net cash flow from loan conduit consolidation | (1,884.0 | ) | — | — | — | Net cash flow from loan conduit consolidation | (1,884.0 | ) | — | — | — | |||||||||||||||||||||||||
2002 | ||||||||||||||||||||||||||||||||||||
| Proceeds from | ||||||||||||||||||||||||||||||||||||
| New sales and securitizations | $ | — | $ | — | $ | — | $ | 1,677.5 | ||||||||||||||||||||||||||||
| Collections used by trust to purchase new receivables in revolving securitizations | — | — | 610.3 | — | ||||||||||||||||||||||||||||||||
| Servicing and other fees received and cash flows on retained interests | 83.0 | 4.0 | 115.0 | 71.8 | ||||||||||||||||||||||||||||||||
| (a) | The small business credit |
Other InformationQuantitative information related to managed assets and loan securitizationssales was as follows:
| At December 31 | Year Ended December 31 | At December 31 | Year Ended December 31 | |||||||||||||||||||||||||||||||||||||||||||||||||||||||||||||||||||
| Total Principal | Principal Amount | Total Principal | Principal Amount | |||||||||||||||||||||||||||||||||||||||||||||||||||||||||||||||||||
| Balance | 90 Days or More Past Due (a) | Average Balance | Net Credit Losses | Balance | 90 Days or More Past Due (a) | Average Balance | Net Credit Losses | |||||||||||||||||||||||||||||||||||||||||||||||||||||||||||||||
| (Dollars in Millions) | 2003 | 2002 | 2003 | 2002 | 2003 | 2002 | 2003 | 2002 | ||||||||||||||||||||||||||||||||||||||||||||||||||||||||||||||
| Asset Type (Dollars in Millions) | Asset Type (Dollars in Millions) | 2004 | 2003 | 2004 | 2003 | 2004 | 2003 | 2004 | 2003 | |||||||||||||||||||||||||||||||||||||||||||||||||||||||||||||
Commercial | Commercial | Commercial | ||||||||||||||||||||||||||||||||||||||||||||||||||||||||||||||||||||
| Commercial | $ | 35,891 | $ | 34,427 | $ | 311 | $ | 651 | $ | 35,274 | $ | 39,079 | $ | 129 | $ | 535 | ||||||||||||||||||||||||||||||||||||||||||||||||||||||
| Commercial | $ | 34,427 | $ | 41,861 | $ | 651 | $ | 819 | $ | 39,093 | $ | 45,192 | $ | 535 | $ | 543 | Lease financing | 4,963 | 4,990 | 92 | 115 | 4,866 | 5,088 | 69 | 84 | |||||||||||||||||||||||||||||||||||||||||||||
| Lease financing | 4,990 | 5,360 | 115 | 172 | 5,088 | 5,573 | 84 | 149 | ||||||||||||||||||||||||||||||||||||||||||||||||||||||||||||||
| Total commercial | 40,854 | 39,417 | 403 | 766 | 40,140 | 44,167 | 198 | 619 | ||||||||||||||||||||||||||||||||||||||||||||||||||||||||||||||
| Total commercial | 39,417 | 47,221 | 766 | 991 | 44,181 | 50,765 | 619 | 692 | ||||||||||||||||||||||||||||||||||||||||||||||||||||||||||||||
Commercial real estate | Commercial real estate | Commercial real estate | ||||||||||||||||||||||||||||||||||||||||||||||||||||||||||||||||||||
| Commercial mortgages | 20,624 | 20,325 | 181 | 181 | 20,166 | 19,212 | 28 | 32 | Commercial mortgages | 20,315 | 20,624 | 175 | 181 | 20,386 | 20,166 | 18 | 28 | |||||||||||||||||||||||||||||||||||||||||||||||||||||
| Construction and development | 6,618 | 6,542 | 42 | 62 | 6,976 | 6,511 | 11 | 7 | Construction and development | 7,270 | 6,618 | 26 | 42 | 6,881 | 6,976 | 9 | 11 | |||||||||||||||||||||||||||||||||||||||||||||||||||||
| Total commercial real estate | 27,242 | 26,867 | 223 | 243 | 27,142 | 25,723 | 39 | 39 | Total commercial real estate | 27,585 | 27,242 | 201 | 223 | 27,267 | 27,142 | 27 | 39 | |||||||||||||||||||||||||||||||||||||||||||||||||||||
Residential mortgages | Residential mortgages | 13,457 | 9,746 | 123 | 140 | 11,696 | 8,412 | 27 | 19 | Residential mortgages | 15,367 | 13,457 | 114 | 123 | 14,322 | 11,696 | 29 | 27 | ||||||||||||||||||||||||||||||||||||||||||||||||||||
Retail | Retail | Retail | ||||||||||||||||||||||||||||||||||||||||||||||||||||||||||||||||||||
| Credit card | 5,933 | 5,665 | 100 | 118 | 5,525 | 5,633 | 255 | 280 | Credit card | 6,603 | 5,933 | 115 | 100 | 6,090 | 5,525 | 252 | 255 | |||||||||||||||||||||||||||||||||||||||||||||||||||||
| Retail leasing | 6,029 | 5,680 | 8 | 12 | 5,804 | 5,389 | 50 | 39 | Retail leasing | 7,166 | 6,029 | 6 | 8 | 6,653 | 5,804 | 39 | 50 | |||||||||||||||||||||||||||||||||||||||||||||||||||||
| Other retail | 27,048 | 26,505 | 135 | 167 | 26,876 | 25,756 | 311 | 360 | Other retail | 29,421 | 27,048 | 101 | 135 | 28,461 | 26,876 | 251 | 311 | |||||||||||||||||||||||||||||||||||||||||||||||||||||
| Total retail | 39,010 | 37,850 | 243 | 297 | 38,205 | 36,778 | 616 | 679 | Total retail | 43,190 | 39,010 | 222 | 243 | 41,204 | 38,205 | 542 | 616 | |||||||||||||||||||||||||||||||||||||||||||||||||||||
| Total managed loans | $ | 119,126 | $ | 121,684 | $ | 1,355 | $ | 1,671 | $ | 121,224 | $ | 121,678 | $ | 1,301 | $ | 1,429 | Total managed loans | 126,996 | 119,126 | 940 | 1,355 | 122,933 | 121,210 | 796 | 1,301 | |||||||||||||||||||||||||||||||||||||||||||||
Investment securities | Investment securities | 50,679 | 37,999 | — | — | 45,633 | 38,689 | — | — | Investment securities | 47,191 | 50,679 | — | — | 49,452 | 45,574 | — | — | ||||||||||||||||||||||||||||||||||||||||||||||||||||
| Total managed assets | $ | 169,805 | $ | 159,683 | $ | 1,355 | $ | 1,671 | $ | 166,857 | $ | 160,367 | $ | 1,301 | $ | 1,429 | Total managed assets | $ | 174,187 | $ | 169,805 | $ | 940 | $ | 1,355 | $ | 172,385 | $ | 166,784 | $ | 796 | $ | 1,301 | |||||||||||||||||||||||||||||||||||||
| Less | Less | Less | ||||||||||||||||||||||||||||||||||||||||||||||||||||||||||||||||||||
| Assets sold or securitized | 8,236 | 14,944 | 11,247 | 17,085 | Assets sold or securitized | 6,391 | 8,236 | 7,235 | 11,174 | |||||||||||||||||||||||||||||||||||||||||||||||||||||||||||||
| Total assets held | $ | 161,569 | $ | 144,739 | $ | 155,610 | $ | 143,282 | Total assets held | $ | 167,796 | $ | 161,569 | $ | 165,150 | $ | 155,610 | |||||||||||||||||||||||||||||||||||||||||||||||||||||
Managed or securitized assets | ||||||||||||||||||||||||||||||||||||||||||||||||||||||||||||||||||||||
Sold or securitized assets | Sold or securitized assets | |||||||||||||||||||||||||||||||||||||||||||||||||||||||||||||||||||||
| Commercial loans | $ | — | $ | 4,151 | $ | — | $ | — | $ | 1,834 | $ | 5,715 | $ | — | $ | — | Commercial loans | $ | — | $ | — | $ | — | $ | — | $ | — | $ | 1,834 | $ | — | $ | — | |||||||||||||||||||||||||||||||||||||
| Indirect automobile loans (b) | — | 156 | — | 1 | 7 | 277 | — | 5 | Indirect automobile loans (b) | — | — | — | — | — | 7 | — | — | |||||||||||||||||||||||||||||||||||||||||||||||||||||
| Guaranteed SBA loans (c) | 406 | 490 | — | — | 450 | 532 | — | — | Guaranteed SBA loans (c) | 315 | 406 | — | — | 364 | 450 | — | — | |||||||||||||||||||||||||||||||||||||||||||||||||||||
| Small business credit lines (c) | 485 | 636 | 6 | 6 | 571 | 701 | 49 | 51 | Small business credit lines (c) | 366 | 485 | 4 | 6 | 428 | 557 | 29 | 49 | |||||||||||||||||||||||||||||||||||||||||||||||||||||
| Investment securities | 7,345 | 9,511 | — | — | 8,385 | 9,860 | — | — | Investment securities | 5,710 | 7,345 | — | — | 6,443 | 8,326 | — | — | |||||||||||||||||||||||||||||||||||||||||||||||||||||
| Total securitized assets | $ | 8,236 | $ | 14,944 | $ | 6 | $ | 7 | $ | 11,247 | $ | 17,085 | $ | 49 | $ | 56 | Total securitized assets | $ | 6,391 | $ | 8,236 | $ | 4 | $ | 6 | $ | 7,235 | $ | 11,174 | $ | 29 | $ | 49 | |||||||||||||||||||||||||||||||||||||
| (a) | Includes nonaccrual |
| (b) | Reported in “other retail” loans. |
| (c) | Reported in “commercial” loans. |
| Note | Premises and Equipment |
Premises and equipment at December 31 consisted of the following:
| (Dollars in Millions) | (Dollars in Millions) | 2003 | 2002 | (Dollars in Millions) | 2004 | 2003 | ||||||||||||
| Land | Land | $ | 311 | $ | 275 | Land | $ | 311 | $ | 311 | ||||||||
| Buildings and improvements | Buildings and improvements | 2,226 | 1,844 | Buildings and improvements | 2,288 | 2,226 | ||||||||||||
| Furniture, fixtures and equipment | Furniture, fixtures and equipment | 2,092 | 2,152 | Furniture, fixtures and equipment | 2,105 | 2,092 | ||||||||||||
| Capitalized building and equipment leases | Capitalized building and equipment leases | 175 | 173 | Capitalized building and equipment leases | 138 | 175 | ||||||||||||
| Construction in progress | Construction in progress | 7 | 4 | Construction in progress | 5 | 7 | ||||||||||||
| 4,811 | 4,448 | 4,847 | 4,811 | |||||||||||||||
| Less accumulated depreciation and amortization | Less accumulated depreciation and amortization | 2,854 | 2,751 | Less accumulated depreciation and amortization | (2,957 | ) | (2,854 | ) | ||||||||||
| Total | $ | 1,957 | $ | 1,697 | Total | $ | 1,890 | $ | 1,957 | |||||||||
| Note | Mortgage Servicing Rights |
The Company’s portfolio of residential mortgages serviced for others was $63.2 billion, $53.9 billion $43.1 billion and $22.0$43.1 billion at December 31, 2004, 2003 and 2002 and 2001 respectively.
| Year Ended December 31 (Dollars in Millions) | 2004 | 2003 | 2002 | ||||||||||
| Balance at beginning of year | $ | 160 | $ | 207 | $ | 53 | |||||||
| Additions charged to operations | 57 | 209 | 186 | ||||||||||
| Direct write-downs charged against the allowance | (45 | ) | (256 | ) | (32 | ) | |||||||
| Balance at end of year | $ | 172 | $ | 160 | $ | 207 | |||||||
TheChanges in net carrying value of capitalized mortgage servicing rights was as follows:
| December 31 (Dollars in Millions) | 2003 | 2002 | |||||||
| Initial carrying value, net of amortization | $ | 830 | $ | 849 | |||||
| Impairment valuation allowance | (160 | ) | (207 | ) | |||||
| Net carrying value | $ | 670 | $ | 642 | |||||
Changes in capitalized mortgage servicing rights are summarized as follows:
| Year Ended December 31 (Dollars in Millions) | Year Ended December 31 (Dollars in Millions) | 2003 | 2002 | Year Ended December 31 (Dollars in Millions) | 2004 | 2003 | 2002 | |||||||||||||||
| Balance at beginning of year | Balance at beginning of year | $ | 642 | $ | 360 | Balance at beginning of year | $ | 670 | $ | 642 | $ | 360 | ||||||||||
| Rights purchased | 55 | 229 | Rights purchased | 139 | 55 | 229 | ||||||||||||||||
| Rights capitalized | 338 | 357 | Rights capitalized | 300 | 338 | 357 | ||||||||||||||||
| Amortization | (156 | ) | (94 | ) | Amortization | (186 | ) | (156 | ) | (94 | ) | |||||||||||
| Rights sold | — | (24 | ) | Rights sold | — | — | (24 | ) | ||||||||||||||
| Impairment | (209 | ) | (186 | ) | Impairment | (57 | ) | (209 | ) | (186 | ) | |||||||||||
| Balance at end of year | Balance at end of year | $ | 670 | $ | 642 | Balance at end of year | 866 | 670 | 642 | |||||||||||||
| Impairment valuation allowance | 172 | 160 | 207 | |||||||||||||||||||
| Initial carrying value, net of amortization | Initial carrying value, net of amortization | $ | 1,038 | $ | 830 | $ | 849 | |||||||||||||||
The key economic assumptions used to estimate the value of the mortgage servicing rights portfolio were as follows:
| December 31 (Dollars in Millions) | 2003 | 2002 | 2004 | 2003 | ||||||||||||
| Fair value | $ | 670 | $ | 655 | $ | 872 | $ | 670 | ||||||||
| Expected weighted-average life (in years) | 5.2 | 4.8 | 5.5 | 5.2 | ||||||||||||
| Discount rate | 9.9 | % | 9.8 | % | 9.9 | % | 9.9 | % | ||||||||
The estimated sensitivity of the fair value of the mortgage servicing rights portfolio to changes in interest rates at December 31, 2003,2004, was as follows:
| Down Scenario | Up Scenario | Down Scenario | Up Scenario | |||||||||||||||||||||||||||||
| (Dollars in Millions) | 50 bps | 25 bps | 25 bps | 50 bps | 50 bps | 25 bps | 25 bps | 50 bps | ||||||||||||||||||||||||
| Fair value | $ | (127 | ) | $ | (78 | ) | $75 | $ | 133 | $ | (258 | ) | $ | (133 | ) | $ | 109 | $ | 177 | |||||||||||||
The Company utilizes the investment securities portfolio as an economic hedge against possible adverse interest rate changes. The Company also, from time to time, purchases principal-only securities that act as a partial economic hedge. The Company is able to recognize reparations from increases in fair value of servicing rights when impairment reserves are released.
A summary of the Company’s mortgage servicing rights and related characteristics by portfolio as of December 31, 2003, is as follows:
| U.S. Bank Home Mortgage | ||||||||||||||||
| Leader | ||||||||||||||||
| (Dollars in Millions) | Mortgage | Conventional | Government | Total | ||||||||||||
| Servicing portfolio | $ | 8,018 | $ | 36,306 | $ | 9,597 | $ | 53,921 | ||||||||
| Fair market value | $ | 119 | $ | 412 | $ | 139 | $ | 670 | ||||||||
| Value (bps) | 148 | 113 | 145 | 124 | ||||||||||||
| Weighted-average servicing fees (bps) | 44 | 34 | 45 | 37 | ||||||||||||
| Multiple (value/servicing fees) | 3.36 | 3.32 | 3.22 | 3.35 | ||||||||||||
| Weighted-average note rate | 6.49 | % | 5.82 | % | 6.39 | % | 6.02 | % | ||||||||
| Age (in years) | 3.3 | 1.3 | 2.0 | 1.8 | ||||||||||||
| Expected life (in years) | 5.4 | 5.1 | 5.1 | 5.2 | ||||||||||||
| Discount rate | 10.1 | % | 9.5 | % | 11.1 | % | 9.9 | % | ||||||||
The Leader Mortgage Company, LLCMRBP division specializes in servicing loans made under state and local housing authority programs. These programs provide mortgages to low and moderate income borrowers and are generally under government insured programs with down payment or closing cost assistance. As a result of the slower prepayment characteristics of the stateThe conventional and local loan programs, the Leader portfolio has a longer expected life relative to othergovernment servicing portfolios.
A summary of the Company’s mortgage servicing rights and related characteristics by portfolio as of December 31, 2004, was as follows:
| (Dollars in Millions) | MRBP | Government | Conventional | Total | ||||||||||||
| Servicing portfolio | $ | 7,524 | $ | 9,204 | $ | 46,435 | $ | 63,163 | ||||||||
| Fair market value | $ | 126 | $ | 136 | $ | 610 | $ | 872 | ||||||||
| Value (bps) | 167 | 148 | 131 | 138 | ||||||||||||
| Weighted-average servicing fees (bps) | 43 | 46 | 34 | 37 | ||||||||||||
| Multiple (value/servicing fees) | 3.88 | 3.22 | 3.85 | 3.73 | ||||||||||||
| Weighted-average note rate | 6.24 | % | 6.04 | % | 5.71 | % | 5.82 | % | ||||||||
| Age (in years) | 3.6 | 2.2 | 1.7 | 2.0 | ||||||||||||
| Expected life (in years) | 6.3 | 5.1 | 5.4 | 5.5 | ||||||||||||
| Discount rate | 10.1 | % | 11.0 | % | 9.6 | % | 9.9 | % | ||||||||
| Note | Intangible Assets |
The Company adopted Statement of Financial Accounting Standards No. 142 (“SFAS 142142”), “Goodwill and Other Intangible Assets” on January 1, 2002. The most significant changes made by SFAS 142 are that goodwill and other indefinite lived intangible assets are no longer amortized and will be tested for impairment at least annually. The amortization provisions of SFAS 142 apply to goodwill and intangible assets acquired after June 30, 2001. With respect to goodwill and intangible assets acquired prior to July 1, 2001, the amortization provisions of SFAS 142 were effective upon adoption of SFAS 142.
Net income and earnings per share adjusted for the exclusion of amortization expense (net of tax) and asset impairments related to goodwill are as follows:
| Year Ended December 31 (Dollars in Millions, Except Per Share Data) | Year Ended December 31 (Dollars in Millions, Except Per Share Data) | 2003 | 2002 | 2001 | Year Ended December 31 (Dollars in Millions, Except Per Share Data) | 2004 | 2003 | 2002 | ||||||||||||||||||||
| Reported net income | Reported net income | $ | 3,732.6 | $ | 3,168.1 | $ | 1,478.8 | Reported net income | $4,166.8 | $3,732.6 | $3,168.1 | |||||||||||||||||
| Goodwill amortization, net of tax | — | — | 236.7 | Asset impairments, net of tax | — | — | 37.2 | |||||||||||||||||||||
| Asset impairments, net of tax | — | 37.2 | — | |||||||||||||||||||||||||
| Adjusted net income | $4,166.8 | $3,732.6 | $3,205.3 | |||||||||||||||||||||||||
| Adjusted net income | $ | 3,732.6 | $ | 3,205.3 | $ | 1,715.5 | ||||||||||||||||||||||
| Earnings per share | Earnings per share | Earnings per share | ||||||||||||||||||||||||||
| Reported net income | $ | 1.94 | $ | 1.65 | $ | .77 | ||||||||||||||||||||||
| Goodwill amortization, net of tax | — | — | .12 | Reported net income | $ 2.21 | $ 1.94 | $ 1.65 | |||||||||||||||||||||
| Asset impairments, net of tax | — | .02 | — | Asset impairments, net of tax | — | — | .02 | |||||||||||||||||||||
| Adjusted net income | $ | 1.94 | $ | 1.67 | $ | .89 | Adjusted net income | $ 2.21 | $ 1.94 | $ 1.67 | ||||||||||||||||||
| Diluted earnings per share | Diluted earnings per share | Diluted earnings per share | ||||||||||||||||||||||||||
| Reported net income | $ | 1.93 | $ | 1.65 | $ | .76 | Reported net income | $ 2.18 | $ 1.93 | $ 1.65 | ||||||||||||||||||
| Goodwill amortization, net of tax | — | — | .12 | Asset impairments, net of tax | — | — | .02 | |||||||||||||||||||||
| Asset impairments, net of tax | — | .02 | — | |||||||||||||||||||||||||
| Adjusted net income | $ 2.18 | $ 1.93 | $ 1.67 | |||||||||||||||||||||||||
| Adjusted net income | $ | 1.93 | $ | 1.67 | $ | .88 | ||||||||||||||||||||||
The following table reflects the changes in the carrying value of goodwill for the years ended December 31, 20022003 and 2003:2004:
| Private Client, | Private Client, | |||||||||||||||||||||||||||||||||||||||||||||||||
| Wholesale | Consumer | Trust and Asset | Payment | Capital | Consolidated | Wholesale | Consumer | Trust and Asset | Payment | Capital | Consolidated | |||||||||||||||||||||||||||||||||||||||
| (Dollars in Millions) | (Dollars in Millions) | Banking | Banking | Management | Services | Markets (a) | Company | (Dollars in Millions) | Banking | Banking | Management | Services | Markets | Company | ||||||||||||||||||||||||||||||||||||
| Balance at December 31, 2001 | $ | 1,244 | $ | 1,810 | $ | 289 | $ | 1,810 | $ | 306 | $ | 5,459 | ||||||||||||||||||||||||||||||||||||||
| Goodwill acquired | 45 | 431 | 447 | 2 | — | 925 | ||||||||||||||||||||||||||||||||||||||||||||
| Disposal | (59 | ) | — | — | — | — | (59 | ) | ||||||||||||||||||||||||||||||||||||||||||
| Balance at December 31, 2002 | Balance at December 31, 2002 | $ | 1,230 | $ | 2,241 | $ | 736 | $ | 1,812 | $ | 306 | $ | 6,325 | Balance at December 31, 2002 | $1,230 | $2,241 | $736 | $1,812 | $ 306 | $6,325 | ||||||||||||||||||||||||||||||
| Goodwill acquired | — | 1 | 6 | 4 | — | 11 | Goodwill acquired | — | 1 | 6 | 4 | — | 11 | |||||||||||||||||||||||||||||||||||||
| Disposal | (5 | ) | — | — | — | (306 | ) | (311 | ) | Other (a) | (5 | ) | — | — | — | (306 | ) | (311 | ) | |||||||||||||||||||||||||||||||
| Balance at December 31, 2003 | Balance at December 31, 2003 | $ | 1,225 | $ | 2,242 | $ | 742 | $ | 1,816 | $ | — | $ | 6,025 | Balance at December 31, 2003 | $1,225 | $2,242 | $742 | $1,816 | $ — | $6,025 | ||||||||||||||||||||||||||||||
| Goodwill acquired | — | — | 101 | 105 | — | 206 | ||||||||||||||||||||||||||||||||||||||||||||
| Other (a) | — | — | — | 10 | — | 10 | ||||||||||||||||||||||||||||||||||||||||||||
| Balance at December 31, 2004 | Balance at December 31, 2004 | $1,225 | $2,242 | $843 | $1,931 | $ — | $6,241 | |||||||||||||||||||||||||||||||||||||||||||
| (a) | In 2003, the Company completed a tax-free distribution of Piper Jaffray Companies. |
Intangible assets consisted of the following:
| Estimated | Amortization | Balance | Estimated | Amortization | Balance | |||||||||||||||||||||||||||||
| December 31 (Dollars in Millions) | December 31 (Dollars in Millions) | Life (a) | Method (b) | 2003 | 2002 | December 31 (Dollars in Millions) | Life (a) | Method (b) | 2004 | 2003 | ||||||||||||||||||||||||
| Goodwill | Goodwill | — | — | $ | 6,025 | $ | 6,325 | Goodwill | — | — | $ | 6,241 | $ | 6,025 | ||||||||||||||||||||
| Merchant processing contracts | Merchant processing contracts | 8 years | AC | 552 | 596 | Merchant processing contracts | 9 years/8 years | SL/AC | 714 | 552 | ||||||||||||||||||||||||
| Core deposit benefits | Core deposit benefits | 10 years/6 years | SL/AC | 417 | 505 | Core deposit benefits | 10 years/6 years | SL/AC | 336 | 417 | ||||||||||||||||||||||||
| Mortgage servicing rights | Mortgage servicing rights | 5 years | AC | 670 | 642 | Mortgage servicing rights | 6 years | AC | 866 | 670 | ||||||||||||||||||||||||
| Trust relationships | Trust relationships | 15 years/10 years | SL/AC | 311 | 371 | Trust relationships | 15 years/8 years | SL/AC | 297 | 311 | ||||||||||||||||||||||||
| Other identified intangibles | Other identified intangibles | 8 years/9 years | SL/AC | 174 | 207 | Other identified intangibles | 8 years/4 years | SL/AC | 174 | 174 | ||||||||||||||||||||||||
| Total | $ | 8,149 | $ | 8,646 | Total | $ | 8,628 | $ | 8,149 | |||||||||||||||||||||||||
| (a) | Estimated life represents the amortization period for assets subject to the straight line method and the weighted average amortization period for intangibles subject to accelerated methods. If more than one amortization method is used for a category, the estimated life for each method is calculated and reported separately. |
Aggregate amortization and impairment expense consisted of the following:
| Year Ended December 31 (Dollars in Millions) | Year Ended December 31 (Dollars in Millions) | 2003 | 2002 | 2001 | Year Ended December 31 (Dollars in Millions) | 2004 | 2003 | 2002 | ||||||||||||||||||
| Goodwill (a) | $ | — | $ | — | $ | 236.7 | ||||||||||||||||||||
| Merchant processing contracts | Merchant processing contracts | 132.4 | 135.1 | 15.3 | Merchant processing contracts | $ | 131.6 | $ | 132.4 | $ | 135.1 | |||||||||||||||
| Core deposit benefits | Core deposit benefits | 88.2 | 80.9 | 80.9 | Core deposit benefits | 80.7 | 88.2 | 80.9 | ||||||||||||||||||
| Mortgage servicing rights | 365.1 | 280.1 | 106.1 | |||||||||||||||||||||||
| Mortgage servicing rights (a) | Mortgage servicing rights (a) | 242.6 | 365.1 | 280.1 | ||||||||||||||||||||||
| Trust relationships | Trust relationships | 53.3 | 19.3 | 19.3 | Trust relationships | 49.4 | 53.3 | 19.3 | ||||||||||||||||||
| Other identified intangibles | Other identified intangibles | 43.4 | 37.6 | 56.8 | Other identified intangibles | 45.8 | 43.4 | 37.6 | ||||||||||||||||||
| Total | $ | 682.4 | $ | 553.0 | $ | 515.1 | Total | $ | 550.1 | $ | 682.4 | $ | 553.0 | |||||||||||||
| (a) |
Below is the estimated amortization expense for the next five years:
| (Dollars in Millions) | ||||||||
| 2004 | $ | 477.5 | ||||||
| 2005 | 370.2 | $ | 458.9 | |||||
| 2006 | 306.9 | 389.4 | ||||||
| 2007 | 261.3 | 334.0 | ||||||
| 2008 | 209.6 | 273.8 | ||||||
| 2009 | 225.2 | |||||||
| Note | Short-Term Borrowings |
The following table is a summary of short-term borrowings for the last three years:
| 2003 | 2002 | 2001 | 2004 | 2003 | 2002 | |||||||||||||||||||||||||||||||||||||||||||||||
| (Dollars in Millions) | (Dollars in Millions) | Amount | Rate | Amount | Rate | Amount | Rate | (Dollars in Millions) | Amount | Rate | Amount | Rate | Amount | Rate | ||||||||||||||||||||||||||||||||||||||
| At year-end | At year-end | At year-end | ||||||||||||||||||||||||||||||||||||||||||||||||||
| Federal funds purchased | $ | 5,098 | .91 | % | $ | 3,025 | .98 | % | $ | 1,146 | 1.08 | % | Federal funds purchased | $ | 3,379 | 1.25 | % | $ | 5,098 | .91 | % | $ | 3,025 | .98 | % | |||||||||||||||||||||||||||
| Securities sold under agreements to repurchase | 3,586 | .71 | 2,950 | .97 | 3,001 | 1.10 | Securities sold under agreements to repurchase | 4,848 | 1.95 | 3,586 | .71 | 2,950 | .97 | |||||||||||||||||||||||||||||||||||||||
| Commercial paper | 699 | .88 | 380 | 1.20 | 452 | 1.85 | Commercial paper | 2,634 | 2.11 | 699 | .88 | 380 | 1.20 | |||||||||||||||||||||||||||||||||||||||
| Treasury, tax and loan notes | 809 | .69 | 102 | .91 | 4,038 | 1.27 | Treasury, tax and loan notes | 251 | 1.72 | 809 | .69 | 102 | .91 | |||||||||||||||||||||||||||||||||||||||
| Other short-term borrowings | 658 | .65 | 1,349 | 1.26 | 6,033 | 2.54 | Other short-term borrowings | 1,972 | 2.20 | 658 | .65 | 1,349 | 1.26 | |||||||||||||||||||||||||||||||||||||||
| Total | $ | 10,850 | .81 | % | $ | 7,806 | 1.03 | % | $ | 14,670 | 1.75 | % | Total | $ | 13,084 | 1.84 | % | $ | 10,850 | .81 | % | $ | 7,806 | 1.03 | % | |||||||||||||||||||||||||||
| Average for the year | Average for the year | Average for the year | ||||||||||||||||||||||||||||||||||||||||||||||||||
| Federal funds purchased | $ | 4,966 | 2.36 | % | $ | 4,145 | 2.94 | % | $ | 4,997 | 5.02 | % | Federal funds purchased | $ | 3,823 | 3.10 | % | $ | 4,966 | 2.36 | % | $ | 4,145 | 2.94 | % | |||||||||||||||||||||||||||
| Securities sold under agreements to repurchase | 3,374 | .79 | 2,308 | 1.14 | 2,421 | 2.89 | Securities sold under agreements to repurchase | 6,144 | 1.19 | 3,374 | .79 | 2,308 | 1.14 | |||||||||||||||||||||||||||||||||||||||
| Commercial paper | 681 | 1.06 | 391 | 1.74 | 390 | 3.85 | Commercial paper | 1,144 | .91 | 681 | 1.06 | 391 | 1.74 | |||||||||||||||||||||||||||||||||||||||
| Treasury, tax and loan notes | 634 | .95 | 707 | 1.50 | 1,321 | 3.53 | Treasury, tax and loan notes | 804 | 1.01 | 634 | .95 | 707 | 1.50 | |||||||||||||||||||||||||||||||||||||||
| Other short-term borrowings | 848 | 1.13 | 2,565 | 2.23 | 2,550 | 3.65 | Other short-term borrowings | 2,619 | 2.01 | 848 | 1.13 | 2,565 | 2.23 | |||||||||||||||||||||||||||||||||||||||
| Total | $ | 10,503 | 1.59 | % | $ | 10,116 | 2.20 | % | $ | 11,679 | 4.07 | % | Total | $ | 14,534 | 1.81 | % | $ | 10,503 | 1.59 | % | $ | 10,116 | 2.20 | % | |||||||||||||||||||||||||||
| Maximum month-end balance | Maximum month-end balance | Maximum month-end balance | ||||||||||||||||||||||||||||||||||||||||||||||||||
| Federal funds purchased | $ | 6,658 | $ | 7,009 | $ | 7,829 | Federal funds purchased | $ | 6,342 | $ | 6,658 | $ | 7,009 | |||||||||||||||||||||||||||||||||||||||
| Securities sold under agreements to repurchase | 4,173 | 2,950 | 3,001 | Securities sold under agreements to repurchase | 8,972 | 4,173 | 2,950 | |||||||||||||||||||||||||||||||||||||||||||||
| Commercial paper | 952 | 452 | 590 | Commercial paper | 2,687 | 952 | 452 | |||||||||||||||||||||||||||||||||||||||||||||
| Treasury, tax and loan notes | 4,223 | 4,164 | 6,618 | Treasury, tax and loan notes | 7,867 | 4,223 | 4,164 | |||||||||||||||||||||||||||||||||||||||||||||
| Other short-term borrowings | 2,676 | 6,172 | 7,149 | Other short-term borrowings | 3,856 | 2,676 | 6,172 | |||||||||||||||||||||||||||||||||||||||||||||
| Note | Long-Term Debt |
Long-term debt (debt with original maturities of more than one year) at December 31 consisted of the following:
| (Dollars in Millions) | (Dollars in Millions) | 2003 | 2002 | (Dollars in Millions) | 2004 | 2003 | ||||||||||||||
U.S. Bancorp(Parent Company) | U.S. Bancorp(Parent Company) | U.S. Bancorp(Parent Company) | ||||||||||||||||||
| Fixed-rate subordinated notes | Fixed-rate subordinated notes | Fixed-rate subordinated notes | ||||||||||||||||||
| 7.00% due 2003 | $ | — | $ | 150 | 8.00% due 2004 | $ | — | $ | 73 | |||||||||||
| 6.625% due 2003 | — | 100 | 7.625% due 2005 | 120 | 120 | |||||||||||||||
| 7.25% due 2003 | — | 32 | 6.75% due 2005 | 186 | 191 | |||||||||||||||
| 8.00% due 2004 | 73 | 73 | 6.875% due 2007 | 220 | 220 | |||||||||||||||
| 7.625% due 2005 | 120 | 120 | 7.30% due 2007 | 171 | 200 | |||||||||||||||
| 6.75% due 2005 | 191 | 191 | 7.50% due 2026 | 200 | 200 | |||||||||||||||
| 6.875% due 2007 | 220 | 220 | ||||||||||||||||||
| 7.30% due 2007 | 200 | 200 | ||||||||||||||||||
| 7.50% due 2026 | 200 | 200 | ||||||||||||||||||
| Senior contingent convertible debt 1.50% due 2021 | — | 57 | ||||||||||||||||||
| Medium-term notes | Medium-term notes | 4,025 | 4,127 | Medium-term notes | 3,225 | 4,025 | ||||||||||||||
| Junior subordinated debentures | Junior subordinated debentures | 2,669 | 2,601 | |||||||||||||||||
| Capitalized lease obligations, mortgage indebtedness and other | Capitalized lease obligations, mortgage indebtedness and other | 171 | 225 | Capitalized lease obligations, mortgage indebtedness and other | 108 | 171 | ||||||||||||||
| Subtotal | 5,200 | 5,695 | Subtotal | 6,899 | 7,801 | |||||||||||||||
Subsidiaries | Subsidiaries | Subsidiaries | ||||||||||||||||||
| Fixed-rate subordinated notes | Fixed-rate subordinated notes | Fixed-rate subordinated notes | ||||||||||||||||||
| 6.00% due 2003 | — | 79 | 6.375% due 2004 | — | 75 | |||||||||||||||
| 6.375% due 2004 | 75 | 75 | 6.375% due 2004 | — | 150 | |||||||||||||||
| 6.375% due 2004 | 150 | 150 | 7.55% due 2004 | — | 100 | |||||||||||||||
| 7.55% due 2004 | 100 | 100 | 8.35% due 2004 | — | 100 | |||||||||||||||
| 8.35% due 2004 | 100 | 100 | 7.30% due 2005 | 100 | 100 | |||||||||||||||
| 7.30% due 2005 | 100 | 100 | 6.875% due 2006 | 70 | 70 | |||||||||||||||
| 6.875% due 2006 | 70 | 70 | 6.625% due 2006 | 100 | 100 | |||||||||||||||
| 6.625% due 2006 | 100 | 100 | 6.50% due 2008 | 300 | 300 | |||||||||||||||
| 6.50% due 2008 | 300 | 300 | 6.30% due 2008 | 300 | 300 | |||||||||||||||
| 6.30% due 2008 | 300 | 300 | 5.70% due 2008 | 400 | 400 | |||||||||||||||
| 5.70% due 2008 | 400 | 400 | 7.125% due 2009 | 500 | 500 | |||||||||||||||
| 7.125% due 2009 | 500 | 500 | 7.80% due 2010 | 300 | 300 | |||||||||||||||
| 7.80% due 2010 | 300 | 300 | 6.375% due 2011 | 1,500 | 1,500 | |||||||||||||||
| 6.375% due 2011 | 1,500 | 1,500 | 6.30% due 2014 | 963 | 1,000 | |||||||||||||||
| 6.30% due 2014 | 1,000 | 1,000 | 4.95% due 2014 | 650 | — | |||||||||||||||
| 4.80% due 2015 | 500 | — | 4.80% due 2015 | 500 | 500 | |||||||||||||||
| Floating-rate subordinated notes | Floating-rate subordinated notes | |||||||||||||||||||
| 2.34% due 2014 | 350 | — | ||||||||||||||||||
| Federal Home Loan Bank advances | Federal Home Loan Bank advances | 8,595 | 9,255 | Federal Home Loan Bank advances | 3,629 | 8,595 | ||||||||||||||
| Bank notes | Bank notes | 10,870 | 7,302 | Bank notes | 17,624 | 10,870 | ||||||||||||||
| Euro medium-term notes due 2004 | Euro medium-term notes due 2004 | 400 | 400 | Euro medium-term notes due 2004 | — | 400 | ||||||||||||||
| Capitalized lease obligations, mortgage indebtedness and other | Capitalized lease obligations, mortgage indebtedness and other | 655 | 862 | Capitalized lease obligations, mortgage indebtedness and other | 554 | 655 | ||||||||||||||
| Subtotal | 26,015 | 22,893 | Subtotal | 27,840 | 26,015 | |||||||||||||||
| Total | $ | 31,215 | $ | 28,588 | Total | $ | 34,739 | $ | 33,816 | |||||||||||
Maturities of long-term debt outstanding at December 31, 2003, are as follows:2004, were:
| Parent | Parent | |||||||||||||||
| (Dollars in Millions) | Consolidated | Company | Consolidated | Company | ||||||||||||
| 2004 | $ | 9,989 | $ | 888 | ||||||||||||
| 2005 | 9,074 | 1,346 | $ | 11,932 | $ | 1,320 | ||||||||||
| 2006 | 1,858 | 658 | 6,309 | 655 | ||||||||||||
| 2007 | 1,574 | 1,557 | 5,819 | 1,501 | ||||||||||||
| 2008 | 4,302 | 503 | 2,221 | 503 | ||||||||||||
| 2009 | 1,018 | 5 | ||||||||||||||
| Thereafter | 4,418 | 248 | 7,440 | 2,915 | ||||||||||||
| Total | $ | 31,215 | $ | 5,200 | $ | 34,739 | $ | 6,899 | ||||||||
| Note |
The Company has issued $2.6 billionsponsors and wholly owns 100% of company-obligatedthe common equity of eight trusts that were formed for the purpose of issuing Company-obligated mandatorily redeemable preferred securities of subsidiary trusts holding solely the junior subordinated debentures of the parent company (“Trust Preferred Securities”) through eight separate issuances by eight wholly-owned subsidiary grantor trusts (“Trusts”). Theto third-party investors and investing the proceeds from the sale of the Trust Preferred Securities accrue and pay distributions periodically at specified rates as providedsolely in the indentures. The Trusts used the net proceeds from the offerings to purchase a like amount of junior subordinated deferrable interest debenturesdebt securities of the Company (the “Debentures”) of. The Debentures held by the Company. The Debenturestrusts, which total $2.6 billion, are the sole assets of the Trusts and are eliminated, along with the related income statement effects, in the consolidated financial statements.
The following table is a summary of the Trust Preferred SecuritiesDebentures included in long-term debt as of December 31, 2003:2004:
| Trust | Trust | |||||||||||||||||||||||||||||||||||||||||||||||||||||||||
| Preferred | Preferred | Earliest | ||||||||||||||||||||||||||||||||||||||||||||||||||||||||
| Issuance | Securities | Debentures | Rate | Maturity | Redemption | Issuance | Securities | Debentures | Rate | Maturity | Redemption | |||||||||||||||||||||||||||||||||||||||||||||||
| Issuance Trust (Dollars in Millions) | Issuance Trust (Dollars in Millions) | Date | Amount (a) | Amount | Type (b) | Rate | Date | Date (c) | Issuance Trust (Dollars in Millions) | Date | Amount | Amount (a) | Type (b) | Rate | Date | Date | ||||||||||||||||||||||||||||||||||||||||||
Retail | Retail | Retail | ||||||||||||||||||||||||||||||||||||||||||||||||||||||||
| USB Capital V | December 2001 | $ | 300 | $ | 309 | Fixed | 7.25 | % | December 2031 | December 7, 2006 | USB Capital V | December 2001 | $300 | $309 | Fixed | 7.25 | % | December 2031 | December 7, 2006 | |||||||||||||||||||||||||||||||||||||||
| USB Capital IV | November 2001 | 500 | 515 | Fixed | 7.35 | November 2031 | November 1, 2006 | USB Capital IV | November 2001 | 500 | 515 | Fixed | 7.35 | November 2031 | November 1, 2006 | |||||||||||||||||||||||||||||||||||||||||||
| USB Capital III | May 2001 | 700 | 722 | Fixed | 7.75 | May 2031 | May 4, 2006 | USB Capital III | May 2001 | 700 | 722 | Fixed | 7.75 | May 2031 | May 4, 2006 | |||||||||||||||||||||||||||||||||||||||||||
Institutional | Institutional | Institutional | ||||||||||||||||||||||||||||||||||||||||||||||||||||||||
| Star Capital I | June 1997 | 150 | 155 | Variable | 1.94 | (d) | June 2027 | June 15, 2007 | Star Capital I | June 1997 | 150 | 155 | Variable | 3.26 | June 2027 | June 15, 2007 | ||||||||||||||||||||||||||||||||||||||||||
| Mercantile Capital Trust I | February 1997 | 150 | 155 | Variable | 2.01 | (e) | February 2027 | February 1, 2007 | Mercantile Capital Trust I | February 1997 | 150 | 155 | Variable | 3.01 | February 2027 | February 1, 2007 | ||||||||||||||||||||||||||||||||||||||||||
| USB Capital I | December 1996 | 300 | 309 | Fixed | 8.27 | December 2026 | December 15, 2006 | USB Capital I | December 1996 | 300 | 309 | Fixed | 8.27 | December 2026 | December 15, 2006 | |||||||||||||||||||||||||||||||||||||||||||
| Firstar Capital Trust I | December 1996 | 150 | 155 | Fixed | 8.32 | December 2026 | December 15, 2006 | Firstar Capital Trust I | December 1996 | 150 | 155 | Fixed | 8.32 | December 2026 | December 15, 2006 | |||||||||||||||||||||||||||||||||||||||||||
| FBS Capital I | November 1996 | 300 | 309 | Fixed | 8.09 | November 2026 | November 15, 2006 | FBS Capital I | November 1996 | 300 | 309 | Fixed | 8.09 | November 2026 | November 15, 2006 | |||||||||||||||||||||||||||||||||||||||||||
| (a) | |
| (b) | The variable-rate Trust Preferred Securities and Debentures reprice |
On April 1, 2003, USB Capital II, a subsidiary company of U.S. Bancorp, redeemed 100 percent, or $350 million of its 7.20 percent Trust Preferred Securities. On May 2, 2003, USB Capital II was legally dissolved.
| Note | Shareholders’ Equity |
At December 31, 20032004 and 2002,2003, the Company had authority to issue 4 billion shares of common stock and 10 million shares of preferred stock. The Company had 1,922.91,857.6 million and 1,917.01,922.9 million shares of common stock outstanding at December 31, 20032004 and 2002,2003, respectively. At December 31, 2003,2004, the Company had 208.0170.5 million shares of common stock reserved for future issuances, primarily under stock option plans.
The following table summarizes the Company’s common stock repurchased in each of the last three years:
| (Dollars and Shares in Millions) | Shares | Value | Shares | Value | ||||||||||||
| 2004 | 93.8 | $ | 2,656 | |||||||||||||
| 2003 | 15.0 | $ | 417 | 15.0 | 417 | |||||||||||
| 2002 | 45.3 | 1,040 | 45.3 | 1,040 | ||||||||||||
| 2001 | 19.7 | 468 | ||||||||||||||
Shareholders’ equity is affected by transactions and valuations of asset and liability positions that require adjustments to Accumulated Other Comprehensive Income. The reconciliation of the transactions affecting Accumulated Other Comprehensive Income included in shareholders’ equity for the years ended December 31, is as follows:
| Transactions | |||||||||||||||||
| Balances | |||||||||||||||||
| (Dollars in Millions) | Pre-tax | Tax-effect | Net-of-tax | Net-of-tax | |||||||||||||
2004 | |||||||||||||||||
| Unrealized loss on securities available-for-sale | $ | (123 | ) | $ | 47 | $ | (76 | ) | $ | (135 | ) | ||||||
| Unrealized loss on derivatives | (43 | ) | 16 | (27 | ) | 9 | |||||||||||
| Foreign currency translation adjustment | (17 | ) | 6 | (11 | ) | 5 | |||||||||||
| Realized gain on derivatives | 16 | (6 | ) | 10 | 105 | ||||||||||||
| Reclassification adjustment for losses realized in net income | 32 | (12 | ) | 20 | — | ||||||||||||
| Total | $ | (135 | ) | $ | 51 | $ | (84 | ) | $ | (16 | ) | ||||||
2003 | |||||||||||||||||
| Unrealized loss on securities available-for-sale | $ | (716 | ) | $ | 272 | $ | (444 | ) | $ | (123 | ) | ||||||
| Unrealized loss on derivatives | (373 | ) | 142 | (231 | ) | 35 | |||||||||||
| Foreign currency translation adjustment | 23 | (9 | ) | 14 | 16 | ||||||||||||
| Realized gain on derivatives | 199 | (76 | ) | 123 | 140 | ||||||||||||
| Reclassification adjustment for gains realized in net income | (288 | ) | 110 | (178 | ) | — | |||||||||||
| Total | $ | (1,155 | ) | $ | 439 | $ | (716 | ) | $ | 68 | |||||||
2002 | |||||||||||||||||
| Unrealized gain on securities available-for-sale | $ | 1,048 | $ | (398 | ) | $ | 650 | $ | 473 | ||||||||
| Unrealized gain on derivatives | 324 | (123 | ) | 201 | 266 | ||||||||||||
| Foreign currency translation adjustment | 7 | (3 | ) | 4 | 2 | ||||||||||||
| Realized gain on derivatives | 64 | (24 | ) | 40 | 43 | ||||||||||||
| Reclassification adjustment for gains realized in net income | (332 | ) | 126 | (206 | ) | — | |||||||||||
| Total | $ | 1,111 | $ | (422 | ) | $ | 689 | $ | 784 | ||||||||
Regulatory Capital
| Transactions | |||||||||||||||||
| Balance | |||||||||||||||||
| (Dollars in Millions) | Pre-tax | Tax-effect | Net-of-tax | Net-of-tax | |||||||||||||
2003 | |||||||||||||||||
| Unrealized loss on securities available-for-sale | $ | (716 | ) | $ | 272 | $ | (444 | ) | $ | (123 | ) | ||||||
| Unrealized loss on derivatives | (373 | ) | 142 | (231 | ) | 35 | |||||||||||
| Realized gain on derivatives | 199 | (76 | ) | 123 | 140 | ||||||||||||
| Reclassification adjustment for gains realized in net income | (288 | ) | 110 | (178 | ) | — | |||||||||||
| Foreign currency translation adjustment | 23 | (9 | ) | 14 | 16 | ||||||||||||
| Total | $ | (1,155 | ) | $ | 439 | $ | (716 | ) | $ | 68 | |||||||
2002 | |||||||||||||||||
| Unrealized gain on securities available-for-sale | $ | 1,048 | $ | (398 | ) | $ | 650 | $ | 473 | ||||||||
| Unrealized gain on derivatives | 324 | (123 | ) | 201 | 266 | ||||||||||||
| Realized gain on derivatives | 64 | (24 | ) | 40 | 43 | ||||||||||||
| Reclassification adjustment for gains | |||||||||||||||||
| realized in net income | (332 | ) | 126 | (206 | ) | — | |||||||||||
| Foreign currency translation adjustment | 7 | (3 | ) | 4 | 2 | ||||||||||||
| Total | $ | 1,111 | $ | (422 | ) | $ | 689 | $ | 784 | ||||||||
2001 | |||||||||||||||||
| Unrealized gain on securities available-for-sale | $ | 194 | $ | (78 | ) | $ | 116 | $ | 9 | ||||||||
| Unrealized gain on derivatives | 106 | (40 | ) | 66 | 65 | ||||||||||||
| Realized gain on derivatives | 42 | (16 | ) | 26 | 24 | ||||||||||||
| Reclassification adjustment for gains | |||||||||||||||||
| realized in net income | (333 | ) | 127 | (206 | ) | — | |||||||||||
| Foreign currency translation adjustment | (4 | ) | 1 | (3 | ) | (3 | ) | ||||||||||
| Total | $ | 5 | $ | (6 | ) | $ | (1 | ) | $ | 95 | |||||||
| Note | Earnings Per Share |
The components of earnings per share were:
| (Dollars and Shares in Millions, Except Per Share Data) | (Dollars and Shares in Millions, Except Per Share Data) | 2003 | 2002 | 2001 | (Dollars and Shares in Millions, Except Per Share Data) | 2004 | 2003 | 2002 | ||||||||||||||||||||||
| Income from continuing operations | Income from continuing operations | $ | 3,710.1 | $ | 3,228.0 | $ | 1,524.0 | Income from continuing operations | $ | 4,166.8 | $ | 3,710.1 | $ | 3,228.0 | ||||||||||||||||
| Income (loss) from discontinued operations (after-tax) | 22.5 | (22.7 | ) | (45.2 | ) | Income (loss) from discontinued operations (after-tax) | — | 22.5 | (22.7 | ) | ||||||||||||||||||||
| Cumulative effect of accounting change (after-tax) | — | (37.2 | ) | — | Cumulative effect of accounting change (after-tax) | — | — | (37.2 | ) | |||||||||||||||||||||
| Net income | $ | 3,732.6 | $ | 3,168.1 | $ | 1,478.8 | Net income | $ | 4,166.8 | $ | 3,732.6 | $ | 3,168.1 | |||||||||||||||||
| Weighted-average common shares outstanding | 1,923.7 | 1,916.0 | 1,927.9 | |||||||||||||||||||||||||||
| Average common shares outstanding | Average common shares outstanding | 1,887.1 | 1,923.7 | 1,916.0 | ||||||||||||||||||||||||||
| Net effect of the assumed purchase of stock based on the treasury stock method for options and stock plans | Net effect of the assumed purchase of stock based on the treasury stock method for options and stock plans | 12.5 | 8.8 | 12.4 | Net effect of the assumed purchase of stock based on the treasury stock method for options and stock plans | 25.8 | 12.5 | 8.8 | ||||||||||||||||||||||
| Weighted-average diluted common shares outstanding | 1,936.2 | 1,924.8 | 1,940.3 | |||||||||||||||||||||||||||
| Average diluted common shares outstanding | Average diluted common shares outstanding | 1,912.9 | 1,936.2 | 1,924.8 | ||||||||||||||||||||||||||
Earnings per share | Earnings per share | Earnings per share | ||||||||||||||||||||||||||||
| Income from continuing operations | $ | 1.93 | $ | 1.68 | $ | .79 | Income from continuing operations | $ | 2.21 | $ | 1.93 | $ | 1.68 | |||||||||||||||||
| Discontinued operations | .01 | (.01 | ) | (.02 | ) | Discontinued operations | — | .01 | (.01 | ) | ||||||||||||||||||||
| Cumulative effect of accounting change | — | (.02 | ) | — | Cumulative effect of accounting change | — | — | (.02 | ) | |||||||||||||||||||||
| Net income | $ | 1.94 | $ | 1.65 | $ | .77 | Net income | $ | 2.21 | $ | 1.94 | $ | 1.65 | |||||||||||||||||
Diluted earnings per share | Diluted earnings per share | Diluted earnings per share | ||||||||||||||||||||||||||||
| Income from continuing operations | $ | 1.92 | $ | 1.68 | $ | .79 | Income from continuing operations | $ | 2.18 | $ | 1.92 | $ | 1.68 | |||||||||||||||||
| Discontinued operations | .01 | (.01 | ) | (.03 | ) | Discontinued operations | — | .01 | (.01 | ) | ||||||||||||||||||||
| Cumulative effect of accounting change | — | (.02 | ) | — | Cumulative effect of accounting change | — | — | (.02 | ) | |||||||||||||||||||||
| Net income | $ | 1.93 | $ | 1.65 | $ | .76 | Net income | $ | 2.18 | $ | 1.93 | $ | 1.65 | |||||||||||||||||
For the years ended December 31, 2004, 2003 2002 and 2001,2002, options to purchase 36 million, 79 million 140 million and 125140 million shares, respectively, were outstanding but not included in the computation of diluted earnings per share because they were antidilutive.
| Note | Employee Benefits |
Employee Investment PlanThe Company has a defined contribution retirement savings plansplan which allowallows qualified employees, at their option, to make contributions up to certain percentages50 percent of pre-tax base salary through salary deductions under Section 401(k) of the Internal Revenue Code. Employee contributions are invested, at the employees’ direction, among a variety of investment alternatives. Employee contributions are 100 percent matched by the Company, up to the first four percent of an employee’s compensation. The Company’s matching contribution vests immediately; however, a participant must be employed on December 31st to receive that year’s matching contribution. Although the matching contribution is initially invested in the Company’s common stock, an employee can reinvest the matching contributions among various investment alternatives. Total expense was $49.1 million, $48.5 million and $50.5 million in 2004, 2003 and $43.7 million in 2003, 2002, and 2001, respectively.
Pension PlansPension benefits are provided to substantially all employees based on years of service and employees’ compensation while employed with the Company. Employees are fully vested after five years of service. Prior to their acquisition dates, employees of certain acquired companies were covered by separate, noncontributory pension plans that provided benefits based on years of service and compensation. Generally, the Company merges plans of acquired companies into its existing pension plans when it becomes practicable.
Funding PracticesThe Company’s funding policy is to contribute amounts to its plans sufficient to meet the minimum funding requirements of the Employee Retirement Income Security Act of 1974, plus such additional amounts as the Company determines to be appropriate. DuringIn 2003, and 2002, the Company made contributionsa contribution of $310.8 million and $150.0 million, respectively, to the qualified pension plan in accordance with this policy. No contributions were made in 2004. In 2004,2005, the Company anticipates no minimum funding requirement and therefore does not expect to make any contributions to the plan. Contributions made to the plan were invested in accordance with established investment policies and asset allocation strategies.
Investment Policies and Asset AllocationIn establishing its investment policies and asset allocation strategies, the Company considers expected returns and the volatility associated with different strategies. The independent consultant performs modeling that projects numerous outcomes using a broad range of possible scenarios, including a mix of possible rates of inflation and economic growth. Some of the scenarios included are: low inflation and high growth (ideal growth), low inflation and low growth (recession), high inflation and low growth (stagflation) and high inflation and high growth (inflationary growth). Starting with current economic information, the model bases its projections on past relationships between inflation, fixed income rates and equity returns when these types of economic conditions have existed over the previous 30 years, both in the U.S. and in foreign countries.
The following unaudited table provides a summary of asset allocations adopted by the Company compared with a typical asset allocation alternative:
| 2003 | 2004 | |||||||||||||||||||||||||||||||||||||||||||||||||||||||||||||||||
| Asset Allocation | Expected Returns | Asset Allocation | Expected Returns | |||||||||||||||||||||||||||||||||||||||||||||||||||||||||||||||
| December 2003 | December 2002 | December 2004 | December 2003 | |||||||||||||||||||||||||||||||||||||||||||||||||||||||||||||||
| Typical | Standard | Typical | Standard | |||||||||||||||||||||||||||||||||||||||||||||||||||||||||||||||
| Asset Class | Asset Class | Asset Mix | Actual | Target (a) | Actual | Target | Compound | Average | Deviation | Asset Class | Asset Mix | Actual | Target | Actual | Target (a) | Compound | Average | Deviation | ||||||||||||||||||||||||||||||||||||||||||||||||
Domestic Equities | ||||||||||||||||||||||||||||||||||||||||||||||||||||||||||||||||||
Domestic equities | Domestic equities | |||||||||||||||||||||||||||||||||||||||||||||||||||||||||||||||||
| Large Cap | 30 | % | 42 | % | 55 | % | 33 | % | 36 | % | 8.3 | % | 9.7 | % | 18.0 | % | Large Cap | 30 | % | 53 | % | 55 | % | 42 | % | 55 | % | 8.0 | % | 9.5 | % | 18.0 | % | |||||||||||||||||||||||||||||||||
| Mid Cap | 15 | 15 | 19 | 18 | 18 | 8.6 | 10.6 | 21.1 | Mid Cap | 15 | 16 | 19 | 15 | 19 | 8.4 | 10.4 | 21.1 | |||||||||||||||||||||||||||||||||||||||||||||||||
| Small Cap | 15 | 19 | 6 | 27 | 26 | 8.8 | 11.3 | 24.0 | Small Cap | 15 | 7 | 6 | 19 | 6 | 8.6 | 11.1 | 24.0 | |||||||||||||||||||||||||||||||||||||||||||||||||
International Equities | 10 | 21 | 20 | 18 | 20 | 8.5 | 10.6 | 21.9 | ||||||||||||||||||||||||||||||||||||||||||||||||||||||||||
Fixed Income | 30 | — | — | — | — | |||||||||||||||||||||||||||||||||||||||||||||||||||||||||||||
International equities | International equities | 10 | 22 | 20 | 21 | 20 | 8.3 | 10.4 | 21.9 | |||||||||||||||||||||||||||||||||||||||||||||||||||||||||
Fixed income | Fixed income | 30 | — | — | — | — | ||||||||||||||||||||||||||||||||||||||||||||||||||||||||||||
Other | Other | — | 3 | — | 4 | — | Other | — | 2 | — | 3 | — | ||||||||||||||||||||||||||||||||||||||||||||||||||||||
Total mix or weighted rates | Total mix or weighted rates | 100 | % | 100 | % | 100 | % | 100 | % | 100 | % | 8.7 | 10.2 | 18.0 | Total mix or weighted rates | 100 | % | 100 | % | 100 | % | 100 | % | 100 | % | 8.5 | 10.0 | 18.0 | ||||||||||||||||||||||||||||||||||||||
| LTROR assumed | 7.8 | % | 8.9 | % (b) | 9.9 | % | LTROR assumed | 7.8 | % | 8.9 | % (b) | 8.9 | % | |||||||||||||||||||||||||||||||||||||||||||||||||||||
| Standard deviation | 13.9 | % | 18.0 | % | 18.8 | % | Standard deviation | 13.9 | % | 18.0 | % | 18.0 | % | |||||||||||||||||||||||||||||||||||||||||||||||||||||
| Sharpe ratio (c) | .399 | .389 | .382 | Sharpe ratio (c) | .409 | .386 | .389 | |||||||||||||||||||||||||||||||||||||||||||||||||||||||||||
| (a) | The target asset allocation was modified in December 2003, effective January 1, 2004, to reduce the potential volatility of the portfolio without significantly reducing the expected returns. The change in the allocation |
| (b) | The LTROR assumed for the target asset allocation strategy of 8.9 percent is based on a range of estimates evaluated by the Company including the compound expected return of |
| (c) | The Sharpe ratio is a direct measure of reward-to-risk. The Sharpe ratio for these asset allocation strategies is considered to be within acceptable parameters. |
Post-Retirement Medical PlansIn addition to providing pension benefits, the Company provides health care and death benefits to certain retired employees through several retiree medical programs. As a result of the Firstar/ USBM merger, there were three major retiree medical programs in place during 2001 with various terms and subsidy schedules. Effective January 1, 2002, theThe Company adopted one retiree medical program for all future retirees.retirees on January 1, 2002. For certain eligible employees, the provisions of the USBM retiree medical plan and the Mercantile retiree medical plan remained in place until December 31, 2002. Generally, all employees may become eligible for retiree health care benefits by meeting defined age and service requirements. The Company may also subsidize the cost of coverage for employees meeting certain age and service requirements. The medical plan contains other cost-sharing features such as deductibles and coinsurance. The estimated cost of these retiree benefit payments is accrued during the employees’ active service.
The Company uses a measurement date of September 30 for its retirement plans. The following table summarizes benefit obligation and plan asset activity for the retirement plans:
| Post-Retirement | Post-Retirement | |||||||||||||||||||||||||||||||||
| Pension Plans | Medical Plans | Pension Plans | Medical Plans | |||||||||||||||||||||||||||||||
| (Dollars in Millions) | (Dollars in Millions) | 2003 | 2002 | 2003 | 2002 | (Dollars in Millions) | 2004 | 2003 | 2004 | 2003 | ||||||||||||||||||||||||
Projected benefit obligation | Projected benefit obligation | Projected benefit obligation | ||||||||||||||||||||||||||||||||
| Benefit obligation at beginning of measurement period | $ | 1,671.1 | $ | 1,656.4 | $ | 282.5 | $ | 265.1 | ||||||||||||||||||||||||||
| Service cost | 56.5 | 49.9 | 3.4 | 3.3 | Benefit obligation at beginning of measurement period | $ | 1,801.1 | $ | 1,671.1 | $ | 320.3 | $ | 282.5 | |||||||||||||||||||||
| Interest cost | 107.7 | 115.1 | 18.5 | 19.1 | Service cost | 58.5 | 56.5 | 3.7 | 3.4 | |||||||||||||||||||||||||
| Plan participants’ contributions | — | — | 14.9 | 10.4 | Interest cost | 109.5 | 107.7 | 18.1 | 18.5 | |||||||||||||||||||||||||
| Actuarial loss | 161.7 | — | 38.9 | 18.1 | Plan participants’ contributions | — | — | 16.2 | 14.9 | |||||||||||||||||||||||||
| Benefit payments | (140.8 | ) | (147.3 | ) | (36.5 | ) | (33.5 | ) | Actuarial (gain) loss | 150.3 | 161.7 | (40.2 | ) | 38.9 | ||||||||||||||||||||
| Curtailments | — | (.7 | ) | — | — | Benefit payments | (162.6 | ) | (140.8 | ) | (36.7 | ) | (36.5 | ) | ||||||||||||||||||||
| Settlements | (23.8 | ) | (5.0 | ) | — | — | Curtailments | — | — | — | — | |||||||||||||||||||||||
| Benefit obligation transferred to Piper Jaffray Companies | (31.3 | ) | — | (1.4 | ) | — | Settlements | (5.7 | ) | (23.8 | ) | — | — | |||||||||||||||||||||
| Termination benefits | — | 2.7 | — | — | Benefit obligation transferred to Piper Jaffray Companies | — | (31.3 | ) | — | (1.4 | ) | |||||||||||||||||||||||
| Benefit obligation at end of measurement period (a) (b) | $ | 1,801.1 | $ | 1,671.1 | $ | 320.3 | $ | 282.5 | Benefit obligation at end of measurement period (a)(b) | $ | 1,951.1 | $ | 1,801.1 | $ | 281.4 | $ | 320.3 | |||||||||||||||||
Fair value of plan assets | Fair value of plan assets | Fair value of plan assets | ||||||||||||||||||||||||||||||||
| Fair value at beginning of measurement period | $ | 1,442.7 | $ | 1,611.1 | $ | 30.2 | $ | 35.4 | Fair value at beginning of measurement period | $ | 1,975.8 | $ | 1,442.7 | $ | 38.9 | $ | 30.2 | |||||||||||||||||
| Actual return on plan assets | 351.7 | (193.2 | ) | .4 | .7 | Actual return on plan assets | 298.7 | 351.7 | .2 | .4 | ||||||||||||||||||||||||
| Employer contributions | 346.0 | 172.1 | 29.9 | 17.2 | Employer contributions | 20.8 | 346.0 | 20.2 | 29.9 | |||||||||||||||||||||||||
| Plan participants’ contributions | — | — | 14.9 | 10.4 | Plan participants’ contributions | — | — | 16.2 | 14.9 | |||||||||||||||||||||||||
| Settlements | (23.8 | ) | — | — | — | Settlements | (5.7 | ) | (23.8 | ) | — | — | ||||||||||||||||||||||
| Benefit payments | (140.8 | ) | (147.3 | ) | (36.5 | ) | (33.5 | ) | Benefit payments | (162.6 | ) | (140.8 | ) | (36.7 | ) | (36.5 | ) | |||||||||||||||||
| Fair value at end of measurement period (c) | $ | 1,975.8 | $ | 1,442.7 | $ | 38.9 | $ | 30.2 | Fair value at end of measurement period (c) | $ | 2,127.0 | $ | 1,975.8 | $ | 38.8 | $ | 38.9 | |||||||||||||||||
Funded status | Funded status | Funded status | ||||||||||||||||||||||||||||||||
| Funded status at end of measurement period | $ | 174.7 | $ | (228.4 | ) | $ | (281.4 | ) | $ | (252.3 | ) | Funded status at end of measurement period | $ | 175.9 | $ | 174.7 | $ | (242.6 | ) | $ | (281.4 | ) | ||||||||||||
| Unrecognized transition (asset) obligation | — | (.1 | ) | 6.6 | 7.4 | Unrecognized transition (asset) obligation | — | — | 5.9 | 6.6 | ||||||||||||||||||||||||
| Unrecognized prior service cost | (51.1 | ) | (59.0 | ) | (7.2 | ) | (8.6 | ) | Unrecognized prior service cost | (44.8 | ) | (51.1 | ) | (6.3 | ) | (7.2 | ) | |||||||||||||||||
| Unrecognized net (gain) loss | 854.7 | 867.8 | 80.0 | 41.0 | Unrecognized net (gain) loss | 840.8 | 854.7 | 38.6 | 80.0 | |||||||||||||||||||||||||
| Fourth quarter contribution | 4.8 | 4.3 | 5.4 | 13.7 | Fourth quarter contribution | 4.5 | 4.8 | 3.8 | 5.4 | |||||||||||||||||||||||||
| Net amount recognized | $ | 983.1 | $ | 584.6 | $ | (196.6 | ) | $ | (198.8 | ) | Net amount recognized | $ | 976.4 | $ | 983.1 | $ | (200.6 | ) | $ | (196.6 | ) | |||||||||||||
Components of statement of financial position | Components of statement of financial position | Components of statement of financial position | ||||||||||||||||||||||||||||||||
| Prepaid benefit cost | $ | 1,123.8 | $ | 763.9 | $ | — | $ | — | Prepaid benefit cost | $ | 1,155.6 | $ | 1,123.8 | $ | — | $ | — | |||||||||||||||||
| Accrued benefit liability | (140.7 | ) | (179.3 | ) | (196.6 | ) | (198.8 | ) | Accrued benefit liability | (179.2 | ) | (140.7 | ) | (200.6 | ) | (196.6 | ) | |||||||||||||||||
| Net amount recognized | $ | 983.1 | $ | 584.6 | $ | (196.6 | ) | $ | (198.8 | ) | Net amount recognized | $ | 976.4 | $ | 983.1 | $ | (200.6 | ) | $ | (196.6 | ) | |||||||||||||
| (a) | At December 31, |
| (b) | U.S. Bancorp retained the qualified pension plan obligation for the inactive participants, relating to employees of the Piper Jaffray Companies. Therefore, all liabilities and plan assets related to inactive participants in the qualified pension plan associated with the Piper Jaffray Companies are included in the pension plans benefit obligation. |
| (c) | At December 31, |
The following table sets forth the components of net periodic benefit cost (income) for the retirement plans:
| Pension Plans | Post-Retirement Medical Plans | Pension Plans | Post-Retirement Medical Plans | |||||||||||||||||||||||||||||||||||||||||||||||
| (Dollars in Millions) | (Dollars in Millions) | 2003 | 2002 | 2001 | 2003 | 2002 | 2001 | (Dollars in Millions) | 2004 | 2003 | 2002 | 2004 | 2003 | 2002 | ||||||||||||||||||||||||||||||||||||
| Components of net periodic benefit cost (income) | Components of net periodic benefit cost (income) | Components of net periodic benefit cost (income) | ||||||||||||||||||||||||||||||||||||||||||||||||
| Service cost | $ | 56.5 | $ | 49.9 | $ | 50.5 | $ | 3.4 | $ | 3.3 | $ | 2.1 | Service cost | $ | 58.5 | $ | 56.5 | $ | 49.9 | $ | 3.7 | $ | 3.4 | $ | 3.3 | |||||||||||||||||||||||||
| Interest cost | 107.7 | 115.1 | 118.7 | 18.5 | 19.1 | 17.9 | Interest cost | 109.5 | 107.7 | 115.1 | 18.1 | 18.5 | 19.1 | |||||||||||||||||||||||||||||||||||||
| Expected return on plan assets | (184.4 | ) | (214.1 | ) | (232.6 | ) | (1.2 | ) | (1.6 | ) | (1.0 | ) | Expected return on plan assets | (203.1 | ) | (184.4 | ) | (214.1 | ) | (1.4 | ) | (1.2 | ) | (1.6 | ) | |||||||||||||||||||||||||
| Net amortization and deferral | (6.7 | ) | (6.5 | ) | (10.7 | ) | (.2 | ) | (.1 | ) | .2 | Net amortization and deferral | (6.3 | ) | (6.7 | ) | (6.5 | ) | (.1 | ) | (.2 | ) | (.1 | ) | ||||||||||||||||||||||||||
| Recognized actuarial (gain) loss | (.5 | ) | .8 | (1.2 | ) | .5 | — | (.1 | ) | Recognized actuarial (gain) loss | 50.4 | (.5 | ) | .8 | 2.4 | .5 | — | |||||||||||||||||||||||||||||||||
| Net periodic benefit cost (income) | Net periodic benefit cost (income) | (27.4 | ) | (54.8 | ) | (75.3 | ) | 21.0 | 20.7 | 19.1 | Net periodic benefit cost (income) | 9.0 | (27.4 | ) | (54.8 | ) | 22.7 | 21.0 | 20.7 | |||||||||||||||||||||||||||||||
| Curtailment and settlement (gain) loss | 3.5 | (11.7 | ) | — | — | — | — | Curtailment and settlement (gain) loss | — | 3.5 | (11.7 | ) | — | — | — | |||||||||||||||||||||||||||||||||||
| Cost of special or contractual termination benefits recognized | — | 2.7 | — | — | — | — | Cost of special or contractual termination benefits recognized | — | — | 2.7 | — | — | — | |||||||||||||||||||||||||||||||||||||
| Net periodic benefit cost (income) after curtailment and settlement (gain) loss, and cost of special or contractual termination benefits recognized | Net periodic benefit cost (income) after curtailment and settlement (gain) loss, and cost of special or contractual termination benefits recognized | $ | (23.9 | ) | $ | (63.8 | ) | $ | (75.3 | ) | $ | 21.0 | $ | 20.7 | $ | 19.1 | Net periodic benefit cost (income) after curtailment and settlement (gain) loss, and cost of special or contractual termination benefits recognized | $ | 9.0 | $ | (23.9 | ) | $ | (63.8 | ) | $ | 22.7 | $ | 21.0 | $ | 20.7 | |||||||||||||||||||
The following table sets forth the weighted-average plan assumptions and other data:
| Company | USBM | Firstar | Company | |||||||||||||||||||||||||||||
| (Dollars in Millions) | (Dollars in Millions) | 2003 | 2002 | 2001 | 2001 | (Dollars in Millions) | 2004 | 2003 | 2002 | |||||||||||||||||||||||
| Pension plan actuarial computations | Pension plan actuarial computations | Pension plan actuarial computations | ||||||||||||||||||||||||||||||
| Expected long-term return on plan assets (a) (b) | 8.9 | % | 10.9 | % | 11.0 | % | 12.2 | % | Expected long-term return on plan assets (c) | 8.9 | % | 8.9 | % | 10.9 | % | |||||||||||||||||
| Discount rate in determining benefit obligations (c) | 6.2 | 6.8 | 7.5 | 7.5 | Discount rate in determining benefit obligations (a) | 6.0 | 6.2 | 6.8 | ||||||||||||||||||||||||
| Rate of increase in future compensation | 3.5 | 3.5 | 3.5 | 3.5 | Rate of increase in future compensation | 3.5 | 3.5 | 3.5 | ||||||||||||||||||||||||
| Post-retirement medical plan actuarial computations | Post-retirement medical plan actuarial computations | Post-retirement medical plan actuarial computations | ||||||||||||||||||||||||||||||
| Expected long-term return on plan assets | 3.5 | % | 5.0 | % | 5.0 | % | * | % | Expected long-term return on plan assets | 3.5 | % | 3.5 | % | 5.0 | % | |||||||||||||||||
| Discount rate in determining benefit obligations | 6.2 | 6.8 | 7.5 | 7.5 | Discount rate in determining benefit obligations | 6.0 | 6.2 | 6.8 | ||||||||||||||||||||||||
| Health care cost trend rate (d) | Health care cost trend rate (b) | |||||||||||||||||||||||||||||||
| Prior to age 65 | 11.0 | % | 12.0 | % | 10.5 | % | 10.5 | % | Prior to age 65 | 10.0 | % | 11.0 | % | 12.0 | % | |||||||||||||||||
| After age 65 | 13.0 | 14.0 | 13.0 | 13.0 | After age 65 | 12.0 | 13.0 | 14.0 | ||||||||||||||||||||||||
| Effect of one percent increase in health care cost trend rate | Effect of one percent increase in health care cost trend rate | Effect of one percent increase in health care cost trend rate | ||||||||||||||||||||||||||||||
| Service and interest costs | $ | 1.4 | $ | 1.3 | $ | 1.2 | $ | .4 | Service and interest costs | $ | 1.4 | $ | 1.4 | $ | 1.3 | |||||||||||||||||
| Accumulated post-retirement benefit obligation | 22.5 | 19.7 | 13.1 | 6.0 | Accumulated post-retirement benefit obligation | 21.1 | 22.5 | 19.7 | ||||||||||||||||||||||||
| Effect of one percent decrease in health care cost trend rate | Effect of one percent decrease in health care cost trend rate | Effect of one percent decrease in health care cost trend rate | ||||||||||||||||||||||||||||||
| Service and interest costs | $ | (1.3 | ) | $ | (1.2 | ) | $ | (1.0 | ) | $ | (.4 | ) | Service and interest costs | $ | (1.3 | ) | $ | (1.3 | ) | $ | (1.2 | ) | ||||||||||
| Accumulated post-retirement benefit obligation | (20.0 | ) | (17.5 | ) | (13.6 | ) | (5.7 | ) | Accumulated post-retirement benefit obligation | (18.8 | ) | (20.0 | ) | (17.5 | ) | |||||||||||||||||
| (a) | |
| (b) | The pre-65 and post-65 rates are assumed to decrease gradually to 5.5% and 6.0% respectively by 2011 and remain at these levels thereafter |
| (c) | In light of the market performance and the results of the independent analysis, the Company made a decision to re-measure its pension plans effective in the third quarter of 2002 based on the current information at that time with respect to asset values, a reduction in the LTROR, discount rates, census data and other relevant factors. As a result of the remeasurement, the LTROR was reduced to 9.9% for the last half of 2002. |
The following table provides information for pension plans with benefit obligations in excess of plan assets:
| (Dollars in Millions) | 2003 | 2002 | 2004 | 2003 | ||||||||||||
| Benefit obligation | $ | 188.7 | $ | 218.6 | $ | 233.9 | $ | 183.9 | ||||||||
| Accumulated benefit obligation | 179.6 | 210.6 | 222.6 | 174.8 | ||||||||||||
| Fair value of plan assets | — | — | — | — | ||||||||||||
The following benefit payments (net of participant contributions) are expected to be paid from the retirement plans:
| Pension | Post-Retirement | ||||||||
| (Dollars in Millions) | Plans | Medical Plans | |||||||
| Estimated Future Benefit Payments | |||||||||
| 2005 | $ | 158.6 | $ | 24.8 | |||||
| 2006 | 132.9 | 21.9 | |||||||
| 2007 | 130.9 | 22.6 | |||||||
| 2008 | 127.3 | 23.2 | |||||||
| 2009 | 125.9 | 23.7 | |||||||
| 2010 — 2014 | 606.3 | 119.6 | |||||||
| Note | Stock-based Compensation |
As part of its employee and director compensation programs, the Company may grant certain stock awards under the provisions of the existing stock compensation plans, including plans assumed in acquisitions. The plans provide for grants of options to purchase shares of common stock at a fixed price generally equal to the fair value of the underlying stock at the date of grant. Option grants are generally exercisable up to ten years from the date of grant. In addition, the plans provide for grants of shares of common stock or stock units that are subject to restriction on transfer. Most stock awards vest over three to five years and are subject to forfeiture if certain vesting requirements are not met.
The following is a summary of shares issuable under stock options outstanding and exercised under various stock optionoptions plans of the Company:
| 2003 | 2002 | 2001 | 2004 | 2003 | 2002 | |||||||||||||||||||||||||||||||||||||||||||||
| Weighted-Average | Weighted-Average | Weighted-Average | Stock | Weighted-Average | Stock | Weighted-Average | Stock | Weighted-Average | ||||||||||||||||||||||||||||||||||||||||||
| Year Ended December 31 | Year Ended December 31 | Stock Options | Exercise Price | Stock Options | Exercise Price | Stock Options | Exercise Price | Year Ended December 31 | Options/Shares | Exercise Price | Options/Shares | Exercise Price | Options/Shares | Exercise Price | ||||||||||||||||||||||||||||||||||||
Stock option plans | Stock option plans | Stock option plans | ||||||||||||||||||||||||||||||||||||||||||||||||
| Number outstanding at beginning of year | Number outstanding at beginning of year | 206,252,590 | $ | 22.77 | 201,610,265 | $ | 22.58 | 153,396,226 | $ | 22.80 | Number outstanding at beginning of year | 165,522,354 | $ | 22.93 | 206,252,590 | $ | 22.77 | 201,610,265 | $ | 22.58 | ||||||||||||||||||||||||||||||
| Granted | 1,872,653 | 23.00 | 29,742,189 | 21.81 | 65,144,310 | 21.25 | Granted | 8,741,521 | 28.46 | 1,872,653 | 23.00 | 29,742,189 | 21.81 | |||||||||||||||||||||||||||||||||||||
| Assumed/converted (a) | 1,116,884 | — | — | — | 8,669,285 | 16.40 | Assumed/converted (a) | — | — | 1,116,884 | — | — | — | |||||||||||||||||||||||||||||||||||||
| Exercised | (22,484,069 | ) | 18.27 | (9,594,213 | ) | 13.26 | (12,775,067 | ) | 13.44 | Exercised | (27,319,242 | ) | 21.59 | (22,484,069 | ) | 18.27 | (9,594,213 | ) | 13.26 | |||||||||||||||||||||||||||||||
| Cancelled | (21,235,704 | ) | 25.13 | (15,505,651 | ) | 24.18 | (12,824,489 | ) | 23.29 | Cancelled (b) | (12,217,348 | ) | 24.56 | (21,235,704 | ) | 25.13 | (15,505,651 | ) | 24.18 | |||||||||||||||||||||||||||||||
| Number outstanding at end of year | Number outstanding at end of year | 165,522,354 | $ | 22.93 | 206,252,590 | $ | 22.77 | 201,610,265 | $ | 22.58 | Number outstanding at end of year | 134,727,285 | $ | 23.41 | 165,522,354 | $ | 22.93 | 206,252,590 | $ | 22.77 | ||||||||||||||||||||||||||||||
| Exercisable at end of year | Exercisable at end of year | 116,427,321 | $ | 23.60 | 123,195,273 | $ | 23.63 | 117,534,343 | $ | 22.36 | Exercisable at end of year | 101,027,155 | $ | 23.51 | 116,427,321 | $ | 23.60 | 123,195,273 | $ | 23.63 | ||||||||||||||||||||||||||||||
| Weighted-average fair value of options granted | Weighted-average fair value of options granted | $ | 8.75 | $ | 6.82 | $ | 7.03 | |||||||||||||||||||||||||||||||||||||||||||
Restricted share plans | Restricted share plans | Restricted share plans | ||||||||||||||||||||||||||||||||||||||||||||||||
| Number outstanding at beginning of year | Number outstanding at beginning of year | 2,280,057 | 2,177,588 | 6,377,137 | Number outstanding at beginning of year | 1,304,106 | 2,280,057 | 2,177,588 | ||||||||||||||||||||||||||||||||||||||||||
| Granted | 58,481 | 806,355 | 1,021,887 | |||||||||||||||||||||||||||||||||||||||||||||||
| Assumed/converted | — | — | 298,988 | Granted | 1,338,054 | 58,481 | 806,355 | |||||||||||||||||||||||||||||||||||||||||||
| Cancelled/vested | (1,034,432 | ) | (703,886 | ) | (5,520,424 | ) | Cancelled/vested | (376,535 | ) | (1,034,432 | ) | (703,886 | ) | |||||||||||||||||||||||||||||||||||||
| Number outstanding at end of year | Number outstanding at end of year | 1,304,106 | 2,280,057 | 2,177,588 | Number outstanding at end of year | 2,265,625 | 1,304,106 | 2,280,057 | ||||||||||||||||||||||||||||||||||||||||||
| Weighted-average fair value of shares granted | Weighted-average fair value of shares granted | $ | 6.82 | $ | 7.03 | $ | 6.76 | Weighted-average fair value of shares granted | $ | 28.42 | $ | 24.43 | $ | 20.51 | ||||||||||||||||||||||||||||||||||||
| (a) | |
| (b) | Options cancelled includes both non-vested (i.e., forfeitures) and vested shares. |
Additional information regarding stock options outstanding as of December 31, 2003,2004, is as follows:
| Options Outstanding | Exercisable Options | Options Outstanding | Exercisable Options | |||||||||||||||||||||||||||||||||||||
| Weighted- | Weighted- | |||||||||||||||||||||||||||||||||||||||
| Average | Weighted- | Weighted- | Average | Weighted- | Weighted- | |||||||||||||||||||||||||||||||||||
| Remaining | Average | Average | Remaining | Average | Average | |||||||||||||||||||||||||||||||||||
| Contractual | Exercise | Exercise | Contractual | Exercise | Exercise | |||||||||||||||||||||||||||||||||||
| Range of Exercise Prices | Shares | Life (Years) | Price | Shares | Price | Shares | Life (Years) | Price | Shares | Price | ||||||||||||||||||||||||||||||
| $.83 — $10.00 | 2,893,745 | 1.4 | $ | 5.90 | 2,890,211 | $ | 5.90 | |||||||||||||||||||||||||||||||||
| $3.28 — $10.00 | 726,431 | 1.0 | $ | 7.06 | 724,664 | $ | 7.05 | |||||||||||||||||||||||||||||||||
| $10.01 — $15.00 | 4,120,299 | 3.8 | 11.72 | 3,561,885 | 11.55 | 3,072,352 | 2.7 | 11.51 | 2,835,094 | 11.39 | ||||||||||||||||||||||||||||||
| $15.01 — $20.00 | 34,269,234 | 7.1 | 18.79 | 20,441,742 | 18.58 | 26,115,430 | 6.1 | 18.81 | 19,671,582 | 18.71 | ||||||||||||||||||||||||||||||
| $20.01 — $25.00 | 78,525,163 | 7.1 | 22.43 | 45,944,620 | 22.70 | 63,059,643 | 6.1 | 22.39 | 45,466,324 | 22.54 | ||||||||||||||||||||||||||||||
| $25.01 — $30.00 | 40,092,423 | 5.0 | 28.43 | 37,967,373 | 28.49 | 37,433,500 | 5.1 | 28.55 | 28,066,483 | 28.66 | ||||||||||||||||||||||||||||||
| $30.01 — $35.00 | 5,138,138 | 3.4 | 32.65 | 5,138,138 | 32.65 | 4,020,322 | 2.4 | 32.73 | 3,963,401 | 32.75 | ||||||||||||||||||||||||||||||
| $35.01 — $36.95 | 483,352 | 3.0 | 35.81 | 483,352 | 35.81 | 299,607 | 2.4 | 35.89 | 299,607 | 35.89 | ||||||||||||||||||||||||||||||
| 165,522,354 | 6.3 | $ | 22.93 | 116,427,321 | $ | 23.60 | 134,727,285 | 5.6 | $ | 23.41 | 101,027,155 | $ | 23.51 | |||||||||||||||||||||||||||
The following table provides a summary of the valuation assumptions utilized by the Company to determine the estimated value of stock option grants:
| Weighted-average assumptions in stock option valuation | 2003 | 2002 | 2001 | 2004 | 2003 | 2002 | ||||||||||||||||||
| Risk-free interest rates | 2.8 | % | 3.3 | % | 4.6 | % | 3.5 | % | 2.8 | % | 3.3 | % | ||||||||||||
| Dividend yields | 3.0 | % | 3.0 | % | 3.0 | % | 3.5 | % | 3.0 | % | 3.0 | % | ||||||||||||
| Stock volatility factor | .40 | .41 | .42 | .40 | .40 | .41 | ||||||||||||||||||
| Expected life of options (in years) | 5.3 | 6.0 | 4.5 | 5.9 | 5.3 | 6.0 | ||||||||||||||||||
| Note | Income Taxes |
The components of income tax expense were:
| (Dollars in Millions) | (Dollars in Millions) | 2003 | 2002 | 2001 | (Dollars in Millions) | 2004 | 2003 | 2002 | ||||||||||||||||||
Federal | Federal | Federal | ||||||||||||||||||||||||
| Current | Current | $ | 1,528.8 | $ | 1,268.9 | $ | 982.2 | Current | $ | 1,530.9 | $ | 1,528.8 | $ | 1,268.9 | ||||||||||||
| Deferred | Deferred | 222.9 | 256.9 | (275.9 | ) | Deferred | 260.2 | 222.9 | 256.9 | |||||||||||||||||
| Federal income tax | 1,751.7 | 1,525.8 | 706.3 | |||||||||||||||||||||||
| Federal income tax | 1,791.1 | 1,751.7 | 1,525.8 | |||||||||||||||||||||||
State | State | State | ||||||||||||||||||||||||
| Current | Current | 139.8 | 146.9 | 132.2 | Current | 197.4 | 139.8 | 146.9 | ||||||||||||||||||
| Deferred | Deferred | 49.8 | 34.8 | (20.2 | ) | Deferred | 21.1 | 49.8 | 34.8 | |||||||||||||||||
| State income tax | 189.6 | 181.7 | 112.0 | State income tax | 218.5 | 189.6 | 181.7 | |||||||||||||||||||
| Total income tax provision | $ | 1,941.3 | $ | 1,707.5 | $ | 818.3 | Total income tax provision | $ | 2,009.6 | $ | 1,941.3 | $ | 1,707.5 | |||||||||||||
A reconciliation of expected income tax expense at the federal statutory rate of 35% to the Company’s applicable income tax expense follows:
| (Dollars in Millions) | (Dollars in Millions) | 2003 | 2002 | 2001 | (Dollars in Millions) | 2004 | 2003 | 2002 | ||||||||||||||||||
| Tax at statutory rate (35%) | Tax at statutory rate (35%) | $ | 1,978.0 | $ | 1,727.4 | $ | 819.8 | Tax at statutory rate (35%) | $ | 2,161.7 | $ | 1,978.0 | $ | 1,727.4 | ||||||||||||
| State income tax, at statutory rates, net of federal tax benefit | State income tax, at statutory rates, net of federal tax benefit | 123.2 | 116.5 | 68.9 | State income tax, at statutory rates, net of federal tax benefit | 142.0 | 123.2 | 116.5 | ||||||||||||||||||
| Tax effect of | Tax effect of | Tax effect of | ||||||||||||||||||||||||
| Tax-exempt interest, net | (21.7 | ) | (24.9 | ) | (37.4 | ) | Tax credits | (145.6 | ) | (109.6 | ) | (85.5 | ) | |||||||||||||
| Amortization of nondeductible goodwill | — | — | 83.0 | Resolution of federal and state income tax examinations | (106.3 | ) | — | — | ||||||||||||||||||
| Tax credits | (109.6 | ) | (85.5 | ) | (69.4 | ) | Tax-exempt interest, net | (21.4 | ) | (21.7 | ) | (24.9 | ) | |||||||||||||
| Nondeductible merger charges | — | 5.0 | 52.5 | Other items | (20.8 | ) | (28.6 | ) | (26.0 | ) | ||||||||||||||||
| Other items | (28.6 | ) | (31.0 | ) | (99.1 | ) | ||||||||||||||||||||
| Applicable income taxes | Applicable income taxes | $ | 1,941.3 | $ | 1,707.5 | $ | 818.3 | Applicable income taxes | $ | 2,009.6 | $ | 1,941.3 | $ | 1,707.5 | ||||||||||||
The tax effects of fair value adjustments on securities available-for-sale, derivative instruments in cash flow hedges and certain tax benefits related to stock options are recorded directly to shareholders’ equity as part of other comprehensive income.
The significant components of the Company’s net deferred tax liability as of December 31 were:
| (Dollars in Millions) | (Dollars in Millions) | 2003 | 2002 | (Dollars in Millions) | 2004 | 2003 | ||||||||||||
Deferred tax assets | Deferred tax assets | Deferred tax assets | ||||||||||||||||
| Allowance for credit losses | Allowance for credit losses | $ | 977.6 | $ | 961.0 | Allowance for credit losses | $ | 924.4 | $ | 977.6 | ||||||||
| Stock compensation | Stock compensation | 318.2 | 334.7 | Stock compensation | 303.3 | 318.2 | ||||||||||||
| Accrued expenses | Accrued expenses | 148.9 | 140.1 | |||||||||||||||
| Intangible asset basis | Intangible asset basis | 146.1 | 133.1 | |||||||||||||||
| Federal AMT credits and capital losses | Federal AMT credits and capital losses | 59.1 | 48.6 | Federal AMT credits and capital losses | 59.1 | 59.1 | ||||||||||||
| Pension and postretirement benefits | 58.8 | 62.8 | ||||||||||||||||
| Deferred fees | 29.9 | (70.6 | ) | |||||||||||||||
| State and federal operating loss carryforwards | 21.2 | 34.9 | ||||||||||||||||
| Real estate and other asset basis differences | 7.0 | 39.1 | ||||||||||||||||
| Accrued severance, pension and retirement benefits | Accrued severance, pension and retirement benefits | 16.3 | 69.3 | |||||||||||||||
| Securities available-for-sale and financial instruments | Securities available-for-sale and financial instruments | 13.1 | (31.2 | ) | ||||||||||||||
| Federal and state net operating loss carryforwards | Federal and state net operating loss carryforwards | 9.2 | 21.2 | |||||||||||||||
| Other deferred tax assets, net | Other deferred tax assets, net | 209.2 | 487.4 | Other deferred tax assets, net | 84.5 | 62.0 | ||||||||||||
| Gross deferred tax assets | 1,681.0 | 1,897.9 | Gross deferred tax assets | 1,704.9 | 1,749.4 | |||||||||||||
Deferred tax liabilities | Deferred tax liabilities | Deferred tax liabilities | ||||||||||||||||
| Leasing activities | Leasing activities | (2,509.6 | ) | (2,292.2 | ) | Leasing activities | (2,770.7 | ) | (2,509.6 | ) | ||||||||
| Accrued severance, pension and retirement benefits | (297.5 | ) | (65.0 | ) | ||||||||||||||
| Pension and postretirement benefits | Pension and postretirement benefits | (272.2 | ) | (308.0 | ) | |||||||||||||
| Mortgage servicing rights | Mortgage servicing rights | (93.8 | ) | (60.0 | ) | |||||||||||||
| Other investment basis differences | Other investment basis differences | (80.4 | ) | (60.2 | ) | |||||||||||||
| Deferred fees | Deferred fees | (77.8 | ) | 29.9 | ||||||||||||||
| Loans | Loans | (59.0 | ) | (59.0 | ) | |||||||||||||
| Accelerated depreciation | Accelerated depreciation | (142.3 | ) | (104.4 | ) | Accelerated depreciation | (55.7 | ) | (142.3 | ) | ||||||||
| Securities available-for-sale and financial instruments | (31.2 | ) | (478.8 | ) | ||||||||||||||
| Other investment basis differences | (19.5 | ) | (37.2 | ) | ||||||||||||||
| Other deferred tax liabilities, net | Other deferred tax liabilities, net | (236.3 | ) | (248.7 | ) | Other deferred tax liabilities, net | (193.2 | ) | (195.6 | ) | ||||||||
| Gross deferred tax liabilities | (3,236.4 | ) | (3,226.3 | ) | Gross deferred tax liabilities | (3,602.8 | ) | (3,304.8 | ) | |||||||||
| Valuation allowance | Valuation allowance | (1.0 | ) | (1.0 | ) | Valuation allowance | (1.0 | ) | (1.0 | ) | ||||||||
Net deferred tax liability | Net deferred tax liability | $ | (1,556.4 | ) | $ | (1,329.4 | ) | Net deferred tax liability | $ | (1,898.9 | ) | $ | (1,556.4 | ) | ||||
The Company has established a valuation allowance to offset deferred tax assets related to state net operating loss carryforwards which are expected to expire unused. The Company has approximately $252$134 million of state net operating loss carryforwards which expire at various times through 2022.2009.
| Note | Derivative Instruments |
In the ordinary course of business, the Company enters into derivative transactions to manage its interest rate, prepayment and prepayment riskforeign currency risks and to accommodate the business requirements of its customers. The Company does not enter into derivative transactions for speculative purposes. Refer to Note 1 “Significant Accounting Policies” in the Notes to Consolidated Financial Statements for a discussion of the Company’s accounting policies for derivative instruments. For information related to derivative positions held for asset and liability management purposes and customer-related derivative positions, see Table 17 “Derivative Positions,” included in Management’s Discussion and Analysis, which is incorporated by reference intoin these Notes to Consolidated Financial Statements.
ASSET AND LIABILITY MANAGEMENT POSITIONS
Cash Flow HedgesThe Company had $21.2has $24.3 billion of designated cash flow hedges at December 31, 2003.2004. These
Fair Value HedgesThe Company has $8.6$7.8 billion of designated fair value hedges at December 31, 2003.2004. These derivatives are primarily interest rate contracts that hedge the change in fair value related to interest rate changes of underlying fixed-rate debt and trust preferred securities, and deposit obligations.securities. In addition, the Company uses forward commitments to sell residential mortgage loans to hedge its interest rate risk related to residential mortgage loans held for sale. The Company commits to sell the loans at specified prices in a future period, typically within 90 days. The Company is exposed to interest rate risk during the period between issuing a loan commitment and the sale of the loan into the secondary market.
Net Investment HedgesIn 2004, the Company entered into derivatives to protect its net investment in certain foreign operations. The Company uses forward commitments to sell specified amounts of certain foreign currencies to hedge its capital volatility risk associated with fluctuations in foreign currency exchange rates. The net amount of gains or losses included in the cumulative translation adjustment for 2004 was not significant.
Other Asset and Liability Management Derivative PositionsThe Company has derivative positions that are used for interest rate risk and other risk management purposes but are not designated as cash flow hedges or fair value hedges in accordance with the provisions of Statement of Financial Accounting Standards No. 133, “Accounting for Derivative Instruments and HedgeHedging Activities.” At December 31, 2003,2004, the Company had $1.0$1.1 billion of forward commitments to sell residential mortgage loans to hedge the Company’s interest rate risk related to $1.0 billion of unfunded residential loan commitments. Gains and losses on mortgage banking derivatives and the unfunded loan commitments are included in mortgage banking revenue on the income statement.Consolidated Statement of Income.
CUSTOMER-RELATED POSITIONS
The Company acts as a seller and buyer of interest rate contracts and foreign exchange rate contracts on behalf of customers. At December 31, 2003,2004, the Company had $16.6$20.0 billion of aggregate customer derivative positions, including $12.6$15.8 billion of interest rate swaps, caps, and floors and $4.0$4.2 billion of foreign exchange rate contracts. The Company minimizes its market and liquidity risks by taking similar offsetting positions. Gains or losses on customer-related transactions were not significant for the year ended December 31, 2003.2004.
| Note | Fair Values of Financial Instruments |
Due to the nature of its business and its customers’ needs, the Company offers a large number of financial instruments, most of which are not actively traded. When market quotes are unavailable, valuation techniques including discounted cash flow calculations and pricing models or services are used. The Company also uses various aggregation methods and assumptions, such as the discount rate and cash flow timing and amounts. As a result, the fair value estimates can neither be substantiated by independent market comparisons, nor realized by the immediate sale or settlement of the financial instrument. Also, the estimates reflect a point in time and could change significantly based on changes in economic factors, such as interest rates. Furthermore, the disclosure of certain financial and nonfinancial assets and liabilities are not required. Finally, the fair value disclosure is not intended to estimate a market value of the Company as a whole. A summary of the Company’s valuation techniques and assumptions follows.
Cash and Cash EquivalentsThe carrying value of cash, amounts due from banks, federal funds sold and securities purchased under resale agreements was assumed to approximate fair value.
SecuritiesInvestment securities were valued using available market quotes. In some instances, for securities that are not widely traded, market quotes for comparable securities were used.
LoansThe loan portfolio consists of both floatingincludes adjustable and fixed-rate loans, the fair value of which was estimated using discounted cash flow analyses and other valuation techniques. To calculate discounted cash flows, the loans were aggregated into pools of similar types and expected repayment terms. The expected cash flows of loans considered historical prepayment experiences and estimated credit losses for nonperforming loans and were discounted using current rates offered to borrowers of similar credit characteristics. The fair value of floating-rate loans are assumed to be equal to their carrying value.
Deposit LiabilitiesThe fair value of demand deposits, savings accounts and certain money market deposits is equal to the amount payable on demand at year-end. The fair value of fixed-rate certificates of deposit was estimated
Short-term BorrowingsFederal funds purchased, securities sold under agreements to repurchase, commercial paper and other short-term funds borrowed are at floating rates or have short-term maturities. Their carrying value is assumed to approximate their fair value.
Long-term Debt and Company-obligated Mandatorily Redeemable Preferred Securities of Subsidiary Trusts Holding Solely the Junior Subordinated Debentures of the Parent CompanyThe estimated fair value of medium-term notes, bank notes, Federal Home Loan Bank Advances,advances, capital lease obligations and mortgage note obligations was determined using a discounted cash flow analysis based on current market rates of similar maturity debt securities to discount cash flows. Other long-term debt instruments and company-obligated mandatorily redeemable preferred securities of subsidiary trusts holding solely the junior subordinated debentures of the parent company were valued using available market quotes.
Interest Rate Swaps, Equity Contracts, Basis Swaps and OptionsThe interest rate options and swap cash flows were estimated using a third-party pricing model and discounted based on appropriate LIBOR, eurodollar futures, swap, and treasury note yield curves.curves and equity market prices.
Loan Commitments, Letters of Credit and GuaranteesThe fair value of commitments, letters of credit and guarantees represents the estimated costs to terminate or otherwise settle the obligations with a third-party. Residential mortgage commitments are actively traded and the fair value is estimated using available market quotes. Other loan commitments, letters of credit and guarantees are not actively traded. Substantially all loan commitments have floating rates and do not expose the Company to interest rate risk assuming no premium or discount was ascribed to loan commitments because funding could occur at market rates. The Company estimates the fair value of loan commitments, letters of credit and guarantees based on the related amount of unamortized deferred commitment fees adjusted for the probable losses for these arrangements.
The estimated fair values of the Company’s financial instruments at December 31 are shown in the following table:table below.
| 2003 | 2002 | 2004 | 2003 | |||||||||||||||||||||||||||||||||||||
| Carrying | Fair | Carrying | Fair | Carrying | Fair | Carrying | Fair | |||||||||||||||||||||||||||||||||
| December 31 (Dollars in Millions) | Amount | Value | Amount | Value | ||||||||||||||||||||||||||||||||||||
| (Dollars in Millions) | (Dollars in Millions) | Amount | Value | Amount | Value | |||||||||||||||||||||||||||||||||||
Financial Assets | Financial Assets | Financial Assets | ||||||||||||||||||||||||||||||||||||||
| Cash and cash equivalents | $ | 8,782 | $ | 8,782 | $ | 11,192 | $ | 11,192 | Cash and cash equivalents | $ | 6,537 | $ | 6,537 | $ | 8,782 | $ | 8,782 | |||||||||||||||||||||||
| Investment securities | 43,334 | 43,343 | 28,488 | 28,495 | Investment securities | 41,481 | 41,486 | 43,334 | 43,343 | |||||||||||||||||||||||||||||||
| Loans held for sale | 1,433 | 1,433 | 4,159 | 4,159 | Loans held for sale | 1,439 | 1,439 | 1,433 | 1,433 | |||||||||||||||||||||||||||||||
| Loans | 115,866 | 116,874 | 113,829 | 115,341 | Loans | 124,235 | 124,611 | 116,051 | 117,058 | |||||||||||||||||||||||||||||||
| Total financial assets | 169,415 | $ | 170,432 | 157,668 | $ | 159,187 | Total financial assets | 173,692 | $ | 174,073 | 169,600 | $ | 170,616 | |||||||||||||||||||||||||||
| Nonfinancial assets | 19,871 | 22,359 | Nonfinancial assets | 21,412 | 19,871 | |||||||||||||||||||||||||||||||||||
| Total assets | $ | 189,286 | $ | 180,027 | Total assets | $ | 195,104 | $ | 189,471 | |||||||||||||||||||||||||||||||
Financial Liabilities | Financial Liabilities | Financial Liabilities | ||||||||||||||||||||||||||||||||||||||
| Deposits | $ | 119,052 | $ | 119,120 | $ | 115,534 | $ | 116,039 | Deposits | $ | 120,741 | $ | 120,788 | $ | 119,052 | $ | 119,120 | |||||||||||||||||||||||
| Short-term borrowings | 10,850 | 10,850 | 7,806 | 7,806 | Short-term borrowings | 13,084 | 13,084 | 10,850 | 10,850 | |||||||||||||||||||||||||||||||
| Long-term debt | 31,215 | 31,725 | 28,588 | 29,161 | Long-term debt | 34,739 | 35,160 | 33,816 | 34,425 | |||||||||||||||||||||||||||||||
| Company-obligated mandatorily redeemable preferred securities of subsidiary trusts holding solely the junior subordinated debentures of the parent company | 2,601 | 2,700 | 2,994 | 3,055 | ||||||||||||||||||||||||||||||||||||
| Total financial liabilities | 168,564 | $ | 169,032 | 163,718 | $ | 164,395 | ||||||||||||||||||||||||||||||||||
| Total financial liabilities | 163,718 | $ | 164,395 | 154,922 | $ | 156,061 | ||||||||||||||||||||||||||||||||||
| Nonfinancial liabilities | 7,001 | 6,511 | ||||||||||||||||||||||||||||||||||||||
| Nonfinancial liabilities | 6,326 | 6,669 | Shareholders’ equity | 19,539 | 19,242 | |||||||||||||||||||||||||||||||||||
| Shareholders’ equity | 19,242 | 18,436 | ||||||||||||||||||||||||||||||||||||||
| Total liabilities and shareholders’ equity | $ | 195,104 | $ | 189,471 | ||||||||||||||||||||||||||||||||||||
| Total liabilities and shareholders’ equity | $ | 189,286 | $ | 180,027 | ||||||||||||||||||||||||||||||||||||
Derivative Positions | Derivative Positions | Derivative Positions | ||||||||||||||||||||||||||||||||||||||
| Asset and liability management positions | Asset and liability management positions | |||||||||||||||||||||||||||||||||||||||
| Interest rate swaps | $ | 631 | $ | 631 | $ | 1,438 | $ | 1,438 | Interest rate swaps | $ | 435 | $ | 435 | $ | 631 | $ | 631 | |||||||||||||||||||||||
| Forward commitments to sell residential mortgages | — | — | (80 | ) | (80 | ) | Forward commitments to sell residential mortgages | (4 | ) | (4 | ) | — | — | |||||||||||||||||||||||||||
| Customer-related positions | Foreign exchange forward contracts | (12 | ) | (12 | ) | — | — | |||||||||||||||||||||||||||||||||
| Interest rate contracts | 31 | 31 | 22 | 22 | Equity contracts | 4 | 4 | — | — | |||||||||||||||||||||||||||||||
| Foreign exchange contracts | 2 | 2 | 1 | 1 | Customer related positions | |||||||||||||||||||||||||||||||||||
| Interest rate contracts | 36 | 36 | 31 | 31 | ||||||||||||||||||||||||||||||||||||
| Foreign exchange contracts | 4 | 4 | 2 | 2 | ||||||||||||||||||||||||||||||||||||
| Note | Guarantees and Contingent Liabilities |
COMMITMENTS TO EXTEND CREDIT
Commitments to extend credit are legally binding and generally have fixed expiration dates or other termination clauses. The contractual amount represents the Company’s exposure to credit loss, in the event of default by the borrower. The Company manages this credit risk by using the same credit policies it applies to loans. Collateral is obtained to secure commitments based on management’s credit assessment of the borrower. The collateral may include marketable securities, receivables, inventory, equipment and real estate. Since the Company expects many of the commitments to expire without being drawn, total commitment amounts do not necessarily represent the Company’s future liquidity requirements. In addition, the commitments include consumer credit lines that are cancelable upon notification to the consumer.
LETTERS OF CREDIT
Standby letters of credit are conditional commitments the Company issues to guarantee the performance of a customer to a third-party. The guarantees frequently support public and private borrowing arrangements, including commercial paper issuances, bond financings and other similar transactions. The Company issues commercial letters of credit on behalf of customers to ensure payment or collection in connection with trade transactions. In the event of a customer’s nonperformance, the Company’s credit loss exposure is the same as in any extension of credit, up to the letter’s contractual amount. Management assesses the borrower’s credit to determine the necessary collateral, which may include marketable securities, receivables, inventory, equipment and real estate, accounts receivable and inventory.estate. Since the conditions requiring the Company to fund letters of credit may not occur, the Company expects its liquidity requirements to be less than the total outstanding commitments. The maximum potential future payments guaranteed by the Company under standby letter of credit arrangements at December 31, 2003,2004, were approximately $9.7$10.6 billion with a weighted averageweighted-average term of approximately 2422 months. The estimated fair value of standby letters of credit was approximately $84.6$75.5 million at December 31, 2003.2004.
| Less Than | After | Less Than | After | |||||||||||||||||||||||
| (Dollars in Millions) | (Dollars in Millions) | One Year | One Year | Total | (Dollars in Millions) | One Year (a) | One Year | Total | ||||||||||||||||||
| Commitments to extend credit | ||||||||||||||||||||||||||
| Commercial | $ | 17,240 | $ | 30,902 | $ | 48,142 | Commercial | $ | 23,453 | $ | 33,771 | $ | 57,224 | |||||||||||||
| Corporate and purchasing cards | 12,525 | — | 12,525 | Corporate and purchasing cards | 12,941 | 25 | 12,966 | |||||||||||||||||||
| Consumer credit cards | 22,349 | — | 22,349 | Consumer credit cards | 28,074 | — | 28,074 | |||||||||||||||||||
| Other consumer | 1,900 | 9,690 | 11,590 | Other consumer | 2,100 | 11,355 | 13,455 | |||||||||||||||||||
| Letters of credit | Letters of credit | Letters of credit | ||||||||||||||||||||||||
| Standby | 4,667 | 5,073 | �� | 9,740 | Standby | 5,083 | 5,515 | 10,598 | ||||||||||||||||||
| Commercial | 370 | 40 | 410 | Commercial | 327 | 36 | 363 | |||||||||||||||||||
| (a) | Discretionary facilities are included in less than one year. |
LEASE COMMITMENTS
Rental expense for operating leases amounted to $151.4$184.6 million in 2004, $205.0 million in 2003 $148.0and $201.5 million in 2002 and $165.2 million in 2001.2002. Future minimum payments, net of sublease rentals, under capitalized leases and noncancelable operating leases with initial or remaining terms of one year or more, consisted of the following at December 31, 2003:2004:
| Capitalized | Operating | Capitalized | Operating | |||||||||||||
| (Dollars in Millions) | Leases | Leases | Leases | Leases | ||||||||||||
| 2004 | $ | 8.9 | $ | 181.9 | ||||||||||||
| 2005 | 7.9 | 161.7 | $ | 7.9 | $ | 197.9 | ||||||||||
| 2006 | 7.0 | 146.2 | 7.4 | 183.7 | ||||||||||||
| 2007 | 6.6 | 131.3 | 6.6 | 167.6 | ||||||||||||
| 2008 | 6.2 | 110.9 | 6.2 | 146.6 | ||||||||||||
| 2009 | 6.1 | 125.8 | ||||||||||||||
| Thereafter | 38.7 | 516.1 | 32.4 | 596.0 | ||||||||||||
| Total minimum lease payments | 75.3 | $ | 1,248.1 | 66.6 | $ | 1,417.6 | ||||||||||
| Less amount representing interest | 28.5 | 24.6 | ||||||||||||||
| Present value of net minimum lease payments | $ | 46.8 | $ | 42.0 | ||||||||||||
GUARANTEES
Guarantees are contingent commitments issued by the Company to customers or other third-parties. The Company’s guarantees primarily include parent guarantees related to subsidiaries’ third-party borrowing arrangements; third-party performance guarantees inherent in the Company’s business operations such as indemnified securities lending programs and merchant charge-back guarantees; indemnification or buy-back provisions related to certain asset sales; and contingent consideration arrangements related to acquisitions. For certain guarantees, the Company has recorded a liability related to the potential obligation, or has access to collateral to support
Third-Party Borrowing ArrangementsThe Company provides guarantees to third-parties as a part of certain
Commitments from Securities LendingThe Company participates in securities lending activities by acting as the customer’s agent involving the loan or salelending of securities. The Company indemnifies customers for the difference between the market value of the securities lent and the market value of the collateral received. Cash collateralizes these transactions. The maximum potential future payments guaranteed by the Company under these arrangements waswere approximately $13.2$11.4 billion at December 31, 2003,2004, and represented the market value of the securities lent to third-parties. At December 31, 2003,2004, the Company held assets with a market value of $13.6$11.7 billion as collateral for these arrangements.
Asset SalesThe Company has provided guarantees to certain third-parties in connection with the sale of certain assets, primarily loan portfolios and low-income housing tax credits. These guarantees are generally in the form of asset buy-back or make-whole provisions that are triggered upon a credit event or a change in the tax-qualifying status of the related projects, as applicable, and remain in effect until the loans are collected or final tax credits are realized, respectively. The maximum potential future payments guaranteed by the Company under these arrangements were approximately $784.9$487.5 million at December 31, 2003,2004, and represented the total proceeds received from the buyer in these transactions where the buy-back or make-whole provisions have not yet expired. Recourse available to the Company includes guarantees from the Small Business Administration (for SBA loans sold), recourse against the correspondent that originated the loan or to the private mortgage issuer, the right to collect payments from the debtors, and/or the right to liquidate the underlying collateral, if any, and retain the proceeds. Based on its established loan-to-value guidelines, the Company believes the recourse available is sufficient to recover future payments, if any, under the loan buy-back guarantees.
Merchant ProcessingThe Company, through its subsidiarysubsidiaries NOVA Information Systems, Inc., and NOVA European Holdings Company, provides merchant processing services. Under the rules of credit card associations, a merchant processor retains a contingent liability for credit card transactions processed. This contingent liability arises in the event of a billing dispute between the merchant and a cardholder that is ultimately resolved in the cardholder’s favor. In this situation, the transaction is “charged back” to the merchant and the disputed amount is credited or otherwise refunded to the cardholder. If the Company is unable to collect this amount from the merchant, it bears the loss for the amount of the refund paid to the cardholder.
Contingent Consideration ArrangementsThe Company has contingent payment obligations related to certain business combination transactions. Payments are guaranteed as long as certain post-acquisition performance-based criteria are met or customer relationships are maintained. At December 31, 2003, the maximum potential future payments required to be made by In addition, the Company under these arrangements was approximately $75.5had a $53.8 million and primarily represented contingent payments related to the acquisition of the State Street Corporate Trust business on December 31, 2002. If required, these contingent payments would be payable within the next six months.liability for obligations associated with its airline processing business.
Other GuaranteesThe Company provides liquidity and credit enhancement facilities to a Company-sponsored conduit, as more fully described in the “Off-Balance Sheet Arrangements” section within Management’s Discussion and Analysis.Note 10. Although management believes a draw against these facilities is remote, the maximum potential future payments guaranteed by the Company under these arrangements waswere approximately $7.3$5.7 billion at December 31, 2003.2004. The recorded fair value of the Company’s liability for the credit enhancement recourse obligation and liquidity facilitiesfacility was $47.3$32.4 million at December 31, 2003,2004, and was included in other liabilities.
OTHER CONTINGENT LIABILITIES
In connection with the spin-off of Piper Jaffray Companies, the Company has agreed to indemnify Piper Jaffray Companies against losses that may result from third-party claims relating to certain specified matters. The Company’s indemnification obligation related to these specified matters is capped at $17.5 million and can be terminated by the Company if there is a change in control event for Piper Jaffray Companies. Through December 31, 2004, the Company has paid approximately $3.3 million to Piper Jaffray Companies under this agreement.
| Note | U.S. Bancorp (Parent Company) |
Condensed Balance Sheet
| December 31 (Dollars in Millions) | December 31 (Dollars in Millions) | 2003 | 2002 | December 31 (Dollars in Millions) | 2004 | 2003 | |||||||||||||
Assets | Assets | Assets | |||||||||||||||||
| Deposits with subsidiary banks, principally interest-bearing | Deposits with subsidiary banks, principally interest-bearing | $ | 4,726 | $ | 5,869 | Deposits with subsidiary banks, principally interest-bearing | $ | 6,806 | $ | 4,726 | |||||||||
| Available-for-sale securities | Available-for-sale securities | 127 | 118 | Available-for-sale securities | 126 | 127 | |||||||||||||
| Investments in | |||||||||||||||||||
| Bank and bank holding company subsidiaries | 22,628 | 17,479 | |||||||||||||||||
| Nonbank subsidiaries (a) | 605 | 1,501 | |||||||||||||||||
| Advances to | |||||||||||||||||||
| Bank and bank holding company subsidiaries | — | 575 | |||||||||||||||||
| Nonbank subsidiaries (a) | 16 | 363 | |||||||||||||||||
| Investments in bank and bank holding company subsidiaries | Investments in bank and bank holding company subsidiaries | 20,082 | 22,628 | ||||||||||||||||
| Investments in nonbank subsidiaries | Investments in nonbank subsidiaries | 371 | 605 | ||||||||||||||||
| Advances to nonbank subsidiaries | Advances to nonbank subsidiaries | 5 | 16 | ||||||||||||||||
| Other assets | Other assets | 676 | 2,663 | Other assets | 690 | 676 | |||||||||||||
| Total assets | $ | 28,778 | $ | 28,568 | Total assets | $ | 28,080 | $ | 28,778 | ||||||||||
Liabilities and Shareholders’ Equity | Liabilities and Shareholders’ Equity | Liabilities and Shareholders’ Equity | |||||||||||||||||
| Short-term funds borrowed | Short-term funds borrowed | $ | 699 | $ | 380 | Short-term funds borrowed | $ | 683 | $ | 699 | |||||||||
| Advances from subsidiaries | — | 117 | |||||||||||||||||
| Long-term debt | Long-term debt | 5,200 | 5,695 | Long-term debt | 6,899 | 7,880 | |||||||||||||
| Junior subordinated debentures issued to subsidiary trusts | 2,629 | 2,990 | |||||||||||||||||
| Other liabilities | Other liabilities | 1,008 | 950 | Other liabilities | 959 | 957 | |||||||||||||
| Shareholders’ equity | Shareholders’ equity | 19,242 | 18,436 | Shareholders’ equity | 19,539 | 19,242 | |||||||||||||
| Total liabilities and shareholders’ equity | $ | 28,778 | $ | 28,568 | Total liabilities and shareholders’ equity | $ | 28,080 | $ | 28,778 | ||||||||||
Condensed Statement of Income
| Year Ended December 31 (Dollars in Millions) | Year Ended December 31 (Dollars in Millions) | 2003 | 2002 | 2001 | Year Ended December 31 (Dollars in Millions) | 2004 | 2003 | 2002 | ||||||||||||||||||
Income | Income | Income | ||||||||||||||||||||||||
| Dividends from bank and bank holding company subsidiaries | Dividends from bank and bank holding company subsidiaries | $ | 27.0 | $ | 3,140.0 | $ | 1,300.1 | Dividends from bank and bank holding company subsidiaries | $ | 4,900.0 | $ | 27.0 | $ | 3,140.0 | ||||||||||||
| Dividends from nonbank subsidiaries | Dividends from nonbank subsidiaries | 5.8 | 15.2 | 10.1 | Dividends from nonbank subsidiaries | 229.0 | 5.8 | 15.2 | ||||||||||||||||||
| Interest from subsidiaries | Interest from subsidiaries | 69.1 | 96.9 | 272.8 | Interest from subsidiaries | 54.1 | 69.1 | 96.9 | ||||||||||||||||||
| Service and management fees from subsidiaries | 24.2 | 38.5 | 221.8 | |||||||||||||||||||||||
| Other income | Other income | 37.9 | 16.0 | 21.0 | Other income | 20.9 | 62.1 | 54.5 | ||||||||||||||||||
| Total income | 164.0 | 3,306.6 | 1,825.8 | Total income | 5,204.0 | 164.0 | 3,306.6 | |||||||||||||||||||
Expense | Expense | Expense | ||||||||||||||||||||||||
| Interest on short-term funds borrowed | Interest on short-term funds borrowed | 8.0 | 8.9 | 18.5 | Interest on short-term funds borrowed | 7.5 | 8.0 | 8.9 | ||||||||||||||||||
| Interest on long-term debt | Interest on long-term debt | 78.2 | 126.8 | 318.5 | Interest on long-term debt | 256.4 | 270.8 | 340.9 | ||||||||||||||||||
| Interest on junior subordinated debentures issued to subsidiary trusts | 192.6 | 214.1 | 141.7 | |||||||||||||||||||||||
| Merger and restructuring-related charges | Merger and restructuring-related charges | 2.9 | 6.7 | 63.2 | Merger and restructuring-related charges | — | 2.9 | 6.7 | ||||||||||||||||||
| Other expense | Other expense | 86.5 | 76.0 | 335.1 | Other expense | 46.9 | 86.5 | 76.0 | ||||||||||||||||||
| Total expense | 368.2 | 432.5 | 877.0 | Total expense | 310.8 | 368.2 | 432.5 | |||||||||||||||||||
| Income (loss) before income taxes and equity in undistributed income of subsidiaries | Income (loss) before income taxes and equity in undistributed income of subsidiaries | (204.2 | ) | 2,874.1 | 948.8 | Income (loss) before income taxes and equity in undistributed income of subsidiaries | 4,893.2 | (204.2 | ) | 2,874.1 | ||||||||||||||||
| Income tax credit | Income tax credit | (37.1 | ) | (84.6 | ) | (112.0 | ) | Income tax credit | (52.9 | ) | (37.1 | ) | (84.6 | ) | ||||||||||||
| Income (loss) of parent company | Income (loss) of parent company | (167.1 | ) | 2,958.7 | 1,060.8 | Income (loss) of parent company | 4,946.1 | (167.1 | ) | 2,958.7 | ||||||||||||||||
| Equity in undistributed income of subsidiaries | 3,899.7 | 209.4 | 418.0 | |||||||||||||||||||||||
| Equity (deficiency) in undistributed income of subsidiaries | Equity (deficiency) in undistributed income of subsidiaries | (779.3 | ) | 3,899.7 | 209.4 | |||||||||||||||||||||
| Net income | $ | 3,732.6 | $ | 3,168.1 | $ | 1,478.8 | Net income | $ | 4,166.8 | $ | 3,732.6 | $ | 3,168.1 | |||||||||||||
| Year Ended December 31 (Dollars in Millions) | Year Ended December 31 (Dollars in Millions) | 2003 | 2002 | 2001 | Year Ended December 31 (Dollars in Millions) | 2004 | 2003 | 2002 | ||||||||||||||||||||
Operating Activities | Operating Activities | Operating Activities | ||||||||||||||||||||||||||
| Net income | Net income | $ | 3,732.6 | $ | 3,168.1 | $ | 1,478.8 | Net income | $ | 4,166.8 | $ | 3,732.6 | $ | 3,168.1 | ||||||||||||||
| Adjustments to reconcile net income to net cash provided by operating activities | Adjustments to reconcile net income to net cash provided by operating activities | Adjustments to reconcile net income to net cash provided by operating activities | ||||||||||||||||||||||||||
| Equity in undistributed income of subsidiaries | (3,899.7 | ) | (209.4 | ) | (418.0 | ) | ||||||||||||||||||||||
| Other, net | 172.2 | 43.8 | 88.4 | (Equity) deficiency in undistributed income of subsidiaries | 779.3 | (3,899.7 | ) | (209.4 | ) | |||||||||||||||||||
| Other, net | 43.6 | 172.2 | 43.8 | |||||||||||||||||||||||||
| Net cash provided by (used in) operating activities | 5.1 | 3,002.5 | 1,149.2 | |||||||||||||||||||||||||
| Net cash provided by (used in) operating activities | 4,989.7 | 5.1 | 3,002.5 | |||||||||||||||||||||||||
Investing Activities | Investing Activities | Investing Activities | ||||||||||||||||||||||||||
| Proceeds from sales and maturities of investment securities | Proceeds from sales and maturities of investment securities | 20.9 | 113.1 | 254.9 | Proceeds from sales and maturities of investment securities | 76.1 | 20.9 | 113.1 | ||||||||||||||||||||
| Purchases of investment securities | Purchases of investment securities | (73.0 | ) | (52.9 | ) | (73.5 | ) | Purchases of investment securities | (76.4 | ) | (73.0 | ) | (52.9 | ) | ||||||||||||||
| Investments in subsidiaries | Investments in subsidiaries | (283.9 | ) | (536.4 | ) | (1,941.0 | ) | Investments in subsidiaries | (.1 | ) | (283.9 | ) | (536.4 | ) | ||||||||||||||
| Equity distributions from subsidiaries | Equity distributions from subsidiaries | 536.5 | 1,200.0 | 600.0 | Equity distributions from subsidiaries | 1,915.9 | 536.5 | 1,200.0 | ||||||||||||||||||||
| Net (increase) decrease in short-term advances to subsidiaries | Net (increase) decrease in short-term advances to subsidiaries | 35.5 | 415.1 | 190.4 | Net (increase) decrease in short-term advances to subsidiaries | 10.8 | 35.5 | 415.1 | ||||||||||||||||||||
| Long-term advances to subsidiaries | Long-term advances to subsidiaries | — | (410.0 | ) | (1,144.0 | ) | Long-term advances to subsidiaries | — | — | (410.0 | ) | |||||||||||||||||
| Principal collected on long-term advances to subsidiaries | Principal collected on long-term advances to subsidiaries | 572.6 | 1,770.0 | 2,713.2 | Principal collected on long-term advances to subsidiaries | — | 572.6 | 1,770.0 | ||||||||||||||||||||
| Other, net | Other, net | 130.7 | 44.5 | 34.7 | Other, net | (11.5 | ) | 130.7 | 44.5 | |||||||||||||||||||
| Net cash provided by (used in) investing activities | 939.3 | 2,543.4 | 634.7 | Net cash provided by (used in) investing activities | 1,914.8 | 939.3 | 2,543.4 | |||||||||||||||||||||
Financing Activities | Financing Activities | Financing Activities | ||||||||||||||||||||||||||
| Net increase (decrease) in short-term advances from subsidiaries | Net increase (decrease) in short-term advances from subsidiaries | (117.2 | ) | 48.4 | (10.6 | ) | Net increase (decrease) in short-term advances from subsidiaries | — | (117.2 | ) | 48.4 | |||||||||||||||||
| Net increase (decrease) in short-term borrowings | Net increase (decrease) in short-term borrowings | 318.5 | (72.3 | ) | 228.9 | Net increase (decrease) in short-term borrowings | (15.8 | ) | 318.5 | (72.3 | ) | |||||||||||||||||
| Principal payments on long-term debt | (1,593.5 | ) | (2,537.5 | ) | (1,612.8 | ) | ||||||||||||||||||||||
| Principal payments or redemptions of long-term debt | Principal payments or redemptions of long-term debt | (909.0 | ) | (1,954.3 | ) | (2,537.5 | ) | |||||||||||||||||||||
| Proceeds from issuance of long-term debt | Proceeds from issuance of long-term debt | 1,150.0 | 2,075.0 | 1,100.0 | Proceeds from issuance of long-term debt | — | 1,150.0 | 2,075.0 | ||||||||||||||||||||
| Proceeds from issuance of junior subordinated debentures to subsidiary trusts | — | — | 1,546.4 | |||||||||||||||||||||||||
| Redemption of junior subordinated debentures from subsidiary trusts | (360.8 | ) | — | — | ||||||||||||||||||||||||
| Proceeds from issuance of common stock | Proceeds from issuance of common stock | 398.4 | 147.0 | 136.4 | Proceeds from issuance of common stock | 580.6 | 398.4 | 147.0 | ||||||||||||||||||||
| Repurchase of common stock | Repurchase of common stock | (326.3 | ) | (1,040.4 | ) | (467.9 | ) | Repurchase of common stock | (2,659.6 | ) | (326.3 | ) | (1,040.4 | ) | ||||||||||||||
| Cash dividends paid | Cash dividends paid | (1,556.8 | ) | (1,480.7 | ) | (1,235.1 | ) | Cash dividends paid | (1,820.5 | ) | (1,556.8 | ) | (1,480.7 | ) | ||||||||||||||
| Net cash provided by (used in) financing activities | (2,087.7 | ) | (2,860.5 | ) | (314.7 | ) | Net cash provided by (used in) financing activities | (4,824.3 | ) | (2,087.7 | ) | (2,860.5 | ) | |||||||||||||||
| Change in cash and cash equivalents | (1,143.3 | ) | 2,685.4 | 1,469.2 | Change in cash and cash equivalents | 2,080.2 | (1,143.3 | ) | 2,685.4 | |||||||||||||||||||
| Cash and cash equivalents at beginning of year | Cash and cash equivalents at beginning of year | 5,869.0 | 3,183.6 | 1,714.4 | Cash and cash equivalents at beginning of year | 4,725.7 | 5,869.0 | 3,183.6 | ||||||||||||||||||||
| Cash and cash equivalents at end of year | $ | 4,725.7 | $ | 5,869.0 | $ | 3,183.6 | Cash and cash equivalents at end of year | $ | 6,805.9 | $ | 4,725.7 | $ | 5,869.0 | |||||||||||||||
Transfer of funds (dividends, loans or advances) from bank subsidiaries to the Company is restricted. Federal law prohibits loans unless they are secured and generally limits any loan to the Company or individual affiliate to 10 percent of theeach bank’s equity.unimpaired capital and surplus. In aggregate, loans to the Company and all affiliates cannot exceed 20 percent of theeach bank’s equity.unimpaired capital and surplus.
Consolidated Statement of Cash Flows Listed below are supplemental disclosures to the Consolidated Statement of Cash Flows:
| Year Ended December 31 (Dollars in Millions) | 2003 | 2002 | 2001 | |||||||||||
| Income taxes paid | $ | 1,257.8 | $ | 1,129.5 | $ | 658.1 | ||||||||
| Interest paid | 2,077.0 | 2,890.1 | 5,092.2 | |||||||||||
| Net noncash transfers to foreclosed property | 110.0 | 89.5 | 59.9 | |||||||||||
| Acquisitions and divestitures | ||||||||||||||
| Assets acquired | $ | — | $ | 2,068.9 | $ | 1,150.8 | ||||||||
| Liabilities assumed | — | (3,821.9 | ) | (509.0 | ) | |||||||||
| Net | $ | — | $ | (1,753.0 | ) | $ | 641.8 | |||||||
Money Market InvestmentsMoney market investments are included with cash and due from banks as part of cash and cash equivalents. Money market investments consisted of the following at December 31:
| (Dollars in Millions) | 2003 | 2002 | |||||||
| Interest-bearing deposits | $ | 4 | $ | 102 | |||||
| Federal funds sold | 109 | 61 | |||||||
| Securities purchased under agreements to resell | 39 | 271 | |||||||
| Total money market investments | $ | 152 | $ | 434 | |||||
Regulatory CapitalThe measures used to assess capital include the capital ratios established by bank regulatory agencies, including the specific ratios for the “well capitalized” designation. For a description of the regulatory capital requirements and the actual ratios as of December 31, 2003 and 2002, for the Company and its bank subsidiaries, see Table 20 included in Management’s Discussion and Analysis which is incorporated by reference into these Notes to Consolidated Financial Statements.
Net Gains on the Sale of LoansIncluded in noninterest income, primarily in mortgage banking revenue, for the years ended December 31, 2003, 2002 and 2001, the Company had net gains on the sale of loans of $162.9 million, $243.4 million and $164.2 million, respectively.
To the Shareholders andThe Board of Directors and Shareholders of
U.S. Bancorp:
We have audited the accompanying consolidated balance sheetsheets of U.S. Bancorp as of December 31, 2004 and 2003, and the related consolidated statements of income, shareholders’ equity, and cash flows for each of the year then ended.two years in the period ended December 31, 2004. These financial statements are the responsibility of the Company’s management. Our responsibility is to express an opinion on these financial statements based on our audit.audits.
We conducted our auditaudits in accordance with auditingthe standards generally accepted inof the United States.Public Company Accounting Oversight Board (United States). Those standards require that we plan and perform the audit to obtain reasonable assurance about whether the financial statements are free of material misstatement. An audit includes examining, on a test basis, evidence supporting the amounts and disclosures in the financial statements. An audit also includes assessing the accounting principles used and significant estimates made by management, as well as evaluating the overall financial statement presentation. We believe that our audit providesaudits provide a reasonable basis for our opinion.
In our opinion, the financial statements referred to above present fairly, in all material respects, the consolidated financial position of U.S. Bancorp at December 31, 2004 and 2003, and the consolidated results of theirits operations and their cash flows for each of the year thentwo years in the period ended December 31, 2004, in conformity with accounting principlesU.S. generally accepted accounting principles.
We also have audited, in accordance with the United States.
As discussed in Note 2standards of the Notes to Consolidated Financial Statements,Public Company Accounting Oversight Board (United States), the effectiveness of U.S. Bancorp’s internal control over financial reporting as of December 31, 2004, based on criteria established in 2003Internal Control — Integrated Framework issued by the Company changed its methodCommittee of accounting for stock-based employee compensation.Sponsoring Organizations of the Treadway Commission and our report dated February 18, 2005 expressed an unqualified opinion thereon.
![]()
Minneapolis, Minnesota
To the Shareholders and Board of Directors of U.S. Bancorp:
In our opinion, the accompanying consolidated balance sheet as of December 31, 2002 and the related consolidated statements of income, shareholders’ equity and cash flows for each of the two years in the period ended December 31, 2002U.S. Bancorp and its subsidiaries present fairly, in all material respects, the financial position of U.S. Bancorp and its subsidiaries at December 31, 2002, and the results of their operations and their cash flows for each of the two years in the periodyear ended December 31, 2002, in conformity with accounting principles generally accepted in the United States of America. These financial statements are the responsibility of the Company’s management; ourmanagement. Our responsibility is to express an opinion on these financial statements based on our audits.audit. We conducted our auditsaudit of these statements in accordance with auditingthe standards generally accepted inof the United States of America, whichPublic Company Accounting Oversight Board (United States). Those standards require that we plan and perform the audit to obtain reasonable assurance about whether the financial statements are free of material misstatement. An audit includes examining, on a test basis, evidence supporting the amounts and disclosures in the financial statements, assessing the accounting principles used and significant estimates made by management, and evaluating the overall financial statement presentation. We believe that our audits provideaudit provides a reasonable basis for our opinion.
As discussed in Note 1213 of the Notes to Consolidated Financial Statements, in 2002 the Company adopted the provisions of Statement of Financial Accounting Standards No. 142, “Goodwill and Other Intangible Assets.”

Minneapolis, Minnesota
Responsibility for the financial statements and other information presented throughout the Annual Report on Form 10-K rests with the management of U.S. Bancorp
| % Change | ||||||||||||||||||||||||||
| December 31 (Dollars in Millions) | 2003 | 2002 | 2001 | 2000 | 1999 | 2003 v 2002 | ||||||||||||||||||||
Assets | ||||||||||||||||||||||||||
| Cash and due from banks | $ | 8,630 | $ | 10,758 | $ | 9,120 | $ | 8,475 | $ | 7,324 | (19.8 | )% | ||||||||||||||
| Held-to-maturity securities | 152 | 233 | 299 | 252 | 194 | (34.8 | ) | |||||||||||||||||||
| Available-for-sale securities | 43,182 | 28,255 | 26,309 | 17,390 | 17,255 | 52.8 | ||||||||||||||||||||
| Loans held for sale | 1,433 | 4,159 | 2,820 | 764 | 670 | (65.5 | ) | |||||||||||||||||||
| Loans | 118,235 | 116,251 | 114,405 | 122,365 | 113,229 | 1.7 | ||||||||||||||||||||
| Less allowance for credit losses | (2,369 | ) | (2,422 | ) | (2,457 | ) | (1,787 | ) | (1,710 | ) | (2.2 | ) | ||||||||||||||
| Net loans | 115,866 | 113,829 | 111,948 | 120,578 | 111,519 | 1.8 | ||||||||||||||||||||
| Other assets | 20,023 | 22,793 | 20,894 | 17,462 | 17,356 | (12.2 | ) | |||||||||||||||||||
| Total assets | $ | 189,286 | $ | 180,027 | $ | 171,390 | $ | 164,921 | $ | 154,318 | 5.1 | % | ||||||||||||||
Liabilities and Shareholders’ Equity | ||||||||||||||||||||||||||
| Deposits | ||||||||||||||||||||||||||
| Noninterest-bearing | $ | 32,470 | $ | 35,106 | $ | 31,212 | $ | 26,633 | $ | 26,350 | (7.5 | )% | ||||||||||||||
| Interest-bearing | 86,582 | 80,428 | 74,007 | 82,902 | 77,067 | 7.7 | ||||||||||||||||||||
| Total deposits | 119,052 | 115,534 | 105,219 | 109,535 | 103,417 | 3.0 | ||||||||||||||||||||
| Short-term borrowings | 10,850 | 7,806 | 14,670 | 11,833 | 10,558 | 39.0 | ||||||||||||||||||||
| Long-term debt | 31,215 | 28,588 | 25,716 | 21,876 | 21,027 | 9.2 | ||||||||||||||||||||
| Company-obligated mandatorily redeemable preferred securities | 2,601 | 2,994 | 2,826 | 1,400 | 1,400 | (13.1 | ) | |||||||||||||||||||
| Other liabilities | 6,326 | 6,669 | 6,214 | 4,944 | 3,865 | (5.1 | ) | |||||||||||||||||||
| Total liabilities | 170,044 | 161,591 | 154,645 | 149,588 | 140,267 | 5.2 | ||||||||||||||||||||
| Shareholders’ equity | 19,242 | 18,436 | 16,745 | 15,333 | 14,051 | 4.4 | ||||||||||||||||||||
| Total liabilities and shareholders’ equity | $ | 189,286 | $ | 180,027 | $ | 171,390 | $ | 164,921 | $ | 154,318 | 5.1 | % | ||||||||||||||
In meeting its responsibilities for the reliability of the financial statements, management is responsible for establishing and maintaining an adequate system of internal control over financial reporting as defined by Rules 13a-15(f) and 15d-15(f) under the Securities Exchange Act of 1934. The Company’s system of internal controls is designed to provide reasonable assurance regarding the reliability of financial reporting and the preparation of publicly filed financial statements in accordance with accounting principles generally accepted in the United States.
To test compliance, the Company carries out an extensive audit program. This program includes a review for compliance with written policies and procedures and a comprehensive review of the adequacy and effectiveness of the internal control system. Although control procedures are designed and tested, it must be recognized that there are limits inherent in all systems of internal control and, therefore, errors and irregularities may nevertheless occur. Also, estimates and judgments are required to assess and balance the relative cost and expected benefits of the controls. Projection of any evaluation of effectiveness to future periods are subject to the risk that controls may become inadequate because of changes in conditions, or that the degree of compliance with the policies or procedures may deteriorate.
The Board of Directors of the Company has an Audit Committee composed of directors who are independent of U.S. Bancorp. The committee meets periodically with management, the internal auditors and the independent accountants to consider audit results and to discuss internal accounting control, auditing and financial reporting matters.
Management assessed the effectiveness of the Company’s internal controls over financial reporting as of December 31, 2004. In making this assessment, management used the criteria set forth by the Committee of Sponsoring Organizations of the Treadway Commission in its Internal Control-Integrated Framework. Based on our assessment and those criteria, management believes that the Company designed and maintained effective internal control over financial reporting as of December 31, 2004.
The Company’s independent accountants, Ernst & Young LLP, have been engaged to render an independent professional opinion on the financial statements and issue an attestation report on management’s assessment of the Company’s system of internal control over financial reporting. Their opinion on the financial statements appearing on page 105 and their attestation on the system of internal controls over financial reporting appearing on page 107 are based on procedures conducted in accordance with auditing standards of the Public Company Accounting Oversight Board (United States).
The Board of Directors and Shareholders of U.S. Bancorp:
We have audited management’s assessment, included in the accompanying Report of Management, that U.S. Bancorp
| % Change | ||||||||||||||||||||||||||
| Year Ended December 31 (Dollars in Millions) | 2003 | 2002 | 2001 | 2000 | 1999 | 2003 v 2002 | ||||||||||||||||||||
Interest Income | ||||||||||||||||||||||||||
| Loans | $ | 7,272.0 | $ | 7,743.0 | $ | 9,413.7 | $ | 10,519.3 | $ | 9,078.0 | (6.1 | )% | ||||||||||||||
| Loans held for sale | 202.2 | 170.6 | 146.9 | 102.1 | 103.9 | 18.5 | ||||||||||||||||||||
| Investment securities | ||||||||||||||||||||||||||
| Taxable | 1,654.6 | 1,438.2 | 1,206.1 | 1,008.3 | 1,047.1 | 15.0 | ||||||||||||||||||||
| Non-taxable | 29.4 | 46.1 | 89.5 | 140.6 | 150.1 | (36.2 | ) | |||||||||||||||||||
| Other interest income | 99.8 | 96.0 | 90.2 | 114.8 | 131.5 | 4.0 | ||||||||||||||||||||
| Total interest income | 9,258.0 | 9,493.9 | 10,946.4 | 11,885.1 | 10,510.6 | (2.5 | ) | |||||||||||||||||||
Interest Expense | ||||||||||||||||||||||||||
| Deposits | 1,096.6 | 1,485.3 | 2,828.1 | 3,618.8 | 2,970.0 | (26.2 | ) | |||||||||||||||||||
| Short-term borrowings | 166.8 | 222.9 | 475.6 | 682.2 | 538.6 | (25.2 | ) | |||||||||||||||||||
| Long-term debt | 702.2 | 834.8 | 1,164.2 | 1,483.0 | 1,109.5 | (15.9 | ) | |||||||||||||||||||
| Company-obligated mandatorily redeemable preferred securities | 103.1 | 136.6 | 127.8 | 110.7 | 111.0 | (24.5 | ) | |||||||||||||||||||
| Total interest expense | 2,068.7 | 2,679.6 | 4,595.7 | 5,894.7 | 4,729.1 | (22.8 | ) | |||||||||||||||||||
| Net interest income | 7,189.3 | 6,814.3 | 6,350.7 | 5,990.4 | 5,781.5 | 5.5 | ||||||||||||||||||||
| Provision for credit losses | 1,254.0 | 1,349.0 | 2,528.8 | 828.0 | 646.0 | (7.0 | ) | |||||||||||||||||||
| Net interest income after provision for credit losses | 5,935.3 | 5,465.3 | 3,821.9 | 5,162.4 | 5,135.5 | 8.6 | ||||||||||||||||||||
Noninterest Income | ||||||||||||||||||||||||||
| Credit and debit card revenue | 560.7 | 517.0 | 465.9 | 431.0 | * | 8.5 | ||||||||||||||||||||
| Corporate payment products revenue | 361.3 | 325.7 | 297.7 | 299.2 | * | 10.9 | ||||||||||||||||||||
| ATM processing services | 165.9 | 160.6 | 153.0 | 141.9 | * | 3.3 | ||||||||||||||||||||
| Merchant processing services | 561.4 | 567.3 | 308.9 | 120.0 | * | (1.0 | ) | |||||||||||||||||||
| Credit card and payment processing revenue | * | * | * | * | 837.8 | ** | ||||||||||||||||||||
| Trust and investment management fees | 953.9 | 892.1 | 887.8 | 920.6 | 883.1 | 6.9 | ||||||||||||||||||||
| Deposit service charges | 715.8 | 690.3 | 644.9 | 555.6 | 501.1 | 3.7 | ||||||||||||||||||||
| Treasury management fees | 466.3 | 416.9 | 347.3 | 292.4 | 280.6 | 11.8 | ||||||||||||||||||||
| Commercial products revenue | 400.5 | 479.2 | 437.4 | 350.0 | 260.7 | (16.4 | ) | |||||||||||||||||||
| Mortgage banking revenue | 367.1 | 330.2 | 234.0 | 189.9 | 190.4 | 11.2 | ||||||||||||||||||||
| Investment products fees and commissions | 144.9 | 132.7 | 130.8 | 66.4 | 91.1 | 9.2 | ||||||||||||||||||||
| Securities gains, net | 244.8 | 299.9 | 329.1 | 8.1 | 13.2 | (18.4 | ) | |||||||||||||||||||
| Merger and restructuring-related gains | — | — | 62.2 | — | — | — | ||||||||||||||||||||
| Other | 370.4 | 398.8 | 370.4 | 591.9 | 457.1 | (7.1 | ) | |||||||||||||||||||
| Total noninterest income | 5,313.0 | 5,210.7 | 4,669.4 | 3,967.0 | 3,515.1 | 2.0 | ||||||||||||||||||||
Noninterest Expense | ||||||||||||||||||||||||||
| Compensation | 2,176.8 | 2,167.5 | 2,036.6 | 1,993.9 | 2,086.7 | .4 | ||||||||||||||||||||
| Employee benefits | 328.4 | 317.5 | 285.5 | 303.7 | 332.0 | 3.4 | ||||||||||||||||||||
| Net occupancy and equipment | 643.7 | 658.7 | 666.6 | 653.0 | 627.7 | (2.3 | ) | |||||||||||||||||||
| Professional services | 143.4 | 129.7 | 116.4 | 102.2 | 90.1 | 10.6 | ||||||||||||||||||||
| Marketing and business development | 180.3 | 171.4 | 178.0 | 188.0 | 181.8 | 5.2 | ||||||||||||||||||||
| Technology and communications | 417.4 | 392.1 | 353.9 | 362.1 | 299.0 | 6.5 | ||||||||||||||||||||
| Postage, printing and supplies | 245.6 | 243.2 | 241.9 | 241.6 | 244.4 | 1.0 | ||||||||||||||||||||
| Goodwill | — | — | 236.7 | 219.9 | 164.0 | — | ||||||||||||||||||||
| Other intangibles | 682.4 | 553.0 | 278.4 | 157.3 | 154.0 | 23.4 | ||||||||||||||||||||
| Merger and restructuring-related charges | 46.2 | 321.2 | 1,044.8 | 327.9 | 524.5 | (85.6 | ) | |||||||||||||||||||
| Other | 732.7 | 786.2 | 710.2 | 433.3 | 427.6 | (6.8 | ) | |||||||||||||||||||
| Total noninterest expense | 5,596.9 | 5,740.5 | 6,149.0 | 4,982.9 | 5,131.8 | (2.5 | ) | |||||||||||||||||||
| Income from continuing operations before income taxes | 5,651.4 | 4,935.5 | 2,342.3 | 4,146.5 | 3,518.8 | 14.5 | ||||||||||||||||||||
| Applicable income taxes | 1,941.3 | 1,707.5 | 818.3 | 1,422.0 | 1,296.3 | 13.7 | ||||||||||||||||||||
| Income from continuing operations | 3,710.1 | 3,228.0 | 1,524.0 | 2,724.5 | 2,222.5 | 14.9 | ||||||||||||||||||||
| Income (loss) from discontinued operations (after-tax) | 22.5 | (22.7 | ) | (45.2 | ) | 27.6 | 17.9 | ** | ||||||||||||||||||
| Cumulative effect of accounting change (after-tax) | — | (37.2 | ) | — | — | — | ** | |||||||||||||||||||
| Net income | $ | 3,732.6 | $ | 3,168.1 | $ | 1,478.8 | $ | 2,752.1 | $ | 2,240.4 | 17.8% | |||||||||||||||
A company’s internal control over financial reporting is a process designed to provide reasonable assurance regarding the reliability of financial reporting and the preparation of financial statements for external purposes in accordance with generally accepted accounting principles. A company’s internal control over financial reporting includes those policies and procedures that (1) pertain to the maintenance of records that, in reasonable detail, accurately and fairly reflect the transactions and dispositions of the assets of the company; (2) provide reasonable assurance that transactions are recorded as necessary to permit preparation of financial statements in accordance with generally accepted accounting principles, and that receipts and expenditures of the company are being made only in accordance with authorizations of management and directors of the company; and (3) provide reasonable assurance regarding prevention or timely detection of unauthorized acquisition, use, or disposition of the company’s assets that could have a material effect on the financial statements.
Because of its inherent limitations, internal control over financial reporting may not prevent or detect misstatements. Also, projections of any evaluation of effectiveness to future periods are subject to the risk that controls may become inadequate because of changes in conditions, or that the degree of compliance with the policies or procedures may deteriorate.
In our opinion, management’s assessment that U.S. Bancorp maintained effective internal control over financial reporting as of December 31, 2004, is fairly stated, in all material respects, based on the COSO criteria. Also, in our opinion, U.S. Bancorp maintained, in all material respects, effective internal control over financial reporting as of December 31, 2004, based on the COSO criteria.
We also have audited, in accordance with the standards of the Public Company Accounting Oversight Board (United States), the consolidated balance sheets of U.S. Bancorp as of December 31, 2004 and 2003, and the related consolidated statements of income, shareholders’ equity, and cash flows for each of the two years in the period ended December 31, 2004 and our report dated February 18, 2005 expressed an unqualified opinion thereon.
![]()
Minneapolis, Minnesota
| 2003 | 2002 | |||||||||||||||||||||||||||||||||
| First | Second | Third | Fourth | First | Second | Third | Fourth | |||||||||||||||||||||||||||
| (Dollars in Millions, Except Per Share Data) | Quarter | Quarter | Quarter | Quarter | Quarter | Quarter | Quarter | Quarter | ||||||||||||||||||||||||||
Interest Income | ||||||||||||||||||||||||||||||||||
| Loans | $ | 1,836.7 | $ | 1,821.0 | $ | 1,818.3 | $ | 1,796.0 | $ | 1,931.0 | $ | 1,936.8 | $ | 1,961.6 | $ | 1,913.6 | ||||||||||||||||||
| Loans held for sale | 59.6 | 51.8 | 59.5 | 31.3 | 39.2 | 36.6 | 37.3 | 57.5 | ||||||||||||||||||||||||||
| Investment securities | ||||||||||||||||||||||||||||||||||
| Taxable | 396.1 | 422.4 | 403.6 | 432.5 | 347.8 | 346.1 | 372.2 | 372.1 | ||||||||||||||||||||||||||
| Non-taxable | 8.9 | 7.5 | 6.7 | 6.3 | 13.2 | 11.7 | 10.9 | 10.3 | ||||||||||||||||||||||||||
| Other interest income | 29.9 | 25.1 | 23.2 | 21.6 | 16.7 | 29.6 | 21.8 | 27.9 | ||||||||||||||||||||||||||
| Total interest income | 2,331.2 | 2,327.8 | 2,311.3 | 2,287.7 | 2,347.9 | 2,360.8 | 2,403.8 | 2,381.4 | ||||||||||||||||||||||||||
Interest Expense | ||||||||||||||||||||||||||||||||||
| Deposits | 306.6 | 288.5 | 256.4 | 245.1 | 395.5 | 375.8 | 370.3 | 343.7 | ||||||||||||||||||||||||||
| Short-term borrowings | 39.5 | 38.9 | 44.9 | 43.5 | 72.9 | 57.3 | 51.1 | 41.6 | ||||||||||||||||||||||||||
| Long-term debt | 184.3 | 184.0 | 167.9 | 166.0 | 189.9 | 214.5 | 225.1 | 205.3 | ||||||||||||||||||||||||||
| Company-obligated mandatorily redeemable preferred securities | 31.4 | 24.5 | 23.6 | 23.6 | 34.8 | 33.9 | 34.7 | 33.2 | ||||||||||||||||||||||||||
| Total interest expense | 561.8 | 535.9 | 492.8 | 478.2 | 693.1 | 681.5 | 681.2 | 623.8 | ||||||||||||||||||||||||||
| Net interest income | 1,769.4 | 1,791.9 | 1,818.5 | 1,809.5 | 1,654.8 | 1,679.3 | 1,722.6 | 1,757.6 | ||||||||||||||||||||||||||
| Provision for credit losses | 335.0 | 323.0 | 310.0 | 286.0 | 335.0 | 335.0 | 330.0 | 349.0 | ||||||||||||||||||||||||||
| Net interest income after provision for credit losses | 1,434.4 | 1,468.9 | 1,508.5 | 1,523.5 | 1,319.8 | 1,344.3 | 1,392.6 | 1,408.6 | ||||||||||||||||||||||||||
Noninterest Income | ||||||||||||||||||||||||||||||||||
| Credit and debit card revenue | 127.4 | 142.3 | 137.6 | 153.4 | 109.3 | 131.2 | 132.8 | 143.7 | ||||||||||||||||||||||||||
| Corporate payment products revenue | 86.0 | 90.9 | 95.7 | 88.7 | 75.2 | 82.5 | 87.6 | 80.4 | ||||||||||||||||||||||||||
| ATM processing services | 42.4 | 41.9 | 41.3 | 40.3 | 36.3 | 39.7 | 42.9 | 41.7 | ||||||||||||||||||||||||||
| Merchant processing services | 127.3 | 141.8 | 146.3 | 146.0 | 133.6 | 144.4 | 147.3 | 142.0 | ||||||||||||||||||||||||||
| Trust and investment management fees | 228.6 | 238.9 | 239.8 | 246.6 | 222.7 | 232.9 | 222.9 | 213.6 | ||||||||||||||||||||||||||
| Deposit service charges | 163.2 | 179.0 | 187.0 | 186.6 | 150.3 | 167.1 | 186.5 | 186.4 | ||||||||||||||||||||||||||
| Treasury management fees | 112.0 | 111.8 | 126.2 | 116.3 | 104.2 | 104.3 | 105.8 | 102.6 | ||||||||||||||||||||||||||
| Commercial products revenue | 104.2 | 100.0 | 97.8 | 98.5 | 122.2 | 123.7 | 125.0 | 108.3 | ||||||||||||||||||||||||||
| Mortgage banking revenue | 95.4 | 90.3 | 89.5 | 91.9 | 52.0 | 78.0 | 111.8 | 88.4 | ||||||||||||||||||||||||||
| Investment products fees and commissions | 35.1 | 38.1 | 35.5 | 36.2 | 34.0 | 30.9 | 32.8 | 35.0 | ||||||||||||||||||||||||||
| Securities gains (losses), net | 140.7 | 213.1 | (108.9 | ) | (.1 | ) | 44.1 | 30.6 | 119.0 | 106.2 | ||||||||||||||||||||||||
| Other | 103.8 | 84.8 | 89.6 | 92.2 | 76.9 | 87.2 | 97.3 | 137.4 | ||||||||||||||||||||||||||
| Total noninterest income | 1,366.1 | 1,472.9 | 1,177.4 | 1,296.6 | 1,160.8 | 1,252.5 | 1,411.7 | 1,385.7 | ||||||||||||||||||||||||||
Noninterest Expense | ||||||||||||||||||||||||||||||||||
| Compensation | 546.0 | 547.6 | 543.8 | 539.4 | 532.4 | 537.2 | 552.8 | 545.1 | ||||||||||||||||||||||||||
| Employee benefits | 91.7 | 79.6 | 75.8 | 81.3 | 78.5 | 72.9 | 83.1 | 83.0 | ||||||||||||||||||||||||||
| Net occupancy and equipment | 161.3 | 159.5 | 161.3 | 161.6 | 162.6 | 163.8 | 164.6 | 167.7 | ||||||||||||||||||||||||||
| Professional services | 26.4 | 32.9 | 39.9 | 44.2 | 25.4 | 33.1 | 36.3 | 34.9 | ||||||||||||||||||||||||||
| Marketing and business development | 29.8 | 51.1 | 48.6 | 50.8 | 34.5 | 41.6 | 45.7 | 49.6 | ||||||||||||||||||||||||||
| Technology and communications | 104.9 | 104.1 | 102.1 | 106.3 | 95.6 | 95.8 | 99.6 | 101.1 | ||||||||||||||||||||||||||
| Postage, printing and supplies | 60.4 | 61.8 | 61.6 | 61.8 | 63.5 | 59.0 | 60.8 | 59.9 | ||||||||||||||||||||||||||
| Other intangibles | 235.1 | 312.3 | 10.8 | 124.2 | 80.2 | 104.7 | 211.4 | 156.7 | ||||||||||||||||||||||||||
| Merger and restructuring-related charges | 17.6 | 10.8 | 10.2 | 7.6 | 71.7 | 72.4 | 69.8 | 107.3 | ||||||||||||||||||||||||||
| Other | 181.4 | 186.9 | 199.2 | 165.2 | 182.3 | 210.5 | 212.1 | 181.3 | ||||||||||||||||||||||||||
| Total noninterest expense | 1,454.6 | 1,546.6 | 1,253.3 | 1,342.4 | 1,326.7 | 1,391.0 | 1,536.2 | 1,486.6 | ||||||||||||||||||||||||||
| Income from continuing operations before income taxes | 1,345.9 | 1,395.2 | 1,432.6 | 1,477.7 | 1,153.9 | 1,205.8 | 1,268.1 | 1,307.7 | ||||||||||||||||||||||||||
| Applicable income taxes | 461.8 | 480.2 | 491.9 | 507.4 | 400.1 | 418.2 | 440.1 | 449.1 | ||||||||||||||||||||||||||
| Income from continuing operations | 884.1 | 915.0 | 940.7 | 970.3 | 753.8 | 787.6 | 828.0 | 858.6 | ||||||||||||||||||||||||||
| Income (loss) from discontinued operations (after-tax) | .7 | 4.9 | 10.2 | 6.7 | 9.8 | 4.8 | 1.6 | (38.9 | ) | |||||||||||||||||||||||||
| Cumulative effect of accounting change (after-tax) | — | — | — | — | (37.2 | ) | — | — | — | |||||||||||||||||||||||||
| Net income | $ | 884.8 | $ | 919.9 | $ | 950.9 | $ | 977.0 | $ | 726.4 | $ | 792.4 | $ | 829.6 | $ | 819.7 | ||||||||||||||||||
| Earnings per share | $ | .46 | $ | .48 | $ | .49 | $ | .51 | $ | .38 | $ | .41 | $ | .43 | $ | .43 | ||||||||||||||||||
| Diluted earnings per share | $ | .46 | $ | .48 | $ | .49 | $ | .50 | $ | .38 | $ | .41 | $ | .43 | $ | .43 | ||||||||||||||||||
| % Change | ||||||||||||||||||||||||||
| December 31 (Dollars in Millions) | 2004 | 2003 | 2002 | 2001 | 2000 | 2004 v 2003 | ||||||||||||||||||||
Assets | ||||||||||||||||||||||||||
| Cash and due from banks | $ | 6,336 | $ | 8,630 | $ | 10,758 | $ | 9,120 | $ | 8,475 | (26.6 | )% | ||||||||||||||
| Held-to-maturity securities | 127 | 152 | 233 | 299 | 252 | (16.4 | ) | |||||||||||||||||||
| Available-for-sale securities | 41,354 | 43,182 | 28,255 | 26,309 | 17,390 | (4.2 | ) | |||||||||||||||||||
| Loans held for sale | 1,439 | 1,433 | 4,159 | 2,820 | 764 | .4 | ||||||||||||||||||||
| Loans | 126,315 | 118,235 | 116,251 | 114,405 | 122,365 | 6.8 | ||||||||||||||||||||
| Less allowance for loan losses | (2,080 | ) | (2,184 | ) | (2,422 | ) | (2,457 | ) | (1,787 | ) | (4.8 | ) | ||||||||||||||
| Net loans | 124,235 | 116,051 | 113,829 | 111,948 | 120,578 | 7.1 | ||||||||||||||||||||
| Other assets | 21,613 | 20,023 | 22,793 | 20,894 | 17,462 | 7.9 | ||||||||||||||||||||
| Total assets | $ | 195,104 | $ | 189,471 | $ | 180,027 | $ | 171,390 | $ | 164,921 | 3.0 | % | ||||||||||||||
Liabilities and Shareholders’ Equity | ||||||||||||||||||||||||||
| Deposits | ||||||||||||||||||||||||||
| Noninterest-bearing | $ | 30,756 | $ | 32,470 | $ | 35,106 | $ | 31,212 | $ | 26,633 | (5.3 | )% | ||||||||||||||
| Interest-bearing | 89,985 | 86,582 | 80,428 | 74,007 | 82,902 | 3.9 | ||||||||||||||||||||
| Total deposits | 120,741 | 119,052 | 115,534 | 105,219 | 109,535 | 1.4 | ||||||||||||||||||||
| Short-term borrowings | 13,084 | 10,850 | 7,806 | 14,670 | 11,833 | 20.6 | ||||||||||||||||||||
| Long-term debt | 34,739 | 33,816 | 31,582 | 28,542 | 23,276 | 2.7 | ||||||||||||||||||||
| Other liabilities | 7,001 | 6,511 | 6,669 | 6,214 | 4,944 | 7.5 | ||||||||||||||||||||
| Total liabilities | 175,565 | 170,229 | 161,591 | 154,645 | 149,588 | 3.1 | ||||||||||||||||||||
| Shareholders’ equity | 19,539 | 19,242 | 18,436 | 16,745 | 15,333 | 1.5 | ||||||||||||||||||||
| Total liabilities and shareholders’ equity | $ | 195,104 | $ | 189,471 | $ | 180,027 | $ | 171,390 | $ | 164,921 | 3.0 | % | ||||||||||||||
| Earnings Per Share Summary | 2003 | 2002 | 2001 | 2000 | 1999 | |||||||||||||||
| Earnings per share from continuing operations | $1.93 | $1.68 | $ .79 | $1.43 | $1.16 | |||||||||||||||
| Discontinued operations | .01 | (.01 | ) | (.02 | ) | .01 | .01 | |||||||||||||
| Cumulative effect of accounting change | — | (.02 | ) | — | — | — | ||||||||||||||
| Earnings per share | $1.94 | $1.65 | $ .77 | $1.44 | $1.17 | |||||||||||||||
| Diluted earnings per share from continuing operations | $1.92 | $1.68 | $ .79 | $1.42 | $1.15 | |||||||||||||||
| Discontinued operations | .01 | (.01 | ) | (.03 | ) | .01 | .01 | |||||||||||||
| Cumulative effect of accounting change | — | (.02 | ) | — | — | — | ||||||||||||||
| Diluted earnings per share | $1.93 | $1.65 | $ .76 | $1.43 | $1.16 | |||||||||||||||
| % Change | ||||||||||||||||||||||||||
| Year Ended December 31 (Dollars in Millions) | 2004 | 2003 | 2002 | 2001 | 2000 | 2004 v 2003 | ||||||||||||||||||||
Interest Income | ||||||||||||||||||||||||||
| Loans | $ | 7,168.1 | $ | 7,272.0 | $ | 7,743.0 | $ | 9,413.7 | $ | 10,519.3 | (1.4 | )% | ||||||||||||||
| Loans held for sale | 91.5 | 202.2 | 170.6 | 146.9 | 102.1 | (54.7 | ) | |||||||||||||||||||
| Investment securities | 1,827.1 | 1,684.0 | 1,484.3 | 1,295.6 | 1,148.9 | 8.5 | ||||||||||||||||||||
| Other interest income | 99.8 | 99.8 | 96.0 | 90.2 | 114.8 | — | ||||||||||||||||||||
| Total interest income | 9,186.5 | 9,258.0 | 9,493.9 | 10,946.4 | 11,885.1 | (.8 | ) | |||||||||||||||||||
Interest Expense | ||||||||||||||||||||||||||
| Deposits | 904.3 | 1,096.6 | 1,485.3 | 2,828.1 | 3,618.8 | (17.5 | ) | |||||||||||||||||||
| Short-term borrowings | 262.7 | 166.8 | 222.9 | 475.6 | 682.2 | 57.5 | ||||||||||||||||||||
| Long-term debt | 908.2 | 805.3 | 971.4 | 1,292.0 | 1,593.7 | 12.8 | ||||||||||||||||||||
| Total interest expense | 2,075.2 | 2,068.7 | 2,679.6 | 4,595.7 | 5,894.7 | .3 | ||||||||||||||||||||
| Net interest income | 7,111.3 | 7,189.3 | 6,814.3 | 6,350.7 | 5,990.4 | (1.1 | ) | |||||||||||||||||||
| Provision for credit losses | 669.6 | 1,254.0 | 1,349.0 | 2,528.8 | 828.0 | (46.6 | ) | |||||||||||||||||||
| Net interest income after provision for credit losses | 6,441.7 | 5,935.3 | 5,465.3 | 3,821.9 | 5,162.4 | 8.5 | ||||||||||||||||||||
Noninterest Income | ||||||||||||||||||||||||||
| Credit and debit card revenue | 649.3 | 560.7 | 517.0 | 465.9 | 431.0 | 15.8 | ||||||||||||||||||||
| Corporate payment products revenue | 406.8 | 361.3 | 325.7 | 297.7 | 299.2 | 12.6 | ||||||||||||||||||||
| ATM processing services | 175.3 | 165.9 | 160.6 | 153.0 | 141.9 | 5.7 | ||||||||||||||||||||
| Merchant processing services | 674.6 | 561.4 | 567.3 | 308.9 | 120.0 | 20.2 | ||||||||||||||||||||
| Trust and investment management fees | 981.2 | 953.9 | 892.1 | 887.8 | 920.6 | 2.9 | ||||||||||||||||||||
| Deposit service charges | 806.4 | 715.8 | 690.3 | 644.9 | 555.6 | 12.7 | ||||||||||||||||||||
| Treasury management fees | 466.7 | 466.3 | 416.9 | 347.3 | 292.4 | .1 | ||||||||||||||||||||
| Commercial products revenue | 432.2 | 400.5 | 479.2 | 437.4 | 350.0 | 7.9 | ||||||||||||||||||||
| Mortgage banking revenue | 397.3 | 367.1 | 330.2 | 234.0 | 189.9 | 8.2 | ||||||||||||||||||||
| Investment products fees and commissions | 156.0 | 144.9 | 132.7 | 130.8 | 66.4 | 7.7 | ||||||||||||||||||||
| Securities gains (losses), net | (104.9 | ) | 244.8 | 299.9 | 329.1 | 8.1 | * | |||||||||||||||||||
| Merger and restructuring-related gains | — | — | — | 62.2 | — | — | ||||||||||||||||||||
| Other | 478.3 | 370.4 | 398.8 | 370.4 | 591.9 | 29.1 | ||||||||||||||||||||
| Total noninterest income | 5,519.2 | 5,313.0 | 5,210.7 | 4,669.4 | 3,967.0 | 3.9 | ||||||||||||||||||||
Noninterest Expense | ||||||||||||||||||||||||||
| Compensation | 2,252.2 | 2,176.8 | 2,167.5 | 2,036.6 | 1,993.9 | 3.5 | ||||||||||||||||||||
| Employee benefits | 389.4 | 328.4 | 317.5 | 285.5 | 303.7 | 18.6 | ||||||||||||||||||||
| Net occupancy and equipment | 630.8 | 643.7 | 658.7 | 666.6 | 653.0 | (2.0 | ) | |||||||||||||||||||
| Professional services | 148.9 | 143.4 | 129.7 | 116.4 | 102.2 | 3.8 | ||||||||||||||||||||
| Marketing and business development | 193.5 | 180.3 | 171.4 | 178.0 | 188.0 | 7.3 | ||||||||||||||||||||
| Technology and communications | 429.6 | 417.4 | 392.1 | 353.9 | 362.1 | 2.9 | ||||||||||||||||||||
| Postage, printing and supplies | 248.4 | 245.6 | 243.2 | 241.9 | 241.6 | 1.1 | ||||||||||||||||||||
| Goodwill | — | — | — | 236.7 | 219.9 | — | ||||||||||||||||||||
| Other intangibles | 550.1 | 682.4 | 553.0 | 278.4 | 157.3 | (19.4 | ) | |||||||||||||||||||
| Merger and restructuring-related charges | — | 46.2 | 321.2 | 1,044.8 | 327.9 | * | ||||||||||||||||||||
| Debt prepayment | 154.8 | — | (.2 | ) | 6.8 | — | * | |||||||||||||||||||
| Other | 786.8 | 732.7 | 786.4 | 703.4 | 433.3 | 7.4 | ||||||||||||||||||||
| Total noninterest expense | 5,784.5 | 5,596.9 | 5,740.5 | 6,149.0 | 4,982.9 | 3.4 | ||||||||||||||||||||
| Income from continuing operations before income taxes | 6,176.4 | 5,651.4 | 4,935.5 | 2,342.3 | 4,146.5 | 9.3 | ||||||||||||||||||||
| Applicable income taxes | 2,009.6 | 1,941.3 | 1,707.5 | 818.3 | 1,422.0 | 3.5 | ||||||||||||||||||||
| Income from continuing operations | 4,166.8 | 3,710.1 | 3,228.0 | 1,524.0 | 2,724.5 | 12.3 | ||||||||||||||||||||
| Income (loss) from discontinued operations (after-tax) | — | 22.5 | (22.7 | ) | (45.2 | ) | 27.6 | * | ||||||||||||||||||
| Cumulative effect of accounting change (after-tax) | — | — | (37.2 | ) | — | — | — | |||||||||||||||||||
| Net income | $ | 4,166.8 | $ | 3,732.6 | $ | 3,168.1 | $ | 1,478.8 | $ | 2,752.1 | 11.6 | |||||||||||||||
| 2004 | 2003 | ||||||||||||||||||||||||||||||||
| First | Second | Third | Fourth | First | Second | Third | Fourth | ||||||||||||||||||||||||||
| (Dollars in Millions, Except Per Share Data) | Quarter | Quarter | Quarter | Quarter | Quarter | Quarter | Quarter | Quarter | |||||||||||||||||||||||||
Interest Income | |||||||||||||||||||||||||||||||||
| Loans | $ | 1,747.0 | $ | 1,740.0 | $ | 1,802.8 | $ | 1,878.3 | $ | 1,836.7 | $ | 1,821.0 | $ | 1,818.3 | $ | 1,796.0 | |||||||||||||||||
| Loans held for sale | 19.9 | 27.3 | 21.1 | 23.2 | 59.6 | 51.8 | 59.5 | 31.3 | |||||||||||||||||||||||||
| Investment securities | 469.3 | 443.4 | 453.2 | 461.2 | 405.0 | 429.9 | 410.3 | 438.8 | |||||||||||||||||||||||||
| Other interest income | 21.9 | 25.5 | 25.7 | 26.7 | 29.9 | 25.1 | 23.2 | 21.6 | |||||||||||||||||||||||||
| Total interest income | 2,258.1 | 2,236.2 | 2,302.8 | 2,389.4 | 2,331.2 | 2,327.8 | 2,311.3 | 2,287.7 | |||||||||||||||||||||||||
Interest Expense | |||||||||||||||||||||||||||||||||
| Deposits | 227.0 | 205.3 | 221.4 | 250.6 | 306.6 | 288.5 | 256.4 | 245.1 | |||||||||||||||||||||||||
| Short-term borrowings | 49.9 | 58.9 | 74.5 | 79.4 | 39.5 | 38.9 | 44.9 | 43.5 | |||||||||||||||||||||||||
| Long-term debt | 209.4 | 199.6 | 232.3 | 266.9 | 215.7 | 208.5 | 191.5 | 189.6 | |||||||||||||||||||||||||
| Total interest expense | 486.3 | 463.8 | 528.2 | 596.9 | 561.8 | 535.9 | 492.8 | 478.2 | |||||||||||||||||||||||||
| Net interest income | 1,771.8 | 1,772.4 | 1,774.6 | 1,792.5 | 1,769.4 | 1,791.9 | 1,818.5 | 1,809.5 | |||||||||||||||||||||||||
| Provision for credit losses | 235.0 | 204.5 | 165.1 | 65.0 | 335.0 | 323.0 | 310.0 | 286.0 | |||||||||||||||||||||||||
| Net interest income after provision for credit losses | 1,536.8 | 1,567.9 | 1,609.5 | 1,727.5 | 1,434.4 | 1,468.9 | 1,508.5 | 1,523.5 | |||||||||||||||||||||||||
Noninterest Income | |||||||||||||||||||||||||||||||||
| Credit and debit card revenue | 141.8 | 158.8 | 164.3 | 184.4 | 127.4 | 142.3 | 137.6 | 153.4 | |||||||||||||||||||||||||
| Corporate payment products revenue | 94.8 | 102.7 | 108.5 | 100.8 | 86.0 | 90.9 | 95.7 | 88.7 | |||||||||||||||||||||||||
| ATM processing services | 42.2 | 44.9 | 45.2 | 43.0 | 42.4 | 41.9 | 41.3 | 40.3 | |||||||||||||||||||||||||
| Merchant processing services | 141.1 | 165.1 | 187.5 | 180.9 | 127.3 | 141.8 | 146.3 | 146.0 | |||||||||||||||||||||||||
| Trust and investment management fees | 248.6 | 251.7 | 240.2 | 240.7 | 228.6 | 238.9 | 239.8 | 246.6 | |||||||||||||||||||||||||
| Deposit service charges | 185.2 | 202.1 | 207.4 | 211.7 | 163.2 | 179.0 | 187.0 | 186.6 | |||||||||||||||||||||||||
| Treasury management fees | 117.5 | 121.5 | 117.9 | 109.8 | 112.0 | 111.8 | 126.2 | 116.3 | |||||||||||||||||||||||||
| Commercial products revenue | 110.4 | 107.4 | 106.7 | 107.7 | 104.2 | 100.0 | 97.8 | 98.5 | |||||||||||||||||||||||||
| Mortgage banking revenue | 94.2 | 109.9 | 97.2 | 96.0 | 95.4 | 90.3 | 89.5 | 91.9 | |||||||||||||||||||||||||
| Investment products fees and commissions | 39.3 | 42.2 | 37.1 | 37.4 | 35.1 | 38.1 | 35.5 | 36.2 | |||||||||||||||||||||||||
| Securities gains (losses), net | — | (171.7 | ) | 87.3 | (20.5 | ) | 140.7 | 213.1 | (108.9 | ) | (.1 | ) | |||||||||||||||||||||
| Other | 103.2 | 107.1 | 124.7 | 143.3 | 103.8 | 84.8 | 89.6 | 92.2 | |||||||||||||||||||||||||
| Total noninterest income | 1,318.3 | 1,241.7 | 1,524.0 | 1,435.2 | 1,366.1 | 1,472.9 | 1,177.4 | 1,296.6 | |||||||||||||||||||||||||
Noninterest Expense | |||||||||||||||||||||||||||||||||
| Compensation | 535.8 | 572.6 | 564.6 | 579.2 | 546.0 | 547.6 | 543.8 | 539.4 | |||||||||||||||||||||||||
| Employee benefits | 100.2 | 91.2 | 100.0 | 98.0 | 91.7 | 79.6 | 75.8 | 81.3 | |||||||||||||||||||||||||
| Net occupancy and equipment | 155.7 | 153.4 | 159.2 | 162.5 | 161.3 | 159.5 | 161.3 | 161.6 | |||||||||||||||||||||||||
| Professional services | 32.4 | 34.7 | 37.2 | 44.6 | 26.4 | 32.9 | 39.9 | 44.2 | |||||||||||||||||||||||||
| Marketing and business development | 35.3 | 48.7 | 60.6 | 48.9 | 29.8 | 51.1 | 48.6 | 50.8 | |||||||||||||||||||||||||
| Technology and communications | 101.7 | 102.4 | 109.8 | 115.7 | 104.9 | 104.1 | 102.1 | 106.3 | |||||||||||||||||||||||||
| Postage, printing and supplies | 61.6 | 60.5 | 61.4 | 64.9 | 60.4 | 61.8 | 61.6 | 61.8 | |||||||||||||||||||||||||
| Other intangibles | 226.1 | (47.6 | ) | 210.2 | 161.4 | 235.1 | 312.3 | 10.8 | 124.2 | ||||||||||||||||||||||||
| Merger and restructuring-related charges | — | — | — | — | 17.6 | 10.8 | 10.2 | 7.6 | |||||||||||||||||||||||||
| Debt prepayment | 35.4 | 1.3 | 5.6 | 112.5 | — | — | — | — | |||||||||||||||||||||||||
| Other | 170.7 | 215.4 | 210.4 | 190.3 | 181.4 | 186.9 | 199.2 | 165.2 | |||||||||||||||||||||||||
| Total noninterest expense | 1,454.9 | 1,232.6 | 1,519.0 | 1,578.0 | 1,454.6 | 1,546.6 | 1,253.3 | 1,342.4 | |||||||||||||||||||||||||
| Income from continuing operations before income taxes | 1,400.2 | 1,577.0 | 1,614.5 | 1,584.7 | 1,345.9 | 1,395.2 | 1,432.6 | 1,477.7 | |||||||||||||||||||||||||
| Applicable income taxes | 391.8 | 540.1 | 549.0 | 528.7 | 461.8 | 480.2 | 491.9 | 507.4 | |||||||||||||||||||||||||
| Income from continuing operations | 1,008.4 | 1,036.9 | 1,065.5 | 1,056.0 | 884.1 | 915.0 | 940.7 | 970.3 | |||||||||||||||||||||||||
| Income from discontinued operations (after- tax) | — | — | — | — | .7 | 4.9 | 10.2 | 6.7 | |||||||||||||||||||||||||
| Net income | $ | 1,008.4 | $ | 1,036.9 | $ | 1,065.5 | $ | 1,056.0 | $ | 884.8 | $ | 919.9 | $ | 950.9 | $ | 977.0 | |||||||||||||||||
| Earnings per share | $ | .53 | $ | .55 | $ | .57 | $ | .57 | $ | .46 | $ | .48 | $ | .49 | $ | .51 | |||||||||||||||||
| Diluted earnings per share | $ | .52 | $ | .54 | $ | .56 | $ | .56 | $ | .46 | $ | .48 | $ | .49 | $ | .50 | |||||||||||||||||
| Earnings Per Share Summary | 2004 | 2003 | 2002 | 2001 | 2000 | |||||||||||||||
| Earnings per share from continuing operations | $2.21 | $1.93 | $1.68 | $ .79 | $1.43 | |||||||||||||||
| Discontinued operations | — | .01 | (.01 | ) | (.02 | ) | .01 | |||||||||||||
| Cumulative effect of accounting change | — | — | (.02 | ) | — | — | ||||||||||||||
| Earnings per share | $2.21 | $1.94 | $1.65 | $ .77 | $1.44 | |||||||||||||||
| Diluted earnings per share from continuing operations | $2.18 | $1.92 | $1.68 | $.79 | $1.42 | |||||||||||||||
| Discontinued operations | — | .01 | (.01 | ) | (.03 | ) | .01 | |||||||||||||
| Cumulative effect of accounting change | — | — | (.02 | ) | — | — | ||||||||||||||
| Diluted earnings per share | $2.18 | $1.93 | $1.65 | $ .76 | $1.43 | |||||||||||||||
| Ratios | Ratios | Ratios | ||||||||||||||||||||||||||||||||||||||||
| Return on average assets | Return on average assets | 1.99 | % | 1.84 | % | .89 | % | 1.74 | % | 1.49 | % | Return on average assets | 2.17 | % | 1.99 | % | 1.84 | % | .89 | % | 1.74 | % | ||||||||||||||||||||
| Return on average equity | Return on average equity | 19.2 | 18.3 | 9.0 | 19.0 | 16.9 | Return on average equity | 21.4 | 19.2 | 18.3 | 9.0 | 19.0 | ||||||||||||||||||||||||||||||
| Average total equity to average assets | Average total equity to average assets | 10.3 | 10.0 | 9.9 | 9.1 | 8.8 | Average total equity to average assets | 10.2 | 10.3 | 10.0 | 9.9 | 9.1 | ||||||||||||||||||||||||||||||
| Dividends per share to net income per share | Dividends per share to net income per share | 44.1 | 47.3 | 97.4 | 45.1 | 39.3 | Dividends per share to net income per share | 46.2 | 44.1 | 47.3 | 97.4 | 45.1 | ||||||||||||||||||||||||||||||
Other Statistics(Dollars and Shares in Millions) | Other Statistics(Dollars and Shares in Millions) | Other Statistics(Dollars and Shares in Millions) | ||||||||||||||||||||||||||||||||||||||||
| Common shares outstanding (a) | Common shares outstanding (a) | 1,922.9 | 1,917.0 | 1,951.7 | 1,902.1 | 1,928.5 | Common shares outstanding (a) | 1,857.6 | 1,922.9 | 1,917.0 | 1,951.7 | 1,902.1 | ||||||||||||||||||||||||||||||
| Average common shares outstanding and common stock equivalents | Average common shares outstanding and common stock equivalents | Average common shares outstanding and common stock equivalents | ||||||||||||||||||||||||||||||||||||||||
| Earnings per share | 1,923.7 | 1,916.0 | 1,927.9 | 1,906.0 | 1,907.8 | Earnings per share | 1,887.1 | 1,923.7 | 1,916.0 | 1,927.9 | 1,906.0 | |||||||||||||||||||||||||||||||
| Diluted earnings per share | 1,936.2 | 1,924.8 | 1,940.3 | 1,918.5 | 1,930.0 | Diluted earnings per share | 1,912.9 | 1,936.2 | 1,924.8 | 1,940.3 | 1,918.5 | |||||||||||||||||||||||||||||||
| Number of shareholders (b) | Number of shareholders (b) | 74,341 | 74,805 | 76,395 | 46,052 | 45,966 | Number of shareholders (b) | 71,492 | 74,341 | 74,805 | 76,395 | 46,052 | ||||||||||||||||||||||||||||||
| Common dividends declared | Common dividends declared | $1,645 | $1,488 | $1,447 | $1,267 | $1,091 | Common dividends declared | $1,917 | $1,645 | $1,488 | $1,447 | $1,267 | ||||||||||||||||||||||||||||||
| (a) | Defined as total common shares less common stock held in treasury at December 31. |
| (b) | Based on number of common stock shareholders of record at December 31. |
Stock Price Range and Dividends
| 2003 | 2002 | 2004 | 2003 | |||||||||||||||||||||||||||||||||||||||||||||||||||||||||||||
| Sales Price | Sales Price | Sales Price | Sales Price | |||||||||||||||||||||||||||||||||||||||||||||||||||||||||||||
| Closing | Dividends | Closing | Dividends | Closing | Dividends | Closing | Dividends | |||||||||||||||||||||||||||||||||||||||||||||||||||||||||
| High | Low | Price | Declared | High | Low | Price | Declared | High | Low | Price | Declared | High | Low | Price | Declared | |||||||||||||||||||||||||||||||||||||||||||||||||
| First quarter | $ | 23.47 | $ | 18.56 | $ | 18.98 | $ | .205 | $ | 23.07 | $ | 19.02 | $ | 22.57 | $ | .195 | $ | 29.70 | $ | 26.41 | $ | 27.65 | $ | .240 | $ | 23.47 | $ | 18.56 | $ | 18.98 | $ | .205 | ||||||||||||||||||||||||||||||||
| Second quarter | 24.99 | 18.96 | 24.50 | .205 | 24.50 | 22.08 | 23.35 | .195 | 28.65 | 24.89 | 27.56 | .240 | 24.99 | 18.96 | 24.50 | .205 | ||||||||||||||||||||||||||||||||||||||||||||||||
| Third quarter | 25.82 | 22.93 | 23.99 | .205 | 23.29 | 17.09 | 18.58 | .195 | 30.00 | 27.42 | 28.90 | .240 | 25.82 | 22.93 | 23.99 | .205 | ||||||||||||||||||||||||||||||||||||||||||||||||
| Fourth quarter | 30.00 | 24.04 | 29.78 | .240 | 22.38 | 16.05 | 21.22 | .195 | 31.65 | 27.52 | 31.32 | .300 | 30.00 | 24.04 | 29.78 | .240 | ||||||||||||||||||||||||||||||||||||||||||||||||
The common stock of U.S. Bancorp is traded on the New York Stock Exchange, under the ticker symbol “USB.”
Reconciliation of Quarterly Consolidated Financial Data
| 2003 | 2002 | |||||||||||||||||||||||||||||||||||||||||
| 2003 | ||||||||||||||||||||||||||||||||||||||||||
| First | Second | Third | First | Second | Third | Fourth | First | Second | Third | |||||||||||||||||||||||||||||||||
| (Dollars in Millions and After-tax) | (Dollars in Millions and After-tax) | Quarter | Quarter | Quarter | Quarter | Quarter | Quarter | Quarter | (Dollars in Millions and After-tax) | Quarter | Quarter | Quarter | ||||||||||||||||||||||||||||||
| Income before cumulative effect of accounting change, as previously reported | Income before cumulative effect of accounting change, as previously reported | $ | 911.2 | $ | 953.6 | $ | 984.9 | $ | 793.2 | $ | 823.1 | $ | 860.3 | $ | 849.8 | Income before cumulative effect of accounting change, as previously reported | $ | 911.2 | $ | 953.6 | $ | 984.9 | ||||||||||||||||||||
| Less | Less | Less | ||||||||||||||||||||||||||||||||||||||||
| Discontinued operations of Piper Jaffray Companies (a) | .7 | 4.9 | 10.2 | 9.8 | 4.8 | 1.6 | (38.9 | ) | Discontinued operations of Piper Jaffray Companies (a) | .7 | 4.9 | 10.2 | ||||||||||||||||||||||||||||||
| Adoption of SFAS 123 for stock options (a) | 26.4 | 33.7 | 34.0 | 29.6 | 30.7 | 30.7 | 30.1 | Adoption of SFAS 123 for stock options (a) | 26.4 | 33.7 | 34.0 | |||||||||||||||||||||||||||||||
| Income from continuing operations | Income from continuing operations | $ | 884.1 | $ | 915.0 | $ | 940.7 | $ | 753.8 | $ | 787.6 | $ | 828.0 | $ | 858.6 | Income from continuing operations | $ | 884.1 | $ | 915.0 | $ | 940.7 | ||||||||||||||||||||
| (a) | The Company’s quarterly financial results previously filed on Form 10-Q with the Securities and Exchange Commission have been retroactively restated to give effect to the spin-off of Piper Jaffray Companies on December 31, 2003, and the adoption of the fair value method of accounting for stock-based compensation. The accounting change was adopted using the retroactive restatement method. |
| Year Ended December 31 | Year Ended December 31 | 2003 | 2002 | Year Ended December 31 | 2004 | 2003 | ||||||||||||||||||||||||||||||||||||||||||||||||||
| Average | Yields | Average | Yields | Average | Yields | Average | Yields | |||||||||||||||||||||||||||||||||||||||||||||||||
| (Dollars in Millions) | (Dollars in Millions) | Balances | Interest | and Rates | Balances | Interest | and Rates | (Dollars in Millions) | Balances | Interest | and Rates | Balances | Interest | and Rates | ||||||||||||||||||||||||||||||||||||||||||
Assets | Assets | Assets | ||||||||||||||||||||||||||||||||||||||||||||||||||||||
| Taxable securities | $ | 36,647 | $ | 1,654.6 | 4.51 | % | $ | 27,892 | $ | 1,438.2 | 5.16 | % | ||||||||||||||||||||||||||||||||||||||||||||
| Non-taxable securities | 601 | 42.1 | 7.01 | 937 | 65.3 | 6.97 | ||||||||||||||||||||||||||||||||||||||||||||||||||
| Investment securities | Investment securities | $ | 43,009 | $ | 1,835.5 | 4.27 | % | $ | 37,248 | $ | 1,696.7 | 4.56 | % | |||||||||||||||||||||||||||||||||||||||||||
| Loans held for sale | Loans held for sale | 3,616 | 202.2 | 5.59 | 2,644 | 170.6 | 6.45 | Loans held for sale | 1,608 | 91.5 | 5.69 | 3,616 | 202.2 | 5.59 | ||||||||||||||||||||||||||||||||||||||||||
| Loans (b) | Loans (b) | Loans (b) | ||||||||||||||||||||||||||||||||||||||||||||||||||||||
| Commercial | 41,326 | 2,315.4 | 5.60 | 43,817 | 2,622.2 | 5.98 | Commercial | 39,348 | 2,212.9 | 5.62 | 41,326 | 2,315.4 | 5.60 | |||||||||||||||||||||||||||||||||||||||||||
| Commercial real estate | 27,142 | 1,584.6 | 5.84 | 25,723 | 1,636.3 | 6.36 | Commercial real estate | 27,267 | 1,543.3 | 5.66 | 27,142 | 1,584.6 | 5.84 | |||||||||||||||||||||||||||||||||||||||||||
| Residential mortgages | 11,696 | 713.4 | 6.10 | 8,412 | 595.3 | 7.08 | Residential mortgages | 14,322 | 812.1 | 5.67 | 11,696 | 713.4 | 6.10 | |||||||||||||||||||||||||||||||||||||||||||
| Retail | 38,198 | 2,673.8 | 7.00 | 36,501 | 2,902.8 | 7.95 | Retail | 41,204 | 2,619.7 | 6.36 | 38,198 | 2,673.8 | 7.00 | |||||||||||||||||||||||||||||||||||||||||||
| Total loans | 118,362 | 7,287.2 | 6.16 | 114,453 | 7,756.6 | 6.78 | Total loans | 122,141 | 7,188.0 | 5.89 | 118,362 | 7,287.2 | 6.16 | |||||||||||||||||||||||||||||||||||||||||||
| Other earning assets | Other earning assets | 1,582 | 100.1 | 6.32 | 1,484 | 96.1 | 6.48 | Other earning assets | 1,365 | 100.1 | 7.33 | 1,582 | 100.1 | 6.32 | ||||||||||||||||||||||||||||||||||||||||||
| Total earning assets | 160,808 | 9,286.2 | 5.77 | 147,410 | 9,526.8 | 6.46 | Total earning assets | 168,123 | 9,215.1 | 5.48 | 160,808 | 9,286.2 | 5.77 | |||||||||||||||||||||||||||||||||||||||||||
| Allowance for credit losses | Allowance for credit losses | (2,467 | ) | (2,542 | ) | Allowance for credit losses | (2,303 | ) | (2,467 | ) | ||||||||||||||||||||||||||||||||||||||||||||||
| Unrealized gain (loss) on available-for-sale securities | Unrealized gain (loss) on available-for-sale securities | 120 | 409 | Unrealized gain (loss) on available-for-sale securities | (346 | ) | 120 | |||||||||||||||||||||||||||||||||||||||||||||||||
| Other assets (c) | Other assets (c) | 29,169 | 26,671 | Other assets (c) | 26,119 | 29,169 | ||||||||||||||||||||||||||||||||||||||||||||||||||
| Total assets | $ | 187,630 | $ | 171,948 | Total assets | $ | 191,593 | $ | 187,630 | |||||||||||||||||||||||||||||||||||||||||||||||
Liabilities and Shareholders’ Equity | Liabilities and Shareholders’ Equity | Liabilities and Shareholders’ Equity | ||||||||||||||||||||||||||||||||||||||||||||||||||||||
| Noninterest-bearing deposits | Noninterest-bearing deposits | $ | 31,715 | $ | 28,715 | Noninterest-bearing deposits | $ | 29,816 | $ | 31,715 | ||||||||||||||||||||||||||||||||||||||||||||||
| Interest-bearing deposits | Interest-bearing deposits | Interest-bearing deposits | ||||||||||||||||||||||||||||||||||||||||||||||||||||||
| Interest checking | 19,104 | 84.3 | .44 | 15,631 | 102.3 | .65 | Interest checking | 20,933 | 70.8 | .34 | 19,104 | 84.3 | .44 | |||||||||||||||||||||||||||||||||||||||||||
| Money market accounts | 32,310 | 317.7 | .98 | 25,237 | 312.8 | 1.24 | Money market accounts | 32,854 | 235.2 | .72 | 32,310 | 317.7 | .98 | |||||||||||||||||||||||||||||||||||||||||||
| Savings accounts | 5,612 | 21.2 | .38 | 4,928 | 25.1 | .51 | Savings accounts | 5,866 | 15.4 | .26 | 5,612 | 21.2 | .38 | |||||||||||||||||||||||||||||||||||||||||||
| Time certificates of deposit less than $100,000 | 15,493 | 450.9 | 2.91 | 19,283 | 743.4 | 3.86 | Time certificates of deposit less than $100,000 | 13,074 | 341.3 | 2.61 | 15,493 | 450.9 | 2.91 | |||||||||||||||||||||||||||||||||||||||||||
| Time deposits greater than $100,000 | 12,319 | 222.5 | 1.81 | 11,330 | 301.7 | 2.66 | Time deposits greater than $100,000 | 13,679 | 241.6 | 1.77 | 12,319 | 222.5 | 1.81 | |||||||||||||||||||||||||||||||||||||||||||
| Total interest-bearing deposits | 84,838 | 1,096.6 | 1.29 | 76,409 | 1,485.3 | 1.94 | Total interest-bearing deposits | 86,406 | 904.3 | 1.05 | 84,838 | 1,096.6 | 1.29 | |||||||||||||||||||||||||||||||||||||||||||
| Short-term borrowings | Short-term borrowings | 10,503 | 166.8 | 1.59 | 10,116 | 222.9 | 2.20 | Short-term borrowings | 14,534 | 262.7 | 1.81 | 10,503 | 166.8 | 1.59 | ||||||||||||||||||||||||||||||||||||||||||
| Long-term debt | Long-term debt | 30,965 | 702.2 | 2.27 | 29,268 | 834.8 | 2.85 | Long-term debt | 35,115 | 908.2 | 2.59 | 33,663 | 805.3 | 2.39 | ||||||||||||||||||||||||||||||||||||||||||
| Company-obligated mandatorily redeemable preferred securities | 2,698 | 103.1 | 3.82 | 2,904 | 136.6 | 4.70 | ||||||||||||||||||||||||||||||||||||||||||||||||||
| Total interest-bearing liabilities | 129,004 | 2,068.7 | 1.60 | 118,697 | 2,679.6 | 2.26 | Total interest-bearing liabilities | 136,055 | 2,075.2 | 1.53 | 129,004 | 2,068.7 | 1.60 | |||||||||||||||||||||||||||||||||||||||||||
| Other liabilities (d) | Other liabilities (d) | 7,518 | 7,263 | Other liabilities (d) | 6,263 | 7,518 | ||||||||||||||||||||||||||||||||||||||||||||||||||
| Shareholders’ equity | Shareholders’ equity | 19,393 | 17,273 | Shareholders’ equity | 19,459 | 19,393 | ||||||||||||||||||||||||||||||||||||||||||||||||||
| Total liabilities and shareholders’ equity | $ | 187,630 | $ | 171,948 | Total liabilities and shareholders’ equity | $ | 191,593 | $ | 187,630 | |||||||||||||||||||||||||||||||||||||||||||||||
| Net interest income | Net interest income | $ | 7,217.5 | $ | 6,847.2 | Net interest income | $ | 7,139.9 | $ | 7,217.5 | ||||||||||||||||||||||||||||||||||||||||||||||
| Gross interest margin | Gross interest margin | 4.17 | % | 4.20 | % | Gross interest margin | 3.95 | % | 4.17 | % | ||||||||||||||||||||||||||||||||||||||||||||||
| Gross interest margin without taxable-equivalent increments | Gross interest margin without taxable-equivalent increments | 4.15 | 4.18 | Gross interest margin without taxable-equivalent increments | 3.93 | 4.15 | ||||||||||||||||||||||||||||||||||||||||||||||||||
Percent of Earning Assets | Percent of Earning Assets | Percent of Earning Assets | ||||||||||||||||||||||||||||||||||||||||||||||||||||||
| Interest income | Interest income | 5.77 | % | 6.46 | % | Interest income | 5.48 | % | 5.77 | % | ||||||||||||||||||||||||||||||||||||||||||||||
| Interest expense | Interest expense | 1.28 | 1.81 | Interest expense | 1.23 | 1.28 | ||||||||||||||||||||||||||||||||||||||||||||||||||
| Net interest margin | Net interest margin | 4.49 | 4.65 | Net interest margin | 4.25 | % | 4.49 | % | ||||||||||||||||||||||||||||||||||||||||||||||||
| Net interest margin without taxable-equivalent increments | Net interest margin without taxable-equivalent increments | 4.47 | % | 4.63 | % | Net interest margin without taxable-equivalent increments | 4.23 | % | 4.47 | % | ||||||||||||||||||||||||||||||||||||||||||||||
| * | Not meaningful. |
| (a) | Interest and rates are presented on a fully taxable-equivalent basis under a tax rate of 35 percent. |
| (b) | Interest income and rates on loans include loan fees. Nonaccrual loans are included in average loan balances. |
| (c) | Includes approximately $1,427 million, $1,733 million, $1,664 million, and $1,970 million |
| (d) | Includes approximately $1,034 million, $1,524 million, $1,776 million, and $2,072 million |
| 2001 | 2000 | 1999 | 2003 v 2002 | |||||||||||||||||||||||||||||||||||||||
| % Change | ||||||||||||||||||||||||||||||||||||||||||
| Average | Yields | Average | Yields | Average | Yields | Average | ||||||||||||||||||||||||||||||||||||
| Balances | Interest | and Rates | Balances | Interest | and Rates | Balances | Interest | and Rates | Balances | |||||||||||||||||||||||||||||||||
| $ | 20,129 | $ | 1,206.1 | 5.99 | % | $ | 14,567 | $ | 1,008.3 | 6.92 | % | $ | 16,301 | $ | 1,047.1 | 6.42 | % | 31.4% | ||||||||||||||||||||||||
| 1,787 | 128.9 | 7.21 | 2,744 | 203.1 | 7.40 | 2,970 | 220.6 | 7.43 | (35.9 | ) | ||||||||||||||||||||||||||||||||
| 1,911 | 146.9 | 7.69 | 1,303 | 102.1 | 7.84 | 1,450 | 103.9 | 7.17 | 36.8 | |||||||||||||||||||||||||||||||||
| 50,072 | 3,609.3 | 7.21 | 50,062 | 4,222.6 | 8.43 | 43,328 | 3,261.1 | 7.53 | (5.7 | ) | ||||||||||||||||||||||||||||||||
| 26,081 | 2,002.7 | 7.68 | 26,040 | 2,296.9 | 8.82 | 23,076 | 1,922.8 | 8.33 | 5.5 | |||||||||||||||||||||||||||||||||
| 8,576 | 658.2 | 7.67 | 11,207 | 863.7 | 7.71 | 13,890 | 1,056.3 | 7.60 | 39.0 | |||||||||||||||||||||||||||||||||
| 33,448 | 3,158.2 | 9.44 | 31,008 | 3,155.1 | 10.18 | 29,344 | 2,860.8 | 9.75 | 4.6 | |||||||||||||||||||||||||||||||||
| 118,177 | 9,428.4 | 7.98 | 118,317 | 10,538.3 | 8.91 | 109,638 | 9,101.0 | 8.30 | 3.4 | |||||||||||||||||||||||||||||||||
| 1,497 | 90.6 | 6.05 | 1,705 | 115.3 | 6.76 | 2,326 | 132.2 | 5.68 | 6.6 | |||||||||||||||||||||||||||||||||
| 143,501 | 11,000.9 | 7.67 | 138,636 | 11,967.1 | 8.63 | 132,685 | 10,604.8 | 7.99 | 9.1 | |||||||||||||||||||||||||||||||||
| (1,979 | ) | (1,781 | ) | (1,709 | ) | (3.0 | ) | |||||||||||||||||||||||||||||||||||
| 165 | (247 | ) | 54 | (70.7 | ) | |||||||||||||||||||||||||||||||||||||
| 24,257 | 21,873 | 19,137 | 9.4 | |||||||||||||||||||||||||||||||||||||||
| $ | 165,944 | $ | 158,481 | $ | 150,167 | 9.1 | ||||||||||||||||||||||||||||||||||||
| $ | 25,109 | $ | 23,820 | $ | 23,556 | 10.4 | ||||||||||||||||||||||||||||||||||||
| 13,962 | 203.6 | 1.46 | 13,035 | 270.4 | 2.07 | 12,898 | 231.0 | 1.79 | 22.2 | |||||||||||||||||||||||||||||||||
| 24,932 | 711.0 | 2.85 | 22,774 | 1,000.0 | 4.39 | 22,534 | 842.2 | 3.74 | 28.0 | |||||||||||||||||||||||||||||||||
| 4,571 | 42.5 | .93 | 5,027 | 74.0 | 1.47 | 5,961 | 111.9 | 1.88 | 13.9 | |||||||||||||||||||||||||||||||||
| 23,328 | 1,241.4 | 5.32 | 25,861 | 1,458.3 | 5.64 | 26,296 | 1,322.6 | 5.03 | (19.7 | ) | ||||||||||||||||||||||||||||||||
| 13,054 | 629.6 | 4.82 | 12,909 | 816.1 | 6.32 | 8,675 | 462.3 | 5.33 | 8.7 | |||||||||||||||||||||||||||||||||
| 79,847 | 2,828.1 | 3.54 | 79,606 | 3,618.8 | 4.55 | 76,364 | 2,970.0 | 3.89 | 11.0 | |||||||||||||||||||||||||||||||||
| 11,679 | 475.6 | 4.07 | 11,008 | 682.1 | 6.20 | 10,883 | 538.6 | 4.95 | 3.8 | |||||||||||||||||||||||||||||||||
| 24,133 | 1,164.2 | 4.82 | 21,916 | 1,483.1 | 6.77 | 19,873 | 1,109.5 | 5.58 | 5.8 | |||||||||||||||||||||||||||||||||
| 1,955 | 127.8 | 6.54 | 1,400 | 110.7 | 7.91 | 1,400 | 111.0 | 7.93 | (7.1 | ) | ||||||||||||||||||||||||||||||||
| 117,614 | 4,595.7 | 3.91 | 113,930 | 5,894.7 | 5.17 | 108,520 | 4,729.1 | 4.36 | 8.7 | |||||||||||||||||||||||||||||||||
| 6,795 | 6,232 | 4,818 | 3.5 | |||||||||||||||||||||||||||||||||||||||
| 16,426 | 14,499 | 13,273 | 12.3 | |||||||||||||||||||||||||||||||||||||||
| $ | 165,944 | $ | 158,481 | $ | 150,167 | 9.1% | ||||||||||||||||||||||||||||||||||||
| $ | 6,405.2 | $ | 6,072.4 | $ | 5,875.7 | |||||||||||||||||||||||||||||||||||||
| 3.76 | % | 3.46 | % | 3.63 | % | |||||||||||||||||||||||||||||||||||||
| 3.72 | 3.40 | 3.56 | ||||||||||||||||||||||||||||||||||||||||
| 7.67 | % | 8.63 | % | 7.99 | % | |||||||||||||||||||||||||||||||||||||
| 3.21 | 4.25 | 3.56 | ||||||||||||||||||||||||||||||||||||||||
| 4.46 | 4.38 | 4.43 | ||||||||||||||||||||||||||||||||||||||||
| 4.43 | % | 4.32 | % | 4.36 | % | |||||||||||||||||||||||||||||||||||||
| 2002 | 2001 | 2000 | 2004 v 2003 | |||||||||||||||||||||||||||||||||||||||
| % Change | ||||||||||||||||||||||||||||||||||||||||||
| Average | Yields | Average | Yields | Average | Yields | Average | ||||||||||||||||||||||||||||||||||||
| Balances | Interest | and Rates | Balances | Interest | and Rates | Balances | Interest | and Rates | Balances | |||||||||||||||||||||||||||||||||
| $ | 28,829 | $ | 1,503.5 | 5.22 | % | $ | 21,916 | $ | 1,335.0 | 6.09 | % | $ | 17,311 | $ | 1,211.4 | 7.00 | % | 15.5% | ||||||||||||||||||||||||
| 2,644 | 170.6 | 6.45 | 1,911 | 146.9 | 7.69 | 1,303 | 102.1 | 7.84 | (55.5 | ) | ||||||||||||||||||||||||||||||||
| 43,817 | 2,622.2 | 5.98 | 50,072 | 3,609.3 | 7.21 | 50,062 | 4,222.6 | 8.43 | (4.8 | ) | ||||||||||||||||||||||||||||||||
| 25,723 | 1,636.3 | 6.36 | 26,081 | 2,002.7 | 7.68 | 26,040 | 2,296.9 | 8.82 | .5 | |||||||||||||||||||||||||||||||||
| 8,412 | 595.3 | 7.08 | 8,576 | 658.2 | 7.67 | 11,207 | 863.7 | 7.71 | 22.5 | |||||||||||||||||||||||||||||||||
| 36,501 | 2,902.8 | 7.95 | 33,448 | 3,158.2 | 9.44 | 31,008 | 3,155.1 | 10.18 | 7.9 | |||||||||||||||||||||||||||||||||
| 114,453 | 7,756.6 | 6.78 | 118,177 | 9,428.4 | 7.98 | 118,317 | 10,538.3 | 8.91 | 3.2 | |||||||||||||||||||||||||||||||||
| 1,484 | 96.1 | 6.48 | 1,497 | 90.6 | 6.05 | 1,705 | 115.3 | 6.76 | (13.7 | ) | ||||||||||||||||||||||||||||||||
| 147,410 | 9,526.8 | 6.46 | 143,501 | 11,000.9 | 7.67 | 138,636 | 11,967.1 | 8.63 | 4.5 | |||||||||||||||||||||||||||||||||
| (2,542 | ) | (1,979 | ) | (1,781 | ) | (6.6 | ) | |||||||||||||||||||||||||||||||||||
| 409 | 165 | (247 | ) | * | ||||||||||||||||||||||||||||||||||||||
| 26,671 | 24,257 | 21,873 | (10.5 | ) | ||||||||||||||||||||||||||||||||||||||
| $ | 171,948 | $ | 165,944 | $ | 158,481 | 2.1 | ||||||||||||||||||||||||||||||||||||
| $ | 28,715 | $ | 25,109 | $ | 23,820 | (6.0 | ) | |||||||||||||||||||||||||||||||||||
| 15,631 | 102.3 | .65 | 13,962 | 203.6 | 1.46 | 13,035 | 270.4 | 2.07 | 9.6 | |||||||||||||||||||||||||||||||||
| 25,237 | 312.8 | 1.24 | 24,932 | 711.0 | 2.85 | 22,774 | 1,000.0 | 4.39 | 1.7 | |||||||||||||||||||||||||||||||||
| 4,928 | 25.1 | .51 | 4,571 | 42.5 | .93 | 5,027 | 74.0 | 1.47 | 4.5 | |||||||||||||||||||||||||||||||||
| 19,283 | 743.4 | 3.86 | 23,328 | 1,241.4 | 5.32 | 25,861 | 1,458.3 | 5.64 | (15.6 | ) | ||||||||||||||||||||||||||||||||
| 11,330 | 301.7 | 2.66 | 13,054 | 629.6 | 4.82 | 12,909 | 816.1 | 6.32 | 11.0 | |||||||||||||||||||||||||||||||||
| 76,409 | 1,485.3 | 1.94 | 79,847 | 2,828.1 | 3.54 | 79,606 | 3,618.8 | 4.55 | 1.8 | |||||||||||||||||||||||||||||||||
| 10,116 | 222.9 | 2.20 | 11,679 | 475.6 | 4.07 | 11,008 | 682.1 | 6.20 | 38.4 | |||||||||||||||||||||||||||||||||
| 32,172 | 971.4 | 3.02 | 26,088 | 1,292.0 | 4.95 | 23,316 | 1,593.8 | 6.84 | 4.3 | |||||||||||||||||||||||||||||||||
| 118,697 | 2,679.6 | 2.26 | 117,614 | 4,595.7 | 3.91 | 113,930 | 5,894.7 | 5.17 | 5.5 | |||||||||||||||||||||||||||||||||
| 7,263 | 6,795 | 6,232 | (16.7 | ) | ||||||||||||||||||||||||||||||||||||||
| 17,273 | 16,426 | 14,499 | .3 | |||||||||||||||||||||||||||||||||||||||
| $ | 171,948 | $ | 165,944 | $ | 158,481 | 2.1 | % | |||||||||||||||||||||||||||||||||||
| $ | 6,847.2 | $ | 6,405.2 | $ | 6,072.4 | |||||||||||||||||||||||||||||||||||||
| 4.20 | % | 3.76 | % | 3.46 | % | |||||||||||||||||||||||||||||||||||||
| 4.18 | 3.72 | 3.40 | ||||||||||||||||||||||||||||||||||||||||
| 6.46 | % | 7.67 | % | 8.63 | % | |||||||||||||||||||||||||||||||||||||
| 1.81 | 3.21 | 4.25 | ||||||||||||||||||||||||||||||||||||||||
| 4.65 | % | 4.46 | % | 4.38 | % | |||||||||||||||||||||||||||||||||||||
| 4.63 | % | 4.43 | % | 4.32 | % | |||||||||||||||||||||||||||||||||||||
Securities and Exchange Commission
Washington, D.C. 20549
Annual Report pursuant to Section 13 or 15(d) of the Securities Exchange Act of 1934 for the fiscal year ended December 31, 20032004
Commission File Number 1-6880
U.S. Bancorp
Incorporated in the State of Delaware
IRS Employer Identification #41-0255900
Address: 800 Nicollet Mall
Minneapolis, Minnesota 55402-7014
Telephone: (651) 466-3000
Securities registered pursuant to Section 12(b) of the Act (and listed on the New York Stock Exchange): Common Stock, par value $.01.
| Index | Page | ||||
Part I | |||||
Item 1 | Business | ||||
| General Business Description | 20-21, | ||||
| Line of Business Financial Performance | |||||
| Website Access to SEC Reports | |||||
Item 2 | Properties | ||||
Item 3 | Legal Proceedings | none | |||
Item 4 | Submission of Matters to a Vote of Security Holders | none | |||
Part II | |||||
Item 5 | Market | 3, 51-52, | |||
Item 6 | Selected Financial Data | 19 | |||
Item 7 | Management’s Discussion and Analysis of Financial Condition and Results of Operations | ||||
Item 7A | Quantitative and Qualitative Disclosures About Market Risk | ||||
Item 8 | Financial Statements and Supplementary Data | ||||
Item 9 | Changes in and Disagreements with Accountants on Accounting and Financial Disclosure | ||||
Item 9A | |||||
Item 9B | Other Information | none | |||
Part III | |||||
Item 10 | Directors and Executive Officers of the Registrant | ||||
Item 11 | Executive Compensation | * | |||
Item 12 | Security Ownership of Certain Beneficial Owners and Management and Related Stockholder Matters | ||||
Item 13 | Certain Relationships and Related Transactions | * | |||
Item 14 | Principal Accountant Fees and Services | * | |||
Part IV | |||||
Item 15 | Exhibits and Financial Statement Schedules | ||||
Signatures | |||||
Certifications | |||||
| * | U.S. Bancorp’s definitive proxy statement for the |
General Business Description U.S. Bancorp is a multi-state financial services holding company headquartered in Minneapolis, Minnesota. U.S. Bancorp was incorporated in Delaware in 1929 and operates as a financial holding company and a bank holding company under the Bank Holding Company Act of 1956. U.S. Bancorp provides a full range of financial services, including lending and depository services, cash management, foreign exchange and trust and investment management services. It also engages in credit card services, merchant and automated teller machine (“ATM”) processing, mortgage banking, insurance, brokerage, leasing and investment banking.
Competition.CompetitionThe commercial banking business is highly competitive. Subsidiary banks compete with other commercial banks and with other financial institutions, including savings and loan associations, mutual savings banks, finance companies, mortgage banking companies, credit unions and investment companies. In recent years, competition has increased from institutions not subject to the same regulatory restrictions as domestic banks and bank holding companies.
Government PoliciesThe operations of the Company’s various operating units are affected by state and federal legislative changes and by policies of various regulatory authorities, including those of the numerous states in which they operate, the United States and foreign governments. These policies include, for example, statutory maximum legal lending rates, domestic monetary policies of the Board of Governors of the Federal Reserve System, United States fiscal policy, international currency regulations and monetary policies, U.S. Patriot Act and capital adequacy and liquidity constraints imposed by bank regulatory agencies.
Supervision and RegulationAs a registered bank holding company and financial holding company under the Bank Holding Company Act, U.S. Bancorp is subject to the supervision of, and regulation by, the Board of Governors of the Federal Reserve System.
PropertiesU.S. Bancorp and its significant subsidiaries occupy headquarter offices under a long-term lease in Minneapolis, Minnesota. The Company also leases eight freestanding operations centers in St. Paul, Portland, Milwaukee and Denver. The Company owns six principal operations centers in Cincinnati, St. Louis, Fargo, Milwaukee and St. Paul. At December 31, 2003,2004, the Company’s subsidiaries owned and operated a total of 1,4491,484 facilities and leased an additional 1,3611,462 facilities, all of which are well maintained. The Company believes its current facilities are adequate to meet its needs. Additional information with respect to premises and equipment is presented in Notes 1011 and 2324 of the Notes to Consolidated Financial Statements.
Equity Compensation Plan InformationThe following table summarizes information regarding equity compensation plans in effect as of December 31, 2003.2004.
| Number of securities remaining | Number of securities remaining | |||||||||||||||||||||||||
| Number of securities to be issued | Weighted-average exercise | available for future issuance under | Number of securities to be issued | Weighted-average exercise | available for future issuance under | |||||||||||||||||||||
| upon exercise of outstanding options, | price of outstanding options, | equity compensation plans (excluding | upon exercise of outstanding options, | price of outstanding options, | equity compensation plans (excluding | |||||||||||||||||||||
| Plan Category | Plan Category | warrants and rights | warrants and rights | securities reflected in the first column) (a) | Plan Category | warrants and rights | warrants and rights | securities reflected in the first column) (a) | ||||||||||||||||||
| Equity compensation plans approved by security holders (b) | Equity compensation plans approved by security holders (b) | 91,603,009 | $20.63 | 41,825,251 | Equity compensation plans approved by security holders (b) | 83,464,408 | $21.83 | 35,154,782 | ||||||||||||||||||
| Equity compensation plans not approved by security holders | Equity compensation plans not approved by security holders | 12,259,923 | $22.45 | — | Equity compensation plans not approved by security holders | 11,777,683 | $22.62 | — | ||||||||||||||||||
| Total | 103,862,932 | $20.72 | 41,825,251 | Total | 95,242,091 | $21.90 | 35,154,782 | |||||||||||||||||||
| (a) | No shares are available for the granting of future awards under the U.S. Bancorp 1998 Executive Stock Incentive Plan or the U.S. Bancorp 1991 Executive Stock Incentive plan. The |
| (b) | Includes shares underlying stock options and restricted stock units (convertible into shares of the Company’s common stock on a one-for-one basis) under the U.S. Bancorp 2001 Stock Incentive Plan, the U.S. Bancorp 1998 Executive Stock Incentive Plan and the U.S. Bancorp 1991 Executive Stock Incentive Plan. Excludes |
| (c) | Includes 3,585,410 shares of common stock issuable pursuant to the U.S. Bancorp Deferred Compensation Plan. All of the remaining identified shares underlie stock options granted to a broad-based employee population pursuant to the U.S. Bancorp 2001 Employee Stock Incentive plan, the Firstar Corporation 1999 Employee Stock Incentive Plan, the Firstar Corporation 1998 Employee Stock Incentive Plan and the Star Banc Corporation 1996 Starshare Stock Incentive Plan for Employees. |
| (d) | The weighted-average exercise price does not include any assumed price at issuance of shares that may be issuable pursuant to the Deferred Compensation Plan. |
The U.S. Bancorp Deferred Compensation Plan allows non-employee directors and members of our senior management, including all of our executive officers, to defer all or part of their compensation until retirement or earlier termination of employment. The deferred compensation is deemed to be invested in one of several investment alternatives at the option of the participant, including shares of U.S. Bancorp common stock. Deferred compensation deemed to be invested in U.S. Bancorp stock may be received at the time of distribution at the election of the participant, in the form of shares of U.S. Bancorp common stock. The 3,585,410 shares included in the table assumes that participants in the plan whose deferred compensation had been deemed to be invested in U.S. Bancorp common stock had elected to receive all of that deferred compensation in shares of U.S. Bancorp common stock on December 31, 2004.
Change in Certifying AccountantsIn response to the Sarbanes-Oxley Act of 2002, the Audit Committee determined on November 8, 2002, to segregate the internal and external auditing functions performed for U.S. Bancorp by PricewaterhouseCoopers LLP and appointed Ernst & Young LLP to become the Company’s external auditors following the filing of the Company’s 2002 Annual Report on Form 10-K during the first quarter of 2003.
Website Access to SEC ReportsU.S. Bancorp’s internet website can be found at usbank.com. U.S. Bancorp makes available free of charge on its website its annual reports on Form 10-K, quarterly reports on Form 10-Q, current reports on Form 8-K, and amendments to those reports filed or furnished pursuant to Section 13 or 15(d) of the Exchange Act, as well as all other reports filed by U.S. Bancorp with the SEC, as soon as reasonably practicable after electronically filed with, or furnished to, the SEC.
CertificationsWe have filed as exhibits to this annual report on Form 10-K the Chief Executive Officer and Chief Financial Officer certifications required by Section 302 of the Sarbanes-Oxley Act. We have also submitted the required annual Chief Executive Officer certification to the New York Stock Exchange.
Governance DocumentsOur Corporate Governance Guidelines, Code of Ethics and Business Conduct and Board of Directors committee charters are available free of charge on our web site at usbank.com, by clicking on “About U.S. Bancorp,” then “Investor/ Shareholder Information.“Corporate Governance.” Shareholders may request a free printed copy of any of these documents from our investor relations department by contacting them atCorporaterelations@usbank.cominvestorrelations@usbank.com or calling (612) 303-0799.(866) 775-9668.
Exhibits
| Financial Statements Filed | Page | ||
| U.S. Bancorp and Subsidiaries Consolidated Financial Statements | |||
| Notes to Consolidated Financial Statements | |||
| Reports of Independent Auditors and Accountants | 105 | ||
Schedules to the consolidated financial statements required by Regulation S-X are omitted since the required information is included in the footnotes or is not applicable.
| (1)3.1 | Restated Certificate of Incorporation, as amended. Filed as Exhibit 3.1 to Form 10-K for the year ended December 31, 2000. | |||
| (1)3.2 | Restated bylaws, as amended. Filed as Exhibit 3.2 to Form 10-K for the year ended December 31, 2001. | |||
| 4.1 | [Pursuant to Item 601(b)(4)(iii)(A) of Regulation S-K, copies of instruments defining the rights of holders of long-term debt are not filed. U.S. Bancorp agrees to furnish a copy thereof to the Securities and Exchange Commission upon request.] | |||
| (1)4.2 | Warrant Agreement, dated as of October 2, 1995, between U.S. Bancorp and First Chicago Trust Company of New York, as Warrant Agent and Form of Warrant. Filed as Exhibits 4.18 and 4.19 to Registration Statement on Form S-3, File No. 33-61667. | |||
| (1)4.3 | Amended and Restated Rights Agreement, dated as of December 31, 2002, between U.S. Bancorp and Mellon Investor Services LLC. Filed as Exhibit 4.2 to Amendment No. 1 to Registration Statement on Form 8-A (File No. 001-06880) on December 31, 2002. | |||
| (1)(2)10.1 | U.S. Bancorp 2001 Stock Incentive Plan. Filed as Exhibit 10.1 to Form 10-K for the year ended December 31, 2001. | |||
| (1)(2)10.2 | Amendment No. 1 to U.S. Bancorp 2001 Stock Incentive Plan. Filed as Exhibit 10.2 to Form 10-K for the year ended December 31, 2002. | |||
| (1)(2)10.3 | U.S. Bancorp 1998 Executive Stock Incentive Plan. Filed as Exhibit 10.3 to Form 10-K for the year ended December 31, 2002. | |||
| (1)(2)10.4 | Summary of U.S. Bancorp 1991 Executive Stock Incentive Plan. Filed as Exhibit 10.4 to Form 10-K for the year ended December 31, 2002. | |||
| (1)(2)10.5 | U.S. Bancorp 2001 Employee Stock Incentive Plan. Filed as Exhibit 10.5 to Form 10-K for the year ended December 31, 2002. | |||
| (1)(2)10.6 | Firstar Corporation 1999 Employee Stock Incentive Plan. Filed as Exhibit 10.6 to Form 10-K for the year ended December 31, 2002. | |||
| (1)(2)10.7 | Firstar Corporation 1998 Employee Stock Incentive Plan. Filed as Exhibit 10.7 to Form 10-K for the year ended December 31, 2002. | |||
| (1)(2)10.8 | Star Banc Corporation 1996 Starshare Stock Incentive Plan for Employees. Filed as Exhibit 10.8 to Form 10-K for the year ended December 31, 2002. | |||
| (1)(2)10.9 | U.S. Bancorp Executive Incentive Plan. Filed as Exhibit 10.2 to Form 10-K for the year ended December 31, 2001. | |||
| (1)(2)10.10 | U.S. Bancorp Executive Deferral Plan, as amended. Filed as Exhibit 10.7 to Form 10-K for the year ended December 31, 1999. | |||
| (1)(2)10.11 | Summary of Nonqualified Supplemental Executive Retirement Plan, as amended, of the former U.S. Bancorp. Filed as Exhibit 10.4 to Form 10-K for the year ended December 31, 2001. | |||
| (1)(2)10.12 | 1991 Performance and Equity Incentive Plan of the former U.S. Bancorp. Filed as Exhibit 10.13 to Form 10-K for the year ended December 31, 1997. | |||
| (1)(2)10.13 | Form of Director Indemnification Agreement entered into with former directors of the former U.S. Bancorp. Filed as Exhibit 10.15 to Form 10-K for the year ended December 31, 1997. | |||
| (1)(2)10.14 | U.S. Bancorp Independent Director Retirement and Death Benefit Plan, as amended. Filed as Exhibit 10.17 to Form 10-K for the year ended December 31, 1999. | |||
| (1)(2)10.15 | U.S. Bancorp Deferred Compensation Plan for Directors, as amended. Filed as Exhibit 10.18 to Form 10-K for the year ended December 31, 1999. | |||
| (1)(2)10.16 | U.S. Bancorp Non Qualified Executive Retirement Plan. Filed as Exhibit 10.16 to Form 10-K for the year ended December 31, 2002. | |||
| (1)(2)10.17 | Amendments No. 1, 2 and 3 to U.S. Bancorp Non-Qualified Executive Retirement Plan. Filed as Exhibit 10.17 to Form 10-K for the year ended December 31, 2003. | |||
| (1)(2)10.18 | Amendment No. 4 to U.S. Bancorp Non-Qualified Executive Retirement Plan. Filed as Exhibit 10.1 to Form 8-K filed on December 23, 2004. | |||||||
| (1)(2)10.19 | U.S. Bancorp Executive Employees Deferred Compensation Plan. | |||||||
| (1)(2)10.20 | U.S. Bancorp Outside Directors Deferred Compensation Plan. Filed as Exhibit 10.19 to Form 10-K for the year ended December 31, 2003. | |||||||
| (1)(2)10.21 | Form of Change in Control Agreement, effective November 16, 2001, between U.S. Bancorp and certain executive officers of U.S. Bancorp. Filed as Exhibit 10.12 to Form 10-K for the year ended December 31, 2001. | |||||||
| (1)(2) | Form of Executive Officer Stock Option Agreement with cliff and performance vesting under U.S. Bancorp 2001 Stock Incentive Plan. Filed as Exhibit 10.1 to Form 10-Q for the quarterly period ended September 30, 2004. | |||||||
| (1)(2)10.23 | Form of Executive Officer Stock Option Agreement with annual vesting under U.S. Bancorp 2001 Stock Incentive Plan. Filed as Exhibit 10.2 to Form 10-Q for the quarterly period ended September 30, 2004. | |||||||
| (1)(2)10.24 | Form of Executive Officer Restricted Stock Award Agreement under U.S. Bancorp 2001 Stock Incentive Plan. Filed as Exhibit 10.3 to Form 10-Q for the quarterly period ended September 30, 2004. | |||||||
| (1)(2)10.25 | Form of Director Stock Option Agreement under U.S. Bancorp 2001 Stock Incentive Plan. Filed as Exhibit 10.4 to Form 10-Q for the quarterly period ended September 30, 2004. | |||||||
| (1)(2)10.26 | Form of Director Restricted Stock Unit Agreement under U.S. Bancorp 2001 Stock Incentive Plan. Filed as Exhibit 10.5 to Form 10-Q for the quarterly period ended September 30, 2004. | |||||||
| (1)(2)10.27 | Form of Executive Officer Restricted Stock Unit Agreement under U.S. Bancorp 2001 Stock Incentive Plan. Filed as Exhibit 10.6 to Form 10-Q for the quarterly period ended September 30, 2004. | |||||||
| (1)(2)10.28 | Employment Agreement with Jerry A. Grundhofer. Filed as Exhibit 10.13 to Form 10-K for the year ended December 31, 2001. | |||
| (1)(2) | Amendment of Employment Agreement with Jerry A. Grundhofer. Filed as Exhibit 10.1 to Form 10-Q for the quarterly period ended June 30, 2004. | |||
| (1)(2)10.30 | Amendment No. 2 of Employment Agreement with Jerry A. Grundhofer. Filed as Exhibit 10.8 to Form 10-Q for the quarterly period ended September 30, 2004. | |||
| (1)(2)10.31 | Restricted Stock Unit Award Agreement with Jerry A. Grundhofer dated January 2, 2002. Filed as Exhibit 10.7 to Form 10-Q for the quarterly period ended September 30, 2004. | |||
| (1)(2)10.32 | Employment Agreement with Edward Grzedzinski. Filed as Exhibit 10.22 to Form 10-K for the year ended December 31, 2002. | |||
| (2)10.33 | Information Regarding the 2005 Compensation of the Non-Employee Members of the Board of Directors of U.S. Bancorp. | |||
| 12 | Statement re: Computation of Ratio of Earnings to Fixed Charges. | |||
| 21 | Subsidiaries of the Registrant. | |||
| 23.1 | Consent of Ernst & Young LLP. | |||
| 23.2 | Consent of PricewaterhouseCoopers LLP. | |||
| 31.1 | Certification of Chief Executive Officer pursuant to Rule 13a-14(a) under the Securities Exchange Act of 1934. | |||
| 31.2 | Certification of Chief Financial Officer pursuant to Rule 13a-14(a) under the Securities Exchange Act of 1934. | |||
| 32 | Certification of Chief Executive Officer and Chief Financial Officer pursuant to 18 U.S.C. section 1350 as adopted pursuant to section 906 of the Sarbanes-Oxley Act of 2002. | |||
| (1) | Exhibit has previously been filed with the Securities and Exchange Commission and is incorporated herein as an exhibit by reference to the prior filing. |
| (2) | Management contracts or compensatory plans or arrangements. |
Pursuant to the requirements of Section 13 or 15(d) of the Securities Exchange Act of 1934, the registrant has duly caused this report to be signed on February 27, 2004,28, 2005, on its behalf by the undersigned, thereunto duly authorized.
U.S. Bancorp
Pursuant to the requirements of the Securities Exchange Act of 1934, this report has been signed below on February 27, 2004,28, 2005, by the following persons on behalf of the registrant and in the capacities indicated.
Jerry A. GrundhoferChairman President and Chief Executive Officer
(principal executive officer)
David M. MoffettVice Chairman and Chief Financial Officer
(principal financial officer)
Terrance R. DolanExecutive Vice President and Controller
(principal accounting officer)
Linda L. AhlersDirector
Victoria Buyniski GluckmanDirector
Arthur D. Collins, Jr.Director
Peter H. CoorsDirectorJohn C. DannemillerDirectorJohn F. GrundhoferDirectorDelbert W. JohnsonDirector
Joel W. JohnsonDirector
Jerry W. LevinDirector
David B. O’MaleyDirector
O’dell M. Owens, M.D., M.P.H.Director
Thomas E. PetryDirector
Richard G. ReitenDirector
Craig D. SchnuckDirector
Warren R. StaleyDirector
Patrick T. StokesDirector
John J. StollenwerkDirector 120 118 U.S. BancorpBANCORP
EXHIBIT 31.1
CERTIFICATION PURSUANT TO
I, Jerry A. Grundhofer, Chief Executive Officer of U.S. Bancorp, a Delaware corporation, certify that:
| (1) | I have reviewed this |
| (2) | Based on my knowledge, this report does not contain any untrue statement of a material fact or omit to state a material fact necessary to make the statements made, in light of the circumstances under which such statements were made, not misleading with respect to the period covered by this report; |
| (3) | Based on my knowledge, the financial statements, and other financial information included in this report, fairly present in all material respects the financial condition, results of operations and cash flows of the registrant as of, and for, the periods presented in this report; |
| (4) | The registrant’s other certifying officers and I are responsible for establishing and maintaining disclosure controls and procedures (as defined in Exchange Act Rules 13a-15(e) and 15d-15(e)) and internal control over financial reporting (as defined in Exchange Act Rules 13a-15(f) and 15d-15(f)) for the registrant and have: |
| (a) | designed such disclosure controls and procedures, or caused such disclosure controls and procedures to be designed under our supervision, to ensure that material information relating to the registrant, including its consolidated subsidiaries, is made known to us by others within those entities, particularly during the period in which this report is being prepared; |
| (b) | designed such internal control over financial reporting, or caused such internal control over financial reporting to be designed under our supervision, to provide reasonable assurance regarding the reliability of financial reporting and the preparation of financial statements for external purposes in accordance with generally accepted accounting principles; |
| (c) | evaluated the effectiveness of the registrant’s disclosure controls and procedures and presented in this report our conclusions about the effectiveness of the disclosure controls and procedures, as of the end of the period covered by this report based on such evaluation; and |
| disclosed in this report any change in the registrant’s internal control over financial reporting that occurred during the registrant’s most recent fiscal quarter (the registrant’s fourth fiscal quarter in the case of an annual report) that has materially affected, or is reasonably likely to materially affect, the registrant’s internal control over financial reporting; and |
| (5) | The registrant’s other certifying officers and I have disclosed, based on our most recent evaluation of internal control over financial reporting, to the registrant’s auditors and the audit committee of the registrant’s board of directors (or persons |
| (a) | all significant deficiencies and material weaknesses in the design or operation of internal control over financial reporting which are reasonably likely to adversely affect the registrant’s ability to record, process, summarize and report financial information; and |
| (b) | any fraud, whether or not material, that involves management or other employees who have a significant role in the registrant’s internal control over financial reporting. |
| /s/ JERRY A. GRUNDHOFER | |
| Jerry A. Grundhofer | |
Dated: February 27, 200428, 2005
EXHIBIT 31.2
CERTIFICATION PURSUANT TO
I, David M. Moffett, Chief Financial Officer of U.S. Bancorp, a Delaware corporation, certify that:
| (1) | I have reviewed this |
| (2) | Based on my knowledge, this report does not contain any untrue statement of a material fact or omit to state a material fact necessary to make the statements made, in light of the circumstances under which such statements were made, not misleading with respect to the period covered by this report; |
| (3) | Based on my knowledge, the financial statements, and other financial information included in this report, fairly present in all material respects the financial condition, results of operations and cash flows of the registrant as of, and for, the periods presented in this report; |
| (4) | The registrant’s other certifying officers and I are responsible for establishing and maintaining disclosure controls and procedures (as defined in Exchange Act Rules 13a-15(e) and 15d-15(e)) and internal control over financial reporting (as defined in Exchange Act Rules 13a-15(f) and 15d-15(f)) for the registrant and have: |
| (a) | designed such disclosure controls and procedures, or caused such disclosure controls and procedures to be designed under our supervision, to ensure that material information relating to the registrant, including its consolidated subsidiaries, is made known to us by others within those entities, particularly during the period in which this report is being prepared; |
| (b) | designed such internal control over financial reporting, or caused such internal control over financial reporting to be designed under our supervision, to provide reasonable assurance regarding the reliability of financial reporting and the preparation of financial statements for external purposes in accordance with generally accepted accounting principles; |
| (c) | evaluated the effectiveness of the registrant’s disclosure controls and procedures and presented in this report our conclusions about the effectiveness of the disclosure controls and procedures, as of the end of the period covered by this report based on such evaluation; and |
| disclosed in this report any change in the registrant’s internal control over financial reporting that occurred during the registrant’s most recent fiscal quarter (the registrant’s fourth fiscal quarter in the case of an annual report) that has materially affected, or is reasonably likely to materially affect, the registrant’s internal control over financial reporting; and |
| (5) | The registrant’s other certifying officers and I have disclosed, based on our most recent evaluation of internal control over financial reporting, to the registrant’s auditors and the audit committee of the registrant’s board of directors (or persons |
| (a) | all significant deficiencies and material weaknesses in the design or operation of internal control over financial reporting which are reasonably likely to adversely affect the registrant’s ability to record, process, summarize and report financial information; and |
| (b) | any fraud, whether or not material, that involves management or other employees who have a significant role in the registrant’s internal control over financial reporting. |
| /s/ DAVID M. MOFFETT | |
| David M. Moffett | |
| Chief Financial Officer |
Dated: February 27, 200428, 2005
EXHIBIT 32
CERTIFICATION PURSUANT TO
| (1) | The Annual Report on Form 10-K for the fiscal year ended December 31, | |
| (2) | The information contained in the Form 10-K fairly presents, in all material respects, the financial condition and results of operations of the Company. |
| /s/ JERRY A. GRUNDHOFER | /s/ DAVID M. MOFFETT | |
| Jerry A. Grundhofer Chief Executive Officer | David M. Moffett Chief Financial Officer |
Dated: February 27, 200428, 2005
Jerry A. Grundhofer
Jennie P. Carlson
Andrew Cecere
William L. Chenevich
Richard K. Davis
Michael J. Doyle
Edward Grzedzinski
Joseph E. Hasten
Richard J. Hidy
Pamela A. Joseph
Lee R. Mitau
David M. Moffett
Jerry A. Grundhofer1,6
Linda L. Ahlers1,2,3
Victoria Buyniski Gluckman3,44,6
Arthur D. Collins, Jr.1,5,6
Peter H. Coors2,4
John C. Dannemiller4,5Retired ChairmanApplied Industrial TechnologiesCleveland, Ohio
John F. Grundhofer1,6Chairman EmeritusU.S. Bancorp
Delbert W. Johnson1,3,6Vice PresidentSafeguard Scientifics, Inc.Wayne, Pennsylvania
Joel W. Johnson4,5
Jerry W. Levin5,6
David B. O’Maley1,2,5
O’dell M. Owens, M.D., M.P.H.4,6
Thomas E. Petry1,2,31,2,5
Richard G. Reiten1,3,6
Craig D. Schnuck3,4
Warren R. Staley1,3,6
Patrick T. Stokes1,2,5
John J. Stollenwerk2,3
| 1. | Executive Committee |
| 2. | Compensation Committee |
| 3. | Audit Committee |
| 4. | Community Outreach and Fair Lending Committee |
| 5. | Governance Committee |
| 6. | Credit and Finance Committee |
| CORPORATE INFORMATION |  |
c o r p o r a t ei n f o r m a t i o n
Executive Offices
Common Stock Transfer Agent and Registrar
Mellon Investor Services
P.O. Box 3315
South Hackensack, NJ 07606-1915
Phone: 888-778-1311 or 201-329-8660
Internet: melloninvestor.com
For Registered or Certified Mail:
Mellon Investor Services
85 Challenger Road
Ridgefield Park, NJ 07660-2104
Telephone representatives are available weekdays from 8:00 a.m. to 6:00 p.m. Central Time, and automated support is available 24 hours a day, 7 days a week. Specific information about your account is available on Mellon’s Internetinternet site by clicking on For Investors and then the Investor ServiceDirect®ServiceDirect® link.
Independent AuditorsAuditor
Common Stock Listing and Trading
Dividends and Reinvestment Plan
Investor Relations Contacts
| Howell D. McCullough | Judith T. Murphy | |||
| Senior Vice President, | Vice President, | |||
| Investor Relations | Investor Relations | |||
| howell.mccullough@usbank.com | judith.murphy@usbank.com | |||
| Phone: 612-303-0786 | Phone: | 612-303-0783 or | ||
| | 866-775-9668 | |||

Financial Information
Web site.Website.For information about U.S. Bancorp, including news, financial results, annual reports and other documents filed with the Securities and Exchange Commission, access our home page on the Internet siteinternet at usbank.com, and click on About U.S. Bancorp, then Investor/Shareholder Information.
Mail.At your request, we will mail to you our quarterly earnings, news releases, quarterly financial data reported on Form 10-Q and additional copies of our annual reports.
U.S. Bancorp Investor Relations
800 Nicollet Mall
Minneapolis, MN 55402corporaterelations@usbank.cominvestorrelations@usbank.com
Phone: 612-303-0799 or 866-775-9668
Media Requests
Privacy
Code of Ethics
Diversity
Equal Employment Opportunity/
Affirmative Action
U.S. Bancorp, including each of our subsidiaries, is an Equal Opportunity Employer committed to creating a diverse workforce.


|  |

U.S. Bancorp
800 Nicollet Mall
Minneapolis, MN 55402
usbank.com
usbank.com

