UNITED STATES SECURITIES AND EXCHANGE COMMISSION
Washington, D.C. 20549
| x | | |
þ
| | ANNUAL REPORT PURSUANT TO SECTION 13 OR 15(d) OF THE SECURITIES EXCHANGE ACT OF 1934. |
For the fiscal year ended December 31, 2008
| ¨ | | For the fiscal year ended December 31, 2006 |
o
| | TRANSITION REPORT PURSUANT TO SECTION 13 OR 15(d) OF THE SECURITIES EXCHANGE ACT OF 1934. |
| | For the transition period from to |
For the transition period from to
Commission file number000-50350
(Exact name of registrant as specified in its charter)
| | |
| Delaware | | 77-0419172 |
Delaware | | 77-0419172 |
(State or other jurisdiction of
incorporation or organization) | | (I.R.S. Employer
Identification No.) |
| | |
350 East Plumeria Drive, San Jose, California | | 95134 |
4500 Great America Parkway,
Santa Clara, California
(Address of principal executive offices) | | 95054
(Zip Code) |
(Registrant’s telephone number, including area code)
Securities registered pursuant to Section 12(b) of the Act:
Common Stock, par value $0.001
| | |
Title of each class | | Name of each exchange on which registered |
| Common Stock, par value $0.001 | | The NASDAQ Stock Market LLC |
| | (NASDAQ Global Select Market) |
Securities registered pursuant to 12(g) of the Act:
None
Indicate by check mark if the registrant is a well-known seasoned issuer, as defined in Rule 405 of the Securities Act. Yes o¨ No þx
Indicate by check mark if the registrant is not required to file reports pursuant to Section 13 or Section 15(d) of the Act. Yes o¨ No þx
Indicate by check mark whether the registrant (1) has filed all reports required to be filed by Section 13 or 15(d) of the Securities Exchange Act of 1934 during the preceding 12 months (or for such shorter period that the registrant was required to file such reports), and (2) has been subject to such filing requirements for the past 90 days. Yes þx Noo¨
Indicate by check mark if disclosure of delinquent filers pursuant to Item 405 ofRegulation S-K is not contained herein, and will not be contained, to the best of Registrant’s knowledge, in definitive proxy or information statements incorporated by reference in Part III of thisForm 10-K or any amendment to thisForm 10-K. xþ
Indicate by check mark whether the registrant is a large accelerated filer, an accelerated filer, or a non-accelerated filer, (as definedor a smaller reporting company. See definitions of “large accelerated filer,” “accelerated filer” and “smaller reporting company” inRule 12b-2 of the Act).
Exchange Act. (Check one): | | | | | | |
| Large accelerated filer ¨ | | Accelerated filer x | | Non-accelerated filer ¨ | | Smaller reporting company ¨ |
þ Accelerated filer o Non-accelerated filer o
Indicate by check mark whether the registrant is a shell company (as defined inRule 12b-2 of the Act.) Yes o¨ No þx
The aggregate market value of the voting and non-voting common equity held by non-affiliates of the Registrant as of July 2, 2006,June 27, 2008 was approximately $643,599,531.$378,612,000. Such aggregate market value was computed by reference to the closing price of the common stock as reported on the Nasdaq NationalGlobal Select Market on June 30, 200627, 2008 (the last business day of the Registrant’s most recently completed fiscal second quarter).
Shares of common stock held by each executive officer and director and each entity that owns 5% or more of the outstanding common stock have been excluded in that such persons may be deemed to be affiliates. The determination of affiliate status is not necessarily a conclusive determination for other purposes.The number of outstanding shares of the registrant’s Common Stock, $0.001 par value, was 34,323,92834,376,650 shares as of February 16, 2007.
17, 2009.DOCUMENTS INCORPORATED BY REFERENCE
Portions of the Proxy Statement for the Registrant’s 20072009 Annual Meeting of Stockholders are incorporated by reference in Part III of thisForm 10-K.
PART I
This Annual Report on Form 10-K (“Form 10-K”), including Management’s Discussion and Analysis of Financial Condition and Results of Operations in Part II, Item 7 below, includes forward-looking statements within the meaning of Section 27A of the Securities Act of 1933, as amended, and Section 21E of the Securities Exchange Act of 1934, as amended.amended (the “Exchange Act”). All statements other than statements of historical facts contained in thisForm 10-K, including statements regarding our future financial position, business strategy and plans and objectives of management for future operations, are forward-looking statements. The words “believe,” “may,” “will,” “estimate,” “continue,” “anticipate,” “intend,” “should,” “plan,” “expect” and similar expressions, as they relate to us, are intended to identify forward-looking statements. We have based these forward-looking statements largely on our current expectations and projections about future events and financial trends that we believe may affect our financial condition, results of operations, business strategy and financial needs. These forward-looking statements are subject to a number of risks, uncertainties and assumptions described in “Risk Factors” in Part I, Item 1A below, and elsewhere in thisForm 10-K, including, among other things: the future growth of the small business and home markets; speed of adoption of wireless networking worldwide; our business strategies and development plans; our successful introduction of new products and technologies; future operating expenses and financing requirements; and competition and competitive factors in the small business and home markets. In light of these risks, uncertainties and assumptions, the forward-looking events and circumstances discussed in thisForm 10-K may not occur and actual results could differ materially from those anticipated or implied in the forward-looking statements. All forward-looking statements in thisForm 10-K are based on information available to us as of the date hereof and we assume no obligation to update any such forward-looking statements. The following discussion should be read in conjunction with our consolidated financial statements and the accompanying notes contained in thisForm 10-K.
We design, develop and market networking products for home users and for small business, which we define as a business with fewer than 250 employees. We are focused on satisfying theease-of-use, quality, reliability, performance and affordability requirements of these users. Our product offerings enable users to connect and communicate across local area networks, or LANs, and the World Wide Web and share Internet access, peripherals, files, digital multimedia content and applications among multiple personal computers, or PCs,networked devices and other Internet-enabled devices. We sell our products primarily through a globalmultiple sales channel network,channels worldwide, which includes traditional retailers, online retailers, direct market resellers, or DMRs, value added resellers, or VARs, and broadband service providers. A discussion of factors potentially affecting our operations is set forth in “Risk Factors,” underFactors” in Part I, Item 1A of thisForm 10-K.
We were incorporated in Delaware on January 8, 1996. Our principal executive offices are located at 4500 Great America Parkway, Santa Clara,350 East Plumeria Drive, San Jose, California 95054,95134, and our telephone number at that location is(408) 907-8000. We file reports, proxy statements and other information with the Securities and Exchange Commission, or SEC, in accordance with the Securities Exchange Act of 1934, as amended, or the Exchange Act. You may read and copy our reports, proxy statements and other information filed by us at the public reference room of the SECSEC’s Public Reference Room located at 450 Fifth100 F Street, N.W.N.E., Washington, D.C. 20549. Please call the SEC at1-800-SEC-0330 for further information about the public reference rooms.Public Reference Room. Our filings are also available to the public over the Internet at the SEC’s website athttp://www.sec.gov, and, as soon as practicable after such reports are filed with the SEC, free of charge through a hyperlink on our Internet website athttp://www.netgear.com.Information contained on the websitethese websites is not a part of thisForm 10-K.
Our objectivegoal is to be the leading provider of innovative networking products to the small business and home markets. A number of factors are driving today’s increasing demand for networking products within small businesses and homes. As the number of computing devices, such as PCs, has increased in recent years, networks are being
deployed in order to share information and resources among users and devices. This information and resource sharing occurs internally, through a local area network, or LAN, or externally, via the Internet. To take
2
advantage of complex applications, advanced communication capabilities and rich multimedia content, users are upgrading their Internet connections by deploying high-speed broadband access technologies. Users also seek the convenience and flexibility of operating their PCs, laptops and related computing devices and accessing their content in a more mobile, or wireless, manner. Finally, as the usage of networks, including the Internet, has increased, users have become much more focused on the security of their connections and the protection of the data within their networks.
Small business and home users demand a complete set of wired and wireless networking and broadband solutionsproducts that are tailored to their specific needs and budgets and also incorporate the latest networking technologies. These users require the continual introduction of new and refined products. Small business and home users often lack extensive IT resources and technical knowledge and therefore demand ‘plug-and-play’ oreasy-to-install and use solutions.products. These users seek reliable products that require little or no maintenance, and are supported by effective technical support and customer service. We believe that these users also prefer the convenience of obtaining a networking solution from a single company with whom they are familiar; as these users expand their networks, they tend to be loyal purchasers of that brand. In addition, purchasing decisions of users in the small business and home markets are also driven by the affordability of networking products. To provide reliable,easy-to-use products at an attractive price, we believe a successful supplier must have a company-wide focus on the unique requirements of these markets and the operational discipline and cost-efficient company infrastructure and processes that allow for efficient product development, manufacturing and distribution.
We sell our products through multiple sales channels worldwide, including traditional retailers, online retailers, wholesale distributors, DMRs, VARs, and broadband service providers.
Retailers.Our retail channel primarily supplies products that are sold into the home market. We sell directly to, or enter into consignment arrangements with, a number of our traditional retailers. The remaining traditional retailers, as well as our online retailers, are fulfilled through wholesale distributors, the largest of which are Ingram Micro, Inc. and Tech Data Corporation. We work directly with our retail channels on market development activities, such as co-advertising, in-store promotions and demonstrations, instant rebate programs, event sponsorship and sales associate training, as well as establishing “store within a store” websites and banner advertising.
DMRs and VARs.We primarily sell into the small business market through an extensive network of DMRs and VARs. Our DMRs include companies such as CDW and Insight. VARs include our network of registered Powershift Partners, or resellers who achieve prescribed quarterly sales goals and as a result may receive sales incentives, marketing support and other program benefits from us. Our products are also resold by a large number of smaller VARs whose sales are not large enough to qualify them for our Powershift Partner program. Our DMRs and VARs generally purchase our products through our wholesale distributors, primarily Ingram Micro Inc. and Tech Data Corporation.
Data.Broadband Service Providers.We also supply our products directly to broadband service providers in the United States and internationally, who distribute our products to their small business and home subscribers.
We derive the majority of our net revenue from international sales. International sales as a percentage of net revenue grewdecreased from 56% in 2005 to 62% in 2006. Sales2007 to 60% in Europe, Middle-East and Africa, or EMEA, grew from $200.0 million in 2005 to $298.2 million in 2006, representing an increase of approximately 49% during that period. We continue to penetrate new markets such as Brazil, Eastern Europe, India, and the Middle-East.2008. The table below sets forth our net revenue by major geographic region.
| | | | | | | | | | | | | | | | | | | | | |
| | | Year Ended December 31, | |
| | | | | | Percentage
| | | | | | Percentage
| | | | |
| | | 2004 | | | Change | | | 2005 | | | Change | | | 2006 | |
| | | (In thousands, except percentage data) | |
| |
| United States | | $ | 186,836 | | | | 7 | % | | $ | 199,208 | | | | 11 | % | | $ | 220,440 | |
| EMEA | | | 159,615 | | | | 25 | % | | | 199,951 | | | | 49 | % | | | 298,234 | |
| Asia Pacific and rest of world | | | 36,688 | | | | 38 | % | | | 50,451 | | | | 9 | % | | | 54,896 | |
| | | | | | | | | | | | | | | | | | | | | |
| Total | | $ | 383,139 | | | | 17 | % | | $ | 449,610 | | | | 28 | % | | $ | 573,570 | |
| | | | | | | | | | | | | | | | | | | | | |
3
| | | | | | | | | | | | | | | |
| | | 2008 | | Percentage
Change | | | 2007 | | Percentage
Change | | | 2006 |
| | | (In thousands, except percentage data) |
United States | | $ | 297,641 | | 9 | % | | $ | 273,695 | | 24 | % | | $ | 220,440 |
EMEA | | | 354,058 | | (7 | )% | | | 380,354 | | 28 | % | | | 298,234 |
Asia Pacific and rest of world | | | 91,645 | | 24 | % | | | 73,738 | | 34 | % | | | 54,896 |
| | | | | | | | | | | | | | | |
| | $ | 743,344 | | 2 | % | | $ | 727,787 | | 27 | % | | $ | 573,570 |
| | | | | | | | | | | | | | | |
RevenuesNet revenues from significant customers as a percentage of our total net revenues for the years ended December 31, 2004, 20052008, 2007 and 2006 were as follows:
| | | | | | | | | | | | | |
| | | Year Ended December 31, | |
| | | 2004 | | | 2005 | | | 2006 | |
| |
| Ingram Micro, Inc. | | | 27 | % | | | 25 | % | | | 19 | % |
| Tech Data Corporation | | | 18 | % | | | 17 | % | | | 16 | % |
| | | | | | | | | |
| | | Year Ended December 31, | |
| | | 2008 | | | 2007 | | | 2006 | |
Ingram Micro, Inc. | | 14 | % | | 17 | % | | 19 | % |
Tech Data Corporation | | 11 | % | | 14 | % | | 16 | % |
Product Offerings
Our product line consists of wired and wireless devices that enable Ethernet networking, broadband access, network connectivity, network storage and network connectivity.security appliances. These products are available in multiple configurations to address the needs of our customers in each geographic region in which our products are sold.
Ethernet networking.Ethernet is the most commonly used wired network protocol for connecting devices in today’s home and small-office networks. Products that enable Ethernet networking include:
switches, which are multiple port devices used to network PCs and peripherals;
network interface cards, adapters and bridges, that enable PCs and other equipment to be connected to a network;
| | |
| • | switches, which are multiple port devices used to network PCs and peripherals; |
|
| • | network interface cards, adapters and bridges, that enable PCs and other equipment to be connected to a network; |
|
| • | peripheral servers, such as print servers that manage printing on a network, and disk servers which manage shared disks on the network; and |
|
| • | VPN firewalls, which provide secure remote network access and anti-virus and anti-spam capabilities. |
Internet Security Appliances, which provide Internet access through capabilities such as anti-virus and anti-spam.
Broadband Access.Broadband is a transmission medium capable of moving more information and at a higher speeddigital content over public high speed networks than traditional narrowband frequencies.low speed telephone lines. Products that enable broadband access include:
routers, which connect the home or office networks to the Internet via broadband modems;
gateways, which are routers with integrated modems, for Internet access;
| | |
| • | routers, which are used to connect two networks together, such as the home or office network and the Internet; |
|
| • | gateways, or routers with an integrated modem, for Internet access; |
|
| • | IP telephony products, used for transmitting voice communications over a network; and |
|
| • | wireless gateways, or gateways that include an integrated wireless access point. |
IP telephony products, used for transmitting voice communications over a network; and
wireless gateways, or gateways that include an integrated wireless access point.
Network Connectivity.Products that enable network connectivity and resource sharing include:
wireless access points, which provide a wireless link between a wired network and wireless devices;
wireless network interface cards and adapters, which enable devices to be connected to the network wirelessly;
| | |
| • | wireless access points, which provide a wireless link between a wired network and wireless devices; |
|
| • | wireless network interface cards and adapters, which enable devices to be connected to the network wirelessly; |
|
| • | media adapters, which connect PCs, stereos, TVs and other equipment to a network; |
|
| • | wi-fi phones, which enable users to make voice calls over the Internet; |
|
| • | network attached storage, which enables file sharing and remote storage over a local area network; and |
|
| • | powerline adapters and bridges, which enable devices to be connected to the network over existing electrical wiring. |
media adapters, which connect non PC entertainment devices such as TVs, audio players, and game consoles to a network;
wi-fi phones, which enable users to make voice calls over the Internet;
network attached storage, which enables file sharing among multiple PCs and media adapters over a local area network; and
powerline adapters and bridges, which enable devices to be connected to the network over existing electrical wiring.
We design our products to meet the specific needs of both the small business and home markets, tailoring various elements of the product design, including component specification, physical characteristics such as casing, design and coloration, and specific user interface features to meet the needs of these markets. We also leverage many of our technological developments, high volume manufacturing, technical support and engineering infrastructure across our markets to maximize business efficiencies.
4
Our products that target the small business market are designed with an industrial appearance, including metal cases, and for some product categories, the ability to mount the product within standard data networking racks. These products typically include higher port counts, higher data transfer rates and other performance characteristics designed to meet the needs of a small business user. For example, we offer data transfer rates up to ten Gigabit per second for our business products to meet the higher capacity requirements of business users. Some of these products are also designed to support transmission modes such as fiber optic cabling, which is common in more sophisticated business environments. Security requirements within our products for small business broadband access include firewall, and virtual private network and content threat management capabilities that allow for secure interactions between remote offices and business headquarter locations.locations over the Internet. Our connectivity product offerings for the small business market include enhanced security and remote configurability often required in a business setting.
Our ReadyNAS® family of network attached storage products implements redundant array of independent disks data protection, enabling small businesses to store and protect critical data easily, efficiently and intelligently.Our products for the home user are designed with pleasing visual and physical aesthetics that are more desirable in a home environment. For example, our RangeMaxRangeMax™ series of routers have distinctive blue antenna-indicator LEDs in a circular dome atop a sleek black or white plastic casing. Our connectivity offerings for use in the home are generally at a lower price than higher security and configurability wireless offerings for the small business market. Our products for facilitating broadband access in the home are available with features such as parental control capabilities and firewall security, to allow for safer, more controlled Internet usage in families with children. Our broadband products designed for the home market also contain advanced installation software that guides a less sophisticated data networking user through the installation process with their broadband service provider, using a graphical user interface and simple point and click operations. Our connectivity product offerings for the home include powerline data transmission modes which allow home users to take advantage of their existing electrical wiring infrastructure for transmitting data among network components.
The small business and home networking markets are intensely competitive and subject to rapid technological change. We expect competition to continue to intensify. Our principal competitors include:
within the small business networking market, companies such as 3Com Corporation, Allied Telesyn International, Buffalo, Inc., Dell Computer Corporation, D-Link, Hewlett-Packard Company, the Linksys division of Cisco Systems, Baracuda Networks, Inc. and SonicWALL, Inc.; and
within the home networking market, companies such as Apple Inc., Belkin Corporation, D-Link, and the Linksys division of Cisco Systems.
| | |
| • | within the small business networking market, companies such as 3Com, Allied Telesyn, the Linksys division of Cisco Systems, Dell Computer, D-Link, Hewlett-Packard, Nortel Networks, and SonicWall, Inc.; and |
|
| • | within the home networking market, companies such as Belkin Corporation, D-Link, and the Linksys division of Cisco Systems. |
Other current competitors include numerous local vendors such as Siemens Corporation, Devolo and AVM in Europe, Corega International SA and Melco, Inc./Buffalo Technology in Japan and TP-Link in China, and broadband equipment suppliers such as Actiontec Electronics, Inc., ARRIS Group, Inc., Comtrend Corporation, Huawei Technologies Co. Ltd., Motorola, Inc., Sagem Corporation, Scientific Atlanta, Atlanta—a Cisco company, Terayon Communications Systems, Inc., Thomson Corporation and
2Wire, Inc. Our potential competitors include consumer electronics vendors and telecommunications equipment vendors who could integrate networking capabilities into their line of products, and our channel customers who may decide to offer self-branded networking products. We also face competition from service providers who may bundle a free networking device with their broadband service offering, which would reduce our sales if we are not the supplier of choice to those service providers.
Many of our existing and potential competitors have longer operating histories, greater name recognition and substantially greater financial, technical, sales, marketing and other resources. As a result, they may have more advanced technology, larger distribution channels, stronger brand names, better customer service and access to more customers than we do. For example, Dell ComputerHewlett-Packard has significant brand name recognition and has an advertising presence substantially greater than ours. Similarly, Cisco Systems is well recognized as a leader in providing networking solutionsproducts to businesses and has substantially greater financial resources than we do. Several of our competitors, such as the Linksys division of Cisco Systems and D-Link, offer a range of products that directly compete with most of our product offerings. Several of our other competitors primarily compete in a more limited manner. For example, Hewlett-Packard sells networking products primarily targeted at larger businesses or enterprises. However, the competitive environment in which we operate changes rapidly. Other large companies with significant resources could become direct competitors, either through acquiring a competitor or through internal efforts.
5
We believe that the principal competitive factors in the small business and home markets for networking products include product breadth, size and scope of the sales channel, brand name, timeliness of new product introductions, product performance, features, functionality and reliability, price,ease-of-installation, maintenance and use, and customer service and support.
To remain competitive, we believe we must invest significant resources in developing new products and enhancing our current products expandingwhile continuing to expand our sales channels and maintaining customer satisfaction worldwide.
As of December 31, 2006,2008, we had 62158 employees engaged in research and development. We believe that our success depends on our ability to develop products that meet the changing user needs and to anticipate and proactively respond to evolving technology in a timely and cost-effective manner. Accordingly, we have made investments in our research and development department in order to effectively evaluate new third party technologies, develop new in-house technologies, and develop and test new products. Our research and development employees work closely with our technology and manufacturing partners to bring our products to market in a timely, high quality and cost-efficient manner.
We identify, and qualify or self-develop new technologies, and we work closely with our various technology suppliers and manufacturing partners to develop products using one or more of the two manufacturingdevelopment methodologies described below.
ODM.Under the original design manufacturer, or ODM, methodology, which we use for most of our product development activities, we define the product concept and specification and perform the technology selection. We then coordinate with our technology suppliers while they develop the chipsets, software and detailed circuit designs. On certain new products, one or more subsystems of the design can be done in-house and then integrated in with the remaining design pieces from the ODM. Once prototypes are completed, we work with our partners to complete the debugging and systems integration and testing. Our ODMs are responsible for conducting all of the regulatory agency approval processes required for each product. After completion of the final tests, agency approvals and product documentation, the product is released for production.
CM. Under the contract manufacturer, or CM, methodology, which we use for a limited number of products, we define the product concept and specification and develop the primary technology and software internally.
Once prototypes are completed, we work with our partners to complete the debugging and systems integration and testing. We are responsible for conducting all of the regulatory agency approval processes required for each product. After completion of the final tests, agency approvals and product documentation, the product is released for production.
IN-HOUSE DEVELOPMENT.Under the in-house development model, one or more subsystems of the product are designed and developed utilizing the NETGEAR engineering team. Under this model some of the primary technology is developed in-house. We then work closely with either an ODM or a contract manufacturer to complete the development of the entire design, perform the necessary testing, and obtain regulatory approvals before the product is released for production.
OEM. Under the original equipment manufacturer, or OEM, methodology, which we use for a limited number of products, we define the product specification and then purchase the product from OEM suppliers that have existing products fitting our design requirements. OnceIn some cases, once a technology supplier’s product is selected, we work with the OEM supplier to complete the cosmetic changes to fit into our mechanical and packaging design, as well as our documentation and graphical user interface, or GUI, standard. The OEM supplier completes regulatory approvals on our behalf. When all design verification and regulatory testing is completed, the product is released for production.
Our internal research and development efforts focus on developing and improving the usability, reliability, functionality, cost and performance of our partner’s designs. In addition, we define the industrial design, GUI, documentation and installation process of our products. In August 2006, we acquired SkipJam Corp. (“SkipJam”), a developer of networkable media devices for integrating television into the home network and to the Internet for entertainment content streaming. Our total research and development expenses were $33.8 million in 2008, $28.1 million in 2007 and $18.4 million in 2006, $12.8 million in 2005 and $10.3 million in 2004.
Our primary manufacturers are ASUSTek Computer, Inc., Cameo Communications Inc., Delta Networks Incorporated, Gemtek Technology Co., Hon Hai Precision Industry Co., Ltd. (more commonly known as Foxconn Corporation), and SerComm Corporation, Kepro, and Unihan Corporation (which was spun out of ASUSTek Computer, Inc. in January 2008), all of which are headquartered in Taiwan. The actual manufacturing of our products occurs primarily in mainland China, with pilot and is supplemented withlow-volume manufacturing in Taiwan on a select basis. We distribute our manufacturing among these key suppliers to avoid excessive concentration with a single supplier. In addition to their responsibility for the manufacturing of our products, our manufacturers purchase all necessary parts and materials to produce complete, finished goods. To maintain quality standards for our suppliers, we have established our own product testing and quality organization based in Hong Kong and mainland China. They are responsible for auditing and inspecting process and product quality on the premises of our ODMs, CMs and OEMs.
We currently outsource warehousing and distribution logistics to four third-party providers who are responsible for warehousing, distribution logistics and order fulfillment. In addition, these parties are also responsible for
6
some configuration and re-packaging of our products including bundling components to form kits, inserting appropriate documentation, disk drive configuration, and adding power adapters. APL Logistics Americas, Ltd. in City of Industry, California serves the Americas region, Kerry Logistics Ltd. in Hong Kong serves the Asia Pacific region, and Furness Logistics BVDSV Solutions B.V. and ModusLink BV in the Netherlands serve the the United States and Europe, Middle-East and Africa, or EMEA, region.
As of December 31, 2006,2008, we had 187266 employees engaged in sales and marketing. We work directly with our customers on market development activities, such as co-advertising, in-store promotions and demonstrations, instant rebate programs, event sponsorship and sales associate training. We also participate in major industry trade shows and marketing events. Our marketing department is comprised of our product marketing and corporate marketing groups.
Our product marketing group focuses on product strategy, product development roadmaps, the new product introduction process, product lifecycle management, demand assessment and competitive analysis. The group
works closely with our sales and research and development groups to align our product development roadmap to meet customer technology demands from a strategic perspective. The group also ensures that product development activities, product launches, channel marketing program activities, and ongoing demand and supply planning occur in a well-managed, timely basis in coordination with our development, manufacturing, and sales groups, as well as our ODM, CM, OEM and sales channel partners.
Our corporate marketing group is responsible for defining and building our corporate brand. The group focuses on defining our mission, brand promise and marketing messages on a worldwide basis. This group also defines the marketing approaches in the areas of advertising, public relations, events, channel programs and our web delivery mechanisms. These marketing messages and approaches are customized for both the small business and home markets through a variety of delivery mechanisms designed to effectively reach end-users in a cost-efficient manner.
We conduct muchmost of our international sales and marketing operations through NETGEAR International Inc. and NETGEAR International Ltd., our wholly-owned subsidiariessubsidiary which have formedoperates via sales and marketing subsidiaries and branch offices worldwide.
TechnicalCustomer Support
We provide technicaldesign our products with “plug and play” ease of use. We respond globally to customer questions over the phone and Internet including providing an online Knowledgebase and User Forum. Customer support to our customersis provided through a combination of a limited number of permanent employees and extensive use of subcontracted “out-sourcing” resources. Although we design our products to require minimal technical support, if a customer requires assistance, we generally provide free, high-quality technical advice worldwide over the phone and Internet for a specified period of time, generally less than one year. We currently subcontract first level and the majority of second level technical support for our products and as of December 31, 2006, we were utilizing approximately 720 part-time and full-time individuals to answer customers’ technical questions. First level technical support represents the first team member a customer will reach with questions; and, typically, these individuals are able to answer routine technical questions. If they are unable to resolve the issue, the first level support member will forward the customer to our more highly trained second level support group. The most difficult or unique questions are forwarded to NETGEAR employees. This 20 person in-house staff provides the most sophisticated support when customer issues require escalation.
In addition to providing third level technical support, these internal NETGEAROur permanent employees design our technical support database and are responsible for training and managing our outsourcedsub-contractors. We utilize the information gained from customers by our technicalcustomer support organization to enhance our current and future products by providing bug fixes,product offerings, including further simplifying the installation process and planning future product needs.
In North America, the United Kingdom, South East Asia and Australia, the first and second level technical support in English is provided 24 hours a day, 7 days a week, 365 days a year. Local language support is also available during local business hours in Austria, Switzerland, China, France, Germany, Italy, Japan, Korea, Spain, Thailand, Brazil, Hungary, Russia, the Nordic countries, Belgium and the Netherlands.
7
Intellectual Property
We believe that our continued success will depend primarily on the technical expertise, speed of technology implementation, creative skills and management abilities of our officers and key employees, plus ownership of a limited but important set of copyrights, trademarks, trade secrets and patents. We primarily rely on a combination of copyright, trademark and trade secret and patent laws, nondisclosure agreements with employees, consultants and suppliers and other contractual provisions to establish, maintain and protect our proprietary rights. We hold twothree issued patents that expire between years 2023 and 2025 and currently have a number of pending United States patent applications related to technology and products offered by us. In addition, we rely on third-party licensors for patented hardware and software license rights in technology that are incorporated into and are necessary for the operation and functionality of our products. We typically retain limited exclusivity over intellectual property we jointly develop with our OEMs and ODMs. Our success will depend in part on our continued ability to have access to these technologies.
We have trade secret rights for our products, consisting mainly of product design, technical product documentation and software. We also own, or have applied for registration of trademarks, in connection with our products, including NETGEAR, the NETGEAR logo, the NETGEAR Digital Entertainer logo, the Gear Guy logo, Connect with Innovation, Everybody’s connecting, IntelliFi, ProSafe, RangeMax, andReadyNAS, Smart Wizard and X-RAID in the United States and internationally. We have registered severala number of Internet domain names that we use for electronic interaction with our customers including dissemination of product information, marketing programs, product registration, sales activities, and other commercial uses.
As of December 31, 2006,2008, we had 388579 full-time employees, with 207266 in sales, marketing and technical support, 62158 in research and development, 5365 in operations, and 6690 in finance, information systems and administration. We also utilize a number of temporary staff including 15 full-time contractors, to supplement our workforce. We have never had a work stoppage among our employees and no personnel are represented under collective bargaining agreements. We consider our relations with our employees to be good.
Website Posting of SEC Filings
Our website provides a link to our SEC filings, which are available on the same day such filings are made. The specific location on the website where these reports can be found ishttp://www.investor.netgear.com/edgar.cfm.investor.netgear.com/sec.cfm. Our website also provides a link to Section 16 filings which are available on the same day as such filings are made.
Executive Officers of the Registrant
The following table sets forth the names, ages and positions of our executive officers (who are subject to Section 16 of the Securities Exchange Act of 1934) as of March 1, 2007.
| | | | |
Name | | Age | | Position |
Patrick C.S. Lo | | |
Name
| | Age
| | Position
|
|
Patrick C.S. Lo | | | 50 | 52 | | Chairman and Chief Executive Officer |
Mark G. Merrill | | | 52 | 54 | | Chief Technology Officer |
Michael F. Falcon | | | 50 | 52 | | Senior Vice President of Operations |
Christine M. Gorjanc | | | 50 | 52 | | Chief AccountingFinancial Officer |
Albert Y. LiuAndrew Kim | | | 34 | 38 | | Vice President, Legal and Corporate Development |
Charles T. Olson | | | 51 | 53 | | Senior Vice President of Engineering |
David Soares | | | 40 | 42 | | Senior Vice President of Worldwide Sales and Support |
Michael A. Werdann | | | 38 | 40 | | Vice President of Americas Sales |
Deborah A. Williams | | | 49 | | | Senior Vice President, Marketing and Chief Marketing Officer |
8
Patrick C.S. Lohas served as our Chairman and Chief Executive Officer since March 2002. From September 1999 to March 2002, he served as our President, and since our inception in 1996 to September 1999, he served as Vice President and General Manager. Mr. Lo joined Bay Networks, a networking company, in August 1995 to launch a division targeting the small business and home markets and established the NETGEAR division in January 1996. From 1983 until 1995, Mr. Lo worked at Hewlett-Packard Company, a computer and test equipment company, where he served in various management positions in software sales, technical support, network product management, sales support and marketing in the United States and Asia, including as the Asia/Pacific marketing director for Unix servers. Mr. Lo received a B.S. degree in Electrical Engineering from Brown University.
Mark G. Merrillhas served as our Chief Technology Officer since January 2003. From September 1999 to January 2003, he served as Vice President of Engineering and served as Director of Engineering from September 1995 to September 1999. From 1987 to 1995, Mr. Merrill worked at SynOptics Communications, a local area networking company, which later merged with Wellfleet to become Bay Networks, where his responsibilities included system design and analog implementations for SynOptic’sSynOptics’ first 10BASE-T products. Mr. Merrill received both a B.S. degree and an M.S. degree in Electrical Engineering from Stanford University.
Michael F. Falconhas served as our Senior Vice President of Operations since March 2006 and Vice President of Operations since November 2002. From September 1999 to November 2002, Mr. Falcon worked at Quantum Corporation, a data technology company, where he served as Vice President of Operations and Supply Chain Management. From April 1999 to September 1999, Mr. Falcon was at Meridian Data, a storage company acquired by Quantum Corporation, where he served as Vice President of Operations. From February 1989 to April 1999, Mr. Falcon was at Silicon Valley Group, a semiconductor equipment manufacturer, where he served as Director of Operations, Strategic Planning and Supply Chain Management. Prior to that, he served in management positions at SCI Systems, an electronics manufacturer, Xerox Imaging Systems, a provider of scanning and text recognition solutions, and Plantronics, Inc., a provider of lightweight communication headsets. Mr. Falcon received a B.A. degree in Economics from the University of California, Santa Cruz and has completed coursework in the M.B.A. program at Santa Clara University.
Christine M. Gorjanchas served as our Chief Financial Officer since January 2008, as our Chief Accounting Officer since December 2006 and as our Vice President, Finance since November 2005. From September 1996 through November 2005, Ms. Gorjanc served as Vice President, Controller, Treasurer and Assistant Secretary for Aspect Communications Corporation, a provider of workforce and customer management
solutions. From October 1988 through September 1996, she served as the Manager of Tax for Tandem Computers, Inc., a provider of fault-tolerant computer systems. Prior to that, she served in management positions at Xidex Corporation, a manufacturer of storage devices, and spent eight years in public accounting with a number of accounting firms. Ms. Gorjanc holds a B.A. in Accounting (with honors) from the University of Texas at El Paso and a M.S. in Taxation from Golden Gate University, and is a Certified Public Accountant.
University.Albert Y. LiuAndrew Kimhas served as our Vice President, Legal and Corporate Development and Corporate Secretary since March 2006October 2008 and as our Associate General Counsel since March 2008. Prior to joining NETGEAR, Mr. Kim served as Special Counsel in the Corporate and Secretary since October 2004. From March 2004 to October 2004, Mr. Liu consulted as Acting General CounselSecurities Department of Wilson Sonsini Goodrich & Rosati, where he represented public and Secretary for Yipes Enterprise Services, Inc., an emerging telecom services company. From May 2000 to June 2004, Mr. Liu workedprivate technology companies in a wide range of matters, including mergers and acquisitions, debt and equity financing arrangements, securities law compliance and corporate governance. In between two terms at Turnstone Systems, Inc., a telecommunications equipment provider, whereWilson Sonsini Goodrich & Rosati, he served as General CounselPartner in the Business and Secretary, as DirectorFinance Department of Human Resources since September 2001Schwartz Cooper Chartered in Chicago, Illinois, and as a memberwas an Adjunct Professor of Entrepreneurship at the boardIllinois Institute of directors since November 2003. Prior to that,Technology. Mr. Liu practiced corporate and securities law at Sullivan & Cromwell, a leading U.S. law firm, from October 1997 to May 2000. Mr. LiuKim holds a J.D. from the University of California, Hastings College of theCornell Law School, and an A.B.received a B.A. degree in Political Science and a B.S. in Computer Sciencehistory from StanfordYale University.
Charles T. Olsonhas served as our Senior Vice President of Engineering since March 2006 and our Vice President of Engineering since January 2003. From July 1978 to January 2003, Mr. Olson worked at Hewlett-Packard Company, a computer and test equipment company, where he served as Director of Research and Development for ProCurve networking from 1998 to 2003, as Research and Development Manager for the Enterprise Netserver division from 1997 to 1998, and, prior to that, in various other engineering management roles in Hewlett-Packard’s Unix server and personal computer product divisions. Mr. Olson received a B.S. degree in Electrical Engineering from the University of California, Davis and an M.B.A. from Santa Clara University.
9
David Soareshas served as our Senior Vice President of Worldwide Sales and Support since August 2004. Mr. Soares joined us in January 1998, and served as Vice President of EMEA sales from December 2003 to July 2004, EMEA Managing Director from April 2000 to November 2003, United Kingdom and Nordic Regional Manager from February 1999 to March 2000 and United Kingdom Country Manager from January 1998 to January 1999. Prior to joining us, Mr. Soares was at Hayes Microcomputer Products, a manufacturer ofdial-up modems. Mr. Soares attended Ridley College, Ontario Canada.
Michael A. Werdannhas served as our Vice President of Americas Sales since December 2003. Since joining us in 1998, Mr. Werdann has served as our United States Director of Sales,E-Commerce and DMR from December 2002 to 2003 and as our Eastern regional sales director from October 1998 to December 2002. Prior to joining us, Mr. Werdann worked for three years at Iomega Corporation, a computer hardware company, as a sales director for the value added reseller sector. Mr. Werdann holds a B.S. Degree in Communications from Seton Hall University.
Deborah A. Williamshas served as our Senior Vice President, Marketing and Chief Marketing Officer since September 2006. From 1984 through 2005, Ms. Williams worked at Hewlett-Packard Company, a computer and test equipment company, where she held various executive-level marketing positions, most recently as Vice President of Marketing for the Business Imaging and Printing Global Business Unit. Ms. Williams previously served as Vice President of Marketing of the LaserJet Supplies Division, Vice President of Category Operations and Marketing of the Supplies Global Business Unit, Director of Marketing of the DeskJet Printers Division, Director of Consumer Marketing of the European Peripherals Group, and Director of Support of the European Computer Products Sales Unit. Ms. Williams holds a B.A. in Industrial Distribution from Clarkson University, and an M.B.A. from the J.L. Kellogg Graduate School of Management.
Investing in our common stock involves a high degree of risk. The risks described below are not exhaustive of the risks that might affect our business. Other risks, including those we currently deem immaterial, may also impact our business. Any of the following risks could materially adversely affect our business operations, results of operations and financial condition and could result in a significant decline in our stock price.
Economic conditions are likely to materially adversely affect our revenue and results of operations.
Our business has been and may continue to be affected by a number of factors that are beyond our control such as general geopolitical economic and business conditions, conditions in the financial services markets, and changes in the overall demand for networking products. A severe and/or prolonged economic downturn could adversely affect our customers’ financial condition and the levels of business activity of our customers. Uncertainty about current global economic conditions could cause businesses to postpone spending in response
to tighter credit, negative financial news and/or declines in income or asset values, which could have a material negative effect on the demand for networking products.
The current economic crisis affecting the banking system and financial markets and the current uncertainty in global economic conditions have resulted in a tightening in the credit markets, a low level of liquidity in many financial markets, and extreme volatility in credit, equity, currency and fixed income markets. There could be a number of follow-on effects from these economic developments and negative economic trends on our business, including the inability of customers to obtain credit to finance purchases of our products; customer insolvencies; decreased customer confidence to make purchasing decisions; decreased customer demand; and decreased customer ability to pay their trade obligations.
If conditions in the global economy, U.S. economy or other key vertical or geographic markets remain uncertain or weaken further, such conditions could have a material adverse impact on our business, operating results and financial condition. In addition, if we are unable to successfully anticipate changing economic and political conditions, we may be unable to effectively plan for and respond to those changes, which could materially adversely affect our business and results of operations.
We are exposed to adverse currency exchange rate fluctuations in jurisdictions where we transact in local currency, which could harm our financial results and cash flows.
Because a significant portion of our business is conducted outside the United States, we face exposure to adverse movements in foreign currency exchange rates. These exposures may change over time as business practices evolve, and they could have a material adverse impact on our results of operations, financial position and cash flows. Although a portion of our international sales are currently invoiced in United States dollars, we have implemented and continue to implement for certain countries both invoicing and payment in foreign currencies. Our primary exposure to movements in foreign currency exchange rates relates to non-U.S. dollar denominated sales in Europe, Japan and Australia and certain parts of Asia and non-U.S. dollar denominated operating expenses incurred throughout the world. In addition, weaknesses in foreign currencies for U.S. dollar denominated sales could adversely affect demand for our products. Conversely, a strengthening in foreign currencies against the U.S. dollar could increase foreign currency denominated costs. As a result we may attempt to renegotiate pricing of existing contracts or request payment to be made in U.S. dollars. We cannot be sure that our customers would agree to renegotiate along these lines. This could result in customers eventually terminating contracts with us or in our decision to terminate certain contracts, which would adversely affect our sales.
We implemented a hedging program in November 2008 to hedge exposures to fluctuations in foreign currency exchange rates as a response to the risks of changes in the value of foreign currency denominated assets and liabilities. We may enter into foreign currency forward contracts or other instruments, the majority of which mature within approximately three months. Our foreign currency forward contracts reduce, but do not eliminate, the impact of currency exchange rate movements. For example, we do not execute forward contracts in all currencies in which we conduct business. In addition, our hedging program is not currently structured to reduce the impact, due to volatile exchange rates, on net revenues, gross profit and operating profit. Accordingly, the use of such hedging activities may not offset more than a portion of the adverse financial effect resulting from unfavorable movements in foreign exchange rates.
We expect our operating results to fluctuate on a quarterly and annual basis, which could cause our stock price to fluctuate or decline.
Our operating results are difficult to predict and may fluctuate substantially fromquarter-to-quarter oryear-to-year for a variety of reasons, many of which are beyond our control. If our actual revenue were to fall below our estimates or the expectations of public market analysts or investors, our quarterly and annual results would be negatively impacted and the price of our stock could decline. Other factors that could affect our quarterly and annual operating results include those listed in thisthe risk factors section of thisForm 10-K report and others such as:
| | |
| • | changes in the pricing policies of or the introduction of new products by us or our competitors; |
|
| • | changes in the terms of our contracts with customers or suppliers that cause us to incur additional expenses or assume additional liabilities; |
|
| • | slow or negative growth in the networking product, personal computer, Internet infrastructure, home electronics and related technology markets, as well as decreased demand for Internet access; |
|
| • | changes in or consolidation of our sales channels and wholesale distributor relationships or failure to manage our sales channel inventory and warehousing requirements; |
|
| • | delay or failure to fulfill orders for our products on a timely basis; |
|
| • | our inability to accurately forecast product demand; |
|
| • | unfavorable level of inventory and turns; |
|
| • | unanticipated shift in overall product mix from higher to lower margin products which would adversely impact our margins; |
10
changes in the terms of our contracts with customers or suppliers that cause us to incur additional expenses or assume additional liabilities;
slow or negative growth in the networking product, personal computer, Internet infrastructure, home electronics and related technology markets, as well as decreased demand for Internet access;
changes in or consolidation of our sales channels and wholesale distributor relationships or failure to manage our sales channel inventory and warehousing requirements;
delay or failure to fulfill orders for our products on a timely basis;
| | |
| • | delays in the introduction of new products by us or market acceptance of these products; |
|
| • | an increase in price protection claims, redemptions of marketing rebates, product warranty returns or allowance for doubtful accounts; |
|
| • | operational disruptions, such as transportation delays or failure of our order processing system, particularly if they occur at the end of a fiscal quarter; |
|
| • | seasonal patterns of higher sales during the second half of our fiscal year, particularly retail-related sales in our fourth quarter; |
|
| • | delay or failure of our service provider customers to purchase at the volumes that we forecast; |
|
| • | foreign currency exchange rate fluctuations in the jurisdictions where we transact sales in local currency; |
|
| • | bad debt exposure as we expand into new international markets; and |
|
| • | changes in accounting rules, such as recording expenses for employee stock option grants. |
disruptions or delays related to our new financial and enterprise resource planning systems;
our inability to accurately forecast product demand;
unfavorable level of inventory and turns;
unanticipated shift in overall product mix from higher to lower margin products that would adversely impact our margins;
unanticipated shift or decline in profit by geographical region that would adversely impact our tax rate;
delays in the introduction of new products by us or market acceptance of these products;
an increase in price protection claims, redemptions of marketing rebates, product warranty and stock rotation returns or allowance for doubtful accounts;
challenges associated with integrating acquisitions that we make;
operational disruptions, such as transportation delays or failure of our order processing system, particularly if they occur at the end of a fiscal quarter;
delay or failure of our service provider customers to purchase at the volumes that we forecast;
foreign currency exchange rate fluctuations in the jurisdictions where we transact sales and expenditures in local currency;
our customers’ inability to pay for purchased goods in a timely fashion;
bad debt exposure with our existing customers and as we expand into new international markets; and
any changes in accounting rules.
As a result,period-to-period comparisons of our operating results may not be meaningful, and you should not rely on them as an indication of our future performance. In addition, our future operating results may fall below the expectations of public market analysts or investors. In thisthat event, our stock price could decline significantly.
Our stock price may be volatile and your investment in our common stock could suffer a decline in value.
With the continuing uncertainty about economic conditions in the United States and abroad, there has been significant volatility in the market price and trading volume of securities of technology and other companies, which may be unrelated to the financial performance of these companies. These broad market fluctuations may negatively affect the market price of our common stock.
Some specific factors that may have a significant effect on our common stock market price include:
actual or anticipated fluctuations in our operating results or our competitors’ operating results;
actual or anticipated changes in the growth rate of the general networking sector, our growth rates or our competitors’ growth rates;
conditions in the financial markets in general or changes in general economic conditions;
interest rate or currency exchange rate fluctuations;
our ability or inability to raise additional capital; and
changes in stock market analyst recommendations regarding our common stock, other comparable companies or our industry generally.
Some of our competitors have substantially greater resources than we do, and to be competitive we may be required to lower our prices or increase our advertising expenditures or othersales and marketing expenses, which could result in reduced margins and loss of market share.
We compete in a rapidly evolving and highly competitive market, and we expect competition to intensify.continue to be intense, including price competition. Our principal competitors in the small business market include 3Com, Corporation, Allied Telesyn, International,Buffalo, Dell, Computer Corporation, D-Link, Systems, Inc., Hewlett-Packard, Company, the Linksys division of Cisco Systems and Nortel Networks.SonicWALL. Our principal competitors in the home market include Apple, Belkin, Corporation, D-Link and the Linksys division of Cisco Systems. Our principal competitors in the broadband service provider market include AARIS Group, Inc.,Actiontec, ARRIS, Comtrend, Huawei, Motorola, Inc., Sagem, Corporation, Scientific Atlanta, Atlanta—a Cisco company, Terayon Communications Systems, Inc.,ZyXEL, Thomson Corporation and 2Wire, Inc.2Wire. Other current and potential competitors include numerous local vendors such as Devolo, Siemens Corporation and AVM in Europe, Corega International SA,and Melco Inc./Buffalo Technology in Japan and TP-Link in China. Our potential competitors also include consumer electronics vendors who could integrate networking capabilities into their line of products, and our channel customers who may decide to offer self-branded networking products. We also face competition from service providers who may bundle a free networking device with their broadband service offering, which would reduce our sales if we are not the supplier of choice to those service providers.
Many of our existing and potential competitors have longer operating histories, greater name recognition and substantially greater financial, technical, sales, marketing and other resources. These competitors may, among other things, undertake more extensive marketing campaigns, adopt more aggressive pricing policies, obtain more favorable pricing from suppliers and manufacturers, and exert more influence on the sales channelchannels than we can. We anticipate that current and potential competitors will also intensify their efforts to penetrate our target markets. For example, price competition has intensified in our industry. Average sales prices have declined in the past and may continue to decline in the future. These competitors may have more advanced technology, more extensive distribution channels, stronger brand names, greater access to shelf space in retail locations, bigger promotional budgets and larger customer bases than we do. These companies could devote more capital resources to develop, manufacture and market competing products than we could. If any of these companies are successful in competing against us, our sales could decline, our margins could be negatively impacted and we could lose market share, any of which could seriously harm our business and results of operations.
If we do not effectively manage our sales channel inventory and product mix, we may incur costs associated with excess inventory, or lose sales from having too few products.
If we are unable to properly monitor, control and manage our sales channel inventory and maintain an appropriate level and mix of products with our wholesale distributors and within our sales channel,channels, we may incur
11
increased and unexpected costs associated with this inventory. We generally allow wholesale distributors and traditional retailers to return a limited amount of our products in exchange for other products. Under our price protection policy, if we reduce the list price of a product, we are often required to issue a credit in an amount equal to the reduction for each of the products held in inventory by our wholesale distributors and retailers. If our wholesale distributors and retailers are unable to sell their inventory in a timely manner, we might lower the price of the products, or these parties may exchange the products for newer products. Also, during the transition from an existing product to a new replacement product, we must accurately predict the demand for the existing and the new product.
We determine production levels based on our forecasts of demand for our products. Actual demand for our products depends on many factors, which makes it difficult to forecast. We have experienced differences between our actual and our forecasted demand in the past and expect differences to arise in the future. If we improperly forecast demand for our products we could end up with too many products and be unable to sell the excess
inventory in a timely manner, if at all, or, alternatively we could end up with too few products and not be able to satisfy demand. This problem is exacerbated because we attempt to closely match inventory levels with product demand leaving limited margin for error. If these events occur, we could incur increased expenses associated with writing off excessive or obsolete inventory, or lose sales, incur penalties for late delivery or have to ship products by air freight to meet immediate demand incurring incremental freight costs above the sea freight costs, of transporting product via boat, a preferred method, and suffering a corresponding decline in gross margins.
Our business is subject to the risks of international operations.
We derive a significant portion of our revenue from international operations. As a result, our financial condition and operating results could be significantly affected by risks associated with international activities, including economic and labor conditions, political instability, tax laws (including U.S. taxes on foreign subsidiaries), and changes in the value of the U.S. dollar versus local currencies. Margins on sales of our products in foreign countries, and on sales of products that include components obtained from foreign suppliers, could be materially adversely affected by foreign currency exchange rate fluctuations and by international trade regulations.
The average selling prices of our products typically decrease rapidly over the sales cycle of the product, which may negatively affect our gross margins.
Our products typically experience price erosion, a fairly rapid reduction in the average unit selling prices over their respective sales cycles. In order to sell products that have a falling average unit selling price and maintain margins at the same time, we need to continually reduce product and manufacturing costs. To manage manufacturing costs, we must collaborate with our third party manufacturers to engineer the most cost-effective design for our products. In addition, we must carefully manage the price paid for components used in our products. We must also successfully manage our freight and inventory costs to reduce overall product costs. We also need to continually introduce new products with higher sales prices and gross margins in order to maintain our overall gross margins. If we are unable to manage the cost of older products or successfully introduce new products with higher gross margins, our net revenue and overall gross margin would likely decline.
We are currently involved in various litigation matters and may in the future become involved in additional litigation, including litigation regarding intellectual property rights, which could be costly and subject us to significant liability.
The networking industry is characterized by the existence of a large number of patents and frequent claims and related litigation regarding infringement of patents, trade secrets and other intellectual property rights. In particular, leading companies in the data communications markets, some of which are competitors, have extensive patent portfolios with respect to networking technology. From time to time, third parties, including these leading companies, have asserted and may continue to assert exclusive patent, copyright, trademark and other intellectual property rights against us demanding license or royalty payments or seeking payment for damages, injunctive relief and other available legal remedies through litigation. These include third parties who claim to own patents or other intellectual property that cover industry standards that our products comply with. If we are unable to resolve these matters or obtain licenses on acceptable or commercially reasonable terms, we could be sued or we may be forced to initiate litigation to protect our rights. The cost of any necessary licenses could significantly harm our business, operating results and financial condition. Also, at any time, any of these companies, or any other third-partythird party could initiate litigation against us, or we may be forced to initiate litigation against them, which could divert management attention, be costly to defend or prosecute, prevent us from using or selling the challenged technology, require us to design around the challenged technology and cause the price of our stock to decline. In addition, third parties, some of whom are potential competitors, have initiated and may continue to initiate litigation against our manufacturers, suppliers, or members of our sales channel,channels or our service provider customers, alleging infringement of their proprietary rights with respect to existing or future products. In the event successful claims of infringement are brought by third parties, and we are unable to obtain licenses or independently develop alternative technology on a timely basis, we may be subject to indemnification
obligations, be unable to offer competitive products, or be subject to increased expenses. Finally, consumerclass-action class- action lawsuits related to the marketing and performance of our home networking products have been asserted and may in the future be asserted against us. For additional information regarding certain of the lawsuits in which we are involved, see the information set forth under Note 8 of the Notes to Consolidated Financial Statements in Part IV, Item 15 of this report, which information is incorporated into this Item 1A by reference. If we do not resolve these claims on a favorable basis, our business, operating results and financial condition could be significantly harmed.
If our products contain defects or errors, we could incur significant unexpected expenses, experience product returns and lost sales, experience product recalls, suffer damage to our brand and reputation, and be subject to product liability or other claims.
Our products are complex and may contain defects, errors or failures, particularly when first introduced or when new versions are released. The average selling pricesindustry standards upon which many of our products typically decrease rapidlyare based are also complex, experience change over time and may be interpreted in different manners. Some errors and defects may be discovered only after a product has been installed and used by the sales cycleend-user. For example, in January 2008, we announced a voluntary recall of the XE103 Powerline Ethernet Adapter made for Europe and other countries using 220-240 volt power sources and sold individually or in a bundled kit. If our products contain defects or errors, or are found to be noncompliant with industry standards, we could experience decreased sales and increased product which may negatively affectreturns, loss of customers and market share, and increased service, warranty and insurance costs. In addition, our gross margins.
Our products typically experience price erosion, a fairly rapid reduction in the average selling prices over their respective sales cycles. In order to sell products that have a falling average selling pricereputation and maintain margins at the same time,brand could be damaged, and we need to continually reduce product and manufacturing costs. To manage manufacturing costs, we must collaborate with our third-party manufacturers to engineer the most cost-effective design forcould face legal claims regarding our products. A product liability or other claim could result in negative publicity and harm our reputation, resulting in unexpected expenses and adversely impact our operating results. For instance, if a third party were able to successfully overcome the security measures in our products, such a person or entity could misappropriate customer data, third party data stored by our customers and other information, including intellectual property. In addition, we must carefully manage the price paid for components used in our products. We must also successfully manage our freight and inventory costs to reduce overall product costs. We also need to continually introduce new products with higher sales prices and gross margins in order to maintain our overall gross margins. If we are unable
12
to manage the cost of older products or successfully introduce new products with higher gross margins, our net revenue and overall gross margin would likely decline.
Our future success is dependent on the growth in personal computers sales and the acceptance of networking products in the small business and home markets into which we sell substantially alloperations of our products.end user customers may be interrupted. If the acceptancethat happens, affected end-users or others may file actions against us alleging product liability, tort, or breach of networking products in these markets does not continue to grow, we will be unable to increase or sustain our net revenue, and our business will be severely harmed.
We believe that growth in the small business market will depend, in significant part, on the growth of the number of personal computers purchased by these end-users and the demand for sharing data intensive applications, such as large graphic files. We believe that acceptance of networking products in the home will depend upon the availability of affordable broadband Internet access and increased demand for wireless products. Unless these markets continue to grow, our business will be unable to expand, which could cause the value of our stock to decline. Moreover, if networking functions are integrated more directly into personal computers and other Internet-enabled devices, such as electronic gaming platforms or personal video recorders, and these devices do not rely upon external network-enabling devices, sales of our products could suffer. In addition, if the small business or home markets experience a recession or other cyclical effects that diminish or delay networking expenditures, our business growth and profits would be severely limited, and our business could be more severely harmed than those companies that primarily sell to large business customers.
warranty claims.If we fail to continue to introduce new products that achieve broad market acceptance on a timely basis, we will not be able to compete effectively and we will be unable to increase or maintain net revenue and gross margins.
We operate in a highly competitive, quickly changing environment, and our future success depends on our ability to develop and introduce new products that achieve broad market acceptance in the small business and home markets. Our future success will depend in large part upon our ability to identify demand trends in the small business and home markets and quickly develop, manufacture and sell products that satisfy these demands in a cost effective manner. Successfully predicting demand trends is difficult, and it is very difficult to predict the effect introducing a new product will have on existing product sales. We will also need to respond effectively to new product announcements by our competitors by quickly introducing competitive products.
We have experienced delays and quality issues in releasing new products in the past, which resulted in lower quarterly net revenue than expected. In addition, we have experienced, and may in the future experience, product introductions that fall short of our projected rates of market adoption. Any future delays in product development and introduction or product introductions that do not meet broad market acceptance could result in:
loss of or delay in revenue and loss of market share;
negative publicity and damage to our reputation and brand;
| | |
| • | loss of or delay in revenue and loss of market share; |
|
| • | negative publicity and damage to our reputation and brand; |
|
| • | a decline in the average selling price of our products; |
|
| • | adverse reactions in our sales channel, such as reduced shelf space, reduced online product visibility, or loss of sales channel; and |
|
| • | increased levels of product returns. |
a decline in the average selling price of our products;
adverse reactions in our sales channels, such as reduced shelf space, reduced online product visibility, or loss of sales channel; and
increased levels of product returns.
We depend substantially on our sales channel,channels, and our failure to maintain and expand our sales channelchannels would result in lower sales and reduced net revenue.
To maintain and grow our market share, net revenue and brand, we must maintain and expand our sales channel.channels. We sell our products through our sales channel,channels, which consists of traditional retailers, on-lineonline retailers, DMRs, VARs, and broadband service providers. Some of these entities purchase our products through our wholesale distributors. We generally have no minimum purchase commitments or long-term contracts with any of these third parties.
13
Traditional retailers have limited shelf space and promotional budgets, and competition is intense for these resources. If the networking sector does not experience sufficient growth, retailers may choose to allocate more shelf space to other consumer product sectors. A competitor with more extensive product lines and stronger brand identity, such as Cisco Systems, may have greater bargaining power with these retailers. Any reduction in available shelf space or increased competition for such shelf space would require us to increase our marketing expenditures simply to maintain current levels of retail shelf space, which would harm our operating margin. The recent trend in the consolidation of online retailers and DMR channels has resulted in intensified competition for preferred product placement, such as product placement on an online retailer’s Internet home page. Expanding our presence in the VAR channel may be difficult and expensive. We compete with established companies that have longer operating histories and longstanding relationships with VARs that we would find highly desirable as sales channel partners. We have limited experience selling to broadband service providers. Penetrating service provider accounts typically involves a long sales cycle and the challenge of displacing incumbent suppliers with established relationships and field-deployed products. If we were unable to maintain and expand our sales channel,channels, our growth would be limited and our business would be harmed.
We must also continuously monitor and evaluate emerging sales channels. If we fail to establish a presence in an important developing sales channel, our business could be harmed.
We are exposed to the credit risk of some of our customers and to credit exposures in weakened markets, which could result in material losses.
Most of our sales are on an open credit basis, with typical payment terms of 30 to 60 days in the United States and, because of local customs or conditions, longer in some markets outside the United States. We monitor individual customer financial viability in granting such open credit arrangements, seek to limit such open credit to amounts we believe the customers can pay, and maintain reserves we believe are adequate to cover exposure for doubtful accounts.
In the past, there have been bankruptcies amongst our customer base. Although any resulting loss has not been material to date, future losses, if incurred, could harm our business and have a material adverse effect on our operating results and financial condition. To the degree that the recent turmoil in the credit markets makes it more difficult for some customers to obtain financing, our customers’ ability to pay could be adversely impacted, which in turn could have a material adverse impact on our business, operating results, and financial condition.
If we fail to successfully overcome the challenges associated with profitably growing our broadband service provider sales channel, our net revenue and gross profit will be negatively impacted.
We sell a substantial portion of our products through broadband service providers worldwide. We face a number of challenges associated with penetrating, marketing and selling to the broadband service provider channel that differ from what we have traditionally faced with the other channels. These challenges include a longer sales cycle, more stringent product testing and validation requirements, a higher level of customer service and supportcustomization demands, requirements that suppliers take on a larger share of the risk with respect to contractual business terms, competition from established suppliers, pricing pressure resulting in lower gross margins, and our general inexperience in selling to service providers. Orders from service providers generally tend to be large but sporadic, which causes our revenues from them to fluctuate wildly and challenges our ability to accurately forecast demand from them. In certain cases, we may commit to fixed price long term purchase orders, with such orders
priced in foreign currencies which could lose value over time in the event of adverse changes in foreign exchange rates. Even if we are selected as a supplier, typically a service provider will also designate a second source supplier, which over time will reduce the aggregate orders that we receive from that service provider. If we were to lose a service provider customer for any reason, we may experience a material and immediate reduction in forecasted revenue that may cause us to be below our net revenue and operating margin guidance for a particular period of time and therefore adversely affect our stock price. In addition, service providers may choose to prioritize the implementation of other technologies or the roll out of other services than home networking. Weakness in orders from this industry could have a material adverse effect on our business, operating results, and financial condition. We have seen a slowdown in capital expenditures by certain of our service provider customers, and believe there may be potential for a broader slowdown in the global service provider marketin the next few quarters. Any slowdown in the general economy, over capacity, consolidation among service providers, regulatory developments and constraint on capital expenditures could result in reduced demand from service providers and therefore adversely affect our sales to them. If we do not successfully overcome these challenges, we will not be able to profitably grow our service provider sales channel and our growth will be slowed.
If our products contain defects or errors, we could incur significant unexpected expenses, experience product returns and lost sales, experience product recalls, suffer damage to our brand and reputation, and be subject to product liability or other claims.
Our products are complex and may contain defects, errors or failures, particularly when first introduced or when new versions are released. The industry standards upon which many of our products are based are also complex, experience change over time and may be interpreted in different manners. Some errors and defects may be discovered only after a product has been installed and used by the end-user. If our products contain defects or errors, or are found to be noncompliant with industry standards, we could experience decreased sales and increased product returns, loss of customers and market share, and increased service, warranty and insurance costs. In addition, our reputation and brand could be damaged, and we could face legal claims regarding our products. A successful product liability or other claim could result in negative publicity and harm our reputation, result in unexpected expenses and adversely impact our operating results.
We obtain several key components from limited or sole sources, and if these sources fail to satisfy our supply requirements, we may lose sales and experience increased component costs.
Any shortage or delay in the supply of key product components would harm our ability to meet scheduled product deliveries. Many of the semiconductors used in our products are specifically designed for use in our products and are obtained from sole source suppliers on a purchase order basis. In addition, some components that are used in all our products are obtained from limited sources. These components include connector jacks, plastic casings and physical layer transceivers. We also obtain switching fabric semiconductors, which are used in our
14
Ethernet switches and Internet gateway products, and wireless local area network chipsets, which are used in all of our wireless products, from a limited number of suppliers. Semiconductor suppliers have experienced and continue to experience component shortages themselves, such as with substrates used in manufacturing chipsets, which in turn adversely impact our ability to procure semiconductors from them. Our contractthird party manufacturers generally purchase these components on our behalf on a purchase order basis, and we do not have any contractual commitments or guaranteed supply arrangements with our suppliers. If demand for a specific component increases, we may not be able to obtain an adequate number of that component in a timely manner. In addition, if our suppliers experience financial or other difficulties or if worldwide demand for the components they provide increases significantly, the availability of these components could be limited. It could be difficult, costly and time consuming to obtain alternative sources for these components, or to change product designs to make use of alternative components. In addition, difficulties in transitioning from an existing supplier to a new supplier could create delays in component availability that would have a significant impact on our ability to fulfill orders for our products. If we are unable to obtain a sufficient supply of components, or if we experience any interruption in the supply of components, our product shipments could be reduced or delayed. This would affect our ability to meet scheduled product deliveries, damage our brand and reputation in the market, and cause us to lose market share.
We are exposed to adverse currency exchange rate fluctuations in jurisdictions where we transact in local currency, which could harmAs part of growing our financial results and cash flows.
Although a significant portion of our international sales are currently invoiced in United States dollars,business, we have implementedmade and expect to continue to implement for certain countries both invoicing and payment in foreign currencies. Recently,make acquisitions. If we have experienced currency exchange gains, howeverfail to successfully select, execute or integrate our exposure to adverse foreign currency rate fluctuations will likely increase. We currentlyacquisitions, or if stock market analysts or our stockholders do not engage in any currency hedging transactions. Moreover,support the costs of doing business abroad may increase as a result of adverse exchange rate fluctuations. For example, if the United States dollar declined in value relativeacquisitions that we choose to a local currency, we could be required to pay more in U.S. dollar terms for our expenditures in that market, including salaries, commissions, local operations and marketing expenses, each of which is paid in local currency. In addition, we may lose customers if exchange rate fluctuations, currency devaluations or economic crises increase the local currency prices of our products or reduce our customers’ ability to purchase products.
Rising oil prices, unfavorable economic conditions, particularly in Western Europe, and turmoil in the international geopolitical environment may adversely affect our operating results.
We derive a significant percentage of our revenues from international sales, and a deterioration in global economic and market conditions, particularly in Western Europe, may result in reduced product demand, increased price competition and higher excess inventory levels. Turmoil in the global geopolitical environment, including the ongoing tensions in Iraq and the Middle-East, have pressured and continue to pressure global economies. In addition, rising oil prices may result in a reduction in consumer spending and an increase in freight costs to us. If the global economic climate does not improve,execute, then our business and operating results
could be harmed and our stock price could decline.From time to time, we will undertake acquisitions to add new product lines and technologies, gain new sales channels or enter into new sales territories. Acquisitions involve numerous risks and challenges, including but not limited to the following:
integrating the companies, assets, systems, products, sales channels and personnel that we acquire;
growing or maintaining revenues to justify the purchase price and the increased expenses associated with acquisitions;
entering into territories or markets that we have limited or no prior experience with;
establishing or maintaining business relationships with customers, vendors and suppliers who may be new to us;
overcoming the employee, customer, vendor and supplier turnover that may occur as a result of the acquisition; and
diverting management’s attention from running the day to day operations of our business.
As part of undertaking an acquisition, we may also significantly revise our capital structure or operational budget, such as issuing common stock that would dilute the ownership percentage of our stockholders, assuming liabilities or debt, utilizing a substantial portion of our cash resources to pay for the acquisition or significantly increasing operating expenses. Our acquisitions have resulted and may in the future result in charges being taken in an individual quarter as well as future periods, which results in variability in our quarterly earnings. In addition, our effective tax rate in any particular quarter may also be impacted by acquisitions.
We cannot assure you that we will be harmed.
successful in selecting, executing and integrating acquisitions. Failure to manage and successfully integrate acquisitions could materially harm our business and operating results. In addition, if stock market analysts or our stockholders do not support or believe in the value of the acquisitions that we choose to undertake, our stock price may decline.We have recently upgraded our financial, demand planning and operational management systems. If we experience problems with the initial deployment and operation of these new systems, our business and operations will be adversely affected.
We have recently upgraded our financial and enterprise resource planning systems. We have invested, and will continue to invest, significant capital and human resources in their design and enhancement, which may be disruptive to our underlying business. We depend on these systems in order to timely and accurately process and report key components of our results of operations, financial position and cash flows. If the systems fail to operate appropriately or we experience any disruptions or delays in enhancing their functionality to meet current business requirements, our ability to fulfill customer orders, bill and track our customers, fulfill contractual obligations, accurately report our financials and otherwise run our business could be adversely affected. Even if we do not encounter these adverse effects, the integration of the new systems may be much more costly than we anticipated. If we are unable to successfully integrate the new information technology systems as planned, our financial position, results of operations and cash flows could be negatively impacted.
If disruptions in our transportation network occur or our shipping costs substantially increase, we may be unable to sell or timely deliver our products and our operating expenses could increase.
We are highly dependent upon the transportation systems we use to ship our products, including surface and air freight. Our attempts to closely match our inventory levels to our product demand intensify the need for our transportation systems to function effectively and without delay. On a quarterly basis, our shipping volume also tends to steadily increase as the quarter progresses, which means that any disruption in our transportation network in the latter half of a quarter will have a more material effect on our business than at the beginning of a quarter.
The transportation network is subject to disruption or congestion from a variety of causes, including labor disputes or port strikes, acts of war or terrorism, natural disasters and congestion resulting from higher shipping volumes. Labor disputes among freight carriers and at ports of entry are common, especially in Europe, and we expect labor unrest and its effects on shipping our products to be a continuing challenge for us. The labor unions for the ports in the west coast of the U.S. are now engaging in contract negotiation with the port operators. If the negotiation falters and results in strikes, it will severely impact our business. Since September 11, 2001, the rate of inspection of international freight by governmental entities has substantially increased, and has become increasingly unpredictable. If our delivery times increase unexpectedly for these or any other reasons, our
15 ability
ability to deliver products on time would be materially adversely affected and result in delayed or lost revenue.revenue as well as customer imposed penalties. In addition, if the increases in fuel prices were to continue,occur, our transportation costs would likely further increase. Moreover, the cost of shipping our products by air freight is greater than other methods. From time to time in the past, we have shipped products using air freight to meet unexpected spikes in demand, shifts in demand between product categories or to bring new product introductions to market quickly. If we rely more heavily upon air freight to deliver our products, our overall shipping costs will increase. A prolonged transportation disruption or a significant increase in the cost of freight could severely disrupt our business and harm our operating results.
We rely on a limited number of wholesale distributors for most of our sales, and if they refuse to pay our requested prices or reduce their level of purchases, our net revenue could decline.
We sell a substantial portion of our products through wholesale distributors, including Ingram Micro, Inc. and Tech Data Corporation. During the fiscal year ended December 31, 2006,2008, sales to Ingram Micro and its affiliates accounted for 19%14% of our net revenue and sales to Tech Data and its affiliates accounted for 16%11% of our net revenue. We expect that a significant portion of our net revenue will continue to come from sales to a small number of wholesale distributors for the foreseeable future. In addition, because our accounts receivable are concentrated with a small group of purchasers, the failure of any of them to pay on a timely basis, or at all, would reduce our cash flow. We generally have no minimum purchase commitments or long-term contracts with any of these distributors. These purchasers could decide at any time to discontinue, decrease or delay their purchases of our products. In addition, the prices that they pay for our products are subject to negotiation and could change at any time. If any of our major wholesale distributors reduce their level of purchases or refuse to pay the prices that we set for our products, our net revenue and operating results could be harmed. If our wholesale distributors increase the size of their product orders without sufficient lead-time for us to process the order, our ability to fulfill product demands would be compromised.
If our goodwill or amortizable intangible assets become impaired we may be required to record a significant charge to earnings.
Under generally accepted accounting principles, we review our amortizable intangible assets for impairment when events or changes in circumstances indicate the carrying value may not be recoverable. Goodwill is required to be tested for impairment at least annually. Factors that may be considered when determining if the carrying value of our goodwill or amortizable intangible assets may not be recoverable include a significant decline in our expected future cash flows or a sustained, significant decline in our stock price and market capitalization.
As a result of our acquisitions, we have significant goodwill and amortizable intangible assets recorded on our balance sheet. In addition, significant negative industry or economic trends, such as those that have occurred in the last six months, including reduced estimates of future cash flows or disruptions to our business could indicate that goodwill or amortizable intangible assets might be impaired. If, in any period like the fourth quarter of 2008, our stock price decreases to the point where our market capitalization is less than our book value, this too could indicate a potential impairment and we may be required to record an impairment charge in that period. In the fourth quarter of 2008, we recorded an impairment charge of $458,000 for the net carrying value of certain intangible assets acquired in connection with the Company’s 2006 acquisition of Skipjam Corp. due to the departure of a key employee responsible for managing the asset group as well as recent economic conditions. In conducting our annual impairment test for goodwill during the fourth quarter of 2008, our fair value exceeded the carrying value of our net assets by approximately 12%. As such, no goodwill impairment loss was recorded.
Our valuation methodology for assessing impairment requires management to make judgments and assumptions based on projections of future operating performance. We operate in highly competitive environments and projections of future operating results and cash flows may vary significantly from actual
results. As a result, we may incur substantial impairment charges to earnings in our financial statements should an impairment of our goodwill or amortizable intangible assets be determined resulting in an adverse impact on our results of operations.
Our income tax provision and liability for uncertain tax positions may be insufficient if any taxing authorities are successful in asserting tax positions that are contrary to our positions.
Significant judgment is required to determine our provision for income taxes and liability for uncertain tax positions. In the ordinary course of our business, there may be matters for which the ultimate tax outcome is uncertain. Although we believe our approach to determining the appropriate tax treatment is reasonable, no assurance can be given that the final tax authority determination will not be materially different than that which is reflected in our income tax provision and liability for uncertain tax positions. Such differences could have a material adverse effect on our income tax provision or benefit and liability for uncertain tax positions in the period in which such determination is made and, consequently, on our results of operations for such period.
From time to time, we are audited by various federal, state and foreign authorities regarding tax matters. Our audits are in various stages of completion; however, no outcome for a particular audit can be determined with certainty prior to the conclusion of the audit and, in some cases, appeal or litigation process. As each audit is concluded, adjustments, if any, are appropriately recorded in our financial statements in the period determined. To provide for potential tax exposure, we maintain a liability for uncertain tax positions in accordance with Financial Accounting Standards Board (“FASB”) Interpretation No. 48, “Accounting for Uncertainty in Income Taxes—an interpretation of FASB Statement No. 109,” (“FIN 48”). However, if these accrued liabilities and/or reserves are insufficient upon completion of any audit process, there could be an adverse impact on our financial position and results of operations.
Changes in our tax rates could affect our future results.
Our future effective tax rates are affected by changes in the mix of earnings in countries with differing statutory tax rates, changes in the valuation of deferred tax assets and liabilities, or by changes in tax laws or their interpretation. As a result our effective tax rates are difficult to predict and may fluctuate substantially from quarter-to-quarter or year-to-year for a variety of reasons, many of which are beyond our control. If our effective tax rates were to increase significantly, our quarterly and annual results would be negatively impacted and the price of our stock could decline. Therefore, period-to-period comparisons of our operating results may not be meaningful, and you should not rely on them as an indication of our future performance. In addition, our future operating results may fall below the expectations of public market analysts or investors. In that event, our stock price could decline significantly.
We depend on a limited number of third party manufacturers for substantially all of our manufacturing needs. If these third party manufacturers experience any delay, disruption or quality control problems in their operations, we could lose market share and our brand may suffer.
All of our products are manufactured, assembled, tested and generally packaged by a limited number of original design manufacturers (“ODMs”), contract manufacturers (“CMs”) and original equipment manufacturers (“OEMs”). We rely on our manufacturers to procure components and, in some cases, subcontract engineering work. Some of our products are manufactured by a single manufacturer. We do not have any long-term contracts with any of our third party manufacturers. Some of these third party manufacturers produce products for our competitors. Due to weakening economic conditions, the viability of some of these third party manufacturers may be at risk. The loss of the services of any of our primary third party manufacturers could cause a significant disruption in operations and delays in product shipments. Qualifying a new manufacturer and commencing volume production is expensive and time consuming.
Our reliance on third party manufacturers also exposes us to the following risks over which we have limited control:
unexpected increases in manufacturing and repair costs;
inability to control the quality of finished products;
inability to control delivery schedules; and
potential lack of adequate capacity to manufacture all or a part of the products we require.
All of our products must satisfy safety and regulatory standards and some of our products must also receive government certifications. Our ODMs, CMs and OEMs are primarily responsible for obtaining most regulatory approvals for our products. If our ODMs, CMs and OEMs fail to obtain timely domestic or foreign regulatory approvals or certificates, we would be unable to sell our products and our sales and profitability could be reduced, our relationships with our sales channel could be harmed, and our reputation and brand would suffer.
If we are unable to provide our third party manufacturers a timely and accurate forecast of our component and material requirements, we may experience delays in the manufacturing of our products and the costs of our products may increase.
We provide our third party manufacturers with a rolling forecast of demand, which they use to determine our material and component requirements. Lead times for ordering materials and components vary significantly and depend on various factors, such as the specific supplier, contract terms and demand and supply for a component at a given time. Some of our components have long lead times, such as wireless local area network chipsets, switching fabric chips, physical layer transceivers, connector jacks and metal and plastic enclosures. If our forecasts are not timely provided or are less than our actual requirements, our third party manufacturers may be unable to manufacture products in a timely manner. If our forecasts are too high, our third party manufacturers will be unable to use the components they have purchased on our behalf. The cost of the components used in our products tends to drop rapidly as volumes increase and the technologies mature. Therefore, if our third party manufacturers are unable to promptly use components purchased on our behalf, our cost of producing products may be higher than our competitors due to an oversupply of higher-priced components. Moreover, if they are unable to use components ordered at our direction, we will need to reimburse them for any losses they incur.
We rely upon third parties for technology that is critical to our products, and if we are unable to continue to use this technology and future technology, our ability to develop, sell, maintain and support technologically innovative products would be limited.
We rely on third parties to obtain non-exclusive patented hardware and software license rights in technologies that are incorporated into and necessary for the operation and functionality of most of our products. In these cases, because the intellectual property we license is available from third parties, barriers to entry may be lower than if we owned exclusive rights to the technology we license and use. On the other hand, if a competitor or potential competitor enters into an exclusive arrangement with any of our key third party technology providers, or if any of these providers unilaterally decide not to do business with us for any reason, our ability to develop and sell products containing that technology would be severely limited. If we are shipping products which contain third party technology that we subsequently lose the right to license, then we will not be able to continue to offer or support those products. Our licenses often require royalty payments or other consideration to third parties. Our success will depend in part on our continued ability to have access to these technologies, and we do not know whether these third party technologies will continue to be licensed to us on commercially acceptable terms or at all. If we are unable to license the necessary technology, we may be forced to acquire or develop alternative technology of lower quality or performance standards. This would limit and delay our ability to offer new or competitive products and increase our costs of production. As a result, our margins, market share, and operating results could be significantly harmed.
We also utilize third party software development companies to develop, customize, maintain and support software that is incorporated into our products. If these companies fail to timely deliver or continuously maintain and support the software that we require of them, we may experience delays in releasing new products or difficulties with supporting existing products and customers.
If the redemption rate for our end-user promotional programs is higher than we estimate, then our net revenue and gross margin will be negatively affected.
From time to time we offer promotional incentives, including cash rebates, to encourage end-users to purchase certain of our products. Purchasers must follow specific and stringent guidelines to redeem these incentives or rebates. Often qualified purchasers choose not to apply for the incentives or fail to follow the required redemption guidelines, resulting in an incentive redemption rate of less than 100%. Based on historical data, we estimate an incentive redemption rate for our promotional programs. If the actual redemption rate is higher than our estimated rate, then our net revenue and gross margin will be negatively affected.
We are required to evaluate our internal control under Section 404 of the Sarbanes-Oxley Act of 2002 and any adverse results from such evaluation could impact investor confidence in the reliability of our internal controls over financial reporting.
Pursuant to Section 404 of the Sarbanes-Oxley Act of 2002, we are required to furnish a report by our management on our internal control over financial reporting. Such report must contain among other matters, an assessment of the effectiveness of our internal control over financial reporting as of the end of our fiscal year, including a statement as to whether or not our internal control over financial reporting is effective. This assessment must include disclosure of any material weaknesses in our internal control over financial reporting identified by management. Such report must also contain a statement that our independent registered public accounting firm has issued an audit report on management’s assessment of such internal controls.
We will continue to perform the system and process documentation and evaluation needed to comply with Section 404, which is both costly and challenging. During this process, if our management identifies one or more material weaknesses in our internal control over financial reporting, we will be unable to assert such internal control is effective. If we are unable to assert that our internal control over financial reporting is effective as of the end of a fiscal year, or if our independent registered public accounting firm is unable to attest that our management’s report is fairly stated or they are unable to express an opinion on the effectiveness of our internal control over financial reporting, we could lose investor confidence in the accuracy and completeness of our financial reports, which may have an adverse effect on our stock price.
16
We depend on a limited number of third-party contract manufacturers for substantially all of our manufacturing needs. If these contract manufacturers experience any delay, disruption or quality control problems in their operations, we could lose market share and our brand may suffer.
All of our products are manufactured, assembled, tested and generally packaged by a limited number of original design manufacturers, or ODMs, and original equipment manufacturers, or OEMs. We rely on our contract manufacturers to procure components and, in some cases, subcontract engineering work. Some of our products are manufactured by a single contract manufacturer. We do not have any long-term contracts with any of our third-party contract manufacturers. Some of these third-party contract manufacturers produce products for our competitors. The loss of the services of any of our primary third-party contract manufacturers could cause a significant disruption in operations and delays in product shipments. Qualifying a new contract manufacturer and commencing volume production is expensive and time consuming.
Our reliance on third-party contract manufacturers also exposes us to the following risks over which we have limited control:
| | |
| • | unexpected increases in manufacturing and repair costs; |
|
| • | inability to control the quality of finished products; |
|
| • | inability to control delivery schedules; and |
|
| • | potential lack of adequate capacity to manufacture all or a part of the products we require. |
All of our products must satisfy safety and regulatory standards and some of our products must also receive government certifications. Our ODM and OEM contract manufacturers are primarily responsible for obtaining most regulatory approvals for our products. If our ODMs and OEMs fail to obtain timely domestic or foreign regulatory approvals or certificates, we would be unable to sell our products and our sales and profitability could be reduced, our relationships with our sales channel could be harmed, and our reputation and brand would suffer.
If we are unable to provide our third-party contract manufacturers a timely and accurate forecast of our component and material requirements, we may experience delays in the manufacturing of our products and the costs of our products may increase.
We provide our third-party contract manufacturers with a rolling forecast of demand, which they use to determine our material and component requirements. Lead times for ordering materials and components vary significantly and depend on various factors, such as the specific supplier, contract terms and demand and supply for a component at a given time. Some of our components have long lead times, such as wireless local area network chipsets, switching fabric chips, physical layer transceivers, connector jacks and metal and plastic enclosures. If our forecasts are not timely provided or are less than our actual requirements, our contract manufacturers may be unable to manufacture products in a timely manner. If our forecasts are too high, our contract manufacturers will be unable to use the components they have purchased on our behalf. The cost of the components used in our products tends to drop rapidly as volumes increase and the technologies mature. Therefore, if our contract manufacturers are unable to promptly use components purchased on our behalf, our cost of producing products may be higher than our competitors due to an over supply of higher-priced components. Moreover, if they are unable to use components ordered at our direction, we will need to reimburse them for any losses they incur.
We rely upon third parties for technology that is critical to our products, and if we are unable to continue to use this technology and future technology, our ability to develop, sell, maintain and support technologically advanced products would be limited.
We rely on third parties to obtain non-exclusive patented hardware and software license rights in technologies that are incorporated into and necessary for the operation and functionality of most of our products. In these cases, because the intellectual property we license is available from third parties, barriers to entry may be lower than if we owned exclusive rights to the technology we license and use. On the other hand, if a competitor or potential competitor enters into an exclusive arrangement with any of our key third-party technology providers, or if any of these providers unilaterally decide not to do business with us for any reason, our ability to develop and sell products
17
containing that technology would be severely limited. If we are shipping products which contain third party technology that we subsequently lose the right to license, then we will not be able to continue to offer or support those products. Our licenses often require royalty payments or other consideration to third parties. Our success will depend in part on our continued ability to have access to these technologies, and we do not know whether these third-party technologies will continue to be licensed to us on commercially acceptable terms or at all. If we are unable to license the necessary technology, we may be forced to acquire or develop alternative technology of lower quality or performance standards. This would limit and delay our ability to offer new or competitive products and increase our costs of production. As a result, our margins, market share, and operating results could be significantly harmed.
We also utilize third party software development companies to develop, customize, maintain and support software that is incorporated into our products. If these companies fail to timely deliver or continuously maintain and support the software that we require of them, we may experience delays in releasing new products or difficulties with supporting existing products and customers.
If we are unable to secure and protect our intellectual property rights, our ability to compete could be harmed.
We rely upon third parties for a substantial portion of the intellectual property we use in our products. At the same time, we rely on a combination of copyright, trademark, patent and trade secret laws, nondisclosure agreements with employees, consultants and suppliers and other contractual provisions to establish, maintain and protect our intellectual property rights. Despite efforts to protect our intellectual property, unauthorized third parties may attempt to design around, copy aspects of our product design or obtain and use technology or other intellectual property associated with our products. For example, one of our primary intellectual property assets is the NETGEAR name, trademark and logo. We may be unable to stop third parties from adopting similar names, trademarks and logos, especially in those international markets where our intellectual property rights may be less protected. Furthermore, our competitors may independently develop similar technology or design around our intellectual property. Our inability to secure and protect our intellectual property rights could significantly harm our brand and business, operating results and financial condition.
Our sales and operations in international markets expose us to operational, financial and regulatory risks.
International sales comprise a significant amount of our overall net revenue. International sales were 62%60% of overall net revenue in fiscal 2006.2008. We anticipate that international sales may grow as a percentage of net revenue. We have committed resources to expanding our international operations and sales channels and these efforts may not be successful. International operations are subject to a number of other risks, including:
| | |
| • | political and economic instability, international terrorism and economic instability, international terrorism andanti-American sentiment, particularly in emerging markets; |
|
| • | preference for locally branded products, and laws and business practices favoring local competition; |
|
| • | exchange rate fluctuations; |
|
| • | increased difficulty in managing inventory; |
|
| • | delayed revenue recognition; |
|
| • | less effective protection of intellectual property; |
|
| • | stringent consumer protection and product compliance regulations, including but not limited to the recently enacted Restriction of Hazardous Substances directive and the Waste Electrical and Electronic Equipment, or WEEE directive in Europe, that may vary from country to country and that are costly to comply with; and |
|
| • | difficulties and costs of staffing and managing foreign operations. |
18
preference for locally branded products, and laws and business practices favoring local competition;exchange rate fluctuations;
increased difficulty in managing inventory;
delayed revenue recognition;
less effective protection of intellectual property;
stringent consumer protection and product compliance regulations, including but not limited to the recently enacted Restriction of Hazardous Substances directive and the Waste Electrical and Electronic Equipment directive in Europe, that may vary from country to country and that are costly to comply with;
difficulties and costs of staffing and managing foreign operations; and
changes in local tax laws.
We intend to expand our operations and infrastructure, which may strain our operations and increase our operating expenses.
We intend to expand our operations and pursue market opportunities domestically and internationally to grow our sales. We expect that this attempted expansion will strainrequire enhancements to our existing management
information systems, and operational and financial controls. In addition, if we continue to grow, our expenditures will likely be significantly higher than our historical costs. We may not be able to install adequate controls in an efficient and timely manner as our business grows, and our current systems may not be adequate to support our future operations. The difficulties associated with installing and implementing these new systems, procedures and controls may place a significant burden on our management, operational and financial resources. In addition, if we grow internationally, we will have to expand and enhance our communications infrastructure. If we fail to continue to improve our management information systems, procedures and financial controls or encounter unexpected difficulties during expansion, our business could be harmed.
Governmental regulations of imports or exports affecting Internet security could affect our net revenue.
Any additional governmental regulation of imports or exports or failure to obtain required export approval of our encryption technologies could adversely affect our international and domestic sales. The United States and various foreign governments have imposed controls, export license requirements, and restrictions on the import or export of some technologies, especially encryption technology. In addition, from time to time, governmental agencies have proposed additional regulation of encryption technology, such as requiring the escrow and governmental recovery of private encryption keys. In response to terrorist activity, governments could enact additional regulation or restriction on the use, import, or export of encryption technology. This additional regulation of encryption technology could delay or prevent the acceptance and use of encryption products and public networks for secure communications, resulting in decreased demand for our products and services. In addition, some foreign competitors are subject to less stringent controls on exporting their encryption technologies. As a result, they may be able to compete more effectively than we can in the United States and the international Internet security market.
We recently moved into a new corporate headquarters in the third quarter of 2008. If we cannot retain sub lessees for the remaining lease term of our old facilities, then we will be forced to take an additional charge related to such excess space.
We recently moved into our new corporate headquarters in the third quarter of 2008. The existing lease on our former Santa Clara corporate headquarters does not expire until the end of 2010 and the existing lease on our Fremont facility does not expire until the end of October 2009. We have subleased a portion of these facilities and taken a restructuring charge for the balance of the lease costs. If any tenant moves out or is unable to meet its obligations to us, we would have to record an additional charge associated with such excess space.
We are required to evaluate our internal control under Section 404 of the Sarbanes-Oxley Act of 2002 and any adverse results from such evaluation could impact investor confidence in the reliability of our internal controls over financial reporting.
Pursuant to Section 404 of the Sarbanes-Oxley Act of 2002, we are required to furnish a report by our management on our internal control over financial reporting. Such report must contain among other matters, an assessment of the effectiveness of our internal control over financial reporting as of the end of our fiscal year, including a statement as to whether or not our internal control over financial reporting is effective. This assessment must include disclosure of any material weaknesses in our internal control over financial reporting identified by management.
We will continue to perform the system and process documentation and evaluation needed to comply with Section 404, which is both costly and challenging. During this process, if our management identifies one or more material weaknesses in our internal control over financial reporting, we will be unable to assert such internal control is effective. If we are unable to assert that our internal control over financial reporting is effective as of the end of a fiscal year or if our independent registered public accounting firm is unable to express an opinion on the effectiveness of our internal control over financial reporting, we could lose investor confidence in the accuracy and completeness of our financial reports, which may have an adverse effect on our stock price.
We are continuing to implement our international reorganization, which is straining our resources and increasing our operating expenses.
We have been reorganizing our foreign subsidiaries and entities to better manage and optimize our international operations. Our implementation of this project requires substantial efforts by our staff and is resulting in increased staffing requirements and related expenses. Failure to successfully execute the reorganization or other factors outside of our control could negatively impact the timing and extent of any benefit we receive from the reorganization. As part
We depend on large, recurring purchases from certain significant customers, and a loss, cancellation or delay in purchases by these customers could negatively affect our revenue.
The loss of recurring orders from any of our more significant customers could cause our revenue and profitability to suffer. Our ability to attract new customers will depend on a variety of factors, including the cost-effectiveness, reliability, scalability, breadth and depth of our products. In addition, a change in the mix of our customers, or a change in the mix of direct and indirect sales, could adversely affect our revenue and gross margins.
Although our financial performance may depend on large, recurring orders from certain customers and resellers, we do not generally have binding commitments from them. For example:
our reseller agreements generally do not require substantial minimum purchases;
our customers can stop purchasing and our resellers can stop marketing our products at any time; and
our reseller agreements generally are not exclusive and are for one-year terms, with no obligation of the reorganization,resellers to renew the agreements.
Because our expenses are based on our revenue forecasts, a substantial reduction or delay in sales of our products to, or unexpected returns from, customers and resellers, or the loss of any significant customer or reseller, could harm or otherwise disrupt our business. Although our largest customers may vary from period to period, we anticipate that our operating results for any given period will continue to depend on large orders from a small number of customers.
We are required to expense equity compensation given to our employees, which could reduce our reported earnings, could significantly impact our operating results in future periods and could reduce our stock price and our ability to effectively utilize equity compensation to attract and retain employees.
We historically have used stock options as a significant component of our employee compensation program in order to align employees’ interests with the interests of our stockholders, encourage employee retention, and provide competitive compensation packages. The Financial Accounting Standards Board has adopted changes that require companies to record a charge to earnings for employee stock option grants and other equity incentives. As a result, we have been implementing new information technology systems, including new forecastingexperienced a substantial increase in compensation costs, and order processing systems. If we failthese charges could further significantly impact our operating results in future periods. This could require us to successfullyreduce the availability and timely integrate these new systems, we will suffer disruptionsamount of equity incentives provided to employees, which may make it more difficult for us to attract, retain and motivate key personnel. Moreover, if securities analysts, institutional investors and other investors adopt financial models that include stock option expense in their primary analysis of our operations. Any unanticipated interruptions infinancial results, our business operationsstock price could decline as a result of implementingreliance on these changesmodels with higher expense calculations. Each of these results could resultmaterially and adversely affect our business.
We are exposed to credit risk and fluctuations in loss or delaythe market values of our investment portfolio.
Although we have not recognized any material losses on our cash equivalents and short-term investments, future declines in revenue causing antheir market values could have a material adverse effect on our financial results.
Our stock price may be volatilecondition and your investment in our common stock could suffer a decline in value.
Withoperating results. Given the continuing uncertainty about economic conditions in the United States, there has been significant volatility in the market price and trading volume of securities of technology and other companies, which may be unrelated to the financial performance of these companies. These broad market fluctuations may negatively affect the market priceglobal nature of our common stock.
Some specificbusiness, we have investments both domestically andinternationally. A substantial portion of our money market funds are insured by the U.S. Treasury’s temporary guarantee program, which expires in April 2009. If these financial institutions default on their obligations or their credit ratings are negatively impacted by liquidity issues, credit deterioration or losses, financial results, or other factors, that maythe value of our cash equivalents and short-term investments could decline and result in a material impairment, which could have a significantmaterial adverse effect on our common stock market price include:
| | |
| • | actual or anticipated fluctuations in our operating results or our competitors’ operating results; |
|
| • | actual or anticipated changes in the growth rate of the general networking sector, our growth rates or our competitors’ growth rates; |
|
| • | conditions in the financial markets in general or changes in general economic conditions; |
|
| • | interest rate or currency exchange rate fluctuations; |
|
| • | our ability to raise additional capital; and |
|
| • | changes in stock market analyst recommendations regarding our common stock, other comparable companies or our industry generally. |
financial condition and operating results.NaturalEconomic conditions, political events, war, terrorism, public health issues, natural disasters mischievous actions or terrorist attacksand other circumstances could delay our ability to receive or ship our products, or otherwise disrupt our business.materially adversely affect us.
Our corporate headquarters are located in Northern California and one of our warehouses is located in Southern California, regions known for seismic activity. In addition, substantially all of our manufacturing occurs in two geographically concentrated areas in mainland China, where disruptions from natural disasters, health epidemics and political, social and economic instability may affect the region. If our manufacturers or warehousing facilities are disrupted or destroyed, we would be unable to distribute our products on a timely basis, which could
19
harm our business. Moreover, if our computer information systems or communication systems, or those of our vendors or customers, are subject to disruptive hacker attacks or other disruptions, our business could suffer. We have not established a formal disaster recovery plan. Ourback-up operations may be inadequate and our business interruption insurance may not be enough to compensate us for any losses that may occur. A significant business interruption could result in losses or damages and harm our business. For example, much of our order fulfillment process is automated and the order information is stored on our servers. If our computer systems and servers go down even for a short period at the end of a fiscal quarter, our ability to recognize revenue would be delayed until we were again able to process and ship our orders, which could cause our stock price to decline significantly.
We depend significantly on worldwide economic conditions and their impact on levels of consumer spending, which have recently deteriorated significantly in many countries and regions, including without limitation the United States, and may remain depressed for the foreseeable future. Factors that could influence the levels of consumer spending include increases in fuel and other energy costs, conditions in the residential real estate and mortgage markets, labor and healthcare costs, access to credit, consumer confidence and other macroeconomic factors affecting consumer spending behavior.
In addition, war, terrorism, geopolitical uncertainties, public health issues, and other business interruptions have caused and could cause damage or disruption to international commerce and the global economy, and thus could have a strong negative effect on us, our suppliers, logistics providers, manufacturing vendors and customers. Our business operations are subject to interruption by natural disasters, fire, power shortages, terrorist attacks, and other hostile acts, labor disputes, public health issues, and other events beyond our control. Such events could decrease demand for our products, make it difficult or impossible for us to make and deliver products to our customers or to receive components from our suppliers, and create delays and inefficiencies in our supply chain. Should major public health issues, including pandemics, arise, we could be negatively affected by more stringent employee travel restrictions, additional limitations in freight services, governmental actions limiting the movement of products between regions, delays in production ramps of new products, and disruptions in the operations of our manufacturing vendors and component suppliers.
If we lose the services of our Chairman and Chief Executive Officer, Patrick C.S. Lo, or our other key personnel, we may not be able to execute our business strategy effectively.
Our future success depends in large part upon the continued services of our key technical, sales, marketing and senior management personnel. In particular, the services of Patrick C.S. Lo, our Chairman and Chief Executive Officer, who has led our company since its inception, are very important to our business. In November 2006, Jonathan R. Mather, our former Executive Vice President and Chief Financial Officer, left the company to pursue other opportunities, and we are still in the process of hiring his replacement. We do not maintain any key person life insurance policies. The loss of any of our senior management or other key research, development, sales or marketing personnel, particularly if lost to competitors, could harm our ability to implement our business strategy and respond to the rapidly changing needs of the small business and home markets.
| |
| Item 1B.Unresolved | Unresolved Staff Comments.Comments |
Our principal administrative, sales, marketing and research and development facilities currently occupy approximately 74,000142,700 square feet in an office complex in Santa Clara,San Jose, California, under a lease that expires in December 2007, with a three-year renewal option. March 2018.
Our international headquarters occupy approximately 10,000 square feet in an office complex in Cork, Ireland, under a lease entered into in February 2006 and expiring in December 2026. Our international sales personnel reside in local sales offices or home offices in Austria, Australia, Brazil, China, Czech Republic, Denmark, France, Germany, Hong Kong, India, Italy, Japan, Korea, Mexico, New Zealand, Norway, Poland, Russia, Singapore, Spain, Sweden, Switzerland, the Netherlands, the United Arab Emirates, and the United Kingdom. We also have operations personnel using a leased facility in Hong Kong, which is subleased from our third party logistics provider, Kerry Logistics.Kong. We also maintain a research and development facilityfacilities in Beijing, Guangzhou, Nanjing, and Shanghai, China, and in Taipei, Taiwan. From time to time we consider various alternatives related to our long-term facilities needs. While we believe our existing facilities are adequate to meet our immediate needs, it may be necessary to lease additional space to accommodate future growth.
We use third parties to provide warehousing services to us, consisting of facilities in Southern California, Hong Kong and the Netherlands.
The information set forth under Note 68 of the Notes to Consolidated Financial Statements, included in Part IV, Item 15 of this report,Form 10-K, is incorporated herein by reference. For an additional discussion of certain risks associated with legal proceedings, see the section entitled “Risk Factors” in Part I, Item 1A of this report.
| |
| Item 4. | Submission of Matters to a Vote of Security Holders |
No matters were submitted to a vote of the security holders during the fourth quarter ended December 31, 2006.
202008.
PART II
| |
| Item 5. | Market for Registrant’s Common Stock,Equity, Related Stockholder Matters and Issuer Purchases of Equity Securities |
Market Information
Our common stock has been quoted under the symbol “NTGR” on the Nasdaq National Market from July 31, 2003 to July 1, 2006, and on the Nasdaq Global Select Market since then. Prior to that time, there was no public market for our common stock. The following table sets forth for the indicated periods the high and low sales prices for our common stock on the Nasdaq markets. Such information reflects interdealer prices, without retail markup, markdown or commission, and may not represent actual transactions.
| | | | | | | | | |
Fiscal Year Ended December 31, 2005 | | High | | | Low | |
| |
| First Quarter | | $ | 19.16 | | | $ | 13.45 | |
| Second Quarter | | | 20.78 | | | | 12.96 | |
| Third Quarter | | | 25.73 | | | | 18.65 | |
| Fourth Quarter | | | 24.30 | | | | 17.52 | |
| | | | | | | | | |
Fiscal Year Ended December 31, 2006 | | High | | | Low | |
| |
| First Quarter | | $ | 19.59 | | | $ | 16.64 | |
| Second Quarter | | | 25.39 | | | | 18.40 | |
| Third Quarter | | | 21.64 | | | | 16.92 | |
| Fourth Quarter | | | 28.15 | | | | 20.01 | |
| | | | | | |
Fiscal Year Ended December 31, 2007 | | High | | Low |
First Quarter | | $ | 31.31 | | $ | 25.00 |
Second Quarter | | | 38.75 | | | 28.50 |
Third Quarter | | | 41.33 | | | 25.85 |
Fourth Quarter | | | 37.00 | | | 29.70 |
| | | | | | |
Fiscal Year Ended December 31, 2008 | | High | | Low |
First Quarter | | $ | 34.92 | | $ | 18.58 |
Second Quarter | | | 20.68 | | | 13.80 |
Third Quarter | | | 17.50 | | | 12.41 |
Fourth Quarter | | | 15.17 | | | 8.21 |
On February 16, 2007,17, 2009, there were 2637 stockholders of record.
21
Equity Compensation Plan InformationThe following table provides information as of December 31, 2008 about our common stock that may be issued upon the exercise of options and rights granted to employees or members of our Board of Directors under all existing equity compensation plans, including the 2000 Plan (which was terminated as to new grants in May 2003), the 2003 Stock Plan, the 2006 Long Term Incentive Plan, the 2006 Stand-Alone Stock Option Agreement and the 2003 Employee Stock Purchase Plan.
| | | | | | | | | |
Plan Category | | Number of Securities
to be Issued Upon
Exercise of
Outstanding Options,
Warrants and Rights | | | Weighted-Average
Exercise Price of
Outstanding Options,
Warrants and Rights | | Number of Securities
Remaining Available for
Future Issuance Under
Equity Compensation Plans
(Excluding Securities
Reflected in Column (a)) | |
| | | (a) | | | (b) | | (c) | |
Equity compensation plans approved by security holders | | 4,081,753 | (1) | | $ | 19.82 | | 2,682,229 | (2) |
Equity compensation plans not approved by security holders | | 68,749 | (3) | | $ | 19.16 | | — | |
| | | | | | | | | |
Total | | 4,150,502 | | | $ | 19.81 | | 2,682,229 | |
| | | | | | | | | |
| (1) | Includes 1,580,422 shares outstanding under the 2003 Plan, 2,501,331 shares outstanding under the 2006 Plan and no outstanding shares under the 2003 Employee Stock Purchase Plan. |
| (2) | Includes 160,737 shares available for issuance under the 2003 Plan, 2,345,289 shares available for issuance under the 2006 Plan and 176,203 shares available for issuance under the 2003 Employee Stock Purchase Plan. |
| (3) | Consists of 68,749 shares outstanding under the 2006 Stand-Alone Stock Option Agreement. |
Company Performance
Notwithstanding any statement to the contrary in any of our previous or future filings with the Securities and Exchange Commission,SEC, the following information relating to the price performance of our common stock shall not be deemed “filed” with the CommissionSEC or “soliciting material” under the 1934Exchange Act and shall not be incorporated by reference into any such filings.
The following graph shows a comparison from JulyDecember 31, 2003 (the date our common stock commenced trading on the Nasdaq National Market) through December 31, 20062008 of cumulative total return for our common stock, the Nasdaq Composite Index and the Nasdaq Computer Index. Such returns are based on historical results and are not intended to suggest future performance. Data for the Nasdaq Composite Index and the Nasdaq Computer Index assume reinvestment of dividends. We have never paid dividends on our common stock and have no present plans to do so.
| | | | | | | | | | | | | | | | | | | | | | | | | | |
| | | | July 31, 2003 | | | | December 31, 2003 | | | | December 31, 2004 | | | | December 31, 2005 | | | | December 31, 2006 | |
| NETGEAR, Inc. | | | $ | 100.00 | | | | $ | 90.39 | | | | $ | 102.66 | | | | $ | 108.82 | | | | $ | 148.39 | |
| NASDAQ Computer Index | | | $ | 100.00 | | | | $ | 116.78 | | | | $ | 120.58 | | | | $ | 123.89 | | | | $ | 131.51 | |
| NASDAQ Composite Index | | | $ | 100.00 | | | | $ | 115.47 | | | | $ | 125.38 | | | | $ | 127.11 | | | | $ | 139.21 | |
| | | | | | | | | | | | | | | | | | | | | | | | | | |
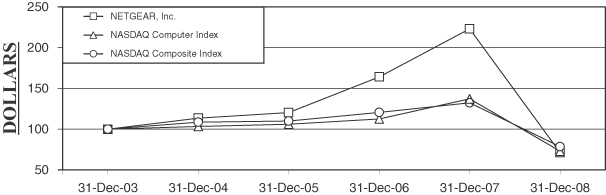
| | | | | | | | | | | | | | | | | | |
| | | December 31,
2003 | | December 31,
2004 | | December 31,
2005 | | December 31,
2006 | | December 31,
2007 | | December 31,
2008 |
NETGEAR, Inc. | | $ | 100.00 | | $ | 113.57 | | $ | 120.39 | | $ | 164.17 | | $ | 223.08 | | $ | 71.36 |
NASDAQ Computer Index | | $ | 100.00 | | $ | 103.25 | | $ | 106.09 | | $ | 112.61 | | $ | 137.22 | | $ | 73.15 |
NASDAQ Composite Index | | $ | 100.00 | | $ | 108.59 | | $ | 110.08 | | $ | 120.56 | | $ | 132.39 | | $ | 78.72 |
Dividend Policy
We have never declared or paid cash dividends on our capital stock. We currently intend to retain future earnings, if any, to finance the operation and expansion of our business, and we do not anticipate paying cash dividends in the foreseeable future.
22
Repurchase of Equity Securities by the Company
| | | | | | | | | |
Period | | Total Number of
Shares
Purchased | | Average Price
Paid per
Share | | Total Number of Shares
Purchased as Part of
Publicly Announced
Plans or Programs | | Maximum Number of Shares
that May Yet Be Purchased
Under the Plans or Programs |
January 1, 2008-January 31, 2008 | | 5,448 | | $ | 28.79 | | — | | — |
February 1, 2008-February 29, 2008 | | — | | | — | | — | | — |
March 1, 2008-March 31, 2008 | | — | | | — | | — | | — |
April 1, 2008-April 30, 2008 | | — | | | — | | — | | — |
May 1, 2008-May 31, 2008 | | 1,403 | | | 18.40 | | — | | — |
June 1, 2008-June 30, 2008 | | — | | | — | | — | | — |
July 1, 2008-July 31, 2008 | | — | | | — | | — | | — |
August 1, 2008-August 31, 2008 | | — | | | — | | — | | — |
September 1, 2008-September 30, 2008 | | — | | | — | | — | | — |
October 1, 2008-October 31, 2008 | | 174,341 | | | 8.95 | | 173,000 | | 5,827,000 |
November 1, 2008-November 30, 2008 | | 995,780 | | | 10.52 | | 995,780 | | 4,831,220 |
December 1, 2008-December 31, 2008 | | 805 | | | 11.15 | | — | | 4,831,220 |
| | | | | | | | | |
| | 1,177,777 | | $ | 10.38 | | 1,168,780 | | 4,831,220 |
| | | | | | | | | |
Equity Compensation Plan Information
The following table summarizesOn October 21, 2008, our Board of Directors authorized management to repurchase up to 6,000,000 shares of our outstanding common stock. Under this authorization, the timing and actual number of outstanding options grantedshares subject to employeesrepurchase are at the discretion of management and directors, as well as theare contingent on a number of securities remaining availablefactors, such as levels of cash generation from operations, cash requirements for future issuance, underacquisitions and our compensation plans as ofshare price. During the fiscal year ended December 31, 2006.
| | | | | | | | | | | | | |
| | | | | | | | | (c)
| |
| | | (a)
| | | | | | Number of Securities
| |
| | | Number of Securities
| | | (b)
| | | Remaining Available for
| |
| | | to be Issued Upon
| | | Weighted-Average
| | | Future Issuance Under
| |
| | | Exercise of
| | | Exercise Price of
| | | Equity Compensation Plans
| |
| | | Outstanding Options,
| | | Outstanding Options,
| | | (Excluding Securities
| |
Plan Category | | Warrants and Rights | | | Warrants and Rights | | | Reflected in Column(a)) | |
| |
| Equity compensation plans approved by security holders(1) | | | 4,048,457 | | | $ | 14.37 | | | | 1,911,861 | |
| Equity compensation plans not approved by security holder | | | — | | | | — | | | | — | |
| | |
(1) | | These plans include our 2000 Stock Option Plan, 2003 Stock Plan, 2006 Long Term Incentive Plan, 2006 Stand-Alone Stock Option Agreement, and 2003 Employee Stock Purchase Plan. |
23
| |
| Item 6. | Selected Consolidated Financial Data |
The following selected consolidated financial data are qualified in their entirety, and should be read in conjunction with, the consolidated financial statements and related notes thereto, and “Management’s Discussion and Analysis of Financial Condition and Results of Operations” included elsewhere in thisForm 10-K.
We derived the selected consolidated statement of operations data for the years ended December 2004, 2005, and 2006 and the selected consolidated balance sheet data as of December 31, 2005 and 2006 from our audited consolidated financial statements appearing elsewhere in thisForm 10-K.We derived the selected consolidated statement of operations data for the years ended December 31, 20022008, 2007 and 20032006 and the selected consolidated balance sheet data as of December 31, 2002, 20032008 and 2007 from our audited consolidated financial statements appearing elsewhere in this Form 10-K. We derived the selected consolidated statement of operations data for the years ended December 31, 2005 and 2004 and the selected consolidated balance sheet data as of December 31, 2006, 2005 and 2004 from our audited consolidated financial statements, which are not included in thisForm 10-K.
| | | | | | | | | | | | | | | | | | | | | |
| | | Year Ended December 31, | |
| | | 2002 | | | 2003 | | | 2004 | | | 2005 | | | 2006 | |
| | | (In thousands, except per share data) | |
| |
Consolidated Statement of Operations Data: | | | | | | | | | | | | | | | | | | | | |
| Net revenue | | $ | 237,331 | | | $ | 299,302 | | | $ | 383,139 | | | $ | 449,610 | | | $ | 573,570 | |
| Cost of revenue(2) | | | 177,116 | | | | 215,460 | | | | 260,318 | | | | 297,911 | | | | 379,911 | |
| | | | | | | | | | | | | | | | | | | | | |
| Gross profit | | | 60,215 | | | | 83,842 | | | | 122,821 | | | | 151,699 | | | | 193,659 | |
| | | | | | | | | | | | | | | | | | | | | |
| Operating expenses: | | | | | | | | | | | | | | | | | | | | |
| Research and development(2) | | | 7,665 | | | | 8,674 | | | | 10,316 | | | | 12,837 | | | | 18,443 | |
| Sales and marketing(2) | | | 32,968 | | | | 49,678 | | | | 62,247 | | | | 71,345 | | | | 91,881 | |
| General and administrative(2) | | | 8,970 | | | | 9,453 | | | | 14,905 | | | | 14,559 | | | | 20,905 | |
| In-process research and development | | | — | | | | — | | | | — | | | | — | | | | 2,900 | |
| Litigation reserves | | | — | | | | — | | | | — | | | | 802 | | | | — | |
| | | | | | | | | | | | | | | | | | | | | |
| Total operating expenses | | | 49,603 | | | | 67,805 | | | | 87,468 | | | | 99,543 | | | | 134,129 | |
| | | | | | | | | | | | | | | | | | | | | |
| Income from operations | | | 10,612 | | | | 16,037 | | | | 35,353 | | | | 52,156 | | | | 59,530 | |
| Interest income | | | 119 | | | | 364 | | | | 1,593 | | | | 4,104 | | | | 6,974 | |
| Interest expense | | | (1,240 | ) | | | (901 | ) | | | — | | | | — | | | | — | |
| Extinguishment of debt | | | — | | | | (5,868 | ) | | | — | | | | — | | | | — | |
| Other income (expense) | | | (19 | ) | | | (59 | ) | | | (560 | ) | | | (1,770 | ) | | | 2,495 | |
| | | | | | | | | | | | | | | | | | | | | |
| Income before taxes | | | 9,472 | | | | 9,573 | | | | 36,386 | | | | 54,490 | | | | 68,999 | |
| Provision for (benefit from) income taxes | | | 1,333 | | | | (3,524 | ) | | | 12,921 | | | | 20,867 | | | | 27,867 | |
| | | | | | | | | | | | | | | | | | | | | |
| Net income | | | 8,139 | | | | 13,097 | | | | 23,465 | | | | 33,623 | | | | 41,132 | |
| Deemed dividend on preferred stock | | | (17,881 | ) | | | — | | | | — | | | | — | | | | — | |
| | | | | | | | | | | | | | | | | | | | | |
| Net income (loss) attributable to common stockholders | | $ | (9,742 | ) | | $ | 13,097 | | | $ | 23,465 | | | $ | 33,623 | | | $ | 41,132 | |
| | | | | | | | | | | | | | | | | | | | | |
| Net income (loss) per share attributable to common stockholders: | | | | | | | | | | | | | | | | | | | | |
| Basic(1) | | $ | (0.46 | ) | | $ | 0.55 | | | $ | 0.77 | | | $ | 1.04 | | | $ | 1.23 | |
| | | | | | | | | | | | | | | | | | | | | |
| Diluted(1) | | $ | (0.46 | ) | | $ | 0.49 | | | $ | 0.72 | | | $ | 0.99 | | | $ | 1.19 | |
| | | | | | | | | | | | | | | | | | | | | |
| | | | | | | | | | | | | | | | | | |
| | | Year Ended December 31, | |
| | | 2008 | | | 2007 | | 2006 | | 2005 | | | 2004 | |
| | | (In thousands, except per share data) | |
Consolidated Statement of Operations Data: | | | | | | | | | | | | | | | | | | |
Net revenue | | $ | 743,344 | | | $ | 727,787 | | $ | 573,570 | | $ | 449,610 | | | $ | 383,139 | |
Cost of revenue(2) | | | 502,320 | | | | 485,180 | | | 379,911 | | | 297,911 | | | | 260,318 | |
| | | | | | | | | | | | | | | | | | |
Gross profit | | | 241,024 | | | | 242,607 | | | 193,659 | | | 151,699 | | | | 122,821 | |
| | | | | | | | | | | | | | | | | | |
Operating expenses: | | | | | | | | | | | | | | | | | | |
Research and development(2) | | | 33,773 | | | | 28,070 | | | 18,443 | | | 12,837 | | | | 10,316 | |
Sales and marketing(2) | | | 121,687 | | | | 117,938 | | | 91,881 | | | 71,345 | | | | 62,247 | |
General and administrative(2) | | | 31,733 | | | | 27,220 | | | 20,905 | | | 14,559 | | | | 14,905 | |
Restructuring | | | 1,929 | | | | — | | | — | | | — | | | | — | |
In-process research and development | | | 1,800 | | | | 4,100 | | | 2,900 | | | — | | | | — | |
Litigation reserves, net | | | 711 | | | | 167 | | | — | | | 802 | | | | — | |
| | | | | | | | | | | | | | | | | | |
Total operating expenses | | | 191,633 | | | | 177,495 | | | 134,129 | | | 99,543 | | | | 87,468 | |
| | | | | | | | | | | | | | | | | | |
Income from operations | | | 49,391 | | | | 65,112 | | | 59,530 | | | 52,156 | | | | 35,353 | |
Interest income, net | | | 4,336 | | | | 8,426 | | | 6,974 | | | 4,104 | | | | 1,593 | |
Other income (expense), net | | | (8,384 | ) | | | 3,298 | | | 2,495 | | | (1,770 | ) | | | (560 | ) |
| | | | | | | | | | | | | | | | | | |
Income before income taxes | | | 45,343 | | | | 76,836 | | | 68,999 | | | 54,490 | | | | 36,386 | |
Provision for income taxes | | | 27,293 | | | | 30,882 | | | 27,867 | | | 20,867 | | | | 12,921 | |
| | | | | | | | | | | | | | | | | | |
Net income | | $ | 18,050 | | | $ | 45,954 | | $ | 41,132 | | $ | 33,623 | | | $ | 23,465 | |
| | | | | | | | | | | | | | | | | | |
Net income per share: | | | | | | | | | | | | | | | | | | |
Basic(1) | | $ | 0.51 | | | $ | 1.32 | | $ | 1.23 | | $ | 1.04 | | | $ | 0.77 | |
| | | | | | | | | | | | | | | | | | |
Diluted(1) | | $ | 0.51 | | | $ | 1.28 | | $ | 1.19 | | $ | 0.99 | | | $ | 0.72 | |
| | | | | | | | | | | | | | | | | | |
| | |
| (1) | | Information regarding calculation of per share data is described in Note 45 of the Notes to Consolidated Financial Statements. |
24
| | |
| (2) | | Stock-based compensation expense was allocated as follows: |
| | | | | | | | | | | | | | | | | | | | | |
| Cost of revenue | | $ | 144 | | | $ | 128 | | | $ | 163 | | | $ | 147 | | | $ | 430 | |
| Research and development | | | 306 | | | | 454 | | | | 400 | | | | 293 | | | | 1,119 | |
| Sales and marketing | | | 346 | | | | 715 | | | | 733 | | | | 375 | | | | 1,405 | |
| General and administrative | | | 867 | | | | 476 | | | | 391 | | | | 249 | | | | 1,551 | |
| | | | | | | | | | | | | | | |
Cost of revenue | | $ | 864 | | $ | 633 | | $ | 430 | | $ | 147 | | $ | 163 |
Research and development | | | 3,218 | | | 2,391 | | | 1,119 | | | 293 | | | 400 |
Sales and marketing | | | 3,406 | | | 3,013 | | | 1,405 | | | 375 | | | 733 |
General and administrative | | | 3,835 | | | 2,842 | | | 1,551 | | | 249 | | | 391 |
Effective January 1, 2006, the Companywe adopted Statement of Financial Accounting Standards (“SFAS”) No. 123 (revised 2004), “Share-Based Payment” (“SFAS 123R”).
| | | | | | | | | | | | | | | | | | | | | |
| | | December 31, | |
| | | 2002 | | | 2003 | | | 2004 | | | 2005 | | | 2006 | |
| | | (In thousands) | |
| |
Consolidated Balance Sheet Data: | | | | | | | | | | | | | | | | | | | | |
| Cash, cash equivalents and short-term investments | | $ | 19,880 | | | $ | 73,605 | | | $ | 141,715 | | | $ | 173,656 | | | $ | 197,465 | |
| Working capital | | | 13,753 | | | | 130,755 | | | | 180,696 | | | | 230,416 | | | | 280,877 | |
| Total assets | | | 93,851 | | | | 205,146 | | | | 300,238 | | | | 356,297 | | | | 437,904 | |
| Total current liabilities | | | 76,396 | | | | 70,207 | | | | 115,044 | | | | 120,293 | | | | 143,482 | |
| Redeemable convertible preferred stock | | | 48,052 | | | | — | | | | — | | | | — | | | | — | |
| Total stockholders’ equity (deficit) | | | (30,597 | ) | | | 134,939 | | | | 185,194 | | | | 236,004 | | | | 294,422 | |
| | | | | | | | | | | | | | | |
| | | December 31, |
| | | 2008 | | 2007 | | 2006 | | 2005 | | 2004 |
| | | (In thousands) |
Consolidated Balance Sheet Data: | | | | | | | | | | | | | | | |
Cash, cash equivalents and short-term investments | | $ | 203,009 | | $ | 205,343 | | $ | 197,465 | | $ | 173,656 | | $ | 141,715 |
Working capital | | $ | 312,843 | | $ | 311,082 | | $ | 280,877 | | $ | 230,416 | | $ | 180,696 |
Total assets | | $ | 586,209 | | $ | 551,109 | | $ | 437,904 | | $ | 356,297 | | $ | 300,238 |
Total current liabilities | | $ | 176,505 | | $ | 168,507 | | $ | 143,482 | | $ | 120,293 | | $ | 115,044 |
Total stockholders’ equity | | $ | 390,958 | | $ | 371,523 | | $ | 294,422 | | $ | 236,004 | | $ | 185,194 |
| Item 7. | Management’s Discussion and Analysis of Financial Condition and Results of Operations |
Item 7. Management’s Discussion and Analysis of Financial Condition and Results of Operations
You should read the following discussion of our financial condition and results of operations together with the audited consolidated financial statements and notes to the financial statements included elsewhere in thisForm 10-K. This discussion contains forward-looking statements that involve risks and uncertainties. The forward-looking statements are not historical facts, but rather are based on current expectations, estimates, assumptions and projections about our industry, business and future financial results. Our actual results could differ materially from the results contemplated by these forward-looking statements due to a number of factors, including those discussed under “Risk Factors” in Part I, Item 1A above.
We design, develop and market innovative networking products that address the specific needs of small business and home users. We define small business as a business with fewer than 250 employees. We are focused on satisfying theease-of-use, reliability, performance and affordability requirements of these users. Our product offerings enable users to share Internet access, peripherals, files, digital multimedia content and applications among multiple personal computers, or PCs,networked devices and other Internet-enabled devices.
Our product line consists of wired and wireless devices that enable Ethernet networking, broadband access, and network connectivity. These products are available in multiple configurations to address the needs of our end-users in each geographic region in which our products are sold.
We sell our networking products through multiple sales channels worldwide, including traditional retailers, online retailers, wholesale distributors, DMRs, VARs, and broadband service providers. Our retail channel includes traditional retail locations domestically and internationally, such as Best Buy, Circuit City, CompUSA, Costco, Fry’s Electronics, Radio Shack, Staples, Argos (U.K.), Dixons (U.K.), PC World (U.K.), MediaMarkt (Germany, Austria), and FNAC (France). Online retailers include Amazon.com, Dell, Newegg.com and Buy.com. Our DMRs include Dell, CDW Corporation, Insight Corporation and PC Connection in domestic markets and Misco throughout Europe. In addition, we also sell our products through broadband service providers, such as multiple system operators in domestic markets(MSOs), DSL, and cableother broadband technology operators domestically and DSL operators internationally. Some of these retailers and resellersbroadband service providers purchase directly from us while mostothers are fulfilled through wholesale distributors around the world. A substantial portion of our net revenue to date has been derived from a limited number of wholesale distributors, the
25
largest of which are Ingram Micro Inc. and Tech Data Corporation. We expect that these wholesale distributors will continue to contribute a significant percentage of our net revenue for the foreseeable future.
We have well developed channels in the United States and Europe, Middle-East and Africa, or EMEA, and are building a strong presence in the Asia Pacific region.and Latin American regions. We derive the majority of our net revenue from international sales. International sales as a percentage of net revenue grewdecreased from 56% in 2005 to 62% in 2006. Sales2007 to 60% in EMEA grew2008. International sales decreased from $200.0$454.1 million in 20052007 to $298.2$445.7 million in 2006, 2008,
representing an increasea decrease of approximately 49%1.8% during that period. We continue to penetrate new markets such as Brazil, Russia and Eastern Europe, India, and the Middle-East.
Our net revenue grew 27.6%2.1% during the year ended December 31, 2006,2008 primarily attributable to higher sales of DSL gateway and powerlineincreased shipments in our wireless-G products to new and existing service provider customers especially in Europe, as well as continued strengthsales of our ReadyNAS products, which were acquired in connection with our RangeMax wirelessMay 16, 2007 acquisition of Infrant Technologies, Inc. (“Infrant”). We have also experienced growth in wireless-N router product line.
sales. The growth was offset by a decrease in DSL gateway products sold.The small business and home networking markets are intensely competitive and subject to rapid technological change. We expect our competition to continue to intensify. We believe that the principal competitive factors in the small business and home markets for networking products include product breadth, size and scope of the sales channel, brand name, timeliness of new product introductions, product performance, features, functionality and reliability,ease-of-installation, maintenance and use, and customer service and support. To remain competitive, we believe we must invest significant resources in developing new products and enhancing our current products expandingwhile continuing to expand our channels and maintaining customer satisfaction worldwide.
The current recessionary environment and overall weakness in consumer demand will negatively impact net revenue in the coming year. We expect global sales to decline as weakness in the U.S. and United Kingdom is spreading to continental Europe and Australia. We anticipate further erosion of our gross and operating margins in the first quarter of 2009 due to our foreign currency business exposure. However, we foresee our operating margin improving in the second quarter of 2009 when our local currency pricing actions have had a chance to catch up with the strength of the rising U.S. dollar and our new products will have a meaningful margin impact. In the interim, we are taking immediate actions to reduce our cost structure and improve our operating margins. In this effort, we plan to reduce the variable components of employee compensation, reduce the base compensation of executives and country managers by 10%, forego bonuses for all executives and eligible employees in 2009, as well as reduce overall headcount through natural attrition.
Our gross margin improveddecreased to 33.8%32.4% for the year ended December 31, 20062008, from 33.7%33.3% for the year ended December 31, 2005. Our gross margin improvement was2007, primarily dueattributable to decreased marketing costs and improved vendor rebates, offset by increased sales of products carrying lower gross margins to service providers.providers and the impact on our foreign currency denominated revenues due to the strengthening of the U.S. dollar, as well as higher warranty costs associated with end-user warranty returns. Additionally, inventory reserves increased primarily due to selling prices of certain products, primarily attributable to the strengthening of the U.S. dollar in locations where we bill in local currencies, falling below cost. These negative margin impacts were partially mitigated by reduced air freight expenses as a result of increased on-hand inventory levels, as well as reduced marketing expenses. Operating expenses for the year ended December 31, 20062008 were $134.1$191.6 million, or 23.4%25.8% of net revenue, and $99.5compared to $177.5 million, or 22.1%24.4% of net revenue, for the year ended December 31, 2005.
2007. This increase was primarily attributable to higher legal fees of $3.5 million, a $3.0 million increase in salary and other employee related expenses, and a $2.2 million increase in stock based compensation.Net income increased $7.5decreased $27.9 million, or 60.7%, to $41.1$18.1 million for the year ended December 31, 20062008, from $33.6$46.0 million for the year ended December 31, 2005.2007. This increasedecrease was dueprimarily attributable to an increase in gross profit of $42.0 million and an increase in interest and other income of $7.1 million, offset by an increase in operating expenses of $34.6$14.1 million, a decrease in other income (expense), net, of $11.7 million, and an increasea decrease in interest income, net, of $4.1 million. These decreases in pre-tax income were offset by a decrease in provision for income taxes of $7.0$3.6 million.
Critical Accounting Policies and Estimates
Our consolidated financial statements have been prepared in accordance with accounting principles generally accepted in the United States of America.America and pursuant to the rules and regulations of the SEC. The preparation of these financial statements requires management to make assumptions, judgments and estimates that can have a significant impact on the reported amounts of assets, liabilities, revenues and expenses. We base our estimates on historical experience and on various other assumptions believed to be applicable and reasonable
under the circumstances. Actual results could differ significantly from these estimates. These estimates may change as new events occur, as additional information is obtained and as our operating environment changes. On a regular basis we evaluate our assumptions, judgments and estimates and make changes accordingly. We also discuss our critical accounting estimates with the Audit Committee of the Board of Directors. Note 1 of the Notes to Consolidated Financial Statements describes the significant accounting policies used in the preparation of the consolidated financial statements. We have listed below our critical accounting policies which we believe to have the greatest potential impact on our consolidated financial statements. Historically, our assumptions, judgments and estimates relative to our critical accounting policies have not differed materially from actual results.
Revenue from product sales is recognized at the time the product is shipped provided that persuasive evidence of an arrangement exists, title and risk of loss has transferred to the customer, the selling price is fixed or determinable and collection of the related receivable is reasonably assured. Currently, for some of our customers, title passes to the customer upon delivery to the port or country of destination, upon their receipt of the product, or upon the customer’s resale of the product. At the end of each fiscal quarter, we estimate and defer revenue related to product where title has not transferred. The revenue continues to be deferred until such time that title passes to the
26
customer. The amount and timing of our revenue for any period could be materially different if our management made different judgments and estimates.
Allowances for Product Warranties, Returns due to Stock Rotation, Price Protection, Sales Incentives and Doubtful Accounts
Our standard warranty obligation to our direct customers generally provides for a right of return of any product for a full refund in the event that such product is not merchantable or is found to be damaged or defective. At the time revenue is recognized, an estimate of future warranty returns is recorded to reduce revenue in the amount of the expected credit or refund to be provided to the our direct customers. At the time we record the reduction to revenue related to warranty returns, we include within cost of revenue a write-down to reduce the carrying value of such products to net realizable value. Our standard warranty obligation to end-users provides for repair or replacement of a defective product for one or more years. Factors that affect the warranty obligation include product failure rates, material usage, and service delivery costs incurred in correcting product failures. The estimated cost associated with fulfilling the warranty obligation to end-users is recorded in cost of revenue. Because our products are manufactured by contractthird party manufacturers, in certain cases we have recourse to the contractthird party manufacturer for replacement or credit for the defective products. We give consideration to amounts recoverable from our contractthird party manufacturers in determining our warranty liability. Our estimated allowances for product warranties can vary from actual results and we may have to record additional revenue reductions or charges to cost of revenue which could materially impact our financial position and results of operations.
In addition to warranty-related returns, certain distributors and retailers generally have the right to return product for stock rotation purposes. Every quarter, stock rotation rights are generally limited to 10% of invoiced sales to the distributor or retailer in the prior quarter. Upon shipment of the product, we reduce revenue for an estimate of potential future stock rotation returns related to the current period product revenue. We analyze historical returns, channel inventory levels, current economic trends and changes in customer demand for our products when evaluating the adequacy of the allowance for sales returns, namely stock rotation returns. Our estimated allowances for returns due to stock rotation can vary from actual results and we may have to record additional revenue reductions which could materially impact our financial position and results of operations.
Sales incentives provided to customers are accounted for in accordance with Emerging Issues Task Force (“EITF”) IssueNo. 01-9, “Accounting for Consideration Given by a Vendor to a Customer or Reseller of the Vendor’s Products”.01-9. Under these guidelines, we accrue for sales incentives as a marketing expense if we receive an identifiable benefit in exchange and can reasonably estimate the fair value of the identifiable benefit
received; otherwise, it is recorded as a reduction of revenues. Our estimated provisions for sales incentives can vary from actual results and we may have to record additional expenses or additional revenue reductions dependent on the classification of the sales incentive.
We maintain an allowance for doubtful accounts for estimated losses resulting from the inability of our customers to make required payments. We regularly perform credit evaluations of our customers’ financial condition and consider factors such as historical experience, credit quality, age of the accounts receivable balances, and geographic or country-specific risks and economic conditions that may affect a customer’s ability to pay. The allowance for doubtful accounts is reviewed monthly and adjusted if necessary based on our assessments of our customers’ ability to pay. If the financial condition of our customers should deteriorate or if actual defaults are higher than our historical experience, additional allowances may be required, which could have an adverse impact on operating expenses.
We value our inventory at the lower of cost or market, cost being determined using thefirst-in, first-out method. We continually assess the value of our inventory and will periodically write down its value for estimated excess and obsolete inventory based upon assumptions about future demand and market conditions. On a quarterly basis, we review inventory quantities on hand and on order under non-cancelable purchase commitments, including consignment inventory, in comparison to our estimated forecast of product demand for the next nine months to determine what inventory, if any, are not saleable. Our analysis is based on the demand forecast but takes into
27
account market conditions, product development plans, product life expectancy and other factors. Based on this analysis, we write down the affected inventory value for estimated excess and obsolescence charges. At the point of loss recognition, a new, lower cost basis for that inventory is established, and subsequent changes in facts and circumstances do not result in the restoration or increase in that newly established cost basis. As demonstrated during prior years, demand for our products can fluctuate significantly. If actual demand is lower than our forecasted demand and we fail to reduce our manufacturing accordingly, we could be required to write down additional inventory, which would have a negative effect on our gross margin.
profit.Goodwill and intangibles
We apply SFAS No. 142, “Goodwill and Other Intangible Assets” and perform an annual goodwill impairment test. Should certain events or indicators of impairment occur between annual impairment tests, we will perform the impairment test as those events or indicators occur. For purposes of impairment testing, we have determined that we have only one reporting unit.
The goodwill impairment test involves a two-step process. In the first step, we estimate our fair value and compare the fair value with the carrying value of our net assets. If the fair value is greater than the carrying value of our net assets, then no impairment results. If the fair value is less than our carrying value, then we would perform the second step and determine the fair value of the goodwill. In this second step, the amount of impairment is determined by comparing the implied fair value to the carrying value of the goodwill in the same manner as if we were being acquired in a business combination. Specifically, we would allocate the fair value to all of our assets and liabilities, including any unrecognized intangible assets, in a hypothetical analysis that would calculate the implied fair value of goodwill. If the implied fair value of goodwill is less than the recorded goodwill, an impairment charge would be recorded to earnings in the Consolidated Statements of Operations.
In addition, we would evaluate goodwill for impairment if events or circumstances change between annual tests indicating a possible impairment. Examples of such events or circumstances include the following: a significant decline in our expected future cash flows; a sustained, significant decline in our stock price and market capitalization; a significant adverse change in the business climate; the testing for recoverability of a significant asset group; and slower growth rates.
In the fourth quarter of fiscal 2008, we completed the annual impairment test of goodwill. Our fair value was determined using a combination of the income approach and the market approach. Under the market
approach, we utilized our own information as well as publicly available industry information to determine earnings multiples and revenue multiples that were used to value the Company. Under the income approach, we determined the fair value based on estimated future cash flows, discounted by an estimated weighted-average cost of capital, which reflects our overall level of inherent risk and the rate of return an outside investor would expect to earn. Determining our fair value is judgmental in nature and requires the use of significant estimates and assumptions, including revenue growth rates and operating margins, discount rates and future market conditions, among others.
Solely for the purpose of establishing inputs for the fair value calculation, we made the following assumptions. For the income approach, a 3% growth factor was used to calculate our terminal value and the discount rate was estimated at 20%. For the market approach, we applied a control premium of 30% which seeks to give effect to the increased consideration a potential acquirer would be required to pay in order to gain sufficient ownership to set policies, direct operations and make decisions related to the Company. In conducting our impairment test in the fourth quarter of 2008, we determined the fair value of the Company exceeded the carrying value of our net assets by approximately 12%. No goodwill impairment loss was recognized in the years ended December 31, 2006, 2007, or 2008.
Given the current economic environment and the uncertainties regarding the impact on our business, there can be no assurance that our estimates and assumptions regarding the duration of the ongoing economic downturn, or the period or strength of recovery, made for purposes of our goodwill impairment testing during the year ended December 31, 2008 will prove to be accurate predictions of the future. If our assumptions regarding forecasted revenue or earnings are not achieved, we may be required to record goodwill impairment charges in future periods, whether in connection with our next annual impairment testing in the fourth quarter of 2009 or prior to that, if any such change constitutes a triggering event outside of the quarter from when the annual goodwill impairment test is performed. It is not possible at this time to determine if any such future impairment charge would result or, if it does, whether such charge would be material.
Purchased intangible assets with finite lives are amortized using the straight-line method over the estimated economic lives of the assets, which range from two to five years. Purchased intangible assets determined to have indefinite useful lives are not amortized. Long-lived assets, including property and equipment and intangible assets, are reviewed for impairment whenever events or changes in circumstances indicate that the carrying amount of such assets may not be recoverable. Such conditions may include an economic downturn or a change in the assessment of future operations. Determination of recoverability is based on an estimate of undiscounted future cash flows resulting from the use of the asset and its eventual disposition. Measurement of an impairment loss for long-lived assets that management expects to hold and use is based on the fair value of the asset. Long-lived assets to be disposed of are reported at the lower of carrying amount or fair value less costs to sell. The carrying value of the asset is reviewed on a regular basis for the existence of facts, both internal and external, that may suggest impairment.
In the fourth quarter of 2008, a key employee responsible for managing the asset group acquired in connection with our 2006 acquisition of Skipjam Corp. departed the Company. The departure of this employee, along with the recent economic environment, resulted in our decision to reduce efforts geared at marketing the related products. As a result, we performed an impairment analysis of these long-lived assets during the fourth quarter of 2008. Based on the results of the analysis, we recorded an impairment charge within cost of revenue in the Consolidated Statements of Operations of $458,000 for the net carrying value of intangibles acquired in connection with our 2006 acquisition of Skipjam Corp. During the years ended December 31, 2007 and 2006, there were no events or changes in circumstances that indicated the carrying amount of our long-lived assets may not be recoverable from their undiscounted cash flows. Consequently, we did not perform an impairment test or record an impairment of our long-lived assets during those periods.
We will continue to evaluate the carrying value of our long-lived assets and if we determine in the future that there is a potential further impairment, we may be required to record additional charges to earnings which could affect our financial results.
Income Taxes
We account for income taxes under an asset and liability approach. Under this method, income tax expense is recognized for the amount of taxes payable or refundable for the current year. In addition, deferred tax assets and liabilities are recognized for the expected future tax consequences of temporary differences resulting from different treatments for tax versus accounting of certain items, such as accruals and allowances not currently deductible for tax purposes. These differences result in deferred tax assets and liabilities, which are included within the consolidated balance sheet. We must then assess the likelihood that our deferred tax assets will be recovered from future taxable income and to the extent we believe that recovery is not more likely than not, we must establish a valuation allowance. As of December 31, 2006,2008, we believe that all of our deferred tax assets are recoverable; however, if there were a change in our ability to recover our deferred tax assets, we would be required to take a charge in the period in which we determined that recovery was not more likely than not.
Our effective tax rate differs fromWe adopted FASB Interpretation No. 48, “Accounting for Uncertainty in Income Taxes—an interpretation of FASB Statement No. 109,” (“FIN 48”) on January 1, 2007. FIN 48 clarifies the statutory rate due to tax credits, state taxes, stock compensation and other factors. Our future effective tax rate could be impacted by a shift in the mix of domestic and foreignaccounting for uncertain income tax treatiespositions recognized in an enterprise’s financial statements in accordance with foreign jurisdictions; changesStatement SFAS No. 109, “Accounting for Income Taxes.” It provides that a company should use a more-likely-than-not recognition threshold based on the technical merits of the income tax position taken. Income tax positions that meet the more-likely-than-not recognition threshold should be measured in tax laws in the United States or internationally; a change which would result in a valuation allowance being required to be recorded; or a federal, state or foreign jurisdiction’s view of tax returns which differs materially from what we originally provided. We assess the probability of adverse outcomes from tax examinations regularlyorder to determine the adequacy of our income tax liability. If we ultimately determine that payment of these amounts is unnecessary, we reverse the liability and recognize a tax benefit during the period in which we determine that the liability is no longer necessary. We record an additional charge in our provision for taxesto be recognized in the periodfinancial statements. As a result of adoption, we recorded a reduction in which we determine that the recorded tax liability is less than we expect the ultimate assessmentof $255,000 and a corresponding increase in retained earnings as of January 1, 2007. We include interest expense and penalties related to be.
28
Results of Operations
The following table sets forth the consolidated statementsConsolidated Statements of operationsOperations and the percentage change from the preceding year for the periods indicated:
| | | | | | | | | | | | | | | | | | | | | |
| | | Year Ended December 31, | |
| | | | | | Percentage | | | | | | Percentage | | | | |
| | | 2004 | | | Change | | | 2005 | | | Change | | | 2006 | |
| | | (In thousands, except percentage data) | |
| |
| Net revenue | | $ | 383,139 | | | | 17.3 | % | | $ | 449,610 | | | | 27.6 | % | | $ | 573,570 | |
| Cost of revenue | | | 260,318 | | | | 14.4 | | | | 297,911 | | | | 27.5 | | | | 379,911 | |
| | | | | | | | | | | | | | | | | | | | | |
| Gross profit | | | 122,821 | | | | 23.5 | | | | 151,699 | | | | 27.7 | | | | 193,659 | |
| | | | | | | | | | | | | | | | | | | | | |
| Operating expenses: | | | | | | | | | | | | | | | | | | | | |
| Research and development | | | 10,316 | | | | 24.4 | | | | 12,837 | | | | 43.7 | | | | 18,443 | |
| Sales and marketing | | | 62,247 | | | | 14.6 | | | | 71,345 | | | | 28.8 | | | | 91,881 | |
| General and administrative | | | 14,905 | | | | (2.3 | ) | | | 14,559 | | | | 43.6 | | | | 20,905 | |
| In-process research and development | | | — | | | | ** | | | | — | | | | ** | | | | 2,900 | |
| Litigation reserves | | | — | | | | ** | | | | 802 | | | | (100.0 | ) | | | — | |
| | | | | | | | | | | | | | | | | | | | | |
| Total operating expenses | | | 87,468 | | | | 13.8 | | | | 99,543 | | | | 34.7 | | | | 134,129 | |
| | | | | | | | | | | | | | | | | | | | | |
| Income from operations | | | 35,353 | | | | 47.5 | | | | 52,156 | | | | 14.1 | | | | 59,530 | |
| Interest income | | | 1,593 | | | | 157.6 | | | | 4,104 | | | | 69.9 | | | | 6,974 | |
| Other income (expense), net | | | (560 | ) | | | 216.1 | | | | (1,770 | ) | | | ** | | | | 2,495 | |
| | | | | | | | | | | | | | | | | | | | | |
| Income before income taxes | | | 36,386 | | | | 49.8 | | | | 54,490 | | | | 26.6 | | | | 68,999 | |
| Provision for income taxes | | | 12,921 | | | | 61.5 | | | | 20,867 | | | | 33.5 | | | | 27,867 | |
| | | | | | | | | | | | | | | | | | | | | |
| Net income | | $ | 23,465 | | | | 43.3 | % | | $ | 33,623 | | | | 22.3 | % | | $ | 41,132 | |
| | | | | | | | | | | | | | | | | | | | | |
| | | | | | | | | | | | | | | | |
| | | Year Ended December 31, |
| | | 2008 | | | Percentage
Change | | | 2007 | | Percentage
Change | | | 2006 |
| | | (In thousands, except percentage data) |
Net revenue | | $ | 743,344 | | | 2.1 | % | | $ | 727,787 | | 26.9 | % | | $ | 573,570 |
Cost of revenue | | | 502,320 | | | 3.5 | % | | | 485,180 | | 27.7 | % | | | 379,911 |
| | | | | | | | | | | | | | | | |
Gross profit | | | 241,024 | | | (0.7 | )% | | | 242,607 | | 25.3 | % | | | 193,659 |
| | | | | | | | | | | | | | | | |
Operating expenses: | | | | | | | | | | | | | | | | |
Research and development | | | 33,773 | | | 20.3 | % | | | 28,070 | | 52.2 | % | | | 18,443 |
Sales and marketing | | | 121,687 | | | 3.2 | % | | | 117,938 | | 28.4 | % | | | 91,881 |
General and administrative | | | 31,733 | | | 16.6 | % | | | 27,220 | | 30.2 | % | | | 20,905 |
Restructuring | | | 1,929 | | | * | * | | | — | | * | * | | | — |
In-process research and development | | | 1,800 | | | (56.1 | )% | | | 4,100 | | 41.4 | % | | | 2,900 |
Litigation reserves, net | | | 711 | | | 325.7 | % | | | 167 | | * | * | | | — |
| | | | | | | | | | | | | | | | |
Total operating expenses | | | 191,633 | | | 8.0 | % | | | 177,495 | | 32.3 | % | | | 134,129 |
| | | | | | | | | | | | | | | | |
Income from operations | | | 49,391 | | | (24.1 | )% | | | 65,112 | | 9.4 | % | | | 59,530 |
Interest income, net | | | 4,336 | | | (48.5 | )% | | | 8,426 | | 20.8 | % | | | 6,974 |
Other income (expense), net | | | (8,384 | ) | | * | * | | | 3,298 | | 32.2 | % | | | 2,495 |
| | | | | | | | | | | | | | | | |
Income before income taxes | | | 45,343 | | | (41.0 | )% | | | 76,836 | | 11.4 | % | | | 68,999 |
Provision for income taxes | | | 27,293 | | | (11.6 | )% | | | 30,882 | | 10.8 | % | | | 27,867 |
| | | | | | | | | | | | | | | | |
Net income | | $ | 18,050 | | | (60.7 | )% | | $ | 45,954 | | 11.7 | % | | $ | 41,132 |
| | | | | | | | | | | | | | | | |
| | |
| ** | | Percentage change not meaningful as prior year basis is zero or a negative amount. |
29
The following table sets forth the consolidated statementsConsolidated Statements of operations,Operations, expressed as a percentage of net revenue, for the periods presented:
| | | | | | | | | | | | | |
| | | Year Ended December 31, | |
| | | 2004 | | | 2005 | | | 2006 | |
| |
| Net revenue | | | 100 | % | | | 100 | % | | | 100 | % |
| Cost of revenue | | | 67.9 | | | | 66.3 | | | | 66.2 | |
| | | | | | | | | | | | | |
| Gross margin | | | 32.1 | | | | 33.7 | | | | 33.8 | |
| | | | | | | | | | | | | |
| Operating expenses: | | | | | | | | | | | | |
| Research and development | | | 2.7 | | | | 2.8 | | | | 3.2 | |
| Sales and marketing | | | 16.3 | | | | 15.9 | | | | 16.0 | |
| General and administrative | | | 3.9 | | | | 3.2 | | | | 3.7 | |
| In-process research and development | | | 0.0 | | | | 0.0 | | | | 0.5 | |
| Litigation reserves | | | 0.0 | | | | 0.2 | | | | 0.0 | |
| | | | | | | | | | | | | |
| Total operating expenses | | | 22.9 | | | | 22.1 | | | | 23.4 | |
| | | | | | | | | | | | | |
| Income from operations | | | 9.2 | | | | 11.6 | | | | 10.4 | |
| Interest income | | | 0.4 | | | | 0.9 | | | | 1.2 | |
| Other income (expense), net | | | (0.1 | ) | | | (0.4 | ) | | | 0.4 | |
| | | | | | | | | | | | | |
| Income before income taxes | | | 9.5 | | | | 12.1 | | | | 12.0 | |
| Provision for income taxes | | | 3.4 | | | | 4.6 | | | | 4.8 | |
| | | | | | | | | | | | | |
| Net income | | | 6.1 | % | | | 7.5 | % | | | 7.2 | % |
| | | | | | | | | | | | | |
| | | | | | | | | |
| | | Year Ended December 31, | |
| | | 2008 | | | 2007 | | | 2006 | |
Net revenue | | 100 | % | | 100 | % | | 100 | % |
Cost of revenue | | 67.6 | | | 66.7 | | | 66.2 | |
| | | | | | | | | |
Gross margin | | 32.4 | | | 33.3 | | | 33.8 | |
| | | | | | | | | |
Operating expenses: | | | | | | | | | |
Research and development | | 4.5 | | | 3.9 | | | 3.2 | |
Sales and marketing | | 16.4 | | | 16.2 | | | 16.0 | |
General and administrative | | 4.3 | | | 3.7 | | | 3.7 | |
Restructuring | | 0.3 | | | 0.0 | | | 0.0 | |
In-process research and development | | 0.2 | | | 0.6 | | | 0.5 | |
Litigation reserves, net | | 0.1 | | | 0.0 | | | 0.0 | |
| | | | | | | | | |
Total operating expenses | | 25.8 | | | 24.4 | | | 23.4 | |
| | | | | | | | | |
Income from operations | | 6.6 | | | 8.9 | | | 10.4 | |
Interest income, net | | 0.6 | | | 1.2 | | | 1.2 | |
Other income (expense), net | | (1.1 | ) | | 0.5 | | | 0.4 | |
| | | | | | | | | |
Income before income taxes | | 6.1 | | | 10.6 | | | 12.0 | |
Provision for income taxes | | 3.7 | | | 4.3 | | | 4.8 | |
| | | | | | | | | |
Net income | | 2.4 | % | | 6.3 | % | | 7.2 | % |
| | | | | | | | | |
Net Revenue
| | | | | | | | | | | | | | | | | | | | | |
| | | Year Ended December 31, | |
| | | | | | Percentage
| | | | | | Percentage
| | | | |
| | | 2004 | | | Change | | | 2005 | | | Change | | | 2006 | |
| | | (In thousands, except percentage data) | |
| |
| Net revenue | | $ | 383,139 | | | | 17.3 | % | | $ | 449,610 | | | | 27.6 | % | | $ | 573,570 | |
| | | | | | | | | | | | | | | |
| | | Year Ended December 31, |
| | | 2008 | | Percentage
Change | | | 2007 | | Percentage
Change | | | 2006 |
| | | (In thousands, except percentage data) |
Net revenue | | $ | 743,344 | | 2.1 | % | | $ | 727,787 | | 26.9 | % | | $ | 573,570 |
Our net revenue consists of gross product shipments, less allowances for estimated returns for stock rotation and warranty, price protection, end-user customer rebates and other sales incentives deemed to be a reduction of net revenue per EITF IssueNo. 01-9 and net changes in deferred revenue. Sales incentives include advertising, cooperative marketing programs, end-caps, instant rebates and mail-in rebates.
20062008 Net Revenue Compared to 20052007 Net Revenue
Net revenue increased $124.0$15.5 million, or 27.6%2.1%, to $743.3 million for the year ended December 31, 2008, from $727.8 million for the year ended December 31, 2007. We experienced lower net revenue in the second half of the year due to the economic downturn and the rapid strengthening of the U.S. dollar. The increase in total year revenue was attributable to higher sales in several of our product categories. These include wireless-G products sold to existing service provider customers and the full year sales of our ReadyNAS products, which were acquired in connection with our acquisition of Infrant in May 2007, as well as growth in wireless-N router sales. The growth was partially offset by a decrease in DSL gateway products sold.
Sales incentives that are classified as contra-revenue grew at a slower rate than overall gross sales, which further contributed to the increased net revenue.
For the year ended December 31, 2008 revenue generated in the United States, EMEA and Asia Pacific and rest of world was 40.1%, 47.6% and 12.3%, respectively. The comparable net revenue for the year ended December 31, 2007 was 37.6%, 52.3% and 10.1%, respectively. The change in net revenue over the prior year for each region amounted to an 8.7% increase, a 6.9% decrease, and a 24.3% increase, respectively.
2007 Net Revenue Compared to 2006 Net Revenue
Net revenue increased $154.2 million, or 26.9%, to $727.8 million for the year ended December 31, 2007, from $573.6 million for the year ended December 31, 2006, from $449.6 million for the year ended December 31, 2005.2006. We continued to experience our seasonal pattern of higher net revenues in the second half of the year. The increase in revenue was especially attributable to higher sales in several of our product categories. These include DSL gateway and powerlinecable gateway products sold to new and existing service provider customers especiallyand stronger worldwide switch sales, the launch of our ReadyNAS products, which were acquired in Europe. The majorityconnection with our acquisition of these incremental sales specifically included our wireless gateway customized for major service provider British Sky Broadcasting in the United Kingdom, with shipments of wireless gatewaysInfrant, and powerline products to other service providers further improving revenue.
Sales were further enhanced by the firsta full year of RangeMax wirelesswireless-N router sales to the home market. We introduced our RangeMax family of products, which included performance-enhancing Multiple-In Multiple-Out (MIMO) technology, during 2005, and the market has continued to embrace this key product line throughout the year. We expect the RangeMax family to remain strong in the coming year, and anticipate continuing our recent trend of increased sales of customized wireless gateways to service providers, both domestically and abroad. We
30
also anticipate new products such as our wireless-N routers, Skype wi-fi phones, and Gigabit smart switches to drive revenue in the near future.
Sales incentives that are classified as contra-revenue grew at a slower rate than overall gross sales, which further contributed to the increased net revenue. This is primarily due to increased sales to the service provider markets, which typically require less marketing spending. This favorable net revenue impact was partially offset by an increase in sales returns compared to historical return rates.
For the year ended December 31, 20062007 revenue generated in the United States, EMEA and Asia Pacific and rest of world was 38.4%37.6%, 52.0%52.3% and 9.6%10.1%, respectively. The comparable net revenue for the year ended December 31, 20052006 was 44.3%38.4%, 44.5% and 11.2%, respectively. The increase in net revenue over the prior year for each region was 10.7%, 49.2% and 8.8%, respectively.
2005 Net Revenue Compared to 2004 Net Revenue
Net revenue increased $66.5 million, or 17.3%, to $449.6 million for the year ended December 31, 2005, from $383.1 million for the year ended December 31, 2004. We continued to experience our seasonal pattern of higher net revenues in the second half of the year. The increase in revenue was especially attributable to higher sales of wireless LAN products to the home market, especially the new RangeMax family of products and continued strength in G and Super-G products, as well as increased gross shipments of our broadband gateways. These revenue increases were partially offset by increases in allowances for sales incentives associated with increased retail product sales.
We were able to slow down the pace of erosion in our average selling prices on our relatively older products in 2005 in part due to our new “minimum advertised price” policy with our U.S. retailers, as well as a general slowdown in competitive pricing pressures.
End-user customer rebates and other sales incentives which are classified as reductions in net revenue increased in 2005, especially in the latter half of 2005 when we took advantage of significant strategic joint promotion opportunities with our biggest retail partners both in the U.S. and in Europe. For example, we co-marketed our new RangeMax family of products with U.S. national retailers using a unified advertising campaign involving ad circulars and new end-cap displays. These increases in spending combined with higher use of end-user customer rebates impacted our revenue growth.
For the year ended December 31, 2005 revenue generated in the United States, EMEA and Asia Pacific and rest of world was 44.3%, 44.5% and 11.2%, respectively. The comparable net revenue for the year ended December 31, 2004 was 48.8%, 41.6%52.0% and 9.6%, respectively. The increase in net revenue over the prior year for each region was 6.6%24.2%, 25.3%27.5% and 37.5%34.3%, respectively.
Cost of Revenue and Gross Margin
| | | | | | | | | | | | | | | | | | | | | |
| | | Year Ended December 31, | |
| | | | | | Percentage
| | | | | | Percentage
| | | | |
| | | 2004 | | | Change | | | 2005 | | | Change | | | 2006 | |
| | | | | | (In thousands, except percentage data) | |
| |
| Cost of revenue | | $ | 260,318 | | | | 14.4 | % | | $ | 297,911 | | | | 27.5 | % | | $ | 379,911 | |
| Gross margin percentage | | | 32.1 | % | | | | | | | 33.7 | % | | | | | | | 33.8 | % |
| | | | | | | | | | | | | | | | | | |
| | | Year Ended December 31, | |
| | | 2008 | | | Percentage
Change | | | 2007 | | | Percentage
Change | | | 2006 | |
| | | (In thousands, except percentage data) | |
Cost of revenue | | $ | 502,320 | | | 3.5 | % | | $ | 485,180 | | | 27.7 | % | | $ | 379,911 | |
Gross margin percentage | | | 32.4 | % | | | | | | 33.3 | % | | | | | | 33.8 | % |
Cost of revenue consists primarily of the following: the cost of finished products from our third-party contractthird party manufacturers; overhead costs including purchasing, product planning, inventory control, warehousing and distribution logistics; inbound freight; and warranty costs associated with returned goods andgoods; write-downs for excess and obsolete inventory.inventory; and amortization expense of certain acquired intangibles. We outsource our manufacturing, warehousing and distribution logistics. We believe this outsourcing strategy allows us to better manage our product costs and gross margin. Our gross margin can be affected by a number of factors, including fluctuation in foreign exchange rates, sales returns, changes in net revenues due to changes in average selling prices, end-user customer rebates and other sales incentives, and changes in our cost of goods sold due to fluctuations in prices paid for components, net
31
of vendor rebates, warranty and overhead costs, inbound freight, conversion costs, and charges for excess or obsolete
inventoryinventory.2008 Cost of Revenue and transitions from olderGross Margin Compared to newer products.
2007 Cost of Revenue and Gross MarginCost of revenue increased $82.0$17.1 million, or 27.5%3.5%, to $502.3 million for the year ended December 31, 2008, from $485.2 million for the year ended December 31, 2007. Our gross margin decreased to 32.4% for the year ended December 31, 2008, from 33.3% for the year ended December 31, 2007.
The decrease in gross margin was primarily attributable to sales of products carrying lower gross margins to service providers and the impact on our foreign currency denominated revenues due to the strengthening of the U.S. dollar, as well as higher warranty costs associated with end-user warranty returns. Additionally, inventory reserves increased primarily due to selling price declines of certain products. These declines were primarily attributable to the strengthening of the U.S. dollar in locations where we bill in local currencies. These negative margin impacts were partially mitigated by reduced air freight expenses as a result of increased on-hand inventory levels which allowed us to minimize the amount of higher cost air freight expense, as well as reduced marketing expenses.
Additionally, stock-based compensation expense increased $231,000 to $864,000 for the year ended December 31, 2008, from $633,000 for the year ended December 31, 2007.
2007 Cost of Revenue and Gross Margin Compared to 2006 Cost of Revenue and Gross Margin
Cost of revenue increased $105.3 million, or 27.7%, to $485.2 million for the year ended December 31, 2007, from $379.9 million for the year ended December 31, 2006, from $297.9 million2006. Our gross margin decreased to 33.3% for the year ended December 31, 2005. Our gross margin improved to2007, from 33.8% for the year ended December 31, 2006, from 33.7% for2006.
The decrease in gross margin percentage was primarily attributable to higher warranty costs associated with end-user warranty returns as well as amortization expense related to certain intangible assets acquired in connection with the Infrant acquisition. We amortized an additional $3.1 million in intangibles related to our recent acquisitions in the year ended December 31, 2005.
2007 as compared to the year ended December 31, 2006. We also sold through the entire $3.5 million in inventory acquired from Infrant, which was recorded at fair value under purchase accounting guidelines. Of this $3.5 million, $1.3 million represented a charge for the step-up to fair value in connection with the acquisition purchase accounting. We also experienced increased sales of products carrying lower gross margins to service providers.These negative margin impacts were partially mitigated by certain gross margin improvements. Our gross margin iswas impacted by our sales incentives that are recorded as a reduction in revenue which grew at a relatively slower rate than overall net revenue, as most of our revenue increases relate to sales to service providers, which involve significantly lower sales incentive expenses. Additionally, werevenue. We experienced decreased price protection claims, as well as relatively lower inbound freight during the year, as we were able to continue to shift the mix of inbound shipments from our suppliers from more costly air freight to lower cost sea freight due to better supply chain planning. Furthermore, rebates from vendors were significantly higher in 2006. While we do not expect this higher level of rebates to continue in the future, we anticipate lower costs on these products.
These improvements were almost entirely offset by a number of factors. Incremental sales in 2006 came primarily from increased sales of products carrying lower gross margins to service providers. We also experienced increased warranty and sales returns costs, driven primarily by a higher scrap rate of warranty return units and an increase in reserves taken for future returns based on the increase in returns volume during the year. We also experienced higher costs related to inventory reserves and devaluation.
Additionally, stock-based compensation expense increased $283,000$203,000 to $633,000 for the year ended December 31, 2007, from $430,000 for the year ended December 31, 2006, from $147,000 for the year ended December 31, 2005, as a result of the adoption of Statement of Financial Accounting Standards (“SFAS”) No. 123 (revised 2004), “Share-Based Payment” (“SFAS 123R”).
Cost of revenue increased $37.6 million, or 14.4%, to $297.9 million for the year ended December 31, 2005 from $260.3 million for the year ended December 31, 2004. Our gross margin improved to 33.7% for the year ended December 31, 2005, from 32.1% for the year ended December 31, 2004, an increase of 1.6 percentage points. This increase was due primarily to a favorable shift in product mix and our product costs decreasing relatively more quickly than sales prices, offset by an increase in end-user customer rebates and other sales incentives, which reduce revenue along with increased inbound freight and conversion costs.
We were able to slow down the pace of erosion in our average selling prices on our relatively older products in 2005 in part due to our new “minimum advertised price” policy with our U.S. retailers, as well as a general slowdown in competitive pricing pressures. We have also had continued success in obtaining cost reductions and efficiencies from our vendors and manufacturers, and have pursued product redesigns when appropriate to further lower production costs. These decreasing costs, coupled with the relative slowing in the decrease of average selling prices, boosted margins on our older products, especially our G and Super G wireless adapters. Additionally, we have benefited from relatively higher standard margins on newer products, especially from our RangeMax family of products.
It is difficult to accurately forecast demand for our products across our markets and within specific countries. The shift in the mix of actual orders compared to forecasted demand resulted in a higher than normal reliance on more expensive air versus surface freight during the last quarter of 2005 as well as higher rework and other costs primarily related to product conversions among country-specific packaging.
Additionally, stock-based compensation expense decreased $16,000 to $147,000 for the year ended December 31, 2005, from $163,000 for the year ended December 31, 2004.
32
Operating Expenses
Research and development expenseDevelopment Expense
| | | | | | | | | | | | | | | | | | | | | |
| | | Year Ended December 31, | |
| | | | | | Percentage
| | | | | | Percentage
| | | | |
| | | 2004 | | | Change | | | 2005 | | | Change | | | 2006 | |
| | | | | | (In thousands, except percentage data) | | | | |
| |
| Research and development expense | | $ | 10,316 | | | | 24.4 | % | | $ | 12,837 | | | | 43.7 | % | | $ | 18,443 | |
| Percentage of net revenue | | | 2.7 | % | | | | | | | 2.8 | % | | | | | | | 3.2 | % |
| | | | | | | | | | | | | | | | | | |
| | | Year Ended December 31, | |
| | | 2008 | | | Percentage
Change | | | 2007 | | | Percentage
Change | | | 2006 | |
| | | (In thousands, except percentage data) | |
Research and development expense | | $ | 33,773 | | | 20.3 | % | | $ | 28,070 | | | 52.2 | % | | $ | 18,443 | |
Percentage of net revenue | | | 4.5 | % | | | | | | 3.9 | % | | | | | | 3.2 | % |
Research and development expenses consist primarily of personnel expenses, payments to suppliers for design services, tooling design costs, safety and regulatory testing, product certification expenditures to qualify our products for sale into specific markets, prototypes and other consulting fees. Research and development expenses are recognized as they are incurred. We have invested in building our research and development organization to enhance our ability to introduce innovative and easy to use products. We expect to continue to add additional employees in our research and development department. In the future, we believe that research and development expenses will increase in absolute dollars as we expand into new networking product technologies enhance theease-of-use of our products, and broaden our core competencies.
2008 Research and Development Expense Compared to 2007 Research and Development Expense
Research and development expenses increased $5.6$5.7 million, or 43.7%20.3%, to $33.8 million for the year ended December 31, 2008, from $28.1 million for the year ended December 31, 2007. The increase was primarily due to increased salary, related payroll and other employee expenses of $3.6 million primarily due to incremental headcount expenses related to the acquisition of Infrant in May 2007, which was partially offset by a decrease in employee performance compensation of $1.7 million. Employee headcount increased by 37% to 158 employees as of December 31, 2008 as compared to 115 employees as of December 31, 2007, primarily due to new employees obtained from the acquisition of certain assets of CP Secure International Holding Limited (“CP Secure”) in December 2008. The increase in research and development expense was also due to an increase in
non-recurring engineering of $1.3 million primarily due to incremental product development projects, as well as an increase in costs allocated to research and development from other functional expense categories of $1.4 million primarily resulting from increased facilities costs primarily related to our new corporate headquarters in San Jose, California. Additionally, stock-based compensation expense increased $827,000 to $3.2 million for the year ended December 31, 2008, from $2.4 million for the year ended December 31, 2007.
2007 Research and Development Expense Compared to 2006 Research and Development Expense
Research and development expenses increased $9.7 million, or 52.2%, to $28.1 million for the year ended December 31, 2007, from $18.4 million for the year ended December 31, 2006, from $12.8 million for the year ended December 31, 2005.2006. The increase was primarily due to higher salary and related payroll expenses of $2.1$4.8 million resulting from research and development related headcount growth, including $486,000 related to$292,000 of retention bonuses for certain employees associated with the acquisition of SkipJam.SkipJam Corp. (“SkipJam”) and $1.7 million related to higher headcount from the Infrant acquisition. Employee headcount increased by 15%85% to 115 employees as of December 31, 2007 as compared to 62 employees as of December 31, 2006, as compared to 54 employees as of December 31, 2005, in part due to 26 employees obtained from the acquisition of SkipJam. The increase was also attributableInfrant. Other employee expenses increased by $800,000 due to an increase of $2.1 millioncontractor conversions in engineeringour China Engineering Center and recruiting costs. These costs were incurredRent expense increased $643,000 due to improve the qualityexpansion of our small business products.China Engineering Center. Furthermore, information technology infrastructure costs allocated to research and development increased $982,000 as a result of additional investments in software and systems in 2007 as well as relatively higher headcount which drove a higher allocation percentage to research and development. Additionally, stock-based compensation expense increased $826,000$1.3 million to $2.4 million for the year ended December 31, 2007, from $1.1 million for the year ended December 31, 2006, from $293,000 for the year ended December 31, 2005, as a result of the adoption of SFAS 123R.
Research and development expenses increased $2.5 million, or 24.4%, to $12.8 million for the year ended December 31, 2005, from $10.3 million for the year ended December 31, 2004. The increase was primarily due to increased salary and payroll related expenses of $2.4 million resulting from research and development related headcount growth. Employee headcount increased by 35% to 54 employees as of December 31, 2005 as compared to 40 employees as of December 31, 2004. These headcount increases were primarily due to the expansion of our research and development facility in Taiwan and expansion of our focus on the broadband service provider market which often requires additional certifications and testing. Additionally, stock-based compensation expense decreased $107,000 to $293,000 for the year ended December 31, 2005, from $400,000 for the year ended December 31, 2004.
2006.Sales and marketing expenseMarketing Expense
| | | | | | | | | | | | | | | | | | | | | |
| | | Year Ended December 31, | |
| | | | | | Percentage
| | | | | | Percentage
| | | | |
| | | 2004 | | | Change | | | 2005 | | | Change | | | 2006 | |
| | | (In thousands, except percentage data) | |
| |
| Sales and marketing expense | | $ | 62,247 | | | | 14.6 | % | | $ | 71,345 | | | | 28.8 | % | | $ | 91,881 | |
| Percentage of net revenue | | | 16.3 | % | | | | | | | 15.9 | % | | | | | | | 16.0 | % |
| | | | | | | | | | | | | | | | | | |
| | | Year Ended December 31, | |
| | | 2008 | | | Percentage
Change | | | 2007 | | | Percentage
Change | | | 2006 | |
| | | (In thousands, except percentage data) | |
Sales and marketing expense | | $ | 121,687 | | | 3.2 | % | | $ | 117,938 | | | 28.4 | % | | $ | 91,881 | |
Percentage of net revenue | | | 16.4 | % | | | | | | 16.2 | % | | | | | | 16.0 | % |
Sales and marketing expenses consist primarily of advertising, trade shows, corporate communications and other marketing expenses, product marketing expenses, outbound freight costs, personnel expenses for sales and marketing staff and technical support expenses. WeIn 2009 we believe that maintaining and building brand awareness is key to both net revenue growth and maintaining our gross margin. We also believe that maintaining widely available and high quality technical support is key to building and maintaining brand awareness. Accordingly, we expect sales and marketing expensesexpense will decrease as we implement cost savings efforts.
2008 Sales and Marketing Expense Compared to increase in absolute dollars in the future, related to the planned growth of our business.
33
Sales and marketing expenses increased
$20.6$3.8 million, or
28.8%3.2%, to
$121.7 million for the year ended December 31, 2008, from $117.9 million for the year ended December 31, 2007. Of this increase, $2.8 million was attributable to increased salary, related payroll and other employee expenses as a result of sales and marketing related headcount growth, which was partially offset by a decrease in employee performance compensation of $1.7 million. Employee headcount increased from 260 employees as of December 31, 2007 to 266 employees as of December 31, 2008. Most of our increase in headcount occurred in connection with our expansion in EMEA and Asia Pacific. Furthermore, outbound freight increased $1.0 million, reflecting our higher unit volume sales, and costs allocated to sales and marketing from other functional expense categories increased $1.8 million due to increased facilities costs primarily related to our new corporate headquarters in San Jose, California. These increases were partially offset by lower advertising and promotion expenses.2007 Sales and Marketing Expense Compared to 2006 Sales and Marketing Expense
Sales and marketing expenses increased $26.0 million, or 28.4%, to $117.9 million for the year ended December 31, 2007, from $91.9 million for the year ended December 31, 2006, from $71.3 million for the year ended December 31, 2005. We note that sales and marketing expenses grew in line with revenue growth.2006. Of this increase, $9.4$9.7 million was
due to increased salary and payroll related expenses, including sales commissions, as a result of sales and marketing related headcount growth and increased commissions earned in EMEA due to substantialthe revenue growth. Employee headcount increased from 157 employees as of December 31, 2005 to 207 employees as of December 31, 2006.2006 to 260 employees as of December 31, 2007. More specifically, 4647 of the 5053 incremental employees relaterelated to expansion in EMEA and Asia Pacific, which represents our continued geographic expansion and increasing sales staffing in these regions. For example, we established a Technical Support Center in our Ireland office, which accounted for 7 new individuals.Pacific. Outside service fees related to customer service and technical support also increased by $4.9$3.8 million, in support of higher call volumes related to increased units sold.volumes. We also incurred a $1.7$1.9 million increase in advertising travel, and promotion expenses related to our expansion of marketing activities into new geographies.geographic regions. Outbound freight increased $1.6$3.2 million, reflecting our higher sales volume. Travel and entertainment increased $1.7 million and rent increased by $873,000 due to the higher headcount and expansion into new countries. Marketing costs classified as operating expenses remained relatively constant, as the majority of incremental marketing expenses related to rebates and other items classified as contra-revenue. Furthermore, information technology infrastructure costs allocated to sales and marketing increased $1.9 million as a result of additional investments in software and systems in 2007 as well as relatively higher headcount which drove a higher allocation percentage to sales and marketing. Additionally, stock-based compensation expense increased $1.0$1.6 million to $3.0 million for the year ended December 31, 2007, from $1.4 million for the year ended December 31, 2006, from $375,000 for the year ended December 31, 2005, as a result of the adoption of SFAS 123R.
Sales and marketing expenses increased $9.1 million, or 14.6%, to $71.3 million for the year ended December 31, 2005, from $62.2 million for the year ended December 31, 2004. Of this increase, $5.1 million was due to product promotion, including intensified in-store staffing and training programs, advertising, and outside technical support expenses, all in support of increased volume. In addition, salary and related expenses for additional sales and marketing personnel increased by $2.7 million as a result of sales and marketing related headcount growth from 125 employees as of December 31, 2004 to 157 employees as of December 31, 2005. We attributed 28 of the 32 incremental employee additions to expansion in EMEA and Asia Pacific, where sales and marketing employee headcount grew 46% and 35%, respectively. The increase was also attributable to additional allocated overhead costs such as facilities and information systems costs amounting to $851,000, which reflects sales and marketing’s larger relative headcount growth rate and correspondingly higher share of overhead costs. Additionally, stock-based compensation expense decreased $358,000 to $375,000 for the year ended December 31, 2005, from $733,000 for the year ended December 31, 2004.
2006.General and administrative expenseAdministrative Expense
| | | | | | | | | | | | | | | | | | | | | |
| | | Year Ended December 31, | |
| | | | | | Percentage
| | | | | | Percentage
| | | | |
| | | 2004 | | | Change | | | 2005 | | | Change | | | 2006 | |
| | | (In thousands, except percentage data) | |
| |
| General and administrative expense | | $ | 14,905 | | | | −2.3 | % | | $ | 14,559 | | | | 43.6 | % | | $ | 20,905 | |
| Percentage of net revenue | | | 3.9 | % | | | | | | | 3.2 | % | | | | | | | 3.7 | % |
| | | | | | | | | | | | | | | | | | |
| | | Year Ended December 31, | |
| | | 2008 | | | Percentage
Change | | | 2007 | | | Percentage
Change | | | 2006 | |
| | | (In thousands, except percentage data) | |
General and administrative expense | | $ | 31,733 | | | 16.6 | % | | $ | 27,220 | | | 30.2 | % | | $ | 20,905 | |
Percentage of net revenue | | | 4.3 | % | | | | | | 3.7 | % | | | | | | 3.7 | % |
General and administrative expenses consist of salaries and related expenses for executive, finance and accounting, human resources, professional fees, allowance for bad debts,doubtful accounts and other corporate expenses. WeIn 2009 we expect general and administrative costs to increase in absolute dollars relatedslightly as compared to the year ended December 31, 2008.
2008 General and Administrative Expense Compared to 2007 General and Administrative Expense
General and administrative expenses increased $4.5 million, or 16.6%, to $31.7 million for the year ended December 31, 2008, from $27.2 million for the year ended December 31, 2007. The increase was primarily due to higher outside professional services, due to higher legal consulting expenses of $3.5 million. Furthermore, stock-based compensation expense increased approximately $1.0 million to $3.8 million for the year ended December 31, 2008, from $2.8 million for the year ended December 31, 2007. Overall general growth ofand administrative compensation costs were flat, as the business, continued international expansion,increases in salary, related payroll and increased investmentsother employee expenses were offset by a decrease in infrastructure such as a new enterprise resource planning system.
employee performance compensation.2007 General and Administrative Expense Compared to 2006 General and Administrative Expense
General and administrative expenses increased $6.3 million, or 43.6%30.2%, to $27.2 million for the year ended December 31, 2007, from $20.9 million for the year ended December 31, 2006, from $14.6 million for the year ended December 31, 2005. The increase was primarily due to higher salary and payroll related expenses of $3.3 million due to an increase in general and administrative related headcount.2006. Employee headcount increased by 25%17% to 77 employees as of December 31, 2007 compared to 66 employees as of December 31, 2006 compared to 53 employees as of December 31, 2005. Of the incremental 13 additions, 8 personnel were hired into accounting and finance departments in our new Ireland office.2006. We also incurred a $1.4$3.1 million increase in fees for outside professional services, which was in part relateddue to higher accounting, tax, legal and IT consulting expenses. Software and hardware maintenance increased by $644,000 primarily due to our new enterprise resource planning system. We experienced an increase in IT consulting costs, tax consultingdepreciation expense of $731,000 as compared to the previous year due to the continued investment in our finance and general legal expenses.operations systems. Additionally, stock-based compensation expense increased approximately $1.4$1.2 million to $2.8 million for the year ended December 31, 2007, from $1.6 million for the year ended December 31, 2006, from $249,000 for2006. Offsetting these increases were higher IT and facilities allocations to research and development as well as sales and marketing due to relatively higher headcount growth in those areas.
Restructuring
During the year ended December 31, 2005, as2008, we expensed $965,000 related to the termination of employment of approximately 35 individuals on November 12, 2008. Additionally, we expensed $964,000 related to excess facilities we ceased to use in Santa Clara and Fremont, California due to our relocation to a resultnew corporate headquarters in San Jose, California. For a detailed discussion of our restructuring expenses, please see Note 4 of the adoption of SFAS 123R.
34
General and administrative expenses decreased approximately $300,000, or 2.3%, to $14.6 million forWe did not incur any restructuring expense during the year ended December 31,
2005, from $14.9 million for2007 or 2006.In-process Research and Development
During the year ended December 31, 2004. This decrease2008, we expensed $1.8 million for in-process research and development (“in-process R&D”) related to intangible assets purchased in our acquisition of certain assets of CP Secure. See Note 2 of the Notes to Consolidated Financial Statements for additional information regarding this acquisition. The in-process R&D was primarily dueexpensed upon acquisition because technological feasibility had not been established and no future alternative uses exist. We acquired two in-process R&D projects, both of which involved improvements to a decrease in fees for professional services aggregating $1.7 millionthreat management characteristics of future products.
To date, there have been no significant differences between the actual and a decrease in net allocated overhead such as information systems costs aggregating $588,000, offset by an increase in employee relatedestimated results of the in-process R&D projects. We estimate that we will incur costs of $2.1 million. The decrease in fees for professional services resulted from decreases in consulting, outsourced accounting fees and legal fees, and costs associated with initial Sarbanes-Oxley 404 compliance documentation in 2004. The increase in employee related costs resulted from an increase in general and administrative related headcount, particularly inapproximately $870,000 to complete the finance area to support an increase in transactional processing due to increased revenue. Employee headcount increased by 43% to 53 employees asprojects, of which approximately $120,000 was incurred through December 31, 2005 as compared2008. We expect to 37 employees as of December 31, 2004. The decreasecomplete and begin benefiting from these projects in net allocated overhead reflects the general and administrative function’s slower headcount growth rate relative to other functional areas. Additionally, stock-based compensation expense decreased $142,000 to $249,000 formid-2009.
During the year ended December 31, 2005,2007, we expensed $4.1 million for in-process R&D related to intangible assets purchased in our acquisition of Infrant. The in-process R&D was expensed upon acquisition because technological feasibility had not been established and no future alternative uses exist. We acquired three in-process R&D projects. Two projects involve development of new products in the ReadyNAS desktop product category, and one project involves development of a higher end version of a product currently selling in the ReadyNAS rack mount product category. We expect to incur costs of approximately $1.6 million to complete the projects, of which approximately $1.4 million was incurred through December 31, 2008. We completed two projects in mid-2008, and we expect to complete and begin benefiting from $391,000 forthe final project contemplated at the date of acquisition in the middle of the year endedending December 31, 2004.
In-process research and development
2009.During the year ended December 31, 2006, we expensed $2.9 million for in-process research and developmentR&D related to intangible assets purchased in our acquisition of SkipJam. See Note 2 of the Notes to the Consolidated Financial Statements for additional information regarding the acquisition. In-processThe in-process R&D iswas expensed upon an acquisition because technological feasibility has not been established and no future alternative uses exist. We acquired only one in-process R&D project, which is related to the development of a multimedia product that had not reached technological feasibility and had no alternative use. We incurred costs of approximately $725,000 to complete the project, of which approximately $575,000 was incurred through December 31, 2006.2006 and an additional $150,000 was incurred during the year ended December 31, 2007. We completed the project in February 2007.
Litigation reservesReserves and Payments
During the year ended December 31, 2005,2008, we recorded net litigation reserves expense of $711,000. This expense was primarily comprised of $575,000 in estimated costs related to the settlement of various lawsuits filed against us. Additionally, we incurred $109,000 for costs related to the settlement of the patent-infringement lawsuit filed by Hybrid Patents, Inc. (“Hybrid”) against Charter Communications, Inc. (“Charter”) where we assumed the defense of the litigation after receiving a request for indemnification from Charter and an expense of $85,000 for costs related to the settlement of the patent-infringement lawsuit filed by Linex Technologies, Inc. against us. These expenses were offset by a reduction in previously accrued legal settlement costs of $58,000. For a detailed discussion of our litigation matters, please see Note 8 of the Notes to Consolidated Financial Statements.
During the year ended December 31, 2007, we recorded an allowanceexpense of $802,000$167,000 for costs related to the estimated costssettlement of settlement for theZilbermanSercoNet v. NETGEAR lawsuit. The lawsuit was settled on May 26, 2006, andThere were no material additional costs were incurred. No litigation reserves were recorded in the year ended December 31, 2006.
Interest incomeIncome and other income (expense)Other Income (Expense)
| | | | | | | | | | | | | |
| | | Year Ended December 31, | |
| | | 2004 | | | 2005 | | | 2006 | |
| | | | | | (In thousands) | | | | |
| |
| Interest income | | $ | 1,593 | | | $ | 4,104 | | | $ | 6,974 | |
| Other income (expense), net | | | (560 | ) | | | (1,770 | ) | | | 2,495 | |
| | | | | | | | | | | | | |
| Total interest income and other income (expense) | | $ | 1,033 | | | $ | 2,334 | | | $ | 9,469 | |
| | | | | | | | | | | | | |
| | | | | | | | | | |
| | | Year Ended December 31, |
| | | 2008 | | | 2007 | | 2006 |
| | | (In thousands) |
Interest income and other income (expense) | | | | | | | | | | |
Interest income, net | | $ | 4,336 | | | $ | 8,426 | | $ | 6,974 |
Other income (expense), net | | | (8,384 | ) | | | 3,298 | | | 2,495 |
| | | | | | | | | | |
Total interest income and other income (expense) | | $ | (4,048 | ) | | $ | 11,724 | | $ | 9,469 |
| | | | | | | | | | |
Interest income represents amounts earned on our cash, cash equivalents and short-term investments.
Other income (expense), net, primarily represents gains and losses on transactions denominated in foreign currencies and other miscellaneous expenses.
2008 Interest Income and Other Income (Expense) Compared to 2007 Interest Income and Other Income (Expense)
The aggregate of interest income, increased $2.9 million, or 69.9%,interest expense, other income, and other expense amounted to $7.0net other expense of $4.0 million for the year ended December 31, 2006, from $4.12008, compared to net other income of $11.7 million for the year ended December 31, 2005.2007. The increasedecrease is partially due to a $4.1 million decrease in interest income, waswhich is a result of an increasea decrease in interest rates on our cash, cash equivalents, and short-term investments balances during the average interest rate earned.
Other income (expense), net, increased to income of $2.5 million for the year ended December 31, 2006, from an expense of $1.8 million for the year ended December 31, 2005. The income of $2.5 million was primarily attributable to a net foreign exchange gain experienced in the year ended December 31, 2006 due to the weakening of the U.S. dollar against the Euro, the Great Britain Pound, and the Australian Dollar. The expense of $1.8 million in the year ended December 31, 2005 was primarily attributable toyear. We also recorded a net foreign exchange loss experiencedof $8.4 million due to the continued strengthening of the U.S. dollar against the Euro, Great Britain Poundeuro, the British pound, the Australian dollar and the Australian Dollar.
35
2007 Interest Income and Other Income (Expense) Compared to 2006 Interest Income and Other Income (Expense)The aggregate of interest income, interest expense,
other income, and other expense amounted to net other income of
$2.3$11.7 million for the year ended December 31,
2005,2007, compared to
net other income of $1.0$9.5 million for the year ended December 31,
2004. This change was primarily2006. The increase is partially due to
an additional $2.5a $1.4 million
increase in interest income,
which is a result of our increased cash balances. The interest rate we earned on our cash balances decreased during the year. Other income (expense), net, increased by $803,000. The net foreign exchange gain of $3.3 million was due to the continued weakening of the U.S. dollar against the euro, the British pound, the Australian dollar and the Japanese yen during 2007.Provision for Income Taxes
2008 Provision for Income Taxes Compared to 2007 Provision for Income Taxes
Provision for income taxes decreased $3.6 million, resulting in a provision of $27.3 million for the year ended December 31, 2005,2008, compared to a provision of $30.9 million for the year ended December 31, 2007. The effective tax rate increased from 40.2% for the year ended December 31, 2007 to 60.2% for the year ended December 31, 2008. The effective tax rate for both periods differed from the investmentstatutory rate of our cash, cash equivalents,approximately 35% due to non-deductible stock-based compensation, state taxes, other non-deductible expenses, and short-term investments balance throughouttax credits. In 2008, there was no rate effect from in-process R&D expensed in connection with the year. Thisacquisition of CP Secure since such in-process R&D was offsetdeductible for tax purposes. In 2007, the acquisition of Infrant resulted in part by
non-deductible in-process R&D expense which resulted in an increase in other expensethe effective tax rate. Additionally, in 2008 compared to 2007, tax attributable to foreign operations increased the effective tax rate by 19.4 percentage points. This was primarily caused by the tax effect of $1.2 million consisting primarily of realized and unrealizednon-deductible losses associated with foreign currency denominated transactions due in part to currency volatility during the year as well as our billing in foreign currencies which beganjurisdictions where no benefit can be claimed and increases in the first quarter of 2005.
earnings in countries with rates higher than 35%.2007 Provision for Income Taxes Compared to 2006 Provision for Income Taxes
Provision for income taxes increased $7.0$3.0 million, resulting in a provision of $30.9 million for the year ended December 31, 2007, from a provision of $27.9 million for the year ended December 31, 2006, from a provision of $20.9 million for the year ended December 31, 2005.2006. The effective tax rate remained unchanged and was approximately 40% for the yearyears ended December 31, 20062007 and approximately 38% for the year ended December 31, 2005.2006. The effective tax rate for both periods differed from our statutory rate of approximately 35% due to non-deductible stock-based compensation, state taxes, other non-deductible expenses, and tax credits. The effective tax rate for the year ended December 31, 2006 was also impacted by non-deductible charges pertaining to in-process research and development as a result of the acquisition of SkipJam.
Provision forour recent acquisitions, state taxes, other non-deductible expenses, and tax credits.Net Income
Net income taxes increased $8.0decreased $27.9 million, or 60.7%, to a provision of $20.9$18.1 million for the year ended December 31, 2005,2008, from a provision of $12.9$46.0 million for the year ended December 31, 2004. The effective tax rate2007. This decrease was primarily attributable to an increase in operating expenses of $14.1 million, a decrease in other income (expense), net, of $11.7 million, and a decrease in interest income, net, of $4.1 million. These decreases in pre-tax income were offset by a decrease in provision for income taxes of $3.6 million.
Net income increased $4.9 million, or 11.7%, to $46.0 million for the year ended December 31, 2005 was approximately 38% and differed2007, from our statutory rate of approximately 35% due to state taxes, and other non-deductible expenses, offset in part by tax credits. The effective tax rate for the year ended December 31, 2004 was approximately 36% and differed from our statutory rate of approximately 35% due to non-deductible stock-based compensation, state taxes, and other non-deductible expenses, offset in part by a $1.5 million tax benefit from exercises of stock options and tax credits.
Net Income
Net income increased $7.5 million, to $41.1 million for the year ended December 31, 2006 from $33.6 million for the year ended December 31, 2005.2006. This increase was dueprimarily attributable to an increase in gross profit of $42.0$48.9 million, an increase in interest income of $1.4 million and an increase in interest and other income of $7.1 million,$803,000. These increases were partially offset by an increase in operating expenses of $34.6$43.4 million and an increase in the provision for income taxes of $7.0$3.0 million.
Net income increased $10.1 million, to $33.6 million for the year ended December 31, 2005 from $23.5 million for the year ended December 31, 2004. This increase was primarily due to an increase in gross profit of $28.9 million, offset by an increase in operating expenses of $12.0 million and an increase in provision for income taxes of $8.0 million.
Liquidity and Capital Resources
As of December 31, 20062008 we had cash, cash equivalents and short-term investments totaling $197.5$203.0 million.
Our cash and cash equivalents balance decreasedincreased from $90.0$167.5 million as of December 31, 20052007 to $87.7$192.8 million as of December 31, 2006.2008. Our short-term investments, which represent the investment of funds available for current operations, increaseddecreased from $83.7$37.8 million as of December 31, 20052007 to $109.7$10.2 million as of December 31, 2006.2008, as we shifted assets from Treasuries to low risk money market funds with higher returns. Operating activities during the year ended December 31, 20062008 generated cash of $23.1 million primarily due to an increase in net income.$47.5 million. Investing activities during the year ended December 31, 20062008 used $37.7$12.5 million, which includes the net purchaseproceeds from the sale of short-term investments of $24.2$27.5 million, offset primarily by payments, excluding cash acquired, made in connection with the acquisitions of Infrant and certain assets of CP Secure of $24.6 million, and purchases of property and equipment amounting to $5.9 million, and payments made in connection with our acquisition of SkipJam of $7.6$15.4 million. During the year ended December 31, 2006,2008, financing activities provided $12.3used $9.7 million, primarily resulting fromdue to the repurchase and retirement of 1.2 million shares of our common stock for $12.2 million offset in part by the issuance of our common stock upon exercise of stock options and our employee stock purchase program.
program, as well as the excess tax benefit from exercise of stock options.Our days sales outstanding decreasedincreased from 7773 days as of December 31, 20052007 to 6681 days as of December 31, 2006.
2008.Our accounts payable increased from $38.9$55.3 million at December 31, 20052007 to $39.8$60.1 million at December 31, 2006.
36
Inventory increased by $26.0$29.2 million from $51.9$83.0 million at December 31, 20052007 to $77.9$112.2 million at December 31, 2006.2008 in part due to a decline in sales. Ending inventory turns decreased from approximately 6.5 turns in the quarter ended December 31, 2005,2007, to 5.74.0 turns in the quarter ended December 31, 2006.
2008.We enter into foreign currency forward-exchange contracts, which typically mature in three months, to hedge a portion of our exposure to foreign currency fluctuations of foreign currency-denominated receivables, payables, and cash balances. We record on the consolidated balance sheet at each reporting period the fair value of our forward-exchange contracts and record any fair value adjustments in our Consolidated Statements of Operations. Gains and losses associated with currency rate changes on contracts are recorded within other income (expense), net, offsetting gains and losses on our monetary assets and liabilities.
On October 21, 2008, the Board of Directors approved plans to purchase shares of our common stock in the open market. During the year ended December 31, 2008, we purchased approximately 1.2 million shares of our common stock in the open market for cash of $12.2 million. As of December 31, 2008, we were authorized to purchase up to an additional 4.8 million shares under the share repurchase plan. See Note 9 of the Notes to Consolidated Financial Statements for a discussion of the accounting for our common stock repurchases. The stock repurchase authorization does not have an expiration date and the pace of repurchase activity will depend on various factors including, but not limited to, such factors as levels of cash generation from operations, cash requirements for acquisitions, and current stock price.
Based on our current plans and market conditions, we believe that our existing cash, cash equivalents and short-term investments will be sufficient to satisfy our anticipated cash requirements for the forseeableforeseeable future. However, we cannot be certain that our planned levels of revenue, costs and expenses will be achieved. If our operating results fail to meet our expectations or if we fail to manage our inventory, accounts receivable or other assets, we could be required to seek additional funding through public or private financings or other arrangements. In addition, as we continue to expand our product offerings, channels and geographic presence, we may require additional working capital. In such event, adequate funds may not be available when needed or may not be available on favorable or commercially acceptable terms, which could have a negative effect on our business and results of operations.
As of December 31, 2006,2008, we had a backlog of approximately $42.7$37.7 million compared to approximately $15.7$37.8 million as of December 31, 2005.2007. Our backlog consists of products for which customer purchase orders have been received and which are scheduled or in the process of being scheduled for shipment. While we expect to fulfill the order backlog within the current year, most orders are subject to rescheduling or cancellation with little or no penalties. Because of the possibility of customer changes in product scheduling or order cancellation, our backlog as of any particular date may not be an indicator of net sales for any succeeding period.
Contractual Obligations and Off-Balance Sheet Arrangements
The following table describes our commitments to settle non-cancelable lease and purchase commitments as of December 31, 2006.
| | | | | | | | | | | | | | | | | | | | | |
| | | Less Than 1
| | | | | | | | | More Than
| | | | |
| | | Year | | | 1-3 Years | | | 3-5 Years | | | 5 Years | | | Total | |
| | | (In thousands) | |
| |
Operating leases | | $ | 2,371 | | | $ | 2,016 | | | $ | 1,053 | | | $ | 3,214 | | | $ | 8,654 | |
Purchase obligations | | $ | 55,227 | | | $ | — | | | $ | — | | | $ | — | | | $ | 55,227 | |
| | | | | | | | | | | | | | | | | | | | | |
| | | $ | 57,598 | | | $ | 2,016 | | | $ | 1,053 | | | $ | 3,214 | | | $ | 63,881 | |
| | | | | | | | | | | | | | | | | | | | | |
2008. | | | | | | | | | | | | | | | |
| | | Less Than
1 Year | | 1-3
Years | | 3-5
Years | | More Than
5 Years | | Total |
| | | (In thousands) |
Operating leases, net of sublease payments | | $ | 5,589 | | $ | 7,922 | | $ | 16,716 | | $ | 6,176 | | $ | 36,403 |
Purchase obligations | | $ | 26,777 | | $ | — | | $ | — | | $ | — | | $ | 26,777 |
| | | | | | | | | | | | | | | |
| | $ | 32,366 | | $ | 7,922 | | $ | 16,716 | | $ | 6,176 | | $ | 63,180 |
| | | | | | | | | | | | | | | |
We lease office space, cars and equipment under non-cancelable operating leases with various expiration dates through December 2026. Rent expense was $1.3$6.3 million for the year ended December 31, 2004, $1.52008, $3.4 million for the year ended December 31, 20052007, and $2.2 million for the year ended December 31, 2006. The terms of some of the office leases provide for rental payments on a graduated scale. We recognize rent expense
on a straight-line basis over the lease period, and have accrued for rent expense incurred but not paid. We have also accrued for the expected loss on certain facilities we do not intend to sublease. The amounts presented are consistent with contractual terms and are not expected to differ significantly, unless a substantial change in our headcount needs requires us to exit an office facility early or expand our occupied space.
We enter into various inventory-related purchase agreements with suppliers. Generally, under these agreements, 50% of the orders are cancelable by giving notice 46 to 60 days prior to the expected shipment date and 25% of orders are cancelable by giving notice31-45 days prior to the expected shipment date. Orders are not cancelable within 30 days prior to the expected shipment date. At December 31, 2006,2008, we had $55.2$26.8 million in non-cancelable purchase commitments with suppliers.
As part of our acquisition of SkipJam, we agreed We expect to pay up to $1.4 million in cash contingent on the continued employment of certain former SkipJam employees with us. These payments will be recorded as compensation expense over a two-year period. During the year ended December 31, 2006,sell all products for which we have recorded $486,000 of additional compensation expense pursuant to this agreement, and expect to pay up to $933,000 over the remaining life of this agreement.
37
Off-Balance Sheet Arrangements
We adopted FIN 48 on January 1, 2007. As of December 31,
2006,2008 and December 31, 2007, we had $14.5 million and $10.0 million, respectively, of total gross unrecognized tax benefits and related interest. The timing of any payments which could result from these unrecognized tax benefits will depend upon a number of factors. Accordingly, the timing of payment cannot be estimated. We do not expect a significant tax payment related to these obligations to occur within the next 12 months.Off-Balance Sheet Arrangements
As of December 31, 2008, we did not have any off-balance sheet arrangements as defined in Item 303(a)(4)(ii) of SECRegulation S-K.
Recent Accounting Pronouncements
See Note 1 of the Notes to Consolidated Financial Statements for recent accounting pronouncements.
pronouncements, which are hereby incorporated by reference into this Part II, Item 7.| Item 7A. | Quantitative and Qualitative Disclosures About Market Risk |
Interest Rate Risk
We do not use derivative financial instruments in our investment portfolio. We have an investment portfolio of fixed income securities that are classified as“available-for-sale “available-for-sale securities.” These securities, like all fixed income instruments, are subject to interest rate risk and will fall in value if market interest rates increase. We attempt to limit this exposure by investing primarily in highly rated short-term securities. Additionally, our investment policy generally limits the amount of credit exposure to any one issuer. Our investment policy requires investments to be rated triple-A with the objective of minimizing the potential risk of principal loss. Due to the short duration and conservative nature of our investment portfolio, a movement of 10% by market interest rates would not have a material impact on our operating results and the total value of the portfolio over the next fiscal year.
We
are exposedmonitor our interest rate and credit risks, including our credit exposure to
risks associated with foreign exchange rate fluctuations duespecific rating categories and to
individual issuers. There were no impairment charges on our
international manufacturing and sales activities. We generally have not hedged currency exposures. These exposures may change over time as business practices evolve and could negatively impact our operating results and financial condition. investments during fiscal 2008.Foreign Currency Transaction Risk
In the second quarter of 2005 we began to invoice some of our international customers in foreign currencies including, but not limited to, the Euro, Great Britain Pound,Australian dollar, British pound, euro, and Japanese Yen and the Australian dollar.yen. As the customers that are currently invoiced in local currency become a larger percentage of our business, or to the extent we begin to bill additional customers in foreign currencies, the impact of fluctuations in foreign exchange rates could have a more significant impact on our results of operations. For those customers in our international markets that we continue to sell to in U.S. dollars, an increase in the value of the U.S. dollar relative to foreign currencies could make our products more expensive and therefore reduce the demand for our products. Such a decline in the demand for our products could reduce sales and negatively impact our operating results. Certain operating expenses of our foreign operations require payment in the local currencies.
We are exposed to risks associated with foreign exchange rate fluctuations due to our international sales and operating activities. These exposures may change over time as business practices evolve and could negatively impact our operating results and financial condition. We began using derivatives in the fourth quarter of 2008 to partially offset our business exposure to foreign exchange risk on our foreign currency denominated assets and liabilities. The objective of these contracts is to reduce the impact of currency exchange rate movements on our operating results by offsetting gains and losses on the forward contracts with increases or decreases in foreign currency transactions. The contracts are marked-to-market on a monthly basis with gains and losses included in other income (expense), net in the Consolidated Statements of Operations. We do not use foreign currency contracts for speculative or trading purposes. Hedging of our balance sheet exposures may not always be effective to protect us against currency exchange rate fluctuations. In addition, we do not fully hedge our balance sheet exposures, leaving us at risk to foreign exchange gains and losses on the unhedged exposures. Furthermore, our hedging program is not currently structured to reduce the impact, due to volatile exchange rates, on net revenues, gross profit and operating profit. Accordingly, if there was an adverse movement in exchange rates, we might suffer significant losses. See Note 3 of the Notes to Consolidated Financial Statements for additional disclosure on our foreign currency contracts, which are hereby incorporated by reference into this Part II, Item 7A.
As of December 31, 2006,2008, we had net assets in various local currencies. A hypothetical 10% movement in foreign exchange rates would result in an after tax positive or negative impact of $2.6 million$98,000 to net income, net of our hedged position, at December 31, 2006.
382008. Actual future gains and losses associated with our foreign currency exposures and positions may differ materially from the sensitivity analyses performed as of December 31, 2008 due to the inherent limitations associated with predicting the foreign currency exchange rates, and our actual exposures and positions. For the year ended December 31, 2008, 30% of total net revenue was denominated in a currency other than the U.S. dollar.
| |
| Item 8. | Consolidated Financial Statements and Supplementary Data |
Management’s Report on Internal Control Over Financial Reporting
Management of NETGEAR, Inc. is responsible for establishing and maintaining adequate internal control over financial reporting, as defined inRules 13a-15(f) and 15(d)-15(f) under the Securities Exchange Act of 1934. The Company’s internal control over financial reporting is designed to provide reasonable assurance regarding the reliability of financial reporting and the preparation of financial statements for external purposes in accordance with generally accepted accounting principles.
Because of its inherent limitations, internal control over financial reporting may not prevent or detect misstatements. Also, projections of any evaluation of effectiveness to future periods are subject to the risk that controls may become inadequate because of changes in conditions, or that the degree of compliance with the policies or procedures may deteriorate.
Under the supervision and with the participation of management, including its principal executive officer and principal financial officer, the Company assessed the effectiveness of its internal control over financial reporting as of December 31, 2006. In conducting its evaluation, the Company used the criteria set forth in theInternal Control-Integrated Frameworkissued by the Committee of Sponsoring Organizations of the Treadway Commission.
Based on its evaluation and those criteria, management concluded that the Company maintained effective internal control over financial reporting as of December 31, 2006. The Company’s independent registered public accounting firm, PricewaterhouseCoopers LLP, has audited management’s assessment of the Company’s internal control over financial reporting as of December 31, 2006 as stated in their report which appears herein.
39
Report of Independent Registered Public Accounting Firm
To the Board of Directors and Stockholders
We have completed integrated audits of NETGEAR, Inc.’s consolidated financial statements and of its internal control over financial reporting as of December 31, 2006 in accordance with the standards of the Public Company Accounting Oversight Board (United States). Our opinions, based on our audits, are presented below.
Consolidated financial statements and financial statement schedule
In our opinion, the consolidated financial statements listed in the accompanying index appearing under Item 15 (a)(1) present fairly, in all material respects, the financial position of NETGEAR, Inc. and its subsidiaries at December 31, 20062008 and December 31, 2005,2007, and the results of their operations and their cash flows for each of the three years in the period ended December 31, 20062008 in conformity with accounting principles generally accepted in the United States of America. In addition, in our opinion, the financial statement schedule appearing under Item 15 (a)(2) presents fairly, in all material respects, the information set forth therein when read in conjunction with the related consolidated financial statements. TheseAlso in our opinion, the Company maintained, in all material respects, effective internal control over financial statements and financial statement schedule arereporting as of December 31, 2008, based on criteria established in Internal Control—Integrated Framework issued by the responsibilityCommittee of Sponsoring Organizations of the Treadway Commission (COSO). The Company’s management. Our responsibilitymanagement is to express an opinion onresponsible for these financial statements and financial statement schedule, for maintaining effective internal control over financial reporting and for its assessment of the effectiveness of internal control over financial reporting, included in the accompanying Management��s Report on Internal Control over Financial Reporting appearing under Item 9A. Our responsibility is to express opinions on these financial statements, on the financial statement schedule, and on the Company’s internal control over financial reporting based on our integrated audits. We conducted our audits of these statements in accordance with the standards of the Public Company Accounting Oversight Board (United States). Those standards require that we plan and perform the auditaudits to obtain reasonable assurance about whether the financial statements are free of material misstatement. An auditmisstatement and whether effective internal control over financial reporting was maintained in all material respects. Our audits of the financial statements includesincluded examining, on a test basis, evidence supporting the amounts and disclosures in the financial statements, assessing the accounting principles used and significant estimates made by management, and evaluating the overall financial statement presentation. Our audit of internal control over financial reporting included obtaining an understanding of internal control over financial reporting, assessing the risk that a material weakness exists, and testing and evaluating the design and operating effectiveness of internal control based on the assessed risk. Our audits also included performing such other procedures as we considered necessary in the circumstances. We believe that our audits provide a reasonable basis for our opinion.
opinions.As discussed in Note 71 of the Notes to Consolidated Financial Statements, in accordance with the adoption of SFAS 123R, the Company changed the manner in which it accounts for share-based compensationfair value measurement of financial assets and liabilities in 2008 and the year ended December 31, 2006.
Internal control over financial reporting
Also,manner in our opinion, management’s assessment, includedwhich it accounts for uncertain tax positions in Management’s Report on Internal Control Over Financial Reporting appearing under Item 8, that the Company maintained effective internal control over financial reporting as of December 31, 2006 based on criteria established inInternal Control — Integrated Frameworkissued by the Committee of Sponsoring Organizations of the Treadway Commission (COSO), is fairly stated, in all material respects, based on those criteria. Furthermore, in our opinion, the Company maintained, in all material respects, effective internal control over financial reporting as of December 31, 2006, based on criteria established inInternal Control — Integrated Frameworkissued by the COSO. The Company’s management is responsible for maintaining effective internal control over financial reporting and for its assessment of the effectiveness of internal control over financial reporting. Our responsibility is to express opinions on management’s assessment and on the effectiveness of the Company’s internal control over financial reporting based on our audit. We conducted our audit of internal control over financial reporting in accordance with the standards of the Public Company Accounting Oversight Board (United States). Those standards require that we plan and perform the audit to obtain reasonable assurance about whether effective internal control over financial reporting was maintained in all material respects. An audit of internal control over financial reporting includes obtaining an understanding of internal control over financial reporting, evaluating management’s assessment, testing and evaluating the design and operating effectiveness of internal control, and performing such other procedures as we consider necessary in the circumstances. We believe that our audit provides a reasonable basis for our opinions.
2007.A company’s internal control over financial reporting is a process designed to provide reasonable assurance regarding the reliability of financial reporting and the preparation of financial statements for external purposes in accordance with generally accepted accounting principles. A company’s internal control over financial reporting includes those policies and procedures that (i) pertain to the maintenance of records that, in reasonable detail,
40
accurately and fairly reflect the transactions and dispositions of the assets of the company; (ii) provide reasonable assurance that transactions are recorded as necessary to permit preparation of financial statements in accordance with generally accepted accounting principles, and that receipts and expenditures of the company are being made only in accordance with authorizations of management and directors of the company; and (iii) provide reasonable assurance regarding prevention or timely detection of unauthorized acquisition, use, or disposition of the company’s assets that could have a material effect on the financial statements.
Because of its inherent limitations, internal control over financial reporting may not prevent or detect misstatements. Also, projections of any evaluation of effectiveness to future periods are subject to the risk that controls may become inadequate because of changes in conditions, or that the degree of compliance with the policies or procedures may deteriorate.
/s/ PRICEWATERHOUSECOOPERSPricewaterhouseCoopers LLP
413, 2009
CONSOLIDATED BALANCE SHEETS
| | | | | | | | | |
| | | December 31, | |
| | | 2005 | | | 2006 | |
| | | (In thousands, except share and per share data) | |
| |
ASSETS |
| Current assets: | | | | | | | | |
| Cash and cash equivalents | | $ | 90,002 | | | $ | 87,736 | |
| Short-term investments | | | 83,654 | | | | 109,729 | |
| Accounts receivable, net | | | 104,269 | | | | 119,601 | |
| Inventories | | | 51,873 | | | | 77,932 | |
| Deferred income taxes | | | 11,503 | | | | 13,415 | |
| Prepaid expenses and other current assets | | | 9,408 | | | | 15,946 | |
| | | | | | | | | |
| Total current assets | | | 350,709 | | | | 424,359 | |
| Property and equipment, net | | | 4,702 | | | | 6,568 | |
| Intangibles, net | | | — | | | | 975 | |
| Goodwill | | | 558 | | | | 3,800 | |
| Other non-current assets | | | 328 | | | | 2,202 | |
| | | | | | | | | |
| Total assets | | $ | 356,297 | | | $ | 437,904 | |
| | | | | | | | | |
| |
LIABILITIES AND STOCKHOLDERS’ EQUITY |
| Current liabilities: | | | | | | | | |
| Accounts payable | | $ | 38,912 | | | $ | 39,818 | |
| Accrued employee compensation | | | 7,743 | | | | 11,803 | |
| Other accrued liabilities | | | 66,279 | | | | 75,909 | |
| Deferred revenue | | | 4,304 | | | | 8,215 | |
| Income taxes payable | | | 3,055 | | | | 7,737 | |
| | | | | | | | | |
| Total current liabilities | | | 120,293 | | | | 143,482 | |
| Commitments and contingencies (Note 6) | | | | | | | | |
| Stockholders’ equity: | | | | | | | | |
| Preferred stock: $0.001 par value; 5,000,000 shares authorized in 2005 and 2006; none outstanding in 2005 or 2006 | | | — | | | | — | |
| Common stock: $0.001 par value; 200,000,000 shares authorized in 2005 and 2006; shares issued and outstanding: 32,963,596 in 2005 and 33,960,506 in 2006 | | | 33 | | | | 33 | |
| Additional paid-in capital | | | 204,754 | | | | 221,487 | |
| Deferred stock-based compensation | | | (468 | ) | | | — | |
| Cumulative other comprehensive loss | | | (90 | ) | | | (5 | ) |
| Retained earnings | | | 31,775 | | | | 72,907 | |
| | | | | | | | | |
| Total stockholders’ equity | | | 236,004 | | | | 294,422 | |
| | | | | | | | | |
| Total liabilities and stockholders’ equity | | $ | 356,297 | | | $ | 437,904 | |
| | | | | | | | | |
(In thousands, except share and per share data)
| | | | | | |
| | | December 31, |
| | | 2008 | | 2007 |
| ASSETS | | | | | | |
Current assets: | | | | | | |
Cash and cash equivalents | | $ | 192,839 | | $ | 167,495 |
Short-term investments | | | 10,170 | | | 37,848 |
Accounts receivable, net | | | 138,275 | | | 157,765 |
Inventories | | | 112,240 | | | 83,023 |
Deferred income taxes | | | 13,129 | | | 13,091 |
Prepaid expenses and other current assets | | | 22,695 | | | 20,367 |
| | | | | | |
Total current assets | | | 489,348 | | | 479,589 |
Property and equipment, net | | | 20,292 | | | 11,205 |
Intangibles, net | | | 13,311 | | | 16,319 |
Goodwill | | | 61,400 | | | 41,985 |
Other non-current assets | | | 1,858 | | | 2,011 |
| | | | | | |
Total assets | | $ | 586,209 | | $ | 551,109 |
| | | | | | |
| LIABILITIES AND STOCKHOLDERS’ EQUITY | | | | | | |
Current liabilities: | | | | | | |
Accounts payable | | $ | 60,073 | | $ | 55,333 |
Accrued employee compensation | | | 7,177 | | | 16,085 |
Other accrued liabilities | | | 87,747 | | | 89,470 |
Deferred revenue | | | 21,508 | | | 7,619 |
| | | | | | |
Total current liabilities | | | 176,505 | | | 168,507 |
Deferred income tax liability | | | 15 | | | 2,626 |
Non-current income taxes payable | | | 12,357 | | | 8,272 |
Other non-current liabilities | | | 6,374 | | | 181 |
| | | | | | |
Total liabilities | | | 195,251 | | | 179,586 |
Commitments and contingencies (Note 8) | | | | | | |
Stockholders’ equity: | | | | | | |
Preferred stock: $0.001 par value; 5,000,000 shares authorized in 2008 and 2007; none outstanding in 2008 or 2007 | | | — | | | — |
Common stock: $0.001 par value; 200,000,000 shares authorized in 2008 and 2007; shares issued and outstanding: 34,280,539 in 2008 and 35,243,586 in 2007 | | | 34 | | | 35 |
Additional paid-in capital | | | 266,070 | | | 252,421 |
Cumulative other comprehensive income | | | 67 | | | 101 |
Retained earnings | | | 124,787 | | | 118,966 |
| | | | | | |
Total stockholders’ equity | | | 390,958 | | | 371,523 |
| | | | | | |
Total liabilities and stockholders’ equity | | $ | 586,209 | | $ | 551,109 |
| | | | | | |
The accompanying notes are an integral part of these consolidated financial statements.
42
CONSOLIDATED STATEMENTS OF OPERATIONS
| | | | | | | | | | | | | |
| | | Year Ended December 31, | |
| | | 2004 | | | 2005 | | | 2006 | |
| | | (In thousands, except per share data) | |
| |
| Net revenue | | $ | 383,139 | | | $ | 449,610 | | | $ | 573,570 | |
| Cost of revenue(1) | | | 260,318 | | | | 297,911 | | | | 379,911 | |
| | | | | | | | | | | | | |
| Gross profit | | | 122,821 | | | | 151,699 | | | | 193,659 | |
| | | | | | | | | | | | | |
| Operating expenses: | | | | | | | | | | | | |
| Research and development(1) | | | 10,316 | | | | 12,837 | | | | 18,443 | |
| Sales and marketing(1) | | | 62,247 | | | | 71,345 | | | | 91,881 | |
| General and administrative(1) | | | 14,905 | | | | 14,559 | | | | 20,905 | |
| In-process research and development | | | — | | | | — | | | | 2,900 | |
| Litigation reserves | | | — | | | | 802 | | | | — | |
| | | | | | | | | | | | | |
| Total operating expenses | | | 87,468 | | | | 99,543 | | | | 134,129 | |
| | | | | | | | | | | | | |
| Income from operations | | | 35,353 | | | | 52,156 | | | | 59,530 | |
| Interest income | | | 1,593 | | | | 4,104 | | | | 6,974 | |
| Other income (expense), net | | | (560 | ) | | | (1,770 | ) | | | 2,495 | |
| | | | | | | | | | | | | |
| Income before income taxes | | | 36,386 | | | | 54,490 | | | | 68,999 | |
| Provision for income taxes | | | 12,921 | | | | 20,867 | | | | 27,867 | |
| | | | | | | | | | | | | |
| Net income | | $ | 23,465 | | | $ | 33,623 | | | $ | 41,132 | |
| | | | | | | | | | | | | |
| Net income per share: | | | | | | | | | | | | |
| Basic | | $ | 0.77 | | | $ | 1.04 | | | $ | 1.23 | |
| | | | | | | | | | | | | |
| Diluted | | $ | 0.72 | | | $ | 0.99 | | | $ | 1.19 | |
| | | | | | | | | | | | | |
| Weighted average shares outstanding used to compute net income per share: | | | | | | | | | | | | |
| Basic | | | 30,441 | | | | 32,351 | | | | 33,381 | |
| | | | | | | | | | | | | |
| Diluted | | | 32,626 | | | | 33,939 | | | | 34,553 | |
| | | | | | | | | | | | | |
| (1) Stock-based compensation expense was allocated as follows: | | | | | | | | | | | | |
| Cost of revenue | | $ | 163 | | | $ | 147 | | | $ | 430 | |
| Research and development | | | 400 | | | | 293 | | | | 1,119 | |
| Sales and marketing | | | 733 | | | | 375 | | | | 1,405 | |
| General and administrative | | | 391 | | | | 249 | | | | 1,551 | |
(In thousands, except per share data)
| | | | | | | | | | |
| | | Year Ended December 31, |
| | | 2008 | | | 2007 | | 2006 |
Net revenue | | $ | 743,344 | | | $ | 727,787 | | $ | 573,570 |
Cost of revenue | | | 502,320 | | | | 485,180 | | | 379,911 |
| | | | | | | | | | |
Gross profit | | | 241,024 | | | | 242,607 | | | 193,659 |
| | | | | | | | | | |
Operating expenses: | | | | | | | | | | |
Research and development | | | 33,773 | | | | 28,070 | | | 18,443 |
Sales and marketing | | | 121,687 | | | | 117,938 | | | 91,881 |
General and administrative | | | 31,733 | | | | 27,220 | | | 20,905 |
Restructuring | | | 1,929 | | | | — | | | — |
In-process research and development | | | 1,800 | | | | 4,100 | | | 2,900 |
Litigation reserves, net | | | 711 | | | | 167 | | | — |
| | | | | | | | | | |
Total operating expenses | | | 191,633 | | | | 177,495 | | | 134,129 |
| | | | | | | | | | |
Income from operations | | | 49,391 | | | | 65,112 | | | 59,530 |
Interest income, net | | | 4,336 | | | | 8,426 | | | 6,974 |
Other income (expense), net | | | (8,384 | ) | | | 3,298 | | | 2,495 |
| | | | | | | | | | |
Income before income taxes | | | 45,343 | | | | 76,836 | | | 68,999 |
Provision for income taxes | | | 27,293 | | | | 30,882 | | | 27,867 |
| | | | | | | | | | |
Net income | | $ | 18,050 | | | $ | 45,954 | | $ | 41,132 |
| | | | | | | | | | |
Net income per share: | | | | | | | | | | |
Basic | | $ | 0.51 | | | $ | 1.32 | | $ | 1.23 |
| | | | | | | | | | |
Diluted | | $ | 0.51 | | | $ | 1.28 | | $ | 1.19 |
| | | | | | | | | | |
Weighted average shares outstanding used to compute net income per share: | | | | | | | | | | |
Basic | | | 35,212 | | | | 34,809 | | | 33,381 |
| | | | | | | | | | |
Diluted | | | 35,619 | | | | 35,839 | | | 34,553 |
| | | | | | | | | | |
The accompanying notes are an integral part of these consolidated financial statements.
43
| | | | | | | | | | | | | | | | | | | | | | | | | | | | | |
| | | | | | | | | | | | | | | Cumulative
| | | Retained
| | | | |
| | | | | | | | | Additional
| | | Deferred
| | | Other
| | | Earnings
| | | | |
| | | Common Stock | | | Paid-in
| | | Stock-Based
| | | Comprehensive
| | | (Accumulated
| | | | |
| | | Shares | | | Amount | | | Capital | | | Compensation | | | Income (Loss) | | | Deficit) | | | Total | |
| | | (In thousands, except share data) | |
| |
| Balance at December 31, 2003 | | | 28,618,969 | | | | 28 | | | | 164,459 | | | | (4,248 | ) | | | 13 | | | | (25,313 | ) | | | 134,939 | |
| Comprehensive income: | | | | | | | | | | | | | | | | | | | | | | | | | | | | |
| Unrealized loss on short-term investments | | | — | | | | — | | | | — | | | | — | | | | (20 | ) | | | — | | | | (20 | ) |
| Net income | | | — | | | | — | | | | — | | | | — | | | | — | | | | 23,465 | | | | 23,465 | |
| | | | | | | | | | | | | | | | | | | | | | | | | | | | | |
| Total comprehensive income | | | — | | | | — | | | | — | | | | — | | | | — | | | | — | | | | 23,445 | |
| | | | | | | | | | | | | | | | | | | | | | | | | | | | | |
| Reversal of deferred stock-based compensation | | | — | | | | — | | | | (678 | ) | | | 678 | | | | — | | | | — | | | | — | |
| Amortization of deferred stock-based compensation | | | — | | | | — | | | | — | | | | 1,688 | | | | — | | | | — | | | | 1,688 | |
| Exercise of common stock options | | | 2,796,428 | | | | 3 | | | | 12,965 | | | | — | | | | — | | | | — | | | | 12,968 | |
| Issuance of common stock under employee stock purchase plan | | | 39,217 | | | | — | | | | 381 | | | | — | | | | — | | | | — | | | | 381 | |
| Tax benefit from exercise of stock options | | | — | | | | — | | | | 11,773 | | | | — | | | | — | | | | — | | | | 11,773 | |
| | | | | | | | | | | | | | | | | | | | | | | | | | | | | |
| Balance at December 31, 2004 | | | 31,454,614 | | | | 31 | | | | 188,900 | | | | (1,882 | ) | | | (7 | ) | | | (1,848 | ) | | | 185,194 | |
| Comprehensive income: | | | | | | | | | | | | | | | | | | | | | | | | | | | | |
| Unrealized loss on short-term investments | | | — | | | | — | | | | — | | | | — | | | | (83 | ) | | | — | | | | (83 | ) |
| Net income | | | — | | | | — | | | | — | | | | — | | | | — | | | | 33,623 | | | | 33,623 | |
| | | | | | | | | | | | | | | | | | | | | | | | | | | | | |
| Total comprehensive income | | | — | | | | — | | | | — | | | | — | | | | — | | | | — | | | | 33,540 | |
| | | | | | | | | | | | | | | | | | | | | | | | | | | | | |
| Reversal of deferred stock-based compensation | | | — | | | | — | | | | (350 | ) | | | 350 | | | | — | | | | — | | | | — | |
| Amortization of deferred stock-based compensation | | | — | | | | — | | | | — | | | | 1,064 | | | | — | | | | — | | | | 1,064 | |
| Exercise of common stock options | | | 1,422,123 | | | | 2 | | | | 8,101 | | | | — | | | | — | | | | — | | | | 8,103 | |
| Issuance of common stock under employee stock purchase plan | | | 86,859 | | | | — | | | | 1,002 | | | | — | | | | — | | | | — | | | | 1,002 | |
| Tax benefit from exercise of stock options | | | — | | | | — | | | | 7,101 | | | | — | | | | — | | | | — | | | | 7,101 | |
| | | | | | | | | | | | | | | | | | | | | | | | | | | | | |
| Balance at December 31, 2005 | | | 32,963,596 | | | | 33 | | | | 204,754 | | | | (468 | ) | | | (90 | ) | | | 31,775 | | | | 236,004 | |
| Comprehensive income: | | | | | | | | | | | | | | | | | | | | | | | | | | | | |
| Unrealized gain on short-term investments | | | — | | | | — | | | | — | | | | — | | | | 85 | | | | — | | | | 85 | |
| Net income | | | — | | | | — | | | | — | | | | — | | | | — | | | | 41,132 | | | | 41,132 | |
| | | | | | | | | | | | | | | | | | | | | | | | | | | | | |
| Total comprehensive income | | | — | | | | — | | | | — | | | | — | | | | — | | | | — | | | | 41,217 | |
| | | | | | | | | | | | | | | | | | | | | | | | | | | | | |
| Reversal of deferred stock-based compensation | | | — | | | | — | | | | (468 | ) | | | 468 | | | | — | | | | — | | | | — | |
| Stock-based compensation expense | | | — | | | | — | | | | 4,505 | | | | — | | | | — | | | | — | | | | 4,505 | |
| Exercise of common stock options | | | 932,928 | | | | — | | | | 7,433 | | | | — | | | | — | | | | — | | | | 7,433 | |
| Issuance of common stock under employee stock purchase plan | | | 63,982 | | | | — | | | | 1,100 | | | | — | | | | — | | | | — | | | | 1,100 | |
| Tax benefit from exercise of stock options | | | — | | | | — | | | | 4,163 | | | | — | | | | — | | | | — | | | | 4,163 | |
| | | | | | | | | | | | | | | | | | | | | | | | | | | | | |
| Balance at December 31, 2006 | | | 33,960,506 | | | $ | 33 | | | $ | 221,487 | | | $ | — | | | $ | (5 | ) | | $ | 72,907 | | | $ | 294,422 | |
| | | | | | | | | | | | | | | | | | | | | | | | | | | | | |
2008(In thousands)
| | | | | | | | | | | | | | | | | | | | | | | | | | | |
| | | Common Stock | | | Paid-In
Capital | | | Stock-Based
Compensation | | | Comprehensive
Income (Loss) | | | Retained
Earnings | | | Total | |
| | | Shares | | | Amount | | | | | | |
Balance at December 31, 2005 | | 32,964 | | | $ | 33 | | | $ | 204,754 | | | $ | (468 | ) | | $ | (90 | ) | | $ | 31,775 | | | $ | 236,004 | |
| | | | | | | |
Comprehensive income: | | | | | | | | | | | | | | | | | | | | | | | | | | | |
Unrealized gain on short-term investments, net of tax | | — | | | | — | | | | — | | | | — | | | | 85 | | | | — | | | | 85 | |
Net income | | — | | | | — | | | | — | | | | — | | | | — | | | | 41,132 | | | | 41,132 | |
| | | | | | | | | | | | | | | | | | | | | | | | | | | |
Total comprehensive income | | — | | | | — | | | | — | | | | — | | | | — | | | | — | | | | 41,217 | |
| | | | | | | | | | | | | | | | | | | | | | | | | | | |
Reversal of deferred stock-based compensation | | — | | | | — | | | | (468 | ) | | | 468 | | | | — | | | | — | | | | — | |
Stock-based compensation expense | | — | | | | — | | | | 4,505 | | | | — | | | | — | | | | — | | | | 4,505 | |
Issuance of common stock under stock-based compensation plans | | 997 | | | | 1 | | | | 8,532 | | | | — | | | | — | | | | — | | | | 8,533 | |
Tax benefit from exercise of stock options | | — | | | | — | | | | 4,163 | | | | — | | | | — | | | | — | | | | 4,163 | |
| | | | | | | | | | | | | | | | | | | | | | | | | | | |
Balance at December 31, 2006 | | 33,961 | | | | 34 | | | | 221,486 | | | | — | | | | (5 | ) | | | 72,907 | | | | 294,422 | |
Cumulative adjustment resulting from adoption of FIN 48 | | — | | | | — | | | | — | | | | — | | | | — | | | | 255 | | | | 255 | |
Comprehensive income: | | | | | | | | | | | | | | | | | | | | | | | | | | | |
Unrealized gain on short-term investments, net of tax | | — | | | | — | | | | — | | | | — | | | | 106 | | | | — | | | | 106 | |
Net income | | — | | | | — | | | | — | | | | — | | | | — | | | | 45,954 | | | | 45,954 | |
| | | | | | | | | | | | | | | | | | | | | | | | | | | |
Total comprehensive income | | — | | | | — | | | | — | | | | — | | | | — | | | | — | | | | 46,060 | |
| | | | | | | | | | | | | | | | | | | | | | | | | | | |
Stock-based compensation expense | | — | | | | — | | | | 8,879 | | | | — | | | | — | | | | — | | | | 8,879 | |
Purchase and retirement of common stock | | (5 | ) | | | — | | | | — | | | | — | | | | — | | | | (150 | ) | | | (150 | ) |
Issuance of common stock under stock-based compensation plans | | 1,288 | | | | 1 | | | | 13,692 | | | | — | | | | — | | | | — | | | | 13,693 | |
Tax benefit from exercise of stock options | | — | | | | — | | | | 8,364 | | | | — | | | | — | | | | — | | | | 8,364 | |
| | | | | | | | | | | | | | | | | | | | | | | | | | | |
Balance at December 31, 2007 | | 35,244 | | | | 35 | | | | 252,421 | | | | — | | | | 101 | | | | 118,966 | | | | 371,523 | |
Comprehensive income: | | | | | | | | | | | | | | | | | | | | | | | | | | | |
Unrealized loss on short-term investments, net of tax | | — | | | | — | | | | — | | | | — | | | | (34 | ) | | | — | | | | (34 | ) |
Net income | | — | | | | — | | | | — | | | | — | | | | — | | | | 18,050 | | | | 18,050 | |
| | | | | | | | | | | | | | | | | | | | | | | | | | | |
Total comprehensive income | | — | | | | — | | | | — | | | | — | | | | — | | | | — | | | | 18,016 | |
| | | | | | | | | | | | | | | | | | | | | | | | | | | |
Stock-based compensation expense | | — | | | | — | | | | 11,206 | | | | — | | | | — | | | | — | | | | 11,206 | |
Purchase and retirement of common stock | | (1,178 | ) | | | (1 | ) | | | — | | | | — | | | | — | | | | (12,229 | ) | | | (12,230 | ) |
Issuance of common stock under stock-based compensation plans | | 214 | | | | — | | | | 2,362 | | | | — | | | | — | | | | — | | | | 2,362 | |
Tax benefit from exercise of stock options | | — | | | | — | | | | 81 | | | | — | | | | — | | | | — | | | | 81 | |
| | | | | | | | | | | | | | | | | | | | | | | | | | | |
Balance at December 31, 2008 | | 34,280 | | | $ | 34 | | | $ | 266,070 | | | $ | — | | | $ | 67 | | | $ | 124,787 | | | $ | 390,958 | |
| | | | | | | | | | | | | | | | | | | | | | | | | | | |
The accompanying notes are an integral part of these consolidated financial statements.
44
CONSOLIDATED STATEMENTS OF CASH FLOWS
| | | | | | | | | | | | | |
| | | Year Ended December 31, | |
| | | 2004 | | | 2005 | | | 2006 | |
| | | (In thousands) | |
| |
Cash flows from operating activities: | | | | | | | | | | | | |
| Net income | | $ | 23,465 | | | $ | 33,623 | | | $ | 41,132 | |
| Adjustments to reconcile net income to net cash provided by operating activities: | | | | | | | | | | | | |
| Depreciation and amortization | | | 2,593 | | | | 3,069 | | | | 7,078 | |
| Amortization (accretion) of investment purchase premiums (discounts) | | | 210 | | | | (1,373 | ) | | | (1,835 | ) |
| Non-cash stock-based compensation | | | 1,688 | | | | 1,064 | | | | 4,505 | |
| Income tax benefit associated with stock option exercises | | | 11,773 | | | | 7,101 | | | | 4,163 | |
| Excess tax benefit from stock-based compensation | | | — | | | | — | | | | (3,806 | ) |
| Deferred income taxes | | | (2,419 | ) | | | (356 | ) | | | (3,252 | ) |
| Changes in assets and liabilities, net of effect of acquisition: | | | | | | | | | | | | |
| Accounts receivable | | | (8,037 | ) | | | (22,066 | ) | | | (15,332 | ) |
| Inventories | | | (14,291 | ) | | | 1,684 | | | | (26,059 | ) |
| Prepaid expenses and other current assets | | | (2,492 | ) | | | (1,358 | ) | | | (6,582 | ) |
| Accounts payable | | | 21,850 | | | | (13,830 | ) | | | 906 | |
| Accrued employee compensation | | | 1,663 | | | | 2,209 | | | | 4,060 | |
| Other accrued liabilities | | | 19,667 | | | | 15,313 | | | | 9,497 | |
| Deferred revenue | | | (237 | ) | | | 2,160 | | | | 3,911 | |
| Income taxes payable | | | 1,894 | | | | (604 | ) | | | 4,682 | |
| | | | | | | | | | | | | |
| Net cash provided by operating activities | | | 57,327 | | | | 26,636 | | | | 23,068 | |
| | | | | | | | | | | | | |
Cash flows from investing activities: | | | | | | | | | | | | |
| Purchases of short-term investments | | | (451,287 | ) | | | (124,471 | ) | | | (173,191 | ) |
| Proceeds from maturities of short-term investments | | | 420,494 | | | | 117,873 | | | | 149,036 | |
| Purchase of property and equipment | | | (2,546 | ) | | | (4,193 | ) | | | (5,918 | ) |
| Payments made in connection with business acquisition | | | — | | | | — | | | | (7,600 | ) |
| | | | | | | | | | | | | |
| Net cash used in investing activities | | | (33,339 | ) | | | (10,791 | ) | | | (37,673 | ) |
| | | | | | | | | | | | | |
Cash flows from financing activities: | | | | | | | | | | | | |
| Proceeds from exercise of stock options | | | 12,968 | | | | 8,103 | | | | 7,433 | |
| Proceeds from issuance of common stock under employee stock purchase plan | | | 381 | | | | 1,002 | | | | 1,100 | |
| Excess tax benefit from stock-based compensation | | | — | | | | — | | | | 3,806 | |
| | | | | | | | | | | | | |
| Net cash provided by financing activities | | | 13,349 | | | | 9,105 | | | | 12,339 | |
| | | | | | | | | | | | | |
| Net increase (decrease) in cash and cash equivalents | | | 37,337 | | | | 24,950 | | | | (2,266 | ) |
| Cash and cash equivalents, at beginning of period | | | 27,715 | | | | 65,052 | | | | 90,002 | |
| | | | | | | | | | | | | |
| Cash and cash equivalents, at end of period | | $ | 65,052 | | | $ | 90,002 | | | $ | 87,736 | |
| | | | | | | | | | | | | |
Supplemental cash flow information: | | | | | | | | | | | | |
| Cash paid for income taxes | | $ | 3,297 | | | $ | 14,728 | | | $ | 22,284 | |
| | | | | | | | | | | | | |
(In thousands)
| | | | | | | | | | | | |
| | | Year Ended December 31, | |
| | | 2008 | | | 2007 | | | 2006 | |
Cash flows from operating activities: | | | | | | | | | | | | |
Net income | | $ | 18,050 | | | $ | 45,954 | | | $ | 41,132 | |
Adjustments to reconcile net income to net cash provided by operating activities: | | | | | | | | | | | | |
Depreciation and amortization | | | 13,261 | | | | 12,685 | | | | 7,078 | |
Purchase premium amortization (discount accretion) on investments | | | 56 | | | | (1,044 | ) | | | (1,835 | ) |
Non-cash stock-based compensation | | | 11,323 | | | | 8,879 | | | | 4,505 | |
Income tax benefit associated with stock option exercises | | | 81 | | | | 8,364 | | | | 4,163 | |
Excess tax benefit from stock-based compensation | | | (143 | ) | | | (7,053 | ) | | | (3,806 | ) |
Deferred income taxes | | | (2,029 | ) | | | (1,044 | ) | | | (3,252 | ) |
Changes in assets and liabilities, net of effect of acquisitions: | | | | | | | | | | | | |
Accounts receivable | | | 19,490 | | | | (36,962 | ) | | | (15,332 | ) |
Inventories | | | (29,135 | ) | | | (1,588 | ) | | | (26,059 | ) |
Prepaid expenses and other assets | | | (2,175 | ) | | | (6,346 | ) | | | (6,582 | ) |
Accounts payable | | | 4,740 | | | | 14,818 | | | | 906 | |
Accrued employee compensation | | | (8,908 | ) | | | 3,886 | | | | 4,060 | |
Other accrued liabilities | | | 4,942 | | | | 12,659 | | | | 9,497 | |
Deferred revenue | | | 13,889 | | | | (616 | ) | | | 3,911 | |
Income taxes payable | | | 4,085 | | | | 781 | | | | 4,682 | |
| | | | | | | | | | | | |
Net cash provided by operating activities | | | 47,527 | | | | 53,373 | | | | 23,068 | |
| | | | | | | | | | | | |
Cash flows from investing activities: | | | | | | | | | | | | |
Purchases of short-term investments | | | (10,133 | ) | | | (75,670 | ) | | | (173,191 | ) |
Proceeds from sale of short-term investments | | | 37,700 | | | | 148,765 | | | | 149,036 | |
Purchase of property and equipment | | | (15,390 | ) | | | (9,839 | ) | | | (5,918 | ) |
Payments made in connection with business acquisitions, net of cash acquired | | | (24,635 | ) | | | (57,466 | ) | | | (7,600 | ) |
| | | | | | | | | | | | |
Net cash provided by (used in) investing activities | | | (12,458 | ) | | | 5,790 | | | | (37,673 | ) |
| | | | | | | | | | | | |
Cash flows from financing activities: | | | | | | | | | | | | |
Purchase and retirement of common stock | | | (12,229 | ) | | | (150 | ) | | | — | |
Proceeds from exercise of stock options | | | 1,008 | | | | 12,487 | | | | 7,433 | |
Proceeds from issuance of common stock under employee stock purchase plan | | | 1,353 | | | | 1,206 | | | | 1,100 | |
Excess tax benefit from stock-based compensation | | | 143 | | | | 7,053 | | | | 3,806 | |
| | | | | | | | | | | | |
Net cash provided by (used in) financing activities | | | (9,725 | ) | | | 20,596 | | | | 12,339 | |
| | | | | | | | | | | | |
Net increase (decrease) in cash and cash equivalents | | | 25,344 | | | | 79,759 | | | | (2,266 | ) |
Cash and cash equivalents, at beginning of period | | | 167,495 | | | | 87,736 | | | | 90,002 | |
| | | | | | | | | | | | |
Cash and cash equivalents, at end of period | | $ | 192,839 | | | $ | 167,495 | | | $ | 87,736 | |
| | | | | | | | | | | | |
Supplemental cash flow information: | | | | | | | | | | | | |
Cash paid for income taxes | | $ | 25,177 | | | $ | 25,349 | | | $ | 22,284 | |
| | | | | | | | | | | | |
The accompanying notes are an integral part of these consolidated financial statements.
45
Note 1 — 1—The Company and Summary of Significant Accounting Policies:
NETGEAR, Inc. (“NETGEAR” or the “Company”) was incorporated in Delaware in January 1996. The Company designs, develops and markets networking products for small business, which the Company defines as a business with fewer than 250 employees, and home users. The Company focuses on satisfying theease-of-use, quality, reliability, performance and affordability requirements of these users. The Company’s product offerings enable users to share Internet access, peripherals, files, digital multimedia content and applications among multiple personal computers, or PCs,networked devices and other Internet-enabled devices. The Company sells products primarily through a global sales channel network, which includes traditional retailers, online retailers, direct market resellers, or DMRs, value added resellers, or VARs, and broadband service providers.
The accompanying consolidated financial statements include the accounts of the Company and its wholly owned subsidiaries. All inter-company accounts and transactions have been eliminated in the consolidation of these subsidiaries. Certain reclassifications have been made to prior period reported amounts to conform to current year presentation.
The Company’s fiscal year begins on January 1 of the year stated and ends on December 31 of the same year. The Company reports its results on a fiscal quarter basis rather than on a calendar quarter basis. Under the fiscal quarter basis, each of the first three fiscal quarters ends on the Sunday closest to the calendar quarter end, with the fourth quarter ending on December 31.
The preparation of financial statements in conformity with accounting principles generally accepted in the United States of America requires management to make estimates and assumptions that affect the reported amounts of assets and liabilities and disclosure of contingent assets and liabilities at the date of the financial statements and the reported amounts of revenues and expenses during the reported period. Actual results could differ from those estimates.
Cash and cash equivalents
The Company considers all highly liquid investments with a maturity at the time of purchase of three months or less to be cash equivalents. The Company deposits cash and cash equivalents with high credit quality financial institutions.
Short-term investments comprise marketable securities that consist of government securities with an original maturity or a remaining maturity at the time of purchase, of greater than three months and lessno more than twelve months. All marketable securities are held in the Company’s name with twoone high quality financial institutions, who actinstitution, which acts as the Company’s custodianscustodian and investment managers.manager. All of the Company’s marketable securities are classified asavailable-for-sale securities in accordance with the provisions of Statement of Financial Accounting Standards (“SFAS”) No. 115, “Accounting For Certain Investments in Debt and Equity Securities” and are carried at fair value with unrealized gains and losses reported as a separate component of stockholders’ equity.
46
NETGEAR, INC.
NOTES TO CONSOLIDATED FINANCIAL STATEMENTS — (Continued)
Certain risks and uncertainties
The Company’s products are concentrated in the networking industry, which is characterized by rapid technological advances, changes in customer requirements and evolving regulatory requirements and industry standards. The success of the Company depends on management’s ability to anticipateand/or to respond quickly and adequately to technological developments in its industry, changes in customer requirements, or changes in regulatory requirements or industry standards. Any significant delays in the development or introduction of products could have a material adverse effect on the Company’s business and operating results.
The Company relies on a limited number of third parties to manufacture all of its products. If any of the Company’s third party manufacturers cannot or will not manufacture its products in required volumes, on a cost-effective basis, in a timely manner, or at all, the Company will have to secure additional manufacturing capacity. Any interruption or delay in manufacturing could have a material adverse effect on the Company’s business and operating results.
Derivative financial instruments
The Company uses foreign currency forward contracts to hedge certain existing foreign currency denominated assets and liabilities. Foreign currency forward contracts generally mature within three months of inception. Under its foreign currency risk management strategy, the Company utilizes derivative instruments to reduce the impact of currency exchange rate movements on the Company’s operating results by offsetting gains and losses on the forward contracts with increases or decreases in foreign currency transactions. These exposures are monitored and managed by the Company as an integral part of its overall risk management program which focuses on the unpredictability of foreign currency markets and seeks to reduce the potentially adverse effects that the volatility of these markets may have on its operating results. The Company does not designate these foreign currency forward contracts as hedging instruments and, as such, records the changes in the fair value of these derivatives in earnings in accordance with SFAS No. 52, “Foreign Currency Translation.”
Concentration of credit risk
Financial instruments that potentially subject the Company to a concentration of credit risk consist of cash and cash equivalents, short-term investments and accounts receivable. The Company believes that there is minimal credit risk associated with the investment of its cash and cash equivalents and short-term investments, due to the high quality financial institutions which manage the Company’s investments, and the restrictions placed on the type of investment that can be entered into under the Company’s investment policy.
The Company’s short-term investments consist of investment-grade securities, and the Company’s cash and investments are held and managed by recognized financial institutions.The Company’s customers are primarily distributors as well as retailers and broadband service providers who sell the products to a large group of end-users. The Company maintains an allowance for doubtful accounts for estimated losses resulting from the inability of the Company’s customers to make required payments. The Company regularly performs credit evaluations of the Company’s customers’ financial condition and considers factors such as historical experience, credit quality, age of the accounts receivable balances, and geographic or country-specific risks and current economic conditions that may affect customers’ ability to pay, and, generally, requires no collateral from its customers.
The Company secures credit insurance for certain customers in international markets.The Company is exposed to credit loss in the event of nonperformance by counterparties to the foreign currency forward contracts used to mitigate the effect of foreign currency exchange rate changes. The Company believes the counterparties for its outstanding contracts are large, financially sound institutions and thus, the Company does not anticipate nonperformance by these counterparties. However, given the recent, unprecedented turbulence in the financial markets, the failure of additional counterparties is possible.
The following table summarizes the percentage of the Company’s total accounts receivable represented by customers with balances in excess of 10% of its total accounts receivable as of December 31, 20052008 and 2006.
| | | | | | | | | |
| | | December 31, | |
| | | 2005 | | | 2006 | |
| |
| Ingram Micro, Inc. | | | 21 | % | | | 12 | % |
| Tech Data Corporation | | | 15 | % | | | 12 | % |
| Best Buy Co., Inc. | | | 17 | % | | | 15 | % |
2007. | | | | | | |
| | | December 31, | |
| | | 2008 | | | 2007 | |
Best Buy Co., Inc. | | 18 | % | | 19 | % |
Ingram Micro, Inc. | | 12 | % | | 11 | % |
Fair value of financial instrumentsmeasurements
The carrying amounts of the Company’s financial instruments, including cash and cash equivalents, accounts receivable, prepaid expenses,and accounts payable accrued employee compensation and other accrued liabilities approximate their fair values due to their short maturities. Foreign currency forward contracts are recorded at fair value based on observable market data. See Note 312 for disclosures regarding the fair value of the Company’s short-term investments.
measurements in accordance with SFAS No. 157, Fair Value Measurements (“SFAS 157”).Inventories
Inventories consist primarily of finished goods which are valued at the lower of cost or market, with cost being determined using thefirst-in, first-out method. The Company writes down its inventories based on estimated excess and obsolete inventories determined primarily by future demand forecasts. At the point of loss recognition, a new,
47
NETGEAR, INC.
NOTES TO CONSOLIDATED FINANCIAL STATEMENTS — (Continued)
lower cost basis for that inventory is established, and subsequent changes in facts and circumstances do not result in the restoration or increase in that newly established cost basis.
Property and equipment are stated at historical cost, less accumulated depreciation. Depreciation is computed using the straight-line method over the estimated useful lives of the assets as follows:
| | | | |
Computer equipment | | | 2 years | |
Furniture and fixtures | | | 5 years | |
Software | | | 2-5 years | |
Machinery and equipment | | | 1-32-3 years | |
Leasehold improvements | | | Shorter of the lease term or 5 years | |
The Company accounts for impairment of property and equipment in accordance with SFAS No. 144 “Accounting for the Impairment or Disposal of Long-Lived Assets.” Recoverability of assets to be held and used is measured by comparing the carrying amount of an asset to the estimated undiscounted future cash flows expected to be generated by the asset. If the carrying amount of the asset exceeds its estimated undiscounted future net cash flows, an impairment charge is recognized by the amount by which the carrying amount of the asset exceeds the fair value of the asset. The carrying value of the asset is reviewed on a regular basis for the existence of facts, both internal and external, that may suggest impairment. The Company didCharges related to the impairment of property and equipment were not recognize impairment chargesmaterial in any of the periods presented.
years ended December 31, 2008, 2007 and 2006.Goodwill and intangibles
The Company applies SFAS No. 142, “Goodwill and Other Intangible Assets” and performs an annual goodwill impairment test.test in the fourth quarter of each year. Should certain events or indicators of impairment occur between annual impairment tests, the Company will perform the impairment test as those events or indicators occur. For purposes of impairment testing, the Company has determined that it has only one reporting unit.
The identification and measurement of goodwill impairment test involves a two-step process. In the estimationfirst step, the Company estimates the Company’s fair value and compares the fair value with the carrying value of the Company’s net assets. If the fair
value is greater than the carrying value of the Company’s net assets, then no impairment results. If the fair value is less than its carrying value, then the Company would perform the second step and determine the fair value of the Company. The estimatesgoodwill. In this second step, the amount of impairment is determined by comparing the implied fair value to the carrying value of the goodwill in the same manner as if the Company was being acquired in a business combination. Specifically, the Company would allocate the fair value to all of the Company’s assets and liabilities, including any unrecognized intangible assets, in a hypothetical analysis that would calculate the implied fair value of goodwill. If the implied fair value of goodwill is less than the recorded goodwill, an impairment charge would be recorded to earnings in the Consolidated Statements of Operations.
In addition, the Company are based onwould evaluate goodwill for impairment if events or circumstances change between annual tests indicating a possible impairment. Examples of such events or circumstances include the best information available as offollowing: a significant decline in the date of the assessment, which primarily includes the Company’s market capitalization and incorporates management assumptions about expected future cash flows.
flows; a sustained, significant decline in the Company’s stock price and market capitalization; a significant adverse change in the business climate; the testing for recoverability of a significant asset group; and slower growth rates.In the fourth quarter of fiscal 2008, the Company completed the annual impairment test of goodwill. The Company’s fair value was determined using a combination of the income approach and the market approach. Under the market approach, the Company utilized information regarding the Company as well as publicly available industry information to determine earnings multiples and revenue multiples that were used to value the Company. Under the income approach, the Company determined the fair value based on estimated future cash flows, discounted by an estimated weighted-average cost of capital, which reflects the Company’s overall level of inherent risk and the rate of return an outside investor would expect to earn. Determining the Company’s fair value is judgmental in nature and requires the use of significant estimates and assumptions, including revenue growth rates and operating margins, discount rates and future market conditions, among others.
Solely for the purpose of establishing inputs for the fair value calculation, the Company made the following assumptions. For the income approach, a 3% growth factor was used to calculate the Company’s terminal value and the discount rate was estimated at 20%. For the market approach, the Company applied a control premium of 30% which seeks to give effect to the increased consideration a potential acquirer would be required to pay in order to gain sufficient ownership to set policies, direct operations and make decisions related to the Company. In conducting its impairment test in the fourth quarter of 2008, the Company determined its fair value exceeded the carrying value of its net assets by approximately 12%. No goodwill impairment loss was recognized in the years ended December 31, 2006, 2007, or 2008.
Given the current economic environment and the uncertainties regarding the impact on the Company’s business, there can be no assurance that the Company’s estimates and assumptions regarding the duration of the ongoing economic downturn, or the period or strength of recovery, made for purposes of the Company’s goodwill impairment testing during the year ended December 31, 2008 will prove to be accurate predictions of the future. If the Company’s assumptions regarding forecasted revenue or earnings are not achieved, the Company may be required to record goodwill impairment charges in future periods, whether in connection with the Company’s next annual impairment testing in the fourth quarter of 2009 or prior to that, if any such change constitutes a triggering event outside of the quarter from when the annual goodwill impairment test is performed. It is not possible at this time to determine if any such future impairment charge would result or, if it does, whether such charge would be material.
Long-lived assets
Purchased intangible assets with finite lives are amortized using the straight-line method over the estimated economic lives of the assets, which range from two to fourfive years. Purchased intangible assets determined to have indefinite useful lives are not amortized. Long-lived assets, including property and equipment and intangible assets, are reviewed for impairment whenever events or changes in circumstances indicate that the carrying amount of such assets may not be recoverable, in accordance with SFAS No. 144, “Accounting for the Impairment or Disposal of Long-Lived Assets.” Such conditions may include an economic downturn or a change
in the assessment of future operations. Determination of recoverability is based on an estimate of undiscounted future cash flows resulting from the use of the asset and its eventual disposition. MeasurementIf the aggregate undiscounted cash flows are less than the carrying value of anthe assets, the resulting impairment loss for long-livedcharge to be recorded is calculated based on the excess of the carrying value of the assets that management expects to hold and use is based onover the fair value of such assets, with the asset.fair value determined based on an estimate of discounted future cash flows. Long-lived assets to be disposed of are reported at the lower of carrying amount or fair value less costs to sell. The carrying value of the asset is reviewed on a regular basis for the existence of facts, both internal and external, that may suggest impairment.
In the fourth quarter of 2008, a key employee responsible for managing the asset group acquired in connection with the Company’s 2006 acquisition of Skipjam Corp. departed the Company. The departure of this employee, along with the recent economic environment, resulted in the Company’s decision to reduce efforts geared at marketing the related products. As a result, the Company performed an impairment analysis of these long-lived assets during the fourth quarter of 2008. Based on the results of the analysis, the Company recorded an impairment charge, which was classified in cost of revenue in the Consolidated Statements of Operations, of $458,000 for the net carrying value of intangibles acquired in connection with the Company’s 2006 acquisition of Skipjam Corp. During the years ended December 31, 2007 and 2006, there were no events or changes in circumstances that indicated the carrying amount of the Company’s long-lived assets may not be recoverable from their undiscounted cash flows. Consequently, the Company did not perform an impairment test or record an impairment of its long-lived assets during those periods.
The Company will continue to evaluate the carrying value of its long-lived assets and if it determines in the future that there is a potential further impairment, the Company may be required to record additional charges to earnings which could affect the Company’s financial results.
Product warranties
The Company provides for estimated future warranty obligations at the time revenue is recognized. The Company’s standard warranty obligation to its direct customers generally provides for a right of return of any product for a full refund in the event that such product is not merchantable or is found to be damaged or defective. At the time revenue is recognized, an estimate of future warranty returns is recorded to reduce revenue in the amount of the expected credit or refund to be provided to its direct customers. At the time the Company records the reduction to revenue related to warranty returns, the Company includes within cost of revenue a write-down to reduce the carrying value of such products to net realizable value. The Company’s standard warranty obligation to its end-users provides for repair or replacement of a defective product for one or more years. Factors that affect the warranty obligation include product failure rates, material usage, and service delivery costs incurred in correcting product
48
NETGEAR, INC.
NOTES TO CONSOLIDATED FINANCIAL STATEMENTS — (Continued)
failures. The estimated cost associated with fulfilling the Company’s warranty obligation to end-users is recorded in cost of revenue. Because the Company’s products are manufactured by contractthird party manufacturers, in certain cases the Company has recourse to the contractthird party manufacturer for replacement or credit for the defective products. The Company gives consideration to amounts recoverable from its contractthird party manufacturers in determining its warranty liability. Changes in the Company’s warranty liability, which is included as a component of “Other accrued liabilities” in the consolidated balance sheets, are as follows (in thousands):
| | | | | | | | | |
| | | Year Ended December 31, | |
| | | 2005 | | | 2006 | |
| |
| Balance as of beginning of year | | $ | 10,766 | | | $ | 11,845 | |
| Provision for warranty liability made during the year | | | 25,087 | | | | 45,459 | |
| Settlements made during the year | | | (24,008 | ) | | | (36,005 | ) |
| | | | | | | | | |
| Balance at end of year | | $ | 11,845 | | | $ | 21,299 | |
| | | | | | | | | |
| | | | | | | | |
| | | Year Ended December 31, | |
| | | 2008 | | | 2007 | |
Balance as of beginning of the period | | $ | 27,557 | | | $ | 21,299 | |
Provision for warranty liability made during the period | | | 46,449 | | | | 45,400 | |
Warranty obligation assumed in acquisition | | | 82 | | | | 432 | |
Settlements made during the period | | | (45,481 | ) | | | (39,574 | ) |
| | | | | | | | |
Balance at end of period | | $ | 28,607 | | | $ | 27,557 | |
| | | | | | | | |
Revenue recognition
Revenue from product sales is recognized at the time the product is shipped provided that persuasive evidence of an arrangement exists, title and risk of loss has transferred to the customer, the selling price is fixed or determinable and collection of the related receivable is reasonably assured. Currently, for some of the Company’s customers, title passes to the customer upon delivery to the port or country of destination, upon their receipt of the product, or upon the customer’s resale of the product. At the end of each fiscal quarter, the Company estimates and defers revenue related to product where title has not transferred. The revenue continues to be deferred until such time that title passes to the customer.
The Company assesses collectability based on a number of factors, including general economic and market conditions, past transaction history with the customer, and the creditworthiness of the customer. If the Company determines that collection of the fee is not reasonably assured, then the Company defers the fee and recognizes revenue upon receipt of payment.In addition to warranty-related returns, certain distributors and retailers generally have the right to return product for stock rotation purposes. Every quarter, stock rotation rights are generally limited to 10% of invoiced sales to the distributor or retailer in the prior quarter. Upon shipment of the product, the Company reduces revenue for an estimate of potential future product warranty and stock rotation returns related to the current period product revenue. Management analyzes historical returns, channel inventory levels, current economic trends and changes in customer demand for the Company’s products when evaluating the adequacy of the allowance for sales returns, namely warranty and stock rotation returns. Revenue on shipments is also reduced for estimated price protection and sales incentives deemed to be contra-revenue under Emerging Issues Task Force (“EITF”) IssueNo. 01-9.
Sales incentives provided to customers are accounted for in accordance with EITF IssueNo. 01-9, “Accounting for Consideration Given by a Vendor to a Customer or Reseller of the Vendor’s Products”. Under these guidelines, the Company accrues for sales incentives as a marketing expense if it receives an identifiable benefit in exchange and can reasonably estimate the fair value of the identifiable benefit received; otherwise, it is recorded as a reduction to revenues. As a consequence, the Company records a substantial portion of its channel marketing costs as a reduction of revenue.
The Company records estimated reductions to revenues for sales incentives at the later of when the related revenue is recognized or when the program is offered to the customer or end consumer.
Shipping and handling fees and costs
In September 2000, the EITF issued EITF IssueNo. 00-10, “Accounting for Shipping and Handling Fees and Costs.” EITF IssueNo. 00-10 requires shipping and handling fees billed to customers to be classified as revenue and shipping and handling costs to be either classified as cost of revenue or disclosed in the notesNotes to the consolidated financial statements.Consolidated Financial Statements. The Company includes shipping and handling fees billed to customers in net revenue.
49
NETGEAR, INC.
NOTES TO CONSOLIDATED FINANCIAL STATEMENTS — (Continued)
Shipping and handling costs associated with inbound freight are included in cost of revenue. In cases where the Company gives a freight allowance to the customer for their own inbound freight costs, such costs are appropriately recorded as a reduction in net revenue. Shipping and handling costs associated with outbound freight are included in sales and marketing expenses and totaled $6.4$12.5 million, $6.7$11.6 million and $8.3 million in the years ended December 31, 2004, 20052008, 2007 and 2006 respectively.
Costs incurred in the research and development of new products are charged to expense as incurred.
Advertising costs are expensed as incurred. Total advertising and promotional expenses were $11.9$17.0 million, $14.5$17.4 million and $15.3 million in the years ended December 31, 2004, 20052008, 2007 and 2006, respectively.
The Company accounts for income taxes under an asset and liability approach. Under this method, income tax expense is recognized for the amount of taxes payable or refundable for the current year. In addition, deferred tax assets and liabilities are recognized for the expected future tax consequences of temporary differences resulting from different treatmentstreatment for tax versus accounting offor certain items, such as accruals and allowances not currently deductible for tax purposes. These differences result in deferred tax assets and liabilities, which are included within the consolidated balance sheet. The Company must then assess the likelihood that the Company’s deferred tax assets will be recovered from future taxable income and to the extent the Company believes that recovery is not more likely than not, the Company must establish a valuation allowance.
TheAs discussed in Note 7, effective January 1, 2007, the Company assessesadopted Financial Accounting Standards Board (“FASB”) Interpretation No. 48, “Accounting for Uncertainty in Income Taxes” (“FIN 48”). In the probabilityordinary course of adverse outcomes from tax examinations regularly to determine the adequacy ofbusiness there is inherent uncertainty in assessing the Company’s income tax liability. Ifpositions. The Company assesses its tax positions and records benefits for all years subject to examination based on management’s evaluation of the Company ultimately determinesfacts, circumstances and information available at the reporting date. For those tax positions where it is more likely than not that payment of these amounts is unnecessary, the Company reverses the liability and recognizes a tax benefit during the period in whichwill be sustained, the Company determinesrecords the largest amount of tax benefit with a greater than 50 percent likelihood of being realized upon ultimate settlement with a taxing authority that the liabilityhas full knowledge of all relevant information. For those income tax positions where it is not more likely than not that a tax benefit will be sustained, no longer necessary. The Company records an additional chargetax benefit has been recorded in the Company’s provision for taxes in the period in which the Company determines that the recordedfinancial statements. Where applicable, associated interest and penalties have also been recognized as a component of income tax liability is less than the Company expects the ultimate assessment to be.
expense.Computation of net income per share
Basic net income per share is computed by dividing net income by the weighted average number of common shares outstanding for the period. Diluted net income per share reflects the additional dilution from potential issuances of common stock, such as stock issuable pursuant to the exercise of stock options and awards. Potentially dilutive shares are excluded from the computation of diluted net income per share when their effect is anti-dilutive.
Effective January 1, 2006, the Company adopted the fair value recognition provisions of SFAS No. 123 (revised 2004), “Share-Based Payment” (“SFAS 123R”), using the modified prospective transition method and therefore has not restated results for prior periods.method. Under this transition method, stock-based compensation expense for the yearyears ended December 31, 2008, 2007 and 2006 includes compensation expense for all stock-based compensation awards granted prior to, but not yet vested as of January 1, 2006, based on the grant date fair value estimated in accordance with the original provisions of SFAS No. 123, “Accounting for Stock-Based Compensation” (“SFAS 123”). Stock-based compensation expense for all stock-based compensation awards granted on or after January 1, 2006 is based on the grant-date fair value estimated in accordance with the provisions of SFAS 123R. The valuation provisions of SFAS 123R also apply to grants that are modified after January 1, 2006. The Company recognizes these compensation costs on a straight-line basis over the requisite service period of the award, which is generally
50
NETGEAR, INC.
NOTES TO CONSOLIDATED FINANCIAL STATEMENTS — (Continued)
the option vesting term of four years. Prior to the adoption of SFAS 123R, the Company recognized stock-based compensation expense in accordance with Accounting Principles Board (“APB”) Opinion No. 25, “Accounting for Stock Issued to Employees” (“APB 25”). In March 2005, the Securities and Exchange Commission (the “SEC”) issued Staff Accounting Bulletin No. 107 (“SAB 107”) regarding the SEC’s interpretation of SFAS 123R and the valuation of share-based payments for public companies. The Company has applied the provisions of SAB 107 in its adoption of SFAS 123R. See Note 79 for a further discussion on stock-based compensation.
Under SFAS No. 130, “Reporting Comprehensive Income,” the Company is required to display comprehensive income and its components as part of the financial statements.components. The Company has displayed its comprehensive income as part of the Consolidated Statements of Stockholders’ Equity.
Foreign currency translation
The Company’s functional currency is the U.S. dollar for all of its international subsidiaries. Foreign currency transactions of international subsidiaries are remeasuredre-measured into U.S. dollars at theend-of-period
exchange rates for monetary assets and liabilities, and historical exchange rates for nonmonetary assets. Expenses are remeasuredre-measured at average exchange rates in effect during each period, except for expenses related to non-monetary assets, which are remeasuredre-measured at historical exchange rates. Revenue is remeasuredre-measured at the daily rateaverage exchange rates in effect as of the date the order ships.during each period. Gains and losses arising from foreign currency transactions are included in net income and were a net lossesloss of $560,000$7.2 million for the year ended December 31, 2008, and $1.8net gains of $3.3 million and $2.5 million for the years ended December 31, 20042007 and 2005, respectively, and a net gain of $2.5 million for the year ended December 31, 2006.
2006, respectively.Recent accounting pronouncements
In JuneSeptember 2006, the Financial Accounting Standards Board (“FASB”) issued FASB Interpretation No. 48, “Accounting for Uncertainty in Income Taxes — an interpretationStatement of FASB Statement No. 109”Financial Accounting Standards (“FIN 48”SFAS”), which clarifies the accounting for uncertainty in income tax positions. FIN 48 prescribes a recognition threshold and measurement attribute for the financial statement recognition and measurement of a tax position taken, or expected to be taken, on a tax return. This Interpretation also provides guidance on derecognition, classification, interest, penalties, accounting in interim periods, disclosure and transition. The evaluation of a tax position in accordance with this Interpretation is a two-step process. The first step will determine if it is more likely than not that a tax position will be sustained upon examination and should therefore be recognized. The second step will measure a tax position that meets the more likely than not recognition threshold to determine the amount of benefit to recognize in the financial statements. FIN 48 is effective for fiscal years beginning after December 15, 2006. The Company is currently evaluating the impact of adopting FIN 48 on the consolidated financial statements.
In June 2006, the EITF reached a consensus on EITF IssueNo. 06-3, “How Taxes Collected from Customers and Remitted to Governmental Authorities Should Be Presented in the Income Statement (That Is, Gross versus Net Presentation)”. EITF IssueNo. 06-3 provides that the presentation of taxes assessed by a governmental authority that is directly imposed on a revenue-producing transaction between a seller and a customer on either a gross basis (included in revenues and costs) or on a net basis (excluded from revenues) is an accounting policy decision that should be disclosed. EITF IssueNo. 06-3 is effective for fiscal years beginning after December 15, 2006. The Company is currently evaluating the impact of adopting EITF IssueNo. 06-3 on the consolidated financial statements.
In September 2006, the FASB issued SFAS No. 157, “FairFair Value Measurements”Measurements (“SFAS 157”), which defines fair value, establishes guidelinesa framework for measuring fair value in accordance with U.S. generally accepted accounting principles, and expands disclosures regardingabout fair value measurements. SFAS 157 applies under other existing accounting pronouncements that require or permit fair value measurements, as the FASB previously concluded in those accounting pronouncements that fair value is the relevant measurement attribute. Accordingly, SFAS 157 does not require any new fair value measurements but rather eliminates inconsistencies in guidance found in various prior accounting pronouncements.measurements. Effective January 1, 2008, the Company adopted SFAS 157 is effective for fiscal years beginning after
51
NETGEAR, INC.
NOTES TO CONSOLIDATED FINANCIAL STATEMENTS — (Continued)
November 15, 2007. The Company is currently evaluating the impact of adoptingas it relates to financial assets and liabilities recognized at fair value on a recurring basis. Additional disclosures required by SFAS 157 on the consolidated financial statements.
In September 2006, the SEC issued Staff Accounting Bulletin No. 108, “Considering the Effects of Prior Year Misstatements when Quantifying Misstatementsare included in Current Year Financial Statements” (“SAB 108”). SAB 108 requires that registrants quantify errors using both a balance sheet and income statement approach and evaluate whether either approach results in a misstated amount that, when all relevant quantitative and qualitative factors are considered, is material. SAB 108 is effective for fiscal years ending after November 15, 2006, and did not have a material impact on the Company’s consolidated financial statements.
Note 12.In February 2007, the FASB issued SFAS No. 159, “The Fair Value Option for Financial Assets and Financial Liabilities”Liabilities—Including an amendment of FASB Statement No. 115,” (“SFAS 159”). SFAS 159 which permits entities to chooseelect to measure many financial assetsinstruments and financial liabilitiescertain other items at fair value that are not currently required to be measured at fair value. Unrealized gains and losses on items for whichThis election is irrevocable. SFAS 159 was effective in the first quarter of fiscal 2008. The Company has not elected to apply the fair value option has been electedto any of its financial instruments.
In December 2007, the FASB issued SFAS No. 141 (revised 2007), “Business Combinations” (“SFAS 141R”) and SFAS No. 160, “Non-controlling Interests in Consolidated Financial Statements, an amendment of Accounting Research Bulletin No. 51” (“SFAS 160”). SFAS 141R will have a material impact on future business combinations by the Company as it establishes principles and requirements for how the Company: (1) recognizes and measures in its financial statements the identifiable assets acquired, the liabilities assumed, and any noncontrolling interest in the acquiree; (2) recognizes and measures the goodwill acquired in the business combination or a gain from a bargain purchase; and (3) determines what information to disclose to enable users of the financial statements to evaluate the nature and financial effects of the business combination. SFAS 141R requires contingent consideration to be recognized at its fair value on the acquisition date and the recognition of in-process research and development as an indefinite-lived intangible asset until the development is complete, after which time the related capitalized costs would be amortized over the expected useful life. If the in-process research and development is subsequently abandoned prior to completion, the associated capitalized costs would be expensed in such period. SFAS 141R also requires acquisition-related transaction and restructuring costs to be expensed rather than treated as part of the cost of the acquisition. SFAS 160 will change the accounting and reporting for minority interests, which will be re-characterized as non-controlling interests and classified as a component of equity. SFAS 141R and SFAS 160 are reported in earnings. SFAS 159 is effective for fiscal years beginning after NovemberDecember 15, 2007.2008. The Company is currently assessingwill assess the impact of SFAS 159141R if and when future acquisitions occur. The Company does not expect that the adoption of SFAS 160 will have an impact on the consolidated financial statements.
In February 2008, the FASB issued FASB Staff Position (“FSP”) No. 157-2, Effective Date of FASB Statement No. 157 (“FSP 157-2”), which delays the effective date of SFAS 157 until January 1, 2009 for all non-financial assets and non-financial liabilities, except for items that are recognized or disclosed at fair value in the financial statements on a recurring basis. These non-financial items include assets and liabilities such as reporting units measured at fair value in a goodwill impairment test and non-financial assets acquired and liabilities assumed in a business combination. The Company does not expect that the adoption of the remainder of SFAS 157 will have an impact on the consolidated financial statements.
In March 2008, the FASB issued FASB Statement No. 161, “Disclosures about Derivative Instruments and Hedging Activities” (“SFAS 161”). SFAS 161 requires companies with derivative instruments to disclose information that should enable financial-statement users to understand how and why a company uses derivative instruments, how derivative instruments and related hedged items are accounted for under FASB Statement No. 133 (“SFAS 133”) “Accounting for Derivative Instruments and Hedging Activities” and how derivative instruments and related hedged items affect a company’s financial position, financial performance and cash flows. SFAS 161 is effective for financial statements issued for fiscal years and interim periods beginning after November 15, 2008. The Company does not expect that the adoption of SFAS 161 will have an impact on the consolidated financial statements.
In April 2008, the FASB issued FSP No. 142-3, “Determination of the Useful Life of Intangible Assets” (“FSP 142-3”), which amends the factors an entity should consider in developing renewal or extension assumptions used in determining the useful life of recognized intangible assets under FASB Statement No. 142, “Goodwill and Other Intangible Assets”. This new guidance applies prospectively to intangible assets that are acquired individually or with a group of other assets in business combinations and asset acquisitions. FSP 142-3 is effective for financial statements issued for fiscal years and interim periods beginning after December 15, 2008. Early adoption is prohibited. The Company will assess the impact of FSP 142-3 if and when future acquisitions occur.
In September 2008, the FASB issued FSP No. 133-1 and FASB Interpretation No. 45-4 (“FSP SFAS 133-1 and FIN 45-4”), “Disclosures about Credit Derivatives and Certain Guarantees: An Amendment of FASB Statement No. 133 and FASB Interpretation No. 45; and Clarification of the Effective Date of FASB Statement No. 161”. FSP SFAS 133-1 and FIN 45-4 amends SFAS 133 to require disclosures by sellers of credit derivatives, including credit derivatives embedded in hybrid instruments. FSP SFAS 133-1 and FIN 45-4 also amend FASB Interpretation No. 45 (“FIN 45”), “Guarantor’s Accounting and Disclosure Requirements for Guarantees, Including Indirect Guarantees of Indebtedness to Others”, to require additional disclosure about the current status of the payment/performance risk of a guarantee. The provisions of the FSP that amend SFAS 133 and FIN 45 are effective for reporting periods ending after November 15, 2008. FSP SFAS 133-1 and FIN 45-4 also clarifies the effective date in SFAS 161. Disclosures required by SFAS 161 are effective for financial statements issued for fiscal years and interim periods beginning after November 15, 2008. The adoption of FSP SFAS 133-1 and FIN 45-4 did not have an impact on the Company’s consolidated financial position, results of operations or cash flows.
In October 2008, the FASB issued FSP No. 157-3, “Determining the Fair Value of a Financial Asset When the Market for That Asset Is Not Active” (“FSP 157-3”). FSP 157-3 clarifies the application of SFAS 157 in a market that is not active and addresses application issues such as the use of internal assumptions when relevant observable data does not exist, the use of observable market information when the market is not active and the use of market quotes when assessing the relevance of observable and unobservable data. FSP 157-3 is effective for all periods presented in accordance with SFAS 157. The guidance in FSP 157-3 is effective immediately and did not have an impact on the Company upon adoption. See Note 12 for information and related disclosures regarding the Company’s fair value measurements.
In December 2008, the FASB issued FASB Staff Position (“FSP”) No. 140-4 and FIN 46R-8 (“FSP 140-4 and FIN 46R-8”), “Disclosures by Public Entities (Enterprises) about Transfers of Financial Assets and Interests in Variable Interest Entities.” FSP 140-4 and FIN 46R-8 require additional disclosures about transfers of financial assets and involvement with variable interest entities. The requirements apply to transferors, sponsors, servicers, primary beneficiaries and holders of significant variable interests in a variable interest entity or qualifying special purpose entity. Disclosures required by FSP 140-4 and FIN 46R-8 are effective for the Company in the first quarter of fiscal 2009. Because FSP 140-4 and FIN 46R-8 only require additional disclosures, the adoption will not impact the Company’s consolidated financial position, results of operations or cash flows.
Note 2 — 2—Business Acquisition:Acquisitions:
CP Secure International Holding Limited
On August 1, 2006,December 18, 2008, the Company completed the acquisition of SkipJam Corp.certain intellectual property and other assets of CP Secure International Holding Limited (“SkipJam”CP Secure”), a developerprivately-held provider of networkable media devicesintegrated network security solutions. The acquisition qualified as a business acquisition and has been accounted for home entertainment and control.using the purchase method of accounting. The Company believes the acquisition enhances its strategically important digital home entertainment and control business by strengtheningintends to incorporate CP Secure’s integrated platform into the Company’s abilityproducts to expand its multimedia product portfolio.provide organizations with enhanced protection for their network, web access and email traffic. The aggregate purchase price was $7.6$14 million, paid in cash.
CP Secure shareholders may receive a total additional payout of up to $3.5 million in cash over the five years following closure of the acquisition if developed products pass certain acceptance criteria. Any additional payout is expected to be accounted for as additional purchase price and is expected to be recorded as an increase in goodwill.The results of SkipJam’sCP Secure’s operations have been included in the consolidated financial statements since the date of acquisition. The historical results of SkipJamoperations of CP Secure prior to the acquisition were not material to the Company’s results of operations.
The accompanying consolidated financial statements reflect total considerationa purchase price of approximately $7.7$14.6 million, consisting of cash, and other costs directly related to the acquisition as follows (in thousands):
| | | | | |
| Purchase price | | $ | 7,600 | |
| Direct acquisition costs | | | 133 | |
| | | | | |
| Total consideration | | $ | 7,733 | |
| | | | | |
| | | |
Purchase price | | $ | 14,000 |
Direct acquisition costs | | | 635 |
| | | |
Total consideration | | $ | 14,635 |
| | | |
In accordance with the purchase method of accounting, the Company allocated the total purchase price to tangible assets, liabilities and identifiable intangible assets based on their estimated fair values. The excess of purchase price over the aggregate fair values was recorded as goodwill. The fair values assigned to identifiable intangible assets acquired were estimated with the assistance of an independent valuation firm. Purchased intangibles are amortized on a straight-line basis over their respective estimated useful lives. Goodwill was recorded based on the residual purchase price after allocating the purchase price to the fair market value of tangible and intangible assets acquired less liabilities assumed. Goodwill arises as a result of, among other factors, future unidentified new products and new technologies as well as the implicit value of future cost savings as a result of the combining of entities. The total allocation of the purchase price is as follows (in thousands):
| | | | | |
| | | Fair Value on
| |
| | | August 1, 2006 | |
| |
| Prepaid expenses and other current assets | | $ | 6 | |
| Intangibles | | | 4,000 | |
| Goodwill | | | 3,243 | |
| Non-current deferred income taxes | | | 484 | |
| | | | | |
| Total purchase price allocation | | $ | 7,733 | |
| | | | | |
$2.9 | | | | |
| | | Fair Value on
December 18, 2008 | |
Inventories | | | 82 | |
Property and equipment, net | | | 49 | |
Intangibles, net | | | 3,900 | |
Goodwill | | | 10,686 | |
Other accrued liabilities | | | (82 | ) |
| | | | |
Total purchase price allocation | | $ | 14,635 | |
| | | | |
Of the $10.7 million of goodwill recorded on the acquisition of CP Secure, $4.5 million and $10.7 million is deductible for federal and state income tax purposes, respectively.
A total of $1.8 million of the $4.0$3.9 million in acquired intangible assets was designated as in-process research and development (“in-process R&D”). In-process R&D iswas expensed upon an acquisition because technological feasibility has not been established and no future alternative uses exist. The Company acquired only onetwo in-process
52
NETGEAR, INC.
NOTES TO CONSOLIDATED FINANCIAL STATEMENTS — (Continued)
R&D
project,projects, which
isinvolve improvements to threat management characteristics of future products. These two projects required further research and development to determine technical feasibility and commercial viability. The fair value assigned to in-process R&D was determined using the income approach, under which the Company considered the importance of products under development to the Company’s overall developmentplans, estimated the costs to develop the purchased in-process R&D into commercially viable products, estimated the resulting net cash flows from the products when completed and discounted the net cash flows to their present values. The Company used a 32% discount rate in the present value calculations, which was derived from a weighted-average cost of capital analysis, adjusted to reflect additional risks related to the products’ development and success as well as the products’ stage of completion. The estimates used in valuing in-process R&D were based upon assumptions believed to be reasonable but which are inherently uncertain and unpredictable. These assumptions may be incomplete or inaccurate, and unanticipated events and circumstances may occur. Accordingly, actual results may vary from the projected results.
A total of $1.2 million of the $3.9 million in acquired intangible assets was designated as existing technology. The value was calculated based on the present value of the future estimated cash flows derived from projections of future revenue attributable to existing technology. This $1.2 million will be amortized over its estimated useful life of three years.
A total of $900,000 of the $3.9 million in acquired intangible assets was designated as core technology. The value was calculated based on the present value of the future estimated cash flows derived from estimated royalty savings attributable to the core technology. This $900,000 will be amortized over its estimated useful life of five years.
Infrant Technologies, Inc.
On May 16, 2007, the Company completed the acquisition of 100% of the outstanding shares of Infrant Technologies, Inc. (“Infrant”), a developer of network attached storage products. The Company believes the acquisition will accelerate the Company’s participation in the expanding market for network attached storage. The aggregate purchase price was $60 million, paid in cash. Under the terms of the acquisition agreement, Infrant shareholders may receive a total additional payout of up to $20 million in cash over the three years following closure of the acquisition if specific revenue targets are reached, of which $10 million was paid in November 2008. Any additional payout will primarily be accounted for as additional purchase price and will be recorded as an increase in goodwill.
The results of Infrant’s operations have been included in the consolidated financial statements since the date of acquisition. The historical results of Infrant prior to the acquisition were not material to the Company’s results of operations.
The accompanying consolidated financial statements reflect an initial purchase price of approximately $60.3 million, consisting of cash, and other costs directly related to the acquisition as follows (in thousands):
| | | |
Purchase price | | $ | 60,000 |
Direct acquisition costs | | | 254 |
| | | |
Total consideration | | $ | 60,254 |
| | | |
In accordance with the purchase method of accounting, the Company allocated the total purchase price to tangible assets, liabilities and identifiable intangible assets based on their estimated fair values. Goodwill was recorded based on the residual purchase price after allocating the purchase price to the fair market value of tangible and intangible assets acquired less liabilities assumed. Purchased intangibles are amortized on a straight-line basis over their respective estimated useful lives. Goodwill arises as a result of, among other factors, future unidentified new products and new technologies as well as the implicit value of future cost savings as a result of the combining of entities. The total allocation of the purchase price is as follows (in thousands):
| | | | |
| | | Fair Value on
May 16, 2007 | |
Cash and cash equivalents | | $ | 2,787 | |
Accounts receivable | | | 1,202 | |
Inventories | | | 3,504 | |
Deferred income taxes | | | 667 | |
Prepaid expenses and other current assets | | | 36 | |
Property and equipment | | | 128 | |
Intangibles | | | 22,700 | |
Goodwill | | | 38,185 | |
Accounts payable | | | (697 | ) |
Accrued employee compensation | | | (396 | ) |
Other accrued liabilities | | | (1,048 | ) |
Deferred income tax liability | | | (6,814 | ) |
| | | | |
Total purchase price allocation | | $ | 60,254 | |
| | | | |
The goodwill of $38.2 million recorded on the acquisition of Infrant is not deductible for income tax purposes.
A total of $4.1 million of the $22.7 million in acquired intangible assets was designated as in-process R&D. In-process R&D was expensed upon acquisition because technological feasibility has not been established and no future alternative uses exist. The Company acquired three in-process R&D projects. Two projects involve development of new products in the ReadyNAS desktop product category, and one project involves development of a multimediahigher end version of a product that had not reached technologicalcurrently selling in the ReadyNAS rack mount product category. These three projects required further research and development to determine technical feasibility and had no alternative use.
commercial viability. The fair value assigned to in-process R&D was determined using the income approach, under which the Company considered the importance of products under development to the Company’s overall development plans, estimated the costs to develop the purchased in-process R&D into commercially viable products, estimated the resulting net cash flows from the products when completed and discounted the net cash flows to their present
values. The Company used discount rates ranging from 36% to 38% in the present value calculations, which was derived from a weighted-average cost of capital analysis, adjusted to reflect additional risks related to the products’ development and success as well as the products’ stage of completion. The estimates used in valuing in-process R&D were based upon assumptions believed to be reasonable but which are inherently uncertain and unpredictable. These assumptions may be incomplete or inaccurate, and unanticipated events and circumstances may occur. Accordingly, actual results may vary from the projected results.A total of $10.8 million of the $22.7 million in acquired intangible assets was designated as existing technology. The value was calculated based on the present value of the future estimated cash flows derived from projections of future revenue attributable to existing technology. This $10.8 million will be amortized over its estimated useful life of four years.
A total of $5.2 million of the $22.7 million in acquired intangible assets was designated as core technology. The value was calculated based on the present value of the future estimated cash flows derived from estimated royalty savings attributable to the core technology. This $5.2 million will be amortized over its estimated useful life of four years.
A total of $2.6 million of the $22.7 million in acquired intangible assets was designated as trademarks. The value was calculated based on the present value of the future estimated cash flows derived from estimated royalty savings attributable to use of the trademarks. This $2.6 million will be amortized over its estimated useful life of six years.
In November 2008, the Company made an additional $10 million payment in connection with the Company’s 2007 acquisition of Infrant in connection with the achievement of certain revenue targets. This resulted in an increase in goodwill of $8.7 million, the recognition of compensation expense of $650,000, and a reduction in taxes payable of $620,000.
Skipjam Corp.
On August 1, 2006, the Company completed the acquisition of SkipJam Corp. (“SkipJam”), a developer of networkable media devices for home entertainment and control. The Company believes the acquisition enhances its strategically important digital home entertainment and control business by strengthening the Company’s ability to expand its multimedia product portfolio. The aggregate purchase price was $7.6 million, paid in cash.
The results of SkipJam’s operations have been included in the consolidated financial statements since the date of acquisition. The historical results of SkipJam prior to the acquisition were not material to the Company’s results of operations.
The accompanying consolidated financial statements reflect total consideration of approximately $7.7 million, consisting of cash, and other costs directly related to the acquisition as follows (in thousands):
| | | |
Purchase price | | $ | 7,600 |
Direct acquisition costs | | | 133 |
| | | |
Total consideration | | $ | 7,733 |
| | | |
In accordance with the purchase method of accounting, the Company allocated the total purchase price to tangible assets, liabilities and identifiable intangible assets based on their estimated fair values. The excess of purchase price over the aggregate fair values was recorded as goodwill. Purchased intangibles are amortized on a straight-line basis over their respective useful lives. The total allocation of the purchase price is as follows (in thousands):
| | | |
| | | Fair Value on
August 1, 2006 |
Prepaid expenses and other current assets | | $ | 6 |
Intangibles | | | 4,000 |
Goodwill | | | 3,243 |
Non-current deferred income taxes | | | 484 |
| | | |
Total purchase price allocation | | $ | 7,733 |
| | | |
$2.9 million of the $4.0 million in acquired intangible assets was designated as in-process research and development (“in-process R&D”). In-process R&D was expensed upon acquisition because technological feasibility has not been established and no future alternative uses exist. The Company acquired only one in-process R&D project, which is related to the development of a multimedia product that had not reached technological feasibility and had no alternative use.
The fair value assigned to in-process R&D was determined using the income approach, under which the Company considered the importance of products under development to the Company’s overall development plans, estimated the costs to develop the purchased in-process R&D into commercially viable products, estimated the resulting net cash flows from the products when completed and discounted the net cash flows to their present
values. The Company used a discount rate of 35% in the present value calculations, which was derived from a weighted-average cost of capital analysis, adjusted to reflect additional risks related to the products’ development and success as well as the products’ stage of completion. The estimates used in valuing in-process R&D were based upon assumptions believed to be reasonable but which are inherently uncertain and unpredictable. These assumptions may be incomplete or inaccurate, and unanticipated events and circumstances may occur. Accordingly, actual results may vary from the projected results. The Company incurred costs of approximately $725,000 to complete the project, of which approximately $575,000 was incurred through December 31, 2006.2006 and the remainder was incurred in 2007. The Company completed the project in February 2007.
$1.0 million of the $4.0 million in acquired intangible assets was designated as core technology. The value was calculated based on the present value of the future estimated cash flows derived from estimated royalty savings attributable to the core technology. This $1.0 million willwas originally intended to be amortized over its four year useful life.
In the fourth quarter of 2008, the Company determined that this intangible asset was impaired, and recorded an impairment charge within cost of revenue in the Consolidated Statements of Operations of $458,000 for the net carrying value of the intangible. For further discussion of the Company’s intangibles impairment analysis, please see Note 1.The remaining acquired intangible assets consist of non-competition agreements of $100,000, with a two year useful life. None of the goodwill recorded as part of the SkipJam acquisition will be deductible for income tax purposes.
Of the $1.1 million in total intangibles subject to amortization, $125,000 was expensed by the Company in the year ended December 31, 2006.
As part of the acquisition, the Company has also agreed to pay up to $1.4 million in cash contingent on the continued employment of certain SkipJam employees with the Company. These payments will bewere recorded as compensation expense over a two-year period. During
Note 3—Balance Sheet Components (in thousands):
Available-for-sale short-term investments consist of the following:
| | | | | | | | | | | | | | | | | | |
| | | December 31, |
| | | 2008 | | 2007 |
| | | Cost | | Unrealized
Gain | | Estimated
Fair Value | | Cost | | Unrealized
Gain | | Estimated
Fair Value |
U.S. Treasury bills and notes | | $ | 10,061 | | $ | 109 | | $ | 10,170 | | $ | 37,683 | | $ | 165 | | $ | 37,848 |
| | | | | | | | | | | | | | | | | | |
Derivative financial instruments:
The Company uses derivatives to mitigate its business exposure to foreign exchange risk. Foreign currency forward contracts are used to offset the foreign exchange risk on certain existing assets and liabilities. The Company records all derivatives on the balance sheet at fair value. All forward contracts mature within three months.
The following table shows the outstanding forward contracts at December 31, 2008 (in thousands):
| | | | | | | | | | | | | |
| | | December 31, 2008 | |
| | | Currency | | Local Currency
Contract Amount | | Currency | | Contracted
Amount | | Fair Market
Value at
December 31,
2008 | |
Forward contracts to sell | | | | | | | | | | | | | |
Australian dollar | | AUD | | 12,353 | | USD | | $ | 8,253 | | ($ | 178 | ) |
euro | | EUR | | 25,101 | | USD | | $ | 32,449 | | ($ | 2,611 | ) |
British pound | | GBP | | 11,609 | | USD | | $ | 18,096 | | $ | 1,444 | |
Japanese yen | | JPY | | 447,929 | | USD | | $ | 4,492 | | ($ | 436 | ) |
These forward contracts are the Company’s only derivative instruments. The Company accounts for forward contracts in accordance with SFAS No. 52, “Foreign Currency Translation.” The Company realized net gains of $616,000 upon settlement of forward contracts during the year ended December 31, 2006,2008.
The Company did not enter into any forward contracts in the Company recorded $486,000 of additional compensation expense pursuant to this agreement.
year ended December 31, 2007.Note 3 — Balance Sheet Components (in thousands):
Available-for-sale short-term investments consist of the following:
| | | | | | | | | | | | | | | | | | | | | | | | | |
| | | December 31, |
| | | 2005 | | 2006 |
| | | | | Unrealized
| | Estimated
| | | | Unrealized
| | Estimated
|
| | | Cost | | Loss | | Fair Value | | Cost | | Loss | | Fair Value |
| |
| Government Securities | | $ | 83,744 | | | $ | (90 | ) | | $ | 83,654 | | | $ | 109,734 | | | $ | (5 | ) | | $ | 109,729 | |
| | | | | | | | | | | | | | | | | | | | | | | | | |
53
NETGEAR, INC.
NOTES TO CONSOLIDATED FINANCIAL STATEMENTS — (Continued)
Accounts receivable and related allowances consist of the following:
| | | | | | | | | |
| | | December 31, | |
| | | 2005 | | | 2006 | |
| |
| Gross accounts receivable | | $ | 113,005 | | | $ | 132,651 | |
| | | | | | | | | |
| Less: Allowance for doubtful accounts | | | (1,295 | ) | | | (1,727 | ) |
| Allowance for sales returns | | | (5,985 | ) | | | (8,129 | ) |
| Allowance for price protection | | | (1,456 | ) | | | (3,194 | ) |
| | | | | | | | | |
| Total allowances | | | (8,736 | ) | | | (13,050 | ) |
| | | | | | | | | |
| Accounts receivable, net | | $ | 104,269 | | | $ | 119,601 | |
| | | | | | | | | |
| | | | | | | | | | |
| | | | | December 31, | |
| | | | | 2008 | | | 2007 | |
| | | | | (In thousands) | |
Gross accounts receivable | | $ | 153,333 | | | $ | 169,986 | |
| | | | | | | | | | |
Less: | | Allowance for doubtful accounts | | | (1,918 | ) | | | (2,307 | ) |
| | Allowance for sales returns | | | (9,710 | ) | | | (9,417 | ) |
| | Allowance for price protection | | | (3,430 | ) | | | (497 | ) |
| | | | | | | | | | |
| | Total allowances | | | (15,058 | ) | | | (12,221 | ) |
| | | | | | | | | | |
Accounts receivable, net | | $ | 138,275 | | | $ | 157,765 | |
| | | | | | | | | | |
Inventories consist of the following:
| | | | | | | | | |
| | | December 31, | |
| | | 2005 | | | 2006 | |
| |
| Finished goods | | $ | 51,873 | | | $ | 77,932 | |
| | | | | | | | | |
| | | | | | |
| | | December 31, |
| | | 2008 | | 2007 |
| | | (In thousands) |
Raw materials | | $ | 639 | | $ | 496 |
Finished goods | | | 111,601 | | | 82,527 |
| | | | | | |
Total | | $ | 112,240 | | $ | 83,023 |
| | | | | | |
Property and equipment, net, consists of the following:
| | | | | | | | | |
| | | December 31, |
| | | 2005 | | 2006 |
| |
| Computer equipment | | $ | 4,514 | | | $ | 6,101 | |
| Furniture, fixtures and leasehold improvements | | | 1,407 | | | | 2,150 | |
| Software | | | 4,523 | | | | 6,805 | |
| Machinery | | | 4,174 | | | | 5,646 | |
| Construction in progress | | | 1,090 | | | | 554 | |
| | | | | | | | | |
| | | | 15,708 | | | | 21,256 | |
| Less: Accumulated depreciation and amortization | | | (11,006 | ) | | | (14,688 | ) |
| | | | | | | | | |
| | | $ | 4,702 | | | $ | 6,568 | |
| | | | | | | | | |
| | | | | | | | |
| | | December 31, | |
| | | 2008 | | | 2007 | |
Computer equipment | | $ | 6,101 | | | $ | 7,798 | |
Furniture, fixtures and leasehold improvements | | | 8,734 | | | | 2,699 | |
Software | | | 18,083 | | | | 10,237 | |
Machinery | | | 8,923 | | | | 7,075 | |
Construction in progress | | | 158 | | | | 3,305 | |
| | | | | | | | |
| | | 41,999 | | | | 31,114 | |
Less: Accumulated depreciation and amortization | | | (21,707 | ) | | | (19,909 | ) |
| | | | | | | | |
| | $ | 20,292 | | | $ | 11,205 | |
| | | | | | | | |
Depreciation and amortization expense pertaining to property and equipment in 2004, 20052008, 2007 and 2006 was $2.6$6.3 million, $3.1$5.3 million and $4.0 million, respectively.
Goodwill
Activity related to goodwill consisted of the following:
| | | | | | |
| | | Year Ended December 31, |
| | | 2008 | | 2007 |
Balance as of beginning of the period | | $ | 41,985 | | $ | 3,800 |
Additions related to earn-out payments | | | 8,729 | | | — |
Additions related to acquisitions | | | 10,686 | | | 38,185 |
| | | | | | |
Balance at end of period | | $ | 61,400 | | $ | 41,985 |
| | | | | | |
During 2008, the Company recorded $10.7 million of goodwill related to the acquisition of CP Secure. The company also recorded $8.7 million of goodwill, approximately $650,000 in compensation expense, and an approximate $620,000 reduction in taxes payable associated with a $10 million earn-out payment made in connection with the Company’s 2007 acquisition of Infrant. During 2007, the Company recorded $38.2 million of goodwill related to the acquisition of Infrant.
Intangibles, net, consist of the following:
| | | | | | | | | | | | | | | | | | | | |
| | | December 31,
2007
Cost | | December 31,
2007
Net | | Additions | | Amortization
Expense | | Impairment
Charge | | December 31,
2008
Net | | Weighted
Average
Amortization
Period
(Years) |
Core technology | | $ | 6,200 | | $ | 4,979 | | $ | 900 | | $ | 1,488 | | $ | 458 | | $ | 3,933 | | 1.37 |
Existing technology | | | 10,800 | | | 9,000 | | | 1,200 | | | 2,700 | | | — | | | 7,500 | | 3.57 |
Trademarks | | | 2,600 | | | 2,311 | | | — | | | 433 | | | — | | | 1,878 | | 2.17 |
Non-compete agreements | | | 100 | | | 29 | | | — | | | 29 | | | — | | | — | | — |
| | | | | | | | | | | | | | | | | | | | |
Total intangible assets | | $ | 19,700 | | $ | 16,319 | | $ | 2,100 | | $ | 4,650 | | $ | 458 | | $ | 13,311 | | 2.72 |
| | | | | | | | | | | | | | | | | | | | |
| | | | | | | | | | | | | | | | | |
| | | December 31,
2006
Cost | | December 31,
2006
Net | | Additions | | Amortization
Expense | | December 31,
2007
Net | | Weighted
Average
Amortization
Period
(Years) |
Core technology | | $ | 1,000 | | $ | 896 | | $ | 5,200 | | $ | 1,117 | | $ | 4,979 | | 1.62 |
Existing technology | | | — | | | — | | | 10,800 | | | 1,800 | | | 9,000 | | 1.67 |
Trademarks | | | — | | | — | | | 2,600 | | | 289 | | | 2,311 | | 2.67 |
Non-compete agreements | | | 100 | | | 79 | | | — | | | 50 | | | 29 | | 0.30 |
| | | | | | | | | | | | | | | | | |
Total intangible assets | | $ | 1,100 | | $ | 975 | | $ | 18,600 | | $ | 3,256 | | $ | 16,319 | | 1.79 |
| | | | | | | | | | | | | | | | | |
Amortization expense related to intangibles in 2008, 2007 and 2006 was $4.7 million, $3.3 million, and $125,000, respectively.
In 2008 the Company recorded an impairment charge within cost of revenue in the Consolidated Statements of Operations of $458,000 for the net carrying value of intangibles acquired during the Company’s 2006 acquisition of Skipjam Corp. Recoverability was assessed in accordance with SFAS No. 144, “Accounting for the Impairment or Disposal of Long-Lived Assets,” based on undiscounted estimated future net cash flows, and the impairment charge was based on fair value using discounted cash flows. No such impairment charges were recorded in prior years.
Estimated amortization expense related to intangibles for each of the next five years and thereafter is as follows (in thousands):
| | | |
Year Ending December 31, | | |
2009 | | $ | 5,013 |
2010 | | | 5,013 |
2011 | | | 2,347 |
2012 | | | 613 |
2013 | | | 325 |
Thereafter | | | — |
| | | |
Total expected amortization expense | | $ | 13,311 |
| | | |
Other accrued liabilities consist of the following:
| | | | | | | | | |
| | | December 31, | |
| | | 2005 | | | 2006 | |
| |
| Sales and marketing programs | | $ | 39,126 | | | $ | 38,058 | |
| Warranty obligation | | | 11,845 | | | | 21,299 | |
| Freight | | | 5,814 | | | | 4,073 | |
| Other | | | 9,494 | | | | 12,479 | |
| | | | | | | | | |
| Other accrued liabilities | | $ | 66,279 | | | $ | 75,909 | |
| | | | | | | | | |
| | | | | | |
| | | December 31, |
| | | 2008 | | 2007 |
| | | (In thousands) |
Sales and marketing programs | | $ | 33,584 | | $ | 39,796 |
Warranty obligation | | | 28,607 | | | 27,557 |
Freight | | | 3,546 | | | 4,728 |
Other | | | 22,010 | | | 17,389 |
| | | | | | |
Other accrued liabilities | | $ | 87,747 | | $ | 89,470 |
| | | | | | |
Note 4 — 4—Restructuring:
The Company accounts for its restructuring plans under SFAS No. 146, “Accounting for Costs Associated with Exit or Disposal Activities” (“SFAS 146”). The Company presents expenses related to restructuring as a separate line item in its Consolidated Statements of Operations.
On July 25, 2008, the Company ceased using buildings leased in Santa Clara and Fremont, California, and consolidated all personnel and operations from those locations to a new corporate headquarters in San Jose, California. The Company expects to sublease the majority of the formerly occupied Santa Clara space through the end of the operating lease, which extends to December 2010. However, payments from sublessee arrangements will not completely offset the payments of $3.5 million due under the original leases. The Company recognized $964,000 in expenses related to future lease payments on the vacated facilities in the year ended December 31, 2008.
The following is a summary of the accrued restructuring charges related to ceasing use of certain buildings:
| | | | | | | | | | | | | | | | | | | | | | | |
| | | Accrued
Restructuring
Charges at
December 31,
2007 | | Initial
Accrual
Recognition | | Adjustment
to Initial
Accrual
Recognition | | | Ongoing
Exit
Expense | | Present
Value
Accretion | | Cash
Payments | | | Accrued
Restructuring
Charges at
December 31,
2008 |
| | | (In thousands) |
Abandonment of excess leased facilities | | $ | — | | $ | 955 | | $ | (21 | ) | | $ | 12 | | $ | 18 | | $ | (610 | ) | | $ | 354 |
Current portion | | $ | — | | | | | | | | | | | | | | | | | | | $ | 264 |
Long-term portion | | $ | — | | | | | | | | | | | | | | | | | | | $ | 90 |
Additionally, on November 12, 2008, the Company terminated the employment of approximately 35 individuals. The Company recognized $965,000 in expenses related to this restructuring in the year ended December 31, 2008, of which $94,000 is accrued and not yet paid as of December 31, 2008. The Company expects to pay the $94,000 in the first quarter of 2009.
Note 5—Net Income Per Share:
Basic Earnings Per Share (“EPS”)net income per share is computed by dividing the net income (numerator)for the period by the weighted average number of common shares outstanding (denominator) during the period. Basic EPS excludesDiluted net income per share is computed by dividing the net income for the period by the weighted average number of shares of common stock and potentially dilutive effect of
54
NETGEAR, INC.
NOTES TO CONSOLIDATED FINANCIAL STATEMENTS — (Continued)
stock options. Diluted EPS gives effect to all dilutive potential common sharesstock outstanding during the period. In computing diluted EPS, the average stock price for the period is used in determining the number of shares assumed to be purchased using the proceeds from the assumed exercise of stock options.
Potentially dilutive common shares include outstanding stock options and unvested restricted stock awards, which are reflected in diluted earningsnet income per share by application of the treasury stock method. Under the treasury stock method, the amount that the employee must pay for exercising stock options, the amount of stock-based compensation cost for future services that the Company has not yet recognized, and the amount of tax benefit that would be recorded in additional paid-in capital upon exercise are assumed to be used to repurchase shares.
Net income per share for the years ended December 31, 2004, 20052008, 2007, and 2006 are as follows (in thousands, except per share data):
| | | | | | | | | | | | | |
| | | Year Ended December 31, | |
| | | 2004 | | | 2005 | | | 2006 | |
| |
| Net income | | $ | 23,465 | | | $ | 33,623 | | | $ | 41,132 | |
| | | | | | | | | | | | | |
| Weighted average shares outstanding: | | | | | | | | | | | | |
| Basic | | | 30,441 | | | | 32,351 | | | | 33,381 | |
| Options and awards | | | 2,185 | | | | 1,588 | | | | 1,172 | |
| | | | | | | | | | | | | |
| Total diluted | | | 32,626 | | | | 33,939 | | | | 34,553 | |
| | | | | | | | | | | | | |
| Basic net income per share | | $ | 0.77 | | | $ | 1.04 | | | $ | 1.23 | |
| | | | | | | | | | | | | |
| Diluted net income per share | | $ | 0.72 | | | $ | 0.99 | | | $ | 1.19 | |
| | | | | | | | | | | | | |
| | | | | | | | | |
| | | Year Ended December 31, |
| | | 2008 | | 2007 | | 2006 |
Net income | | $ | 18,050 | | $ | 45,954 | | $ | 41,132 |
| | | | | | | | | |
Weighted average shares outstanding: | | | | | | | | | |
Basic | | | 35,212 | | | 34,809 | | | 33,381 |
Options and awards | | | 407 | | | 1,030 | | | 1,172 |
| | | | | | | | | |
Total diluted shares | | | 35,619 | | | 35,839 | | | 34,553 |
| | | | | | | | | |
Basic net income per share | | $ | 0.51 | | $ | 1.32 | | $ | 1.23 |
| | | | | | | | | |
Diluted net income per share | | $ | 0.51 | | $ | 1.28 | | $ | 1.19 |
| | | | | | | | | |
Anti-dilutive common stock options totalling 416,280, 131,560totaling 3,231,105, 1,162,953, and 675,953 were excluded from the weighted average shares outstanding for the diluted per share calculation for 2004, 20052008, 2007 and 2006, respectively.
Note 5 — 6—Other Income (Expense), Net:
Other income (expense), net consisted of the following (in thousands):
| | | | | | | | | | |
| | | Year Ended December 31, |
| | | 2008 | | | 2007 | | 2006 |
Foreign currency transaction gains (losses), net | | ($ | 7,219 | ) | | $ | 3,298 | | $ | 2,495 |
Foreign currency contract gains (losses), net | | | (1,165 | ) | | | — | | | — |
| | | | | | | | | | |
Total | | ($ | 8,384 | ) | | $ | 3,298 | | $ | 2,495 |
| | | | | | | | | | |
Note 7—Income Taxes:
Income before income taxes consists of the following (in thousands):
| | | | | | | | | | | | | |
| | | Year Ended December 31, | |
| | | 2004 | | | 2005 | | | 2006 | |
| |
| United States | | $ | 32,743 | | | $ | 50,127 | | | $ | 52,501 | |
| International | | | 3,643 | | | | 4,363 | | | | 16,498 | |
| | | | | | | | | | | | | |
| Total | | $ | 36,386 | | | $ | 54,490 | | | $ | 68,999 | |
| | | | | | | | | | | | | |
55
| | | | | | | | | | |
| | | Year Ended December 31, |
| | | 2008 | | | 2007 | | 2006 |
United States | | $ | 54,222 | | | $ | 48,715 | | $ | 52,501 |
International | | | (8,879 | ) | | | 28,121 | | | 16,498 |
| | | | | | | | | | |
Total | | $ | 45,343 | | | $ | 76,836 | | $ | 68,999 |
| | | | | | | | | | |
NETGEAR, INC.
NOTES TO CONSOLIDATED FINANCIAL STATEMENTS — (Continued)
The provision for income taxes consists of the following (in thousands):
| | | | | | | | | | | | | |
| | | Year Ended December 31, | |
| | | 2004 | | | 2005 | | | 2006 | |
| |
Current: | | | | | | | | | | | | |
| U.S. Federal | | $ | 13,110 | | | $ | 16,766 | | | $ | 21,362 | |
| State | | | 1,197 | | | | 2,799 | | | | 2,965 | |
| Foreign | | | 1,033 | | | | 1,658 | | | | 6,719 | |
| | | | | | | | | | | | | |
| | | | 15,340 | | | | 21,223 | | | | 31,046 | |
| | | | | | | | | | | | | |
Deferred: | | | | | | | | | | | | |
| U.S. Federal | | | (2,427 | ) | | | (860 | ) | | | (780 | ) |
| State | | | 8 | | | | 504 | | | | 100 | |
| Foreign | | | — | | | | — | | | | (2,499 | ) |
| | | | | | | | | | | | | |
| | | | (2,419 | ) | | | (356 | ) | | | (3,179 | ) |
| | | | | | | | | | | | | |
| Total | | $ | 12,921 | | | $ | 20,867 | | | $ | 27,867 | |
| | | | | | | | | | | | | |
| | | | | | | | | | | | |
| | | Year Ended December 31, | |
| | | 2008 | | | 2007 | | | 2006 | |
Current: | | | | | | | | | | | | |
U.S. Federal | | $ | 21,451 | | | $ | 25,722 | | | $ | 21,362 | |
State | | | 2,959 | | | | 4,138 | | | | 2,965 | |
Foreign | | | 5,541 | | | | 2,509 | | | | 6,719 | |
| | | | | | | | | | | | |
| | | 29,951 | | | | 32,369 | | | | 31,046 | |
| | | | | | | | | | | | |
Deferred: | | | | | | | | | | | | |
U.S. Federal | | | (1,750 | ) | | | (2,709 | ) | | | (780 | ) |
State | | | (908 | ) | | | (928 | ) | | | 100 | |
Foreign | | | — | | | | 2,150 | | | | (2,499 | ) |
| | | | | | | | | | | | |
| | | (2,658 | ) | | | (1,487 | ) | | | (3,179 | ) |
| | | | | | | | | | | | |
Total | | $ | 27,293 | | | $ | 30,882 | | | $ | 27,867 | |
| | | | | | | | | | | | |
Net deferred tax assets consist of the following (in thousands):
| | | | | | | | | |
| | | December 31, | |
| | | 2005 | | | 2006 | |
| |
Deferred Tax Assets: | | | | | | | | |
| Accruals and allowances | | $ | 11,503 | | | $ | 13,302 | |
| Net operating loss carryforwards | | | — | | | | 859 | |
| Depreciation | | | 328 | | | | 801 | |
| Stock-based compensation | | | — | | | | 899 | |
| Other | | | — | | | | 113 | |
| | | | | | | | | |
| | | | 11,831 | | | | 15,974 | |
Deferred Tax Liabilities: | | | | | | | | |
| Acquired intangible assets | | | — | | | | (395 | ) |
| Unremitted earnings of foreign subsidiaries | | | — | | | | (11 | ) |
| | | | | | | | | |
| | | | — | | | | (406 | ) |
| | | | | | | | | |
| Net deferred tax assets | | $ | 11,831 | | | $ | 15,568 | |
| | | | | | | | | |
| Current portion | | $ | 11,503 | | | $ | 13,415 | |
| Non-current portion | | | 328 | | | | 2,153 | |
| | | | | | | | | |
| Net deferred tax assets | | $ | 11,831 | | | $ | 15,568 | |
| | | | | | | | | |
| | | | | | | | |
| | | Year Ended December 31, | |
| | | 2008 | | | 2007 | |
Deferred Tax Assets: | | | | | | | | |
Accruals and allowances | | $ | 12,216 | | | $ | 12,928 | |
Net operating loss carryforwards | | | 343 | | | | 607 | |
Depreciation and amortization | | | — | | | | 1,286 | |
Stock-based compensation | | | 4,103 | | | | 1,960 | |
Deferred rent | | | 2,878 | | | | — | |
Deferred revenue | | | 695 | | | | — | |
Tax credit carryforwards | | | 686 | | | | — | |
Other | | | 250 | | | | 544 | |
| | | | | | | | |
| | | 21,171 | | | | 17,325 | |
Deferred Tax Liabilities: | | | | | | | | |
Acquired intangible assets | | | (4,246 | ) | | | (6,615 | ) |
Depreciation and amortization | | | (3,811 | ) | | | — | |
Unremitted earnings of foreign subsidiaries | | | — | | | | (29 | ) |
Other | | | — | | | | (216 | ) |
| | | | | | | | |
Net deferred tax assets | | $ | 13,114 | | | $ | 10,465 | |
| | | | | | | | |
Current portion | | $ | 13,129 | | | $ | 13,091 | |
Non-current portion | | | (15 | ) | | | (2,626 | ) |
| | | | | | | | |
Net deferred tax assets | | $ | 13,114 | | | $ | 10,465 | |
| | | | | | | | |
Management’s judgment is required in determining the Company’s provision for income taxes, its deferred tax assets and any valuation allowance recorded against its deferred tax assets. In management’s judgment it is more likely than not that such assets will be realized in the future as of December 31, 2006,2008, and as such no valuation allowance has been recorded against the Company’s deferred tax assets.
56
NETGEAR, INC.
NOTES TO CONSOLIDATED FINANCIAL STATEMENTS — (Continued)
The effective tax rate differs from the applicable U.S. statutory federal income tax rate as follows:
| | | | | | | | | | | | | |
| | | Year Ended December 31, | |
| | | 2004 | | | 2005 | | | 2006 | |
| |
| Tax at federal statutory rate | | | 35.0 | % | | | 35.0 | % | | | 35.0 | % |
| State, net of federal benefit | | | 2.3 | | | | 3.5 | | | | 2.8 | |
| Stock-based compensation | | | (2.3 | ) | | | 0.0 | | | | 0.8 | |
| In-process research and development | | | 0.0 | | | | 0.0 | | | | 1.4 | |
| Tax credits | | | (2.3 | ) | | | (0.6 | ) | | | (0.6 | ) |
| Permanent and other items | | | 2.8 | | | | 0.4 | | | | 1.0 | |
| | | | | | | | | | | | | |
| Provision for income taxes | | | 35.5 | % | | | 38.3 | % | | | 40.4 | % |
| | | | | | | | | | | | | |
| | | | | | | | | |
| | | Year Ended December 31, | |
| | | 2008 | | | 2007 | | | 2006 | |
Tax at federal statutory rate | | 35.0 | % | | 35.0 | % | | 35.0 | % |
State, net of federal benefit | | 3.7 | | | 3.7 | | | 2.8 | |
Impact of international operations | | 19.4 | | | (0.6 | ) | | — | |
Stock-based compensation | | 2.8 | | | 1.4 | | | 0.8 | |
In-process research and development | | — | | | 1.9 | | | 1.4 | |
Tax credits | | (1.9 | ) | | (0.9 | ) | | (0.6 | ) |
Permanent and other items | | 1.2 | | | (0.3 | ) | | 1.0 | |
| | | | | | | | | |
Provision for income taxes | | 60.2 | % | | 40.2 | % | | 40.4 | % |
| | | | | | | | | |
Income tax benefits in the amount of $11.8 million, $7.1$81,000, $8.4 million and $4.2 million related to the exercise of stock options were credited to additional paid-in capital during the years ended December 31, 2004, 20052008, 2007 and 2006, respectively.
As a result of changes in fair value of available for sale securities, income tax expense of $11,000 and $64,000 was recorded in comprehensive income related to the year ended December 31, 2008 and December 31, 2007, respectively.The Company has $2.5$335,000 and $2.6 million of acquired federal and state net operating losses from its acquisitionacquisitions of SkipJam and Infrant, respectively, as of December 31, 2006.2008. Use of these losses isare subject to annual limitation under Internal Revenue Code Section 382. TheseAdditionally, the Company has state tax credit carryforwards of $507,000 as of December 31, 2008 that resulted from limitations on use imposed by the State of California. The federal losses and credits expire in different years beginning in fiscal 2023.
2021. The state loss begins to expire in fiscal 2021. The state tax credit carryforward has no expiration.The Company files income tax returns in the U.S. federal jurisdiction, various state and local, and foreign jurisdictions. With few exceptions, the Company is no longer subject to U.S. federal, state and local, or foreign income tax examinations for years before 2004. The Company has limited audit activity in various states and foreign jurisdictions. Currently the Company does not expect a material change in unrecognized tax benefits to occur during the next 12 months.
The Company adopted the provisions of FIN 48 on January 1, 2007. A reconciliation of the beginning and ending amount of gross unrecognized tax benefits (“UTB”) is as follows (in millions):
| | | | |
| | Federal, State, and
Foreign Tax | |
Gross UTB Balance at January 1, 2007 | | $ | 3,428 | |
Additions based on tax positions related to the current year | | | 6,147 | |
Additions for tax positions of prior years | | | — | |
Reductions for tax positions of prior years | | | — | |
Settlements | | | (6 | ) |
Reductions due to lapse of applicable statutes | | | (233 | ) |
| | | | |
Gross UTB Balance at December 31, 2007 | | $ | 9,336 | |
| | | | |
Additions based on tax positions related to the current year | | | 3,940 | |
Additions for tax positions of prior years | | | 658 | |
Reductions for tax positions of prior years | | | (140 | ) |
Settlements | | | — | |
Reductions due to lapse of applicable statutes | | | (503 | ) |
| | | | |
Gross UTB Balance at December 31, 2008 | | $ | 13,291 | |
| | | | |
The total amount of net unrecognized tax benefits that, if recognized would affect the effective tax rate as of December 31, 2008 is $11.5 million. The ending net UTB results from adjusting the gross balance at December 31, 2007 for items such as U.S. federal, state and foreign deferred tax, foreign tax credits, interest, and deductible taxes. The net UTB is included as a component of non-current income taxes payable within the consolidated balance sheet.
The Company recognizes interest and penalties accrued related to unrecognized tax benefits in income tax expense. As of December 31, 2007 and December 31, 2008, accrued interest on a gross basis was $643,000 and $1.2 million, respectively. No penalties have been accrued. Included in accrued interest are amounts related to tax positions for which the ultimate deductibility is highly certain but for which there is uncertainty about the timing of such deductibility. Because of the impact of deferred tax accounting, other than interest, the disallowance of the shorter deductibility period would not affect the annual effective tax rate but would accelerate the payment of cash to the taxing authority to an earlier period.
The Company has recognized a deferred tax benefit related to excess foreign tax credits of $202,000 related to unremitted earnings of certain foreign sales subsidiaries. With the exception of those foreign sales subsidiaries for which deferred tax has been provided, the Company intends to indefinitely reinvest foreign earnings. These earnings were approximately $22.8 million and $28.0 million as of December 31, 2008 and December 31, 2007, respectively. Because of the availability of U.S. foreign tax credits, it is not practicable to determine the income tax liability that would be payable if such earnings were not indefinitely reinvested.
Note 6 — 8—Commitments and Contingencies:
Litigation and Other Legal Matters
In June 2004, a lawsuit, entitled Zilberman v. NETGEAR, Civil Action CV021230, was filed against the Company in the Superior Court of California, County of Santa Clara. The complaint purported to be a class action on behalf of all persons or entities in the United States who purchased the Company’s wireless products other than for resale. Plaintiff alleged that the Company made false representations concerning the data transfer speeds of its wireless products when used in typical operating circumstances, and requested injunctive relief, payment of restitution and reasonable attorney fees. Similar lawsuits were filed against other companies within the industry. In November 2005, without admitting any wrongdoing or violation of law and to avoid the distraction and expense of continued litigation, the Company and the Plaintiff received preliminary court approval for a proposed settlement.
Under the terms of the settlement, the Company (i) issued each eligible class member a promotional code which may be used to purchase a new wireless product from the Company’s online store, www.buynetgear.com, at a 15% discount during the redemption period; (ii) included a disclaimer regarding wireless signal rates on the Company’s wireless products packaging and user’s manuals and in the Company’s press releases and advertising that reference wireless signal rates; (iii) donated $25,000 worth of the Company’s products to a local,not-for-profit charitable organization to be chosen by the Company; and (iv) agreed to pay, subject to court approval, up to $700,000 in attorneys’ fees and costs.
In March 2006, the Company received final court approval for the proposed settlement. On May 26, 2006, the proposed settlement became final and binding. The Company recorded a charge of $802,000 relating to this proposed settlement during the year ended December 31, 2005.
NETGEAR v. CSIRO
In May 2005, the Company filed a complaint for declaratory relief against the Commonwealth Scientific and Industrial Research Organization (CSIRO)(“CSIRO”), in the San Jose division of the United States District Court, Northern District of California. The complaint alleges that the claims of CSIRO’s U.S. Patent No. 5,487,069 are invalid and not infringed by any of the Company’s products. CSIRO had asserted that the Company’s wireless networking
57
NETGEAR, INC.
NOTES TO CONSOLIDATED FINANCIAL STATEMENTS — (Continued)
products implementing the IEEE 802.11a, 802.11g, and 802.11g802.11n wireless LAN standards infringe its patent. In July 2006, the United States Court of Appeals for the Federal Circuit affirmed the District Court’s decision to deny CSIRO’s motion to dismiss the action under the Foreign Sovereign Immunities Act. CSIRO has filed a petition withIn September 2006, the Federal Circuit requestingdenied CSIRO’s request for a rehearing en banc. ThisCSIRO filed a response to the complaint in September 2006. In December 2006, the District Court granted CSIRO’s motion to transfer the case to the Eastern District of Texas, where CSIRO had brought and won a similar lawsuit against Buffalo Technology (USA), Inc., which Buffalo recently appealed and which has been partially remanded to the District Court. The District Court consolidated this action with three related actions involving other companies (such as Buffalo) accused of infringing CSIRO’s patent. The case is now in the preliminaryfinal stages of discovery. The Company attended a court-mandated mediation in November 2007 but failed to resolve the litigation. The District Court held a June 26, 2008 claim construction hearing. On August 14, 2008, the District Court issued a claim construction order and denied a motion stagesfor summary judgment of invalidity. In December 2008, the parties filed numerous motions for summary judgment concerning, among other things, infringement, validity, and noother affirmative defenses. The District Court has scheduled an April 13, 2009 jury trial date has been set.
regarding all liability issues for the four consolidated cases. Beginning in June of 2009, the District Court will hold the first in a series of damages trials. The Company’s case will be heard in the second trial in this series, which will likely commence sometime during the third or fourth quarter of 2009.SercoNetLinex Technologies v. NETGEAR
In May 2006,June 2007, a lawsuit was filed against the Company by SercoNet, Ltd.Linex Technologies, Inc. (“Linex”), a manufacturer of computer networking productspatent-holding company organized under the laws of Israel,Delaware, in the United StatesU.S. District Court, for the SouthernEastern District of New York. SercoNetTexas. Linex alleged that the Company infringed U.S. Patent No. 6,757,322. Linex had accused certain of the
Company’s wireless networking products incorporating multiple input/multiple output (MIMO) technology of infringement. Linex had also sued 14 other technology companies alleging similar claims of patent infringement. In December 2008, the Company agreed to settle the litigation with Linex. Without admitting any patent infringement, wrongdoing or violation of law and to avoid the distraction and expense of continued litigation, the Company agreed to a fully paid perpetual license and a covenant not to sue with respect to the ‘322 patent and related patents. The terms of the settlement agreement are confidential. Based on the historical and estimated projected future unit sales of the Company’s products that were alleged to infringe the asserted patents, the Company allocated a portion of the settlement cost towards product shipments prior to the settlement, which the Company recorded as a litigation settlement expense in the year ended December 31, 2008. Additionally, the Company allocated the balance of the settlement cost to prepaid royalties which is being recognized as a component of cost of revenue over the period that the related products are sold.
Wi-Lan Inc. v. NETGEAR
In October 2007, a lawsuit was filed against the Company by Wi-Lan Inc. (“Wi-Lan”), a patent-holding company existing under the laws of Canada, in the U.S. District Court, Eastern District of Texas. Wi-Lan alleges that the Company infringes U.S. PatentsPatent Nos. 5,841,360; 6,480,510; 6,970,538; 7,016,368;5,282,222, RE37,802 and 7,035,280. SercoNet5,956,323. Wi-Lan has accused certainthe Company’s wireless networking products compliant with the IEEE 802.11 standards and ADSL products compliant with the ITU G.992 standards of infringement. Wi-Lan has also sued 21 other technology companies alleging similar claims of patent infringement. The Company filed its answer in the first quarter of 2008. This action is now in the discovery phase. The District Court has scheduled a September 1, 2010 claim construction hearing, and a January 4, 2011 jury trial.
Fujitsu et. al v. NETGEAR
In December 2007, a lawsuit was filed against the Company by Fujitsu Limited, LG Electronics, Inc. and U.S. Philips Corporation in the U.S. District Court, Western District of Wisconsin. The plaintiffs allege that the Company infringes U.S. Patent Nos. 6,018,642, 6,469,993 and 4,975,952. The plaintiffs accuse the Company’s wireless networking products compliant with the IEEE 802.11 standards of infringement. The Company filed its answer in the first quarter of 2008. This action is in the final stages of discovery. The District Court held a claim construction hearing on August 15, 2008. On September 10, 2008, the District Court issued a claim construction order. The District Court has rescheduled the jury trial to take place on August 24, 2009.
OptimumPath, L.L.C. v. NETGEAR
In January 2008, a lawsuit was filed against the Company by OptimumPath, L.L.C (“OptimumPath”), a patent-holding company existing under the laws of the Company’s switches, routers, modems, adapters, powerline products, and wireless access pointsState of infringement. In July 2006,South Carolina, in the court grantedU.S. District Court for the District of South Carolina. OptimumPath alleges that the Company infringes U.S. Patent No. 7,035,281. OptimumPath has claimed that the Company’s motionwireless networking products infringe on OptimumPath’s patents. OptimumPath has also sued six other technology companies alleging similar claims of patent infringement. The Company filed its answer in the second quarter of 2008. Several defendants, including the Company, jointly filed a request for inter partes reexamination of the OptimumPath patent with the United States Patent and Trademark Office (the “USPTO”) on October 13, 2008. On January 12, 2009, a reexamination was ordered with respect to transferclaims 1-3 and 8-10 of the patent, but denied with respect to claims 4-7 and 11-32 of the patent. On February 4, 2009, the defendants jointly filed a petition to challenge the denial of reexamination of claims 4-7 and 11-32.
Network-1 Security Solutions, Inc. v. NETGEAR
In February 2008, a lawsuit was filed against the Company by Network-1 Security Solutions, Inc. (“Network-1”), a patent-holding company existing under the laws of the State of Delaware, in the U.S. District Court for the Eastern District of Texas. Network-1 alleges that the Company infringes U.S. Patent No. 6,218,930. Network-1 has alleged that the Company’s power over Ethernet (“PoE”) products infringe their patent.
Network-1 has also sued six other companies alleging similar claims of patent infringement. The Company filed its answer in the second quarter of 2008. The District Court has scheduled a December 3, 2009 claim construction hearing and a July 6, 2010 jury trial.
Fenner Investments Ltd. v. NETGEAR
In February 2008, a lawsuit was filed against the Company by Fenner Investments, Ltd. (“Fenner”), a patent-holding company existing under the laws of the State of Texas, in the U.S. District Court for the Eastern District of Texas. Fenner alleges that the Company infringes U.S. Patent No. 7,145,906 entitled “Packet Switching Node” and U.S. Patent No. 5,842,224 entitled “Method and Apparatus for Source Filtering Data Packets Between Networks of Differing Media”. Fenner has also sued six other companies alleging similar claims of patent infringement. The Company filed its answer in the second quarter of 2008. The District Court had scheduled a February 19, 2009 claim construction hearing and an October 13, 2009 jury trial, but the claim construction hearing has since been rescheduled for April 2009. The Company attended a court-mandated mediation in February 2009 but failed to resolve the litigation. This action tois in the discovery phase.
Ruckus Wireless v. NETGEAR
In May 2008, a lawsuit was filed against the Company by Ruckus Wireless (“Ruckus”), a developer of Wi-Fi technology, in the U.S. District Court for the Northern District of California. ThisRuckus alleges that the Company infringes U.S. Patent Nos. 7,358,912 and 7,193,562 in the course of deploying Wi-Fi antenna array technology in its products. The Company filed its answer in the third quarter of 2008. Ruckus also sued Rayspan Corporation alleging similar claims of patent infringement. The Company and Rayspan Corporation jointly filed a request for inter partes reexamination of the Ruckus patents with the USPTO on September 4, 2008. On December 2, 2008, reexamination was granted to all claims of U.S. Patent No. 7,358,912. On November 28, 2008, a reexamination was ordered with respect to claims 11-17 of U.S. Patent No. 7,193,562, but denied with respect to claims 1-10 and 18-36. On December 17, 2008, the defendants jointly filed a petition to challenge the denial of reexamination of claims 1-10 and 18-36 of U.S. Patent No. 7,193,562.
EZ4Media, Inc. v. NETGEAR
In June 2008, a lawsuit was filed against the Company by EZ4Media, Inc. (“EZ4Media”) in the U.S. District Court for the Northern District of Illinois. EZ4Media alleges that the Company’s digital media receivers infringe U.S. Patent Nos. 7,142,934, 7,142,935, 7,167,765 and 7,130,616. EZ4Media has also sued eight other companies alleging similar claims of patent infringement. The Company filed its answer and counterclaims in the third quarter of 2008.
Northpeak Wireless, LLC v. NETGEAR
In October 2008, a lawsuit was filed against the Company and thirty other companies by Northpeak Wireless, LLC (“Northpeak”) in the U.S. District Court for the Northern District of Alabama. Northpeak alleges that the Company infringes U.S. Patent Nos. 4,977,577 and 5,987,058. The Company filed its answer in the fourth quarter of 2008. On January 21, 2009, the Court granted a motion to transfer the case to the U.S. District Court for the Northern District of California. The Court has not yet set a trial date.
IP Indemnification Claims
In addition, in its sales agreements, the Company typically agrees to indemnify its direct customers, distributors and resellers (the “Indemnified Parties”) for any expenses or liability resulting from claimed infringements of patents, trademarks or copyrights of third parties that are asserted against the Indemnified Parties. The terms of these indemnification agreements are generally perpetual after execution of the agreement. The maximum amount of potential future indemnification is generally unlimited. From time to time, the Company receives requests for indemnity and may choose to assume the defense of such litigation asserted against the Indemnified Parties.
In December 2005, the Company received a request for indemnification from Charter Communications, Inc. (“Charter”), a direct customer, related to a lawsuit filed in the U.S. District Court, Eastern District of Texas, by Hybrid Patents, Inc. (“Hybrid”), a patent holding company. Hybrid alleged that Charter infringed U.S. Patent Nos. 5,586,121, 5,818,845, 6,104,727 and Re. 35,774. Hybrid alleged that products implementing the Data Over Cable Service Interface Specification (“DOCSIS”) standard, which are supplied to Charter by, among others, the Company, infringed these patents. In the third quarter of 2006, the Company together with a number of other equipment suppliers to Charter assumed the defense of the litigation. In the second quarter of 2007, a jury found that the Hybrid patents were not infringed by Charter. Hybrid filed similar lawsuits in the same jurisdiction against Comcast Corporation, Comcast of Dallas, LP, Time Warner Cable, Inc. and Cox Communications, Inc., all of whom are also customers of the Company. In May 2008, the Company, together with several co-defendants, agreed to settle the litigation as part of a group settlement with Hybrid. Without admitting any patent infringement, wrongdoing or violation of law and to avoid the distraction and expense of continued litigation, the Company agreed to make a one-time payment of $450,000 for its portion of the settlement, in exchange for a fully paid perpetual license to all Hybrid patents, including those asserted in the lawsuit. Based on the historical and estimated projected future unit sales of the Company’s products that were alleged to infringe the asserted patents, the Company allocated $109,000 of the settlement cost towards product shipments prior to the settlement, which the Company recorded as a litigation settlement expense in the three months ended March 30, 2008. Additionally, the Company allocated $341,000 of the settlement cost to prepaid royalties which is being recognized as a component of cost of revenue as the related products are sold.
In June 2006, the Company received a request for indemnification from Charter and Charter Communications Operating, LLC, related to a lawsuit filed in the U.S. District Court, Eastern District of Texas, by Rembrandt Technologies, L.P. (“Rembrandt”), a patent-holding company. Rembrandt alleges that Charter infringes U.S. Patent Nos. 5,243,627, 5,852,631, 5,719,858 and 4,937,819. Rembrandt alleges that products implementing the DOCSIS standard, which are supplied to Charter by, among others, the Company, infringe these patents. Rembrandt has also filed a similar lawsuit in the same jurisdiction against Comcast Corporation, Comcast Cable Communications, LLC and Comcast of Plano, LP. In November 2007, the Company along with Motorola, Inc., Cisco Systems, Inc., Scientific-Atlanta, Inc., ARRIS Group, Inc., Thomson, Inc. and Ambit Microsystems, Inc. filed a complaint for declaratory judgment in the U.S. District Court for the District of Delaware against Rembrandt, seeking a declaration that Rembrandt’s alleged patents are either invalid or not infringed. The action is currently in the preliminary motion stagesdiscovery phase. The District Court held a claim construction hearing on August 5, 2008, and no trial date has been set.
Thesescheduled a September 9, 2009 jury trial. On November 29, 2008, the District Court issued its claim construction order. The District Court has scheduled a mediation for March 3-4, 2009.All of the above described claims against the Company, or filed by the Company, whether meritorious or not, could be time consuming,time-consuming, result in costly litigation, require significant amounts of management time, and result in the diversion of significant operational resources. Were an unfavorable outcome to occur, there exists the possibility it would have a material adverse impact on the Company’s financial position and results of operations for the period in which the unfavorable outcome occurs or becomes probable. In addition, the Company is subject to legal proceedings, claims and litigation arising in the ordinary course of business, including litigation related to intellectual property and employment matters.
While the outcome of these matters isBased on currently not determinable,available information, the Company does not expectbelieve that the ultimate costsoutcomes of any unresolved matters, individually and in the aggregate, are likely to resolve these matters will have a material adverse effect on the Company’s consolidated financial position, liquidity or results of operations within the next twelve months. However, litigation is subject to inherent uncertainties, and the Company’s view of these matters may change in the future. Were an unfavorable outcome to occur, there exists the possibility of a material adverse impact on the Company’s financial position and results of operations or cash flows.
liquidity for the period in which the unfavorable outcome occurs or becomes probable, and potentially in future periods.Environmental Regulation
The European Union (“EU”) has enacted the Waste Electrical and Electronic Equipment Directive, which makes producers of electrical goods, including home and small business networking products, financially responsible for specified collection, recycling, treatment and disposal of past and future covered products. The deadline for the individual member states of the EU to enact the directive in their respective countries was August 13, 2004 (such legislation, together with the directive, the “WEEE Legislation”). Producers participating in the market are financially responsible for implementing these responsibilities under the WEEE Legislation beginning in August 2005. Similar WEEE Legislation has been or may be enacted in other jurisdictions, including in the United States, Canada, Mexico, China and Japan. The Company adopted FSPSFAS No. 143-1, “Accounting for Electronic Equipment Waste Obligations”, in the third quarter of fiscal 2005 and has determined that its effect did not have a material impact on its consolidated results of operations and financial position for fiscal 2005 and fiscal 2006.2006, 2007, or 2008. The Company is continuing to evaluate the impact of the WEEE Legislation and similar legislation in other jurisdictions as individual countries issue their implementation guidance.
Additionally, the EU has enacted the Restriction of Hazardous Substances Directive (“RoHS Legislation”). The RoHS Legislation, along with similar legislation in China, prohibits the use of certain substances, including mercury and lead, in certain products put on the market after July 1, 2006. The Company believes it has met the requirements of the RoHS Legislation.
EmploymentsEmployment Agreements
The Company has signed various employment agreements with key executives pursuant to which if their employment is terminated without cause, the employees are entitled to receive their base salary (and commission or bonus, as applicable) for 52 weeks (forfor the Chief Executive Officer)Officer and up to 26 weeks (forfor other key executives), and suchexecutives. Such employees will continue to have stock options vest for up to a one year period following the termination. If the termination, without cause, occurs within one year of a change in control, the officer is entitled to two years acceleration of any unvested portion of his or her stock options.
58
NETGEAR, INC.
NOTES TO CONSOLIDATED FINANCIAL STATEMENTS — (Continued)
Leases
The Company leases office space, cars and equipment under non-cancelable operating leases with various expiration dates through December 2026. Rent expense in the years ended, December 31, 2004, 20052008, 2007 and 2006 was $1.3$6.3 million, $1.5$3.4 million, and $2.2 million, respectively. The terms of some of the Company’s office leases provide for rental payments on a graduated scale. The Company recognizes rent expense on a straight-line basis over the lease period, and has accrued for rent expense incurred but not paid.
Future minimum lease payments under non-cancelable operating leases, net of sublease payments, are as follows (in thousands):
| | | | | |
Year Ending December 31, | | | |
| |
| 2007 | | | 2,371 | |
| 2008 | | | 1,298 | |
| 2009 | | | 718 | |
| 2010 | | | 544 | |
| 2011 | | | 509 | |
| 2012 and thereafter | | | 3,214 | |
| | | | | |
| Total minimum lease payments | | $ | 8,654 | |
| | | | | |
| | | |
Year Ending December 31, | | |
2009 | | $ | 5,589 |
2010 | | | 4,398 |
2011 | | | 3,524 |
2012 | | | 3,169 |
2013 | | | 3,254 |
Thereafter | | | 16,468 |
| | | |
Total minimum lease payments | | $ | 36,402 |
| | | |
Guarantees and Indemnifications
The Company has entered into various inventory relatedinventory-related purchase agreements with suppliers. Generally, under these agreements, 50% of orders are cancelable by giving notice 46 to 60 days prior to the expected
shipment date and 25% of orders are cancelable by giving notice 31 to 45 days prior to the expected shipment date. Orders are non-cancelable within 30 days prior to the expected shipment date. At December 31, 2006,2008, the Company had $55.2$26.8 million in non-cancelable purchase commitments with suppliers. The Company expectsestablishes a loss liability for all products it does not expect to sell all products for which it has committed purchases from suppliers.
Such losses have not been material to date.The Company, as permitted under Delaware law and in accordance with its Bylaws, indemnifies its officers and directors for certain events or occurrences, subject to certain limits, while the officer or director is or was serving at the Company’s request in such capacity. The term of the indemnification period is for the officer’s or director’s lifetime. The maximum amount of potential future indemnification is unlimited; however, the Company has a Director and Officer Insurance Policy that limits its exposure and enables it to recover a portion of any future amounts paid. As a result of its insurance policy coverage, the Company believes the fair value of these indemnification agreements is minimal. Accordingly, the Company has no liabilities recorded for these agreements as of December 31, 2006.
2008.In its sales agreements, the Company typically agrees to indemnify its direct customers, distributors and resellers for any expenses or liability resulting from claimed infringements of patents, trademarks or copyrights of third parties. The terms of these indemnification agreements are generally perpetual any time after execution of the agreement. The maximum amount of potential future indemnification is unlimited. To date the Company has not paid any amounts to settle claims or defend lawsuits. As a result, theThe Company believes the estimated fair value of these agreements is minimal. Accordingly, the Company has no liabilities recorded for these agreements as of December 31, 2006.
2008.Note 7 — Stock-Based Compensation:9—Stockholder’s Equity:
At December 31, 2006,2008, the Company had five stock-based employee compensation plans as described below. The total compensation expense related to these plans was approximately $4.5$11.3 million for the year ended December 31, 2006. Prior to January 1, 2006,2008.
The following table sets forth the Company accounted for those plans under the recognition and measurement provisions of APB 25. Accordingly, the Company generally recognized compensation expense
59
NETGEAR, INC.
NOTES TO CONSOLIDATED FINANCIAL STATEMENTS — (Continued)
only when it granted options with a discounted exercise price. Any resulting compensation expense was recognized ratably over the associated service period, which was generally the option vesting term.
Prior to January 1, 2006, the Company provided pro forma disclosure amounts in accordance with SFAS No. 148, “Accounting for Stock-Based Compensation — Transition and Disclosure” (“SFAS 148”), as if the fair value method defined by SFAS 123 had been applied to its stock-based compensation.
Effective January 1, 2006, the Company adopted the fair value recognition provisions of SFAS 123R, using the modified prospective transition method and therefore has not restated prior periods’ results. Under this transition method,total stock-based compensation expense forresulting from stock options, restricted stock awards, and the year ended December 31, 2006 includes compensation expense for all stock-based compensation awards granted prior to, but not yet vested asEmployee Stock Purchase Plan included in the Company’s Consolidated Statements of January 1, 2006, based on the grant date fair value estimated in accordance with the original provisions of SFAS 123. Stock-based compensation expense for the year ended December 31, 2006 also includes stock-based compensation awards granted after January 1, 2006 based on the grant-date fair value estimated in accordance with the provisions of SFAS 123R. The valuation provisions of SFAS 123R also apply to grants that are modified after January 1, 2006.
Operations (in thousands): | | | | | | | | | |
| | | Year Ended December 31, |
| | | 2008 | | 2007 | | 2006 |
Cost of revenue | | | 864 | | | 633 | | | 430 |
Research and development | | | 3,218 | | | 2,391 | | | 1,119 |
Sales and marketing | | | 3,406 | | | 3,013 | | | 1,405 |
General and administrative | | | 3,835 | | | 2,842 | | | 1,551 |
| | | | | | | | | |
| | $ | 11,323 | | $ | 8,879 | | $ | 4,505 |
| | | | | | | | | |
The Company recognizes these compensation costs net of the estimated forfeitures on a straight-line basis over the requisite service period of the award, which is generally the option vesting term of four years. The Company estimated the forfeiture rate for the year ended December 31, 2006 based on its historical experience.
As a result of adopting SFAS 123R, the Company’s income before income taxes and net income for the year ended December 31, 2006 was $4.0 million and $3.0 million lower, respectively, than if the Company had continued to account for stock-based compensation under APB 25. The impact on both basic and diluted earnings per share for the year ended December 31, 2006 was $0.09. Total stock-based compensation cost capitalized in inventory was less than $0.1 million for the year ended December 31, 2006.
Prior to the adoption$250,000 in each of SFAS 123R, the Company presented the excess tax benefit of stock option exercises as operating cash flows. Upon the adoption of SFAS 123R, “as if” windfall tax benefits (the tax deductions in excess of the compensation cost that would increase the pool of windfall tax benefits) are classified as financing cash flows, with the remaining excess tax benefit classified as operating cash flows. This requirement will reduce net operating cash flows and increase net financing cash flows in periods after adoption. Prior period cash flows are not reclassified to reflect this new requirement. In addition, total cash flow is not impacted as a result of this new requirement.
60
NETGEAR, INC.
NOTES TO CONSOLIDATED FINANCIAL STATEMENTS — (Continued)
The pro forma table below reflects net income and basic and diluted net income per share for the years ended December 31, 20042008, 2007, and 2005, had the Company applied the fair value recognition provisions of SFAS 123, as follows (in thousands, except per share data):
| | | | | | | | | |
| | | Year Ended
| |
| | | December 31, | |
| | | 2004 | | | 2005 | |
| |
| Net income, as reported | | $ | 23,465 | | | $ | 33,623 | |
| Add: | | | | | | | | |
| Employee stock-based compensation included in reported net income | | | 1,687 | | | | 1,064 | |
| Less: | | | | | | | | |
| Total employee stock-based compensation determined under fair value method, net of taxes(1) | | | (4,329 | ) | | | (9,684 | ) |
| | | | | | | | | |
| Pro forma net income | | $ | 20,823 | | | $ | 25,003 | |
| | | | | | | | | |
| Basic net income per share: | | | | | | | | |
| As reported | | $ | 0.77 | | | $ | 1.04 | |
| | | | | | | | | |
| Pro forma | | $ | 0.68 | | | $ | 0.77 | |
| | | | | | | | | |
| Diluted net income per share: | | | | | | | | |
| As reported | | $ | 0.72 | | | $ | 0.99 | |
| | | | | | | | | |
| Pro forma | | $ | 0.64 | | | $ | 0.74 | |
| | | | | | | | | |
| | |
(1) | | Of the 1,144,050 options granted during the year ended December 31, 2005, 964,100 were sales-restricted options that vested immediately on grant. These options had a fair value of $6.1 million, net of taxes. No such options were granted in 2004. |
2006.As of December 31, 2006,2008, the Company has the following share-based compensation plans:
In April 2000, the Company adopted the 2000 Stock Option Plan (the “2000 Plan”). The 2000 Plan provides for the granting of stock options to employees and consultants of the Company. Options granted under
the 2000 Plan may be either incentive stock options (“ISOs”) or nonqualified stock options. Incentive stock options (“ISO”NSOs”). ISOs may be granted only to Company employees (including officers and directors who are also employees). Nonqualified stock options (“NSO”)NSOs may be granted to Company employees, directors and consultants. A total of 7,350,000 shares of Common Stock have been reserved for issuance under the 2000 Plan.
Options under the 2000 Plan may be granted for periods of up to ten years, and at prices no less than the estimated fair value of the shares on the date of grant as determined by the Board of Directors, provided, however, that (i) the exercise price of an ISO and NSO shall not be less than the estimated fair value of the sharesunderlying stock on the date of grant and (ii) the exercise price of an ISO and NSO granted to a 10% shareholder shall not be less than 110% of the estimated fair value of the sharesunderlying stock on the date of grant. To date, options granted generally vest over four years.
In April 2003, the Company adopted the 2003 Stock Plan (the “2003 Plan”). The 2003 Plan provides for the granting of stock options to employees and consultants of the Company. Options granted under the 2003 Plan may be either incentive stock optionsISOs or nonqualified stock options.NSOs. ISOs may be granted only to Company employees (including officers and directors who are also employees). NSOs may be granted to Company employees, directors
61
NETGEAR, INC.
NOTES TO CONSOLIDATED FINANCIAL STATEMENTS — (Continued)
and consultants. The Company has reserved 750,000 shares of Common Stock plus any shares which were reserved but not issued under the 2000 Plan as of the date of the approval of the 2003 Plan. The number of shares which were reserved but not issued under the 2000 Plan that were transferred to the Company’s 2003 Plan were 615,290, which when combined with the shares reserved for the Company’s 2003 Plan total 1,365,290 shares reserved under the Company’s 2003 Plan as of the date of transfer. Any options cancelled under either the 2000 Plan or the 2003 Plan are returned to the pool available for grant. As of December 31, 2006, 143,2092008, 160,737 shares were reserved for future grants under the Company’s 2003 Plan.
Options under the 2003 Plan may be granted for periods of up to ten years, and at prices no less than the estimated fair value of the common stock on the date of grant as determined by the closing sales price for such stock as quoted on any established stock exchange or a national market system, provided, however, that (i) the exercise price of an ISO and NSO shall not be less than the estimated fair value of the sharesunderlying stock on the date of grant and (ii) the exercise price of an ISO and NSO granted to a 10% shareholder shall not be less than 110% of the estimated fair value of the sharesunderlying stock on the date of grant. To date, options granted generally vest over four years, with the first tranche vesting at the end of twelve months and the remaining shares underlying the option vesting monthly over the remaining three years. In fiscal 2005, certain options granted under the 2003 Plan immediately vested and were exercisable on the date of grant, and the shares underlying such options were subject to a resale restriction which expires at a rate of 25% per year.
2006 Long Term Incentive Plan
In April 2006, the Company adopted the 2006 Long Term Incentive Plan (the “2006 Plan”), which was approved by the Company’s stockholders at the 2006 Annual Meeting of Stockholders on May 23, 2006. The 2006 Plan provides for the granting of stock options, stock appreciation rights, restricted stock, performance awards and other stock awards, to eligible directors, employees and consultants of the Company. TheUpon the adoption of the 2006 Plan, the Company has reserved 2,500,000 shares of Common Stockcommon stock for issuance under the 2006 Plan. Any options cancelledIn June 2008, the Company adopted amendments to the 2006 Plan which increased the number of shares of the Company’s common stock that may be issued under the 2006 Plan are returned to the pool available for grant.plan by an additional 2,500,000 shares. As of December 31, 2006, 1,458,7102008, 2,345,289 shares were reserved for future grants under the 2006 Plan.
Options granted under the 2006 Plan may be either incentive stock optionsISOs or nonqualified stock options.NSOs. ISOs may be granted only to Company employees (including officers and directors who are also employees). NSOs may be granted to Company employees, directors and consultants. Options may be granted for periods of up to ten years, and at prices no less than the estimated fair value of the common stock on the date of grant as determined by the closing sales price for such stock as quoted on any established stock exchange or a national market system, provided, however, that (i) the exercise price of an ISO and NSO shall not be less than the estimated fair value of the sharesunderlying stock on the date of grant and (ii) the exercise price of an ISO and NSO granted to a 10% shareholder shall not be less than 110% of the estimated fair value of the sharesunderlying stock on the date of grant. Options granted under the 2006 Plan generally vest over four years, with the first tranche vesting at the end of twelve months and the remaining shares underlying the option vesting monthly over the remaining three years.
Stock appreciation rights may be granted under the 2006 Plan subject to the terms specified by the plan administrator, provided that the term of any such right may not exceed ten (10) years from the date of grant. The exercise price generally cannot be less than the fair market value of the Company’s common stock on the date the stock appreciation right is granted.
Restricted stock awards may be granted under the 2006 Plan subject to the terms specified by the plan administrator. The period over which any restricted award may fully vest is generally no less than three (3) years. Restricted stock awards are nonvested stock awards that may include grants of restricted stock or grants of restricted stock units. Restricted stock awards are independent of option grants and are generally subject to forfeiture if employment terminates prior to the release of the restrictions. During that period, ownership of the shares cannot be transferred. Restricted stock has the same voting rights as other common stock and is considered to be currently issued and outstanding. Restricted stock units do not have the voting rights of common stock, and the shares
62
NETGEAR, INC.
NOTES TO CONSOLIDATED FINANCIAL STATEMENTS — (Continued)
underlying the restricted stock units are not considered issued and outstanding. The Company expenses the cost of the restricted stock awards, which is determined to be the fair market value of the shares at the date of grant, ratably over the period during which the restrictions lapse.
Performance awards may be in the form of performance shares or performance units. A performance share means an award denominated in shares of Company common stock and a performance unit means an award denominated in units having a dollar value or other currency, as determined by the Committee.plan administrator. The plan administrator will determine the number of performance awards that will be granted and will establish the performance goals and other conditions for payment of such performance awards. The period of measuring the achievement of performance goals will be a minimum of twelve (12) months.
Other stock-based awards may be granted under the 2006 Plan subject to the terms specified by the plan administrator. Other stock-based awards may include dividend equivalents, restricted stock awards, or amounts which are equivalent to all or a portion of any federal, state, local, domestic or foreign taxes relating to an award, and may be payable in shares, cash, other securities or any other form of property as the plan administrator may determine.
In the event of a change in control of the Company, all awards under the 2006 Plan vest in full and all outstanding performance shares and performance units will be paid out upon transfer.
Any shares of common stock subject to an award that is forfeited, settled in cash, expires or is otherwise settled without the issuance of shares shall again be available for awards under the 2006 Plan. Additionally, any shares that are tendered by a participant of the 2006 Plan or retained by the Company as full or partial payment to the Company for the purchase of an award or to satisfy tax withholding obligations in connection with an award shall no longer again be made available for issuance under the 2006 Plan.
The number of “full value equity awards” (as defined below) that may be granted will be limited to no more than ten percent (10%) of the shares issuable under the 2006 Plan. For these purposes, a “full value equity award” is any award pursuant to the 2006 Plan, other than options, stock appreciation rights or other awards which are based solely on an increase in value of the Company’s common stock following the date of grant.
2006 Stand-Alone Stock Option Agreement
In August 2006, the Company reserved for and granted a 300,000 share nonqualified stock optionNSO in connection with the hiring of a key executive. In the event of a change in control of the Company, this option vests in full.
Employee Stock Purchase Plan
The Company sponsors an Employee Stock Purchase Plan (the “ESPP”), pursuant to which eligible employees may contribute up to 10% of compensation, subject to certain income limits, to purchase shares of the Company’s common stock. Prior to January 1, 2006, employees were able to purchase stock semi-annually at a
price equal to 85% of the fair market value at certain plan-defined dates. As of January 1, 2006, the Company changed the ESPP such that employees will purchase stock semi-annually at a price equal to 85% of the fair market value on the purchase date. Since the price of the shares is now determined at the purchase date and there is no longer a look-back period, the Company recognizes the expense based on the 15% discount at purchase. For the yearyears ended December 31, 2008, 2007, and 2006, ESPP compensation expense was $206,000.
$250,000, $232,000 and $206,000, respectively.Valuation and Expense Information Under SFAS 123R
The fair value of each option award is estimated on the date of grant using the Black-Scholes-Merton option valuation model and the weighted average assumptions in the following table. The expected term of options granted is derived from historical data on employee exercise and post-vesting employment termination behavior. The risk free interest rate is based on the implied yield currently available on U.S. Treasury securities with an equivalent remaining term. Expected volatility is based on a combination of the historical volatility of the Company’s stock as well as the historical volatility of certain of the Company’s industry peers’ stock.
| | | | | | | | | | | | | | | | | | | | | |
| | | Stock Options | | | | |
| | | Year Ended
| | | ESPP | |
| | | December 31, | | | Year Ended December 31, | |
| | | 2004 | | | 2005 | | | 2006 | | | 2004 | | | 2005 | |
| |
| Expected life (in years) | | | 4.0 | | | | 4.0 | | | | 4.9 | | | | 0.5 | | | | 0.5 | |
| Risk-free interest rate | | | 2.81 | % | | | 3.85 | % | | | 4.74 | % | | | 1.39 | % | | | 2.93 | % |
| Expected volatility | | | 52 | % | | | 56 | % | | | 59 | % | | | 52 | % | | | 55 | % |
| Dividend yield | | | — | | | | — | | | | — | | | | — | | | | — | |
| Weighted average fair value of grants | | $ | 5.47 | | | $ | 8.01 | | | $ | 12.05 | | | $ | 4.11 | | | $ | 5.21 | |
63
| | | | | | | | | | | | |
| | | Stock Options | |
| | | Year Ended December 31, | |
| | | 2008 | | | 2007 | | | 2006 | |
Expected life (in years) | | | 4.3 | | | | 4.5 | | | | 4.9 | |
Risk-free interest rate | | | 3.02 | % | | | 4.48 | % | | | 4.75 | % |
Expected volatility | | | 49 | % | | | 53 | % | | | 59 | % |
Dividend yield | | | — | | | | — | | | | — | |
Weighted average fair value of grants | | $ | 9.57 | | | $ | 15.36 | | | $ | 11.85 | |
NETGEAR, INC.
NOTES TO CONSOLIDATED FINANCIAL STATEMENTS — (Continued)
Activity under the Company’s Stock Option Plans is set forth as follows:
| | | | | | | | | | | | | | | | | |
| | | December 31, 2004 | | | December 31, 2005 | |
| | | | | | Weighted
| | | | | | Weighted
| |
| | | | | | Average
| | | | | | Average
| |
| | | | | | Exercise
| | | | | | Exercise
| |
| | | Shares | | | Price | | | Shares | | | Price | |
| |
| Options outstanding at beginning of year | | | 6,561,693 | | | $ | 5.39 | | | | 4,147,089 | | | $ | 7.00 | |
| Options granted | | | 614,602 | | | | 13.60 | | | | 1,147,050 | | | | 17.22 | |
| Options exercised | | | (2,796,428 | ) | | | 4.64 | | | | (1,378,373 | ) | | | 5.77 | |
| Options cancelled | | | (232,778 | ) | | | 7.41 | | | | (242,079 | ) | | | 9.41 | |
| | | | | | | | | | | | | | | | | |
| Outstanding at end of year | | | 4,147,089 | | | | 7.00 | | | | 3,673,687 | | | | 10.49 | |
| | | | | | | | | | | | | | | | | |
| Options exercisable at end of year | | | 2,644,063 | | | | 5.29 | | | | 2,959,255 | | | | 9.82 | |
| | | | | | | | | | | | | | | | | |
Options outstandingoptions activity under the stock option plans as of December 31, 2005 and changes during the yearyears ended December 31, 2006, 2007, and 2008 were as follows:
| | | | | | | | | | | | | | | | | |
| | | | | | | | | Weighted
| | | | |
| | | | | | Weighted
| | | Average
| | | | |
| | | | | | Average
| | | Remaining
| | | Aggregate
| |
| | | | | | Exercise
| | | Contractual
| | | Intrinsic
| |
| | | Shares | | | Price | | | Term (In Years) | | | Value | |
| | | | | | | | | | | | (In thousands) | |
| |
| Options outstanding at December 31, 2005 | | | 3,673,687 | | | $ | 10.49 | | | | | | | | | |
| Options granted | | | 1,326,490 | | | | 22.06 | | | | | | | | | |
| Options exercised | | | (932,928 | ) | | | 7.97 | | | | | | | | | |
| Options cancelled | | | (132,792 | ) | | | 16.60 | | | | | | | | | |
| | | | | | | | | | | | | | | | | |
| Options outstanding at December 31, 2006 | | | 3,934,457 | | | $ | 14.79 | | | | 7.13 | | | $ | 45,148 | |
| | | | | | | | | | | | | | | | | |
| Options exercisable and expected to vest at December 31, 2006 | | | 3,843,643 | | | $ | 14.64 | | | | 7.08 | | | $ | 44,650 | |
| | | | | | | | | | | | | | | | | |
| Options exercisable at December 31, 2006 | | | 2,386,728 | | | $ | 10.86 | | | | 5.72 | | | $ | 36,732 | |
| | | | | | | | | | | | | | | | | |
follows (share data in thousands): | | | | | | |
| | | Outstanding Options |
| | | Number of
Shares | | | Weighted Average
Exercise Price |
December 31, 2005 | | 3,674 | | | $ | 10.49 |
Granted | | 1,390 | | | | 21.84 |
Exercised | | (997 | ) | | | 8.56 |
Cancelled | | (133 | ) | | | 16.60 |
December 31, 2006 | | 3,934 | | | $ | 14.79 |
Granted | | 951 | | | | 32.40 |
Exercised | | (1,237 | ) | | | 11.07 |
Cancelled | | (224 | ) | | | 23.22 |
December 31, 2007 | | 3,424 | | | $ | 20.47 |
Granted | | 1,018 | | | | 23.02 |
Exercised | | (157 | ) | | | 15.01 |
Cancelled | | (369 | ) | | | 24.22 |
December 31, 2008 | | 3,916 | | | $ | 21.00 |
Information regarding the stock options outstanding at December 31, 2008, 2007, and 2006 is summarized below.
| | | | | | | | | | |
| | | Number of
Shares
(thousands) | | Weighted Average
Exercise Price | | Weighted
Average
Remaining
Contractual Life | | Aggregate
Intrinsic Value
(thousands) |
As of December 31, 2008 | | | | | | | | | | |
Shares outstanding | | 3,916 | | $ | 21.00 | | 6.99 | | $ | 3,410 |
Shares vested and expected to vest | | 3,820 | | $ | 20.87 | | 6.95 | | $ | 3,406 |
Shares exercisable | | 2,272 | | $ | 17.39 | | 5.75 | | $ | 3,353 |
| | | | |
As of December 31, 2007 | | | | | | | | | | |
Shares outstanding | | 3,424 | | $ | 20.47 | | 7.45 | | $ | 52,424 |
Shares vested and expected to vest | | 3,333 | | $ | 20.28 | | 7.41 | | $ | 51,656 |
Shares exercisable | | 1,744 | | $ | 13.80 | | 6.00 | | $ | 38,134 |
| | | | |
As of December 31, 2006 | | | | | | | | | | |
Shares outstanding | | 3,934 | | $ | 14.79 | | 7.13 | | $ | 45,148 |
Shares vested and expected to vest | | 3,844 | | $ | 14.64 | | 7.08 | | $ | 44,650 |
Shares exercisable | | 2,387 | | $ | 10.86 | | 5.72 | | $ | 36,732 |
The aggregate intrinsic valuevalues in the table above representsrepresent the total pre-tax intrinsic valuevalues (the difference between the Company’s closing stock price on the last trading day of fiscal2008, 2007, and 2006 and the exercise price, multiplied by the number of shares underlying thein-the-money options) that would have been received by the option holders had all option holders exercised their options on December 31, 2008, December 31, 2007, and December 31, 2006. This amount changes based on the fair market value of the Company’s stock. Total intrinsic value of options exercised for the year ended December 31, 2004, 20052008, 2007 and 2006 was $30.9$1.2 million, $18.7$25.7 million, and $15.1$15.3 million, respectively. Total fair value of options expensed for the year ended December 31, 2006 was $3.2 million, net of tax.
The total fair value of options vested during the years ended December 31, 2004, 2005,2008, 2007, and 2006 was $1.9$9.1 million, $1.1$6.4 million, and $2.8$3.0 million, respectively.
64
NETGEAR, INC.
NOTES TO CONSOLIDATED FINANCIAL STATEMENTS — (Continued)
Additional information regarding stock options outstanding under the Company’s Stock Option Plans as of December 31, 2006 is as follows:
| | | | | | | | | | | | | | | | | | | | | |
| | | Options Outstanding | | | Options Exercisable | |
| | | | | | Weighted Average
| | | Weighted
| | | | | | Weighted
| |
| | | | | | Remaining
| | | Average
| | | | | | Average
| |
| | | Number
| | | Contractual Life
| | | Exercise
| | | Number
| | | Exercise
| |
Range of Exercise Prices | | Outstanding | | | (In Years) | | | Price | | | Outstanding | | | Price | |
| |
| $ 1.29 - $ 2.99 | | | 81,888 | | | | 2.6 | | | $ | 1.29 | | | | 81,888 | | | $ | 1.29 | |
| $ 3.00 - $ 5.99 | | | 830,138 | | | | 3.4 | | | $ | 4.53 | | | | 830,138 | | | $ | 4.53 | |
| $ 6.00 - $ 8.99 | | | 205,495 | | | | 4.8 | | | $ | 7.54 | | | | 202,521 | | | $ | 7.53 | |
| $ 9.00 - $11.99 | | | 183,536 | | | | 7.0 | | | $ | 10.12 | | | | 121,156 | | | $ | 10.35 | |
| $12.00 - $14.99 | | | 253,812 | | | | 7.3 | | | $ | 13.86 | | | | 187,127 | | | $ | 13.80 | |
| $15.00 - $17.99 | | | 658,928 | | | | 7.4 | | | $ | 15.69 | | | | 564,417 | | | $ | 15.57 | |
| $18.00 - $20.99 | | | 954,158 | | | | 9.1 | | | $ | 19.42 | | | | 335,519 | | | $ | 19.51 | |
| $21.00 - $23.99 | | | 430,012 | | | | 9.2 | | | $ | 22.44 | | | | 63,962 | | | $ | 21.23 | |
| $24.00 - $26.39 | | | 336,490 | | | | 10.0 | | | $ | 26.39 | | | | 0 | | | | N/A | |
| | | | | | | | | | | | | | | | | | | | | |
| $ 1.29 - $26.39 | | | 3,934,457 | | | | 7.1 | | | $ | 14.79 | | | | 2,386,728 | | | $ | 10.86 | |
| | | | | | | | | | | | | | | | | | | | | |
As of December 31, 2006, $15.12008, $14.2 million of total unrecognized compensation cost related to stock options is expected to be recognized over a weighted-average period of 1.721.28 years.
Cash received from option exercises and purchases under the ESPP for the years ended December 31, 2008, 2007 and 2006 was $2.4 million, $13.7 million, and $8.5 million, respectively.
Restricted stock units as of December 31, 2008, 2007, and 2006, and changes during the years ended December 31, 2008, 2007, and 2006 were as follows (share data in thousands):
| | | | | | | | | | | | | | | | | |
| | | 2008 | | 2007 | | 2006 |
| | | Shares | | | Weighted
Average
Grant Date
Fair Value | | Shares | | | Weighted
Average
Grant Date
Fair Value | | Shares | | Weighted
Average
Grant Date
Fair Value |
| | | In thousands | | | | | In thousands | | | | | In thousands | | |
Restricted stock units outstanding at beginning of year | | 149 | | | $ | 27.67 | | 114 | | | $ | 22.52 | | — | | $ | — |
Restricted stock units granted | | 153 | | | | 24.86 | | 101 | | | | 29.84 | | 114 | | | 22.52 |
Restricted stock units vested | | (58 | ) | | | 28.93 | | (51 | ) | | | 22.59 | | — | | | — |
Restricted stock units cancelled | | (9 | ) | | | 27.32 | | (15 | ) | | | 20.35 | | — | | | — |
| | | | | | | | | | | | | | | | | |
Restricted stock units outstanding at end of year | | 235 | | | $ | 25.55 | | 149 | | | $ | 27.67 | | 114 | | $ | 22.52 |
| | | | | | | | | | | | | | | | | |
Total intrinsic value of restricted stock units vested during the years ended December 31, 2008 and 2007 was $1.2 million and $1.7 million. No restricted stock units vested in the year ended December 31, 2006.
The total fair value of restricted stock units vested during the year ended December 31, 2008 and 2007 was $1.7 million and $1.2 million, respectively. No restricted stock units vested in the year ended December 31, 2006.
As of December 31, 2008, $3.3 million of total unrecognized compensation cost related to non-vested restricted stock units is expected to be recognized over a weighted-average period of 1.17 years.
Total fair value of stock-based compensation awards expensed for the years ended December 31, 2008, 2007, and 2006 was $8.5 million.million, $6.6 million, and $3.4 million, respectively, net of tax. The actual excess tax benefit recognized for the tax deduction arising from the exercise of stock-based compensation awards for the years ended December 31, 2008, 2007, and 2006 totaled $81,000, $8.4 million, and $4.2 million, respectively.
Common Stock Repurchase Programs
In October 21, 2008, the Company’s Board of Directors authorized management to repurchase up to 6,000,000 shares of the Company’s outstanding common stock. Under this authorization, the timing and actual number of shares subject to repurchase are at the discretion of management and are contingent on a number of factors, such as levels of cash generation from operations, cash requirements for acquisitions and the price of the Company’s common stock. During the fiscal year ended December 31, 2006 totaled $4.2 million.
Nonvested2008, the Company repurchased approximately 1.2 million shares or $12.0 million of common stock under this repurchase authorization.In addition, the Company repurchased approximately 9,000 shares, or $206,000 of common stock under a repurchase program to help administratively facilitate the withholding and subsequent remittance of personal income and payroll taxes for individuals receiving restricted stock awards as of December 31, 2006 and changesunits during the year ended December 31, 2006 were as follows:
| | | | | | | | | |
| | | | | | Weighted
| |
| | | | | | Average
| |
| | | | | | Grant Date
| |
| | | Shares | | | Fair Value | |
| |
| Nonvested outstanding at December 31, 2005 | | | — | | | $ | — | |
| Granted | | | 114,000 | | | | 22.52 | |
| Vested | | | — | | | | — | |
| Forfeited | | | — | | | | — | |
| | | | | | | | | |
| Nonvested outstanding at December 31, 2006 | | | 114,000 | | | $ | 22.52 | |
| | | | | | | | | |
As2008. Similarly, during the year ended December 31, 2007, the Company repurchased approximately 5,000 shares, or $150,000 of
common stock under the same program to help facilitate tax withholding for restricted stock units. During the year ended December 31, 2006,
$1.9 million of total unrecognized compensation costthe Company did not repurchase any common stock.These shares were retired upon repurchase. The Company’s policy related to nonvested restrictedrepurchases of its common stock awards is expected to be recognizedcharge the excess of cost over a weighted-average periodpar value to retained earnings. All repurchases were made in compliance with Rule 10b-18 under the Securities Exchange Act of 1.59 years.
1934, as amended.Note 8 — 10—Segment Information, Operations by Geographic Area and Customer Concentration:
Operating segments are components of an enterprise about which separate financial information is available and is regularly evaluated by management, namely the chief operating decision maker of an organization, in order to make operating and resource allocation decisions. By this definition, the Company operates in one business segment, which comprises the development, marketing and sale of networking products for the small business and home markets. The Company’s primary headquarters and a significant portion of its operations are located in the United States. The Company also conducts sales, marketing and customer service activities and certain distribution
65
NETGEAR, INC.
NOTES TO CONSOLIDATED FINANCIAL STATEMENTS — (Continued)
center activities through several small sales offices in Europe, Middle-East and Africa (EMEA)(“EMEA”) and Asia as well as outsourced distribution centers.
For reporting purposes revenue is attributed to each geography based on the geographic location of the customer. Net revenue by geography comprises gross revenue less such items as sales incentives deemed to be a reduction of net revenue per EITF IssueNo. 01-9, sales returns and price protection, which reduce gross revenue.
Net revenue by geographic location is as follows (in thousands):
| | | | | | | | | | | | | |
| | | Year Ended December 31, | |
| | | 2004 | | | 2005 | | | 2006 | |
| |
| United States | | $ | 186,836 | | | $ | 199,208 | | | $ | 220,440 | |
| United Kingdom | | | 60,585 | | | | 76,456 | | | | 151,026 | |
| Germany | | | 51,304 | | | | 52,869 | | | | 55,104 | |
| EMEA (excluding UK and Germany) | | | 47,726 | | | | 70,626 | | | | 92,104 | |
| Asia Pacific and rest of the world | | | 36,688 | | | | 50,451 | | | | 54,896 | |
| | | | | | | | | | | | | |
| | | $ | 383,139 | | | $ | 449,610 | | | $ | 573,570 | |
| | | | | | | | | | | | | |
| | | | | | | | | |
| | | Year Ended December 31, |
| | | 2008 | | 2007 | | 2006 |
United States | | $ | 297,641 | | $ | 273,695 | | $ | 220,440 |
United Kingdom | | | 120,994 | | | 183,341 | | | 151,026 |
EMEA (excluding UK) | | | 233,064 | | | 197,013 | | | 147,208 |
Asia Pacific and rest of the world | | | 91,645 | | | 73,738 | | | 54,896 |
| | | | | | | | | |
| | $ | 743,344 | | $ | 727,787 | | $ | 573,570 |
| | | | | | | | | |
Long-lived assets, comprising fixed assets, are reported based on the location of the asset. Long-lived assets by geographic location are as follows (in thousands):
| | | | | | | | | |
| | | December 31, | |
| | | 2005 | | | 2006 | |
| |
| United States | | $ | 4,378 | | | $ | 4,878 | |
| EMEA | | | 42 | | | | 592 | |
| Asia Pacific and rest of the world | | | 282 | | | | 1,098 | |
| | | | | | | | | |
| | | $ | 4,702 | | | $ | 6,568 | |
| | | | | | | | | |
| | | | | | |
| | | Year Ended December 31, |
| | | 2008 | | 2007 |
United States | | $ | 17,632 | | $ | 9,459 |
EMEA | | | 434 | | | 578 |
Asia Pacific and rest of the world | | | 2,226 | | | 1,168 |
| | | | | | |
| | $ | 20,292 | | $ | 11,205 |
| | | | | | |
Customer concentration (as a percentage of net revenue):
| | | | | | | | | | | | | |
| | | Year Ended December 31, |
| | | 2004 | | 2005 | | 2006 |
| |
| Ingram Micro, Inc. | | | 27 | % | | | 25 | % | | | 19 | % |
| Tech Data Corporation | | | 18 | % | | | 17 | % | | | 16 | % |
| | | | | | | | | |
| | | Year Ended December 31, | |
| | | 2008 | | | 2007 | | | 2006 | |
Ingram Micro, Inc. | | 14 | % | | 17 | % | | 19 | % |
Tech Data Corporation | | 11 | % | | 14 | % | | 16 | % |
All others individually less than 10% of revenue | | 75 | % | | 69 | % | | 65 | % |
| | | | | | | | | |
| | 100 | % | | 100 | % | | 100 | % |
| | | | | | | | | |
Note 9 — 11—Employee Benefit Plan:
In April 2000, the Company adopted the NETGEAR 401(k) Plan to which employees may contribute up to 100% of salary subject to the legal maximum. TheThrough December 31, 2007, the Company contributescontributed an amount equal to 50% of the employee contributions up to a maximum of $1,500 per calendar year per employee. Beginning on January 1, 2008 through December 31, 2008, the Company contributed an amount equal to 100% of the employee contributions up to a maximum of $7,000 per calendar year per employee. The Company contributed and expensed $279,000, $361,000$1.3 million, $698,000 and $473,000 related to the NETGEAR 401(k) Plan in the years ended December 31, 2004, 20052008, 2007 and 2006, respectively.
66
The Company adopted SFAS 157 effective January 1, 2008 for financial assets and liabilities measured on a recurring basis. SFAS 157 applies to all financial assets and financial liabilities that are being measured and reported on a fair value basis. Although there was no impact for adoption of SFAS 157 to the consolidated financial statements, the Company is now required to provide additional disclosures as part of its financial statements. In accordance with FSP 157-2, the Company deferred adoption of SFAS 157 as it relates to non-financial assets and liabilities except those measured at fair value in the financial statements on a recurringbasis. SFAS 157 establishes a framework for measuring fair value and expands disclosure about fair value measurements. The statement requires fair value measurements be classified and disclosed in one of the following three categories:
Level 1: Unadjusted quoted prices in active markets that are accessible at the measurement date for identical, unrestricted assets or liabilities;Level 2: Quoted prices in markets that are not active, or inputs which are observable, either directly or indirectly, for substantially the full term of the asset or liability;
Level 3: Prices or valuation techniques that require inputs that are both significant to the fair value measurement and unobservable (i.e., supported by little or no market activity).
The following table summarizes the valuation of the Company’s financial assets and liabilities by the above SFAS 157 categories as of December 31, 2008:
| | | | | | | | | | | | |
| | | As of December 31, 2008 |
| | | Total | | Quoted market
prices in active
markets
(Level 1) | | Significant other
observable inputs
(Level 2) | | Significant
unobservable inputs
(Level 3) |
Assets | | | | | | | | | | | | |
Cash equivalents | | $ | 122,232 | | $ | 122,232 | | $ | — | | $ | — |
Available-for-sale
securities(1) | | | 10,170 | | | 10,170 | | | — | | | — |
Foreign currency forward contracts | | | 1,494 | | | — | | | 1,494 | | | — |
| | | | | | | | | | | | |
Total | | $ | 133,896 | | $ | 132,402 | | $ | 1,494 | | $ | — |
| | | | | | | | | | | | |
| (1) | Included in short-term investments on the Company’s consolidated balance sheet. |
| | | | | | | | | | | | | | |
| | | As of December 31, 2008 |
| | | Total | | | Quoted market
prices in active
markets
(Level 1) | | Significant other
observable
inputs (Level 2) | | | Significant
unobservable inputs
(Level 3) |
Liabilities | | | | | | | | | | | | | | |
Foreign currency forward contracts | | $ | (3,274 | ) | | $ | — | | $ | (3,274 | ) | | $ | — |
| | | | | | | | | | | | | | |
Total | | $ | (3,274 | ) | | $ | — | | $ | (3,274 | ) | | $ | — |
| | | | | | | | | | | | | | |
The Company’s investments in cash equivalents and available-for-sale securities are recorded at fair value based on quoted market prices in active markets. All of the Company’s foreign currency forward contracts are with counterparties that have long-term credit ratings of double-A. The Company’s foreign currency forward contracts are valued using pricing models that take into account the contract terms as well as currency rates and counterparty credit rates. The Company verifies the reasonableness of these pricing models using observable market data for related inputs into such models. Additionally, the Company includes an adjustment for non-performance risk in the recognized measure of fair value of derivative instruments. At December 31, 2008, the adjustment for non-performance risk did not have a material impact on the fair value of the Company’s foreign currency forward contracts.
The carrying value of nonfinancial assets and liabilities measured at fair value in the financial statements on a recurring basis, including accounts receivable and accounts payable, approximate fair value due to their short maturities.
QUARTERLY FINANCIAL DATA
(In thousands, except per share amounts)
(unaudited)
(Unaudited)
The following table presents unaudited quarterly financial information for each of the Company’s last eight quarters. This information has been derived from the Company’s unaudited financial statements and has been prepared on the same basis as the audited Consolidated Financial Statements appearing elsewhere in thisForm 10-K. In the opinion of management, all necessary adjustments, consisting only of normal recurring adjustments, have been included to state fairly the quarterly results.
| | | | | | | | | | | | | | | | | |
| | | April 2, 2006 | | | July 2, 2006 | | | October 1, 2006 | | | December 31, 2006 | |
| |
| Net revenue | | $ | 127,259 | | | $ | 130,738 | | | $ | 151,571 | | | $ | 164,002 | |
| Gross profit | | $ | 44,548 | | | $ | 45,377 | | | $ | 50,558 | | | $ | 53,176 | |
| Provision for income taxes | | $ | 6,714 | | | $ | 6,413 | | | $ | 7,080 | | | $ | 7,660 | |
| Net income | | $ | 9,868 | | | $ | 9,835 | | | $ | 7,980 | | | $ | 13,449 | |
| Net income per share — basic | | $ | 0.30 | | | $ | 0.30 | | | $ | 0.24 | | | $ | 0.40 | |
| Net income per share — diluted | | $ | 0.29 | | | $ | 0.29 | | | $ | 0.23 | | | $ | 0.38 | |
| | | | | | | | | | | | | | | | | |
| | | April 3, 2005 | | | July 3, 2005 | | | October 2, 2005 | | | December 31, 2005 | |
| |
| Net revenue | | $ | 108,952 | | | $ | 107,576 | | | $ | 111,317 | | | $ | 121,765 | |
| Gross profit | | $ | 35,881 | | | $ | 38,601 | | | $ | 39,099 | | | $ | 38,118 | |
| Provision for income taxes | | $ | 5,068 | | | $ | 4,944 | | | $ | 5,492 | | | $ | 5,363 | |
| Net income | | $ | 7,860 | | | $ | 8,301 | | | $ | 8,594 | | | $ | 8,868 | |
| Net income per share — basic | | $ | 0.25 | | | $ | 0.26 | | | $ | 0.26 | | | $ | 0.27 | |
| Net income per share — diluted | | $ | 0.24 | | | $ | 0.25 | | | $ | 0.25 | | | $ | 0.26 | |
67
| | | | | | | | | | | | | |
| | | March 30,
2008 | | June 29,
2008 | | September 28,
2008 | | December 31,
2008 | |
Net revenue | | $ | 198,154 | | $ | 204,464 | | $ | 179,367 | | $ | 161,359 | |
Gross profit | | $ | 63,863 | | $ | 66,409 | | $ | 62,293 | | $ | 48,459 | |
Provision for income taxes | | $ | 7,862 | | $ | 8,718 | | $ | 7,929 | | $ | 2,784 | |
Net income | | $ | 11,226 | | $ | 11,064 | | $ | 3,103 | | $ | (7,343 | ) |
Net income per share—basic | | $ | 0.32 | | $ | 0.31 | | $ | 0.09 | | $ | (0.21 | ) |
Net income per share—diluted | | $ | 0.31 | | $ | 0.31 | | $ | 0.09 | | $ | (0.21 | ) |
| | | | | | | | | | | | |
| | | April 1,
2007 | | July 1,
2007 | | September 30,
2007 | | December 31,
2007 |
Net revenue | | $ | 173,572 | | $ | 164,275 | | $ | 191,681 | | $ | 198,259 |
Gross profit | | $ | 60,030 | | $ | 55,954 | | $ | 63,778 | | $ | 62,845 |
Provision for income taxes | | $ | 7,756 | | $ | 6,784 | | $ | 8,796 | | $ | 7,546 |
Net income | | $ | 14,021 | | $ | 6,133 | | $ | 13,266 | | $ | 12,534 |
Net income per share—basic | | $ | 0.41 | | $ | 0.18 | | $ | 0.38 | | $ | 0.36 |
Net income per share—diluted | | $ | 0.40 | | $ | 0.17 | | $ | 0.37 | | $ | 0.35 |
| |
| Item 9. | Changes in and Disagreements With Accountants on Accounting and Financial Disclosure |
| |
| Item 9A. | Controls and Procedures |
Evaluation of disclosure controls and procedures.Management’s Report on Internal Control Over Financial Reporting
Our management evaluated,is responsible for establishing and maintaining adequate internal control over financial reporting (as defined in Rule 13a-15(f) under the Exchange Act). Because of its inherent limitations, internal control over financial reporting may not prevent or detect misstatements. Also, projections of any evaluation of effectiveness to future periods are subject to the risk that controls may become inadequate because of changes in conditions, or that the degree of compliance with the participationpolicies or procedures may deteriorate.
Our management, including our Chief Executive Officer and Chief Financial Officer, conducted an evaluation of our chief executive officer and our chief accounting officer, the effectiveness of our disclosure controls and procedures, as defined inRules 13a-15(e) and15d-15(e) under the Securities Exchange Act of 1934,internal control over financial reporting as of December 31, 2008. In making this assessment, our management used the endcriteria established inInternal Control—Integrated Framework, issued by The Committee of Sponsoring Organizations of the period coveredTreadway Commission (COSO). Based on management’s assessment using those criteria, our management concluded that our internal control over financial reporting was effective as of December 31, 2008. The effectiveness of our internal control over financial reporting as of December 31, 2008 has been audited by PricewaterhouseCoopers LLP, an independent registered public accounting firm, as stated in their report which is included in this Annual Report onForm 10-K. Based on this evaluation, our chief executive officer and our chief accounting officer have concluded that our disclosure controls and procedures are effective to ensure that information we are required to disclose in reports that we file or submit under the Securities Exchange Act of 1934, as amended, is recorded, processed, summarized and reported within the time periods specified in Securities and Exchange Commission rules and forms, and that such information is accumulated and communicated to management, including the chief executive officer and chief accounting officer, as appropriate to allow timely decisions regarding required disclosures.
Design and evaluation of internal control over financial reporting. Pursuant to Section 404 of the Sarbanes-Oxley Act of 2002, we have included a report of management’s assessment of the design and effectiveness of our internal controls as part of this Annual Report onForm 10-K for the fiscal year ended December 31, 2006. Management’s report is included with our Consolidated Financial Statements under Part II, Item 8 of thisForm 10-K.
Changes in internal control over financial reporting.Internal Control Over Financial ReportingThere was no change in our internal control over financial reporting that occurred during the most recentfourth quarter of fiscal quarteryear 2008 that has materially affected, or is reasonably likely to materially affect, our internal control over financial reporting. We are aware
Evaluation of Disclosure Controls and Procedures
Based on an evaluation under the supervision and with the participation of our management (including our Chief Executive Officer and Chief Financial Officer), our Chief Executive Officer and Chief Financial Officer have concluded that any system of controls, however well designed and operated, can only provide reasonable, and not absolute, assurance that the objectives of the system are met, and that maintenance ofour disclosure controls and procedures as defined in Rules 13a-15(e) and 15d-15(e) under the Exchange Act were effective as of the end of the period covered by this Annual Report on Form 10-K to ensure that information required to be disclosed by us in reports that we file or submit under the Exchange Act is an ongoing process that may change over time.
(i) recorded, processed, summarized and reported within the time periods specified in the SEC’s rules and forms and (ii) accumulated and communicated to our management, including our Chief Executive Officer and Chief Financial Officer, as appropriate to allow timely decisions regarding required disclosure. | |
| Item 9B. | Other Information |
PART III
Certain information required by Part III is incorporated herein by reference from our Proxy Statementproxy statement related to our 20072009 Annual Meeting of Stockholders, which we intend to file no later than 120 days after the end of the fiscal year covered by this report.
| |
| Item 10. | Directors, Executive Officers and Corporate Governance |
The information required by this Item concerning our directors and executive officers is incorporated by reference to the sections of our Proxy Statement under the headings “Election of Directors,” “Board and CommitteesCommittee Meetings,” and “Section 16(a) Beneficial Ownership Reporting Compliance,” and to the information contained in the section captioned “Executive Officers of the Registrant” included under Part I, Item 1 of this report.
Form 10-K.We have adopted a Code of Ethics that applies to our chief executive officerChief Executive Officer and senior financial officers, as required by the SEC. The current version of our Code of Ethics can be found on our Internet site athttp://www.netgear.com. Additional information required by this Item regarding our Code of Ethics is incorporated by reference to the information contained in the section captioned “Code of Ethics”“Corporate Governance Policies and Practices” in our Proxy Statement.
We intend to satisfy the disclosure requirement under Item 105.05 ofForm 8-K regarding an amendment to, or waiver from, a provision of this codeour Code of ethicsEthics by posting such information on our website at http:// www.netgear.com within four business days following the address specified above.
68
| |
| Item 11. | Executive Compensation |
The information required by this Item is incorporated by reference to the sections of our Proxy Statement under the headings “Compensation Discussion and Analysis,” “Executive Compensation,” “Director Compensation,” “Compensation Committee Interlocks and Insider Participation,” and “Compensation“Report of the Compensation Committee Report.of the Board of Directors.”
| |
| Item 12. | Security Ownership of Certain Beneficial Owners and Management and Related Stockholder Matters |
The information required by this Item regarding equity compensation plans is incorporated by reference to the section entitled “Equity Compensation Plan Information” set forth in Item 5 of this Form 10-K.
The additional information required by this Item is incorporated by reference to the information contained in the section captioned “Security Ownership of Certain Beneficial Owners and Management” in our Proxy Statement. The information required by this Item regarding Equity Compensation Plan information is included in Part II, Item 5 of this report.
| |
| Item 13. | Certain Relationships and Related Transactions, and Director Independence |
The information required by this Item is incorporated by reference to the information contained in the section captioned “Election of Directors” and “Related Party Transactions” in our Proxy Statement.
| |
| Item 14. | Principal Accountant Fees and Services |
The information required by this Item related to audit fees and services is incorporated by reference to the information contained in the section captioned “Ratification of Appointment of Independent Registered Public Accounting Firm” appearing in our Proxy Statement.
69
PART IV
| |
| Item 15. | Exhibits and Financial Statement Schedule |
(a) The following documents are filed as part of this report:
(1) Financial Statements.
(2) Financial Statement Schedule.
The following financial statement schedule of NETGEAR, Inc. for the fiscal years ended December 31, 2004, 20052008, 2007 and 2006 is filed as part of thisForm 10-K and should be read in conjunction with the Consolidated Financial Statements of NETGEAR, Inc.
70
Schedule II — II—Valuation and Qualifying Accounts
| | | | | | | | | | | | | | | | | |
| | | Balance at
| | | | | | | | | Balance at
| |
| | | Beginning of Year | | | Additions | | | Deductions | | | End of Year | |
| | | (In thousands) | |
| |
| Allowance for doubtful accounts: | | | | | | | | | | | | | | | | |
| Year ended December 31, 2004 | | | 1,322 | | | | 371 | | | | (184 | ) | | | 1,509 | |
| Year ended December 31, 2005 | | | 1,509 | | | | (4 | ) | | | (210 | ) | | | 1,295 | |
| Year ended December 31, 2006 | | | 1,295 | | | | 648 | | | | (216 | ) | | | 1,727 | |
| Allowance for sales returns and product warranty: | | | | | | | | | | | | | | | | |
| Year ended December 31, 2004 | | | 16,804 | | | | 30,863 | | | | (30,494 | ) | | | 17,173 | |
| Year ended December 31, 2005 | | | 17,173 | | | | 37,533 | | | | (36,876 | ) | | | 17,830 | |
| Year ended December 31, 2006 | | | 17,830 | | | | 61,558 | | | | (49,960 | ) | | | 29,428 | |
| Allowance for price protection: | | | | | | | | | | | | | | | | |
| Year ended December 31, 2004 | | | 2,607 | | | | 14,939 | | | | (12,897 | ) | | | 4,649 | |
| Year ended December 31, 2005 | | | 4,649 | | | | 11,828 | | | | (15,021 | ) | | | 1,456 | |
| Year ended December 31, 2006 | | | 1,456 | | | | 9,517 | | | | (7,779 | ) | | | 3,194 | |
(In thousands)
| | | | | | | | | |
| | | Balance at
Beginning
of Year | | Additions | | Deductions | | | Balance at
End of
Year |
Allowance for doubtful accounts: | | | | | | | | | |
Year ended December 31, 2008 | | 2,307 | | 43 | | (432 | ) | | 1,918 |
Year ended December 31, 2007 | | 1,727 | | 966 | | (386 | ) | | 2,307 |
Year ended December 31, 2006 | | 1,295 | | 648 | | (216 | ) | | 1,727 |
| | | | |
Allowance for sales returns and product warranty: | | | | | | | | | |
Year ended December 31, 2008 | | 36,974 | | 69,748 | | (68,405 | ) | | 38,317 |
Year ended December 31, 2007 | | 29,428 | | 62,982 | | (55,436 | ) | | 36,974 |
Year ended December 31, 2006 | | 17,830 | | 61,558 | | (49,960 | ) | | 29,428 |
| | | | |
Allowance for price protection: | | | | | | | | | |
Year ended December 31, 2008 | | 497 | | 7,489 | | (4,556 | ) | | 3,430 |
Year ended December 31, 2007 | | 3,194 | | 5,297 | | (7,994 | ) | | 497 |
Year ended December 31, 2006 | | 1,456 | | 9,517 | | (7,779 | ) | | 3,194 |
(3) Exhibits.The exhibits listed in the accompanying Index to Exhibits are filed or incorporated by reference as part of this report.
71
SIGNATURES
SIGNATURES
Pursuant to the requirements of Section 13 or 15(d) of the Securities Exchange Act of 1934, the Registrant has duly caused this Annual Report to be signed on its behalf by the undersigned, thereunto duly authorized, in the City of Santa Clara,San Jose, State of California, on the 1st4th day of March 2007.
2009.NETGEAR, INC.
Registrant
| | |
NETGEAR, INC. Registrant |
|
| /s/ | PATRICKPATRICK C.S. LOLO |
Patrick C.S. Lo Chairman of the Board and Chief Executive Officer (Principal Executive Officer) |
Patrick C.S. Lo
Chairman of the Board and Chief Executive Officer
(Principal Executive Officer)
KNOW ALL PERSONS BY THESE PRESENTS, that each person whose signature appears below constitutes and appoints Patrick C.S. Lo and Christine M. Gorjanc, and each of them, hisattorneys-in-fact, each with the power of substitution, for him in any and all capacities, to sign any and all amendments to this Report onForm 10-K and to file the same, with exhibits thereto and other documents in connection therewith, with the Securities and Exchange Commission, hereby ratifying and confirming all that each of saidattorneys-in-fact, or his substitute or substitutes, may do or cause to be done by virtue hereof.
Pursuant to the requirements of the Securities Exchange Act of 1934, this report has been signed below by the following persons on behalf of the Registrant and in the capacities and on the dates indicated:
| | | | |
Signature | | Title | | Date |
| | |
/s/ PATRICK C.S. LO Patrick C.S. Lo | | |
Signature
| | Title
| | Date
|
|
/s/ PATRICK C.S. LO
Patrick C.S. Lo | | Chairman of the Board and
Chief Executive Officer
(Principal Executive Officer) | | March 1, 20074, 2009 |
| | |
/s/ CHRISTINE M. GORJANC Christine M. Gorjanc | | | | |
/s/ CHRISTINE M. GORJANC
Christine M. Gorjanc | | Chief AccountingFinancial Officer
(Principal Financial and
Accounting Officer) | | March 1, 20074, 2009 |
| | | | |
/s/ JOCELYN CARTER-MILLER RALPH E. FAISONJocelyn Carter-Miller
Ralph E. Faison | | Director | | March 1, 20074, 2009 |
| | | | |
/s/ RALPH E. FAISON A. TIMOTHY GODWINRalph E. Faison
A. Timothy Godwin | | Director | | March 1, 20074, 2009 |
| | | | |
/s/ A. TIMOTHY GODWIN JEF GRAHAMA. Timothy Godwin
Jef Graham | | Director | | March 1, 20074, 2009 |
| | | | |
/s/ LINWOODLINWOOD A. LACY,Lacy, JR.
Linwood A. Lacy, Jr. | | Director | | March 1, 20074, 2009 |
| | | | |
George G. C. ParkerGeorge G. C. Parker | | Director | | March 1, 20074, 2009 |
| | | | |
Signature | | Title | | Date |
| | |
/s/ GREGORYGREGORY J. ROSSMANNROSSMANN
Gregory J. Rossmann | | Director | | March 1, 20074, 2009 |
| | |
/s/ JULIE A. SHIMER Julie A. Shimer | | Director | | March 4, 2009 |
72
INDEX TO EXHIBITS
| | | | | |
Exhibit
| | |
Number | | Description |
| |
| | 3 | .3 | | Amended and Restated Certificate of Incorporation of the registrant(1) |
| | 3 | .5 | | Bylaws of the registrant(1) |
| | 4 | .1 | | Form of registrant’s common stock certificate(1) |
| | 10 | .1 | | Form of Indemnification Agreement for directors and officers(1) |
| | 10 | .2 | | 2000 Stock Option Plan and forms of agreements thereunder(1) |
| | 10 | .3 | | 2003 Stock Plan and forms of agreements thereunder(1) |
| | 10 | .4 | | 2003 Employee Stock Purchase Plan(1) |
| | 10 | .5 | | Employment Agreement, dated December 3, 1999, between the registrant and Patrick C.S. Lo(1) |
| | 10 | .7 | | Employment Agreement, dated August 10, 2001, between the registrant and Jonathan R. Mather(1) |
| | 10 | .8 | | Employment Agreement, dated December 9, 1999, between the registrant and Mark G. Merrill(1) |
| | 10 | .9 | | Employment Agreement, dated November 4, 2002, between the registrant and Michael F. Falcon(1) |
| | 10 | .10 | | Employment Agreement, dated January 6, 2003, between the registrant and Charles T. Olson(1) |
| | 10 | .11 | | Employment Agreement, dated October 18, 2004, between the registrant and Albert Y. Liu(2) |
| | 10 | .12 | | Employment Agreement, dated November 16, 2005, between the registrant and Christine M. Gorjanc(3) |
| | 10 | .13 | | Standard Office Lease, dated December 3, 2001, between the registrant and Dell Associates II-A, and First Amendment to Standard Office Lease, dated March 21, 2002(1) |
| | 10 | .13.1 | | Second Amendment to Lease, dated June 30, 2004, between the registrant and Dell Associates II-A(4) |
| | 10 | .14* | | Distributor Agreement, dated March 1, 1997, between the registrant and Tech Data Product Management, Inc.(1) |
| | 10 | .15* | | Distributor Agreement, dated March 1, 1996, between the registrant and Ingram Micro Inc., as amended by Amendment dated October 1, 1996 and Amendment No. 2 dated July 15, 1998(1) |
| | 10 | .24* | | Warehousing Agreement, dated July 5, 2001, between the registrant and APL, Logistics Americas, Ltd.(1) |
| | 10 | .25* | | Distribution Operation Agreement, dated April 27, 2001, between the registrant and Furness Logistics BV(1) |
| | 10 | .26* | | Distribution Operation Agreement, dated December 1, 2001, between the registrant and Kerry Logistics (Hong Kong) Limited(1) |
| | 10 | .30 | | Employment Agreement, dated November 3, 2003, between the registrant and Michael Werdann(5) |
| | 10 | .31 | | Severance Agreement and Release, effective as of November 12, 2004, between the registrant and Christopher Marshall(6) |
| | 10 | .32 | | Settlement Agreement and Release for Zilberman v. NETGEAR, Civil Action CV021230, effective as of November 22, 2005(7) |
| | 10 | .33 | | 2006 Long Term Incentive Plan and forms of agreements thereunder(8) |
| | 10 | .34 | | Agreement and Plan of Merger, dated as of July 26, 2006, by and among NETGEAR, Inc., SKJM Holdings Corporation, SkipJam Corp., Michael Spilo, Jonathan Daub, Francis Refol, Dennis Aldover and Zhicheng Qiu(9) |
| | 10 | .35 | | Separation Agreement and Release, dated as of April 26, 2006, by and between NETGEAR, Inc. and Jonathan R. Mather(10) |
| | 10 | .36 | | Employment Agreement, dated September 5, 2006, between the registrant and Deborah A. Williams(11) |
| | 10 | .38 | | Relocation Agreement, dated September 5, 2006, between the registrant and Deborah A. Williams(12) |
| | 10 | .39 | | Employment Agreement, dated September 7, 2006, between the registrant and Thomas Holt(13) |
| | 10 | .40 | | Relocation Agreement, dated September 7, 2006, between the registrant and Thomas Holt(14) |
| | 21 | .1 | | List of subsidiaries |
| | 23 | .1 | | Consent of PricewaterhouseCoopers LLP, Independent Registered Public Accounting Firm |
73
| | | | | |
Exhibit
| | |
Number | | Description |
| |
| | 31 | .1 | | Certification of Chief Executive Officer pursuant to Securities Exchange ActRules 13a-15(c) and15d-15(e), as adopted pursuant to Section 302 of the Sarbanes-Oxley Act of 2002 |
| | 31 | .2 | | Certification of Chief Accounting Officer pursuant to Securities Exchange ActRules 13a-15(c) and15d-15(e), as adopted pursuant to Section 302 of the Sarbanes-Oxley Act of 2002 |
| | 32 | .1 | | Certification of Chief Executive Officer pursuant to 18 U.S.C. Section 1350, as adopted pursuant to Section 906 of the Sarbanes-Oxley Act of 2002 |
| | 32 | .2 | | Certification of Chief Accounting Officer pursuant to 18 U.S.C. Section 1350, as adopted pursuant to Section 906 of the Sarbanes-Oxley Act of 2002 |
| | |
* Exhibit Number | | Description |
| 2.1** | | Asset Purchase Agreement, dated as of September 22, 2008, by and among CP Secure International Holding Limited, the stockholders thereof and the registrant(1) |
| |
| 3.3 | | Amended and Restated Certificate of Incorporation of the registrant(2) |
| |
| 3.5 | | Amended and Restated Bylaws of the registrant(2) |
| |
| 4.1 | | Form of registrant’s common stock certificate(2) |
| |
| 10.1 | | Form of Indemnification Agreement for directors and officers(2) |
| |
| 10.2# | | 2000 Stock Option Plan and forms of agreements thereunder(2) |
| |
| 10.3# | | 2003 Stock Plan and forms of agreements thereunder(2) |
| |
| 10.4# | | 2003 Employee Stock Purchase Plan(2) |
| |
| 10.5# | | Offer Letter, dated December 3, 1999, between the registrant and Patrick C.S. Lo(2) |
| |
| 10.7# | | Employment Agreement, dated August 10, 2001, between the registrant and Jonathan R. Mather(2) |
| |
| 10.8# | | Offer Letter, dated December 9, 1999, between the registrant and Mark G. Merrill(2) |
| |
| 10.9# | | Employment Agreement, dated November 4, 2002, between the registrant and Michael F. Falcon(2) |
| |
| 10.10# | | Employment Agreement, dated January 6, 2003, between the registrant and Charles T. Olson(2) |
| |
| 10.11# | | Employment Agreement, dated October 18, 2004, between the registrant and Albert Y. Liu(3) |
| |
| 10.12# | | Employment Agreement, dated November 16, 2005, between the registrant and Christine M. Gorjanc(4) |
| |
| 10.13 | | Standard Office Lease, dated December 3, 2001, between the registrant and Dell Associates II-A, and First Amendment to Standard Office Lease, dated March 21, 2002(2) |
| |
| 10.13.1 | | Second Amendment to Lease, dated June 30, 2004, between the registrant and Dell Associates II-A(5) |
| |
| 10.14* | | Distributor Agreement, dated March 1, 1997, between the registrant and Tech Data Product Management, Inc.(2) |
| |
| 10.15* | | Distributor Agreement, dated March 1, 1996, between the registrant and Ingram Micro Inc., as amended by Amendment dated October 1, 1996 and Amendment No. 2 dated July 15, 1998(2) |
| |
| 10.24* | | Warehousing Agreement, dated July 5, 2001, between the registrant and APL, Logistics Americas, Ltd.(2) |
| |
| 10.25* | | Distribution Operation Agreement, dated April 27, 2001, between the registrant and DSV Solutions B.V. (formerly Furness Logistics BV)(2) |
| |
| 10.26* | | Distribution Operation Agreement, dated December 1, 2001, between the registrant and Kerry Logistics (Hong Kong) Limited(2) |
| |
| 10.30# | | Employment Agreement, dated November 3, 2003, between the registrant and Michael Werdann(6) |
| |
| 10.31# | | Severance Agreement and Release, effective as of November 12, 2004, between the registrant and Christopher Marshall(7) |
| |
| 10.32 | | Settlement Agreement and Release for Zilberman v. NETGEAR, Civil Action CV021230, effective as of November 22, 2005(8) |
| | |
Exhibit Number | | Description |
| 10.33# | | 2006 Long Term Incentive Plan and forms of agreements thereunder(9) |
| |
| 10.34 | | Agreement and Plan of Merger, dated as of July 26, 2006, by and among the registrant, SKJM Holdings Corporation, SkipJam Corp., Michael Spilo, Jonathan Daub, Francis Refol, Dennis Aldover and Zhicheng Qiu(10) |
| |
| 10.35# | | Separation Agreement and Release, dated as of April 26, 2006, by and between the registrant and Jonathan R. Mather(11) |
| |
| 10.36# | | Employment Agreement, dated September 5, 2006, between the registrant and Deborah A. Williams(12) |
| |
| 10.38# | | Relocation Agreement, dated September 5, 2006, between the registrant and Deborah A. Williams(13) |
| |
| 10.39# | | Employment Agreement, dated September 7, 2006, between the registrant and Thomas Holt(14) |
| |
| 10.40# | | Relocation Agreement, dated September 7, 2006, between the registrant and Thomas Holt(15) |
| |
| 10.41** | | Agreement and Plan of Merger, dated as of May 2, 2007, by and among the registrant, NAS Holdings Corporation, Infrant Technologies, Inc., certain Infrant shareholders thereof, and Paul Tien as the Holders Representative(16) |
| |
| 10.42# | | NETGEAR, Inc. 2007 Bonus Plan(17) |
| |
| 10.43# | | Separation Agreement and Release, dated as of August 29, 2007, by and between the registrant and Deborah A. Williams(18) |
| |
| 10.44 | | Office Lease, dated as of September 25, 2007, by and between the registrant and BRE/Plumeria, LLC(19) |
| |
| 10.45 | | First Amendment to Office Lease, dated as of April 23, 2008, by and between the registrant and BRE/Plumeria, LLC(20) |
| |
| 10.46# | | Amended and Restated 2006 Long-Term Incentive Plan(21) |
| |
| 10.47# | | NETGEAR, Inc. Executive Bonus Plan(22) |
| |
| 10.49# | | Amendment to Employment Agreement, dated December 29, 2008, between the registrant and Michael F. Falcon |
| |
| 10.50# | | Amendment to Employment Agreement, dated December 31, 2008, between the registrant and Christine Gorjanc |
| |
| 10.51# | | Amendment to Offer Letter, dated December 23, 2008, between the registrant and Patrick Lo |
| |
| 10.52# | | Amendment to Offer Letter, dated December 28, 2008, between the registrant and Mark Merrill |
| |
| 10.53# | | Amendment to Employment Agreement, dated December 24, 2008, between the registrant and Chuck Olson |
| |
| 10.54# | | Amendment to Employment Agreement, dated December 30, 2008, between the registrant and Michael Werdann |
| |
| 10.55# | | Amendment to Employment Agreement, dated December 29, 2008, between the registrant and Thomas Holt |
| |
| 21.1 | | List of subsidiaries and affiliates |
| |
| 23.1 | | Consent of PricewaterhouseCoopers LLP, Independent Registered Public Accounting Firm |
| | |
Exhibit Number | | Description |
| 24.1 | | Power of Attorney (included on signature page) |
| |
| 31.1 | | Certification of Chief Executive Officer pursuant to Securities Exchange Act Rules 13a-14(a)/15d-14(a), as adopted pursuant to Section 302 of the Sarbanes-Oxley Act of 2002 |
| |
| 31.2 | | Certification of Chief Financial Officer pursuant to Securities Exchange Act Rules 13a-14(a)/15d-14(a), as adopted pursuant to Section 302 of the Sarbanes-Oxley Act of 2002 |
| |
| 32.1 | | Certification of Chief Executive Officer pursuant to 18 U.S.C. Section 1350, as adopted pursuant to Section 906 of the Sarbanes-Oxley Act of 2002 |
| |
| 32.2 | | Certification of Chief Financial Officer pursuant to 18 U.S.C. Section 1350, as adopted pursuant to Section 906 of the Sarbanes-Oxley Act of 2002 |
| # | Indicates management contract or compensatory plan or arrangement. |
| * | Confidential treatment has been granted as to certain portions of this Exhibit. |
| ** | Registrant hereby agrees to furnish a copy of the omitted schedules and exhibits to the Securities and Exchange Commission upon its request. |
| (1) | | Incorporated by reference to the exhibit bearing the same number filed with the Registrant’s Current Report on Form 8-K filed on September 23, 2008 with the Securities and Exchange Commission. |
| (2) | Incorporated by reference to an exhibit filed with the Registrant’s Registration Statement onForm S-1 (RegistrationStatement 333-104419), which the Securities and Exchange Commission declared effective on July 30, 2003. |
|
(2) | (3) | Incorporated by reference to Exhibit 10.3 of the Registrant’s Quarterly Report onForm 10-Q filed on November 17, 2004 with the Securities and Exchange Commission. |
|
(3) | (4) | Incorporated by reference to Exhibit 10.32 of the Registrant’s Current Report onForm 8-K filed on November 22, 2005 with the Securities and Exchange Commission. |
|
(4) | (5) | Incorporated by reference to Exhibit 10.2 of the Registrant’s Quarterly Report onForm 10-Q filed on November 17, 2004 with the Securities and Exchange Commission. |
|
(5) | (6) | Incorporated by reference to Exhibit 10.11 of the Registrant’s Annual Report onForm 10-K filed on March 5, 2004 with the Securities and Exchange Commission. |
|
(6) | (7) | Incorporated by reference to Exhibit 10.4 of the Registrant’s Quarterly Report onForm 10-Q filed on November 17, 2004 with the Securities and Exchange Commission. |
|
(7) | (8) | Incorporated by reference to Exhibit 10.33 of the Registrant’s Current Report onForm 8-K filed on November 25, 2005 with the Securities and Exchange Commission. |
|
(8) | (9) | Incorporated by reference to the copy included in the Registrant’s Proxy Statement for the 2006 Annual Meeting of Stockholders filed on April 21, 2006 with the Securities and Exchange Commission. |
|
(9) | (10) | Incorporated by reference to Exhibit 2.1 of the Registrant’s Current Report onForm 8-K filed on July 27, 2006 with the Securities and Exchange Commission. |
|
(10) | (11) | Incorporated by reference to Exhibit 99.2 of the Registrant’s Current Report onForm 8-K filed on April 26, 2006 with the Securities and Exchange Commission. |
|
(11) | (12) | Incorporated by reference to Exhibit 99.1 of the Company’sRegistrant’s Current Report onForm 8-K filed on September 11, 2006 with the Securities and Exchange Commission. |
|
(12) | (13) | Incorporated by reference to Exhibit 99.2 of the Company’sRegistrant’s Current Report onForm 8-K filed on September 11, 2006 with the Securities and Exchange Commission. |
|
(13) | (14) | Incorporated by reference to Exhibit 99.3 of the Company’sRegistrant’s Current Report onForm 8-K filed on September 11, 2006 with the Securities and Exchange Commission. |
|
(14) | (15) | Incorporated by reference to Exhibit 99.4 of the Company’sRegistrant’s Current Report onForm 8-K filed on September 11, 2006 with the Securities and Exchange Commission. |
| (16) | Incorporated by reference to Exhibit 2.1 of the Registrant’s Current Report on Form 8-K filed on May 3, 2007 with the Securities and Exchange Commission. |
| (17) | Incorporated by reference to Exhibit 2.2 of the Registrant’s Current Report on Form 8-K filed on May 3, 2007 with the Securities and Exchange Commission. |
74
| (18) | Incorporated by reference to Exhibit 10.1 of the Registrant’s Current Report on Form 8-K filed on August 30, 2007 with the Securities and Exchange Commission. |
| (19) | Incorporated by reference to Exhibit 10.1 of the Registrant’s Current Report on Form 8-K filed on September 27, 2007 with the Securities and Exchange Commission. |
| (20) | Incorporated by reference to Exhibit 10.1 of the Registrant’s Quarterly Report on Form 10-Q filed on May 9, 2008 with the Securities and Exchange Commission. |
| (21) | Incorporated by reference to the copy included in the Registrant’s Proxy Statement for the 2008 Annual Meeting of Stockholders filed on April 28, 2008 with the Securities and Exchange Commission. |
| (22) | Incorporated by reference to the copy included in the Registrant’s Proxy Statement for the 2008 Annual Meeting of Stockholders filed on April 28, 2008 with the Securities and Exchange Commission. |
96