| (Name of registrant at as specific in its charter) | | | | CALIFORNIA | | 68-0454068 | | | | | (State of incorporation) | | (I.R.S. Employer Identification No.) | | 202 West Napa Street | | | Sonoma, California 95476 | | | (707) 935-3200 | | | (Address, including zip code, and telephone number, | | | including area code, of principal executive offices) | | | ------------------------ | |
202 West Napa Street
Sonoma, California 95476
(707) 935-3200(Address, including zip code, and telephone number,including area code, of principal executive offices)Securities to be registered under section 12(b) of the Exchange Act: None Securities to be registered under section 12(g) of the Exchange Act: | | |
Title of each class | | Name of each exchange
| | Title of each class | on which registered | | | | | Common Stock, No Par Value | | None |
Indicate by check mark if the registrant is a well-known seasoned issuer, as defined in Rule 405 of the Securities Act.o [ ] Yesþ [ X ] No Indicate by check mark if the registrant is not required to file reports pursuant to Section 13 or 15(d) of the Exchange Act.o [ ] Yesþ [ X ] No Indicate by check mark whether the registrant (1) has filed all reports required to be filed by Section 13 or 15(d) of the Securities Exchange Act of 1934 during the preceding 12 months (or for such shorter period that the registrant was required to file such reports), and (2) has been subject to such filing requirements for the past 90 days.þ [X] Yeso [ ] No Indicate by check mark if disclosure of delinquent filers pursuant to Item 405 of Regulation S-K is contained herein, and will not be contained, to the best of registrant’sregistrant's knowledge, in definitive proxy or information statements incorporated by reference in Part III of this Form 10-K or any amendment of this Form 10-K.o [ ] Indicate by check mark whether the registrant is a large accelerated filed, an accelerated filer or a non-accelerated filer. See definition of “accelerated filer and large accelerated filer” in Rule 12b-2 of the Act. Large Accelerated Filero [ ] Accelerated FileroFiler[ ] Non-accelerated filerþ [ X ] Smaller Reporting Filer[ ] Indicate by check mark whether the registrant is a shell company (as defined in Rule 12b-2 of the Exchange Act.o [ ] Yesþ [ X ] No
As of June 30, 2006,2008, the aggregate market value of the registrant’s common stock held by non-affiliates of the registrant was $ 46,650,786$41,567,872 based on the closing sale price as reported on the Over the Counter Bulletin Board (“OTC Bulletin Board”).
Indicate the number of shares outstanding of each of the issuer’s classes of common stock, as of the latest practicable date. | | | Class | | Outstanding at March 13, 2007 | | | | Common Stock, no par value per share | | 2,319,627 |
Class Outstanding at March 9, 2009 Common Stock, no par value per share 2,313,821 DOCUMENTS INCORPORATE BY REFERENCE
The information required by Items 10,11,12,13 and 14 of Part III are incorporated by reference to the registrant’s proxy statement, which will be filed within 120 days of the registrant’s year end.
TABLE OF CONTENTS
With the exception of historical facts stated herein, the matters discussed in this Form 10-K are “forward looking” statements that involve risks and uncertainties that could cause actual results to differ materially from projected results. Such “forward looking” statements include, but are not necessarily limited to statements regarding anticipated levels of future revenues and earnings from the operation of Sonoma Valley Bancorp’sBancorp's (“the Company”) wholly owned subsidiary, Sonoma Valley Bank (“the Bank”), projected costs and expenses related to operations of the bank’s liquidity, capital resources, and the availability of future equity capital on commercially reasonable terms. Factors that could cause actual results to differ materially include, in addition to the other factors identified in thisForm 10-K,, the following: (i) increased competition from other banks, savings and loan associations, thrift and loan associations, finance companies, credit unions, offerors of money market funds, and other financial institutions; (ii) the risks and uncertainties relating to general economic and political conditions, both domestically and internationally, including, but not limited to, inflation, or natural disasters affecting the primary service area of the Bank or its major industries; or (iii) changes in the laws and regulations governing the Bank’s activities at either the state or federal level.
| (i) | increased competition from other banks, savings and loan associations, thrift and loan associations, finance companies, credit unions, offerors of money market funds, and other financial institutions; |
| (ii) | the risks and uncertainties relating to general economic and political conditions, both domestically and internationally, including, but not limited to, inflation, or natural disasters affecting the primary service area of the Bank or its major industries; |
| (iii) | Changing business, banking, or regulatory conditions or policies, or new legislation, affecting the Bank’s activities at either the state or federal level, including the Emergency Economic Stabilization Act of 2008 and related programs such as the U.S. government’s Troubled Assets Relief Program and any new legislation adopted by Congress and the administration of President Barack Obama, that could lead to changes in the competitive balance among financial institutions, restrictions on bank activities, changes in costs, including deposit insurance premiums, for particular financial institutions or financial institutions generally, declines in consumer confidence in depository institutions generally or certain financial institutions in particular or changes in the secondary market for bank loan and other products; |
Readers of this Form 10-K are cautioned not to put undue reliance on “forward looking” statements which, by their nature, are uncertain as reliable indicators of future performance. Sonoma Valley Bancorp disclaims any obligation to publicly update these “forward looking” statements, whether as a result of new information, future events, or otherwise.
PART I ITEM 1. BUSINESS General
General
Sonoma Valley Bancorp (“Company”("Company") was incorporated under California law on March 9, 2000 at the direction of Sonoma Valley Bank for the purpose of forming a single-bank holding company structure pursuant to a plan of reorganization. The reorganization became effective November 1, 2000, after obtaining all required regulatory approvals and permits, shares of the Company’sCompany's common stock were issued to shareholders of Sonoma Valley Bank in exchange for their Sonoma Valley Bank stock. Previously, Sonoma Valley Bank filed its periodic reports and current reports under the Securities Exchange Act of 1934 with the Federal Deposit Insurance Corporation(“Corporation (“FDIC”). Following the reorganization, periodic and current reports are now filed with the Securities and Exchange Commission (“SEC”). The business operations of the Company continue to be conducted through its wholly-owned subsidiary, Sonoma Valley Bank (“Bank”("Bank"), which began commercial lending operations on June 3, 1988. In addition to its main branch located in Sonoma, California, the Bank also operates two additional branch offices, one branch office is located in Glen Ellen, California. In March 2004, the Bank opened another branch office, Banco de Sonoma, located in Boyes Hot Springs, California. The following discussion, although presented on a consolidated basis, analyzes the financial condition and results of operations of the Bank for the twelve month period ended December 31, 2006.2008.
Primary Services The Bank emphasizes the banking needs of small to medium-sized commercial businesses, professionals and upper middle to high income individuals and families in its primary service area of Sonoma, California and the immediate surrounding area. In recognition of CRA compliance, the Company offers products to accommodate special needs of individuals regardless of their economic status and more recently the Company has focused on the needs of the Latino community. 3
The Bank offers depository and lending services keyed to the needs of its business and professional clientele. These services include a variety of demand deposit, savings and time deposit account alternatives, all insured by the FDIC up to its applicable limits. Special merchant and business services, such as coin, night depository, courier, on line cash management and merchant teller services are available. The Bank offers Internet Banking for both commercial and consumer customers, bank by mail service, drive-up ATM service, extended hours including Saturday banking, drive-up windows and telephone voice response. The Bank’sBank's lending activities are directed primarily towards granting short and medium-term commercial loans, augmented by customized lines of credit, for such purposes as operating capital, business and professional start-ups, inventory, equipment, accounts receivable, credit cards, and interim construction financing, personal loans and loans secured by residential real estate. With the opening of our third branch office, Banco de Sonoma, in March 2004, the Bank is offering additional services to the Latino community in our market place. The Banco de Sonoma Office is predominantly staffed by bilingual officers, customer service employees and tellers. The Bank offers special money transfer services to facilitate the transfer of funds to Mexico. The business of the Bank is not seasonal. The Bank intends to continue with the same basic commercial banking activities with which it has operated with since beginning operations June 3, 1988. Retail deposit gathering activities at the branches comprise the bulk of sources for lending. The Bank has approved borrowing levels at the Federal Home Loan Bank for temporary funding needs.
Competition In general, the banking business in California and in the market areas, which the Bank serves, is highly competitive with respect to both loans and deposits, and is dominated by a relatively small number of major banks, which have many offices operating over a wide geographic area. The Bank competes for loans and deposits with these and other regional banks, including several which are much larger than the Bank, as well as savings and loan associations, thrift and loan associations, finance companies, credit unions, offerors of money market funds and other financial institutions. The Bank’sBank's primary service area is currently served by branches of eight other banks (including threefour major banks: Citigroup, Bank of America, and Wells Fargo Bank)Bank and J.P. Morgan Chase). In order to compete with the major financial institutions in its primary service area, the Bank uses its flexibility as an independent bank. This includes emphasis on specialized services and personalized attention. In the event there are customers whose loan demands exceed the Bank’sBank's lending limit, the Bank seeks to arrange for such loans on a participation basis with other financial institutions and intermediaries. The Bank also is able to assist those customers requiring other services not offered by the Bank by obtaining those services through its correspondent banks.
Concentration of Credit Risk The majority of the Bank’sBank's loan activity is with customers located within the county of Sonoma. While the Bank has a diversified loan portfolio, approximately 90.5%91.3% of these loans are secured by real estate in its service area. This concentration for the year ending December 31, 20062008 is presented below: | | | | | | | (in thousands of dollars) | | | | | | Secured by real estate: | | | | | | Construction/land development | | $ | 48,036 | | | Farmland | | | 7,953 | | | 1-4 family residences | | | 43,440 | | | Commercial/multi-family | | | 99,354 | |
4
Employees
| (in thousands of dollars) | | | | Secured by real estate: | | | | Construction/land development | $ | 49,269 | | Farmland | | 7,513 | | 1-4 family residences | | 58,278 | | Commercial/multi-family | | 129,012 |
Employees
As of December 31, 2006,2008, the Company employed 4954 full-time equivalent employees.
Website Access
We maintain a website where certain information about the Bank is posted. Through the website, our annual report on Form 10-K, quarterly reports on Form 10-Q, current reports on Form 8-K, and amendment to those reports, as well as Section 16 reports and amendments, are available as soon as reasonably practicable after such material is electronically filed with or furnished to the SEC. These reports are free of charge and can be accessed through the web address www.SonomaValleyBank.com by selecting the Investor Relations Tab- SEC Filings link. Further, certain corporate charters and policies are also posted on this site, and are similarly available without charge. Supervision and Regulation
The Company is a registered bank holding company under the Bank Holding Company Act, regulated, supervised and examined by the Federal Reserve Bank (“FRB”). As such, it must file with the FRB an annual report and additional reports as the Federal Reserve Board may require. The Company is also subject to periodic examination by the Federal Reserve Board.
In addition, both the Company and the Bank are extensively regulated under both federal and state laws and regulations. These laws and regulations are primarily intended to protect depositors, not shareholders. To the extent that the following information describes statutory or regulatory provisions, it is qualified in its entirety by reference to the particular statutory and regulatory provisions at issue.
As a California state-licensed bank, the Bank is subject to regulation, supervision and periodic examination by the California Department of Financial Institutions. The Bank is also subject to regulation, supervision, and periodic examination by the FDIC. The Bank is not a member of the Federal Reserve System, but is nevertheless subject to certain regulations of the Board of Governors of the Federal Reserve System. As a state bank, the Bank’sBank's deposits are insured by the FDIC to the maximum amount permitted by law, which is currently $100,000$250,000 per depositor in most cases. For this protection, the Bank pays a semi-annualquarterly assessment.
The regulations of these state and federal bank regulatory agencies govern most aspects of the Company’sCompany's and the Bank’sBank's business and operations, including but not limited to, requiring the maintenance of non interest-bearing reserves on deposits, limiting the nature and amount of investments and loans which may be made, regulating the issuance of securities, restricting the payment of dividends, regulating bank expansion and bank activities, including real estate development activities. The Federal Reserve Board, the FDIC, and the California Department of Financial Institutions have broad enforcement powers over depository institutions, including the power to prohibit a bank from engaging in business practices which are considered to be unsafe or unsound, to impose substantial fines and other civil and criminal penalties, to terminate deposit insurance, and to appoint a conservator or receiver under a variety of circumstances. The Federal Reserve Board also has broad enforcement powers over bank holding companies, including the power to impose substantial fines and other civil and criminal penalties.
Regulation of Bank Holding Companies
As a bank holding company, the Company’sCompany's activities are subject to extensive regulation by the Federal Reserve Board. The Bank Holding Company Act requires us to obtain the prior approval of the Federal Reserve Board before (i) directly or indirectly acquiring ownership or control of any voting shares of another bank or bank holding company if, after such acquisition, we would own or control more than 5% of the shares of the other bank or bank holding company (unless the acquiring company already owns or controls a majority of such shares); (ii) acquiring all or substantially all of the assets of another bank or bank holding company; or (iii) merging or consolidating with another bank holding company. The Federal Reserve Board will not approve any acquisition, merger or consolidation that would have a substantially anticompetitive result, unless the anticompetitive effects of the proposed transaction are clearly outweighed by a greater public interest in meeting the convenience and needs of the community to be served. The Federal Reserve Board also considers capital adequacy and other financial and managerial factors in its review of acquisitions and mergers. 5
With certain exceptions, the Bank Holding Company Act also prohibits us from acquiring or retaining direct or indirect ownership or control of more than 5% of the voting shares of any company that is not a bank or bank holding company, or from engaging directly or indirectly in activities other than those of banking, managing or controlling banks, or providing services for its subsidiaries. The principal exceptions to these prohibitions involve certain non-bank activities that, by statute or by Federal Reserve Board regulation or order, have been determined to be activities closely related to the business of banking or of managing or controlling banks.
Federal Deposit Insurance
The FDIC may terminate the deposit insurance of any insured depository institution if the FDIC determines that the institution has engaged or is engaging in unsafe or unsound practices, is in an unsafe or unsound condition to continue operations or has violated any applicable law, regulation, order or any condition imposed in writing by, or pursuant to written agreement with, the FDIC. The FDIC may also suspend deposit insurance temporarily during the hearing process for a permanent termination of insurance if the institution has no tangible capital.
Impact of Economic Conditions and Monetary Policies
The earnings and growth of the Bank are and will be affected by general economic conditions, both domestic and international, and by the monetary and fiscal policies of the United States Government and its agencies, particularly the FRB. One function of the FRB is to regulate the money supply and the national supply of bank credit in order to mitigate recessionary and inflationary pressures. Among the instruments of monetary policy used to implement these objects are open market transactions in United States Government securities, changes in the discount rate on member bank borrowings, and changes in reserve requirement held by depository institutions. The monetary policies of the FRB have had a significant effect on the operating results of commercial banks in the past and are expected to continue to do so in the future. However, the effect of such policies on the future business and earnings of the Bank cannot be accurately predicted. Recent and Proposed Legislation
From time to time, legislation is enacted which has the effect of increasing the cost of doing business, limiting or expanding permissible activities, or affecting the competitive balance between banks and other financial institutions. Proposals to change the laws and regulations governing the operations and taxation of banks and other financial institutions are frequently made in Congress, in the California legislature, and by various bank regulatory agencies. No prediction can be made as to the likelihood of any major changes or the impact such changes might have on the Bank. Certain changes of potential significance to the Bank which have been enacted recently or others which are currently under consideration by Congress or various regulatory or professional agencies are discussed below.Sarbanes-Oxley Act of 2002.2002
The Sarbanes-Oxley Act of 2002 (“Sarbanes-Oxley”) intended to address corporate and accounting fraud. Sarbanes-Oxley applies to publicly reporting companies. In addition to the establishment of a new accounting oversight board, which will enforce auditing, quality control and independence standards and will be funded by fees from all publicly traded companies, the bill restricts provision of both auditing and consulting services by accounting firms. To maintain auditor independence, any non-audit services being provided to an audit client requires pre-approval by the Company’s audit committee members. In addition, the audit partners must be rotated. Sarbanes-Oxley also requires the chief executive officer and the chief financial officer to certify to the accuracy of periodic reports filed with the SEC, subject to civil and criminal penalties if they knowingly or willfully violate this certification requirement. In addition, under Sarbanes-Oxley, legal counsel will be 6
required to report evidence of a material violation of the securities laws or a breach of fiduciary duty by a company to its chief executive officer or its chief legal officer, and, if such officer does not appropriately respond, to report such evidence to the audit committee or other similar committee of the board of directors or the board itself. Companies are required to adopt a Code of Ethics for their Financial Managers and any violators are subject to disciplinary action. Longer prison terms and increased penalties will also be applied to corporate executives who violate federal securities laws, the period during which certain types of suits can be brought against a company or its officers has been extended, and bonuses issued to top executives prior to restatement of a company’s financial statements are now subject to disgorgement if such restatement was due to corporate misconduct. Executives are also prohibited from insider trading during retirement plan “blackout” periods, and loans to company executives are restricted. Sarbanes-Oxley accelerates the time frame for disclosures by public companies, as they must immediately disclose any material changes in their financial condition or operations. Directors and executive officers must also provide information for most changes in ownership in a company’s securities within two business days of the change. Sarbanes-Oxley also prohibits any officer or director of a company or any other person acting under their direction from taking any action to fraudulently influence, coerce, manipulate or mislead any independent public or certified accountant engaged in the audit of the company’s financial statements for the purpose of rendering the financial statements materially misleading. In addition, Sarbanes-Oxley requires that each financial report required to be prepared in accordance with (or reconciled to) accounting principles generally accepted in the United States of America and filed with the SEC reflect all material correcting adjustments that are identified by a “registered public accounting firm” in accordance with accounting principles generally accepted in the United States of America and the rules and regulations of the SEC.
Section 404 of Sarbanes-Oxley requires the SEC to prescribe rules requiring the inclusion of an internal control report in each annual report. Accordingly, in the annual report for December 31, 2007,2008, management will be required to includehas included a report on the effectiveness of the Company’s internal controls. The Company’s independent auditors are required to attest to and report on management’s assessment of internal control. The Company’s management and staff are working diligently toward evaluating and documenting the internal control systems in order to allow management to report on, and the Company’s independent auditors to attest to, the Company’s internal control over financial reporting beginning the year ending December 31, 2008. The Company has retained the services of a consulting firm to assist management and staff with this process. Even so, thereThere can be no assurances that the evaluation required by Sarbanes-Oxley will not result in the identification of significant control deficiencies at some point or that the Company’s auditors will be able to attest to the effectiveness of our internal controls over financial reporting. The Company’s independent auditors are required to attest to and report on management’s assessment of internal control beginning the year ending December 31, 2009.
Regulation W.
The FRB on October 31, 2002 approved a final Regulation W that comprehensively implements sections 23A and 23B of the Federal Reserve Act. Sections 23A and 23B and Regulation W restrict loans by a depository institution to its affiliates, asset purchases by a depository institution from its affiliates, and other transactions between a depository institution and its affiliates. Regulation W unifies in one public document the FRB ’sFRB’s interpretations of sections 23A and 23B.
Regulatory Capital Treatment of Equity Investments.
In December of 2001 and January of 2002, the Office of the Comptroller of the Currency, the FRB and the FDIC adopted final rules governing the regulatory capital treatment of equity investments in non-financial companies held by banks, bank holding companies and financial holding companies. The new capital requirements apply symmetrically to equity investments made by banks and their holding companies in non-financial companies under the legal authorities specified in the final rules. Among others, these include the merchant banking authority granted by the Gramm-Leach-Bliley Act and the authority to invest in small business investment companies (“SBICs”) granted by the Small Business Investment Act. Covered equity investments will be subject to a series of marginal Tier 1 capital 7
charges, with the size of the charge increasing as the organization’s level of concentration in equity investments increases. The highest marginal charge specified in the final rules requires a 25 percent deduction from Tier 1 capital for covered investments that aggregate more than 25 percent of an organization’s Tier 1 capital. Equity investments through SBICs will be exempt from the new charges to the extent such investments, in the aggregate, do not exceed 15 percent of the banking organization’s Tier 1 capital. Grandfathered investments made by state banks under section 24(f) of the Federal Deposit Insurance Act also are exempted from coverage.
USA Patriot Act.
The terrorist attacks in September, 2001, have impacted the financial services industry and led to federal legislation that attempts to address certain issues involving financial institutions. On October 26, 2001, President Bush signed into law the Uniting and Strengthening America by Providing Appropriate Tools Required to Intercept and Obstruct Terrorism Act of 2001 (the “USA Patriot Act”).
Part of the USA Patriot Act is the International Money Laundering Abatement and Financial Anti-Terrorism Act of 2001 (“IMLA”). IMLA authorizes the Secretary of the Treasury, in consultation with the heads of other government agencies, to adopt special measures applicable to banks, bank holding companies, and/or other financial institutions. These measures may include enhanced recordkeeping and reporting requirements for certain financial transactions that are of primary money laundering concern, due diligence requirements concerning the beneficial ownership of certain types of accounts, and restrictions or prohibitions on certain types of accounts with foreign financial institutions. Among its other provisions, IMLA requires each financial institution to: (i) establish an anti-money laundering program; (ii) establish due diligence policies, procedures and controls with respect to its private banking accounts and correspondent banking accounts involving foreign individuals and certain foreign banks; and (iii) avoid establishing, maintaining, administering, or managing correspondent accounts in the United States for, or on behalf of, a foreign bank that does not have a physical presence in any country. In addition, IMLA contains a provision encouraging cooperation among financial institutions, regulatory authorities and law enforcement authorities with respect to individuals, entities and organizations engaged in, or reasonably suspected of engaging in, terrorist acts or money laundering activities. IMLA expands the circumstances under which funds in a bank account may be forfeited and requires covered financial institutions to respond under certain circumstances to requests for information from federal banking agencies within 120 hours. IMLA also amends the Bank Holding Company Act and the Bank Merger Act to require the federal banking agencies to consider the effectiveness of a financial institution’s anti-money laundering activities when reviewing an application under these acts. Merchant Banking Investments.
The FRB and the Secretary of the Treasury in January 2001 jointly adopted a final rule governing merchant banking investments made by financial holding companies. The rule implements provisions of the Gramm-Leach-Bliley Act discussed below that permit financial holding companies to make investments as part of a bona fide securities underwriting or merchant or investment banking activity. The rule provides that a financial holding company may not, without FRB approval, directly or indirectly acquire any additional shares, assets or ownership interests or make any additional capital contribution to any company the shares, assets or ownership interests of which are held by the financial holding company subject to the rule if the aggregate carrying value of all merchant banking investments held by the financial holding company exceeds:
| § | | 30% of the Tier 1 capital of the financial holding company, or |
| | § | | after excluding interests in private equity funds, 20% of the Tier 1 capital of the financial holding company. |
8
A separate final rule will establish the capital charge of merchant banking investments for the financial holding company.
Financial Services Modernization Act of 1999.
The Financial Services Modernization Act of 1999 (also known as the “Gramm-Leach-Bliley Act” after its Congressional sponsors) substantially eliminates most of the separations between banks, brokerage firms, and insurers enacted by the Glass-Steagall Act of 1933. The reform legislation permits securities firms and insurers to buy banks, and banks to underwrite insurance and securities. States retain regulatory authority over insurers. The Treasury Department’s Office of the Comptroller of the Currency has authority to regulate bank subsidiaries that underwrite securities and the Federal Reserve has authority over bank affiliates for activities such as insurance underwriting and real-estate development.
The U.S. federal bank regulatory agencies’ risk-based capital guidelines are based upon the 1988 capital accord of the Basel Committee on Banking Supervision (the “Basel Committee”). The Basel Committee is a committee of central banks and bank supervisors from the major industrialized countries that develops broad policy guidelines that each country’s supervisors can use to determine the supervisory policies they apply. In January 2001, the Basel Committee on Banking Supervision issued a proposal for a “New"New Capital Accord”Accord". The New Capital Accord incorporates a three-part framework of minimum capital requirements, supervisory review of an institution’sinstitution's capital adequacy and internal assessment process, and market discipline through effective disclosure to encourage safe and sound banking practices. To remain a financial holding company, a company must remain “well capitalized” and “well managed”. “Well managed” means that at their most recent examination the bank received a satisfactory composite rating and at least a satisfactory rating for management. The federal banking agencies are required to take “prompt"prompt corrective action”action" in respect of depository institutions and their bank holding companies that do not meet minimum capital requirements. FDIC established five capital tiers: “well capitalized”"well capitalized", “adequately capitalized”"adequately capitalized", “undercapitalized”"undercapitalized", “significantly undercapitalized”"significantly undercapitalized" and “critically undercapitalized”"critically undercapitalized". A depository institution’sinstitution's capital tier, or that of its bank holding company, depends upon where its capital levels are in relation to various relevant capital measures, including a risk-based capital measure and a leverage ratio capital measure, and certain other factors. As of December 31, 2005,2008, the Company and Bank are “well capitalized” and “well managed”. Under the regulations adopted by the federal banking agencies, a bank holding company is “well capitalized”"well capitalized" if it has (i) a total risk-based capital ratio of 10% or greater, (ii) a Tier 1 risk-based capital ratio of 6% or greater, (iii) a leverage ratio of 5% or greater and (iv) is not subject to any written agreement, order or directive to meet and maintain a specific capital level for any capital measure. An “adequately capitalized”"adequately capitalized" depository institution is defined as one that has (i) a total risk-based capital ratio of 8% or greater, (ii) a Tier 1 risk-based capital ratio of 4% or greater and (iii) a leverage ratio of 4% or greater (or 3% or greater in the case of a bank rated a composite 1 under the Uniform Financial Institution Rating System, “CAMELS rating”, established by the Federal Financial Institution Examinations Council). A company is considered (i) “undercapitalized”"undercapitalized" if it has (A) a total risk-based capital ratio of less than 8%, (B) a Tier 1 risk-based capital ratio of less than 4% or (C) a leverage ratio of less than 4% (or 3% in the case of an institution with a CAMELS rating of 1), (ii) “significantly undercapitalized”"significantly undercapitalized" if it has (A) a total risk-based capital ratio of less than 6%, or (B) a Tier 1 risk-based capital ratio of less than 3% or (C) a leverage ratio of less than 3% and (iii) “critically undercapitalized”"critically undercapitalized" if it has a ratio of tangible equity to total assets equal to or less than 2%. An institution may be deemed by the regulators to be in a capitalization category that is lower than is indicated by its actual capital position if, among other things, it receives an unsatisfactory examination rating. 9
Recent and Proposed Legislation
From time to time, legislation is enacted which has the effect of increasing the cost of doing business, limiting or expanding permissible activities, or affecting the competitive balance between banks and other financial institutions. Proposals to change the laws and regulations governing the operations and taxation of banks and other financial institutions are frequently made in Congress, in the California legislature, and by various bank regulatory agencies. No prediction can be made as to the likelihood of any major changes or the impact such changes might have on the Bank. Certain changes of potential significance to the Bank which have been enacted recently or others which are currently under consideration by Congress or various regulatory or professional agencies are discussed below.
Emergency Economic Stabilization Act of 2008. In response to global credit and liquidity issues involving a number of financial institutions, the United States government, particularly the United States Department of the Treasury (the "Treasury") and the FDIC, have taken a variety of extraordinary measures designed to restore confidence in the financial markets and to strengthen financial institutions, including capital injections, guarantees of bank liabilities and the acquisition of illiquid assets from banks. On October 3, 2008, the Emergency Economic Stabilization Act of 2008 (the "EESA") was signed into law. Pursuant to the EESA, the U.S. Treasury was granted the authority to take a range of actions for the purpose of stabilizing and providing liquidity to the U.S. financial markets and has proposed several programs, including the purchase by the U.S. Treasury of certain troubled assets from financial institutions (the "Troubled Asset Relief Program") and the direct purchase by the U.S. Treasury of equity of healthy financial institutions (the "Capital Purchase Program").
On February 20, 2009, the Company, entered into a Letter Agreement, including a Securities Purchase Agreement - Standard Terms incorporated therein (collectively, the "Agreement"), with the Treasury pursuant to the Capital Purchase Program. Under the terms of the Agreement, the Company issued to the Treasury, on February 20, 2009, 8,653 shares of senior preferred stock (“Series A Preferred Stock”) and a warrant (the "Warrant") to acquire up to 433.00433 shares of a separate series of senior preferred stock (“Series B Preferred Stock”) for an aggregate purchase price of $8,653,000. Pursuant to the terms of the Warrant, the Treasury exercised the Warrant on February 20, 2009 and paid the exercise price by having the Company withhold, from the shares of Series B Preferred Stock that would otherwise be delivered to the Treasury upon such exercise, shares of Series B Preferred Stock issuable upon exercise of the Warrant with an aggregate liquidation amount equal in value to the aggregate exercise price of $4.33.
The Series A Preferred Stock pays cumulative dividends at a rate of 5% per year for the first five years and at a rate of 9% per year thereafter, but will be paid only if, as and when declared by the Company's board of directors. The Series A Preferred Stock has no maturity date and ranks senior to the Common Stock with respect to the payment of dividends and distributions and amounts payable upon liquidation, dissolution and winding up of the Company. The Series A Preferred Stock is generally non-voting, other than class voting on certain matters that could adversely affect the Series A Preferred Stock. The Series B Preferred Stock has the same rights, preferences, privileges, and voting rights as the Series A Preferred Stock, except that the Series B Preferred Stock will pay dividends immediately at the rate of 9% per year and may not be redeemed until all the Series A Preferred Stock has been redeemed. The Agreement contains limitations on certain actions of the Company, including, but not limited to, payment of dividends, redemptions and acquisitions of Company equity securities. In addition, the terms Agreement subject the Company to certain executive compensation limitations as set forth in the EESA. American Recovery and Reinvestment Act of 2009. On February 17, 2009, the American Recovery and Reinvestment Act of 2009 (the "ARRA") was signed into law. Section 7001 of the ARRA amended Section 111 of the EESA in its entirety. While the Treasury must promulgate regulations to implement the restrictions and standards set forth in Section 7001, the ARRA, among other things, significantly expands the executive compensation restrictions previously imposed by the EESA. Such restrictions apply to any entity that has received or will receive financial assistance under the Troubled Asset Recovery Program, and shall generally continue to apply for as long as any obligation arising from financial assistance provided under TARP, including preferred stock issued under the Capital Purchase Program, remains outstanding. These ARRA restrictions shall not apply to any Troubled Asset Recovery Program recipient during such time when the federal government (i) only holds any warrants to purchase common stock of such recipient or (ii) holds no preferred stock or warrants to purchase common stock of such recipient. As a result of our participation in the Capital Purchase Program, the restrictions and standards set forth in Section 7001 of the ARRA shall be applicable to the Company, subject to regulations promulgated by the Treasury. Pursuant to Section 7001(g) of the ARRA, the Company shall be permitted to repay the capital it received under the Capital Purchase Program, subject to consultation with the Federal Reserve, without regard to certain repayment restrictions in the Agreement.
Accounting Pronouncements Fair Value Measurement
Business Combinations
In September 2006December 2007, the FASB issued SFAS No. 141, revised, Business Combinations. This Statement established principles and requirements for how the acquirer recognizes and measures in its financial statements the identifiable assets acquired, the liabilities assumed, and any noncontrolling interest, recognizes and measures goodwill acquired in a business combination, and discloses the nature and financial effects of the business combination. This Statement applies prospectively to business combinations for which the acquisition date is on or after December 15, 2008.
Noncontrolling Interest in Consolidated Financial Accounting Standards Number 157(“FAS 157”),Fair Value Measurements.FAS 157Statements
In December 2007, the FASB issued SFAS No. 160, Noncontrolling Interests in Consolidated Financial Statements—an Amendment of ARB No. 51. This Statement establishes accounting and reporting standards for a formal framework for measuring fair value under generally accepted accounting principles. It (1) codifiesminority interest in the many definitionsparent company financial statements and requires separate identification of fair value included among various other authoritative literature, (2) clarifiesequity and net income in some instances, expands on the guidance for implementing fair value measurements, and (3) increases the level of disclosure required for fair value measurements. FAS 157 does not, of itself, require any new fair value measurements, nor does it establish valuation standards. FAS 157consolidated financial statements. This Statement is effective for fiscal years, and interim periods within those fiscal years, beginning on or after December 15, 2008.
Share Based Payments as Participating Securities
In June 2008, the Financial Accounting Standard Board (FASB) issued Staff Position No. EITF 03-6-1 that addresses whether instruments granted in share-based payment transactions are participation securities prior to vesting and, therefore need to be included in the earnings allocation in computing earnings per share. This Staff Position is effective for financial statements issued for the fiscal years beginning after NovemberDecember 15, 2007.2008. 10
Statistical Data
The following information is required by Industry Guide 3, “Statistical"Statistical Disclosure by Bank Holding Companies”Companies". The averages shown have been calculated using the average daily balance.
| | | | | Sequential Page | | | | | | Number | | I. | | Distribution of Assets, Liabilities and Shareholder’s | | | | | | | Sequential Page | | | Number | I. Distribution of Assets, Liabilities and Share- holders’ Equity; Interest Rates and Differential | | | | | | | | | | | | | A. Average balance sheets | | 30 | 35 | | | B. Analysis of net interest earnings | | 30 | 35 | | | C. Rate/volume analysis | | 31 | 36 | | | | | | | | II. | | Investment Portfolio | | | | | | | | | | | | | A. Book value (Amortized Cost) of investments | | 58 | 66 | | | B. Weighted average yield and maturity | | 30, 34, 42 | 35,41,48 and 6067 | | | C. Securities of issuer exceeding ten percent of equity | | | None | | | | | | | | | III. | | Loan Portfolio | | | | | | | | | | | | | A. Types of loans | | 30 | 35 and 6169 | | | B. Maturities and sensitivities of loans to change in interest rates | | 42 | 48 and 6270 | | | C. Risk elements | | | | | | | | | 1. Non-accrual, past due, and restructured loans | | 36 | 42 and 61 | 2. Potential problem loans | | None | 3. Foreign outstandings | | None | 4. Loan concentrations | | 35 and 6170 | | | | | D. Other Interest-Bearing Assets2. Potential problem loans | | | None | | | | | 3. Foreign outstandings | | | None | | | | 4. Loan concentrations | | | 41 and 85 | | | | | | | | | D. Other Interest-Bearing Assets | | | None | | | | | | | | IV. | | Summary of Loan Loss Experience | | 36 | 42 and 6270 | | | | | | | | V. | | Deposits | | | | | | | | | | | | | A. Average balances and average rates paid | | 30 | 35 | | | B. Other categories of deposits | | | None | | | C. Foreign outstandings | | | None | | | D. Maturity of time deposits greater than $100,000 | | 42 | 48 | | | E. Maturity of foreign time deposits greater than $100,000 | | | None | | | | | | | | | VI. | | Return on Equity and Assets | | 26 | 29 and 32 | | | | | | | VII. Short-term Borrowings: | | 63Short-term Borrowings | | | 72 | | | | | | |
11
ITEM 1A. RISK FACTORS.
An investment in the Company’s common stock is subject to risks inherent to the Company’s business. The material risks and uncertainties that management believes affect the Company are described below. Before making an investment decision, you should carefully consider the risks and uncertainties described below together with all of the other information included or incorporated by reference in this report. The risks and uncertainties described below are not the only ones facing the Company. Additional risks and uncertainties that management is not aware of or focused on or that management currently deems immaterial may also impair the Company’s business operations. This report is qualified in its entirety by these risk factors. If any of the following risks actually occur, the Company’s financial condition and results of operations could be materially and adversely affected. If this were to happen, the value of the Company’s common stock could decline significantly, and you could lose all or part of your investment. Risks Related to the Company’s Business The Company is Subject to Interest Rate Risk The Company’s earnings and cash flows are largely dependent upon its net interest income. Net interest income is the difference between interest income earned on interest-earning assets such as loans and securities and interest expense paid on interest-bearing liabilities such as deposits and borrowed funds. Interest rates are highly sensitive to many factors that are beyond the Company’s control, including general economic conditions and policies of various governmental and regulatory agencies and, in particular, the Board of Governors of the Federal Reserve System. Changes in monetary policy, including changes in interest rates, could influence not only the interest the Company receives on loans and securities and the amount of interest it pays on deposits and borrowings, but such changes could also affect (i) the Company’s ability to originate loans and obtain deposits, (ii) the fair value of the Company’s financial assets and liabilities, and (iii) the average duration of the Company’s mortgage-backed securities portfolio. If the interest rates paid on deposits and other borrowings increase at a faster rate than the interest rates received on loans and other investments, the Company’s net interest income, and therefore earnings, could be adversely affected. Earnings could also be adversely affected if the interest rates received on loans and other investments fall more quickly than the interest rates paid on deposits and other borrowings. Although management believes it has implemented effective asset and liability management strategies to reduce the potential effects of changes in interest rates on the Company’s results of operations, any substantial, unexpected, prolonged change in market interest rates could have a material adverse effect on the Company’s financial condition and results of operations. See Management’s Discussion and Analysis of Financial Condition and Results of Operations located elsewhere in this report for further discussion related to the Company’s management of interest rate risk. The Company is Subject to Lending Risk There are inherent risks associated with the Company’s lending activities. These risks include, among other things, the impact of changes in interest rates and changes in the economic conditions in the markets where the Company operates as well as those across the State of California and the United States. Increases in interest rates and/or weakening economic conditions could adversely impact the ability of borrowers to repay outstanding loans or the value of the collateral securing these loans. The Company is also subject to various laws and regulations that affect its lending activities. Failure to comply with applicable laws and regulations could subject the Company to regulatory enforcement action that could result in the assessment of significant civil money penalties against the Company. 12
As of December 31, 2006,2008, approximately 90.5%91.3% of the Company’s loan portfolio is directly or indirectly secured by real property. Because the Company’s loan portfolio contains a significant number of construction, commercial and residential real estate loans, the deterioration of one or a few of these loans could cause a significant increase in non-performing loans. An increase in non-performing loans could result in a net loss of earnings from these loans, an increase in the provision for possible loan losses and an increase in loan charge-offs, all of which could have a material adverse effect on the Company’s financial condition and results of operations. See Management’s Discussion and Analysis of Financial Condition and Results of Operations located elsewhere in this report for further discussion related to commercial and industrial, construction and commercial real estate loans. The Company’s Allowance for Possible Loan Losses may be Insufficient The Company maintains an allowance for possible loan losses, which is a reserve established through a provision for possible loan losses charged to expense, that represents management’s best estimate of probable losses that have been incurred within the existing portfolio of loans. The allowance, in the judgment of management, is necessary to reserve for estimated loan losses and risks inherent in the loan portfolio. The level of the allowance reflects management’s continuing evaluation of industry concentrations; specific credit risks; loan loss experience; current loan portfolio quality; present economic, political and regulatory conditions and unidentified losses inherent in the current loan portfolio. The determination of the appropriate level of the allowance for possible loan losses inherently involves a high degree of subjectivity and requires the Company to make significant estimates of current credit risks and future trends, all of which may undergo material changes. Changes in economic conditions affecting borrowers, new information regarding existing loans, identification of additional problem loans and other factors, both within and outside of the Company’s control, may require an increase in the allowance for possible loan losses. In addition, bank regulatory agencies periodically review the Company’s allowance for loan losses and may require an increase in the provision for possible loan losses or the recognition of further loan charge-offs, based on judgments different than those of management. In addition, if charge-offs in future periods exceed the allowance for possible loan losses; the Company will need additional provisions to increase the allowance for possible loan losses. Any increases in the allowance for possible loan losses will result in a decrease in net income and, possibly, capital, and may have a material adverse effect on the Company’s financial condition and results of operations. See Management’s Discussion and Analysis of Financial Condition and Results of Operations located elsewhere in this report for further discussion related to the Company’s process for determining the appropriate level of the allowance for possible loan losses. The Company is Subject to Environmental Liability Risk Associated with Lending Activities A significant portion of the Company’s loan portfolio is secured by real property. During the ordinary course of business, the Company may foreclose on and take title to properties securing certain loans. In doing so, there is a risk that hazardous or toxic substances could be found on these properties. If hazardous or toxic substances are found, the Company may be liable for remediation costs, as well as for personal injury and property damage. Environmental laws may require the Company to incur substantial expenses and may materially reduce the affected property’s value or limit the Company’s ability to use or sell the affected property. In addition, future laws or more stringent interpretations or enforcement policies with respect to existing laws may increase the Company’s exposure to environmental liability. Although the Company has policies and procedures to perform an environmental review before initiating any foreclosure action on real property, these reviews may not be sufficient to detect all potential environmental hazards. The remediation costs and any other financial liabilities associated with an environmental hazard could have a material adverse effect on the Company’s financial condition and results of operations. 13
The Company’s Profitability Depends Significantly on Economic Conditions in the State of California The Company’s success depends primarily on the general economic conditions of the State of California and the specific local markets in which the Company operates. Unlike larger national or other regional banks that are more geographically diversified, the Company provides banking and financial services to customers primarily in Sonoma and its immediate surrounding towns (the “Sonoma Valley”). The local economic conditions in these areas have a significant impact on the demand for the Company’s products and services as well as the ability of the Company’s customers to repay loans, the value of the collateral securing loans and the stability of the Company’s deposit funding sources. A significant decline in general economic conditions, caused by inflation, recession, acts of terrorism, outbreak of hostilities or other international or domestic occurrences, unemployment, changes in securities markets or other factors could impact these local economic conditions and, in turn, have a material adverse effect on the Company’s financial condition and results of operations. The Company Operates in a Highly Competitive Industry and Market Area The Company faces substantial competition in all areas of its operations from a variety of different competitors, many of which are larger and may have more financial resources. Such competitors primarily include national, regional, and community banks within the various markets the Company operates. Additionally, various out-of-state banks have begun to enter or have announced plans to enter the market areas in which the Company currently operates. The Company also faces competition from many other types of financial institutions, including, without limitation, savings and loans, credit unions, finance companies, brokerage firms, insurance companies, factoring companies and other financial intermediaries. The financial services industry could become even more competitive as a result of legislative, regulatory and technological changes and continued consolidation. Banks, securities firms and insurance companies can merge under the umbrella of a financial holding company, which can offer virtually any type of financial service, including banking, securities underwriting, insurance (both agency and underwriting) and merchant banking. Also, technology has lowered barriers to entry and made it possible for non-banks to offer products and services traditionally provided by banks, such as automatic transfer and automatic payment systems. Many of the Company’s competitors have fewer regulatory constraints and may have lower cost structures. Additionally, due to their size, many competitors may be able to achieve economies of scale and, as a result, may offer a broader range of products and services as well as better pricing for those products and services than the Company can. The Company’s ability to compete successfully depends on a number of factors, including, among other things: | § | | The ability to develop, maintain and build upon long-term customer relationships based on top quality service, high ethical standards and safe, sound assets. |
| | § | | The ability to expand the Company’s market position. |
| | § | | The scope, relevance and pricing of products and services offered to meet customer needs and demands. |
| | § | | The rate at which the Company introduces new products and services relative to its competitors. |
| | § | | Customer satisfaction with the Company’s level of service. |
| | § | | Industry and general economic trends. |
Failure to perform in any of these areas could significantly weaken the Company’s competitive position, which could adversely affect the Company’s growth and profitability, which, in turn, could have a material adverse effect on the Company’s financial condition and results of operations. 14
The Company is Subject to Extensive Government Regulation and Supervision The Company, through its subsidiary Sonoma Valley Bank, is subject to extensive federal and state regulation and supervision. Banking regulations are primarily intended to protect depositors’ funds, federal deposit insurance funds and the banking system as a whole, not shareholders. These regulations affect the Company’s lending practices, capital structure, investment practices, dividend policy and growth, among other things. Congress and federal regulatory agencies continually review banking laws, regulations and policies for possible changes. Changes to statutes, regulations or regulatory policies, including changes in interpretation or implementation of statutes, regulations or policies, could affect the Company in substantial and unpredictable ways. Such changes could subject the Company to additional costs, limit the types of financial services and products the Company may offer and/or increase the ability of non-banks to offer competing financial services and products, among other things. Failure to comply with laws, regulations or policies could result in sanctions by regulatory agencies, civil money penalties and/or reputation damage, which could have a material adverse effect on the Company’s business, financial condition and results of operations. While the Company has policies and procedures designed to prevent any such violations, there can be no assurance that such violations will not occur. See the section captioned “Supervision and Regulation” in Item 1. The Congressional and regulatory response to the current economic and credit crisis could have an adverse effect on our business. Federal and state legislators and regulators are expected to pursue increased regulation of how banks are operated and how loans are originated, purchased, and sold as a result of the current economic and credit crisis. Changes in the lending market and secondary markets for loans and related congressional and regulatory responses may impact how the Bank makes and underwrites loans and otherwise conducts its business. We are unable to predict whether any legislative or regulatory initiatives or actions will be implemented, what form they will take, whether they will be directed at the Bank, or whether such initiatives or actions, once they are initiated or taken, will thereafter continue to change. Any such actions could affect us in substantial and unpredictable ways and could have an adverse effect on our business, financial condition and results of operations. The Company’s Controls and Procedures may Fail or be Circumvented Management regularly reviews and updates the Company’s internal controls, disclosure controls and procedures, and corporate governance policies and procedures. Any system of controls, however well designed and operated, is based in part on certain assumptions and can provide only reasonable, not absolute, assurances that the objectives of the system are met. Any failure or circumvention of the Company’s controls and procedures or failure to comply with regulations related to controls and procedures could have a material adverse effect on the Company’s business, results of operations and financial condition. New Lines of Business or new Products and Services may Subject the Company to Additional Risks From time to time, the Company may implement new lines of business or offer new products and services within existing lines of business. There are substantial risks and uncertainties associated with these efforts, particularly in instances where the markets are not fully developed. In developing and marketing new lines of business and/or new products and services the Company may invest significant time and resources. Initial timetables for the introduction and development of new lines of business and/or new products or services may not be achieved and price and profitability targets may not prove feasible. External factors, such as compliance with regulations, competitive alternatives, and shifting market preferences, may also impact the successful implementation of a new line of business or a new product or service. Furthermore, any new line of business and/or new product or service could have a significant impact on the effectiveness of the Company’s system of internal controls. Failure to successfully manage these risks in the development and implementation of new lines of business or new products or services could have a material adverse effect on the Company’s business, results of operations and financial condition. The Company may not be able to Attract and Retain Skilled People The Company’s success depends, in large part, on its ability to attract and retain key people. Competition for the best people in most activities engaged in by the Company can be intense and the Company may not be able to hire people or to retain them. The unexpected loss of services of one or more of the Company’s key personnel could have a material adverse impact on the Company’s business because of their skills, knowledge of the Company’s market, years of industry experience and the difficulty of promptly finding qualified replacement personnel. 15
The Company’s Information Systems may Experience an Interruption or Breach in Security The Company relies heavily on communications and information systems to conduct its business. Any failure, interruption or breach in security of these systems could result in failures or disruptions in the Company’s customer relationship management, general ledger, deposit, loan and other systems. While the Company has policies and procedures designed to prevent or limit the effect of the failure, interruption or security breach of its information systems, there can be no assurance that any such failures, interruptions or security breaches will not occur or, if they do occur, that they will be adequately addressed. The occurrence of any failures, interruptions or security breaches of the Company’s information systems could damage the Company’s reputation, result in a loss of customer business, subject the Company to additional regulatory scrutiny, or expose the Company to civil litigation and possible financial liability, any of which could have a material adverse effect on the Company’s financial condition and results of operations. The Company Continually Encounters Technological Change The financial services industry is continually undergoing rapid technological change with frequent introductions of new technology-driven products and services. The effective use of technology increases efficiency and enables financial institutions to better serve customers and to reduce costs. The Company’s future success depends, in part, upon its ability to address the needs of its customers by using technology to provide products and services that will satisfy customer demands, as well as to create additional efficiencies in the Company’s operations. Many of the Company’s competitors have substantially greater resources to invest in technological improvements. The Company may not be able to effectively implement new technology-driven products and services or be successful in marketing these products and services to its customers. Failure to successfully keep pace with technological change affecting the financial services industry could have a material adverse impact on the Company’s business and, in turn, the Company’s financial condition and results of operations. The Company is Subject to Claims and Litigation Pertaining to Fiduciary Responsibility From time to time, customers make claims and take legal action pertaining to the Company’s performance of its fiduciary responsibilities. Whether customer claims and legal action related to the Company’s performance of its fiduciary responsibilities are founded or unfounded, if such claims and legal actions are not resolved in a manner favorable to the Company they may result in significant financial liability and/or adversely affect the market perception of the Company and its products and services as well as impact customer demand for those products and services. Any financial liability or reputation damage could have a material adverse effect on the Company’s business, which, in turn, could have a material adverse effect on the Company’s financial condition and results of operations. Severe Weather, Natural Disasters, Acts of War or Terrorism and Other External Events Could Significantly Impact the Company’s Business Severe weather, natural disasters, acts of war or terrorism and other adverse external events could have a significant impact on the Company’s ability to conduct business. Such events could affect the stability of the Company’s deposit base, impair the ability of borrowers to repay outstanding loans, impair the value of collateral securing loans, cause significant property damage, result in loss of revenue and/or cause the Company to incur additional expenses. Although management has established disaster recovery policies and procedures, the occurrence of any such event could have a material adverse effect on the Company’s business, which, in turn, could have a material adverse effect on the Company’s financial condition and results of operations. 16
Risks Associated with the Company’s Common Stock The Company’s Stock Price can be Volatile Stock price volatility may make it more difficult for you to resell your common stock when you want and at prices you find attractive. The Company’s stock price can fluctuate significantly in response to a variety of factors including, among other things: | § | | Actual or anticipated variations in quarterly results of operations. |
| | § | | Recommendations by securities analysts. |
| | § | | Operating and stock price performance of other companies that investors deem comparable to the Company. |
| | § | | News reports relating to trends, concerns and other issues in the financial services industry. |
| | § | | Perceptions in the marketplace regarding the Company and/or its competitors. |
| | § | | New technology used, or services offered, by competitors. |
| | § | | Significant acquisitions or business combinations, strategic partnerships, joint ventures or capital commitments by or involving the Company or its competitors. |
| | § | | Failure to integrate acquisitions or realize anticipated benefits from acquisitions. |
| | § | | Changes in government regulations. |
| | § | | Geopolitical conditions such as acts or threats of terrorism or military conflicts. |
| § | Regional disasters, such as wild fires, earthquakes, and floods that may impact the Sonoma County region, and specifically our customers businesses, including agriculture and tourism. |
| § | Economic conditions in the financial industry, including further contractions on liquidity of financial institutions, Federal policies on interest rates and lending practices, and deterioration in other regional factors such as housing and commercial property defaults. |
General market fluctuations, industry factors and general economic and political conditions and events, such as economic slowdowns or recessions, interest rate changes or credit loss trends, could also cause the Company’s stock price to decrease regardless of operating results.
The Trading Volume in the Company’s Common Stock is Less than that of Other Larger Financial Services Companies Although the Company’s common stock is listed for trading on the OTC Bulletin Board, the trading volume in its common stock is less than that of other larger financial services companies. A public trading market having the desired characteristics of depth, liquidity and orderliness depends on the presence in the marketplace of willing buyers and sellers of the Company’s common stock at any given time. This presence depends on the individual decisions of investors and general economic and market conditions over which the Company has no control. Given the lower trading volume of the Company’s common stock, significant sales of the Company’s common stock, or the expectation of these sales, could cause the Company’s stock price to fall. An Investment in the Company’s Common Stock is not an Insured Deposit The Company’s common stock is not a bank deposit and, therefore, is not insured against loss by the FDIC, any other deposit insurance fund or by any other public or private entity. Investment in the Company’s common stock is inherently risky for the reasons described in this “Risk Factors” section and elsewhere in this report and is subject to the same market forces that affect the price of common stock in any company. As a result, if you acquire the Company’s common stock, you may lose some or all of your investment. 17
Risks Associated with the Company’s Industry The Earnings of Financial Services Companies are Significantly Affected by General Business and Economic Conditions The Company’s operations and profitability are impacted by general business and economic conditions in the United States and abroad. These conditions include short-term and long-term interest rates, inflation, money supply, political issues, legislative and regulatory changes, fluctuations in both debt and equity capital markets, broad trends in industry and finance, and the strength of the U.S. economy and the local economies in which the Company operates, all of which are beyond the Company’s control. A deterioration in economic conditions could result in an increase in loan delinquencies and non-performing assets, decreases in loan collateral values and a decrease in demand for the Company’s products and services, among other things, any of which could have a material adverse impact on the Company’s financial condition and results of operations. Financial Services Companies Depend on the Accuracy and Completeness of Information About Customers and Counterparties In deciding whether to extend credit or enter into other transactions, the Company may rely on information furnished by or on behalf of customers and counterparties, including financial statements, credit reports and other financial information. The Company may also rely on representations of those customers, counterparties or other third parties, such as independent auditors, as to the accuracy and completeness of that information. Reliance on inaccurate or misleading financial statements, credit reports or other financial information could have a material adverse impact on the Company’s business and, in turn, the Company’s financial condition and results of operations. Consumers may Decide not to use Banks to Complete Their Financial Transactions Technology and other changes are allowing parties to complete financial transactions that historically have involved banks through alternative methods. For example, consumers can now maintain funds that would have historically been held as bank deposits in brokerage accounts or mutual funds. Consumers can also complete transactions such as paying bills and/or transferring funds directly without the assistance of banks. The process of eliminating banks as intermediaries, known as “disintermediation,” could result in the loss of fee income, as well as the loss of customer deposits and the related income generated from those deposits. The loss of these revenue streams and the lower cost deposits as a source of funds could have a material adverse effect on the Company’s financial condition and results of operations. ITEM 1B. UNRESOLVED STAFF COMMENTS.
None. ITEM 2. PROPERTIES The Company is headquartered in Sonoma, California. At the present time the Company’s Bank has three branch offices. The Sonoma Branch is located at 202 W. Napa Street, Sonoma. The building contains approximately 6800 square feet and has been subleased on a long-term basis (the initial term expires in 2009, with option to extend for two additional five-year terms). The office is considered by management to be well maintained and adequate for the purpose intended. Lease payments made in 20062008 totaled $253,071$273,721 compared to the $243,337$263,194 paid in 2005.2007. The lease provides for future annual rents to be adjusted for changes in the Consumer Price Index (“CPI”("CPI"), with a minimum annual increase of 4%, effective each March 1st. 18
The Glen Ellen Branch is located at 13751 Arnold Drive, Glen Ellen. The facility is 525 square feet. The facility is leased for a five year term expiring in 20082013 with the option to extend for twoone additional five year terms.term. Lease payments made in 20062008 totaled $14,705$15,560 compared to $14,140$15,294 in 2005.2007. The lease provides for future annual rents to be adjusted for changes in the CPI, with a minimum annual increase of 4% effective April 1st of each year. The Banco de Sonoma Branch, which opened in March 2004, is located at 18615 Sonoma Hwy, Suite 108, Boyes Hot Springs, California. The facility is 1200 square feet. The facility is leased for a five year term expiring in 2009 with options to extend for two additional five year terms. Lease payments in 20062008 totaled $20,031$20,442 compared to $19,704$22,125 in 2005.2007. The reduction in lease expense for 2008 was due to a credit adjustment for CAM charges for prior years. The lease provides for future annual rents to be adjusted for changes in the CPI effective February 1st of each year. In July 1995, the Bank entered into a lease for the building located at 463 Second Street West (the “Operations Center”). The building contains approximately 2400 square feet and has been leased on a long term basis to coincide with the Sonoma Branch lease. The initial term and the first option expired in 2000 and 2005, respectively. The lease provides for an additional option to extend for two additional five year terms and one additional four year term. Lease payments made in 20062008 totaled $41,268$46,113 compared with the $39,199$44,578 paid in 2005.2007. The lease provides for future annual rents to be adjusted for changes in the CPI effective each July 1st. In September 1997, the Bank purchased the building and land at 472 Second St. West. The building contains approximately 1013 square feet. The Bank paid $246,943 for the property. At present the Bank is utilizing the parking area for additional parking for Bank employees and until February 2005,employees. In September 2007 the Bank had beenbegan renting out the building premises. At the present time, the Bank is currently evaluating how to utilize the additional space to accommodate additional growth or generate additional income. Rental income in 2005for 2008 was $1,519.$15,000 and for 2007 was $5,000. In March 2005, the Bank entered into a lease for the building located at 453 Second Street West (the “Finance Center”). The building contains approximately 1200 square feet. The facility is leased for a five year term expiring in February 2010 with the option to renew for two additional five year terms. Lease payments paid in 20062008 totaled $20,972$22,404 compared with the $16,000$21,451 paid in 2005.2007. The lease provides for future annual rents to be adjusted for changes in the CPI effective March 15th of each year. ITEM 3. LEGAL PROCEEDINGS
In the normal course of operations, the Company and/or its Bank may have disagreements or disputes with vendors, borrowers, or employees, which may or may not result in litigation. These disputes are seen by the Company’s management as a normal part of business. There are no pending actions reported and no threatened actions that management believes would have a significant material impact on the Company’s financial position, results of operations or cash flows. ITEM 4. SUBMISSION OF MATTERS TO A VOTE OF SECURITY HOLDERS
The Company did not submit any matters to security holders during the fourth quarter of its last fiscal year ended December 31, 2006.2008. 19
PART II ITEM 5. MARKET FOR THE COMPANY’SCOMPANY'S COMMON STOCK AND RELATED SECURITY HOLDER MATTERS AND ISSUER PURCHASES OF EQUITY SECURITIES
The Company’s common stock is quoted on the OTC Bulletin Board under the symbol “SBNK”"SBNK". The Company is not listed on any exchange or on the National Association of Securities Dealers Automated Quotation System (“NASDAQ”).
Several brokers act as facilitators in the trades of the Company’s stock. They are: | Wachovia | | | A.G.Edwards | | Monroe Securities | 703 2nd Street Suite 10050 Old Courthouse Square #110 | | 343 W. Erie Street Suite 410 | | 100 N. Riverside Plaza, #1620 | | Santa Rosa, CA 95409 | | Chicago, IL 60610 | Denise Gilseth | | Russ FeltesChicago, Il 60606 | | Jody Hampton | | | | Steven Schroeder | (800) 972-4800356-7022 | | | | (312) 327-2535506-8743 | Fax (707) 528-1117528-9728 | | | | Fax (312) 327-2540506-8799 | | | | | Baird, Patrick & Company | | UBS Financial Services | 20 Exchange Place | | 6570 Oakmont Drive | R. J. Dragani | | Santa Rosa, CA 95409 | New York, New York 10005 | | John Rector | (800) 421-0123 | | (707) 539-1500 | Fax (212) 493-6643 | | Fax (707) 537-3553sschroeder@monroesecurities.com | | | | | Edward Jones | | Howe Barnes Hoefer & Arnett | 515 First Street East | | 555 Market Street, 18th Floor | Sonoma, CA 95476 | | San Francisco, CA 94105 | Gary Scott | | Dave Bonaccorso (415) 538-5723 | (707) 935-1856 | | Switchboard (800) 346-5544 Fax (415) 398-4875 | Fax (707) 935-1894 | | | | | | Wedbush Morgan Securities | | Stone & Youngberg LLC | 1300 S.W. Fifth Avenue Suite 2000 | | P.O.Box 1688 | Joey Warmenhoven X254 | | 42605 Moonridge Road | Portland, Oregon 97201-5667 | | Troy Norlander | (503) 224-0480 | | Big Bear, CA 92315 | Fax (503) 224-7097 | | (800) 288-2811 | | | Fax (909) 585-7220 | | | Tnorlander@syllc.com | | | | | | Hill, Thompson, Magid & Co., Inc. | | | | UBS Financial Services | 15 Exchange Place, Suite 800#800 | | | | 100 B. St., Suite #300 | | Jersey City, NJ 07302 | | | | Santa Rosa, CA 95401 | Lisa LeeTim Padala | | | | Matthew Ricketts | | (866) 291-6316 or (201) 369-2908 | | | | (707 539-1500 | | Fax (201) 395-0624 | | | | Fax (707) 537-3553 | | ht@hilltompson.com | | | | | 866-291-6316 or 201-369-2908 | | | | | | Wedbush Morgan Securities | | | | Stone & Youngberg LLC | | 4949 S.W. Meadow Rd. #100 | | | | P.O. Box 1688 | | Lake Oswego, OR 97035 | | | | 42605 Moonridge Road | | Lisa Gallo | | | | Big Bear, CA 92315 | | Lafayette, CA 94549 | | | | Troy Norlander | | (866) 491-7828 | | | | (800) 288-2811 | Direct Fax 201-395-0624(866) 415-0756 | | | | Fax (909) 585-7220 | | Fax (503) 675-5037 | | | | tnorlander@syllc.com | | Lisa.gallo@wedbush.com | | | | | Lisa.lee@hillthompson.com | | | | | | Howe Barnes Hoefer & Arnett | | | | | 555 Market Street, 18th Floor | | | | | | San Francisco, CA 94105 | | | | | | John Cavender | | | | | | (415) 538-5723 Fax (415) 398-4875 | | | | | | Switchboard (800) 346-5544 | | | | |
20
The table below summarizes those trades of the common stock as reported by OTC Bulletin Board, setting forth the high and low prices for the periods shown. The stock prices have been adjusted for stock dividends and stock splits. These over the counter quotations reflect inter-dealer prices, without retail mark-up, mark-down or commission and may not necessarily represent actual transactions. | | | | | | | | | | | Quarter Ended: | | High | | | Low | | | December 31, 2006 | | $ | 31.00 | | | $ | 27.35 | | | September 30, 2006 | | | 28.00 | | | | 25.50 | | | June 30, 2006 | | | 30.00 | | | | 23.80 | | | March 31, 2006 | | | 24.95 | | | | 20.50 | | | | | | | | | | | | | December 31, 2005 | | $ | 23.00 | | | $ | 20.25 | | | September 30, 2005 | | | 23.20 | | | | 20.18 | | | June 30, 2005 | | | 22.00 | | | | 19.15 | | | March 31, 2005 | | | 25.50 | | | | 21.10 | |
Quarter Ended: High Low
December 31, 2008 $22.75 $12.50 September 30, 2008 22.50 19.10 June 30, 2008 25.70 22.50 March 31, 2008 27.50 23.00
December 31, 2007 $30.00 $25.15 September 30, 2007 30.95 25.10 June 30, 2007 29.50 28.35 March 31, 2007 29.50 27.75
As of March 8, 200710, 2009 there were 1,0521,026 registered holders of the Company’sCompany's common stock, in addition to an unknown number of holders whose shares of common stock are held in street name.
Payment of Dividends
Under state law, the Board of Directors of a California state-licensed bank may declare a cash dividend, subject to the restriction that the amount available for the payment of cash dividends shall be the lesser of retained earnings of the bank or the bank’sbank's net income for its last three fiscal years (less the amount of any distributions to shareholders made during such period).
However, under the Financial Institutions Supervisory Act, the FDIC has broad authority to prohibit a bank from engaging in banking practices which it considers to be unsafe or unsound. It is possible, depending upon the financial condition of the bank in question and other factors, that the FDIC may assert that the payment of dividends or other payments by a bank is considered an unsafe and unsound banking practice and therefore, implement corrective action to address such a practice. The Company paid cash dividends of $0.25 per share to shareholders of record as of March 1, 2004 with payment made on March 15, 2004, $.25 per share to shareholders of record as of August 6, 2004 with payment made on August 26, 2004, $.25 per share to shareholders of record as of March 1, 2005 with payment made on March 15, 2005, $.25 per share to shareholders of record as of August 1, 2005 with payment made on August 15, 2005 , $.25 per share to shareholders of record as of March 1, 2006 with payment made on March 15, 2006 and $.30 per share to shareholders of record as of September 1, 2006 with payment made on September 15, 2006. The Board of Directors of the Company (the “Board”) is currently reviewing our strategic plan to utilize our capital assets in order to enhance shareholder value. One of the initiatives includes review of the declaration of future cash dividends. No plan has yet been finalized.
21
Historically, the Company and the Bank (prior to the formation of the Holding Company) have declared teneleven stock dividends of 5% each, two stock dividends of 10% in May 1996 and June 1997, a 2 for 1 stock split in March 1998, a 3 for 2 stock split in July 2004 and seventen cash dividends in February 2004, July 2004, February 2005, July 2005, February 2006, August 2006, March 2007, August 2007, March 2008, September 2008 and March 20072009 as detailed below: Dividends Paid by the Bank
| | | | | Dividends Paid by the Bank | | | Date Declared | | Record Date | | Date Paid | | Dividend Paid | | May 13, 1992 | | May 31, 1992 | | June 15, 1992 | | 5% Stock Dividend | | June 26, 1993 | | July 15, 1993 | | July 31, 1993 | | 5% Stock Dividend | | July 20, 1994 | | August 1, 1994 | | August 15, 1994 | | 5% Stock Dividend | | January 18, 1995 | | February 5, 1995 | | February 20, 1995 | | 5% Stock Dividend | | August 16, 1995 | | September 11, 1995 | | September 29, 1995 | | 5% Stock Dividend | | May 22, 1996 | | June 14, 1996 | | June 28, 1996 | | 10% Stock Dividend | | June 18, 1997 | | July 15, 1997 | | August 1, 1997 | | 10% Stock Dividend | | March 18, 1998 | | April 15, 1998 | | April 30, 1998 | | 2 for 1 Stock Split | | July 21, 1999 | | August 16, 1999 | | August 31, 1999 | | 5% Stock Dividend | | August 16, 2000 | | September 8, 2000 | | September 25, 2000 | | 5% Stock Dividend |
Dividends Paid by the Company | | | | | Dividends Paid by the Company | | | Date Declared | | Record Date | | Date Paid | | Dividend Paid | | July 18, 2001 | | August 3, 2001 | | August 17, 2001 | | 5% Stock Dividend | | June 17, 2002 | | July 2, 2002 | | July 16, 2002 | | 5% Stock Dividend | | June 18, 2003 | | July 2, 2003 | | July 16, 2003 | | 5% Stock Dividend | | February 18, 2004 | | March 1, 2004 | | March 15, 2004 | | $.25 Cash Dividend | | July 21, 2004 | | August 6, 2004 | | August 26, 2004 | | 3 for 2 Stock Split & $.25 Cash Dividend | | February 16, 2005 | | March 1, 2005 | | March 15, 2005 | | $.25 Cash Dividend | | July 20, 2005 | | August 1, 2005 | | August 15, 2005 | | $.25 Cash Dividend | | February 15, 2006 | | March 1, 2006 | | March 15, 2006 | | $.25 Cash Dividend | | August 17, 2006 | | September 1, 2006 | | September 15, 2006 | | $.30 Cash Dividend | | February 22, 2007 | | March 15, 2007 | | March 30, 2007 | $.30 Cash Dividend | | August 15, 2007 | August 31, 2007 | September 14, 2007 | $.30 Cash Dividend | | February 20, 2008 | March 14, 2008 | March 28, 2008 | $.30 Cash Dividend | | August 20, 2008 | September 15, 2008 | September 30, 2008 | $.30 Cash Dividend | | February 18, 2009 | February 27, 2009 | March 13, 2009 | $.30 Cash Dividend |
22
Comparison of Cumulative Total Return on Investment
There can be no assurance that our stock performance will continue into the future with the same or similar trends depicted in the graph below. The market price of our common stock in recent years has fluctuated significantly and it is likely that the price of the stock will fluctuate in the future. We do not endorse any predictions of future stock performance. Furthermore, the stock performance chart is not considered by us to be (i) soliciting material, (ii) deemed filed with the Securities and Exchange Commission, or (iii) to be incorporated by reference in any filings by us under the Securities Act, or the Exchange Act. | | | | | | | | | | | | | | | | | | | | | | | | | | | | | | | | | | | | | | | | | | | | | | Period Ending | | | | | | | | | | Index | | | | 12/31/00 | | | | | 12/31/01 | | | | | 12/31/02 | | | | | 12/31/03 | | | | | 12/31/04 | | | | | 12/31/05 | | | | | 12/31/06 | | | | | Sonoma Valley Bancorp | | | | 100.00 | | | | | 121.03 | | | | | 176.98 | | | | | 180.65 | | | | | 223.45 | | | | | 203.83 | | | | | 272.52 | | | | | Russell 2000 | | | | 100.00 | | | | | 102.49 | | | | | 81.49 | | | | | 120.00 | | | | | 142.00 | | | | | 148.47 | | | | | 175.73 | | | | | SNL OTC & Pink Sheet Western Index | | | | 100.00 | | | | | 101.11 | | | | | 120.72 | | | | | 178.37 | | | | | 223.14 | | | | | 255.27 | | | | | 281.51 | | | | |
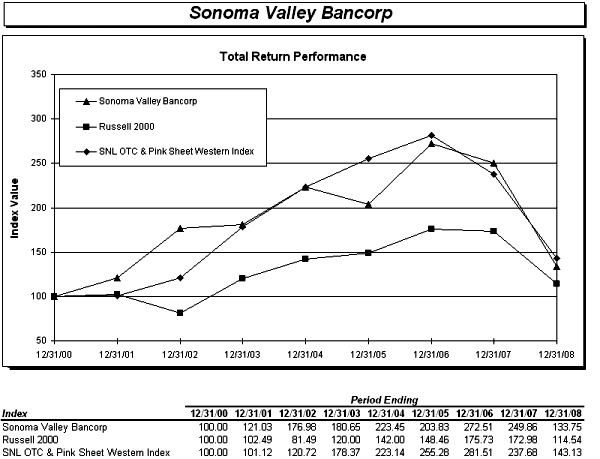 Source: SNL Financial LC, Charlottesville, VA,
(434) 977-1600
(c) 2007www.snl.com| Source : SNL Financial LC, Charlottesville, VA | | | | | | | | | (434) 977-1600 www.snl.co© 2009 | | | | | | | | | |
The following chart summarizes the Company repurchases of the Company’s common stock during the fiscal year ended December 31, 2006.2008. | | | | | | | | | | | | | | | | | | | | | | | | | (a) | | | (b) | | | | | | | (c) | | | (d) | | | | | | | | | | | | | | | | | | | | | Maximum Number (or | | | | | | | | | | | | | | | | | Total Number of | | | Approximate Dollar | | | | | | | | | | | | | | | | | Shares (or Units) | | | Value) of Shares | | | | | | | | | | | | | | | | | Purchased as Part | | | (or Units) that May | | | | | Total Number of | | | | | | | | | | | of Publicly | | | Yet be Purchased | | | | | Shares (or Units) | | | Average Price paid | | | Announced Plans or | | | Under the Plans or | | | Period | | Purchased | | | per Share (or Unit) | | | Programs | | | Programs | | | 10/1/06- 10/31/06 | | | 10,145 | | | | | | | $ | 27.60 | | | | 10,145 | | | | 53,851 | | | 11/1/06 - 11/30/06 | | | 0 | | | | | | | | 0 | | | | 0 | | | | | | | 12/1/06 - 12/31/06 | | | 0 | | | | | | | | 0 | | | | 0 | | | | | | | Total | | | 10,145 | | | | | | | $ | 27.60 | | | | 10,145 | | | | 53,851 | |
23
Period | (a) Total Number of Shares (or Units) Purchased | (b) Average Price paid per Share (or Unit) | (c) Total Number of Shares (or Units) Purchased as Part of Publicly Announced Plans or Programs | (d) Maximum Number (or Approximate Dollar Value) of Shares (or Units) that May Yet be Purchased Under the Plans or Programs (1) (2) (3) | 10/1/08- 10/31/08 | 815 | $19.10 | 815 | 38,777 | 11/1/08 - 11/30/08 | 375 | $16.95 | 375 | 38,402 | 12/1/08 - 12/31/08 | 0 | $ 0.00 | 0 | 38,402 | Total | 1,190 | $18.42 | 1,190 | |
| (1) | On January 17, 2001 a repurchase program was approved up to $1,000,000. On August 21, 2002 an additional $1,000,000 was approved. No expiration. |
| (2) | On February 15, 2006, 60,000 shares were approved to repurchase, on October 18, 2006, an additional 60,000 shares were approved for repurchase and on July 18, 2007, an additional 60,000 shares were approved for repurchase. No expiration. | | (3) | On February 20, 2009, the Company agreed to no longer repurchase shares without the approval of the U.S. Treasury as part of their Preferred Stock Investment in Sonoma Valley Bancorp. |
ITEM 6. SELECTED FINANCIAL DATA The following unaudited selected historical information has been derived from the audited consolidated financial statements of the Company. The information set forth below should be read in conjunction with the financial statements, related Notes thereto, and the section entitled “Management’s Discussion and Analysis of Financial Condition and Results of Operations” included elsewhere in this Form 10-K. SONOMA VALLEY BANCORP
Selected Consolidated Financial Data
dollars in thousands, except share
and per share data | | | | | | | | | | | | | | | | | | | | | | | | | For the years ended: | | | | | 2006 | | | 2005 | | | 2004 | | | 2003 | | | 2002 | | | RESULTS OF OPERATIONS: | | | | | | | | | | | | | | | | | | | | | | Net interest income | | $ | 12,922 | | | $ | 11,300 | | | $ | 10,004 | | | $ | 8,906 | | | $ | 8,633 | | | Provision for loan losses | | | (500 | ) | | | (360 | ) | | | (130 | ) | | | (20 | ) | | | (393 | ) | | Non-interest income | | | 2,094 | | | | 1,968 | | | | 1,710 | | | | 1,715 | | | | 1,641 | | | Non-interest expense | | | (8,306 | ) | | | (7,848 | ) | | | (7,225 | ) | | | (6,244 | ) | | | (5,862 | ) | | Provision for income tax | | | (2,218 | ) | | | (1,711 | ) | | | (1,451 | ) | | | (1,446 | ) | | | (1,275 | ) | | | | | | | | | | | | | | | | | | | Net Income | | $ | 3,992 | | | $ | 3,349 | | | $ | 2,908 | | | $ | 2,911 | | | $ | 2,744 | | | | | | | | | | | | | | | | | | | | | | | | | | | | | | | | | | | | | | | | | | SELECTED AVERAGE BALANCES: | | | | | | | | | | | | | | | | | | | | | | Assets | | $ | 262,090 | | | $ | 232,543 | | | $ | 210,883 | | | $ | 195,177 | | | $ | 164,200 | | | Loans, net of unearned | | | 199,001 | | | | 160,655 | | | | 139,395 | | | | 123,044 | | | | 116,867 | | | Deposits | | | 223,560 | | | | 203,341 | | | | 186,496 | | | | 171,620 | | | | 143,228 | | | Shareholders’ equity | | | 25,111 | | | | 21,935 | | | | 20,799 | | | | 20,232 | | | | 17,964 | | | PER SHARE DATA: | | | | | | | | | | | | | | | | | | | | | | Basic net income | | $ | 1.78 | | | $ | 1.54 | | | $ | 1.35 | | | $ | 1.34 | | | $ | 1.26 | | | Fully diluted net income | | $ | 1.68 | | | $ | 1.45 | | | $ | 1.25 | | | $ | 1.23 | | | $ | 1.16 | | | Period end book value | | $ | 11.71 | | | $ | 10.63 | | | $ | 9.65 | | | $ | 9.89 | | | $ | 8.81 | | | Weighted average shares outstanding | | | 2,247,231 | | | | 2,170,866 | | | | 2,148,558 | | | | 2,165,066 | | | | 2,176,386 | | | Weighted average shares outstanding diluted | | | 2,369,218 | | | | 2,303,639 | | | | 2,330,841 | | | | 2,364,433 | | | | 2,373,208 | | | FINANCIAL RATIOS: | | | | | | | | | | | | | | | | | | | | | | Return on average assets | | | 1.52 | % | | | 1.44 | % | | | 1.38 | % | | | 1.49 | % | | | 1.67 | % | | Return on average shareholders’ equity | | | 15.90 | % | | | 15.27 | % | | | 13.98 | % | | | 14.39 | % | | | 15.27 | % | | Net yield on earning assets | | | 5.46 | % | | | 5.46 | % | | | 5.48 | % | | | 5.24 | % | | | 6.06 | % | | Efficiency ratio | | | 53.95 | % | | | 57.44 | % | | | 59.52 | % | | | 56.95 | % | | | 55.07 | % | | Average shareholders’ equity to average assets | | | 9.58 | % | | | 9.43 | % | | | 9.86 | % | | | 10.37 | % | | | 10.94 | % | | CAPITAL RATIOS: | | | | | | | | | | | | | | | | | | | | | | Risk-based capital: | | | | | | | | | | | | | | | | | | | | | | Tier I | | | 9.57 | % | | | 10.68 | % | | | 10.77 | % | | | 12.81 | % | | | 12.31 | % | | Total | | | 10.26 | % | | | 11.93 | % | | | 12.02 | % | | | 14.07 | % | | | 13.57 | % | | Leverage ratio | | | 11.51 | % | | | 9.61 | % | | | 9.51 | % | | | 10.50 | % | | | 10.62 | % | | CREDIT QUALITY: | | | | | | | | | | | | | | | | | | | | | | Net charge-offs to average loans | | | 0.00 | % | | | 0.01 | % | | | 0.24 | % | | | 0.14 | % | | | 0.02 | % | | Allowance for possible loan losses to period end loans | | | 1.49 | % | | | 1.62 | % | | | 1.59 | % | | | 2.15 | % | | | 2.17 | % |
24
| For the years ended: | | 2008 | | | 2007 | | | 2006 | | | 2005 | | | 2004 | | | RESULTS OF OPERATIONS: | | | | | | | | | | | | | | | | | Net interest income | | $ | 14,483 | | | $ | 14,367 | | | $ | 12,922 | | | $ | 11,300 | | | $ | 10,004 | | | Provision for loan losses | | | (2,110 | ) | | | (680 | ) | | | (500 | ) | | | (360 | ) | | | (130 | ) | | Non-interest income | | | 2,131 | | | | 2,279 | | | | 2,094 | | | | 1,968 | | | | 1,710 | | | Non-interest expense | | | (9,624 | ) | | | (9,182 | ) | | | (8,306 | ) | | | (7,848 | ) | | | (7,225 | ) | | Provision for income tax | | | (1,565 | ) | | | (2,440 | ) | | | (2,218 | ) | | | (1,711 | ) | | | (1,451 | ) | | Net Income | | $ | 3,315 | | | $ | 4,344 | | | $ | 3,992 | | | $ | 3,349 | | | $ | 2,908 | | | SELECTED AVERAGE BALANCES: | | | | | | | | | | | | | | | | | | | | | | Assets | | $ | 301,554 | | | $ | 286,692 | | | $ | 262,090 | | | $ | 232,543 | | | $ | 210,883 | | | Loans, net of unearned | | | 258,191 | | | | 237,338 | | | | 199,001 | | | | 160,655 | | | | 139,395 | | | Deposits | | | 241,747 | | | | 229,105 | | | | 223,560 | | | | 203,341 | | | | 186,496 | | | Long-term borrowings | | | 16.667 | | | | 9,192 | | | | 1,397 | | | | | | | | | | | Shareholders' equity | | | 30,019 | | | | 27,248 | | | | 25,111 | | | | 21,935 | | | | 20,799 | | | PER SHARE DATA: | | | | | | | | | | | | | | | | | | | | | | Dividends | | $ | 0.60 | | | $ | 0.60 | | | $ | 0.55 | | | $ | 0.50 | | | $ | 0.50 | | | Basic net income | | $ | 1.46 | | | $ | 1.94 | | | $ | 1.78 | | | $ | 1.54 | | | $ | 1.35 | | | Fully diluted net income | | $ | 1.45 | | | $ | 1.88 | | | $ | 1.68 | | | $ | 1.45 | | | $ | 1.25 | | | Period end book value | | $ | 13.57 | | | $ | 12.58 | | | $ | 11.71 | | | $ | 10.63 | | | $ | 9.65 | | Weighted average shares outstanding | | | 2,263,045 | | | | 2,241,104 | | | | 2,247,231 | | | | 2,170,866 | | | | 2,148,558 | | Weighted average shares outstanding diluted | | | 2,292,731 | | | | 2,313,588 | | | | 2,369,218 | | | | 2,303,639 | | | | 2,330,841 | | | FINANCIAL RATIOS: | | | | | | | | | | | | | | | | | | | | | | Return on average assets | | | 1.10 | % | | | 1.52 | % | | | 1.52 | % | | | 1.44 | % | | | 1.38 | % | Return on average shareholders' equity | | | 11.04 | % | | | 15.94 | % | | | 15.90 | % | | | 15.27 | % | | | 13.98 | % | Net yield on earning assets | | | 5.26 | % | | | 5.51 | % | | | 5.46 | % | | | 5.46 | % | | | 5.48 | % | | Efficiency ratio | | | 56.78 | % | | | 53.88 | % | | | 53.95 | % | | | 57.44 | % | | | 59.52 | % | Average shareholders' equity to average assets | | | 9.95 | % | | | 9.50 | % | | | 9.58 | % | | | 9.43 | % | | | 9.86 | % | | CAPITAL RATIOS: | | | | | | | | | | | | | | | | | | | | | | Risk-based capital: | | | | | | | | | | | | | | | | | | | | | | Tier I | | | 10.24 | % | | | 9.73 | % | | | 10.26 | % | | | 10.68 | % | | | 10.77 | % | | Total | | | 11.50 | % | | | 10.98 | % | | | 11.51 | % | | | 11.93 | % | | | 12.02 | % | | Leverage ratio | | | 9.38 | % | | | 9.21 | % | | | 9.57 | % | | | 9.61 | % | | | 9.51 | % | | CREDIT QUALITY: | | | | | | | | | | | | | | | | | | | | | Net charge-offs to average loans | | | 0.31 | % | | | 0.10 | % | | | 0.00 | % | | | 0.01 | % | | | 0.24 | % | Allowance for possible loan losses to period end loans | | | 1.88 | % | | | 1.49 | % | | | 1.49 | % | | | 1.62 | % | | | 1.59 | % |
ITEM 7. MANAGEMENT’SMANAGEMENT'S DISCUSSION AND ANALYSIS OF CONSOLIDATED FINANCIAL CONDITION AND RESULTS OF OPERATIONS
The Year Ended December 31, 20062008 versus December 31, 20052007
The business operations of the Company continue to be conducted through the Bank, its wholly-owned subsidiary, which began commercial lending operations on June 3, 1988. Accordingly, the following discussion and analysis of the financial condition and the results of operations should be read in conjunction with the financial statements and notes included elsewhere in this annual report. Per share amounts for prior years have been adjusted for the Company’s 3 for 2 stock split declared July 2004. The continued growth and success of the company is dependent upon a stable economy, an increasing deposit base in the Sonoma Valley and economically viable technology to enhance customer service. Expansion of services in the Sonoma Valley such as the opening of a new branch, the placement of a remote ATM in the local hospital, and the deployment of wire transfer services through an international network are some of the strategies contributing to successful performance. It is management’s opinion that community banking will continue to prosper, by providing useful services in niche markets, in spite of the consolidation taking place in the industry.
Critical Accounting Policies The accounting and reporting policies of the Company conform to accounting principles generally accepted in the United States and general practices within the financial services industry. The preparation of financial statements in conformity with generally accepted accounting principles requires management to make estimates and assumptions that affect the amounts reported in the financial statements and accompanying notes. Actual results could differ from those estimates. A summary of the Company’s most significant accounting policies is contained on page 5461 in Note A to the consolidated financial statements. The Company considers its most critical accounting policies to consist of the allowance for loan and lease losses and the estimation of fair value, which are separately discussed below. Allowance for Loan and Lease Losses. The allowance for loan and lease losses represents management’s best estimate of inherent losses in the existing loan portfolio. The allowance for loan and lease losses is increased by the provision for losses on loans and leases charged to expense and reduced by loans and leases charged off, net of recoveries. The allowance for loan and lease losses is determined based on management’s assessment of several factors: reviews and evaluations of specific loans and leases, changes in the nature and volume of the loan portfolio, current economic conditions and the related impact on specific borrowers and industry groups, historical loan and lease loss experience, the level of classified and nonperforming loans and the results of regulatory examinations. The Company’s allowance for loan losses consists of three elements: (i) specific allocated allowances determined in accordance with SFAS 114 based on probable losses on specific commercial or commercial real estate loans; (ii) risk allocated allowance which is comprised of several loan pool valuation allowances determined in accordance with SFAS 5 based on Sonoma Valley Bank’s historical quantitative loan loss experience for similar loans with similar risk characteristics, including additional qualitative risks and (iii) general valuation allowances based on existing regional and local economic factors, including deterioration in commercial and residential real estate values, an adjustment factor for the current economic cycle the Company is experiencing, and other judgmental factors supported by qualitative documentation. The Company’s Audit Committee engages experienced independent loan portfolio review professionals many of whom are former bank examiners. The Audit Committee determines the scope of such reviews and provides the report of findings to the Board’s Loan Committee after it has reviewed and accepted the report. These reviews are supplemented with periodic reviews internally by the Company’s credit review function, as well as the periodic examination of both selected credits and the credit review process by the applicable regulatory agencies. The information from these reviews assists management in the timely identification of problems and potential problems and provides a basis for deciding whether the credit represents a probable loss or risk that should be recognized. Changes in the financial condition of individual borrowers, in economic conditions, in historical loss experience and in the conditions of the various markets in which collateral may be sold may all affect the required level of the allowance for loan and lease losses and the associated provision for loan and lease losses. 25
Estimation of Financial Instruments Measured at Fair Value. Accounting principles generally acceptedThe Company’s investment securities available for sale are carried at fair value with changes in fair value recognized in other comprehensive income.
Fair value is defined as the price that would be received to sell an asset or paid to transfer a liability (i.e., the “exit price) in an orderly transaction between market participants at the measurement date.
In determining fair value, the Company uses various valuation approaches. A hierarchy for inputs is used in measuring fair value that maximizes the use of observable prices and inputs and minimizes the use of unobservable prices and inputs by requiring that the observable inputs be used when available. The hierarchy is broken down into three levels, wherein Level 1 uses observable prices in active markets, and Level 3 consists of valuation techniques that incorporate significant unobservable inputs and therefore require the greatest use of judgment. In periods of market dislocation, such as those experienced in fiscal 2008, the observability of prices and inputs may be reduced for many instruments. This condition could cause an instrument to be reclassified from Level 1 to Level 2 or Level 2 to Level 3. In addition, a continued downturn in market conditions could lead to further declines in the United States requirevaluation of many instruments. For further information on the fair value definition, Level 1, Level 2 and Level 3 hierarchy, and related valuation techniques, see Note R, page 89 to the consolidated financial statements.
Assets and Liabilities Measured at Fair Value on a Non-Recurring Basis. Certain of the Company’s assets were measured at fair value on a non-recurring basis. These assets include certain impaired loans and other real estate that certainis written down to fair value upon repossession and subsequently impaired for any further declines in value. A continued downturn in market conditions could result in additional impairment charges in future periods.
For assets and liabilities be carried on the Consolidated Balance Sheetmeasured at fair value oron a non-recurring basis, fair value is determined by using various valuation approaches. The same hierarchy as described above, which maximizes the use of observable inputs and minimizes the use of unobservable inputs, by generally requiring that the observable inputs be used when available, is used in measuring fair value for these items. For further information on financial statement assets and liabilities that are measured at fair value on a recurring and non-recurring basis, see Note R, page 89 to the consolidated financial statements.
Share-Based Compensation. We account for share-based awards to employees, officers, and directors in accordance with the provisions of SFAS No. 123(R), Share-Based Payment. Under SFAS No. 123(R), share-based compensation cost is measured at the lower of cost or fair value, and that stock awards be recordedgrant date, based on their estimated fair value. Furthermore, the fair value of financial instrumentsthe award, and is recognized as expense over the employee’s requisite service period. We adopted SFAS No. 123(R), as required on January 1, 2003. Prior to 2003, we recognized stock-based compensation expense for employee share-based awards based on their intrinsic value on the date of grant pursuant to Accounting Principles Board Opinion No. 25, Accounting for Stock Issued to Employees, and followed the disclosure requirements of SFAS No. 123, Accounting for Stock-Based Compensation.
We grant nonqualified stock options, incentive stock options and restricted stock. Most of our stock option and restricted stock awards include a service condition that relates only to vesting. The stock option awards generally vest in three to five years from the grant date, as does the restricted stock awards. Compensation expense is amortized on a straight-line basis over the requisite service period for the entire award, which is generally the maximum vesting period of the award.
We use an option-pricing model to determine the grant-date fair value of our stock options which is affected by assumptions regarding a number of complex and subjective variables. We make assumptions regarding expected term, expected volatility, expected dividend yield, and risk-free interest rate in determining the fair value of our stock options. The expected term represents the weighted-average period that stock options are expected to remain outstanding. The expected term assumption is estimated based on the stock options’ vesting terms and remaining contractual life and employees’ historical exercise behavior. The expected volatility is based on the historical volatility of our common stock over a period of time equal to the expected term of the stock options. The dividend yield assumption is based on the Company’s current dividend payout rate on its common stock. The risk-free interest rate assumption is based upon the U.S. Treasury yield curve in effect at the time of grant appropriate for the term of the employee stock options.
For restricted share awards, the grant-date fair value is measured at the fair value of the Company’s common stock as if the restricted share was vested and issued on the date of the grant.
As share-based compensation expense under SFAS No. 123(R) is based on awards ultimately expected to vest, it is reduced for estimated forfeitures. SFAS No. 123(R) requires forfeitures to be disclosed as a partestimated at the time of the notesgrant and revised, if necessary, in subsequent periods if actual forfeitures differ from those estimates. Share-based compensation is discussed in more detail in Notes A and L to the Company’s consolidated financial statements for other assets and liabilities (see Note R, page 79). Fair values are volatile and may be influenced by a number of factors, including market interest rates, prepayment speeds, discount rates, the shape of yield curves and the credit worthiness of counterparties.presented elsewhere in this report. Fair values for the majority of the Company’s available for sale investment securities are based on quoted market prices. In instances where quoted market prices are not available, fair values are based on the quoted prices of similar instruments with adjustment for relevant distinctions. For trading account assets, fair value is estimated giving consideration to the contractual interest rates, weighted average maturities and anticipated prepayment speeds of the underlying instruments and market interest rates. Overview We reported net income of $3,991,759$3,315,361 for the year ending December 31, 2006, an increase2008, a decrease of $643,230$1,028,177 over $3,348,529$4,343,538 for the year ending December 31, 2005.2007. The increasedecline in net income in 2006earnings is primarily a result of a $1.4 million increase in the provision for loan growth of 28.3% over loans at year end of 2005. Deposits have grown 7.9% over 2005, but market pressureloss charged to increase deposit rates has lowered the benefit received from the growth inexpense without which our earnings would be on par with 2007. Non interest income. The Banco de Sonoma Officeincome showed a year to date profitdecline of $45,306.6.48% or $148,000 and non interest expense showed an increase of 4.81% or $442,000. On a per share basis, net income equaled $1.78$1.46 in 20062008 compared with $1.54$1.94 per share in 2005.2007.
Return on average total assets for 2008, 2007 and 2006 2005was 1.10%, 1.52% and 2004 was 1.52%, 1.44% and 1.38%, respectively. Return on average shareholders’ equity increaseddeclined to 15.90%11.04% in 20062008 compared to 15.27%15.94% in 2005.2007. The increase$14.9 million growth in average assets from $286.7 to $301.6 and the $1.0 million decline in net income translate into the lower return on average assets when compared to prior years. The decline in the return on average assets is a result of the 19.2% growth in net income compared to 12.7% growth in average assets. The higher return on equity is the result of the increase in income during 2006 offset by the $3.2$2.8 million increase in average equity from $21.9offset by the $1.0 million decline in net income. At December 31, 2008, total assets were $321.9 million, an 8.1% increase over the $297.9 million at December 31, 2007. We showed loans net of unearned of $267.4 million in 2005 to $25.12008, compared with $250.5 million in 2006. While we have enjoyed strong earnings over the last three years, in 2006, our growth in earnings has exceeded both the growth in average assets and average equity. Income at year end 2006 is higher than 2005 due to the increase in loan volume which generated strong earnings in spite of the net interest margin remaining unchanged (see the table- Average Balances/Yields and Rates Paid on page 30) supplemented by the growth of $125,344 in non interest income.
We continue to focus on the Latino Community at the Banco de Sonoma Office. At year end deposits totaled $12.6 million compared to $11.1 million in 2005, growth of $1.3 million. Year end loans were $5.9 million,2007, an increase of $3.26.8%. Deposits increased $17.9 million, over 2005 totalgrowing 7.6%, from $236.0 million at year end 2007 to $253.9 million at year end 2008. Deposit growth continues to be challenging due to competition in the market from local banks, savings and loans of $2.7 million. Net income forand money market accounts with brokers and a decline in deposits in our market place. The loan-to-deposit ratio was 105.3% in 2008 and 106.1% in 2007. In 2009 we anticipate slower growth in assets, loans and deposits.
Total shareholders equity increased by $2.9 million or 10.5% during the yeartwelve months ended December 31, 2006 was $45,000 compared to a loss of $94,000 in 2005. We identified this as a niche market which was underserved and an opportunity for potential future growth and profitability. Most of the employees at the branch are bilingual and the Bank offers full service banking. An additional product, that has been added, is the ability for customers to effect an immediate transfer of funds to Mexico. We anticipate that the growth in the office will be slow and steady. Total shareholder’s equity increased by $2.964 million or 12.6% at year end 2006.2008. At December 31, 2006,2008, we reported net income of $3.99 million.$3,315,361. In MarchFebruary, 2008 and in August, 2008 we declared cash dividends which were paid out $562,566 for cash dividends declared in February 2006March, 2008 and in September, 2006 we2008, respectively. In each instance the amount of the dividend paid out $690,391 for cash dividends declared in August 2006.was $686,613. In 2004, stock options were granted to senior employees with a fifth of the options vesting each year over a five year period. In 2006, 13,0502008, 12,450 options vested which increased equity by $100,224 at year end.$2,282. The 2004 stock option grant is now fully expensed and the options are all vested. In July 2006, 26,000 shares of restricted stock were granted to senior employees with a fifth of the shares vesting each year over a five-year period and 3,000 shares of restricted stock were granted to a senior employee with a third of the shares vesting over a three-year period. In 2008, 6,200 shares of restricted stock vested, which resulted in a tax liability of $14,677. In 2008, equity was increased by $162,750 to reflect the expense for these shares. In June 2007, 10,000 unqualified stock options were granted to senior employeesa director with a fifth of the options vesting each year over a five-year periodfive year period. Additionally, in December, 2007, 7,410 unqualified stock options were granted to two directors with one third vesting immediately and 3,000 restrictedtwo thirds vesting over a two year period. In 2008, equity has been increased by $20,196 and $16,763, respectively, for these 2007 grants. In January 2008, 10,000 incentive stock options were awarded to a senior employee with a fifth of the options vesting each year over a five year period. In 2008, equity was increased by $13,664. In April 2008, 10,000 unqualified stock options were granted to a senior employeedirector with a thirdfifth of the
26
options vesting each year over a three-yearfive year period. In 2006,2008 equity was increased by $81,375 to reflect the expense$11,899 for these options. The net income figure of $3.99 million$3,315,361 reflects an expense for the incentive stock of $15,947, shares of restricted stock of $162,750, and the unqualified stock options of $100,224 and restricted stock options of $81,375,$48,858, therefore the net effect of the stock option transactions relative to equity was zero. Directors exercised 64,86223,164 options which added $515,460$200,860 to the capital accounts. The tax benefit of these options was $459,493,$158,718, which also increased equity. Officers exercised 39,26425,874 options which added $349,533$381,697 to the capital accounts. During the twelve months ended December 31, 20062008 we repurchased 55,0281,190 shares which lowered equity by $1,436,151.$21,941. The net effect of this activity results in capital of $26,404,071$30,860,096 as of December 31, 2006,2008, compared to capital of $23,439,793$27,934,280 as of December 31, 2005.2007. See page 5157 for detail of “Changes in Shareholders’ Equity”. At December 31, 2006, total assets were $277.7 million, a 13.8% increase over the $244.1 million at December 31, 2005. We showed loans of $219.6 million in 2006, compared with $171.2 million at year-end 2005, an increase of 28.3%. Deposits increased, growing 7.9%, from $215.8 million at year-end 2005 to $232.8 million at year-end 2006. The loan-to-deposit ratio increased to 94.3% in 2006 from 79.3% in 2005. In 2007, management anticipates slower growth in assets, loans and deposits.
Section 404 of Sarbanes-Oxley Act of 2002 (“Section 404”) requires the Securities and Exchange Commission (“SEC”) to prescribe rules requiring the establishment, maintenance and evaluation of an issuer’s internal control of financial reporting. Accordingly,We certified compliance in the annualthis report for the year ended December 31, 2006, our management was going to be required to include an assessment on the effectiveness of our internal controls over financial reporting in accordance with standards set by the Public Company Accounting Oversight Board. On September 21, 2005, the SEC extended for another year the deadline for non-accelerated filers to first certify compliance with Section 404. This means that we will not have to certify compliance until December 31, 2007.2008. Our external independent auditors are required to attest to and report on management’smanagement's assessment of internal control over financial reporting beginning December 31, 2008.2009. Our management and staff are workingworked diligently toward evaluating and documenting the internal control systems in order to allow our management to report on and our independent auditors to attest to, our internal control over financial reporting beginning December 31, 2008. We have retained the services of a consulting firm to assist management and staff with this process and to address any material weaknesses and plan accordingly to maintain adequate processes. Even so, there can be no assurances that the evaluation required by Section 404 will not result in the identification of significant control deficiencies or that our auditors will be able to attest to the effectiveness of our internal controls over financial reporting. RESULTS OF OPERATIONS
Net Interest Income
Net interest income is the difference between total interest income and total interest expense. Net interest income, adjusted to a fully taxable equivalent basis, increased $1.6 millionminimally by $54,000 to $13.3$14.818 million, up 13.7%.36% from 20052007 net interest income of $11.7$14.764 million. Net interest income on a fully taxable equivalent basis, as shown on the table —- Average Balances, Yields and Rates Paid on page 3035,is higher than net interest income on the statements of operations because it reflects adjustments applicable to tax-exempt income from certain securities and loans ($379,000334,000 in 20062008 and $395,000$397,000 in 2005,2007, based on a 34% federal income tax rate). The improvement in net
Net interest income for the year ended December 31, 20062008 (stated on a fully taxable equivalent basis) is a result of the net effect of a $3.7 million increase$935,000 decline in interest income offset by an increasea somewhat larger decline of $989,000 in interest expense of $2.1 million, thefor a net effect being an increase of $1.6 million$54,000 or 13.7%.36%. This increase is a resultAt the beginning of 2008, the 100 basis point increase in the federal funds and prime lending rates since December 31, 2005. The federalfed funds rate increased from 4.25% as of December 31, 2005, to 5.25% as of December 31, 2006 and the Wall street Journal prime rate were at 4.25% and 7.25%, respectively. During the year the Federal Open Market Committee (FOMC) lowered the fed funds target rate seven times for a total of 400 basis points. The target fed funds rate is now 0 to ..25% and the Wall Street Journal Prime lending rate increased from 7.25% as of December 31, 2005 to 8.25% as of December 27
31, 2006. Also contributing to the increase in net interest income is the strong loan growth experienced during the year.3.25%.
Net interest income (stated on a fully taxable equivalent basis) expressed as a percentage of average earning assets, is referred to as net interest margin. Our net interest margin remained flat at 5.46%decreased 25 basis points to 5.26% for 2008 from 5.51% in both 2005 and 2006. Our ability to maintain a flat2007. The decrease in the net interest margin is thea result of the strong loanstronger growth and our ability to control deposit rates through deposit management and by borrowing atin earning liabilities causing higher interest expense when factored against the Federal Home Loan Bank. There is still considerable pressure to raise deposit rates which could cause deteriorationlower rate of growth in the net interest margin.earning assets.
Interest Income
As previously stated, interest income (stated on a fully taxable equivalent basis) increaseddecreased by $3.7 million$935,000 to $17.8$20.3 million in 2006,2008, a 26.0% increase over4.4% decrease from the $14.1$21.2 million realized in 2005.2007.
The $3.7 million increase$935,000 decrease in interest income was the result of a $2.7$1.2 million increase due to the growth in volume of average balances, together with a $1.0$2.1 million increasedecrease in income related to higherlower interest rates paid.paid for a net decrease of $935,000. The yield on earning assets was 7.29%7.19% as of December 31, 20062008 compared to 6.58%7.91% in 2005,2007, a 7172 basis point increase.decrease. The increasedecrease is primarily the result of the $29.1 million or 13.6% growtha decline in average earning assets from $214.4interest rates paid by borrowers.
Interest Expense
Total interest expense decreased by $989,000 to $5.4 million as of December 31, 20052008 compared to $243.5$6.4 million in 2006. Interest Expense
Total interest expense increased by $2.1 million to $4.5 million as of December 31, 2006 compared to $2.4 million in 2005.2007. The average rate paid on all interest-bearing liabilities decreased from 3.22% in 2007 to 2.54% in 2008, a 68 basis point decrease. Average balances on earning liabilities increased from 1.51% in 2005 to 2.51% in 2006, a 100 basis point increase. Average balances increased from $158.7$199.6 million to $177.5$214.7 million, a 11.8%7.55% gain in earning liabilities. Of the increase in average interest-bearing liabilities, $8.2 million was borrowings at the Federal Home Loan Bank. We continue to experience stronger loan growth than deposit growth, so we determined it is more cost effective to satisfy our liquidity needs by borrowing at the Federal Home Loan Bank.
The gain in volume of average balances was responsible for a $1.0 million$466,000 increase in interest expense while higherlower rates paid were responsible for a $1.1$1.455 million increasedecrease in interest expense resulting in highera decrease in interest expense of $2.1 million.$989,000. The higher interestdecline in rates we have paid on deposits and borrowingsinterest-bearing liability balances is the primary cause for the increasedecrease in interest expense.
Individual components of interest income and interest expense are provided in the table-Average Balances, Yields and Rates Paid on page 30.the following page. SONOMA VALLEY BANCORP AVERAGE BALANCES/YIELDS AND RATES PAID Rate/Volume | | | | | | 2008 | | | | | | | | | 2007 | | | | | | | | | 2006 | | | | | | ASSETS | | Average Balance | | | Income/ Expense | | | Yield/ Rate | | | Average Balance | | | Income/ Expense | | | Yield/ Rate | | | Average Balance | | | Income/ Expense | | | Yield/ Rate | | | Interest-earning assets: | | | | | | | | | | | | | | | | | | | | | | | | | | | | | Loans(2): | | | | | | | | | | | | | | | | | | | | | | | | | | | | | Commercial | | $ | 177,266,393 | | | $ | 13,154,813 | | | | 7.42 | % | | $ | 158,772,063 | | | $ | 12,943,010 | | | | 8.15 | % | | $ | 136,909,555 | | | $ | 10,895,909 | | | | 7.96 | % | | Consumer | | | 32,199,803 | | | | 2,292,529 | | | | 7.12 | % | | | 28,115,183 | | | | 2,504,305 | | | | 8.91 | % | | | 25,167,482 | | | | 2,065,754 | | | | 8.21 | % | | Real estate construction | | | 27,247,317 | | | | 2,135,850 | | | | 7.84 | % | | | 30,167,065 | | | | 2,640,403 | | | | 8.75 | % | | | 19,431,136 | | | | 1,593,551 | | | | 8.20 | % | | Real estate mortgage | | | 19,591,931 | | | | 1,421,658 | | | | 7.26 | % | | | 18,460,123 | | | | 1,378,532 | | | | 7.47 | % | | | 15,624,447 | | | | 1,088,846 | | | | 6.97 | % | | Tax exempt loans (1) | | | 2,171,461 | | | | 179,250 | | | | 8.25 | % | | | 2,278,470 | | | | 187,389 | | | | 8.22 | % | | | 2,379,741 | | | | 195,558 | | | | 8.22 | % | | Leases | | | 19,140 | | | | 2,156 | | | | 11.26 | % | | | 27,221 | | | | 2,928 | | | | 10.76 | % | | | 44,438 | | | | 5,185 | | | | 11.67 | % | | Tax exempt leases (1) | | | 0 | | | | 0 | | | | 0.00 | % | | | 0 | | | | 0 | | | | 0.00 | % | | | 0 | | | | 0 | | | | 0.00 | % | | Unearned loan fees | | | (305,246 | ) | | | | | | | | | | | (482,421 | ) | | | | | | | | | | | (555,992 | ) | | | | | | | | | | | Total loans | | | 258,190,799 | | | | 19,186,256 | | | | 7.43 | % | | | 237,337,704 | | | | 19,656,567 | | | | 8.28 | % | | | 199,000,807 | | | | 15,844,803 | | | | 7.96 | % | | Investment securities | | | | | | | | | | | | | | | | | | | | | | | | | | | | | | | | | | | | | | Available for sale: | | | | | | | | | | | | | | | | | | | | | | | | | | | | | | | | | | | | | | | Taxable | | | 4,199,237 | | | | 137,080 | | | | 3.26 | % | | | 12,659,444 | | | | 461,209 | | | | 3.64 | % | | | 25,545,606 | | | | 859,937 | | | | 3.37 | % | | | Tax exempt (1) | | | 0 | | | | 0 | | | | 0.00 | % | | | 0 | | | | 0 | | | | 0.00 | % | | | 0 | | | | 0 | | | | 0.00 | % | | Hold to maturity: | | | | | | | | | | | | | | | | | | | | | | | | | | | | | | | | | | | | | | | Taxable | | | 0 | | | | 0 | | | | 0.00 | % | | | 0 | | | | 0 | | | | 0.00 | % | | | 175,371 | | | | 5,128 | | | | 2.92 | % | | | Tax exempt (1) | | | 13,916,098 | | | | 803,827 | | | | 5.78 | % | | | 15,689,127 | | | | 980,182 | | | | 6.25 | % | | | 15,897,167 | | | | 920,114 | | | | 5.79 | % | | Total investment securities | | | 18,115,335 | | | | 940,907 | | | | 5.19 | % | | | 28,348,571 | | | | 1,441,391 | | | | 5.08 | % | | | 41,618,144 | | | | 1,785,179 | | | | 4.29 | % | | Federal funds sold/Federal Reserve Bank | | | 1,824,686 | | | | 11,924 | | | | 0.65 | % | | | 67,123 | | | | 3,506 | | | | 5.22 | % | | | 1,648,644 | | | | 74,102 | | | | 4.49 | % | | FHLB Stock | | | 1,633,447 | | | | 88,041 | | | | 5.39 | % | | | 1,466,403 | | | | 69,286 | | | | 4.72 | % | | | 1,045,871 | | | | 50,408 | | | | 4.82 | % | | Total Due from Banks/Interest | | | 2,194,897 | | | | 38,007 | | | | 1.73 | % | | | 834,271 | | | | 29,847 | | | | 3.58 | % | | | 157,468 | | | | 4,977 | | | | 3.16 | % | | Short term investments | | | 0 | | | | 0 | | | | 0.00 | % | | | 0 | | | | 0 | | | | 0.00 | % | | | 0 | | | | 0 | | | | 0.00 | % | | Total interest earning assets | | | 281,959,164 | | | $ | 20,265,135 | | | | 7.19 | % | | | 268,054,072 | | | $ | 21,200,597 | | | | 7.91 | % | | | 243,470,934 | | | $ | 17,759,469 | | | | 7.29 | % | | Noninterest-bearing assets: | | | | | | | | | | | | | | | | | | | | | | | | | | | | | | | | | | | | | | Reserve for loan losses | | | (3,979,307 | ) | | | | | | | | | | | (3,620,160 | ) | | | | | | | | | | | (2,995,052 | ) | | | | | | | | | | Cash and due from banks | | | 5,534,594 | | | | | | | | | | | | 5,676,187 | | | | | | | | | | | | 6,077,171 | | | | | | | | | | | Premises and equipment | | | 794,831 | | | | | | | | | | | | 861,563 | | | | | | | | | | | | 1,078,565 | | | | | | | | | | | Other real estate owned | | | 246,662 | | | | | | | | | | | | 0 | | | | | | | | | | | | 0 | | | | | | | | | | | Other assets | | | 16,997,701 | | | | | | | | | | | | 15,720,025 | | | | | | | | | | | | 14,458,246 | | | | | | | | | | | Total assets | | $ | 301,553,645 | | | | | | | | | | | $ | 286,691,687 | | | | | | | | | | | $ | 262,089,864 | | | | | | | | | | | LIABILITIES AND SHAREHOLDERS’ EQUITY | | | | | | | | | | | | | | | | | | | | | | | | | | | | | | | | | | | | | | Interest-bearing liabilities: | | | | | | | | | | | | | | | | | | | | | | | | | | | | | | | | | | | | | | Interest-bearing deposits | | | | | | | | | | | | | | | | | | | | | | | | | | | | | | | | | | | | | | | Interest-bearing transaction | | $ | 30,129,902 | | | $ | 49,514 | | | | 0.16 | % | | $ | 29,053,472 | | | $ | 47,332 | | | | 0.16 | % | | $ | 30,838,635 | | | $ | 50,928 | | | | 0.17 | % | | | Savings deposits | | | 78,614,676 | | | | 1,433,907 | | | | 1.82 | % | | | 75,703,801 | | | | 1,887,350 | | | | 2.49 | % | | | 73,425,495 | | | | 1,363,563 | | | | 1.86 | % | | | Time less than $100,000 | | | 32,128,240 | | | | 1,138,555 | | | | 3.54 | % | | | 29,008,487 | | | | 1,300,629 | | | | 4.48 | % | | | 26,544,506 | | | | 1,015,391 | | | | 3.83 | % | | | Time $100,000 and over | | | 50,707,135 | | | | 1,933,523 | | | | 3.81 | % | | | 41,397,521 | | | | 1,957,123 | | | | 4.73 | % | | | 38,501,063 | | | | 1,602,820 | | | | 4.16 | % | | Total interest-bearing deposits | | | 191,579,953 | | | | 4,555,499 | | | | 2.38 | % | | | 175,163,281 | | | | 5,192,434 | | | | 2.96 | % | | | 169,309,699 | | | | 4,032,702 | | | | 2.38 | % | | Federal funds purchased | | | 120,218 | | | | 2,652 | | | | 2.21 | % | | | 0 | | | | 0 | | | | 0.00 | % | | | 0 | | | | 0 | | | | 0.00 | % | | Long term debt & other borrowings | | | 22,976,885 | | | | 889,470 | | | | 3.87 | % | | | 24,441,329 | | | | 1,244,256 | | | | 5.09 | % | | | 8,225,343 | | | | 425,681 | | | | 5.18 | % | | | Total interest-bearing liabilities | | | 214,677,056 | | | $ | 5,447,621 | | | | 2.54 | % | | | 199,604,610 | | | $ | 6,436,690 | | | | 3.22 | % | | | 177,535,042 | | | $ | 4,458,383 | | | | 2.51 | % | | Non interest-bearing liabilities: | | | | | | | | | | | | | | | | | | | | | | | | | | | | | | | | | | | | | | Demand deposits | | | 50,167,445 | | | | | | | | | | | | 53,941,828 | | | | | | | | | | | | 54,250,592 | | | | | | | | | | | Other liabilities | | | 6,690,052 | | | | | | | | | | | | 5,897,019 | | | | | | | | | | | | 5,193,491 | | | | | | | | | | | Shareholders’ equity | | | 30,019,092 | | | | | | | | | | | | 27,248,230 | | | | | | | | | | | | 25,110,739 | | | | | | | | | | | Total liabilities and shareholders equity | | $ | 301,553,645 | | | | | | | | | | | $ | 286,691,687 | | | | | | | | | | | $ | 262,089,864 | | | | | | | | | | | Interest rate spread | | | | | | | | | | | 4.65 | % | | | | | | | | | | | 4.68 | % | | | | | | | | | | | 4.78 | % | | Interest income | | | | | | $ | 20,265,135 | | | | 7.19 | % | | | | | | $ | 21,200,597 | | | | 7.91 | % | | | | | | $ | 17,759,469 | | | | 7.29 | % | | Interest expense | | | | | | | 5,447,621 | | | | 1.93 | % | | | | | | | 6,436,690 | | | | 2.40 | % | | | | | | | 4,458,383 | | | | 1.83 | % | | Net interest income/margin | | | | | | $ | 14,817,514 | | | | 5.26 | % | | | | | | $ | 14,763,907 | | | | 5.51 | % | | | | | | $ | 13,301,086 | | | | 5.46 | % |
| (1) | Fully tax equivalent adjustments are based on a federal income tax rate of 34% in 2008, 2007 and 2006 | | (2) | Non accrual loans have been included in loans for the purposes of the above presentation. Loan fees of approximately $353,000, $536,000 and $471,000 for the twelve months ended December 31, 2008, 2007 and 2006, respectively, were amortized to the appropriate interest income categories. |
SONOMA VALLEY BANCORP Rate/Volume Analysis
| | | | | | 2008 over 2007 | | | | | | | | | 2007 over 2006 | | | | | | | | Volume | | | Rate | | | Vol/Rate | | | Total | | | Volume | | | Rate | | | Vol/Rate | | | Total | | | ASSETS | | | | | | | | | | | | | | | | | | | | | | | | | | Interest-earning assets: | | | | | | | | | | | | | | | | | | | | | | | | | | Loans: | | | | | | | | | | | | | | | | | | | | | | | | | | Commercial | | | 1,507,647 | | | | (1,160,648 | ) | | | (135,196 | ) | | | 211,803 | | | | 1,739,922 | | | | 264,882 | | | | 42,298 | | | | 2,047,101 | | | Consumer | | | 363,830 | | | | (502,589 | ) | | | (73,017 | ) | | | (211,776 | ) | | | 241,948 | | | | 175,990 | | | | 20,613 | | | | 438,551 | | | Real estate construction | | | (255,554 | ) | | | (275,681 | ) | | | 26,682 | | | | (504,553 | ) | | | 880,455 | | | | 107,179 | | | | 59,218 | | | | 1,046,852 | | | Real estate mortgage | | | 84,519 | | | | (39,002 | ) | | | (2,391 | ) | | | 43,126 | | | | 197,614 | | | | 77,928 | | | | 14,143 | | | | 289,686 | | | Tax exempt loans | | | (8,801 | ) | | | 694 | | | | (33 | ) | | | (8,139 | ) | | | (8,322 | ) | | | 160 | | | | (7 | ) | | | (8,169 | ) | | Leases | | | (869 | ) | | | 138 | | | | (41 | ) | | | (772 | ) | | | (2,009 | ) | | | (405 | ) | | | 157 | �� | | | (2,257 | ) | | Tax exempt leases | | | 0 | | | | 0 | | | | 0 | | | | 0 | | | | 0 | | | | 0 | | | | 0 | | | | 0 | | | Unearned fee income | | | 0 | | | | 0 | | | | 0 | | | | 0 | | | | 0 | | | | 0 | | | | 0 | | | | 0 | | | Total loans | | | 1,690,772 | | | | (1,977,087 | ) | | | (183,996 | ) | | | (470,311 | ) | | | 3,049,609 | | | | 625,734 | | | | 136,422 | | | | 3,811,764 | | | | | | | | | | | | | | | | | | | | | | | | | | | | | | | | | | | | | Investment securities: | | | | | | | | | | | | | | | | | | | | | | | | | | | | | | | | | | Available for sale: | | | | | | | | | | | | | | | | | | | | | | | | | | | | | | | | | | Taxable | | | (308,222 | ) | | | (47,954 | ) | | | 32,047 | | | | (324,129 | ) | | | (433,784 | ) | | | 70,741 | | | | (35,684 | ) | | | (398,728 | ) | | Tax-exempt | | | 0 | | | | 0 | | | | 0 | | | | 0 | | | | 0 | | | | 0 | | | | 0 | | | | 0 | | | Held to maturity: | | | | | | | | | | | | | | | | | | | | | | | | | | | | | | | | | | Taxable | | | 0 | | | | 0 | | | | 0 | | | | 0 | | | | (5,128 | ) | | | 0 | | | | 0 | | | | (5,128 | ) | | Tax-exempt | | | (110,770 | ) | | | (73,941 | ) | | | 8,356 | | | | (176,355 | ) | | | (12,041 | )) | | | 73,065 | | | | (956 | ) | | | 60,068 | | Total investment Securities | | | (418,993 | ) | | | (121,894 | ) | | | 40,403 | | | | (500,484 | ) | | | (450,954 | ) | | | 143,806 | | | | (36,640 | ) | | | (343,787 | ) | | Federal funds sold | | | 91,802 | | | | (3,067 | ) | | | (80,316 | ) | | | 8,418 | | | | (71,085 | ) | | | 12,011 | | | | (11,522 | ) | | | (70,596 | ) | | FHLB Stock | | | 7,893 | | | | 9,752 | | | | 1,111 | | | | 18,755 | | | | 20,268 | | | | (992 | ) | | | (399 | ) | | | (18,878 | ) | | Due from banks-int bearing | | | 48,678 | | | | (15,401 | ) | | | (25,117 | ) | | | 8,160 | | | | 21,391 | | | | 657 | | | | 2,822 | | | | 24,870 | | | Short term investments | | | 0 | | | | 0 | | | | 0 | | | | 0 | | | | 0 | | | | 0 | | | | 0 | | | | 0 | | Total interest-earning Assets | | | 1,420,152 | | | | (2,107,698 | ) | | | (247,916 | ) | | | (935,462 | ) | | | 2,569,229 | | | | 781,216 | | | | 90,683 | | | | 3,441,128 | | | | | | | | | | | | | | | | | | | | | | | | | | | | | | | | | | | | | LIABILITIES | | | | | | | | | | | | | | | | | | | | | | | | | | | | | | | | | | Interest-bearing liabilities: | | | | | | | | | | | | | | | | | | | | | | | | | | | | | | | | | | Interest-bearing deposits: | | | | | | | | | | | | | | | | | | | | | | | | | | | | | | | | | | Savings deposits | | | 1,754 | | | | 413 | | | | 15 | | | | 2,182 | | | | (2,948 | ) | | | (688 | ) | | | 40 | | | | (3,596 | ) | Interest-bearing demand Deposits | | | 72,570 | | | | (506,536 | ) | | | (19,477 | ) | | | (453,443 | ) | | | 42,310 | | | | 466,987 | | | | 14,490 | | | | 523,787 | | | Time less than $100,000 | | | 139,878 | | | | (272,631 | ) | | | (29,320 | ) | | | (162,074 | ) | | | 94,253 | | | | 174,763 | | | | 16,222 | | | | 285,238 | | | Time $100,000 and over | | | 440,124 | | | | (378,587 | ) | | | (85,138 | ) | | | (23,600 | ) | | | 120,581 | | | | 217,369 | | | | 16,353 | | | | 354,303 | | Total interest-bearing Deposits | | | 654,326 | | | | (1,157,341 | ) | | | (133,920 | ) | | | (636,935 | ) | | | 254,196 | | | | 858,431 | | | | 47,105 | | | | 1,159,732 | | | Federal funds purchased | | | 0 | | | | 0 | | | | 2,652 | | | | 2,652 | | | | 0 | | | | 0 | | | | 0 | | | | 0 | | | Long term debit & other borrowing | | | (74,552 | ) | | | (298,095 | ) | | | 17,861 | | | | (354,786 | ) | | | 839,216 | | | | (6,946 | ) | | | (13,694 | ) | | | 818,575 | | Total interest-bearing Liabilities | | | 579,774 | | | | (1,455,436 | ) | | | (113,407 | ) | | | (989,069 | ) | | | 1,093,412 | | | | 851,485 | | | | 33,411 | | | | 1,978,307 | | | Interest differential | | | 840,378 | | | | (652,262 | ) | | | (134,509 | ) | | | 53,607 | | | | 1,475,817 | | | | (70,269 | ) | | | (57,272 | ) | | | 1,462,821 | |
| Volume/Rate variances were allocated in the following manner: |
| a. Changes affected by volume (change in volume times old rate) |
| b. Changes affected by rates (change in rates times old volume) |
| c. Changes affected by rate/volume (change in volume times change in rates) |
| The total for each category was arrived at by totaling the individual items in their respective categories. |
Provision for Loan Losses
The provision for loan losses charged to operations as of December 31, 20062008 was $500,000$2.1 million compared to $360,000$680,000 in 2005.2007. The provision for loan losses is based on our monthly evaluation of the loan portfolio and the adequacy of the allowance for loan losses in relation to total loans outstanding. We experienced strongmodest loan growth in 20062008 and we anticipate loan growth will continue, although a bit slower, which could require additional provisions for loan losses. Additionally, there are regulatory concerns about concentrations of commercial real estate loans among many financial institutions. We have a concentration of commercial real estate loans and although the loans are adequately collateralized, we determined that it is prudent to continue making a provision for loan losses. In addition to the above, in recent months the economy has demonstrated weakness and real estate values have declined. We are monitoring our loan portfolio in order to be aware of any concerns which may develop. 28
The economic climate so far remains strong and At year end the non-performing assets to total loans ratio continues to be below 1% at 0.41%was 2.54% as of December 31, 20062008 compared to 0.63%0.45% in 2005.2007. Non accrual loans were $820,000$6.2 million as of December 31, 20062008 compared to $944,000$800,000 as of December 31, 2005, a decline2007, an increase of 13.1%680%. Loans charged-off were $18,855$1.028 million and recoveries were $19,320$227,000 for 20062008 compared with $70,313$251,000 in charge-offs and $58,248$17,000 in recoveries for the same period in 2005. Resulting2007. The increase in more recoveries than charge offs in 2006.2008 is a result of multiple issues including an increase in total loans, a significant and growing recession during 2008 which caused more business failures and borrowers to become delinquent and unable to payback their loans, and a material drop in real estate values in the Bank’s lending area. Refer to page 6269,Note D for an analysis in the changes in allowance for loan losses including charge offs and recoveries. 29
SONOMA VALLEY BANCORP
AVERAGE BALANCES/YIELDS AND RATES PAID
Rate/Volume
| | | | | | | | | | | | | | | | | | | | | | | | | | | | | | | | | | | | | | | | | 2006 | | | 2005 | | | 2004 | | | | | Average | | | Income/ | | | Yield/ | | | Average | | | Income/ | | | Yield/ | | | Average | | | Income/ | | | Yield/ | | | | | Balance | | | Expense | | | Rate | | | Balance | | | Expense | | | Rate | | | Balance | | | Expense | | | Rate | | | ASSETS | | | | | | | | | | | | | | | | | | | | | | | | | | | | | | | | | | | | | | Interest-earning assets: | | | | | | | | | | | | | | | | | | | | | | | | | | | | | | | | | | | | | | Loans(2): | | | | | | | | | | | | | | | | | | | | | | | | | | | | | | | | | | | | | | Commercial | | $ | 136,909,555 | | | $ | 10,895,909 | | | | 7.96 | % | | $ | 109,030,041 | | | $ | 8,186,579 | | | | 7.51 | % | | $ | 98,242,841 | | | $ | 7,020,157 | | | | 7.15 | % | | | | | | | | | | | | | | | | | | | | | | | | | | | | Consumer | | | 25,167,482 | | | | 2,065,754 | | | | 8.21 | % | | | 19,216,697 | | | | 1,367,094 | | | | 7.11 | % | | | 14,223,761 | | | | 941,735 | | | | 6.62 | % | | Real estate construction | | | 19,431,136 | | | | 1,593,551 | | | | 8.20 | % | | | 19,741,512 | | | | 1,494,312 | | | | 7.57 | % | | | 19,134,306 | | | | 1,470,918 | | | | 7.69 | % | | Real estate mortgage | | | 15,624,447 | | | | 1,088,846 | | | | 6.97 | % | | | 10,502,449 | | | | 729,886 | | | | 6.95 | % | | | 5,178,002 | | | | 372,145 | | | | 7.19 | % | | Tax exempt loans (1) | | | 2,379,741 | | | | 195,558 | | | | 8.22 | % | | | 2,604,858 | | | | 215,214 | | | | 8.26 | % | | | 3,033,269 | | | | 254,332 | | | | 8.38 | % | | Leases | | | 44,438 | | | | 5,185 | | | | 11.67 | % | | | 37,486 | | | | 3,677 | | | | 9.81 | % | | | 36,061 | | | | 7,610 | | | | 21.10 | % | | Tax exempt leases (1) | | | 0 | | | | 0 | | | | 0.00 | % | | | 0 | | | | 0 | | | | 0.00 | % | | | 868 | | | | 0 | | | | 0.00 | % | | Unearned loan fees | | | (555,992 | ) | | | | | | | | | | | (478,473 | ) | | | | | | | | | | | (453,892 | ) | | | | | | | | | | | | | | | | | | | | | | | | | | | | | | | | | | | | | | | | | | | | | Total loans | | | 199,000,807 | | | | 15,844,803 | | | | 7.96 | % | | | 160,654,570 | | | | 11,996,762 | | | | 7.47 | % | | | 139,395,216 | | | | 10,066,897 | | | | 7.22 | % | | Investment securities | | | | | | | | | | | | | | | | | | | | | | | | | | | | | | | | | | | | | | Available for sale: | | | | | | | | | | | | | | | | | | | | | | | | | | | | | | | | | | | | | | Taxable | | | 25,545,606 | | | | 859,937 | | | | 3.37 | % | | | 33,559,732 | | | | 1,049,443 | | | | 3.13 | % | | | 23,264,663 | | | | 780,886 | | | | 3.36 | % | | Tax exempt (1) | | | 0 | | | | 0 | | | | 0.00 | % | | | 0 | | | | 0 | | | | 0.00 | % | | | 0 | | | | 0 | | | | 0.00 | % | | Hold to maturity: | | | | | | | | | | | | | | | | | | | | | | | | | | | | | | | | | | | | | | Taxable | | | 175,371 | | | | 5,128 | | | | 2.92 | % | | | 370,518 | | | | 10,149 | | | | 2.74 | % | | | 390,564 | | | | 10,094 | | | | 2.58 | % | | Tax exempt (1) | | | 15,897,167 | | | | 920,114 | | | | 5.79 | % | | | 16,604,344 | | | | 947,633 | | | | 5.71 | % | | | 17,187,291 | | | | 993,469 | | | | 5.78 | % | | | | | | | | | | | | | | | | | | | | | | | | | | | | | | | | | | Total investment securities | | | 41,618,144 | | | | 1,785,179 | | | | 4.29 | % | | | 50,534,594 | | | | 2,007,225 | | | | 3.97 | % | | | 40,842,518 | | | | 1,784,449 | | | | 4.37 | % | | Federal funds sold | | | 1,648,644 | | | | 74,102 | | | | 4.49 | % | | | 2,291,052 | | | | 59,256 | | | | 2.59 | % | | | 9,446,626 | | | | 106,176 | | | | 1.12 | % | | FHLB Stock | | | 1,045,871 | | | | 50,408 | | | | 4.82 | % | | | 814,701 | | | | 33,032 | | | | 4.05 | % | | | 599,670 | | | | 20,370 | | | | 3.40 | % | | Total Due from Banks/Interest | | | 157,468 | | | | 4,977 | | | | 3.16 | % | | | 61,200 | | | | 1,453 | | | | 2.37 | % | | | 154,083 | | | | 4,462 | | | | 2.90 | % | | Short term investments | | | 0 | | | | 0 | | | | 0.00 | % | | | 0 | | | | 0 | | | | 0.00 | % | | | 0 | | | | 0 | | | | 0.00 | % | | | | | | | | | | | | | | | | | | | | | | | | | | | | | | | | | | | | | | Total interest earning assets | | | 243,470,934 | | | $ | 17,759,469 | | | | 7.29 | % | | | 214,356,117 | | | $ | 14,097,728 | | | | 6.58 | % | | | 190,438,113 | | | $ | 11,982,354 | | | | 6.29 | % | | | | | | | | | | | | | | | | | | | | | | | | | | | | | | | | | | | | | Noninterest-bearing assets: | | | | | | | | | | | | | | | | | | | | | | | | | | | | | | | | | | | | | | Reserve for loan losses | | | (2,995,052 | ) | | | | | | | | | | | (2,668,551 | ) | | | | | | | | | | | (2,436,434 | ) | | | | | | | | | | Cash and due from banks | | | 6,077,171 | | | | | | | | | | | | 6,732,111 | | | | | | | | | | | | 9,319,173 | | | | | | | | | | | Premises and equipment | | | 1,078,565 | | | | | | | | | | | | 1,282,313 | | | | | | | | | | | | 1,369,737 | | | | | | | | | | | Other real estate owned | | | 0 | | | | | | | | | | | | 0 | | | | | | | | | | | | 0 | | | | | | | | | | | Other assets | | | 14,458,246 | | | | | | | | | | | | 12,841,172 | | | | | | | | | | | | 12,192,166 | | | | | | | | | | | | | | | | | | | | | | | | | | | | | | | | | | | | | | | | | | | | | | Total assets | | $ | 262,089,864 | | | | | | | | | | | $ | 232,543,162 | | | | | | | | | | | $ | 210,882,755 | | | | | | | | | | | | | | | | | | | | | | | | | | | | | | | | | | | | | | | | | | | | | | LIABILITIES AND SHAREHOLDERS’ EQUITY | | | | | | | | | | | | | | | | | | | | | | | | | | | | | | | | | | | | | | Interest-bearing liabilities: | | | | | | | | | | | | | | | | | | | | | | | | | | | | | | | | | | | | | | Interest-bearing deposits | | | | | | | | | | | | | | | | | | | | | | | | | | | | | | | | | | | | | | Interest-bearing transaction | | $ | 30,838,635 | | | $ | 50,928 | | | | 0.17 | % | | | 34,027,331 | | | $ | 57,905 | | | | 0.17 | % | | | 30,888,052 | | | $ | 51,744 | | | | 0.17 | % | | Savings deposits | | | 73,425,495 | | | | 1,363,563 | | | | 1.86 | % | | | 73,821,236 | | | | 826,657 | | | | 1.12 | % | | | 67,113,729 | | | | 434,671 | | | | 0.65 | % | | Time less than $100,000 | | | 26,544,506 | | | | 1,015,391 | | | | 3.83 | % | | | 20,600,270 | | | | 568,772 | | | | 2.76 | % | | | 18,739,735 | | | | 399,813 | | | | 2.13 | % | | Time $100,000 and over | | | 38,501,063 | | | | 1,602,820 | | | | 4.16 | % | | | 27,300,405 | | | | 851,427 | | | | 3.12 | % | | | 25,666,191 | | | | 667,862 | | | | 2.60 | % | | | | | | | | | | | | | | | | | | | | | | | | | | | | | | | | | | Total interest-bearing deposits | | | 169,309,699 | | | | 4,032,702 | | | | 2.38 | % | | | 155,749,242 | | | | 2,304,761 | | | | 1.48 | % | | | 142,407,707 | | | | 1,554,090 | | | | 1.09 | % | | Federal funds purchased | | | 0 | | | | 0 | | | | 0.00 | % | | | 0 | | | | 0 | | | | 0.00 | % | | | 0 | | | | 0 | | | | 0.00 | % | | Long term debit & other borrowings | | | 8,225,343 | | | | 425,681 | | | | 5.18 | % | | | 2,990,049 | | | | 97,799 | | | | 3.27 | % | | | 0 | | | | 0 | | | | 0.00 | % | | | | | | | | | | | | | | | | | | | | | | | | | | | | | | | | | | Total interest-bearing liabilities | | | 177,535,042 | | | $ | 4,458,383 | | | | 2.51 | % | | | 158,739,291 | | | $ | 2,402,560 | | | | 1.51 | % | | | 142,407,707 | | | $ | 1,554,090 | | | | 1.09 | % | | | | | | | | | | | | | | | | | | | | | | | | | | | | | | | | | | | | | Non interest-bearing liabilities: | | | | | | | | | | | | | | | | | | | | | | | | | | | | | | | | | | | | | | Demand deposits | | | 54,250,592 | | | | | | | | | | | | 47,591,444 | | | | | | | | | | | | 44,088,274 | | | | | | | | | | | Other liabilities | | | 5,193,491 | | | | | | | | | | | | 4,276,993 | | | | | | | | | | | | 3,587,532 | | | | | | | | | | | Shareholders’ equity | | | 25,110,739 | | | | | | | | | | | | 21,935,434 | | | | | | | | | | | | 20,799,242 | | | | | | | | | | | | | | | | | | | | | | | | | | | | | | | | | | | | | | | | | | | | | | Total liabilities and shareholders’ equity | | $ | 262,089,864 | | | | | | | | | | | $ | 232,543,162 | | | | | | | | | | | $ | 210,882,755 | | | | | | | | | | | | | | | | | | | | | | | | | | | | | | | | | | | | | | | | | | | | | | Interest rate spread | | | | | | | | | | | 4.78 | % | | | | | | | | | | | 5.06 | % | | | | | | | | | | | 5.20 | % | | Interest income | | | | | | $ | 17,759,469 | | | | 7.29 | % | | | | | | $ | 14,097,728 | | | | 6.58 | % | | | | | | $ | 11,982,354 | | | | 6.29 | % | | Interest expense | | | | | | | 4,458,383 | | | | 1.83 | % | | | | | | | 2,402,560 | | | | 1.12 | % | | | | | | | 1,554,090 | | | | 0.82 | % | | | | | | | | | | | | | | | | | | | | | | | | | | | | | | | | | | Net interest income/margin | | | | | | $ | 13,301,086 | | | | 5.46 | % | | | | | | $ | 11,695,168 | | | | 5.46 | % | | | | | | $ | 10,428,264 | | | | 5.48 | % | | | | | | | | | | | | | | | | | | | | | | | | | | | | | | | | | | | |
Non-interest Income | | | (1) | | Fully tax equivalent adjustments are based on a federal income tax rate of 34% in 2006, 2005 and 2004 | | (2) | | Non accrual loans have been included in loans for the purposes of the above presentation. Loan fees of approximately $471,000, 367,000 and $299,000 for the twelve months ended December 31, 2006, 2005 and 2004, respectively, were amortized to the appropriate interest income categories. |
30
SONOMA VALLEY BANCORP
Rate/Volume Analysis
| | | | | | | | | | | | | | | | | | | | | | | | | | | | | | | | | | | | | 2006 over 2005 | | | 2005 over 2004 | | | | | Volume | | | Rate | | | Vol/Rate | | | Total | | | Volume | | | Rate | | | Vol/Rate | | | Total | | | ASSETS | | | | | | | | | | | | | | | | | | | | | | | | | | | | | | | | | | Interest-earning assets: | | | | | | | | | | | | | | | | | | | | | | | | | | | | | | | | | | Loans: | | | | | | | | | | | | | | | | | | | | | | | | | | | | | | | | | | Commercial | | | 2,093,348 | | | | 490,547 | | | | 125,435 | | | | 2,709,330 | | | | 770,823 | | | | 356,459 | | | | 39,140 | | | | 1,166,422 | | | Consumer | | | 423,344 | | | | 210,218 | | | | 65,098 | | | | 698,660 | | | | 330,575 | | | | 70,157 | | | | 24,627 | | | | 425,359 | | | Real estate construction | | | (23,494 | ) | | | 124,693 | | | | (1,960 | ) | | | 99,239 | | | | 46,678 | | | | (22,568 | ) | | | (716 | ) | | | 23,394 | | | Real estate mortgage | | | 355,962 | | | | 2,015 | | | | 983 | | | | 358,960 | | | | 382,670 | | | | (12,291 | ) | | | (12,638 | ) | | | 357,741 | | | Tax exempt loans | | | (18,599 | ) | | | (1,157 | ) | | | 100 | | | | (19,656 | ) | | | (35,921 | ) | | | (3,723 | ) | | | 526 | | | | (39,118 | ) | | Leases | | | 682 | | | | 697 | | | | 129 | | | | 1,508 | | | | 301 | | | | (4,073 | ) | | | (161 | ) | | | (3,933 | ) | | Tax exempt leases | | | 0 | | | | 0 | | | | 0 | | | | 0 | | | | 0 | | | | 0 | | | | 0 | | | | 0 | | | Unearned fee income | | | 0 | | | | 0 | | | | 0 | | | | 0 | | | | 0 | | | | 0 | | | | 0 | | | | 0 | | | | | | | | | | | | | | | | | | | | | | | | | | | | | Total loans | | | 2,831,244 | | | | 827,013 | | | | 189,784 | | | | 3,848,041 | | | | 1,495,126 | | | | 383,962 | | | | 50,777 | | | | 1,929,865 | | | | | | | | | | | | | | | | | | | | | | | | | | | | | | | | | | | | | Investment securities: | | | | | | | | | | | | | | | | | | | | | | | | | | | | | | | | | | Available for sale: | | | | | | | | | | | | | | | | | | | | | | | | | | | | | | | | | | Taxable | | | (250,609 | ) | | | 80,272 | | | | (19,169 | ) | | | (189,506 | ) | | | 345,557 | | | | (53,379 | ) | | | (23,621 | ) | | | 268,557 | | | | | | | | | | | | | | | | | | | | | | | | | | | | | | | | | | | | | Tax-exempt | | | 0 | | | | 0 | | | | 0 | | | | 0 | | | | 0 | | | | 0 | | | | 0 | | | | 0 | | | Held to maturity: | | | | | | | | | | | | | | | | | | | | | | | | | | | | | | | | | | Taxable | | | (5,345 | ) | | | 685 | | | | (361 | ) | | | (5,021 | ) | | | (518 | ) | | | 604 | | | | (31 | ) | | | 55 | | | | | | | | | | | | | | | | | | | | | | | | | | | | | Tax-exempt | | | (40,360) | ) | | | 13,412 | | | | (571 | ) | | | (27,519 | ) | | | (33,696 | ) | | | (12,566 | ) | | | 426 | | | | (45,836 | ) | | | | | | | | | | | | | | | | | | | | | | | | | | | | Total investment Securities | | | (296,314 | ) | | | 94,369 | | | | (20,101 | ) | | | (222,046 | ) | | | 311,343 | | | | (65,341 | ) | | | (23,226 | ) | | | 222,776 | | | Federal funds sold | | | (16,615 | ) | | | 43,720 | | | | (12,259 | ) | | | (14,846 | ) | | | (80,426 | ) | | | 138,152 | | | | (104,647 | ) | | | (46,920 | ) | | FHLB Stock | | | 9,373 | | | | 6,234 | | | | 1,769 | | | | 17,376 | | | | 7,304 | | | | 3,944 | | | | 1,414 | | | | 12,662 | | | Due from banks-int bearing | | | 2,286 | | | | 481 | | | | 757 | | | | 3,524 | | | | (2,690 | ) | | | (804 | ) | | | 485 | | | | (3,009 | ) | | Short term investments | | | 0 | | | | 0 | | | | 0 | | | | 0 | | | | 0 | | | | 0 | | | | 0 | | | | 0 | | | | | | | | | | | | | | | | | | | | | | | | | | | | | Total interest-earning Assets | | | 2,529,973 | | | | 971,818 | | | | 159,950 | | | | 3,661,741 | | | | 1,730,658 | | | | 459,913 | | | | (75,197 | ) | | | 2,115,374 | | | | | | | | | | | | | | | | | | | | | | | | | | | | | | | | | | | | | | | | | | | | | | | | | | | | | | | | | | | | | | | LIABILITIES | | | | | | | | | | | | | | | | | | | | | | | | | | | | | | | | | | Interest-bearing liabilities: | | | | | | | | | | | | | | | | | | | | | | | | | | | | | | | | | | Interest-bearing deposits: | | | | | | | | | | | | | | | | | | | | | | | | | | | | | | | | | | Savings deposits | | | (5,426 | ) | | | (1,711 | ) | | | 160 | | | | (6,977 | ) | | | 5,259 | | | | 819 | | | | 83 | | | | 6,161 | | | Interest-bearing demand Deposits | | | (4,432 | ) | | | 544,255 | | | | (2,918 | ) | | | 536,906 | | | | 43,442 | | | | 316,875 | | | | 31,669 | | | | 391,986 | | | Time less than $100,000 | | | 164,120 | | | | 219,238 | | | | 63,261 | | | | 446,619 | | | | 39,695 | | | | 117,590 | | | | 11,675 | | | | 168,959 | | | Time $100,000 and over | | | 349,319 | | | | 285,104 | | | | 116,971 | | | | 751,393 | | | | 42,524 | | | | 132,598 | | | | 8,443 | | | | 183,565 | | | | | | | | | | | | | | | | | | | | | | | | | | | | | Total interest-bearing Deposits | | | 503,581 | | | | 1,046,885 | | | | 177,475 | | | | 1,727,941 | | | | 130,920 | | | | 567,882 | | | | 51,870 | | | | 750,671 | | | Federal funds purchased | | | 0 | | | | 0 | | | | 0 | | | | 0 | | | | 0 | | | | 0 | | | | 0 | | | | 0 | | | Long term debit & other borrowing | | | 171,237 | | | | 56,943 | | | | 99,702 | | | | 327,882 | | | | 0 | | | | 0 | | | | 97,799 | | | | 97,799 | | | | | | | | | | | | | | | | | | | | | | | | | | | | | Total interest-bearing Liabilities | | | 674,818 | | | | 1,103,829 | | | | 277,177 | | | | 2,055,823 | | | | 130,920 | | | | 567,882 | | | | 149,669 | | | | 848,470 | | | Interest differential | | | 1,855,156 | | | | (132,011 | ) | | | (117,227 | ) | | | 1,605,918 | | | | 1,599,739 | | | | (107,968 | ) | | | (224,866 | ) | | | 1,266,904 | | | | | | | | | | | | | | | | | | | | | | | | | | | |
Volume/Rate variances were allocated in the following manner:
| | | a. | | Changes affected by volume (change in volume times old rate) | | b. | | Changes affected by rates (change in rates times old volume) | | c. | | Changes affected by rate/volume (change in volume times change in rates) |
The total for each category was arrived at by totaling the individual items in their respective categories.
31
Non-interest Income
Non-interest income of $2.1 million for 2006 increased 6.4%2008 decreased 6.5% or $125,000 in comparison with$148,000 compared to the $2.0$2.3 million recorded in 2005.2007. Of the increase 74.6%decrease 52.7% or $78,000 was due to increasesa decrease in service charges on deposit accounts. In 2006accounts income, from service charges on deposit accounts increased 7.4% or $94,000 from $1.3 million in 2005 to $1.4 million in 2006. This increase51.4% was a result of both increasesdecreases in other fee income of $76,000 and the category of all other non-interest income showed an increase of 4.1% or $6,000. The $78,000 decrease in service charge income was a result of a $95,000 decrease in service charges received for overdrafts and growthNSF (non sufficient funds) checks. We have been more proactive closing customer’s accounts which show a strong history of newwriting NSF checks and maintaining overdrawn accounts. Other fee income showed an increasea decrease in 20062008 of 4.4%17.8% or $16,000$76,000 from $364,000$426,000 in 20052007 to $380,000$350,000 in 2006 and comprised 12.7% of the 2006 increase of $16,000.2008. The higherdecline in income is a result of an increasea decrease of $18,000$39,000 in income we earned from loan referrals, which increaseddecreased from $38,000$80,000 in 20052007 to $56,000$41,000 in 2006.2008. Also contributing to the increasedecrease was an increasea decline of $8,000 or an increase of 40.9%$16,000 in wire transfercredit card merchant fee income from $28,000$168,000 in 20052007 to $36,000$152,000 in 2006.2008 and a decrease of $15,000 in miscellaneous operation income. Miscellaneous operational income is a category reflecting one time payments or rebates that are not properly categorized elsewhere. 2007 reflected a higher number of one time only payments than 2008. All other non-interest income showed a 4.6%1.39% increase or $16,000$6,000 from $346,000$442,000 in 20052007 to $361,000$448,000 in 2006.2008. This is largely a result of an increase in the income generated by bank owned life insurance policies in 2006.2007. Income on the policies was $326,000$423,000 in 20052008 compared to $348,000$417,000 in 20062007 or yields of 3.60%4.00% and 3.63%4.14%, respectively. The earnings on these policies will increase as the balances increase and if market rates increase, the income produced by these policies should also increase.
Non-interest Expense Total non-interest expense increased 5.8%4.8% to $8.3$9.6 million in 20062008 from $7.8$9.2 million in 2005.2007. Non-interest expense represented 3.17%3.19% of average total assets in 20062008 and 3.38%3.20% in 2005.2007. The expense/asset ratio is a standard industry measurement of a bank’sbank's ability to control its overhead or non-interest costs. During 2007,2009, we will continue to emphasize cost controls, although certain costs, such as professional fees associated with the implementation and compliance with Sarbanes-Oxley, costs of company insurance and salary and benefit expense including workers compensation insurance and medical benefits are not controllable by management. Refer to Note I, page 6675 for a detailed description of Non-Interest Income and Other Non-Interest Expense.
Salaries and Benefits The most significant dollar increase was in the salaries and benefits category. Salary and benefits increased 12.0%.42% from $4.4$5.587 million in 20052007 to $4.9$5.610 million in 2006.2008. The increase is a result of increases in employee incentives paid as a result of the strong earnings in 2006, an increase of $148,000$222,000 in salary expense which grew from $490,000$3.3 million in 20052007 to $638,000$3.5 million in 2006. Additionally, accrual adjustments were necessary to the Supplemental Executive retirement plan due to additional accruals in 2006 for 2005. There was a $21,000 increase in employee group insurance from $218,000 in 2005 to $239,000 in 2006. An additional expense of $81,000 was expensed for restricted stock that was granted to bank officers.2008. At December 31, 20062008 and 2005December 31, 2007 total full-timefull time equivalent employees were 4954 and 50,51, respectively a decreasean increase of onethree full time equivalent employee.employees. Also contributing to the increase is normal merit increases. Year-end assets per employee were $5.7$6.0 million in 20062008 compared with $4.9$5.8 million in 2005.2007.
Premises and Equipment Expense relative to premises and equipment decreased 2.3% to $937,000 in 2008 from $959,000 in 2007. Most areas of premises and equipment showed declines except for lease expense. Lease expense increased 1.7%from $381,000 in 2007 to $1.016 million$393,000 in 2006 from $999,000 in 2005. The increase in 2006 is2008, a result of normal increases in lease expense from $347,000 in 2005 to $364,000 in 2006, a $17,000 (4.88%$12,000 (3.36%) increase. There were also increases in janitorial service, real property tax, additional costs for equipment maintenance, and an increase in software expense of $9,000, $10,000, $10,000 and $17,000 respectively. These increases were offset by declines in building maintenance and repair of $11,000 and depreciation of equipment as more equipment was fully depreciated of $27,000. The Bank 32
continues to emphasize security in its computer operations. Equipment and software are monitored and upgraded as appropriate to ensure confidentiality of customer and Company data contributing to additional increases in expense. We continue to emphasize the utilization of technology to accommodate customer and market demands.
Other Non-interest Expense The most significant dollar increase was in the area of other non-interest expense. Other non-interest expense declined by 3.7%showed an increase of 16.7% or $440,000 to $2.3$3.1 million in 20062008 from $2.4$2.6 million in 2005.2007. The decreaselargest percentage of this increase was due to increases in FDIC and other insurance. FDIC and other insurance was $133,000 in 2007 and increased to $264,000 in 2008, an increase of $131,000 or 29.7% of the total increase of $440,000. FDIC assessment showed the most significant increase of $130,000 from $26,000 in 2007 to $156,000 in 2008, an increase of 491.7%. The FDIC recently announced a special assessment for banks, which will have a significant effect on net income in 2009. Professional fees represented 22.13% or $98,000 of the $440,000 increase in other non-interest expense. Professional fees were $1.0 million in 2007 and grew to $1.1 million in 2008. In 2007 director retirement had a credit balance of $129,000 due to two director terminations. This year reflected normal expense for the director retirement accruals which resulted in an increase of $147,000. Loan expense represented 16.86% or $75,000 of the total increase in other non-interest expense was due to decreases in professional fees, FDIC and other insurance and loan expense which declined by 26.3%, 5.1% and 66.6%, respectively. Professional fees were $953,000 in 2005 and declined to $702,000 in 2006, a decline of $251,000. The categories of professional fees which showed the most significant decreases were in the areas of accounting and taxes, accruals for Sarbanes Oxley professional assistance, other professional fees, other exam fees and transfer agent fees. The delay in the implementation of Sarbanes Oxley, Rule 404, regarding internal controls of financial statement reporting has been delayed to December 31, 2007. We anticipate an increasegrew from $2,000 in 2007 to cover fees associated with$76,000 in 2008. Of the implementation. Expense for advertising and marketing increased $51,000 from $225,000increase $44,000 is expense on foreclosed property which in 2005 to $276,000 in 2006. The increases in this category arepart reflects a resultwrite down on the value of our involvement in the community, both through donations as well as participation in civic organizations. Additionally, shareholder relationsproperty. Loan appraisal expense showed an increase of $27,000 from a credit balance of $7,000 in 2006 over 2005.
Staff related expenses grew $5,000 from $202,0002007 to an expense of $20,000 in 2005 to $207,000 in 2006. These increases were a result of director and employee involvement in attending meetings and seminars and related costs. It2008. This is important that directors and employee keep up with the many regulatory changes in recent years and the regulators have increased their attention relativedue to the involvement of employees and directorsfact that in training.2008 we had additional appraisals performed on our real estate secured loans to analyze our collateral position.
Provision for Income Taxes The provision for income taxes increaseddecreased to an effective tax rate of 35.7%32.1% in 20062008 compared with 33.8%36.0% in 2005.2007. The higherlower effective tax rate is a reflection of tax benefits received for options exercised and tax credits resulting from the increasebank’s investment in taxable income when compared with income derived from tax exempt investments.California affordable housing. Income taxes reported in the financial statements include deferred taxes resulting from timing differences in the recognition of items for tax and financial reporting purposes.
Unaudited Quarterly Statement of Operations Data
(Dollars in thousands, except per share data) | | | | | | | | | | | | | | | | | | | | | | | | | | | | | | | | | | | | | Q4 | | | Q3 | | | Q2 | | | Q1 | | | Q4 | | | Q3 | | | Q2 | | | Q1 | | | | | 2006 | | | 2006 | | | 2006 | | | 2006 | | | 2005 | | | 2005 | | | 2005 | | | 2005 | | | Net interest income | | $ | 3,440 | | | $ | 3,298 | | | $ | 3,204 | | | $ | 2,978 | | | $ | 2,947 | | | $ | 2,865 | | | $ | 2,784 | | | $ | 2,703 | | | Provision for loan and lease losses | | | (180 | ) | | | (30 | ) | | | (240 | ) | | | (50 | ) | | | (15 | ) | | | (95 | ) | | | (160 | ) | | | (90 | ) | | Other operating income | | | 536 | | | | 534 | | | | 520 | | | | 505 | | | | 525 | | | | 498 | | | | 487 | | | | 459 | | | Other operating expenses | | | (2,098 | ) | | | (2,230 | ) | | | (1,973 | ) | | | (2,004 | ) | | | (1,964 | ) | | | (1,967 | ) | | | (1,944 | ) | | | (1,973 | ) | | | | | | | | | | | | | | | | | | | | | | | | | | | | Income before income taxes | | | 1,698 | | | | 1,572 | | | | 1,511 | | | | 1,429 | | | | 1,493 | | | | 1,301 | | | | 1,167 | | | | 1,099 | | | Provision for income taxes | | | (609 | ) | | | (560 | ) | | | (542 | ) | | | (507 | ) | | | (494 | ) | | | (453 | ) | | | (396 | ) | | | (368 | ) | | | | | | | | | | | | | | | | | | | | | | | | | | | | Net Income | | | 1,089 | | | | 1,012 | | | | 969 | | | | 922 | | | | 999 | | | | 848 | | | | 771 | | | | 731 | | | Per share: | | | | | | | | | | | | | | | | | | | | | | | | | | | | | | | | | | Basic earnings per share | | $ | .48 | | | $ | .45 | | | $ | .43 | | | $ | .41 | | | $ | .46 | | | $ | .39 | | | $ | .36 | | | $ | .34 | | | Diluted earnings per share | | $ | .46 | | | $ | .43 | | | $ | .41 | | | $ | .40 | | | $ | .43 | | | $ | .37 | | | $ | .34 | | | $ | .32 | |
33
| | | | Q4 2008 | | | | Q3 2008 | | | | Q2 2008 | | | | Q1 2008 | | | | Q4 2007 | | | | Q3 2007 | | | | Q2 2007 | | | | Q1 2007 | | | Net interest income | | $ | 3,759 | | | $ | 3,601 | | | $ | 3,552 | | | $ | 3,571 | | | $ | 3,681 | | | $ | 3,571 | | | $ | 3,640 | | | $ | 3,475 | | | Provision for loan and lease losses | | | (1,280 | ) | | | (300 | ) | | | (310 | ) | | | (220 | ) | | | (115 | ) | | | (140 | ) | | | (290 | ) | | | (135 | ) | | Other operating income | | | 514 | | | | 529 | | | | 531 | | | | 557 | | | | 568 | | | | 582 | | | | 579 | | | | 550 | | | Other operating expenses | | | (2,442 | ) | | | (2,454 | ) | | | (2,346 | ) | | | (2,382 | ) | | | (2,379 | ) | | | (2,331 | ) | | | (2,274 | ) | | | (2,198 | ) | | Income before income taxes | | | 551 | | | | 1,376 | | | | 1,427 | | | | 1,526 | | | | 1,755 | | | | 1,682 | | | | 1,655 | | | | 1,692 | | | Provision for income taxes | | | (126 | ) | | | (460 | ) | | | (480 | ) | | | (499 | ) | | | (593 | ) | | | (589 | ) | | | (582 | ) | | | (676 | ) | | Net Income | | | 425 | | | | 916 | | | | 947 | | | | 1,027 | | | | 1,162 | | | | 1,093 | | | | 1,073 | | | | 1,016 | | | Per share: | | | | | | | | | | | | | | | | | | | | | | | | | | | | | | | | | | Basic earnings per share | | $ | .19 | | | $ | .41 | | | $ | .42 | | | $ | .46 | | | $ | .52 | | | $ | .49 | | | $ | .48 | | | $ | .45 | | | Diluted earnings per share | | $ | .19 | | | $ | .40 | | | $ | .41 | | | $ | .45 | | | $ | .50 | | | $ | .47 | | | $ | .46 | | | $ | .43 | | | | | | | | | | | | | | | | | | | | | | | | | | | | | | | | | | | | | | | | | | | | | | | | | | | | | | | | | | | | | | | | | | | | | |
BALANCE SHEET ANALYSIS
Investment Securities
Investment securities were $36.8$20.4 million at December 31, 2006,2008, a 27.0%10.2% decline from the $50.4$22.8 million at December 31, 2005.2007. At year end 2006,2008, the overall portfolio had a market value of $36.9$20.6 million compared with an amortized cost of $37.1$20.4 million. We purchasespurchase securities rated A or higher by Standard and Poor’s and/or Moody’s Investors Service. In the event a security is downgraded, we will monitor the investment more closely or sell if appropriate. Local tax-exempt bonds are occasionally purchased without an A rating. Securities are classified as held to maturity (HTM) if we have both the intent and the ability to hold these securities to maturity. As of December 31, 2006,2008, we had securities totaling $15.8$13.9 million with a market value of $16.0$14.0 million categorized as held to maturity. Decisions to acquire municipal securities, which are generally placed in this category, are based on tax planning needs and pledge requirements. Securities are classified as available for sale (AFS) if we intend to hold these debt securities for an indefinite period of time, but not necessarily to maturity. Investment securities which are categorized as available for sale are acquired as part of the overall asset and liability management function and serve as a primary source of liquidity. Decisions to acquire or dispose of different investments are based on an assessment of various economic and financial factors, including, but not limited to, interest rate risk, liquidity and capital adequacy. Securities held in the available for sale category are recorded at market value, which is $21.0$6.6 million compared to an amortized cost of $21.3$6.6 million as of December 31, 2006.2008. There were sixteen Federal Farm Credit Bank, Federal Home Loan Bank, Federal Home Loan Mortgage Corporation or Federal National Mortgage Associationequity securities of $16.0 million and five U. S. Treasury securities $4.9 million$17,000 in the AFS portfolio and twenty one municipalfive securities of $6.5$1.5 million in the HTM portfolio that are temporarily impaired as of December 31, 2006.2008. Unrealized losses totaled $31,000 on equity securities and $100,000 on municipal securities. Of the above, there were sixteen Federal Farm Credit Bank, Federal Home Loan Mortgage Agency, Federal Home Loan Bank and Federal National Mortgage Association15 equity securities of $16.0 million and five U. S. Treasury securities of $4.9 millionor $16,000 in the AFS portfolio and fifteenfive municipal securities of $4.9$1.5 million in the HTM portfolio that have been in a continuous loss position for 12 months or more as of December 31, 2006.2008. The primary cause of the impairment of these securities is interest rate volatility inherent in a rising rate environment which causesdue to market volatility and downgrades of municipal insurers causing municipal securities to rely on the market valueunderlying rating of the security to decline. Management understood the potential market risks at the time of acquisition and determined the benefit to us of the higher interest rates received moremunicipality which is typically lower than offset the potential deterioration in value.AAA rated. It is our intention to carry the securities to maturity date, at which time we will receive face value for the securities at no loss. The equity securities are minimal shares of local and peer group banks so that we may better review their financial and compensation information. Although the quoted market values fluctuate, investment securities are generally held to maturity, and accordingly, gains and losses to the income statement are recognized upon sale, or at such time as management determines that a permanent decline in value exists. In theour opinion, of management, there was no investment in securities at December 31, 20062008 that constituted a material credit risk to the Company. The lower market value to amortized costs was a result of the increase in market interest rates and not an indication of lower credit quality. There is some uncertainty in the market relative to the companies insuring the municipal securities that we hold. We are monitoring this situation very closely and believe that the municipalities will be able to fulfill their obligations and there will be no need to rely on the insurance companies for payment. If the insurance companies are down graded it could lower the rating on the securities and therefore affect the fair value. The table on the following pagebelow shows the components of the investment portfolio and average yields. For further information concerning our total securities portfolio, including market values and unrealized gains and losses, refer to Note C of the Notes to Consolidated Financial Statements on page 58.66. 34
| | | | | | | | | | | | | | | | | | | | | | | | | | | | | Twelve Months Ended 12/31/06 | | | Twelve Months Ended 12/31/05 | | | | | Average | | | Income/ | | | Yield/ | | | Average | | | Income/ | | | Yield/ | | | | | Balance | | | Expense | | | Rate | | | Balance | | | Expense | | | Rate | | | | | | | Investment securities: | | | | | | | | | | | | | | | | | | | | | | | | | | U.S. Treasury securities | | $ | 5,319,515 | | | $ | 177,501 | | | | 3.34 | % | | $ | 5,096,320 | | | $ | 169,259 | | | | 3.32 | % | | U.S. federal agency issues | | | 20,201,000 | | | | 681,782 | | | | 3.37 | % | | | 28,463,381 | | | | 880,184 | | | | 3.09 | % | | State, county & munis | | | 16,072,538 | | | | 925,242 | | | | 5.76 | % | | | 16,974,862 | | | | 957,782 | | | | 5.64 | % | | Other securities | | | 25,091 | | | | 654 | | | | 2.61 | % | | | 31 | | | | 0 | | | | 0.00 | % | | | | | | | | | | | | | | | | Total investment securities | | $ | 41,618,144 | | | $ | 1,785,179 | | | | 4.29 | % | | $ | 50,534,594 | | | $ | 2,007,225 | | | | 3.97 | % | | | | | | | | | | | | | | |
Loans| | | Twelve Months Ended 12/31/08 | | | | Twelve Months Ended 12/31/07 | | | | | Average | | | Income/ | | | Yield/ | | | | Average | | | Income/ | | | Yield/ | | | | | Balance | | | Expense | | | Rate | | | | Balance | | | Expense | | | Rate | | | | | | | | | | | | | | | | | | | | | | | | Investment securities: | | | | | | | | | | | | | | | | | | | | | U.S. Treasury securities | | $ | 902,378 | | | $ | 18,457 | | | | 2.05 | % | | | $ | 2,953,303 | | | $ | 99,747 | | | | 3.38 | % | | U.S. federal agency issues | | | 3,270,640 | | | | 118,062 | | | | 3.61 | % | | | | 9,668,731 | | | | 360,231 | | | | 3.73 | % | | State, county & munis | | | 13,916,098 | | | | 803,827 | | | | 5.78 | % | | | | 15,689,127 | | | | 980,182 | | | | 6.25 | % | | Other securities | | | 26,219 | | | | 561 | | | | 2.14 | % | | | | 37,410 | | | | 1,231 | | | | 3.29 | % | | Total investment securities | | $ | 18,115,335 | | | $ | 940,907 | | | | 5.19 | % | | | $ | 28,348,571 | | | $ | 1,441,391 | | | | 5.08 | % |
Loans
A comparative schedule of average loan balances is presented in the table on page 30;35; year-end balances are presented in Note D to the Consolidated Financial Statements on page 61.69. Loan balances, net of deferred loan fees at December 31, 2006,2008, were $219.6$267.4 million, an increase of 28.3%6.8% over 2005.2007. Commercial loans, comprising 66.6%68.4% of the portfolio, increased $28.0$5.0 million, or 23.6%2.8% over 20052007 showing the greatest change in volume of all categories. Included in Commercial loans are loans made for commercial purposes and secured by real estate. Consumer loans showed the strongest growth of $7.4 million or 25.3%. The growth is both a result of new loans as well as advances against existing home equity lines of credit. Real Estate Mortgage and Real Estate MortgageConstruction loans bothalso showed growth over 20052007 of 27.5%12.4% and 29.5%8.3% or $6.0$2.2 million and $3.9$2.1 million, respectively. Growth in home equity loans has contributed to the increase in Consumer loans in 2006 from $21.8 million in 2005 to $27.8 million at year end 2006. During 20062008 we were able to continue to expand the conventional real estate mortgage loan portfolio, as Real Estate Mortgage loans grew from $13.3$17.9 million in 20052007 to $17.2$20.2 million in 2006.2008. It is anticipated that the growth rate will be more modest in 20072009 due to the increasetightened lending standards and declines in interest rates. property values. Real Estate Construction loans vary from year to year due to variability in the construction loans progress and Lease Financing Receivables also showed increases over 2005.seasonability. At 2008 year end, Real Estate Construction loans showwere $27.9 million, an increase of 58.8%$2.1 million or $10.68.3% over $25.8 million from $18.0 million in 2005 to $28.6 million in 2006. This increase is a resultas of seasonality in construction loans and as projects are completed construction loans could show a decline. year end 2007. Lease Financing Receivables increasedshowed a decline over 2007. Lease Financing Receivables decreased by 39.5%18.6% or $10,000$4,000 from $26,000$22,000 in 20052007 to $36,000$18,000 in 2006.2008. Customer interest in lease financing receivables has declined in our market and we do not see this changing in the foreseeable future.
Risk Elements
The majority of our loan activity is with customers located within Sonoma County. Approximately 90.5%91.3% of the total loan portfolio is secured by real estate located in our service area. Significant concentrations of credit risk may exist if a number of loan customers are engaged in similar activities and have similar economic characteristics. We believe the Company has policies in place to identify problem loans and to monitor concentrations of credit (see Note O, on page 7584 of the Consolidated Financial Statements, Concentration of Credit Risk). Based on its risk management review and a review of its loan portfolio, management believes that its allowance for loan losses as of December 31, 2006,2008, is sufficient to absorb losses inherent in the loan portfolio. This assessment is based upon the best available information and does involve uncertainty and matters of judgment. Accordingly, the adequacy of the loan loss reserve cannot be determined with precision, but is subject to periodic review, and could be susceptible to significant change in future periods. 35
Loan Commitments and Letters of Credit
Loan commitments are written agreements to lend to customers at agreed upon terms, provided there are no violations of any condition established in the contract. Commitments generally have fixed expiration dates or other termination clauses. Loan commitments may have variable interest rates and terms that reflect current market conditions at the date of commitment. Because many of the commitments are expected to expire without being drawn upon, the amount of total commitments does not necessarily represent our anticipated future funding requirements. Unfunded loan commitments were $42.0$42.3 million at December 31, 20062008 and $48.6$51.5 million at December 31, 2005.2007. The increasedecrease at 20062008 year end is partially a result of the lag in advances on existing Real Estate Construction loans as mentioned in the prior “Loans” section above.section. Standby letters of credit commit us to make payments on behalf of customers when certain specified events occur. Standby letters of credit are primarily issued to support customers’customers' financing requirements of twelve months or less and must meet our normal policies and collateral requirements. Standby letters of credit outstanding were $348,000$118,000 at December 31, 20062008 and $348,000$158,000 at December 31, 2005.2007.
Nonperforming Assets
Management classifies all loans as non-accrual loans when they become more than 90 days past due as to principal or interest, or when the timely collection of interest or principal becomes uncertain, if earlier, unless they are adequately secured and in the process of collection. A loan remains in a non-accrual status until both principal and interest have been current for six months and meets cash flow or collateral criteria, or when the loan is determined to be uncollectible and is charged off against the allowance for loan losses, or in the case of real estate loans, is transferred to other real estate owned. A loan is classified as a restructured loan when the interest rate is reduced, when the term is extended beyond the original maturity date, or other concessions are made by us, because of the inability of the borrower to repay the loan under the original terms. We had loans of $820,000$6.2 million in non-accrual status at December 31, 20062008 and $994,000$800,000 at December 31, 2005.2007. There were $157,677$2.8 million in loans 90 days or more past due at December 31, 20062008 and $259,189$601,238 in loans 90 days or more past due at December 31, 2005.2007. Occasionally, we will have more loans in non-accrual status than are 90 days past due following the guidelines in the above paragraph or if management determines the collection of principal or interest is unlikely.
Allowance for Loan Losses
The allowance for loan losses is maintained at a level considered adequate to provide for losses that can be reasonably anticipated. The allowance is increased by provisions charged to operating expense and reduced by charge-offs, net of recoveries. The allowance is based on estimates, and ultimate losses may vary from the current estimates. These estimates are reviewed monthly and, as adjustments become necessary, they are reported in earnings in the periods in which they become known. The review process is intended to identify loan customers who may be experiencing financial difficulties. In these circumstances, a specific reserve allocation or charge-off may be recommended. Other factors considered by management in evaluating the adequacy of the allowance include: loan volume, historical net loan loss experience, the condition of industries and geographic areas experiencing or expected to experience economic adversities, credit evaluations, and current economic conditions. The allowance for loan losses is not a precise amount, but based on the factors above, represents management’smanagement's best estimate of losses that may be ultimately realized from the current loan portfolio. 36
Worsening conditions in certain economic sectorsthe general economy and geographic areas couldreal estate markets will likely continue to adversely affect the loan portfolio, necessitatingwhich could necessitate materially larger provisions for loan losses than currently estimated.in prior periods. The drastic changes in the availability of credit during 2008 and continuing into 2009 has negatively impacted most asset values which serve as collateral to the majority of the Bank’s loans. However, as of December 31, 2006,2008, we believe the overall allowance for loan losses is adequate based on our analysis of conditions at that time. At December 31, 2006,2008, the allowance for loan losses was $3.3$5.0 million, or 1.88% of year end loans, compared with $3.7 million or 1.49% of year end loans compared with $2.8 million or 1.62% of year end loans at December 31, 2005.2007. The declineincrease in the allowance is consistent witha result of the loan losses experienced in 2006growth and our review and analysis of the portfolio.portfolio, due to deterioration in Real Estate values and poor economic conditions.
Net charge-offs to average loans decreasedincreased when compared with the prior year. There were more recoveries than charge-offs in 2006 and there wereWe recorded net losses of $12,000$801,000 or .01%.31% of average loans in 2005.2008 compared to net losses of $233.8 in 2007 or .10% of average loans. The decline in net charge offs in 2006increase reflects our attention and effort in managing and collecting past due loans and charged-off loans by encouraging the customer to bring them to a current status or to pay them off and management’s desire to quickly charge off a loan when it is determined to be uncollectible. The prompt charge-off of loans has increased the quality of the loan portfolio. Deposits
Deposits
A comparative schedule of average deposit balances is presented in the table on page 3035;year-end deposit balances are presented in the table below.
Total deposits increased $17.0$17.9 million (7.9%)or 7.6% in 2006,2008, to $232.8$253.9 million compared to $215.8$236.0 million in 2005. Demand deposits,2007. Savings, time deposits greater than $100,000, and other time depositdeposits and interest bearing checking showed increases over 2005.2007. The deposits showing the strongest growth were timesavings, which increased $14.8 million or 20.1% from $73.5 million in 2007 to $88.3 million in 2008. This increase can be attributed to customers opting for liquidity and the low rates offered on all deposits. Time deposits greater than $100,000 which increased $12.1$6.5 million or 37.7%14.8% from $32.0 million in 2005 to $44.1 million in 2006. Demand deposits increased $9.2 million or 18.8% from $49.5$44.2 million to $58.7 million and other$50.7 million. Other time deposits grew 12.9%to $35.6 million in 2008 from $29.6 million as of year end 2007, growth of $6.0 million or $3.120.1%. Showing a smaller increase was interest bearing checking, which increased $928,000 to $31.1 million from $24.5$30.1 million.
Non-interest bearing demand declined $10.3 million or 17.6% from $58.6 million in 2007 to $27.6 million. The growth in both categories$48.3 million at year end. Non-interest bearing demand is 19.0% of timetotal deposits, can be attributed to special rate promotions attracting new deposits and customers movingdown from interest checking and money market to time deposits.24.8% at year end 2007. Interest bearing checking and savings (including money market accounts) declined $5.6 million (15.7%) and $1.9 million (2.5%), respectively. The increase in time deposit rates may have caused funds to shift to time deposits from these accounts or the funds may have moved to broker fund accounts.
The composition of deposits for the years ending December 31, 20062008 and 20052007 are as follows: | | | | | | | | | | | | | | | | | | | | | December 31, | | Percentage | | December 31, | | Percentage | | | | 2006 | | of Total | | 2005 | | of Total | | Interest-bearing Transaction Deposits | | $ | 29,983,572 | | | | 12.9 | % | | $ | 35,586,113 | | | | 16.6 | % | | Savings deposits | | | 72,346,136 | | | | 31.1 | % | | | 74,218,076 | | | | 34.4 | % | | Time deposits, over $100,000 | | | 44,067,435 | | | | 18.9 | % | | | 32,011,640 | | | | 14.8 | % | | Other time deposits | | | 27,629,801 | | | | 11.9 | % | | | 24,482,074 | | | | 11.3 | % | | | | | | | | Total interest-bearing deposits | | | 174,026,944 | | | | 74.8 | % | | | 166,297,903 | | | | 77.1 | % | | Noninterest-bearing demand | | | 58,740,471 | | | | 25.2 | % | | | 49,460,864 | | | | 22.9 | % | | | | | | | | Total deposits | | $ | 232,767,415 | | | | 100.0 | % | | $ | 215,758,767 | | | | 100.0 | % | | | | | | |
37
| | | December 31, | | | Percentage | | | December 31, | | | Percentage | | | | | 2008 | | | of Total | | | 2007 | | | of Total | | | | | | | | | | | | | | | | | Interest-bearing Transaction Deposits | | $ | 31,062,597 | | | | 12.2 | % | | $ | 30,135,049 | | | | 12.8 | % | | Savings deposits | | | 88,317,397 | | | | 34.8 | % | | | 73,528,081 | | | | 31.1 | % | | Time deposits, over $100,000 | | | 50,694,468 | | | | 20.0 | % | | | 44,160,741 | | | | 18.7 | % | | Other time deposits | | | 35,591,280 | | | | 14.0 | % | | | 29,634,626 | | | | 12.6 | % | | Total interest-bearing deposits | | | 205,665,742 | | | | 81.0 | % | | | 177,458,497 | | | | 75.2 | % | | Noninterest-bearing demand | | | 48,279,759 | | | | 19.0 | % | | | 58,589,202 | | | | 24.8 | % | | Total deposits | | $ | 253,945,501 | | | | 100.0 | % | | $ | 236,047,699 | | | | 100.0 | % | | | | | | | | | | | | | | | | | | |
Capital
The Bank is subject to FDIC regulations governing capital adequacy. The FDIC has adopted risk-based capital guidelines which establish a risk-adjusted ratio relating capital to different categories of assets and off-balance sheet exposures. Under the current guidelines, as of December 31, 2006,2008, the Bank was required to have minimum Tier I and total risk-based capital ratios of 4% and 8%, respectively. To be well capitalized under Prompt Corrective Action Provisions requires minimum Tier I and total risk-based capital ratios to be 6% and 10%, respectively. The FDIC has also adopted minimum leverage ratio guidelines for compliance by banking organizations. The guidelines require a minimum leverage ratio of 4% of Tier 1 capital to total average assets. Banks experiencing high growth rates are expected to maintain capital positions well above the minimum levels. The leverage ratio, in conjunction with the risk-based capital ratio, constitutes the basis for determining the capital adequacy of banking organizations. Based on the FDIC’sFDIC's guidelines, the Bank’sBank's total risk-based capital ratio at December 31, 20062008 was 11.03%11.32% and its Tier 1 risk-based capital ratio was 9.78%10.06%. The Bank’sBank's leverage ratio was 9.13%9.22%. All the ratios exceed the minimum guidelines of 8.00%, 4.00% and 4.00%, respectively. The total risk based capital, Tier 1 risk based capital and leverage ratios for the Company at December 31, 2005,2007, were 11.93%10.98%, 10.68%9.73% and 9.61%9.21%, respectively. The capital ratios for the Company at December 31, 2006,2008, were 11.51%11.50%, 10.26%10.24% and 9.57%9.38%, respectively. In November 2008, the company applied for funds through the U.S. Treasury’s Capital Purchase Program. On December 17, 2008, we were preliminarily approved to receive capital in the form of Senior Preferred shares of $8,653,000. This preliminary approval was pending shareholder approval of a change to our Articles of Incorporation allowing us to issue preferred shares. On February 11, 2009 shareholder approval was received and the Articles of Incorporation were amended. On February 20, 2009, the Company entered into a Letter Agreement with the United States Department of the Treasury pursuant to the Troubled Asset Relief Program Capital Purchase Program. Under the terms of the Letter Agreement, the Company issued to the Treasury, 8,653 shares of senior preferred stock and a warrant to acquire up to 433.00433 shares of a separate series of senior preferred stock for an aggregate purchase price of $8,653,000, pursuant to the standard Capital Purchase Program terms and conditions for non-public companies. In February 2001, we approved a program to repurchase Sonoma Valley Bancorp stock up to $1.0 million and in August 2002 we approved the repurchase of an additional $1.0 million of Sonoma Valley Bancorp stock. As of December 31, 2006,2005, $1,580,162 had been repurchased and retired, net of options which were exercised and then subsequently repurchased and retired. In February 2006 we approved the repurchase of 60,000 shares of Sonoma Valley Bancorp stock, and in October 2006 we approved an additional 60,000 shares of Sonoma Valley Bancorp stock and in July, 2007 we approved an additional 60,000 shares of Sonoma Valley Bancorp stock. As ofDuring the twelve months ended December 31, 2006, 55,028 shares were repurchased and retired of which 15,035 shares or $364,729 were a part of the amount approved August 2002. During the twelve months ended December 31, 2007, 100,415 shares were repurchased and in 2007 11,121retired. During the twelve months ended December 31, 2008, 1,190 shares have been repurchased and retired. Refer to page 38,33, for a discussion of the changes in capital and page 50pages 57 and 58 for the table of “Changes in Shareholders’ Equity.” We believe that the Bank’sBank's current capital position, which exceeds guidelines established by industry regulators, is adequate to support our business.business.
Off Balance Sheet Commitments and Contractual Obligations
Our off balance sheet commitments consist of commitments to extend credit and standby letters of credit. These commitments are extended to customers in the normal course of business and are described on page 36,42, Loan Commitments and Letters of Credit and in Note N to the Consolidated Financial Statements on page 74.83. We also hashave contractual obligations consisting of operating leases for various facilities and payments to participants under our supplemental executive retirement plan, director retirement plan and deferred compensation plan, which are described in Note H on page 64.73. 38
The following table summarizes our contractual obligations as of December 31, 2006.2008. | | | | | | | | | | | | | | | | | | | | | | | | | Payments due by period | | | | | | | | | Less than | | | | | | | | | | | More than | | | Contractual Obligations | | Total | | | 1 year | | | 1-3 years | | | 3-5 Years | | | 5 years | | | Operating Lease Obligations | | | $961,045 | | | | $363,699 | | | | $570,960 | | | | $26,386 | | | | — | | | | | | | | | | | | | | | | | | | | | | | | | Executive Officer Supplemental Retirement | | | $10,006,965 | | | | — | | | | $55,184 | | | | $568,122 | | | | $9,383,659 | | | | | | | | | | | | | | | | | | | | | | | | | Federal Home Loan Bank - Long Term Borrowings | | | $5,000,000 | | | | — | | | | $5,000,000 | | | | — | | | | — | | | | | | | | | | | | | | | | | | | | | | | | | Director Retirement Plan | | | $1,234,276 | | | | $7,917 | | | | $19,510 | | | | $38,397 | | | | $1,168,452 | | | | | | | | | | | | | | | | | | | | | | | | | Deferred Compensation | | | $1,448,181 | | | | $11,452 | | | | $34,987 | | | | $96,572 | | | | $1,305,170 | |
| | | Payments due by period | | | Contractual Obligations | | Total | | | Less than 1 year | | | 1-3 years | | | 3-5 Years | | | More than 5 years | | | Operating Lease Obligations | | $ | 432,680 | | | $ | 249,422 | | | $ | 108,487 | | | $ | 72,651 | | | $ | 2,120 | | | Executive Officer Supplemental Retirement | | $ | 10,475,933 | | | $ | 225,109 | | | $ | 577,495 | | | $ | 704,772 | | | $ | 8,968,557 | | | Federal Home Loan Bank - Long Term Borrowings | | $ | 30,000,000 | | | $ | 25,000,000 | | | $ | 5,000,000 | | | | -- | | | | -- | | | Director Retirement Plan | | $ | 1,050,518 | | | $ | 10,200 | | | $ | 39,337 | | | $ | 89,455 | | | $ | 911,636 | | | Deferred Compensation | | $ | 4,614,626 | | | $ | 242,891 | | | $ | 569,969 | | | $ | 644,919 | | | $ | 3,156,847 | |
Liquidity Management and Capital Resources
Our liquidity is determined by the level of assets (such as cash, federal funds sold and available-for-sale securities) that are readily convertible to cash to meet customer withdrawal and borrowing needs. Deposit growth also contributes to our liquidity. We review our liquidity position on a regular basis to verify that it is adequate to meet projected loan funding and potential withdrawal of deposits. We have a comprehensive Asset and Liability Policy which we use to monitor and determine adequate levels of liquidity. At year end 2006,2008, our primary liquidity ratio (adjusted liquid assets to deposits and short term liabilities) was 11.4%7.72% compared to 20.1%5.9% and 18.5%11.4% at year end 20052007 and 2004,2006, respectively. Available liquidity which includes the ability to borrow at the Federal Home Loan Bank wasand CDARS deposits were 27.1% or $87.1 million in December 31, 20062008 and 33.8%29.4% or $87.1 million and 31.6%38.2% or $106.0 million in 20052007 and 2004,2006, respectively. Management expects that liquidity will remain adequate throughout 2007, with deposit growth, security maturities and borrowing capacity offsetting the strong loan growth we are experiencing.2009, if deposits continue to grow. Any excess funds will be invested in quality liquid assets, such as U.S. Treasury and Agency securities. Management believes that the Company has adequate liquidity and capital resources to meet its short term and long term commitments. Market Risk Management
Overview. Market risk is the risk of loss from adverse changes in market prices and rates. Our market risk arises primarily from interest rate risk inherent in our loan, investment and deposit functions. The goal for managing our assets and liabilities is to maximize shareholder value and earnings while maintaining a high quality balance sheet without exposing us to undue interest rate risk. Our Board of Directors has overall responsibility for the interest rate risk management policies. Sonoma Valley Bank has an Asset and Liability Management Committee (ALCO) that establishes and monitors guidelines to control the sensitivity of earnings to changes in interest rates. Asset/Liability Management.Activities involved in asset/liability management include but are not limited to lending, accepting and placing deposits and investing in securities. Interest rate risk is the primary market risk associated with asset/liability management. Sensitivity of earnings to interest rate changes arises when yields on assets change in a different time period or in a different amount from that of interest costs on liabilities. To mitigate interest rate risk, the structure of the balance sheet is managed with the goal that movements of interest rates on assets and liabilities are correlated and contribute to earnings even in periods of 39
volatile interest rates. When interest rates increase, the market value of securities held in the investment portfolio declines. Generally, this decline is offset by an increase in earnings. When interest rates decline, the market value of securities increases while earnings decrease due to our asset sensitivity caused by the variable rate loans. Usually we are able to mitigate the risk from changes in interest rates with this balance sheet structure. At the present time, the market is experiencing an anomaly from historical norms. While short-term rates have increased over the past year as a result of the Federal Open Market Committee increasing the Federal Funds target rate from 4.25% to 5.25%, a 100 basis point increase, the long term interest rates have only increased about 24 basis points when compared to December 2005. The asset/liability management policy sets limits on the acceptable amount of variance in net interest margin and market value of equity under changing interest environments. We use simulation models to forecast earnings, net interest margin and market value of equity. Simulation of earnings is the primary tool used to measure the sensitivity of earnings to interest rate changes. Using computer-modeling techniques, we are able to estimate the potential impact of changing interest rates on earnings. A balance sheet forecast is prepared quarterly using inputs of actual loans, securities and interest bearing liabilities (i.e. deposits/borrowings) positions as the beginning base. The forecast balance sheet is processed against five interest rate scenarios. The scenarios include 100 and 200 basis point rising rate forecasts, a flat rate forecast and 100 and 200 basis point falling rate forecasts which take place within a one year time frame. The net interest income is measured during the year assuming a gradual change in rates over the twelve-month horizon. Our 20072009 net income, as forecast below, was modeled utilizing a forecast balance sheet projected from year end 20062008 balances. The following table summarizes the effect on net income of ±100+100, +200 and ±200+300 basis point changes in interest rates as measured against a constant rate (no change) scenario. Interest Rate Risk Simulation of Net Income as of December 31, 2006
2008 (In thousands)
| | | | | | Variation from a constant rate scenario | | | $ Change in Net Income | +200bp+300bp | | | (238 | )(162) | +100bp+200bp | | | (125 | )(199) | -100bp+100bp | | | (166 | ) | -200bp | | | (399 | )(146) |
The simulations of earnings do not incorporate any management actions, which might moderate the negative consequences of interest rate deviations. Therefore, they do not reflect likely actual results, but serve as conservative estimates of interest rate risk. Since the primary tool used by management to measure and manage interest rate exposure is a simulation model, use of the model to perform simulations reflecting changes in interest rates over a twelve month horizon enables management to develop and initiate strategies for managing exposure to interest rate risks. Our management believes that both individually and in the aggregate its modeling assumptions are reasonable, but the complexity of the simulation modeling process results in a sophisticated estimate, not an absolutely precise calculation of exposure.
Interest Rate Sensitivity Analysis. Interest rate sensitivity is a function of the repricing characteristics of the portfolio of assets and liabilities. These repricing characteristics are the time frames within which the interest-bearing assets and liabilities are subject to change in interest rates either at replacement, repricing or maturity. Interest rate sensitivity management focuses on the maturity of assets and liabilities and their repricing during periods of changes in market interest rates. Interest rate sensitivity is measured as the difference between the volumes of assets and liabilities in the current portfolio that are subject to repricing at various time horizons. The differences are known as interest sensitivity gaps.
A positive cumulative gap may be equated to an asset sensitive position. An asset sensitive position in a rising interest rate environment will cause a bank’s interest rate margin to expand. This results as floating or 40
variable rate loans reprice more rapidly than fixed rate certificates of deposit that reprice as they mature over time. Conversely, a declining interest rate environment will cause the opposite effect. A negative cumulative gap may be equated to a liability sensitive position. A liability sensitive position in a rising interest rate environment will cause a bank’s interest rate margin to contract, while a declining interest rate environment will have the opposite effect. The table above shows net interest income declining both when rates increase and when rates decline. Although we are usually asset sensitive, which would cause the Bank’s net interest margin to expand when rates increase, the simulation is showing a negative change in net interest income both in a rising and declining rate environment due to the need to rapidly increase deposit rates. The decline in net income in the rising rate environment is a result of our conservative evaluation of the market pressure to increase rates on deposits, which causes a decline in the net interest margin.
The following table sets forth the dollar amounts of maturing and/or repricing assets and liabilities for various periods. This does not include the impact of prepayments or other forms of convexity caused by changing interest rates. Historically, this has been immaterial and estimates for them are not included.
We have more liabilities than assets repricing during the next year. Usually because our asset rates change more than deposit rates, our interest income will change more than the cost of funds when rates change. For the current quarter, we are making a more conservative assumption. Historically, we have been able to raise deposit rates with a lag to loan rate increases, however loan rates have remained flat and market demands are creating pressure to raise interest rates on deposits.deposits in the event of a rise in interest rates. Therefore for a period of time we have chosen to use the simulation to forecast deposits rates rising quite rapidly. This causes the net interest margin to shrink and net interest income to decline in both a rising and falling rate environment. The table below indicates that we are liability sensitive throughout the next year. At the end of the twelve month cycle, the rate sensitive gap shows $55.4$68.4 million more in liabilities than assets with a repricing opportunity.
We control long-term interest rate risk by keeping long term fixed rate assets (longer than 5 years) less than its long term fixed rate funding, primarily demand deposit accounts and capital. The following table sets forth cumulative maturity distributions as of December 31, 20062008 for our interest-bearing assets and interest-bearing liabilities, and our interest rate sensitivity gap as a percentage of total interest-earning assets. Of the $135.6$130.4 million in fixed rate assets repricing in the over 12 months category, shown in the table below, $31.3$37.3 million are long term assets with a maturity over five years. This $31.3$37.3 million compares favorably to our long term funding of $84.7$78.7 million which includes demand and core deposits and equity. 41
(dollars in thousands) | | | | | | | | | | | | | | | | | | | | | | | | | | | | | Immediate | | | Up to 3 | | | 4 to 6 | | | 7 to 12 | | | Over | | | | | | December 31, 2006 | | Reprice | | | Months | | | Months | | | Months | | | 12 Months | | | Total | | | ASSETS: | | | | | | | | | | | | | | | | | | | | | | | | | | Securities + Other Interest-Bearing Balances | | $ | 0 | | | $ | 5,988 | | | $ | 2,407 | | | $ | 4,815 | | | $ | 23,586 | | | $ | 36,796 | | | Loans | | | 50,981 | | | | 7,532 | | | | 15,956 | | | | 29,825 | | | | 112,037 | | | | 216,331 | | | Fed Funds Sold + Overnight Interest-Bearing Balances | | | 1,292 | | | | 0 | | | | 0 | | | | 0 | | | | 0 | | | | 1,292 | | | | | | | | | | | | | | | | | | | | | | | | | | | | | | | | | | | | | | | | | | | | | | | | | Total Rate Sensitive Assets | | $ | 52,273 | | | $ | 13,520 | | | $ | 18,363 | | | $ | 34,640 | | | $ | 135,623 | | | $ | 254,419 | | | | | | | | | | | | | | | | | | | | | | | | | | | | | | | | | | | | | | | | | | | | | | | | | LIABILITIES: | | | | | | | | | | | | | | | | | | | | | | | | | | MMDA/NOW/SAV | | $ | 102,329 | | | $ | 0 | | | $ | 0 | | | $ | 0 | | | $ | 0 | | | $ | 102,329 | | | CD’s<$100 | | | 0 | | | | 7,609 | | | | 8,356 | | | | 8,356 | | | | 3,310 | | | | 27,631 | | | CD’s>$100 | | | 0 | | | | 17,992 | | | | 17,538 | | | | 4,385 | | | | 4,154 | | | | 44,069 | | | Borrowings | | | 7,600 | | | | 0 | | | | 0 | | | | 0 | | | | 5,000 | | | | 12,600 | | | | | | | | | | | | | | | | | | | | | | | | | | | | | | | | | | | | | | | | | | | | | | | | | Total Rate Sensitive Liabilities | | $ | 109,929 | | | $ | 25,601 | | | $ | 25,894 | | | $ | 12,741 | | | $ | 12,464 | | | $ | 186,629 | | | | | | | | | | | | | | | | | | | | | | | | | | | | | | | | | | | | | | | | | | | | | | | | | Rate Sensitivity Gap | | $ | (57,656 | ) | | $ | (12,081 | ) | | $ | (7,531 | ) | | $ | 21,899 | | | $ | 123,159 | | | $ | 88,547 | | | | | | | | | | | | | | | | | | | | | | | | | | | | | Cumulative Rate Sensitivity Gap | | $ | (57,656 | ) | | $ | (69,737 | ) | | $ | (77,268 | ) | | $ | (55,369 | ) | | $ | 67,790 | | | | | | | | | | | | | | | | | | | | | | | | | | | | | | | | | Cumulative Position to Total Assets | | | (20.8 | %) | | | (25.2 | %) | | | (27.9 | ) | | | (20.0 | %) | | | 24.5 | % | | | | |
| | | Immediate | | | Up to 3 | | | 4 to 6 | | | 7 to 12 | | | Over | | | | | | December 31, 2008 | | Reprice | | | Months | | | Months | | | Months | | | 12 Months | | | Total | | | | | | | | | | | | | | | | | | | | | | | ASSETS: | | | | | | | | | | | | | | | | | | | | Securities + Other Interest-Bearing Balances | | $ | 0 | | | $ | 0 | | | $ | 2,472 | | | $ | 4,945 | | | $ | 13,025 | | | $ | 20,442 | | | Loans | | | 64,760 | | | | 10,355 | | | | 24,399 | | | | 45,458 | | | | 117,405 | | | | 262,377 | | Fed Funds Sold + Overnight Interest-Bearing Balances | | | 274 | | | | 0 | | | | 0 | | | | 0 | | | | 0 | | | | 274 | | | Total Rate Sensitive Assets | | $ | 65,034 | | | $ | 10,355 | | | $ | 26,871 | | | $ | 50,403 | | | $ | 130,430 | | | $ | 283,093 | | | | | | | | | | | | | | | | | | | | | | | | | | | | | LIABILITIES: | | | | | | | | | | | | | | | | | | | | | | | | | | MMDA/NOW/SAV | | $ | 119,380 | | | $ | 0 | | | $ | 0 | | | $ | 0 | | | $ | 0 | | | $ | 119,380 | | | CD’s<$100 | | | 0 | | | | 11,873 | | | | 9,894 | | | | 9,894 | | | | 3,674 | | | | 35,335 | | | CD’s>$100 | | | 0 | | | | 12,507 | | | | 26,049 | | | | 6,512 | | | | 5,883 | | | | 50,951 | | | Borrowings | | | 0 | | | | 10,000 | | | | 0 | | | | 15,000 | | | | 5,000 | | | | 30,000 | | | | | | | | | | | | | | | | | | | | | | | | | | | | | Total Rate Sensitive Liabilities | | $ | 119,380 | | | $ | 34,380 | | | $ | 35,943 | | | $ | 31,406 | | | $ | 14,557 | | | $ | 235,666 | | | | | | | | | | | | | | | | | | | | | | | | | | | | | | | | | | | | | | | | | | | | | | | | | | | | | | | Rate Sensitivity Gap | | $ | (54,346 | ) | | $ | (24,025 | ) | | $ | (9,072 | ) | | $ | 18,997 | | | $ | 115,873 | | | $ | 47,427 | | | | | | | | | | | | | | | | | | | | | | | | | | | | | Cumulative Rate Sensitivity Gap | | $ | (54,346 | ) | | $ | (78,371 | ) | | $ | (87,443 | ) | | $ | (68,446 | ) | | $ | 47,427 | | | | | | | | | | | | | | | | | | | | | | | | | | | | | | | | | Cumulative Position to Total Assets | | | (16.9 | %) | | | (24.4 | %) | | | (27.2 | %) | | | (21.3 | %) | | | 14.7 | % | | | | | | | | | | | | | | | | | | | | | | | | | | | | | | |
Market risk in securities.Market risk in securities shows the amount of gain or loss (before tax) in the securities portfolio. Portfolio volume, sector distribution, duration, and quality all affect market valuation. The adjusted equity ratio is Tier 1 capital adjusted for the market gain or loss less any applicable tax effect divided by average total assets for leverage capital purposes for the most recent quarter. The ratio is designed to show Tier 1 capital if the securities portfolio had to be liquidated and all gains and losses recognized. If the ratio remains strong after a +2% or +3% rate shock, market risk is reasonable in relation to the level of capital. A bank has flexibility and strength when the securities portfolio can be liquidated for liquidity purposes without affecting capital adequacy. We have only moderate market risk in investments because the average maturity in the portfolio is not very long, except for municipals, which are held to maturity (see page 3440 for a discussion of investments). The portfolio should decline in value only about 1.9%0.8% or $594,000$348,000 for a 1% increase in rates. The gain in value if rates fall would be somewhat less, because there are some callable bonds. Marking-to-market available for sale securities when rates change would add only modest volatility to a strong level of equity. This market risk acts to offset the interest rate risk (i.e. if rates decline and NIM is squeezed, there would be a concurrent gain in the value of securities). Inflation
Inflation Assets and liabilities of a financial institution are principally monetary in nature. Accordingly, interest rates, which generally move with the rate of inflation, have potentially the most significant effect on our net interest income. We attemptsattempt to limit inflation’sinflation's impact on rates and net income margins by minimizing its effect on these margins through continuing asset/liability management programs. 42
Management’sManagement's Discussion and Analysis
The Year Ended December 31, 20052007 versus December 31, 20042006 Summary
Summary
Net income for 20052007 was $3,348,529$4,343,538 compared with $2,907,621$3,991,759 million in 2004.2006. Basic earnings per share for 20052007 were $1.54$1.94 compared with $1.35$1.78 in 2004.2006. Return on average assets was 1.44%1.52% in 2005 compared with 1.38% the previous year,both 2007 and 2006, while return on average equity was 15.27%15.94% in 20052007 and 13.98%15.90% for the previous year. Total assets reached $244.1$297.9 million in 2005, an 11.8%2007, a 7.3% increase over the $218.2$277.7 million at December 31, 2004.2006. We showed loans of $171.2$250.5 million in 2005,2007, compared with $153.2$219.6 million at year-end 2004,2006, an increase of 11.8%14.0%. Deposits increased, growing 11.4%1.4%, from $193.7$232.8 million at year-end 20042006 to $215.8$236.0 million at year-end 2005.2007. The loan-to-deposit ratio remained levelincreased to 79.3%106.1% in 20052007 from 79.1%94.3% in 2004.2006.
Net Interest Income Net interest income, adjusted to a fully taxable equivalent basis, increased $1.3$1.4 million to $11.7$14.7 million in 2007, up 12.1%11.0% from 2004 net interest income of $10.4 million.$13.3 million in 2006. Our net interest margin decreased 2 basis points from 5.48%was 5.51% in 20042007 compared to 5.46% in 2005. The decrease in the net interest margin is the result of the pressure to renegotiate loans from floating to fixed and market pressure to increase the rates on deposit accounts, offset by the loan growth in 2005, which allowed the margin to remain almost flat.2006. Individual components of interest income and interest expense are provided in the table - Average Balances, Yields and Rates Paid on page 30.35.
Interest Income Interest income increased by $2.1$3.4 million, or 17.7%19.4%, to $14.1$21.2 million over the $12.0$17.8 million realized in 2004.2006. The gain in volume of average earning assets was responsible for a $1.6$2.660 million increase in interest income, while the increase in yield contributed $456,000$781,000 for a total increase of $2.1$3.441 million.
Interest Expense Total interest expense increased $848,000$2.0 million to $2.4$6.4 million. The average rate paid on all interest-bearing liabilities was 1.51%3.22% in 2005,2007, compared to 1.09%2.51% in 2004.2006. Average balances increased from $142.4$177.5 million to $158.7$199.6 million, an 11.5%a 12.4% gain. The gain in volume of average balances was responsible for a $280,000$1.127 million increase in interest expense in conjunction with a $568,000$851,000 increase related to higher interest rates paid for a net increase of $848,000.$1.978 million. The higher rates paid on interest-bearing liabilities iswas a result of market pressures driving interest rates paid on deposit accounts higher. Individual components of interest income and interest expense are provided in the table – Average Balances, Yields and Rates Paid on page 30.35.
Provision for Loan Losses
The provisions to the allowance for loan losses amounted to $360,000$680,000 in 20052007 and $130,000$500,000 in 2004.2006. The increase in the provision is the result of management’s evaluation and assessment of the loan portfolio and 43
the growth in the loan portfolio. We anticipate some loan growth will continue in 2006, which could necessitate a further increase in the provision to the allowance for loan losses. The non-performing assets ratio at December 31, 20052007 was .63%.45% compared to .72%.42% as of year end 2004.2006. Non accrual loans were $994,000$800,000 as of December 31, 20052007 compared to $1.0 million$820,000 as of December 31, 2004,2006, a decline of .2%2.4%. Loans charged-off, net of recoveries, resulted in net losses of $234,000 in 2007 and in net recoveries totaling $12,000$465 in 2005 and $336,000 in 2004 (one loan represented 80.3% of this figure).2006. Refer to page 61,70, Note D for an analysis of the changes in the allowance for loan and lease losses.
Non-interest Income Non-interest income of $2.0$2.3 million for 20052007 increased 15.1%8.8% or $259,000 in comparison with$185,000 compared to the $1.7$2.1 million recorded in 2004.2006. Of the increase 65.5%43.5% or $81,000 was due to an increase in all other non-interest income, 31.6% was a result of increases in service charges on deposit accounts. In 2005 income from service charges on deposit accounts increased 15.6% or $169,000 from $1.1 million in 2004 to $1.3 million in 2005. Thisaccount of $58,000 and the remainder of the increase was a resultin the area of both increases in service charges and growth of new accounts. Otherother fee income, showed an increase in 2005 of 19.1% or $58,000 from $306,000 in 2004 to $364,000 in 2005 and comprised 22.6% of the 2005 increase of $259,000. The higher income is a result of an increase of 43.1%$46,000 or $53,000 in income the bank earns from merchant credit card processing fees from $122,000 in 2004 to $175,000 in 2005. Also contributing to the increase was an increase of $9,000 or 49.3% in wire transfer fee income from $19,000 in 2004 to $28,000 in 2005.
Other24.9%. All other non-interest income showed a 9.8%22.3% increase or $31,000$81,000 from $315,000$361,000 in 20042006 to $346,000$442,000 in 2005.2007. This is largely a result of an increase in the income generated by bank owned life insurance policies in 2005.2007. Income on the policies was $298,000$417,000 in 20042007 compared to $326,000$348,000 in 20052006 or yields of 3.63%4.14% and 3.60%3.73%, respectively. The earnings on these policies will increase as the balances increase and if market rates increase, the income produced by these policies should also increase. Additionally, there was an $11,600 increase in check printing income due to a change in vendors.
Other fee income showed an increase in 2007 of 12.4% or $46,000 from $380,000 in 2006 to $426,000 in 2007. The higher income is a result of an increase of $24,000 in income we earned from loan referrals, which increased from $56,000 in 2006 to $80,000 in 2007. Also contributing to the increase was an increase of $11,000 in credit card merchant fee income from $162,000 in 2006 to $173,000 in 2007. Non-interest Expense Total non-interest expense increased 8.6%10.6% to $7.8$9.2 million in 20052007 from $7.2$8.3 million in 2004.2006. Non-interest expense represented 3.38%3.20% of average total assets in 20052007 and 3.43%3.17% in 2004.2006. The expense/asset ratio is a standard industry measurement of a bank’sbank's ability to control its overhead or non-interest costs. During 2006,2008, we will continue to emphasize cost controls, although certain costs, such as professional fees associated with the implementation and compliance with Sarbanes-Oxley, costs of company insurance and certain salary and benefit expense includingexpenses such as workers compensation insurance and medical benefits are not controllable by management. We monitor our efficiency ratio relative to peers as a means of evaluating out control over expenses. The efficiency ratio is operating expenses divided by revenues (net interest income plus non-interest income). This ratio has become an industry “benchmark” and is used as a means of measuring overall expense management. For example, an efficiency ratio of 60% indicates that a bank spends $0.60 to generate $1.00 of revenues. As of December 31, 2007 and December 31, 2006 our efficiency ratios were 53.88% and 53.95%, respectively. Refer to Note I, page 66,75 for a detailed description of Non-Interest Income and Other Non-Interest Expense.
Salaries and Benefits
The most significant dollar increase was in the salaries and benefits category. Salary and benefits increased 6.9%13.1% from $4.1$4.9 million in 20042006 to $4.4$5.5 million in 2005.2007. The increase is a result of increases in employee incentives paid as a result of the strong earnings in 2005, an increase of $162,000$357,000 in salary expense which grew from $328,000$2.9 million in 20042006 to $490,000$3.3 million in 2005.2007. At December 31, 2007 and December 31, 2006 total full time equivalent employees were 51 and 49, respectively an increase of two full time equivalent employees. Also contributing to the increase is normal merit increases. Year-end assets per employee were $5.8 million in 2007 compared with $5.7 million in 2006. Additionally, accrual adjustments were necessary to the Supplemental Executive retirement plan dueplan. An additional increase in expense of $81,000 over prior year was taken for restricted stock that was granted to a decline in the discount rate. Other areas of increase were normal merit increases and increases in the costs of employee benefits. At December 31, 2005 and 2004 total full-time equivalent employees were 50 and 55, respectively, a decrease of 5 full time equivalent employees. Year-end assets per employee were $4.9 million in 2005 compared with $4.0 million in 2004.bank officers. 44
Premises and Equipment Expense relative to premises and equipment decreased 5.7% to $959,000 in 2007 from $1.016 million in 2006. Most areas of premises and equipment showed declines except for lease expense. Lease expense increased 10.9%from $364,000 in 2006 to $999,000$381,000 in 2005 from $900,000 in 2004.2007, a $17,000 (4.64%) increase. The $99,000 increase in expense in 2005 is a result of additional lease expense for the Finance Center, increased expenses for maintenance and repairs both for buildings and fixed assets, increases in property tax accruals, increases in utility costs and increases in software expense. We continueBank continues to emphasize security in ourits computer operations. Equipment and software are monitored and upgraded as appropriate to ensure confidentiality of customer and Company data contributing to additional increases in expense. We continue to emphasize the utilization of technology to accommodate customer and market demands.
Other Non-interest Expense Other non-interest expense increased by 10.9%showed an increase of 12.2% or $286,000 to $2.4$2.6 million in 20052007 from $2.2$2.3 million in 2004.2006. The largest piece of this increase in other non-interest expense was due to increases in professional fees and data processing fees, advertising and marketing, operational losses and outages and staff related expenses which increased by 18.0%, 15.4%, 75.4% and 8.5%, respectively.fees. Professional and data processing fees were $1.2 million$702,000 in 20042006 and increased to $1.4$1.0 million in 2005,2007, an increase of $218,000.$316,000. The categories of professional fees which showed the most significant increases were in the areas of accounting and taxes, accruals for Sarbanes Oxley professional assistance andlegal fees-corporate matters, other professional fees, other exam fees and director fees. The growth inOther professional fees is predominatelygrew significantly due to the resultinvolvement of additional accruals for expenses associatedan outside technology company to assist with the implementation of Sarbanes-Oxley, Rule 404, regarding internal controls over financial reporting. The delay in implementation could mitigate or spread out the ongoing expenses relative to this process. Additionally, with our growth time spent by outside professionals increased, therefore, the costs increased.network security and disaster planning. Advertising Expense for advertising and marketing increased $30,000$10,000 from $195,000$276,000 in 20042006 to $225,000$286,000 in 2005.2007. The increases in this category are a result of our involvement in the community, both through donations as well as participation in civic organizations. Additionally, shareholder relations showed an increase in 20052007 over 2004.2006. Staff related expenses grew $16,000 from $186,000 in 2004 to $202,000 in 2005. These increases were a result of director and employee involvement in attending meetings and seminars and related costs. It is important that directors and employee keep up with the many regulatory changes in recent years and the regulators have increased their attention relative to the involvement of employees and directors in training. Provision for Income Taxes The provision for income taxes increased to an effective tax rate of 33.8%36% in 20052007 compared with 33.3%35.7% in 2004.2006. The higher effective tax rate is a reflection of the increase in taxable income when compared with income derived from tax exempt investments. Income taxes reported in the financial statements include deferred taxes resulting from timing differences in the recognition of items for tax and financial reporting purposes. ITEM 7A. QUANTITATIVE AND QUALITATIVE DISCLOSURES ABOUT MARKET RISK Information regarding Quantitative and Qualitative Disclosures about Market Risk appears on pages 3946 through 4249 under the caption “Management’s Discussion and Analysis of Consolidated Financial Condition and Results of Operations – Market Risk Management” and is incorporated herein by reference. 45
SONOMA VALLEY BANCORP AND SUBSIDIARY
Audited Consolidated Financial Statements
December 31, 20062008 46
| | | Richardson & Company | | 550 Howe Avenue, Suite 210 | | | | Sacramento, California 95825 | | | | | | Telephone: (916) 564-8727 | | | FAX: (916) 564-8728 |
Richardson & Company ; 550 Howe Avenue, Suite 210 Sacramento, California 95825 Telephone: (916) 564-8727 FAX: (916) 564-8728 REPORT OF RICHARDSON & COMPANY
INDEPENDENT REGISTERED PUBLIC
ACCOUNTING FIRM Board of Directors and Shareholders
Sonoma Valley Bancorp and Subsidiary
Sonoma, California We have audited the accompanying consolidated balance sheets of Sonoma Valley Bancorp and Subsidiary as of December 31, 20062008 and 2005,2007, and the related consolidated statements of operations, changes in the shareholders’shareholders' equity and cash flows for each of the three years in the period ended December 31, 2006.2008. These financial statements are the responsibility of the Company’s management. Our responsibility is to express an opinion on these financial statements based on our audits. We conducted our audits in accordance with the standards of the Public Company Accounting Oversight Board (United States). Those standards require that we plan and perform the audit to obtain reasonable assurance about whether the financial statements are free of material misstatement. The company is not required to have, nor were we engaged to perform, an audit of its internal control over financial reporting. Our audit included consideration of internal control over financial reporting as a basis of designing audit procedures that are appropriate in the circumstances, but not for the purpose of expressing an opinion on the effectiveness of the company’s internal control over financial reporting. Accordingly, we express no such opinion. An audit includes examining, on a test basis, evidence supporting the amounts and disclosures in the financial statements. An audit also includes assessing the accounting principles used and significant estimates made by management, as well as evaluating the overall financial statement presentation. We believe that our audits provide a reasonable basis for our opinion. In our opinion, the financial statements referred to above present fairly, in all material respects, the consolidated financial position of Sonoma Valley Bancorp and Subsidiary as of December 31, 20062008 and 2005,2007, and the consolidated results of their operations and their consolidated cash flows for each of the three years in the period ended December 31, 2006,2008, in conformity with accounting principles generally accepted in the United States of America. | | | | | | | | | /s/ Richardson & Company | | | Richardson & Company | | | | | |
February 26, 2007 47
March 5, 2009
SONOMA VALLEY BANCORP AND SUBSIDIARY
CONSOLIDATED BALANCE SHEETS
December 31, 20062008 and 20052007 | | | | | | | | | | | | | 2006 | | | 2005 | | | ASSETS | | | | | | | | | | | | | | | | | | | | Cash and due from banks | | $ | 6,159,931 | | | $ | 6,988,820 | | | Federal funds sold | | | | | | | 2,050,000 | | | Interest-bearing due from banks | | | 1,292,325 | | | | 39,521 | | | | | | | | | | | Total cash and cash equivalents | | | 7,452,256 | | | | 9,078,341 | | | Investment securities available-for-sale, at fair value | | | 20,991,232 | | | | 33,917,094 | | | Investment securities held-to-maturity (fair value of $15,951,553 and $16,634,519, respectively) | | | 15,804,421 | | | | 16,499,865 | | | Loans and lease financing receivables, net | | | 216,330,690 | | | | 168,418,085 | | | Premises and equipment, net | | | 949,224 | | | | 1,178,666 | | | Accrued interest receivable | | | 1,671,618 | | | | 1,400,255 | | | Cash surrender value of life insurance | | | 9,587,306 | | | | 9,239,439 | | | Other assets | | | 4,867,187 | | | | 4,331,172 | | | | | | | | | | | | | | | | | | | | | Total assets | | $ | 277,653,934 | | | $ | 244,062,917 | | | | | | | | | | | | | | | | | | | | | LIABILITIES | | | | | | | | | | Noninterest-bearing demand deposits | | $ | 58,740,471 | | | $ | 49,460,864 | | | Interest-bearing transaction deposits | | | 29,983,572 | | | | 35,586,113 | | | Savings and money market deposits | | | 72,346,136 | | | | 74,218,076 | | | Time deposits, $100,000 and over | | | 44,067,435 | | | | 32,011,640 | | | Other time deposits | | | 27,629,801 | | | | 24,482,074 | | | | | | | | | | | Total deposits | | | 232,767,415 | | | | 215,758,767 | | | | | | | | | | | | | Federal Home Loan Bank borrowings | | | 12,600,000 | | | | | | | Accrued interest payable and other liabilities | | | 5,882,448 | | | | 4,864,357 | | | | | | | | | | | Total liabilities | | | 251,249,863 | | | | 220,623,124 | | | Commitments and contingencies ( see accompanying notes ) | | | | | | | | | | | | | | | | | | | | SHAREHOLDERS’ EQUITY | | | | | | | | | | | | | | | | | | | | Common stock, no par value; 10,000,000 shares authorized; 2,283,047 shares in 2006 and 2,204,949 in 2005 issued and outstanding | | | 15,479,556 | | | | 15,004,135 | | | Additional paid-in-capital | | | 1,872,648 | | | | 1,252,292 | | | Retained earnings | | | 9,206,716 | | | | 7,493,757 | | | Accumulated other comprehensive loss | | | (154,849 | ) | | | (310,391 | ) | | | | | | | | | | Total shareholders’ equity | | | 26,404,071 | | | | 23,439,793 | | | | | | | | | | | | | | | | | | | | | Total liabilities and shareholders’ equity | | $ | 277,653,934 | | | $ | 244,062,917 | | | | | | | | | |
ASSETS | | 2008 | | | 2007 | | | Cash and due from banks | | $ | 17,959,020 | | | $ | 6,268,091 | | | Interest-bearing due from banks | | | 274,035 | | | | 3,065,543 | | | Total cash and cash equivalents | | | 18,233,055 | | | | 9,333,634 | | | Investment securities available-for-sale, at fair value | | | 6,578,924 | | | | 8,203,190 | | Investment securities held-to-maturity (fair value of $14,028,111 and $14,754,249, respectively) | | | 13,862,911 | | | | 14,554,224 | | | Loans and lease financing receivables, net | | | 262,376,784 | | | | 246,738,218 | | | Premises and equipment, net | | | 734,091 | | | | 792,455 | | | Accrued interest receivable | | | 1,678,547 | | | | 1,682,209 | | | Cash surrender value of life insurance | | | 10,777,482 | | | | 10,354,153 | | | Other assets | | | 7,706,287 | | | | 6,201,195 | | Total assets | | $ | 321,948,081 | | | $ | 297,859,278 | | | LIABILITIES | | | | | | | | | | Noninterest-bearing demand deposits | | $ | 48,279,759 | | | $ | 58,589,202 | | | Interest-bearing transaction deposits | | | 31,062,597 | | | | 30,135,049 | | | Savings and money market deposits | | | 88,317,397 | | | | 73,528,081 | | | Time deposits, $100,000 and over | | | 50,694,468 | | | | 44,160,741 | | | Other time deposits | | | 35,591,280 | | | | 29,634,626 | | Total deposits | | | 253,945,501 | | | | 236,047,699 | | Federal Home Loan Bank borrowings Accrued interest payable and other liabilities | | | 30,000,000 7,142,484 | | | | 27,500,000 6,377,299 | | Total liabilities | | | 291,087,985 | | | | 269,924,998 | | | Commitments and contingencies ( see accompanying notes ) | | | | | | | | | | | | | | | | | | | | SHAREHOLDERS’ EQUITY | | | | | | | | | Common stock, no par value; 10,000,000 shares authorized; 2,290,657 shares in 2008 and 2,242,809 in 2007 issued and outstanding | | | 16,402,084 | | | | 15,578,903 | | Additional paid-in-capital Retained earnings | | | 2,577,855 11,863,688 | | | | 2,455,409 9,934,967 | | | Accumulated other comprehensive income/(loss) | | | 16,469 | | | | (34,999 | ) | | | | | | | | | | | | Total liabilities and shareholders’ equity | | $ | 321,948,081 | | | $ | 297,859,278 | |
The accompanying notes are an integral part of these financial statements. 48
SONOMA VALLEY BANCORP AND SUBSIDIARY
CONSOLIDATED STATEMENTS OF OPERATIONS
For the years ended December 31, 2006, 20052008, 2007 and 20042006 | | | | | | | | | | | | | | | | | 2006 | | | 2005 | | | 2004 | | | INTEREST INCOME | | | | | | | | | | | | | | Loans and leases | | $ | 15,778,313 | | | $ | 11,923,589 | | | $ | 9,980,424 | | | Taxable securities | | | 864,410 | | | | 1,059,592 | | | | 790,980 | | | Tax-exempt securities | | | 607,276 | | | | 625,438 | | | | 655,689 | | | Federal funds sold and other | | | 79,079 | | | | 60,710 | | | | 110,639 | | | Dividends | | | 51,062 | | | | 33,031 | | | | 20,370 | | | | | | | | | | | | | | Total interest income | | | 17,380,140 | | | | 13,702,360 | | | | 11,558,102 | | | INTEREST EXPENSE | | | | | | | | | | | | | | Interest-bearing transaction deposits | | | 50,928 | | | | 57,905 | | | | 51,744 | | | Savings and money market deposits | | | 1,363,563 | | | | 826,657 | | | | 434,671 | | | Time deposits, $100,000 and over | | | 1,602,820 | | | | 851,427 | | | | | | | Interest on borrowings | | | 425,681 | | | | 97,799 | | | | 667,862 | | | | | | | | | | | | | | | | Other time deposits | | | 1,015,391 | | | | 568,772 | | | | 399,813 | | | | | | | | | | | | | | Total interest expense | | | 4,458,383 | | | | 2,402,560 | | | | 1,554,090 | | | | | | | | | | | | | | | | | | | | | | | | | | | | NET INTEREST INCOME | | | 12,921,757 | | | | 11,299,800 | | | | 10,004,012 | | | Provision for loan and lease losses | | | 500,000 | | | | 360,000 | | | | 130,000 | | | | | | | | | | | | | | NET INTEREST INCOME AFTER PROVISION FOR LOAN AND LEASE LOSSES | | | 12,421,757 | | | | 10,939,800 | | | | 9,874,012 | | | NON-INTEREST INCOME | | | 2,093,738 | | | | 1,968,394 | | | | 1,709,771 | | | NON-INTEREST EXPENSE | | | | | | | | | | | | | | Salaries and employee benefits | | | 4,940,130 | | | | 4,410,604 | | | | 4,124,120 | | | Premises and equipment | | | 1,016,200 | | | | 999,019 | | | | 900,465 | | | Other | | | 2,349,639 | | | | 2,438,886 | | | | 2,200,104 | | | | | | | | | | | | | | Total non-interest expense | | | 8,305,969 | | | | 7,848,509 | | | | 7,224,689 | | | | | | | | | | | | | | | | | | | | | | | | | | | | Income before provision for income taxes | | | 6,209,526 | | | | 5,059,685 | | | | 4,359,094 | | | Provision for income taxes | | | 2,217,767 | | | | 1,711,156 | | | | 1,451,473 | | | | | | | | | | | | | | | | | | | | | | | | | | | | NET INCOME | | $ | 3,991,759 | | | $ | 3,348,529 | | | $ | 2,907,621 | | | | | | | | | | | | | | | | | | | | | | | | | | | | BASIC EARNINGS PER SHARE | | $ | 1.78 | | | $ | 1.54 | | | $ | 1.35 | | | | | | | | | | | | | | | | | | | | | | | | | | | | DILUTED EARNINGS PER SHARE | | $ | 1.68 | | | $ | 1.45 | | | $ | 1.25 | | | | | | | | | | | | |
| | | 2008 | | 2007 | 2006 | | | | | INTEREST INCOME | | | | | | | Loans and leases | | $ | 19,125,311 | | | $ | 19,592,855 | | $ | 15,778,313 | | | Taxable securities | | | 136,519 | | | | 459,978 | | | 864,410 | | | Tax-exempt securities | | | 530,526 | | | | 646,920 | | | 607,276 | | | Federal funds sold and other | | | 49,931 | | | | 33,352 | | | 79,079 | | | Dividends | | | 88,602 | | | | 70,517 | | | 51,062 | | | Total interest income | | | 19,930,889 | | | | 20,803,622 | | | 17,380,140 | | | INTEREST EXPENSE | | | | | | | Interest-bearing transaction deposits | | | 49,514 | | | | 47,332 | | | 50,928 | | | Savings and money market deposits | | | 1,433,907 | | | | 1,887,350 | | | 1,363,563 | | Time deposits, $100,000 and over Other time deposits | | | 1,933,523 1,138,555 | | | | 1,957,123 1,300,629 | | | 1,602,820 1,015,391 | | | Interest on borrowings | | | 892,122 | | | | 1,244,256 | | | 425,681 | | Total interest expense | | | 5,447,621 | | | | 6,436,690 | | | 4,458,383 | | | | | | | | | | | | | | | | | | NET INTEREST INCOME | | | 14,483,268 | | | | 14,366,932 | | | 12,921,757 | | | Provision for loan and lease losses | | | 2,110,000 | | | | 680,000 | | | 500,000 | | NET INTEREST INCOME AFTER PROVISION FOR LOAN AND LEASE LOSSES | | | 12,373,268 | | | | 13,686,932 | | | 12,421,757 | | | NON-INTEREST INCOME | | | 2,131,182 | | | | 2,278,810 | | | 2,093,738 | | | NON-INTEREST EXPENSE | | | | | | | Salaries and employee benefits | | | 5,610,821 | | | | 5,587,176 | | | 4,940,130 | | | Premises and equipment | | | 936,798 | | | | 959,021 | | | 1,016,200 | | | Other | | | 3,076,292 | | | | 2,635,845 | | | 2,349,639 | | | Total non-interest expense | | | 9,623,911 | | | | 9,182,042 | | | 8,305,969 | | | | | | | | | | Income before provision for income taxes | | | 4,880,539 | | | | 6,783,700 | | | 6,209,526 | | | Provision for income taxes | | | 1,565,178 | | | | 2,440,162 | | | 2,217,767 | | NET INCOME | | $ | 3,315,361 | | | $ | 4,343,538 | | $ | 3,991,759 | | BASIC EARNINGS PER SHARE | | $ | 1.46 | | | $ | 1.94 | | $ | 1.78 | | DILUTED EARNINGS PER SHARE | | $ | 1.45 | | | $ | 1.88 | | $ | 1.68 | |
The accompanying notes are an integral part of these financial statements. 49
SONOMA VALLEY BANCORP AND SUBSIDIARY
CONSOLIDATED STATEMENTS OF CHANGES IN SHAREHOLDERS’ EQUITY
For the years ended December 31, 2006, 2005 and 2004
| | | | | | | | | | | | | | | | | | | | | | | | | | | | | | | | | | | | | | | | | | | | | | | | | | | | | Accumulated | | | | | | | | | | | | | | | | | | | | Additional | | | | | | | Other | | | | | | | | Comprehensive | | | Common Stock | | | Paid-in | | | Retained | | | Comprehensive | | | | | | | | Income | | | Shares | | | Amount | | | Capital | | | Earnings | | | Income (Loss) | | | Total | | | BALANCE AT JANUARY 1, 2004 | | | | | | | 1,457,594 | | | $ | 14,766,301 | | | $ | 295,335 | | | $ | 6,386,083 | | | $ | 23,560 | | | $ | 21,471,279 | | | Redemption and retirement of stock | | | | | | | (601 | ) | | | (6,218 | ) | | | | | | | (11,839 | ) | | | | | | | (18,057 | ) | | Stock options exercised and related tax benefits | | | | | | | 97,494 | | | | 1,168,805 | | | | 617,260 | | | | | | | | | | | | 1,786,065 | | | Redemption of stock under tender offer | | | | | | | (126,208 | ) | | | (1,416,223 | ) | | | | | | | (3,071,903 | ) | | | | | | | (4,488,126 | ) | | Cash dividends | | | | | | | | | | | | | | | | | | | (906,732 | ) | | | | | | | (906,732 | ) | | Stock options granted | | | | | | | | | | | | | | | 103,680 | | | | | | | | | | | | 103,680 | | | 3 for 2 stock split | | | | | | | 713,825 | | | | | | | | | | | | | | | | | | | | | | | Fractional shares | | | | | | | | | | | | | | | | | | | (7,498 | ) | | | | | | | (7,498 | ) | | Net income for the year | | $ | 2,907,621 | | | | | | | | | | | | | | | | 2,907,621 | | | | | | | | 2,907,621 | | | Other comprehensive income net of tax: | | | | | | | | | | | | | | | | | | | | | | | | | | | | | | Unrealized holding losses on securities available-for-sale arising during the year, net of taxes of $116,844 | | | (167,072 | ) | | | | | | | | | | | | | | | | | | | | | | | | | | | | | | | | | | | | | | | | | | | | | | | | | | | | | | | Other comprehensive income, net of taxes | | | (167,072 | ) | | | | | | | | | | | | | | | | | | | (167,072 | ) | | | (167,072 | ) | | | | | | | | | | | | | | | | | | | | | | | | | | | | | | | | | | | | | | | | | | | | | | | | | | | | | | | Total comprehensive income | | $ | 2,740,549 | | | | | | | | | | | | | | | | | | | | | | | | | | | | | | | | | | | | | | | | | | | | | | | | | | | | | | | | BALANCE AT DECEMBER 31, 2004 | | | | | | | 2,142,104 | | | | 14,512,665 | | | | 1,016,275 | | | | 5,295,732 | | | | (143,512 | ) | | | 20,681,160 | | | Redemption and retirement of stock | | | | | | | (5,616 | ) | | | (41,165 | ) | | | | | | | (72,503 | ) | | | | | | | (113,668 | ) | | Stock options exercised and related tax benefits | | | | | | | 68,461 | | | | 532,635 | | | | 132,337 | | | | | | | | | | | | 664,972 | | | Cash dividends | | | | | | | | | | | | | | | | | | | (1,078,001 | ) | | | | | | | (1,078,001 | ) | | Stock options granted | | | | | | | | | | | | | | | 103,680 | | | | | | | | | | | | 103,680 | | | Net income for the year | | $ | 3,348,529 | | | | | | | | | | | | | | | | 3,348,529 | | | | | | | | 3,348,529 | | | Other comprehensive income, net of tax: | | | | | | | | | | | | | | | | | | | | | | | | | | | | | | Unrealized holding losses on securities available-for-sale arising during the year, net of taxes of $116,709 | | | (166,879 | ) | | | | | | | | | | | | | | | | | | | | | | | | | | | | | | | | | | | | | | | | | | | | | | | | | | | | | | | Other comprehensive income, net of taxes | | | (166,879 | ) | | | | | | | | | | | | | | | | | | | (166,879 | ) | | | (166,879 | ) | | | | | | | | | | | | | | | | | | | | | | | | | | | | | | | | | | | | | | | | | | | | | | | | | | | | | | | Total comprehensive income | | $ | 3,181,650 | | | | | | | | | | | | | | | | | | | | | | | | | | | | | | | | | | | | | | | | | | | | | | | | | | | | | | | | BALANCE AT DECEMBER 31, 2005 | | | | | | | 2,204,949 | | | | 15,004,135 | | | | 1,252,292 | | | | 7,493,757 | | | | (310,391 | ) | | | 23,439,793 | |
50
SONOMA VALLEY BANCORP AND SUBSIDIARY
CONSOLIDATED STATEMENTS OF CHANGES IN SHAREHOLDERS’ EQUITY
For the years ended December 31, 2006, 2005 and 2004
| | | | | | | | | | | | | | | | | | | | | | | | | | | | | | | | | | | | | | | | | | | | | | | | | | | | | Accumulated | | | | | | | | | | | | | | | | | | | | Additional | | | | | | | Other | | | | | | | | Comprehensive | | | Common Stock | | | Paid-in | | | Retained | | | Comprehensive | | | | | | | | Income | | | Shares | | | Amount | | | Capital | | | Earnings | | | Income (Loss) | | | Total | | | Redemption and retirement of stock | | | | | | | (55,028 | ) | | $ | (410,308 | ) | | | | | | $ | (1,025,843 | ) | | | | | | $ | (1,436,151 | ) | | Stock options exercised and related tax benefits | | | | | | | 104,126 | | | | 885,729 | | | $ | 438,757 | | | | | | | | | | | | 1,324,486 | | | Cash dividends | | | | | | | | | | | | | | | | | | | (1,252,957 | ) | | | | | | | (1,252,957 | ) | | Stock options granted | | | | | | | 29,000 | | | | | | | | 100,224 | | | | | | | | | | | | 100,224 | | | Restricted stock granted | | | | | | | | | | | | | | | 81,375 | | | | | | | | | | | | 81,375 | | | Net income for the year | | $ | 3,991,759 | | | | | | | | | | | | | | | | 3,991,759 | | | | | | | | 3,991,759 | | | Other comprehensive Income, net of tax: | | | | | | | | | | | | | | | | | | | | | | | | | | | | | | Unrealized holding gains on securities available-for-sale arising during the year, net of taxes of $108,781 | | | 155,542 | | | | | | | | | | | | | | | | | | | | | | | | | | | | | | | | | | | | | | | | | | | | | | | | | | | | | | | | Other comprehensive income,net of taxes | | | 155,542 | | | | | | | | | | | | | | | | | | | $ | 155,542 | | | | 155,542 | | | | | | | | | | | | | | | | | | | | | | | | | | | | | | | | | | | | | | | | | | | | | | | | | | | | | | | | Total comprehensive income | | $ | 4,147,301 | | | | | | | | | | | | | | | | | | | | | | | | | | | | | | | | | | | | | | | | | | | | | | | | | | | | | | | | | | | | | | | | | | | | | | | | | | | | | | | | | | | | | | BALANCE AT DECEMBER 31, 2006 | | | | | | | 2,283,047 | | | $ | 15,479,556 | | | $ | 1,872,648 | | | $ | 9,206,716 | | | $ | (154,849 | ) | | $ | 26,404,071 | | | | | | | | | | | | | | | | | | | | | | | | | |
The accompanying notes are an integral part of these financial statements. 51
SONOMA VALLEY BANCORP AND SUBSIDIARY CONSOLIDATED STATEMENTS OF CASH FLOWSCHANGES IN SHAREHOLDERS' EQUITY
For the years ended December 31, 2006, 20052008, 2007 and 20042006 | | | | | | | | | | | | | | | | | 2006 | | | 2005 | | | 2004 | | | OPERATING ACTIVITIES | | | | | | | | | | | | | | Net income | | $ | 3,991,859 | | | $ | 3,348,529 | | | $ | 2,907,621 | | | Adjustments to reconcile net income to net cash provided by operating activities: | | | | | | | | | | | | | | Provision for loan and lease losses | | | 500,000 | | | | 360,000 | | | | 130,000 | | | Depreciation | | | 284,357 | | | | 307,202 | | | | 306,747 | | | Loss on sale of equipment | | | | | | | 306 | | | | 206 | | | Amortization and other | | | 116,041 | | | | 166,269 | | | | 153,510 | | | Stock options and restricted stock granted | | | 181,599 | | | | 103,680 | | | | 103,680 | | | Net change in interest receivable | | | (271,363 | ) | | | (261,648 | ) | | | (231,649 | ) | | Net change in cash surrender value of life insurance | | | (347,867 | ) | | | (326,303 | ) | | | (297,536 | ) | | Net change in other assets | | | (185,303 | ) | | | (1,002,386 | ) | | | 942,827 | | | Net change in interest payable and other liabilities | | | 1,018,091 | | | | 961,070 | | | | 383,045 | | | | | | | | | | | | | | NET CASH PROVIDED BY OPERATING ACTIVITIES | | | 5,287,414 | | | | 3,656,719 | | | | 4,398,451 | | | INVESTING ACTIVITIES | | | | | | | | | | | | | | Purchases of securities held-to-maturity | | | (438,272 | ) | | | (399,570 | ) | | | (2,519,972 | ) | | Purchases of securities available-for-sale | | | (42,140 | ) | | | (15,014,859 | ) | | | (8,653,217 | ) | | Proceeds from maturing securities held-to-maturity | | | 1,055,000 | | | | 1,219,406 | | | | 1,551,900 | | | Proceeds from maturing securities available-for-sale | | | 13,195,000 | | | | 1,000,000 | | | | 8,190,000 | | | Net increase in loans and leases | | | (48,412,605 | ) | | | (18,045,998 | ) | | | (31,028,098 | ) | | Purchases of premises and equipment | | | (54,915 | ) | | | (122,095 | ) | | | (361,506 | ) | | Purchases of life insurance | | | | | | | | | | | (885,000 | ) | | Proceeds from disposal of equipment | | | | | | | 800 | | | | 3,669 | | | | | | | | | | | | | | NET CASH USED FOR INVESTING ACTIVITIES | | | (34,697,932 | ) | | | (31,362,316 | ) | | | (33,702,224 | ) |
| | | | | | | | | | | | | | | | | | Accumulated | | | | | | | | | | | | | | | | | Additional | | | | | | Other | | | | | | | | Comprehensive | | | Common Stock | | | Paid-in | | | Retained | | | Comprehensive | | | | | | | | Income | | | Shares | | | Amount | | | Capital | | | Earnings | | | Income (Loss) | | | Total | | BALANCE AT JANUARY 1, 2006 | | | | | | 2,204,949 | | | $ | 15,004,135 | | | $ | 1,252,292 | | | $ | 7,493,757 | | | $ | (310,391 | ) | | $ | 23,439,793 | | Redemption and retirement of stock | | | | | | (55,028 | ) | | | (410,308 | ) | | | | | | | (1,025,843 | ) | | | | | | | (1,436,151 | ) | Stock options exercised and related tax benefits | | | | | | 104,126 | | | | 885,729 | | | | 438,757 | | | | | | | | | | | | 1,324,486 | | | Cash dividends of $.55 per share | | | | | | | | | | | | | | | | | | (1,252,957 | ) | | | | | | | (1,252,957 | ) | | Stock options vested | | | | | | | | | | | | | | 100,224 | | | | | | | | | | | | 100,224 | | | Restricted stock granted | | | | | | 29,000 | | | | | | | | 81,375 | | | | | | | | | | | | 81,375 | | | Net income for the year | | $ | 3,991,759 | | | | | | | | | | | | | | | | 3,991,759 | | | | | | | | 3,991,759 | | Other comprehensive income, net of tax: Unrealized holding gains on securities available-for-sale arising during the year, net of taxes of $108,781 | | | 155,542 | | | | | | | | | | | | | | | | | | | | | | | | | | Other comprehensive income, net of taxes | | | 155,542 | | | | | | | | | | | | | | | | | | | | 155,542 | | | | 155,542 | | Total comprehensive income | | $ | 4,147,301 | | | | | | | | | | | | | | | | | | | | | | | | | | BALANCE AT DECEMBER 31, 2006 | | | | | | | 2,283,047 | | | | 15,479,556 | | | | 1,872,648 | | | | 9,206,716 | | | | (154,849 | ) | | | 26,404,071 | | | | | | | | | | | | | | | | | | | | | | | | | | | | | | | | | Redemption and retirement of stock | | | | | | | (100,415 | ) | | | (689,422 | ) | | | | | | | (2,243,816 | ) | | | | | | | (2,933,238 | ) | | Stock options exercised and related tax benefits | | | | | | | 60,177 | | | | 626,019 | | | | 358,353 | | | | | | | | | | | | 984,372 | | | Cash dividends of $.60 per share | | | | | | | | | | | | | | | | | | | (1,371,471 | ) | | | | | | | (1,371,471 | ) | | Stock options vested | | | | | | | | | | | | | | | 216,473 | | | | | | | | | | | | 216,473 | | | Restricted stock vested and related tax benefits | | | | | | | | | | | 162,750 | | | | 7,935 | | | | | | | | | | | | 170,685 | | | Net income for the year | | $ | 4,343,538 | | | | | | | | | | | | | | | | 4,343,538 | | | | | | | | 4,343,538 | | Other comprehensive income, net of tax: Unrealized holding gains on securities available-for-sale arising during the year, net of taxes of $83,819 | | | 119,850 | | | | | | | | | | | | | | | | | | | | | | | | | | Other comprehensive income, net of taxes | | | 119,850 | | | | | | | | | | | | | | | | | | | | 119,850 | | | | 119,850 | | Total comprehensive income | | $ | 4,463,388 | | | | | | | | | | | | | | | | | | | | | | | | | | BALANCE AT DECEMBER 31, 2007 | | | | | | | 2,242,809 | | | | 15,578,903 | | | | 2,455,409 | | | | 9,934,967 | | | | (34,999 | ) | | | 27,934,280 | |
SONOMA VALLEY BANCORP AND SUBSIDIARY CONSOLIDATED STATEMENTS OF CASH FLOWS (Continued)CHANGES IN SHAREHOLDERS' EQUITY
For the years ended December 31, 2006, 20052008, 2007 and 20042006 | | | | | | | | | | | | | | | | | 2006 | | | 2005 | | | 2004 | | | FINANCING ACTIVITIES | | | | | | | | | | | | | | Net change in demand, interest-bearing transaction and savings deposits | | $ | 1,805,126 | | | $ | 9,540,545 | | | $ | 15,628,556 | | | Net change in time deposits | | | 15,203,522 | | | | 12,555,207 | | | | (2,080,157 | ) | | Stock repurchases | | | (1,436,151 | ) | | | (113,668 | ) | | | (4,506,183 | ) | | Stock options exercised | | | 864,993 | | | | 532,635 | | | | 1,168,805 | | | Fractional shares purchased | | | | | | | | | | | (7,498 | ) | | Proceeds from FHLB borrowings | | | 12,600,000 | | | | | | | | | | | Cash dividends paid | | | (1,252,957 | ) | | | (1,078,001 | ) | | | (906,732 | ) | | | | | | | | | | | | | NET CASH PROVIDED BY FINANCING ACTIVITIES | | | 27,784,533 | | | | 21,436,718 | | | | 9,296,791 | | | | | | | | | | | | | | | | | | | | | | | | | | | | NET CHANGE IN CASH AND CASH EQUIVALENTS | | | (1,626,085 | ) | | | (6,268,879 | ) | | | (20,006,982 | ) | | | | | | | | | | | | | | | | Cash and cash equivalents at beginning of year | | | 9,078,341 | | | | 15,347,220 | | | | 35,354,202 | | | | | | | | | | | | | | CASH AND CASH EQUIVALENTS AT END OF YEAR | | $ | 7,452,256 | | | $ | 9,078,341 | | | $ | 15,347,220 | | | | | | | | | | | | | | | | | | | | | | | | | | | | SUPPLEMENTAL DISCLOSURES OF CASH FLOW INFORMATION | | | | | | | | | | | | | | | | | | | | | | | | | | | | Interest expense | | $ | 4,404,411 | | | $ | 2,367,482 | | | $ | 1,550,556 | | | Income taxes | | $ | 2,195,000 | | | $ | 2,340,000 | | | $ | 219,200 | | | | | | | | | | | | | | | | | SUPPLEMENTAL DISCLOSURES OF NONCASH ACTIVITIES: | | | | | | | | | | | | | | | | | | | | | | | | | | | | Net change in unrealized gains and losses on securities | | $ | 264,323 | | | $ | (283,588 | ) | | $ | (283,916 | ) | | Net change in deferred income taxes on unrealized gains and losses on securities | | $ | 108,781 | | | $ | 116,709 | | | $ | 116,844 | |
| | | | | | | | | | | | | | | | | Accumulated | | | | | | | | | | | | | | | | | Additional | | | | | | Other | | | | | | | | Comprehensive | | | Common Stock | | | Paid-in | | | Retained | | | Comprehensive | | | | | | | | Income | | | Shares | | | Amount | | | Capital | | | Earnings | | | Income (Loss) | | | Total | | Redemption and retirement of stock | | | | | | (1,190 | ) | | $ | (8,526 | ) | | | | | | $ | (13,414 | ) | | | | | | $ | (21,940 | ) | Stock options exercised and related tax benefits | | | | | | 49,038 | | | | 668,957 | | | | 72,318 | | | | | | | | | | | | 741,275 | | | Cash dividends of $.60 per share | | | | | | | | | | | | | | | | | | (1,373,226 | ) | | | | | | | (1,373,226 | ) | | Stock options vested | | | | | | | | | | | | | | 64,805 | | | | | | | | | | | | 64,805 | | Restricted stock vested and related tax benefits | | | | | | | | | | 162,750 | | | | (14,677 | ) | | | | | | | | | | | 148,073 | | | Net income for the year | | $ | 3,315,361 | | | | | | | | | | | | | | | | 3,315,361 | | | | | | | | 3,315,361 | | Other comprehensive income, net of tax: Unrealized holding gains on securities available-for-sale arising during the year, net of taxes of $35,994 | | | 51,468 | | | | | | | | | | | | | | | | | | | | | | | | | | Other comprehensive income, net of taxes | | | 51,468 | | | | | | | | | | | | | | | | | | | | 51,468 | | | | 51,468 | | Total comprehensive income | | $ | 3,366,829 | | | | | | | | | | | | | | | | | | | | | | | | | | BALANCE AT DECEMBER 31, 2008 | | | | | | | 2,290,657 | | | $ | 16,402,084 | | | $ | 2,577,855 | | | $ | 11,863,688 | | | $ | 16,469 | | | $ | 30,860,096 | | | | | | | | | | | | | | | | | | | | | | | | | | | | | | | |
The accompanying notes are an integral part of these financial statements. 53
SONOMA VALLEY BANCORP AND SUBSIDIARY
CONSOLIDATED STATEMENTS OF CASH FLOWS
For the years ended December 31, 2008, 2007 and 2006
| | | 2008 | | | 2007 | | | 2006 | | | OPERATING ACTIVITIES | | | | | | | | | | | Net income | | $ | 3,315,361 | | | $ | 4,343,538 | | | $ | 3,991,759 | | Adjustments to reconcile net income to net cash provided by operating activities: | | | | | | | | | | | | | | Provision for loan and lease losses | | | 2,110,000 | | | | 680,000 | | | | 500,000 | | | Depreciation | | | 229,538 | | | | 239,374 | | | | 284,357 | | | Gain on sale of equipment | | | 45 | | | | | | | | | | | Amortization and other | | | 71,590 | | | | 40,254 | | | | 116,041 | | | Stock options and restricted stock granted | | | 227,555 | | | | 379,223 | | | | 181,599 | | | Provision for foreclosed real estate | | | 34,751 | | | | | | | | | | | Net change in interest receivable | | | 3,662 | | | | (10,591 | ) | | | (271,363 | ) | Net change in cash surrender value of life insurance | | | (423,329 | ) | | | (416,847 | ) | | | (347,867 | ) | | Net change in other assets | | | (1,111,380 | ) | | | (1,002,003 | ) | | | (185,303 | ) | Net change in interest payable and other liabilities | | | 765,185 | | | | 494,851 | | | | 1,018,091 | | NET CASH PROVIDED BY OPERATING ACTIVITIES | | | 5,222,978 | | | | 4,747,799 | | | | 5,287,314 | | | INVESTING ACTIVITIES | | | | | | | | | | | | | | Purchases of securities held-to-maturity | | | (495,000 | ) | | | (101,751 | ) | | | (438,272 | ) | | Purchases of securities available-for-sale | | | (6,506,649 | ) | | | (4,195 | ) | | | (42,140 | ) | | Proceeds from maturing securities held-to-maturity | | | 1,128,100 | | | | 1,307,600 | | | | 1,055,000 | | | Proceeds from maturing securities available-for-sale | | | 8,205,000 | | | | 13,000,000 | | | | 13,195,000 | | | Net increase in loans and leases | | | (18,068,982 | ) | | | (31,087,528 | ) | | | (48,412,605 | ) | | Purchases of premises and equipment | | | (171,219 | ) | | | (82,605 | ) | | | (54,915 | ) | | Purchases of life insurance | | | 0 | | | | (350,000 | ) | | | 0 | | | Proceeds from disposal of equipment | | | 0 | | | | 0 | | | | 0 | | NET CASH USED FOR INVESTING ACTIVITIES | | | (15,908,750 | ) | | | (17,318,479 | ) | | | (34,697,932 | ) |
(Continued) SONOMA VALLEY BANCORP AND SUBSIDIARY
CONSOLIDATED STATEMENTS OF CASH FLOWS (Continued)
For the years ended December 31, 2008, 2007 and 2006
| | | 2008 | | | 2007 | | | 2006 | | | FINANCING ACTIVITIES | | | | | | | | | | Net change in demand, interest-bearing transaction and savings deposits | | $ | 5,407,421 | | | $ | 1,182,153 | | | $ | 1,805,126 | | | Net change in time deposits | | | 12,490,381 | | | | 2,098,131 | | | | 15,203,522 | | | Stock repurchases | | | (21,940 | ) | | | (2,933,237 | ) | | | (1,436,151 | ) | | Stock options exercised | | | 582,557 | | | | 576,482 | | | | 864,993 | | | Proceeds from FHLB borrowings | | | 25,000,000 | | | | 14,900,000 | | | | 12,600,000 | | | Repayments on FHLB borrowings | | | (22,500,000 | ) | | | | | | | | | | Cash dividends paid | | | (1,373,226 | ) | | | (1,371,471 | ) | | | (1,252,957 | ) | .NET CASH PROVIDED BY FINANCING ACTIVITIES | | | 19,585,193 | | | | 14,452,058 | | | | 27,784,533 | | NET CHANGE IN CASH AND CASH EQUIVALENTS | | | 8,899,421 | | | | 1,881,378 | | | | (1,626,085 | ) | Cash and cash equivalents at beginning of year | | | 9,333,634 | | | | 7,452,256 | | | | 9,078,341 | | CASH AND CASH EQUIVALENTS AT END OF YEAR | | $ | 18,233,055 | | | $ | 9,333,634 | | | $ | 7,452,256 | | | | | | | | | | | | | | | | SUPPLEMENTAL DISCLOSURES OF CASH FLOW INFORMATION | | | | | | | | | | | | | | �� Interest expense | | $ | 5,485,326 | | | $ | 6,431,217 | | | $ | 4,404,411 | | | Income taxes | | $ | 2,212,156 | | | $ | 2,265,000 | | | $ | 2,195,000 | | | SUPPLEMENTAL DISCLOSURES OF NONCASH ACTIVITIES: | | | | | | | | | | | | | | Loans transferred to other real estate owned | | $ | 332,718 | | | | | | | | | | | Net change in unrealized gains and losses on securities | | $ | 87,462 | | | $ | 203,669 | | | $ | 264,323 | | | Net change in deferred income taxes on unrealized gains and losses on securities | | $ | 35,994 | | | $ | 83,819 | | | $ | 108,781 | |
The accompanying notes are an integral part of these financial statements. NOTE A—SIGNIFICANT ACCOUNTING POLICIES
Business: Sonoma Valley Bancorp (the Company), formed in 2000, is a bank holding company whose principal activity is the ownership and management of its wholly-owned subsidiary, Sonoma Valley Bank. Sonoma Valley Bank was organized in 1987 and commenced operations on June 3, 1988 as a California state-chartered bank. The Bank is subject to regulation, supervision and regular examination by the State Department of Financial Institutions and Federal Deposit Insurance Corporation. The regulations of these agencies govern most aspects of the Bank’sBank's business.
Principles of Consolidation: The consolidated financial statements include the accounts of the Company and the Bank. All material inter-company accounts and transactions have been eliminated.
Nature of Operations: The Bank provides a variety of banking services to individuals and businesses in its primary service area of Sonoma, California and the immediate surrounding area. The Bank offers depository and lending services primarily to meet the needs of its business and professional clientele. These services include a variety of demand deposit, savings and time deposit account alternatives and special merchant and business services. The Bank’sBank's lending activities are directed primarily towards granting short and medium-term commercial loans, customized lines of credit, for such purposes as operating capital, business and professional start-ups, inventory, equipment and accounts receivable and interim construction financing.
Use of Estimates: The preparation of financial statements in conformity with generally accepted accounting principles requires management to make estimates and assumptions that affect the reported amounts of assets and liabilities and disclosure of contingent assets and liabilities at the date of the financial statements and the reported amounts of revenues and expenses during the reporting period. Actual results could differ from those estimates.
The determination of the adequacy of the allowance for loan losses is based on estimates that are particularly susceptible to significant changes in the economic environment and market conditions. In connection with the determination of the estimated losses on loans, management obtains independent appraisals for significant collateral. The Bank's loans are generally secured by specific items of collateral including real property, consumer assets, and business assets. Although the Bank has a diversified loan portfolio, a substantial portion of its debtors' ability to honor their contracts is dependent on local economic conditions. While management uses available information to recognize losses on loans, further reductions in the carrying amounts of loans may be necessary based on changes in local economic conditions. Because of these factors, it is reasonably possible that the estimated losses on loans may change materially in the near term. However, the amount of the change that is reasonably possible cannot be estimated.
Cash and Cash Equivalents: For the purposes of reporting cash flows, cash and cash equivalents are defined as those amounts included in the balance sheet captions “Cash"Cash and due from banks”banks" and “Federal"Federal funds sold.”" Generally, federal funds are sold or purchased for one-day periods.
Investment Securities: Securities are classified as held-to-maturity if the Company has both the intent and ability to hold those debt securities to maturity regardless of changes in market conditions, liquidity needs or changes in general economic conditions. These securities are carried at cost adjusted for amortization of premium and accretion of discount, computed by the interest method over their contractual lives. NOTE A—SIGNIFICANT ACCOUNTING POLICIES (Continued) Securities are classified as available-for-sale if the Company intends to hold those debt securities for an indefinite period of time, but not necessarily to maturity. Any decision to sell a security classified as available-for-sale would be based on various factors, including significant movements in interest rates, changes in the maturity mix of the Company’sCompany's assets and liabilities, liquidity needs, regulatory capital considerations and other similar factors. Securities available-for-sale are carried at fair value. Unrealized holding gains or losses are reported as increases or decreases in shareholders’shareholders' equity, net of the related deferred tax effect. Realized gains or losses, determined on the basis of the cost of specific securities sold, are included in earnings. 54
NOTE A—SIGNIFICANT ACCOUNTING POLICIES (Continued)
Loans and Lease Financing Receivables: Loans are stated at the amount of unpaid principal, less the allowance for loan losses and net deferred loan fees. Interest on loans is accrued and credited to income based on the principal amount outstanding. Loan origination fees and certain direct loan origination costs are capitalized and recognized as an adjustment of the yield on the related loan. However, loan origination costs in excess of fees collected are not deferred but this treatment has an immaterial impact on the financial statements. Amortization of net deferred loan fees is discontinued when the loan is placed on nonaccrual status.
All of the Company’s leases are classified and accounted for as direct financing leases. Under the direct financing method of accounting for leases, the total net rentals receivable under the lease contracts, net of unearned income, are recorded as a net investment in direct financing leases, and the unearned income is recognized each month as it is earned so as to produce a constant periodic rate of return on the unrecovered investment.
Allowance for Loan and Lease Losses: The allowance is maintained at a level which, in the opinion of management, is adequate to absorb probable losses inherent in the loan and lease portfolio. Credit losses related to off-balance-sheet instruments are included in the allowance for loan and lease losses except if the loss meets the criteria for accrual under Statement of Financial Accounting Standards (SFAS) No. 5, in which case the amount is accrued and reported separately as a liability. Management determines the adequacy of the allowance based upon reviews of individual loans and leases, recent loss experience, current economic conditions, the risk characteristics of the various categories of loans and leases and other pertinent factors. The allowance is based on estimates, and ultimate losses may vary from the current estimates. These estimates are reviewed monthly and, as adjustments become necessary, they are reported in earnings in the periods in which they become known. Loans and leases deemed uncollectible are charged to the allowance. Provisions for loan and lease losses and recoveries on loans previously charged off are added to the allowance. The allowance for loan and lease losses is based on a formula allocation for similarly risk-rated loans and individually for impaired loans as determined by SFAS No. 114, Accounting by Creditors for Impairment of a Loan and SFAS No. 5, Accounting for Contingencies.
Commercial, real estate and construction loans are considered impaired, based on current information and events, if it is probable that the Company will be unable to collect the scheduled payments of principal or interest when due according to the contractual terms of the loan agreement. Allowances on impaired loans are established based on the present value of expected future cash flows discounted at the loan’s historical effective interest rate or, for collateral-dependent loans, on the fair value of the collateral. Consumer and other homogeneous smaller balance loans are reviewed on a collective basis for impairment. Cash receipts on impaired loans are used to reduce principal. NOTE A—SIGNIFICANT ACCOUNTING POLICIES (Continued) Income Recognition on Impaired and Nonaccrual Loans and Leases: Loans and leases, including impaired loans, are generally classified as nonaccrual if they are past due as to maturity or payment of principal or interest for a period of more than 90 days, unless such loans are well-secured and in the process of collection. If a loan or lease or a portion of a loan or lease is classified as doubtful or is partially charged off, the loan or lease is classified as nonaccrual.nonaccrual except for overdrafts that are converted to loans. These loans are classified as doubtful but are carried in accrual status as long as they are current. Loans and leases that are on a current payment status or past due less than 90 days may also be classified as nonaccrual if repayment in full of principal and/or interest is in doubt. 55
NOTE A—SIGNIFICANT ACCOUNTING POLICIES (Continued)
Loans and leases may be returned to accrual status when all principal and interest amounts contractually due (including arrearages) are reasonably assured of repayment within an acceptable period of time, and there is a sustained period of repayment performance by the borrower, in accordance with the contractual terms of interest and principal.
While a loan or lease is classified as nonaccrual and the future collectibilitycollectability of the recorded balance is doubtful, collections of interest and principal are generally applied as a reduction to principal outstanding. When the future collectibilitycollectability of the recorded balance is expected, interest income may be recognized on a cash basis. In the case where a nonaccrual loan or lease had been partially charged off, recognition of interest on a cash basis is limited to that which would have been recognized on the recorded balance at the contractual interest rate. Cash interest receipts in excess of that amount are recorded as recoveries to the allowance for loan losses until prior charge-offs have been fully recovered.
Premises and Equipment: Premises and equipment are stated at cost, less accumulated depreciation. The provision for depreciation is computed principally by the straight-line method over the estimated useful lives of the related assets. Leasehold improvements are amortized over the shorter of their useful life or the lease term.
Investments in Limited Partnerships: The Company owns a 3.06% interest in a limited partnership that owns and operates affordable housing projects. The investment in this project serves as an element of the Company’s compliance with the Community Reinvestment Act and the Company receives tax benefits in the form of deductions for operating losses and tax credits. The tax credits may be used to reduce taxes currently payable or may be carried back one year or forward ten years to recapture or reduce taxes. The Company uses the equity method of accounting for the partnership’s operating results and tax credits are recorded in the years they became available to reduce income taxes.
Investment in Federal Home Loan Bank Stock: As a member of the Federal Home Loan Bank (FHLB) System, the Bank is required to maintain an investment in capital stock of the FHLB. The investment exceeds the minimum requirement at December 31, 2008 and 2007. The investment is stated at cost in the accompanying balance sheets and is reported as part of other assets.
Foreclosed Real Estate: Foreclosed real estate includes both formally foreclosed property and in-substance foreclosed property. In-substance foreclosed properties are those properties for which the Company has taken physical possession, regardless of whether formal foreclosure proceedings have taken place. NOTE A—SIGNIFICANT ACCOUNTING POLICIES (Continued) At the time of foreclosure, foreclosed real estate is recorded at the lower of the carrying amount or fair value less cost to sell, which becomes the property’s new basis. Any write-downs based on the asset’s fair value at date of acquisition are charged to the allowance for loan losses. After foreclosure, valuations are periodically performed by management and the real estate is carried at the lower of their new cost basis or fair value minus estimated costs to sell. Revenue and expenses from operations and subsequent adjustments to the carrying amount are included in other non-interest expenses. Income Taxes: Provisions for income taxes are based on amounts reported in the statements of operations (after exclusion of non-taxable income such as interest on state and municipal securities) and include deferred taxes on temporary differences in the recognition of income and expense for tax and financial statement purposes. Deferred taxes are computed using the asset and liability method. Deferred tax assets and liabilities are recognized for the future tax consequences attributable to differences between the financial statement carrying amounts of assets and liabilities and their respective tax bases. Deferred tax assets and liabilities are measured using enacted tax rates expected to apply to taxable income in the years in which those temporary differences are expected to be recovered or settled. The effect on deferred tax assets and liabilities of a change in tax rates is recognized in income in the period that includes the enactment date. Deferred tax assets are recognized for deductible temporary differences and tax credit carryforwards, and then a valuation allowance is established to reduce that deferred tax asset if it is “more"more likely than not”not" that the related tax benefits will not be realized.
The Company adopted the provisions of FIN No. 48, Accounting for Uncertainty in Income Taxes (“FIN 48”), on January 1, 2007. FIN 48 prescribes a recognition threshold that a tax position is required to meet before being recognized in the financial statements and provides guidance on derecognition, measurement, classification, interest and penalties, accounting in interim periods, disclosure and transition issues. Pursuant to FIN 48, the Company examines its financial statements, its income tax provision, and its federal and state income tax returns and analyzes its tax position, including permanent and temporary differences, as well as the major components of income and expense to determine whether a tax benefit is more likely than not to be sustained upon examination by tax authorities. The Company recognizes interest and penalties arising from income tax settlements as part of its provision for income taxes.
Advertising: Advertising costs are charged to operations in the year incurred.
Net Income Per Share of Common Stock: Net income per share of common stock is computed by dividing net income by the weighted average number of shares of common stock outstanding during the year, after giving retroactive effect to stock dividends and splits. Net income per share—assuming dilution is computed similar to net income per share except that the denominator is increased to include the number of additional common shares that would have been outstanding if the dilutive potential common shares had been issued. Included in the denominator is the dilutive effect of stock options and unvested restricted stock computed under the treasury method. 56
NOTE A—SIGNIFICANT ACCOUNTING POLICIES (Continued)
Share-Based Payment Accounting: At December 31, 2006,2008, the Company has a stock-based employee and director compensation plan, which is described more fully in Note L. Prior to January 1, 2003, the Company accounted for those plans under the recognition and measurement provisions of APB Opinion No. 25,Accounting for Stock Issued to Employees,and related Interpretations. No stock-based compensation cost is reflected in net income for stock options granted prior to January 1, 2003, as all options granted under those plans had an exercise price equal to the market value of the underlying common stock on the date of grant. Effective January 1, 2003, theThe Company adopted the fair value recognition provisions of SFASStatement of Financial Accounting Standard (SFAS) No. 123,Accounting for Stock-Based Compensation,prospectively to all employee awards granted, modified, or settled after January 1, 2003. Options were granted in 2004, 2007 and 2008 under the fair value method. Awards under the plan vest over two to five years. Restricted stock was granted in July 2006 that vests over three to five years beginning July 2007. The cost related to stock-based employee compensation included in the determination of net income for 2004 is less than that which would have been recognized if the fair value based method had been applied to all awards since the original effective date of SFAS No. 123 because a portion of the shares had not yet vested. The cost related to share-based employee compensation is included in the determination of net income for the years ended December 31, 20062008, 2007 and 2005. The following table illustrates the effect on net income and earnings per share if the fair value-based method had been applied to all outstanding and unvested awards in each period.2006. | | | | | | | | | | | | | | | | | 2006 | | | 2005 | | | 2004 | | | Net income, as reported | | $ | 3,991,759 | | | $ | 3,348,529 | | | $ | 2,907,621 | | | Add: Share-based employee compensation expense included in reported net income, net of related tax effects | | | 106,871 | | | | 61,011 | | | | 61,011 | | | Deduct: Total share-based employee compensation expense determined under fair value based method for all awards, net of related tax effects | | | (106,871 | ) | | | (61,011 | ) | | | (185,012 | ) | | | | | | | | | | | | | | | | | | | | | | | | | | | Pro forma net income | | $ | 3,991,759 | | | $ | 3,348,529 | | | $ | 2,783,620 | | | | | | | | | | | | | | | | | | | | | | | | | | | | Earnings per share: | | | | | | | | | | | | | | Basic—as reported | | $ | 1.78 | | | $ | 1.54 | | | $ | 1.35 | | | Basic—pro forma | | | 1.78 | | | | 1.54 | | | | 1.30 | | | Diluted—as reported | | | 1.68 | | | | 1.45 | | | | 1.25 | | | Diluted—pro forma | | | 1.68 | | | | 1.45 | | | | 1.20 | |
Off-Balance-Sheet Financial Instruments: In the ordinary course of business the Company has entered into off-balance-sheet financial instruments consisting of commitments to extend credit and standby letters of credit. Such financial instruments are recorded in the financial statements when they become payable. 57
NOTE A—SIGNIFICANT ACCOUNTING POLICIES (Continued)
Operating Segments: Reportable segments are based on products and services, geography, legal structure, management structure and any other manner in which management desegregates a company for making operating decisions and assessing performance. The Company has determined that its business is comprised of a single operating segment. Reclassifications: As a result of implementing SFAS No. 123R, the Company has reclassified $295,335 at January 1, 2004, $1,016,275 as of December 31, 2004 and $1,252,292 as of December 31, 2005 from Common Stock to Additional Paid-in Capital representing activity related to share-based compensation.
New Accounting Pronouncements: In September 2006June 2008, the FASBFinancial Accounting Standard Board (FASB) issued Statement Number 157(SFASStaff Position No. 157),Fair Value Measurements. FAS 157 changesEITF 03-6-1 that addresses whether instruments granted in share-based payment transactions are participation securities prior to vesting and, therefore need to be included in the definition of fair value, the methods used to measure fair value and also expands disclosures about fair value measurement. SFAS No. 157earnings allocation in computing earnings per share. This Staff Position is effective for the financial statements issued for the fiscal years beginning after NovemberDecember 15, 2007.2008.
In December 2007, the FASB issued SFAS No. 141, revised, Business Combination. This Statement established principles and requirements for how the acquirer recognizes and measures in its financial statements the identifiable assets acquired, the liabilities assumed, and any noncontrolling interest, recognizes and measures goodwill acquired in a business combination, and discloses the nature and financial effects of the business combination. This Statement applies prospectively to business combinations for which the acquisition date is on or after December 15, 2008.
In December 2007, the FASB issued SFAS No. 160, Noncontrolling Interests in Consolidated Financial Statements—an Amendment of ARB No. 51. This Statement establishes accounting and reporting standards for a minority interest in the parent company financial statements and requires separate identification of equity and net income in the consolidated financial statements. This Statement is effective for fiscal years, and interim periods within those fiscal years, beginning on or after December 15, 2008.
NOTE B—RESTRICTIONS ON CASH AND DUE FROM BANKS
Cash and due from banks include amounts the Bank is required to maintain to meet certain average reserve and compensating balance requirements of the Federal Reserve. The total requirement at December 31, 20062008 and 20052007 was $680,000$654,000 and $586,000,$721,000, respectively. NOTE C—INVESTMENT SECURITIES The amortized cost and approximate fair value of investment securities are summarized as follows: | | | | | | | | | | | | | | | | | | | | | Amortized | | | Unrealized | | | Unrealized | | | | | | | | Cost | | | Gain | | | Losses | | | Fair Value | | | December 31, 2006: | | | | | | | | | | | | | | | | | | Securities Available-For-Sale | | | | | | | | | | | | | | | | | | U.S. Treasury securities | | $ | 4,987,285 | | | | | | | $ | (51,816 | ) | | $ | 4,935,469 | | | U.S. Government agency securities | | | 16,224,950 | | | | | | | | (207,344 | ) | | | 16,017,606 | | | Equity securities | | | 42,140 | | | $ | 1,163 | | | | (5,146 | ) | | | 38,157 | | | | | | | | | | | | | | | | | | | | | | | | | | | | | | | | | | | | | $ | 21,254,375 | | | $ | 1,163 | | | $ | (264,306 | ) | | $ | 20,991,232 | | | | | | | | | | | | | | | | | | | | | | | | | | | | | | | | | | | Securities Held-to-Maturity | | | | | | | | | | | | | | | | | | Municipal securities | | $ | 15,804,421 | | | $ | 262,609 | | | $ | (115,477 | ) | | $ | 15,951,553 | | | | | | | | | | | | | | | |
58
| | | Amortized Cost | | | | Unrealized Gain | | | | Unrealized Losses | | | | Fair Value | | | December 31, 2008: | | | | | | | | | | | | | | | | | Securities Available-For-Sale | | | | | | | | | | | | | | | | U.S. Treasury securities | | $ | 498,909 | | | | $ | 943 | | | | | | | | $ | 499,852 | | U.S. Government agency securities | | | 6,004,588 | | | | | 57,365 | | | | | | | | | 6,061,953 | | | Equity securities | | | 47,440 | | | | | | | | | $ | (30,321 | ) | | | | 17,119 | | | | | $ | 6,550,937 | | | | $ | 58,308 | | | | $ | (30,321 | ) | | | $ | 6,578,924 | | | Securities Held-to-Maturity | | | | | | | | | | | | | | | | | | | | Municipal securities | | $ | 13,862,911 | | | | $ | 265,339 | | | | $ | (100,139 | ) | | | $ | 14,028,111 | | | | | | | | | | | | | | | | | | | | | | |
| | | Amortized Cost | | | Unrealized Gain | | | Unrealized Losses | | | Fair Value | | | December 31, 2007: | | | | | | | | | | | | | | Securities Available-For-Sale | | | | | | | | | | | | | U.S. Treasury securities | | $ | 999,495 | | | $ | 349 | | | | | | $ | 999,844 | | U.S. Government agency securities | | | 7,216,834 | | | | | | | $ | (45,481 | ) | | | 7,171,353 | | | Equity securities | | | 46,335 | | | | | | | | (14,342 | ) | | | 31,993 | | | | | $ | 8,262,664 | | | $ | 349 | | | $ | (59,823 | ) | | $ | 8,203,190 | | | Securities Held-to-Maturity | | | | | | | | | | | | | | | | | | Municipal securities | | $ | 14,554,224 | | | $ | 226,356 | | | $ | (26,331 | ) | | $ | 14,754,249 | |
NOTE C—INVESTMENT SECURITIES (Continued) | | | | | | | | | | | | | | | | | | | | | Amortized | | | Unrealized | | | Unrealized | | | | | | | | Cost | | | Gain | | | Losses | | | Fair Value | | | December 31, 2005: | | | | | | | | | | | | | | | | | | Securities Available-For-Sale | | | | | | | | | | | | | | | | | | U.S. Treasury securities | | $ | 5,462,455 | | | | | | | $ | (89,799 | ) | | $ | 5,372,656 | | | U.S. Government agency securities | | | 28,982,106 | | | | | | | | (437,668 | ) | | | 28,544,438 | | | | | | | | | | | | | | | | | | | | | | $ | 34,444,561 | | | | | | | $ | (527,467 | ) | | $ | 33,917,094 | | | | | | | | | | | | | | | | | | Securities Held-to-Maturity | | | | | | | | | | | | | | | | | | Municipal securities | | $ | 16,499,865 | | | $ | 295,863 | | | $ | (161,209 | ) | | $ | 16,634,519 | | | | | | | | | | | | | | | |
| | | | | | | | | | | | | | | | | | Contractual maturities of investment securities at December 31, 2008 were as follows: | | | | | | | | | | | | | | | | | |
| | | | Securities | | | | Securities | | | | | | Available-For-Sale | | | | Held-To-Maturity | | | | | | Amortized | | | | | | | Amortized | | | | | | | | | Cost | | Fair Value | | | Cost | | Fair Value | | | | | | | | | | | | | | | | | | | | Due in one year or less | | $ | 6,503,497 | | | $ | 6,561,805 | | | $ | 854,779 | | | $ | 864,523 | | | Due after one year through five years | | | | | | | | | | | 7,109,369 | | | | 7,242,833 | | | Due after five years through ten years | | | | | | | | | | | 4,748,090 | | | | 4,810,605 | | | Due after ten years | | | | | | | | | | | 1,150,673 | | | | 1,110,150 | | | Equity securities | | | 47,440 | | | | 17,119 | | | | | | | | | | | | | $ | 6,550,937 | | | $ | 6,578,924 | | | $ | 13,862,911 | | | $ | 14,028,111 | | | | | | | | | | | | | | | | | | | |
During 2006, 20052008, 2007 and 2004,2006, the Company did not sell any securities available-for-sale.
As of December 31, 2006,2008, investment securities with a carrying amount of $7,298,481$7,629,270 and an approximate fair value of $7,438,150$7,714,451 were pledged, in accordance with federal and state requirements, as collateral for public deposits. Investment securities with a carrying amount and fair value of $5,318,743$6,261,894 at December 31, 20062008 were pledged to meet the requirements of the Federal Reserve and the U.S. Department of Justice. As of December 31, 2005,2007, investment securities with a carrying amount of $7,675,665$6,131,085 and an approximate fair value of $7,854,363$6,247,992 were pledged, in accordance with federal and state requirements, as collateral for public deposits. Investment securities with a carrying amount and fair value of $5,284,008$3,991,635 at December 31, 20052007 were pledged to meet the requirements of the Federal Reserve and the U.S. Department of Justice. NOTE C—INVESTMENT SECURITIES (Continued)
The following table shows the investments’ gross unrealized losses and fair value, aggregated by investment category and length of time that individual securities have been in a continuous unrealized loss position, at December 31. | | | | | | | | | | | | | | | | | | | | | 2006 | | | | | Less Than 12 Months | | | 12 Months or Greater | | | | | Fair | | | Unrealized | | | Fair | | | Unrealized | | | Description of Securities | | Value | | | Losses | | | Value | | | Losses | | | U.S. Treasury securities | | | | | | | | | | $ | 4,935,469 | | | $ | 51,816 | | | U.S. Government agency securities | | | | | | | | | | | 16,017,606 | | | | 207,344 | | | Municipal securities | | $ | 1,582,429 | | | $ | 8,141 | | | | 4,888,575 | | | | 107,336 | | | | | | | | | | | | | | | | | | | | | | | | | | | | | | | | | | | Total temporarily impaired securities | | $ | 1,582,429 | | | $ | 8,141 | | | $ | 25,841,650 | | | $ | 366,496 | | | | | | | | | | | | | | | |
59
NOTE C—INVESTMENT SECURITIES (Continued)| | | | | | | | | | | | | | | | | | | | | | 2005 | | | 2008 | | | | | Less Than 12 Months | | 12 Months or Greater | | | Less Than 12 Months | | | 12 Months or Greater | | | | | Fair | | Unrealized | | Fair | | Unrealized | | | Fair | | | Unrealized | | | Fair | | | Unrealized | | | Description of Securities | | Value | | Losses | | Value | | Losses | | | Value | | | Losses | | | Value | | | Losses | | | U.S. Treasury securities | | $ | 982,969 | | $ | 12,614 | | $ | 4,389,687 | | $ | 77,185 | | | | U.S. Government agency securities | | 7,018,348 | | 46,292 | | 21,526,090 | | 391,376 | | | | | | | | | | | | | | | | | | | Municipal securities | | 3,380,940 | | 37,025 | | 4,771,878 | | 124,184 | | | $ | 1,411,398 | | | $ | 100,139 | | | | | | | | | | | | | | | | | | | | | | | | | Equity securities | | | | 580 | | | | 525 | | | $ | 16,539 | | | $ | 30,316 | | | Total temporarily impaired securities | | $ | 11,382,257 | | $ | 95,931 | | $ | 30,687,655 | | $ | 592,745 | | | $ | 1,411,978 | | | $ | 100,664 | | | $ | 16,539 | | | $ | 30,316 | | | | | | | | | | | | | |
| | | 2007 | | | | | Less Than 12 Months | | | 12 Months or Greater | | | | | Fair | | | Unrealized | | | Fair | | | Unrealized | | | Description of Securities | | Value | | | Losses | | | Value | | | Losses | | | | | | | | | | | | | | | | | U.S. Government agency securities | | | | | | | | $ | 7,171,353 | | | $ | 45,481 | | | Municipal securities | | $ | 101,564 | | | $ | 63 | | | | 3,608,462 | | | | 26,268 | | | Equity securities | | | 11,778 | | | | 4,216 | | | | 20,215 | | | | 10,126 | | | Total temporarily impaired securities | | $ | 113,342 | | | $ | 4,279 | | | $ | 10,800,030 | | | $ | 81,875 | |
There were 5 municipal securities and 16 U.S. government agency securities, 5 U.S. Treasury Notes and 21 municipalequity securities in an unrealized loss position at December 31, 2006.2008. There were 227 U.S. government agency securities, 5 U.S. Treasury Notes14 municipal securities and 14 municipal15 equity securities in an unrealized loss position at December 31, 2005.2007. The unrealized losses on these securities were caused by interest rate increases.increases or, in the case of the equity securities, market disfavor with financial institutions stock. The Company purchased small amounts of various bank equity securities in order to track and analyze peer group banks and the potential loss is relatively small. In the case of the municipal securities, the contractual terms of these investments do not permit the issuer to settle the securities at a price less than the par value of the investment. Because the Company has the ability and intent to hold these investments until a recovery of fair value, which may be maturity, the Company does not consider these investments to be other-than-temporarily impaired at December 31, 20062008 and 2005.2007. 60
NOTE D—LOANS AND LEASES AND ALLOWANCE FOR LOAN AND LEASE LOSSES
The composition of the loan and lease portfolio was as follows at December 31: | | | | | | | | | | | | | | | | | | | | | 2006 | | | 2005 | | | Commercial | | $ | 146,573,119 | | | | 66.6 | % | | $ | 118,590,731 | | | | 69.1 | % | | Consumer | | | 27,797,562 | | | | 12.6 | % | | | 21,804,507 | | | | 12.7 | % | | Real estate mortgage | | | 17,154,768 | | | | 7.8 | % | | | 13,251,137 | | | | 7.7 | % | | Real estate construction | | | 28,590,367 | | | | 13.0 | % | | | 18,004,805 | | | | 10.5 | % | | Lease financing receivables, net of unearned income of $9,513 in 2006 and $4,357 in 2005 | | | 36,030 | | | | 0.0 | % | | | 25,822 | | | | 0.0 | % | | | | | | | | | | | | | | | | | | | 220,151,846 | | | | 100.0 | % | | | 171,677,002 | | | | 100.0 | % | | | | | | | | | | | | | | | | | | | | | | | | | | | | | | | | | | | | Deferred loan fees and costs, net | | | (544,184 | ) | | | | | | | (482,410 | ) | | | | | | Allowance for loan and lease losses | | | (3,276,972 | ) | | | | | | | (2,776,507 | ) | | | | | | | | | | | | | | | | | | | | | | | | | | | | | | | | | | | | | | | | | | $ | 216,330,690 | | | | | | | $ | 168,418,085 | | | | | | | | | | | | | | | | | | | | | |
| | | 2008 | | | | | 2007 | | | | | | | | | | | | | | | | | | Commercial | | $ | 182,975,920 | | | | 68.4 | % | | | | $ | 177,989,391 | | | | | 70.9 | % | | Consumer | | | 36,549,623 | | | | 13.7 | % | | | | | 29,163,877 | | | | | 11.6 | % | | Real estate mortgage | | | 20,163,163 | | | | 7.5 | % | | | | | 17,946,113 | | | | | 7.2 | % | | Real estate construction | | | 27,918,414 | | | | 10.4 | % | | | | | 25,772,958 | | | | | 10.3 | % | Lease financing receivables, net of unearned income of $6,290 in 2007 | | | 17,634 | | | | 0.0 | % | | | | | 21,665 | | | | | 0.0 | % | | | | | 267,624,754 | | | | 100.0 | % | | | | | 250,894,004 | | | | | 100.0 | % | | | | | | | | | | | | | | | | | | | | | | | Deferred loan fees and costs, net | | | (215,470 | ) | | | | | | | | | (432,569 | ) | | | | | | | Allowance for loan and lease losses | | | (5,032,500 | ) | | | | | | | | | (3,723,217 | ) | | | | | | | | | $ | 262,376,784 | | | | | | | | | $ | 246,738,218 | | | | | | |
At December 31, 2006,2008, the recorded investment in loans for which impairment has been recognized in accordance with SFAS No. 114 totaled $ 939,000$8,700,000 with a corresponding valuation allowance of $ 124,000.$1,186,000. At December 31, 2005,2007, the recorded investment in loans for which impairment has been recognized in accordance with Statement No. 114 totaled $1,137,000,$2,097,000, with a corresponding valuation allowance of $250,000.$283,000. For the years ended December 31, 2006, 20052008, 2007 and 2004,2006, the average recorded investment in impaired loans was approximately $1,035,000, $1,060,000$5,325,000, $332,000 and $1,263,000,$1,035,000, respectively. During 2008, 2007 and 2006, 2005$334,000, $163,000 and 2004, $8,000 $8,000 and $7,000 of interest was received and recognized on impaired loans, respectively.
At December 31, 2006 and 2005,2008, the Company did not havehad other nonaccrual loans totaling $1,030,000 for which impairment hadhas not been recognized.
The Company has no commitments to loan additional funds to the borrowers of impaired or nonaccrual loans. 61
NOTE D—LOANS AND LEASES AND ALLOWANCE FOR LOAN AND LEASE LOSSES (Continued)
The maturity and repricing distribution of the loan and lease portfolio at December 31: | | | | | | | | | | | | | 2006 | | | 2005 | | | Fixed rate loan maturities | | | | | | | | | | Three months or less | | $ | 10,269,932 | | | $ | 10,168,260 | | | Over three months to twelve months | | | 40,265,531 | | | | 12,279,697 | | | Over one year to five years | | | 97,220,910 | | | | 90,625,410 | | | Over five years | | | 20,611,428 | | | | 23,608,069 | | | Floating rate loans repricing | | | | | | | | | | Quarterly or more frequently | | | 46,890,506 | | | | 30,197,653 | | | Quarterly to annual frequency | | | 1,456,216 | | | | 79,850 | | | One to five years frequency | | | 2,617,687 | | | | 3,724,175 | | | | | | | | | | | | | | 219,332,210 | | | | 170,683,114 | | | Nonaccrual loans | | | 819,637 | | | | 993,888 | | | | | | | | | | | | | | | | | | | | | | | $ | 220,151,847 | | | $ | 171,677,002 | | | | | | | | | |
| | | 2008 | | | | 2007 | | | Fixed rate loan maturities | | | | | | | | | Three months or less | | $ | 69,203,657 | | | | $ | 32,464,840 | | | Over three months to twelve months | | | 65,919,143 | | | | | 60,965,840 | | | Over one year to five years | | | 80,413,259 | | | | | 93,613,696 | | | Over five years | | | 31,842,236 | | | | | 16,817,804 | | | Floating rate loans repricing | | | | | | | | | | | Quarterly or more frequently | | | 4,886,141 | | | | | 39,892,211 | | | Quarterly to annual frequency | | | 861,510 | | | | | 311,741 | | | One to five years frequency | | | 8,258,927 | | | | | 6,027,843 | | | | | | 261,384,874 | | | | | 250,093,975 | | | Nonaccrual loans | | | 6,239,881 | | | | | 800,029 | | | | | $ | 267,624,754 | | | | $ | 250,894,004 | |
An analysis of the changes in the allowance for loan and lease losses is as follows for the years ended December 31: | | | | | | | | | | | | | | | | | 2006 | | | 2005 | | | 2004 | | | Beginning balance | | $ | 2,776,507 | | | $ | 2,428,572 | | | $ | 2,634,625 | | | Provision for loan and lease losses | | | 500,000 | | | | 360,000 | | | | 130,000 | | | Loans charged off: | | | | | | | | | | | | | | Commercial | | | (6,593 | ) | | | (53,337 | ) | | | (290,000 | ) | | Consumer | | | (12,262 | ) | | | (16,976 | ) | | | (63,007 | ) | | | | | | | | | | | | | | | | (18,855 | ) | | | (70,313 | ) | | | (353,007 | ) | | Recoveries: | | | | | | | | | | | | | | Commercial | | | 17,668 | | | | 55,055 | | | | 15,416 | | | Consumer | | | 1,652 | | | | 3,193 | | | | 1,538 | | | | | | | | | | | | | | | | | 19,320 | | | | 58,248 | | | | 16,954 | | | | | | | | | | | | | | | | | | | | | | | | | | | | Ending balance | | $ | 3,276,972 | | | $ | 2,776,507 | | | $ | 2,428,572 | | | | | | | | | | | | |
62
| | | 2008 | | | | 2007 | | | | 2006 | | | | | | | | | | | | | | | | Beginning balance | | $ | 3,723,217 | | | | $ | 3,276,972 | | | | $ | 2,776,507 | | | Provision for loan and lease losses | | | 2,110,000 | | | | | 680,000 | | | | | 500,000 | | | Loans charged off: | | | | | | | | | | | | | | | Commercial | | | (519,318 | ) | | | | (187,075 | ) | | | | (6,593 | ) | Consumer | | | (508,758 | ) | | | | (63,901 | ) | | | | (12,262 | ) | | | | | (1,028,076 | ) | | | | (250,976 | ) | | | | (18,855 | ) | | Recoveries: | | | | | | | | | | | | | | | Commercial | | | 218,812 | | | | | 16,315 | | | | | 17,668 | | Consumer | | | 8,547 | | | | | 906 | | | | | 1,652 | | | | | | 227,359 | | | | | 17,221 | | | | | 19,320 | | | Ending balance | | $ | 5,032,500 | | | | $ | 3,723,217 | | | | $ | 3,276,972 | |
NOTE E—PREMISES AND EQUIPMENT
Premises and equipment consisted of the following at December 31: | | | | | | | | | | | | | 2006 | | | 2005 | | | Land | | $ | 175,000 | | | $ | 175,000 | | | Building | | | 71,943 | | | | 71,943 | | | Leasehold improvements | | | 797,191 | | | | 797,191 | | | Furniture, fixtures and equipment | | | 2,016,045 | | | | 1,961,130 | | | | | | | | | | | | | | 3,060,179 | | | | 3,005,264 | | | Less: Accumulated depreciation | | | (2,110,955 | ) | | | (1,826,598 | ) | | | | | | | | | | | | | | | | | | | | | | $ | 949,224 | | | $ | 1,178,666 | | | | | | | | | |
| | | 2008 | | | | 2007 | | | | | | | | | | | Land | | $ | 175,000 | | | | $ | 175,000 | | Building | | | 71,943 | | | | | 71,943 | | Building improvements | | | 37,402 | | | | | 25,432 | | Leasehold improvements | | | 803,594 | | | | | 797,191 | | Furniture, fixtures and equipment | | | 2,158,554 | | | | | 2,073,218 | | | | | | 3,246,493 | | | | | 3,142,784 | | Less: Accumulated depreciation | | | (2,512,402 | ) | | | | (2,350,329 | ) | | | | $ | 734,091 | | | | $ | 792,455 | |
NOTE F—TIME DEPOSITS
The maturities of time deposits at December 31, 20062008 are as follows: | | | | | | | Maturing within one year | | $ | 64,234,000 | | | Maturing in one year to two years | | | 6,070,000 | | | Maturing two years through five years | | | 1,393,000 | | | | | | | | | | | | | | | | $ | 71,697,000 | | | | | | |
Maturing within one year | | $ | 76,730,000 | | Maturing in one year to three years | | | 7,714,000 | | Maturing three years through five years | | | 1,842,000 | | | | | $ | 86,286,000 | |
NOTE G—FEDERAL FUNDS CREDIT LINES AND BORROWINGS The Company has an agreement to borrow from the Federal Reserve by obtaining advances to the extent of pledged collateral. Investment securities with a carrying value of $5,700,000 were held as collateral with the Federal Reserve Bank. The maximum borrowing available under the agreement was $5,500,000 at December 31, 2008.
The Company has uncommitted federal funds lines of credit agreements with other banks. The maximum borrowings available under these lines totaled $22,000,000$19,000,000 at December 31, 2006.2008. There were no borrowings outstanding under these agreements at December 31, 20062008 or 2005.2007.
The Company pledged loans totaling $146,885,010$152,879,522 as collateral to secure advances from the Federal Home Loan Bank of up to $82,093,929.$68,450,663. At December 31, 2006,2008, the Company borrowed $7,600,000 over-night with the Federal Home Loan Bank and also has ahad long-term borrowingborrowings of $5,000,000. The over-night borrowing expires five days from the date of purchase and carries an interest on the outstanding principal balance of 5.22%.$30,000,000. The long-term borrowing carriesborrowings carry a fixed interest rate on outstanding principal of 5.03%, with interest due monthly, for which the principal is due on September 22, 2008. There were no borrowings outstandingas follows at December 31, 2005.31: 63
| Funded | Rate | Principal Outstanding | Maturity | | 9/25/2008 | 3.68% | 5,000,000 | 9/25/2009 | | 9/19/2008 | 2.99% | 5,000,000 | 3/19/2009 | | 9/18/2008 | 3.16% | 5,000,000 | 9/18/2009 | | 9/8/2008 | 3.25% | 5,000,000 | 9/08/2010 | | 7/18/2008 | 3.14% | 5,000,000 | 7/20/2009 | | 3/1/2007 | 4.92% | 5,000,000 | 3/2/2009 |
NOTE H—EMPLOYEE BENEFIT PLANS The Company has a 401(k) Employee Savings Plan (the Plan) in which the Company matches a portion of the employee’semployee's contribution each payday. All employees are eligible for participation following three months of employment. Bancorp contributions are 100% vested at all times. The Company made contributions totaling $136,733 in 2008, $147,994 in 2007 and $148,691 in 2006, $131,549 in 2005 and $109,628 in 2004.2006.
The Company purchased single premium life insurance policies in connection with the implementation of retirement plans for four key officers and for the Board of Directors. The policies provide protection against the adverse financial effects from the death of a key officer and provide income to offset expenses associated with the plans. The officers are insured under the policies, but the Company is the owner and beneficiary. At December 31, 20062008 and 2005,2007, the cash surrender value of these policies totaled $9,587,306$10,777,482 and $9,239,439,$20,354,153 respectively.
The retirement plans are unfunded and provide for the Company to pay the officers and directors specified amounts for specified periods after retirement and allow them to defer a portion of current compensation in exchange for the Company’sCompany's commitment to pay a deferred benefit at retirement. If death occurs prior to or during retirement, the Company will pay the officer’sofficer's beneficiary or estate the benefits set forth in the plans. Deferred compensation is vested as to the amounts deferred. Liabilities are recorded for the estimated present value of future salary continuation benefits and for the amounts deferred by the officers and directors. At December 31, 20062008 and 2005,2007, the liability recorded for the executive officer supplemental retirement plan totaled $2,123,778$3,383,708 and $1,701,811,$2,665,602 respectively. The amount of pension expense related to this plan for 20062008 and 20052007 was $421,967$745,698 and $207,271,$541,824, respectively. At December 31, 20062008 and 2005,2007, the liability recorded for the director supplemental retirement plan totaled $573,647$457,513 and $476,001,$444,580, respectively. The amount of pension expense related to this plan for 20062008 and 20052007 was $97,646$17,931 and $79,305,($129,067), respectively. At December 31, 20062008 and 2005,2007, the liability recorded for the deferred compensation planplans totaled $1,448,181$1,750,326 and $1,285,194,$1,583,308, respectively. The amount of expense related to this planthese plans for 20062008 and 20052007 was $96,677$120,826 and $86,103,$109,768, respectively. The following are the components of the accumulated benefit obligation related to the executive officer and director supplemental retirement plans as of December 31: | | | | | | | | | | | | | | | | | | | | | Directors | | | Officers | | | | | 2006 | | | 2005 | | | 2006 | | | 2005 | | | Projected benefit obligation | | $ | 524,469 | | | $ | 567,281 | | | $ | 2,311,592 | | | $ | 1,630,908 | | | Accrued prior service costs | | | 49,178 | | | | (91,280 | ) | | | (187,814 | ) | | | 70,903 | | | | | | | | | | | | | | | | | | | | | | | | | | | | | | | | | | | Benefit obligation included in other liabilities | | $ | 573,647 | | | $ | 476,001 | | | $ | 2,123,778 | | | $ | 1,701,811 | | | | | | | | | | | | | | | |
| | | Directors | | | | Officers | | | | | 2008 | | | 2007 | | | | 2008 | | | 2007 | | | | | | | | | | | | | | | | | | Projected benefit obligation | | $ | 441,099 | | | $ | 411,282 | | | | $ | 3,412,343 | | | $ | 2,933,784 | | | Accrued prior service costs | | | 16,408 | | | | 33,298 | | | | | ( (28,635 | ) | | | (268,182 | ) | Benefit obligation included in other liabilities | | $ | 457,513 | | | $ | 444,580 | | | | $ | 3,383,708 | | | $ | 2,665,602 | |
The weighted-average discount rate used in determining the actuarial present value of the projected benefit obligation was 6.75% for both 20062008 and 2005.2007. Inflationary increases of 4.5%4% for 2008 and 4% for 2007 were assumed. The Directors projected benefit calculation includes a 2% cost of living adjustment. The entire accumulated benefit obligation was not fully vested at December 31, 20062008 and 2005.2007. Full vesting for the Officers does not occur until the participant has been in the plan for 15 years. The Directors only receive the benefit if they are on the Board upon reaching age 70. The measurement dates for the benefit obligation are December 31, 2008 and 2007. 64
NOTE H—EMPLOYEE BENEFIT PLANS (Continued)
SFAS No. 158 applies to this Plan and requires unamortized prior service costs be recognized as a component of other comprehensive income. The Plan has a net after tax unrecognized prior service cost of $81,587 that is$7,191 at December 31, 2008 and $138,229 at December 31, 2007. The amounts are not deemed to be material and isare not included in other comprehensive income.
The following is a reconciliation of the beginning and ending balances of the benefit obligation for the years ended December 31: | | | | | | | | | | | | | | | | | | | | | | | | | | | | | Directors | | | Officers | | | | | 2006 | | | 2005 | | | 2004 | | | 2006 | | | 2005 | | | 2004 | | | Benefit obligation at beginning of year | | $ | 476,001 | | | $ | 396,696 | | | $ | 293,653 | | | $ | 1,701,811 | | | $ | 1,494,540 | | | $ | 1,439,970 | | | Net periodic pension cost: | | | | | | | | | | | | | | | | | | | | | | | | | | Service cost | | | 110,027 | | | | 30,469 | | | | 39,201 | | | | 195,710 | | | | 134,943 | | | | 35,454 | | | Interest cost on projected benefit Obligation | | | 26,275 | | | | 35,679 | | | | 36,975 | | | | 159,440 | | | | 90,054 | | | | 10,630 | | | Amortization of prior service costs | | | (38,656 | ) | | | 7,990 | | | | 36,201 | | | | 66,817 | | | | (17,726 | ) | | | 8,486 | | | Amendments | | | | | | | 5,167 | | | | (9,334 | ) | | | | | | | | | | | | | | | | | | | | | | | | | | | | | | | | | | Net periodic pension cost recognized | | | 97,646 | | | | 79,305 | | | | 103,043 | | | | 421,967 | | | | 207,271 | | | | 54,570 | | | | | | | | | | | | | | | | | | | | | | | | | | | | | | | | | | | | | | | | | | | | | | | | | Benefit obligation at end of year | | $ | 573,647 | | | $ | 476,001 | | | $ | 396,696 | | | $ | 2,123,778 | | | $ | 1,701,811 | | | $ | 1,494,540 | | | | | | | | | | | | | | | | | | | | | |
| | Directors | | | Officers | | | | 2008 | | | 2007 | | | 2006 | | | 2008 | | | 2007 | | | 2006 | | | | | | | | | | | | | | | | | | | | | | Benefit obligation at beginning of year | $ | 444,580 | | | $ | 573,647 | | | $ | 476,001 | | | $ | 2,665,602 | | | $ | 2,123,778 | | | $ | 1,701,811 | | | Net periodic pension cost: | | | | | | | | | | | | | | | | | | | | | | | | Service cost | | 45,443 | | | | 54,277 | | | | 110,027 | | | | 124,840 | | | | 218,799 | | | | 195,710 | | Interest cost on projected benefit obligation | | 26,920 | | | | 23,987 | | | | 26,275 | | | | 221,134 | | | | 190,652 | | | | 159,440 | | Amortization of prior service costs | | (13,258 | ) | | | (51,638 | ) | | | (38,656 | ) | | | 399,724 | | | | 132,373 | | | | 66,817 | | | Terminations | | (41,172 | ) | | | (155,693 | ) | | | | | | | | | | | | | | | | | | Benefits Paid | | (5,000 | ) | | | | | | | | | | | (27,592 | ) | | | | | | | | | | Benefit obligation at end of year | $ | 457,513 | | | $ | 444,580 | | | $ | 573,647 | | | $ | 3,383,708 | | | $ | 2,665,602 | | | $ | 2,123,778 | |
The following benefit payments, which reflect expected future service, as appropriate, are expected to be paid: | | | | | | | | | | | | | Directors | | Officers | | 2007 | | $ | 7,917 | | | | | | | 2008 | | | 9,658 | | | $ | 27,592 | | | 2009 | | | 9,852 | | | | 27,592 | | | 2010 | | | 12,882 | | | | 223,183 | | | 2011 | | | 25,515 | | | | 344,939 | | | 2012 to 2016 | | | 288,049 | | | | 1,724,695 | |
65
| | | Directors | | | | Officers | | | | | | | | | | | 2009 | | $ | 10,200 | | | | $ | 225,109 | | 2010 | | | 13,237 | | | | | 225,109 | | 2011 | | | 25,990 | | | | | 352,386 | | 2012 | | | 37,397 | | | | | 352,386 | | | 2013 | | | 52,058 | | | | | 352,386 | | 2014 to 2018 | | | 343,408 | | | | | 1,761,930 | |
NOTE I—NON-INTEREST INCOME AND OTHER NON-INTEREST EXPENSE
Non-interest income is comprised of the following for the years ended December 31: | | | | | | | | | | | | | | | | | 2006 | | | 2005 | | | 2004 | | | Service charges on deposit accounts | | $ | 1,352,251 | | | $ | 1,258,728 | | | $ | 1,089,315 | | | Other fee income | | | 380,070 | | | | 364,157 | | | | 305,847 | | | Life insurance earnings | | | 347,867 | | | | 326,303 | | | | 297,536 | | | Investment securities gains | | | | | | | 5,094 | | | | | | | Other | | | 13,550 | | | | 14,112 | | | | 17,073 | | | | | | | | | | | | | | | | | | | | | | | | | | | | | | $ | 2,093,738 | | | $ | 1,968,394 | | | $ | 1,709,771 | | | | | | | | | | | | |
| | | 2008 | | | | 2007 | | | | 2006 | | | | | | | | | | | | | | | | Service charges on deposit accounts | | $ | 1,332,787 | | | | $ | 1,410,637 | | | | $ | 1,352,251 | | | Other fee income | | | 350,304 | | | | | 426,220 | | | | | 380,070 | | | Life insurance earnings | | | 423,329 | | | | | 416,847 | | | | | 347,867 | | | Other | | | 24,762 | | | | | 25,106 | | | | | 13,550 | | | | | $ | 2,131,182 | | | | $ | 2,278,810 | | | | $ | 2,093,738 | |
Other non-interest expense is comprised of the following for the years ended December 31: | | | | | | | | | | | | | | | | | 2006 | | | 2005 | | | 2004 | | | Professional and consulting fees | | $ | 702,221 | | | $ | 952,681 | | | $ | 750,846 | | | Data processing | | | 501,873 | | | | 478,991 | | | | 462,709 | | | Stationary and supplies | | | 128,088 | | | | 122,578 | | | | 168,496 | | | Staff related | | | 164,335 | | | | 173,777 | | | | 167,026 | | | Advertising and business development | | | 308,612 | | | | 245,063 | | | | 201,409 | | | Postage and telephone | | | 120,096 | | | | 111,429 | | | | 112,276 | | | Assessments and insurance | | | 142,378 | | | | 150,049 | | | | 152,172 | | | Other | | | 282,036 | | | | 204,318 | | | | 185,170 | | | | | | | | | | | | | | | | | | | | | | | | | | | | | | $ | 2,349,639 | | | $ | 2,438,886 | | | $ | 2,200,104 | | | | | | | | | | | | |
66
| | | 2008 | | | | 2007 | | | | 2006 | | | | | | | | | | | | | | | | Professional and consulting fees | | $ | 1,115,868 | | | | $ | 1,018,088 | | | | $ | 702,221 | | | Data processing | | | 517,793 | | | | | 546,924 | | | | | 501,873 | | | Stationary and supplies | | | 173,696 | | | | | 132,410 | | | | | 160,468 | | | Staff related | | | 185,857 | | | | | 155,430 | | | | | 164,271 | | | Advertising and business development | | | 339,614 | | | | | 286,074 | | | | | 276,232 | | | Postage and telephone | | | 141,359 | | | | | 133,808 | | | | | 120,096 | | | Assessments and insurance | | | 264,200 | | | | | 133,154 | | | | | 142,378 | | | Other | | | 337,905 | | | | | 229,957 | | | | | 282,100 | | | | | $ | 3,076,292 | | | | $ | 2,635,845 | | | | $ | 2,349,639 | |
NOTE J—INCOME TAXES
The provision for income taxes is comprised of the following: | | | | | | | | | | | | | | | | | 2006 | | | 2005 | | | 2004 | | | Current | | | | | | | | | | | | | | Federal | | $ | 2,077,673 | | | $ | 1,648,074 | | | $ | 929,028 | | | State | | | 755,982 | | | | 605,003 | | | | 448,161 | | | | | | | | | | | | | | | | | 2,833,655 | | | | 2,253,077 | | | | 1,377,189 | | | Deferred | | | | | | | | | | | | | | Federal | | | (507,264 | ) | | | (441,020 | ) | | | 67,446 | | | State | | | (108,624 | ) | | | (100,901 | ) | | | 6,818 | | | | | | | | | | | | | | | | | (615,888 | ) | | | (541,921 | ) | | | 74,264 | | | | | | | | | | | | | | | | | | | | | | | | | | | | Provision for income taxes | | $ | 2,217,767 | | | $ | 1,711,156 | | | $ | 1,451,473 | | | | | | | | | | | | |
| | | 2008 | | | | 2007 | | | | 2006 | | | Current | | | | | | | | | | | | Federal | | $ | 1,685,119 | | | | $ | 2,062,700 | | | | $ | 2,077,673 | | State | | | 731,718 | | | | | 782,799 | | | | | 755,982 | | | | | | 2,416,837 | | | | | 2,845,499 | | | | | 2,833,655 | | | Deferred | | | | | | | | | | | | | | | Federal | | | (627,459 | ) | | | | (331,115 | ) | | | | (507,264 | ) | State | | | (224,200 | ) | | | | (74,222 | ) | | | | (108,624 | ) | | | | | (851,658 | ) | | | | (405,337 | ) | | | | (615,888 | ) | Provision for income taxes | | $ | 1,565,178 | | | | $ | 2,440,162 | | | | $ | 2,217,767 | |
The following is a reconciliation of income taxes computed at the Federal statutory income tax rate of 34% to the effective income tax rate used for the provision for income taxes: | | | | | | | | | | | | | | | | | 2006 | | | 2005 | | | 2004 | | | Income tax at Federal statutory rate | | $ | 2,111,239 | | | $ | 1,720,293 | | | $ | 1,482,092 | | | State franchise tax, less Federal income tax benefit | | | 444,254 | | | | 361,990 | | | | 311,867 | | | Interest on municipal obligations exempt from Federal tax | | | (229,226 | ) | | | (247,467 | ) | | | (269,872 | ) | | Life insurance earnings | | | (143,163 | ) | | | (134,288 | ) | | | (122,449 | ) | | Incentive stock option expense | | | 41,247 | | | | 42,669 | | | | 42,669 | | | Meals and entertainment | | | 6,888 | | | | 5,452 | | | | 7,050 | | | Other differences | | | (13,472 | ) | | | (37,493 | ) | | | 116 | | | | | | | | | | | | | | | | | | | | | | | | | | | | Provision for income taxes | | $ | 2,217,767 | | | $ | 1,711,156 | | | $ | 1,451,473 | | | | | | | | | | | | |
67
| | | 2008 | | | | 2007 | | | | 2006 | | | | | | | | | | | | | | | | Income tax at Federal statutory rate | | $ | 1,659,383 | | | | $ | 2,306,458 | | | | $ | 2,111,239 | | State franchise tax, less Federal income tax benefit | | | 349,173 | | | | | 485,333 | | | | | 444,254 | | Interest on municipal obligations exempt from Federal tax | | | (201,082 | ) | | | | (235,525 | ) | | | | (229,226 | ) | | Life insurance earnings | | | (174,219 | ) | | | | (171,551 | ) | | | | (143,163 | ) | | Incentive stock option expense | | | (15,630 | ) | | | | 57,616 | | | | | 41,247 | | | Meals and entertainment | | | 8,053 | | | | | 6,654 | | | | | 6,888 | | | Tax credits | | | (60,509 | ) | | | | (7,922 | ) | | | | | | | Other differences | | | 9 | | | | | (901 | ) | | | | (13,472 | ) | Provision for income taxes | | $ | 1,565,178 | | | | $ | 2,440,162 | | | | $ | 2,217,767 | |
NOTE J—INCOME TAXES (Continued)
The tax effects of temporary differences that give rise to the components of the net deferred tax asset recorded as an other asset as of December 31 were as follows: | | | | | | | | | | | | | | | | | 2006 | | | 2005 | | | 2004 | | | Deferred tax assets: | | | | | | | | | | | | | | Nonqualified benefit plans | | $ | 1,706,099 | | | $ | 1,427,237 | | | $ | 1,244,196 | | | Allowance for loan losses | | | 1,153,381 | | | | 979,526 | | | | 840,827 | | | Unrealized securities holding losses | | | 108,295 | | | | 217,076 | | | | 100,407 | | | Accrued liabilities | | | 240,490 | | | | 210,374 | | | | 111,035 | | | State franchise taxes | | | 215,884 | | | | 201,710 | | | | 96,810 | | | Restricted stock | | | 63,956 | | | | | | | | | | | Other | | | 102,850 | | | | 60,983 | | | | 21,038 | | | | | | | | | | | | | | Total deferred tax assets | | | 3,590,955 | | | | 3,096,906 | | | | 2,414,313 | | | | | | | | | | | | | | | | | Deferred tax liabilities: | | | | | | | | | | | | | | Depreciation | | | 120,217 | | | | 153,976 | | | | 143,513 | | | Other | | | 83,510 | | | | 62,809 | | | | 49,269 | | | | | | | | | | | | | | Total deferred tax liabilities | | | 203,727 | | | | 216,785 | | | | 192,782 | | | | | | | | | | | | | | | | | | | | | | | | | | | | Net deferred tax assets | | $ | 3,387,228 | | | $ | 2,880,121 | | | $ | 2,221,531 | | | | | | | | | | | | |
| | | 2008 | | | | 2007 | | | | 2006 | | | Deferred tax assets: | | | | | | | | | | | | | Nonqualified benefit plans | | $ | 2,301,167 | | | | $ | 1,931,578 | | | | $ | 1,706,099 | | Allowance for loan losses | | | 1,773,938 | | | | | 1,305,486 | | | | | 1,153,381 | | Unrealized securities holding losses | | | - | | | | | 24,477 | | | | | 108,295 | | Accrued liabilities | | | 291,632 | | | | | 290,976 | | | | | 240,490 | | State franchise taxes | | | 235,884 | | | | | 228,912 | | | | | 215,884 | | | Nonaccrual interest | | | 79,495 | | | | | 47,881 | | | | | 87,081 | | | Restricted stock | | | 49,343 | | | | | 50,499 | | | | | 63,956 | | | Nonqualified stock options | | | 31,434 | | | | | 11,327 | | | | | - | | Other | | | 35,526 | | | | | 15,770 | | | | | 15,769 | | | Total deferred tax assets | | | 4,798,419 | | | | | 3,906,906 | | | | | 3,590,955 | | | | | | | | | | | | | | | | | | | Deferred tax liabilities: | | | | | | | | | | | | | | | | Federal Home Loan Bank dividends | | | 116,291 | | | | | 111,947 | | | | | 83,510 | | Depreciation | | | 70,018 | | | | | 85,556 | | | | | 120,217 | | | Prepaid Expense | | | 76,181 | | | | | - | | | | | - | | | Unrealized securities holding gains | | | 11,518 | | | | | - | | | | | - | | Other | | | - | | | | | 655 | | | | | - | | | Total deferred tax liabilities | | | 274,008 | | | | | 198,158 | | | | | 203,727 | | | Net deferred tax assets | | $ | 4,524,411 | | | | $ | 3,708,748 | | | | $ | 3,387,228 | |
The amounts presented for the tax effects of temporary differences are based upon estimates and assumptions and could vary from amounts ultimately reflected on the Company’sCompany's tax returns. Accordingly, the variances from amounts reported for prior years are primarily the result of adjustments to conform to the tax returns as filed.
Income tax receivablepayable was $66,784 and $230,351$159,851 at December 31, 20062008. Income tax payable was $99,212 at December 31, 2007.
The Company or one of its subsidiaries files income tax returns in the U.S. Federal jurisdiction and the state of California jurisdiction. The Company is no longer subject to U.S. federal income tax examinations and California Franchise tax examinations by tax authorities for years before 2005 and 2004, respectively. 68
The Company adopted the provisions of FASB Interpretation No. 48, Accounting for Uncertainty in Income Taxes, on January 1, 2007. No adjustments were identified for unrecognized tax benefits which would require an adjustment to the January 1, 2007 beginning balance of retained earnings. There were also no adjustments identified for unrecognized tax benefits which would require an adjustment to the income statement for the years ended December 31, 2008 or 2007. During the years ended December 31, 2008 and 2007, the Company recognized no interest and penalties. NOTE K—EARNINGS PER SHARE
The following is the computation of basic and diluted earnings per share for the years ended December 31: | | | | | | | | | | | | | | | | | 2006 | | | 2005 | | | 2004 | | | Basic: | | | | | | | | | | | | | | | | | | | | | | | | | | | | Net income | | $ | 3,991,759 | | | $ | 3,348,529 | | | $ | 2,907,621 | | | | | | | | | | | | | | | | | | | | | | | | | | | | Weighted-average common shares outstanding | | | 2,247,231 | | | | 2,170,866 | | | | 2,148,558 | | | | | | | | | | | | | | | | | | | | | | | | | | | | Earnings per share | | $ | 1.78 | | | $ | 1.54 | | | $ | 1.35 | | | | | | | | | | | | | | | | | | | | | | | | | | | | Diluted: | | | | | | | | | | | | | | | | | | | | | | | | | | | | Net income | | $ | 3,991,759 | | | $ | 3,348,529 | | | $ | 2,907,621 | | | | | | | | | | | | | | | | | | | | | | | | | | | | Weighted-average common shares outstanding | | | 2,247,231 | | | | 2,170,866 | | | | 2,148,558 | | | Net effect of dilutive share-based awards – based on the treasury stock method using average market price | | | 121,987 | | | | 132,773 | | | | 179,825 | | | | | | | | | | | | | | Weighted-average common shares outstanding and common stock equivalents | | | 2,369,218 | | | | 2,303,639 | | | | 2,328,383 | | | | | | | | | | | | | | | | | | | | | | | | | | | | Earnings per share — assuming dilution | | $ | 1.68 | | | $ | 1.45 | | | $ | 1.25 | | | | | | | | | | | | |
| | | 2008 | | | | 2007 | | | | 2006 | | | Basic: | | | | | | | | | | | | Net income | | $ | 3,315,361 | | | | $ | 4,343,538 | | | | $ | 3,991,759 | | Weighted-average common shares outstanding | | | 2,263,045 | | | | | 2,241,104 | | | | | 2,247,231 | | Earnings per share | | $ | 1.46 | | | | $ | 1.94 | | | | $ | 1.78 | | | | | | | | | | | | | | | | | | | Diluted: | | | | | | | | | | | | | | | Net income | | $ | 3,315,361 | | | | $ | 4,343,538 | | | | $ | 3,991,759 | | Weighted-average common shares outstanding | | | 2,263,045 | | | | | 2,241,104 | | | | | 2,247,231 | | Net effect of dilutive share-based awards – based on the treasury stock method using average market price | | | 29,686 | | | | | 72,484 | | | | | 121,987 | | Weighted-average common shares outstanding and common stock equivalents | | | 2,292,731 | | | | | 2,313,588 | | | | | 2,369,218 | | Earnings per share - assuming dilution | | $ | 1.45 | | | | $ | 1.88 | | | | $ | 1.68 | | | | | | | | | | | | | | | | | |
Nonvested restricted shares are included in the computation of diluted earnings per share using the treasury stock method. Vested restricted shares are outstanding for both basic and diluted earnings per share. In addition, options to purchase 37,410 common shares at $23.50 to $28.54 and 16,600 shares of restricted stock were outstanding during 2008 but were excluded from the computation of diluted earnings per share because the exercise price or issuance price was greater than the average market price of the common shares.
NOTE L—EQUITY INCENTIVE PLANPLANS The Company has a stock option plan (the 1996 Plan), effective March 31, 1996 and terminated on May 14, 2002 under which incentive and nonstatutory stock options, as defined under the Internal Revenue Code, were granted. The 1996 Plan was administered by a Committee appointed by the Board. No additional options are available for granting under this plan; however, there are unexercised options currently outstanding under this plan. The options granted under this plan have an exercise period of 10 years, a portion of which were subject to a graded vesting schedule of 20% per year. The Company approved an equity incentive plan (the 2002 Plan), effective May 14, 2002 and terminating May 14, 2012, under which stock options, restricted stock, stock appreciation rights and stock bonuses may be granted. The 2002 Plan is administered by a Committee appointed by the Board. Options representing 123,555 shares of the Company’s authorized and unissued common stock may be granted under the Plan by the Committee to directors and employees of the Company at a price to be determined by the Committee but shall not be less than 100% of the fair market value of the shares on the date the incentive stock option is granted. NOTE L—EQUITY INCENTIVE PLANS (Continued) The options generally vest based on 5 years of continuous service and have 10-year contractual terms. No options were granted in 2005 and 2006. There were 10,000 options granted in June 2007 and 7,410 options granted in December 2007. There were 10,000 options granted in January 2008. The Company has 2,195 options available to grant under this plan at December 31, 2008.
The Company approved an equity incentive plan (the 2007 Plan), effective February 21, 2007 and terminating February 20, 2017, under which stock options, restricted stock, stock appreciation rights and stock bonuses may be granted. The 2007 Plan is administered by a Committee appointed by the Board. Options representing 231,963 shares of the Company’s authorized and unissued common stock may be granted under the Plan by the Committee to directors and employees of the Company at a price to be determined by the Committee but shall not be less than 100% of the fair market value of the shares on the date the incentive stock option is granted. The options generally vest based on 5 years of continuous service and have 10-year contractual terms. There were 10,000 options granted in April 2008. The numberCompany has 221,963 options available to grant under this plan at December 31, 2008.
The fair value of options granted is estimated on the date of grant using the Black-Scholes option pricing model with the following assumptions used: | | | January 2008 | | April 2008 | | Expected Life in Years | | | 7.00 | | | | 7.00 | | | Risk Free Interest Rate | | | 3.32 | % | | | 3.21 | % | | Expected Stock Price Volatility | | | 35.00 | % | | | 35.70 | % | | Expected Cash Dividend Yield | | | 2.80 | % | | | 2.33 | % | | Expected Annual Forfeiture Rate | | | 0.00 | % | | | 0.00 | % |
The Company uses historical data to estimate expected cash dividend yield, expected life in January 2004 was 67,500. Noyears, expected stock price volatility and expected annual forfeiture rate within the valuation model. Expected volatilities are based on the historical volatility of the Company’s stock. The expected life of options wererepresents the period of time that options granted are expected to be outstanding. The risk-free rate for periods within the contractual life of the option is based on the U.S. Treasury yield curve in 2005 and 2006.effect at the time of grant. 69
NOTE L—EQUITY INCENTIVE PLAN (Continued)
The Company also granted a stock bonus under the 2002 plan in July of 2006, consisting of 29,000 shares of restricted stock, with a fair value at grant date of $26.25. The employees have dividend and voting rights at the time of grant, regardless of whether they are vested in these shares. This restricted stock vests over three to five years. The fair value of options granted is estimated on the date of grant using the Black-Scholes option pricing model with the following assumptions used for grants in 2004: dividend yield of zero; a range of expected volatility of 1 percent to 28 percent; weighted average expected volatility of 11.94 percent; risk-free interest rate of 4.39 percent and expected life of 10 years. Expected volatilities are based on historical volatility of the Company’s stock. The Company uses historical data to estimate option exercise and employee termination within the valuation model. The expected term of options granted is derived from the output of the option valuation model and represents the period of time that options granted are expected to be outstanding. The risk-free rate for periods within the contractual life of the option is based on the U.S. Treasury yield curve in effect at the time of grant.NOTE L—EQUITY INCENTIVE PLANS (Continued)
A summary of stock option activity adjusted to give effect to stock dividends and stock splits follows for the years ended December 31: | | | | | | | | | | | | | | | | | | | | | | | | | | | | | Incentive Stock Options | | | | 2006 | | 2005 | | 2004 | | | | Weighted- | | | | | | Weighted- | | | | | | Weighted- | | | | | | Average | | | | | | Average | | | | | | Average | | | | | | Exercise Price | | Shares | | Exercise Price | | Shares | | Exercise Price | | Shares | | Shares under option at beginning of year | | $ | 14.64 | | | | 133,085 | | | $ | 12.94 | | | | 179,730 | | | $ | 8.27 | | | | 147,269 | | | | | | | | | | | | | | | | | | | | | | | | | | | | | Options granted | | | | | | | | | | | | | | | | | | | 20.71 | | | | 67,500 | | | | | | | | | | | | | | | | | | | | | | | | | | | | | Options exercised | | | 8.90 | | | | (39,264 | ) | | | 7.70 | | | | (45,295 | ) | | | 8.29 | | | | (35,039 | ) | | | | | | | | | | | | | | | | | | | | | | | | | | | | Options forfeited or expired | | | 20.71 | | | | (1,200 | ) | | | 20.71 | | | | (1,350 | ) | | | | | | | | | | | | | | | | | | | | | | | | | | | | | | | | | | | | | | | | | | | | | | | | | | | | | | | | | | | | | | Shares under option at end of year | | | 17.00 | | | | 92,621 | | | | 14.64 | | | | 133,085 | | | | 12.94 | | | | 179,730 | | | | | | | | | | | | | | | | | | | | | | | | | | | | | | | | | | | | | | | | | | | | | | | | | | | | | | | Options exercisable at end of year | | | 15.63 | | | | 67,721 | | | | 12.11 | | | | 93,935 | | | | 9.60 | | | | 125,730 | | | | | | | | | | | | | | | | | | | | | | | | | | | | | Weighted-average fair value of options granted during the year | | | | | | | | | | | | | | | | | | | 7.68 | | | | | |
70
| | | Incentive Stock Options | | | | | | 2008 | | | | 2007 | | | | 2006 | | | | | Weighted-Average | | | | | | | | | | | | Weighted-Average | | | | | | | | Exercise | | | | | | Exercise | | | | | | Exercise | | | | | | | Price | | | Shares | | | Price | | | Shares | | | Price | | | Shares | | | Shares under option at beginning of year | | $ | 17.40 | | | | 78,773 | | $ | 17.00 | | | 92,621 | | $ | 14.64 | | | 133,085 | | | Options granted | | | 23.50 | | | | 10,000 | | | | | | | | | | | | | | | Options exercised | | | 14.75 | | | | (25,874 | ) | | 14.69 | | | (13,848 | ) | | 8.90 | | | (39,264 | ) | | Options forfeited or expired | | | 0.00 | | | | 0 | | | 0.00 | | | | 0 | | | | 20.71 | | | (1,200 | ) | | Shares under option at end of year | | | 19.46 | | | | 62,899 | | | 17.40 | | | | 78,773 | | | | 17.00 | | | 92,621 | | | Options exercisable at end of year | | | 18.70 | | | | 52,899 | | | 16.78 | | | | 66,323 | | | | 15.63 | | | 67,721 | | | Weighted-average fair value of options granted during the year | | | 7.12 | | | | | | | | | | | | | | | | | | | | | | | | | | | | | | | | | | | | | | | | | | | |
| | | Nonstatutory Stock Options | | | | | | 2008 | | | | 2007 | | | | 2006 | | | | | Weighted-Average | | | | | | | | | | | | Weighted-Average | | | | | | | | Exercise | | | | | | Exercise | | | | | | Exercise | | | | | | | Price | | | Shares | | | Price | | | Shares | | | Price | | | Shares | | | Shares under option at beginning of year | | $ | 11.85 | | | | 91,532 | | $ | 8.12 | | | 120,438 | | $ | 8.07 | | | 185,300 | | | Options granted | | | 25.70 | | | | 10,000 | | | 27.48 | | | 17,410 | | | | | | | | | Options exercised | | | 8.67 | | | | (23,162 | ) | | 8.06 | | | | (46,316 | ) | | | 7.95 | | | (64,862 | ) | | Shares under option at end of year | | | 14.56 | | | | 78,370 | | | 11.85 | | | | 91,532 | | | | 8.12 | | | 120,438 | | | Options exercisable at end of year | | | 10.21 | | | | 57,900 | | | 8.75 | | | | 76,592 | | | | 8.12 | | | 120,438 | | | Weighted-average fair value of options granted during the year | | | 8.36 | | | | | | | 8.68 | | | | | | | |
NOTE L—EQUITY INCENTIVE PLANPLANS (Continued) | | | | | | | | | | | | | | | | | | | | | | | | | | | | | Nonstatutory Stock Options | | | | 2006 | | 2005 | | 2004 | | | | Weighted- | | | | | | Weighted- | | | | | | Weighted- | | | | | | Average | | | | | | Average | | | | | | Average | | | | | | Exercise Price | | Shares | | Exercise Price | | Shares | | Exercise Price | | Shares | | Shares under option at Beginning of year | | $ | 8.07 | | | | 185,300 | | | $ | 8.05 | | | | 208,465 | | | $ | 8.00 | | | | 319,670 | | | | | | | | | | | | | | | | | | | | | | | | | | | | | Options exercised | | | 7.95 | | | | (64,862 | ) | | | 7.94 | | | | (23,165 | ) | | | 7.90 | | | | (111,205 | ) | | | | | | | | | | | | | | | | | | | | | | | | | | | | | | | | | | | | | | | | | | | | | | | | | | | | | | Shares under option at end of year | | | 8.12 | | | | 120,438 | | | | 8.07 | | | | 185,300 | | | | 8.05 | | | | 208,465 | | | | | | | | | | | | | | | | | | | | | | | | | | | | | | | | | | | | | | | | | | | | | | | | | | | | | | | Options exercisable at end of year | | | 8.12 | | | | 120,438 | | | | 8.07 | | | | 185,300 | | | | 8.05 | | | | 208,465 | |
Following is the intrinsic value and weighted average contractual term of stock options outstanding for the years ended December 31: | | | | | | | | | | | | | | | | | Incentive Stock Options | | | | 2006 | | 2005 | | 2004 | | Intrinsic value: | | | | | | | | | | | | | | Outstanding shares | | $ | 1,019,333 | | | $ | 899,589 | | | $ | 1,988,417 | | | Exercisable shares | | | 837,751 | | | | 872,458 | | | | 1,810,595 | | | | | | | | | | | | | | | | | Weighted average remaining contractual term: | | | | | | | | | | | | | | Outstanding shares | | 6.15 years | | 6.58 years | | 7.08 years | | Exercisable shares | | 5.71 years | | 5.54 years | | 5.23 years |
| | | | | | | | | | | | | | | | | Nonstatutory Stock Options | | | | 2006 | | 2005 | | 2004 | | Intrinsic value: | | | | | | | | | | | | | | Outstanding shares | | $ | 2,392,987 | | | $ | 2,470,660 | | | $ | 3,324,461 | | | Exercisable shares | | | 2,392,987 | | | | 2,470,660 | | | | 3,324,461 | | | | | | | | | | | | | | | | | Weighted average remaining contractual term: | | | | | | | | | | | | | | Outstanding shares | | 2.02 years | | 3.11 years | | 4.13 years | | Exercisable shares | | 2.02 years | | 3.11 years | | 4.13 years |
| | | Incentive Stock Options | | | | | 2008 | | | 2007 | | | 2006 | | | Intrinsic value: | | | | | | | | | | | Outstanding shares | | $ | (400,014 | ) | | $ | 610,396 | | | $ | 1,019,333 | | | Exercisable shares | | | (296,014 | ) | | | 555,081 | | | | 837,751 | | | | | | | | | | | | | | | | | Weighted average | | | | | | | | | | | | | | remaining contractual term: | | | | | | | | | | | | | | Outstanding shares | | 5.56 years | | | 5.21 years | | | 6.15 years | | | Exercisable shares | | 4.73 years | | | 5.01 years | | | 5.71 years | |
| | | Nonstatutory Stock Options | | | | | 2008 | | | 2007 | | | 2006 | | | Intrinsic value: | | | | | | | | | | | Outstanding shares | | $ | (114,155 | ) | | $ | 1,217,399 | | | $ | 2,392,987 | | | Exercisable shares | | | 167,352 | | | | 1,255,745 | | | | 2,392,987 | | | | | | | | | | | | | | | | | Weighted average | | | | | | | | | | | | | | remaining contractual term: | | | | | | | | | | | | | | Outstanding shares | | 4.98 years | | | 4.02 years | | | 2.02 years | | | Exercisable shares | | 1.88 years | | | 1.49 years | | | 2.02 years | |
Upon the exercise of stock options, new shares are issued or shares that have been repurchased through the Company’s on-going repurchase programs are provided.issued. The total amount of cash received from the exercise of stock options during 2008, 2007 and 2006 2005was $582,557, $576,483 and 2004 was $885,729, $532,635 and $1,168,805,$864,993, respectively. The tax benefits realized for the tax deductions from stock options exercised during 2008, 2007 and 2006 2005was $158,718, $407,889 and 2004 was $438,729, $132,337 and $617,260,$459,493, respectively. 71
NOTE L—EQUITY INCENTIVE PLAN (Continued)
A summary of the status of the Company’s nonvested shares as of December 31, 2006, and changes during the yearyears ended December 31, 2006, is31are presented below: | | | | | | | | | | | | | | | | | | | | | | | | | | | | | 2006 | | 2005 | | 2004 | | | | | | | | Weighted- | | | | | | Weighted- | | | | | | Weighted- | | | | | | | | Average | | | | | | Average | | | | | | Average | | | | | | | | Grant-Date | | | | | | Grant-Date | | | | | | Grant-Date | | Nonvested Shares | | Shares | | Fair Value | | Shares | | Fair Value | | Shares | | Fair Value | | Nonvested at beginning of year | | | 39,150 | | | $ | 7.68 | | | | 54,000 | | | $ | 7.68 | | | | 4,633 | | | $ | 4.13 | | | Granted | | | | | | | | | | | | | | | | | | | 67,500 | | | | 7.68 | | | Vested | | | (13,050 | ) | | | 7.68 | | | | (13,500 | ) | | | 7.68 | | | | (18,133 | ) | | | 6.77 | | | Forfeited | | | (1,200 | ) | | | 7.68 | | | | (1,350 | ) | | | 7.68 | | | | | | | | | | | | | | | | | | | | | | | | | | | | | | | | | | | | | | | | | | | | | | | | | | | | | | | | | | | | | | | Nonvested at end of year | | | 24,900 | | | | 7.68 | | | | 39,150 | | | | 7.68 | | | | 54,000 | | | | 7.68 | | | | | | | | | | | | | | | | | | | | | | | | | | | |
| | | | | | Incentive Stock Options | | | | | | | | 2008 | | | 2007 | | | 2006 | | | | | | | | Weighted-Average | | | | | | Weighted-Average | | | | | | Weighted-Average | | | | | | | | Grant-Date | | | | | | Grant-Date | | | | | | Grant-Date | | | Nonvested Shares | | Shares | | | Fair Value | | | Shares | | | Fair Value | | | Shares | | | Fair Value | | | | | | | | | | | | | | | | | | | | | | | Nonvested at beginning of year | | | 12,450 | | | $ | 7.68 | | | | 24,900 | | | $ | 7.68 | | | | 39,150 | | | $ | 7.68 | | | Granted | | | 10,000 | | | | 7.12 | | | | | | | | | | | | | | | | | | | Vested | | | (12,450 | ) | | | 7.68 | | | | (12,450 | ) | | | 7.68 | | | | (13,050 | ) | | | 7.68 | | | Forfeited | | | | | | | | | | | | | | | | | | | (1,200 | ) | | | 7.68 | | | | | | | | | | | | | | | | | | | | | | | | | | | | | Nonvested at end of year | | | 10,000 | | | | 7.12 | | | | 12,450 | | | | 7.68 | | | | 24,900 | | | | 7.68 | |
NOTE L—EQUITY INCENTIVE PLANS (Continued)
| | | Nonstatutory Stock Options | | | | | 2008 | | | 2007 | | | | | | | | Weighted-Average | | | | | | Weighted- Average | | | | | | | | Grant-Date | | | | | | Grant-Date | | | Nonvested Shares | | Shares | | | Fair Value | | | Shares | | | Fair Value | | | | | | | | | | | | | | | | | Nonvested at beginning of year | | | 14,940 | | | $ | 9.00 | | | | 0 | | | | | | Granted | | | 10,000 | | | | 8.36 | | | | 17,410 | | | $ | 8.68 | | | Vested | | | (4,470 | ) | | | 8.26 | | | | (2,470 | ) | | | 6.79 | | | | | | | | | | | | | | | | | | | | | Nonvested at end of year | | | 20,470 | | | | 8.85 | | | | 14,940 | | | | 9.00 | |
As of December 30, 2006,2008 and 2007 there was $191,232$215,891 and $125,918, respectively, of total unrecognized compensation cost related to nonvested stock options granted under the Plan. That cost is expected to be recognized over a weighted-average period of two3.7 years. The total fair value of shares vested during the years ended December 31, 2008, 2007 and 2006, 2005was $132,553, $112,379 and 2004, was $100,224, $103,680 and $314,403, respectively.
A summary of restricted stock bonus activity follows for the yearyears ended December 31, 2006:2008 and 2007: | | | | | | | | | | | | | | | | | | | | | Weighted- | | | | | | | | | | | | Average | | | Aggregate | | | | | | | | | Grant-Date | | | Intrinsic | | | Restricted Stock | | Shares | | | Fair Value | | | Value | | | Granted | | | 29,000 | | | $ | 26.25 | | | | | | | | | | | | | | | | | | | | | | | | | | | | | | | | | | Outstanding at December 31, 2006 | | | 29,000 | | | $ | 26.25 | | | $ | 50,750 | | | | | | | | | | | | |
None of the restricted stock was exercisable as of December 31, 2006.A summary of the status of the Company’s nonvested restricted stock as of December 31, 2006, and changes during the year ended December 31, 2006, is presented below:| | | 2008 | | 2007 | | | | | | | Weighted-Average | | Aggregate | | | | | Weighted-Average | | Aggregate | | | | | | | Grant-Date | | Intrinsic | | | | | Grant-Date | | Intrinsic | | Restricted Stock | | Shares | | | Fair Value | | Value | | Shares | | | Fair Value | | Value | | | | | | | | | | | | | | | | | | Nonvested at beginning of year | | | 22,800 | | | $ | 26.25 | | | | | | | | | | | | | | | | | | | | | | | | | | | | | Granted | | | | | | | | | | | | 29,000 | | | $ | 26.25 | | | | | | | | | | | | | | | | | | | | | | | | Shares Vested and Issued | | | (6,200 | ) | | $ | 26.25 | | | | | (6,200 | ) | | $ | 26.25 | | | | | | | | | | | | | | | | | | | | | | | | Nonvested at end of year | | | 16,600 | | | $ | 26.25 | | $217,460 | | | 22,800 | | | $ | 26.25 | | $573,420 |
| | | | | | | | | | | | | | | | | Weighted- | | | | | | | | | Average | | | | | | | | | Grant-Date | | | Nonvested Shares | | Shares | | | Fair Value | | | Nonvested at January 1, 2006 | | | | | | | | | | Granted | | | 29,000 | | | $ | 26.25 | | | | | | | | | | | | | | | | | | | | | Nonvested at December 31, 2006 | | | 29,000 | | | $ | 26.25 | | | | | | | | | |
72
NOTE L—EQUITY INCENTIVE PLAN (Continued)
As of December 31, 2006,2008 and 2007, there was $679,875$354,375 and $517,125 of total unrecognized compensation cost related to nonvested restricted stock. That cost is expected to be recognized over a weighted-average period of 4.5 years.2.5 years and 3.5 years, respectively.
Total compensation cost for all share-based payments recognized in net income for 2008, 2007 and 2006 2005totaled $133,916, $223,172 and 2004 totaled $106,871, $61,011 and $61,011, respectively, which is net of the related tax benefits for 2008, 2007 and 2006 2005of $93,639, $156,050 and 2004 of $74,728, $42,669 and $42,669, respectively.
The Company has entered into transactions with its directors, executive officers and their affiliates (related parties). Such transactions were made in the ordinary course of business on substantially the same terms and conditions, including interest rates and collateral, as those prevailing at the same time for comparable transactions with other customers, and did not, in the opinion of management, involve more than normal credit risk or present other unfavorable features. The following is a summary of the aggregate activity involving related party borrowers at December 31, 20062008 and 2005:2007:
| | | | | | | | | | | | | 2006 | | | 2005 | | | Loans outstanding at beginning of year | | $ | 2,657,000 | | | $ | 3,474,000 | | | Loans disbursements | | | 415,000 | | | | 1,730,000 | | | Loan repayments | | | (415,000 | ) | | | (2,547,000 | ) | | | | | | | | | | | | | | | | | | | | Loans outstanding at end of year | | $ | 2,657,000 | | | $ | 2,657,000 | | | | | | | | | |
| | | 2008 | | | 2007 | | | | | | | | | | | Loans outstanding at beginning of year | | $ | 2,461,000 | | | $ | 2,657,000 | | | Loans disbursements | | | 821,000 | | | | 703,000 | | | Loan repayments | | | (1,839,000 | ) | | | (899,000 | ) | | | | | | | | | | | | Loans outstanding at end of year | | $ | 1,443,000 | | | $ | 2,461,000 | |
At December 31, 2006,2008, commitments to related parties of approximately $2,031,000$1,412,000 were undisbursed. Deposits received from directors and officers totaled $3,567,000$4,094,000 and $8,351,000$4,621,000 at December 31, 20062008 and 2005,2007, respectively.
The Company leases its Glen Ellen office from a director of the Company under a noncancellable operating lease. Lease expense for the years ended December 31, 20062008 and 20052007 was $14,705$15,560 and $14,140,$15,294, respectively. The remaining lease commitment is approximately $19,154 through$72,794 expiring March 2008 including a minimum inflationary increase of 4% per year.2013. When the current term expires the Company has the option to extend the lease for one additional 5 year term. The monthly lease payments will be increasedexpense increases annually based upon the Consumer Price Index, but not less than 4% annually. The term of the lease is 5 years with an option to extend the lease term for two additional 5 year terms at the same Consumer Price Index limitations. 73
NOTE N—COMMITMENTS AND CONTINGENT LIABILITIES
Lease Commitments: TheThe Company leases its three Sonoma offices, the Glen Ellen office and the Banco de Sonoma office under noncancelable operating leases with remaining terms of approximately three6 months, two years, one year, four years four years, two years and twofive years, respectively. All of the leases require adjustments to the base rent for changing price indices and two have a minimum annual increase of four percent. The Sonoma main office lease and the Sonoma Finance Center lease have the option to renew for two consecutive five-year terms and the Sonoma annex office has an option to renew for one five-year period and one four-year period. The Glen Ellen office and the Banco de Sonoma office lease each have an option to renew for twoone additional five-year terms.term. The following table summarizes future minimum commitments under the noncancelable operating leases. | | | | | | | Year ended December 31 | | | | | | 2007 | | $ | 363,699 | | | 2008 | | | 362,793 | | | 2009 | | | 208,167 | | | 2010 | | | 26,386 | | | | | | | | | | | | | | | | $ | 961,045 | | | | | | |
| Year ended December 31, | | | | | | 2009 | | $ | 249,422 | | | 2010 | | | 67,192 | | | 2011 | | | 41,295 | | | 2012 | | | 42,708 | | | 2013 | | | 29,943 | | | Thereafter | | | 2,120 | | | | | $ | 432,680 | |
NOTE N—COMMITMENTS AND CONTINGENT LIABILITIES (Continued) Rental expense was $393,000 in 2008, $381,000 in 2007 and $364,000 in 2006, $347,000 in 2005 and $318,000 in 2004.2006.
Financial Instruments with Off-Balance-Sheet Risk: The Company’sCompany's financial statements do not reflect various commitments and contingent liabilities which arise in the normal course of business and which involve elements of credit risk, interest rate risk and liquidity risk. These commitments and contingent liabilities are commitments to extend credit and standby letters of credit. A summary of the Company’sCompany's commitments and contingent liabilities at December 31 is as follows: | | | | | | | | | | | Contractual Amounts | | | | | Contractual Amounts | | 2008 | | | 2007 | | | | | 2006 | | 2005 | | | | | | | | Commitments to extend credit | | $ | 42,043,000 | | $ | 48,643,000 | | | $ | 42,284,000 | | | $ | 51,458,000 | | | Standby letters of credit | | 348,000 | | 348,000 | | | 118,000 | | | 158,000 | |
Commitments to extend credit and standby letters of credit include exposure to some credit loss in the event of nonperformance of the customer. The Company’sCompany's credit policies and procedures for credit commitments and financial guarantees are the same as those for extensions of credit that are recorded on the balance sheet. Because these instruments have fixed maturity dates, and because many of them expire without being drawn upon, they do not generally present any significant liquidity risk to the Company.
Commitments to extend credit are agreements to lend to a customer as long as there is no violation of any condition established in the contract. Commitments generally have fixed expiration dates or other termination 74
NOTE N—COMMITMENTS AND CONTINGENT LIABILITIES (Continued)
clauses and may require payment of a fee. The Company evaluates each customer’s credit worthiness on a case-by-case basis. The amount of collateral obtained, if deemed necessary by the Company upon extension of credit, is based on management’s credit evaluation of the customer. Collateral held varies but may include accounts receivable, inventory, property, plant, and equipment, certificates of deposits and income-producing commercial properties.
Standby letters of credit are conditional commitments issued by the Company to guarantee the performance of a customer to a third party. Those guarantees are primarily issued to support public and private borrowing arrangements. The credit risk involved in issuing letters of credit is essentially the same as that involved in extending facilities to customers.
The Company has not incurred any losses on its commitments in 2006, 20052008, 2007 or 2004.2006.
As a guarantor of its customer’scustomers’ credit card accounts, the Company is contingently liable for credit card receivable balances held by another financial institution should the customers default. The total amount guaranteed as of December 31, 20062008 and 20052007 was $313,000$580,000 and $207,000,$655,000, respectively. NOTE O—CONCENTRATIONS OF CREDIT RISK Most of the Company’sCompany's business activity is with customers located within the State of California, primarily in Sonoma County. The economy of the Company’sCompany's primary service area is heavily dependent on the area’sarea's major industries which are tourism and agriculture, especially wineries, dairies and cheese producers. General economic conditions or natural disasters affecting the primary service area or its major industries could affect the ability of customers to repay loans and the value of real property used as collateral. While NOTE O—CONCENTRATIONS OF CREDIT RISK (Continued)
The composition of the Company has a diversified loan portfolio approximately 91% of these loans are secured by real estate in its service area. The concentrations of credit by type of loan areis set forth in Note D. The distribution ofNote D does not include unfunded loan commitments, to extend credit approximates the distributionwhich represent 14.0% of loans outstanding. In addition,While the Company has approximately 91.3% of its loan portfolio centered in real estate secured loans within its service area, the loans in this category are diversified. Based on outstanding loan commitments in he wine/agricultural industry,(“total loans”), the Company has the following loan concentrations: Non-owner occupied construction (6.92%), owner-occupied construction (3.39%), land loans (7.78%), mixed-use commercial real estate (10.14%), industrial and warehouse commercial real estate (7.69%), retail commercial real estate (8.98%), office commercial real estate (6.39%), multi-family commercial real estate (7.34%) and loans to the tourism industry and construction loans, representing 5%, 5% and 27%, of outstanding loans, respectively.industries (3.38%). Standby letters of credit were granted primarily to commercial borrowers. The Company, as a matter of policy, does not extend credit to any single borrower or group of related borrowers on a secured basis in excess of 25% of its unimpaired capital (shareholders’(shareholders' equity plus the allowance for credit losses) and on an unsecured basis in excess of 15% of its unimpaired capital.
The concentrations of investments are set forth in Note C. The Company places its investments primarily in financial instruments backed by the U.S. Government and its agencies or by high quality financial institutions, municipalities or corporations. The Company has significant funds deposited with four correspondent banks. In addition, deposits with two correspondent banks were in excess of the federally insured limit by $677,939$309,169 at December 31, 2006.2008. While management recognizes the inherent risks involved in such concentrations, this 75
NOTE O—CONCENTRATIONS OF CREDIT RISK (Continued)
concentration provides the Company with an effective and cost efficient means of managing its liquidity position and item processing needs. Management closely monitors the financial condition of their correspondent banks on a continuous basis. The Company also maintains additional deposit accounts with other correspondent banks should management determine that a change in its correspondent banking relationship would be appropriate.
At December 31, 2006,2008, the Company had life insurance policies with cash surrender values of $2,492,966, $2,043,089, $1,866,319$2,716,604, $2,027,179, $2,019,301 and $1,851,806$1,996,317 with four insurance companies, which represented 9%8.8%, 8%6.6%, 7%6.5% and 7%6.5%, respectively, of the Company’sCompany's net worth. Management closely monitors the financial condition and rating of these insurance companies on a regular basis.
NOTE P—REGULATORY MATTERS Banking regulations limit the amount of cash dividends that may be paid without prior approval of the Bank’sBank's regulatory agency. Cash dividends are limited to the lesser of retained earnings, if any, or net income for the last three years, net of the amount of any other distributions made to shareholders during such periods. As of December 31, 2006, $4,996,8662008, $7,440,441 was available for cash dividend distribution without prior approval.
The Bank is subject to various regulatory capital requirements administered by its primary federal regulator, the Federal Deposit Insurance Corporation (FDIC). Failure to meet minimum capital requirements can initiate certain mandatory—and possibly additional discretionary—actions by regulators that, if undertaken, could have a direct material effect on the Bank’s financial statements. Under capital adequacy guidelines and the regulatory framework for prompt corrective action, the Bank must meet specific capital guidelines that involve quantitative measures of the Bank’s assets, liabilities, and certain off-balance-sheet items as calculated under regulatory accounting practices. The Bank’s capital amounts and classification are also subject to qualitative judgments by the regulators about components, risk weightings, and other factors.
NOTE P—REGULATORY MATTERS (Continued) Quantitative measures established by regulation to ensure capital adequacy require the Bank to maintain minimum amounts and ratios (set forth in the table below) of total and Tier I capital (as defined in the regulations) to risk-weighted assets (as defined), and of Tier I capital (as defined) to average assets (as defined). Management believes, as of December 31, 2006,2008, that the Bank meets all capital adequacy requirements to which it is subject.
As of December 31, 2006,2008, the most recent notification from the FDIC categorized the Bank as well capitalized under the regulatory framework for prompt corrective action. To be categorized as well capitalized the Bank must maintain minimum total risk-based, Tier I risk-based and Tier I leverage ratios as set forth in the table. There are no conditions or events since that notification that management believes have changed the institution’s category. The Bank’s actual capital amounts and ratios are also presented in the table. 76
NOTE P—REGULATORY MATTERS (Continued)| | | | | | | | | | | | | | | | | | | | | | | | | | | | | | | | | | | | | | | | | | | | | To Be Well | | | | | | | | | | | | | | | | | | | | Capitalized Under | | | | | | | | | | | | For Capital | | Prompt Corrective | | | | Actual | | Adequacy Purposes | | Action Provisions | | | | Amount | | Ratio | | Amount | | Ratio | | Amount | | Ratio | | | | (in thousands) | | As of December 31, 2006: | | | | | | | | | | | | | | | | | | | | | | | | | | Total Capital | | | | | | | | | | | | | | | | | | | | | | | | | | (to Risk Weighted Assets) | | $ | 28,223 | | | | 11.0 | % | | | ³$20,466 | | | | ³8.0 | % | | | ³$25,583 | | | | ³10.0 | % | | Tier I Capital | | | | | | | | | | | | | | | | | | | | | | | | | | (to Risk Weighted Assets) | | $ | 25,024 | | | | 9.8 | % | | | ³$10,233 | | | | ³4.0 | % | | | ³$15,350 | | | | ³ 6.0 | % | | Tier I Capital | | | | | | | | | | | | | | | | | | | | | | | | | | (to Average Assets) | | $ | 25,024 | | | | 9.1 | % | | | ³$10,960 | | | | ³4.0 | % | | | ³$13,700 | | | | ³ 5.0 | % | | | | | | | | | | | | | | | | | | | | | | | | | | | | As of December 31, 2005: | | | | | | | | | | | | | | | | | | | | | | | | | | Total Capital | | | | | | | | | | | | | | | | | | | | | | | | | | (to Risk Weighted Assets) | | $ | 24,514 | | | | 11.4 | % | | | ³$17,211 | | | | ³8.0 | % | | | ³$21,513 | | | | ³10.0 | % | | Tier I Capital | | | | | | | | | | | | | | | | | | | | | | | | | | (to Risk Weighted Assets) | | $ | 21,824 | | | | 10.1 | % | | | ³$8,605 | | | | ³4.0 | % | | | ³$12,908 | | | | ³ 6.0 | % | | Tier I Capital | | | | | | | | | | | | | | | | | | | | | | | | | | (to Average Assets) | | $ | 21,824 | | | | 9.1 | % | | | ³$9,576 | | | | ³4.0 | % | | | ³$11,970 | | | | ³ 5.0 | % |
| | Actual | For Capital Adequacy | To Be Well Capitalized Under Prompt Corrective Action Provisions | | | Amount | Ratio | Purposes Amount | Ratio | Amount | Ratio | As of December 31, 2008: Total Capital (to Risk Weighted Assets) | $ 32,640 | 11.3% | ≥$ 23,077 | ≥8.0% | ≥$ 28,846 | ≥10.0% | Tier I Capital (to Risk Weighted Assets) | $ 29,017 | 10.1% | ≥$ 11,538 | ≥4.0% | ≥$ 17,308 | ≥ 6.0% | Tier I Capital (to Average Assets) | $ 29,017 | 9.2% | ≥$ 12,586 | ≥4.0% | ≥$ 15,732 | ≥ 5.0% | As of December 31, 2007: | | | | | | | Total Capital (to Risk Weighted Assets) | $ 29,996 | 10.8% | ≥$ 22,310 | ≥8.0% | ≥$ 27,887 | ≥10.0% | Tier I Capital (to Risk Weighted Assets) | $ 26,507 | 9.5% | ≥$ 11,155 | ≥4.0% | ≥$ 16,732 | ≥ 6.0% | Tier I Capital (to Average Assets) | $ 26,507 | 9.0% | ≥$ 11,761 | ≥4.0% | ≥$ 14,701 | ≥ 5.0% |
77
NOTE Q—CONDENSED FINANCIAL INFORMATION OF THE PARENT COMPANY
A condensed balance sheet as of December 31, 20062008 and 20052007 and the related condensed statement of operations and cash flows for the years ended December 31, 2006, 20052008 and 20042007 for Sonoma Valley Bancorp (parent company only) are presented as follows:
Condensed Balance Sheets
December 31, 20062008 and 20052007 | | | | | | | | | | | | | 2006 | | | 2005 | | | Assets | | | | | | | | | | Cash | | $ | 682,798 | | | $ | 911,439 | | | Other assets | | | 764,470 | | | | 289,877 | | | Investment in common stock of subsidiary | | | 25,236,403 | | | | 22,459,620 | | | | | | | | | | | | | | | | | | | | | Total assets | | $ | 26,683,671 | | | $ | 23,660,936 | | | | | | | | | |
| | | | | | | | | | | | | 2006 | | | 2005 | | | Liabilities | | | | | | | | | | Accrued expenses | | $ | 279,600 | | | $ | 221,143 | | | | | | | | | | | | | Shareholders’ equity | | | | | | | | | | Common stock | | | 15,479,556 | | | | 15,004,135 | | | Additional paid-in-capital | | | 1,872,648 | | | | 1,252,292 | | | Retained earnings and other equity | | | 9,051,867 | | | | 7,183,366 | | | | | | | | | | | | | | | | | | | | | Total liabilities and shareholders’ equity | | $ | 26,683,671 | | | $ | 23,660,936 | | | | | | | | | |
| | | 2008 | | | 2007 | | | Assets | | | | | | | Cash | | $ | 171,504 | | | $ | 55,380 | | Other assets | | | 841,500 | | | | 947,911 | | Investment in common stock of subsidiary | | | 30,226,920 | | | | 27,218,520 | | | Total assets | | $ | 31,239,924 | | | $ | 28,221,811 | |
| | | | | | | | | Liabilities | | | | | | | Accrued expenses | | $ | 379,828 | | | $ | 287,531 | | | | | | | | | | | | | Shareholders’ equity | | | | | | | | | Common stock | | | 16,402,084 | | | | 15,578,903 | | Additional paid-in-capital Retained earnings and other equity | | | 2,577,855 11,880,157 | | | | 2,455,409 9,899,968 | | | Total liabilities and shareholders’ equity | | $ | 31,239,924 | | | $ | 28,221,811 | |
Condensed Statements of Operations
For the years ended December 31, 2006, 20052008, 2007 and 20042006 | | | | | | | | | | | | | | | | | 2006 | | | 2005 | | | 2004 | | | Dividend from subsidiary | | $ | 1,750,000 | | | $ | 500,000 | | | $ | 4,000,000 | | | Expenses | | | 583,724 | | | | 601,886 | | | | 303,690 | | | | | | | | | | | | | | Income (loss) before income taxes and equity in undistributed income of subsidiary | | | 1,166,276 | | | | (101,886 | ) | | | 3,696,310 | | | Equity in undistributed net income of subsidiary | | | 2,621,241 | | | | 3,252,996 | | | | (877,370 | ) | | Income tax benefit | | | 204,242 | | | | 197,419 | | | | 88,681 | | | | | | | | | | | | | | | | | | | | | | | | | | | | Net income | | $ | 3,991,759 | | | $ | 3,348,529 | | | $ | 2,907,621 | | | | | | | | | | | | |
78
| | | 2008 | | | 2007 | | | 2006 | | | Dividend from subsidiary | | $ | 1,000,000 | | | $ | 3,000,000 | | | $ | 1,750,000 | | | Expenses | | | 1,179,574 | | | | 892,962 | | | | 583,724 | | Income (loss) before income taxes and equity in undistributed income of subsidiary | | | (179,574 | ) | | | 2,107,038 | | | | 1,166,276 | | | Equity in undistributed net income of subsidiary | | | 2,956,932 | | | | 1,862,267 | | | | 2,621,241 | | | Income tax benefit | | | 538,003 | | | | 374,233 | | | | 204,242 | | | Net income | | $ | 3,315,361 | | | $ | 4,343,538 | | | $ | 3,991,759 | |
NOTE Q—CONDENSED FINANCIAL INFORMATION OF THE PARENT COMPANY (Continued) Condensed Statements of Cash Flows
For the years ended December 31, 2006, 20052008, 2007 and 20042006 | | | | | | | | | | | | | | | | | 2006 | | | 2005 | | | 2004 | | | Operating activities: | | | | | | | | | | | | | | Net income | | $ | 3,991,759 | | | $ | 3,348,529 | | | $ | 2,907,621 | | | Adjustments to reconcile net income to net cash provided by operating activities: | | | | | | | | | | | | | | Equity in undistributed net income of subsidiary | | | (2,621,241 | ) | | | (3,252,996 | ) | | | 877,370 | | | Restricted stock granted | | | 81,375 | | | | | | | | | | | Stock options granted | | | 100,224 | | | | 103,680 | | | | 103,680 | | | Net change in other assets | | | (15,100 | ) | | | 549,057 | | | | 169,526 | | | Net change in accrued expenses | | | 58,457 | | | | 159,893 | | | | (14,210 | ) | | | | | | | | | | | | | Net cash provided by operating activities | | | 1,595,474 | | | | 908,163 | | | | 4,043,987 | | | | | | | | | | | | | | | | | | | | | | | | | | | | Financing activities: | | | | | | | | | | | | | | Stock repurchases | | | (1,436,151 | ) | | | (113,668 | ) | | | (4,506,183 | ) | | Stock options exercised | | | 864,993 | | | | 532,635 | | | | 1,168,805 | | | Cash dividends paid | | | (1,252,957 | ) | | | (1,078,001 | ) | | | (906,732 | ) | | Fractional shares purchased | | | | | | | | | | | (7,498 | ) | | | | | | | | | | | | | | | | | | | | | | | | | | | Net cash used by financing activities | | | (1,824,115 | ) | | | (659,034 | ) | | | (4,251,608 | ) | | | | | | | | | | | | | | | | | | | | | | | | | | | Net change in cash and cash equivalents | | | (228,641 | ) | | | 249,129 | | | | (207,621 | ) | | | | | | | | | | | | | | | | Cash and cash equivalents at beginning of year | | | 911,439 | | | | 662,310 | | | | 869,931 | | | | | | | | | | | | | | | | | | | | | | | | | | | | Cash and cash equivalents at end of year | | $ | 682,798 | | | $ | 911,439 | | | $ | 662,310 | | | | | | | | | | | | |
| | | 2008 | | | 2007 | | | 2006 | | | Operating activities: | | | | | | | | | | Net income | | $ | 3,315,361 | | | $ | 4,343,538 | | | $ | 3,991,759 | | Adjustments to reconcile net income to net cash | | | | | | | | | | | | | provided by operating activities: | | | | | | | | | | | | | Equity in undistributed net income of subsidiary | | | (2,956,932 | ) | | | (1,862,267 | ) | | | (2,621,241 | ) | | Stock options and restricted stock granted | | | 227,555 | | | | 379,223 | | | | 181,599 | | Net change in other assets | | | 250,452 | | | | 232,383 | | | | (15,100 | ) | Net change in accrued expenses | | | 92,297 | | | | 7,931 | | | | 58,457 | | | Net cash provided by operating activities | | | 928,733 | | | | 3,100,808 | | | | 1,595,474 | |
| Financing activities: | | | | | | | | | | Stock repurchases | | | (21,940 | ) | | | (2,933,237 | ) | | | (1,436,151 | ) | Stock options exercised | | | 582,557 | | | | 576,482 | | | | 864,993 | | Cash dividends paid | | | (1,373,226 | ) | | | (1,371,471 | ) | | | (1,252,957 | ) | | Net cash used by financing activities | | | (812,609 | ) | | | (3,728,226 | ) | | | (1,824,115 | ) | | | | | | | | | | | | | | | | Net change in cash and cash equivalents | | | 116,124 | | | | (627,418 | ) | | | (228,641 | ) | | | | | | | | | | | | | | | | Cash and cash equivalents at beginning of year | | | 55,380 | | | | 682,798 | | | | 911,439 | | | | | | | | | | | | | | | | | Cash and cash equivalents at end of year | | $ | 171,504 | | | $ | 55,380 | | | $ | 682,798 | |
NOTE R—FAIR VALUES OF FINANCIAL INSTRUMENTS Statement of Financial Accounting Standards No. 107,Disclosures about Fair Value of Financial Instruments, requires disclosure of fair value information about financial instruments, whether or not recognized in the balance sheet. In cases where quoted market prices are not available, fair values are based on estimates using present value or other valuation techniques. Those techniques are significantly affected by the assumptions used, including the discount rate and estimates of future cash flows. In that regard, the derived fair value estimates cannot be substantiated by comparison to independent markets and, in many cases could not be realized in immediate settlement of the instruments. Statement No. 107 excludes certain financial instruments and all nonfinancial instruments from its disclosure requirements. Accordingly, the aggregate fair value amounts presented do not represent the underlying value of the Company as a whole. 79
NOTE R—FAIR VALUES OF FINANCIAL INSTRUMENTS (Continued)
The estimated fair values of the Company and Subsidiary’sSubsidiary's financial instruments are as follows at December 31: | | | | | | | | | | | | | | | | | | | | | 2006 | | 2005 | | | | Carrying | | Estimated | | Carrying | | Estimated | | | | Amount | | Fair Value | | Amount | | Fair Value | | Financial assets: | | | | | | | | | | | | | | | | | | Cash and due from banks | | $ | 6,159,931 | | | $ | 6,159,931 | | | $ | 6,988,820 | | | $ | 6,988,820 | | | Federal funds sold | | | | | | | | | | | 2,050,000 | | | | 2,050,000 | | | Interest-bearing due from banks | | | 1,292,325 | | | | 1,292,325 | | | | 39,521 | | | | 39,521 | | | Investment securities available-for-sale | | | 20,991,232 | | | | 20,991,232 | | | | 33,917,094 | | | | 33,917,094 | | | Investment securities held- to-maturity | | | 15,804,421 | | | | 15,951,553 | | | | 16,499,865 | | | | 16,634,518 | | | Loans and lease financing receivable, net | | | 216,330,690 | | | | 214,690,033 | | | | 168,418,085 | | | | 168,520,446 | | | Accrued interest receivable | | | 1,671,618 | | | | 1,671,618 | | | | 1,400,255 | | | | 1,400,255 | | | Cash surrender value of life insurance | | | 9,587,306 | | | | 9,587,306 | | | | 9,239,439 | | | | 9,239,439 | | | | | | | | | | | | | | | | | | | | | Financial liabilities: | | | | | | | | | | | | | | | | | | Deposits | | | 232,767,415 | | | | 233,038,180 | | | | 215,758,767 | | | | 216,317,041 | | | Federal Home Loan Bank Borrowings | | | 12,600,000 | | | | 12,600,000 | | | | | | | | | | | Accrued interest payable | | | 144,636 | | | | 144,636 | | | | 90,664 | | | | 90,664 | |
| | | 2008 | | | 2007 | | | | | Carrying Amount | | | Estimated Fair Value | | | Carrying Amount | | | Estimated Fair Value | | | Financial assets: | | | | | | | | | | | | | Cash and due from banks | | $ | 17,959,020 | | | $ | 17,959,020 | | | $ | 6,268,091 | | | $ | 6,268,091 | | Federal funds sold | | | | | | | | | | | | | | | | | Interest-bearing due from banks | | | 274,035 | | | | 274,035 | | | | 3,065,543 | | | | 3,065,543 | | | Investment securities available-for-sale | | | 6,578,924 | | | | 6,578,924 | | | | 8,203,190 | | | | 8,203,190 | | | Investment securities held-to-maturity | | | 13,862,911 | | | | 14,028,111 | | | | 14,554,224 | | | | 14,754,249 | | | Loans and lease financing receivable, net | | | 262,376,784 | | | | 268,700,000 | | | | 246,738,218 | | | | 245,521,222 | | | Accrued interest receivable | | | 1,678,547 | | | | 1,678,547 | | | | 1,682,209 | | | | 1,682,209 | | | Cash surrender value of life insurance | | | 10,777,482 | | | | 10,777,482 | | | | 10,354,153 | | | | 10,354,153 | | | | | | | | | | | | | | | | | | | | | Financial liabilities: | | | | | | | | | | | | | | | | | | Deposits | | | 253,945,501 | | | | 255,702,857 | | | | 236,047,699 | | | | 236,347,423 | | | Accrued interest payable | | | 112,405 | | | | 112,405 | | | | 150,109 | | | | 150,109 | | | Federal Home Loan Bank Borrowings | | | 30,000,000 | | | | 30,600,000 | | | | 27,500,000 | | | | 27,638,811 | | | | | | | | | | | | | | | | | | | |
The carrying amounts in the preceding table are included in the balance sheet under the applicable captions.
The following methods and assumptions were used by the Company in estimating its fair value disclosures for financial instruments:
Cash, due from banks and federal funds sold: The carrying amount is a reasonable estimate of fair value. NOTE R—FAIR VALUES OF FINANCIAL INSTRUMENTS (Continued) Investment securities: Fair values for investment securities are based on quoted market prices, where available. If quoted market prices are not available, fair values are based on quoted market prices of comparable instruments. The carrying amount of accrued interest receivable approximates its fair value. 80
NOTE R—FAIR VALUES OF FINANCIAL INSTRUMENTS (Continued)
Loans and lease financing receivables, net: For variable-rate loans and leases that reprice frequently and fixed rate loans and leases that mature in the near future, with no significant change in credit risk, fair values are based on carrying amounts. The fair values for other fixed rate loans and leases are estimated using discounted cash flow analysis, based on interest rates currently being offered for loans or leases with similar terms to borrowers of similar credit quality. Loan and lease fair value estimates include judgments regarding future expected loss experience and risk characteristics and are adjusted for the allowance for loan and lease losses. The carrying amount of accrued interest receivable approximates its fair value. Cash surrender value of life insurance: The carrying amount approximates its fair value.
Deposits: The fair values disclosed for demand deposits (for example, interest-bearing checking accounts and passbook accounts) are, by definition, equal to the amount payable on demand at the reporting date (that is, their carrying amounts). The fair values for certificates of deposit are estimated using a discounted cash flow calculation that applies interest rates currently being offered on certificates to a schedule of aggregated contractual maturities on such time deposits. The carrying amount of accrued interest payable approximates fair value.
Federal Home Loan Bank borrowings: The carrying amount of borrowed fundsovernight borrowings approximates fair value. The fair value of the long-term borrowings is estimated using a discounted cash flow calculation that applies current interest rates on similar borrowings with similar terms. Off-balance sheet instruments: Off-balance sheet commitments consist
Statement of commitments to extend creditFinancial Accounting Standards (SFAS) No. 157 defines fair value, establishes a framework for measuring fair value under generally accepted accounting principals, and standby lettersexpands disclosures about fair value measurement. Effective January 1, 2008 the Company adopted SFAS No. 157, which enhances the disclosures about financial instruments carried at fair value. The adoption of credit. The contract or notional amounts ofSFAS No. 157 did not have an impact on the Company’s financial instruments with off-balance-sheet riskcondition or results of operations.
Fair value is a market-based measure considered from the perspective of a market participant who holds the asset or owes the liability rather than an entity-specific measure. Therefore, even when market assumptions are disclosednot readily available, the Company’s own assumptions are set to reflect those that market participants would use in Note N. Estimatingpricing the asset or liability at the measurement date. The Company uses prices and inputs that are current as of the measurement date, including during periods of market dislocation, the observability of prices and inputs may be reduced for many instruments. This condition could cause an instrument to be reclassified from Level 1 to Level 2 or Level 2 to Level 3. NOTE R—FAIR VALUES OF FINANCIAL INSTRUMENTS (Continued) In general, fair values are determined by:
Level 1 inputs utilize quoted prices (unadjusted) in active markets for identical assets or liabilities that the Company has the ability to access.
Level 2 inputs include quoted prices for similar assets and liabilities in active markets, and inputs other than quoted prices that are observable for the asset or liability, such as interest rates and yield curves that are observable at commonly quoted intervals. Fair values determined by Level 2 inputs utilize inputs other than quoted prices included in Level 1 that are observable for the asset or liability, either directly or indirectly.
Level 3 inputs are unobservable inputs for the asset or liability, and include situations where there is little, if any market activity for the asset or liability.
| At December 31, 2008 | | | | | Total | | | Level 1 | | | Level 2 | | | Level 3 | | | Available-for-sale securities | | $ | 6,578,924 | | | $ | 17,119 | | | $ | 6,561,805 | | | $ | 0 | |
The following methods were used to estimate the fair value of theseeach class of financial instruments is not considered practicable due toinstrument above:
Securities available-for-sale – Securities classified as available-for-sale are reported at fair value utilizing Level 1 inputs for equity securities and Level 2 inputs for all other investment securities. For equity securities, the immateriality of the amounts of fees collected, which are used as a basis for calculatingCompany obtains the fair value measurements from NASDAQ and for investment securities, the Company obtains fair value measurements from an independent pricing service. The fair value measurements consider observable data that may include dealer quotes, market spreads, cash flows, the U.S. Treasury yield curve, live trading levels, trade execution data, market consensus prepayment speeds, credit information and the bond’s terms and conditions among other things.
The Company may be required, from time to time, to measure certain assets at fair value on a nonrecurring basis in accordance with U.S. generally accepted accounting principles. These include assets that are measured at the lower of cost or market that were recognized at fair value below cost at the end of the period. Assets measured at fair value on a nonrecurring basis are included in the table below. | December 31, 2008 | | | | | Total | | | Level 1 | | | Level 2 | | | Level 3 | | | Impaired Loans | | $ | 9,688,585 | | | $ | 0 | | | $ | 9,688,585 | | | $ | 0 | | | Other Real Estate Owned | | $ | 285,665 | | | $ | 0 | | | $ | 285,665 | | | $ | 0 | |
NOTE R—FAIR VALUES OF FINANCIAL INSTRUMENTS (Continued) Impaired loans and other real estate owned – The fair value of impaired loans and other real estate owned is estimated using one of several methods, including collateral value, market value of similar debt, enterprise value, liquidation value and discounted cash flows. Those impaired loans not requiring an allowance represent loans for which the fair value of the expected repayments or collateral exceed the recorded investments in such instruments.loans. At December 31, 2008 substantially all of the total impaired loans were evaluated based on the fair value of the collateral. In accordance with SFAS 157, impaired loans where an allowance is established based on the fair value of collateral require classification in the fair value hierarchy. When the fair value of the collateral is based on an observable market price or a current appraised value, the Company records the impaired loan as nonrecurring Level 2. When an appraised value is not available or management determines the fair value of the collateral is further impaired below the appraised value and there is no observable market price, the Company records the impaired loan as nonrecurring Level 3. NOTE S—SUBSEQUENT EVENTS In November 2008, the Company applied for funds through the U.S. Treasury’s Capital Purchase Program. On December 17, 2008, we were preliminarily approved to receive capital in the form of Senior Preferred shares of $8,653,000. This preliminary approval was pending shareholder approval of a change to our Articles of Incorporation allowing us to issue preferred shares. On February 21, 2007,11, 2009 shareholder approval was received and the Articles of Incorporation were amended. On February 20, 2009, the Company entered into a Letter Agreement with the United States Department of the Treasury pursuant to the Troubled Asset Relief Program Capital Purchase Program. Under the terms of the Letter Agreement, the Company issued to the Treasury, 8,653 shares of senior preferred stock and a warrant to acquire up to 433.00433 shares of a separate series of senior preferred stock for an aggregate purchase price of $8,653,000, pursuant to the standard Capital Purchase Program terms and conditions for non-public companies. On February 18, 2009, the Board of Directors declared a cash dividend of $.30 per share to shareholders of record on March 15, 2007February 27, 2009 and payable on March 30, 2007.13, 2009. 81
ITEM 9. CHANGES IN AND DISAGREEMENTS WITH ACCOUNTANTS ON ACCOUNTING AND FINANCIAL DISCLOSURE| ITEM 9. | CHANGES IN AND DISAGREEMENTS WITH ACCOUNTANTS ON ACCOUNTING AND FINANCIAL DISCLOSURE |
None
ITEM 9A. CONTROLS AND PROCEDURES.
Disclosure Controls and Procedures Disclosure controls and procedures are designed with the objective of ensuring that information required to be disclosed in reports filed by the Company under the Exchange Act, such as this Annual Report, is recorded, processed, summarized and reported within the time periods specified in the rules and forms of the Securities and Exchange Commission. Disclosure controls and procedures are also designed with the objective of ensuring that such information is accumulated and communicated to management, including the Chief Executive Officer and the Chief Financial Officer, as appropriate to allow timely decisions regarding required disclosure. Evaluation of Disclosure Controls and Procedures and Internal Control over Financial Reporting The Company carried out an evaluation, under the supervision and with the participation of management, including the Chief Executive Officer and the Chief Financial Officer, about the effectiveness of disclosure controls and procedures pursuant to Exchange Act Rule 13a-15(e). Based upon that evaluation, the Chief Executive Officer and the Chief Financial Officer concluded that the disclosure controls and procedures, as of the end of the period covered by this Form 10-K, are effective in alerting them to material information required to be included in this Form 10-K. Management's Report on Internal Control over Financial Reporting Management of the Company is responsible for establishing and maintaining adequate internal control over financial reporting. As defined in Rule 13a-15(f) under the Exchange Act, internal control over financial reporting is a process designed by, or under the supervision of, a company's principal executive and principal financial officers and effected by a company's board of directors, management and other personnel, to provide reasonable assurance regarding the reliability of financial reporting and the preparation of financial statements for external purposes in accordance with generally accepted accounting principles. It includes those policies and procedures that: | a) Pertain to the maintenance of records that in reasonable detail accurately and fairly reflect the transactions and dispositions of the assets of a company; |
| b) Provide reasonable assurance that transactions are recorded as necessary to permit preparation of financial statements in accordance with generally accepted accounting principles, and that receipts and expenditures of a company are being made only in accordance with authorizations of management and the board of directors of the company; and |
| c) Provide reasonable assurance regarding prevention or timely detection of unauthorized acquisition, use or disposition of a company's assets that could have a material effect on its financial statements. |
Because of the inherent limitations, internal control over financial reporting may not prevent or detect misstatements. Also, projections of any evaluation of effectiveness to future periods are subject to the risk that controls may become inadequate because of changes in conditions, or that the degree of compliance with the policies or procedures may deteriorate. The Company's management has used the criteria established in "Internal Control-Integrated Framework" issued by the Committee of Sponsoring Organizations of the Treadway Commission ("COSO") to evaluate the effectiveness of the Company's internal control over financial reporting. Management has selected the COSO framework for its evaluation as it is a control framework recognized by the SEC and the Public Company Accounting Oversight Board, that is free from bias, permits reasonably consistent qualitative and quantitative measurement of the Company's internal controls, is sufficiently complete so that relevant controls are not omitted, and is relevant to an evaluation of internal controls over financial reporting. Based on our assessment, management has concluded that our internal control over financial reporting, based on criteria established in "Internal Control-Integrated Framework" issued by COSO was effective as of December 31, 2008. This annual report does not include an attestation report of our registered public accounting firm regarding internal control over financial reporting. Our management's report was not subject to attestation by our registered public accounting firm pursuant to temporary rules of the Securities and Exchange Commission that permit us to provide only our management's report in this annual report. Date: March 18, 2009
/s/Sean C. Cutting /s/Mary Dieter Smith Sean C. Cutting Mary Dieter Smith Chief Executive Officer Chief Financial Officer ITEM 9B. OTHER INFORMATION.
None PART III ITEM 10. DIRECTORS AND EXECUTIVE OFFICERS OF THE REGISTRANT.
The information called for in Item 10 of Part III is incorporated by reference from the definitive proxy statement of the Company to be filed with the Securities and Exchange Commission within 120 days from fiscal year end. ITEM 11. EXECUTIVE COMPENSATION.
The information called for in Item 11 of Part III is incorporated by reference from the definitive proxy statement of the Company to be filed with the Securities and Exchange Commission within 120 days from fiscal year end. ITEM 12. SECURITY OWNERSHIP OF CERTAIN BENEFICIAL OWNERS AND MANAGEMENT AND RELATED
STOCKHOLDER MATTERS.| ITEM 12. | SECURITY OWNERSHIP OF CERTAIN BENEFICIAL OWNERS AND MANAGEMENT AND RELATED STOCKHOLDER MATTERS. |
The information called for in Item 12 of Part III is incorporated by reference from the definitive proxy statement of the Company to be filed with the Securities and Exchange Commission within 120 days from fiscal year end. ITEM 13. CERTAIN RELATIONSHIPS AND RELATED TRANSACTIONS.| ITEM 13. | CERTAIN RELATIONSHIPS AND RELATED TRANSACTIONS. |
The information called for in Item 13 of Part III is incorporated by reference from the definitive proxy statement of the Company to be filed with the Securities and Exchange Commission within 120 days from fiscal year end. 82
ITEM 14. PRINCIPAL ACCOUNTING FEES AND SERVICES.
The information called for in Item 14 of Part III is incorporated by reference from the definitive proxy statement of the Company to be filed with the Securities and Exchange Commission within 120 days from fiscal year end.
PART IV ITEM 15. EXHIBITS, FINANCIAL STATEMENT SCHEDULES.
Financial Statements
The following financial statements of the Company are filed as part of this Annual Report: | | | | | | | Number | | | Page | | 1. | | Independent Auditor’s Report | | 47 | | | | | | | | 2. | | Consolidated Balance Sheets as of December 31, 2006 and 2005 | | 48 | | | | | | | | 3. | | Consolidated Statements of Operations for the three years ended December 31, 2006, 2005 and 2004 | | 49 | | | | | | | | 4. | | Consolidated Statements of Changes in Shareholders’ Equity for the three years ended December 31, 2006, 2005 and 2004 | | 50 and 51 | | | | | | | | 5. | | Consolidated Statements of Cash Flows for the three years ended December 31, 2006, 2005 and 2004 | | 52 and 53 | | | | | | | | 6. | | Notes to Consolidated Financial Statements | | 54 |
| | | | Page Number | | | | | | | 1. | Independent Auditor's Report | | 54 | | | | | | | 2. | Consolidated Balance Sheets as of December 31, 2008 and 2007 | | 55 | | | | | | | 3. | Consolidated Statements of Operations for the three years ended December 31, 2008, 2007 and 2006 | | 56 | | | | | | | 4. | Consolidated Statements of Changes in Shareholders' Equity for the three years ended December 31, 2008, 2007 and 2006 | | 57 and 58 | | | | | | | 5. | Consolidated Statements of Cash Flows for the three years ended December 31, 2008, 2007 and 2006 | | 59 and 60 | | | | | | | 6. | Notes to Consolidated Financial Statements | | 61 |
Financial Statement Schedules
All other schedules have been omitted since the required information is not present or is not present in sufficient amounts to require submission of the schedules or because the information is included in the financial statements or the notes thereto. 83
Exhibits
The following Exhibits are attached or incorporated herein by reference:
| | | | 3.1 | | Sonoma Valley Bancorp Articles of Incorporation, filed as Exhibit 3.1 to the Registrant’sRegistrant's Registration Statement on Form S-8 filed on June 5, 2001. | | | |
| 3.3 | | Sonoma Valley Bancorp By-laws, filed as Exhibit 3.2 to the Registrant’sRegistrant's Registration Statement on Form S-8 filed on June 5, 2001. | | | |
| 4.2 | | Agreement for the sale of Sonoma Valley Bank Stock dated September 23, 1992, filed as Exhibit 4.2 (formerly A-1) to the Form F-2 for the year ended December 31, 1992. | | | |
| 10.1 | | Lease for Sonoma branch office, filed as Exhibit 10.1 (formerly 7.1) to the Registrant’sRegistrant's Registration Statement on Form F-1 filed on May 1, 1989. | | | |
| 10.2 | | Sonoma Valley Bank Chief Executive Officer Severance Agreement dated January 4, 1995, filed as Exhibit 10.2 to the Form 10-KSB for the year ended December 31, 1997. | | | |
| 10.3 | | Sonoma Valley Bank Supplemental Executive Retirement Plan, as amended on March 20, 1996, filed as Exhibit 10.3 to the Form 10-KSB for the year ended December 31, 1997. | | | |
| 10.4 | | Sonoma Valley Bank Deferred Compensation Plan, filed as Exhibit 10.4 to the Form 10-KSB for the year ended December 31, 1997. | | | |
| 10.5 | | Sonoma Valley Bank Master Trust Agreement for Executive Deferral Plans, filed as Exhibit 10.5 to the Form 10-KSB for the year ended December 31, 1997. | | | |
| 10.6 | | Sonoma Valley Bank 1996 Stock Option Plan, filed as Exhibit 10.6 to the Form 10-KSB for the year ended December 31, 1997. | | | |
| 10.7 | | Sonoma Valley Bank Severance Agreement with Mel Switzer, Jr. dated October 21, 1998, filed as Exhibit 10.7 to the From 10-KSB for the year ended December 31, 1998. | | | |
| 10.8 | | Sonoma Valley Bank Severance Agreement with Mary Dieter dated October 21, 1998, filed as Exhibit 10.8 to the From 10-KSB for the year ended December 31, 1998. | | | | | | 10.10 | | Sonoma Valley Bancorp Assumption of Severance Agreement [Form of], filed as Exhibit 10.1 to the Form 10-KSB for the year ended December 31, 2001. | | | | | | 10.11 | | Sonoma Valley Bancorp 2002 Equity Incentive Plan, filed as Exhibit A to the Company’s Proxy Statement for the Annual Meeting held on May 14, 2002. | | | | | | 10.12 | | Sonoma Valley Bank Severance Agreement with Sean CuttingsCutting dated March 18, 2004, filed as Exhibit 10.12 to the Form 10-K for the year ended December 31, 2003. | | | |
| 23.1 | | Consent of Richardson and Co., Independent Auditors. | | | |
| 31.1 | | Certification of Chief Executive Officer pursuant to Section 302 of the Sarbanes-Oxley Act |
84
| | | | 31.2 | | Certification of Chief Financial Officer pursuant to Section 302 of the Sarbanes-Oxley Act | | | |
| 32 | | Certification of Chief Executive Officer and Chief Financial Officer pursuant to Section 906 of the Sarbanes-Oxley Act |
85
Pursuant to the requirements of Section 13 or 15(d) of the Securities Act of 1934, the registrant has duly caused this report to be signed on its behalf by the undersigned, thereunto duly authorized.
SONOMA VALLEY BANCORP,
A California corporation | | | | | /s/ Mel Switzer, Jr. | | | | March 14, 2007 | | | | | | President and | | | | | Chief Executive Officer | | | | | (Principal Executive Officer) | | | | | | | | | | | | | | March 14, 2007 | Mary Dieter Smith | | | | | Executive Vice President and | | | | | Chief Operating Officer | | | | | (Principal Finance and Accounting Officer) | | | | |
/s/ Sean C. Cutting. March 18, 2009 Sean C. Cutting, President and Chief Executive Officer (Principal Executive Officer)
/s/ Mary Dieter Smith March 18, 2009 Mary Dieter Smith, Executive Vice President and Chief Financial Officer (Principal Finance and Accounting Officer)
In accordance with the Exchange Act, this report has been signed below by the following persons on behalf of the registrant and in the capacities and on the dates indicated. | | | | |
/s/ Suzanne Brangham March 18, 2009 Suzanne Brangham, Secretary of the Board and Director
/s/ Dale T. Downing March 18, 2009 Dale T. Downing, Director
/s/ Robert B. Hitchcock March 18, 2009 Robert B. Hitchcock, Director
/s/ Robert J. Nicholas March 18, 2009 Robert J. Nicholas, Chairman of the Board and Director Suzanne Brangham, Secretary | | | | March 14, 2007 | of the Board and Director | | | | | | | | | | /s/ Dale T. DowningDale T. Downing, Director | | | | March 14, 2007 | | | | | | /s/ Frederick H. HarlandFrederick H. Harland, Director | | | | March 14, 2007 | | | | | | /s/ Robert B. HitchcockRobert B. Hitchcock, Director | | | | March 14, 2007 |
86
| | | | | /s/ Robert J. Nicholas
/s/ Valerie Pistole March 18, 2009 Valerie Pistole, Director
Robert J. Nicholas, Chairman | | | | March 14, 2007 | of the Board and Director | | | | | | | | | | /s/ Angelo C. SangiacomoAngelo C. Sangiacomo, Director | | | | March 14, 2007 | | | | | | /s/ Jesse R. StoneJesse R. Stone, Director | | | | March 14, 2007 | | | | | | /s/ Mel Switzer, Jr.Mel Switzer, Jr., President, Chief | | | | March 14, 2007 | Executive Officer and Director | | | | | (Principal Executive Officer) | | | | | | | | | | /s/ Harry WeiseHarry Weise, Director | | | | March 14, 2007 | | | | | | /s/ Mary Dieter SmithMary Dieter Smith, Executive VicePresident, Chief Operating Officer andChief Financial Officer (PrincipalFinance and Accounting Officer) | | | | March 14, 2007 |
87
Exhibit Index97 | | | 3.1 | | Sonoma Valley Bancorp Articles of Incorporation, filed as Exhibit 3.1 to the Registrant’s Registration Statement on Form S-8 filed on June 5, 2001. | | | | 3.3 | | Sonoma Valley Bancorp By-laws, filed as Exhibit 3.2 to the Registrant’s Registration Statement on Form S-8 filed on June 5, 2001. | | | | 4.2 | | Agreement for the sale of Sonoma Valley Bank Stock dated September 23, 1992, filed as Exhibit 4.2 (formerly A-1) to the Form F-2 for the year ended December 31, 1992. | | | | 10.1 | | Lease for Sonoma branch office, filed as Exhibit 10.1 (formerly 7.1) to the Registrant’s Registration Statement on Form F-1 filed on May 1, 1989. | | | | 10.2 | | Sonoma Valley Bank Chief Executive Officer Severance Agreement dated January 4, 1995, filed as Exhibit 10.2 to the Form 10-KSB for the year ended December 31, 1997. | | | | 10.3 | | Sonoma Valley Bank Supplemental Executive Retirement Plan, as amended on March 20, 1996, filed as Exhibit 10.3 to the Form 10-KSB for the year ended December 31, 1997. | | | | 10.4 | | Sonoma Valley Bank Deferred Compensation Plan, filed as Exhibit 10.4 to the Form 10-KSB for the year ended December 31, 1997. | | | | 10.5 | | Sonoma Valley Bank Master Trust Agreement for Executive Deferral Plans, filed as Exhibit 10.5 to the Form 10-KSB for the year ended December 31, 1997. | | | | 10.6 | | Sonoma Valley Bank 1996 Stock Option Plan, filed as Exhibit 10.6 to the Form 10-KSB for the year ended December 31, 1997. | | | | 10.7 | | Sonoma Valley Bank Severance Agreement with Mel Switzer, Jr. dated October 21, 1998, filed as Exhibit 10.7 to the From 10-KSB for the year ended December 31, 1998. | | | | 10.8 | | Sonoma Valley Bank Severance Agreement with Mary Dieter dated October 21, 1998, filed as Exhibit 10.8 to the From 10-KSB for the year ended December 31, 1998. | | | | 10.10 | | Sonoma Valley Bancorp Assumption of Severance Agreement [Form of], filed as Exhibit 10.1 to the Form 10-KSB for the year ended December 31, 2001. | | | | 10.11 | | Sonoma Valley Bancorp 2002 Equity Incentive Plan, filed as Exhibit A to the Company’s Proxy Statement for the Annual Meeting held on May 14, 2002. | | | | 10.12 | | Sonoma Valley Bank Severance Agreement with Sean Cuttings dated March 18, 2004, filed as Exhibit 10.12 to the Form 10-K for the year ended December 31, 2003. | | | | 23.1 | | Consent of Richardson and Co., Independent Auditors. | | | | 31.1 | | Certification of Chief Executive Officer pursuant to Section 302 of the Sarbanes-Oxley Act |
| | | 31.2 | | Certification of Chief Financial Officer pursuant to Section 302 of the Sarbanes-Oxley Act | | | | 32 | | Certification of Chief Executive Officer and Chief Financial Officer pursuant to Section 906 of the Sarbanes-Oxley Act |
/s/ Mel Switzer, Jr. March 18, 2009 Mel Switzer, Jr., Vice-Chairman of the Board and Director
/s/ Sean C. Cutting. March 18, 2009 Sean C. Cutting, President and Chief Executive Officer (Principal Executive Officer)
/s/ Mary Dieter Smith March 18, 2009 Mary Dieter Smith, Executive Vice President and Chief Financial Officer (Principal Finance and Accounting Officer)
| |
