UNITED STATES
SECURITIES AND EXCHANGE COMMISSION
Washington, D.C. 20549
(Mark One)
x | | |
(Mark One) | | |
| | ANNUAL REPORT PURSUANT TO SECTION 13 OR 15(d)OF THE SECURITIES |
For the fiscal year ended December 31, 2011
OR
¨ | | For the fiscal year ended December 31, 2008
|
or
|
o
| | TRANSITION REPORT PURSUANT TO SECTION 13 OR 15(d)OF THE SECURITIES EXCHANGE ACT OF 1934 |
| | For the transition period from to |
For the transition period from to
Commission file number 1-4174
The Williams Companies, Inc.
(Exact nameName of Registrant as Specified in Its Charter)
| | |
| Delaware | | 73-0569878 |
Delaware
(State or Other Jurisdiction of
Incorporation or Organization) | | 73-0569878
(IRS Employer
Identification No.) |
| | |
One Williams Center, Tulsa, Oklahoma
| | 74172 |
| (Address of Principal Executive Offices) | | 74172
(Zip Code) |
(Registrant’s Telephone Number, Including Area Code)
Securities registered pursuant to Section 12(b) of the Act:
| | |
Title of Each Class | | |
| | Name of Each Exchange
|
Title of Each Class
| | |
|
| Common Stock, $1.00 par value | | New York Stock Exchange |
| Preferred Stock Purchase Rights | | New York Stock Exchange |
Securities registered pursuant to Section 12(g) of the Act:
5.50% Junior Subordinated Convertible Debentures due 2033
Indicate by check mark if the registrant is a well-known seasoned issuer, as defined in Rule 405 of the Securities Act. Yes þx No o¨
Indicate by check mark if the registrant is not required to file reports pursuant to Section 13 or Section 15(d) of the Act. Yes o¨ No þx
Indicate by check mark whether the registrant: (1) has filed all reports required to be filed by Section 13 or 15(d) of the Securities Exchange Act of 1934 during the preceding 12 months (or for such shorter period that the registrant was required to file such reports), and (2) has been subject to such filing requirements for the past 90 days. Yes þx No o¨
Indicate by check mark whether the registrant has submitted electronically and posted on its corporate Web site, if any, every Interactive Data File required to be submitted and posted pursuant to Rule 405 of Regulation S-T (§232.405 of this chapter) during the preceding 12 months (or for such shorter period that the registrant was required to submit and post such files). Yes x No ¨
Indicate by check mark if disclosure of delinquent filers pursuant to Item 405 ofRegulation S-K (§229.405 of this chapter) is not contained herein, and will not be contained, to the best of registrant’s knowledge, in definitive proxy or information statements incorporated by reference in Part III of thisForm 10-K or any amendment to thisForm 10-K. ¨þ
Indicate by check mark whether the registrant is a large accelerated filer, an accelerated filer, a non-accelerated filer, or a smaller reporting company. See the definitions of “large accelerated filer,” “accelerated filer” and “smaller reporting company” inRule 12b-2 of the Exchange Act. (Check one):
| | | | | | |
Large accelerated filer | | x | | Accelerated filer | | ¨ |
Large accelerated
| | | |
Non-accelerated filerþ | | Accelerated filero¨
| | Non-accelerated filer o
(Do (Do not check if a smaller reporting company) | | Smaller reporting companyo | | ¨ |
Indicate by check mark whether the registrant is a shell company (as defined inRule 12b-2 of the Act). Yes o¨ No þx
The aggregate market value of the voting and non-voting common equity held by non-affiliates computed by reference to the price at which the common equity was last sold as of the last business day of the registrant’s most recently completed second quarter was approximately $23,344,993,927.
$17,802,985,945.The number of shares outstanding of the registrant’s common stock outstanding at February 19, 200922, 2012 was 579,213,365.
592,181,611.DOCUMENTS INCORPORATED BY REFERENCE
Portions of the Registrant’s Definitive Proxy Statement for the Registrant’s 20092011 Annual Meeting of Stockholders to be held on May 21, 2009,17, 2012, are incorporated into Part III, as specifically set forth in Part III.
THE WILLIAMS COMPANIES, INC.
FORM 10-K
i
DEFINITIONS
We use the following oil and gas measurements in this report:
BcfeBarrel — means one barrel of petroleum products that equals 42 U.S. gallons.
Bcf— means one billion cubic feet of gas equivalent determined using the ratio of one barrel of oil or condensate to six thousand cubic feet of natural gas.
feet.Bcf/d — means one billion cubic feet per day.
British Thermal Unit or BTU(Btu) — means a unit of energy needed to raise the temperature of one pound of water by one degree Fahrenheit.
BBtud — means one billion BTUs per day.
Dekatherms or Dth or Dt(Dth) — means a unit of energy equal to one million BTUs.
Btus.Mbbls/d — means one thousand barrels per day.
Mcfe — means one thousand cubic feet of gas equivalent using the ratio of one barrel of oil or condensate to six thousand cubic feet of natural gas.
Mdt/Mdth/d — means one thousand dekatherms per day.
MMcfMMBtu — — means one million cubic feet.
Btus.MMcf/d — means one million cubic feet per day.
MMcfe — means one million cubic feet of gas equivalent using the ratio of one barrel of oil or condensate to six thousand cubic feet of natural gas.
MMdtMMdth — means one million dekatherms or approximately one trillion BTUs.
Btus.MMdt/MMdth/d — means one: One million dekatherms per day.
TBtu — means one trillion BTUs.
iiOther definitions:
FERC — means Federal Energy Regulatory Commission.
Fractionation — means the process by which a mixed stream of natural gas liquids is separated into its constituent products, such as ethane, propane, and butane.
LNG — means liquefied natural gas; natural gas which has been liquefied at cryogenic temperatures.
NGL — means natural gas liquids; natural gas liquids result from natural gas processing and crude oil refining and are used as petrochemical feedstocks, heating fuels, and gasoline additives, among other applications.
NGL margins — means NGL revenues less Btu replacement cost, plant fuel, transportation, and fractionation.
Throughput — means the volume of product transported or passing through a pipeline, plant, terminal, or other facility.
2
PART I
In this report, Williams (which includes The Williams Companies, Inc. and, unless the context otherwise requires, all of our subsidiaries) is at times referred to in the first person as “we,” “us” or “our.” We also sometimes refer to Williams as the “Company.”
WEBSITE ACCESS TO REPORTS AND OTHER INFORMATION
We file our annual report onForm 10-K, quarterly reports onForm 10-Q, current reports onForm 8-K, proxy statements and other documents electronically with the Securities and Exchange Commission (SEC) under the Securities Exchange Act of 1934, as amended (Exchange Act). You may read and copy any materials that we file with the SEC at the SEC’s Public Reference Room at 100 F Street, N.E., Washington, DC 20549. You may obtain information on the operation of the Public Reference Room by calling the SEC at1-800-SEC-0330. You may also obtain such reports from the SEC’s Internet website at www.sec.gov.
http://www.sec.gov.
Our Internet website is www.williams.comhttp://www.williams.com..We make available free of charge on or through the Investor tab of our Internet website our annual report onForm 10-K, quarterly reports onForm 10-Q, current reports onForm 8-K and amendments to those reports filed or furnished pursuant to Section 13(a) or 15(d) of the Exchange Act as soon as reasonably practicable after we electronically file such material with, or furnish it to, the SEC. Our Corporate Governance Guidelines, Code of Ethics for Senior Officers, Board Committee Charterscommittee charters and the Williams Code of Business Conduct are also available on our Internet website. We will also provide, free of charge, a copy of any of our corporate documents listed above upon written request to our Corporate Secretary, One Williams Center, Suite 4700, Tulsa, Oklahoma 74172.
GENERAL
We are aan energy infrastructure company focused on connecting North America’s hydrocarbon resource plays to growing markets for natural gas, companyNGLs, and olefins. Our operations span from the deepwater Gulf of Mexico to the Canadian oil sands.
Our interstate gas pipeline and domestic midstream interests are largely held through its significant investment in Williams Partners L.P. (WPZ), one of the largest energy master limited partnerships. We own the general-partner interest and a 70 percent limited-partner interest in WPZ. We also own a Canadian midstream and domestic olefins production business, which processes oil sands off-gas and produces olefins for petrochemical feedstocks.
We were founded in 1908, originally incorporated under the laws of the state of Nevada in 1949 and reincorporated under the laws of the state of Delaware in 1987. We were founded in 1908 when two Williams brothers began a construction company in Fort Smith, Arkansas. Today, we primarily find, produce, gather, process and transport natural gas. Our operations are concentrated in the Pacific Northwest, Rocky Mountains, Gulf Coast, the Eastern Seaboard, and the province of Alberta in Canada.
Our principal executive officesWilliams’ headquarters are located
at One Williams Center,in Tulsa, Oklahoma,
74172.with other major offices in Salt Lake City, Houston, the Four Corners Area and Pennsylvania. Our telephone number is
918-573-2000.3
918-573-2000.SPIN-OFF OF WPX
In 2008,On December 1, 2011, we used Economic Value Added® (EVA®)1 as the basis for disciplined decision making around the useannounced that our Board of capital. EVA® isDirectors approved a tool that considers both financial earningstax-free spinoff of 100 percent of our exploration and a cost of capital in measuring performance. It is based on the idea that earning profits from an economic perspective requires that a company cover not only all of its operating expenses but also all of its capital costs. The two main components of EVA® are net operating profit after taxes and a charge for the opportunity cost of capital. We derive these amounts by making various adjustmentsproduction business, WPX Energy, Inc. (WPX), to our reportedshareholders. On December 31, 2011, we distributed one share of WPX common stock for every three shares of Williams common stock. As a result, with the exception of the December 31, 2011 balance sheet which no longer includes WPX, the consolidated financial statements reflect the results of operations and financial position of WPX as discontinued operations.
DIVIDEND GROWTH
We doubled our quarterly dividends from $0.125 per share in the fourth quarter of 2010 to $0.25 per share in the fourth quarter of 2011. Also, consistent with expected growing cash distributions from our interest in WPZ, we expect continued dividend increases on a quarterly basis. Our Board of Directors has approved a dividend of $0.25875 per share for the first quarter of 2012 and we expect total 2012 dividends to be $1.09 per share, which is approximately 41 percent higher than 2011.
RECENT EVENTS
In February 2012, Williams Partners completed the acquisition of 100 percent of the ownership interests in certain entities from Delphi Midstream Partners, LLC. These entities primarily own the Laser Gathering System, which is comprised of 33 miles of 16-inch natural gas pipeline and associated gathering facilities in the Marcellus Shale in Susquehanna County, Pennsylvania, as well as 10 miles of gathering lines in southern New York. This acquisition represents a strategic platform to enhance Williams Partners’ expansion in the Marcellus Shale by applying a costproviding its customers with both operational flow assurance and marketing flexibility. (See Results of capital. We look for opportunities to improve EVA® because we believe there is a strong correlation between EVA® improvement and creation of shareholder value.
4
FINANCIAL INFORMATION ABOUT SEGMENTS
See “Item“Item 8 — Financial Statements and Supplementary Data — Notes to Consolidated Financial Statements — Note 18” of our Notes to Consolidated Financial Statements18” for information with respect to each segment’s revenues, profits or losses and total assets.
1 Economic Value Added® (EVA®) is a registered trademark of Stern, Stewart & Co.
1
BUSINESS SEGMENTS
Substantially all our operations are conducted through our subsidiaries. To achieve organizational and operating efficiencies, ourOur activities arein 2011 were primarily operated through the following business segments:
| | |
| | • | | Exploration & ProductionWilliams Partners — produces, developscomprised of our master limited partnership WPZ, which includes gas pipeline and managesdomestic midstream businesses. The gas pipeline business includes interstate natural gas reserves primarily located inpipelines and pipeline joint venture investments, and the Rocky Mountainmidstream business provides natural gas gathering, treating and Mid-Continent regions of the United Statesprocessing services; NGL production, fractionation, storage, marketing and transportation; deepwater production handling and crude oil transportation services and is comprised of several wholly owned and partially owned subsidiaries including Williams Production Company LLC and Williams Production RMT Company (RMT).joint venture investments.
|
|
| | • | | Gas PipelineMidstream Canada & Olefins — includesprimarily our interstate natural gasCanadian midstream and domestic olefins operations. Our Canadian operations include an oil sands off-gas processing plant located near Ft. McMurray, Alberta, and an NGL/olefin fractionation facility and butylenes/butane splitter (B/B splitter) facility, both of which are located at Redwater, Alberta, which is near Edmonton, Alberta. In the Gulf of Mexico region, we own a 5/6 interest in and are the operator of an NGL light-feed olefins cracker plant in Geismar, Louisiana. We also own ethane and propane pipelines systems in Louisiana that provide feedstock to the Geismar plant. Additionally, we own a refinery grade propylene splitter and pipeline joint venture investments organized under our wholly owned subsidiary, Williams Gas Pipeline Company, LLC (WGP). Gas Pipelineassociated pipeline. Our olefins business also includes Williams Pipeline Partners L.P. (WMZ), our master limited partnership formed in 2007.operates an ethylene storage hub at Mont Belvieu using leased third-party underground storage wells.
|
|
| | • | Midstream Gas & Liquids — includes our natural gas gathering, treating and processing business and is comprised of several wholly owned and partially owned subsidiaries including Williams Field Services Group LLC and Williams Natural Gas Liquids, Inc. Midstream also includes Williams Partners L.P. (WPZ), our master limited partnership formed in 2005. |
|
| | • | Gas Marketing Services — manages our natural gas commodity risk through purchases, sales and other related transactions, under our wholly owned subsidiary Williams Gas Marketing, Inc. |
|
| • | Other — primarily consists of corporate operations. |
This report is organized to reflect this structure.
Detailed discussion of each of our business segments follows.
Exploration & ProductionWilliams Partners
Our Exploration & Production segment produces, develops, and manages natural gas reserves primarily located in the Rocky Mountain (primarily New Mexico, Wyoming and Colorado) and Mid-Continent (Oklahoma and Texas) regions of the United States. We specialize in natural gas production from tight-sands and shale formations and coal bed methane reserves in the Piceance, San Juan, Powder River, Arkoma, Green River and Fort Worth basins. Over 99 percent of Exploration & Production’s domestic reserves are natural gas. Our Exploration & Production segment also has international oil and gas interests, which include a 69 percent equity interest in Apco Argentina Inc., an oil and gas exploration and production company with operations in Argentina, and a 4 percent equity interest in Petrowayu S.A., a Venezuelan corporation that is the operator of a 100 percent interest in the La Concepcion block located in western Venezuela.
Exploration & Production’s current proved undeveloped and probable reserves provide us with strong capital investment opportunities for several years into the future. Exploration & Production’s goal is to drill its existing proved undeveloped reserves, which is comprised of approximately 43 percent of proved reserves, and to drill in areas of probable reserves adding to our proved reserves. In addition, Exploration & Production provides a significant amount of equity production that is gatheredand/or processed by our Midstream facilities in the San Juan basin.
Information for our Exploration & Production segment relates only to domestic activity unless otherwise noted. We use the terms “gross” to refer to all wells or acreage in which we have at least a partial working interest and “net” to refer to our ownership represented by that working interest.
2
Gas reserves and wells
The following table summarizes our U.S. natural gas reserves as of December 31 (using market prices on December 31 held constant) for the year indicated:
| | | | | | | | | | | | | |
| | | 2008 | | | 2007 | | | 2006 | |
| | | (Bcfe) | |
| |
| Proved developed natural gas reserves | | | 2,456 | | | | 2,252 | | | | 1,945 | |
| Proved undeveloped natural gas reserves | | | 1,883 | | | | 1,891 | | | | 1,756 | |
| | | | | | | | | | | | | |
| Total proved natural gas reserves | | | 4,339 | | | | 4,143 | | | | 3,701 | |
| | | | | | | | | | | | | |
No major discovery or other favorable or adverse event has caused a significant change in estimated gas reserves since year-end 2008. We have not filed on a recurring basis estimates of our total proved net oil and gas reserves with any U.S. regulatory authority or agency other than the Department of Energy (DOE) and the SEC. The estimates furnished to the DOE have been consistent with those furnished to the SEC, although Exploration & Production has not yet been required to file any information with respect to its estimated total reserves at December 31, 2008 with the DOE. Certain estimates filed with the DOE may not necessarily be directly comparable to those reported here due to special DOE reporting requirements, such as the requirement to report gross operated reserves only. In 2007 and 2006, the underlying estimated reserves for the DOE did not differ by more than 5 percent from the underlying estimated reserves utilized in preparing the estimated reserves reported to the SEC.
Approximately 99 percent of our year-end 2008 United States proved reserves estimates were audited in each separate basin by Netherland, Sewell & Associates, Inc. (NSAI). When compared on awell-by-well basis, some of our estimates are greater and some are less than the estimates of NSAI. However, in the opinion of NSAI, the estimates of our proved reserves are in the aggregate reasonable by basin and have been prepared in accordance with generally accepted petroleum engineering and evaluation principles. These principles are set forth in the Standards Pertaining to the Estimating and Auditing of Oil and Gas Reserve Information promulgated by the Society of Petroleum Engineers. NSAI is satisfied with our methods and procedures in preparing the December 31, 2008 reserve estimates and saw nothing of an unusual nature that would cause NSAI to take exception with the estimates, in the aggregate, as prepared by us. Reserve estimates related to properties underlying the Williams Coal Seam Gas Royalty Trust, which comprise approximately 1 percent of our total U.S. proved reserves, were prepared by Miller and Lents, LTD.
The SEC has revised its oil and gas reporting requirements effective for fiscal years ending on or after December 31, 2009, with early adoption prohibited. These changes include:
| | |
| • | Expanding the definition of oil and gas reserves and providing clarification of certain concepts and technologies used in the reserve estimation process. |
|
| • | Allowing optional disclosure of probable and possible reserves and permitting optional disclosure of price sensitivity analysis. |
|
| • | Modifying prices used to estimate reserves for SEC disclosure purposes to a12-month average price instead of asingle-day,period-end price. |
|
| • | Requiring certain additional disclosures around proved undeveloped reserves, internal controls used to ensure objectivity of the estimation process, and qualifications of those preparing and/or auditing the reserves. |
3
Oil and gas properties and reserves by basin
The table below summarizes 2008 activity and reserves for each of our areas, with further discussion following the table.
| | | | | | | | | | | | | | | | | | | | | | | | | | | | | |
| | | Wells
| | | Wells
| | | Wells
| | | Wells
| | | Wellhead
| | | Proved
| | | % of Total
| |
| | | Drilled
| | | Drilled
| | | Producing
| | | Producing
| | | Production
| | | Reserves
| | | Proved
| |
| | | (Gross) | | | (Operated) | | | (Gross) | | | (Net) | | | (Net Bcfe) | | | (Bcfe) | | | Reserves | |
| |
| Piceance | | | 687 | | | | 646 | | | | 3,163 | | | | 2,894 | | | | 238 | | | | 3,095 | | | | 71 | % |
| San Juan | | | 95 | | | | 37 | | | | 3,129 | | | | 852 | | | | 55 | | | | 523 | | | | 12 | % |
| Powder River | | | 703 | | | | 366 | | | | 5,407 | | | | 2,465 | | | | 84 | | | | 390 | | | | 9 | % |
| Mid-Continent | | | 82 | | | | 76 | | | | 672 | | | | 434 | | | | 25 | | | | 224 | | | | 5 | % |
| Other | | | 220 | | | | 0 | | | | 611 | | | | 21 | | | | 4 | | | | 107 | | | | 3 | % |
| | | | | | | | | | | | | | | | | | | | | | | | | | | | | |
| Total | | | 1,787 | | | | 1,125 | | | | 12,982 | | | | 6,666 | | | | 406 | | | | 4,339 | | | | 100 | % |
| | | | | | | | | | | | | | | | | | | | | | | | | | | | | |
Piceance basin
The Piceance basin is located in northwestern Colorado and is our largest area of concentrated development. During 2008 we operated an average of 26 drilling rigs in the basin. As of December 31, 2008, 15 of these rigs were the new high efficiency rigs designed to drill up to 22 wells from one location. This area has approximately 1,770 undrilled proved locations in inventory. Within this basin we own and operate natural gas gathering facilities including some 300 miles of gathering lines and associated field compression. Approximately 85 percent of the gas gathered is our own equity production. The gathering system also includes 7 processing plants and associated treating facilities with an eighth plant that came on-line in February 2009, for a total capacity of 1.25 Bcfd. During 2008, these plants recovered approximately 69 million gallons of natural gas liquids (NGLs) which were marketed separately from the residue natural gas.
San Juan basin
The San Juan basin is located in northwest New Mexico and southwest Colorado.
Powder River basin
The Powder River basin is located in northeast Wyoming. The Powder River basin includes large areas with multiple coal seam potential, targeting thick coal bed methane formations at shallow depths. We have a significant inventory of undrilled locations, providing long-term drilling opportunities.
Mid-Continent properties
The Mid-Continent properties are located in the southeastern Oklahoma portion of the Arkoma basin and the Barnett Shale in the Fort Worth basin of Texas.
Other properties
Other properties are primarily comprised of interests in the Green River basin in southwestern Wyoming. Also included is exploration activity and other miscellaneous activity.
The following table summarizes our leased acreage as of December 31, 2008:
| | | | | | | | | |
| | | Gross Acres | | | Net Acres | |
| |
| Developed | | | 981,853 | | | | 512,896 | |
| Undeveloped | | | 1,269,350 | | | | 661,568 | |
4
Operating statistics
We focus on lower-risk development drilling. Our development drilling success rate was approximately 99 percent in each of 2008, 2007 and 2006. The following table summarizes domestic drilling activity by number and type of well for the periods indicated:
| | | | | | | | | |
Number of Wells | | Gross Wells | | | Net Wells | |
| |
| Development: | | | | | | | | |
| Drilled | | | | | | | | |
| 2008 | | | 1,783 | | | | 1,050 | |
| 2007 | | | 1,590 | | | | 904 | |
| 2006 | | | 1,783 | | | | 954 | |
| Successful | | | | | | | | |
| 2008 | | | 1,782 | | | | 1,050 | |
| 2007 | | | 1,581 | | | | 899 | |
| 2006 | | | 1,770 | | | | 948 | |
We also successfully drilled four exploratory wells in 2008. In addition, two exploratory wells drilled in prior years were determined to be unsuccessful in 2008.
Because we currently have a low-risk drilling program in proven basins, the main component of risk that we manage is price risk. Exploration & Production natural gas hedges for 2009 domestic natural gas production consist of NYMEX fixed price contracts of106 MMcf/d (whole year) and approximately490 MMcf/d in regional collars (whole year). Our natural gas production hedges in 2008 consisted of70 MMcf/d in NYMEX fixed price hedges and434 MMcf/d in regional collars. A collar is an option contract that sets a gas price floor and ceiling for a certain volume of natural gas. Hedging decisions are made considering the overall Williams commodity risk exposure and are not executed independently by Exploration & Production; there are expected future gas purchases for other Williams entities that when taken as a net position may offset price risk related to Exploration & Production’s expected future gas sales. In February 2007, we entered into a five-year unsecured credit agreement with certain banks in order to reduce margin requirements related to our hedging activities as well as lower transaction fees. Margin requirements, if any, under this new facility are dependent on the level of hedging with the banks and on natural gas reserves value. In June 2008, we amended this agreement to extend the facility through year end 2013.
The following table summarizes our domestic sales and cost information for the years indicated:
| | | | | | | | | | | | | |
| | | 2008 | | | 2007 | | | 2006 | |
| |
| Total net production sold (in Bcfe) | | | 400.4 | | | | 333.1 | | | | 274.4 | |
| Average production costs including production taxes per (Mcfe) produced | | $ | 1.26 | | | $ | 0.98 | | | $ | 1.02 | |
| Average sales price per Mcfe | | $ | 6.39 | | | $ | 4.92 | | | $ | 5.24 | |
| Realized gain (loss) on hedging contracts | | $ | 0.09 | | | $ | 0.16 | | | $ | (0.73 | ) |
Acquisitions & divestitures
In January 2008, we sold a contractual right to a production payment on certain future international hydrocarbon production for $148 million. As a result of the contract termination, we have no further interests associated with the crude oil concession, which is located in Peru. We obtained these interests through our acquisition of Barrett Resources Corporation in 2001.
In May 2008, we acquired certain undeveloped leasehold acreage, producing properties and gathering facilities in the Piceance basin for $285 million. In July 2008, a third party exercised its contractual option to purchase, on the same terms and conditions, an interest in a portion of the acquired assets for $71 million. We received this $71 million in October 2008.
In September 2008, we increased our position in the Fort Worth basin by acquiring certain undeveloped leasehold acreage and producing properties for $147 million subject to post-closing adjustments. This acquisition is
5
consistent with our growth strategy of leveraging our horizontal drilling expertise by acquiring and developing low-risk properties in the Barnett Shale formation.
Through other transactions totaling approximately $111 million, Exploration & Production expanded its acreage position and producing properties in the Fort Worth basin in north-central Texas and also expanded its acreage position in the Highlands area of the Piceance basin and in the Paradox basin.
Other information
In 1993, Exploration & Production conveyed a net profits interest in certain of its properties to the Williams Coal Seam Gas Royalty Trust. Substantially all of the production attributable to the properties conveyed to the trust was from the Fruitland coal formation and constituted coal seam gas. We subsequently sold trust units to the public in an underwritten public offering and retained 3,568,791 trust units then representing 36.8 percent of outstanding trust units. We have previously sold trust units on the open market, with our last sales in June 2005. As of February 1, 2009, we own 789,291 trust units.
International exploration and production interests
We also have investments in international oil and gas interests. If combined with our domestic proved reserves, our international interests would make up approximately 3 percent of our total proved reserves.
Gas Pipeline Business
We ownWilliams Partners owns and operate,operates a combined total of approximately 14,00013,700 miles of pipelines with a total annual throughput of approximately 2,700 trillion British Thermal Units3,000 TBtu of natural gas andpeak-day delivery capacity of approximately 12 MMdt13 MMdth of natural gas. Gas Pipeline consistsOur gas pipeline businesses consist primarily of Transcontinental Gas Pipe Line Company, LLC (Transco) and Northwest Pipeline GP (Northwest Pipeline). Gas PipelineOur gas pipeline business also holds interests in joint venture interstate and intrastate natural gas pipeline systems including a 5049 percent interest in Gulfstream Natural Gas System, L.L.C. Gas Pipeline also includes WMZ.
(Gulfstream). Our gas pipeline businesses contributed revenues of approximately 21 percent, 24 percent and 30 percent oftotal revenues in 2011, 2010, and 2009, respectively.Transco
Transco is an interstate natural gas transportationtransmission company that owns and operates a 10,100-mile9,800-mile natural gas pipeline system extending from Texas, Louisiana, Mississippi and the offshore Gulf of Mexico through Alabama, Georgia, South Carolina, North Carolina, Virginia, Maryland, Pennsylvania, and New Jersey to the New York City metropolitan area. The system serves customers in Texas and 11 southeast and Atlantic seaboard states, including major metropolitan areas in Georgia, North Carolina, Washington, D.C., New York, New Jersey and Pennsylvania.
5
Pipeline system and customers
At December 31, 2008,2011, Transco’s system had a mainline delivery capacity of approximately 4.7 MMdt5.6 MMdth of natural gas per day from its production areas to its primary markets.markets, including delivery capacity from the mainline to locations on its Mobile Bay Lateral. Using its Leidy Line along with market-area storage and transportation capacity, Transco can deliver an additional 3.8 MMdt4.0 MMdth of natural gas per day for a system-wide delivery capacity total of approximately 8.5 MMdt9.6 MMdth of natural gas per day. Transco’s system includes 45 compressor stations, four underground storage fields, and a liquefied natural gas (LNG)an LNG storage facility. Compression facilities at sea level-rated capacity total approximately 1.5 million horsepower.
Transco’s major natural gas transportation customers are public utilities and municipalities that provide service to residential, commercial, industrial and electric generation end users. Shippers on Transco’s system include public utilities, municipalities, intrastate pipelines, direct industrial users, electrical generators, gas marketers and producers. One customer accounted for approximately 11 percent and another customer accounted for approximately 10 percent of Transco’s total revenues in 2008. Transco’s firm transportation agreements are generally long-term agreements with various expiration dates and account for the major portion of Transco’s business. Additionally, Transco offers storage services and interruptible transportation services under short-term agreements.
6
Transco has natural gas storage capacity in four underground storage fields located on or near its pipeline system or market areas and operates two of these storage fields. Transco also has storage capacity in an LNG storage facility that it owns and operates the facility.operates. The total usable gas storage capacity available to Transco and its customers in such underground storage fields and LNG storage facility and through storage service contracts is approximately 204 billion cubic feet200 Bcf of natural gas. At December 31, 2011, our customers had stored in our facilities approximately 164 Bcf of natural gas. In October 2008, the FERC approved Transco’s request to abandon its Hesteraddition, wholly owned subsidiaries of Transco operate and hold a 35 percent ownership interest in Pine Needle LNG Company, LLC, an LNG storage facility which is not in operation. Hester is not included in the capacity described above.with 4 Bcf of storage capacity. Storage capacity permits Transco’s customers to inject gas into storage during the summer and off-peak periods for delivery during peak winter demand periods.
Transco expansion projects
The pipeline projects listed below were completed during 2011 or are future significant pipeline projects for which we haveTransco has customer commitments.
Sentinel Expansion Project
The Sentinel Expansion Project involves an expansion of our existing natural gas transmission system from the Leidy Hub in Clinton County, Pennsylvania and from the Pleasant Valley interconnection with Cove Point LNG in Fairfax County, Virginia to various delivery points requested by the shippers under the project. The capital cost of the project is estimated to be up to approximately $200 million. Phase I was placed into service in December 2008. Phase II is expected to be placed into service by November 2009.
Mobile Bay South Expansion ProjectII
The Mobile Bay South II Expansion Project involvesinvolved the addition of compression at Transco’s Station 85 in Choctaw County, Alabama, and modifications to existing facilities at Transco’s Station 83 in Mobile County, Alabama, to allow Transco to provide additional firm transportation service southbound on the Mobile Bay line from Station 85 to various delivery points. The capital cost of the project is estimated to be up to approximately $37 million. Transco plans to place the projectwas placed into service byin May 2010.
2011 and provides incremental firm capacity of 380 Mdth/d.85 North Expansion Project
The 85 North Expansion Project involvesinvolved an expansion of ourTransco’s existing natural gas transmission system from Station 85 in Choctaw County, Alabama, to various delivery points as far north as North Carolina. The first phase was placed into service in July 2010 and provides incremental firm capacity of 90 Mdth/d, and the second phase was placed into service in May 2011 and provides incremental firm capacity of 219 Mdth/d.
Mid-South
The Mid-South Expansion Project involves an expansion of Transco’s mainline from Station 85 in Choctaw County, Alabama, to markets as far downstream as North Carolina. In August 2011, Transco
6
received approval from the FERC. The capital cost of the project is estimated to be $248approximately $217 million. Transco plans to place the project into service in phases in September 2012 and June 2013, and it is expected to increase capacity by 225 Mdth/d.
Mid-Atlantic Connector
The Mid-Atlantic Connector Project involves an expansion of Transco’s mainline from an existing interconnection in North Carolina to markets as far downstream as Maryland. In July 2010 and May 2011.
Operating statistics
2011, Transco received approval from the FERC. The following table summarizes transportation data for the Transco system for the periods indicated:
| | | | | | | | | | | | | |
| | | 2008 | | | 2007 | | | 2006 | |
| | | (In trillion British
| |
| | | Thermal Units) | |
| |
| Market-area deliveries: | | | | | | | | | | | | |
| Long-haul transportation | | | 753 | | | | 839 | | | | 795 | |
| Market-area transportation | | | 969 | | | | 875 | | | | 817 | |
| | | | | | | | | | | | | |
| Total market-area deliveries | | | 1,722 | | | | 1,714 | | | | 1,612 | |
| Production-area transportation | | | 188 | | | | 190 | | | | 247 | |
| | | | | | | | | | | | | |
| Total system deliveries | | | 1,910 | | | | 1,904 | | | | 1,859 | |
| | | | | | | | | | | | | |
| Average Daily Transportation Volumes | | | 5.2 | | | | 5.2 | | | | 5.1 | |
| Average Daily Firm Reserved Capacity | | | 6.8 | | | | 6.6 | | | | 6.6 | |
Transco’s facilities are divided into eight rate zones. Five are located in the production area, and three are located in the market area. Long-haul transportation involves gas that Transco receives in onecapital cost of the
production-area zonesproject is estimated to be approximately $55 million. Transco plans to place the project into service in November 2012, and
deliversit is expected to increase capacity by 142 Mdth/d.Northeast Supply Link
In December 2011, Transco filed an application with the FERC to expand its existing natural gas transmission system from the Marcellus Shale production region on the Leidy Line to various delivery points in New York and New Jersey. The capital cost of the project is estimated to be approximately $341 million. Transco plans to place the project into service in November 2013, and it is expected to increase capacity by 250 Mdth/d.
Rockaway Delivery Lateral
The Rockaway Delivery Lateral Project involves the construction of a three-mile offshore lateral to a market-area zone. Market-area transportationdistribution system in New York. Transco anticipates filing an application with the FERC in 2012. The capital cost of the project is estimated to be approximately $182 million. Transco plans to place the project into service as early as April 2014, and its capacity is expected to be 647 Mdth/d.
Northeast Connector
The Northeast Connector Project involves expansion of Transco’s existing natural gas thattransmission system from southeastern Pennsylvania to the proposed Rockaway Delivery Lateral. Transco both receivesanticipates filing an application with the FERC in 2012. The capital cost of the project is estimated to be approximately $39 million. Transco plans to place the project into service as early as April 2014, and
7
delivers within the market-area zones. Production-area transportation involves gas that Transco both receives and delivers within the production-area zones.
Northwest Pipeline
Northwest Pipeline is an interstate natural gas transportationtransmission company that owns and operates a natural gas pipeline system extending from the San Juan basin in northwestern New Mexico and southwestern Colorado through Colorado, Utah, Wyoming, Idaho, Oregon, and Washington to a point on the Canadian border near Sumas, Washington. Northwest Pipeline provides services for markets in California, Arizona, New Mexico, Colorado, Utah, Nevada, Wyoming, Idaho, Oregon, and Washington directly or indirectly through interconnections with other pipelines.
Pipeline system and customers
At December 31, 2008,2011, Northwest Pipeline’s system, having long-term firm transportation agreements including peaking service of approximately 3.6 Bcf of natural gas per day,3.8 MMdth/d, was composed of approximately 3,900 miles of mainline and lateral transmission pipelines and 41 transmission compressor stations having a combined sea level-rated capacity of approximately 473,000477,000 horsepower.
In 2008, 7
Northwest Pipeline served a total of 136 transportationtransports and storage customers. We transport and storestores natural gas for a broad mix of customers, including local natural gas distribution companies, municipal utilities, direct industrial users, electric power generators and natural gas marketers and producers. The largest customer of Northwest Pipeline in 2008 accounted for approximately 20.7 percent of its total operating revenues. No other customer accounted for more than 10 percent of Northwest Pipeline’s total operating revenues in 2008. Northwest Pipeline’s firm transportation and storage contracts are generally long-term contracts with various expiration dates and account for the major portion of Northwest Pipeline’s business. Additionally, Northwest Pipeline offers interruptible and short-term firm transportation service.
As a part of its transportation services, Northwest Pipeline utilizesowns a one-third interest in the Jackson Prairie underground storage facilitiesfacility in UtahWashington and Washington enabling it to balance daily receipts and deliveries.contracts with a third party for storage service in the Clay basin underground field in Utah. Northwest Pipeline also owns and operates an LNG storage facility in Washington that provides service for customers during a few days of extreme demands.Washington. These storage facilities have an aggregate working gas storage capacity of 13 Bcf of natural gas, which is substantially utilized for third-party natural gas, and firm delivery capability of approximately 700 MMcf/d enable Northwest Pipeline to provide storage services to its customers and to balance daily receipts and deliveries.
Northwest Pipeline expansion project
North and South Seattle Lateral Delivery Expansions
Northwest Pipeline has executed agreements with a customer to expand the North and South Seattle laterals and provide additional lateral capacity of approximately 700 MMcf84 Mdth/d and 74 Mdth/d, respectively. The total estimated cost of gas per day.
Northwest Pipeline expansion projects
The pipeline projects listed below were completed during 2008 or are future pipeline projects for which we have customer commitments.
Colorado Hub Connection Project
Northwest Pipeline has proposed installing a new27-mile,24-inch diameter lateral to connect the Meeker/White River Hub near Meeker, Colorado to its mainline near Sand Springs, Colorado. This project is referred to as the Colorado Hub Connection (CHC Project). Itbetween $28 and $30 million. North Seattle is estimated that the construction of the CHC Project will cost up to $60 million withcurrently targeted for service in fall 2012 and South Seattle is currently targeted to commencefor service in November 2009. Northwest Pipeline will combine the lateral capacity with 341 MDth per day of existing mainline capacity from various receipt points for delivery to Ignacio, Colorado, including approximately 98 MDth per day of capacity that was sold on a short-term basis. Approximately 243 MDth per day of this capacity is held by Pan-Alberta Gas under a contract that terminates on October 31, 2012.
In addition to providing greater opportunity for contract extensions for the short-term firm and Pan-Alberta capacity, the CHC Project provides direct access to additional natural gas supplies at the Meeker/White River Hub for Northwest Pipeline’s on-system and off-system markets. Northwest Pipeline has entered into precedent agreements with terms ranging between eight and fifteen years at maximum rates for all of the short-term firm and Pan-Alberta capacity resulting in the successful re-contracting of the capacity out to 2018 and beyond. In September 2008, Northwest Pipeline filed an application for FERC certification and is awaiting necessary regulatory approvals. If Northwest Pipeline does not proceed with the CHC Project, Northwest
8
GulfstreamPipeline will seek recovery of any shortfall in annual capacity reservation revenues from our remaining customers in a future rate proceeding. Northwest Pipeline does expect to collect maximum rates for the new CHC Project capacity commitments and seek approval to recover the CHC Project costs in any future rate case filed with the FERC.
Sundance Trail Expansion
In February 2008, Northwest Pipeline initiated an open season for the proposed Sundance Trail Expansion project that resulted in the execution of an agreement for 150 MDth per day of firm transportation service from the Meeker/White River Hub in Colorado for delivery to the Opal Hub in Wyoming. The project will include construction of approximately 16 miles of30-inch loop between Northwest Pipeline’s existing Green River and Muddy Creek compressor stations in Wyoming as well as an upgrade to Northwest Pipeline’s existing Vernal compressor station, with service targeted to commence in November 2010. The total project is estimated to cost up to $65 million, including the cost of replacing existing compression at the Vernal compressor station which will enhance the efficiency of Northwest Pipeline’s system. The Sundance Trail Expansion will utilize available capacity on the CHC lateral and the existing Piceance lateral in conjunction with available and expanded mainline capacity. The Sundance Trail Expansion remains subject to certain conditions, including receiving the necessary regulatory approvals. Northwest Pipeline expects to collect maximum system rates, and will seek approval to roll-in the Sundance Trail Expansion costs in any future rate case filed with the FERC.
Operating statistics
The following table summarizes volume and capacity data for the Northwest Pipeline system for the periods indicated:
| | | | | | | | | | | | | |
| | | 2008 | | | 2007 | | | 2006 | |
| | | (In trillion British
| |
| | | Thermal Units) | |
| |
| Total Transportation Volume | | | 781 | | | | 757 | | | | 676 | |
| Average Daily Transportation Volumes | | | 2.1 | | | | 2.1 | | | | 1.8 | |
| Average Daily Reserved Capacity Under Long-Term Base Firm Contracts, excluding peak capacity | | | 2.5 | | | | 2.5 | | | | 2.5 | |
| Average Daily Reserved Capacity Under Short-Term Firm Contracts(1) | | | .7 | | | | .8 | | | | .9 | |
| | |
(1) | | Consists primarily of additional capacity created from time to time through the installation of new receipt or delivery points or the segmentation of existing mainline capacity. Such capacity is generally marketed on a short-term firm basis. |
Gulfstream Natural Gas System, L.L.C. (Gulfstream)
Gulfstream is a natural gas pipeline system extending from the Mobile Bay area in Alabama to markets in Florida.
Gas PipelineWilliams Partners owns, through a subsidiary, a 49 percent interest in Gulfstream while we own an additional 1 percent interest through a subsidiary in Other. Spectra Energy Corporation, through its subsidiary, and Spectra Energy
through their respective subsidiaries, each holds aPartners, LP, own the other 50 percent
ownership interest ininterest. Williams Partners shares operating responsibilities for Gulfstream
and provides operating services for Gulfstream. At December 31, 2008, our equity investment in with Spectra Energy Corporation.Gulfstream Phase V
The Gulfstream Phase V expansion involved the addition of compression to provide 35 Mdth/d of incremental firm transportation capacity. The expansion was $525 million.
Gulfstream expansion projects
Gulfstream placed the Phase III expansion project in service on September 1, 2008. The project extended the pipeline system into South Florida and fully subscribed the remaining 345 Mdt/d of firm capacity on the existing pipeline system on a long-term basis. The estimated capital cost of this project is $118 million, with Gas Pipeline’s share being 50 percent of such costs. Service under the Gulfstream Phase IV expansion project began during the fourth quarter of 2008. The project is fully subscribed on a long-term basis and is the first incremental expansion of Gulfstream’s mainline capacity. The estimated capital cost of this expansion is $192 million, with Gas Pipeline’s share being 50 percent of such costs.
9
Midstream BusinessWMZ
WMZ was formed to own and operate natural gas transportation and storage assets. We currently own an approximate 45.7 percent limited partnership interest and a 2 percent general partner interest in WMZ. WMZ provides us with lower cost of capital that is expected to enable growth of our Gas Pipeline business. WMZ also creates a vehicle to monetize our qualifying assets. Such transactions, which are subject to approval by the boards of directors of Williams and WMZ’s general partner, allow us to retain control of the assets through our ownership interest in WMZ. A subsidiary of ours, Williams Pipeline GP LLC, serves as the general partner of WMZ. The initial asset of WMZ is a 35 percent interest in Northwest Pipeline.
Midstream Gas & Liquids
Our Midstream segment,Partners’ midstream business, one of the nation’s largest natural gas gatherers and processors, has primary service areas concentrated in major producing basins in Colorado, New Mexico, Wyoming, the Gulf of Mexico, Venezuela and western Canada. Midstream’sPennsylvania. The primary businesses —are: (1) natural gas gathering, treating, and processing; (2) NGL fractionation, storage and transportation; and (3) oil transportation —transportation. These fall within the middle of the process of taking raw natural gas and crude oil from the wellheadproducing fields to the consumer. NGLs, ethylene and propylene are extracted/produced at our plants, including our Canadian and Gulf Coast olefins plants. These products are used primarily for the manufacture of petrochemicals, home heating fuels and refinery feedstock.
Some of our assets are owned through our interest in WPZ.
Key variables for ourthis business will continue to be:
Retaining and attracting customers by continuing to provide reliable services;
Revenue growth associated with additional infrastructure either completed or currently under construction;
| | |
| • | Retaining and attracting customers by continuing to provide reliable services; |
|
| • | Revenue growth associated with additional infrastructure either completed or currently under construction; |
|
| • | Disciplined growth in our core service areas and new step-out areas; |
|
| • | Prices impacting our commodity-based processing and olefin activities. |
Disciplined growth in core service areas and new step-out areas;
Prices impacting commodity-based activities.
The midstream business revenue contributed approximately 75 percent, 72 percent, and 65 percent of Williams Partners’ revenues in 2011, 2010, and 2009, respectively.
8
Domestic gathering,Gathering, processing and treating
Our domesticWilliams Partners’ gathering systems receive natural gas from producers’ oil and natural gas wells and gather these volumes to gas processing, treating or redelivery facilities. Typically, natural gas, in its raw form, is not acceptable for transportation in major interstate natural gas pipelines or for commercial use as a fuel. Williams Partners’ treating facilities remove water vapor, carbon dioxide, and other contaminants and collect condensate, but do not extract NGLs. Williams Partners’ is generally paid a fee based on the volume of natural gas gathered and/or treated, generally measured in the BTU heating value.
In addition, natural gas contains various amounts of NGLs, which generally have a higher value when separated from the natural gas stream. Our processing and treating plants removeextract the NGLs in addition to removing water vapor, carbon dioxide, and other contaminants and our processing plants extract the NGLs.contaminants. NGL products include:
| | |
| • | Ethane, primarily used in the petrochemical industry as a feedstock for ethylene production, one of the basic building blocks for plastics; |
|
| • | Propane, used for heating, fuel and as a petrochemical feedstock in the production of ethylene and propylene, another building block for petrochemical-based products such as carpets, packing materials and molded plastic parts; |
|
| • | Normal butane, iso-butane and natural gasoline, primarily used by the refining industry as blending stocks for motor gasoline or as a petrochemical feedstock. |
Although a significant portionfeedstock for ethylene production, one of ourthe basic building blocks for plastics;
Propane, used for heating, fuel and as a petrochemical feedstock in the production of ethylene and propylene, another building block for petrochemical-based products such as carpets, packing materials, and molded plastic parts;
Normal butane, iso-butane and natural gasoline, primarily used by the refining industry as blending stocks for motor gasoline or as a petrochemical feedstock.
Our gas processing services are performed for a volumetric-based fee, a portion of our gas processing agreements are commodity-based and include two distinctgenerate revenues primarily from the following three types of commodity exposure. The first type includes “keep whole” processing agreements whereby we owncontracts:
Fee-based: We are paid a fee based on the rightsvolume of natural gas processed, generally measured in the BTU heating value. Our customers are entitled to the value from NGLs recovered atproduced in connection with this type of processing agreement. For the year ended December 31, 2011, 59 percent of the NGL production volumes were under fee-based contracts.
Keep-whole: Under keep-whole contracts, we (1) process natural gas produced by customers, (2) retain some or all of the extracted NGLs as compensation for our plants and have the obligation toservices, (3) replace the lost heating valueBTU content of the retained NGLs that were extracted during processing with natural gas.gas purchases, also known as shrink replacement gas and (4) deliver an equivalent BTU content of natural gas for customers at the plant outlet. NGLs we retain in connection with this type of processing agreement are referred to as our equity NGL production. Under these agreements, we are exposedhave commodity exposure to the spreaddifference between NGL prices and natural gas prices. The second type consistsFor the year ended December 31, 2011, 38 percent of “percentthe NGL production volumes were under keep-whole contracts.
Percent-of-Liquids: Under percent-of-liquids processing contracts, we (1) process natural gas produced by customers, (2) deliver to customers an agreed-upon percentage of liquids” agreements whereby we receivethe extracted NGLs, (3) retain a portion of the extracted liquids with no direct exposureNGLs as compensation for our services and (4) deliver natural gas to customers at the priceplant outlet. Under this type of natural gas. Under these agreements,contract, we are not required to replace the BTU content of the retained NGLs that were extracted during processing, and are therefore only exposed to NGL price movements. NGLs we retain in
10
connection with these typesthis type of processing agreementsagreement are also referred to as our equity NGL production. For the year ended December 31, 2011, 3 percent of the NGL production volumes were under percent-of-liquids contracts.
Our gathering and processing agreements have terms ranging frommonth-to-month to the life of the producing lease. Generally, our gathering and processing agreements are long-term agreements.
Our domesticDemand for gas gathering and processing services is dependent on producers’ drilling activities, which is impacted by the strength of the economy, natural gas prices, and the resulting demand for natural gas by manufacturing and industrial companies and consumers. Williams Partners’ gas gathering and processing customers are generally natural gas producers who have provedand/or producing natural gas fields in the areas
9
surrounding ourits infrastructure. During 2008, these operations2011, Williams Partners’ facilities gathered and processed gas for approximately 230210 gas gathering and processing customers. OurWilliams Partners’ top six5 gathering and processing customers accounted for aboutapproximately 50 percent of our domestic gathering and processing revenue.
Demand for our equity NGLs is affected by economic conditions and the resulting demand from industries using these commodities to produce petrochemical-based products such as plastics, carpets, packing materials and blending stocks for motor gasoline and the demand from consumers using these commodities for heating and fuel. NGL products are currently the preferred feedstock for ethylene and propylene production, which has been shifting away from the more expensive crude-based feedstocks.
Geographically, the midstream natural gas assets are positioned to maximize commercial and operational synergies with our other assets. For example, most of the offshore gathering and processing assets attach and process or condition natural gas supplies delivered to the Transco pipeline. Our San Juan basin, southwest Wyoming and Piceance systems are capable of delivering residue gas volumes into Northwest Pipeline’s interstate system in addition to third-party interstate systems. Our gathering system in Pennsylvania delivers residue gas volumes into Transco’s pipeline in addition to third-party interstate systems.
Williams Partners owns and operates gas gathering, processing and treating assets within the states of Wyoming, Colorado, New Mexico, and Pennsylvania. We also own and operate gas gathering and processing assets and pipelines primarily within the onshore, offshore shelf, and deepwater areas in and around the Gulf Coast states of Texas, Louisiana, Mississippi, and Alabama.
The following table summarizes our significant operated natural gas gathering assets as of December 31, 2011:
| | | | | | | | | | | | | | | | |
| | | Natural Gas Gathering Assets |
| | | Location | | Pipeline
Miles | | | Inlet
Capacity
(Bcf/d) | | | Ownership
Interest | | | Supply Basins |
Onshore | | | | | | | | | | | | | | | | |
Rocky Mountain | | Wyoming | | | 3,587 | | | | 1.1 | | | | 100 | % | | Wamsutter & SW Wyoming |
Four Corners | | Colorado & New Mexico | | | 3,823 | | | | 1.8 | | | | 100 | % | | San Juan |
Piceance | | Colorado | | | 328 | | | | 1.4 | | | | 100 | % | | Piceance |
NE Pennsylvania | | Pennsylvania | | | 75 | | | | 0.7 | | | | 100 | % | | Appalachian |
Laurel Mountain (1) | | Pennsylvania | | | 1,386 | | | | 0.2 | | | | 51 | % | | Appalachian |
Gulf Coast | | | | | | | | | | | | | | | | |
Canyon Chief & Blind Faith | | Deepwater Gulf of Mexico | | | 139 | | | | 0.4 | | | | 100 | % | | Eastern Gulf of Mexico |
Seahawk | | Deepwater Gulf of Mexico | | | 115 | | | | 0.4 | | | | 100 | % | | Western Gulf of Mexico |
Perdido Norte | | Deepwater Gulf of Mexico | | | 105 | | | | 0.3 | | | | 100 | % | | Western Gulf of Mexico |
Offshore shelf & other | | Gulf of Mexico | | | 46 | | | | 0.2 | | | | 100 | % | | Eastern Gulf of Mexico |
Offshore shelf & other | | Gulf of Mexico | | | 245 | | | | 0.9 | | | | 100 | % | | Western Gulf of Mexico |
Discovery (1) | | Gulf of Mexico | | | 319 | | | | 0.6 | | | | 60 | % | | Central Gulf of Mexico |
(1) | Statistics reflect 100 percent of the assets from the equity method investments that we operate, however our financial statements report equity method income from these investments based on our equity ownership percentage. |
(2) | In the first quarter of 2012, our Springville gathering pipeline was put into service, initially providing an optional takeaway for 0.3 Bcf/d of gas gathered on our system in northeast Pennsylvania. Also in the first quarter of 2012, 0.3 Bcf/d of capacity was added from the Laser gathering system acquisition. |
10
In addition we own and operate several natural gas treating facilities in New Mexico, Colorado, Texas and Louisiana which bring natural gas to specifications allowable by major interstate pipelines. At our Milagro treating facility, we also use gas-driven turbines to produce approximately 60 mega-watts per day of electricity which we primarily sell into the local electrical grid.
The following table summarizes our significant operated natural gas processing facilities as of December 31, 2011:
| | | | | | | | | | | | | | | | |
| | | Natural Gas Processing Facilities |
| | | Location | | Inlet
Capacity
(Bcf/d) | | | NGL
Production
Capacity
(Mbbls/d) | | | Ownership
Interest | | | Supply Basins |
Onshore | | | | | | | | | | | | | | | | |
Opal | | Opal, WY | | | 1.5 | | | | 67 | | | | 100 | % | | SW Wyoming |
Echo Springs | | Echo Springs, WY | | | 0.7 | | | | 58 | | | | 100 | % | | Wamsutter |
Ignacio | | Ignacio, CO | | | 0.5 | | | | 23 | | | | 100 | % | | San Juan |
Kutz | | Bloomfield, NM | | | 0.2 | | | | 12 | | | | 100 | % | | San Juan |
Lybrook (2) | | Lybrook, NM | | | 0.1 | | | | 6 | | | | 100 | % | | San Juan |
Willow Creek | | Rio Blanco County, CO | | | 0.5 | | | | 30 | | | | 100 | % | | Piceance |
Parachute | | Garfield County, CO | | | 1.4 | | | | 7 | | | | 100 | % | | Piceance |
Gulf Coast | | | | | | | | | | | | | | | | |
Markham | | Markham, TX | | | 0.5 | | | | 45 | | | | 100 | % | | Western Gulf of Mexico |
Mobile Bay | | Coden, AL | | | 0.7 | | | | 30 | | | | 100 | % | | Eastern Gulf of Mexico |
Discovery (1) | | Larose, LA | | | 0.6 | | | | 32 | | | | 60 | % | | Central Gulf of Mexico |
(1) | Statistics reflect 100 percent of the assets from the equity method investments that we operate, however our financial statements report equity method income from these investments based on our equity ownership percentage. |
(2) | Our Lybrook plant has been idled as of January 2012. Gas previously processed at Lybrook has been redirected to our Ignacio plant. |
Crude oil transportation and production handling assets
In addition to our natural gas assets, we own and operate threefour deepwater crude oil pipelines and aown production platforms serving the deepwater floating production platform in the Gulf of Mexico. Our crude oil transportation revenues are typically volumetric-based fee arrangements. However, a substantial portion of our marketing revenues are recognized from purchase and sale arrangements whereby we purchase oil from producers at the receipt points of our crude oil pipelines for an index-based price and sell the oil back to the producers at delivery points atthat we transport is purchased and sold as a function of the same index-based price. Our offshore floating production platform providesplatforms provide centralized services to deepwater producers such as compression, separation, production handling, water removal and pipeline landings. Revenue sources have historically included a combination of fixed-fee, volumetric-based fee and cost reimbursement arrangements. Fixed fees associated with the resident production at our Devils Tower facility are recognized on a unitsunits-of-production basis.
The following table summarizes our significant crude oil transportation pipelines as of December 31, 2011:
| | | | | | | | | | | | | | |
| | | Crude Oil Pipelines |
| | | Pipeline
Miles | | | Handling
Capacity
(Mbbls/d) | | | Ownership
Interest | | | Supply Basins |
Mountaineer & Blind Faith | | | 155 | | | | 150 | | | | 100 | % | | Eastern Gulf of Mexico |
BANJO | | | 57 | | | | 90 | | | | 100 | % | | Western Gulf of Mexico |
Alpine | | | 96 | | | | 85 | | | | 100 | % | | Western Gulf of Mexico |
Perdido Norte | | | 74 | | | | 150 | | | | 100 | % | | Western Gulf of Mexico |
11
The following table summarizes our production basis.
Geographically, our Midstream natural gas assets are positioned to maximize commercial and operational synergies with our other assets. For example, mosthandling platforms as of our offshore gathering and processing assets attach and process or condition natural gas supplies delivered to the Transco pipeline. Also, our gathering and processing facilities in the San Juan Basin handle about 87 percent of our Exploration & Production group’s wellhead production in this basin. Both our San Juan Basin and Southwest Wyoming systems deliver residue gas volumes into Northwest Pipeline’s interstate system in addition to third party interstate systems.
West Region domestic gathering, processing and treating
We ownand/or operate domestic gas gathering, processing and treating assets within the western states of Wyoming, Colorado and New Mexico.
In the Rocky Mountain area, our assets include:
December 31, 2011: | | | | | | | | | | | | | | |
| | | Production Handling Platforms |
| | | Gas Inlet
Capacity
(MMcf/d) | | | Crude/NGL
Handling
Capacity
(Mbbls/d) | | | Ownership
Interest | | | Supply Basins |
Devils Tower | | | 210 | | | | 60 | | | | 100 | % | | Eastern Gulf of Mexico |
Canyon Station | | | 500 | | | | 16 | | | | 100 | % | | Eastern Gulf of Mexico |
Discovery Grand Isle 115 (1) | | | 150 | | | | 10 | | | | 60 | % | | Central Gulf of Mexico |
(1) | | |
| • | Approximately 3,500 milesStatistics reflect 100 percent of gathering pipelines serving the Wamsutter and southwest Wyoming areas in Wyoming; |
|
| • | Opal and Echo Springs processing plants with a combined daily inlet capacity of over1,800 MMcf/d and NGL processing capacity of nearly 100 Mbbls/d. |
In the Four Corners area, our assets include:
| | |
| • | Approximately 3,800 miles of gathering pipelines serving the San Juan Basin in New Mexico and Colorado; |
|
| • | Ignacio, Kutz and Lybrook processing plants with a combined daily inlet capacity of765 MMcf/d and NGL processing capacity of approximately 40 Mbbls/d; |
|
| • | Milagro and Esperanza natural gas treating plants, which remove carbon dioxide but do not extract NGLs, with a combined daily inlet capacity of750 MMcf/d. At our Milagro facility, we also use the steam generated by gas-driven turbines to produce approximately 60 mega-watts per day of electricity which we primarily sell into the local electrical grid. |
As we enter the Piceance Basin in Colorado, our initial infrastructure includes:
| | |
| • | Parachute Lateral, a38-mile,30-inch diameter line transporting gas from the Parachute area to the Greasewood Hub and White River Hub in northwest Colorado. Our new Willow Creek processing plant (see expansion projects below) will process gas flowing through the Parachute Lateral in addition to processing gasequity method investments that we operate, however our financial statements report equity method income from other sources. In an arrangement approved by the FERC, Midstream is leasing thethese investments based on our equity ownership percentage. |
11
| | |
| | pipeline to Gas Pipeline, who will continue to operate the Parachute Lateral until completion of a planned FERC abandonment filing; |
| | |
| • | PGX pipeline delivering NGLs previously transported by truck from Exploration & Production’s existing Parachute area processing plants to a major NGL transportation pipeline system. |
West region expansion projects
Our two major expansion projects include the new Willow Creek facility and additional capacity at our Echo Springs facility.
| | |
| • | The Willow Creek processing plant is a450 MMcf/d cryogenic natural gas processing plant in western Colorado’s Piceance Basin, where Exploration & Production has its most significant volume of natural gas production, reserves and development activity. The plant is designed to recover 25 Mbbls/d of NGLs and the plant’s inlet processing capacity is expected to be full atstart-up expected in late 2009. |
|
| • | We expect to significantly increase the processing and NGL production capacities at our Echo Springs cryogenic natural gas processing plant in Wyoming. The addition of a fourth cryogenic processing train will add approximately350 MMcf/d of processing capacity and 30 Mbbls/d of NGL production capacity, nearly doubling Echo Spring’s capacities in both cases. We expect to begin construction on the fourth train at Echo Springs during the second half of 2009 and to bring the additional capacity online during late 2010, subject to all applicable permitting. |
Gulf region domestic gathering, processing and treating
We ownand/or operate domestic gas gathering and processing assets and crude oil pipelines primarily within the onshore and offshore shelf and deepwater areas in and around the Gulf Coast states of Texas, Louisiana, Mississippi and Alabama. We own:
| | |
| • | Over 700 miles of onshore and offshore natural gas gathering pipelines, including: |
| | |
| • | The115-mile deepwater Seahawk gas pipeline in the western Gulf of Mexico, flowing into our Markham processing plant and serving the Boomvang and Nansen field areas; |
|
| • | The139-mile Canyon Chief gas pipeline, now including the new37-mile Blind Faith extension, in the eastern Gulf of Mexico, flowing into our Mobile Bay processing plant and serving the Devils Tower, Triton, Goldfinger, Bass Lite and Blind Faith fields; |
| | |
| • | Mobile Bay, Markham, and Cameron Meadows processing plants with a combined daily inlet capacity of nearly1,500 MMcf/d and NGL handling capacity of 65 Mbbls/d; |
|
| • | Canyon Station offshore gas production system fixed-leg platform, which brings natural gas to specifications allowable by major interstate pipelines but does not extract NGLs, with a daily inlet capacity of500 MMcf/d; |
|
| • | Three deepwater crude oil pipelines with a combined length of 300 miles and capacity of 300 Mbbls/d including: |
| | |
| • | BANJO pipeline running parallel to the Seahawk gas pipeline delivering production from two producer-owned spar-type floating production systems; and delivering production to our shallow-water platform at Galveston Area Block A244 (GA-A244) and then onshore through ExxonMobil’s Hoover Offshore Oil Pipeline System (HOOPS); |
|
| • | Alpine pipeline in the central Gulf of Mexico, serving the Gunnison field, and delivering production to GA-A244 and then onshore through HOOPS under a joint tariff agreement; |
|
| • | Mountaineer oil pipeline which connects to similar production sources as our Canyon Chief pipeline and, now including the new Blind Faith extension, ultimately delivering production to ChevronTexaco’s Empire Terminal in Plaquemines Parish, Louisiana; |
| | |
| • | Devils Tower floating production platform located in Mississippi Canyon Block 773, approximately 150 miles south-southwest of Mobile, Alabama and serving production from the Devils Tower, Triton, Goldfinger and Bass Lite fields. Located in 5,610 feet of water, it is one of the world’s deepest dry tree |
12
| | |
| | spars. The platform, which is operated by ENI Petroleum on our behalf, is capable of handling210 MMcf/d of natural gas and 60 Mbbls/d of oil. |
Gulf region expansion projects
The deepwater Gulf continues to be an attractive growth area for our Midstream business. Since 1997, we have invested over $1.5 billion in new midstream assets in the Gulf of Mexico. These facilities provide both onshore and offshore services through pipelines, platforms and processing plants. The new facilities could also attract incremental gas volumes to Transco’s pipeline system in the southeastern United States.
Our current major expansion projects in the Gulf region include:
| | |
| • | In the deepwater of the Gulf of Mexico, we completed construction of37-mile extensions of both of our oil and gas pipelines from our Devils Tower spar to the Blind Faith discovery located in Mississippi Canyon in the eastern deepwater of the Gulf of Mexico. The pipelines have been commissioned and production began flowing in the fourth quarter of 2008; |
|
| • | In the western deepwater of the Gulf of Mexico, we continued construction activities on our Perdido Norte project which will include an expansion of our onshore Markham gas processing facility and oil and gas lines that would expand the scale of our existing infrastructure. |
Venezuela
Our Venezuelan investments involve gas compression and an equity interest in a gas processing and NGL fractionation operation. We own controlling interests and operate three gas compressor facilities which provide roughly 65 percent of the gas injections in eastern Venezuela. These facilities help stabilize the reservoir and enhance the recovery of crude oil by re-injecting natural gas at high pressures. The three gas compressor facilities, owned within two of our Venezuelan subsidiaries, had a net book value of $324 million at December 31, 2008 and are held as security on $177 million of non-recourse debt at December 31, 2008. We own controlling interests of 70% and 66.67% in these two subsidiaries.
Our Venezuelan assets were constructed and are currently operated for the exclusive benefit of the Venezuelan state-owned oil company, Petróleos de Venezuela S.A. under long-term contracts. These significant contracts have a remaining term between 9 and 12 years and our revenues are based on a combination of fixed capital payments, throughput volumes and, in the case of one of the gas compression facilities, a minimum throughput guarantee. The Venezuelan government continues its public criticism of U.S. economic and political policy, has implemented unilateral changes to existing energy related contracts, and has expropriated privately held assets within the energy and telecommunications sector. The continued threat of nationalization of certain energy-related assets in Venezuela could have a material negative impact on our results of operations. The economic situation resulting from lower commodity prices could jeopardize the Venezuelan oil industry and may further exacerbate political tension in Venezuela. We may not receive adequate compensation, or any compensation, if our assets in Venezuela are nationalized.
We also own a 49.25 percent interest in Accroven SRL which includes two400 MMcf/d NGL extraction plants, a 50 Mbbls/d NGL fractionation plant and associated storage and refrigeration facilities. Our equity investment had a book value of $69 million at December 31, 2008.
Olefins
In the Gulf of Mexico region, we own a10/12 interest in and are the operator of an ethane cracker at Geismar, Louisiana, with a total production capacity of 1.3 billion pounds of ethylene and 90 million pounds of propylene per year. Our feedstock for the ethane cracker is ethane and propane; as a result, we are exposed to the price spread between ethane and propane, and ethylene and propylene. We also own ethane and propane pipeline systems and a refinery grade propylene splitter with a production capacity of approximately 500 million pounds per year of propylene and its related pipeline system in Louisiana. At our propylene splitter, we purchase refinery grade propylene and fractionate it into polymer grade propylene and propane; as a result we are exposed to the price spread between those commodities.
13
Our Canadian operations include an olefin liquids extraction plant located near Ft. McMurray, Alberta and an olefin fractionation facility near Edmonton, Alberta. Our facilities extract olefinic liquids from the off-gas produced by a third party oil sands bitumen upgrading process. Our arrangement with the third-party upgrade is a “keep whole” type where we remove a mix of NGLs and olefins from the off-gas and return the equivalent heating value back to the third party in the form of natural gas. We then fractionate, treat, store, terminal and sell the propane, propylene, butane, butylenes and condensate recovered from this process. Our commodity price exposure is the spread between the price for natural gas and the NGL and olefin products we produce. We continue to be the only olefins fractionator in western Canada and the only treater/processor of oil sands upgrader off-gas. These operations extract petrochemical feedstocks from upgrader off-gas streams allowing the upgraders to burn cleaner natural gas streams and reduce overall air emissions. The extraction plant has processing capacity in excess of100 MMcf/d with the ability to recover in excess of 15 Mbbls/d of olefin and NGL products.
NGL and olefin marketing services
In addition to our gathering processing and olefin productionprocessing operations, we market NGLs and olefinNGL products to a wide range of users in the energy and petrochemical industries. The NGL marketing business transports and markets equity NGLs from the production at our domestic processing plants, and also markets NGLs on behalf of third-party NGL producers, including some of our fee-based processing customers, and the NGL volumes owned by Discovery Producer Services L.L.C.LLC (Discovery). The NGL marketing business bears the risk of price changes in these NGL volumes while they are being transported to final sales delivery points. In order to meet sales contract obligations, we may purchase products in the spot market for resale. TheOther than a long-term agreement to sell our equity NGLs transported on Overland Pass Pipeline to ONEOK Hydrocarbon L.P., the majority of domestic sales are based on supply contracts of one year or less in duration. The production fromSales to ONEOK Hydrocarbon L.P., accounted for 17 percent, 15 percent, and 9 percent of our Canadian facilities is marketedconsolidated revenues in Canada2011, 2010, and in the United States.
2009, respectively.Other operations
We own interests inand/or operate NGL fractionation and storage assets. These assets include two partially owneda 50 percent interest in an NGL fractionation facilities: onefacility near Conway, Kansas, with capacity of slightly more than 100 Mbbls/d and the othera 31.45 percent interest in another fractionation facility in Baton Rouge, Louisiana, that havewith a combined capacity in excess of 16760 Mbbls/d. We also own approximately 20 million barrels of NGL storage capacity in central Kansas near Conway.
We own an equity interest in and operate the facilitiesapproximately 115 miles of Discovery Producer Services LLC and its subsidiary Discovery Gas Transmission Services LLC (collectively, Discovery) through our interest in WPZ. Discovery’s assets include a600 MMcf/d cryogenic natural gas processing plant near Larose, Louisiana, a32 Mbbl/NGL fractionator plant near Paradis, Louisiana and an offshore natural gas gathering and transportation systempipelines in the GulfHouston Shipping Channel area which transport a variety of Mexico.
products including ethane, propane and other products used in the petrochemical industry.We also own a 14.6 percent equity interest in Aux Sable Liquid Products L.P. (Aux Sable) and its Channahon, Illinois, gas processing and NGL fractionation facility near Chicago. The facility is capable of processing up to 2.1 Bcf/d of natural gas from the Alliance Pipeline system and fractionating approximately 87102 Mbbls/d of extracted liquids into NGL products.
Additionally, in June 2011, Aux Sable acquired an 80 MMcf/d gas conditioning plant and a 12-inch, 83-mile gas pipeline infrastructure in North Dakota that provides additional NGLs to Channahon from the Bakken Shale in the Williston basin.Operated Equity Investments
Discovery
We own a 60 percent equity interest in and operate the facilities of Discovery. Discovery’s assets include a 600 MMcf/d cryogenic natural gas processing plant near Larose, Louisiana, a 32 Mbbls/d NGL fractionator plant near Paradis, Louisiana, and an offshore natural gas gathering and transportation system in the Gulf of Mexico.
12
Laurel Mountain
We own a 51 percent interest in a joint venture, Laurel Mountain Midstream, LLC (Laurel Mountain), in the Marcellus Shale located in western Pennsylvania. Laurel Mountain’s assets, which we operate, include a gathering system of nearly 1,400 miles of pipeline with a capacity of approximately 230 MMcf/d. Laurel Mountain has a long-term, dedicated, volumetric-based fee agreement, with some exposure to natural gas prices, to gather the anchor customer’s production in the western Pennsylvania area of the Marcellus Shale. Construction is ongoing for numerous new pipeline segments and compressor stations, the largest of which is our Shamrock compressor station. The Shamrock compressor station currently has a capacity of 60 MMcf/d and is expandable to 350 MMcf/d.
Overland Pass Pipeline
We operate and own a 50 percent ownership interest in Overland Pass Pipeline Company LLC (OPPL). OPPL includes a 760-mile NGL pipeline from Opal, Wyoming, to the Mid-Continent NGL market center in Conway, Kansas, along with 150- and 125-mile extensions into the Piceance and Denver-Joules basins in Colorado, respectively. Our equity NGL volumes from our two Wyoming plants and our Willow Creek facility in Colorado are dedicated for transport on OPPL under a long-term transportation agreement. We plan to participate in the construction of a pipeline connection and capacity expansions expected to be complete in early 2013, to increase the pipeline’s capacity to the maximum of 255 Mbbls/d, to accommodate new volumes coming from the Bakken Shale in the Williston basin.
Operating statistics
The following table summarizes our significant operating statistics for Midstream:
| | | | | | | | | | | | | |
| | | 2008 | | | 2007 | | | 2006 | |
| |
| Volumes(1): | | | | | | | | | | | | |
| Domestic gathering (TBtu) | | | 1,013 | | | | 1,045 | | | | 1,181 | |
| Plant inlet natural gas (TBtu) | | | 1,311 | | | | 1,275 | | | | 1,222 | |
| Domestic NGL production (Mbbls/d)(2) | | | 154 | | | | 163 | | | | 152 | |
| Domestic NGL equity sales (Mbbls/d)(2) | | | 80 | | | | 92 | | | | 88 | |
| Crude oil gathering (Mbbls/d)(2) | | | 70 | | | | 80 | | | | 86 | |
| Canadian NGL equity sales (Mbbls/d)(2) | | | 7 | | | | 9 | | | | 8 | |
| Olefin (ethylene and propylene) sales (millions of pounds) | | | 1,605 | | | | 1,401 | | | | 988 | |
| | | | | | | | | | | | |
| | | 2011 | | | 2010 | | | 2009 | |
Volumes: (1) | | | | |
Gathering (Tbtu) | | | 1,377 | | | | 1,262 | | | | 1,370 | |
Plant inlet natural gas (Tbtu) | | | 1,592 | | | | 1,599 | | | | 1,342 | |
NGL production (Mbbls/d) (2) | | | 189 | | | | 178 | | | | 164 | |
NGL equity sales (Mbbls/d) (2) | | | 77 | | | | 80 | | | | 80 | |
Crude oil transportation (Mbbls/d) (2) | | | 105 | | | | 94 | | | | 109 | |
(1) | | |
(1) | | Excludes volumes associated with partially owned assets such as our Discovery and Laurel Mountain investments that are not consolidated for financial reporting purposes. |
|
(2) | | Annual Averageaverage Mbbls/d. |
Midstream Canada & Olefins
The Midstream Canada & Olefins segment consists of our Canadian midstream business and our domestic olefins business. The segment contributed revenues of approximately 17 percent, 16 percent and 14 percent of our consolidated revenues in 2011, 2010 and 2009, respectively.
Midstream Canada
Our Canadian operations include an oil sands off-gas processing plant located near Ft. McMurray, Alberta, and an NGL/olefin fractionation facility and butylene/butane splitter (B/B splitter) facility, both of which are located at Redwater, Alberta, which is near Edmonton, Alberta. We operate the Ft. McMurray area processing plant, while another party operates the Redwater facilities on our behalf. The B/B splitter was completed and placed into service in August 2010. Our Ft. McMurray area facilities extract liquids from the off-gas produced by a third-party oil sands bitumen upgrading process. Our arrangement with the third-party upgrader is a “keep-whole” type where we remove a mix of NGLs and olefins from the off-gas and return the equivalent heating
13
WPZ
WPZ was formedvalue to the third-party upgrader in 2005 to engage in gathering, transporting, processingthe form of natural gas. We extract, fractionate, treat, store, terminal and treatingsell the propane, propylene, normal butane (butane), isobutane/butylene (butylene) and condensate recovered from this process. The commodity price exposure of this asset is the spread between the price for natural gas and fractionatingthe NGL and storing NGLs.olefin products we produce. We currently own approximately a 23.6 percent limited partnership interest includingcontinue to be the interests of the general partner, Williams Partners GP LLC, which is wholly owned by us, and incentive distribution rights. WPZ provides us with an alternative source of equity capital. WPZ also creates a vehicle to monetize our qualifying assets. Such transactions, which are subject to approval by the boards of directors of both Williams and WPZ’s general partner, allow us to retain control of the assets through our ownership interestonly NGL/olefins fractionator in WPZ and operation of the assets. WPZ’s asset portfolio includes Williams Four Corners LLC, certain ownership interests in Wamsutter LLC, a 60 percent interest in Discovery, three integrated NGL storage facilities near Conway, Kansas, a 50 percent interest in an NGL fractionator near Conway, Kansaswestern Canada and the Carbonate Trend sour gas gathering pipeline offonly treater/processor of oil sands upgrader off-gas. Our extraction of liquids from upgrader off-gas streams allows the coast of Alabama.
Gas Marketing Services
Gas Marketing Services (Gas Marketing) primarily supports ourupgraders to burn cleaner natural gas
businesses by providing marketingstreams and
risk management services, which includes marketing and hedgingreduces their overall air emissions.The Ft. McMurray extraction plant has processing capacity of 121 MMcf/d with the gas produced by Exploration & Production, and procuring fuel and shrink gas and hedging natural gas liquids sales for Midstream. Gas Marketing also provides similar servicesability to third parties, such as producers. In addition, Gas Marketing manages various natural gas-related contracts such as transportation, storage, related hedges and proprietary trading positions, including certain legacy natural gas contracts and positions.
Gas Marketing’s 2008 natural gas purchase volumes include 1.4Bcf/recover in excess of 17 Mbbls/d of
olefin and NGL products. Our Redwater fractionator has a liquids handling capacity of 18 Mbbls/d. The B/B splitter, which has a production capacity of 3.7 Mbbls/d of butylene and 3.7 Mbbls/d of butane, further fractionates the butylene/butane mix produced at our Redwater fractionators into separate butylene and butane products, which receive higher values and are in greater demand. We also purchase small volumes of olefin/NGLs mixes from third-party gas
processors, fractionate the olefins and NGLs at our Redwater plant and sell the resulting products. Our products are sold within Canada and the United States.Canadian expansion projects
Construction is well underway on a 261-mile, 12-inch diameter Canadian pipeline which will transport recovered NGLs and olefins from our processing plant in Ft. McMurray to our Redwater fractionation facility. The pipeline, which will have an initial capacity of 43 Mbbls/d that can be increased to an ultimate capacity of 125 Mbbls/d with additional pump stations, will have sufficient capacity to transport additional NGLs and olefins from our existing operations as well as other NGLs and olefins produced by Exploration & Productionfrom oil sands off-gas. The project is being constructed using cash previously generated from Canadian and another 1.0 Bcf/d from third party/other sources. This natural gas wasinternational projects. We anticipate an in-service date in turn marketed and sold to third parties (2.0 Bcf/d) and to Midstream (.4 Bcf/d).
Our Exploration & Production and Midstream segments may execute commodity hedges with Gas Marketing. In turn, Gas Marketing may execute offsetting derivative contracts with unrelated third parties.
As a resultsecond quarter of
the sale of a substantial portion of our Power business2012.Construction began in the fourth quarter of 2007, Gas Marketing2011 on the ethane recovery project that will allow us to recover ethane/ethylene mix from our operations that process off-gas from the Alberta oil sands. We are modifying our oil sands off-gas extraction plant near Fort McMurray, Alberta, and constructing a de-ethanizer at our Redwater fractionation facility. Our de-ethanizer, which will have a production capacity of 17,000 bbls/d, will enable us to initially process approximately 10,000 bbls/d of ethane/ethylene mix. We have signed a long-term contract to provide the ethane/ethylene mix to a third-party customer. We expect the project to be constructed using cash previously generated from Canadian and other international projects and we expect to complete the expansions and begin producing ethane/ethylene mix in the first quarter of 2013.
Domestic olefins
In the Gulf of Mexico region, we own a 5/6 interest in and are the operator of an NGL light-feed olefins cracker in Geismar, Louisiana, with a total production capacity of 1.35 billion pounds of ethylene and 90 million pounds of propylene per year. Our feedstocks for the cracker are ethane and propane; as a result, these assets are primarily exposed to the price spread between ethane and propane, and ethylene and propylene, respectively. Ethane and propane are available for purchase from third parties and from affiliates. We own ethane and propane pipeline systems in Louisiana that provide feedstock transportation to the Geismar plant and other third-party crackers. Additionally, we own a refinery grade propylene splitter and associated pipeline with a production capacity of approximately 500 million pounds per year of propylene. At our propylene splitter, we purchase refinery grade propylene and fractionate it into polymer grade propylene and propane; as a result this asset is exposed to the price spread between those commodities. As a merchant producer of ethylene and propylene, our product sales are to customers for use in making plastics and other downstream petrochemical products destined for both domestic and export markets. Our olefins business also responsibleoperates an ethylene storage hub at Mont Belvieu using leased third-party underground storage wells.
We own and operate 63 miles of pipeline in the Houston Ship Channel area which transport ammonia, tertiary butyl alcohol and other industrial gases for certain remaining legacy natural gas contractsthird parties. We also own a tunnel crossing pipeline under the Houston Ship Channel which contains multiple pipelines which are leased to third parties.
14
We also market olefin and positions. During 2008,NGL products to a wide range of users in the energy and petrochemical industries. In order to meet sales contract obligations, we substantially reducedmay purchase products for resale.
Domestic olefins expansion project
We are currently in the overall legacy positions remaining.
Operating statistics
The following table summarizes our significant operating statistics for Midstream Canada & Olefins:
| | | | | | | | | | | | |
| | | 2011 | | | 2010 | | | 2009 | |
Volumes: | | | | |
Geismar ethylene sales (millions of pounds) | | | 1,038 | | | | 981 | | | | 1,109 | |
Canadian propylene sales (millions of pounds) | | | 139 | | | | 127 | | | | 130 | |
Canadian NGL sales (millions of gallons) | | | 163 | | | | 145 | | | | 144 | |
Additional Business Segment Information
Our ongoing business segments are accounted for as continuing operations in the accompanying financial statements and notes to financial statements included in Part II.
Operations related to certain assets in “Discontinued Operations” have been reclassified from their traditional business segment to “Discontinued Operations” in the accompanying financial statements and notes to financial statements included in Part II.
We perform certain management, legal, financial, tax, consultation, information technology, administrative and other services for our subsidiaries.
Our principal sources of cash are from dividends, distributions and advances from our subsidiaries, investments, payments by subsidiaries for services rendered, interest payments from subsidiaries on cash advances and, if needed, external financings, sales of master limited partnership units to the public, and net proceeds from asset sales. The amount of dividends available to us from subsidiaries largely depends upon each subsidiary’s earnings and operating capital requirements. The terms of certain of our subsidiaries’ borrowing arrangements may limit the transfer of funds to us.
us under certain conditions.We believe that we have adequate sources and availability of raw materials and commodities for existing and anticipated business needs. In support of our energy commodity activities, primarily conducted through Gas Marketing Services, our counterparties require us to provide various forms of credit support such as margin, adequate assurance amounts and pre-payments for gas supplies. Our interstate pipeline systems are all regulated in various ways resulting in the financial return on the investments made in the systems being limited to standards permitted by the regulatory agencies. Each of the pipeline systems has ongoing capital requirements for efficiency and mandatory improvements, with expansion opportunities also necessitating periodic capital outlays.
15
REGULATORY MATTERS
Exploration & Production. Our Exploration & Production business is subject to various federal, state and local laws and regulations on taxation and payment of royalties, and the development, production and marketing of oil and gas, and environmental and safety matters. Many laws and regulations require drilling permits and govern the spacing of wells, rates of production, water discharge, prevention of waste and other matters. Such laws and regulations have increased the costs of planning, designing, drilling, installing, operating and abandoning our oil and gas wells and other facilities. In addition, these laws and regulations, and any others that are passed by the jurisdictions where we have production, could limit the total number of wells drilled or the allowable production from successful wells, which could limit our reserves.
Williams Partners
Gas Pipeline.Pipeline Business. Gas Pipeline’sWilliams Partners gas pipeline’s interstate transmission and storage activities are subject to FERC regulation under the Natural Gas Act of 1938 (NGA) and under the Natural Gas Policy Act of 1978, and, as such, its rates and charges for the transportation of natural gas in interstate commerce, its accounting, and the extension, enlargement or abandonment of its jurisdictional facilities, among other things, are subject to regulation. Each gas pipeline company holds certificates of public convenience and necessity issued by the FERC authorizing ownership and operation of all pipelines, facilities and properties for which certificates are required under the NGA. Each gas pipeline company is also subject to the Natural Gas Pipeline Safety Act of 1968, as amended, and the Pipeline Safety Improvement Act of 2002, and the Pipeline Safety, Regulatory Certainty, and Jobs Creation Act of 2011, which regulates safety requirements in the design, construction, operation and maintenance of interstate natural gas transmission facilities. FERC Standards of Conduct govern how our interstate pipelines communicate and do business with gas marketing employees. Among other things, the Standards of Conduct require that interstate pipelines not operate their systems to preferentially benefit gas marketing functions.
Each of our interstate natural gas pipeline companies establishes its rates primarily through the FERC’s ratemaking process. Key determinants in the ratemaking process are:
Costs of providing service, including depreciation expense;
Allowed rate of return, including the equity component of the capital structure and related income taxes;
| | |
| • | Costs of providing service, including depreciation expense; |
|
| • | Allowed rate of return, including the equity component of the capital structure and related income taxes; and |
|
| • | Volume throughput assumptions. |
Contract and volume throughput assumptions.
The allowed rate of return is determined in each rate case. Rate design and the allocation of costs between the demandreservation and commodity rates also impact profitability. As a result of these proceedings, certain revenues previously collected may be subject to refund.
Pipeline Integrity Regulations
For Williams Partners’ gas pipeline business, Transco and Northwest Pipeline have developed an Integrity Management Plan that we believe meets the United States Department of Transportation Pipeline and Hazardous Materials Safety Administration (PHMSA) final rule that was issued pursuant to the requirements of the Pipeline Safety Improvement Act of 2002. The rule requires gas pipeline operators to develop an integrity management program for transmission pipelines that could affect high consequence areas in the event of pipeline failure. The Integrity Management Program includes a baseline assessment plan along with periodic reassessments to be completed within required timeframes. In meeting the integrity regulations, Transco and Northwest Pipeline have identified high consequence areas and developed baseline assessment plans. Transco and Northwest Pipeline are on schedule to complete the required assessments within required timeframes. Currently, Transco and Northwest Pipeline estimate the cost to complete the required initial assessments through 2012 and associated remediation will be primarily capital in nature and range between $25 million and $40 million for Transco and between $30 million and $35 million for Northwest Pipeline. Ongoing periodic reassessments and initial assessments of any new high consequence areas will be completed within the timeframes required by the rule. Management considers the costs associated with compliance with the rule to be prudent costs incurred in the ordinary course of business and, therefore, recoverable through Transco’s and Northwest Pipeline’s rates.
Midstream Gas & Liquids.Business.For our Midstream segment,Williams Partners’ midstream business, onshore gathering is subject to regulation by states in which we operate and offshore gathering is subject to the Outer Continental Shelf Lands Act (OCSLA). Of the states where Midstreamthe midstream business gathers gas, currently only Texas actively regulates gathering activities. Texas regulates gathering primarily through complaint mechanisms under which the state
16
commission may resolve disputes involving an individual gathering arrangement. Although offshore gathering facilities are not subject to the NGA, offshore transmission pipelines are subject to the NGA, and in recent years the FERC has taken a broad view of offshore transmission, finding many shallow-water pipelines to be jurisdictional transmission. Most offshore gathering facilities offshore are subject to the OCSLA, which provides in part that outer continental shelf pipelines “must provide open and nondiscriminatory access to both owner and non-ownernonowner shippers.”
MidstreamThe midstream business also owns interests in and operates two offshore transmission pipelines that are regulated by the FERC because they are deemed to transport gas in interstate commerce. Black Marlin Pipeline Company provides transportation service for offshore Texas production in the High Island area and redelivers that gas to intrastate pipeline interconnects near Texas City. Discovery provides transportation service for offshore Louisiana production from the South Timbalier, Grand Isle, Ewing Bank and Green Canyon (deepwater) areas to an onshore processing facility and downstream interconnect points with major interstate pipelines. FERC regulation requires all terms and conditions of service, including the rates charged, to be filed with and approved by the FERC before any changes can go into effect. In 2007, Black Marlin filed
The midstream business owns a 50 percent interest in, and settled a major rate change application beforeis the operator of OPPL, which is an interstate natural gas liquids pipeline regulated by the FERC resulting in increased rates for service. In November 2007, Discoverypursuant to the Interstate Commerce Act. OPPL provides transportation service pursuant to tariffs filed a settlement in lieu of a rate change filing, whichwith the FERC approved effective January 1, 2008, for all parties, except one protestor, Exxon Mobil Gas
16
Midstream Canada & Olefinsand Power Marketing Company. Among other things, the settlement increases Discovery’s rates for service, although most volumes flowing before the settlement became effective are not affected by the rate change due to life of lease rates and commitments.
Our Midstream Canadian assets are regulated by the Energy Resources Conservation Board (ERCB) and Alberta Environment. The regulatory system for the Alberta oil and gas industry incorporates a large measure of self-regulation, providing that licensed operators are held responsible for ensuring that their operations are conducted in accordance with all provincial regulatory requirements. For situations in which non-compliancenoncompliance with the applicable regulations is at issue, the ERCB and Alberta Environment have implemented an enforcement process with escalating consequences.
Gas Marketing Services.Our Gas Marketing business is subject to a varietydomestic olefins assets are regulated by the Louisiana Department of lawsEnvironmental Quality (LQEQ), the Texas Railroad Commission, and regulations at the local,various other state and federal levels, including the FERC and the Commodity Futures Trading Commission regulations. In addition, natural gas markets continue to be subject to numerous and wide-ranging federal and state regulatory proceedings and investigations. We are also subject to various federal and state actions and investigationsentities regarding among other things, market structure, behavior of market participants, market prices, and reporting to trade publications. We may be liable for refunds and other damages and penalties as a result of ongoing actions and investigations. The outcome of these matters could affect our creditworthiness and ability to perform contractual obligations as well as other market participants’ creditworthiness and ability to perform contractual obligations to us.
liquids pipelines.See Note 16 of our Notes to Consolidated Financial Statements for further details on our regulatory matters.
17
ENVIRONMENTAL MATTERS
Our generation facilities, processing facilities, natural gas pipelines, and exploration and production operations are subject to federal environmental laws and regulations as well as the state, local and tribal laws and regulations adopted by the jurisdictions in which we operate. We could incur liability to governments or third parties for any unlawful discharge of oil, gas or other pollutants into the air, soil, or water, as well as liability for clean upcleanup costs. Materials could be released into the environment in several ways including, but not limited to:
| | |
| • | From a well or drilling equipment at a drill site; |
|
| • | Leakage from gathering systems, underground gas storage caverns, pipelines, processing or treating facilities, transportation facilities and storage tanks; |
|
| • | Damage to oil and gas wells resulting from accidents during normal operations; and |
|
| • | Blowouts, cratering and explosions. |
Because the requirements imposed by environmental laws and regulations are frequently changed, we cannot assure you that lawsstorage tanks;
Damage to facilities resulting from accidents during normal operations;
Damages to onshore and regulations enacted in the future, including changes to existing lawsoffshore equipment and regulations, will not adversely affect our business. facilities resulting from storm events or natural disasters;
Blowouts, cratering and explosions.
In addition, we may be liable for environmental damage caused by former owners or operators of our properties.
We believe compliance with current environmental laws and regulations will not have a material adverse effect on our capital expenditures, earnings or current competitive position. However, environmental laws and regulations could affect our business in various ways from time to time, including incurring capital and maintenance expenditures, fines and penalties, and creating the need to seek relief from the FERC for rate increases to recover the costs of certain capital expenditures and operation and maintenance expenses.
For a discussionadditional information regarding the potential impact of federal, state, tribal or local regulatory measures on our business and specific environmental issues, see “Environmental” under Management’splease refer to “Risk Factors –We are subject to risks associated with climate change and– Our operations are subject to governmental laws and regulations relating to the protection of the environment, which may expose us to significant costs, liabilities and expenditures and could exceed current expectations,” “Management’s Discussion and Analysis of Financial Condition and Results of Operations – Environmental” and “Environmental Matters” in Note 16 of our Notes to Consolidated Financial Statements.
17
18
COMPETITION
Williams Partners
COMPETITION
Exploration & Production. Our Exploration & Production segment competes with other oil andFor Williams Partners’ gas concerns, including major and independent oil and gas companies inpipeline business, the development, production and marketing of natural gas. We compete in areas such as acquisition of oil and gas properties and obtaining necessary equipment, supplies and services. We also compete in recruiting and retaining skilled employees.
Gas Pipeline. The natural gas industry has undergone significant change over the past two decades. A highly-liquid competitive commodity market in natural gas and increasingly competitive markets for natural gas services, including competitive secondary markets in pipeline capacity, have developed. More recently large reserves of shale gas have been discovered, in many cases much closer to major market centers. As a result, pipeline capacity is being used more efficiently and peaking and storage services are increasingly effective substitutes for annualcompetition among pipeline capacity.
suppliers to attach growing supply to market has increased.Local distribution company (LDC) and electric industry restructuring by states have affected pipeline markets. Pipeline operators are increasingly challenged to accommodate the flexibility demanded by customers and allowed under tariffs, but the changes implemented at the state level have not required renegotiation of LDC contracts. The state plans have in some cases discouraged LDCs from signing long-term contracts for new capacity.
States are in the process of developinghave developed new energy plans that may require utilities to encourage energy saving measures and diversify their energy supplies to include renewable sources. This could lowerhas lowered the growth of residential gas demand.
However, due to relatively low prices of natural gas, demand for electric power generation has increased.These factors have increased the risk that customers will reduce their contractual commitments for pipeline capacity.capacity from traditional producing areas. Future utilization of pipeline capacity will also depend on competition from LNG imported into marketsthese factors and new pipelines from the Rockiesothers impacting both U.S. and other new producing areas, many of which are utilizing master limited partnership structures with a lower cost of capital, and on growth ofglobal demand for natural gas demand.
Midstream Gas & Liquids.gas.In our Midstream segment,Williams Partners’ midstream business, we face regional competition with varying competitive factors in each basin. Our gathering and processing business competes with other midstream companies, interstate and intrastate pipelines, producers and independent gatherers and processors. We primarily compete with five to ten companies across all basins in which we provide services. Numerous factors impact any given customer’s choice of a gathering or processing services provider, including rate, location, term, reliability, timeliness of services to be provided, pressure obligations and contract structure. We also compete in recruiting and retaining skilled employees. In 2005,
Midstream Canada & Olefins
Ethylene and propylene markets, and therefore our olefins business, compete in a worldwide marketplace. Due to our NGL feedstock position at Geismar, we formed WPZexpect to helpbenefit from the lower cost position in North America versus other crude-based feedstocks worldwide. The majority of North American olefins producers have significant downstream petrochemical manufacturing for plastics and other products. As such, they buy or sell ethylene and propylene as required. We operate as a merchant seller of olefins with no downstream manufacturing, and therefore can be either a supplier or a competitor at any given time to these other companies depending on their market balances. Generally, we are viewed primarily as a supplier to these companies and not as a direct competitor. We compete against other master limited partnerships for midstream projects. By virtueon the basis of service, price and availability of the master limited partnership structure, WPZ provides us with an alternative sourceproducts we produce.
Our Canadian midstream facilities continue to be the only NGL/olefins fractionator in western Canada and the only treater/processor of equity capital.
Gas Marketing Services. In our Gas Marketing Services segment, we compete directly with large independent energy marketers, marketing affiliatesoil sands upgrader off-gas. Our extraction of regulated pipelines and utilities, andliquids from the upgrader off-gas stream allows the upgraders to burn cleaner natural gas producers. We also competestreams and reduce their overall air emissions. Our Canadian midstream business competes for the sale of its products with brokerage houses, energy hedge fundstraditional Canadian midstream companies on the basis of operational expertise, price, service offerings and other energy-based companies offering similar services.
availability of the products we produce.19
EMPLOYEES
At February 1, 2009,2012, we had approximately 4,7044,293 full-time employees including 924 at the corporate level, 798 at Exploration & Production, 1,726 at Gas Pipeline, 1,232 at Midstream Gas & Liquids, and 24 at Gas Marketing Services. None of our employees are represented by unions or covered by collective bargaining agreements.
FINANCIAL INFORMATION ABOUT GEOGRAPHIC AREAS
See Note 18 of our Notes to Consolidated Financial Statements for amounts of revenues during the last three fiscal years from external customers attributable to the United States and all foreign countries. Also see Note 18 of our Notes to Consolidated Financial Statements for information relating to long-lived assets during the last three fiscal years, located in the United States and all foreign countries.
18
20
FORWARD-LOOKING STATEMENTS/RISK FACTORSSTATEMENTS AND CAUTIONARY STATEMENT
FOR PURPOSES OF THE “SAFE HARBOR” PROVISIONS OF
THE PRIVATE SECURITIES LITIGATION REFORM ACT OF 1995
Certain matters contained in this report include “forward-looking statements” within the meaning of sectionSection 27A of the Securities Act of 1933, as amended, and Section 21E of the Securities Exchange Act of 1934, as amended. These forward-looking statements discuss our expectedrelate to anticipated financial performance, management’s plans and objectives for future results based on currentoperations, business prospects, outcome of regulatory proceedings, market conditions and pending business operations.other matters. We make these forward-looking statements in reliance on the safe harbor protections provided under the Private Securities Litigation Reform Act of 1995.
All statements, other than statements of historical facts, included in this report that address activities, events or developments that we expect, believe or anticipate will exist or may occur in the future, are forward-looking statements. Forward-looking statements can be identified by various forms of words such as “anticipates,” “believes,” “seeks,” “could,” “may,” “should,” “continues,” “estimates,” “expects,” “forecasts,” “intends,” “might,” “goals,” “objectives,” “targets,” “planned,” “potential,” “projects,” “scheduled”“scheduled,” “will” or other similar expressions. These forward-looking statements are based on management’s beliefs and assumptions and on information currently available to management and include, among others, statements regarding:
Amounts and nature of future capital expenditures;
Expansion and growth of our business and operations;
| | |
| • | Amounts and nature of future capital expenditures; |
|
| • | Expansion and growth of our business and operations; |
|
| • | Financial condition and liquidity; |
|
| • | Business strategy; |
|
| • | Estimates of proved gas and oil reserves; |
|
| • | Reserve potential; |
|
| • | Development drilling potential; |
|
| • | Cash flow from operations or results of operations; |
|
| • | Seasonality of certain business segments; |
|
| • | Natural gas and NGL prices and demand. |
Financial condition and liquidity;
Cash flow from operations or results of operations;
Seasonality of certain business components;
Natural gas, natural gas liquids and crude oil prices and demand.
Forward-looking statements are based on numerous assumptions, uncertainties and risks that could cause future events or results to be materially different from those stated or implied in this report. Many of the factors that will determine these results are beyond our ability to control or project.predict. Specific factors whichthat could cause actual results to differ from those inresults contemplated by the forward-looking statements include:include, among others, the following:
Availability of supplies, market demand, volatility of prices, and the availability and cost of capital;
Inflation, interest rates, fluctuation in foreign exchange, and general economic conditions (including future disruptions and volatility in the global credit markets and the impact of these events on our customers and suppliers);
| | |
| • | Availability of supplies (including the uncertainties inherent in assessing, estimating, acquiring and developing future natural gas reserves), market demand, volatility of prices, and the availability and costs of capital; |
|
| • | Inflation, interest rates, fluctuation in foreign exchange, and general economic conditions (including the recent economic slowdown and the disruption of global credit markets and the impact of these events on our customers and suppliers); |
|
| • | The strength and financial resources of our competitors; |
|
| • | Development of alternative energy sources; |
|
| • | The impact of operational and development hazards; |
|
| • | Costs of, changes in, or the results of laws, government regulations (including proposed climate change legislation)The strength and financial resources of our competitors; Ability to acquire new businesses and assets and integrate those operations and assets into our existing businesses, as well as expand our facilities; Development of alternative energy sources; The impact of operational and development hazards; Costs of, changes in, or the results of laws, government regulations (including safety and climate change regulation and changes in natural gas production from exploration and production areas that we serve), environmental liabilities, litigation, and rate proceedings; |
19
21
Our costs and funding obligations for defined benefit pension plans and other postretirement benefit plans;
Changes in maintenance and construction costs;
| | |
| • | Our costs and funding obligations for defined benefit pension plans and other postretirement benefit plans; |
|
| • | Changes in the current geopolitical situation; |
|
| • | Risks related to strategy and financing, including restrictions stemming from our debt agreements, future changes in our credit ratings and the availability and cost of credit; |
|
| • | Risks associated with future weather conditions; |
|
| • | Acts of terrorism and |
|
| • | Additional risks described in our filings with the SEC. |
Changes in the current geopolitical situation;
Our exposure to the credit risk of our customers and counterparties;
Risks related to strategy and financing, including restrictions stemming from our debt agreements, future changes in our credit ratings and the availability and cost of credit;
Risks associated with future weather conditions;
Acts of terrorism, including cybersecurity threats and related disruptions;
Additional risks described in our filings with the Securities and Exchange Commission.
Given the uncertainties and risk factors that could cause our actual results to differ materially from those contained in any forward-looking statement, we caution investors not to unduly rely on our forward-looking statements. We disclaim any obligations to and do not intend to update the above list or to announce publicly the result of any revisions to any of the forward-looking statements to reflect future events or developments.
In addition to causing our actual results to differ, the factors listed above and referred to below may cause our intentions to change from those statements of intention set forth in this report. Such changes in our intentions may also cause our results to differ. We may change our intentions, at any time and without notice, based upon changes in such factors, our assumptions, or otherwise.
Because forward-looking statements involve risks and uncertainties, we caution that there are important factors, in addition to those listed above, that may cause actual results to differ materially from those contained in the forward-looking statements. These factors are described in the following section.
You should carefully consider the following risk factors in addition to the other information in this report. Each of these factors could adversely affect our business, operating results, and financial condition, as well as adversely affect the value of an investment in our securities.
Risks InherentRelated to the Spin-Off
The separation of our exploration and production business may not achieve its intended results.
The separation of our exploration and production business, completed on December 31, 2011, may not achieve its intended results and could have an adverse effect on us due to a number of factors. For example, the separation has significantly reduced the scope and scale of our business, we may not be able to grow as expected and we may incur proportionately higher costs to operate.
If there is a determination that the spin-off of WPX stock to our Industrystockholders is taxable for U.S. federal income tax purposes because the facts, representations, or undertakings underlying an IRS private letter ruling or a tax opinion are incorrect or for any other reason, then we and our stockholders could incur significant income tax liabilities.
In connection with our original separation plan that called for an initial public offering (IPO) of stock of WPX and a subsequent spin-off of our remaining shares of WPX to our stockholders, we obtained a private letter ruling from the Internal Revenue Service (IRS) and an opinion of our outside tax advisor, to the effect that the distribution by us of WPX shares to our stockholders, and any related restructuring transaction undertaken by us, would not result in recognition for U.S. federal income tax purposes, of income, gain, or loss to us or our stockholders under section 355 and section 368(a)(1)(D) of the Internal Revenue Code of 1986 (the Code), except for cash payments made to our stockholders in lieu of fractional shares of WPX common stock. In addition, we received an opinion from our outside tax advisor to the effect that the spin-off pursuant to our revised separation plan which was ultimately consummated on December 31, 2011, which did not involve an IPO of WPX shares, would not result in the recognition, for federal income tax purposes, of income, gain, or loss to us or our stockholders under section 355 and section 368(a)(1)(D) of the Code, except for cash payments made to our stockholders in lieu of fractional shares of WPX. The private letter ruling and opinion have relied on or will rely on certain facts, representations, and undertakings from us and WPX regarding the past and future conduct of the companies’ respective businesses and other matters. If any of these facts, representations, or undertakings are, or become, incorrect or are not otherwise satisfied, including as a result of certain significant changes in the stock ownership of us or WPX after the spin-off, or if the IRS disagrees with any such facts and representations upon audit, we and our stockholders may not be able to rely on the private letter ruling or the opinion of our tax advisor and could be subject to significant income tax liabilities.
The spin-off may expose us to potential liabilities arising out of state and federal fraudulent conveyance laws and legal dividend requirements that we did not assume in our agreements with WPX.
The spin-off is subject to review under various state and federal fraudulent conveyance laws. A court could deem the spin-off or certain internal restructuring transactions undertaken by us in connection with the separation to be a fraudulent conveyance or transfer. Fraudulent conveyances or transfers are defined to include transfers made or obligations incurred with the actual intent to hinder, delay or defraud current or future creditors or transfers made or obligations incurred for less than reasonably equivalent value when the debtor was insolvent, or that rendered the debtor insolvent, inadequately capitalized or unable to pay its debts as they become due. A court could void the transactions or impose substantial liabilities upon us, which could adversely affect our financial condition and our results of operations. Whether a transaction is a fraudulent conveyance or transfer will vary depending upon the jurisdiction whose law is being applied. Under the separation and distribution agreement between us and WPX, from and after the spin-off, each of WPX and we are responsible for the debts, liabilities and other obligations related to the business or businesses which each owns and operates. Although we do not expect to be liable for any such obligations not expressly assumed by us pursuant to the separation and
23
distribution agreement, it is possible that a court would disregard the allocation agreed to between the parties, and require that we assume responsibility for obligations allocated to WPX, particularly if WPX were to refuse or were unable to pay or perform the subject allocated obligations.
Risks Related to our Business
The long-term financial condition of our natural gas transportationpipeline and midstream businesses is dependent on the continued availability of natural gas supplies in the supply basins that we access, demand for those supplies in our traditional markets, and the prices of and market demand for natural gas.
The development of the additional natural gas reserves that are essential for our gas transportationpipeline and midstream businesses to thrive requires significant capital expenditures by others for exploration and development drilling and the installation of production, gathering, storage, transportation and other facilities that permit natural gas to be produced and delivered to our pipeline systems. Low prices for natural gas, regulatory limitations, including environmental regulations, or the lack of available capital for these projects could adversely affect the development and production of additional reserves, as well as gathering, storage, pipeline transportation and import and export of natural gas supplies, adversely impacting our ability to fill the capacities of our gathering, transportation and processing facilities.
Production from existing wells and natural gas supply basins with access to our pipeline and gathering systems will also naturally decline over time. The amount of natural gas reserves underlying these wells may also be less than anticipated, and the rate at which production from these reserves declines may be greater than anticipated. Additionally, the competition for natural gas supplies to serve other markets could reduce the amount of natural gas supply for our customers. Accordingly, to maintain or increase the contracted capacity or the volume of natural gas transported on or gathered through our pipeline systems and cash flows associated with the gathering and transportation of natural gas, our customers must compete with others to obtain adequate supplies of natural gas. In addition, if natural gas prices in the supply basins connected to our pipeline systems are higher than prices in other natural gas producing regions, our ability to compete with other transporters may be negatively impacted on a short-term basis, as well as with respect to our long-term recontracting activities. If new supplies of natural gas are not obtained to replace the natural decline in volumes from existing supply areas, or if natural gas supplies are diverted to
20
serve other markets, if development in new supply basins where we do not have significant gathering or pipeline systems reduces demand for our services, or if environmental regulators restrict new natural gas drilling, the overall volume of natural gas transported, gathered and stored on our system would decline, which could have a material adverse effect on our business, financial condition and results of operations. In addition, new LNG import facilities built near our markets could result in less demand for our gathering and transportation facilities.
Significant prolonged changes in natural gas prices could affect supply and demand and cause a termination of our long-term transportation and storage contracts or a reduction in throughput on our system.the gas pipeline systems.
Higher natural gas prices over the long term could result in a decline in the demand for natural gas and, therefore, in our long-term transportation and storage contracts or throughput on our Gas Pipelines’gas pipeline systems. Also, lower natural gas prices over the long term could result in a decline in the production of natural gas resulting in reduced contracts or throughput on our Gas Pipelines’the gas pipeline systems. As a result, significant prolonged changes in natural gas prices could have a material adverse effect on our gas pipeline business, financial condition, results of operations and cash flows.
Significant capital expenditures are required to replace our reserves.
Our exploration, development and acquisition activities require substantial capital expenditures. Historically, we have funded our capital expenditures through a combination of cash flows from operations and debt and equity issuances. Future cash flows are subject to a number of variables, including the level of production from existing wells, prices of natural gas, and our success in developing and producing new reserves. If our cash flow from operations is not sufficient to fund our capital expenditure budget, we may not be able to access additional bank debt, issue debt or equity securities or access other methods of financing on an economic basis to meet our capital expenditure budget. As a result, our capital expenditure plans may have to be adjusted.
Failure to replace reserves may negatively affect our business.
The growth of our Exploration & Production business depends upon our ability to find, develop or acquire additional natural gas reserves that are economically recoverable. Our proved reserves generally decline when reserves are produced, unless we conduct successful exploration or development activities or acquire properties containing proved reserves, or both. We may not be able to find, develop or acquire additional reserves on an economic basis. If natural gas prices increase, our costsPrices for additional reserves would also increase, conversely if natural gas prices decrease, it could make it more difficult to fund the replacement of our reserves.
Exploration and development drilling may not result in commercially productive reserves.
Our past success rate for drilling projects should not be considered a predictor of future commercial success. We do not always encounter commercially productive reservoirs through our drilling operations. The new wells we drill or participate in may not be productive and we may not recover all or any portion of our investment in wells we drill or participate in. The cost of drilling, completing and operating a well is often uncertain, and cost factors can adversely affect the economics of a project. Our efforts will be unprofitable if we drill dry wells or wells that are productive but do not produce enough reserves to return a profit after drilling, operating and other costs. Further, our drilling operations may be curtailed, delayed or canceled as a result of a variety of factors, including:
| | |
| • | Increases in the cost of, or shortages or delays in the availability of, drilling rigs and equipment, skilled labor, capital or transportation; |
|
| • | Unexpected drilling conditions or problems; |
|
| • | Regulations and regulatory approvals; |
|
| • | Changes or anticipated changes in energy prices; and |
|
| • | Compliance with environmental and other governmental requirements. |
21
Estimating reserves and future net revenues involves uncertainties. Negative revisions to reserve estimates, oil and gas prices or assumptions as to future natural gas prices may lead to decreased earnings, losses or impairment of oil and gas assets, including related goodwill.
Reserve engineering is a subjective process of estimating underground accumulations of oil and gas that cannot be measured in an exact manner. Reserves that are “proved reserves” are those estimated quantities of crude oil, natural gas, and natural gas liquids that geological and engineering data demonstrate with reasonable certainty are recoverable in future years from known reservoirs under existing economic and operating conditions, but should not be considered as a guarantee of results for future drilling projects.
The process relies on interpretations of available geological, geophysical, engineering and production data. There are numerous uncertainties inherent in estimating quantities of proved reserves and in projecting future rates of production and timing of developmental expenditures, including many factors beyond the control of the producer. The reserve data included in this report represent estimates. In addition, the estimates of future net revenues from our proved reserves and the present value of such estimates are based upon certain assumptions about future production levels, prices and costs that may not prove to be correct.
Quantities of proved reserves are estimated based on economic conditions in existence during the period of assessment. Changes to oil and gas prices in the markets for such commodities may have the impact of shortening the economic lives of certain fields because it becomes uneconomic to produce all recoverable reserves on such fields, which reduces proved property reserve estimates.
If negative revisions in the estimated quantities of proved reserves were to occur, it would have the effect of increasing the rates of depreciation, depletion and amortization on the affected properties, which would decrease earnings or result in losses through higher depreciation, depletion and amortization expense. These revisions, as well as revisions in the assumptions of future cash flows of these reserves, may also be sufficient to trigger impairment losses on certain properties which would result in a non-cash charge to earnings. The revisions could also possibly affect the evaluation of Exploration & Production’s goodwill for impairment purposes. At December 31, 2008, we had approximately $1 billion of goodwill on our balance sheet.
Certain of our services are subject to long-term, fixed-price contracts that are not subject to adjustment, even if our cost to perform such services exceeds the revenues received from such contracts.
Our natural gas transportation and midstream businesses provide some services pursuant to long-term, fixed price contracts. It is possible that costs to perform services under such contracts will exceed the revenues we collect for our services. Although most of the services provided by our interstate gas pipelines are priced at cost-based rates that are subject to adjustment in rate cases, under FERC policy, a regulated service provider and a customer may mutually agree to sign a contract for service at a “negotiated rate” that may be above or below the FERC regulated cost-based rate for that service. These “negotiated rate” contracts are not generally subject to adjustment for increased costs that could be produced by inflation or other factors relating to the specific facilities being used to perform the services.
We depend on certain key customers for a significant portion of our revenues. The loss of any of these key customers or the loss of any contracted volumes could result in a decline in our business.
Our Gas Pipelines rely on a limited number of customers for a significant portion of their revenues. The loss of even a portion of our contracted volumes, as a result of competition, creditworthiness, inability to negotiate extensions or replacements of contracts or otherwise, could have a material adverse effect on our business, financial condition, results of operations and cash flows.
We are exposed to the credit risk of our customers.
We are exposed to the credit risk of our customers in the ordinary course of our business. Generally our customers are rated investment grade, are otherwise considered credit worthy, are required to make pre-payments, or provide security to satisfy credit concerns. However, we cannot predict to what extent our business would be impacted by deteriorating conditions in the economy, including declines in our customers’ creditworthiness. While
22
we monitor these situations carefully and attempt to take appropriate measures to protect ourselves, it is possible that we may have to write down or write off doubtful accounts. Such write-downs or write-offs could negatively affect our operating results for the period in which they occur, and, if significant, could have a material adverse effect on our operating results and financial condition.
The failure of new sources of natural gas production or liquid natural gas (LNG) import terminals to be successfully developed in North America could increase natural gas prices and reduce the demand for our services.
New sources of natural gas production in the United States and Canada, particularly in areas of shale development are expected to become an increasingly significant component of future natural gas supplies in North America. Additionally, increases in LNG supplies are expected to be imported through new LNG import terminals, particularly in the Gulf Coast region. If these additional sources of supply are not developed, natural gas prices could increase and cause consumers of natural gas to turn to alternative energy sources, which could have a material adverse effect on our business, financial condition, results of operations and cash flows.
Our drilling, production, gathering, processing, storage and transporting activities involve numerous risks that might result in accidents, and other operating risks and hazards.
Our operations are subject to all the risks and hazards typically associated with the development and exploration for, and the production and transportation of oil and gas. These operating risks include, but are not limited to:
| | |
| • | Fires, blowouts, cratering and explosions; |
|
| • | Uncontrollable releases of oil, natural gas or well fluids; |
|
| • | Pollution and other environmental risks; |
|
| • | Natural disasters; |
|
| • | Aging infrastructure; |
|
| • | Damage inadvertently caused by third party activity, such as operation of construction equipment; and |
|
| • | Terrorist attacks or threatened attacks on our facilities or those of other energy companies. |
These risks could result in loss of human life, personal injuries, significant damage to property, environmental pollution, impairment of our operations and substantial losses to us. In accordance with customary industry practice, we maintain insurance against some, but not all, of these risks and losses, and only at levels we believe to be appropriate. The location of certain segments of our pipelines in or near populated areas, including residential areas, commercial business centers and industrial sites, could increase the level of damages resulting from these risks. In spite of our precautions, an event such as those described above could cause considerable harm to people or property, and could have a material adverse effect on our financial condition and results of operations, particularly if the event is not fully covered by insurance. Accidents or other operating risks could further result in loss of service available to our customers. Such circumstances, including those arising from maintenance and repair activities, could result in service interruptions on segments of our pipeline infrastructure. Potential customer impacts arising from service interruptions on segments of our pipeline infrastructure could include limitations on the pipeline’s ability to satisfy customer requirements, obligations to provide reservations charge credits to customers in times of constrained capacity, and solicitation of existing customers by others for potential new pipeline projects that would compete directly with existing services. Such circumstances could materially impact our ability to meet contractual obligations and retain customers, with a resulting negative impact on our business, financial condition, results of operations and cash flows.
We do not insure against all potential losses and could be seriously harmed by unexpected liabilities or by the ability of the insurers we do use to satisfy our claims.
We are not fully insured against all risks inherent to our business, including environmental accidents that might occur. In addition, we do not maintain business interruption insurance in the type and amount to cover all possible risks of loss. We currently maintain excess liability insurance with limits of $610 million per occurrence and in the
23
aggregate annually and a deductible of $2 million per occurrence. This insurance covers us and our affiliates for legal and contractual liabilities arising out of bodily injury, personal injury or property damage, including resulting loss of use to third parties. This excess liability insurance includes coverage for sudden and accidental pollution liability for full limits, with the first $135 million of insurance also providing gradual pollution liability coverage for natural gas and NGL operations. Pollution liability coverage excludes: release of pollutants subsequent to their disposal; release of substances arising from the combustion of fuels that result in acidic deposition, and testing, monitoring,clean-up, containment, treatment or removal of pollutants from property owned, occupied by, rented to, used by or in the care, custody or control of us or our affiliates.
We do not insure onshore underground pipelines for physical damage, except at river crossings and at certain locations such as compressor stations. We maintain coverage of $300 million per occurrence for physical damage to onshore assets and resulting business interruption caused by terrorist acts. We also maintain coverage of $100 million per occurrence for physical damage to offshore assets caused by terrorist acts, except for our Devils Tower spar where we maintain terrorism limits of $300 million per occurrence for property damage and $105 million per occurrence for resulting business interruption. Also, all of our insurance is subject to deductibles. If a significant accident or event occurs for which we are not fully insured, it could adversely affect our operations and financial condition. We may not be able to maintain or obtain insurance of the type and amount we desire at reasonable rates. Changes in the insurance markets subsequent to the September 11, 2001 terrorist attacks and hurricanes Katrina, Rita, Gustav and Ike have impacted the availability of certain types of coverage at reasonable rates, and we may elect to self insure a portion of our asset portfolio. We cannot assure you that we will in the future be able to obtain the levels or types of insurance we would otherwise have obtained prior to these market changes or that the insurance coverage we do obtain will not contain large deductibles or fail to cover certain hazards or cover all potential losses. The occurrence of any operating risks not fully covered by insurance could have a material adverse effect on our business, financial condition, results of operations and cash flows.
In addition, certain insurance companies that provide coverage to us, including American International Group, Inc., have experienced negative developments that could impair their ability to pay any of our potential claims. As a result, we could be exposed to greater losses than anticipated and may have to obtain replacement insurance, if available, at a greater cost.
Execution of our capital projects subjects us to construction risks, increases in labor and materials costs and other risks that may adversely affect financial results.
A significant portion of our growth in the gas pipeline and midstream business areas is accomplished through the construction of new pipelines, processing and storage facilities, as well as the expansion of existing facilities. Construction of these facilities is subject to various regulatory, development and operational risks, including:
| | |
| • | The ability to obtain necessary approvals and permits by regulatory agencies on a timely basis and on acceptable terms; |
|
| • | The availability of skilled labor, equipment, and materials to complete expansion projects; |
|
| • | Potential changes in federal, state and local statutes and regulations, including environmental requirements, that prevent a project from proceeding or increase the anticipated cost of the project; |
|
| • | Impediments on our ability to acquire rights-of-way or land rights on a timely basis and on acceptable terms; |
|
| • | The ability to construct projects within estimated costs, including the risk of cost overruns resulting from inflation or increased costs of equipment, materials, labor, or other factors beyond our control, that may be material; and |
|
| • | The ability to access capital markets to fund construction projects. |
Any of these risks could prevent a project from proceeding, delay its completion or increase its anticipated costs. As a result, new facilities may not achieve expected investment return, which could adversely affect results of operations, financial position or cash flows.
24
Our costs and funding obligations for our defined benefit pension plans and costs for our other post-retirement benefit plans are affected by factors beyond our control.
We have defined benefit pension plans covering substantially all of our U.S. employees and other post-retirement benefit plans covering certain eligible participants. The timing and amount of our funding requirements under the defined benefit pension plans depend upon a number of factors we control, including changes to pension plan benefits as well as factors outside of our control, such as asset returns, interest rates and changes in pension laws. Changes to these and other factors that can significantly increase our funding requirements could have a significant adverse effect on our financial condition. The amount of expenses recorded for our defined benefit pension plans and other post-retirement benefit plans is also dependent on changes in several factors, including market interest rates and the returns on plan assets. Significant changes in any of these factors may adversely impact our future results of operations.
Two of our subsidiaries act as the respective general partners of two different publicly-traded limited partnerships, Williams Partners L.P. and Williams Pipeline Partners L.P. As such, those subsidiaries’ operations may involve a greater risk of liability than ordinary business operations.
One of our subsidiaries acts as the general partner of WPZ and another subsidiary of ours acts as the general partner of WMZ. Each of these subsidiaries that act as the general partner of a publicly-traded limited partnership may be deemed to have undertaken fiduciary obligations with respect to the limited partnership of which it serves as the general partner and to the limited partners of such limited partnership. Activities determined to involve fiduciary obligations to other persons or entities typically involve a higher standard of conduct than ordinary business operations and therefore may involve a greater risk of liability, particularly when a conflict of interests is found to exist. Our control of the general partners of two different publicly traded partnerships may increase the possibility of claims of breach of fiduciary duties, including claims brought due to conflicts of interest (including conflicts of interest that may arise (i) between the two publicly-traded partnerships as well as (ii) between a publicly-traded partnership, on the one hand, and its general partner and that general partner’s affiliates, including us, on the other hand). Any liability resulting from such claims could be material.
Potential changes in accounting standards might cause us to revise our financial results and disclosures in the future, which might change the way analysts measure our business or financial performance.
Regulators and legislators continue to take a renewed look at accounting practices, financial disclosures, companies’ relationships with their independent registered public accounting firms, and retirement plan practices. We cannot predict the ultimate impact of any future changes in accounting regulations or practices in general with respect to public companies or the energy industry or in our operations specifically. In addition, the Financial Accounting Standards Board (FASB) or the SEC could enact new accounting standards that might impact how we are required to record revenues, expenses, assets, liabilities and equity.
Our risk measurement and hedging activities might not be effective and could increase the volatility of our results.
Although we have systems in place that use various methodologies to quantify commodity price risk associated with our businesses, these systems might not always be followed or might not always be effective. Further, such systems do not in themselves manage risk, particularly risks outside of our control, and adverse changes in energy commodity market prices, volatility, adverse correlation of commodity prices, the liquidity of markets, changes in interest rates and other risks discussed in this report might still adversely affect our earnings, cash flows and balance sheet under applicable accounting rules, even if risks have been identified.
In an effort to manage our financial exposure related to commodity price and market fluctuations, we have entered into contracts to hedge certain risks associated with our assets and operations. In these hedging activities, we have used fixed-price, forward, physical purchase and sales contracts, futures, financial swaps and option contracts traded in the over-the-counter markets or on exchanges. Nevertheless, no single hedging arrangement can adequately address all risks present in a given contract. For example, a forward contract that would be effective in hedging commodity price volatility risks would not hedge the contract’s counterparty credit or performance risk. Therefore, unhedged risks will always continue to exist. While we attempt to manage counterparty credit risk within
25
guidelines established by our credit policy, we may not be able to successfully manage all credit risk and as such, future cash flows and results of operations could be impacted by counterparty default.
Our use of hedging arrangements through which we attempt to reduce the economic risk of our participation in commodity markets could result in increased volatility of our reported results. Changes in the fair values (gains and losses) of derivatives that qualify as hedges under SFAS No. 133, “Accounting for Derivative Instruments and Hedging Activities,” (SFAS 133) to the extent that such hedges are not fully effective in offsetting changes to the value of the hedged commodity, as well as changes in the fair value of derivatives that do not qualify or have not been designated as hedges under Statement of Financial Accounting Standards (SFAS) 133, must be recorded in our income. This creates the risk of volatility in earnings even if no economic impact to the Company has occurred during the applicable period.
The impact of changes in market prices for natural gas on the average gas prices received by us may be reduced based on the level of our hedging strategies. These hedging arrangements may limit our potential gains if the market prices for natural gas were to rise substantially over the price established by the hedge. In addition, our hedging arrangements expose us to the risk of financial loss in certain circumstances, including instances in which:
| | |
| • | Production is less than expected; |
|
| • | The hedging instrument is not perfectly effective in mitigating the risk being hedged; and |
|
| • | The counterparties to our hedging arrangements fail to honor their financial commitments. |
Our investments and projects located outside of the United States expose us to risks related to the laws of other countries, and the taxes, economic conditions, fluctuations in currency rates, political conditions and policies of foreign governments. These risks might delay or reduce our realization of value from our international projects.
We currently own and might acquireand/or dispose of material energy-related investments and projects outside the United States. The economic and political conditions in certain countries where we have interests or in which we might explore development, acquisition or investment opportunities present risks of delays in construction and interruption of business, as well as risks of war, expropriation, nationalization, renegotiation, trade sanctions or nullification of existing contracts and changes in law or tax policy, that are greater than in the United States. The uncertainty of the legal environment in certain foreign countries in which we develop or acquire projects or make investments could make it more difficult to obtain non-recourse project financing or other financing on suitable terms, could adversely affect the ability of certain customers to honor their obligations with respect to such projects or investments and could impair our ability to enforce our rights under agreements relating to such projects or investments. Recent events in certain South American countries, particularly the continued threat of nationalization of certain energy-related assets in Venezuela, could have a material negative impact on our results of operations. We may not receive adequate compensation, or any compensation, if our assets in Venezuela are nationalized.
Operations and investments in foreign countries also can present currency exchange rate and convertibility, inflation and repatriation risk. In certain situations under which we develop or acquire projects or make investments, economic and monetary conditions and other factors could affect our ability to convert to U.S. dollars our earnings denominated in foreign currencies. In addition, risk from fluctuations in currency exchange rates can arise when our foreign subsidiaries expend or borrow funds in one type of currency, but receive revenue in another. In such cases, an adverse change in exchange rates can reduce our ability to meet expenses, including debt service obligations. We may or may not put contracts in place designed to mitigate our foreign currency exchange risks. We have some exposures that are not hedged and which could result in losses or volatility in our results of operations.
Our operating results for certain segments of our business might fluctuate on a seasonal and quarterly basis.
Revenues from certain segments of our business can have seasonal characteristics. In many parts of the country, demand forNGLs, natural gas and other fuels peaks during the winter. As a result, our overall operating results in the future might fluctuate substantially on a seasonal basis. Demand for natural gas and other fuels could vary
26
significantly from our expectations depending on the nature and location of our facilities and pipeline systems and the terms of our natural gas transportation arrangements relative to demand created by unusual weather patterns. Additionally, changes in the price of natural gas could benefit one of our business units, but disadvantage another. For example, our Exploration & Production business may benefit from higher natural gas prices, and Midstream, which uses gas as a feedstock, may not.
Risks Related to Strategy and Financing
Our debt agreements impose restrictions on us that may adversely affect our ability to operate our business.
Certain of our debt agreements contain covenants that restrict or limit, among other things, our ability to create liens supporting indebtedness, sell assets, make certain distributions, and incur additional debt. In addition, our debt agreements contain, and those we enter into in the future may contain, financial covenants and other limitations with which we will need to comply. Our ability to comply with these covenants may be affected by many events beyond our control, and we cannot assure you that our future operating results will be sufficient to comply with the covenants or, in the event of a default under any of our debt agreements, to remedy that default.
Our failure to comply with the covenants in our debt agreements and other related transactional documents could result in events of default. Upon the occurrence of such an event of default, the lenders could elect to declare all amounts outstanding under a particular facility to be immediately due and payable and terminate all commitments, if any, to extend further credit. An event of default or an acceleration under one debt agreement could cause a cross-default or cross-acceleration of another debt agreement. Such a cross-default or cross-acceleration could have a wider impact on our liquidity than might otherwise arise from a default or acceleration of a single debt instrument. If an event of default occurs, or if other debt agreements cross-default, and the lenders under the affected debt agreements accelerate the maturity of any loans or other debt outstanding to us, we may not have sufficient liquidity to repay amounts outstanding under such debt agreements.
Our ability to repay, extend or refinance our existing debt obligations and to obtain future credit will depend primarily on our operating performance, which will be affected by general economic, financial, competitive, legislative, regulatory, business and other factors, many of which are beyond our control. Our ability to refinance existing debt obligations or obtain future credit will also depend upon the current conditions in the credit markets and the availability of credit generally. If we are unable to meet our debt service obligations or obtain future credit on favorable terms, if at all, we could be forced to restructure or refinance our indebtedness, seek additional equity capital or sell assets. We may be unable to obtain financing or sell assets on satisfactory terms, or at all.
Events in the global credit markets created a shortage in the availability of credit and have led to credit market volatility.
In 2008, global credit markets experienced a shortage in overall liquidity and a resulting disruption in the availability of credit. While we cannot predict the occurrence of future disruptions or the duration of the current volatility in the credit markets, we believe cash on hand and cash provided by operating activities, as well as availability under our existing financing agreements will provide us with adequate liquidity. However, our ability to borrow under our existing financing agreements,commodities, including our bank credit facilities, could be negatively impacted if one or more of our lenders fail to honor its contractual obligation to lend to us. Continuing volatility or additional disruptions, including the bankruptcy or restructuring of certain financial institutions, may adversely affect the availability of credit already arranged and the availability and cost of credit in the future.
The continuation of recent economic conditions, including disruptions in the global credit markets, could adversely affect our results of operations.
The slowdown in the economy and the significant disruptions and volatility in global credit markets have the potential to negatively impact our businesses in many ways. Included among these potential negative impacts are reduced demand and lower prices for our products and services, increased difficulty in collecting amounts owed to us by our customers and a reduction in our credit ratings (either due to tighter rating standards or the negative impacts described above), which could result in reducing our access to credit markets, raising the cost of such access or requiring us to provide additional collateral to our counterparties.
27
A downgrade of our current credit ratings could impact our liquidity, access to capital and our costs of doing business, and maintaining current credit ratings is within the control of independent third parties.
A downgrade of our credit rating might increase our cost of borrowing and would require us to post additional collateral with third parties, negatively impacting our available liquidity. Our ability to access capital markets would also be limited by a downgrade of our credit rating and other disruptions. Such disruptions could include:
| | |
| • | Economic downturns; |
|
| • | Deteriorating capital market conditions; |
|
| • | Declining market prices for natural gas, natural gas liquids and other commodities; |
|
| • | Terrorist attacks or threatened attacks on our facilities or those of other energy companies; and |
|
| • | The overall health of the energy industry, including the bankruptcy or insolvency of other companies. |
Credit rating agencies perform independent analysis when assigning credit ratings. The analysis includes a number of criteria including, but not limited to, business composition, market and operational risks, as well as various financial tests. Credit rating agencies continue to review the criteria for industry sectors and various debt ratings and may make changes to those criteria from time to time. Our corporate family credit rating and the credit ratings of Transco and Northwest Pipeline were raised to investment grade in 2007 by Standard & Poor’s, Moody’s Corporation, and Fitch Ratings, Ltd., and our senior unsecured debt ratings were raised to investment grade by Moody’s and Fitch. No assurance can be given that the credit rating agencies will continue to assign us investment grade ratings even if we meet or exceed their criteria for investment grade ratios or that our senior unsecured debt rating will be raised to investment grade by all of the credit rating agencies.
Prices for natural gas liquids, natural gas and other commoditiesoil, are volatile and this volatility could adversely affect our financial results, cash flows, access to capital and ability to maintain our existing businesses.
Our revenues, operating results, future rate of growth and the value of certain segmentscomponents of our businesses depend primarily upon the prices we receive forof NGLs, natural gas, oil, or other commodities, and the differences between
24
prices of these commodities. Price volatility can impact both the amount we receive for our products and services and the volume of products and services we sell. Prices affect the amount of cash flow available for capital expenditures and our ability to borrow money or raise additional capital.
Any of the foregoing can also have an adverse effect on our business, results of operations, financial condition and cash flows.The markets for NGLs, natural gas, oil and other commodities are likely to continue to be volatile. Wide fluctuations in prices might result from relatively minor changes in the supply of and demand for these commodities, market uncertainty and other factors that are beyond our control, including:
| | |
| • | Worldwide and domestic supplies of and demand for natural gas, NGLs, oil, petroleum, and related commodities; |
|
| • | Turmoil in the Middle East and other producing regions; |
|
| • | The activities of the Organization of Petroleum Exporting Countries; |
|
| • | Terrorist attacks on production or transportation assets; |
|
| • | Weather conditions; |
|
| • | The level of consumer demand; |
|
| • | The price and availability of other types of fuels; |
|
| • | The availability of pipeline capacity; |
|
| • | Supply disruptions, including plant outages and transportation disruptions; |
|
| • | The price and level of foreign imports; |
28
Turmoil in the Middle East and other producing regions;The activities of the Organization of Petroleum Exporting Countries;
Terrorist attacks on production or transportation assets;
| | |
| • | Domestic and foreign governmental regulations and taxes; |
|
| • | Volatility in the natural gas markets; |
|
| • | The overall economic environment; |
|
| • | The credit of participants in the markets where products are bought and sold; and |
|
| • | The adoption of regulations or legislation relating to climate change. |
The level of consumer demand;
The price and availability of other types of fuels;
The availability of pipeline capacity;
Supply disruptions, including plant outages and transportation disruptions;
The price and quantity of foreign imports of natural gas and oil;
Domestic and foreign governmental regulations and taxes;
Volatility in the natural gas and oil markets;
The overall economic environment;
The credit of participants in the markets where products are bought and sold;
The adoption of regulations or legislation relating to climate change and changes in natural gas production from exploration and production areas that we serve.
We might not be able to successfully manage the risks associated with selling and marketing products in the wholesale energy markets.Our portfolio of derivative and other energy contracts may consist of wholesale contracts to buy and sell commodities, including contracts for natural gas, NGLs and other commodities that are settled by the delivery of the commodity or cash throughout the United States. If the values of these contracts change in a direction or manner that we do not anticipate or cannot manage, it could negatively affect our results of operations. In the past, certain marketing and trading companies have experienced severe financial problems due to price volatility in the energy commodity markets. In certain instances this volatility has caused companies to be unable to deliver energy commodities that they had guaranteed under contract. If such a delivery failure were to occur in one of our contracts, we might incur additional losses to the extent of amounts, if any, already paid to, or received from, counterparties. In addition, in our businesses, we often extend credit to our counterparties. Despite performing credit analysis prior to extending credit, we are exposed to the risk that we might not be able to collect amounts owed to us. If the counterparty to such a transaction fails to perform and any collateral that secures our counterparty’s obligation is inadequate, we will suffer a loss. A general downturnDownturns in the economy and tightening ofor disruptions in the global credit markets could cause more of our counterparties to fail to perform than we expect.
25
Certain of our gas pipeline services are subject to long-term, fixed-price contracts that are not subject to adjustment, even if our cost to perform such services exceeds the revenues received from such contracts.
Our gas pipelines provide some services pursuant to long-term, fixed price contracts. It is possible that costs to perform services under such contracts will exceed the revenues they collect for their services. Although most of the services are priced at cost-based rates that are subject to adjustment in rate cases, under FERC policy, a regulated service provider and a customer may mutually agree to sign a contract for service at a “negotiated rate” that may be above or below the FERC regulated cost-based rate for that service. These “negotiated rate” contracts are not generally subject to adjustment for increased costs that could be produced by inflation or other factors relating to the specific facilities being used to perform the services.
We may not be able to maintain or replace expiring natural gas transportation and storage contracts at favorable rates or on a long-term basis.
Our primary exposure to market risk for our gas pipelines occurs at the time the terms of their existing transportation and storage contracts expire and are subject to termination. Upon expiration of the terms, we may not be able to extend contracts with existing customers to obtain replacement contracts at favorable rates or on a long-term basis.
The extension or replacement of existing contracts depends on a number of factors beyond our control, including:
The level of existing and new competition to deliver natural gas to our markets;
The growth in demand for natural gas in our markets;
Whether the market will continue to support long-term firm contracts;
Whether our business strategy continues to be successful;
The level of competition for natural gas supplies in the production basins serving us;
The effects of state regulation on customer contracting practices.
Any failure to extend or replace a significant portion of our existing contracts may have expected.a material adverse effect on our business, financial condition, results of operations and cash flows.
Our risk management and measurement systems and hedging activities might not be effective and could increase the volatility of our results.
The systems we use to quantify commodity price risk associated with our businesses might not always be followed or might not always be effective. Further, such systems do not in themselves manage risk, particularly risks outside of our control, and adverse changes in energy commodity market prices, volatility, adverse correlation of commodity prices, the liquidity of markets, changes in interest rates and other risks discussed in this report might still adversely affect our earnings, cash flows and balance sheet under applicable accounting rules, even if risks have been identified.
In an effort to manage our financial exposure related to commodity price and market fluctuations, we have entered and may in the future enter into contracts to hedge certain risks associated with our assets and operations. In these hedging activities, we have used and may in the future use fixed-price, forward, physical purchase and sales contracts, futures, financial swaps and option contracts traded in the over-the-counter markets or on exchanges. Nevertheless, no single hedging arrangement can adequately address all risks present in a given contract. For example, a forward contract that would be effective in hedging commodity price volatility risks would not hedge the contract’s counterparty credit or performance risk. Therefore, unhedged risks will always continue to exist. While we attempt to manage counterparty credit risk within guidelines established by our credit policy, we may not be able to successfully manage all credit risk and as such, future cash flows and results of operations could be impacted by counterparty default.
26
Our use of hedging arrangements through which we attempt to reduce the economic risk of our participation in commodity markets could result in increased volatility of our reported results. Changes in the fair values (gains and losses) of derivatives that qualify as hedges under generally accepted accounting principles (GAAP), to the extent that such hedges are not fully effective in offsetting changes to the value of the hedged commodity, as well as changes in the fair value of derivatives that do not qualify or have not been designated as hedges under GAAP, must be recorded in our income. This creates the risk of volatility in earnings even if no economic impact to us has occurred during the applicable period.
The impact of changes in market prices for NGLs and natural gas on the average prices paid or received by us may be reduced based on the level of our hedging activities. These hedging arrangements may limit or enhance our margins if the market prices for NGLs or natural gas were to change substantially from the price established by the hedges. In addition, our hedging arrangements expose us to the risk of financial loss in certain circumstances, including instances in which:
Volumes are less than expected;
The hedging instrument is not perfectly effective in mitigating the risk being hedged;
The counterparties to our hedging arrangements fail to honor their financial commitments.
The adoption and implementation of new statutory and regulatory requirements for derivative transactions could have an adverse impact on our ability to hedge risks associated with our business and increase the working capital requirements to conduct these activities.
In July 2010, federal legislation known as the Dodd-Frank Wall Street Reform and Consumer Protection Act (the Act) was enacted. The Act provides for new statutory and regulatory requirements for derivative transactions, including oil and gas hedging transactions. Among other things, the Act provides for the creation of position limits for certain derivatives transactions, as well as requiring certain transactions to be cleared on exchanges for which cash collateral will be required. The final impact of the Act on our hedging activities is uncertain at this time due to the requirement that the SEC and the Commodities Futures Trading Commission (CFTC) promulgate rules and regulations implementing the new legislation within 360 days from the date of enactment. These new rules and regulations could significantly increase the cost of derivative contracts, materially alter the terms of derivative contracts or reduce the availability of derivatives. Although we believe the derivative contracts that we enter into should not be impacted by position limits and should be exempt from the requirement to clear transactions through a central exchange or to post collateral, the impact upon our businesses will depend on the outcome of the implementing regulations adopted by the CFTC.
Depending on the rules and definitions adopted by the CFTC or similar rules that may be adopted by other regulatory bodies, we might in the future be required to provide cash collateral for our commodities hedging transactions under circumstances in which we do not currently post cash collateral. Posting of such additional cash collateral could impact liquidity and reduce our cash available for capital expenditures. A requirement to post cash collateral could therefore reduce our ability to execute hedges to reduce commodity price uncertainty and thus protect cash flows. If we reduce our use of derivatives as a result of the Act and regulations, our results of operations may become more volatile and our cash flows may be less predictable.
We depend on certain key customers for a significant portion of our revenues. The loss of any of these key customers or the loss of any contracted volumes could result in a decline in our business.
Our gas pipeline and midstream businesses rely on a limited number of customers for a significant portion of their revenues. Although some of these customers are subject to long-term contracts, extensions or replacements of these contracts may not be renegotiated on favorable terms, if at all. The loss of all, or even a portion of the revenues from natural gas, NGLs or contracted volumes, as applicable, supplied by these customers, as a result of competition, creditworthiness, inability to negotiate extensions or replacements of contracts or otherwise, could have a material adverse effect on our business, financial condition, results of operations, and cash flows, unless we are able to acquire comparable volumes from other sources.
27
We are exposed to the credit risk of our customers and counterparties, and our credit risk management may not be adequate to protect against such risk.
We are subject to the risk of loss resulting from nonpayment and/or nonperformance by our customers and counterparties in the ordinary course of our business. Generally, our customers are rated investment grade, are otherwise considered creditworthy or are required to make prepayments or provide security to satisfy credit concerns. However, our credit procedures and policies may not be adequate to fully eliminate customer and counterparty credit risk. We cannot predict to what extent our business would be impacted by deteriorating conditions in the economy, including declines in our customers’ and counterparties’ creditworthiness. If we fail to adequately assess the creditworthiness of existing or future customers and counterparties, unanticipated deterioration in their creditworthiness and any resulting increase in nonpayment and/or nonperformance by them could cause us to write-down or write-off doubtful accounts. Such write-downs or write-offs could negatively affect our operating results in the periods in which they occur, and, if significant, could have a material adverse effect on our business, results of operations, cash flows and financial condition.
Our industry is highly competitive, and increased competitive pressure could adversely affect our business and operating results.
We have numerous competitors in all aspects of our businesses, and additional competitors may enter our markets. Other companies with which we compete may be able to respond more quickly to new laws or regulations or emerging technologies, or to devote greater resources to the construction, expansion or refurbishment of their facilities than we can. In addition, current or potential competitors may make strategic acquisitions or have greater financial resources than we do, which could affect our ability to make investments or acquisitions. Similarly, a highly-liquid competitive commodity market in natural gas and increasingly competitive markets for natural gas services, including competitive secondary markets in pipeline capacity, have developed. As a result, pipeline capacity is being used more efficiently, and peaking and storage services are increasingly effective substitutes for annual pipeline capacity. We may not be able to compete successfully against current and future competitors and any failure to do so could have a material adverse effect on our business, financial condition, results of operations, and cash flows.
Our operations are subject to operational hazards and unforeseen interruptions for which they may not be adequately insured.
There are operational risks associated with gathering, transporting, storage, processing and treating of natural gas and the fractionation and storage of NGLs, including:
Hurricanes, tornadoes, floods, fires, extreme weather conditions, and other natural disasters;
Aging infrastructure and mechanical problems;
Damages to pipelines and pipeline blockages or other pipeline interruptions;
Uncontrolled releases of natural gas (including sour gas), NGLs, brine or industrial chemicals;
Collapse or failure of storage caverns;
Damage caused by third-party activity, such as operation of construction equipment;
Pollution and other environmental risks;
Fires, explosions, craterings and blowouts;
Risks related to truck and rail loading and unloading;
Risks related to operating in a marine environment;
Terrorist attacks or threatened attacks on our facilities or those of other energy companies.
28
Any of these risks could result in loss of human life, personal injuries, significant damage to property, environmental pollution, impairment of our operations and substantial losses to us. In accordance with customary industry practice, we maintain insurance against some, but not all, of these risks and losses, and only at levels we believe to be appropriate. The location of certain segments of our facilities in or near populated areas, including residential areas, commercial business centers and industrial sites, could increase the level of damages resulting from these risks. In spite of our precautions, an event such as those described above could cause considerable harm to people or property, and could have a material adverse effect on our financial condition and results of operations, particularly if the event is not fully covered by insurance. Accidents or other operating risks could further result in loss of service available to our customers.
Our costs of testing, maintaining or repairing our facilities may exceed our expectations and the FERC or competition in our markets may not allow us to recover such costs in the rates we charge for our services.
We have experienced unexpected leaks or ruptures on one of our gas pipeline systems, including a rupture near Appomattox, Virginia in 2008 and a rupture near Sweet Water, Alabama in 2011. We could experience additional unexpected leaks or ruptures on our gas pipeline systems, or be required by regulatory authorities to test or undertake modifications to our systems that could result in a material adverse impact on our business, financial condition and results of operations if the costs of testing, maintaining or repairing our facilities exceed current expectations and the FERC or competition in our markets do not allow us to recover such costs in the rates we charge for our service. For example, in response to a recent third-party pipeline rupture, PHMSA issued an Advisory Bulletin which, among other things, advises pipeline operators that if they are relying on design, construction, inspection, testing, or other data to determine the pressures at which their pipelines should operate, the records of that data must be traceable, verifiable and complete. More recently, the Pipeline Safety, Regulatory Certainty, and Job Creation Act of 2011 became law and under this statute PHMSA may issue additional regulations addressing such records. Locating such records and, in the absence of any such records, verifying maximum pressures through physical testing or modifying or replacing facilities to meet the demands of such pressures, could significantly increase our costs. Additionally, failure to locate such records or verify maximum pressures could result in reductions of allowable operating pressures, which would reduce available capacity on our pipelines.
We do not insure against all potential losses and could be seriously harmed by unexpected liabilities or by the inability of our insurers to satisfy our claims.
We are not fully insured against all risks inherent to our business, including environmental accidents. We do not maintain insurance in the type and amount to cover all possible risks of loss.
We currently maintain excess liability insurance with limits of $610 million per occurrence and in the annual aggregate with $2 million per occurrence deductible. This insurance covers us, our subsidiaries, and certain of our affiliates for legal and contractual liabilities arising out of bodily injury or property damage, including resulting loss of use to third parties. This excess liability insurance includes coverage for sudden and accidental pollution liability for full limits, with the first $135 million of insurance also providing gradual pollution liability coverage for natural gas and NGL operations.
Although we maintain property insurance on certain physical assets that we own, lease or are responsible to insure, the policy may not cover the full replacement cost of all damaged assets or the entire amount of business interruption loss we may experience. In addition, certain perils may be excluded from coverage or sub-limited. We may not be able to maintain or obtain insurance of the type and amount we desire at reasonable rates. We may elect to self insure a portion of our risks. We do not insure our onshore underground pipelines for physical damage, except at certain locations such as river crossings and compressor stations. Offshore assets are covered for property damage when loss is due to a named windstorm event and coverage for loss caused by a named windstorm is significantly sub-limited and subject to a large deductible. All of our insurance is subject to deductibles. If a significant accident or event occurs for which we are not fully insured it could adversely affect our operations and financial condition.
29
In addition, to the insurance coverage described above, we are a member of Oil Insurance Limited (OIL), an energy industry mutual insurance company, which provides coverage for damage to our property. As an insured of OIL, we share in the losses among other OIL members even if our property is not damaged.
Furthermore, any insurance company that provides coverage to us may experience negative developments that could impair their ability to pay any of our claims. As a result, we could be exposed to greater losses than anticipated and may have to obtain replacement insurance, if available, at a greater cost.
The occurrence of any risks not fully covered by insurance could have a material adverse effect on our business, financial condition, results of operations and cash flows, and our ability to repay our debt.
Execution of our capital projects subjects us to construction risks, increases in labor costs and materials, and other risks that may adversely affect financial results.
The growth in our gas pipeline and midstream businesses may be dependent upon the construction of new natural gas gathering, transportation, compression, processing or treating pipelines and facilities or natural gas liquids fractionation or storage facilities, as well as the expansion of existing facilities. Construction or expansion of these facilities is subject to various regulatory, development and operational risks, including:
The ability to obtain necessary approvals and permits by regulatory agencies on a timely basis and on acceptable terms;
The availability of skilled labor, equipment, and materials to complete expansion projects;
Potential changes in federal, state and local statutes and regulations, including environmental requirements, that prevent a project from proceeding or increase the anticipated cost of the project;
Impediments on our ability to acquire rights-of-way or land rights on a timely basis and on acceptable terms;
The ability to construct projects within estimated costs, including the risk of cost overruns resulting from inflation or increased costs of equipment, materials, labor, or other factors beyond our control, that may be material;
The ability to access capital markets to fund construction projects.
Any of these risks could prevent a project from proceeding, delay its completion or increase its anticipated costs. As a result, new facilities may not achieve expected investment return, which could adversely affect our results of operations, financial position or cash flows.
Our costs and funding obligations for our defined benefit pension plans and costs for our other postretirement benefit plans are affected by factors beyond our control.
We have defined benefit pension plans covering substantially all of our U.S. employees and other post-retirement benefit plans covering certain eligible participants. The timing and amount of our funding requirements under the defined benefit pension plans depend upon a number of factors we control, including changes to pension plan benefits, as well as factors outside of our control, such as asset returns, interest rates and changes in pension laws. Changes to these and other factors that can significantly increase our funding requirements could have a significant adverse effect on our financial condition and results of operations.
One of our subsidiaries acts as the general partner of a publicly traded limited partnership, Williams Partners L.P. As such, this subsidiary’s operations may involve a greater risk of liability than ordinary business operations.
One of our subsidiaries acts as the general partner of WPZ, a publicly traded limited partnership. This subsidiary may be deemed to have undertaken fiduciary obligations with respect to WPZ as the general partner and to the limited partners of WPZ. Activities determined to involve fiduciary obligations to other persons or entities typically involve a higher standard of conduct than ordinary business operations and therefore may
30
involve a greater risk of liability, particularly when a conflict of interests is found to exist. Our control of the general partner of WPZ may increase the possibility of claims of breach of fiduciary duties, including claims brought due to conflicts of interest (including conflicts of interest that may arise between WPZ, on the one hand, and its general partner and that general partner’s affiliates, including us, on the other hand). Any liability resulting from such claims could be material.
Potential changes in accounting standards might cause us to revise our financial results and disclosures in the future, which might change the way analysts measure our business or financial performance.
Regulators and legislators continue to take a renewed look at accounting practices, financial disclosures, and companies’ relationships with their independent public accounting firms. It remains unclear what new laws or regulations will be adopted, and we cannot predict the ultimate impact that any such new laws or regulations could have. In addition, the Financial Accounting Standards Board, the SEC or FERC could enact new accounting standards or FERC could issue rules that might impact how we are required to record revenues, expenses, assets, liabilities and equity. Any significant change in accounting standards or disclosure requirements could have a material adverse effect on our business, results of operations, and financial condition.
Our investments and projects located outside of the United States expose us to risks related to the laws of other countries, and the taxes, economic conditions, fluctuations in currency rates, political conditions and policies of foreign governments. These risks might delay or reduce our realization of value from our international projects.
We currently own and might acquire and/or dispose of material energy-related investments and projects outside the United States. The economic, political and legal conditions and regulatory environment in the countries in which we have interests or in which we might pursue acquisition or investment opportunities present risks that are different from or greater than those in the United States. These risks include delays in construction and interruption of business, as well as risks of war, expropriation, nationalization, renegotiation, trade sanctions or nullification of existing contracts and changes in law or tax policy, including with respect to the prices we realize for the commodities we produce and sell. The uncertainty of the legal environment in certain foreign countries in which we develop or acquire projects or make investments could make it more difficult to obtain nonrecourse project financing or other financing on suitable terms, could adversely affect the ability of certain customers to honor their obligations with respect to such projects or investments and could impair our ability to enforce our rights under agreements relating to such projects or investments.
Operations and investments in foreign countries also can present currency exchange rate and convertibility, inflation and repatriation risk. In certain situations under which we develop or acquire projects or make investments, economic and monetary conditions and other factors could affect our ability to convert to U.S. dollars our earnings denominated in foreign currencies. In addition, risk from fluctuations in currency exchange rates can arise when our foreign subsidiaries expend or borrow funds in one type of currency, but receive revenue in another. In such cases, an adverse change in exchange rates can reduce our ability to meet expenses, including debt service obligations. We may or may not put contracts in place designed to mitigate our foreign currency exchange risks. We have some exposures that are not hedged and which could result in losses or volatility in our results of operations.
Our operating results for certain components of our business might fluctuate on a seasonal and quarterly basis.
Revenues from certain components of our business can have seasonal characteristics. In many parts of the country, demand for natural gas and other fuels peaks during the winter. As a result, our overall operating results in the future might fluctuate substantially on a seasonal basis. Demand for natural gas and other fuels could vary significantly from our expectations depending on the nature and location of our facilities and pipeline systems and the terms of our natural gas transportation arrangements relative to demand created by unusual weather patterns.
31
We do not own all of the land on which our pipelines and facilities are located, which could disrupt our operations.
We do not own all of the land on which our pipelines and facilities have been constructed. As such, we are subject to the possibility of increased costs to retain necessary land use. In those instances in which we do not own the land on which our facilities are located, we obtain the rights to construct and operate our pipelines and gathering systems on land owned by third parties and governmental agencies for a specific period of time. In addition, some of our facilities cross Native American lands pursuant to rights-of-way of limited term. We may not have the right of eminent domain over land owned by Native American tribes. Our loss of these rights, through our inability to renew right-of-way contracts or otherwise, could have a material adverse effect on our business, results of operations, and financial condition and cash flows.
Risks Related to Strategy and Financing
Our debt agreements impose restrictions on us that may limit our access to credit and adversely affect our ability to operate our business.
Certain of our debt agreements contain various covenants that restrict or limit, among other things, our ability and our material subsidiaries ability to grant certain liens to support indebtedness, our ability to merge or consolidate or sell all or substantially all of our assets, enter into certain affiliate transactions, make certain distributions during the continuation of an event of default, and the ability of our subsidiaries to incur additional debt. In addition, our debt agreements contain, and those we enter into in the future may contain, financial covenants and other limitations with which we will need to comply. These covenants could adversely affect our ability to finance our future operations or capital needs or engage in, expand or pursue our business activities and prevent us from engaging in certain transactions that might otherwise be considered beneficial to us. Our ability to comply with these covenants may be affected by events beyond our control, including prevailing economic, financial and industry conditions. If market or other economic conditions deteriorate, our current assumptions about future economic conditions turn out to be incorrect or unexpected events occur, our ability to comply with these covenants may be significantly impaired.
Our failure to comply with the covenants in our debt agreements could result in events of default. Upon the occurrence of such an event of default, the lenders could elect to declare all amounts outstanding under a particular facility to be immediately due and payable and terminate all commitments, if any, to extend further credit. Certain payment defaults or an acceleration under one debt agreement could cause a cross-default or cross-acceleration of another debt agreement. Such a cross-default or cross-acceleration could have a wider impact on our liquidity than might otherwise arise from a default or acceleration of a single debt instrument. If an event of default occurs, or if other debt agreements cross-default, and the lenders under the affected debt agreements accelerate the maturity of any loans or other debt outstanding to us, we may not have sufficient liquidity to repay amounts outstanding under such debt agreements. For more information regarding our debt agreements, please read “Management’s Discussion and Analysis of Financial Condition and Results of Operations—Management’s Discussion and Analysis of Financial Condition and Liquidity.”
Our ability to repay, extend or refinance our existing debt obligations and to obtain future credit will depend primarily on our operating performance, which will be affected by general economic, financial, competitive, legislative, regulatory, business and other factors, many of which are beyond our control. Our ability to refinance existing debt obligations or obtain future credit will also depend upon the current conditions in the credit markets and the availability of credit generally. If we are unable to meet our debt service obligations or obtain future credit on favorable terms, if at all, we could be forced to restructure or refinance our indebtedness, seek additional equity capital or sell assets. We may be unable to obtain financing or sell assets on satisfactory terms, or at all.
32
Our cash flow depends heavily on the earnings and distributions of WPZ
Our partnership interest in WPZ is one of our largest cash-generating assets. Therefore, our cash flow is heavily dependent upon the ability of WPZ to make distributions to its partners. A significant decline in WPZ’s earnings and/or distributions would have a corresponding negative impact on us.
Difficult conditions in the global capital markets, the credit markets and the economy in general could negatively affect our business and results of operations.
Our businesses may be negatively impacted by adverse economic conditions or future disruptions in global financial markets. Included among these potential negative impacts are reduced energy demand and lower prices for our products and services, increased difficulty in collecting amounts owed to us by our customers and a reduction in our credit ratings (either due to tighter rating standards or the negative impacts described above), which could reduce our access to credit markets, raise the cost of such access or require us to provide additional collateral to our counterparties. If financing is not available when needed, or is available only on unfavorable terms, we may be unable to implement our business plans or otherwise take advantage of business opportunities or respond to competitive pressures.
A downgrade of our credit ratings could impact our liquidity, access to capital and our costs of doing business, and independent third parties outside our control determine our credit ratings.
A downgrade of our credit ratings might increase our cost of borrowing and could require us to post collateral with third parties, negatively impacting our available liquidity. Our ability to access capital markets could also be limited by a downgrade of our credit ratings and other disruptions. Such disruptions could include:
Deteriorating capital market conditions;
Declining market prices for natural gas, NGLs, oil and other commodities;
Terrorist attacks or threatened attacks on our facilities or those of other energy companies;
The overall health of the energy industry, including the bankruptcy or insolvency of other companies.
Credit rating agencies perform independent analysis when assigning credit ratings. The analysis includes a number of criteria including, but not limited to, business composition, market and operational risks, as well as various financial tests. Credit rating agencies continue to review the criteria for industry sectors and various debt ratings and may make changes to those criteria from time to time. Credit ratings are not recommendations to buy, sell or hold investments in the rated entity. Ratings are subject to revision or withdrawal at any time by the ratings agencies, and no assurance can be given that we will maintain our current credit ratings or that our senior unsecured debt rating will be raised to investment grade by all of the credit rating agencies.
Our acquisition attempts may not be successful or may result in completed acquisitions that do not perform as anticipated.
We have made and may continue to make acquisitions of businesses and properties. However, suitable acquisition candidates may not continue to be available on terms and conditions we find acceptable. The following are some of the risks associated with acquisitions, including any completed or future acquisitions:
Some of the acquired businesses or properties may not produce revenues, earnings or cash flow at anticipated levels or could have environmental, permitting or other problems for which contractual protections prove inadequate;
We may assume liabilities that were not disclosed to us or that exceed our estimates;
We may be unable to integrate acquired businesses successfully and realize anticipated economic, operational and other benefits in a timely manner, which could result in substantial costs and delays or other operationally, technical or financial problems;
Acquisitions could disrupt our ongoing business, distract management, divert resources and make it difficult to maintain our current business standards, controls and procedures.
33
Risks Related to Regulations that Affect Our Industry
Our gas pipelines could be subject to penalties and fines if they fail to comply with laws governing our Industrybusinesses.
Our gas pipeline’s transportation and storage operations are regulated by numerous governmental agencies including the FERC, the EPA and PHMSA. Should our gas pipelines fail to comply with all applicable statutes, rules, regulations and orders, they could be subject to substantial penalties and fines. Under the Energy Policy Act of 2005, FERC has civil penalty authority under the NGA to impose penalties for current violations of up to $1,000,000 per day for each violation and under the recently enacted Pipeline Safety, Regulatory Certainty, and Job Creation Act of 2011, PHMSA has civil penalty authority up to $200,000 per day (from the prior $100,000), with a maximum of $2 million for any related series of violations (from the prior $1 million). Any material penalties or fines under these or other statutes, rules, regulations or orders could have a material adverse impact on our gas pipeline business, financial condition, results of operations and cash flows.
OurThe natural gas sales, transportation and storage operations of our gas pipelines are subject to regulation by the FERC, which could have an adverse impact on their ability to establish transportation and storage rates that would allow them to recover the full cost of operating their respective pipelines, including a reasonable rate of return.
The natural gas sales, transmission and storage operations of the gas pipelines are subject to government regulationsfederal, state and rate proceedings that could have an adverse impact on our results of operations.
Ourlocal regulatory authorities. Specifically, their interstate
natural gas sales,pipeline transportation and storage
operations conducted through our Gas Pipelines business areservice is subject to
regulation by the
FERC’s rulesFERC. The federal regulation extends to such matters as:Transportation and regulationssale for resale of natural gas in accordanceinterstate commerce;
Rates, operating terms, and conditions of service, including initiation and discontinuation of service;
The types of services the gas pipelines may offer their customers;
Certification and construction of new interstate pipelines and storage facilities;
Acquisition, extension, disposition or abandonment of existing interstate pipelines and storage facilities;
Depreciation and amortization policies;
Relationships with affiliated companies who are involved in marketing functions of the natural gas business;
Market manipulation in connection with interstate sales, purchases or transportation of natural gas.
Under the NGA, FERC has authority to regulate providers of natural gas pipeline transportation and the Natural Gas Policy Actstorage services in interstate commerce, and such providers may only charge rates that have been determined to be just and reasonable by FERC. In addition, FERC prohibits providers from unduly preferring or unreasonably discriminating against any person with respect to pipeline rates or terms and conditions of 1978. The FERC’s regulatory authority extends to:
| | |
| • | Transportation and sale for resale of natural gas in interstate commerce; |
|
| • | Rates, operating terms and conditions of service, including initiation and discontinuation of services; |
|
| • | Certification and construction of new facilities; |
|
| • | Acquisition, extension, disposition or abandonment of facilities; |
|
| • | Accounts and records; |
|
| • | Depreciation and amortization policies; |
|
| • | Relationships with marketing functions within Williams involved in certain aspects of the natural gas business; and |
|
| • | Market manipulation in connection with interstate sales, purchases or transportation of natural gas. |
service.Regulatory actions in these areas can affect our business in many ways, including decreasing tariff rates and revenues, decreasing volumes in our pipelines, increasing our costs and otherwise altering the profitability of our pipeline business. Regulatory decisions
Unlike other interstate pipelines that own facilities in the offshore Gulf of Mexico, Transco charges its transportation customers a separate fee to access its offshore facilities. The separate charge is referred to as an “IT feeder” charge. The “IT feeder” rate is charged only when gas is actually transported on the facilities and typically it is paid by producers or marketers. Because the “IT feeder” rate is typically paid by producers and marketers, it generally results in netback prices to producers that are slightly lower than the netbacks realized by producers transporting on other interstate pipelines. This rate design disparity can result in producers bypassing Transco’s offshore facilities in favor of alternative transportation facilities.
34
The rates, terms and conditions for interstate gas pipeline services are set forth in FERC-approved tariffs. Any successful complaint or protest against the rates of the gas pipelines could have an adverse impact on their revenues associated with providing transportation services. In addition, there is a risk that rates set by FERC in future rate cases filed by the gas pipelines will be inadequate to recover increases in operating costs or to sustain an adequate return on capital investments. There is also the risk that higher rates would cause their customers to look for alternative ways to transport natural gas.
We are subject to risks associated with climate change.
There is a growing belief that emissions of greenhouse gases (GHGs) may be linked to climate change. Climate change and the costs that may be associated with its impacts and the regulation of GHGs have the potential to affect our business in many ways, including negatively impacting the costs we incur in providing our products and services, the demand for compression, processing and dehydrationconsumption of natural gas,our products and services (due to change in both costs and weather patterns), and the economic health of the regions in which we operate, all of which can create financial risks.
In addition, legislative and regulatory responses related to GHGs and climate change create the potential for financial risk. The U.S. Congress and certain states have for some time been considering various forms of legislation related to GHG emissions. There have also been international efforts seeking legally binding reductions in emissions of GHGs. In addition, increased public awareness and concern may result in more state, regional and/or federal requirements to reduce or mitigate GHG emissions.
Numerous states and other jurisdictions have announced or adopted programs to stabilize and reduce GHGs. In 2009, the U.S. Environmental Protection Agency (EPA) issued a final determination that six GHGs are a threat to public safety and welfare. In 2011, the EPA implemented permitting for new and/or modified large sources of GHG emissions through the existing Prevention of Signification Deterioration permitting program. Additional direct regulation of GHG emissions in our industry may be implemented under other Clean Air Act programs, including the New Source Performance Standards program.
The recent actions of the EPA and the passage of any federal or state climate change laws or regulations could result in increased costs to (i) operate and maintain our facilities, (ii) install new emission controls on our facilities, and (iii) administer and manage any GHG emissions program. If we are unable to recover or pass through a significant level of our costs related to complying with climate change regulatory requirements imposed on us, it could have a negativematerial adverse effect on our results of operations.
The FERC has taken certain actionsoperations and financial condition. To the extent financial markets view climate change and GHG emissions as a financial risk, this could negatively impact our cost of and access to
strengthen market forcescapital. Legislation or regulations that may be adopted to address climate change could also affect the markets for our products by making our products more or less desirable than competing sources of energy.Our operations are subject to governmental laws and regulations relating to the protection of the environment, which may expose us to significant costs, liabilities and expenditures and could exceed current expectations.
Substantial costs, liabilities, delays and other significant issues related to environmental laws and regulations are inherent in the gathering, transportation, storage, processing and treating of natural gas pipeline industryand fractionation of NGLs, and as a result, we may be required to make substantial expenditures that have led to increased competition throughout the industry. In a number of key markets, interstate pipelines are now facing
29
competitive pressure from other major pipeline systems, enabling local distribution companies and end users to choose a transportation provider based on considerations other than location.
Costs of environmental liabilities and complying with existing and future environmental regulations, including those related to greenhouse gas emissions, could exceed our current expectations.
Our operations are subject to extensive
environmental regulation pursuant to a variety of federal,
provincial, state,
Native American, and
municipal laws and regulations. Suchlocal laws and regulations
governing environmental protection, the discharge of materials into the environment and the security of chemical and industrial facilities. These laws include:Clean Air Act (CAA), and analogous state laws, which impose among other things, restrictions, liabilitiesobligations related to air emissions;
Clean Water Act (CWA), and obligations in connection withanalogous state laws, which regulate discharge of wastewaters and storm water from our facilities to state and federal waters, including wetlands;
35
Comprehensive Environmental Response, Compensation, and Liability Act (CERCLA), and analogous state laws, which regulate the generation, handling, use, storage, extraction, transportation, treatment and disposalcleanup of hazardous substances that may have been released at properties currently or previously owned or operated by us or locations to which we have sent wastes for disposal;
Resource Conservation and wastes,Recovery Act (RCRA), and analogous state laws, which impose requirements for the handling and discharge of solid and hazardous waste from our facilities.
Endangered Species Act (ESA), and analogous state laws, which seek to ensure that activities do not jeopardize endangered or threatened animals, fish and plant species, nor destroy or modify the critical habitat of such species;
Oil Pollution Act (OPA) of 1990, which requires oil storage facilities and vessels to submit plans to the federal government detailing how they will respond to large discharges, regulates petroleum storage tanks and related equipment, and imposes liability for spills by responsible parties.
Various governmental authorities, including the EPA, the U.S. Department of the Interior, the Bureau of Indian Affairs and analogous state agencies and tribal governments, have the power to enforce compliance with these laws and regulations and the permits issued under them, oftentimes requiring difficult and costly actions. Failure to comply with these laws, regulations, and permits may result in the assessment of administrative, civil, and criminal penalties, the imposition of remedial obligations, the imposition of stricter conditions on or revocation of permits, and the issuance of injunctions limiting or preventing some or all of our operations, delays in granting permits and cancellation of leases.
There is inherent risk of the incurrence of environmental costs and liabilities in our business, some of which may be material, due to our handling of the products as they are gathered, transported, processed, fractionated and stored, air emissions related to our operations, historical industry operations, and waste and waste disposal practices, and the prior use of flow meters containing mercury. Joint and several, strict liability may be incurred without regard to fault under certain environmental laws and regulations, including CERCLA, RCRA, and analogous state laws, for the remediation of contaminated areas and in connection with spills or releases of materials associated with natural gas, oil and emissionswastes on, under, or from our properties and facilities. Private parties, including the owners of various substances intoproperties through which our pipeline and gathering systems pass and facilities where our wastes are taken for reclamation or disposal, may have the environment, and in connection with the operation, maintenance, abandonment and reclamation of our facilities.
Compliance with environmental laws requires significant expenditures, includingright to pursue legal actions to enforce compliance as well as to seek damages for
clean up costs and damages arising out of contaminated properties. In addition, the possible failure to complynon-compliance with environmental laws and regulations
or for personal injury or property damage arising from our operations. Some sites at which we operate are located near current or former third-party hydrocarbon storage and processing or oil and natural gas operations or facilities, and there is a risk that contamination has migrated from those sites to ours. In addition, increasingly strict laws, regulations and enforcement policies could materially increase our compliance costs and the cost of any remediation that may become necessary. Our insurance may not cover all environmental risks and costs or may not provide sufficient coverage if an environmental claim is made against us.In March 2010, the EPA announced its National Enforcement Initiatives for 2011 to 2013, which includes the addition of “Energy Extraction Activities” to its enforcement priorities list. To address its concerns regarding the pollution risks raised by new techniques for oil and gas extraction and coal mining, the EPA is developing an initiative to ensure that energy extraction activities are complying with federal environmental requirements. We cannot predict what the results of this initiative would be, or whether federal, state, or local laws or regulations will be enacted in this area. If regulations were imposed related to oil and gas extraction, the volumes of natural gas that we transport could decline and our results of operations could be adversely affected.
Our business may be adversely affected by changed regulations and increased costs due to stricter pollution control requirements or liabilities resulting from noncompliance with required operating or other regulatory permits. Also, we might resultnot be able to obtain or maintain from time to time all required environmental regulatory approvals for our operations. If there is a delay in obtaining any required environmental regulatory approvals, or
36
if we fail to obtain and comply with them, the impositionoperation or construction of finesour facilities could be prevented or become subject to additional costs, resulting in potentially material adverse consequences to our business, financial condition, results of operations and penalties. cash flows.
We are generally responsible for all liabilities associated with the environmental condition of our facilities and assets, whether acquired or developed, regardless of when the liabilities arose and whether they are known or unknown. In connection with certain acquisitions and divestitures, we could acquire, or be required to provide indemnification against, environmental liabilities that could expose us to material losses, which may not be covered by insurance. In addition, the steps we could be required to take to bring certain facilities into compliance could be prohibitively expensive, and we might be required to shut down, divest or alter the operation of those facilities, which might cause us to incur losses. Although
Hydraulic fracturing is exempt from federal regulation pursuant to the federal Safe Drinking Water Act (except when the fracturing fluids or propping agents contain diesel fuels). However, public concerns have been raised related to its potential environmental impact. Additional federal, state and local laws and regulations to more closely regulate hydraulic fracturing have been considered or implemented. Legislation to further regulate hydraulic fracturing has been proposed in Congress. The U.S. Department of Interior has announced plans to formalize obligations for disclosure of chemicals associated with hydraulic fracturing on federal lands. The results of a pending EPA investigation by a committee of the House of Representatives and two recent reports by the U.S. Department of Energy’s Shale Gas Subcommittee could lead to further restrictions on hydraulic fracturing. The EPA has proposed regulations under the CAA regarding certain emissions from the hydraulic fracturing of oil and natural gas wells and announced its intention to propose regulations by 2014 under the CWA regarding wastewater discharges from hydraulic fracturing and other gas production. In addition, some state and local authorities have considered or imposed new laws and rules related to hydraulic fracturing, including additional permit requirements, operational restrictions, disclosure obligations and temporary or permanent bans on hydraulic fracturing in certain jurisdictions or in environmentally sensitive areas. We cannot predict whether any additional federal, state or local laws or regulations will be enacted in this area and if so, what their provisions would be. If additional levels of reporting, regulation or permitting moratoria were required or imposed related to hydraulic fracturing, the volumes of natural gas and other products that we do not expect that the costs of complying with current environmental laws will have a material adverse effect ontransport, gather, process and treat could decline and our financial condition or results of operations no assurance cancould be given that the costs of complying with environmental laws in the future will not have such an effect.
Legislative and regulatory responses related to climate change create financial risk. The United States Congress and certain states have for some time been considering various forms of legislation related to greenhouse gas emissions. Increased public awareness and concern may result in more state, regionaland/or federal requirements to reduce or mitigate the emission of greenhouse gases. Numerous states have announced or adopted programs to stabilize and reduce greenhouse gases and similar federal legislation has been introduced in both houses of Congress. Our pipeline, exploration and production and gas processing facilities may be subject to regulation under climate change policies introduced at either the state or federal level within the next few years. There is a possibility that, when and if enacted, the final form of such legislation could increase our costs of compliance with environmental laws. If we are unable to recover or pass through all costs related to complying with climate change regulatory requirements imposed on us, it could have a material adverse effect on our results of operations. To the extent financial markets view climate change and emissions of greenhouse gases as a financial risk, this could negatively impact our cost of and access to capital.
adversely affected.We make assumptions and develop expectations about possible expenditures related to environmental conditions based on current laws and regulations and current interpretations of those laws and regulations. If the interpretation of laws or regulations, or the laws and regulations themselves, change, our assumptions and expectations may change. Ouralso change, and any new capital costs incurred to comply with such changes may not be recoverable under our regulatory rate structure andor our contracts with customers might not necessarily allow us to recover capital costs we incur to comply with thecustomer contracts. In addition, new environmental regulations. Also, welaws and regulations might not be able to obtain or maintain from time to time all required environmental regulatory approvals for certain development projects. If there is a delay in obtaining any required environmental regulatory approvals or if we fail to obtain and comply with them, the operation of our facilities could be prevented or become subject to additional costs, resulting in potentially material adverse consequences to our results of operations.
Competition in the markets in which we operate may adversely affect our resultsproducts and activities, including fractionation, storage and transportation, as well as waste management and air emissions. For instance, federal and state agencies could impose additional safety requirements, any of operations.
We have numerous competitors in all aspects of our businesses, and additional competitors may enter our markets. Other companies with which we compete may be able to respond more quickly to new laws or regulations or emerging technologies, or to devote greater resources to the construction, expansion or refurbishment of their facilities than we can. In addition, current or potential competitors may make strategic acquisitions or have greater
30
financial resources than we do, which could affect our ability to make investments or acquisitions. There can be no assurance that we will be able to compete successfully against current and future competitors and any failure to do so could have a material adverse effect on our businesses and results of operations.
profitability.We may not be able to maintain or replace expiring natural gas transportation and storage contracts at favorable rates or on a long-term basis.
Our primary exposure to market risk for our Gas Pipelines occurs at the time the terms of their existing transportation and storage contracts expire and are subject to termination. Although none of our Gas Pipelines’ material contracts are terminable in 2009, upon expiration of the terms we may not be able to extend contracts with existing customers to obtain replacement contracts at favorable rates or on a long-term basis. The extension or replacement of existing contracts depends on a number of factors beyond our control, including:
| | |
| • | The level of existing and new competition to deliver natural gas to our markets; |
|
| • | The growth in demand for natural gas in our markets; |
|
| • | Whether the market will continue to support long-term firm contracts; |
|
| • | Whether our business strategy continues to be successful; |
|
| • | The level of competition for natural gas supplies in the production basins serving us; and |
|
| • | The effects of state regulation on customer contracting practices. |
Any failure to extend or replace a significant portion of our existing contracts may have a material adverse effect on our business, financial condition, results of operations and cash flows.
If third-party pipelines and other facilities interconnected to our pipelinepipelines and facilities become unavailable to transport natural gas and NGLs or to treat natural gas, our revenues could be adversely affected.
We depend upon third-party pipelines and other facilities that provide delivery options to and from our natural gas pipelinepipelines and storage facilities.facilities for the benefit of our customers. Because we do not own these third-party pipelines or facilities, their continuing operation is not within our control. If these pipelines or other facilities were to become temporarily or permanently unavailable due to repairs,for any reason, or if throughput were reduced because of testing, line repair, damage to the facility,pipelines or facilities, reduced operating pressures, lack of capacity, increased credit requirements or rates charged by such pipelines or facilities or for any other reason,causes, we and our abilitycustomers would have reduced capacity to operate efficiently and continue shippingtransport, store or deliver natural gas or NGL products to end-useend use markets could be restricted,or to receive deliveries of mixed NGLs, thereby reducing our revenues. Further, although there are laws and regulations designed to encourage competition in wholesale market transactions, some companies may fail to provide fair and equal access to their transportation systems or may not provide sufficient transportation capacity for other market participants. Any temporary or permanent interruption at any key
37
pipeline interconnect causingor in operations on third-party pipelines or facilities that would cause a material reduction in volumes transported on our pipelinepipelines or our gathering systems or processed, fractionated, treated or stored at our facilities could have a material adverse effect on our business, financial condition, results of operations, financial condition and cash flows.
Our businesses are subjectLegal and regulatory proceedings and investigations relating to complex government regulations.the energy industry have adversely affected our business and may continue to do so. The operationoperations of our businesses might also be adversely affected by changes in thesegovernment regulations or in their interpretationinterpretations or implementation, or the introduction of new laws or regulations applicable to our businesses or our customers.
Existing regulations might be revised or reinterpreted, new laws and regulations might be adopted or become applicable to us, our facilities or our customers, and future changes in laws and regulations might have a detrimental effect on our business. Specifically, the Colorado Oil & Gas Conservation Commission has enacted new rules effective in April 2009 which will increase our costs of permitting and environmental compliance and may affect our ability to meet our anticipated drilling schedule and therefore may have a material effect on our results of operations.
Legal and regulatory proceedings and investigations relating to the energy industry and capital markets have adversely affected our business and may continue to do so.
Public and regulatory scrutiny of the energy industry and of the capital markets has resulted in increased regulationregulations being either proposed or implemented. Such scrutiny has also resulted in various inquiries, investigations
31
and court proceedings in which we are a named defendant. Both the shippers on our pipelines and regulators have rights to challenge the rates we charge under certain circumstances. Any successful challenge could materially affect our results of operations.
Certain inquiries, investigations and court proceedings are ongoing and continue to adversely affect our business as a whole. We might see these adverseAdverse effects may continue as a result of the uncertainty of these ongoing inquiries, investigations and court proceedings, or additional inquiries and proceedings by federal or state regulatory agencies or private plaintiffs. In addition, we cannot predict the outcome of any of these inquiries or whether these inquiries will lead to additional legal proceedings against us, civil or criminal fines or penalties, or other regulatory action, including legislation which might be materially adverse to the operation of our business and our revenues and net income or increase our operating costs in other ways.increased permitting requirements. Current legal proceedings or other matters against us, arising out of our ongoing and discontinued operations including environmental matters, disputes over gas measurement, royalty payments, shareholder class action suits, regulatory appeals, challenges to our permits by citizen groups and similar matters, might result in adverse decisions against us. The result of such adverse decisions, either individually or in the aggregate, could be material and may not be covered fully or at all by insurance.
Such scrutiny has also resulted in various inquiries, investigations and court proceedings in which we are a named defendant. Both the shippers on our pipelines and regulators have rights to challenge the rates we charge under certain circumstances. Any successful challenge could materially affect our results of operations.In addition, existing regulations might be revised or reinterpreted, new laws, regulations and permitting requirements might be adopted or become applicable to us, our facilities our customers, our vendors or our service providers, and future changes in laws and regulations could have a material adverse effect on our financial condition, results of operations and cash flows. For example, various legislative and regulatory reforms associated with pipeline safety and integrity have been proposed recently, including the Pipeline Safety, Regulatory Certainty, and Job Creation Act of 2011 enacted on January 3, 2012. This law will result in the promulgation of new regulations to be administered by the PHMSA affecting the operations of our gas pipelines including, but not limited to, requirements relating to pipeline inspection, installation of additional valves and other equipment and records verification. These reforms and any future changes in related laws and regulations could significantly increase our costs.
The 2010 drilling moratorium in the Gulf of Mexico and potentially more stringent regulations and permitting requirements on drilling in the Gulf of Mexico could adversely affect our operating results, financial condition and cash flows.
The drilling moratorium in the Gulf of Mexico (in force from May to October 2010) impacted our production handling, gathering and transportation operations through production delays which reduced volumes of natural gas and oil delivered to our platform, pipeline and gathering facilities in 2010. In addition, the Bureau of Ocean Energy Management, Regulation and Enforcement continues to develop more stringent drilling and permitting requirements for producers in the Gulf of Mexico which could cause delays in production or new drilling. A significant decline or delay in production volumes in the Gulf of Mexico could adversely affect our operating results, financial condition and cash flows through reduced production handling activities, gathering and transportation volumes, processing activities or other midstream services.
38
Risks Related to Employees, Outsourcing of Non-CoreNoncore Support Activities, and Technology
Institutional knowledge residing with current employees nearing retirement eligibility or with employees going to WPX as part of the separation of our exploration and production business might not be adequately preserved.
In certain segmentsareas of our business, institutional knowledge resides with employees who have many years of service. As these employees reach retirement age, or with the loss of employees as part of the separation of our exploration and production business, we may not be able to replace them with employees of comparable knowledge and experience. In addition, we may not be able to retain or recruit other qualified individuals, and our efforts at knowledge transfer could be inadequate. If knowledge transfer, recruiting and retention efforts are inadequate, access to significant amounts of internal historical knowledge and expertise could become unavailable to us.
Failure of our service providers or disruptions to our outsourcing relationships might negatively impact our ability to conduct our business.
Some studies indicate a high failure rate of outsourcing relationships. Although we have taken steps to build a cooperative and mutually beneficial relationship with our outsourcing providers and to closely monitor their performance, aA deterioration in the timeliness or quality of the services performed by the outsourcing providers or a failure of all or part of these relationships could lead to loss of institutional knowledge and interruption of services necessary for us to be able to conduct our business. The expiration of such agreements or the transition of services between providers could lead to similar losses of institutional knowledge or disruptions.
Certain of our accounting and information technology application development, and help desk services are currently provided by an outsourcing provider from service centers outside of the United States. The economic and political conditions in certain countries from which our outsourcing providers may provide services to us present similar risks of business operations located outside of the United States, previously discussed, including risks of interruption of business, war, expropriation, nationalization, renegotiation, trade sanctions or nullification of existing contracts and changes in law or tax policy, that are greater than in the United States.
Risks Related to Weather, other Natural Phenomena and Business Disruption
Our assets and operations can be adversely affected by weather and other natural phenomena.
Our assets and operations, including those located offshore, can be adversely affected by hurricanes, floods, earthquakes, landslides, tornadoes and other natural phenomena and weather conditions, including extreme temperatures, making it more difficult for us to realize the historic rates of return associated with these assets and operations. Insurance may be inadequate, and in some instances, we may behave been unable to obtain insurance on commercially reasonable terms, ifor insurance has not been available at all. A significant disruption in operations or a significant liability for which we were not fully insured could have a material adverse effect on our business, results of operations and financial condition.
32
In addition, there is a growing belief that emissions of greenhouse gases may be linked to global climate change. Climate change creates physical and financial risk. Our customers’ energy needs vary with weather conditions. To the extent weather conditions are affected by climate change or demand is impacted by regulations associated with climate change, customers’ energy use could increase or decrease depending on the duration and magnitude of the changes, leading either to either increased investment or decreased revenues.
Acts of terrorism could have a material adverse effect on our financial condition, results of operations and cash flows.
Our assets and the assets of our customers and others may be targets of terrorist activities that could disrupt our business or cause significant harm to our operations, such as full or partial disruption to our ability to produce, process, transport or distribute natural gas, natural gas liquidsNGLs or other commodities. Acts of terrorism as well as events occurring in response to or in connection with acts of terrorism could cause environmental repercussions that could result in a significant decrease in revenues or significant reconstruction or remediation costs,costs.
39
Our business could be negatively impacted by security threats, including cybersecurity threats, and related disruptions.
We rely on our information technology infrastructure to process, transmit and store electronic information, including information we use to safely operate our assets. While we believe that we maintain appropriate information security policies and protocols, we face cybersecurity and other security threats to our information technology infrastructure, which could include threats to our operational and safety systems that operate our pipeline, plants and assets. We could face unlawful attempts to gain access to our information technology infrastructure, including coordinated attacks from hackers, whether state-sponsored groups, “hacktivists,” or private individuals. The age, operating systems or condition of our current information technology infrastructure and software assets and our ability to maintain and upgrade such assets could affect our ability to resist cybersecurity threats. We could also face attempts to gain access to information related to our assets through attempts to obtain unauthorized access by targeting acts of deception against individuals with legitimate access, physical location or information otherwise known as “social engineering.”
Our information technology infrastructure is critical to the efficient operation of our business and essential to our ability to perform day-to-day operations. Breaches in our information technology infrastructure or physical facilities, or other disruptions, could result in damage to our assets, safety incidents, damage to the environment, potential liability or the loss of contracts, and have a material adverse effect on our operations, financial condition,position and results of operations and cash flows.
| |
Item 1B. | Unresolved Staff Comments |
None.
Not applicable.
We own property in 31 states plusPlease read “Business” for a description of the Districtlocation and general character of Columbia in the United States and in Argentina, Canada and Venezuela.
Gas Marketing’s primary assets are its term contracts, related systems and technological support. In our Gas Pipeline and Midstream segments, weprincipal physical properties. We generally own our facilities, although a substantial portion of our pipeline and gathering facilities is constructed and maintained pursuant to rights-of-way, easements, permits, licenses or consents on and across properties owned by others. In our Exploration & Production segment, the majority of our ownership interest in exploration and production properties is held as working interests in oil and gas leaseholds.
Environmental
Certain reportable legal proceedings involving governmental authorities under federal, state and local laws regulating the discharge of materials into the environment are described below. While it is not possible for us to predict the final outcome of the proceedings which are still pending, we do not anticipate a material effect on our consolidated financial position if we receive an unfavorable outcome in any one or more of such proceedings.
In September 2007, the EPA requested, and Transco later provided, information regarding natural gas compressor stations in the states of Mississippi and Alabama as part of the EPA’s investigation of Transco’s compliance with the Clean Air Act. On March 28, 2008, the EPA issued notices of violation alleging violations of Clean Air Act requirements at these compressor stations. Transco met with the EPA in May 2008 and submitted a response denying the allegations in June 2008. In May 2011, Transco provided additional information to the EPA pertaining to these compressor stations in response to a request they had made in February 2011. In August 2010, the EPA requested, and Transco provided, similar information for a compressor station in Maryland.
In February 2012, the New Mexico Environmental Department and Williams Four Corner LLC settled alleged violations of the New Mexico Air Quality Act at five separate facilities that we own or operate for $164,000.
40
In September 2011, the Colorado Department of Public Health and Environment proposed a penalty of $301,000 for alleged violations of the Colorado Clean Water Act related to excavation work being done for our Crawford Trail Pipeline. Under a settlement reached with the agency in November 2011, we agreed to pay $44,300 and undertake certain supplemental environmental projects valued at $230,700.
Other
The additional information called for by this item is provided in Note 16 of the Notes to Consolidated Financial Statements included under Part II, Item 8. Financial Statements of this report, which information is incorporated by reference into this item.
| |
Item 4. | Submission of Matters to a Vote of Security HoldersMine Safety Disclosures
|
None.
Not applicable.
41
Executive Officers of the Registrant
The name, age, period of service, and title of each of our executive officers as of February 1, 2009,24, 2012, are listed below.
| | |
Alan S. Armstrong | Director, Chief Executive Officer, and President |
Age: 49
Position held since January 2011.
From February 2002 until January 2011 he was Senior Vice President-Midstream and acted as President of our midstream business. From 1999 to February 2002, Mr. Armstrong was Vice President, Gathering and Processing for our midstream business. From 1998 to 1999 he was Vice President, Commercial Development for Midstream. Mr. Armstrong serves as Chairman of the Board and Chief Executive Officer of Williams Partners GP LLC, the general partner of WPZ, where he was Senior Vice President-Midstream from February 2010, and Chief Operating Officer and a director from February 2005.
Randall L. Barnard | Senior Vice President, Midstream |
| | Age: 46 |
|
| | Position held since February 2002. |
|
| | From 1999 to February 2002, Mr. Armstrong was Vice President, Gathering and Processing for Midstream. From 1998 to 1999 he was Vice President, Commercial Development for Midstream. Mr. Armstrong serves as a director of Williams Partners GP LLC, the general partner of Williams Partners L.P. |
|
James J. Bender | | Senior Vice President and General Counsel |
| | Age: 52 |
|
| | Position held since December 2002.Gas Pipeline |
33
Position held since February 2011.Mr. Barnard acts as President of our gas pipeline business. Mr. Barnard served as Vice President of Natural Gas Market Development from July 2010 to February 2011. From April 2002 to July 2010, Mr. Barnard was Senior Vice President of Operations and Technical Service for our gas pipeline business. From September 2000 to April 2002, he served as President of Williams International, Vice President and General Manager, and a director and from 2001 to 2002 Chief Executive Officer of Apco Oil and Gas International Inc., formerly Apco Argentina. From June 1997 to September 2000, Mr. Barnard was General Manager of Williams International in Venezuela. Mr. Barnard is a director and Senior Vice President, Gas Pipeline, of Williams Partners GP LLC, the general partner of WPZ, a Director of the Board of the Gas Technology Institute and Vice Chair of the Common Ground Alliance.
| | |
| | Prior to joining us, Mr. Bender was Senior Vice President and General Counsel with NRG Energy, Inc., a position held since June 2000, prior to which he was Vice President, General Counsel and Secretary of NRG Energy Inc. |
|
Donald R. Chappel | | Senior Vice President and Chief Financial Officer |
Age: 60
Position held since April 2003.
Prior to joining us, Mr. Chappel held various financial, administrative and operational leadership positions. Mr. Chappel also serves as Chief Financial Officer and a director of Williams Partners GP LLC, the general partner of WPZ. He was Chief Financial Officer from August 2007 and a director from January 2008 of Williams Pipeline GP LLC, the general partner of Williams Pipeline Partners L.P., until its merger with WPZ in August 2010. Mr. Chappel is a director of SUPERVALU, Inc. (a grocery and pharmacy company) and is chairman of its finance committee.
42
| | Age: 57 |
|
| | Position held since April 2003. |
|
| | Prior to joining us, Mr. Chappel held various financial, administrative and operational leadership positions. Mr. Chappel serves as a director of Williams Partners GP LLC, the general partner of Williams Partners L.P., and as a director of Williams Pipeline GP LLC, the general partner of Williams Pipeline Partners L.P. |
|
Robyn L. Ewing | | Senior Vice President Strategic Services and Administration and Chief Administrative Officer |
Age: 56
Position held since April 2008.
From May 2004 to April 2008 Ms. Ewing was Vice President of Human Resources. Prior to joining Williams, Ms. Ewing worked at MAPCO, which merged with Williams in April 1998. She began her career with Cities Service Company in 1976.
Rory L. Miller | | Age: 53 |
|
| | Position held since March 2008. |
|
| | From 2004 to 2008 Ms. Ewing was Vice President of Human Resources. Prior to joining Williams, Ms. Ewing worked at MAPCO, which merged with Williams in April 1998. She began her career with Cities Service Company in 1976. |
|
Ralph A. Hill | | Senior Vice President, Exploration & ProductionMidstream |
Age: 51
Position held since January 2011.
Mr. Miller acts as President of our midstream businesses. He was a Vice President of our midstream businesses from May 2004 to December 2011. Mr. Miller also serves as a director and Senior Vice President, Midstream of Williams Partners GP LLC, the general partner of WPZ.
Craig L. Rainey | | Age: 49 |
|
| | Position held since December 1998. |
|
| | Mr. Hill was Vice President of the Exploration & Production business from 1993 to 1998 as well as Senior Vice President Petroleum Services from 1998 to 2003. Mr. Hill serves as a director of Apco Argentina Inc. |
|
Steven J. Malcolm | | Chairman of the Board, Chief Executive Officer and President |
| | Age: 60 |
|
| | Position held since September 2001. |
|
| | From May 2001 to September 2001, Mr. Malcolm was Executive Vice President of the Company. He was President and Chief Executive Officer of our subsidiary Williams Energy Services, LLC from December 1998 to May 2001 and Senior Vice President and General Manager of our subsidiary, Williams Field Services Company from November 1994 to December 1998. Mr. Malcolm serves as a director of Williams Partners GP LLC, the general partner of Williams Partners L.P., Williams Pipeline GP LLC, the general partner of Williams Pipeline Partners L.P., BOK Financial CorporationCounsel |
Age: 59
Position held since January 2012.
From February 2001 to December 2011, Mr. Rainey served as an Assistant General Counsel of Williams, primarily supporting our midstream business and former exploration and production business. He joined Williams in 1999 as a senior counsel.
Ted T. Timmermans | Vice President, Controller, and the Bank of Oklahoma, N.A.Chief Accounting Officer |
Age: 55
Position held since July 2005.
Mr. Timmermans served as Assistant Controller of Williams from April 1998 to July 2005. Mr. Timmermans is also Vice President, Controller & Chief Accounting Officer of Williams Partners GP LLC, the general partner of WPZ and served as Chief Accounting Officer of Williams Pipeline Partners GP LLC, the general partner of WMZ from January 2008 until its merger with WPZ in August 2010.
|
Phillip D. Wright | | Senior Vice President, Gas Pipeline |
| | Age: 53 |
|
| | Position held since January 2005. |
|
| | From October 2002 to January 2005, Mr. Wright served as Chief Restructuring Officer. From September 2001 to October 2002, Mr. Wright served as President and Chief Executive Officer of our subsidiary Williams Energy Services. From 1996 until September 2001, he was Senior Vice President, EnterpriseCorporate Development and Planning for our energy services group. Mr. Wright has held various positions with us since 1989. Mr. Wright serves as a director of Williams Pipeline GP LLC, the general partner of Williams Pipeline Partners L.P. |
34Age: 56
Position held since February 2011.
Mr. Wright served as Senior Vice President, Gas Pipeline and acted as President of our gas pipeline business from January 2005 to February 2011. From October 2002 to January 2005, he served as Chief Restructuring Officer. From September 2001 to October 2002, Mr. Wright served as President and Chief Executive Officer of our subsidiary, Williams Energy Services, LLC. From 1996 until September 2001, he was Senior Vice President, Enterprise Development and Planning for our energy services group. Mr. Wright served as a director and Chief Operating Officer of Williams Pipeline GP LLC, the general partner of WMZ until its merger with WPZ in August 2010 and was a director and Senior Vice President, Gas
43
Pipeline, of Williams Partners GP LLC, the general partner of WPZ from January 2010 to February 2011. Mr. Wright was appointed to the board of directors of Aegion Corporation (a provider of technologies and services for the rehabilitation of pipeline systems) in November 2011.
| |
Item 5. | Market for Registrant’s Common Equity, Related Stockholder Matters and Issuer Purchases of Equity Securities |
Our common stock is listed on the New York Stock Exchange under the symbol “WMB.” At the close of business on February 19, 2009,22, 2012, we had approximately 10,3239,351 holders of record of our common stock. The high and low closing sales price ranges (New York Stock Exchange composite transactions) and dividends declared by quarter for each of the past two years are as follows:
| | | | | | | | | | | | | | | | | | | | | | | | | |
| | | 2008 | | | 2007 | |
Quarter | | High | | | Low | | | Dividend | | | High | | | Low | | | Dividend | |
| |
| 1st | | $ | 36.99 | | | $ | 30.96 | | | $ | .10 | | | $ | 28.94 | | | $ | 25.32 | | | $ | .09 | |
| 2nd | | $ | 40.31 | | | $ | 33.65 | | | $ | .11 | | | $ | 32.43 | | | $ | 28.20 | | | $ | .10 | |
| 3rd | | $ | 39.90 | | | $ | 21.85 | | | $ | .11 | | | $ | 34.72 | | | $ | 30.08 | | | $ | .10 | |
| 4th | | $ | 22.50 | | | $ | 12.13 | | | $ | .11 | | | $ | 37.16 | | | $ | 33.68 | | | $ | .10 | |
| | | | | | | | | | | | | | | | | | | | | | | | |
| | | 2011 | | | 2010 | |
Quarter | | High | | | Low | | | Dividend | | | High | | | Low | | | Dividend | |
1st | | $ | 31.77 | | | $ | 24.26 | | | $ | 0.125 | | | $ | 23.76 | | | $ | 19.51 | | | $ | 0.11 | |
2nd | | $ | 33.47 | | | $ | 27.92 | | | $ | 0.20 | | | $ | 24.66 | | | $ | 18.16 | | | $ | 0.125 | |
3rd | | $ | 33.16 | | | $ | 23.46 | | | $ | 0.20 | | | $ | 21.00 | | | $ | 17.53 | | | $ | 0.125 | |
4th | | $ | 33.11 | | | $ | 21.90 | | | $ | 0.25 | | | $ | 24.89 | | | $ | 18.88 | | | $ | 0.125 | |
Some of our subsidiaries’ borrowing arrangements may limit the transfer of funds to us. These terms have not impeded, nor are they expected to impede, our ability to pay dividends.
35
Performance Graph
Set forth below is a line graph comparing our cumulative total stockholder return on our common stock (assuming reinvestment of dividends) with the cumulative total return of the S&P 500 Stock Index and the Bloomberg U.S. Pipeline Index for the period of five fiscal years commencing January 1, 2004.2007. The Bloomberg U.S. Pipeline Index is composed of Crosstex Energy, Inc., El Paso, Corporation, Enbridge, Inc., Kinder Morgan, Management, LLC, National Fuel Gas Company, Oneok, Inc., Promigas S.A. E.S.P., Spectra Energy, Corp, TransCanada Corporation,Corp., and The Williams Companies, Inc.Williams. The graph below assumes an investment of $100 at the beginning of the period.
Cumulative Total Shareholder Return
| | | | | | | | | | | | | | | | | | | | | | | | | | | | | | | |
| | | | 2003 | | | 2004 | | | 2005 | | | 2006 | | | 2007 | | | 2008 |
| The Williams Companies, Inc. | | | | 100.0 | | | | | 166.9 | | | | | 240.2 | | | | | 274.7 | | | | | 380.9 | | | | | 156.8 | |
| S&P 500 Index | | | | 100.0 | | | | | 110.9 | | | | | 116.3 | | | | | 134.7 | | | | | 142.1 | | | | | 89.5 | |
| Bloomberg U.S. Pipelines Index | | | | 100.0 | | | | | 130.9 | | | | | 173.3 | | | | | 200.9 | | | | | 238.2 | | | | | 145.5 | |
| | | | | | | | | | | | | | | | | | | | | | | | | | | | | | | |
36
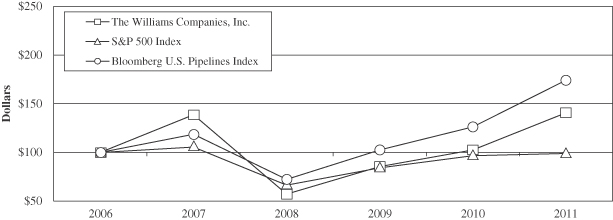
| | | | | | | | | | | | | | | | | | | | | | | | |
| | | 2006 | | | 2007 | | | 2008 | | | 2009 | | | 2010 | | | 2011 | |
The Williams Companies, Inc. | | | 100.0 | | | | 138.7 | | | | 57.1 | | | | 85.5 | | | | 102.6 | | | | 140.7 | |
S&P 500 Index | | | 100.0 | | | | 105.5 | | | | 66.5 | | | | 84.1 | | | | 96.7 | | | | 98.8 | |
Bloomberg U.S. Pipelines Index | | | 100.0 | | | | 118.5 | | | | 72.4 | | | | 102.6 | | | | 126.2 | | | | 174.1 | |
The information presented in this Item has not been recast to reflect the WPX spin-off completed on December 31, 2011.
45
| |
Item 6. | Selected Financial Data |
The following financial data at December 31, 20082011 and 2007,2010, and for each of the three years in the period ended December 31, 2008,2011, should be read in conjunction with the other financial information included in Part II, Item 7,Management’s Discussion and Analysis of Financial Condition and Results of Operationsand Part II, Item 8,Financial Statements and Supplementary Dataof thisForm 10-K. The following All other financial data at December 31, 2006 and 2005, and for the years ended December 31, 2005 and 2004, should be read in conjunction with the financial information included in Exhibit 99.1 of ourForm 8-K as filed on October 12, 2007, except for the adjustments described in footnote (1) below. The following financial data at December 31, 2004, has been prepared from our accounting records.
| | | | | | | | | | | | | | | | | | | | | |
| | | 2008 | | | 2007 | | | 2006 | | | 2005 | | | 2004 | |
| | | (Millions, except per-share amounts) | |
| |
| Revenues(1) | | $ | 12,352 | | | $ | 10,486 | | | $ | 9,299 | | | $ | 9,690 | | | $ | 8,343 | |
| Income from continuing operations(2) | | | 1,334 | | | | 847 | | | | 347 | | | | 473 | | | | 149 | |
| Income (loss) from discontinued operations(3) | | | 84 | | | | 143 | | | | (38 | ) | | | (157 | ) | | | 15 | |
| Cumulative effect of change in accounting principles(4) | | | — | | | | — | | | | — | | | | (2 | ) | | | — | |
| Diluted earnings (loss) per common share: | | | | | | | | | | | | | | | | | | | | |
| Income from continuing operations | | | 2.26 | | | | 1.40 | | | | .57 | | | | .79 | | | | .28 | |
| Income (loss) from discontinued operations | | | .14 | | | | .23 | | | | (.06 | ) | | | (.26 | ) | | | .03 | |
| Total assets at December 31 | | | 26,006 | | | | 25,061 | | | | 25,402 | | | | 29,443 | | | | 23,993 | |
| Short-term notes payable and long-term debt due within one year at December 31 | | | 196 | | | | 143 | | | | 392 | | | | 123 | | | | 250 | |
| Long-term debt at December 31 | | | 7,683 | | | | 7,757 | | | | 7,622 | | | | 7,591 | | | | 7,712 | |
| Stockholders’ equity at December 31 | | | 8,440 | | | | 6,375 | | | | 6,073 | | | | 5,427 | | | | 4,956 | |
| Cash dividends declared per common share | | | .43 | | | | .39 | | | | .345 | | | | .25 | | | | .08 | |
| | | | | | | | | | | | | | | | | | | | |
| | | 2011 | | | 2010 | | | 2009 | | | 2008 | | | 2007 | |
| | | (Millions, except per-share amounts) | |
Revenues | | $ | 7,930 | | | $ | 6,638 | | | $ | 5,278 | | | $ | 6,904 | | | $ | 6,639 | |
Income (loss) from continuing operations (1) | | | 1,078 | | | | 271 | | | | 346 | | | | 682 | | | | 677 | |
Amounts attributable to The Williams Companies, Inc.: | | | | | | | | | | | | | | | | | | | | |
Income (loss) from continuing operations | | | 803 | | | | 104 | | | | 206 | | | | 528 | | | | 606 | |
Diluted earnings (loss) per common share: | | | | | | | | | | | | | | | | | | | | |
Income (loss) from continuing operations | | | 1.34 | | | | 0.17 | | | | 0.35 | | | | 0.90 | | | | 1.00 | |
Total assets at December 31 (2) | | | 16,502 | | | | 24,972 | | | | 25,280 | | | | 26,006 | | | | 25,061 | |
Short-term notes payable and long-term debt due within one year at December 31 | | | 353 | | | | 508 | | | | 17 | | | | 18 | | | | 108 | |
Long-term debt at December 31 | | | 8,369 | | | | 8,600 | | | | 8,259 | | | | 7,683 | | | | 7,579 | |
Stockholders’ equity at December 31 (2) | | | 1,793 | | | | 7,288 | | | | 8,447 | | | | 8,440 | | | | 6,375 | |
Cash dividends declared per common share | | | 0.775 | | | | 0.485 | | | | 0.44 | | | | 0.43 | | | | 0.39 | |
(1) | | |
(1) | | Prior period amounts reportedIncome from continuing operations for Exploration & Production have been adjusted to reflect the presentation2011 includes $271 million of certain revenues and costs on a net basis. These adjustments reducedrevenuesand reducedpre-tax early debt retirement costs and operating expensesby2010 includes $648 million of pre-tax costs associated with our strategic restructuring transaction in the same amount, with no net impact on segment profit. The reductions were $72 million in 2007, $77 million in 2006, $91 million in 2005 and $65 million in 2004. |
|
(2) | | first quarter of 2010. See Note 4 of Notes to Consolidated Financial Statements for further discussion of asset sales, impairments, and other accruals in 2008, 2007,2011, 2010, and 2006. Income from continuing operations2009. |
(2) | Total assets and stockholders’ equity for 2005 includes an $82 million charge for litigation contingencies2011 decreased due to the special dividend to spin off our former exploration and a $110 million charge for impairments of certain equity investments. Income from continuing operations for 2004 includes $94 million of income from a favorable arbitration award and $282 million of early debt retirement costs. |
|
(3) | | production business. See Note 2 of Notes to Consolidated Financial Statements for further information regarding the analysis of the 2008, 2007, and 2006 income (loss) from discontinued operations. The discontinued operations results for 2005 includes our former power business while 2004 includes the power business, the Canadian straddle plants,spin-off and the Alaska refining, retail, and pipeline operations. |
|
(4) | | The 2005cumulative effect of change in accounting principlesis due to the implementation of Financial Accounting Standards Board (FASB) Interpretation No. 47 (FIN 47), “Accounting for Conditional Asset Retirement Obligations — an Interpretation of FASB statement No. 143 (SFAS No. 143).”dividend. |
37
| |
Item 7. | Management’s Discussion and Analysis of Financial Condition and Results of Operations |
We are primarily aan energy infrastructure company focused on connecting North America’s significant hydrocarbon resource plays to growing markets for natural gas, company, engaged in finding, producing, gathering, processing,natural gas liquids, and transporting natural gas.olefins. Our operations are located principally in the United States, but span from the deepwater Gulf of Mexico to the Canadian oil sands, and are organized into the followingWilliams Partners and Midstream Canada & Olefins reporting segments: Exploration & Production, Gas Pipeline, Midstream Gas & Liquids (Midstream), and Gas Marketing Services.segments. All remaining business activities are included in Other. (See Note 1 of Notes to Consolidated Financial Statements and Part I Item 1 for further discussion of these segments.)
The Williams Partners segment consists of our consolidated master limited partnership, Williams Partners L.P. (WPZ), of which we currently own approximately 72 percent, including the general partner interest.Unless indicated otherwise, the following discussion and analysis of critical accounting estimates, results of operations, and financial condition and liquidity relates to our current continuing operations and should be read in conjunction with the consolidated financial statements and notes thereto included in Part II, Item 8 of this document.
Spin-off of WPX
On December 1, 2011, we announced that our Board of Directors approved a tax-free spinoff of 100 percent of our exploration and production business, WPX Energy, Inc. (WPX), to our shareholders. On December 31, 2011, we distributed one share of WPX common stock for every three shares of Williams common stock. As a
46
result, with the exception of the December 31, 2011 balance sheet which no longer includes WPX, the consolidated financial statements reflect the results of operations and financial position of WPX as discontinued operations.
Dividend Growth
We doubled our quarterly dividends from $0.125 per share in the fourth quarter of 2010 to $0.25 per share in the fourth quarter of 2011. Also, consistent with expected growing cash distributions from our interest in WPZ, we expect continued dividend increases on a quarterly basis. Our Board of Directors has approved a dividend of $0.25875 per share for the first quarter of 2012 and we expect total 2012 dividends to be $1.09 per share, which is approximately 41 percent higher than 2011.
Overview of 2008
Our plan for 2008 was focused on continued disciplined growth. ObjectivesCrude oil and highlights ofNGL prices increased in 2011, while natural gas prices have remained relatively low. We have benefited from this plan included:
| | | |
Objectives | | | Highlights |
Continuing to improve both EVA® and segment profit. | | | 2008 segment profit of $2.9 billion, an increase of $749 million from 2007, contributed to improving our EVA®. |
Continuing to increase natural gas production and reserves. | | | We invested $2.5 billion in capital expenditures in Exploration & Production, increasing average daily domestic production by approximately 20 percent over last year while adding 602 billion cubic feet equivalent in net reserves. Total year-end 2008 proved domestic natural gas reserves are 4.3 trillion cubic feet equivalent, up 5 percent from year-end 2007 reserves. |
Increasing the scale of our gathering and processing business in key growth basins. | | | We invested $608 million in capital expenditures in Midstream, primarily Deepwater Gulf expansion projects and gas-processing capacity in the western United States. |
Continue to invest in expansion projects on our interstate natural gas pipelines. | | | We invested $306 million in capital expenditures in Gas Pipeline during 2008. |
| | | |
Our 2008environment as our 2011 income (loss) from continuing operations attributable to The Williams Companies, Inc. increased by $699 million compared to $1.3 billion,2010. This increase is primarily reflective of a $460 million improvement in operating profit and $335 million of lower charges associated with early debt retirements in 2011 as compared to $847 million in 2007. Ournet cash provided by operating activities was almost $3.4 billion in 2008 compared to $2.2 billion in 2007.
While these annual measures are favorable compared to the prior year, the overall trend of results was significantly different when considering the first three quarters of the year versus the last quarter. Through September 30, 2008, our Exploration & Production business benefited from increased levels of production and higher net realized average natural gas prices, while our Midstream business realized higher margins from a favorable energy commodity price environment. However, energy commodity prices declined sharply during the last months of 2008, contributing to significantly lower fourth quarter operating results for these segments. The impact of the declining energy commodity prices on our consolidated results was partially mitigated by:
| | |
| • | Strong earnings from Gas Pipeline, which benefited from new rates enacted during 2007, and the nature of its contracts; |
|
| • | Hedge positions at Exploration & Production related to a significant portion of its production; |
|
| • | Fee-based revenues from certain gathering and processing services at Midstream. |
38
2010. See additional discussion in Results of Operations.
Other Significant 2008 Events
Abundant and low-cost natural gas reserves in the United States continue to drive strong demand for midstream and pipeline infrastructure. We believe we have successfully positioned our energy infrastructure businesses for significant future growth, as highlighted by the following accomplishments during 2011 through the present:
In March 2011, Midstream Canada & Olefins announced a long-term agreement under which it will produce up to 17,000 barrels per day of ethane/ethylene mix for a chemical company in Alberta, Canada. We plan to expand two primary facilities located in Alberta to support the new agreement. (See Results of Operations – Segments, Midstream Canada & Olefins.)
| • | | In October 2011, Williams Partners executed an agreement with two significant producers to provide certain production handling services in the eastern deepwater Gulf of Mexico. We will design, construct and install a floating production system (Gulfstar FPS™) that will have the capacity to handle 60 thousand barrels per day (Mbbls/d) of oil, up to 200 million cubic feet per day (MMcf/d) of natural gas, and the capability to provide seawater injection services. We expect Gulfstar FPS™ to be placed into service in 2014 and to be capable of serving as a central host facility for other deepwater prospects in the area. (See Results of Operations – Segments, Williams Partners.) |
During 2011, Williams Partners placed into service expansions of a natural gas transmission system, compression facilities, and line facilities that provide an aggregate additional 599 Mdth/d of incremental firm capacity. We also filed an application with the FERC to increase capacity by 250 Mdth/d by expanding our natural gas transmission system from the Marcellus Shale production region on the Leidy Line to various delivery points in New York and New Jersey. (See Results of Operations – Segments, Williams Partners.)
In January 2012, Williams Partners placed into service our Springville pipeline that will allow us to initially deliver approximately 300 MMcf/d into the Transco pipeline and full use of approximately 650 MMcf/d of capacity from various compression and dehydration expansion projects to our gathering business in Pennsylvania’s Marcellus Shale. (See Results of Operations – Segments, Williams Partners.)
Discovery, an equity method investee in which we own 60 percent and operate, announced in January 2012 that it signed long-term agreements with anchor customers for natural gas gathering and processing services for production from the central deepwater Gulf of Mexico. To provide these services Discovery plans to construct a new deepwater pipeline which will have the capacity to flow approximately 400 MMcf/d and will accommodate the tie-in of other deepwater prospects. (See Results of Operations – Segments, Williams Partners.)
47
In February 2012, Williams Partners completed our stock repurchase program by reaching the $1 billion limit authorized by our Boardacquisition of Directors. (See Note 12100 percent of Notes to Consolidated Financial Statements.)
Exploration & Production increased its positions by acquiring undeveloped leasehold acreage, producing propertiesthe ownership interests in certain entities from Delphi Midstream Partners, LLC. These entities primarily own the Laser Gathering System, which is comprised of 33 miles of 16-inch natural gas pipeline and associated gathering facilities in the Piceance basin and undeveloped leasehold acreage and producing propertiesMarcellus Shale in Susquehanna County, Pennsylvania, as well as 10 miles of gathering lines in southern New York. This acquisition represents a strategic platform to enhance Williams Partners’ expansion in the Fort Worth basin. See additional discussion inMarcellus Shale by providing our customers with both operational flow assurance and marketing flexibility. (See Results of Operations —- Segments, ExplorationWilliams Partners.)
In February 2012, we announced a new interstate gas pipeline joint venture with Cabot Oil & Production.
We recognized pre-tax income of $183 millionGas Corporation. The new 120-mile Constitution Pipeline will connect Williams Partners’ gathering system inincome from discontinued operationsrelated to our former Alaska operations. (See Note 2 of Notes to Consolidated Financial Statements.)
Exploration & Production recognized pre-tax income of $148 million related Susquehanna County, Pennsylvania, to the sale of a contractual right to a production payment on certain future international hydrocarbon production. See additional discussion in Results of Operations — Segments, Exploration & Production.
Williams Pipeline Partners L.P. completed its initial public offering. See additional discussion in Results of Operations — Segments,Iroquois Gas Pipeline.
In September 2008, Hurricanes GustavTransmission and Ike impacted our operations, primarily at Midstream. As a result, we estimate that our segment profit for 2008 was decreased by approximately $60 million to $85 million due to downtime and charges for repairs and property insurance deductibles. See additional discussion in Results of Operations — Segments,Tennessee Gas Pipeline systems. We will own 75 percent of Constitution Pipeline. This project, along with the newly acquired Laser Gathering System and Midstream Gas & Liquids.
The overall declineour Springville pipeline are key steps in equity marketsWilliams Partners’ strategy to create the Susquehanna Supply Hub, a major natural gas supply hub in 2008 negatively impacted our employee benefit plan assets and will significantly increase our net periodic benefit expense in future periods. (See Note 7 of Notes to Consolidated Financial Statements.)northeastern Pennsylvania.
We expect the overall economic recession and related lower energy commodity price environment as well as the challenging financial markets to continue throughout the year. This is expected to result in sharply lower results of operations and cash flow from operations compared to 2008 levels and could also result in a further reduction in capital expenditures. The impacts could include the future nonperformance of counterparties or impairments of goodwill and long-lived assets. Considering this environment, our plan for 2009 is built around the transition from significant growth to a focus on sustaining our current operations and reducing costs where appropriate. However, we believe we are well positioned to captureexecute on our 2012 business plan and to further realize our growth opportunities. Economic and commodity price indicators for 2012 and beyond reflect continued improvement in the economic environment. However, these measures can be volatile and it is reasonably possible that the economy could worsen and/or commodity prices could decline, negatively impacting our future operating results.
Our business plan for 2012 includes planned capital and investment expenditures of at least $3.4 billion, of which we expect to fund primarily through cash on hand, cash flow from operations, and debt and equity issuances by WPZ. Our structure is designed to drive lower capital costs, enhance reliable access to capital markets, and create a greater ability to pursue development projects and acquisitions. We expect to realize our growth opportunities when commodity prices strengthen and as economic conditions improve. Although we expect a reduction in capital expenditures compared to the prior year, near-term investment in our businesses will remain significant and focused on completing major projects, meeting legal, regulatory,and/or contractual commitments, and maintaining a reduced level of natural gas production development.
We will continue to operate with a focus on EVA® and investthrough these continued investments in our businesses in a way that meets customer needs and enhances our competitive position by:
Continuing to invest in and grow our gathering, processing, and interstate natural gas pipeline systems;
Retaining the flexibility to adjust somewhat our planned levels of capital and investment expenditures in response to changes in economic conditions or business opportunities.
| | |
| • | Continuing to invest our gathering and processing and interstate natural gas pipeline systems, primarily through the completion of projects currently underway; |
|
| • | Continuing to invest in our natural gas production development, although at a lower level than in recent years; |
|
| • | Retaining the flexibility to adjust our planned levels of capital and investment expenditures in response to changes in economic conditions, as well as seizing attractive opportunities. |
Potential risksand/or obstacles that could impact the execution of our plan include:
| | |
| • | Lower than anticipated commodity prices; |
39Availability of capital;
General economic, financial markets, or industry downturn;Lower than anticipated energy commodity margins;
Lower than expected levels of cash flow from operations;
Counterparty credit and performance risk;
| | |
| • | Lower than expected levels of cash flow from operations; |
|
| • | Availability of capital; |
|
| • | Counterparty credit and performance risk; |
|
| • | Decreased drilling success at Exploration & Production; |
|
| • | Decreased drilling success or abandonment of projects by third parties served by Midstream and Gas Pipeline; |
|
| • | Additional general economic, financial markets, or industry downturn; |
|
| • | Changes in the political and regulatory environments; |
|
| • | Exposure associated with our efforts to resolve regulatory and litigation issues (see Note 16 of Notes to Consolidated Financial Statements). |
Decreased volumes from third parties served by our midstream businesses;
Changes in the political and regulatory environments;
Physical damages to facilities, especially damage to offshore facilities by named windstorms.
We continue to address these risks through utilization ofdisciplined investment strategies, commodity hedging strategies, focused efforts to resolve regulatory issues and litigation claims, disciplined investment strategies, and maintaining at least $1 billion in consolidated liquidity from cash and cash equivalents and unused revolving credit facilities. In addition, we utilize master netting agreements and collateral requirements with our counterparties.
We have completed a review of potential changes to our company structure with a goal of enhancing shareholder value and determined to leave our company structure unchanged. Major factors in our decision were the sharp decline in energy commodity prices and a further deterioration in the macroeconomic environment since the initiation of the review in early November 2008. Our business mix and strong credit profile position us to weather the challenging economic and market conditions in 2009 and benefit as the economy recovers.
Accounting Pronouncements Issued But Not Yet Adopted
Accounting pronouncements that have been issued but not yet adopted may have an effect on our Consolidated Financial Statements in the future.
SeeRecent Accounting Standards Issued But Not Yet Adoptedin Note 1 of Notes to Consolidated Financial Statements for further information on recently issued accounting standards.
Modernization of Oil & Gas Reporting Requirements
The SEC has revised its oil and gas reserves reporting requirements effective for fiscal years ending on or after December 31, 2009, with early adoption prohibited. These changes include:
| | |
| • | Expanding the definition of oil and gas reserves and providing clarification of certain concepts and technologies used in the reserve estimation process. |
|
| • | Allowing optional disclosure of probable and possible reserves and permitting optional disclosure of price sensitivity analysis. |
|
| • | Modifying prices used to estimate reserves for SEC disclosure purposes to a12-month average price instead of asingle-day, period-end price. |
|
| • | Requiring certain additional disclosures around proved undeveloped reserves, internal controls used to ensure objectivity of the estimation process, and qualifications of those preparingand/or auditing the reserves. |
Historically, the reserves calculated based on the SEC’s reporting requirements were also used to calculate depletion on our producing properties, as required by SFAS 69, “Disclosures about Oil and Gas Producing Activities” (SFAS 69). However, the change in the SEC reporting requirements has not yet been adopted by the FASB. The SEC has announced its intent to discuss potential amendments to SFAS 69 with the FASB so that the reserves disclosed remain consistent with the reserves used to calculate depletion on our producing properties. Any such change would impact our future financial results. The SEC has indicated that it may delay the effective date of the revised reporting requirements if the FASB does not make conforming amendments by December 31, 2009.
40
48
Critical Accounting EstimatesEstimate
The preparation of financial statements in conformity with generally accepted accounting principles requires management to make estimates and assumptions. We have discussedreviewed the followingselection, application, and disclosure of these critical accounting estimates and assumptions as well as related disclosures with our Audit Committee. We believe that the nature of these estimates and assumptions is material due to the subjectivity and judgment necessary, or the susceptibility of such matters to change, and the impact of these on our financial condition or results of operations.
Impairments of Long-Lived Assets and Goodwill
We evaluate our long-lived assets for impairment when we believe events or changes in circumstances indicate that we may not be able to recover the carrying value. Our computations utilize judgments and assumptions that may include the estimated fair value of the asset, undiscounted future cash flows, discounted future cash flows, and the current and future economic environment in which the asset is operated.
Based on our assessment of the undiscounted and discounted cash flows on natural gas-producing properties and associated unproved leasehold costs in the Arkoma basin, Exploration & Production recorded an impairment charge of $129 million in December 2008. Significant judgments and assumptions in this impairment analysis included year-end natural gas reserves quantities, estimates of future natural gas prices using a forward NYMEX curve adjusted for locational basis differentials, drilling plans, capital costs, and a pre-tax discount rate of 15 percent. The recorded impairment was largely the result of lower forward pricing estimates at year-end and lower reserve estimates resulting from lower year-end prices.
In addition to those long-lived assets for which impairment charges were recorded (see Note 4 of Notes to Consolidated Financial Statements), certain others were reviewed for which no impairment was required. These reviews included Exploration & Production’s properties in other basins and utilized inputs consistent with those described above for the Arkoma basin. Certain assets within our Midstream segment were also evaluated for impairment utilizing judgments and assumptions including future fees, margins and volumes. The use of alternate judgmentsand/or assumptions could result in the recognition of different levels of impairment charges in the consolidated financial statements.
We have goodwill of approximately $1 billion at Exploration & Production primarily resulting from a 2001 acquisition. We assess goodwill for impairment annually as of the end of the year. For purposes of our assessment, the reporting unit is Exploration & Production’s domestic operations. As of December 31, 2008, the estimated fair value of the reporting unit exceeds its carrying value, including goodwill, indicating no impairment of Exploration & Production’s goodwill.
We estimated the fair value of the reporting unit on a stand-alone basis primarily by valuing proved and unproved reserves. We used an income approach (discounted cash flows) for valuing reserves. The significant inputs into the valuation of proved reserves included reserve quantities, forward natural gas prices, anticipated drilling and operating costs, anticipated production curves and appropriate discount rates. Unproved reserves were valued using similar assumptions adjusted further for the uncertainty associated with these reserves.
In estimating the inputs, management must make assumptions that require judgments and are subject to change in response to changing market conditions and other future events. Significant assumptions in valuing proved reserves included reserve quantities of more than 4.3 Tcfe, natural gas prices, adjusted for locational differences, averaging approximately $5.80 per Mcfe and a pre-tax discount rate of 15 percent.
We further reviewed the estimated fair value of the stand-alone reporting unit by reconciling the sum of the fair values of all our businesses to our total market capitalization, including a control premium. In estimating the fair value of our businesses and a control premium, we considered a range of market comparables from historical sales transactions of energy companies. Market capitalization was based on our traded stock price for a reasonably short period of time before and after December 31, 2008. In evaluating these items in our reconciliation analysis, management considered a range of reasonable judgments. This reconciliation allowed management to consider market expectations in corroborating the reasonableness of the estimated stand-alone fair value of the Exploration & Production reporting unit.
41
We also perform interim assessments of goodwill if impairment triggering events or circumstances are present. Examples of impairment triggering events or circumstances include:
| | |
| • | The testing for recoverability of a significant long-lived asset group within the reporting unit; |
|
| • | Recent operating losses or negative cash flows at the reporting unit level; |
|
| • | A decline in natural gas prices or reserve quantities; |
|
| • | Not meeting internal forecasts, or downward adjustments to future forecasts; |
|
| • | A decline in enterprise market capitalization below our consolidated stockholders’ equity; |
|
| • | Industry trends. |
We cannot predict future market conditions and events that might adversely affect the estimated fair value of the Exploration & Production reporting unit and possibly the reported value of goodwill. The estimated fair value of the reporting unit is significantly affected by natural gas prices, reserve quantities and market expectations for required rates of return. Further declines in natural gas prices would lower our estimates of fair value. There are numerous uncertainties inherent in estimating quantities of reserves that could affect our reserve quantities. Low prices for natural gas, regulatory limitations, or the lack of available capital for projects could adversely affect the development and production of additional reserves. Given the significant challenges affecting our businesses and the energy industry in 2009, these factors could impact us and require us to assess goodwill for possible impairment more frequently during 2009.
Subsequent to December 31, 2008, as a result of overall market and energy commodity price declines, we have witnessed periodic reductions in our total market capitalization below our December 31, 2008, consolidated stockholders’ equity balance. If our total market capitalization is below our consolidated stockholders’ equity balance at a future reporting date, we consider this an indicator of potential impairment of goodwill under recent SEC communications and our accounting considerations. We utilize market capitalization in corroborating our assessment of the fair value of our Exploration & Production reporting unit. Considering this, it is reasonably possible that we may be required to conduct an interim goodwill impairment evaluation, which could result in a material impairment of our goodwill.
Accounting for Derivative Instruments and Hedging Activities
We review our energy contracts to determine whether they are, or contain derivatives. We further assess the appropriate accounting method for any derivatives identified, which could include:
| | |
| • | Qualifying for and electing cash flow hedge accounting, which recognizes changes in the fair value of the derivative in other comprehensive income (to the extent the hedge is effective) until the hedged item is recognized in earnings; |
|
| • | Qualifying for and electing accrual accounting under the normal purchases and normal sales exception, or; |
|
| • | Applying mark-to-market accounting, which recognizes changes in the fair value of the derivative in earnings. |
If cash flow hedge accounting or accrual accounting is not applied, a derivative is subject to mark-to-market accounting. Determination of the accounting method involves significant judgments and assumptions, which are further described below.
The determination of whether a derivative contract qualifies as a cash flow hedge includes an analysis of historical market price information to assess whether the derivative is expected to be highly effective in offsetting the cash flows attributed to the hedged risk. We also assess whether the hedged forecasted transaction is probable of occurring. This assessment requires us to exercise judgment and consider a wide variety of factors in addition to our intent, including internal and external forecasts, historical experience, changing market and business conditions, our financial and operational ability to carry out the forecasted transaction, the length of time until the forecasted transaction is projected to occur, and the quantity of the forecasted transaction. In addition, we compare actual cash flows to those that were expected from the underlying risk. If a hedged forecasted transaction is not probable of occurring, or if the derivative contract is not expected to be highly effective, the derivative does not qualify for hedge accounting.
42
For derivatives designated as cash flow hedges, we must periodically assess whether they continue to qualify for hedge accounting. We prospectively discontinue hedge accounting and recognize future changes in fair value directly in earnings if we no longer expect the hedge to be highly effective, or if we believe that the hedged forecasted transaction is no longer probable of occurring. If the forecasted transaction becomes probable of not occurring, we reclassify amounts previously recorded in other comprehensive income into earnings in addition to prospectively discontinuing hedge accounting. If the effectiveness of the derivative improves and is again expected to be highly effective in offsetting the cash flows attributed to the hedged risk, or if the forecasted transaction again becomes probable, we may prospectively re-designate the derivative as a hedge of the underlying risk.
Derivatives for which the normal purchases and normal sales exception has been elected are accounted for on an accrual basis. In determining whether a derivative is eligible for this exception, we assess whether the contract provides for the purchase or sale of a commodity that will be physically delivered in quantities expected to be used or sold over a reasonable period in the normal course of business. In making this assessment, we consider numerous factors, including the quantities provided under the contract in relation to our business needs, delivery locations per the contract in relation to our operating locations, duration of time between entering the contract and delivery, past trends and expected future demand, and our past practices and customs with regard to such contracts. Additionally, we assess whether it is probable that the contract will result in physical delivery of the commodity and not net financial settlement.
Since our energy derivative contracts could be accounted for in three different ways, two of which are elective, our accounting method could be different from that used by another party for a similar transaction. Furthermore, the accounting method may influence the level of volatility in the financial statements associated with changes in the fair value of derivatives, as generally depicted below:
| | | | | | | | |
| | Consolidated Statement of Income | | Consolidated Balance Sheet |
Accounting Method
| | Drivers | | Impact | | Drivers | | Impact |
|
Accrual Accounting | | Realizations | | Less Volatility | | None | | No Impact |
Cash Flow Hedge Accounting | | Realizations & Ineffectiveness | | Less Volatility | | Fair Value Changes | | More Volatility |
Mark-to-Market Accounting | | Fair Value Changes | | More Volatility | | Fair Value Changes | | More Volatility |
Our determination of the accounting method does not impact our cash flows related to derivatives.
Additional discussion of the accounting for energy contracts at fair value is included in Notes 1 and 15 of Notes to Consolidated Financial Statements.
Oil- and Gas-Producing Activities
We use the successful efforts method of accounting for our oil- and gas-producing activities. Estimated natural gas and oil reserves and forward market prices for oil and gas are a significant part of our financial calculations. Following are examples of how these estimates affect financial results:
| | |
| • | An increase (decrease) in estimated proved oil and gas reserves can reduce (increase) our unit-of-production depreciation, depletion and amortization rates. |
|
| • | Changes in oil and gas reserves and forward market prices both impact projected future cash flows from our oil and gas properties. This, in turn, can impact our periodic impairment analyses, including that for goodwill. |
The process of estimating natural gas and oil reserves is very complex, requiring significant judgment in the evaluation of all available geological, geophysical, engineering, and economic data. After being estimated internally, 99 percent of our reserve estimates are either audited or prepared by independent experts. (See Part I Item 1 for further discussion.) The data may change substantially over time as a result of numerous factors, including additional development cost and activity, evolving production history, and a continual reassessment of the viability of production under changing economic conditions. As a result, material revisions to existing reserve estimates could occur from time to time. Such changes could trigger an impairment of our oil- and gas-producing propertiesand/or goodwill and have an impact on our depletion expense prospectively. For example, a change of approximately 10 percent in our total oil and gas reserves could change our annualdepreciation, depletion and
43
amortizationexpense between approximately $46 million and $56 million. The actual impact would depend on the specific basins impacted and whether the change resulted from proved developed, proved undeveloped or a combination of these reserve categories.
Forward market prices, which are utilized in our impairment analyses, include estimates of prices for periods that extend beyond those with quoted market prices. This forward market price information is consistent with that generally used in evaluating our drilling decisions and acquisition plans. These market prices for future periods impact the production economics underlying oil and gas reserve estimates. The prices of natural gas and oil are volatile and change from period to period, thus impacting our estimates. Significant unfavorable changes in the forward price curve could result in an impairment of our oil and gas propertiesand/or goodwill.
Contingent Liabilities
We record liabilities for estimated loss contingencies, including environmental matters, when we assess that a loss is probable and the amount of the loss can be reasonably estimated. Revisions to contingent liabilities are generally reflected in income when new or different facts or information become known or circumstances change that affect the previous assumptions with respect to the likelihood or amount of loss. Liabilities for contingent losses are based upon our assumptions and estimates and upon advice of legal counsel, engineers, or other third parties regarding the probable outcomes of the matter. As new developments occur or more information becomes available, our assumptions and estimates of these liabilities may change. Changes in our assumptions and estimates or outcomes different from our current assumptions and estimates could materially affect future results of operations for any particular quarterly or annual period. See Note 16 of Notes to Consolidated Financial Statements.
Valuation of Deferred Tax Assets and Tax Contingencies
We have deferred tax assets resulting from certain investments and businesses that have a tax basis in excess of the book basis and from tax carry-forwards generated in the current and prior years. We must evaluate whether we will ultimately realize these tax benefits and establish a valuation allowance for those that may not be realizable. This evaluation considers tax planning strategies, including assumptions about the availability and character of future taxable income. At December 31, 2008, we have $639 million of deferred tax assets for which a $15 million valuation allowance has been established. When assessing the need for a valuation allowance, we consider forecasts of future company performance, the estimated impact of potential asset dispositions and our ability and intent to execute tax planning strategies to utilize tax carryovers. The ultimate amount of deferred tax assets realized could be materially different from those recorded, as influenced by potential changes in jurisdictional income tax laws and the circumstances surrounding the actual realization of related tax assets.
We regularly face challenges from domestic and foreign tax authorities regarding the amount of taxes due. These challenges include questions regarding the timing and amount of deductions and the allocation of income among various tax jurisdictions. We evaluate the liability associated with our various filing positions by applying the two step process of recognition and measurement as required by FASB Interpretation No. 48, “Accounting for Uncertainty in Income Taxes, an interpretation of FASB Statement No. 109” (FIN 48). The ultimate disposition of these contingencies could have a significant impact on operating results and net cash flows. To the extent we were to prevail in matters for which accruals have been established or were required to pay amounts in excess of our accrued liability, our effective tax rate in a given financial statement period may be materially impacted.
See Note 5 of Notes to Consolidated Financial Statements for additional information regarding FIN 48.
Pension and Postretirement Obligations
We have employee benefit plans that include pension and other postretirement benefits. Net periodic benefit expense and obligations for these plans are impacted by various estimates and assumptions. These estimates and assumptions include the expected long-term rates of return on plan assets, discount rates, expected rate of compensation increase, health care cost trend rates, and employee demographics, including retirement age and mortality. These assumptions are reviewed annually and adjustments are made as needed. The assumptions utilized to compute expense and the benefit obligations are shown in Note 7 of Notes to Consolidated Financial Statements.
The following table
44
presents the estimated increase (decrease) in net periodic benefit expense and obligations resulting from a one-percentage-point change in the specifiedspecific assumption.
| | | | | | | | | | | | | | | | | |
| | | Benefit Expense | | | Benefit Obligation | |
| | | One-Percentage-
| | | One-Percentage-
| | | One-Percentage-
| | | One-Percentage-
| |
| | | Point Increase | | | Point Decrease | | | Point Increase | | | Point Decrease | |
| | | (Millions) | |
| |
| Pension benefits: | | | | | | | | | | | | | | | | |
| Discount rate | | $ | (13 | ) | | $ | 14 | | | $ | (133 | ) | | $ | 154 | |
| Expected long-term rate of return on plan assets | | | (7 | ) | | | 7 | | | | — | | | | — | |
| Rate of compensation increase | | | 3 | | | | (3 | ) | | | 17 | | | | (17 | ) |
| Other postretirement benefits: | | | | | | | | | | | | | | | | |
| Discount rate | | | (2 | ) | | | 2 | | | | (32 | ) | | | 37 | |
| Expected long-term rate of return on plan assets | | | (1 | ) | | | 1 | | | | — | | | | — | |
| Assumed health care cost trend rate | | | 8 | | | | (6 | ) | | | 53 | | | | (42 | ) |
The | | | | | | | | | | | | | | | | |
| | | Benefit Expense | | | Benefit Obligation | |
| | | One-
Percentage-
Point
Increase | | | One-
Percentage-
Point
Decrease | | | One-
Percentage-
Point
Increase | | | One-
Percentage-
Point
Decrease | |
| | | (Millions) | |
Pension benefits: | | | | | | | | | | | | | | | | |
Discount rate | | $ | (8 | ) | | $ | 9 | | | $ | (141 | ) | | $ | 168 | |
Expected long-term rate of return on plan assets | | | (10 | ) | | | 10 | | | | — | | | | — | |
Rate of compensation increase | | | 2 | | | | (1 | ) | | | 10 | | | | (8 | ) |
Other postretirement benefits: | | | | | | | | | | | | | | | | |
Discount rate | | | (4 | ) | | | 5 | | | | (43 | ) | | | 53 | |
Expected long-term rate of return on plan assets | | | (2 | ) | | | 2 | | | | — | | | | — | |
Assumed health care cost trend rate | | | 6 | | | | (5 | ) | | | 47 | | | | (39 | ) |
Our expected long-term rates of return on plan assets, as determined at the beginning of each fiscal year, are determined by combining a reviewbased on the average rate of return expected on the funds invested in the plans. We determine our long-term expected rates of return on plan assets using our expectations of capital market results, which includes an analysis of historical returns realized within the portfolio, theresults as well as forward-looking projections. These capital market expectations are based on a long-term period of at least ten years and consider our investment strategy included in the plans’ Investment Policy Statement, and mix of assets, which is weighted toward domestic and international equity securities. We develop our expectations using input from several external sources, including consultation with our third-party independent investment consultant. The forward-looking capital market projections are developed using a consensus of economists’ expectations for inflation, GDP growth, and dividend yield along with expected changes in risk premiums. The capital market return projections for specific asset classes in the investment portfolio are then applied to the relative weightings of the asset classificationsclasses in which the portfolio is invested as well asinvestment portfolio. The resulting rates are an estimate of future results and, thus, likely to be different than actual results.
In 2011, the weightings of each asset classification. The credit crisisfixed income exposure in the investment portfolios benefited while equities, particularly U.S. small capitalization stocks and subsequent economic downturn haveinternational stocks, negatively impacted the markets and our 2008 investment returns largely mirror market performance.portfolio returns. While the market downturn has impacted short-term2011 investment performance thesedid not meet our expected rates of return, the expected rates of return on plan assets are long-term in nature and are not significantly impacted by short-term market swings.performance. Changes to our asset
49
allocation would also impact these expected rates of return. Our expected long-term rate of return on plan assets used for our pension plans was 7.75 percent for 2006 through 2008 and 8.5 percent for 2003 through 2005. Over the past ten years, ourThe 2011 actual average return on plan assets for our pension plans has been approximately 2.1 percent. The 2008 return on plan assets for our pension plans was a loss of approximately 34.1 percent, which significantly impactedbreakeven for the year. The ten-year average rate of return on plan assets. The 2007 ten-year average rate of return onpension plan assets for the pension plansthrough December 2011 was approximately 7.74.1 percent. As described in Note 7 of Notes to Consolidated Financial Statements, the asset allocation is being changed during 2009 with a slightly higher percentage of plan assets being allocated to debt securities and cash and cash equivalents. Therefore, our 2009 expected long-term rate of return on plan assets assumption is expected to slightly decrease.
The discount rates are used to measure the benefit obligations of our pension and other postretirement benefit plans. The objective of the discount rates is to determine the amount, if invested at the December 31 measurement date in a portfolio of high-quality debt securities, that will provide the necessary cash flows when benefit payments are due. Increases in the discount rates decrease the obligation and, generally, decrease the related expense. The discount rates for our pension and other postretirement benefit plans are determined separately based on an approach specific to our plans and their respective expected benefit cash flows as described in Note 7 of Notes to Consolidated Financial Statements. Our discount rate assumptions are impacted by changes in general economic and market conditions that affect interest rates on long-term, high-quality debt securities as well as by the duration of our plans’ liabilities.
The expected rate of compensation increase represents average long-term salary increases. An increase in this rate causes the pension obligation and expense to increase.
The assumed health care cost trend rates are based on national trend rates adjusted for our actual historical cost rates that are adjusted for expected changes in the health care industry.and plan design. An increase in this rate causes the other postretirement benefit obligation and expense to increase.
Fair Value Measurements
On January 1, 2008, we adopted SFAS No. 157, “Fair Value Measurements” (SFAS No. 157), for our assets and liabilities that are measured at fair value on a recurring basis, primarily our energy derivatives. See Note 14 of Notes to Consolidated Financial Statements for disclosures regarding SFAS No. 157, including discussion of the fair value hierarchy levels and valuation methodologies.
45
50
Certain of our energy derivative assets and liabilities and other assets trade in markets with lower availability of pricing information requiring us to use unobservable inputs and are considered Level 3 in the fair value hierarchy. At December 31, 2008, 22 percent of the total assets measured at fair value and 2 percent of the total liabilities measured at fair value are included in Level 3. For Level 2 transactions, we do not make significant adjustments to observable prices in measuring fair value as we do not generally trade in inactive markets.
The determination of fair value also incorporates the time value of money and credit risk factors including the credit standing of the counterparties involved, the existence of master netting arrangements, the impact of credit enhancements (such as cash deposits and letters of credit) and our nonperformance risk on our liabilities. Currently, our approach is to apply a credit spread, based on the credit rating of the counterparty, against the net derivative asset with that counterparty. For net derivative liabilities we apply our own credit rating. We derive the credit spreads by using the corporate industrial credit curves for each rating category and building a curve based on certain points through time for each rating category. The spread comes from the discount factor of the individual corporate curves versus the discount factor of the LIBOR curve. At December 31, 2008, the credit reserve is $6 million on our net derivative assets and $15 million on our net derivative liabilities. Considering these factors and that we do not have significant risk from our net credit exposure to derivative counterparties, the impact of credit risk is not significant to the overall fair value of our derivatives portfolio.
As of December 31, 2008, 77 percent of our derivatives portfolio expires in the next 12 months and 99 percent of our derivatives portfolio expires in the next 36 months. Our derivatives portfolio is largely comprised ofexchange-traded products or like products where price transparency has not historically been a concern. Due to the nature of the markets in which we transact and the short tenure of our derivatives portfolio, we do not believe it is necessary to make an adjustment for illiquidity. We regularly analyze the liquidity of the markets based on the prevalence of broker pricing and exchange pricing for products in our derivatives portfolio.
The instruments included in Level 3 at December 31, 2008, predominantly consist of options that hedge future sales of production from our Exploration & Production segment, are structured as costless collars and are financially settled. The options are valued using an industry standard Black-Scholes option pricing model. Certain inputs into the model are generally observable, such as commodity prices and interest rates, whereas a significant input, implied volatility by location, is unobservable. The impact of volatility on changes in the overall fair value of the options structured as collars is mitigated by the offsetting nature of the put and call positions. The change in the overall fair value of instruments included in Level 3 primarily results from changes in commodity prices. The hedges are accounted for as cash flow hedges where net unrealized gains and losses from changes in fair value are recorded, to the extent effective, inother comprehensive income (loss) and subsequently impact earnings when the underlying hedged production is sold.
Exploration & Production has an unsecured credit agreement through December 2013 with certain banks that, so long as certain conditions are met, serves to reduce our usage of cash and other credit facilities for margin requirements related to instruments included in the facility.
46
Results of Operations
The following table and discussion is a summary of our consolidated results of operations for the three years ended December 31, 2008.2011. The results of operations by segment are discussed in further detail following this consolidated overview discussion.
| | | | | | | | | | | | | | | | | | | | | | | | | | | | | |
| | | Years Ended December 31, | |
| | | | | | $ Change
| | | % Change
| | | | | | $ Change
| | | % Change
| | | | |
| | | | | | from
| | | from
| | | | | | from
| | | from
| | | | |
| | | 2008 | | | 2007* | | | 2007* | | | 2007 | | | 2006* | | | 2006* | | | 2006 | |
| | | (Millions) | | | | | | | | | (Millions) | | | | | | | | | (Millions) | |
| |
| Revenues | | $ | 12,352 | | | | +1,866 | | | | +18 | % | | $ | 10,486 | | | | +1,187 | | | | +13 | % | | $ | 9,299 | |
| Costs and expenses: | | | | | | | | | | | | | | | | | | | | | | | | | | | | |
| Costs and operating expenses | | | 9,156 | | | | −1,149 | | | | −14 | % | | | 8,007 | | | | −518 | | | | −7 | % | | | 7,489 | |
| Selling, general and administrative expenses | | | 504 | | | | −33 | | | | −7 | % | | | 471 | | | | −82 | | | | −21 | % | | | 389 | |
| Other (income) expense — net | | | (82 | ) | | | +64 | | | | NM | | | | (18 | ) | | | +52 | | | | NM | | | | 34 | |
| General corporate expenses | | | 149 | | | | +12 | | | | +7 | % | | | 161 | | | | −29 | | | | −22 | % | | | 132 | |
| Securities litigation settlement and related costs | | | — | | | | — | | | | — | | | | — | | | | +167 | | | | +100 | % | | | 167 | |
| | | | | | | | | | | | | | | | | | | | | | | | | | | | | |
| Total costs and expenses | | | 9,727 | | | | | | | | | | | | 8,621 | | | | | | | | | | | | 8,211 | |
| | | | | | | | | | | | | | | | | | | | | | | | | | | | | |
| Operating income | | | 2,625 | | | | | | | | | | | | 1,865 | | | | | | | | | | | | 1,088 | |
| Interest accrued — net | | | (594 | ) | | | +59 | | | | +9 | % | | | (653 | ) | | | — | | | | — | | | | (653 | ) |
| Investing income | | | 191 | | | | −66 | | | | −26 | % | | | 257 | | | | +89 | | | | +53 | % | | | 168 | |
| Early debt retirement costs | | | (1 | ) | | | +18 | | | | +95 | % | | | (19 | ) | | | +12 | | | | +39 | % | | | (31 | ) |
| Minority interest in income of consolidated subsidiaries | | | (174 | ) | | | −84 | | | | −93 | % | | | (90 | ) | | | −50 | | | | −125 | % | | | (40 | ) |
| Other income — net | | | — | | | | −11 | | | | −100 | % | | | 11 | | | | −15 | | | | −58 | % | | | 26 | |
| | | | | | | | | | | | | | | | | | | | | | | | | | | | | |
| Income from continuing operations before income taxes | | | 2,047 | | | | | | | | | | | | 1,371 | | | | | | | | | | | | 558 | |
| Provision for income taxes | | | 713 | | | | −189 | | | | −36 | % | | | 524 | | | | −313 | | | | −148 | % | | | 211 | |
| | | | | | | | | | | | | | | | | | | | | | | | | | | | | |
| Income from continuing operations | | | 1,334 | | | | | | | | | | | | 847 | | | | | | | | | | | | 347 | |
| Income (loss) from discontinued operations | | | 84 | | | | −59 | | | | −41 | % | | | 143 | | | | +181 | | | | NM | | | | (38 | ) |
| | | | | | | | | | | | | | | | | | | | | | | | | | | | | |
| Net income | | $ | 1,418 | | | | | | | | | | | $ | 990 | | | | | | | | | | | $ | 309 | |
| | | | | | | | | | | | | | | | | | | | | | | | | | | | | |
| | | | | | | | | | | | | | | | | | | | | | | | | | | | |
| | | Years Ended December 31, | |
| | | 2011 | | | $ Change
from
2010* | | | % Change
from
2010* | | | 2010 | | | $ Change
from
2009* | | | % Change
from
2009* | | | 2009 | |
| | | (Millions) | |
Revenues | | $ | 7,930 | | | | +1,292 | | | | +19 | % | | $ | 6,638 | | | | +1,360 | | | | +26 | % | | $ | 5,278 | |
Costs and expenses: | | | | | | | | | | | | | | | | | | | | | | | | | | | | |
Costs and operating expenses | | | 5,550 | | | | -838 | | | | -18 | % | | | 4,712 | | | | -1,000 | | | | -27 | % | | | 3,712 | |
Selling, general and administrative expenses | | | 325 | | | | -12 | | | | -4 | % | | | 313 | | | | +17 | | | | +5 | % | | | 330 | |
Other (income) expense – net | | | 1 | | | | -16 | | | | NM | | | | (15 | ) | | | -19 | | | | -56 | % | | | (34 | ) |
General corporate expenses | | | 187 | | | | +34 | | | | +15 | % | | | 221 | | | | -57 | | | | -35 | % | | | 164 | |
| | | | | | | | | | | | | | | | | | | | | | | | | | | | |
Total costs and expenses | | | 6,063 | | | | | | | | | | | | 5,231 | | | | | | | | | | | | 4,172 | |
| | | | | | | | | | | | | | | | | | | | | | | | | | | | |
Operating income (loss) | | | 1,867 | | | | | | | | | | | | 1,407 | | | | | | | | | | | | 1,106 | |
Interest accrued – net | | | (573 | ) | | | +19 | | | | +3 | % | | | (592 | ) | | | +3 | | | | +1 | % | | | (595 | ) |
Investing income – net | | | 168 | | | | -20 | | | | -11 | % | | | 188 | | | | +150 | | | | NM | | | | 38 | |
Early debt retirement costs | | | (271 | ) | | | +335 | | | | +55 | % | | | (606 | ) | | | -605 | | | | NM | | | | (1 | ) |
Other income (expense) – net | | | 11 | | | | +23 | | | | NM | | | | (12 | ) | | | -14 | | | | NM | | | | 2 | |
| | | | | | | | | | | | | | | | | | | | | | | | | | | | |
Income (loss) from continuing operations before income taxes | | | 1,202 | | | | | | | | | | | | 385 | | | | | | | | | | | | 550 | |
Provision (benefit) for income taxes | | | 124 | | | | -10 | | | | -9 | % | | | 114 | | | | +90 | | | | +44 | % | | | 204 | |
| | | | | | | | | | | | | | | | | | | | | | | | | | | | |
Income (loss) from continuing operations | | | 1,078 | | | | | | | | | | | | 271 | | | | | | | | | | | | 346 | |
Income (loss) from discontinued operations | | | (417 | ) | | | +776 | | | | +65 | % | | | (1,193 | ) | | | -1,208 | | | | NM | | | | 15 | |
| | | | | | | | | | | | | | | | | | | | | | | | | | | | |
Net income (loss) | | | 661 | | | | | | | | | | | | (922 | ) | | | | | | | | | | | 361 | |
Less: Net income attributable to noncontrolling interests | | | 285 | | | | -110 | | | | -63 | % | | | 175 | | | | -99 | | | | -130 | % | | | 76 | |
| | | | | | | | | | | | | | | | | | | | | | | | | | | | |
Net income (loss) attributable to | | | | | | | | | | | | | | | | | | | | | | | | | | | | |
The Williams Companies, Inc. | | $ | 376 | | | | | | | | | | | $ | (1,097 | ) | | | | | | | | | | $ | 285 | |
| | | | | | | | | | | | | | | | | | | | | | | | | | | | |
* | | |
* | | + = Favorable change tonet income; –change; - = Unfavorable change tonet income;change; NM = A percentage calculation is not meaningful due to a change in signs, a zero-value denominator, or a percentage change greater than 200. |
Our consolidated results in 2008 have improved significantly compared to 2007. However, these results were considerably influenced by favorable results in the first three quarters of the year, followed by a sharp decline in the fourth quarter due to a rapid decline in energy commodity prices.
The increase inrevenuesis primarily due to higher marketing and NGL production revenues at Exploration & Production resulting from bothWilliams Partners as a result of higher net realized average energy commodity prices, andpartially offset by a decrease in equity NGL production volumes. Additionally, fee revenues increased production volumes sold. Midstream also experienced higher olefin production revenuesat Williams Partners primarily due to higher average pricesgathering, processing, and volumes as well astransportation fees. Midstream Canada & Olefins ethylene and Canadian NGL production revenues increased natural gas liquid (NGL) production revenuesprimarily resulting from higher average energy commodity prices partially offset by lowerand higher volumes. Additionally, Gas Marketing Services revenues increased primarily due to favorable price movements on derivative positions economically hedging the anticipated withdrawals of natural gas from storage and the absence of a loss recognized on a legacy derivative sales contract in 2007.
47
51
The increase incosts and operating expensesis primarily due to increased costs associated with our olefinmarketing purchases and operating costs at Williams Partners, partially offset by a decrease in NGL production costs. The higher marketing purchases are due to higher average energy commodity prices. Additionally, ethylene and NGL production businessesfeedstock costs increased at Midstream. Higher depreciation, depletion, and amortizationMidstream Canada & Olefins reflecting higher average per-unit feedstock costs and higher operating taxes at Exploration & Production also contributed to the increasevolumes.The unfavorable change in expenses.
The increase inselling, general and administrative expenses(SG&A)primarily includes the impact of higher staffing and compensation at our Exploration & Production and Midstream segments in support of increased operational activities.
Otherother (income) expense – net —netwithin
operating income primarily reflects:$15 million of lower involuntary conversion gains in 2008 includes:
| | |
| • | Gain of $148 million on the sale of a contractual right to a production payment on certain future international hydrocarbon production at Exploration & Production; |
|
| • | Net gains of $49 million on foreign currency exchanges at Midstream; |
|
| • | Income of $32 million related to the partial settlement of our Gulf Liquids litigation at Midstream; |
|
| • | Gain of $10 million on the sale of certain south Texas assets at Gas Pipeline; |
|
| • | Income of $17 million resulting from involuntary conversion gains at Midstream; |
|
| • | Impairment charges totaling $143 million related to certain natural gas producing properties at Exploration & Production; |
|
| • | Expense of $23 million related to project development costs at Gas Pipeline. |
Other (income) expense —netwithinoperating incomein 2007 includes:
| | |
| • | Income of $18 million associated with payments received for a terminated firm transportation agreement on Northwest Pipeline’s Grays Harbor lateral; |
|
| • | Income of $17 million associated with a change in estimate related to a regulatory liability at Northwest Pipeline; |
|
| • | Income of $12 million related to a favorable litigation outcome at Midstream; |
|
| • | Income of $8 million due to the reversal of a planned major maintenance accrual at Midstream; |
|
| • | Expense of $20 million related to an accrual for litigation contingencies at Gas Marketing Services; |
|
| • | Expense of $10 million related to an impairment of the Carbonate Trend pipeline at Midstream. |
The increase inoperating incomereflects improved operating results2011 as compared to 2010 at Exploration & ProductionWilliams Partners due to higher net realized average prices, natural gas production growth andinsurance recoveries that are in excess of the carrying value of the assets;
The absence of a $12 million gain of $148 millionin 2010 on the sale of certain assets at Williams Partners;
The absence of a contractual right$6 million favorable customer settlement in 2010 at Midstream Canada & Olefins;
$4 million lower sales of base gas from Hester Storage field in 2011 compared to a production payment,2010 at Williams Partners.
These unfavorable changes are partially offset by increased operating costs and $143by:
$19 million of property impairmentsincome related to the Gulf Liquids litigation contingency accrual reduction in 2008. 2011 at Midstream Canada & Olefins (see Note 16 of Notes to Consolidated Financial Statements);
$10 million related to the reversal of project feasibility costs from expense to capital in 2011 at Williams Partners (see Note 4 of Notes to Consolidated Financial Statements).
The increase also reflects improved results at Gas Marketing Servicesdecrease ingeneral corporate expensesis primarily due to the absence of $45 million of transaction costs incurred in 2010 associated with our strategic restructuring transaction.
The favorable change inoperating income (loss) generally reflects an improved energy commodity price movements on derivative positions economically hedging the anticipated withdrawals of natural gas from storageenvironment in 2011 compared to 2010, increased fee revenues, and the absence of a losscosts associated with the strategic restructuring in 2010, partially offset by higher operating costs and an unfavorable change inother (income) expense – netas previously discussed.
The unfavorable change ininvesting income – netis primarily due to $32 million of decreased gains recognized on a legacy derivative sales contract in 2007. Partially offsetting these increases2011 related to the 2010 sale of our interest in Accroven SRL. (See Note 3 of Notes to Consolidated Financial Statements.) This decrease is a decreasepartially offset by an increase of $12 million in equity earnings, primarily at Williams Partners related to an increased ownership interest in Overland Pass Pipeline Company LLC.
Early debt retirement costsin 2011 reflect costs related to corporate debt retirements in December 2011, including $254 million in related premiums. (See Note 11 of Notes to Consolidated Financial Statements.)Early debt retirement costsin 2010 reflect costs related to corporate debt retirements associated with our first quarter 2010 strategic restructuring transaction, including premiums of $574 million.
Other (income) expense – net belowoperating income (loss)at Midstream changed favorably primarily due to a sharp decline in energy commodity prices in the latter part of 2008.
Interest accrued —netdecreased primarily due to increased capitalized interest resulting from an increased level of capital expenditures. The decrease was also a result of lower interest rates on debt issuances that occurred late in the fourth quarter of 2007 and in the first half of 2008 for which the proceeds were primarily used to retire existing debt bearing higher interest rates. While our overall debt balances have been relatively comparable, the net effect of these retirements and issuances has resulted in lower rates.
The decrease ininvesting incomeis primarily due to a$11 million decrease in interest income largely resulting from lower average interest ratesenvironmental accruals in 20082011 as compared to 2007.
Minority interest in income of consolidated subsidiariesincreased primarily reflecting the growth in the minority interest holdings of Williams Partners L.P. and Williams Pipeline Partners L.P. in late 2007 and early 2008, respectively.
48
Provision (benefit) for income taxesincreasedchanged unfavorably primarily due to higher pre-tax income, partially offset by a reductionfederal settlements in our estimate2011 and an adjustment to reverse taxes on undistributed earnings of the effective deferred state tax rate.certain foreign operations that are now considered permanently reinvested. See Note 5 of Notes to Consolidated Financial Statements for a reconciliation of the effective tax raterates compared to the federal statutory rate for both periods.
years.Income (loss) from discontinued operations reflects the results of operations of our former exploration and production business as discontinued operations. See Note 2 of Notes to Consolidated Financial Statements.
The unfavorable change innet income attributable to noncontrolling interestsreflects higher operating results at WPZ and increased noncontrolling interest ownership of WPZ as a result of WPZ equity issuances in 2010. These changes are partially offset by our greater ownership interest related to WPZ’s merger with Williams Pipeline Partners L.P., which was completed in 2010.
52
2010 vs. 2009
The increase inrevenuesis primarily due to higher marketing and NGL production revenues resulting from higher average energy commodity prices at Williams Partners. NGL and olefin production revenues at Midstream Canada & Olefins also increased due to higher average per-unit prices.
The increase incosts and operating expensesis primarily due to increased marketing purchases and NGL production costs at Williams Partners, reflecting higher average energy commodity prices. Additionally, NGL and olefin production costs at Midstream Canada & Olefins increased due to higher average per-unit feedstock costs.
Other (income) expense – net withinoperating income (loss) in 2009 includes a $40 million gain on the sale of our Cameron Meadows NGL processing plant at Williams Partners.
General corporate expenses in 2010 includes $45 million of transaction costs associated with our strategic restructuring transaction as discussed above.
The favorable change inoperating income (loss) is primarily due to an improved energy commodity price environment in 2010 compared to 2009. The favorable change is partially offset by $45 million of transaction costs in 2010 associated with our strategic restructuring transaction and an unfavorable change inother (income) expense – net.
The increase ininvesting income – net is primarily due to the absence of a $75 million impairment charge in 2009 and a $43 million gain in 2010 on the sale of our 50 percent interest in Accroven at Other, and a $28 million increase in equity earnings at Williams Partners.
Early debt retirement costs in 2010 reflect costs related to corporate debt retirements associated with our first quarter strategic restructuring transaction, including premiums of $574 million.
Other (income) expense – net belowoperating income (loss) in 2010 includes an $8 million environmental expense accrual associated with former refinery operations.
Provision (benefit) for income taxeschanged favorably primarily due to lower pre-tax income. See Note 5 of Notes to Consolidated Financial Statements for a reconciliation of the effective tax rates compared to the federal statutory rate for both years.
See Note 2 of Notes to Consolidated Financial Statements for a discussion of the items inincome (loss) from discontinued operations.operations
The increase inrevenuesis due primarilyNet income attributable to noncontrolling interestsincreased reflecting higher Midstream revenues associated with increased NGL and olefins marketing revenues and increased production of olefins and NGLs. Exploration & Production experienced higher revenues alsoresults at WPZ due to increasesan improved energy commodity price environment in production volumes and net realized average prices. Additionally, Gas Pipeline revenues increased primarily due to increased rates in effect since the first quarter of 2007. These increases are partially offset by a mark-to-market loss recognized at Gas Marketing Services on a legacy derivative natural gas sales contract that we expect to assign to another party in 2008 under an asset transfer agreement that we executed in December 2007.
The increase incosts and operating expensesis due primarily to increased NGL and olefins marketing purchases and increased costs associated with our olefins production business at Midstream. Additionally, Exploration & Production experienced higher depreciation, depletion and amortization and lease operating expenses due primarily to higher production volumes.
The increase inSG&Ais primarily due to increased staffing in support of increased drilling and operational activity at Exploration & Production, the absence of a $25 million gain in 2006 related to the sale of certain receivables at Gas Marketing Services, and a $9 million charge related to certain international receivables at Midstream.
Other (income) expense —netwithinoperating incomein 2006 includes:
| | |
| • | A $73 million accrual for a Gulf Liquids litigation contingency; |
|
| • | Income of $9 million due to a settlement of an international contract dispute at Midstream. |
The increase ingeneral corporate expensesis attributable to various factors, including higher employee-related costs, increased levels of charitable contributions and information technology expenses. The higher employee-related costs are primarily the result of higher stock compensation expense. (See Note 1 of Notes to Consolidated Financial Statements.)
Thesecurities litigation settlement and related costsis primarily the result of our 2006 settlement related toclass-action securities litigation filed on behalf of purchasers of our securities between July 24, 2000 and July 22, 2002. (See Note 16 of Notes to Consolidated Financial Statements.)
The increase inoperating incomereflects record high NGL margins at Midstream, continued strong natural gas production growth at Exploration & Production, the positive effect of new rates at Gas Pipeline, and the absence of 2006 litigation expenses associated with shareholder lawsuits and Gulf Liquids litigation.
Interest accrued — netincludes a decrease of $19 million in interest expense associated with our Gulf Liquids litigation contingency, offset by changes in our debt portfolio, most significantly the issuance of new debt in December 2006 by Williams Partners L.P.
The increase ininvesting incomeis due to:
| | |
| • | A $27 million increase in interest income primarily associated with larger cash and cash equivalent balances combined with slightly higher rates of return in 2007 compared to 2006; |
|
| • | Increased equity earnings of $38 million due largely to increased earnings of our Gulfstream Natural Gas System, L.L.C. (Gulfstream), Discovery Producer Services LLC (Discovery) and Aux Sable Liquid Products, L.P. (Aux Sable) investments; |
49
| | |
| • | The absence of a $16 million impairment in 2006 of a Venezuelan cost-based investment at Exploration & Production; |
|
| • | $14 million of gains from sales of cost-based investments in 2007. |
These increases are partially offset by the absence of a $7 million gain on the sale of an international investment in 2006.
Early debt retirement costsin 2007 includes $19 million of premiums and fees related to the December 2007 repurchase of senior unsecured notes.Early debt retirement costsin 2006 includes $27 million in premiums and fees related to the January 2006 debt conversion and $4 million of accelerated amortization of debt expenses related to the retirement of the debt secured by assets of Williams Production RMT Company.
Minority interest in income of consolidated subsidiariesincreased primarily due to the growth in the minority interest holdings of Williams Partners L.P.
Provision for income taxeswas significantly higher in 2007 due primarily to higher pre-tax earnings. See Note 5 of Notes to Consolidated Financial Statements for a reconciliation of the effective tax rate2010 compared to the federal statutory rate for both periods.
See Note 2 of Notes to Consolidated Financial Statements for a discussion of the items inincome (loss) from discontinued operations.
Results of Operations — Segments
We are currently organized into the following segments: Exploration & Production, Gas Pipeline, Midstream, Gas Marketing Services, and Other. Other primarily consists of corporate operations. Our management currently evaluates performance based on segment profit (loss) from operations. (See Note 18 of Notes to Consolidated Financial Statements.)
Exploration & Production
Overview of 2008
In 2008, segment revenues and segment profit for Exploration & Production improved significantly compared to 2007. The 2008 results benefited from higher production levels coupled with higher natural gas prices through the first three quarters of the year. However, the results were negatively impacted by a significant decline in natural gas prices in the fourth quarter. The potential impact of sustained lower natural gas prices is discussed further in the followingOutlook for 2009,section.
We’ve remained focused on continuing our domestic development drilling program in our growth basins. Accordingly, we:
| | |
| • | Benefited from increased domestic net realized average prices for the total year of 2008, which increased by approximately 28 percent compared to 2007. The domestic net realized average price for 2008 was $6.48 per thousand cubic feet of gas equivalent (Mcfe) compared to $5.08 per Mcfe in 2007. Net realized average prices include market prices, net of fuel and shrink and hedge positions, less gathering and transportation expenses. The domestic net realized average price for the fourth quarter 2008 was $4.43 per Mcfe reflecting the significant decline in natural gas prices. |
|
| • | Increased average daily domestic production levels by approximately 20 percent compared to 2007. The average daily domestic production for 2008 was approximately 1,094 million cubic feet of gas equivalent (MMcfe) compared to 913 MMcfe in 2007. The increased production is primarily due to increased development within the Piceance, Powder River, and Fort Worth basins. |
|
| • | Drilled 1,783 gross domestic development wells in 2008 with a success rate of approximately 99 percent. This contributed to total net additions of 602 billion cubic feet equivalent (Bcfe) in net reserves — a replacement rate for our domestic production of 148 percent. Capital expenditures for domestic drilling, development, and acquisition activity in 2008 were approximately $2.5 billion compared to $1.7 billion in |
50
| | |
| | 2007. Capital expenditures for 2008 include acquisitions in the Piceance and Fort Worth basins discussed inSignificant eventsbelow. |
The benefits of higher net realized average prices and higher production volumes were partially offset by increased operating costs. The increase in operating costs was primarily due to the impact of increased production volumes and prices on operating taxes and higher well service and lease service costs. In addition, higher production volumes coupled with higher capitalized drilling costs increased depreciation, depletion, and amortization expense.
Significant events
In January 2008, we sold a contractual right to a production payment on certain future international hydrocarbon production for $148 million. As a result of the contract termination, we have no further interests associated with the crude oil concession, which is located in Peru. We had obtained these interests through our acquisition of Barrett Resources Corporation in 2001.
In May 2008, we acquired certain undeveloped leasehold acreage, producing properties and gathering facilities in the Piceance basin for $285 million. A third party subsequently exercised its contractual option to purchase, on the same terms and conditions, an interest in a portion of the acquired assets for $71 million.
In September 2008, we increased our position in the Fort Worth basin by acquiring certain undeveloped leasehold acreage and producing properties for $147 million. This acquisition is consistent with our growth strategy of leveraging our horizontal drilling expertise by acquiring and developing low-risk properties.
Based on our assessment of undiscounted and discounted future cash flows, which considered year-end natural gas reserve quantities, we recorded an impairment of $129 million in December 2008 related to our properties in the Arkoma basin. In September 2008, we recorded a $14 million impairment due to unfavorable drilling results, also in the Arkoma basin.
In December 2008, the Wyoming Supreme Court ruled against us on our appeal of the Wyoming State Board of Equalization’s decision to uphold an assessment by the Wyoming Department of Audit related to severance and ad valorem taxes for the years 2000 through 2002. Related to this decision, we adjusted our estimated liability for the periods from 2000 through 2008, which resulted in a charge of $34 million. (See Note 4 of Notes to Consolidated Financial Statements.)
Outlook for 2009
Considering the previously discussed significant decline in natural gas prices, we expect segment revenues and segment profit in 2009 to be significantly lower than in 2008. As a result, we plan to reduce capital expenditures and deploy fewer drilling rigs in 2009 compared to 2008 which will reduce the number of wells drilled. We have the following expectations and objectives for 2009:
| | |
| • | Continuing our development drilling program in the Piceance, Fort Worth, Powder River and San Juan basins through our planned capital expenditures projected between $950 million and $1.05 billion. |
|
| • | Slight growth in our annual average daily domestic production level compared to 2008, with fourth quarter 2009 volumes likely to be less than the prior comparable period. |
|
| • | Declines in the costs of services and materials associated with development activities as demand for these resources decline. However, in the first quarter of 2009, we estimate we will incur between $25 million and $35 million in expense from contract penalties associated with the reduction in drilling rigs deployed. |
Risks to achieving our expectations include unfavorable natural gas market price movements which are impacted by numerous factors, including weather conditions, domestic natural gas production levels and demand, and the downturn in the global economy. A further significant decline in natural gas prices would impact these expectations for 2009.
In addition, changes in laws and regulations may impact our development drilling program. For example, the Colorado Oil & Gas Conservation Commission has enacted new rules effective in April 2009 which will increase our costs of permitting and environmental compliance and potentially delay drilling permits. The new rules include
51
additional environmental and operational requirements before permit approvals are granted, tracking of certain chemicals brought on location, increased wildlife stipulations, new pit and waste management procedures and increased notifications and approvals from surface landowners.
Commodity Price Risk Strategy
To manage the commodity price risk and volatility of owning producing gas properties, we enter into derivative forward sales contracts that fix the sales price relating to a portion of our future production using NYMEX and basis fixed-price contracts and collar agreements.
For 2009, we have the following agreements and contracts for our daily domestic production, shown at weighted average volumes and basin-level weighted average prices:
| | | | | | | | | |
| | | | | | Price ($/Mcf)
| |
| | | Volume
| | | Floor-Ceiling for
| |
| | | (MMcf/d) | | | Collars | |
| |
| Collar agreements — Rockies | | | 150 | | | $ | 6.11 - $9.04 | |
| Collar agreements — San Juan | | | 245 | | | $ | 6.58 - $9.62 | |
| Collar agreements — Mid-Continent | | | 95 | | | $ | 7.08 - $9.73 | |
| NYMEX and basis fixed-price | | | 106 | | | | $3.67 | |
The following is a summary of our agreements and contracts for daily production for the years ended December 31, 2008, 2007 and 2006:
| | | | | | | | | | | | | |
| | | 2008 | | 2007 | | 2006 |
| | | | | Price ($/Mcf)
| | | | Price ($/Mcf)
| | | | Price ($/Mcf)
|
| | | Volume
| | Floor-Ceiling for
| | Volume
| | Floor-Ceiling for
| | Volume
| | Floor-Ceiling for
|
| | | (MMcf/d) | | Collars | | (MMcf/d) | | Collars | | (MMcf/d) | | Collars |
| |
| Collars — NYMEX | | — | | — | | 15 | | $6.50 - $8.25 | | 49 | | $6.50 - $8.25 |
| Collars — NYMEX | | — | | — | | — | | — | | 15 | | $7.00 - $9.00 |
| Collars — Rockies | | 170 | | $6.16 - $9.14 | | 50 | | $5.65 -$7.45 | | 50 | | $6.05 - $7.90 |
| Collars — San Juan | | 202 | | $6.35 - $8.96 | | 130 | | $5.98 - $9.63 | | — | | — |
| Collars — Mid-Continent | | 63 | | $7.02 - $9.72 | | 76 | | $6.82 -$10.77 | | — | | — |
| NYMEX and basis fixed-price | | 70 | | $3.97 | | 172 | | $3.90 | | 299 | | $3.82 |
Additionally, we utilize contracted pipeline capacity through Gas Marketing to move our production from the Rockies to other locations when pricing differentials are favorable to Rockies pricing. We also expect additional pipeline capacity to be put into service in 2009.
Year-Over-Year Operating Results
| | | | | | | | | | | | | |
| | | Years Ended December 31, | |
| | | 2008 | | | 2007 | | | 2006 | |
| | | (Millions) | |
| |
| Segment revenues | | $ | 3,121 | | | $ | 2,021 | | | $ | 1,411 | |
| | | | | | | | | | | | | |
| Segment profit | | $ | 1,260 | | | $ | 756 | | | $ | 552 | |
| | | | | | | | | | | | | |
2008 vs. 2007
The increase in totalsegment revenuesis primarily due to the following:
| | |
| • | $919 million, or 53 percent, increase in domestic production revenues reflecting $571 million associated with a 28 percent increase in net realized average prices and $348 million associated with a 20 percent increase in production volumes sold. The impact of hedge positions on increased net realized average prices includes the effect of fewer volumes hedged by fixed-price contracts. The increase in production volumes reflects an increase in the number of producing wells primarily from the Piceance, Powder River, |
52
| | |
| | and Fort Worth basins. Production revenues in 2008 and 2007 include approximately $85 million and $53 million, respectively, related to natural gas liquids and approximately $62 million and $40 million, respectively, related to condensate. |
| | |
| • | $151 million increase in revenues for gas management activities related to gas sold on behalf of certain outside parties, which is substantially offset by a similar increase insegment costs and expenses. This increase is primarily due to increases in natural gas prices and volumes sold. |
|
| • | $17 million favorable change related to hedge ineffectiveness due to $1 million in net unrealized gains from hedge ineffectiveness in 2008 compared to $16 million in net unrealized losses in 2007. |
Totalsegment costs and expensesincreased $591 million, primarily due to the following:
| | |
| • | $202 million higher depreciation, depletion and amortization expense primarily due to higher production volumes and increased capitalized drilling costs. |
|
| • | $149 million increase in expenses for gas management activities related to gas purchased on behalf of certain outside parties, which is offset by a similar increase insegment revenues. |
|
| • | $143 million of property impairments in 2008 in the Arkoma basin as previously discussed. |
|
| • | $118 million higher operating taxes primarily due to both higher average market prices and higher domestic production volumes sold and the $34 million charge related to the Wyoming severance and ad valorem tax issue previously discussed. |
|
| • | $61 million higher lease operating expenses from the increased number of producing wells primarily within the Piceance, Powder River, and Fort Worth basins combined with increased prices for well and lease service expenses and higher facility expenses. |
|
| • | $28 million higher SG&A expenses primarily due to increased staffing in support of increased drilling and operational activity, including higher compensation. The higher SG&A expenses also include an increase of $11 million in bad debt expense. |
|
| • | $17 million higher gathering expenses due to higher domestic production volumes. |
|
| • | $17 million of expense in 2008 related to the write-off of certain exploratory drilling costs for our domestic and international operations. |
These increases are partially offset by the $148 million gain associated with the previously discussed sale of our Peru interests in 2008.
The $504 million increase in segment profitis primarily due to the 28 percent increase in domestic net realized average prices and the 20 percent increase in domestic production volumes sold, partially offset by the increase in totalsegment costs and expenses.
2007 vs. 2006
The increase in totalsegment revenuesis primarily due to the following:
| | |
| • | $487 million, or 39 percent, increase in domestic production revenues reflecting $264 million associated with a 21 percent increase in production volumes sold and $223 million associated with a 15 percent increase in net realized average prices. The increase in production volumes reflects an increase in the number of producing wells primarily from the Piceance and Powder River basins. The impact of hedge positions on increased net realized average prices includes both the expiration of a portion of fixed-price hedges that are lower than the current market prices and higher than current market prices related to basin-specific collars entered into during the period. Production revenues in 2007 include approximately $53 million related to natural gas liquids. In 2006, approximately $29 million of similar revenues were classified within other revenues. |
|
| • | $144 million increase in revenues for gas management activities related to gas sold on behalf of certain outside parties which is offset by a similar increase insegment costs and expenses. |
53
These increases were partially offset by a $30 million unfavorable change related to hedge ineffectiveness due to $16 million in net unrealized losses from hedge ineffectiveness in 2007 compared to $14 million in net unrealized gains in 2006.
Totalsegment costs and expensesincreased $409 million, primarily due to the following:
| | |
| • | $173 million higher depreciation, depletion and amortization expense primarily due to higher production volumes and increased capitalized drilling costs. |
|
| • | $144 million increase in expenses for gas management activities related to gas purchased on behalf of certain outside parties which is offset by a similar increase insegment revenues. |
|
| • | $46 million higher lease operating expenses from the increased number of producing wells primarily within the Piceance, Powder River, and Fort Worth basins in combination with higher well service expenses, facility expenses, equipment rentals, maintenance and repair services, and salt water disposal expenses. |
|
| • | $36 million higherSG&A expensesprimarily due to increased staffing in support of increased drilling and operational activity, including higher compensation. In addition, we incurred higher insurance and information technology support costs related to the increased activity. First quarter 2007 also includes approximately $5 million of expenses associated with a correction of costs incorrectly capitalized in prior periods. |
The $204 million increase in segment profitis primarily due to the 21 percent increase in domestic production volumes sold as well as the
15impact of the first-quarter 2009 impairments and related charges associated with our discontinued Venezuela operations.Results of Operations— Segments
Williams Partners
Our Williams Partners segment includes WPZ, our consolidated master limited partnership, which includes two interstate natural gas pipelines, as well as investments in natural gas pipeline-related companies, which serve regions from the San Juan basin in northwestern New Mexico and southwestern Colorado to Oregon and Washington and from the Gulf of Mexico to the northeastern United States. WPZ also includes natural gas gathering, processing, and treating facilities and oil gathering and transportation facilities located primarily in the Rocky Mountain and Gulf Coast regions of the United States. As of December 31, 2011, we own approximately 75 percent increaseof the interests in net realized average prices, partially offsetWPZ, including the interests of the general partner, which is wholly owned by the increase insegment costsus, and expenses.
Gas Pipeline
Overview
Gas Pipeline’sincentive distribution rights.53
Williams Partners’ ongoing strategy is to create value focusessafely and reliably operate large-scale, interstate natural gas transmission and midstream infrastructures where our assets can be fully utilized and drive low per-unit costs. We focus on maximizing the utilization of our pipeline capacityconsistently attracting new business by providing high quality,highly reliable service to our customers and utilizing our low cost transportationcost-of-capital to invest in growing markets, including the deepwater Gulf of Mexico, the Marcellus Shale, the western United States, and areas of increasing natural gas to large and growing markets.
Gas Pipeline’sdemand.Williams Partners’ interstate transmission and related storage activities are subject to regulation by the FERC and as such, our rates and charges for the transportation of natural gas in interstate commerce, and the extension, expansion or abandonment of jurisdictional facilities and accounting, among other things, are subject to regulation. The rates are established through the FERC’s ratemaking process. Changes in commodity prices and volumes transported have little near-term impact on revenues because the majority of cost of service is recovered through firm capacity reservation charges in transportation rates. As a result, the recent decline in energy commodity prices has not significantly impacted our results
Overview of operations.
2011Significant events during 2011 include the following:
Laser Northeast Gathering System Acquisition
In February 2012, we acquired the Laser Northeast Gathering System and other midstream businesses from Delphi Midstream Partners, LLC for $325 million in cash, net of 2008 include:
Gas Pipeline master limited partnership
In 2008, Williams Pipeline Partners L.P. completed its initial public offering. We own approximately 47.7 percent ofcash acquired in the interests, including the interests of the general partner, which is wholly owned by us,transaction and incentive distribution rights. We consolidate Williams Pipeline Partners L.P. within our Gas Pipeline segment due to our control through the general partner. (See Note 1 of Notes to Consolidated Financial Statements.) Gas Pipeline’s segment profit includes 100 percent of Williams Pipeline Partners L.P.’s segment profit with the minority interest’s share presented below segment profit.
Status of rate case
During 2006, Transco filed a general rate case with the FERC designed to recover increases in costs. The new rates were effective, subject to refund, on March 1, 2007. On November 28, 2007, Transco filed a formal stipulationcertain closing adjustments, and agreement with the FERC resolving all substantive issues in their pending 2006 rate case. On March 7, 2008, the
54
FERC approved the agreement without modification.approximately 7.5 million of WPZ’s common units. The agreement became effective June 1, 2008 and required refunds were issued in July 2008.
Hurricane Ike
In September 2008, Hurricane Ike impacted several onshore and offshore facilities on Transco’s interstateLaser Gathering System is comprised of 33 miles of 16-inch natural gas pipeline system resultingand associated gathering facilities in varying degreesSusquehanna County, Pennsylvania, as well as 10 miles of damage. However, Transco has continued to meet its customer commitments while running at lower-than-normal volumes. We expect the majority of associated costs will be recoverable through insurance, with the remainder recoverable through Transco’s rates. We also expect the premiums for insuring our assetsgathering pipeline in southern New York. The acquisition is supported by existing long-term gathering agreements that provide acreage dedications and volume commitments. As production in the GulfMarcellus increases, the Laser system is expected to reach a capacity of Mexico region against weather events to significantly increase in 2009.
1.3 Bcf/d.Gulfstream Phase III expansion project
In June 2007, our equity method investee, Gulfstream Natural Gas System, L.L.C. (Gulfstream), received FERC approval to extend its existing pipeline approximately 34 miles within Florida. Construction began in April 2008Marcellus Shale Gathering Asset Transition and the expansion was placed into service in September 2008. The extension fully subscribed the remaining 345 Mdt/d of firm capacity on the existing pipeline. Gulfstream’s estimated cost of this project is $118 million.
Gulfstream Phase IV expansion projectExpansion
In September 2007, Gulfstream received FERC approval to construct 17.8 miles of20-inchOur Springville pipeline and to install a new compressor facility. Construction began in December 2007. The pipeline expansion was placed into service in the fourth quarter of 2008, and the compressor facility was placed into service in January 2009.2012, allowing us to deliver approximately 300 MMcf/d into the Transco pipeline. This new take-away capacity allows full use of approximately 650 MMcf/d of capacity from various compression and dehydration expansion projects to our gathering business in northeastern Pennsylvania’s Marcellus Shale which we acquired at the end of 2010. In conjunction with a long-term agreement with a significant producer, we are operating the 33-mile, 24-inch diameter natural gas gathering pipeline, connecting a portion of our gathering assets into the Transco pipeline. Expansions to the Springville compression facilities in 2012 are expected to increase the capacity to approximately 625 MMcf/d.
Construction of a new noncontiguous gathering system is complete and was placed into service in October 2011. This system currently has the capacity to deliver approximately 50 MMcf/d into a third-party interstate pipeline via the newly acquired Laser gathering system.
In early 2011, we assumed the operational activities for these gathering systems in northeastern Pennsylvania’s Marcellus Shale which we acquired at the end of 2010. The expansion increasedacquired business included 75 miles of gathering pipelines and two compressor stations. We expect to expand this gathering system to a planned capacity of 1.7 Bcf/d by 155 Mdt/d. Gulfstream’s estimated cost of this project is $192 million.
2015.Sentinel expansion projectKeathley Canyon Connector™
In August 2008, we received FERC approvalOur equity investee, Discovery, plans to construct, an expansionown, and operate a new 215-mile 20-inch deepwater lateral pipeline for production from the Keathley Canyon Connector™, Walker Ridge, and Green Canyon areas in the northeast United States.central deepwater Gulf of Mexico. Discovery has signed long-term agreements with anchor customers for natural gas gathering and processing services for production from those fields. The costKeathley Canyon Connector™ lateral will originate from a third-party floating production facility in the southeast portion of the projectKeathley Canyon Connector™ area and will connect to Discovery’s existing 30-inch offshore gas transmission
54
system. The lateral pipeline is estimated to have the capacity to flow more than 400 MMcf/d and will accommodate the tie-in of other deepwater prospects. Construction is expected to begin in 2013, with a mid-2014 in-service date.
Gulfstar FPS™ Deepwater Project
In October 2011, we executed agreements with two significant producers to provide production handling services for the Tubular Bells discovery located in the eastern deepwater Gulf of Mexico. The operator of the Tubular Bells field will utilize our proprietary floating-production system, Gulfstar FPS™. We expect Gulfstar FPS™ to be capable of serving as a central host facility for other deepwater prospects in the area. We will design, construct, and install our Gulfstar FPS™ with a capacity of 60 Mbbls/d of oil, up to $200 million. We placed Phase I into service in December 2008 increasing capacity by 40 Mdt/d. Phase II200 MMcf/d of natural gas, and the capability to provide seawater injection services. The facility is a spar-based floating production system that utilizes a standard design approach that will provide an additional 102 Mdt/dallow customers to reduce their cycle time from discovery to first production. Construction is underway and the project is expected to be placed intoin service by November 2009.
Colorado Hub Connection project
In September 2008, we filed an application with the FERC to construct a27-mile pipeline to provide increased access to the Rockies natural gas supplies. The estimated cost of the project is $60 million with service targeted to commence in
November 2009. 2014.Eagle Ford Shale
We will combine the lateral capacity with 341 Mdt/d of existing mainline capacity from various receipt points for delivery to Ignacio, Colorado, including approximately 98 Mdt/d of capacity that was soldhave completed construction on a short-term basis.
Outlook for 2009
In additionpipeline segment and related modifications necessary to reverse the Gulfstream Phase IV compressor facility, Phase IIflow of the Sentinel expansion project, and the Colorado Hub Connection project previously discussed, we have several other proposed projectsan existing Transco pipeline segment in southwest Texas, which began to meet customer demands. Subject to regulatory approvals, construction of some of these projects could begin as early as 2009.
Year-Over-Year Operating Results
| | | | | | | | | | | | | |
| | | Years Ended December 31, | |
| | | 2008 | | | 2007 | | | 2006 | |
| | | (Millions) | |
| |
| Segment revenues | | $ | 1,634 | | | $ | 1,610 | | | $ | 1,348 | |
| | | | | | | | | | | | | |
| Segment profit | | $ | 689 | | | $ | 673 | | | $ | 467 | |
| | | | | | | | | | | | | |
55
2008 vs. 2007
Segment revenuesincreased $24 million, or 1 percent, due primarily to a $52 million increase in transportation revenues resulting primarily from Transco’s new rates, which were effective March 2007, and expansion projects that Transco placed into service in the fourth quarter of 2007. In addition,segment revenuesincreased $28 million due to transportation imbalance settlements (offset incosts and operating expenses). Partially offsetting these increases is the absence of $59 million associated with a 2007 sale of excess inventory gas (offset incosts and operating expenses).
Costs and operating expensesdecreased $11 million, or 1 percent, due primarily to the absence of $59 million associated with a 2007 sale of excess inventory gas (offset insegment revenues). The decrease is partially offset by an increase in costs of $28 million associated with transportation imbalance settlements (offset insegment revenues) and higher rental expense related to the Parachute lateral that was transferred to Midstream in December 2007.
Other income —netchanged unfavorably by $31 million due primarily to the absence of $18 million of income recognized in 2007 associated with payments received for a terminated firm transportation agreement on Northwest Pipeline’s Grays Harbor lateral and the absence of $17 million of income recorded in 2007 for a change in estimate related to a regulatory liability at Northwest Pipeline. In addition, project development costs were $21 million higher in 2008. Partially offsetting these unfavorable changes is a $10 million gain in 2008 on the sale of certaingather south Texas assets by Transco and a $9 million gain in 2008 on the sale of excess inventory gas.
The $16 million, or 2 percent, increase insegment profitis due primarilygas to the favorable changes in segment revenues and costs and operating expenses as well as slightly higher equity earnings from Gulfstream. These increases are partially offset by the unfavorable change inother income— net.
2007 vs. 2006
Revenuesincreased $262 million, or 19 percent, due primarily to a $173 million increase in transportation revenues and a $25 million increase in storage revenues resulting primarily from new rates effective in the first quarter of 2007. In addition, revenues increased $59 million due to the sale of excess inventory gas.
Costs and operating expensesincreased $86 million, or 11 percent, due primarily to:
| | |
| • | An increase of $59 million associated with the sale of excess inventory gas; |
|
| • | An increase in depreciation expense of $30 million due to property additions; |
|
| • | An increase in personnel costs of $10 million due primarily to higher compensation as well as an increase in number of employees. |
Partially offsetting these increases is a decrease of $12 million in contract and outside service costs and a decrease of $7 million in materials and supplies expense.
Other (income) expense —netchanged favorably by $15 million due primarily to $18 million of income associated with payments received for a terminated firm transportation agreement on Northwest Pipeline’s Grays Harbor lateral. Also included in the favorable change is $17 million of income recordedour Markham gas processing facility in the second quarter of 2007 for2011. In addition, we connected a change in estimate related to a regulatory liability at Northwest Pipeline, partially offset by $18 million of expense related to higher asset retirement obligations.
Equity earnings increased $14 million due primarily to a $14 million increase in equity earnings from Gulfstream. Gulfstream’s higher earnings were primarily due to a decrease in property taxes from a favorable litigation outcome as well as improved operating results.
The $206 million, or 44 percent, increase insegment profitis due primarily to $262 million higher revenues, $14 million higher equity earnings and $15 million favorableother (income) expense — netas previously discussed. Partially offsetting these increases are highercosts and operating expensesas previously discussed.
56
Midstream Gas & Liquids
Overview of 2008
Midstream’s ongoing strategy is to safely and reliably operate large-scale midstream infrastructure where our assets can be fully utilized and drive lowper-unit costs. We focus on consistently attracting new business by providing highly reliable servicethird-party pipeline to our customers.
Significant eventsMarkham plant during 2008 include the following:
In the first three quarters of 2008, segment revenues and segment profit improved considerably compared to 2007. However, these results were followed by a steep decline in the fourththird quarter due to a rapid decline in NGL and olefin prices. Comparedthat is delivering Eagle Ford Shale gas to the prior year,plant. We have executed both fee-based and keep whole processing agreements which we expect will increase utilization of our combined margins associated with the production and marketing of NGLs declined 70 percent in the fourth quarter and 15 percent for the year. ComparedMarkham facility to the prior year, our combined margin from our olefin production and marketing business unit declined 81 percentfull gas processing capacity. Markham is subject to limited NGL take-away capacity until third-party pipeline connections are completed in the fourth quarter and 18 percent for the year. The ongoing impact of sustained lower commodity prices is discussed further in the following Outlook for 2009 section.
early 2013.Volatile commodity pricesPerdido Norte
Domestic Gathering and Processing Per-Unit NGL Margin with Production and
Sales Volumes by Quarter
(excludes partially owned plants)
During the first three quarters of 2008, strongper-unit NGL margins driven by higher crude prices, which impact NGL prices, in relationship to natural gas prices contributed significantly to our realized margins. During the fourth quarter of 2010, both oil and gas production began to flow on a sustained basis through our Perdido Norte expansion, located in the western deepwater of the Gulf of Mexico. The project included a 200 MMcf/d expansion of our Markham gas processing facility and a total of 179 miles of deepwater oil and gas lines that expand the scale of our existing infrastructure. While 2011 production volumes were significantly lower than originally expected, they have increased each quarter of 2011 as producers have resolved several technical issues. With these improvements and with the addition of a new well, we anticipate volumes in 2012 to be higher than in 2011.
Gulfstream
In May 2011, an entity reported within Other contributed a 24.5 percent interest in Gulfstream to WPZ in exchange for aggregate consideration of $297 million of cash, 632,584 limited partner units, and an increase in the capital account of WPZ’s general partner to maintain the 2 percent general partner interest. Williams Partners now holds a 49 percent interest in Gulfstream. Prior period segment disclosures have not been adjusted for this transaction as the impact, which was less than 2.5 percent of Williams Partners’ segment profit for all periods affected, was not material.
Overland Pass Pipeline
We became the operator of OPPL effective April 1, 2011. We own a 50 percent interest in OPPL which includes a 760-mile NGL pipeline from Opal, Wyoming, to the Mid-Continent NGL market center in Conway, Kansas, along with 150- and 125-mile extensions into the Piceance and Denver-Julesburg basins in Colorado, respectively. Our equity NGL volumes from our two Wyoming plants and our Willow Creek plant in Colorado are dedicated for transport on OPPL under a long-term shipping agreement. We plan to participate in the construction of a pipeline connection and capacity expansions, expected to be complete in early 2013, to increase the pipeline’s capacity to the maximum of 255 Mbbls/d, to accommodate new volumes coming from the Bakken Shale in the Williston basin.
55
Laurel Mountain
The initial phases of the Shamrock compressor station are in service, providing 60 MMcf/d of additional capacity, with further expansions planned in 2012. This compressor station is expandable to 350 MMcf/d and will likely be the largest central delivery point out of the Laurel Mountain system. Our equity investee continues to progress on further additions to the gathering infrastructure.
Volatile commodity prices
Average per-unit NGL margins in 2011 were significantly higher than in 2010, benefiting from a strong demand for NGLs resulting in higher NGL prices and slightly lower natural gas prices along with most other energy commodities, were significantly impacteddriven by the weakening economy and experienced a sharp decline. Although average annualabundant natural gas prices increased from 2007 to 2008, we continued to benefit from favorable gas price differentials in the Rocky Mountain area which contributed to realizedper-unit margins that were generally greater than that of the industry benchmarks for gas processed in the Henry Hub area and for liquids fractionated and sold at Mont Belvieu, Texas.
Our average realized NGLper-unit margin at our processing plants during 2008 was 61 cents per gallon (cpg), compared to 55 cpg in 2007. The increase in our NGLper-unit margin is partially due to a change in the mix of NGL products sold. Due to third-party NGL pipeline capacity restrictions during the third quarter of 2008 and to unfavorable ethane economics in the fourth quarter of 2008, we reduced our recoveries of ethane in those periods.
57
Because we typically realize lowerper-unit margins for ethane versus other NGLs, if we had produced the same mix of ethane and non-ethane NGLs during 2008 as we generally have in prior years, the averageper-unit margin in 2008 would have been lower. NGL margins have exceeded our rolling five-year average for the last seven quarters, in spite of strong NGL margins in 2007 and early 2008 that have significantly increased our rolling five-year average from 26 cpg at the end of the 2007 to 37 cpg at the end of 2008.
NGL margins are defined as NGL revenues less
any applicable BTU replacement cost, plant fuel,
and third-party transportation and fractionation.
Per-unit NGL margins are calculated based on sales of our own equity volumes at the processing plants. Our
domestic gathering and processing plants recognize NGL margins on our NGL equity volumes
based upon market-based transfer pricesinclude NGLs where we own the rights to
the value from NGLs recovered at our
NGL marketing business. The NGL marketing business transportsplants under both “keep-whole” processing agreements, where we have the obligation to replace the lost heating value with natural gas, and
markets those equity volumes, and also markets NGLs on behalf“percent-of-liquids” agreements whereby we receive a portion of
third-party NGL producers, including somethe extracted liquids with no obligation to replace the lost heating value.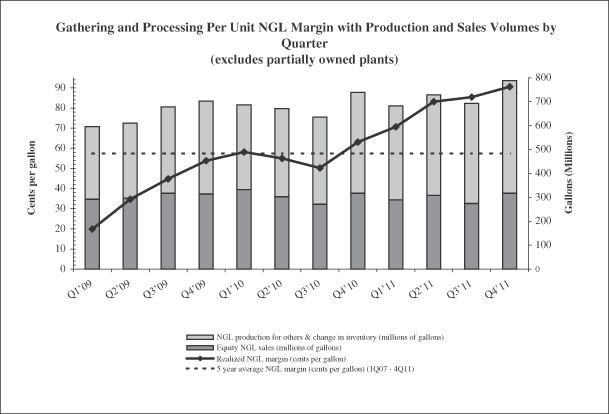
85 North project
In September 2009, we received approval from the FERC to construct an expansion of our fee-based processing customers, and the NGL volumes produced by Discovery Producer Services L.L.C. The NGL marketing business bears the risk of price changes in these NGL volumes while they are being transportedexisting natural gas transmission system from Alabama to final salesvarious delivery points as wellfar north as the impactNorth Carolina. Phase I was placed into service in July 2010 and it provides 90 thousand dekatherms per day (Mdth/d) of lowerincremental firm capacity. Phase II was placed into service in May 2011 and it provides 219 Mdth/d of cost or market write-downs on ending inventory balances.
incremental firm capacity.56
NGL marketing margins impacted by sharp decline in pricesMobile Bay South II project
In late 2007, the NGL marketing business sold the majority of our equity volumes in the West region to a third-party directlyJuly 2010, we received approval from the plants, which reduced our average inventory levelsFERC to construct additional compression facilities and modifications to existing Mobile Bay line facilities in the latter part of 2007. In early 2008, our NGL marketing business beganAlabama allowing transportation service to transport these volumes on a third-party pipeline for sale at downstream markets, which increased our inventory levels. Inventory volumes also increased during 2008 due to the previously discussed hurricane-related suspension of operations at a third-party fractionation facility at Mont Belvieu, Texas.
During 2006 and 2007, NGL price changes did not significantly affect in-transit inventory values. However in 2008 due to significantly and rapidly declining NGL prices, primarily during the fourth quarter, combined with higher average inventory levels, our NGL marketing business experienced a marketing loss of $78 million.
NGL sales volume constrained
Primarily during the third quarter of 2008, we experienced restrictions on the volume of NGLs we could deliver to third-party pipelines in our West region. These restrictions were caused by a lack of third-party NGL pipeline transportation capacity which resulted in us reducing our recovery of ethane to accommodate these restrictions. In the fourth quarter of 2008, these restrictions were alleviated as we were able to deliver NGL volumes from our Wyoming plantsvarious southbound delivery points. The project was placed into the new Overland Pass NGL pipeline.
Due to unfavorable ethane economics during the fourth quarter of 2008, we elected to temporarily suspend ethane recoveries at certain plants which further reduced our NGL sales volumes. While reducing the recovery of ethane did benefit our overall average realized NGLper-unit margins as previously described, it negatively impacted our NGL volumes and operating profit.
Hurricanes Gustav and Ike
As a result of Hurricanes Gustav and Ike in September 2008, not only did our Gulf Coast region facilities experience reduced volumes and damage, but our West region was also negatively impacted. We estimate that our segment profit for 2008 was decreased by approximately $60 million to $85 million due to downtime and charges for repairs and property insurance deductibles associated with Hurricanes Gustav and Ike. Other than the Cameron Meadows natural gas processing plant and the Discovery offshore gathering system, our major gathering and processing assets in the Gulf of Mexico returned to full operations by the end of the third quarter. The Cameron Meadows plant sustained significant damage from Hurricane Ike. Operations are suspended while we evaluate the timing and extent of the required repairs. The Discovery offshore system, which we operate and own a 60 percent equity interest in, also sustained hurricane damage and was not accepting offshore gas from producers while repairs were being made. The mainline of the Discovery offshore system was repaired and returned to service in January 2009. In the West region, we had to store NGL inventories due to the hurricane-related suspensionMay 2011 and provides incremental firm capacity of operations at a third-party fractionation facility at Mont Belvieu, Texas. A portion of this inventory was sold in the fourth quarter of 2008, and we expect to sell the remaining excess inventory in 2009. While we expect business interruption insurance to largely mitigate any losses associated with outages beyond 60 days, the timing to resolve these claims
58
is uncertain. We expect the cost of insuring our assets in the Gulf Coast region against weather events to significantly increase in 2009.
Williams Partners L.P.
We own approximately 23.6 percent of Williams Partners L.P., including the interests of the general partner, which is wholly owned by us, and incentive distribution rights. We consolidate Williams Partners L.P. within the Midstream segment due to our control through the general partner. (See Note 1 of Notes to Consolidated Financial Statements.) Midstream’s segment profit includes 100 percent of Williams Partners L.P.’s segment profit, with the minority interest’s share presented below segment profit.
Outlook for 20092012
The following factors could impact our business in 2009.
2012.Commodity price changes
We expect our average per-unit NGL margins in 2012 to be comparable to 2011 and higher than our rolling five-year average per-unit NGL margins. NGL price changes have historically tracked somewhat with changes in the price of crude oil, although NGL, crude and natural gas prices are highly volatile, difficult to predict, and are often not highly correlated. NGL margins are highly dependent upon continued demand within the global economy. However, NGL products are currently the preferred feedstock for ethylene and propylene production, which has been shifting away from the more expensive crude-based feedstocks. Bolstered by abundant long-term domestic natural gas supplies, we expect to benefit from these dynamics in the broader global petrochemical markets.
As part of our efforts to manage commodity price risks on an enterprise basis, we continue to evaluate our commodity hedging strategies. To reduce the exposure to changes in market prices in 2012, we have entered into NGL swap agreements to fix the prices of approximately 5 percent of our anticipated NGL sales volumes and an approximate corresponding portion of anticipated shrink gas requirements for 2012. The combined impact of these energy commodity derivatives will provide a margin on the hedged volumes of $106 million. The following table presents our energy commodity hedging instruments as of February 15, 2012.
| | | | | | | | | | | | |
| | | Period | | | Volumes
Hedged | | | Weighted
Average Hedge
Price | |
| | | |
| | | |
| | | |
| | | | | | | | | (per gallon) | |
Designated as hedging instruments: | | | | | | | | | | | | |
NGL sales - isobutane (million gallons) | | | Feb - Dec 2012 | | | | 12.8 | | | $ | 1.89 | |
NGL sales - normal butane (million gallons) | | | Feb - Dec 2012 | | | | 19.3 | | | $ | 1.79 | |
NGL sales - natural gasoline (million gallons) | | | Feb - Dec 2012 | | | | 29.0 | | | $ | 2.27 | |
| | | | | | | | | (per MMbtu) | |
Natural gas purchases (Tbtu) | | | Feb - Dec 2012 | | | | 6.5 | | | $ | 2.76 | |
Gathering, processing, and NGL sales volumes
| | |
| • | Margins in our NGL and olefins business are highly dependent upon continued demand within the global economy. NGL products are currently the preferred feedstock for ethylene and propylene olefin production, which are the building blocks of polyethylene or plastics. Forecasted domestic and global demand for polyethylene has weakened with the recent instability in the global economy. A continued slow down in domestic and global economies could further reduce the demand for the petrochemical products we produce in both Canada and the United States. |
|
| • | As evidenced by recent events, NGL, crude and natural gas prices are highly volatile. NGL price changes have historically tracked with changes in the price of crude oil; however ethane prices have recently disassociated from crude prices. As NGL prices, especially ethane, decline, we expect lowerper-unit NGL margins in 2009 compared to 2008. Additionally, we anticipate periods when it is not economical to recover ethane, which will further reduce our segment profit. |
|
| • | Although natural gas prices declined significantly during the fourth-quarter of 2008, which reduced our costs associated with the production of NGLs, NGL margins were compressed as NGL prices fell more than natural gas prices. However, we expect continued favorable gas price differentials in the Rocky Mountain area to partially mitigate suchper-unit margin declines. |
|
| • | In our olefin production business, we continue to maintain a cost advantage as our propylene and ethylene olefin production processes use NGL-based feedstocks, which are less expensive than other olefin production processes that use alternative crude-based feedstocks. However, margins have narrowed and we anticipate results from our olefins production business for the 2009 year to be below 2008 levels. |
|
| • | Fee-based revenues generally reduce our exposure to commodity price risks, but may also reduce our profitability compared to keep-whole arrangements in high margin environments. Certain of our gas processing contracts contain provisions that allow customers to periodically elect processing services on either a fee-basis or a keep-whole or percent-of-liquids basis. If customers switch from keep-whole to fee-based processing, we expect a reduction in our NGL equity sales volumes in 2009 compared to 2008. |
GatheringThe growth of natural gas supplies supporting our gathering and processing volumes
are impacted by producer drilling activities, which are influenced by natural gas prices. | | |
| • | Natural gas supplies supporting our gathering and processing volumes are dependent upon producer drilling activities. The current credit crisis and economic downturn, together with the low commodity price environment, are expected to reduce certain producer drilling activities. Although our customers in the West region are generally large producers and we anticipate they will continue with some level of drilling plans, certain reductions are expected in 2009. A significant decline in drilling activity would likely reduce our gathered volumes and volumes available for both fee-based and keep-whole processing. |
|
| • | We expect higher fee revenues, depreciation and operating expenses in our Gulf Coast region as our Devils Tower infrastructure expansions serving the Blind Faith and Bass Lite prospects move into a full |
59In Williams Partners’ onshore midstream businesses, we anticipate significant growth in our gas gathering volumes as our infrastructure grows to support drilling activities in northeast Pennsylvania. We anticipate slight increases in gas gathering volumes in the Piceance basin and no change or slight declines in basins in the Rocky Mountain and Four Corners areas due to reduced drilling activity. We anticipate equity NGL volumes in 2012 to be comparable to 2011, as we expect little change in the volume of gas processed in the western onshore businesses. Sustained low gas prices could discourage producer drilling activities in our onshore areas and unfavorably impact the supply of natural gas available to gather and process in the long term.
57
| | |
| | year of operation in 2009. While we expect to continue to connect new suppliesIn Williams Partners’ gulf coast businesses, we expect higher gas gathering, processing, and crude transportation volumes as production flowing through our Perdido Norte pipelines becomes consistent and other in-process drilling is completed. Increases in permitting, subsequent to the 2010 drilling moratorium, give us reason to expect gradual increased drilling activities in the deepwater, this increase is expected to be partially offset by lower volumes in other Gulf Coast areas due to natural declines. |
Allocation of Mexico. In the Gulf Coast, our customers’ drilling activities are primarily focused on crude oil economics, rather than natural gas. We have not experienced, and do not anticipate an overall significant decline in volumes due to reduced drilling activities.
The operator of the third-party fractionator serving our NGL production transported on Overland Pass Pipeline has notified us of an expected 20- to 25-day outage in the second quarter of 2012 to accommodate their expansion efforts. The outage could result in a reduction to our equity volumes of up to approximately 20 million to 25 million gallons, along with price impacts; however we are evaluating methods to mitigate the impact.
We anticipate higher general and administrative, operating, and depreciation expense supporting our growing operations in northeast Pennsylvania, Piceance basin, and western Gulf of Mexico.
Expansion Projects
We have planned growth capital and investment expenditures of $2,305 million to $2,535 million in 2012. We plan to pursue expansion and growth opportunities in the Marcellus Shale region, Gulf of Mexico, and Piceance basin. Our ongoing major expansion projects include:
Marcellus Shale & Gulf of Mexico
GivenAs previously discussed, our ongoing major expansions to our gathering infrastructure in the current economic conditions andMarcellus Shale region in northeastern Pennsylvania, including the volatilityacquisition of the commodity price environment,Laser gathering system and related planned additions, expansions within our Laurel Mountain equity investment, also in the Marcellus Shale region, as well as our Gulfstar FPS™ floating production system and Discovery’s Keathley Canyon Connector™ pipeline, both located in the Gulf of Mexico.
Parachute
In conjunction with a new basin-wide agreement for all gathering and processing services provided by us to a customer in the Piceance basin, we will continually prioritizeplan to construct a 350 MMcf/d cryogenic gas processing plant. The Parachute TXP I plant is expected to be in service in 2014.
Mid-South
In August 2011, we received approval from the FERC to upgrade compressor facilities and balanceexpand our capital expenditures againstexisting natural gas transmission system from Alabama to markets as far north as North Carolina. The cost of the demand forproject is estimated to be $217 million. The project is expected to be phased into service in September 2012 and June 2013, with an expected increase in capacity of 225 Mdth/d.
Mid-Atlantic Connector
In July 2011, we received approval from the FERC to expand our services.
existing natural gas transmission system from North Carolina to markets as far downstream as Maryland. The cost of the project is estimated to be $55 million and is expected to increase capacity by 142 Mdth/d. We plan to place the project into service in November 2012.Northeast Supply Link
In December 2011, we filed an application with the FERC to expand our existing natural gas transmission system from the Marcellus Shale production region on the Leidy Line to various delivery
58
points in New York and New Jersey. The cost of the project is estimated to be $341 million and is expected to increase capacity by 250 Mdth/d. We plan to place the project into service in November 2013.
Completed expansion projectsEminence Storage Field Leak
| | |
| • | In the eastern deepwater of the Gulf of Mexico, we completed construction of37-mile extensions of both of our oil and gas pipelines from our Devils Tower spar to the Blind Faith prospect located in Mississippi Canyon. The pipelines have been commissioned and production began flowing in the fourth quarter of 2008. |
Ongoing commitments
| | |
| • | In the western deepwater of the Gulf of Mexico, we expect to spend $205 million on our major expansion projects in 2009, including the Perdido Norte project, which will include an expansion of our Markham gas processing facility and oil and gas lines that will expand the scale of our existing infrastructure. We expect this project to begin contributing to our segment profit at the end of 2009. |
|
| • | In the West Region, we expect to spend $260 million on our major expansion projects in 2009, including the Willow Creek facility and additional capacity at our Echo Springs facility. |
Other factors for consideration
| | |
| • | The current economic and commodity price environment may cause financial difficulties for certain of our customers. Many of our marketing counterparties are in the petrochemicals industry, which has been under severe stress from the current economic downturn. Although we actively manage our credit exposure through certain collateral or payment terms and arrangements, continued economic downturn may result in significant credit or bad debt losses. |
|
| • | We expect significant savings in certain NGL transportation costs in the West region due to the transition from our previous shipping arrangement to transportation on the Overland Pass pipeline. NGL volumes from our Wyoming plants began to flow into the Overland Pass pipeline in the fourth quarter of 2008, relieving pipeline capacity constraints and resulting in an expected increase in NGL volumes for 2009. |
|
| • | Our Venezuelan operations are operated for the exclusive benefit of the Venezuelan state-owned oil company, Petróleos de Venezuela S.A. (PDVSA). As energy commodity prices have sharply declined, PDVSA has failed to make regular payments to many service providers, including us. At December 31, 2008, we had a net receivable of $57 million from PDVSA, none of which was 60 days old or older at that date. This does not include $15 million owed to our 49 percent equity investee, Accroven, of which $5 million was 60 days old or older at December 31, 2008. We continue to monitor the situation and are actively seeking resolution with PDVSA. The collection of receivables from PDVSA has historically been slower and more time consuming than our other customers due to their policies and the political unrest in Venezuela. We expect, at this time, that the amounts will ultimately be paid. The failure of PDVSA to make payments to service providers, however, could jeopardize the Venezuelan oil industry and thereby unfavorably impact all service providers, including us. |
On December 28, 2010, we detected a leak in one of the seven underground natural gas storage caverns at our Eminence Storage Field in Mississippi. Due to the leak and related damage to the well at an adjacent cavern, both caverns are out of service. In addition, two other caverns at the economic situation resulting from lower commodity prices may further exacerbate political tensionfield, which were constructed at or about the same time as those caverns, have experienced operating problems, and we have determined that they should also be retired. The event has not affected the performance of our obligations under our service agreements with our customers.
In September 2011, we filed an application with the FERC seeking authorization to abandon these four caverns. We estimate the total abandonment costs, which will be capital in Venezuela. The Venezuelan government continues its public criticismnature, will be approximately $76 million which is expected to be spent through the first half of U.S. economic2013. Through December 31, 2011, we have incurred approximately $38 million in abandonment costs. This estimate is subject to change as work progresses and political policy, has implemented unilateral changesadditional information becomes known. Management considers these costs to existing energy related contracts, and has expropriated privately held assets within the energy and telecommunications sector. The continued threat of nationalization of certain energy-related assets in Venezuela could have a material negative impact on our results of operations. We may not receive adequate compensation for our interest in these assets, or any compensation, if our assets in Venezuela are nationalized. We own 70 percent and
60
66.67 percent controlling interestsbe prudent costs incurred in the
two subsidiaries that holdabandonment of these
assets. Seecaverns and expects to recover these costs, net of insurance proceeds, in future rate filings. To the extent available, the abandonment costs will be funded from the ARO Trust. (See Note
1114 of Notes to Consolidated Financial
Statements for a discussionStatements.)For the year ended December 31, 2011, we incurred approximately $15 million of expense related primarily to assessment and monitoring costs to ensure the safety of the non-recourse debt relatedsurrounding area.
Filing of rate cases
During 2012, we expect to these assets.
file rate cases for both Transco and Northwest Pipeline, which are expected to result in new transportation and storage rates beginning in 2013.Year-Over-Year Operating Results
| | | | | | | | | | | | | |
| | | Years Ended December 31, | |
| | | 2008 | | | 2007 | | | 2006 | |
| | | (Millions) | |
| |
| Segment revenues | | $ | 5,642 | | | $ | 5,180 | | | $ | 4,159 | |
| | | | | | | | | | | | | |
| Segment profit (loss) | | | | | | | | | | | | |
Domestic gathering & processing | | | 841 | | | | 897 | | | | 631 | |
Venezuela | | | 104 | | | | 89 | | | | 98 | |
NGL Marketing, Olefins and Other | | | 113 | | | | 174 | | | | 16 | |
Indirect general and administrative expense | | | (95 | ) | | | (88 | ) | | | (70 | ) |
| | | | | | | | | | | | | |
| Total | | $ | 963 | | | $ | 1,072 | | | $ | 675 | |
| | | | | | | | | | | | | |
In order to provide additional clarity, our management’s discussion and analysis of operating results separately reflects the portion of general and administrative expense not allocated to an asset group as | | | | | | | | | | | | |
| | | Year ended December 31, | |
| | | 2011 | | | 2010 | | | 2009 | |
| | | (Millions) | |
Segment revenues | | $ | 6,729 | | | $ | 5,715 | | | $ | 4,602 | |
| | | | | | | | | | | | |
Segment profit | | $ | 1,896 | | | $ | 1,574 | | | $ | 1,317 | |
| | | | | | | | | | | | |
indirect general and administrative expense. These charges represent any overhead cost not directly attributable to one of the specific asset groups noted in this discussion.
20082011 vs. 20072010
The increase insegment revenuesis largelyincludes:
A $589 million increase in marketing revenues primarily due to:to higher average NGL and crude prices. These changes are substantially offset by similar changes in marketing purchases.
A $244 million increase in revenues from our equity NGLs reflecting an increase of $272 million associated with a 25 percent increase in average NGL per-unit sales prices, partially offset by a decrease of $28 million associated with a 3 percent decrease in equity NGL volumes.
A $103 million increase in fee revenues primarily due to higher gathering and processing fee revenues. We have fees from new volumes on our gathering assets in the Marcellus Shale in northeastern Pennsylvania, which we acquired at the end of 2010, and on our Perdido Norte gas and oil pipelines in the western deepwater Gulf of Mexico, which went into service in late 2010. In addition, higher fees in the Piceance basin are primarily a result of an agreement executed in November 2010. These increases
59
| | |
| | • | A $210 million increase in revenues in our olefins production business due primarily to higher average product prices and also to higher volumes sold associated with the increase of our ownership interest in the Geismar olefins facility effective July 2007. |
|
| • | A $163 million increase in revenues associated with the production of NGLs due primarily to higher average NGL prices, partially offset by lower volumes. Lower volumes resulted from reduced ethane recoveries at the plants during the third and fourth quarters of 2008 compared to higher volumes during 2007 as we transitioned from shipping volumes through a pipeline for sale downstream to product sales at the plant. |
|
| • | A $69 million increase in fee-based revenues due primarily to the West region, Venezuela, the deepwater Gulf Coast region and at our Conway fractionation and storage facilities. |
Segment costs and expensesincreased $569 million, or 14 percent, primarily as a result of:
| | |
| • | A $213 million increase in costs in our olefins production business due to higher feedstock prices and also to higher volumes produced associated with the increase of our ownership interest in the Geismar olefins facility effective July 2007. The increase also includes a $10 million higher charge to write down the value of olefin inventories. |
|
| • | A $191 million increase in costs associated with the production of NGLs due primarily to higher average natural gas prices. |
|
| • | A $126 million increase in NGL, olefin and crude marketing purchases due primarily to higher average NGL and crude prices, partially offset by lower volumes as discussed in the revenue section above. The increase also includes a $19 million higher charge in 2008 to write down the value of NGL and olefin inventories. |
|
| • | A $107 million increase in operating costs including higher depreciation, repair costs and property insurance deductibles related to the hurricanes, gas transportation expenses in the eastern Gulf of Mexico, employee costs, and higher costs associated with the increase of our ownership interest in the Geismar olefins facility. |
61
These increases are partially offset by:
| | |
| • | A $44 million favorable change related to foreign currency exchange gains primarily due to the revaluation of current assets held in U.S. dollars within our Canadian operations. |
|
| • | $32 million of income related to the partial settlement of our Gulf Liquids litigation (see Note 16 of Notes to Consolidated Financial Statements). |
|
| • | A $16 million favorable change due to higher involuntary conversion gains in 2008 related to insurance recoveries in excess of the carrying value of our Ignacio and Cameron Meadows plants. |
The decrease in Midstream’ssegment profitreflects the previously described changes insegment revenuesandsegment costs and expenses. A more detailed analysis of the segment profit of certain Midstream operations is presented as follows.
Domestic gathering & processing
The decrease indomestic gathering & processing segment profitincludes a $49 million decrease in the West region and a $7 million decrease in the Gulf Coast region.
The decrease in our West region’ssegment profitincludes:
| | |
| • | A $45 million decrease in NGL margins due to a significant increase in costs associated with the production of NGLs reflecting higher natural gas prices and lower volumes sold. The decrease in volumes sold is due primarily to restricted transportation capacity, unfavorable ethane economics, an increase in inventory during 2008, hurricane-related disruptions at a third-party fractionation facility, and lower equity volumes as processing agreements change from keep-whole to fee-based. These decreases were partially offset by a full year of production from the fifth train at our Opal processing plant, which began productiondecline in gathering and transportation fees in the first quartereastern deepwater Gulf of 2007. |
|
| • | A $35 million increase in operating costs driven by higher turbine and engine overhaul expenses, depreciation expense and employee costs. |
|
| • | The absence of a $12 million favorable litigation outcome in 2007. |
|
| • | A $24 million increase in fee revenues including new lease revenues from Gas Pipeline for the Parachute lateral transferredMexico primarily due to Midstream in December 2007. |
|
| • | A $12 million involuntary conversion gain related to our Ignacio plant. These insurance recoveries were used to rebuild the plant.natural field declines. |
A $68 million increase in transportation revenues associated with natural gas pipeline expansion projects placed in service during 2010 and 2011.
The decreaseincrease in the Gulf Coast region’sssegment profitegment costs and expensesisof $725 million includes:
A $574 million increase in marketing purchases primarily due to $39higher average NGL and crude prices. These changes are offset by similar changes in marketing revenues.
A $136 million increase in operating costs reflecting $84 million higher operating costsmaintenance expenses, including higher depreciation, gas transportationmaintenance expenses for our gathering assets in northeastern Pennsylvania acquired at the end of 2010, more maintenance performed on our assets in the western onshore businesses, additional maintenance related to the Eminence storage leak, and hurricane repair andhigher property insurance deductibles. These increases are partially offset by $18expense. In addition, depreciation expense is $43 million higher NGL margins and $8 million higher fee revenues due primarily to connecting new supplies in the deepwater.
Venezuela
Segment profitfor our Venezuela assets increased due to higher fee revenuesour new Perdido Norte pipelines and lower bad debt expense, partially offset by lower currency exchange gains.our Echo Springs expansion, both of which went into service in late 2010, along with accelerated depreciation of our Lybrook plant which was idled in January 2012 when the gas was redirected to our Ignacio plant.
NGL marketing, olefinsThe absence of $30 million in gains recognized in 2010 associated with sale of certain assets in Colorado’s Piceance basin and other
The significant componentsinvoluntary conversion gains due to insurance recoveries in excess of the carrying value.
A $42 million decrease in costs associated with our equity NGLs reflecting a decrease of $21 million associated with a 5 percent decrease in average natural gas prices and a $21 million decrease reflecting lower equity NGL volumes.
The increase in William Partners’segment profitincludes:
$286 million of our other operations include:
| | |
| • | $123 million in lower margins related to the marketing of NGLs and olefins due primarily to the impact of a significant and rapid decline in NGL and olefin prices during the fourth quarter of 2008 on a higher volume of product inventory in transit. This also includes a $19 million charge to write down the value of NGL and olefin inventories. |
62higher NGL production margins reflecting favorable commodity price changes.
A $103 million increase in fee revenues as previously discussed.
A $68 million increase in transportation revenues associated with natural gas pipeline expansion projects placed in service during 2010 and 2011.
A $15 million increase in margins related to the marketing of NGLs and crude.
A $33 million increase in equity earnings primarily due to the acquisition of additional interest in Gulfstream and an increased ownership interest in OPPL.
A $136 million increase in operating costs as previously discussed.
A $30 million unfavorable change related to gains recognized in 2010 as previously discussed.
2010 vs. 2009
| | |
| • | $33 million higher operating costs including higher costs associated with the increase of our ownership interest in the Geismar olefins facility effective July 2007 and hurricane damage repair expense at the Geismar plant. |
These increases are partially offset by:
| | |
| • | A $56 million favorable change in foreign currency exchange gains related to the revaluation of current assets held in U.S. dollars within our Canadian operations. |
|
| • | $32 million of income related to the partial settlement of our Gulf Liquids litigation (see Note 16 of Notes to Consolidated Financial Statements). |
2007 vs. 2006
The increase in
segment revenuesis largelyincludes:A $699 million increase in marketing revenues primarily due to:
| | |
| • | A $528 million increase in revenues from the marketing of NGLs and olefins. |
|
| • | A $303 million increase in revenues from our olefins production business. |
|
| • | A $244 million increase in revenues associated with the production of NGLs. |
to higher average NGL and crude prices. These changes are more than offset by similar changes in marketing purchases.
A $330 million increase in revenues associated with the production of NGLs reflecting an increase of $335 million associated with a 41 percent increase in average NGL per-unit sales prices.
A $56 million increase in fee revenues primarily due to higher gathering revenue in the Piceance basin as a result of permitted increases in the cost-of-service gathering rate in 2010.
The increase in segment costs and expensesof $884 million includes:
A $721 million increase in marketing purchases primarily due to higher average NGL and crude prices. These changes are substantially offset by similar changes in marketing revenues.
60
A $107 million increase in costs associated with the production of NGLs reflecting an increase of $101 million associated with a 30 percent increase in average natural gas prices.
A $19 million increase in operating costs including $12 million higher depreciation primarily due to the new Perdido Norte pipelines and a full year of depreciation on our Willow Creek facility which was placed into service in the latter part of 2009.
The absence of a $40 million gain on the sale of our Cameron Meadows processing plant in 2009, partially offset by smaller gains in 2010. Gains recognized in 2010 include involuntary conversion gains due to insurance recoveries in excess of the carrying value of our gulf assets which were damaged by Hurricane Ike in 2008 and our Ignacio plant, which was damaged by a $35fire in 2007, as well as gains associated with sales of certain assets in Colorado’s Piceance basin.
The increase in William Partners’segment profitincludes:
$223 million of higher NGL production margins reflecting higher NGL prices, partially offset by increased production costs associated with higher natural gas prices. NGL equity volumes were slightly higher due primarily to new production at Willow Creek, partially offset by the absence of favorable customer contractual changes and decreasing inventory levels in 2009.
$28 million increase in equity earnings, including a $10 million increase from Discovery primarily due to higher processing margins and new volumes from the Tahiti pipeline lateral expansion completed in 2009. In addition, equity earnings from Aux Sable are $10 million higher primarily due to higher processing margins, and equity earnings from our increased investment in OPPL were $5 million.
A $56 million increase in fee revenues as previously discussed.
A $22 million decrease in fee revenues.margins related to the marketing of NGLs and crude primarily due to lower favorable changes in pricing while product was in transit in 2010 as compared to 2009.
A $19 million increase in operating costs as previously discussed.
A $14 million unfavorable change related to the disposal of assets as previously discussed.
Midstream Canada & Olefins
Our Midstream Canada & Olefins segment includes our oil sands off-gas processing plant near Fort McMurray, Alberta, our NGL/olefin fractionation facility and butylene/butane (B/B) splitter facility at Redwater, Alberta, our NGL light-feed olefins cracker in Geismar, Louisiana along with associated ethane and propane pipelines, and our refinery grade propylene splitter in Louisiana. The products we produce are: NGLs, ethylene, propylene, and other co-products. Our NGL products include: propane, normal butane, isobutane/butylene (butylene), and condensate. Prior to the operation of the B/B splitter, we also produced and sold B/B mix product which is now separated and sold as butylene and normal butane.
Significant events for 2011
We signed a long-term agreement to initially produce 10,000 barrels per day (bbls/d) of ethane/ethylene mix for a third-party customer. We expect that we will ultimately increase our production of ethane/ethylene mix to 17,000 bbls/d and we expect to complete our expansions necessary to produce the initial barrels in the first quarter of 2013.
Outlook for 2012
The following factors could impact our business in 2012.
Commodity margin changes
While per-unit margins are volatile and highly dependent upon continued demand within the global economy, we believe that our gross commodity margins will be comparable or increase slightly over 2011 levels. NGL products are currently the preferred feedstock for ethylene and propylene production which has been
61
shifting away from the more expensive crude-based feedstocks. Bolstered by abundant long-term domestic natural gas supplies, we expect to benefit from these dynamics in the broader global petrochemical markets because of our NGL-based olefins production.
Allocation of capital to projects
We expect to spend $600 million to $700 million in 2012 on capital projects. The major expansion projects include:
The Boreal Pipeline project, which is a 12-inch diameter pipeline in Canada that will transport recovered NGLs and olefins from our extraction plant in Fort McMurray to our Redwater fractionation facility. The pipeline will have sufficient capacity to transport additional recovered liquids in excess of those from our current agreements. Construction is well underway and we anticipate an in-service date in the second quarter of 2012.
An expansion of our Geismar olefins production facility which is expected to increase the facility’s ethylene production capacity by 600 million pounds per year to a new annual capacity of 1.95 billion pounds. We are currently in the detailed engineering and procurement phase and expect to complete the expansion in the latter part of 2013.
The ethane recovery project, which is an expansion of our Canadian facilities that will allow us to recover ethane/ethylene mix from our operations that process off-gas from the Alberta oil sands. We plan to modify our oil sands off-gas extraction plant near Fort McMurray, Alberta, and construct a de-ethanizer at our Redwater fractionation facility. Our de-ethanizer is expected to initially process approximately 10,000 bbls/d of ethane/ethylene mix. As previously mentioned, we have signed a long-term contract to provide the ethane/ethylene mix to a third-party customer. Construction began in the fourth quarter of 2011 and we expect to complete the expansions and begin producing ethane/ethylene mix in the first quarter of 2013.
Year-Over-Year Operating Results
| | | | | | | | | | | | |
| | | Year ended December 31, | |
| | | 2011 | | | 2010 | | | 2009 | |
| | | (Millions) | |
Segment revenues | | $ | 1,312 | | | $ | 1,033 | | | $ | 753 | |
| | | | | | | | | | | | |
Segment profit | | $ | 296 | | | $ | 172 | | | $ | 37 | |
| | | | | | | | | | | | |
2011 vs. 2010
Segment revenuesincreased primarily due to:
$126 million higher ethylene production sales revenues due to 28 percent higher average per-unit sales prices on 6 percent higher volumes primarily resulting from the absence of a four-week plant maintenance outage in 2010.
$79 million higher NGL production revenues primarily resulting from:
Higher average per-unit sales prices driven by a change in our Canadian product mix. Through mid-2010, we sold B/B mix product, but in August 2010, we began producing and selling both butylene and normal butane that was produced by our new B/B splitter. The separated products receive higher values in the marketplace than the B/B mix sold previously.
Higher NGL sales prices resulting from higher market prices.
29 percent increased sales volumes on our Canadian butylene and normal butane products primarily due to lower volume impact of operational and maintenance issues in 2011 as compared to 2010.
62
$37 million higher propylene production revenues due to $68 million higher revenues from 26 percent higher average per-unit sales prices, partially offset by $31 million lower revenues resulting from 10 percent lower overall propylene production sales volumes. The lower sales volumes were primarily due to the net impact of the following:
18 percent lower volumes at our Louisiana refinery grade propylene splitter primarily due to marketing and supply and third-party storage constraints, and customer outages. The impact of the lower propylene splitter sales was substantially offset by similar changes in related costs.
10 percent higher propylene sales volumes at our Canadian facility primarily due to lower volume impact of operational and maintenance issues in 2011 as compared to 2010.
$30 million higher butadiene and debutanized aromatic concentrate (DAC) production sales revenues primarily due to higher average per-unit sales prices.
Segment costs and expensesincreased $645$155 million or 18 percent, primarily as a result of:
$93 million higher ethylene feedstock costs resulting from higher average per-unit feedstock costs and 6 percent higher volumes.
$17 million higher operating and maintenance expenses primarily resulting from higher repairs and maintenance at our Canadian facilities and Geismar plant.
| | |
| • | A $491 million increase in NGL and olefin marketing purchases. |
|
| • | A $257 million increase in costs from our olefins production business. |
|
| • | A $37 million increase in operating expenses including higher depreciation, maintenance, gathering fuel expenses and operating taxes. |
|
| • | $24 million higher general and administrative expenses. |
|
| • | A $10 million loss on impairment of the Carbonate Trend pipeline and an $8 million loss on impairment of other assets. |
|
| • | The absence of $11 million of net gains on the sales of assets in 2006. |
These increases are partially offset by:
| | |
| • | The absence of a 2006 charge of $73 million related to our Gulf Liquids litigation (see Note 15 of Notes to Consolidated Financial Statements). |
|
| • | A $95 million decrease in costs associated with the production of NGLs due primarily to lower natural gas prices. |
|
| • | $12 million income in 2007 from a favorable litigation outcome. |
The increase in Midstream’ssegment profitreflects $339$14 million higher NGL feedstock costs primarily due to higher average per-unit feedstock costs on certain products and increased volumes on our Canadian butylene and normal butane products primarily due to reduced maintenance and operational issues.
$14 million higher propylene feedstock costs resulting from $36 million higher costs from 19 percent higher average per-unit feedstock costs, partially offset by $22 million lower costs related to reduced propylene feedstock volumes primarily from the lower volumes at our Louisiana refinery grade splitter described above.
$11 million higher butadiene and DAC feedstock costs primarily due to higher per-unit feedstock costs.
$6 million higher general and administrative costs.
The absence of a $6 million favorable customer settlement in 2010.
These increases were partially offset by $19 million of 2011 income related to the reduction of our accrual for the Gulf Liquids litigation. (See Note 16 of Notes to Consolidated Financial Statements.)
Segment profitincreased primarily due to:
$42 million higher Canadian NGL production margins on the butylene and normal butane products primarily resulting from higher average per-unit margins primarily driven by a change in product mix, higher NGL sales prices, and higher volumes.
$33 million higher Geismar ethylene production margins due to 27 percent higher per-unit margins on 6 percent higher volumes.
$24 million higher Canadian propylene production margins resulting from 37 percent higher per-unit margins and 10 percent higher volumes.
$23 million higher Canadian propane production margins due to 37 percent higher per-unit margins and 5 percent higher volumes.
$19 million higher Geismar butadiene and DAC production margins primarily resulting from higher average per-unit margins.
$19 million of 2011 income related to the reduction of our accrual for the Gulf Liquids litigation. (See Note 16 of Notes to Consolidated Financial Statements.)
63
These increases were partially offset by $17 million higher operating and maintenance expenses, $6 million higher general and administrative costs and the absence of a $6 million favorable customer settlement in 2010.
2010 vs. 2009
Segment revenues increased primarily due to:
$307 million higher NGL and olefins production revenues resulting from higher average per-unit prices. The new B/B splitter began producing and selling both butylene and normal butane in August 2010 and resulted in $22 million additional sales revenues over the previously mentioned $732009 B/B mix product sold. The separated products receive higher values in the marketplace than the B/B mix sold previously.
$27 million Gulf Liquids litigation chargehigher marketing revenues due to general increases in 2006, as well as the other previously describedenergy commodity prices on slightly higher volumes. The higher marketing revenues were more than offset by similar changes insegment revenuesandsegment costs and expenses. A more detailed analysis of marketing purchases described below.
Partially offsetting the segment profit of Midstream’s various operations is presented as follows.
Domestic gathering & processing
The increase indomestic gathering and processing segment profitincludesincreased revenue was a
$308 million increase in the West region, partially offset by a $42$57 million decrease
infrom lower sales volumes primarily due to:11 percent lower Geismar ethylene sales volumes, including the Gulf Coast region.impact of a four-week plant maintenance outage at our Geismar plant during the fourth quarter of 2010.
63
The increase in our West region’ssegment profitprimarily results from higher NGL margins, higher processing fee based revenues and a favorable litigation settlement, partially offset by higher operating expenses and12 percent lower gathering fee revenues. The significant components of this increase include the following:
| | |
| • | NGL margins increased $326 million in 2007 compared to 2006. This increase was driven by an increase in average per unit NGL prices, a decrease in costs associated with the production of NGLs reflecting lower natural gas prices and higher volumes due primarily to new capacity on the fifth cryogenic train at our Opal plant. |
|
| • | Processing fee revenues increased $12 million. Processing volumes are higher due to customers electing to take liquids and pay processing fees. |
|
| • | $12 million income in 2007 from a favorable litigation outcome. |
|
| • | Gathering fee revenues decreased $6 million due primarily to natural volume declines and the shutdown of the Ignacio plant in the fourth quarter of 2007 as a result of the fire. |
|
| • | Operating expenses increased $21 million including $9 million in higher depreciation, $9 million in higher treating plant and gathering fuel due primarily to the expiration of a favorable gas purchase contract, $5 million related to gas imbalance revaluation losses in the current year compared to gains in the prior year, $5 million higher leased compression costs and $4 million higher costs related to the Jicarilla lease arrangement. These were partially offset by the absence of a $7 million accounts payable accrual adjustment in 2006 and $5 million in lower system product losses. |
The decrease in the Gulf Coast region’ssegment profitis primarily a result of lowerpropylene volumes from our deepwater facilities, losses on impairments, and the absence of gains on assets in 2006, partially offset by higher NGL margins and higher other fee revenues. The significant components of this decrease include the following:
| | |
| • | Fee revenues from our deepwater assets decreased $40 million due primarily to declines in producers’ volumes. |
|
| • | A $10 million loss on impairment of the Carbonate Trend pipeline and a $6 million loss on impairment of our other assets. |
|
| • | The absence of $8 million in gains on the sales of certain gathering assets and a processing plant in 2006 and $5 million lower involuntary conversion gains resulting from insurance proceeds used to rebuild the Cameron Meadows plant. |
|
| • | NGL margins increased $14 million driven by higher NGL prices, partially offset by lower NGL recoveries and an increase in costs associated with the production of NGLs. |
|
| • | Other fee revenues increased $8 million driven by higher water removal fees. |
Venezuela
Segment profitfor our Venezuela assets decreasedsold primarily due to the absence of certain large 2009 propylene inventory sales and lower volumes available for processing at our Louisiana refinery grade propylene splitter.
Segment costs and expenses increased $145 million primarily as a $9result of:
$156 million gainhigher NGL and olefins production product costs resulting from the settlement of a contract disputehigher average per-unit feedstock costs.
$29 million increased marketing purchases due to general increases in 2006, $6 million lower fee revenues due primarily to the discontinuanceenergy commodity prices on slightly higher volumes. The increased marketing purchases more than offset similar changes in 2007 of revenue recognition related to labor escalation receivables, $7marketing revenues.
$9 million higher operating expenses, and $8general and administrative costs.
Partially offsetting the increased costs are decreases due to:
$45 million of reduced product costs resulting from the lower sales volumes described above.
$6 million favorable customer settlement in 2010.
Segment profitincreased primarily due to $139 million higher bad debt expense related to labor escalation receivables, partially offset by $19 million ofNGL and olefins production margins resulting from significantly higher currency exchange gains and $1 million higher equity earnings.
NGL marketing, olefins and otheraverage per-unit margins on lower volumes.
The significant components of the increase insegment profitof our other operations include the following:
| | |
| • | The absence of the previously mentioned $73 million Gulf Liquids litigation charge in 2006. |
|
| • | $46 million in higher margins from our olefins production business due primarily to the increase in ownership of the Geismar olefins facility in July 2007 and higher prices of NGL products produced in our Canadian olefins operations. |
64
Other | | |
| • | $18 million in higher margins related to the marketing of olefins and $21 million in higher margins related to the marketing of NGLs due to more favorable changes in pricing while product was in transit during 2007 as compared to 2006. |
|
| • | An $8 million reversal of a maintenance accrual (see below). |
|
| • | $9 million higher Aux Sable equity earnings primarily due to favorable processing margins. |
|
| • | $11 million higher Discovery equity earnings primarily due to higher NGL margins and volumes. |
These increasesOther includes business activities that are partially offset by:
| | |
| • | $19 million in higher foreign exchange losses related to the revaluation of current assets held in U.S. dollars within our Canadian operations. |
|
| • | The absence of a $4 million favorable transportation settlement in 2006. |
Effective January 1, 2007, we adopted FASB Staff Position (FSP) No. AUG AIR-1,Accounting for Planned Major Maintenance Activities.As a result, we recognized as other income an $8 million reversal of an accrual for major maintenance on our Geismar ethane cracker. We did not apply the FSP retrospectively because the impact to our first quarter 2007 and estimated full year 2007 earnings,operating segments as well as the impact to prior periods, is not material. We have adopted the deferral method for accounting for these costs going forward.
corporate operations.Indirect general and administrative expense
The increase in indirect general and administrative expense is due primarily to higher technical support services and other charges for various administrative support functions and higher employee expenses.
Gas Marketing Services
Gas Marketing Services (Gas Marketing) primarily supports our natural gas businesses by providing marketing and risk management services, which include marketing and hedging the gas produced by Exploration & Production, and procuring fuel and shrink gas and hedging natural gas liquids sales for Midstream. Gas Marketing also provides similar services to third parties, such as producers. In addition, Gas Marketing manages various natural gas-related contracts such as transportation, storage, related hedges and proprietary trading positions, including certain legacy natural gas contracts and positions.
Overview of 2008
Gas Marketing’s operating results for 2008 were primarily driven by higher realized margins on both storage and transportation contracts in addition to favorable price movements on derivative positions executed to hedge the anticipated withdrawals of natural gas from storage. These gains were partially offset by adjustments made to the carrying value of the natural gas inventories in storage reflecting a decline in the price of natural gas.
Outlook for 2009
For 2009, Gas Marketing will focus on providing services that support our natural gas businesses. Gas Marketing’s earnings may continue to reflect mark-to-market volatility from commodity-based derivatives that represent economic hedges but are not designated as hedges for accounting purposes or do not qualify for hedge accounting.
65
Year-Over-Year Operating Results
| | | | | | | | | | | | | |
| | | Years Ended December 31, | |
| | | 2008 | | | 2007 | | | 2006 | |
| | | (Millions) | |
| |
| Realized revenues | | $ | 6,385 | | | $ | 4,948 | | | $ | 5,185 | |
| Net forward unrealized mark-to-market gains (losses) | | | 27 | | | | (315 | ) | | | (136 | ) |
| | | | | | | | | | | | | |
| Segment revenues | | $ | 6,412 | | | $ | 4,633 | | | $ | 5,049 | |
| | | | | | | | | | | | | |
| Segment profit (loss) | | $ | 3 | | | $ | (337 | ) | | $ | (195 | ) |
| | | | | | | | | | | | | |
| | | | | | | | | | | | |
| | | Year ended December 31, | |
| | | 2011 | | | 2010 | | | 2009 | |
| | | (Millions) | |
Segment revenues | | $ | 25 | | | $ | 24 | | | $ | 27 | |
| | | | | | | | | | | | |
Segment profit (loss) | | $ | 24 | | | $ | 68 | | | $ | (41 | ) |
| | | | | | | | | | | | |
64
20082011 vs. 20072010
The unfavorable change in segment profit
Realized revenuesrepresent (1) revenue from the sale of natural gas and (2) gains and losses from the net financial settlement of derivative contracts.Realized revenues increased $1,437 million is primarily due to an increase$32 million of decreased gains recognized in physical natural gas revenue as a result of a 26 percent increase in average prices on physical natural gas sales. This is slightly offset by a decrease2011 related to net financial settlementsthe 2010 sale of derivative contracts.
Net forward unrealized mark-to-market gains (losses)primarily represent changesour interest in
Accroven SRL. (See Note 3 of Notes to Consolidated Financial Statements.) We are pursuing collection of these past due amounts from Petróleos de Venezuela S.A. (PDVSA), as well as claims related to the
fair values2009 expropriation of certain
derivative contracts with a future settlement or delivery date thatof our Venezuelan operations, which are
not designatedreported as
hedges for accounting purposes or do not qualify for hedge accounting. discontinued operations.2010 vs. 2009
The favorable change of $342 million includes the effect of a $156 million loss realized in December 2007 related to a legacy derivative natural gas sales contract. We had previously accounted for this contract on an accrual basis under the normal purchases and normal sales exception of SFAS No. 133. We discontinued normal purchase and normal sales treatment because it was no longer probable that the contract would not be net settled. In addition, 2008 reflects favorable price movements on our derivative positions executed to hedge the anticipated withdrawal of natural gas from storage.
Totalssegment costs and expensesegment profitincreased $1,439 million, primarily due to a 33 percent increase in average prices on physical natural gas purchases. These increases were partially offset by the absence of a $20 million accrual for litigation contingencies in 2007.
The $340 million favorable change insegment profit (loss)is primarily due to the favorable changenet impact of recognizing $43 million innet forward unrealized mark-to-market gains (losses), which includes the absence of a 2007 loss recognized on a legacy derivative natural gas sales contract. The favorable change insegment profit (loss)also reflects the absence of a $20 million accrual for litigation contingencies in 2007, partially offset by a decline in accrual earnings.
2007 vs. 2006
Realized revenuesdecreased $237 million primarily due to a decrease in net financial settlements of derivative contracts. This is partially offset by an increase in physical natural gas revenue as a result of a 9 percent increase in natural gas sales volumes partially offset by a 6 percent decrease in average prices on physical natural gas sales.
Net forward unrealized mark-to-market gains (losses)changed unfavorably as a result of a $156 million loss related to a legacy derivative natural gas sales contract that was previously accounted for on an accrual basis under the normal purchases and normal sales exception of SFAS No. 133. In addition, losses on gas purchase contracts caused by a decrease in forward natural gas prices were greater in 2007 than in 2006.
Totalsegment costs and expensesdecreased $274 million, primarily due to a decrease in costs and operating expenses reflecting a 7 percent decrease in average prices on physical natural gas purchases partially offset by a 4 percent increase in natural gas purchase volumes. The net decrease was also partially offset by:
| | |
| • | A $20 million accrual for litigation contingencies in 2007. |
|
| • | The absence of a $25 million gain from the sale of certain receivables to a third party in 2006. |
The $142 million unfavorable change insegment profit (loss)is primarily due to the loss recognized on a legacy derivative contract previously treated as a normal purchase and normal sale, a $20 million accrual for
66
litigation contingencies and the absence of a $25 million gain from the sale of certain receivables, partially offset by an improvement in accrual earnings.
Other
Year-Over-Year Operating Results
| | | | | | | | | | | | | |
| | | Years Ended December 31, | |
| | | 2008 | | | 2007 | | | 2006 | |
| | | (Millions) | |
| |
| Segment revenues | | $ | 24 | | | $ | 26 | | | $ | 27 | |
| | | | | | | | | | | | | |
| Segment loss | | $ | (3 | ) | | $ | (1 | ) | | $ | (13 | ) |
| | | | | | | | | | | | | |
2008 vs. 2007
The results of our Other segment are relatively comparable to the prior year.
2007 vs. 2006
The improvement insegment lossfor 2007 is primarily driven by $5 million of net gains on the sale of land.
Accroven investment in 2010 while recording a $75 million impairment charge on that investment in 2009.Management’s Discussion and Analysis of Financial Condition and Liquidity
In 2008,2011, we continued to focus upon growth through disciplined investments in our natural gas businesses. Examples of this growth included:
Continued investment in Williams Partners’ gathering and processing capacity and infrastructure in the Marcellus Shale area, western United States, and deepwater Gulf of Mexico. Included is a project to design, construct and install a floating production system (Gulfstar FPS™) in the eastern deepwater Gulf of Mexico;
Expansion of Williams Partners’ interstate natural gas pipeline system to meet the demand of growth markets;
| | |
| • | Continued investment in Exploration & Production’s development drilling programs. |
|
| • | Expansion of Gas Pipeline’s interstate natural gas pipeline system to meet the demand of growth markets. |
|
| • | Continued investment in Midstream’s Deepwater Gulf expansion projects and gas processing capacity in the western United States. |
Expansion of Midstream Canada & Olefins’ facilities to increase production of an ethane/ethylene mix.
These investments were primarily funded through our cash flow from operations, which totaled nearly $3.4 billion for 2008.
During the latter part of 2008, global credit markets experienced significant instability, our market capitalization declined as markets witnessed significant reductionsdebt offerings at WPZ and cash on hand.Our former exploration and production business, WPX, continued to invest in value and energy commodity prices experienced significant and rapid declines. While we have periodically provided for incremental funding needsdevelopment drilling programs during 2011 that were largely self-funded through cash flow from operations. In November 2011, WPX completed the issuance of debtand/or$1.5 billion of senior unsecured notes. WPX distributed $981 million of the salenet proceeds to us and retained approximately $500 million to fund future investments. Primarily utilizing the distribution we received related to the WPX debt issuance, we retired $746 million of master limited partnership units, these sourcesdebt in December 2011. We completed the tax-free spin-off of funding were considered economically unfavorable at100 percent of WPX to our shareholders on December 31, 2008.2011.
During 2011, the economy has shown mixed signs of recovery; however, financial markets continue to be volatile as fears of global recession persist. In consideration of our liquidity under these conditions,in this environment, we note the following:
| | |
| • | We have sharply reduced our forecasted levels of capital expenditures and have the flexibility to make further reductions if needed. |
|
| • | As of December 31, 2008, we have approximately $1.4 billionthat, as of December 31, 2011, we have $889 million of cash and cash equivalents and approximately $2.5 billion of available credit capacity under our credit facilities, of which $400 million expires in April 2009 and $100 million expires in May 2009. Our primary $1.5 billion credit facility does not expire until May 2012. Additionally, Exploration & Production has an unsecured credit agreement that serves to reduce our margin requirements related to our hedging activities. See additional discussion in the following Available Liquidity section. |
|
| • | We have no significant debt maturities until 2011. |
|
| • | Our credit exposure to derivative counterparties is partially mitigated by master netting agreements and collateral support. (See Note 15 of Notes to Consolidated Financial Statements.) |
67
Outlook
For 2009, we expect operating results and cash
equivalents and $2.9 billion of available credit capacity under our credit facilities. Our $900 million and WPZ’s $2 billion credit facilities do not expire until June 2016. (See additional discussion in the following Available Liquidity section.)Outlook
Our plan for 2012 includes continued strong operating cash flows to be sharply reduced from 2008 levels by the continued impact of lowerour businesses. Lower-than-expected energy commodity prices. This impact isprices would be somewhat mitigated by certain of our cash flow streams that are substantially insulated from sustained lowershort-term changes in commodity prices as follows:
Firm demand and capacity reservation transportation revenues under long-term contracts from our gas pipelines;
| | |
| • | Firm demand and capacity reservation transportation revenues under long-term contracts from Gas Pipeline; |
|
| • | Hedged natural gas sales at Exploration & Production related to a significant portion of its production; |
|
| • | Fee-based revenues from certain gathering and processing services at Midstream. |
In addition, we expect certain costs forgathering and processing services and materials to decline in 2009 as demand for these resources declines.our midstream businesses.
Although the financial markets and energy commodity environment are expected to be depressed for at least the near term, weWe believe we have, or have access to, the financial resources and liquidity necessary to meet our requirements for working capital, capital and investment expenditures, dividends and distributions, working capital, and tax and
65
debt payments while maintaining a sufficient level of liquidity. In particular, we note the following assumptions for 2012:
We expect capital and investment expenditures to total between $3.4 billion and $3.8 billion in 2012. Of this total, maintenance capital expenditures, which are generally considered nondiscretionary and include expenditures to meet legal and regulatory requirements, to maintain and/or extend the coming year:operating capacity and useful lives of our assets, and to complete certain well connections, are expected to total between $520 million and $600 million. Expansion capital expenditures, which are generally more discretionary to fund projects in order to grow our business are expected to total between $2.88 billion and $3.2 billion. See Results of Operations – Segments, Williams Partners and Midstream Canada & Olefins for discussions describing the general nature of these expenditures;
We expect to pay total cash dividends of approximately $1.09 per common share, an increase of 41 percent over 2011 levels. We expect to increase our dividend quarterly through paying out substantially all of the cash distributions, net of applicable taxes, interest and costs, we receive from WPZ;
We expect to fund capital and investment expenditures, debt payments, dividends, and working capital requirements primarily through cash flow from operations, cash and cash equivalents on hand, utilization of our revolving credit facilities, and proceeds from debt issuances and sales of equity securities as needed. Based on a range of market assumptions, we currently estimate our cash flow from operations will be between $1.85 billion and $2.325 billion in 2012;
| | |
| | • | | We expect to maintain consolidated liquidity (which includes liquidity at WPZ) of at least $1 billion fromcash and cash equivalents and unused revolving credit facilities. |
|
| • | We expect to fund capital and investment expenditures, debt payments, dividends, and working capital requirements primarily through cash flow from operations, cash and cash equivalents on hand, and utilization of our revolving credit facilities as needed. However, we may be opportunistic in accessing the capital markets to build additional liquidity. We estimate our cash flow from operations to be between $1.9 billion and $2.2 billion in 2009.facilities; |
We estimate capital and investment expenditures will total $2,150expect WPZ to fund its $325 million of current debt maturities with a new debt issuance;
In January 2012, WPZ completed an equity issuance of 7 million common units representing limited partner interests in it at a price of $62.81 per unit. In February 2012, the underwriters exercised their option to $2,450purchase an additional 1.05 million common units for $62.81 per unit, with expected settlement on February 28, 2012;
On February 17, 2012, Williams Partners completed the acquisition of 100 percent of the ownership interests in certain entities from Delphi Midstream Partners, LLC in exchange for $325 million in 2009. Of this total,cash, net of cash acquired in the transaction and subject to certain closing adjustments, and approximately two-thirds is considered nondiscretionary to meet legal, regulatory,and/or contractual requirements or to preserve the value of existing assets. Included within the total estimated expenditures for 2009 is $2507.5 million to $300 million for compliance and maintenance-related projects at Gas Pipeline, including Clean Air Act compliance.WPZ common units.
Potential risks associated with our planned levels of liquidity and the planned capital and investment expenditures discussed above include:
Sustained reductions in energy commodity prices from the range of current expectations;
Lower than expected distributions, including incentive distribution rights, from WPZ. WPZ’s liquidity could also be impacted by a lack of adequate access to capital markets to fund its growth;
| | |
| • | Lower than expected levels of cash flow from operations. |
|
| • | Sustained reductions in energy commodity prices from year-end 2008 levels. |
|
| • | Exposure associated with our efforts to resolve regulatory and litigation issues (see Note 16 of Notes to Consolidated Financial Statements). |
Lower than expected levels of cash flow from operations from Midstream Canada & Olefins.
Based on our forecasted levels of cash flow from operations and other sources of liquidity, we expect to have sufficient liquidity to manage our businesses in 2009. As noted below, certain of our unsecured revolving and letter of credit facilities are scheduled to expire in 2009 and 2010. These facilities were originated primarily in support of our former power business.
2012. Our internal and external sources of consolidated liquidity include cash generated from our operations, cash and cash equivalents on hand, and our credit facilities. Additional sources of liquidity, if needed, include bank financings, proceeds from the issuance of long-term debt and equity securities, and proceeds from asset sales. While most of ourThese sources are available to us at the parent level others mayand are expected to be available to certain of our subsidiaries, includingparticularly equity and debt issuances from Williams Partners L.P.WPZ. WPZ is expected to be self-funding through its cash flows from operations, use of its credit facility, and Williams Pipeline Partners L.P.,its access to capital markets. WPZ makes cash distributions to us in accordance with the partnership agreement, which considers our master limited partnerships.level of ownership and incentive distribution rights. Our ability to raise funds in the capital markets will be impacted by our financial condition, interest rates, market conditions, and industry conditions.
68
66
| | | | | | | | | | | | | | | | |
| | | | | | December 31, 2011 | |
| | | Expiration | | | WPZ | | | WMB | | | Total | |
| | | | | | (Millions) | |
| Available Liquidity | | | | | | | | | | | | | | | | |
Cash and cash equivalents | | | | | | $ | 163 | | | $ | 726 | (1) | | $ | 889 | |
Available capacity under our $900 million senior unsecured revolving credit facility (2) | | | June 3, 2016 | | | | | | | | 900 | | | | 900 | |
Capacity available to WPZ under its $2 billion senior unsecured revolving credit facility (3) | | | June 3, 2016 | | | | 2,000 | | | | | | | | 2,000 | |
| | | | | | | | | | | | | | | | |
| | | | | | $ | 2,163 | | | $ | 1,626 | | | $ | 3,789 | |
| | | | | | | | | | | | | | | | |
In response to the challenges encountered by many financial institutions, the U.S. Government has provided substantial support to financial institutions, some of which are providers under our credit facilities. We continue to closely monitor the credit status of all providers under our credit facilities.
Available Liquidity
| | | | | | | | | |
| | | | | | Year Ended
| |
| | | Credit Facilities
| | | December 31, 2008
| |
| | | Expiration | | | (Millions) | |
| |
| Cash and cash equivalents(1) | | | | | | $ | 1,439 | |
| Available capacity under our unsecured revolving and letter of credit facilities totaling $1.2 billion: | | | | | | | | |
| $400 million facilities | | | April 2009 | | | | 400 | |
| $100 million facilities | | | May 2009 | | | | 100 | |
| $700 million facilities | | | September 2010 | | | | 480 | |
| Available capacity under our $1.5 billion unsecured revolving and letter of credit facility(2) | | | May 2012 | | | | 1,359 | |
| Available capacity under Williams Partners L.P.’s $450 million senior unsecured credit facility(3) | | | December 2012 | | | | 188 | |
| | | | | | | | | |
| | | | | | | $ | 3,966 | |
| | | | | | | | | |
(1) | | |
(1) | | Includes $467 million ofCashcash and cash equivalentsincludes $30 million of funds received from third parties as collateral. The obligation for these amounts is reported asaccrued liabilitieson the Consolidated Balance Sheet. Also included is $609 million of cash and cash equivalents that is being utilizedheld by certain subsidiary and international operations.operations and is not considered available for general corporate purposes. The remainder of ourcash and cash equivalentsis primarily held in government-backed instruments. |
|
(2) | | Northwest Pipeline and Transco each have access to $400In June 2011, we replaced our existing $900 million under this facility to the extent not utilized by us. We expect that the ability of both Northwest Pipeline and Transco to borrow under this facility is reduced by approximately $19 million each due to the bankruptcy of a participating bank. We also expect that our consolidated ability to borrow under this facility is reduced by a total of $70 million, including the reductions related to Northwest Pipeline and Transco. The available liquidity in the table above reflects this $70 million reduction. (See Note 11 of Notes to Consolidated Financial Statements.) The committed amounts of other participating banks under this agreement remain in effect and are not impacted by this reduction. |
|
| | Our primaryunsecured revolving credit facility contains financial covenants including the requirementagreement that we not exceed stated debtwas scheduled to capitalization ratios.expire in May 2012 with a new $900 million five-year senior unsecured revolving credit facility agreement. At December 31, 2008,2011, we are significantly belowin compliance with the maximum allowed ratiosfinancial covenants associated with this new credit facility agreement (see Note 11 of Notes to Consolidated Financial Statements). |
|
(3) | | In June 2011, WPZ replaced its existing $1.75 billion unsecured revolving credit facility agreement that was scheduled to expire in February 2013 with a new $2 billion five-year senior unsecured revolving credit facility agreement. At December 31, 2011, WPZ is in compliance with the financial covenants associated with this new credit facility agreement. This credit facility is only available to Williams Partners L.P. We expect that Williams Partners L.P.’s ability to borrow under this facility is reduced by $12 million due to the bankruptcy of a participating bank. The available liquidity in the table above reflects this $12 million reduction. (SeeWPZ, Transco and Northwest Pipeline as co-borrowers (see Note 11 of Notes to Consolidated Financial Statements.) The committed amounts of other participating banks under this agreement remain in effect and are not impacted by this reduction. |
|
| | This credit facility contains financial covenants related to Williams Partners L.P.’s EBITDA to interest expense ratio and indebtedness to EBITDA ratio (all as defined in the credit agreement)Statements). At December 31, 2008, they are in compliance with these covenants. However, since the ratios are calculated on a rolling four-quarter basis, the ratios at December 31, 2008, do not reflect the full-year impact of lower commodity prices in the fourth quarter which have continued into 2009. |
Williams Partners L.P. hasIn addition to the credit facilities listed above, we have issued letters of credit totaling $21 million as of December 31, 2011, under certain bilateral bank agreements.
WPZ filed a shelf registration statement which expiresas a well-known, seasoned issuer in October 2009, available for the issuanceFebruary 2012 that allows it to issue an unlimited amount of $1.17 billion aggregate principal amount ofregistered debt and limited partnership unit securities.
69
At the parent-company level, we
havefiled a shelf registration statement
which as a well-known, seasoned issuer
in May 2009 that allows us to issue an unlimited amount of registered debt and equity securities.
This shelf registration statement expiresAs described in May 2009.
Exploration & Production has an unsecured credit agreement with certain banks that, so long as certain conditions are met, serves to reduce our use of cash and other credit facilities for margin requirements related to our hedging activities as well as lower transaction fees. The agreement extends through December 2013. (See Note 11 of Notes to Consolidated Financial Statements.)
Credit ratings
Standard & Poor’s ratesStatements, we have determined that we have net assets that are technically considered restricted in accordance with Rule 4-08(e) of Regulation S-X of the Securities and Exchange Commission in excess of 25 percent of our
senior unsecured debt at BB+ andconsolidated net assets. We do not expect this determination will impact our
corporate credit at BBB-with a stable ratings outlook. With respect to Standard & Poor’s, a rating of “BBB” or above indicates an investment grade rating. A rating below “BBB” indicates that the security has significant speculative characteristics. A “BB” rating indicates that Standard & Poor’s believes the issuer has the capacity to meet its financial commitment on the obligation, but adverse business conditions could lead to insufficient ability to
pay dividends or meet
financial commitments. Standard & Poor’s may modifyfuture obligations as the terms of WPZ’s partnership agreement require it to make quarterly distributions of all available cash, as defined, to its
unitholders.Credit Ratings
Our ability to borrow money is impacted by our credit ratings with a “+” or a “−” sign to showand the obligor’s relative standing within a major rating category.
credit ratings of WPZ. The current ratings are as follows: | | | | |
| | WMB | | WPZ |
Standard and Poor’s (1) | | | | |
Corporate Credit Rating | | BBB- | | BBB- |
Senior Unsecured Debt Rating | | BB+ | | BBB- |
Outlook | | Positive | | Positive |
Moody’s Investors Service (2) | | | | |
Senior Unsecured Debt Rating | | Baa3 | | Baa2 |
Outlook | | Stable | | Stable |
Fitch Ratings (3) | | | | |
Senior Unsecured Debt Rating | | BBB- | | BBB- |
Outlook | | Stable | | Positive |
67
(1) | A rating of “BBB” or above indicates an investment grade rating. A rating below “BBB” indicates that the security has significant speculative characteristics. A “BB” rating indicates that Standard & Poor’s believes the issuer has the capacity to meet its financial commitment on the obligation, but adverse business conditions could lead to insufficient ability to meet financial commitments. Standard & Poor’s may modify its ratings with a “+” or a “-” sign to show the obligor’s relative standing within a major rating category. |
(2) | A rating of “Baa” or above indicates an investment grade rating. A rating below “Baa” is considered to have speculative elements. The “1,” “2,” and “3” modifiers show the relative standing within a major category. A “1” indicates that an obligation ranks in the higher end of the broad rating category, “2” indicates a mid-range ranking, and “3” indicates the lower end of the category. |
On February 27, 2012, Moody’s Investors Service rates our senior unsecured debt at Baa3. On November 6, 2008, Moody’s revised our ratings outlook to negative from stable. On February 23, 2009, Moody’s revised our ratingsWMB’s rating outlook to stable from negative. With respect to
On February 27, 2012, Moody’s a rating of “Baa” or above indicates an investment grade rating. A rating below “Baa” is considered to have speculative elements. The “1”, “2” and “3” modifiers show the relative standing within a major category. A “1” indicates that an obligation ranks in the higher end of the broad rating category, “2” indicates a mid-range ranking, and “3” ranking at the lower end of the category.
Fitch Ratings rates ourInvestors Service upgraded WPZ’s senior unsecured debt
at BBB–. On November 6, 2008, Fitchrating to Baa2 from Baa3. The rating outlook was also revised
our ratings outlook to
evolvingstable from
stable. under review for possible upgrade.(3) | A rating of “BBB” or above indicates an investment grade rating. A rating below “BBB” is considered speculative grade. Fitch may add a “+” or a “-” sign to show the obligor’s relative standing within a major rating category. |
On February 24, 2009,9, 2012, Fitch Ratings revised our ratingsWMB’s outlook to stable from evolving. With respectrating watch negative. WPZ’s outlook was also revised to Fitch, a rating of “BBB” or above indicates an investment grade rating. A rating below “BBB” is considered speculative grade. Fitch may add a “+” or a “−” sign to show the obligor’s relative standing within a major rating category.
positive from stable.Credit rating agencies perform independent analyses when assigning credit ratings. No assurance can be given that the credit rating agencies will continue to assign us investment grade ratings even if we meet or exceed their current criteria for investment grade ratios. A downgrade of our credit rating might increase our future cost of borrowing and would require us to post additional collateral with third parties, negatively impacting our available liquidity. As of December 31, 2008,2011, we estimate that a downgrade to a rating below investment grade would have requiredfor us or WPZ could require us to post up to $400$165 million or $134 million, respectively, in additional collateral with third parties.
| | | | | | | | | | | | | |
| | | Years Ended December 31, | |
| | | 2008 | | | 2007 | | | 2006 | |
| | | (Millions) | |
| |
| Net cash provided (used) by: | | | | | | | | | | | | |
| Operating activities | | $ | 3,355 | | | $ | 2,237 | | | $ | 1,890 | |
| Financing activities | | | (432 | ) | | | (511 | ) | | | 1,103 | |
| Investing activities | | | (3,183 | ) | | | (2,296 | ) | | | (2,321 | ) |
| | | | | | | | | | | | | |
| Increase (decrease) in cash and cash equivalents | | $ | (260 | ) | | $ | (570 | ) | | $ | 672 | |
| | | | | | | | | | | | | |
| | | | | | | | | | | | |
| | | Years Ended December 31, | |
| | | 2011 | | | 2010 | | | 2009 | |
| | | (Millions) | |
Net cash provided (used) by: | | | | | | | | | | | | |
Operating activities | | $ | 3,439 | | | $ | 2,651 | | | $ | 2,572 | |
Financing activities | | | (342 | ) | | | 573 | | | | 166 | |
Investing activities | | | (3,003 | ) | | | (4,296 | ) | | | (2,310 | ) |
| | | | | | | | | | | | |
Increase (decrease) in cash and cash equivalents | | $ | 94 | | | $ | (1,072 | ) | | $ | 428 | |
| | | | | | | | | | | | |
Operating Activitiesactivities
Ournet cash provided by operating activitiesin 20082011 increased from 20072010 primarily due primarily to the increase inhigher operating income from our earnings. Significant transactions impacting ournet cash provided by operating activitiesin 2008 include:
| | |
| • | $140 million of cash received related to a favorable resolution of matters involving pipeline transportation rates associated with our former Alaska operations (see Note 2 of Notes to Consolidated Financial Statements). |
70
| | |
| • | $144 million of required refunds paid by Transco related to a general rate case with the FERC (see Results of Operations — Segments, Gas Pipeline). |
Ournet cash provided by operating activitiesin 20072010 increased slightly from 20062009 primarily due to the improvement in the energy commodity price environment during the year.Financing activities
Significant transactions include:
2011
$526 million of cash retained by WPX upon spin-off on December 31, 2011;
$746 million of notes and debentures retired in December 2011 and $254 million paid in associated premiums;
68
$1.5 billion received from WPX’s issuance of senior unsecured notes in November 2011;
$500 million received from WPZ’s public offering of senior unsecured notes in November 2011 primarily used to repay borrowings on its credit facility mentioned below;
$375 million received by Transco from the issuance of senior unsecured notes in August 2011;
$300 million paid to retire Transco’s senior unsecured notes that matured in August 2011;
$300 million received in revolver borrowings from WPZ’s $1.75 billion unsecured credit facility used for WPZ’s acquisition of a 24.5 percent interest in Gulfstream from us in May 2011. This obligation was transferred to WPZ’s new $2 billion unsecured credit facility at its inception in June 2011;
$150 million paid to retire WPZ’s senior unsecured notes that matured in June 2011;
We paid $457 million of quarterly dividends on common stock for the year ended December 31, 2011;
$425 million in net borrowings and payments related to WPZ’s revolving credit facility in 2011.
2010
$369 million received from WPZ’s December 2010 equity offering used primarily to the increase in our operating resultsreduce revolver borrowings mentioned below and the absenceto fund a portion of WPZ’s acquisition of a $145midstream business in Pennsylvania’s Marcellus Shale in December 2010;
$200 million securities litigation settlement paymentreceived in 2006. These increases are partially offsetrevolver borrowings from WPZ’s $1.75 billion unsecured credit facility primarily used for WPZ’s general partnership purposes and to fund a portion of the cash consideration paid for WPZ’s acquisition of certain gathering and processing assets in Colorado’s Piceance basin in November 2010;
$600 million received from WPZ’s public offering of 4.125 percent senior unsecured notes in November 2010 primarily used to fund a portion of the cash consideration paid to our former exploration and production business for WPZ’s acquisition of certain gathering and processing assets in Colorado’s Piceance basin;
$430 million received in revolver borrowings from WPZ’s $1.75 billion unsecured credit facility primarily used to fund our increased ownership in OPPL, a transaction that closed in September 2010;
$437 million received from a WPZ equity offering used to reduce WPZ’s revolver borrowings mentioned above;
$3.491 billion received by increased income tax paymentsWPZ in 2007February 2010 from the issuance of $3.5 billion of senior unsecured notes related to our previously discussed restructuring;
$3 billion of senior unsecured notes retired in February 2010 and other changes$574 million paid in working capital.associated premiums utilizing proceeds from the $3.5 billion debt issuance;
$250 million received from revolver borrowings on WPZ’s $1.75 billion unsecured credit facility in February 2010 to repay a term loan;
We paid $284 million of quarterly dividends on common stock for the year ended December 31, 2010.
Financing Activities2009
We received $595 million net cash from the issuance of $600 million aggregate principal amount of 8.75 percent senior unsecured notes due 2020 to fund general corporate expenses and capital expenditures;
2008
| | |
| • | We received $362 million from the completion of the Williams Pipeline Partners L.P. initial public offering (see Note 1 of Notes to Consolidated Financial Statements). |
|
| • | We paid $474 million for the repurchase of our common stock (see Note 12 of Notes to Consolidated Financial Statements). |
|
| • | Gas Pipeline received $75 million net from debt transactions (see Note 11 of Notes to Consolidated Financial Statements). |
|
| • | We paid $250 million of quarterly dividends on common stock for the year ended December 31, 2008. |
2007
| | |
| • | We paid $526 million for the repurchase of our common stock. |
|
| • | We repurchased $22 million of our 8.125 percent senior unsecured notes due March 2012 and $213 million of our 7.125 percent senior unsecured notes due September 2011. Early retirement premiums paid were approximately $19 million. |
|
| • | Northwest Pipeline issued $185 million of 5.95 percent senior unsecured notes due 2017 and retired $175 million of 8.125 percent senior unsecured notes due 2010. Early retirement premiums paid were approximately $7 million. |
|
| • | Williams Partners L.P. acquired certain of our membership interests in Wamsutter LLC, the limited liability company that owns the Wamsutter system, from us for $750 million. Williams Partners L.P. completed the transaction after successfully closing a public equity offering of 9.25 million common units that yielded net proceeds of approximately $335 million. The partnership financed the remainder of the purchase price primarily through utilizing $250 million term loan borrowings under their $450 million five-year senior unsecured credit facility and issuing approximately $157 million of common units to us. |
|
| • | We paid $233 million of quarterly dividends on common stock for the year ended December 31, 2007. |
2006
| | |
| • | Transco issued $200 million aggregate principal amount of 6.4 percent senior unsecured notes due 2016. |
|
| • | Northwest Pipeline issued $175 million aggregate principal amount of 7 percent senior unsecured notes due 2016. |
|
| • | Williams Partners L.P. acquired our interest in Williams Four Corners LLC for $1.6 billion. The acquisition was completed after Williams Partners L.P. successfully closed a $150 million private debt offering of 7.5 percent senior unsecured notes due 2011, a $600 million private debt offering of 7.25 percent senior unsecured notes due 2017, $350 million of common and Class B units, and equity offerings of $519 million in net proceeds. |
|
| • | We paid $489 million to retire a secured floating-rate term loan due in 2008. |
|
| • | We paid $26 million in premiums related to the conversion of $220 million of 5.5 percent junior subordinated convertible debentures into common stock. |
71We paid $256 million of quarterly dividends on common stock for the year ended December 31, 2009.
69
Investing activities
Significant transactions include:
2011
Capital expenditures totaled $2.8 billion in 2011;
We contributed $137 million to our Laurel Mountain equity investment.
| | |
| • | We paid $207 million of quarterly dividends on common stock for the year ended December 31, 2006. |
2010
Capital expenditures totaled $2.8 billion in 2010. Included is approximately $599 million, including closing adjustments, related to our former exploration and production business’ acquisition in the Marcellus Shale in July 2010;
We paid approximately $949 million, including closing adjustments, for our former exploration and production business’ December 2010 business purchase, consisting primarily of oil and gas properties in the Bakken Shale;
We contributed $488 million to our investments, including a $424 million cash payment for WPZ’s September 2010 acquisition of an increased interest in OPPL;
We paid $150 million for WPZ’s December 2010 business purchase, consisting primarily of certain midstream assets in the Marcellus Shale.
2009
Capital expenditures totaled $2.4 billion, more than half of which related to our former exploration and production businesses. Included was a $253 million payment by our former exploration and production business for the purchase of additional properties in the Piceance basin;
We received $148 million as a distribution from Gulfstream following its debt offering;
We contributed $142 million to our investments, including $106 million related to our Laurel Mountain equity investment and $20 million related to our Gulfstream equity investment.
Investing ActivitiesOff-Balance Sheet Arrangements and Guarantees of Debt or Other Commitments
2008
| | |
| • | Our net investment in property, plant and equipment totaled $3.3 billion and was primarily related to Exploration & Production’s drilling activity. This total includes Exploration & Production’s acquisitions of certain interests in the Piceance and Fort Worth basins (see Results of Operations — Segments, Exploration & Production). |
|
| • | $148 million of cash received from Exploration & Production’s sale of a contractual right to a production payment (see Note 4 of Notes to Consolidated Financial Statements). |
|
| • | We contributed $111 million to our investments, including $90 million related to our Gulfstream equity investment. |
2007
| | |
| • | Our net investment in property, plant and equipment totaled $2.9 billion and was primarily related to Exploration & Production’s drilling activity, mostly in the Piceance basin. |
|
| • | We received $496 million of gross proceeds from the sale of substantially all of our power business. |
|
| • | We purchased $304 million and received $353 million from the sale of auction rate securities. These were utilized as a component of our overall cash management program. |
2006
| | |
| • | Our net investment in property, plant and equipment totaled $2.4 billion and was primarily related to Exploration & Production’s drilling activity, mostly in the Piceance basin, and Northwest Pipeline’s capacity replacement project. |
|
| • | We purchased $386 million and received $414 million from the sale of auction rate securities. |
Off-balance sheet financing arrangements and guarantees of debt or other commitments
We have various other guarantees and commitments which are disclosed in Notes 3, 9, 10, 11, 15 and 16 of Notes to Consolidated Financial Statements. We do not believe these guarantees or the possible fulfillment of them will prevent us from meeting our liquidity needs.
72
Contractual Obligations
The table below summarizes the maturity dates of our contractual obligations including obligations related to discontinued operations.
| | | | | | | | | | | | | | | | | | | | | |
| | | | | | 2010-
| | | 2012-
| | | | | | | |
| | | 2009 | | | 2011 | | | 2013 | | | Thereafter | | | Total | |
| | | (Millions) | |
| |
| Long-term debt, including current portion: | | | | | | | | | | | | | | | | | | | | |
| Principal(l) | | $ | 53 | | | $ | 994 | | | $ | 1,248 | | | $ | 5,611 | | | $ | 7,906 | |
| Interest | | | 588 | | | | 1,151 | | | | 894 | | | | 4,452 | | | | 7,085 | |
| Capital leases | | | 3 | | | | 2 | | | | — | | | | — | | | | 5 | |
| Operating leases | | | 96 | | | | 80 | | | | 42 | | | | 44 | | | | 262 | |
| Purchase obligations(2) | | | 1,299 | | | | 1,342 | | | | 1,209 | | | | 2,405 | | | | 6,255 | |
| Other long-term liabilities, including current portion: | | | | | | | | | | | | | | | | | | | | |
| Physical and financial derivatives(3)(4) | | | 575 | | | | 606 | | | | 296 | | | | 196 | | | | 1,673 | |
| Other(5)(6) | | | — | | | | 1 | | | | — | | | | — | | | | 1 | |
| | | | | | | | | | | | | | | | | | | | | |
| Total | | $ | 2,614 | | | $ | 4,176 | | | $ | 3,689 | | | $ | 12,708 | | | $ | 23,187 | |
| | | | | | | | | | | | | | | | | | | | | |
| | | | | | | | | | | | | | | | | | | | |
| | | 2012 | | | 2013 -
2014 | | | 2015 -
2016 | | | Thereafter | | | Total | |
| | | | | | | | | (Millions) | | | | | | | |
Long-term debt, including current portion: | | | | | | | | | | | | | | | | | | | | |
Principal | | $ | 352 | | | $ | — | | | $ | 1,125 | | | $ | 7,272 | | | $ | 8,749 | |
Interest | | | 530 | | | | 1,000 | | | | 934 | | | | 4,434 | | | | 6,898 | |
Capital leases | | | 2 | | | | 2 | | | | — | | | | — | | | | 4 | |
Operating leases (1) | | | 44 | | | | 69 | | | | 55 | | | | 148 | | | | 316 | |
Purchase obligations (2) | | | 1,626 | | | | 648 | | | | 418 | | | | 1,320 | | | | 4,012 | |
Other long-term liabilities (3) (4) | | | — | | | | 1 | | | | 1 | | | | — | | | | 2 | |
| | | | | | | | | | | | | | | | | | | | |
Total | | $ | 2,554 | | | $ | 1,720 | | | $ | 2,533 | | | $ | 13,174 | | | $ | 19,981 | |
| | | | | | | | | | | | | | | | | | | | |
70
(1) | Includes a right-of-way agreement with the Jicarilla Apache Nation, which is considered an operating lease. We are required to make a fixed annual payment of $7.5 million and an additional annual payment, which varies depending on per-unit NGL margins and the volume of gas gathered by our gathering facilities subject to the right-of-way agreement. The table above for years 2013 and thereafter does not include such variable amounts related to this agreement as the variable amount is not yet determinable. |
(2) | |
(1) | | The debt instrumentsIncludes an estimated $2.2 billion long-term ethane purchase obligation with index-based pricing terms that is reflected in this table are classified by stated maturity date. See Note 11 of Notes to Consolidated Financial Statements for discussion of certain non-recourse debt of two of our Venezuelan subsidiaries that is in technical default and classified as current on our Consolidated Balance Sheet. |
|
(2) | | Includes $3.7 billion of natural gas purchase obligations at market prices at our Exploration & Production segment. The purchased natural gas can be sold at market prices. |
|
(3) | | The obligations for physical and financial derivatives are based on market information as of December 31, 2008 and assumes contracts remain outstanding for their full contractual duration. Because market information changes daily and has the potential to be volatile, significant changes to the values in this category may occur. |
|
(4) | | Expected offsetting cash inflows of $3.6 billion at December 31, 2008, resulting from product sales2011 prices. This obligation is part of an overall exchange agreement whereby volumes we transport on OPPL are sold at a third-party fractionator in Conway, Kansas, and we are subsequently obligated to purchase ethane volumes at Mont Belvieu. The purchased ethane volumes may be utilized or net positive settlements, are not reflectedresold at comparable prices in these amounts. In addition, product sales may require additional purchase obligations to fulfill sales obligations that are not reflected in these amounts.the Mont Belvieu market. |
|
(5)(3) | | Does not include estimated contributions to our pension and other postretirement benefit plans. We made contributions to our pension and other postretirement benefit plans of $75$83 million in 20082011 and $56$76 million in 2007.2010. In 2009,2012, we expect to contribute approximately $77$94 million to these plans (see Note 7 of Notes to Consolidated Financial Statements). Tax-qualified pension plans are required to meet minimum contribution requirements. In the past, we have contributed amounts to our tax-qualified pension plans in excess of the minimum required contribution. These excess amounts can be used to offset future minimum contribution requirements. During 2008,2011, we contributed $60 million to our tax-qualified pension plans whichplans. In addition to these contributions, a portion of the excess contributions was greater thanused to meet the minimum fundingcontribution requirements. Although the 2008 economic downturn resulted in a significant decrease in the funded status of our tax-qualified pension plans,During 2012, we expect to contribute approximately $60$70 million to theseour tax-qualified pension plans again in 2009, which is expectedand use excess amounts to be greater than thesatisfy minimum fundingcontribution requirements. EstimatedAdditionally, estimated future minimum funding requirements may vary significantly from historical requirements if investment returns do not return to expected levels. Future minimum funding requirements may also be impacted if actual results differ significantly from estimated results for assumptions such as returns on plan assets, interest rates, retirement rates, mortality, and other significant assumptions or by changes to current legislation and regulations. |
|
(6)(4) | | As of December 31, 2008, weWe have accrued approximately $79 million for unrecognizednot included income tax benefits. We cannot make reasonably reliable estimates of the timing of the future payments of these liabilities. Therefore, these liabilities have been excluded fromin the table above. See Note 5 of Notes to Consolidated Financial Statements for information regardinga discussion of income taxes, including our contingent tax liability reserves. |
Our operations have benefited from relatively low inflation rates.historically not been materially affected by inflation. Approximately 3858 percent of our gross property, plant, and equipment is at Gas Pipeline. Gas Pipeline iscomprised of our interstate gas pipelines. These assets are subject to regulation, which limits recovery to historical cost. While amounts in excess of historical cost are not recoverable under current FERC practices, we anticipate being allowed to recover and earn a return based on increased actual cost incurred to replace existing
73
assets. Cost-based regulation, along with competition and other market factors, may limit our ability to recover such increased costs. For the other operating units,remainder of our business, operating costs are influenced to a greater extent by both competition for specialized services and specific price changes in crude oil and natural gas and related commodities than by changes in general inflation. Crude oil, natural gas, and natural gas liquidsNGL prices are particularly sensitive to the Organization of the Petroleum Exporting Countries (OPEC) production levelsand/or the market perceptions concerning the supply and demand balance in the near future, as well as general economic conditions. However, our exposure to certain of these price changes is reduced through the use of hedging instruments and the fee-based nature of certain of our services.
We are a participant in certain environmental activities in various stages including assessment studies, cleanup operationsand/or remedial processes at certain sites, some of which we currently do not own (see Note 16 of Notes to Consolidated Financial Statements). We are monitoring these sites in a coordinated effort with other potentially responsible parties, the U.S. Environmental Protection Agency (EPA), or other governmental authorities. We are jointly and severally liable along with unrelated third parties in some of these activities and solely responsible in others. Current estimates of the most likely costs of such activities are approximately $43$47 million, all of which are recorded asincluded inaccrued liabilitiesandregulatory liabilities, deferred income and other on our balance sheetthe Consolidated Balance Sheet at December 31, 2008.2011. We will seek recovery of approximately $14$10 million of thethese accrued costs through future natural gas transmission rates. The remainder of these costs will be funded
71
from operations. During 2008,2011, we paid approximately $10$8 million for cleanupand/or remediation and monitoring activities. We expect to pay approximately $11$10 million in 20092012 for these activities. Estimates of the most likely costs of cleanup are generally based on completed assessment studies, preliminary results of studies or our experience with other similar cleanup operations. At December 31, 2008,2011, certain assessment studies were still in process for which the ultimate outcome may yield significantly different estimates of most likely costs. Therefore, the actual costs incurred will depend on the final amount, type, and extent of contamination discovered at these sites, the final cleanup standards mandated by the EPA or other governmental authorities, and other factors.
We are also subject to the federalFederal Clean Air Act (Act) and to the federalFederal Clean Air Act Amendments of 1990 (1990 Amendments), which requireadded significantly to the EPAexisting requirements established by the Act. Pursuant to issue new regulations. We are also subject to regulation atrequirements of the state1990 Amendments and local level. In September 1998, the EPA promulgated rules designed to mitigate the migration of ground-level ozone, we have installed air pollution controls on existing sources at certain facilities in certain states. order to reduce ozone emissions.
In March 2004 and June 2004,2008, the EPA promulgated additional regulation regarding hazardous air pollutants, whicha new, lower National Ambient Air Quality Standard (NAAQS) for ground-level ozone. Within two years, the EPA was expected to designate new eight-hour ozone nonattainment areas. However, in September 2009, the EPA announced it would reconsider the 2008 NAAQS for ground level ozone to ensure that the standards were clearly grounded in science and were protective of both public health and the environment. As a result, the EPA delayed designation of new eight-hour ozone nonattainment areas under the 2008 standards until the reconsideration is complete. In January 2010, the EPA proposed to further reduce the ground-level ozone NAAQS from the March 2008 levels.In September 2011, the EPA announced it would not move forward with the proposed 2010 ozone NAAQS. Instead, the EPA will implement the 2008 ozone NAAQS that was stayed during the reconsideration process. The EPA is expected to designate ozone nonattainment areas under the 2008 NAAQS in second quarter 2012 and we are unable at this time to estimate the cost of additions that may be required to meet this new regulation. However, designation of new eight-hour ozone nonattainment areas are expected to result in additional controls. Capital expenditures necessaryfederal and state regulatory actions that will likely impact our operations and increase the cost of additions to installproperty, plant and equipment — net on the Consolidated Balance Sheet.
Additionally, in August 2010, the EPA promulgated National Emission Standards for Hazardous Air Pollutants (NESHAP) regulations that will impact our operations. The emission control devices on our Transco gas pipeline systemadditions required to comply with rules were approximately $2 million in 2008 andthe NESHAP regulations are estimated to be between $5include capital costs in the range of $24 million and $10to $32 million through 2012.2013, the compliance date.
In June 2010, the EPA promulgated a final rule establishing a new one-hour sulfur dioxide (SO2) NAAQS. The actualeffective date of the new SO2 standard was August 23, 2010. This new standard is subject to challenge in federal court. EPA has not adopted final modeling guidance. We are unable at this time to estimate the cost of additions that may be required to meet this new regulation.
In February 2010, the EPA promulgated a final rule establishing a new one-hour nitrogen dioxide (NO2) NAAQS. The effective date of the new NO2 standard was April 12, 2010. This new standard is subject to numerous challenges in the federal court. We are unable at this time to estimate the cost of additions that may be required to meet this new regulation.
Our interstate natural gas pipelines consider prudently incurred environmental assessment and remediation costs incurred will depend onand the final implementation plans developed by each state to comply with these regulations. We consider these costs on our Transco system associated with compliance with these environmental laws and regulationsstandards to be prudent costs incurred in the ordinary course of business and, therefore, recoverable through its rates.
74
| |
Item 7A. | Quantitative and Qualitative Disclosures About Market Risk |
Our current interest rate risk exposure is related primarily to our debt portfolio. The majority of ourOur debt portfolio is comprised of fixed rate debt, in order to mitigatewhich mitigates the impact of fluctuations in interest rates. Any borrowings under
72
our credit facilities could be at a variable interest rate and could expose us to the risk of increasing interest rates. The maturity of our long-term debt portfolio is partially influenced by the expected lives of our operating assets.
(See Note 11 of Notes to Consolidated Financial Statements.)The tables below provide information by maturity date about our interest rate risk-sensitive instruments as of December 31, 20082011 and 2007.2010. Long-term debt in the tables represents principal cash flows, net of (discount) premium, and weighted-average interest rates by expected maturity dates. The fair value of our publicly traded long-term debt is valued using indicative year-end traded bond market prices. Private debt is valued based on market rates and the prices of similar securities with similar terms and credit ratings.
| | | | | | | | | | | | | | | | | | | | | | | | | | | | | | | | | |
| | | | | | | | | | | | | | | | | | | | | | | | Fair Value
| |
| | | | | | | | | | | | | | | | | | | | | | | | December 31,
| |
| | | 2009 | | | 2010 | | | 2011 | | | 2012 | | | 2013 | | | Thereafter(1) | | | Total | | | 2008 | |
| | | (Dollars in millions) | |
| |
| Long-term debt, including current portion(4)(6): | | | | | | | | | | | | | | | | | | | | | | | | | | | | | | | | |
| Fixed rate | | $ | 41 | | | $ | 27 | | | $ | 948 | | | $ | 971 | | | $ | 17 | | | $ | 5,566 | | | $ | 7,570 | | | $ | 6,011 | |
| Interest rate | | | 7.6 | % | | | 7.6 | % | | | 7.6 | % | | | 7.6 | % | | | 7.5 | % | | | 7.9 | % | | | | | | | | |
| Variable rate | | $ | 12 | | | $ | 12 | | | $ | 7 | | | $ | 255 | | | $ | 5 | | | $ | 13 | | | $ | 304 | | | $ | 274 | |
| Interest rate(2) | | | | | | | | | | | | | | | | | | | | | | | | | | | | | | | | |
| | | | | | | | | | | | | | | | | | | | | | | | | | | | | | | | | |
| | | | | | | | | | | | | | | | | | | | | | | | Fair Value
| |
| | | | | | | | | | | | | | | | | | | | | | | | December 31,
| |
| | | 2008 | | | 2009 | | | 2010 | | | 2011 | | | 2012 | | | Thereafter(1) | | | Total | | | 2007 | |
| | | (Dollars in millions) | |
| |
| Long-term debt, including current portion(4): | | | | | | | | | | | | | | | | | | | | | | | | | | | | | | | | |
| Fixed rate | | $ | 53 | | | $ | 41 | | | $ | 27 | | | $ | 948 | | | $ | 971 | | | $ | 5,111 | | | $ | 7,151 | | | $ | 7,994 | |
| Interest rate | | | 7.7 | % | | | 7.7 | % | | | 7.4 | % | | | 7.4 | % | | | 7.3 | % | | | 7.7 | % | | | | | | | | |
| Variable rate | | $ | 85 | | | $ | 12 | | | $ | 12 | | | $ | 7 | | | $ | 605 | (5) | | $ | 18 | | | $ | 739 | | | $ | 735 | |
| Interest rate(3) | | | | | | | | | | | | | | | | | | | | | | | | | | | | | | | | |
| | | | | | | | | | | | | | | | | | | | | | | | | | | | | | | | |
| | | 2012 | | | 2013 | | | 2014 | | | 2015 | | | 2016 | | | Thereafter(1) | | | Total | | | Fair Value
December 31,
2011 | |
| | | (Millions) | |
Long-term debt, including current portion (2): | | | | | | | | | | | | | | | | | | | | | | | | | | | | | | | | |
Fixed rate | | $ | 352 | | | $ | — | | | $ | — | | | $ | 750 | | | $ | 375 | | | $ | 7,241 | | | $ | 8,718 | | | $ | 10,043 | |
Interest rate | | | 6.0% | | | | 6.0% | | | | 6.0% | | | | 6.1% | | | | 6.2% | | | | 6.5% | | | | | | | | | |
| | | | | | | | |
| | | 2011 | | | 2012 | | | 2013 | | | 2014 | | | 2015 | | | Thereafter(1) | | | Total | | | Fair Value
December 31,
2010 | |
| | | (Millions) | |
Long-term debt, including current portion (2): | | | | | | | | | | | | | | | | | | | | | | | | | | | | | | | | |
Fixed rate | | $ | 507 | | | $ | 352 | | | $ | — | | | $ | — | | | $ | 750 | | | $ | 7,495 | | | $ | 9,104 | | | $ | 9,990 | |
Interest rate | | | 6.4% | | | | 6.4% | | | | 6.3% | | | | 6.3% | | | | 6.4% | | | | 6.9% | | | | | | | | | |
(1) | | |
(1) | | Includes unamortized discount and premium. |
|
(2) | | The interest rate at December 31, 2008, is LIBOR plus 0.76 percent. |
|
(3) | | The interest rate at December 31, 2007 was LIBOR plus 0.75 percent. |
|
(4) | | Excludes capital leases. |
|
(5) | | Includes Transco’s subsequent refinancing of its $100 million notes, due on January 15, 2008, under our $1.5 billion revolving credit facility. (See Note 11 of Notes to Consolidated Financial Statements.) |
|
(6) | | The debt instruments in this table are classified by stated maturity date. See Note 11 of Notes to Consolidated Financial Statements for discussion of certain non-recourse debt of two of our Venezuelan subsidiaries that is in technical default and classified as current on our Consolidated Balance Sheet. |
We are exposed to the impact of fluctuations in the market price of natural gas and natural gas liquids,NGLs, as well as other market factors, such as market volatility and energy commodity price correlations. We are exposed to these risks in connection with our owned energy-related assets, our long-term energy-related contracts, and ourlimited proprietary trading activities. We manageOur management of the risks associated with these market fluctuations includes maintaining a conservative capital structure and significant liquidity, as well as using various derivatives and nonderivative energy-related contracts. The fair value of derivative contracts is subject to many factors, including changes in energy-commodityenergy commodity market prices, the liquidity and volatility of the markets in which the contracts are transacted, and changes in interest rates. (See Note 15 of Notes to Consolidated Financial Statements.)
We measure the risk in our portfoliosportfolio using avalue-at-risk methodology to estimate the potentialone-day loss from adverse changes in the fair value of the portfolios.
75
Value at riskportfolio. Value-at-risk requires a number of key assumptions and is not necessarily representative of actual losses in fair value that could be incurred from the portfolios.portfolio. Ourvalue-at-risk model uses a Monte Carlo method to simulate hypothetical movements in future market prices and assumes that, as a result of changes in commodity prices, there is a 95 percent probability that theone-day loss in fair value of the portfoliosportfolio will not exceed the value at risk. The simulation method uses historical correlations and market forward prices and volatilities. In applying thevalue-at-risk methodology, we do not consider that the simulated hypothetical movements affect the positions or would cause any potential liquidity issues, nor do we consider that changing the portfolio in response to market conditions could affect market prices and could take longer than aone-day holding period to execute. While aone-day holding period has historically been the industry standard, a longer holding period could more accurately represent the true market risk given market liquidity and our own credit and liquidity constraints.
73
We segregate our derivative contracts into trading and nontrading contracts, as defined in the following paragraphs. We calculate value at riskvalue-at-risk separately for these two categories. Derivative contractsContracts designated as normal purchases or sales under SFAS No. 133 and nonderivative energy contracts have been excluded from our estimation of value at risk.
Our limited trading portfolio consists of derivative contracts entered into for purposes other than economically hedging our commodity price-risk exposure. The fair value of our trading derivatives was a net liabilityasset of $29less than $0.1 million at December 31, 2008. Our2011. The value at risk for contracts held for trading purposes was $0.2less than $0.1 million at December 31, 2008,2011 and $1 millionzero at December 31, 2007. During the year ended December 31, 2008, our value at risk for these contracts ranged from a high of $3.3 million to a low of $0.2 million.
Our nontrading portfolio consists of derivative contracts that hedge or could potentially hedge the price risk exposure from the following activities:
| | |
Segment | | |
Segment
| | Commodity Price Risk Exposure |
|
Exploration & ProductionWilliams Partners | | • Natural gas sales |
Midstream | | • Natural gas purchases |
Gas Marketing Services | | • Natural gasNGL sales |
| |
Midstream Canada & Olefins | | • NGL purchases and sales |
The fair value of our nontrading derivatives was a net asset of $511$1 million at December 31, 2008.
2011.The value at riskvalue-at-risk for derivative contracts held for nontrading purposes was $33 millionzero at December 31, 2008,2011, and $24 million at December 31, 2007.2010. During the year ended December 31, 2008,2011, our value at risk for these contracts ranged from a high of $72$1 million to a low of $33 million. The increase in value at risk reflects the impact on our nontrading portfolio of the increase in volumes of Exploration & Production hedges in 2009 and 2010. Derivative contracts included in our assets and liabilities of discontinued operations are included in the nontrading portfolio, but these had a value at risk of zero for both periods.
zero.Certain of the derivative contracts held for nontrading purposes arein 2011 were accounted for as cash flow hedges under SFAS No. 133.but realized during the year. Of the total fair value ofon nontrading derivatives, SFAS No. 133 cash flow hedges had a net asset value of $458 millionzero as of December 31, 2008.2011. Though these contracts arewould be included in ourvalue-at-risk calculation, any changechanges in the fair value of the effective portion of these hedge contracts would generally not be reflected in earnings until the associated hedged item affects earnings.
We have policies and procedures that govern our trading and risk management activities. These policies cover authority and delegation thereof in addition to control requirements, authorized commodities, and term and exposure limitations.Value-at-risk is limited in aggregate and calculated at a 95 percent confidence level.
76
Foreign Currency Risk
We have international investments that could affect our financial results if the investments incur a permanent decline in value as a result of changes in foreign currency exchange ratesand/or the economic conditions in foreign countries.
International investments accounted for under the cost method totaled $17 million at December 31, 2008, and $24 million at December 31, 2007. These investments are primarily in nonpublicly traded companies for which it is not practicable to estimate fair value. We believe that we can realize the carrying value of these investments considering the status of the operations of the companies underlying these investments.
Net assets of our consolidated foreign operations, whose functional currency is the local currency, are located primarily in Canada were approximately $690 million and approximate 5 percent and 7 percent of our net assets$580 million at December 31, 20082011 and 2007,2010, respectively. These foreign operations do not have significant transactions or financial instruments denominated in currencies other currencies.than their functional currency. However, these investments do have the potential to impact our financial position, due to fluctuations in these local currencies arising from the process of translating the local functional currency into the U.S. dollar. As an example, a 20 percent change in the respective functional currencies against the U.S. dollar would have changedstockholders’ equityby approximately $84$138 million at December 31, 2008.
2011.
77
74
| |
Item 8. | Financial Statements and Supplementary Data |
MANAGEMENT’S ANNUAL REPORT ON INTERNAL CONTROL OVER
FINANCIAL REPORTING
Management is responsible for establishing and maintaining adequate internal control over financial reporting (as defined inRules 13a-15(f)13a – 15(f) and15d-15(f) 15d – 15(f) under the Securities Exchange Act of 1934). Our internal controls over financial reporting are designed to provide reasonable assurance to our management and board of directors regarding the preparation and fair presentation of financial statements in accordance with accounting principles generally accepted in the United States. Our internal control over financial reporting includes those policies and procedures that (i) pertain to the maintenance of records that, in reasonable detail, accurately and fairly reflect the transactions and dispositions of our assets; (ii) provide reasonable assurance that transactions are recorded as to permit preparation of financial statements in accordance with generally accepted accounting principles, and that our receipts and expenditures are being made only in accordance with authorization of our management and board of directors; and (iii) provide reasonable assurance regarding prevention or timely detection of unauthorized acquisition, use or disposition of our assets that could have a material effect on our financial statements.
All internal control systems, no matter how well designed, have inherent limitations including the possibility of human error and the circumvention or overriding of controls. Therefore, even those systems determined to be effective can provide only reasonable assurance with respect to financial statement preparation and presentation.
Under the supervision and with the participation of our management, including our Chief Executive Officer and Chief Financial Officer, we assessed the effectiveness of our internal control over financial reporting as of December 31, 2008,2011, based on the criteria set forth by the Committee of Sponsoring Organizations of the Treadway Commission (COSO) inInternal Control — Integrated Framework.Based on our assessment, we believeconcluded that, as of December 31, 2008,2011, our internal control over financial reporting was effective.
Ernst & Young LLP, our independent registered public accounting firm, has audited our internal control over financial reporting, as stated in their report which is included in this Annual Report onForm 10-K.
78
75
Report of Independent Registered Public Accounting Firm
On Internal Control Over Financial Reporting
REPORT OF INDEPENDENT REGISTERED PUBLIC ACCOUNTING
FIRM ON INTERNAL CONTROL OVER FINANCIAL REPORTING
The Board of Directors and Stockholders of
The Williams Companies, Inc.
We have audited The Williams Companies, Inc.’s internal control over financial reporting as of December 31, 2008,2011, based on criteria established in Internal Control — Control—Integrated Framework issued by the Committee of Sponsoring Organizations of the Treadway Commission (the COSO criteria). The Williams Companies, Inc.’s management is responsible for maintaining effective internal control over financial reporting, and for its assessment of the effectiveness of internal control over financial reporting included in the accompanying Management’s Annual Report on Internal Control Over Financial Reporting. Our responsibility is to express an opinion on the Company’s internal control over financial reporting based on our audit.
We conducted our audit in accordance with the standards of the Public Company Accounting Oversight Board (United States). Those standards require that we plan and perform the audit to obtain reasonable assurance about whether effective internal control over financial reporting was maintained in all material respects. Our audit included obtaining an understanding of internal control over financial reporting, assessing the risk that a material weakness exists, testing and evaluating the design and operating effectiveness of internal control based on the assessed risk, and performing such other procedures as we considered necessary in the circumstances. We believe that our audit provides a reasonable basis for our opinion.
A company’s internal control over financial reporting is a process designed to provide reasonable assurance regarding the reliability of financial reporting and the preparation of financial statements for external purposes in accordance with generally accepted accounting principles. A company’s internal control over financial reporting includes those policies and procedures that (1) pertain to the maintenance of records that, in reasonable detail, accurately and fairly reflect the transactions and dispositions of the assets of the company; (2) provide reasonable assurance that transactions are recorded as necessary to permit preparation of financial statements in accordance with generally accepted accounting principles, and that receipts and expenditures of the company are being made only in accordance with authorizations of management and directors of the company; and (3) provide reasonable assurance regarding prevention or timely detection of unauthorized acquisition, use, or disposition of the company’s assets that could have a material effect on the financial statements.
Because of its inherent limitations, internal control over financial reporting may not prevent or detect misstatements. Also, projections of any evaluation of effectiveness to future periods are subject to the risk that controls may become inadequate because of changes in conditions, or that the degree of compliance with the policies or procedures may deteriorate.
In our opinion, The Williams Companies, Inc. maintained, in all material respects, effective internal control over financial reporting as of December 31, 2008,2011, based on the COSO criteria.
We also have audited, in accordance with the standards of the Public Company Accounting Oversight Board (United States), the consolidated balance sheet of The Williams Companies, Inc. as of December 31, 20082011 and 2007,2010, and the related consolidated statements of income, stockholders’operations, changes in equity, and cash flows for each of the three years in the period ended December 31, 20082011, of The Williams Companies, Inc. and our report dated February 23, 200927, 2012, expressed an unqualified opinion thereon.
79
76
Report of Independent Registered Public Accounting Firm
REPORT OF INDEPENDENT REGISTERED PUBLIC ACCOUNTING FIRM
The Board of Directors and Stockholders of
The Williams Companies, Inc.
We have audited the accompanying consolidated balance sheet of The Williams Companies, Inc. as of December 31, 20082011 and 2007,2010, and the related consolidated statements of income, stockholders’operations, changes in equity, and cash flows for each of the three years in the period ended December 31, 2008.2011. Our audits also included the financial statement scheduleschedules listed in the index at Item 15(a). These financial statements and scheduleschedules are the responsibility of the Company’s management. Our responsibility is to express an opinion on these financial statements and scheduleschedules based on our audits.
We did not audit the financial statements of Gulfstream Natural Gas System, L.L.C. (Gulfstream) (a limited liability corporation in which the Company has a 50 percent interest). The Company’s investment in Gulfstream constituted two percent of the Company’s assets as of both December 31, 2011 and 2010 and the Company’s equity earnings in the net income of Gulfstream constituted five and seventeen percent of the Company’s income from continuing operations before income taxes for the years ended December 31, 2011 and 2010, respectively, Gulfstream’s financial statements were audited by other auditors whose report has been furnished to us, and our opinion on the 2011 and 2010 consolidated financial statements, insofar as it relates to the amounts included for Gulfstream, is based solely on the report of the other auditors.We conducted our audits in accordance with the standards of the Public Company Accounting Oversight Board (United States). Those standards require that we plan and perform the audit to obtain reasonable assurance about whether the financial statements are free of material misstatement. An audit includes examining, on a test basis, evidence supporting the amounts and disclosures in the financial statements. An audit also includes assessing the accounting principles used and significant estimates made by management, as well as evaluating the overall financial statement presentation. We believe that our audits and the report of other auditors provide a reasonable basis for our opinion.
In our opinion, based on our audits and the report of other auditors, the financial statements referred to above present fairly, in all material respects, the consolidated financial position of The Williams Companies, Inc. at December 31, 20082011 and 2007,2010, and the consolidated results of its operations and its cash flows for each of the three years in the period ended December 31, 2008,2011, in conformity with U.S. generally accepted accounting principles. Also, in our opinion, the related financial statement schedule,schedules, when considered in relation to the basic financial statements taken as a whole, presentspresent fairly in all material respects the information set forth therein.
As explained in Note 5 to the consolidated financial statements, effective January 1, 2007 the Company adopted FASB Interpretation No. 48,Accounting for Uncertainty in Income Taxes, an Interpretation of FASB Statement No. 109.
We also have audited, in accordance with the standards of the Public Company Accounting Oversight Board (United States), The Williams Companies, Inc.’s internal control over financial reporting as of December 31, 2008,2011, based on criteria established in Internal Control — Integrated Framework issued by the Committee of Sponsoring Organizations of the Treadway Commission and our report dated February 23, 200927, 2012, expressed an unqualified opinion thereon.
February 27, 2012
77
REPORT OF INDEPENDENT REGISTERED PUBLIC ACCOUNTING FIRM
To the Members of Gulfstream Natural Gas System, L.L.C.
We have audited the balance sheet of Gulfstream Natural Gas System, L.L.C., (the “Company”), as of December 31, 2011 and 2010, and the related statements of operations, cash flows, and members’ equity and comprehensive income for the years then ended. These financial statements are the responsibility of the Company’s management. Our responsibility is to express an opinion on these financial statements based on our audit.
We conducted our audit in accordance with the auditing standards of the Public Company Accounting Oversight Board (United States). Those standards require that we plan and perform the audit to obtain reasonable assurance about whether the financial statements are free of material misstatement. The Company is not required to have, nor were we engaged to perform, an audit of its internal control over financial reporting. Our audit included consideration of internal control over financial reporting as a basis for designing audit procedures that are appropriate in the circumstances, but not for the purpose of expressing an opinion on the effectiveness of the Company’s internal control over financial reporting. Accordingly, we express no such opinion. An audit also includes examining, on a test basis, evidence supporting the amounts and disclosures in the financial statements, assessing the accounting principles used and significant estimates made by management, as well as evaluating the overall financial statement presentation. We believe that our audit provides a reasonable basis for our opinion.
In our opinion, such financial statements present fairly, in all material respects, the financial position of Gulfstream Natural Gas System, L.L.C. as of December 31, 2011 and 2010, and the results of its operations and its cash flows for the years then ended in conformity with accounting principles generally accepted in the United States of America.
/s/ Deloitte & Touche LLP
Houston, Texas
February 23, 2009
80
78
THE WILLIAMS COMPANIES, INC.
CONSOLIDATED STATEMENT OF INCOMEOPERATIONS
| | | | | | | | | | | | | |
| | | Years Ended December 31, | |
| | | 2008 | | | 2007 | | | 2006 | |
| | | (Millions, except per-share amounts) | |
| |
| Revenues: | | | | | | | | | | | | |
| Exploration & Production | | $ | 3,121 | | | $ | 2,021 | | | $ | 1,411 | |
| Gas Pipeline | | | 1,634 | | | | 1,610 | | | | 1,348 | |
| Midstream Gas & Liquids | | | 5,642 | | | | 5,180 | | | | 4,159 | |
| Gas Marketing Services | | | 6,412 | | | | 4,633 | | | | 5,049 | |
| Other | | | 24 | | | | 26 | | | | 27 | |
| Intercompany eliminations | | | (4,481 | ) | | | (2,984 | ) | | | (2,695 | ) |
| | | | | | | | | | | | | |
| Total revenues | | | 12,352 | | | | 10,486 | | | | 9,299 | |
| | | | | | | | | | | | | |
| Segment costs and expenses: | | | | | | | | | | | | |
| Costs and operating expenses | | | 9,156 | | | | 8,007 | | | | 7,489 | |
| Selling, general and administrative expenses | | | 504 | | | | 471 | | | | 389 | |
| Other (income) expense — net | | | (82 | ) | | | (18 | ) | | | 34 | |
| | | | | | | | | | | | | |
| Total segment costs and expenses | | | 9,578 | | | | 8,460 | | | | 7,912 | |
| | | | | | | | | | | | | |
| General corporate expenses | | | 149 | | | | 161 | | | | 132 | |
| Securities litigation settlement and related costs | | | — | | | | — | | | | 167 | |
| | | | | | | | | | | | | |
| Operating income (loss): | | | | | | | | | | | | |
| Exploration & Production | | | 1,240 | | | | 731 | | | | 530 | |
| Gas Pipeline | | | 630 | | | | 622 | | | | 430 | |
| Midstream Gas & Liquids | | | 904 | | | | 1,011 | | | | 635 | |
| Gas Marketing Services | | | 3 | | | | (337 | ) | | | (195 | ) |
| Other | | | (3 | ) | | | (1 | ) | | | (13 | ) |
| General corporate expenses | | | (149 | ) | | | (161 | ) | | | (132 | ) |
| Securities litigation settlement and related costs | | | — | | | | — | | | | (167 | ) |
| | | | | | | | | | | | | |
| Total operating income | | | 2,625 | | | | 1,865 | | | | 1,088 | |
| | | | | | | | | | | | | |
| Interest accrued | | | (653 | ) | | | (685 | ) | | | (670 | ) |
| Interest capitalized | | | 59 | | | | 32 | | | | 17 | |
| Investing income | | | 191 | | | | 257 | | | | 168 | |
| Early debt retirement costs | | | (1 | ) | | | (19 | ) | | | (31 | ) |
| Minority interest in income of consolidated subsidiaries | | | (174 | ) | | | (90 | ) | | | (40 | ) |
| Other income — net | | | — | | | | 11 | | | | 26 | |
| | | | | | | | | | | | | |
| Income from continuing operations before income taxes | | | 2,047 | | | | 1,371 | | | | 558 | |
| Provision for income taxes | | | 713 | | | | 524 | | | | 211 | |
| | | | | | | | | | | | | |
| Income from continuing operations | | | 1,334 | | | | 847 | | | | 347 | |
| Income (loss) from discontinued operations | | | 84 | | | | 143 | | | | (38 | ) |
| | | | | | | | | | | | | |
| Net income | | $ | 1,418 | | | $ | 990 | | | $ | 309 | |
| | | | | | | | | | | | | |
| Basic earnings (loss) per common share: | | | | | | | | | | | | |
| Income from continuing operations | | $ | 2.30 | | | $ | 1.42 | | | $ | .58 | |
| Income (loss) from discontinued operations | | | .14 | | | | .24 | | | | (.06 | ) |
| | | | | | | | | | | | | |
| Net income | | $ | 2.44 | | | $ | 1.66 | | | $ | .52 | |
| | | | | | | | | | | | | |
| Weighted-average shares (thousands) | | | 581,342 | | | | 596,174 | | | | 595,053 | |
| | | | | | | | | | | | | |
| Diluted earnings (loss) per common share: | | | | | | | | | | | | |
| Income from continuing operations | | $ | 2.26 | | | $ | 1.40 | | | $ | .57 | |
| Income (loss) from discontinued operations | | | .14 | | | | .23 | | | | (.06 | ) |
| | | | | | | | | | | | | |
| Net income | | $ | 2.40 | | | $ | 1.63 | | | $ | .51 | |
| | | | | | | | | | | | | |
| Weighted-average shares (thousands) | | | 592,719 | | | | 609,866 | | | | 608,627 | |
| | | | | | | | | | | | | |
| | | | | | | | | | | | |
| | | Years Ended December 31, | |
| | | 2011 | | | 2010 | | | 2009 | |
| | | (Millions, except per-share
amounts) | |
Revenues: | | | | | | | | | | | | |
Williams Partners | | $ | 6,729 | | | $ | 5,715 | | | $ | 4,602 | |
Midstream Canada & Olefins | | | 1,312 | | | | 1,033 | | | | 753 | |
Other | | | 25 | | | | 24 | | | | 27 | |
Intercompany eliminations | | | (136 | ) | | | (134 | ) | | | (104 | ) |
| | | | | | | | | | | | |
Total revenues | | | 7,930 | | | | 6,638 | | | | 5,278 | |
| | | | | | | | | | | | |
Segment costs and expenses: | | | | | | | | | | | | |
Costs and operating expenses | | | 5,550 | | | | 4,712 | | | | 3,712 | |
Selling, general, and administrative expenses | | | 325 | | | | 313 | | | | 330 | |
Other (income) expense – net | | | 1 | | | | (15 | ) | | | (34 | ) |
| | | | | | | | | | | | |
Total segment costs and expenses | | | 5,876 | | | | 5,010 | | | | 4,008 | |
| | | | | | | | | | | | |
General corporate expenses | | | 187 | | | | 221 | | | | 164 | |
| | | |
Operating income (loss): | | | | | | | | | | | | |
Williams Partners | | | 1,754 | | | | 1,465 | | | | 1,236 | |
Midstream Canada & Olefins | | | 300 | | | | 172 | | | | 37 | |
Other | | | — | | | | (9 | ) | | | (3 | ) |
General corporate expenses | | | (187 | ) | | | (221 | ) | | | (164 | ) |
| | | | | | | | | | | | |
Total operating income (loss) | | | 1,867 | | | | 1,407 | | | | 1,106 | |
| | | | | | | | | | | | |
Interest accrued | | | (598 | ) | | | (628 | ) | | | (656 | ) |
Interest capitalized | | | 25 | | | | 36 | | | | 61 | |
Investing income – net | | | 168 | | | | 188 | | | | 38 | |
Early debt retirement costs | | | (271 | ) | | | (606 | ) | | | (1 | ) |
Other income (expense) – net | | | 11 | | | | (12 | ) | | | 2 | |
| | | | | | | | | | | | |
Income (loss) from continuing operations before income taxes | | | 1,202 | | | | 385 | | | | 550 | |
Provision (benefit) for income taxes | | | 124 | | | | 114 | | | | 204 | |
| | | | | | | | | | | | |
Income (loss) from continuing operations | | | 1,078 | | | | 271 | | | | 346 | |
Income (loss) from discontinued operations | | | (417 | ) | | | (1,193 | ) | | | 15 | |
| | | | | | | | | | | | |
Net income (loss) | | | 661 | | | | (922 | ) | | | 361 | |
Less: Net income attributable to noncontrolling interests | | | 285 | | | | 175 | | | | 76 | |
| | | | | | | | | | | | |
Net income (loss) attributable to The Williams Companies, Inc. | | $ | 376 | | | $ | (1,097 | ) | | $ | 285 | |
| | | | | | | | | | | | |
Amounts attributable to The Williams Companies, Inc.: | | | | | | | | | | | | |
Income (loss) from continuing operations | | $ | 803 | | | $ | 104 | | | $ | 206 | |
Income (loss) from discontinued operations | | | (427 | ) | | | (1,201 | ) | | | 79 | |
| | | | | | | | | | | | |
Net income (loss) | | $ | 376 | | | $ | (1,097 | ) | | $ | 285 | |
| | | | | | | | | | | | |
Basic earnings (loss) per common share: | | | | | | | | | | | | |
Income (loss) from continuing operations | | $ | 1.36 | | | $ | .17 | | | $ | .35 | |
Income (loss) from discontinued operations | | | (.72 | ) | | | (2.05 | ) | | | .14 | |
| | | | | | | | | | | | |
Net income (loss) | | $ | .64 | | | $ | (1.88 | ) | | $ | .49 | |
| | | | | | | | | | | | |
Weighted-average shares (thousands) | | | 588,553 | | | | 584,552 | | | | 581,674 | |
| | | | | | | | | | | | |
Diluted earnings (loss) per common share: | | | | | | | | | | | | |
Income (loss) from continuing operations | | $ | 1.34 | | | $ | .17 | | | $ | .35 | |
Income (loss) from discontinued operations | | | (.71 | ) | | | (2.03 | ) | | | .14 | |
| | | | | | | | | | | | |
Net income (loss) | | $ | .63 | | | $ | (1.86 | ) | | $ | .49 | |
| | | | | | | | | | | | |
Weighted-average shares (thousands) | | | 598,175 | | | | 590,699 | | | | 585,955 | |
| | | | | | | | | | | | |
See accompanying notes.
81
79
THE WILLIAMS COMPANIES, INC.
CONSOLIDATED BALANCE SHEET
| | | | | | | | | |
| | | December 31, | |
| | | 2008 | | | 2007 | |
| | | (Dollars in millions, except per-share amounts) | |
| |
ASSETS |
| Current assets: | | | | | | | | |
| Cash and cash equivalents | | $ | 1,439 | | | $ | 1,699 | |
| Accounts and notes receivable (net of allowance of $40 at December 31, 2008 and $27 at December 31, 2007) | | | 941 | | | | 1,192 | |
| Inventories | | | 260 | | | | 209 | |
| Derivative assets | | | 1,464 | | | | 1,736 | |
| Assets of discontinued operations | | | 6 | | | | 185 | |
| Deferred income taxes | | | — | | | | 199 | |
| Other current assets and deferred charges | | | 301 | | | | 318 | |
| | | | | | | | | |
| Total current assets | | | 4,411 | | | | 5,538 | |
| Investments | | | 971 | | | | 901 | |
| Property, plant and equipment — net | | | 18,065 | | | | 15,981 | |
| Derivative assets | | | 986 | | | | 859 | |
| Goodwill | | | 1,011 | | | | 1,011 | |
| Other assets and deferred charges | | | 562 | | | | 771 | |
| | | | | | | | | |
| Total assets | | $ | 26,006 | | | $ | 25,061 | |
| | | | | | | | | |
| |
| LIABILITIES AND STOCKHOLDERS’ EQUITY |
| Current liabilities: | | | | | | | | |
| Accounts payable | | $ | 1,059 | | | $ | 1,131 | |
| Accrued liabilities | | | 1,170 | | | | 1,158 | |
| Derivative liabilities | | | 1,093 | | | | 1,824 | |
| Liabilities of discontinued operations | | | 1 | | | | 175 | |
| Long-term debt due within one year | | | 196 | | | | 143 | |
| | | | | | | | | |
| Total current liabilities | | | 3,519 | | | | 4,431 | |
| Long-term debt | | | 7,683 | | | | 7,757 | |
| Deferred income taxes | | | 3,390 | | | | 2,996 | |
| Derivative liabilities | | | 875 | | | | 1,139 | |
| Other liabilities and deferred income | | | 1,485 | | | | 933 | |
| Contingent liabilities and commitments (Note 16) | | | | | | | | |
| Minority interests in consolidated subsidiaries | | | 614 | | | | 1,430 | |
| Stockholders’ equity: | | | | | | | | |
| Common stock (960 million shares authorized at $1 par value; 613 million shares issued at December 31, 2008, and 608 million shares issued at December 31, 2007) | | | 613 | | | | 608 | |
| Capital in excess of par value | | | 8,074 | | | | 6,748 | |
| Retained earnings (deficit) | | | 874 | | | | (293 | ) |
| Accumulated other comprehensive loss | | | (80 | ) | | | (121 | ) |
| | | | | | | | | |
| | | | 9,481 | | | | 6,942 | |
| Less treasury stock, at cost (35 million shares of common stock at December 31, 2008 and 22 million shares of common stock at December 31, 2007) | | | (1,041 | ) | | | (567 | ) |
| | | | | | | | | |
| Total stockholders’ equity | | | 8,440 | | | | 6,375 | |
| | | | | | | | | |
| Total liabilities and stockholders’ equity | | $ | 26,006 | | | $ | 25,061 | |
| | | | | | | | | |
| | | | | | | | |
| | | December 31, | |
| | | 2011 | | | 2010 | |
| | | (Millions, except
per-share amounts) | |
| ASSETS | | | | | | | | |
Current assets: | | | | | | | | |
Cash and cash equivalents | | $ | 889 | | | $ | 758 | |
Accounts and notes receivable (net of allowance of $1 at December 31, 2011 and 2010, respectively) | | | 637 | | | | 497 | |
Inventories | | | 169 | | | | 225 | |
Assets of discontinued operations | | | — | | | | 897 | |
Regulatory assets | | | 40 | | | | 51 | |
Other current assets and deferred charges | | | 159 | | | | 102 | |
| | | | | | | | |
Total current assets | | | 1,894 | | | | 2,530 | |
| | |
Investments | | | 1,391 | | | | 1,240 | |
Property, plant, and equipment – net | | | 12,580 | | | | 11,754 | |
Assets of discontinued operations | | | — | | | | 8,828 | |
Regulatory assets, deferred charges, and other | | | 637 | | | | 620 | |
| | | | | | | | |
Total assets | | $ | 16,502 | | | $ | 24,972 | |
| | | | | | | | |
| LIABILITIES AND EQUITY | | | | | | | | |
Current liabilities: | | | | | | | | |
Accounts payable | | $ | 691 | | | $ | 432 | |
Accrued liabilities | | | 631 | | | | 738 | |
Liabilities of discontinued operations | | | — | | | | 896 | |
Long-term debt due within one year | | | 353 | | | | 508 | |
| | | | | | | | |
Total current liabilities | | | 1,675 | | | | 2,574 | |
Long-term debt | | | 8,369 | | | | 8,600 | |
Deferred income taxes | | | 1,660 | | | | 1,738 | |
Liabilities of discontinued operations | | | — | | | | 2,179 | |
Regulatory liabilities, deferred income, and other | | | 1,715 | | | | 1,262 | |
Contingent liabilities and commitments (Note 16) | | | | | | | | |
| | |
Equity: | | | | | | | | |
Stockholders’ equity: | | | | | | | | |
Common stock (960 million shares authorized at $1 par value; 626 million shares issued at December 31, 2011 and 620 million shares issued at December 31, 2010) | | | 626 | | | | 620 | |
Capital in excess of par value | | | 8,417 | | | | 8,269 | |
Retained deficit | | | (5,820 | ) | | | (478 | ) |
Accumulated other comprehensive income (loss) | | | (389 | ) | | | (82 | ) |
Treasury stock, at cost (35 million shares of common stock) | | | (1,041 | ) | | | (1,041 | ) |
| | | | | | | | |
Total stockholders’ equity | | | 1,793 | | | | 7,288 | |
Noncontrolling interests in consolidated subsidiaries | | | 1,290 | | | | 1,331 | |
| | | | | | | | |
Total equity | | | 3,083 | | | | 8,619 | |
| | | | | | | | |
Total liabilities and equity | | $ | 16,502 | | | $ | 24,972 | |
| | | | | | | | |
See accompanying notes.
82
80
THE WILLIAMS COMPANIES, INC.
CONSOLIDATED STATEMENT OF STOCKHOLDERS’CHANGES IN EQUITY
| | | | | | | | | | | | | | | | | | | | | | | | | | | | | |
| | | | | | | | | | | | Accumulated
| | | | | | | | | | |
| | | | | | Capital in
| | | Retained
| | | Other
| | | | | | | | | | |
| | | Common
| | | Excess of
| | | Earnings
| | | Comprehensive
| | | | | | Treasury
| | | | |
| | | Stock | | | Par Value | | | (Deficit) | | | Loss | | | Other | | | Stock | | | Total | |
| | | (Dollars in millions, except per-share amounts) | |
| |
Balance, December 31, 2005 | | $ | 579 | | | $ | 6,328 | | | $ | (1,136 | ) | | $ | (298 | ) | | $ | (5 | ) | | $ | (41 | ) | | $ | 5,427 | |
| Comprehensive income: | | | | | | | | | | | | | | | | | | | | | | | | | | | | |
| Net income — 2006 | | | — | | | | — | | | | 309 | | | | — | | | | — | | | | — | | | | 309 | |
| Other comprehensive income: | | | | | | | | | | | | | | | | | | | | | | | | | | | | |
| Net unrealized gains on cash flow hedges, net of reclassification adjustments | | | — | | | | — | | | | — | | | | 394 | | | | — | | | | — | | | | 394 | |
| Foreign currency translation adjustments | | | — | | | | — | | | | — | | | | (4 | ) | | | — | | | | — | | | | (4 | ) |
| Minimum pension liability adjustment | | | — | | | | — | | | | — | | | | (1 | ) | | | — | | | | — | | | | (1 | ) |
| | | | | | | | | | | | | | | | | | | | | | | | | | | | | |
| Total other comprehensive income | | | | | | | | | | | | | | | | | | | | | | | | | | | 389 | |
| | | | | | | | | | | | | | | | | | | | | | | | | | | | | |
| Total comprehensive income | | | | | | | | | | | | | | | | | | | | | | | | | | | 698 | |
| Adjustment to initially apply SFAS No. 158, net of tax: | | | | | | | | | | | | | | | | | | | | | | | | | | | | |
| Pension benefits: | | | | | | | | | | | | | | | | | | | | | | | | | | | | |
| Prior service cost | | | — | | | | — | | | | — | | | | (4 | ) | | | — | | | | — | | | | (4 | ) |
| Net actuarial loss | | | — | | | | — | | | | — | | | | (150 | ) | | | — | | | | — | | | | (150 | ) |
| Minimum pension liability | | | — | | | | — | | | | — | | | | 5 | | | | — | | | | — | | | | 5 | |
| Other postretirement benefits: | | | | | | | | | | | | | | | | | | | | | | | | | | | | |
| Prior service cost | | | — | | | | — | | | | — | | | | (4 | ) | | | — | | | | — | | | | (4 | ) |
| Net actuarial gain | | | — | | | | — | | | | — | | | | 2 | | | | — | | | | — | | | | 2 | |
| Issuance of common stock from 5.5% debentures conversion (Note 12) | | | 20 | | | | 193 | | | | — | | | | — | | | | — | | | | — | | | | 213 | |
| Cash dividends — Common stock ($.35 per share) | | | — | | | | — | | | | (207 | ) | | | — | | | | — | | | | — | | | | (207 | ) |
| Repayment of stockholders’ notes | | | — | | | | — | | | | — | | | | — | | | | 5 | | | | — | | | | 5 | |
| Stock-based compensation, including tax benefit | | | 4 | | | | 84 | | | | — | | | | — | | | | — | | | | — | | | | 88 | |
| | | | | | | | | | | | | | | | | | | | | | | | | | | | | |
Balance, December 31, 2006 | | | 603 | | | | 6,605 | | | | (1,034 | ) | | | (60 | ) | | | — | | | | (41 | ) | | | 6,073 | |
| Comprehensive income: | | | | | | | | | | | | | | | | | | | | | | | | | | | | |
| Net income — 2007 | | | — | | | | — | | | | 990 | | | | — | | | | — | | | | — | | | | 990 | |
| Other comprehensive loss: | | | | | | | | | | | | | | | | | | | | | | | | | | | | |
| Net unrealized losses on cash flow hedges, net of reclassification adjustments | | | — | | | | — | | | | — | | | | (179 | ) | | | — | | | | — | | | | (179 | ) |
| Foreign currency translation adjustments | | | — | | | | — | | | | — | | | | 53 | | | | — | | | | — | | | | 53 | |
| Pension benefits: | | | | | | | | | | | | | | | | | | | | | | | | | | | | |
| Net actuarial gain | | | — | | | | — | | | | — | | | | 53 | | | | — | | | | — | | | | 53 | |
| Other postretirement benefits: | | | | | | | | | | | | | | | | | | | | | | | | | | | | |
| Prior service cost | | | — | | | | — | | | | — | | | | 1 | | | | — | | | | — | | | | 1 | |
| Net actuarial gain | | | — | | | | — | | | | — | | | | 9 | | | | — | | | | — | | | | 9 | |
| | | | | | | | | | | | | | | | | | | | | | | | | | | | | |
| Total other comprehensive loss | | | | | | | | | | | | | | | | | | | | | | | | | | | (63 | ) |
| | | | | | | | | | | | | | | | | | | | | | | | | | | | | |
| Allocation of other comprehensive loss to minority interest | | | — | | | | — | | | | — | | | | 2 | | | | — | | | | — | | | | 2 | |
| Total comprehensive income | | | | | | | | | | | | | | | | | | | | | | | | | | | 929 | |
| Cash dividends — Common stock ($.39 per share) | | | — | | | | — | | | | (233 | ) | | | — | | | | — | | | | — | | | | (233 | ) |
| FIN 48 adjustment (Note 5) | | | — | | | | — | | | | (17 | ) | | | — | | | | — | | | | — | | | | (17 | ) |
| Purchase of treasury stock (Note 12) | | | — | | | | — | | | | — | | | | — | | | | — | | | | (526 | ) | | | (526 | ) |
| Stock-based compensation, including tax benefit | | | 5 | | | | 143 | | | | — | | | | — | | | | — | | | | — | | | | 148 | |
| Other | | | — | | | | — | | | | 1 | | | | — | | | | — | | | | — | | | | 1 | |
| | | | | | | | | | | | | | | | | | | | | | | | | | | | | |
Balance, December 31, 2007 | | | 608 | | | | 6,748 | | | | (293 | ) | | | (121 | ) | | | — | | | | (567 | ) | | | 6,375 | |
| Comprehensive income: | | | | | | | | | | | | | | | | | | | | | | | | | | | | |
| Net income — 2008 | | | — | | | | — | | | | 1,418 | | | | — | | | | — | | | | — | | | | 1,418 | |
| Other comprehensive income: | | | | | | | | | | | | | | | | | | | | | | | | | | | | |
| Net unrealized gains on cash flow hedges, net of reclassification adjustments | | | — | | | | — | | | | — | | | | 455 | | | | — | | | | — | | | | 455 | |
| Foreign currency translation adjustments | | | — | | | | — | | | | — | | | | (76 | ) | | | | | | | | | | | (76 | ) |
| Pension benefits: | | | | | | | | | | | | | | | | | | | | | | | | | | | | |
| Prior service cost | | | — | | | | — | | | | — | | | | 1 | | | | — | | | | — | | | | 1 | |
| Net actuarial loss | | | — | | | | — | | | | — | | | | (344 | ) | | | | | | | | | | | (344 | ) |
| Other postretirement benefits: | | | | | | | | | | | | | | | | | | | | | | | | | | | | |
| Prior service cost | | | — | | | | — | | | | — | | | | 9 | | | | — | | | | — | | | | 9 | |
| Net actuarial loss | | | — | | | | — | | | | — | | | | (9 | ) | | | — | | | | — | | | | (9 | ) |
| | | | | | | | | | | | | | | | | | | | | | | | | | | | | |
| Total other comprehensive income | | | | | | | | | | | | | | | | | | | | | | | | | | | 36 | |
| | | | | | | | | | | | | | | | | | | | | | | | | | | | | |
| Allocation of other comprehensive income to minority interest | | | — | | | | — | | | | — | | | | 5 | | | | — | | | | — | | | | 5 | |
| Total comprehensive income | | | | | | | | | | | | | | | | | | | | | | | | | | | 1,459 | |
| Cash dividends — Common stock ($.43 per share) | | | — | | | | — | | | | (250 | ) | | | — | | | | — | | | | — | | | | (250 | ) |
| Issuance of common stock from 5.5% debentures conversion (Note 12) | | | 2 | | | | 25 | | | | — | | | | — | | | | — | | | | — | | | | 27 | |
| Conversion of Williams Partners L.P. subordinated units to common units (Note 12) | | | — | | | | 1,225 | | | | — | | | | — | | | | — | | | | — | | | | 1,225 | |
| Purchase of treasury stock (Note 12) | | | — | | | | — | | | | — | | | | — | | | | — | | | | (474 | ) | | | (474 | ) |
| Stock-based compensation, including tax benefit | | | 3 | | | | 67 | | | | — | | | | — | | | | — | | | | — | | | | 70 | |
| Other | | | — | | | | 9 | | | | (1 | ) | | | — | | | | — | | | | — | | | | 8 | |
| | | | | | | | | | | | | | | | | | | | | | | | | | | | | |
Balance, December 31, 2008 | | $ | 613 | | | $ | 8,074 | | | $ | 874 | | | $ | (80 | ) | | $ | — | | | $ | (1,041 | ) | | $ | 8,440 | |
| | | | | | | | | | | | | | | | | | | | | | | | | | | | | |
See accompanying notes.
83
| | | | | | | | | | | | | | | | | | | | | | | | | | | | | | | | |
| | | The Williams Companies, Inc., Stockholders | | | | |
| | | Common
Stock | | | Capital in
Excess of
Par Value | | | Retained
Earnings
(Deficit) | | | Accumulated
Other
Comprehensive
Loss | | | Treasury
Stock | | | Total
Stockholders’
Equity | | | Noncontrolling
Interest | | | Total | |
| | | (Millions, except per-share amounts) | |
Balance, December 31, 2008 | | $ | 613 | | | $ | 8,074 | | | $ | 874 | | | $ | (80 | ) | | $ | (1,041 | ) | | $ | 8,440 | | | $ | 614 | | | $ | 9,054 | |
Comprehensive income (loss): | | | | | | | | | | | | | | | | | | | | | | | | | | | | | | | | |
Net income (loss) | | | — | | | | — | | | | 285 | | | | — | | | | — | | | | 285 | | | | 76 | | | | 361 | |
Other comprehensive income (loss): | | | | | | | | | | | | | | | | | | | | | | | | | | | | | | | | |
Net change in cash flow hedges (Note 17) | | | — | | | | — | | | | — | | | | (221 | ) | | | — | | | | (221 | ) | | | — | | | | (221 | ) |
Foreign currency translation adjustments | | | — | | | | — | | | | — | | | | 83 | | | | — | | | | 83 | | | | — | | | | 83 | |
Pension benefits: | | | | | | | | | | | | | | | | | | | | | | | | | | | | | | | | |
Net actuarial gain (loss) | | | — | | | | — | | | | — | | | | 46 | | | | — | | | | 46 | | | | 7 | | | | 53 | |
Other postretirement benefits: | | | | | | | | | | | | | | | | | | | | | | | | | | | | | | | | |
Prior service cost | | | — | | | | — | | | | — | | | | 4 | | | | — | | | | 4 | | | | — | | | | 4 | |
| | | | | | | | | | | | | | | | | | | | | | | | | | | | | | | | |
Total other comprehensive income (loss) | | | | | | | | | | | | | | | | | | | | | | | (88 | ) | | | 7 | | | | (81 | ) |
| | | | | | | | | | | | | | | | | | | | | | | | | | | | | | | | |
Total comprehensive income (loss) | | | | | | | | | | | | | | | | | | | | | | | 197 | | | | 83 | | | | 280 | |
Cash dividends – common stock (Note 12) | | | — | | | | — | | | | (256 | ) | | | — | | | | — | | | | (256 | ) | | | — | | | | (256 | ) |
Dividends and distributions to noncontrolling interests | | | — | | | | — | | | | — | | | | — | | | | — | | | | — | | | | (129 | ) | | | (129 | ) |
Issuance of common stock from debentures conversion (Note 12) | | | 3 | | | | 25 | | | | — | | | | — | | | | — | | | | 28 | | | | — | | | | 28 | |
Stock-based compensation, net of tax benefit | | | 2 | | | | 36 | | | | — | | | | — | | | | — | | | | 38 | | | | — | | | | 38 | |
Other | | | — | | | | — | | | | — | | | | — | | | | — | | | | — | | | | 4 | | | | 4 | |
| | | | | | | | | | | | | | | | | | | | | | | | | | | | | | | | |
Balance, December 31, 2009 | | | 618 | | | | 8,135 | | | | 903 | | | | (168 | ) | | | (1,041 | ) | | | 8,447 | | | | 572 | | | | 9,019 | |
Comprehensive income (loss): | | | | | | | | | | | | | | | | | | | | | | | | | | | | | | | | |
Net income (loss) | | | — | | | | — | | | | (1,097 | ) | | | — | | | | — | | | | (1,097 | ) | | | 175 | | | | (922 | ) |
Other comprehensive income (loss): | | | | | | | | | | | | | | | | | | | | | | | | | | | | | | | | |
Net change in cash flow hedges (Note 17) | | | — | | | | — | | | | — | | | | 92 | | | | — | | | | 92 | | | | — | | | | 92 | |
Foreign currency translation adjustments | | | — | | | | — | | | | — | | | | 29 | | | | — | | | | 29 | | | | — | | | | 29 | |
Pension benefits: | | | | | | | | | | | | | | | | | | | | | | | | | | | | | | | | |
Prior service cost | | | — | | | | — | | | | — | | | | 1 | | | | — | | | | 1 | | | | — | | | | 1 | |
Net actuarial gain (loss) | | | — | | | | — | | | | — | | | | (25 | ) | | | — | | | | (25 | ) | | | — | | | | (25 | ) |
Other postretirement benefits: | | | | | | | | | | | | | | | | | | | | | | | | | | | | | | | | |
Prior service cost | | | — | | | | — | | | | — | | | | (3 | ) | | | — | | | | (3 | ) | | | — | | | | (3 | ) |
Net actuarial gain (loss) | | | — | | | | — | | | | — | | | | (8 | ) | | | — | | | | (8 | ) | | | — | | | | (8 | ) |
| | | | | | | | | | | | | | | | | | | | | | | | | | | | | | | | |
Total other comprehensive income (loss) | | | | | | | | | | | | | | | | | | | | | | | 86 | | | | — | | | | 86 | |
| | | | | | | | | | | | | | | | | | | | | | | | | | | | | | | | |
Total comprehensive income (loss) | | | | | | | | | | | | | | | | | | | | | | | (1,011 | ) | | | 175 | | | | (836 | ) |
Cash dividends – common stock (Note 12) | | | — | | | | — | | | | (284 | ) | | | — | | | | — | | | | (284 | ) | | | — | | | | (284 | ) |
Dividends and distributions to noncontrolling interests | | | — | | | | — | | | | — | | | | — | | | | — | | | | — | | | | (145 | ) | | | (145 | ) |
Issuance of common stock from debentures conversion (Note 12) | | | — | | | | 2 | | | | — | | | | — | | | | — | | | | 2 | | | | — | | | | 2 | |
Sale of limited partner units of consolidated partnership | | | — | | | | — | | | | — | | | | — | | | | — | | | | — | | | | 806 | | | | 806 | |
Stock-based compensation, net of tax benefit | | | 2 | | | | 55 | | | | — | | | | — | | | | — | | | | 57 | | | | — | | | | 57 | |
Changes in Williams Partners L.P. ownership interest, net | | | — | | | | 77 | | | | — | | | | — | | | | — | | | | 77 | | | | (77 | ) | | | — | |
| | | | | | | | | | | | | | | | | | | | | | | | | | | | | | | | |
Balance, December 31, 2010 | | | 620 | | | | 8,269 | | | | (478 | ) | | | (82 | ) | | | (1,041 | ) | | | 7,288 | | | | 1,331 | | | | 8,619 | |
81
THE WILLIAMS COMPANIES, INC.
CONSOLIDATED STATEMENT OF CHANGES IN EQUITY – (Continued)
| | | | | | | | | | | | | | | | | | | | | | | | | | | | | | | | |
| | | The Williams Companies, Inc., Stockholders | | | | |
| | | Common
Stock | | | Capital in
Excess of
Par Value | | | Retained
Earnings
(Deficit) | | | Accumulated
Other
Comprehensive
Loss | | | Treasury
Stock | | | Total
Stockholders’
Equity | | | Noncontrolling
Interest | | | Total | |
| | | (Millions, except per-share amounts) | |
Balance, December 31, 2010 | | | 620 | | | | 8,269 | | | | (478 | ) | | | (82 | ) | | | (1,041 | ) | | | 7,288 | | | | 1,331 | | | | 8,619 | |
Comprehensive income (loss): | | | | | | | | | | | | | | | | | | | | | | | | | | | | | | | | |
Net income (loss) | | | — | | | | — | | | | 376 | | | | — | | | | — | | | | 376 | | | | 285 | | | | 661 | |
Other comprehensive income (loss): | | | | | | | | | | | | | | | | | | | | | | | | | | | | | | | | |
Net change in cash flow hedges (Note 17) | | | — | | | | — | | | | — | | | | 53 | | | | — | | | | 53 | | | | — | | | | 53 | |
Foreign currency translation adjustments | | | — | | | | — | | | | — | | | | (18 | ) | | | — | | | | (18 | ) | | | — | | | | (18 | ) |
Pension benefits: | | | | | | | | | | | | | | | | | | | | | | | | | | | | | | | | |
Prior service cost | | | — | | | | — | | | | — | | | | 1 | | | | — | | | | 1 | | | | — | | | | 1 | |
Net actuarial gain (loss) | | | — | | | | — | | | | — | | | | (112 | ) | | | — | | | | (112 | ) | | | — | | | | (112 | ) |
Other postretirement benefits: | | | | | | | | | | | | | | | | | | | | | | | | | | | | | | | | |
Prior service cost | | | — | | | | — | | | | — | | | | (2 | ) | | | — | | | | (2 | ) | | | — | | | | (2 | ) |
Net actuarial gain (loss) | | | — | | | | — | | | | — | | | | (13 | ) | | | — | | | | (13 | ) | | | — | | | | (13 | ) |
Unrealized gain (loss) on equity securities | | | — | | | | — | | | | — | | | | 3 | | | | — | | | | 3 | | | | — | | | | 3 | |
| | | | | | | | | | | | | | | | | | | | | | | | | | | | | | | | |
Total other comprehensive income (loss) | | | | | | | | | | | | | | | | | | | | | | | (88 | ) | | | — | | | | (88 | ) |
| | | | | | | | | | | | | | | | | | | | | | | | | | | | | | | | |
Total comprehensive income (loss) | | | | | | | | | | | | | | | | | | | | | | | 288 | | | | 285 | | | | 573 | |
Cash dividends – common stock (Note 12) | | | — | | | | — | | | | (457 | ) | | | — | | | | — | | | | (457 | ) | | | — | | | | (457 | ) |
Dividends and distributions to noncontrolling interests | | | — | | | | — | | | | — | | | | — | | | | — | | | | — | | | | (214 | ) | | | (214 | ) |
Issuance of common stock from debentures conversion (Note 12) | | | 1 | | | | 13 | | | | — | | | | — | | | | — | | | | 14 | | | | — | | | | 14 | |
Stock-based compensation, net of tax benefit | | | 4 | | | | 104 | | | | — | | | | — | | | | — | | | | 108 | | | | — | | | | 108 | |
Changes in Williams Partners L.P. ownership interest, net | | | — | | | | 30 | | | | — | | | | — | | | | — | | | | 30 | | | | (30 | ) | | | — | |
Distribution of WPX Energy, Inc. to shareholders (Note 2) | | | — | | | | — | | | | (5,261 | ) | | | (219 | ) | | | — | | | | (5,480 | ) | | | (81 | ) | | | (5,561 | ) |
Other | | | 1 | | | | 1 | | | | — | | | | — | | | | — | | | | 2 | | | | (1 | ) | | | 1 | |
| | | | | | | | | | | | | | | | | | | | | | | | | | | | | | | | |
Balance, December 31, 2011 | | $ | 626 | | | $ | 8,417 | | | $ | (5,820 | ) | | $ | (389 | ) | | $ | (1,041 | ) | | $ | 1,793 | | | $ | 1,290 | | | $ | 3,083 | |
| | | | | | | | | | | | | | | | | | | | | | | | | | | | | | | | |
See accompanying notes.
82
THE WILLIAMS COMPANIES, INC.
CONSOLIDATED STATEMENT OF CASH FLOWS
| | | | | | | | | | | | | |
| | | Years Ended December 31, | |
| | | 2008 | | | 2007 | | | 2006 | |
| | | (Millions) | |
| |
| OPERATING ACTIVITIES: | | | | | | | | | | | | |
| Net income | | $ | 1,418 | | | $ | 990 | | | $ | 309 | |
| Adjustments to reconcile to net cash provided by operations: | | | | | | | | | | | | |
| Reclassification of deferred net hedge gains related to sale of power business | | | — | | | | (429 | ) | | | — | |
| Depreciation, depletion and amortization | | | 1,310 | | | | 1,082 | | | | 866 | |
| Provision for deferred income taxes | | | 611 | | | | 370 | | | | 154 | |
| Provision for loss on investments, property and other assets | | | 166 | | | | 162 | | | | 26 | |
| Net (gain) loss on dispositions of assets and business | | | (36 | ) | | | 16 | | | | (23 | ) |
| Gain on sale of contractual production rights | | | (148 | ) | | | — | | | | — | |
| Early debt retirement costs | | | 1 | | | | 19 | | | | 31 | |
| Minority interest in income of consolidated subsidiaries | | | 174 | | | | 90 | | | | 40 | |
| Amortization of stock-based awards | | | 31 | | | | 70 | | | | 44 | |
| Cash provided (used) by changes in current assets and liabilities: | | | | | | | | | | | | |
| Accounts and notes receivable | | | 329 | | | | (122 | ) | | | 386 | |
| Inventories | | | (48 | ) | | | 29 | | | | 31 | |
| Margin deposits and customer margin deposits payable | | | 88 | | | | (135 | ) | | | 98 | |
| Other current assets and deferred charges | | | (76 | ) | | | (10 | ) | | | (30 | ) |
| Accounts payable | | | (343 | ) | | | 26 | | | | (184 | ) |
| Accrued liabilities | | | 7 | | | | (200 | ) | | | (110 | ) |
| Changes in current and noncurrent derivative assets and liabilities | | | (121 | ) | | | 370 | | | | 303 | |
| Other, including changes in noncurrent assets and liabilities | | | (8 | ) | | | (91 | ) | | | (51 | ) |
| | | | | | | | | | | | | |
| Net cash provided by operating activities | | | 3,355 | | | | 2,237 | | | | 1,890 | |
| | | | | | | | | | | | | |
| FINANCING ACTIVITIES: | | | | | | | | | | | | |
| Proceeds from long-term debt | | | 674 | | | | 684 | | | | 1,299 | |
| Payments of long-term debt | | | (665 | ) | | | (806 | ) | | | (777 | ) |
| Proceeds from issuance of common stock | | | 32 | | | | 56 | | | | 34 | |
| Proceeds from sale of limited partner units of consolidated partnerships | | | 362 | | | | 333 | | | | 863 | |
| Tax benefit of stock-based awards | | | 21 | | | | 32 | | | | 16 | |
| Dividends paid | | | (250 | ) | | | (233 | ) | | | (207 | ) |
| Purchase of treasury stock | | | (474 | ) | | | (526 | ) | | | — | |
| Payments for debt issuance costs and amendment fees | | | (4 | ) | | | (4 | ) | | | (37 | ) |
| Premiums paid on early debt retirements and tender offer | | | — | | | | (27 | ) | | | (26 | ) |
| Dividends and distributions paid to minority interests | | | (122 | ) | | | (75 | ) | | | (36 | ) |
| Changes in cash overdrafts | | | — | | | | 52 | | | | (25 | ) |
| Other — net | | | (6 | ) | | | 3 | | | | (1 | ) |
| | | | | | | | | | | | | |
| Net cash provided (used) by financing activities | | | (432 | ) | | | (511 | ) | | | 1,103 | |
| | | | | | | | | | | | | |
| INVESTING ACTIVITIES: | | | | | | | | | | | | |
| Property, plant and equipment: | | | | | | | | | | | | |
| Capital expenditures | | | (3,475 | ) | | | (2,816 | ) | | | (2,509 | ) |
| Net proceeds from dispositions | | | 119 | | | | 12 | | | | 23 | |
| Changes in accounts payable and accrued liabilities | | | 81 | | | | (52 | ) | | | 105 | |
| Purchases of investments/advances to affiliates | | | (111 | ) | | | (60 | ) | | | (49 | ) |
| Purchases of auction rate securities | | | — | | | | (304 | ) | | | (386 | ) |
| Purchase of ARO trust investments | | | (31 | ) | | | — | | | | — | |
| Proceeds from sales of auction rate securities | | | — | | | | 353 | | | | 414 | |
| Proceeds from sale of business | | | 22 | | | | 471 | | | | — | |
| Proceeds from sale of contractual production rights | | | 148 | | | | — | | | | — | |
| Proceeds from dispositions of investments and other assets | | | 41 | | | | 92 | | | | 62 | |
| Proceeds from sale of ARO trust investments | | | 14 | | | | — | | | | — | |
| Other — net | | | 9 | | | | 8 | | | | 19 | |
| | | | | | | | | | | | | |
| Net cash used by investing activities | | | (3,183 | ) | | | (2,296 | ) | | | (2,321 | ) |
| | | | | | | | | | | | | |
| Increase (decrease) in cash and cash equivalents | | | (260 | ) | | | (570 | ) | | | 672 | |
| Cash and cash equivalents at beginning of year | | | 1,699 | | | | 2,269 | | | | 1,597 | |
| | | | | | | | | | | | | |
| Cash and cash equivalents at end of year | | $ | 1,439 | | | $ | 1,699 | | | $ | 2,269 | |
| | | | | | | | | | | | | |
| | | | | | | | | | | | |
| | | Years Ended December 31, | |
| | | 2011 | | | 2010 | | | 2009 | |
| | | (Millions) | |
OPERATING ACTIVITIES: | | | | | | | | | | | | |
Net income (loss) | | $ | 661 | | | $ | (922 | ) | | $ | 361 | |
Adjustments to reconcile to net cash provided by operating activities: | | | | | | | | | | | | |
Depreciation, depletion, and amortization | | | 1,614 | | | | 1,507 | | | | 1,469 | |
Provision (benefit) for deferred income taxes | | | (179 | ) | | | (155 | ) | | | 249 | |
Provision for loss on goodwill, investments, property and other assets | | | 882 | | | | 1,735 | | | | 386 | |
Provision for doubtful accounts and notes | | | 1 | | | | (6 | ) | | | 48 | |
Amortization of stock-based awards | | | 52 | | | | 48 | | | | 43 | |
Early debt retirement costs | | | 271 | | | | 606 | | | | 1 | |
Cash provided (used) by changes in current assets and liabilities: | | | | | | | | | | | | |
Accounts and notes receivable | | | (197 | ) | | | (36 | ) | | | 52 | |
Inventories | | | 60 | | | | (81 | ) | | | 33 | |
Margin deposits and customer margin deposits payable | | | (18 | ) | | | (1 | ) | | | 4 | |
Other current assets and deferred charges | | | (15 | ) | | | 43 | | | | 7 | |
Accounts payable | | | 250 | | | | (14 | ) | | | 5 | |
Accrued liabilities | | | 51 | | | | (29 | ) | | | (170 | ) |
Changes in current and noncurrent derivative assets and liabilities | | | 7 | | | | (42 | ) | | | 36 | |
Other, including changes in noncurrent assets and liabilities | | | (1 | ) | | | (2 | ) | | | 48 | |
| | | | | | | | | | | | |
Net cash provided by operating activities | | | 3,439 | | | | 2,651 | | | | 2,572 | |
| | | | | | | | | | | | |
FINANCING ACTIVITIES: | | | | | | | | | | | | |
Proceeds from long-term debt | | | 3,172 | | | | 5,129 | | | | 595 | |
Payments of long-term debt | | | (2,055 | ) | | | (4,305 | ) | | | (33 | ) |
Proceeds from sale of limited partner units of consolidated partnership | | | — | | | | 806 | | | | — | |
Dividends paid | | | (457 | ) | | | (284 | ) | | | (256 | ) |
Dividends and distributions paid to noncontrolling interests | | | (214 | ) | | | (145 | ) | | | (129 | ) |
Cash of WPX Energy, Inc. at spin-off | | | (526 | ) | | | — | | | | — | |
Payments for debt issuance costs | | | (50 | ) | | | (71 | ) | | | (7 | ) |
Premiums paid on early debt retirements | | | (254 | ) | | | (574 | ) | | | — | |
Changes in restricted cash | | | — | | | | — | | | | 40 | |
Other – net | | | 42 | | | | 17 | | | | (44 | ) |
| | | | | | | | | | | | |
Net cash provided (used) by financing activities | | | (342 | ) | | | 573 | | | | 166 | |
| | | | | | | | | | | | |
INVESTING ACTIVITIES: | | | | | | | | | | | | |
Capital expenditures(1) | | | (2,796 | ) | | | (2,788 | ) | | | (2,387 | ) |
Purchases of investments/advances to affiliates | | | (233 | ) | | | (488 | ) | | | (142 | ) |
Purchase of businesses | | | (41 | ) | | | (1,099 | ) | | | — | |
Distribution from Gulfstream Natural Gas System, L.L.C. | | | — | | | | — | | | | 148 | |
Other – net | | | 67 | | | | 79 | | | | 71 | |
| | | | | | | | | | | | |
Net cash used by investing activities | | | (3,003 | ) | | | (4,296 | ) | | | (2,310 | ) |
| | | | | | | | | | | | |
Increase (decrease) in cash and cash equivalents | | | 94 | | | | (1,072 | ) | | | 428 | |
Cash and cash equivalents at beginning of year(2) | | | 795 | | | | 1,867 | | | | 1,439 | |
| | | | | | | | | | | | |
Cash and cash equivalents at end of year(2) | | $ | 889 | | | $ | 795 | | | $ | 1,867 | |
| | | | | | | | | | | | |
| | | | | | | | | | | | |
(1) Increases to property, plant, and equipment | | $ | (2,953 | ) | | $ | (2,755 | ) | | $ | (2,314 | ) |
Changes in related accounts payable and accrued liabilities | | | 157 | | | | (33 | ) | | | (73 | ) |
| | | | | | | | | | | | |
Capital expenditures | | $ | (2,796 | ) | | $ | (2,788 | ) | | $ | (2,387 | ) |
| | | | | | | | | | | | |
(2) | Except for cash and cash equivalents at end of year 2011, includes cash from our former exploration and production business (See Note 2). |
See accompanying notes.
84
83
THE WILLIAMS COMPANIES, INC.
NOTES TO CONSOLIDATED FINANCIAL STATEMENTS
| |
Note 1. | Description of Business, Basis of Presentation, and Summary of Significant Accounting Policies |
Description of Business, Basis of Presentation, and Summary of Significant Accounting PoliciesDescription of Business
Operations of our companyOur operations are located principally in the United States and are organized into the following reporting segments: ExplorationWilliams Partners and Midstream Canada & Production, Gas Pipeline, Midstream Gas & Liquids (Midstream),Olefins. All remaining business activities are included in Other.
Williams Partners consists of our consolidated master limited partnership, Williams Partners L.P. (WPZ) and Gas Marketing Services (Gas Marketing).
Exploration & Production includes natural gas development, productionpipeline and domestic midstream businesses. The gas management activities primarily in the Rocky Mountain and Mid-Continent regionspipeline businesses include 100 percent of the United States and oil and natural gas interests in Argentina.
Gas Pipeline is comprised primarily of two interstate natural gas pipelines, as well as investments in natural gas pipeline-related companies. Gas Pipeline includes Northwest Pipeline GP (Northwest Pipeline), which extends from the San Juan basin in northwestern New Mexico and southwestern Colorado to Oregon and Washington, and Transcontinental Gas Pipe Line Company, LLC (Transco), formerly Transcontinental Gas Pipe Line Corporation, which extends from the Gulf100 percent of Mexico region to the northeastern United States. In addition, we own a 50Northwest Pipeline GP (Northwest Pipeline), and 49 percent interest inof Gulfstream Natural Gas System, L.L.C. (Gulfstream). Gulfstream is a natural gas pipeline system extending from the Mobile Bay area in Alabama to markets in Florida.
Midstream is comprisedWPZ’s midstream operations are composed of
natural gas gathering and processing and treating facilitiessignificant, large-scale operations in the Rocky Mountain and Gulf Coast regions,
of the United States, oiloperations in Pennsylvania’s Marcellus Shale region, and various equity investments in domestic natural gas gathering and
processing assets and natural gas liquid (NGL) fractionation and transportation
facilitiesassets. WPZ’s midstream assets also include substantial operations and investments in the
Gulf CoastFour Corners region,
of the United States, majority-owned natural gas compressionas well as an NGL fractionator and storage facilities
in Venezuela, and assets innear Conway, Kansas.Our Midstream Canada consisting primarily of a natural gas liquids extraction& Olefins segment includes our oil sands off-gas processing plant near Fort McMurray, Alberta, our NGL/olefin fractionation facility and a fractionation plant.
Gas Marketing primarily supportsbutylene/butane splitter facility at Redwater, Alberta, our
natural gas businesses by providing marketingNGL light-feed olefins cracker in Geismar, Louisiana, along with associated ethane and
risk management services, which include marketingpropane pipelines, and
hedging the gas produced by Exploration & Production, and procuring fuel and shrink gas and hedging natural gas liquids sales for Midstream. Gas Marketing also provides similar services to third parties, suchour refinery grade splitter in Louisiana.Other includes other business activities that are not operating segments, as producers. In addition, Gas Marketing manages various natural gas-related contracts suchwell as transportation, storage, related hedges and proprietary trading positions.
corporate operations.Basis of Presentation
In May 2011, we contributed a 24.5 percent interest in Gulfstream to WPZ in exchange for aggregate consideration of $297 million of cash, 632,584 limited partner units, and an increase in the capital account of its general partner to allow us to maintain our 2 percent general partner interest. Williams Partners now holds a 49 percent interest in Gulfstream. We also own an additional 1 percent interest in Gulfstream reported in Other. Prior period amounts reported for Exploration & Productionsegment disclosures have not been adjusted to reflectfor this transaction as the presentationimpact, which was less than 2.5 percent of certain revenues and costs on a net basis. These adjustments reducedrevenuesand reducedcosts and operating expensesby the same amount, with no net impact onWilliams Partners’ segment profit. The reductions were $72 million in 2007 and $77 million in 2006.
Discontinued operations
In accordance with the provisionsprofit for all periods affected, was not material. Equity earnings related to
discontinued operations within Statement of Financial Accounting Standards (SFAS) No. 144, “Accountingthis interest in Gulfstream that have not been recast for the
Impairmentyears ended December 31, 2011, 2010, and 2009 are $12 million, $32 million, and $30 million, respectively.Master limited partnership
At December 31, 2011, we own approximately 75 percent of the interests in WPZ, including the interests of the general partner, which are wholly owned by us, and incentive distribution rights.
WPZ is self funding and maintains separate lines of bank credit and cash management accounts. Cash distributions from WPZ to us, including any associated with our incentive distribution rights, occur through the normal partnership distributions from WPZ to all partners.
Discontinued operations
WPX separation
On December 31, 2011, we completed the tax-free spin-off of our 100 percent interest in WPX Energy, Inc. (WPX), to our shareholders. WPX was formed in April 2011 to hold our former exploration and production business. The spin-off was completed by means of a special stock dividend, which consisted of a distribution of one share of WPX common stock for every three shares of our common stock.
84
THE WILLIAMS COMPANIES, INC.
NOTES TO CONSOLIDATED FINANCIAL STATEMENTS – (Continued)
On December 30, 2011, we entered into a Separation and Distribution Agreement with WPX which at the time was a wholly owned subsidiary, pursuant to which WPX would be legally and structurally separated from us. In addition to, and concurrently with, this agreement, we entered into certain ancillary agreements with WPX, including, (i) an Employee Matters Agreement that sets forth agreements as to certain employment, compensation, and benefits matters, (ii) a Tax Sharing Agreement that governs rights and obligations after the spin-off with respect to matters regarding U.S. Federal, state, local, and foreign income taxes and other taxes, including tax liabilities and benefits, attributes, returns, and contests, and (iii) a Transition Services Agreement under which we or Disposalcertain of Long-Lived Assets” (SFAS No. 144),our subsidiaries will provide WPX with certain services for a limited time to help ensure an orderly transition following the Distribution Date.
For periods prior to the spin-off, the accompanying consolidated financial statements and notes reflect the results of operations and financial position of our former powerexploration and production business as discontinued operations. At December 31, 2011, all net assets of our former exploration and production business have been removed from our consolidated balance sheet as the spin-off was complete. (See Note 2.) These operations included a 7,500-megawatt portfolio of power-related contracts that was sold in 2007 and our natural gas-fired electric generating plant located in Hazleton, Pennsylvania (Hazleton) that was sold in March 2008, in addition to other power-related assets.
Unless indicated otherwise, the information in the Notes to the Consolidatedconsolidated Financial Statements relates to our continuing operations.
Master limited partnershipsAccounting standards issued but not yet adopted
In June 2011, the FASB issued Accounting Standards Update No. 2011-5, “Comprehensive Income (Topic 220) Presentation of Comprehensive Income” (ASU 2011-5). ASU 2011-5 requires presentation of net income and other comprehensive income either in a single continuous statement or in two separate, but consecutive, statements. ASU 2011-5 requires separate presentation in both net income and other comprehensive income of reclassification adjustments for items that are reclassified from other comprehensive income to net income. The new guidance does not change the items reported in other comprehensive income, nor affect how earnings per share is calculated and presented. We currently own approximately 23.6 percentreport net income in the Consolidated Statement of Williams Partners L.P.,Operations and report other comprehensive income in the Consolidated Statement of Changes in Equity. In December 2011, The FASB issued Accounting Standards Update No. 2011-12, “Comprehensive Income (Topic 220) Deferral of the Effective Date for Amendments to the Presentation of Reclassifications of Items Out of Accumulated Other Comprehensive Income in Accounting Standards Update No. 2011-05” (ASU 2011-12). ASU 2011-12 defers the effective date for only the presentation requirements related to reclassifications in ASU 2011-5. During this deferral period, ASU 2011-12 states that we should continue to report reclassifications out of accumulated other comprehensive income consistent with the presentation requirements in effect before ASU 2011-05. All other requirements in ASU 2011-05 are not affected by ASU 2011-12, including the interestsrequirement to report comprehensive income either in a single continuous financial statement or in two separate but consecutive financial statements. Both standards are effective beginning the first quarter of 2012, with retrospective application to prior periods. We will apply the general partner, which is wholly owned by us, and incentive distribution rights. Considering the presumption of control of
85
THE WILLIAMS COMPANIES, INC.
NOTES TO CONSOLIDATED FINANCIAL STATEMENTS — (Continued)
the general partner in accordance with Emerging Issues Task Force (EITF) IssueNo. 04-5, “Determining Whether a General Partner, or the General Partners as a Group, Controls a Limited Partnership or Similar Entity When the Limited Partners Have Certain Rights,” we consolidate Williams Partners L.P. within our Midstream segment.
In January 2008, Williams Pipeline Partners L.P. completed its initial public offering of 16.25 million common units at a price of $20 per unit. In February 2008, the underwriters exercised their right to purchase an additional 1.65 million common units at the same price. The initial asset of the partnership is a 35 percent interest in Northwest Pipeline. Upon completion of these transactions, we now own approximately 47.7 percent of the interests in Williams Pipeline Partners L.P., including the interests of the general partner, which is wholly owned by us, and incentive distribution rights. In accordance with EITF IssueNo. 04-5, we consolidate Williams Pipeline Partners L.P. within our Gas Pipeline segment due to our control through the general partner.
Summary of Significant Accounting Policies
Principles of consolidation
The consolidated financial statements include the accounts of our corporate parent and our majority-owned or controlled subsidiaries and investments. We apply the equity method of accounting for investments in unconsolidated companies in which we and our subsidiaries own 20 to 50 percent of the voting interest, or otherwise exercise significant influence over operating and financial policies of the company.
company, or where majority ownership does not provide us with control due to significant participatory rights of other owners.85
THE WILLIAMS COMPANIES, INC.
NOTES TO CONSOLIDATED FINANCIAL STATEMENTS – (Continued)
Use of estimates
The preparation of financial statements in conformity with accounting principles generally accepted in the United States requires management to make estimates and assumptions that affect the amounts reported in the consolidated financial statements and accompanying notes. Actual results could differ from those estimates.
Significant estimates and assumptions include:
Impairment assessments of investments and long-lived assets;
Litigation-related contingencies;
| | |
| • | Impairment assessments of investments, long-lived assets and goodwill; |
|
| • | Litigation-related contingencies; |
|
| • | Valuations of derivatives; |
|
| • | Hedge accounting correlations and probability; |
|
| • | Environmental remediation obligations; |
|
| • | Realization of deferred income tax assets; |
|
| • | Valuation of Exploration & Production’s reserves; |
|
| • | Asset retirement obligations; |
|
| • | Pension and postretirement valuation variables. |
Environmental remediation obligations;
Realization of deferred income tax assets;
Asset retirement obligations;
Pension and postretirement valuation variables.
These estimates are discussed further throughout these notes.
Regulatory accounting
Transco and Northwest Pipeline are regulated by the Federal Energy Regulatory Commission (FERC). Their rates established by the FERC are designed to recover the costs of providing the regulated services, and their competitive environment makes it probable that such rates can be charged and collected. Therefore, our management has determined that it is appropriate to account for and report regulatory assets and liabilities related to these operations consistent with the economic effect of the way in which their rates are established. Accounting for these businesses that are regulated can differ from the accounting requirements for nonregulated businesses. The components of our regulatory assets and liabilities relate to the effects of deferred taxes on equity funds used during construction, asset retirement obligations, fuel cost differentials, levelized incremental depreciation, negative salvage, and postretirement benefits.
Cash and cash equivalents
OurcashCash and cash equivalentsbalance includes amounts primarily invested in funds with high-quality, short-term securities and instruments that are issued or guaranteed by the U.S. government. These have maturity dates of three months or less when acquired.
86
THE WILLIAMS COMPANIES, INC.
NOTES TO CONSOLIDATED FINANCIAL STATEMENTS — (Continued)
Restricted cash
Current restricted cash is included inother current assets and deferred chargesin the Consolidated Balance Sheet and consists primarily of collateral required by certain loan agreements for our Venezuelan operations, and escrow accounts established to fund payments required by our California settlement. (See Note 16.) Noncurrent restricted cash is included inother assets and deferred chargesin the Consolidated Balance Sheet and relates primarily to certain borrowings by our Venezuelan operations as previously mentioned and letters of credit. We do not expect this cash to be released within the next twelve months. The current and noncurrent restricted cash is primarily invested in short-term money market accounts with financial institutions.
The classification of restricted cash is determined based on the expected term of the collateral requirement and not necessarily the maturity date of the investment.
Auction rate securities
An auction rate security is an instrument with a long-term underlying maturity, but for which an auction is conducted periodically, as specified, to reset the interest rate and allow investors to buy or sell the instrument. Our Consolidated Statement of Cash Flows reflects the gross amount of thepurchases of auction rate securitiesand theproceeds from sales of auction rate securities. At December 31, 2008, we are no longer purchasing auction rate securities. Our remaining auction rate securities balance as of December 31, 2008, was $7 million.
Accounts receivable
Accounts receivableAccounts receivable are carried on a gross basis, with no discounting, less the allowance for doubtful accounts. We estimate the allowance for doubtful accounts based on existing economic conditions, the financial conditions of theour customers, and the amount and age of past due accounts. Receivables are consideredWe consider receivables past due if full payment is not received by the contractual due date. Interest income related to past due accounts receivable is generally recognized at the time full payment is received or collectibilitycollectability is assured. Past due accounts are generally written off against the allowance for doubtful accounts only after all collection attempts have been exhausted.
Allinventoriesare stated at the lower of cost or market. The cost of inventories is primarily determined using the average-cost method. We determine the cost of certain natural gas inventories held by Transco using thelast-in, first-out (LIFO) cost method. We determine the cost of the remaining inventories primarily using the average-cost method.There was no LIFO inventory at December 31, 2008,2011. LIFO inventory at December 31, 2010 was $11$9 million.
86
Property, plant and equipmentTHE WILLIAMS COMPANIES, INC.
NOTES TO CONSOLIDATED FINANCIAL STATEMENTS – (Continued)
Property, plant, and equipment
Property, plant, and equipment is recorded at cost. We base the carrying value of these assets on estimates, assumptions, and judgments relative to capitalized costs, useful lives, and salvage values.
As regulated entities, Northwest Pipeline and Transco provide for depreciation using the straight-line method at Federal Energy Regulatory Commission (FERC)-prescribedFERC-prescribed rates. See Note 9 for depreciation rates used for major regulated gas plant facilities.
Depreciation for nonregulated entities is provided primarily on the straight-line method over estimated useful lives, except as noted below for oil and gas exploration and production activities. Seecertain offshore facilities that apply a declining balance method. (See Note 9 for the estimated useful lives associated with our nonregulated assets.
9.)Gains or losses from the ordinary sale or retirement of property, plant, and equipment for regulated pipelines are credited or charged to accumulated depreciation; other gains or losses are recorded inother (income) expense — netincluded inoperating income (loss) orother (income) expense — netbelowoperating income (loss).
87
THE WILLIAMS COMPANIES, INC.
NOTES TO CONSOLIDATED FINANCIAL STATEMENTS — (Continued)
Ordinary maintenance and repair costs are generally expensed as incurred. Costs of major renewals and replacements are capitalized asproperty, plant, and equipment— net.
Oil and gas exploration and production activities are accounted for under the successful efforts method. Costs incurred in connection with the drilling and equipping of exploratory wells, as applicable, are capitalized as incurred. If proved reserves are not found, such costs are charged to expense. Other exploration costs, including lease rentals, are expensed as incurred. All costs related to development wells, including related production equipment and lease acquisition costs, are capitalized when incurred.Depreciation, depletion and amortizationis provided under the units of production method on a field basis.
equipment.We record an asset and a liability upon incurrence equal to the present value of each expected future asset retirement obligation (ARO). at the time the liability is initially incurred, typically when the asset is acquired or constructed. The ARO asset is depreciated in a manner consistent with the depreciation of the underlying physical asset. As regulated entities, Northwest Pipeline and Transco record the ARO asset depreciation offset to a regulatory asset. We measure changes in the liability due to passage of time by applying an interest method of allocation. This amount is recognized as an increase in the carrying amount of the liability and as a corresponding accretion expense included inother (income) expense— netincluded incosts and operating incomeexpenses, except for regulated entities, for which the liability is offset by a regulatory asset.
Goodwill
Goodwillrepresents the excessasset as management expects to recover amounts in future rates. The regulatory asset is amortized commensurate with our collection of
cost over fair valuethose costs in rates.Measurements of the assetsAROs include, as a component of businesses acquired. It is evaluated annually for impairment by first comparing our management’sfuture expected costs, an estimate of the fair value ofprice that a reporting unit with its carrying value,third party would demand, and could expect to receive, for bearing the uncertainties inherent in the obligations, sometimes referred to as a market-risk premium.
Contingent liabilities
We record liabilities for estimated loss contingencies, including goodwill. If the carrying value of the reporting unit exceeds its fair value,environmental matters, when we assess that a computation of the implied fair value of the goodwill is compared with its related carrying value. If the carrying value of the reporting unit goodwill exceeds the implied fair value of that goodwill, an impairment loss is recognized inprobable and the amount of the excess. We havegoodwillloss can be reasonably estimated. These liabilities are calculated based upon our assumptions and estimates with respect to the likelihood or amount of approximately $1 billion at December 31, 2008loss and 2007, attributable to our Exploration & Production segment.
When a reporting unit is soldupon advice of legal counsel, engineers, or
classified as held for sale, any goodwill of that reporting unit is included in its carrying value for purposes of determining any impairment or gain/loss on sale. If a portion of a reporting unit with goodwill is sold or classified as held for sale and that asset group represents a business, a portionother third parties regarding the probable outcomes of the
reporting unit’s goodwill is allocatedmatters. These calculations are made without consideration of any potential recovery from third-parties. We recognize insurance recoveries or reimbursements from others when realizable. Revisions to
these liabilities are generally reflected in income when new or different facts or information become known or circumstances change that affect the previous assumptions or estimates.Cash flows from revolving credit facilities
Proceeds and includedpayments related to borrowings under our credit facilities are reflected in the carrying value of that asset group. Nonefinancing activities of the operations sold during the periods reported represented reporting units with goodwill or businesses within reporting units to which goodwill was required to be allocated.
Judgments and assumptions are inherent in our management’s estimateConsolidated Statement of future cash flows used to determine the estimate of the reporting unit’s fair value. The use of alternate judgmentsand/or assumptions could result in the recognition of different levels of impairment charges in the financial statements.
Subsequent to December 31, 2008, asCash Flows on a result of overall market and energy commodity price declines, we have witnessed periodic reductions in our total market capitalization below our December 31, 2008, consolidated stockholders’ equity balance. If our total market capitalization is below our consolidated stockholders’ equity balance at a future reporting date, we consider this an indicator of potential impairment of goodwill under recent SEC communications and our accounting considerations. We utilize market capitalization in corroborating our assessment of the fair value of our Exploration & Production reporting unit. Considering this, it is reasonably possible that we may be required to conduct an interim goodwill impairment evaluation, which could result in a material impairment of our goodwill.
gross basis.87
Treasury stockTHE WILLIAMS COMPANIES, INC.
NOTES TO CONSOLIDATED FINANCIAL STATEMENTS – (Continued)
Treasury stock
Treasury stock purchases are accounted for under the cost method whereby the entire cost of the acquired stock is recorded as treasury stock. Gains and losses on the subsequent reissuance of shares are credited or charged tocapital in excess of par valueusing the average-cost method.
88
THE WILLIAMS COMPANIES, INC.
NOTES TO CONSOLIDATED FINANCIAL STATEMENTS — (Continued)
Derivative instruments and hedging activities
We may utilize derivatives to manage a portion of our commodity price risk. These instruments consist primarily of futures contracts, swap agreements option contracts, and forward contracts involving short- and long-term purchases and sales of a physical energy commodity.
commodities. We report the fair value of derivatives, except for those for which the normal purchases and normal sales exception has been elected, on the Consolidated Balance Sheet inderivativeother current assets and deferred charges; regulatory assets, deferred charges, and other; accrued liabilities; orregulatory liabilities, deferred income, andderivative liabilities otheras either current or noncurrent.. We determine the current and noncurrent classification based on the timing of expected future cash flows of individual contracts.trades. We report these amounts on a gross basis. Additionally, we report cash collateral receivables and payables with our counterparties on a gross basis.
The accounting for the changes in the fair value of a commodity derivative is governed by SFAS No. 133, “Accounting for Derivative Instruments and Hedging Activities,” (SFAS No. 133), as amended and depends on whether the derivative has been designated in a hedging relationship and whether we have elected the normal purchases and normal sales exception. The accounting for the change in fair value can be summarized as follows:
| | |
Derivative Treatment | | Accounting Method |
Derivative Treatment
| | Accounting Method
|
|
Normal purchases and normal sales exception | | Accrual accounting |
Designated in a qualifying hedging relationship | | Hedge accounting |
All other derivatives | | Mark-to-market accounting |
We may elect the normal purchases and normal sales exception for certain short- and long-term purchases and sales of a physical energy commodity.commodities. Under accrual accounting, any change in the fair value of these derivatives is not reflected on the balance sheet after the initial election of the exception.
We have also designated a hedging relationship for certain commodity derivatives. For a derivative to qualify for designation in a hedging relationship, it must meet specific criteria and we must maintain appropriate documentation. We establish hedging relationships pursuant to our risk management policies. We evaluate the hedging relationships at the inception of the hedge and on an ongoing basis to determine whether the hedging relationship is, and is expected to remain, highly effective in achieving offsetting changes in fair value or cash flows attributable to the underlying risk being hedged. We also regularly assess whether the hedged forecasted transaction is probable of occurring. If a derivative ceases to be or is no longer expected to be highly effective, or if we believe the likelihood of occurrence of the hedged forecasted transaction is no longer probable, hedge accounting is discontinued prospectively, and future changes in the fair value of the derivative are recognized currently inrevenues orcosts and operating expenses.
For commodity derivatives designated as a cash flow hedge, the effective portion of the change in fair value of the derivative is reported inaccumulated other comprehensive income (loss)(AOCI) and reclassified into earnings in the period in which the hedged item affects earnings. Any ineffective portion of the derivative’s change in fair value is recognized currently inrevenuesorcosts and operating expenses. Gains or losses deferred inaccumulated other comprehensive loss AOCI associated with terminated derivatives, derivatives that cease to be highly effective hedges, derivatives for which the forecasted transaction is reasonably possible but no longer probable of occurring, and cash flow hedges that have been otherwise discontinued remain inaccumulated other comprehensive loss AOCI until the hedged item affects earnings. If it becomes probable that the forecasted transaction designated as the hedged item in a cash flow hedge will not occur, any gain or loss deferred inaccumulated other comprehensive loss AOCI is recognized inrevenuesorcosts and operating expensesat that time. The change in likelihood of a forecasted transaction is a judgmental decision that includes qualitative assessments made by management.
88
THE WILLIAMS COMPANIES, INC.
NOTES TO CONSOLIDATED FINANCIAL STATEMENTS – (Continued)
For commodity derivatives that are not designated in a hedging relationship, and for which we have not elected the normal purchases and normal sales exception, we report changes in fair value currently inrevenues.
89
THE WILLIAMS COMPANIES, INC.
NOTES TO CONSOLIDATED FINANCIAL STATEMENTS — (Continued)
Certain gains and losses on derivative instruments included in the Consolidated Statement of
IncomeOperations are netted together to a single net gain or loss, while other gains and losses are reported on a gross basis. Gains and losses recorded on a net basis include:
Unrealized gains and losses on all derivatives that are not designated as hedges and for which we have not elected the normal purchases and normal sales exception;
The ineffective portion of unrealized gains and losses on derivatives that are designated as cash flow hedges;
| | |
| • | Unrealized gains and losses on all derivatives that are not designated as hedges and for which we have not elected the normal purchases and normal sales exception; |
|
| • | The ineffective portion of unrealized gains and losses on derivatives that are designated as cash flow hedges; |
|
| • | Realized gains and losses on all derivatives that settle financially; |
|
| • | Realized gains and losses on derivatives held for trading purposes; |
|
| • | Realized gains and losses on derivatives entered into as a pre-contemplated buy/sell arrangement. |
Realized gains and losses on all derivatives that settle financially other than natural gas derivatives for NGL processing activities;
Realized gains and losses on derivatives entered into as a pre-contemplated buy/sell arrangement.
Realized gains and losses on derivatives that require physical delivery, as well as natural gas derivatives for NGL processing activities and which are not held for trading purposes nor were entered into as a pre-contemplated buy/sell arrangement, are recorded on a gross basis. In reaching our conclusions on this presentation, we evaluated the indicators in EITF IssueNo. 99-19 “Reporting Revenue Gross as a Principal versus as an Agent,” includingconsidered whether we act as principal in the transaction; whether we have the risks and rewards of ownership, including credit risk; and whether we have latitude in establishing prices.
Gas Pipeline revenuesRevenues
Gas Pipeline revenuesRevenues from Williams Partners’ gas pipeline businesses are primarily from services pursuant to long-term firm transportation and storage agreements. These agreements provide for a demandreservation charge based on the volume of contracted capacity and a commodity charge based on the volume of gas delivered, both at rates specified in our FERC tariffs. We recognize revenues for demandreservation charges ratably over the contract period regardless of the volume of natural gas that is transported or stored. Revenues for commodity charges, from both firm and interruptible transportation services, and storage injection and withdrawal services, are recognized when natural gas is delivered at the agreed upon delivery point or when natural gas is injected or withdrawn from the storage facility.
In the course of providing transportation services to customers, we may receive different quantities of gas from shippers than the quantities delivered on behalf of those shippers. The resulting imbalances are primarily settled through the purchase and sale of gas with our customers under terms provided for in our FERC tariffs. Revenue is recognized from the sale of gas upon settlement of the transportation and exchange imbalances.
As a result of the ratemaking process, certain revenues collected by us may be subject to possible refunds upon the issuance of final orders by the FERC in pending rate proceedings with the FERC.proceedings. We record estimates of rate refund liabilities considering our and other third-party regulatory proceedings, advice of counsel, and estimated total exposure, as discounted and risk weighted, as well as collection and other risks.
Exploration & Production revenues
Revenues from the domestic production ofWilliams Partners’ midstream operations include those derived from natural gas in properties for which Exploration & Production has an interest with other producers are recognized based on the actual volumes sold during the period. Any differences between volumes sold and entitlement volumes, based on Exploration & Production’s net working interest, that are determined to be nonrecoverable through remaining production are recognized as accounts receivable or accounts payable, as appropriate. Cumulative differences between volumes sold and entitlement volumes are not significant.
Midstream revenues
Natural gas gathering and processing services and are performed under volumetric-based fee contracts, keep-whole, agreements and percent-of-liquids arrangements. Revenues under volumetric-based fee contracts are
90
THE WILLIAMS COMPANIES, INC.
NOTES TO CONSOLIDATED FINANCIAL STATEMENTS — (Continued)
recorded when services have been performed. Under keep-whole and percent-of-liquids processing contracts, we retain the rights to all or a portion of the natural gas liquids (NGLs)NGLs extracted from the producers’ natural gas stream and recognize revenues when the extracted NGLs are sold and delivered.
We89
THE WILLIAMS COMPANIES, INC.
NOTES TO CONSOLIDATED FINANCIAL STATEMENTS – (Continued)
Oil gathering and transportation revenues and offshore production handling fees of Williams Partners’ midstream operations are recognized when the services have olefins extractionbeen performed. Certain offshore production handling contracts contain fixed payment terms that result in the deferral of revenues until such services have been performed.
Within Williams Partners, we market NGLs that we purchase from our producer customers as part of the overall service provided to producers. Revenues from marketing NGLs are recognized when the products have been sold and delivered.
Storage revenues under prepaid contracted storage capacity contracts primarily within Williams Partners are recognized evenly over the life of the contract as services are provided.
Our midstream Canada business has processing and fractionation operations where we retain certain products extractedNGLs and olefins from the producers’an upgrader’s off-gas stream and we recognize revenues when the extractedfractionated products are sold and delivered to our purchasers. We also producedelivered. Our domestic olefins business produces olefins from purchased feed-stock, and we recognize revenues when the olefins are sold and delivered.
We also market NGLs and olefins. Revenues from marketing NGLs and olefins are recognized when the products have been sold and delivered.
Revenues for sales of natural gas are recognized when the product is sold and delivered.
All other revenues
Revenues generally are recorded when services are performed or products have been delivered.
Impairment of long-lived assets and investments
We evaluate theour long-lived assets of identifiable business activities for impairment when events or changes in circumstances indicate, in our management’s judgment, that the carrying value of such assets may not be recoverable. Except for proved and unproved properties discussed below, whenWhen an indicator of impairment has occurred, we compare our management’s estimate of undiscounted future cash flows attributable to the assets to the carrying value of the assets to determine whether an impairment has occurred and we apply a probability-weighted approach to consider the likelihood of different cash flow assumptions and possible outcomes including selling in the near term or holding for the remaining estimated useful life. If an impairment of the carrying value has occurred, we determine the amount of the impairment recognized in the financial statements by estimating the fair value of the assets and recording a loss for the amount that the carrying value exceeds the estimated fair value.
For assets identified to be disposed of in the future and considered held for sale, in accordance with SFAS No. 144, we compare the carrying value to the estimated fair value less the cost to sell to determine if recognition of an impairment is required. Until the assets are disposed of, the estimated fair value, which includes estimated cash flows from operations until the assumed date of sale, is recalculated when related events or circumstances change.
Proved properties, including developed and undeveloped, are assessed for impairment using estimated future undiscounted cash flows on a field basis. If the undiscounted cash flows are less than the book value of the assets, then a subsequent analysis is performed using discounted cash flows. Estimating future cash flows involves the use of complex judgments such as estimation of the proved and unproven oil and gas reserve quantities, risk associated with the different categories of oil and gas reserves, timing of development and production, expected future commodity prices, capital expenditures, and production costs.
Unproved properties include lease acquisition costs and costs of acquired unproven reserves. Individually significant lease acquisition costs are assessed annually, or as conditions warrant, for impairment considering our future drilling plans, the remaining lease term and recent drilling results. Lease acquisition costs that are not individually significant are aggregated, and the portion of such costs estimated to be nonproductive, based on historical experience or other information, is amortized over the average holding period. A majority of the costs of acquired unproven reserves are associated with areas to which proved developed producing reserves are also attributed. Generally, economic recovery of unproven reserves in such areas is not yet supported by actual production or conclusive formation tests, but may be confirmed by our continuing development program. Ultimate recovery of potentially recoverable reserves in areas with established production generally has greater probability
91
THE WILLIAMS COMPANIES, INC.
NOTES TO CONSOLIDATED FINANCIAL STATEMENTS — (Continued)
than in areas with limited or no prior drilling activity. Costs of acquired unproven reserves are assessed annually, or as conditions warrant, for impairment using estimated future discounted cash flows on a field basis and considering our future drilling plans. If the unproved properties are determined to be productive, the appropriate related costs are transferred to proved oil and gas properties.
We evaluate our investments for impairment when events or changes in circumstances indicate, in our management’s judgment, that the carrying value of such investments may have experienced an other-than-temporary decline in value. When evidence of loss in value has occurred, we compare our estimate of fair value of the investment to the carrying value of the investment to determine whether an impairment has occurred. If the estimated fair value is less than the carrying value and we consider the decline in value to be other-than-temporary, the excess of the carrying value over the fair value is recognized in the consolidated financial statements as an impairment.
impairment charge.Judgments and assumptions are inherent in our management’s estimate of undiscounted future cash flows and an asset’s or investment’s fair value. Additionally, judgment is used to determine the probability of sale with respect to assets considered for disposal. The use of alternate judgments
and/orInterest capitalized assumptions could result in the recognition of different levels of impairment charges in the consolidated financial statements.
Capitalization of interest
We capitalize interest during construction on major projects with construction periods of at least three months and a total project cost in excess of $1 million. Interest is capitalized on borrowed funds and where
90
THE WILLIAMS COMPANIES, INC.
NOTES TO CONSOLIDATED FINANCIAL STATEMENTS – (Continued)
regulation by the FERC exists, on internally generated funds as a component offunds. The latter is included inother income (expense) — net belownetoperating income (loss). The rates used by regulated companies are calculated in accordance with FERC rules. Rates used by nonregulated companies are based on the average interest rate on debt.
Employee stock-based awards
CompensationStock options are valued at the date of award, which does not precede the approval date, and compensation cost is recognized on a straight-line basis, net of estimated forfeitures, over the requisite service period. The purchase price per share for share-based awards is basedstock options may not be less than the market price of the underlying stock on the date of grant. Stock options generally become exercisable over a three-year period from the date of grant and can be subject to accelerated vesting if certain future stock prices or specific financial performance targets are achieved. Stock options generally expire ten years after the grant.
Restricted stock units are generally valued at market value on the grant date fair value. Total stock-basedand generally vest over three years. Restricted stock unit compensation expense for the years ending December 31, 2008, 2007, and 2006, was $31 million, $70 million and $44 million, respectively, of which $1 million, $9 million and $3 million, respectively, is included inincome (loss) from discontinued operations. Measured but unrecognized stock-based compensation expense at December 31, 2008, was approximately $57 million, which does not include the effectcost, net of estimated forfeitures, of $3 million. This amount is comprised of approximately $7 million related to stock options and approximately $50 million related to restricted stock units. These amounts are expected to begenerally recognized over the vesting period on a weighted-average period of 1.8 years.
straight-line basis.Income taxes
We include the operations of our subsidiaries in our consolidated tax return. Deferred income taxes are computed using the liability method and are provided on all temporary differences between the financial basis and the tax basis of our assets and liabilities. Our management’s judgment and income tax assumptions are used to determine the levels, if any, of valuation allowances associated with deferred tax assets.
Effective with the spin-off of WPX on December 31, 2011, certain state and federal tax attributes (primarily alternative minimum tax credits) will be allocated between us and WPX pursuant to the consolidated return regulations. Although the final allocation of these tax attributes cannot be determined until the consolidated tax returns for tax year 2011 are complete, an estimate of the allocated tax attributes has been recorded in 2011.
Earnings (loss) per common share
Basic earnings (loss) per common shareis based on the sum of the weighted-average number of common shares outstanding and vested restricted stock units.Diluted earnings (loss) per common shareincludes any dilutive effect of stock options, nonvested restricted stock units and, for applicable periods presented, convertible debt, unless otherwise noted.
92
THE WILLIAMS COMPANIES, INC.
NOTES TO CONSOLIDATED FINANCIAL STATEMENTS — (Continued)
Foreign currency translation
Certain of our foreign subsidiaries and equity method investees use their local currencythe Canadian dollar as their functional currency. These foreign currencies include the Canadian dollar, British pound and Euro. Assets and liabilities of certainsuch foreign subsidiaries and equity investees are translated at the spot rate in effect at the applicable reporting date, and the combined statements of operations and our share of the results of operations of our equity affiliates are translated into the U.S. dollar at the average exchange rates in effect during the applicable period. The resulting cumulative translation adjustment is recorded as a separate component ofaccumulated other comprehensive income (loss).
Transactions denominated in currencies other than the functional currency are recorded based on exchange rates at the time such transactions arise. Subsequent changes in exchange rates result in transaction gains and losses which are reflected in the Consolidated Statement of Income.
91
THE WILLIAMS COMPANIES, INC.
NOTES TO CONSOLIDATED FINANCIAL STATEMENTS – (Continued)
Discontinued Operations
In addition to the accounting policies previously discussed, the following policies were considered significant to our former exploration and production business.
IssuanceSignificant estimates and assumptions included the valuation of equityoil and natural gas reserves, valuation of consolidated subsidiary
derivatives and hedge accounting correlations and probability;Property, plant and equipment related to oil and gas exploration and production activities were accounted for under the successful efforts method. Depreciation, depletion and amortization was provided under the units-of-production method on a field basis;
SalesGoodwill was evaluated at least annually for impairment by first comparing our management’s estimate of residual equity intereststhe fair value of a reporting unit with its carrying value, including goodwill. As a result of significant declines in forward natural gas prices during the third quarter of 2010, we performed an impairment assessment of our goodwill which resulted in a $1 billion impairment (See Note 2);
Revenues for sales of natural gas were recognized when the product was sold and delivered;
Impairments of proved properties, including developed and undeveloped, were assessed using estimated future undiscounted cash flows on a field basis. Unproved properties included lease acquisition costs and costs of acquired unproved reserves. These costs were assessed for impairment as conditions warranted.
Note 2. Discontinued Operations
On December 31, 2011, we completed the tax-free spin-off of our interest in WPX to our shareholders. The spin-off was completed by means of a special stock dividend. (See Note 1.) The dividend to our shareholders on December 31, 2011, represented approximately $10.3 billion of assets, $4.8 billion of liabilities and $5.5 billion of net equity, which includes approximately $219 million of accumulated other comprehensive income (AOCI). The carrying value of AOCI is primarily related to net unrealized gains from WPX’s cash flow hedges associated with energy commodity derivatives.
The following summarized results of discontinued operations reflect the results of operations of our former exploration and production business as discontinued operations. Each period presented includes the results of intercompany transactions with our continuing business, such as sales of commodities and charges for gathering, processing and transportation services. Although we expect certain of these types of transactions to continue in the future, the expected continuing cash flows are not considered significant; thus, the operations and cash flows of our former exploration and production business are considered to be eliminated from our ongoing operations. The summarized results of discontinued operations also include certain of our former Venezuela operations, whose facilities were expropriated by the Venezuelan government in May 2009, and settlement of various items pertaining to operations discontinued prior to periods covered by this report.
The December 31, 2010 summarized assets and liabilities of discontinued operations reflects our former exploration and production business. At December 31, 2011, the net assets of this former business have been eliminated from our consolidated subsidiarybalance sheet as the spin-off was complete.
92
THE WILLIAMS COMPANIES, INC.
NOTES TO CONSOLIDATED FINANCIAL STATEMENTS – (Continued)
Summarized Results of Discontinued Operations
| | | | | | | | | | | | |
| | | Years Ended December 31, | |
| | | 2011 | | | 2010 | | | 2009 | |
| | | (Millions) | |
Revenues | | $ | 3,997 | | | $ | 4,042 | | | $ | 3,684 | |
| | | | | | | | | | | | |
Income (loss) from discontinued operations before impairments, gain on deconsolidation and income taxes | | $ | 223 | | | $ | 350 | | | $ | 338 | |
Impairments | | | (755 | ) | | | (1,682 | ) | | | (242 | ) |
Gain on deconsolidation | | | — | | | | — | | | | 9 | |
(Provision) benefit for income taxes | | | 115 | | | | 139 | | | | (90 | ) |
| | | | | | | | | | | | |
Income (loss) from discontinued operations | | $ | (417 | ) | | $ | (1,193 | ) | | $ | 15 | |
| | | | | | | | | | | | |
Income (loss) from discontinued operations: | | | | | | | | | | | | |
Attributable to noncontrolling interests | | $ | 10 | | | $ | 8 | | | $ | (64 | ) |
Attributable to The Williams Companies, Inc. | | $ | (427 | ) | | $ | (1,201 | ) | | $ | 79 | |
Income (loss) from discontinued operations before impairments, gain on deconsolidation and income taxesfor 2011 and 2010 primarily reflect the results of operations of our discontinued exploration and production business (see Note 1), including $42 million of transaction costs related to the spin-off recognized in 2011.
Income (loss) from discontinued operations before impairments, gain on deconsolidation and income taxesfor 2009 primarily reflects $420 million of income from our discontinued exploration and production business. Also reflected are $104 million of losses from our discontinued Venezuela operations and a $15 million gain related to our former coal operations.
Impairments in 2011 reflect $367 million and $180 million of impairments of capitalized costs of certain natural gas producing properties of our discontinued exploration and production business in the Powder River basin and the Barnett Shale, respectively, $29 million of write-downs to estimates of fair value less costs to sell the assets of our discontinued exploration and production business in the Arkoma basin, and a noncash impairment of $179 million in connection with the spin-off of WPX to reflect the difference between the carrying value of our investment in WPX and the estimated fair value of WPX at the time of spin-off. See further discussion below regarding the determination of the fair value of WPX. These nonrecurring fair value measurements fall within Level 3 of the fair value hierarchy.
Impairments in 2010 include a $1,003 million impairment of domestic goodwill (to an implied fair value of zero at the assessment date) and $678 million of impairments of capitalized costs of certain natural gas producing properties in the Barnett Shale and acquired unproved reserves in the Piceance basin of our discontinued exploration and production business (to their estimated fair value of $320 million at the assessment date). These nonrecurring fair value measurements fell within Level 3 of the fair value hierarchy.
For the goodwill evaluation, we used an income approach (discounted cash flow) for valuing reserves. The significant inputs into the valuation of proved and unproved reserves included estimated reserve quantities, forward natural gas prices, anticipated drilling and operating costs, anticipated production curves, income taxes, and appropriate discount rates.
For our assessment of the carrying value of our natural gas producing properties and costs of acquired unproved reserves, we utilized estimates of future cash flows, in certain cases including purchase offers received. Significant judgments and assumptions in these assessments are similar to those used in the goodwill evaluation
93
THE WILLIAMS COMPANIES, INC.
NOTES TO CONSOLIDATED FINANCIAL STATEMENTS – (Continued)
and include estimates of natural gas reserve quantities, estimates of future natural gas prices using a forward NYMEX curve adjusted for locational basis differentials, drilling plans, expected capital costs, and an applicable discount rate commensurate with risk of the underlying cash flow estimates.
Impairmentsfor 2009 primarily reflect a $211 million impairment of our Venezuela property, plant, and equipment that was expropriated by the Venezuelan government in 2009. We are pursuing collection of claims related to that expropriation. Also included is an impairment charge of $20 million related to natural gas producing properties and acquired unproved reserves of our discontinued exploration and production business and an $11 million impairment of a cost-based investment related to our interest in a Venezuelan corporation that owns and operates oil and gas activities.
Gain on deconsolidationreflects the gain recognized when we deconsolidated the entities that owned and operated our Venezuela gas compression facilities prior to their expropriation by the Venezuelan government in 2009.
(Provision) benefit for income taxesfor 2011 includes a $26 million net tax benefit associated with the write-down of certain indebtedness related to our former power operations.
(Provision) benefit for income taxesfor 2009 includes a $76 million benefit from the reversal of deferred tax balances related to our discontinued Venezuela operations.
Impairment of our investment in WPX
In conjunction with accounting for the spin-off of WPX, we evaluated whether there was an indicator of impairment of the carrying value of the investment at the date of the spin-off. Because the market capitalization of WPX as determined by its closing stock price on December 30, 2011 pursuant to the “when issued” trading market was less than our investment in WPX, we determined that an indicator of impairment was present and conducted an evaluation of the fair value of our investment in WPX at the date of the spin-off.
To determine the fair value at the time of spin-off, we considered several valuation approaches to derive a range of fair value estimates. These included consideration of the “when issued” stock price at December 30, 2011, an income approach, and a market approach. While the “when issued” stock price approach utilizes the most observable inputs of the three approaches, we note that the short trading duration, low trading volumes and lack of liquidity in the “when issued” market, among other factors, serve to limit this input in being solely determinative of the fair value of WPX. As such, we also considered the other valuation approaches in estimating the overall fair value of WPX, though giving preferential weighting to the “when issued” stock price approach.
Key variables and assumptions included the application of a control premium of up to 30 percent to the December 30, 2011 “when issued” trading value based on transactions involving energy companies. For the income approach, we estimated the fair value of WPX using a discounted cash flow analysis of their oil and natural gas reserves, primarily adjusted for long-term debt. Implicit in this approach was the use of forward market prices and discount rates that considered the risk of the respective reserves. After tax discount rates assumed to be used by market participants were an average of 11.25 percent for proved reserves, 13.25 percent to 15.25 percent for probable reserves and 15.25 percent to 18.25 percent for possible reserves. For the market approach, we considered multiples of cash flows derived from the value of comparable companies utilizing their respective traded stock prices, adjusted for a control premium consistent with levels noted above. Using these methodologies, we computed a range of estimated fair values from $4.5 billion to $6.7 billion. After giving preferential weighting to the “when issued” valuation, we computed an estimated fair value of approximately $5.5 billion.
94
THE WILLIAMS COMPANIES, INC.
NOTES TO CONSOLIDATED FINANCIAL STATEMENTS – (Continued)
As a result of this evaluation, we have recorded an impairment charge which is nondeductible for tax purposes. This amount served to reduce the investment basis of the net assets accounted for as capital transactions. No adjustmentsa dividend upon the spin-off at December 31, 2011.
Summarized Assets and Liabilities of Discontinued Operations
| | | | |
| | | December 31, 2010 | |
| | | (Millions) | |
Cash and cash equivalents | | $ | 37 | |
Accounts receivable - net | | | 362 | |
Inventories | | | 78 | |
Derivative assets | | | 400 | |
Other current assets and deferred charges | | | 20 | |
| | | | |
Total current assets of discontinued operations | | | 897 | |
Investments | | | 104 | |
Property, plant and equipment - net | | | 8,518 | |
Derivative assets | | | 173 | |
Goodwill | | | 8 | |
Other assets and deferred charges | | | 25 | |
| | | | |
Total noncurrent assets of discontinued operations | | | 8,828 | |
| | | | |
Total assets | | $ | 9,725 | |
| | | | |
Accounts payable | | $ | 486 | |
Accrued liabilities | | | 263 | |
Derivative liabilities | | | 147 | |
| | | | |
Total current liabilities of discontinued operations | | | 896 | |
Deferred income taxes | | | 1,711 | |
Derivative liabilities | | | 142 | |
Other liabilities and deferred income | | | 326 | |
| | | | |
Total noncurrent liabilities of discontinued operations | | | 2,179 | |
| | | | |
Total liabilities | | $ | 3,075 | |
| | | | |
Energy Commodity Derivatives Associated with Discontinued Operations
Our former exploration and production business produced, bought, and/or sold natural gas and crude oil at different locations throughout the United States. It also entered into forward contracts to capital are made forbuy and sell natural gas to maximize the economic value of transportation agreements and storage capacity agreements. To reduce exposure to a decrease in revenues or margins from fluctuations in natural gas and crude oil market prices, it entered into natural gas and crude oil futures contracts, swap agreements, and financial option contracts to mitigate the price risk on forecasted sales of preferential interests in a subsidiary. No gain or loss isnatural gas and crude oil. It also entered into basis swap agreements to reduce the locational price risk associated with its producing basins.
95
THE WILLIAMS COMPANIES, INC.
NOTES TO CONSOLIDATED FINANCIAL STATEMENTS – (Continued)
Gains and Losses
The following table presents pre-tax gains and losses for our former exploration and production business’ energy commodity derivatives designated as cash flow hedges. The amounts previously recognized on these transactions.
withinrevenuesorcosts and operating expensesare now presented within discontinued operations. | | | | | | | | | | |
| | | Years ended
December 31, | | | |
| | 2011 | | | 2010 | | | Classification |
| | | (Millions) | | | |
Net gain (loss) recognized in other comprehensive income (loss) (effective portion) | | $ | 413 | | | $ | 507 | | | AOCI |
| | | | | | | | | | |
Net gain (loss) reclassified from accumulated other comprehensive income (loss) into income (effective portion) | | $ | 332 | | | $ | 355 | | | Income (loss) from discontinued operations |
| | | | | | | | | | |
Gain (loss) recognized in income (ineffective portion) | | $ | — | | | $ | 9 | | | Income (loss) from discontinued operations |
The following table presents pre-tax gains and losses for energy commodity derivatives not designated as hedging instruments. The amounts previously recognized withinrevenuesorcosts and operating expensesare now presented within discontinued operations.
| | | | | | | | |
| | | Years Ended
December 31, | |
| | 2011 | | | 2010 | |
| | | (Millions) | |
Revenues | | $ | 30 | | | $ | 47 | |
Costs and operating expenses | | | — | | | | 28 | |
| | | | | | | | |
Net gain (loss) | | $ | 30 | | | $ | 19 | |
| | | | | | | | |
Recent Accounting StandardsRecurring Fair Value Measurement Disclosures Related to Assets and Liabilities of Discontinued Operations
In September 2006,The following table presents, by level within the Financial Accounting Standards Board (FASB) issued SFAS No. 157, “Fair Value Measurements” (SFAS No. 157). This Statement establishes a framework for fair value measurements in the financial statements by providing a definition of fair value, provides guidance on the methods used to estimate fair value and expands disclosures about fair value measurements. SFAS No. 157 was effective for fiscal years beginning after November 15, 2007. In February 2008, the FASB issued FASB Staff Position (FSP)No. FAS 157-2, permitting entities to delay application of SFAS No. 157 to fiscal years beginning after November 15, 2008, for nonfinancial assets and nonfinancial liabilities, except for items that are recognized or disclosed at fair value in the financial statements on a recurring basis (at least annually). On January 1, 2008, we applied SFAS No. 157 tohierarchy, our assets and liabilities related to discontinued operations that arewere measured at fair value on a recurring basis, primarily ourbasis.
| | | | | | | | | | | | | | | | |
| | | December 31, 2010 | |
| | Level 1 | | | Level 2 | | | Level 3 | | | Total | |
| | | (Millions) | |
Energy derivative assets | | $ | 96 | | | $ | 475 | | | $ | 2 | | | $ | 573 | |
Energy derivative liabilities | | $ | 78 | | | $ | 210 | | | $ | 1 | | | $ | 289 | |
Energy derivatives included commodity based exchange-traded contracts and over-the-counter (OTC) contracts. Exchange-traded contracts included futures, swaps, and options. OTC contracts included forwards, swaps and options.
The instruments included in these Level 1 measurements consisted of energy derivatives. See Note 14 for discussion of the adoption. Beginning January 1, 2009, we will prospectively apply SFAS No. 157 fair value measurement guidance to nonfinancial assetsderivatives that were exchange-traded. Exchange-traded contracts included New York Mercantile Exchange and nonfinancial liabilities that are not recognized or disclosedIntercontinental Exchange contracts and were valued based on a recurring basis when such fair value measurements are required. Had we not elected to defer portions of SFAS No. 157, fair value measurements for nonfinancial items occurringquoted prices in 2008 where SFAS No. 157 would have been applied include long-lived assets measured at fair value for impairment purposes, measuring the fair value of a reporting unit for purposes of assessing goodwill for impairment and the initial measurement at fair value of asset retirement obligations.
In December 2007, the FASB issued SFAS No. 141(R) “Business Combinations” (SFAS No. 141(R)). SFAS No. 141(R) applies to all business combinations and establishes guidance for recognizing and measuring identifiable assets acquired, liabilities assumed, noncontrolling interests in the acquiree and goodwill. Most of these items are recognized at their full fair value on the acquisition date, including acquisitions where the acquirer obtains control but less than 100 percent ownership in the acquiree. SFAS No. 141(R) also requires expensing of restructuring and acquisition-related costs as incurred and establishes disclosure requirements to enable the evaluation of the nature and financial effects of the business combination. SFAS No. 141(R) is effective for business combinations with an acquisition date in fiscal years beginning after December 15, 2008. We will apply this standard for any business combinations after the effective date.
In December 2007, the FASB issued SFAS No. 160, “Noncontrolling Interests in Consolidated Financial Statements — an amendment of Accounting Research Bulletin No. 51” (SFAS No. 160). SFAS No. 160 establishes accounting and reporting standards for noncontrolling ownership interests in subsidiaries (previously referred to as minority interests). Noncontrolling ownership interests in consolidated subsidiaries will be presented in the
active markets.
93
96
THE WILLIAMS COMPANIES, INC.
NOTES TO CONSOLIDATED FINANCIAL STATEMENTS —– (Continued)
consolidated balance sheet within stockholders’ equityThe instruments included in these Level 2 measurements consisted primarily of OTC instruments. Forward, swap, and option contracts included in Level 2 were valued using an income approach including present value techniques and option pricing models. Option contracts, which hedged future sales of production from our discontinued exploration and production business, were structured as a separate component from the parent’s equity. Consolidated net income will now include earnings attributable to both the parentcostless collars and the noncontrolling interests. Earnings per share will continue to bewere financially settled. They were valued using an industry standard Black-Scholes option pricing model. Significant inputs into these Level 2 valuations included commodity prices, implied volatility by location, and interest rates, and considered executed transactions or broker quotes corroborated by other market data. These broker quotes were based on earnings attributable to only the parent company and doesobservable market prices at which transactions could currently be executed. In certain instances where these inputs were not change upon adoption of SFAS No. 160. SFAS No. 160 provides guidance on accounting for changes in the parent’s ownership interest in a subsidiary, including transactions where control is retained and where control is relinquished. SFAS No. 160 also requires additional disclosure of information related to amounts attributable to the parent for income from continuing operations, discontinued operations and extraordinary items and reconciliations of the parent and noncontrolling interests’ equity of a subsidiary. The Statement will be applied prospectively to transactions involving noncontrolling interests, including noncontrolling interests that arose prior to the effective date, as of the beginning of the fiscal year it is initially adopted. However, the presentation of noncontrolling interests within stockholders’ equity and the inclusion of earnings attributable to the noncontrolling interests in consolidated net income requires retrospective application to all periods presented. Beginning January 1, 2009, we will apply SFAS No. 160 prospectively with the exception of the presentation and disclosure requirements which must be applied retrospectivelyobservable for all periods, presented.
In March 2008,relationships of observable market data and historical observations were used as a means to estimate fair value. Where observable inputs were available for substantially the
FASB issued SFAS No. 161, “Disclosures about Derivative Instrumentsfull term of the asset or liability, the instrument was categorized in Level 2.The instruments in these Level 3 measurements primarily consisted of natural gas index transactions that were used by our discontinued exploration and Hedging Activities — an amendmentproduction business to manage physical requirements. These instruments were valued with a present value technique using inputs that may not have been readily observable or corroborated by other market data. These instruments were classified within Level 3 because these inputs had a significant impact on the measurement of FASB Statement No. 133” (SFAS No. 161). SFAS No. 133, “Accounting for Derivative Instruments and Hedging Activities,”currently establishes the disclosure requirements for derivative instruments and hedging activities. SFAS No. 161 amends and expands the disclosure requirements of Statement 133 with enhanced quantitative, qualitative and credit risk disclosures. The Statement requires quantitative disclosure in a tabular format aboutfair value. As the fair valuesvalue of derivative instruments, gainsnatural gas index transactions was primarily driven by the typically nominal differential transacted and losses on derivative instruments and information about wherethe market price, these items are reported in the financial statements. Also required in the tabular presentation is a separation of hedging and nonhedging activities. Qualitative disclosures include outlining objectives and strategies for using derivative instruments in terms of underlying risk exposures, use of derivatives for risk management and other purposes and accounting designation, and an understanding of the volume and purpose of derivative activity. Credit risk disclosures provide information about credit risk related contingent features included in derivative agreements. SFAS No. 161 also amends SFAS No. 107, “Disclosures about Fair Value of Financial Instruments,” to clarify that disclosures about concentrations of credit risk should include derivative instruments. This Statement is effective for financial statements issued for fiscal years and interim periods beginning after November 15, 2008, with early application encouraged. We plan to apply this Statement beginning in 2009. This Statement encourages, but does not require, comparative disclosures for earlier periods at initial adoption. The application of this Statement will increase the disclosures in our Consolidated Financial Statements.
In June 2008, the FASB issued FSPNo. EITF 03-6-1, “Determining Whether Instruments Granted in Share-Based Payment Transactions Are Participating Securities”. FSP No.EITF 03-6-1 requires that unvested share-based payment awards containing nonforfeitable rights to dividends or dividend equivalents (whether paid or unpaid) be considered participating securities and included in the computation of earnings per share (EPS) pursuant to the two-class method of FASB Statement No. 128, “Earnings per Share.” FSP No.EITF 03-6-1 is effective for financial statements issued for fiscal years beginning after December 15, 2008, and interim periods within those years. All prior-period EPS data presented shall be adjusted retrospectively to conform to this FSP. Early application is not permitted. This FSP willtransactions did not have a material impact on
results of operations or liquidity.The energy derivatives portfolio of our EPS attributablediscontinued exploration and production business was largely comprised of exchange-traded products or like products. Due to the common stockholders.
In June 2008,nature of the
FASB issued EITF IssueNo. 07-5, “Determining Whether an Instrument (or Embedded Feature) is Indexed to an Entity’s Own Stock”(EITF 07-5).EITF 07-5 clarifies how to determine whether certain instruments or embedded features are indexed to an entity’s own stock.EITF 07-5 provides that an entity should evaluate the instrument’s settlement provisionsproducts and
contingent exercise provisions, if any, to determine whether an equity-linked financial instrument (or embedded feature) is indexed to its own stock.EITF 07-5 concludes that contingent exercisetenure, market pricing was consistently obtainable. All pricing was reviewed on a daily basis and
settlement provisions in equity-linked financial instruments (or embedded features) are consistentwas formally validated with
being indexed to an entity’s own stock if they are basedbroker quotes and documented on
variables that would be inputs to a
monthly basis.Reclassifications of fair value option or forward pricing modelbetween Level 1, Level 2, and they do not increaseLevel 3 of the instruments’ exposure to those variables. The
94
THE WILLIAMS COMPANIES, INC.
NOTES TO CONSOLIDATED FINANCIAL STATEMENTS — (Continued)
final consensus requires that an entity apply the guidance in this Issue in its first fiscal year beginning after December 15, 2008, including interim periods within those fiscal years. Early application is prohibited. We have outstanding convertible debentures. This Issue will not have an impact on our Consolidated Financial Statements.
In September 2008, the FASB issuedEITF 08-5, “Issuer’s Accounting for Liabilities Measured at Fair Value with a Third-Party Credit Enhancement”(EITF 08-5). The objective of this Issue is to determine an issuer’s unit of accounting for a liability issued with an inseparable third-party credit enhancement when it is measured or disclosed at fair value on a recurring basis. The issuerhierarchy, if applicable, were made at the end of a liabilityeach quarter. No significant transfers between Level 1, Level 2, or Level 3 occurred during the years ended December 31, 2011 or 2010. Additionally, activity associated with a third-party credit enhancement that is inseparable from the liability shall not include the effect of the credit enhancementderivatives classified as Level 3 in the fair value measurement of the liability. An issuer shall disclose the existence of a third-party credit enhancement on its issued liability. In accordance withEITF 08-5, an issuer in considering their own credit in the fair value measurement of a liability would ignore any third-party guarantee, letter of credit, or other form of credit enhancement. This Issue shall be effective on a prospective basis in the first reporting period beginning on or after December 15, 2008. The effect of initially applying the guidance in this Issue shall be included in the change in fair value in the period of adoption. Earlier application is permitted. We will applyEITF 08-5 beginning January 1, 2009, and this Issue willhierarchy was not initially have a material impact on the valuation of our derivative liabilities.
In November 2008, the FASB issuedEITF 08-6, “Accounting for Equity Method Investments Considerations.” The Issue clarifies that an equity method investor is required to continue to recognize an other-than temporary impairment of their investment in accordance with APB Opinion No. 18. Also, an equity method investor should not separately test an investee’s underlying assets for impairment. However, an equity method investor should recognize their share of an impairment charge recorded by an investee. This Issue will be effective on a prospective basis in fiscal years beginning on or after December 15, 2008 and interim periods within those fiscal years. Earlier application by an entity that has previously adopted an alternative accounting policy would not be permitted. Beginning January 1, 2009, we will apply the guidance provided in this Consensus as required.
In December 2008, the FASB issued FSP No. FAS 132(R)-1, “Employers’ Disclosures about Postretirement Benefit Plan Assets”. This FSP amends FASB Statement No. 132 (revised 2003), “Employers’ Disclosures about Pensions and Other Postretirement Benefits”, to provide guidance on an employer’s disclosures about plan assets of a defined benefit pension or other postretirement plan. FSP No. FAS 132(R)-1 applies to an employer that is subject to the disclosure requirements of Statement 132(R). An employer is required to disclose information about how investment allocation decisions are made, including factors that are pertinent to an understanding of investment policies and strategies. An employer should disclose separately for pension plans and other postretirement benefit plans the fair value of each major category of plan assets as of each annual reporting date for which a statement of financial position is presented. Asset categories should be based on the nature and risks of assets in an employer’s plan(s). An employer is required to disclose information that enables users of financial statements to assess the inputs and valuation techniques used to develop fair value measurements of plan assets at the annual reporting date. For fair value measurements using significant unobservable inputs (Level 3), an employer should disclose the effect of the measurements on changes in plan assets for the period. An employer should provide users of financial statements with an understanding of significant concentrations of risk in plan assets. The disclosures about plan assets required by FSP No. FAS 132(R)-1 shall be provided for fiscal years ending after December 15, 2009. Upon initial application, the provisions of FSP No. FAS 132(R)-1 are not required for earlier periods that are otherwise presented for comparative purposes. Earlier application of the provisions of FSP No. FAS 132(R)-1 is permitted. We will assess the application of this Statement on our disclosures in our Consolidated Financial Statements.
| |
Note 2. | Discontinued Operations |
The summarized results of discontinued operations and summarized assets and liabilities of discontinued operations primarily reflect our former power business except where noted otherwise. In November 2007, we sold substantially all of our power business for approximately $496 million in cash. In 2008, we received an additional $22 million of proceeds, including the final purchase price adjustments and $8 million from the sale of Hazleton.
95
THE WILLIAMS COMPANIES, INC.
NOTES TO CONSOLIDATED FINANCIAL STATEMENTS — (Continued)
Summarized Results of Discontinued Operations
| | | | | | | | | | | | | |
| | | 2008 | | | 2007 | | | 2006 | |
| | | (Millions) | |
| |
| Revenues | | $ | 5 | | | $ | 2,436 | | | $ | 2,437 | |
| | | | | | | | | | | | | |
| Income (loss) from discontinued operations before income taxes | | $ | 163 | | | $ | 392 | | | $ | (58 | ) |
| (Impairments) and gain (loss) on sales | | | 8 | | | | (162 | ) | | | — | |
| (Provision) benefit for income taxes | | | (87 | ) | | | (87 | ) | | | 20 | |
| | | | | | | | | | | | | |
| Income (loss) from discontinued operations | | $ | 84 | | | $ | 143 | | | $ | (38 | ) |
| | | | | | | | | | | | | |
Income (loss) from discontinued operations before income taxesfor the year ended December 31, 2008, includes $140 million of gains from the favorable resolution of matters involving pipeline transportation rates associated with our former Alaska operations and $54 million of income from a reduction of remaining amounts accrued in excess of our obligation associated with the Trans-Alaska Pipeline System Quality Bank. (See Note 16.) These gains are partially offset by a $10 million charge from a settlement primarily related to the sale of natural gas liquids pipeline systems in 2002 and a charge of $11 million associated with an oil purchase contract related to our former Alaska refinery.
Income (loss) from discontinued operations before income taxesfor the year ended December 31, 2007, includes a gain of $429 million (reported inrevenuesof discontinued operations) associated with the reclassification of deferred net hedge gains fromaccumulated other comprehensive incometo earnings in second-quarter 2007. This reclassification was based on the determination that the hedged forecasted transactions were probable of not occurring due to the sale of our power business. This gain is partially offset by unrealized mark-to-market losses of approximately $23 million.Income (loss) from discontinued operations before income taxesalso includes the results of our former power business operations.
Income (loss) from discontinued operations before income taxesfor the year ended December 31, 2006, includes charges of $19 million for an adverse arbitration award related to our former chemical fertilizer business, $6 million for a loss contingency in connection with a former exploration business, and $15 million associated with an oil purchase contract related to our former Alaska refinery. Partially offsetting these charges was $13 million of income related to the reduction of contingent obligations associated with our former distributive power business.Income (loss) from discontinued operations before income taxesalso includes the results of our former power business operations.
(Impairments) and gain (loss) on salesfor the year ended December 31, 2007, includes a pre-tax loss of approximately $37 million on the sale of substantially all of our power business. We also recognized impairments of $111 million related to the carrying value of certain derivative contracts for which we had previously elected the normal purchases and normal sales exception under SFAS No. 133, and, accordingly, were no longer recording at fair value, and $14 million related to Hazleton. These impairments were based on our comparison of the carrying value to the estimate of fair value less cost to sell.
96
THE WILLIAMS COMPANIES, INC.
NOTES TO CONSOLIDATED FINANCIAL STATEMENTS — (Continued)
Summarized Assets and Liabilities of Discontinued Operations
| | | | | | | | | |
| | | December 31,
| | | December 31,
| |
| | | 2008 | | | 2007 | |
| | | (Millions) | |
| |
| Derivative assets | | $ | 1 | | | $ | 114 | |
| Accounts receivable — net | | | 5 | | | | 55 | |
| Other current assets | | | — | | | | 3 | |
| | | | | | | | | |
| Total current assets | | | 6 | | | | 172 | |
| | | | | | | | | |
| Property, plant and equipment — net | | | — | | | | 8 | |
| Other noncurrent assets | | | — | | | | 5 | |
| | | | | | | | | |
| Total noncurrent assets | | | — | | | | 13 | |
| | | | | | | | | |
| Total assets | | $ | 6 | | | $ | 185 | |
| | | | | | | | | |
| Derivative liabilities | | $ | 1 | | | $ | 114 | |
| Other current liabilities | | | — | | | | 61 | |
| | | | | | | | | |
| Total current liabilities | | | 1 | | | | 175 | |
| | | | | | | | | |
| Total liabilities | | $ | 1 | | | $ | 175 | |
| | | | | | | | | |
The December 31, 2008 and 2007, balances forderivative assetsandderivative liabilitiesrepresent contracts remaining to be assigned to the purchaser of our former power business, entirely offset by reciprocal positions with that same party. We continue to pursue assignment of the remaining contracts which are with one counterparty as of December 31, 2008.
| |
Note 3. | Investing Activities |
Investing Income
| | | | | | | | | | | | | |
| | | Years Ended December 31, | |
| | | 2008 | | | 2007 | | | 2006 | |
| | | (Millions) | |
| |
| Equity earnings* | | $ | 137 | | | $ | 137 | | | $ | 99 | |
| Income from investments* | | | 1 | | | | — | | | | — | |
| Impairments of cost-based investments | | | (4 | ) | | | (1 | ) | | | (20 | ) |
| Interest income and other | | | 57 | | | | 121 | | | | 89 | |
| | | | | | | | | | | | | |
| Total investing income | | $ | 191 | | | $ | 257 | | | $ | 168 | |
| | | | | | | | | | | | | |
| | |
* | | Items also included insegment profit. (See Note 18.) |
Impairments of cost-based investmentsfor the year ended December 31, 2006, includes a $16 million impairment of a Venezuelan investment primarily due to a decline in reserve estimates. In 2006, our 10 percent direct working interest in an operating contract was converted to a 4 percent equity interest in a Venezuelan corporation which owns and operates oil and gas activities. Our 4 percent equity interest is reported as a cost method investment; previously, we accounted for our working interest using the proportionate consolidation method.
Interest income and otherfor the years ended December 31,
20082011 and
2007, includes $10 million2010.Indemnifications of WPX Matters
According to the terms of the Separation and $14 million, respectively,Distribution Agreement (See Note 1), we have indemnified WPX for certain contingent matters (See Note 16).
Guarantees on behalf of gains from salesWPX
Following the spin-off of cost-based investments.
97
THE WILLIAMS COMPANIES, INC.
NOTES TO CONSOLIDATED FINANCIAL STATEMENTS —– (Continued)
Note 3. Investing Activities
InvestmentsInvesting Income
| | | | | | | | | |
| | | December 31, | |
| | | 2008 | | | 2007 | |
| | | (Millions) | |
| |
| Equity method: | | | | | | | | |
| Gulfstream Natural Gas System, L.L.C. — 50% | | $ | 525 | | | $ | 439 | |
| Discovery Producer Services, L.L.C. — 60%* | | | 184 | | | | 215 | |
| Petrolera Entre Lomas S.A. — 40.8% | | | 73 | | | | 65 | |
| ACCROVEN — 49.3% | | | 69 | | | | 62 | |
| Other | | | 96 | | | | 95 | |
| | | | | | | | | |
| | | | 947 | | | | 876 | |
| Cost method | | | 24 | | | | 25 | |
| | | | | | | | | |
| | | $ | 971 | | | $ | 901 | |
| | | | | | | | | |
| | | | | | | | | | | | |
| | | Years Ended
December 31, | |
| | 2011 | | | 2010 | | | 2009 | |
| | | (Millions) | |
Equity earnings (1) | | $ | 155 | | | $ | 143 | | | $ | 118 | |
Income (loss) from investments (1) | | | 7 | | | | 43 | | | | (75 | ) |
Impairment of cost-based investments | | | (1 | ) | | | — | | | | (11 | ) |
Interest income and other | | | 7 | | | | 2 | | | | 6 | |
| | | | | | | | | | | | |
Total investing income | | $ | 168 | | | $ | 188 | | | $ | 38 | |
| | | | | | | | | | | | |
(1) | Items also included in segment profit (loss). (See Note 18.) |
In June 2010, we sold our 50 percent interest in Accroven SRL (Accroven) to the state-owned oil company, Petróleos de Venezuela S.A. (PDVSA) for $107 million.Income (loss) from investmentsin 2011 and 2010 includes gains of $11 million and $43 million, respectively, from the sale. The $11 million received in the first quarter of 2011 represents the first of six quarterly payments, which was originally due from the buyer in October 2010. We will recognize the remaining payments as income upon future receipt.
Income (loss) from investments in 2009 reflects a $75 million impairment charge related to an other-than-temporary loss in value associated with our Venezuelan investment in Accroven. Accroven owns and operates gas processing facilities and an NGL fractionation plant for the exclusive benefit of PDVSA. The deteriorating circumstances in the first quarter of 2009 for our Venezuelan operations caused us to review our investment in Accroven. We utilized a probability-weighted discounted cash flow analysis, which included an after-tax discount rate of 20 percent to reflect the risk associated with operating in Venezuela. Accroven was not part of the operations that were expropriated by the Venezuelan government in May 2009.
Investments
| | | | | | | | |
| | | December 31, | |
| | 2011 | | | 2010 | |
| | | ( Millions) | |
Equity method: | | | | | | | | |
Overland Pass Pipeline Company LLC (OPPL)- 50% | | $ | 433 | | | $ | 429 | |
Gulfstream—50% (1) | | | 362 | | | | 378 | |
Laurel Mountain Midstream, LLC (Laurel Mountain) - 51% (2) | | | 291 | | | | 170 | |
Discovery Producer Services LLC (Discovery) - 60% (2) | | | 182 | | | | 181 | |
Other | | | 122 | | | | 80 | |
| | | | | | | | |
| | | 1,390 | | | | 1,238 | |
Cost method | | | 1 | | | | 2 | |
Marketable equity securities | | | 24 | | | | — | |
| | | | | | | | |
| | $ | 1,415 | | | $ | 1,240 | |
| | | | | | | | |
(1) | |
* | | Our consolidated subsidiary,As of December 31, 2011, 49 percent interest is held within Williams Partners, L.P., owns 60 percent. However, we continue towith the remaining 1 percent held within Other. |
(2) | We account for this investmentthese investments under the equity method due to the voting provisions of Discovery’s limited liability company, which provide the other member of Discovery significant participatory rights of our partners such that we do not control the investment.investments. |
Differences98
THE WILLIAMS COMPANIES, INC.
NOTES TO CONSOLIDATED FINANCIAL STATEMENTS – (Continued)
Marketable equity securities are classified as available-for-sale. The carrying value is reported at fair value with net unrealized appreciation reported as a component of other comprehensive income.
The difference between the carrying value of our equity investments and the underlying equity in the net assets of the investees is $62 million at December 31, 2011, primarily related to impairments we previously recognized.
These differences are amortized over the expected remaining life of the investees’ underlying assets.We have recognized revenue of $23 million, $41 million, and $27 million from our equity method investees for 2011, 2010, and 2009, respectively, primarily related to OPPL and Discovery. We have recognized costs and operating expenses of $234 million, $220 million, and $158 million with our equity method investees for 2011, 2010, and 2009, respectively. We have $1 million and $2 million accounts receivable and $23 million and $20 million accounts payable with our equity method investees at December 31, 2011 and December 31, 2010, respectively.
WPZ has operating agreements with certain equity method investees. These operating agreements typically provide for reimbursement or payment to WPZ for certain direct operational payroll and employee benefit costs, materials, supplies, and other charges and also for management services. We supplied a portion of these services, primarily those related to employees since WPZ does not have any employees, to certain equity method investees. The total gross charges to equity method investees for these fees are $57 million, $38 million and $23 million for the years ended December 31, 2011, December 31, 2010, and December 31, 2009, respectively.
In September 2010, we purchased an additional 49 percent ownership interest in OPPL for $424 million. In June 2009, we purchased a 51 percent interest in Laurel Mountain for $133 million and invested $137 million and $43 million in Laurel Mountain in 2011 and 2010, respectively. We also invested $30 million in Aux Sable Liquid Products LP (Aux Sable) in 2011.
Dividends and distributions, including those presented below, received from companies accounted for by the equity method were $167$193 million, $175 million, and $282 million in 20082011, 2010, and $118 million in 2007.2009, respectively. These transactions reduced the carrying value of our investments. These dividends and distributions primarily included:
| | | | | | | | | |
| | | 2008 | | | 2007 | |
| | | (Millions) | |
| |
| Gulfstream Natural Gas System, L.L.C. | | $ | 58 | | | $ | 34 | |
| Discovery Producer Services, L.L.C. | | | 56 | | | | 36 | |
| Aux Sable Liquid Products L.P. | | | 28 | | | | 22 | |
| Petrolera Entre Lomas S.A. | | | 7 | | | | 12 | |
In addition, we contributed $90 | | | | | | | | | | | | |
| | | 2011 | | | 2010 | | | 2009 | |
| | | (Millions) | |
Gulfstream | | $ | 84 | | | $ | 81 | | | $ | 223 | |
Discovery | | | 40 | | | | 44 | | | | 32 | |
Aux Sable | | | 35 | | | | 28 | | | | 15 | |
OPPL | | | 19 | | | | — | | | | — | |
The 2009 amount presented above includes a $148 million in 2008distribution from Gulfstream following its debt offering.
Summarized Financial Position and $38 million in 2007 to Gulfstream Natural Gas System, L.L.C. (Gulfstream).
Guarantees on BehalfResults of InvesteesOperations of Equity Method Investments (Unaudited)
We have guaranteed commercial letters of credit totaling $20 million on behalf of ACCROVEN. These expire in January 2010 and have no carrying value.
We have provided guarantees on behalf of certain entities in which we have an equity ownership interest. These generally guarantee operating performance measures and the maximum potential future exposure cannot be determined. There are no expiration dates associated with these guarantees. No amounts have been accrued at December 31, 2008 and 2007.
98
| | | | | | | | |
| | | December 31, | |
| | 2011 | | | 2010 | |
| | (Millions) | |
Current assets | | $ | 293 | | | $ | 236 | |
Noncurrent assets | | | 4,409 | | | | 3,976 | |
Current liabilities | | | 235 | | | | 157 | |
Noncurrent liabilities | | | 1,257 | | | | 1,294 | |
99
THE WILLIAMS COMPANIES, INC.
NOTES TO CONSOLIDATED FINANCIAL STATEMENTS —– (Continued)
| |
| | | | | | | | | | | | | | | | Years Ended December 31, | | | | 2011 | | | 2010 | | | 2009 | | | | | (Millions) | | Gross revenue | | $ | 1,242 | | | $ | 1,086 | | | $ | 872 | | Operating income | | | 623 | | | | 587 | | | | 409 | | Net income | | | 460 | | | | 429 | | | | 317 | |
Note 4. Asset Sales, Impairments and Other Accruals Note 4.
| Asset Sales, Impairments and Other Accruals |
The following table presents significant gains or losses from asset sales, impairments and other accruals or adjustments reflected inother (income) expense— –netwithinsegment costs and expenses.
| | | | | | | | | | | | | |
| | | Years Ended December 31, | |
| | | 2008 | | | 2007 | | | 2006 | |
| | | (Millions) | |
| |
Exploration & Production | | | | | | | | | | | | |
| Gain on sale of contractual right to an international production payment | | $ | (148 | ) | | $ | — | | | $ | — | |
| Impairment of certain natural gas producing properties | | | 143 | | | | — | | | | — | |
Gas Pipeline | | | | | | | | | | | | |
| Income from change in estimate related to a regulatory liability | | | — | | | | (17 | ) | | | — | |
| Income from payments received for a terminated firm transportation agreement on Grays Harbor lateral | | | — | | | | (18 | ) | | | — | |
| Gain on sale of certain south Texas assets | | | (10 | ) | | | — | | | | — | |
Midstream | | | | | | | | | | | | |
| Income from favorable litigation outcome | | | — | | | | (12 | ) | | | — | |
| Impairment of Carbonate Trend pipeline | | | 6 | | | | 10 | | | | — | |
| Gulf Liquids litigation contingency accrual (see Note 16) | | | (32 | ) | | | — | | | | 73 | |
| Involuntary conversion gain related to Ignacio plant | | | (12 | ) | | | — | | | | — | |
Gas Marketing Services | | | | | | | | | | | | |
| Accrual for litigation contingencies | | | — | | | | 20 | | | | — | |
Other (income) expense — netwithin
segment costs and expensesalso includes net foreign currency exchange gains: | | | | | | | | | | | | |
| | | Years Ended
December 31, | |
| | | 2011 | | | 2010 | | | 2009 | |
| | | (Millions) | |
Williams Partners | | | | | | | | | | | | |
Capitalization of project feasibility costs previously expensed | | $ | (10 | ) | | $ | — | | | $ | — | |
Involuntary conversion gains | | | (3 | ) | | | (18 | ) | | | (4 | ) |
Gains on sales of certain assets | | | — | | | | (12 | ) | | | (40 | ) |
Accrual of regulatory liability related to overcollection of certain employee expenses | | | 9 | | | | 10 | | | | — | |
Impairments of certain gathering assets | | | 4 | | | | 9 | | | | — | |
Midstream Canada & Olefins | | | | | | | | | | | | |
Gulf Liquids litigation contingency accrual reduction (see Note 16) | | | (19 | ) | | | — | | | | — | |
The reversal of $48 millionproject feasibility costs from expense to capital in 2008, $5 million in 2007, and $5 million in 2006. The increase in 2008 primarily relates to2011 at Williams Partners is associated with a natural gas pipeline expansion project. This reversal was made upon determining that the remeasurementrelated project was probable of current assets held in U.S. dollars within our Canadian operationsdevelopment. These costs will be included in the Midstream segment.
Impairment of certain natural gas producing properties
Based on a comparisoncapital costs of the
estimated fair value toproject, which we believe are probable of recovery through the
project rates.In 2009, we sold our Cameron Meadows plant, which had a carrying value Exploration & Production recorded an impairment charge of $129$16 million and recognized a $40 million gain at Williams Partners.
Additional Items
In conjunction with the completion of a tender offer for a portion of our debt in December 2008the fourth quarter of 2011 (see Note 11), we incurred $271 million of early debt retirement costs consisting primarily of cash premiums.
We completed a strategic restructuring transaction in the first quarter of 2010 that involved significant debt issuances, retirements and amendments. During 2010, we incurred significant costs related to properties in the Arkoma basin. Our impairment analysis included an assessmentthese transactions, as follows:
$606 million of undiscounted and discounted futureearly debt retirement costs consisting primarily of cash flows, which considered year-end natural gas reserve quantities. Exploration & Production had previously recorded a $14 million impairment charge in 2008 due to unfavorable drilling results in the Arkoma basin.
Additional Item
In fourth-quarter 2008, Exploration & Production recorded a $34 million accrual for Wyoming severance taxes, which is reflected incosts and operating expenseswithinsegment costs and expenses. Associated with this charge is an interest expense accrual of $4 million, which is included ininterest accrued.(See Note 16.)premiums;
99
| • | | $45 million of other transaction costs reflected ingeneral corporate expenses, of which $7 million is attributable to noncontrolling interests; |
| • | | $4 million of accelerated amortization of debt costs related to the amendments of credit facilities, reflected inother income (expense) – net belowoperating income (loss). |
100
THE WILLIAMS COMPANIES, INC.
NOTES TO CONSOLIDATED FINANCIAL STATEMENTS —– (Continued)
| |
We detected a leak in an underground cavern at our Eminence Storage Field in Mississippi on December 28, 2010. We recorded $15 million and $5 million of charges tocosts and operating expensesat Williams Partners during 2011 and 2010, respectively, primarily related to assessment and monitoring costs incurred to ensure the safety of the surrounding area. In conjunction with the Gulf Liquids litigation contingency accrual reduction noted in the table above, Midstream Canada & Olefins also reduced an accrual for the associated interest of $14 million in 2011, which is reflected ininterest accrued. (See Note 16.) Note 5. Provision (Benefit) for Income Taxes Note 5.
| Provision for Income Taxes |
Theprovision (benefit) for income taxesfrom continuing operations includes:
| | | | | | | | | | | | | |
| | | 2008 | | | 2007 | | | 2006 | |
| | | (Millions) | |
| |
| Current: | | | | | | | | | | | | |
| Federal | | $ | 179 | | | $ | 29 | | | $ | (9 | ) |
| State | | | 24 | | | | 9 | | | | 3 | |
| Foreign | | | 35 | | | | 46 | | | | 43 | |
| | | | | | | | | | | | | |
| | | | 238 | | | | 84 | | | | 37 | |
| Deferred: | | | | | | | | | | | | |
| Federal | | | 466 | | | | 422 | | | | 146 | |
| State | | | (11 | ) | | | (4 | ) | | | 4 | |
| Foreign | | | 20 | | | | 22 | | | | 24 | |
| | | | | | | | | | | | | |
| | | | 475 | | | | 440 | | | | 174 | |
| | | | | | | | | | | | | |
| Total provision | | $ | 713 | | | $ | 524 | | | $ | 211 | |
| | | | | | | | | | | | | |
| | | | | | | | | | | | |
| | | Years Ended
December 31, | |
| | | 2011 | | | 2010 | | | 2009 | |
| | | (Millions) | |
Current: | | | | | | | | | | | | |
Federal | | $ | 181 | | | $ | (21 | ) | | $ | (83 | ) |
State | | | 13 | | | | (2 | ) | | | 8 | |
Foreign | | | (6 | ) | | | 29 | | | | 12 | |
| | | | | | | | | | | | |
| | | 188 | | | | 6 | | | | (63 | ) |
Deferred: | | | | | | | | | | | | |
Federal | | | (61 | ) | | | 144 | | | | 234 | |
State | | | (14 | ) | | | (48 | ) | | | 30 | |
Foreign | | | 11 | | | | 12 | | | | 3 | |
| | | | | | | | | | | | |
| | | (64 | ) | | | 108 | | | | 267 | |
| | | | | | | | | | | | |
Total provision (benefit) | | $ | 124 | | | $ | 114 | | | $ | 204 | |
| | | | | | | | | | | | |
Reconciliations from theprovision (benefit) for income taxesfrom continuing operations at the federal statutory rate to the realizedrecordedprovision (benefit) for income taxesare as follows:
| | | | | | | | | | | | | |
| | | 2008 | | | 2007 | | | 2006 | |
| | | (Millions) | |
| |
| Provision at statutory rate | | $ | 717 | | | $ | 480 | | | $ | 195 | |
| Increases (decreases) in taxes resulting from: | | | | | | | | | | | | |
| State income taxes (net of federal benefit) | | | 8 | | | | 4 | | | | 7 | |
| Foreign operations — net | | | — | | | | 18 | | | | 23 | |
| Federal income tax litigation | | | (5 | ) | | | — | | | | (40 | ) |
| Non-deductible convertible debenture expenses | | | — | | | | — | | | | 10 | |
| Other — net | | | (7 | ) | | | 22 | | | | 16 | |
| | | | | | | | | | | | | |
| Provision for income taxes | | $ | 713 | | | $ | 524 | | | $ | 211 | |
| | | | | | | | | | | | | |
| | | | | | | | | | | | |
| | | Years Ended
December 31, | |
| | | 2011 | | | 2010 | | | 2009 | |
| | | (Millions) | |
Provision (benefit) at statutory rate | | $ | 421 | | | $ | 135 | | | $ | 192 | |
Increases (decreases) in taxes resulting from: | | | | | | | | | | | | |
Impact of nontaxable noncontrolling interests | | | (96 | ) | | | (58 | ) | | | (49 | ) |
State income taxes (net of federal benefit) | | | 11 | | | | (35 | ) | | | 24 | |
Foreign operations – net | | | (14 | ) | | | (22 | ) | | | 19 | |
Federal settlements | | | (109 | ) | | | — | | | | — | |
International revised assessments | | | (38 | ) | | | — | | | | — | |
Taxes on undistributed earnings of certain foreign operations | | | (66 | ) | | | 66 | | | | — | |
Reduction of tax benefits on Medicare Part D federal subsidy | | | — | | | | 11 | | | | — | |
Other – net | | | 15 | | | | 17 | | | | 18 | |
| | | | | | | | | | | | |
Provision (benefit) for income taxes | | $ | 124 | | | $ | 114 | | | $ | 204 | |
| | | | | | | | | | | | |
101
THE WILLIAMS COMPANIES, INC.
NOTES TO CONSOLIDATED FINANCIAL STATEMENTS – (Continued)
State income taxes (net of federal benefit) were reduced by $46$43 million in 20082010 due to a reduction in our estimate of the effective deferred state rate, including state income tax carryovers, reflective of a change in the mix of jurisdictional attribution of taxable income.
Utilization of foreign operating loss carryovers reduced the provision for income taxes by $13 million, $5 million and $3 million in 2008, 2007 and 2006, respectively.
Income (loss) from continuing operations before income taxesincludes $196 million, $169$173 million and $144 million of foreign income and $48 million of foreign loss in 2008, 2007,2011, 2010, and 2006,2009, respectively.
During the course of audits of our business by domestic and foreign tax authorities, we frequently face challenges regarding the amount of taxes due. These challenges include questions regarding the timing and amount of deductions and the allocation of income among various tax jurisdictions. In evaluating the liability associated with our various tax filing positions, we apply the two-steptwo step process of recognition and measurement as required by FASB Interpretation No. 48, “Accounting for Uncertainty in Income Taxes, an interpretation of FASB Statement No. 109” (FIN 48). We adopted FIN 48 effective January 1, 2007.measurement. In association with this liability, we record an
100
THE WILLIAMS COMPANIES, INC.
NOTES TO CONSOLIDATED FINANCIAL STATEMENTS — (Continued)
estimate of related interest and tax exposure as a component of our tax provision. The impact of this accrual is included withinother —– netin our reconciliation of the tax provision to the federal statutory rate.
Significant components ofdeferred tax liabilitiesanddeferred tax assets as of December 31, 2008, and 2007, are as follows:
| | | | | | | | | |
| | | 2008 | | | 2007 | |
| | | (Millions) | |
| |
| Deferred tax liabilities: | | | | | | | | |
| Property, plant and equipment | | $ | 3,568 | | | $ | 3,192 | |
| Derivatives — net | | | 263 | | | | — | |
| Investments | | | 163 | | | | 176 | |
| Other | | | 112 | | | | 89 | |
| | | | | | | | | |
| Total deferred tax liabilities | | | 4,106 | | | | 3,457 | |
| | | | | | | | | |
| Deferred tax assets: | | | | | | | | |
| Accrued liabilities | | | 581 | | | | 433 | |
| Derivatives — net | | | — | | | | 173 | |
| Foreign carryovers | | | 3 | | | | 50 | |
| Minimum tax credits | | | — | | | | 8 | |
| Other | | | 55 | | | | 53 | |
| | | | | | | | | |
| Total deferred tax assets | | | 639 | | | | 717 | |
| | | | | | | | | |
| Less valuation allowance | | | 15 | | | | 57 | |
| | | | | | | | | |
| Net deferred tax assets | | | 624 | | | | 660 | |
| | | | | | | | | |
| Overall net deferred tax liabilities | | $ | 3,482 | | | $ | 2,797 | |
| | | | | | | | | |
| | | | | | | | |
| | | December 31, | |
| | | 2011 | | | 2010 | |
| | | (Millions) | |
Deferred tax liabilities: | | | | | | | | |
Property, plant, and equipment | | $ | 65 | | | $ | 115 | |
Investments | | | 2,063 | | | | 1,978 | |
Other | | | 46 | | | | 101 | |
| | | | | | | | |
Total deferred tax liabilities | | | 2,174 | | | | 2,194 | |
| | | | | | | | |
Deferred tax assets: | | | | | | | | |
Accrued liabilities | | | 324 | | | | 257 | |
Minimum tax credits * | | | 119 | | | | 120 | |
State loss and credit carryovers | | | 170 | | | | 201 | |
Other | | | 98 | | | | 59 | |
| | | | | | | | |
Total deferred tax assets | | | 711 | | | | 637 | |
| | | | | | | | |
Less valuation allowance | | | 145 | | | | 178 | |
| | | | | | | | |
Net deferred tax assets | | | 566 | | | | 459 | |
| | | | | | | | |
Overall net deferred tax liabilities | | $ | 1,608 | | | $ | 1,735 | |
| | | | | | | | |
* | In conjunction with the spin-off of WPX, alternative minimum tax credits were allocated between us and WPX. A $98 million deferred tax asset for the estimated alternative minimum tax credit allocable to WPX was contributed to WPX prior to the spin-off. The final allocation of tax attributes cannot be determined until the consolidated tax returns for the tax year 2011 are complete. Any subsequent adjustments will be recorded in the tax provision for the period in which the change occurs. |
Thevaluation allowanceat December 31, 20082011 and December 31, 2007,2010 serves to reduce the recognized tax benefitassets associated with foreignstate loss and credit carryovers to an amount that will more likely than not, be realized. We do not expect to be able to utilize our $15 million of foreign deferred tax assets.
These amounts are presented in the table above before any federal benefit. The
reductions in foreigndecrease from prior year for both thestate loss and credit carryovers and the
valuation allowance were is primarily due to
the restructuringstate income tax adjustments related to reporting of the
European operationsfederal settlements, as discussed below.102
THE WILLIAMS COMPANIES, INC.
NOTES TO CONSOLIDATED FINANCIAL STATEMENTS – (Continued)
In the fourth-quarter 2010, we provided $66 million of our former power business.
Undistributeddeferred taxes on the undistributed earnings of certain consolidatedforeign operations that we no longer could assert were permanently reinvested due to alternatives being considered related to an existing structure impacted by the potential timing of our plan approved by our Board of Directors to pursue the separation of our exploration and production business through an IPO and subsequent tax-free spin-off. During the third quarter of 2011, associated with a ruling received from the Internal Revenue Service (IRS) related to this separation plan, and following a certain internal reorganization, we recognized a deferred tax benefit of $66 million as we now consider the undistributed earnings of these certain foreign operations to be permanently reinvested. As of December 31, 2011, we consider $388 million of undistributed earnings from foreign subsidiaries at December 31, 2008, totaled approximately $377 million. No provision forto be permanently reinvested and have not provided deferred U.S. income taxes has been made for these subsidiaries because we intend to permanently reinvest such earnings in foreign operations.
on that amount.Cash payments for income taxes (net of refunds)refunds and including discontinued operations) were $155$296 million, $384$40 million, and $79$14 million in 2008, 2007,2011, 2010, and 2006,2009, respectively. Cash tax payments include settlements with taxing authorities associated with prior period audits of $47 million, $94 million, and $42 million in 2008, 2007 and 2006, respectively.
101
THE WILLIAMS COMPANIES, INC.
NOTES TO CONSOLIDATED FINANCIAL STATEMENTS — (Continued)
As of December 31, 2008,2011, we had approximately $79$38 million of unrecognized tax benefits. If recognized, approximately $70$41 million, net of federal tax expense, would be recorded as a reduction of income tax expense. A reconciliation of the beginning and ending amount of unrecognized tax benefits is as follows:
| | | | | | | | | |
| | | 2008 | | | 2007 | |
| | | (Millions) | |
| |
| Balance at beginning of period | | $ | 76 | | | $ | 93 | |
| Additions based on tax positions related to the current year | | | 3 | | | | — | |
| Additions for tax positions for prior years | | | 8 | | | | 5 | |
| Reductions for tax positions of prior years | | | (8 | ) | | | (19 | ) |
| Settlement with taxing authorities | | | — | | | | (3 | ) |
| Lapse of applicable statute of limitations | | | — | | | | — | |
| | | | | | | | | |
| Balance at end of period | | $ | 79 | | | $ | 76 | |
| | | | | | | | | |
| | | | | | | | |
| | | 2011 | | | 2010 | |
| | | (Millions) | |
Balance at beginning of period | | $ | 91 | | | $ | 89 | |
Additions based on tax positions related to the current year | | | 26 | | | | 11 | |
Additions for tax positions for prior years | | | 4 | | | | 3 | |
Reductions for tax positions of prior years | | | (39 | ) | | | (12 | ) |
Settlement with taxing authorities | | | (44 | ) | | | — | |
| | | | | | | | |
Balance at end of period | | $ | 38 | | | $ | 91 | |
| | | | | | | | |
We recognize related interest and penalties as a component of income tax expense. Approximately $2 million and $60 million ofexpense (benefit). Total interest and penalties recognized as part of income tax benefit were included in the provision$56 million for 2011 and as part of income taxes during 2008tax expense were $11 million and 2007,$17 million for 2010 and 2009, respectively. Approximately $81$15 million and $86$104 million of interest and penalties primarily relating to uncertain tax positions have been accrued as of December 31, 20082011 and 2007,2010, respectively.
As of December 31, 2008, the Internal Revenue Service (IRS) examinations of our consolidated U.S. income tax returns for 2006 and 2007 were in process. IRS examinations for 1997 through 2005 have been completed at the field level but the years remain open for certain unresolved issues. The statute of limitations for most states expires one year after expiration of the IRS statute.
Generally, tax returns for our Venezuelan, Argentine, and Canadian entities are open to audit from 2003 through 2008. Certain Canadian entities are currently under examination.
During the next twelve12 months, we do not expect ultimate resolution of any unrecognized tax benefit associated with domestic or international matters to have a material impact on our financialunrecognized tax benefit position.
| |
Note 6. | Earnings Per Common Share from Continuing Operations |
BasicDuring the first quarter of 2011, we finalized settlements for 1997 through 2008 on certain contested matters with the IRS that resulted in a 2011 year-to-date tax benefit of approximately $109 million. In July and diluted earnings per common share forAugust 2011, we made cash payments to the years endedIRS of $82 million and $77 million, respectively, related to these settlements. During the first and fourth quarters of 2011, we received revised assessments on an international matter that resulted in a 2011 tax benefit of approximately $38 million.
As of December 31, 2008, 20072011, the IRS examination of our consolidated U.S. federal income tax returns for 2009 and 2006, are:
| | | | | | | | | | | | | |
| | | 2008 | | | 2007 | | | 2006 | |
| | | (Dollars in millions, except per-share amounts; shares in thousands) | |
| |
| Income from continuing operations available to common stockholders for basic and diluted earnings per common share(1) | | $ | 1,334 | | | $ | 847 | | | $ | 347 | |
| | | | | | | | | | | | | |
| Basic weighted-average shares(2)(3) | | | 581,342 | | | | 596,174 | | | | 595,053 | |
| Effect of dilutive securities: | | | | | | | | | | | | |
| Nonvested restricted stock units | | | 1,334 | | | | 1,627 | | | | 1,029 | |
| Stock options | | | 3,439 | | | | 4,743 | | | | 4,440 | |
| Convertible debentures(3) | | | 6,604 | | | | 7,322 | | | | 8,105 | |
| | | | | | | | | | | | | |
| Diluted weighted-average shares | | | 592,719 | | | | 609,866 | | | | 608,627 | |
| | | | | | | | | | | | | |
| Earnings per common share from continuing operations: | | | | | | | | | | | | |
| Basic | | $ | 2.30 | | | $ | 1.42 | | | $ | .58 | |
| | | | | | | | | | | | | |
| Diluted | | $ | 2.26 | | | $ | 1.40 | | | $ | .57 | |
| | | | | | | | | | | | | |
102With the spin-off of WPX on December 31, 2011, WPX will be included in our consolidated federal income tax returns and will be included with us and/or certain of our subsidiaries in applicable combined or unitary state, local and foreign income tax returns. In conjunction with the spin-off, WPX entered into a tax sharing agreement
103
THE WILLIAMS COMPANIES, INC.
NOTES TO CONSOLIDATED FINANCIAL STATEMENTS —– (Continued)
with us under which we generally will be liable for all U.S. federal, state, local and foreign income taxes attributable to WPX with respect to taxable periods ending on or before the distribution date. We will prepare pro forma tax returns for each tax period in which WPX or any of its subsidiaries are combined or consolidated with us for purposes of any tax return. WPX will reimburse us for any additional taxes shown on the pro forma tax returns, and we will reimburse WPX for any additional current losses or credits WPX recognizes based on the pro forma tax returns, excluding alternative minimum tax credits. We are also principally responsible for managing any income tax audits by the various tax jurisdictions for pre-spin-off periods. In the case of any tax audit adjustments, all pro forma returns and associated tax reimbursement obligations will be recomputed to give effect to such adjustments.
Note 6. Earnings (Loss) Per Common Share from Continuing Operations
| | | | | | | | | | | | |
| | | Years Ended December 31, | |
| | | 2011 | | | 2010 | | | 2009 | |
| | | (Dollars in millions, except per-share | |
| | | amounts; shares in thousands) | |
Income (loss) from continuing operations attributable to The Williams Companies, Inc. available to common stockholders for basic and diluted earnings (loss) per common share (1) | | $ | 803 | | | $ | 104 | | | $ | 206 | |
| | | | | | | | | | | | |
Basic weighted-average shares | | | 588,553 | | | | 584,552 | | | | 581,674 | |
Effect of dilutive securities: | | | | | | | | | | | | |
Nonvested restricted stock units | | | 4,332 | | | | 3,190 | | | | 2,216 | |
Stock options | | | 3,374 | | | | 2,957 | | | | 2,065 | |
Convertible debentures | | | 1,916 | | | | — | | | | — | |
| | | | | | | | | | | | |
Diluted weighted-average shares | | | 598,175 | | | | 590,699 | | | | 585,955 | |
| | | | | | | | | | | | |
Earnings (loss) per common share from continuing operations: | | | | | | | | | | | | |
Basic | | $ | 1.36 | | | $ | .17 | | | $ | .35 | |
| | | | | | | | | | | | |
Diluted | | $ | 1.34 | | | $ | .17 | | | $ | .35 | |
| | | | | | | | | | | | |
(1) | | |
(1) | | The years ended December 31, 2008, 2007 and 2006, include $2 million, $3 million and $32011 includes $.7 million of interest expense, net of tax, associated with our convertible debentures. (See Note 12.) These amounts haveThis amount has been added back toincome (loss) from continuing operations attributable to The Williams Companies, Inc. available to common stockholdersto calculate diluted earnings per common share. |
|
(2) | | From the inception of our stock repurchase program in third-quarter 2007 to its completion in July 2008, we purchased 29 million shares of our common stock. (See Note 12.) |
|
(3) | | During third-quarter 2008, we issued 2 million shares of our common stock in exchange for a portion of our 5.5 percent convertible debentures. During January 2006, we issued 20 million shares of common stock related to a conversion offer for our 5.5 percent convertible debentures. |
For 2010, 2.2 million weighted-average shares related to the assumed conversion of our convertible debentures, as well as the related interest, net of tax, have been excluded from the computation of diluted earnings per common share. Inclusion of these shares would have an antidilutive effect on the diluted earnings per common share. We estimate that if 2010income (loss) from continuing operations attributable to The Williams Companies, Inc. available to common stockholderswas $222 million of income, then these shares would become dilutive.
For 2009, 3.4 million weighted-average shares related to the assumed conversion of our convertible debentures, as well as the related interest, net of tax, have been excluded from the computation of diluted earnings per common share. Inclusion of these shares would have an antidilutive effect on the diluted earnings per common share. We estimate that if 2009income (loss) from continuing operations attributable to The Williams Companies, Inc. available to common stockholderswas $212 million of income, then these shares would become dilutive.
104
THE WILLIAMS COMPANIES, INC.
NOTES TO CONSOLIDATED FINANCIAL STATEMENTS – (Continued)
The table below includes information related to stock options for each period that were outstanding at the end of each respective year but have been excluded from the computation of weighted-average stock options due to the option exercise price exceeding the fourth quarter weighted-average market price of our common shares.
| | | | | | | | | | | | | |
| | | 2008 | | | 2007 | | | 2006 | |
| |
| Options excluded (millions) | | | 6.4 | | | | .8 | | | | 3.6 | |
| Weighted-average exercise prices of options excluded | | | $26.41 | | | | $40.07 | | | | $36.14 | |
| Exercise price ranges of options excluded | | | $16.40 - $42.29 | | | | $36.66 -$42.29 | | | | $26.79 - $42.29 | |
| Fourth quarter weighted-average market price | | | $16.37 | | | | $35.14 | | | | $25.77 | |
| | | | | | | | | | | | |
| | | 2011* | | | 2010 | | | 2009 | |
Options excluded (millions) | | | 0.9 | | | | 2.4 | | | | 3.7 | |
Weighted-average exercise price of options excluded | | | $29.68 | | | | $32.41 | | | | $30.21 | |
Exercise price ranges of options excluded | | | $26.10 -$29.72 | | | | $22.68 -$40.51 | | | | $20.28 -$42.29 | |
Fourth quarter weighted-average market price | | | $24.51 | | | | $22.47 | | | | $19.81 | |
* | |
Information related to the excluded options for 2011 has been adjusted to reflect the impact of the spin-off of WPX on December 31, 2011 (see Note 7. | Employee Benefit Plans13). |
Note 7. Employee Benefit Plans
We have noncontributory defined benefit pension plans in which all eligible employees participate. Currently, eligible employees earn benefits primarily based on a cash balance formula. Various other formulas, as defined in the plan documents, are utilized to calculate the retirement benefits for plan participants not covered by the cash balance formula. At the time of retirement, participants may elect, to the extent they are eligible for the various options, to receive annuity payments, a lump sum payment, or a combination of a lump sum and annuity payments. In addition to our pension plans, we currently provide subsidized retiree medical and life insurance benefits (other postretirement benefits) to certain eligible participants. Generally, employees hired after December 31, 1991, are not eligible for the subsidized retiree medical benefits, except for participants that were employees or retirees of Transco Energy Company on December 31, 1995, and other miscellaneous defined participant groups. Certain of these other postretirement benefit plans, particularly the subsidized retiree medical benefit plans, provide for retiree contributions and contain other cost-sharing features such as deductibles, co-payments, and co-insurance. The accounting for these plans anticipates future cost-sharing that is consistent with our expressed intent to increase the retiree contribution level generally in line with health care cost increases.
103
THE WILLIAMS COMPANIES, INC.
NOTES TO CONSOLIDATED FINANCIAL STATEMENTS — (Continued)
Benefit Obligations
The following table presents the changes in benefit obligations and plan assets for pension benefits and other postretirement benefits for the years indicated. The annual measurement date for our plans is December 31. The salespin-off of our power business in 2007WPX did not have a significant impact on our employeepension and other postretirement benefit plans. (See Note 2.)
| | | | | | | | | | | | | | | | | |
| | | | | | Other
| |
| | | | | | Postretirement
| |
| | | Pension Benefits | | | Benefits | |
| | | 2008 | | | 2007 | | | 2008 | | | 2007 | |
| | | (Millions) | |
| |
| Change in benefit obligation: | | | | | | | | | | | | | | | | |
| Benefit obligation at beginning of year | | $ | 896 | | | $ | 931 | | | $ | 284 | | | $ | 312 | |
| Service cost | | | 23 | | | | 23 | | | | 2 | | | | 3 | |
| Interest cost | | | 60 | | | | 54 | | | | 18 | | | | 17 | |
| Plan participants’ contributions | | | — | | | | — | | | | 5 | | | | 5 | |
| Benefits paid | | | (70 | ) | | | (64 | ) | | | (23 | ) | | | (23 | ) |
| Medicare Part D subsidy | | | — | | | | — | | | | 2 | | | | — | |
| Plan amendment | | | — | | | | — | | | | (38 | ) | | | — | |
| Actuarial (gain) loss | | | 126 | | | | (48 | ) | | | 23 | | | | (30 | ) |
| | | | | | | | | | | | | | | | | |
| Benefit obligation at end of year | | | 1,035 | | | | 896 | | | | 273 | | | | 284 | |
| | | | | | | | | | | | | | | | | |
| Change in plan assets: | | | | | | | | | | | | | | | | |
| Fair value of plan assets at beginning of year | | | 1,074 | | | | 1,005 | | | | 192 | | | | 180 | |
| Actual return on plan assets | | | (360 | ) | | | 92 | | | | (62 | ) | | | 15 | |
| Employer contributions | | | 61 | | | | 41 | | | | 14 | | | | 15 | |
| Plan participants’ contributions | | | — | | | | — | | | | 5 | | | | 5 | |
| Benefits paid | | | (70 | ) | | | (64 | ) | | | (23 | ) | | | (23 | ) |
| | | | | | | | | | | | | | | | | |
| Fair value of plan assets at end of year | | | 705 | | | | 1,074 | | | | 126 | | | | 192 | |
| | | | | | | | | | | | | | | | | |
| Funded status — overfunded (underfunded) | | $ | (330 | ) | | $ | 178 | | | $ | (147 | ) | | $ | (92 | ) |
| | | | | | | | | | | | | | | | | |
| Accumulated benefit obligation | | $ | 959 | | | $ | 838 | | | | | | | | | |
| | | | | | | | | | | | | | | | | |
2). Generally, our pension and other postretirement benefit plans have retained the benefit obligations associated with vested benefits earned by eligible employees that transferred to WPX due to the spin-off. No plan assets transferred to WPX.105
THE WILLIAMS COMPANIES, INC.
NOTES TO CONSOLIDATED FINANCIAL STATEMENTS – (Continued)
| | | | | | | | | | | | | | | | |
| | | Pension Benefits | | | Other
Postretirement
Benefits | |
| | | 2011 | | | 2010 | | | 2011 | | | 2010 | |
| | | (Millions) | |
Change in benefit obligation: | | | | | | | | | | | | | | | | |
Benefit obligation at beginning of year | | $ | 1,267 | | | $ | 1,118 | | | $ | 289 | | | $ | 259 | |
Service cost | | | 41 | | | | 35 | | | | 2 | | | | 2 | |
Interest cost | | | 64 | | | | 64 | | | | 15 | | | | 15 | |
Plan participants’ contributions | | | — | | | | — | | | | 6 | | | | 6 | |
Benefits paid | | | (66 | ) | | | (58 | ) | | | (22 | ) | | | (24 | ) |
Medicare Part D and Early Retiree Reinsurance Program subsidies | | | — | | | | — | | | | 4 | | | | 2 | |
Plan amendment | | | — | | | | — | | | | (3 | ) | | | (1 | ) |
Actuarial loss | | | 143 | | | | 108 | | | | 48 | | | | 30 | |
Settlements | | | (8 | ) | | | — | | | | — | | | | — | |
| | | | | | | | | | | | | | | | |
Benefit obligation at end of year | | | 1,441 | | | | 1,267 | | | | 339 | | | | 289 | |
| | | | | | | | | | | | | | | | |
Change in plan assets: | | | | | | | | | | | | | | | | |
Fair value of plan assets at beginning of year | | | 971 | | | | 860 | | | | 162 | | | | 148 | |
Actual return on plan assets | | | — | | | | 108 | | | | (2 | ) | | | 17 | |
Employer contributions | | | 68 | | | | 61 | | | | 15 | | | | 15 | |
Plan participants’ contributions | | | — | | | | — | | | | 6 | | | | 6 | |
Benefits paid | | | (66 | ) | | | (58 | ) | | | (22 | ) | | | (24 | ) |
Settlements | | | (8 | ) | | | — | | | | — | | | | — | |
| | | | | | | | | | | | | | | | |
Fair value of plan assets at end of year | | | 965 | | | | 971 | | | | 159 | | | | 162 | |
| | | | | | | | | | | | | | | | |
Funded status - underfunded | | $ | (476 | ) | | $ | (296 | ) | | $ | (180 | ) | | $ | (127 | ) |
| | | | | | | | | | | | | | | | |
Accumulated benefit obligation | | $ | 1,415 | | | $ | 1,224 | | | | | | | | | |
| | | | | | | | | | | | | | | | |
The net overfunded/underfunded status of our pension plans and other postretirement benefit plans presented in the previous table are recognized in the Consolidated Balance Sheet within the following accounts:
| | | | | | | | | |
| | | December 31, | |
| | | 2008 | | | 2007 | |
| | | (Millions) | |
| |
| Overfunded pension plans: | | | | | | | | |
Noncurrent assets | | $ | — | | | $ | 203 | |
| Underfunded pension plans: | | | | | | | | |
Current liabilities | | | 1 | | | | 1 | |
Noncurrent liabilities | | | 329 | | | | 24 | |
| Underfunded other postretirement benefit plans: | | | | | | | | |
Current liabilities | | | 8 | | | | 9 | |
Noncurrent liabilities | | | 139 | | | | 83 | |
104
| | | | | | | | |
| | | December 31, | |
| | | 2011 | | | 2010 | |
| | | (Millions) | |
Underfunded pension plans: | | | | | | | | |
Current liabilities | | $ | 7 | | | $ | 7 | |
Noncurrent liabilities | | | 469 | | | | 289 | |
Underfunded other postretirement benefit plans: | | | | | | | | |
Current liabilities | | | 8 | | | | 8 | |
Noncurrent liabilities | | | 172 | | | | 119 | |
THE WILLIAMS COMPANIES, INC.
NOTES TO CONSOLIDATED FINANCIAL STATEMENTS — (Continued)
The plan assets within our other postretirement benefit plans are intended to be used for the payment of benefits for certain groups of participants. Thecurrent liabilitiesfor the other postretirement benefit plans represent the current portion of benefits expected to be payable in the subsequent year for the groups of participants whose benefits are not expected to be paid from plan assets.
The 2008pension plans’ benefit obligationactuarial lossesof $143 million in 2011 and $108 million in 2010 are primarily due to the impact of decreases in the discount rates utilized to calculate the benefit obligation. The 2011 benefit obligationactuarial lossof $126$48 million for our pensionother postretirement benefit plans is primarily due to the impact of decreases in the discount rate utilized to calculate the benefit obligation. The 2010 benefit
106
THE WILLIAMS COMPANIES, INC.
NOTES TO CONSOLIDATED FINANCIAL STATEMENTS – (Continued)
obligationactuarial lossof $30 million for our other postretirement benefit plans is also primarily due to the impact of decreases in the discount rate utilized to calculate the benefit obligation andas well as changes to medical claims experience. In 2011, the mortality assumptions. The 2007 benefit obligationactuarial loss includes a curtailment gainof $48$4 million for our pension plans is due primarily to the impact of changes in the discount rate assumptions utilized to calculate the benefit obligation. The 2008 benefit obligationactuarial lossof $23and $1 million for our other postretirement benefit plans is due primarily to the impactspin-off of the decrease in the discount rate used to calculate the benefit obligation and changes to the mortality assumptions. The 2008 other postretirement benefitsplan amendmentof $38 million is due to an increase in the retirees’ cost-sharing percentage within our subsidized retiree medical benefit plans. The 2007 benefit obligationactuarial gainof $30 million for our other postretirement benefit plans is due primarily to the impact of the increase in the discount rate used to calculate the benefit obligation and a decrease in the number of eligible participants in the plan.
WPX.At December 31, 2008,2011 and 2010, all of our pension plans had a projected benefit obligation and accumulated benefit obligation in excess of plan assets. At December 31, 2007, only our unfunded nonqualified pension plans had projected benefit obligations and accumulated benefit obligations in excess of plan assets.
The projected benefit obligation of the unfunded nonqualified pension plans was $25 million and the accumulated benefit obligation was $22 million at December 31, 2007. There are no assets for these plans.
The current accounting rules for the determination ofnet periodic benefit expenseallowallows for the delayed recognition of gains and losses caused by differences between actual and assumed outcomes for items such as estimated return on plan assets, or caused by changes in assumptions for items such as discount rates or estimated future compensation levels. Thenet actuarial gain (loss)losspresented in the following table and recorded inaccumulated other comprehensive lossandnet regulatory assetsrepresents the cumulative net deferred gain (loss)loss from these types of differences or changes which have not yet been recognized in the Consolidated Statement of Income.Operations. A portion of thenet actuarial gain (loss)lossis amortized over the participants’ average remaining future years of service, which is approximately 1213 years for both our pension plans and approximately 10 years for our other postretirement benefit plans.
Pre-tax amounts not yet recognized innet periodic benefit expenseat December 31 are as follows:
| | | | | | | | | | | | | | | | | |
| | | | | | Other
| |
| | | | | | Postretirement
| |
| | | Pension Benefits | | | Benefits | |
| | | 2008 | | | 2007 | | | 2008 | | | 2007 | |
| | | (Millions) | |
| |
Amounts included inaccumulated other comprehensive loss: | | | | | | | | | | | | | | | | |
| Prior service (cost) credit | | $ | (5 | ) | | $ | (6 | ) | | $ | 12 | | | $ | (5 | ) |
| Net actuarial gain (loss) | | | (708 | ) | | | (156 | ) | | | (8 | ) | | | 7 | |
Amounts included innet regulatory assetsassociated with our FERC-regulated gas pipelines: | | | | | | | | | | | | | | | | |
| Prior service credit | | | N/A | | | | N/A | | | $ | 24 | | | $ | 3 | |
| Net actuarial gain (loss) | | | N/A | | | | N/A | | | | (57 | ) | | | 26 | |
105
| | | | | | | | | | | | | | | | |
| | | Pension Benefits | | | Other
Postretirement
Benefits | |
| | | 2011 | | | 2010 | | | 2011 | | | 2010 | |
| | | (Millions) | |
Amounts included inaccumulated other comprehensive loss: | | | | | | | | | | | | | | | | |
Prior service (cost) credit | | $ | (2 | ) | | $ | (3 | ) | | $ | 8 | | | $ | 10 | |
Net actuarial loss | | | (835 | ) | | | (657 | ) | | | (40 | ) | | | (20 | ) |
Amounts included innet regulatory assets associated with our FERC-regulated gas pipelines: | | | | | | | | | | | | | | | | |
Prior service credit | | | N/A | | | | N/A | | | $ | 14 | | | $ | 20 | |
Net actuarial loss | | | N/A | | | | N/A | | | | (85 | ) | | | (48 | ) |
THE WILLIAMS COMPANIES, INC.
NOTES TO CONSOLIDATED FINANCIAL STATEMENTS — (Continued)
Net Periodic Benefit Expense and Items Recognized in Other Comprehensive Income (Loss)
Net periodic benefit expenseand other changes in plan assets and benefit obligations recognized inother comprehensive income (loss)before taxes forIn addition to the years ended December 31, 2008, 2007, and 2006, consist of the following:
| | | | | | | | | | | | | | | | | | | | | | | | | |
| | | | | | Other
| |
| | | Pension Benefits | | | Postretirement Benefits | |
| | | 2008 | | | 2007 | | | 2006 | | | 2008 | | | 2007 | | | 2006 | |
| | | (Millions) | |
| |
| Components of net periodic benefit expense: | | | | | | | | | | | | | | | | | | | | | | | | |
| Service cost | | $ | 23 | | | $ | 23 | | | $ | 22 | | | $ | 2 | | | $ | 3 | | | $ | 3 | |
| Interest cost | | | 60 | | | | 54 | | | | 51 | | | | 18 | | | | 17 | | | | 17 | |
| Expected return on plan assets | | | (79 | ) | | | (73 | ) | | | (67 | ) | | | (13 | ) | | | (12 | ) | | | (11 | ) |
| Amortization of prior service cost (credit) | | | 1 | | | | — | | | | (1 | ) | | | — | | | | — | | | | — | |
| Amortization of net actuarial loss | | | 13 | | | | 19 | | | | 21 | | | | — | | | | — | | | | — | |
| Amortization of regulatory asset | | | — | | | | 1 | | | | — | | | | 5 | | | | 5 | | | | 7 | |
| | | | | | | | | | | | | | | | | | | | | | | | | |
| Net periodic benefit expense | | $ | 18 | | | $ | 24 | | | $ | 26 | | | $ | 12 | | | $ | 13 | | | $ | 16 | |
| | | | | | | | | | | | | | | | | | | | | | | | | |
Other changes in plan assets and benefit obligations recognized inother comprehensive income (loss): | | | | | | | | | | | | | | | | | | | | | | | | |
| Net actuarial (gain) loss | | $ | 565 | | | $ | (68 | ) | | | | | | $ | 15 | | | $ | (15 | ) | | | | |
| Prior service credit | | | — | | | | — | | | | | | | | (16 | ) | | | — | | | | | |
| Amortization of net actuarial loss | | | (13 | ) | | | (19 | ) | | | | | | | — | | | | — | | | | | |
| Amortization of prior service cost | | | (1 | ) | | | — | | | | | | | | (1 | ) | | | (2 | ) | | | | |
| | | | | | | | | | | | | | | | | | | | | | | | | |
Other changes in plan assets and benefit obligations recognized inother comprehensive income (loss) | | | 551 | | | | (87 | ) | | | | | | | (2 | ) | | | (17 | ) | | | | |
| | | | | | | | | | | | | | | | | | | | | | | | | |
Total recognized innet periodic benefit expenseandother comprehensive income (loss) | | $ | 569 | | | $ | (63 | ) | | | | | | $ | 10 | | | $ | (4 | ) | | | | |
| | | | | | | | | | | | | | | | | | | | | | | | | |
Other changes in plan assets and benefit obligations for our other postretirement benefit plans associated with our FERC-regulated gas pipelines are recognized innet regulatory assetsat December 31, 2008, and includenet actuarial lossof $83 million,prior service creditof $22 million, andamortization of prior service creditof $1 million. At December 31, 2007, amounts recognized included innet regulatory liabilitiesincludednet actuarial gainof $18 million andamortization of prior service creditof $2 million.
Pre-tax amounts expected to be amortized innet periodic benefit expensein 2009 are as follows:
| | | | | | | | | |
| | | | | | Other
| |
| | | Pension
| | | Postretirement
| |
| | | Benefits | | | Benefits | |
| | | (Millions) | |
| |
Amounts included inaccumulated other comprehensive loss: | | | | | | | | |
| Prior service cost (credit) | | $ | 1 | | | $ | (2 | ) |
| Net actuarial loss | | | 45 | | | | — | |
Amounts included innet regulatory assetsassociated with our FERC-regulated gas pipelines: | | | | | | | | |
| Prior service credit | | | N/A | | | $ | (5 | ) |
| Net actuarial loss | | | N/A | | | | 3 | |
106
THE WILLIAMS COMPANIES, INC.
NOTES TO CONSOLIDATED FINANCIAL STATEMENTS — (Continued)
The the previous table, differences in the amount of actuarially determinednet periodic benefit expensefor our other postretirement benefit plans and the other postretirement benefit costs recovered in rates for our FERC-regulated gas pipelines are deferred as a regulatory asset or liability. At December 31, 2008, weWe havenet regulatory assets liabilitiesof $26$34 million and at December 31, 2007, we had net regulatory liabilities of $282011 and $23 million at December 31, 2010 related to these deferrals. These amounts will be reflected in future rates based on the gas pipelines’ rate structures.
107
THE WILLIAMS COMPANIES, INC.
NOTES TO CONSOLIDATED FINANCIAL STATEMENTS – (Continued)
Net Periodic Benefit Expense and Items Recognized in Other Comprehensive Income (Loss)
Net periodic benefit expenseand other changes in plan assets and benefit obligations recognized inother comprehensive income (loss)before taxes for the years ended December 31 consist of the following:
| | | | | | | | | | | | | | | | | | | | | | | | |
| | | | | | Other | |
| | | Pension Benefits | | | Postretirement
Benefits | |
| | | 2011 | | | 2010 | | | 2009 | | | 2011 | | | 2010 | | | 2009 | |
| | | (Millions) | |
Components of net periodic benefit expense: | | | | | | | | | | | | | | | | | | | | | | | | |
Service cost | | $ | 41 | | | $ | 35 | | | $ | 32 | | | $ | 2 | | | $ | 2 | | | $ | 2 | |
Interest cost | | | 64 | | | | 64 | | | | 62 | | | | 15 | | | | 15 | | | | 16 | |
Expected return on plan assets | | | (77 | ) | | | (71 | ) | | | (61 | ) | | | (10 | ) | | | (9 | ) | | | (9 | ) |
Amortization of prior service cost (credit) | | | 1 | | | | 1 | | | | 1 | | | | (11 | ) | | | (14 | ) | | | (11 | ) |
Amortization of net actuarial loss | | | 38 | | | | 35 | | | | 43 | | �� | | 3 | | | | 3 | | | | 3 | |
Net actuarial loss from settlements | | | 4 | | | | — | | | | — | | | | — | | | | — | | | | — | |
Amortization of regulatory asset | | | — | | | | — | | | | 1 | | | | 1 | | | | 1 | | | | 5 | |
| | | | | | | | | | | | | | | | | | | | | | | | |
Net periodic benefit expense | | $ | 71 | | | $ | 64 | | | $ | 78 | | | $ | — | | | $ | (2 | ) | | $ | 6 | |
| | | | | | | | | | | | | | | | | | | | | | | | |
| | |
| | | | | | | Other | |
| | | Pension Benefits | | | Postretirement
Benefits | |
| | | 2011 | | | 2010 | | | 2009 | | | 2011 | | | 2010 | | | 2009 | |
| | | (Millions) | |
Other changes in plan assets and benefit obligations recognized inother comprehensive income (loss): | | | | | | | | | | | | | | | | | | | | | | | | |
Net actuarial (gain) loss | | $ | 220 | | | $ | 71 | | | $ | (44 | ) | | $ | 21 | | | $ | 12 | | | $ | 1 | |
Prior service credit | | | — | | | | — | | | | — | | | | (2 | ) | | | — | | | | (7 | ) |
Amortization of prior service (cost) credit | | | (1 | ) | | | (1 | ) | | | (1 | ) | | | 4 | | | | 5 | | | | 4 | |
Amortization of net actuarial loss and loss from settlements | | | (42 | ) | | | (35 | ) | | | (43 | ) | | | (1 | ) | | | (1 | ) | | | — | |
| | | | | | | | | | | | | | | | | | | | | | | | |
Other changes in plan assets and benefit obligations recognized inother comprehensive income (loss) | | | 177 | | | | 35 | | | | (88 | ) | | | 22 | | | | 16 | | | | (2 | ) |
| | | | | | | | | | | | | | | | | | | | | | | | |
Total recognized innet periodic benefit expense andother comprehensive income (loss) | | $ | 248 | | | $ | 99 | | | $ | (10 | ) | | $ | 22 | | | $ | 14 | | | $ | 4 | |
| | | | | | | | | | | | | | | | | | | | | | | | |
Included innet periodic benefit expense in the previous table is expense associated with active and former employees that supported WPX’s operations. This expense was directly charged to WPX and is included in income (loss) from discontinued operations. These amounts totaled $8 million in 2011, and $7 million in both 2010 and 2009 for our pension plans and totaled less than $1 million for each period for our other postretirement benefit plans. The spin-off of WPX is not expected to have a significant impact onnet periodic benefit expense in future periods.
Other changes in plan assets and benefit obligations for our other postretirement benefit plans associated with our FERC-regulated gas pipelines are recognized innet regulatory assetsat December 31, 2011, and include anet actuarial lossof $39 million,prior service credit of $1 million,amortization of prior service credit of $7 million, andamortization of net actuarial loss of $2 million. At December 31, 2010, amounts recognized innet regulatory assets included anet actuarial loss of $10 million,prior service credit of $1 million,amortization of prior service credit of $9 million, andamortization of net actuarial loss of $2 million. At December 31, 2009, amounts recognized innet regulatory assetsincluded a net actuarial gainof $14 million,prior service creditof $11 million,amortization of prior service creditof $7 million, andamortization of net actuarial loss of $3 million.
108
THE WILLIAMS COMPANIES, INC.
NOTES TO CONSOLIDATED FINANCIAL STATEMENTS – (Continued)
Pre-tax amounts expected to be amortized innet periodic benefit expense in 2012 are as follows:
| | | | | | | | |
| | | | | | Other | |
| | | Pension | | | Postretirement | |
| | | Benefits | | | Benefits | |
| | | (Millions) | |
Amounts included in accumulated other comprehensive loss: | | | | | | | | |
Prior service cost (credit) | | $ | 1 | | | $ | (3 | ) |
Net actuarial loss | | | 53 | | | | 3 | |
Amounts included innet regulatory assets associated with our FERC- regulated gas pipelines: | | | | | | | | |
Prior service credit | | | N/A | | | $ | (4 | ) |
Net actuarial loss | | | N/A | | | | 7 | |
Key Assumptions
The weighted-average assumptions utilized to determine benefit obligations as of December 31 2008, and 2007, are as follows:
| | | | | | | | | | | | | | | | | |
| | | | | | Other
| |
| | | | | | Postretirement
| |
| | | Pension Benefits | | | Benefits | |
| | | 2008 | | | 2007 | | | 2008 | | | 2007 | |
| |
| Discount rate | | | 6.08 | % | | | 6.41 | % | | | 6.00 | % | | | 6.40 | % |
| Rate of compensation increase | | | 5.00 | | | | 5.00 | | | | N/A | | | | N/A | |
| | | | | | | | | | | | | | | | |
| | | | | | | | | Other | |
| | | | | | | | | Postretirement | |
| | | Pension Benefits | | | Benefits | |
| | | 2011 | | | 2010 | | | 2011 | | | 2010 | |
Discount rate | | | 3.98 | % | | | 5.20 | % | | | 4.22 | % | | | 5.35 | % |
Rate of compensation increase | | | 4.52 | | | | 5.00 | | | | N/A | | | | N/A | |
The weighted-average assumptions utilized to determinenet periodic benefit expensefor the years ended December 31 2008, 2007, and 2006, are as follows:
| | | | | | | | | | | | | | | | | | | | | | | | | |
| | | | | | Other
| |
| | | Pension Benefits | | | Postretirement Benefits | |
| | | 2008 | | | 2007 | | | 2006 | | | 2008 | | | 2007 | | | 2006 | |
| |
| Discount rate | | | 6.41 | % | | | 5.80 | % | | | 5.65 | % | | | 6.40 | % | | | 5.80 | % | | | 5.60 | % |
| Expected long-term rate of return on plan assets | | | 7.75 | | | | 7.75 | | | | 7.75 | | | | 7.00 | | | | 6.97 | | | | 6.95 | |
| Rate of compensation increase | | | 5.00 | | | | 5.00 | | | | 5.00 | | | | N/A | | | | N/A | | | | N/A | |
| | | | | | | | | | | | | | | | | | | | | | | | |
| | | | | | Other | |
| | | Pension Benefits | | | Postretirement Benefits | |
| | | 2011 | | | 2010 | | | 2009 | | | 2011 | | | 2010 | | | 2009 | |
Discount rate | | | 5.19 | % | | | 5.78 | % | | | 6.08 | % | | | 5.35 | % | | | 5.80 | % | | | 6.00 | % |
Expected long-term rate of return on plan assets | | | 7.50 | | | | 7.50 | | | | 7.75 | | | | 6.54 | | | | 6.51 | | | | 7.00 | |
Rate of compensation increase | | | 5.00 | | | | 5.00 | | | | 5.00 | | | | N/A | | | | N/A | | | | N/A | |
The discount rates for our pension and other postretirement benefit plans were determined separately based on an approach specific to our plans. The year-end discount rates were determined considering a yield curve comprised of high-quality corporate bonds published by a large securities firm and the timing of the expected benefit cash flows of each plan.
The decrease in discount rates from December 31, 2010 to December 31, 2011 is primarily due to the general market decline in yields on long-term, high-quality corporate debt securities.The expected long-term rates of return on plan assets were determined by combining a review of the historical returns realized within the portfolio, the investment strategy included in the plans’ Investment Policy Statement, and capital market projections for the asset classificationsclasses in which the portfolio is invested and the target weightings of each asset classification.
class.The expected return on plan assets component ofnet periodic benefit expenseis calculated using the market-related value of plan assets. For assets held in our pension plans, the market-related value of plan assets is equal to the fair value of plan assets adjusted to reflect amortization of gains or losses associated with the difference between the expected return on plan assets and the actual return on plan assets over a five-year period. Additionally, the market-related value of plan assets may be no more than 110 percent or less than 90 percent of
109
THE WILLIAMS COMPANIES, INC.
NOTES TO CONSOLIDATED FINANCIAL STATEMENTS – (Continued)
the fair value of plan assets at the beginning of the year. The market-related value of plan assets for our other postretirement benefit plans is equal to the unadjusted fair value of plan assets at the beginning of the year.
The mortality assumptions used to determine the obligations for our pension and other postretirement benefit plans are related to the experience of the plans and the best estimate of expected plan mortality.mortality rates for the participants in these plans. The selected mortality tables are among the most recent tables available.
107
THE WILLIAMS COMPANIES, INC.
NOTES TO CONSOLIDATED FINANCIAL STATEMENTS — (Continued)
The assumed health care cost trend rate for 20092012 is 8.68.2 percent, increases slightly in 2013, and systematicallythen decreases to 5.15.0 percent by 2018.2021. The health care cost trend rate assumption has a significant effect on the amounts reported. A one-percentage-point change in assumed health care cost trend rates would have the following effects:
| | | | | | | | | |
| | | Point increase | | | Point decrease | |
| | | (Millions) | |
| |
| Effect on total of service and interest cost components | | $ | 3 | | | $ | (4 | ) |
| Effect on other postretirement benefit obligation | | | 53 | | | | (42 | ) |
| | | | | | | | |
| | | Point increase | | | Point decrease | |
| | | (Millions) | |
Effect on total of service and interest cost components | | $ | 2 | | | $ | (2 | ) |
Effect on other postretirement benefit obligation | | | 47 | | | | (39 | ) |
Plan Assets
The investment policy for our pension and other postretirement benefit plans articulatesprovides for an investment philosophystrategy in accordance with ERISA, which governs the investment of the assets in a diversified portfolio. The plans follow a policy of diversifying the investments across various asset classes and investment strategy formanagers. Additionally, the assets of the pension plans andinvestment returns on approximately one half of the assets40 percent of the other postretirement benefit plans include maximizing returns with reasonable and prudent levels of risk. The investment returns on the approximate one half of remainingplan assets of the other postretirement benefit plans isare subject to federal income tax; therefore, the investment strategy also includes investingcertain investments are managed in a tax efficient manner.
The following table presents the weighted-averagepension plans’ target asset allocationsallocation range at December 31, 2008, and 2007 and target asset allocations at December 31, 2008, by asset category.
| | | | | | | | | | | | | | | | | | | | | | | | | |
| | | | | | Other
| |
| | | Pension Benefits | | | Postretirement Benefits | |
| | | 2008 | | | 2007 | | | Target | | | 2008 | | | 2007 | | | Target | |
| |
| Equity securities | | | 78 | % | | | 84 | % | | | 84 | % | | | 71 | % | | | 79 | % | | | 80 | % |
| Debt securities | | | 17 | | | | 12 | | | | 16 | | | | 17 | | | | 12 | | | | 20 | |
| Other | | | 5 | | | | 4 | | | | — | | | | 12 | | | | 9 | | | | — | |
| | | | | | | | | | | | | | | | | | | | | | | | | |
| | | | 100 | % | | | 100 | % | | | 100 | % | | | 100 | % | | | 100 | % | | | 100 | % |
| | | | | | | | | | | | | | | | | | | | | | | | | |
Included in2011 was 54 percent to 66 percent equity securities, are investments inwhich includes the commingled investment funds that invest entirelyinvested in equity securities, and comprise 2436 percent at December 31, 2008, and 40to 44 percent at December 31, 2007, offixed income securities, including the pension plans’ weighted-average assets, and 13 percent at December 31, 2008, and 29 percent at December 31, 2007, of the other postretirement benefit plans’ weighted-average assets. During 2008, afixed income commingled investment fund, held within the pension plans and the other postretirement benefit plans was replaced with direct investments in certain equity securities. Other assets are comprised primarily of cash and cash equivalents.
The assets are invested in accordance withmanagement funds. Within equity securities, the target allocations identified in the previous table. The investment policy providesrange for minimumU.S. equity securities is 37 percent to 45 percent and maximum ranges for the broad asset classes in the previous table. Additional target allocations are identified for specific classes ofinternational equity securities.securities is 17 percent to 21 percent. The asset allocation ranges established by the investment policy are based upon a long-term investment perspective. The ranges are more heavilycontinues to be weighted toward equity securities since the liabilitiesobligations of the pension and other postretirement benefit plans are long-term in nature and historically equity securities have significantly outperformed other asset classes over long periods of time. In December 2008, the Investment Committee voted to increase the percentage of assets allocated to debt securities and cash and cash equivalents, included within the other category in the previous table, to approximately30-35 percent, as allowed in the investment policy. The reallocation is expected to be completed during the first quarter of 2009. The Investment Committee monitors the markets and asset allocations and at any time may adjust the allocation to debt securities and cash and cash equivalents downward, closer to the target asset allocation shown in the previous table.
Equity security investments are restricted to high-quality, readily marketable securities that are actively traded on the major U.S. and foreign national exchanges. Investment in Williams’ securities or an entity in which Williams has a majority ownership is prohibited in the pension plans except where these securities may be owned in a commingled investment
108
THE WILLIAMS COMPANIES, INC.
NOTES TO CONSOLIDATED FINANCIAL STATEMENTS — (Continued)
vehicle fund in which the
pension plans’
trust invests.trusts invest. No more than
five5 percent of the total stock portfolio valued at market may be invested in the common stock of any one corporation.
The following securities and transactions are not authorized: unregistered securities, commodities or commodity contracts, short sales or margin transactions, or other leveraging strategies. Investment strategies using the direct holding of options or futures require approval and, historically, have not been used; however, these instruments may be used in commingled investment funds. Additionally, real estate equity and natural resource property investments are also not authorized.
Debt security investmentsgenerally restricted.Fixed income securities are restricted to high-quality, marketable securities that may include, but are not necessarily limited to, U.S. Treasury federal agenciessecurities, U.S. government guaranteed and U.S. Government guaranteed obligations,nonguaranteed mortgage-backed securities, government and municipal bonds, and investment grade corporate issues.securities. The overall rating of the debtfixed income security assets is generally required to be at least “A”,“A,” according to the Moody’s or Standard & Poor’s rating system.systems. No more than five5 percent of the total portfolio at the time of purchase may be invested in the debtfixed income securities of any one issuer.issuer with the exception of bond index funds and U.S. Governmentgovernment guaranteed and agency securities are exempt from this provision.
securities.110
THE WILLIAMS COMPANIES, INC.
NOTES TO CONSOLIDATED FINANCIAL STATEMENTS – (Continued)
During 2008, 112011, nine active investment managers and one passive investment manager managed substantially all of the pension plans’ funds and five active investment managers managed the other postretirement benefit plans’ funds. Each of the managers had responsibility for managing a specific portion of these assets and each investment manager was responsible for 1 percent to 16 percent of the assets.
The pension and other postretirement benefit plans’ assets are held primarily in equity securities, including commingled investment funds invested in equity securities, and fixed income securities, including a commingled fund invested in fixed income securities. Within the plans’ investment securities, there are no significant concentrations of risk because of the diversity of the types of investments, diversity of the various industries, and the diversity of the fund managers and investment strategies. Generally, the investments held in the plans are publicly traded, therefore, minimizing liquidity risk in the portfolio.
The pension and other postretirement benefit plans participated in securities lending programs and during 2011, the plans completed their planned exit from these programs. Under the securities lending programs, securities were loaned to selected securities brokerage firms. The title of the securities was transferred to the borrower, but the plans were entitled to all distributions made by the issuer of the securities during the term of the loan and retained the right to redeem the securities on short notice. All loans required collateralization by U.S. government securities, cash, or letters of credit that equaled at least 102 percent of the fair value of the loaned securities plus accrued interest. There were limitations on the aggregate fair value of securities that could be loaned to any one broker and to all brokers as a group. The collateral was invested in repurchase agreements, asset-backed securities, bank notes, corporate floating rate notes, and certificates of deposit. At December 31, 2010, the fair values of the loaned securities were $116 million for the pension plans and $17 million for the other postretirement benefit plans and are included in the following tables. At December 31, 2010, the fair values of securities held as collateral, and the obligation to return the collateral, were $120 million for the pension plans and $17 million for the other postretirement benefit plans and are not included in the following tables. No significant losses were realized during 2011 as a result of the exit from the securities lending programs.
The fair values of our pension plan assets at December 31, 2011 and 2010, by asset class are as follows:
| | | | | | | | | | | | | | | | |
| | | 2011 | |
| | | Level 1 | | | Level 2 | | | Level 3 | | | Total | |
| | | (Millions) | |
Pension assets: | | | | | | | | | | | | | | | | |
Cash management fund (1) | | $ | 43 | | | $ | — | | | $ | — | | | $ | 43 | |
Equity securities: | | | | | | | | | | | | | | | | |
U.S. large cap | | | 170 | | | | — | | | | — | | | | 170 | |
U.S. small cap | | | 121 | | | | — | | | | — | | | | 121 | |
International developed markets large cap growth | | | 4 | | | | 57 | | | | — | | | | 61 | |
Emerging markets growth | | | 3 | | | | 9 | | | | — | | | | 12 | |
Commingled investment funds: | | | | | | | | | | | | | | | | |
Equities - U.S. large cap (2) | | | — | | | | 147 | | | | — | | | | 147 | |
Equities - Emerging markets value (3) | | | — | | | | 27 | | | | — | | | | 27 | |
Equities - International developed markets large cap value (4) | | | — | | | | 69 | | | | — | | | | 69 | |
Fixed income - Corporate bonds (5) | | | — | | | | 58 | | | | — | | | | 58 | |
Fixed income securities (6): | | | | | | | | | | | | | | | | |
U.S. Treasury securities | | | 16 | | | | — | | | | — | | | | 16 | |
Mortgage-backed securities | | | — | | | | 65 | | | | — | | | | 65 | |
Corporate bonds | | | — | | | | 169 | | | | — | | | | 169 | |
Insurance company investment contracts and other | | | — | | | | 7 | | | | — | | | | 7 | |
| | | | | | | | | | | | | | | | |
Total assets at fair value at December 31, 2011 | | $ | 357 | | | $ | 608 | | | $ | — | | | $ | 965 | |
| | | | | | | | | | | | | | | | |
111
THE WILLIAMS COMPANIES, INC.
NOTES TO CONSOLIDATED FINANCIAL STATEMENTS – (Continued)
| | | | | | | | | | | | | | | | |
| | | 2010 | |
| | | Level 1 | | | Level 2 | | | Level 3 | | | Total | |
| | | (Millions) | |
Pension assets: | | | | | | | | | | | | | | | | |
Cash management fund (1) | | $ | 30 | | | $ | — | | | $ | — | | | $ | 30 | |
Equity securities: | | | | | | | | | | | | | | | | |
U.S. large cap | | | 192 | | | | — | | | | — | | | | 192 | |
U.S. small cap | | | 137 | | | | — | | | | — | | | | 137 | |
International developed markets large cap growth | | | 4 | | | | 68 | | | | — | | | | 72 | |
Emerging markets growth | | | 4 | | | | 12 | | | | — | | | | 16 | |
Commingled investment funds: | | | | | | | | | | | | | | | | |
Equities - U.S. large cap (2) | | | — | | | | 168 | | | | — | | | | 168 | |
Equities - Emerging markets value (3) | | | — | | | | 35 | | | | — | | | | 35 | |
Equities - International developed markets large cap value (4) | | | — | | | | 80 | | | | — | | | | 80 | |
Fixed income securities (6): | | | | | | | | | | | | | | | | |
U.S. Treasury securities | | | 17 | | | | 3 | | | | — | | | | 20 | |
Mortgage-backed securities | | | — | | | | 64 | | | | — | | | | 64 | |
Corporate bonds | | | — | | | | 150 | | | | — | | | | 150 | |
Insurance company investment contracts and other | | | — | | | | 7 | | | | — | | | | 7 | |
| | | | | | | | | | | | | | | | |
Total assets at fair value at December 31, 2010 | | $ | 384 | | | $ | 587 | | | $ | — | | | $ | 971 | |
| | | | | | | | | | | | | | | | |
The fair values of our other postretirement benefits plan assets at December 31, 2011 and 2010, by asset class are as follows:
| | | | | | | | | | | | | | | | |
| | | 2011 | |
| | | Level 1 | | | Level 2 | | | Level 3 | | | Total | |
| | | (Millions) | |
Other postretirement benefit assets: | | | | | | | | | | | | | | | | |
Cash management funds (1) | | $ | 16 | | | $ | — | | | $ | — | | | $ | 16 | |
Equity securities: | | | | | | | | | | | | | | | | |
U.S. large cap | | | 42 | | | | — | | | | — | | | | 42 | |
U.S. small cap | | | 20 | | | | — | | | | — | | | | 20 | |
International developed markets large cap growth | | | 1 | | | | 12 | | | | — | | | | 13 | |
Emerging markets growth | | | 1 | | | | 1 | | | | — | | | | 2 | |
Commingled investment funds: | | | | | | | | | | | | | | | | |
Equities - U.S. large cap (2) | | | — | | | | 15 | | | | — | | | | 15 | |
Equities - Emerging markets value (3) | | | — | | | | 3 | | | | — | | | | 3 | |
Equities - International developed markets large cap value (4) | | | — | | | | 7 | | | | — | | | | 7 | |
Fixed income - Corporate bonds (5) | | | — | | | | 6 | | | | — | | | | 6 | |
Fixed income securities (7): | | | | | | | | | | | | | | | | |
U.S. Treasury securities | | | 2 | | | | — | | | | — | | | | 2 | |
Government and municipal bonds | | | — | | | | 10 | | | | — | | | | 10 | |
Mortgage-backed securities | | | — | | | | 6 | | | | — | | | | 6 | |
Corporate bonds | | | — | | | | 17 | | | | — | | | | 17 | |
| | | | | | | | | | | | | | | | |
Total assets at fair value at December 31, 2011 | | $ | 82 | | | $ | 77 | | | $ | — | | | $ | 159 | |
| | | | | | | | | | | | | | | | |
112
THE WILLIAMS COMPANIES, INC.
NOTES TO CONSOLIDATED FINANCIAL STATEMENTS – (Continued)
| | | | | | | | | | | | | | | | |
| | | 2010 | |
| | | Level 1 | | | Level 2 | | | Level 3 | | | Total | |
| | | (Millions) | |
Other postretirement benefit assets: | | | | | | | | | | | | | | | | |
Cash management funds (1) | | $ | 15 | | | $ | — | | | $ | — | | | $ | 15 | |
Equity securities: | | | | | | | | | | | | | | | | |
U.S. large cap | | | 44 | | | | — | | | | — | | | | 44 | |
U.S. small cap | | | 24 | | | | — | | | | — | | | | 24 | |
International developed markets large cap growth | | | 1 | | | | 14 | | | | — | | | | 15 | |
Emerging markets growth | | | 1 | | | | 2 | | | | — | | | | 3 | |
Commingled investment funds: | | | | | | | | | | | | | | | | |
Equities - U.S. large cap (2) | | | — | | | | 17 | | | | — | | | | 17 | |
Equities - Emerging markets value (3) | | | — | | | | 3 | | | | — | | | | 3 | |
Equities - International developed markets large cap value (4) | | | — | | | | 8 | | | | — | | | | 8 | |
Fixed income securities (7): | | | | | | | | | | | | | | | | |
U.S. Treasury securities | | | 2 | | | | — | | | | — | | | | 2 | |
Government and municipal bonds | | | — | | | | 10 | | | | — | | | | 10 | |
Mortgage-backed securities | | | — | | | | 6 | | | | — | | | | 6 | |
Corporate bonds | | | — | | | | 15 | | | | — | | | | 15 | |
| | | | | | | | | | | | | | | | |
Total assets at fair value at December 31, 2010 | | $ | 87 | | | $ | 75 | | | $ | — | | | $ | 162 | |
| | | | | | | | | | | | | | | | |
(1) | These funds invest in high credit-quality, short-term corporate, and government money market debt securities that have remaining maturities of approximately one year or less, and are deemed to have minimal credit risk. |
(2) | This fund invests primarily in equity securities comprising the Standard & Poor’s 500 Index. The investment objective of the fund is to approximate the performance of the Standard & Poor’s 500 Index. The fund manager retains the right to restrict withdrawals from the fund as not to disadvantage other investors in the fund. |
(3) | This fund invests in equity securities of international emerging markets for the purpose of capital appreciation. The fund invests primarily in common stocks in the financial, telecommunications, information technology, consumer goods, energy, industrial, and materials sectors. The plans’ trustee is required to notify the fund manager ten days prior to a withdrawal from the fund. The fund manager retains the right to restrict withdrawals from the fund as not to disadvantage other investors in the fund. |
(4) | This fund invests in a diversified portfolio of international equity securities for the purpose of capital appreciation. The fund invests primarily in common stocks in the consumer goods, materials, financial, energy, information technology, industrial, and health care sectors, as well as forward foreign currency exchange contracts. The plans’ trustee is required to notify the fund manager ten days prior to a withdrawal from the fund. The fund manager retains the right to restrict withdrawals from the fund as not to disadvantage other investors in the fund. |
(5) | This fund invests in U.S. Corporate bonds and U.S. Treasury securities. The fund is managed to closely match the characteristics of a long-term corporate bond index fund and seeks to maintain an average credit quality target of A- or above and a maximum 10 percent allocation to BBB rated securities. The fund’s target duration is approximately 20 years. The trustee of the fund reserves the right to delay the processing of deposits or withdrawals in order to ensure that securities transactions will be carried out in an orderly manner. |
(6) | The weighted-average credit quality rating of the pension assets’ fixed income security portfolio is investment grade with a weighted-average duration of 5.6 years for 2011 and 2010. |
(7) | The weighted-average credit quality rating of the other postretirement benefit assets’ fixed income security portfolio is investment grade with a weighted-average duration of 4.8 years for 2011 and 2010. |
113
THE WILLIAMS COMPANIES, INC.
NOTES TO CONSOLIDATED FINANCIAL STATEMENTS – (Continued)
The asset’s fair value measurement level within the fair value hierarchy is based on the lowest level of any input that is significant to the fair value measurement.
Shares of the cash management funds are valued at fair value based on published market prices as of the close of business on the last business day of the year, which represents the net asset values of the shares held.
The fair values of equity securities traded on U.S. exchanges are derived from quoted market prices as of the close of business on the last business day of the year. The fair values of equity securities traded on foreign exchanges are also derived from quoted market prices as of the close of business on an active foreign exchange on the last business day of the year. However, the valuation requires translation of the foreign currency to U.S. dollars and this translation is considered an observable input to the valuation.
The fair value of all commingled investment funds are estimated based on the net asset values per unit of each of the funds. The net asset values per unit represent the aggregate value of the fund’s assets at fair value less liabilities, divided by the number of units outstanding.
The fair value of fixed income securities, except U.S. Treasury notes and bonds, are determined using pricing models. These pricing models incorporate observable inputs such as benchmark yields, reported trades, broker/dealer quotes, and issuer spreads for similar securities to determine fair value. The U.S. Treasury notes and bonds are valued at fair value based on closing prices on the last business day of the year reported in the active market in which the security is traded.
The investment contracts with insurance companies are valued at fair value by discounting the cash flow of a bond using a yield to maturity based on an investment grade index or comparable index with a similar maturity value, maturity period, and nominal coupon rate.
There have been no significant changes in the preceding valuation methodologies used at December 31, 2011 and 2010. Additionally, there were no transfers or reclassifications of investments between Level 1, Level 2, or Level 3 from December 2010 to December 2011. If transfers between levels occur, the transfers will be recognized as of the end of the period.
Plan Benefit Payments and Employer Contributions
Following are the expected benefits to be paid by the plans and the expected federal prescription drug subsidy to be received in the next ten years. These estimates are based on the same assumptions previously discussed and reflect future service as appropriate. The actuarial assumptions are based on long-term expectations and include, but are not limited to, assumptions as to average expected retirement age and form of benefit payment. Actual benefit payments could differ significantly from expected benefit payments if near-term participant behaviors differ significantly from the actuarial assumptions.
| | | | | | | | | | | | | |
| | | | | | | | | Federal
| |
| | | | | | Other
| | | Prescription
| |
| | | Pension
| | | Postretirement
| | | Drug
| |
| | | Benefits | | | Benefits | | | Subsidy | |
| | | (Millions) | |
| |
| 2009 | | $ | 44 | | | $ | 17 | | | $ | (2 | ) |
| 2010 | | | 38 | | | | 18 | | | | (2 | ) |
| 2011 | | | 38 | | | | 18 | | | | (2 | ) |
| 2012 | | | 42 | | | | 18 | | | | (2 | ) |
| 2013 | | | 42 | | | | 18 | | | | (2 | ) |
| 2014 - 2018 | | | 263 | | | | 96 | | | | (13 | ) |
We | | | | | | | | | | | | |
| | | Pension
Benefits | | | Other
Postretirement
Benefits | | | Federal
Prescription
Drug
Subsidy | |
| | | (Millions) | |
2012 | | $ | 74 | | | $ | 17 | | | $ | (2 | ) |
2013 | | | 76 | | | | 17 | | | | (2 | ) |
2014 | | | 88 | | | | 18 | | | | (2 | ) |
2015 | | | 92 | | | | 19 | | | | (3 | ) |
2016 | | | 98 | | | | 20 | | | | (3 | ) |
2017-2021 | | | 576 | | | | 111 | | | | (16 | ) |
114
THE WILLIAMS COMPANIES, INC.
NOTES TO CONSOLIDATED FINANCIAL STATEMENTS – (Continued)
In 2012, we expect to contribute approximately $61$70 million to our tax-qualified pension plans and approximately $16$9 million to our nonqualified pension plans, for a total of approximately $79 million, and approximately $15 million to our other postretirement benefit plans in 2009.
plans.Defined Contribution Plans
We also maintain defined contribution plans for the benefit of substantially all of our employees. Generally, plan participants may contribute a portion of their compensation on a pre-tax and after-tax basis in accordance with the plans’ guidelines. We match employees’ contributions up to certain limits. Our matching contributions charged to expense were $24 million, $22 million, and $19$28 million in 2008, 2007,2011, $26 million in 2010, and 2006, respectively. A fund within one of our defined contribution plans is a nonleveraged employee stock ownership plan (ESOP). The shares held by the ESOP$25 million in 2009. Included in these amounts are treated as outstanding when computing earnings per share and the dividends on the shares held by the ESOP are recorded as a component of retained earnings. Since 2006 there have been no contributions to this ESOP, other than dividend reinvestment, asmatching contributions for purchaseemployees that support WPX’s operations that were directly charged to WPX and included inincome (loss) from discontinued operations that totaled $5 million for each of our stock are no longer allowed within this defined contribution plan.
109
Note 8. Inventories | | | | | | | | |
| | | December 31, | |
| | | 2011 | | | 2010 | |
| | | (Millions) | |
Natural gas liquids and olefins | | $ | 97 | | | $ | 87 | |
Natural gas in underground storage | | | 1 | | | | 62 | |
Materials, supplies, and other | | | 71 | | | | 76 | |
| | | | | | | | |
| | $ | 169 | | | $ | 225 | |
| | | | | | | | |
Note 9. Property, Plant, and Equipment
THE WILLIAMS COMPANIES, INC.
NOTES TO CONSOLIDATED FINANCIAL STATEMENTS — (Continued)
| | | | | | | | | | | | |
| | | Estimated
Useful Life (a)
(Years) | | Depreciation
Rates (a)
(%) | | | | | | |
| | | | | December 31, | |
| | | | | 2011 | | | 2010 | |
| | | | | | | (Millions) | |
Nonregulated: | | | | | | | | | | | | |
Natural gas gathering and processing facilities | | 5 - 40 | | | | $ | 6,435 | | | $ | 6,134 | |
Construction in progress | | (b) | | | | | 648 | | | | 223 | |
Other | | 3 - 45 | | | | | 816 | | | | 773 | |
Regulated: | | | | | | | | | | | | |
Natural gas transmission facilities | | | | .01 - 6.67 | | | 9,593 | | | | 9,066 | |
Construction in progress | | | | (b) | | | 199 | | | | 240 | |
Other | | | | .01 - 33.33 | | | 1,391 | | | | 1,359 | |
| | | | | | | | | | | | |
Total property, plant, and equipment, at cost | | | | | | | 19,082 | | | | 17,795 | |
Accumulated depreciation and amortization | | | | | | | (6,502 | ) | | | (6,041 | ) |
| | | | | | | | | | | | |
Property, plant, and equipment - net | | | | | | $ | 12,580 | | | $ | 11,754 | |
| | | | | | | | | | | | |
Inventoriesat December 31, 2008, and 2007, are as follows:
| | | | | | | | | |
| | | 2008 | | | 2007 | |
| | | (Millions) | |
| |
| Natural gas liquids | | $ | 56 | | | $ | 66 | |
| Natural gas in underground storage | | | 97 | | | | 45 | |
| Materials, supplies and other | | | 107 | | | | 98 | |
| | | | | | | | | |
| | | $ | 260 | | | $ | 209 | |
| | | | | | | | | |
Inventoriesare primarily determined using the average-cost method.
| |
Note 9. | Property, Plant and Equipment |
Property, plant and equipment — netat December 31, 2008 and 2007, is as follows:
| | | | | | | | | | | | | | | | | |
| | | Estimated
| | | Depreciation
| | | | | | | |
| | | Useful Life(b)
| | | Rates(b)
| | | | | | | |
| | | (Years) | | | (%) | | | 2008 | | | 2007 | |
| | | | | | | | | (Millions) | |
| |
| Nonregulated | | | | | | | | | | | | | | | | |
| Oil and gas properties | | | (a) | | | | | | | $ | 8,749 | | | $ | 6,844 | |
| Natural gas gathering and processing facilities | | | 3 - 40 | | | | | | | | 5,394 | | | | 4,781 | |
| Construction in progress | | | (d) | | | | | | | | 1,169 | | | | 908 | |
| Other(c) | | | 2 - 45 | | | | | | | | 770 | | | | 702 | |
| Regulated | | | | | | | | | | | | | | | | |
| Natural gas transmission facilities | | | | | | | .01 - 7.25 | | | | 8,441 | | | | 8,208 | |
| Construction in progress | | | | | | | (d) | | | | 120 | | | | 72 | |
| Other | | | | | | | .01 - 50 | | | | 1,293 | | | | 1,272 | |
| | | | | | | | | | | | | | | | | |
| Total property, plant and equipment, at cost | | | | | | | | | | | 25,936 | | | | 22,787 | |
| Accumulated depreciation, depletion & amortization | | | | | | | | | | | (7,871 | ) | | | (6,806 | ) |
| | | | | | | | | | | | | | | | | |
| Property, plant and equipment — net | | | | | | | | | | $ | 18,065 | | | $ | 15,981 | |
| | | | | | | | | | | | | | | | | |
| | |
(a) | | Oil and gas properties are depleted using the units-of-production method. See Note 1 of Notes to Consolidated Financial Statements for more information. Balances include $571 million at December 31, 2008, and $378 million at December 31, 2007, of capitalized costs related to properties with unproven reserves not yet subject to depletion at Exploration & Production. |
|
(b) | | Estimated useful life and depreciation rates are presented as of December 31, 2008.2011. Depreciation rates for regulated assets are prescribed by the FERC. |
|
(c)(b) | | Certain assets above are currently pledged as collateral to secure debt. See Note 11 of Notes to Consolidated Financial Statements. |
|
(d) | | Construction in progress balances not yet subject to depreciation. |
Depreciation depletion and amortizationexpense forproperty, plant, and equipment —– netwas $1.3 billion in 2008, $1.1 billion in 2007, and $863$658 million in 2006.
2011, $611 million in 2010, and $576 million in 2009.115
THE WILLIAMS COMPANIES, INC.
NOTES TO CONSOLIDATED FINANCIAL STATEMENTS – (Continued)
RegulatedRegulated property, plant, and equipment – netincludes approximately $1.1 billion$865 million and $906 million at December 31, 20082011 and 20072010, respectively, related to amounts in excess of the original cost of the regulated facilities within Gas Pipelineour gas pipeline businesses as a result of our prior
110
THE WILLIAMS COMPANIES, INC.
NOTES TO CONSOLIDATED FINANCIAL STATEMENTS — (Continued)
acquisitions. This amount is being amortized over 40 years using the straight-line amortization method. Current FERC policy does not permit recovery through rates for amounts in excess of original cost of construction.
Asset Retirement Obligations
Our asset retirement obligations at December 31, 2008 and 2007 are $644 million and $399 million, respectively. The increases in the obligations in 2008 are primarily due to revisions in our estimation of our asset retirement obligations in our Midstream and Gas Pipeline segments and increased asset additions in our Exploration and Production segment.
The accrued obligations relate to producing wells, underground storage caverns, offshore platforms, fractionation and compression facilities, gas gathering well connections and pipelines, and gas transmission facilities. At the end of the useful life of each respective asset, we are legally obligated to plug both producing wells and storage caverns and remove any related surface equipment, to restore land and remove surface equipment at gas processing, fractionation and restore land at fractionationcompression facilities, to dismantle offshore platforms, to cap certain gathering pipelines at the wellhead connection and remove any related surface equipment, and to remove certain components of gas transmission facilities from the ground.
SFAS No. 143 requires measurements ofThe following table presents the significant changes to our asset retirement obligations, to include, as a component of future expected costs, an estimate ofwhich $507 million and $464 million are included inregulatory liabilities, deferred income, and other, with the price that a third party would demand,remaining current portion inaccrued liabilities at December 31, 2011 and could expect to receive, for bearing the uncertainties inherent in the obligations, sometimes referred to as a market-risk premium. We have no examples of credit-worthy third parties in the energy industry who are willing to assume this type of risk for a determinable price. Therefore, because we cannot reasonably estimate such a market-risk premium, we excluded it from our estimates of ARO liabilities.
2010, respectively. | | | | | | | | |
| | | December 31, | |
| | | 2011 | | | 2010 | |
| | | (Millions) | |
Beginning balance | | $ | 499 | | | $ | 499 | |
Liabilities settled | | | (46 | ) | | | (16 | ) |
Additions | | | 4 | | | | 2 | |
Accretion expense | | | 39 | | | | 36 | |
Revisions(1) | | | 77 | | | | (22 | ) |
| | | | | | | | |
Ending balance | | $ | 573 | | | $ | 499 | |
| | | | | | | | |
(1) | The revision in 2011 is primarily due to increases in the inflation rate and estimated removal costs, which are among several factors considered for revision in the annual review process. The revision in 2010 is primarily due to a decrease in the inflation rate. The 2011 and 2010 revisions also include increases of $39 million and $31 million, respectively, related to changes in the timing and method of abandonment on certain of Transco’s natural gas storage caverns that were associated with a leak in 2010. |
Pursuant to its 2008 rate case settlement, Transco deposits a portion of its collected rates into an external trust (ARO Trust) that is specifically designated to fund future asset retirement obligations.AROs. Transco is also required to make annual deposits into the trust through 2012. The trust is reported as a component ofother assets and deferred chargesand has a carrying value of $13 million as of December 31, 2008.
| |
| (See Note 15.). Note 10. | Accounts Payable and Accrued Liabilities |
Under our cash-management system, certain cash accounts reflected negative balances to the extent checks written have not been presented for payment. These negative balances represent obligations and have been reclassified toaccounts payable. Accounts payableincludes approximately $95 million of these negative balances at December 31, 2008, and $96 million at December 31, 2007.
Accrued liabilitiesat December 31, 2008, and 2007, are as follows:
| | | | | | | | | |
| | | 2008 | | | 2007 | |
| | | (Millions) | |
| |
| Taxes other than income taxes | | $ | 223 | | | $ | 169 | |
| Interest | | | 185 | | | | 208 | |
| Employee costs | | | 168 | | | | 174 | |
| Income taxes | | | 165 | | | | 75 | |
| Accrual for Gulf Liquids litigation contingency* | | | 51 | | | | 94 | |
| Guarantees and payment obligations related to WilTel | | | 38 | | | | 39 | |
| Estimated rate refund liability | | | 14 | | | | 96 | |
| Other, including other loss contingencies | | | 326 | | | | 303 | |
| | | | | | | | | |
| | | $ | 1,170 | | | $ | 1,158 | |
| | | | | | | | | |
| | |
* | | Includes interest of $14 million in 2008 and $25 million in 2007. |
Liabilities
111
| | | | | | | | |
| | | December 31, | |
| | | 2011 | | | 2010 | |
| | | (Millions) | |
Interest on debt | | $ | 143 | | | $ | 162 | |
Employee costs | | | 127 | | | | 146 | |
Asset retirement obligations | | | 66 | | | | 35 | |
Income taxes | | | 24 | | | | 187 | |
Other, including other loss contingencies | | | 271 | | | | 208 | |
| | | | | | | | |
| | $ | 631 | | | $ | 738 | |
| | | | | | | | |
116
THE WILLIAMS COMPANIES, INC.
NOTES TO CONSOLIDATED FINANCIAL STATEMENTS —– (Continued)
| |
Note 11. Debt, Banking Arrangements, and Leases Note 11.
| Debt, Leases and Banking Arrangements |
Long-Term Debt
Long-term | | | | | | | | |
| | | December 31, | |
| | | 2011 | | | 2010 | |
| | | (Millions) | |
Unsecured: | | | | | | | | |
Transco: | | | | | | | | |
7% Notes due 2011 | | $ | — | | | $ | 300 | |
8.875% Notes due 2012 | | | 325 | | | | 325 | |
6.4% Notes due 2016 | | | 200 | | | | 200 | |
6.05% Notes due 2018 | | | 250 | | | | 250 | |
7.08% Debentures due 2026 | | | 8 | | | | 8 | |
7.25% Debentures due 2026 | | | 200 | | | | 200 | |
5.4% Notes due 2041 | | | 375 | | | | — | |
Northwest Pipeline: | | | | | | | | |
7% Notes due 2016 | | | 175 | | | | 175 | |
5.95% Notes due 2017 | | | 185 | | | | 185 | |
6.05% Notes due 2018 | | | 250 | | | | 250 | |
7.125% Debentures due 2025 | | | 85 | | | | 85 | |
WPZ: | | | | | | | | |
7.5% Notes due 2011 | | | — | | | | 150 | |
3.8% Notes due 2015 | | | 750 | | | | 750 | |
7.25% Notes due 2017 | | | 600 | | | | 600 | |
5.25% Notes due 2020 | | | 1,500 | | | | 1,500 | |
4.125% Notes due 2020 | | | 600 | | | | 600 | |
4% Notes due 2021 | | | 500 | | | | — | |
6.3% Notes due 2040 | | | 1,250 | | | | 1,250 | |
The Williams Companies, Inc.: | | | | | | | | |
7.875% Notes due 2021 | | | 371 | | | | 571 | |
7.5% Debentures due 2031 | | | 339 | | | | 527 | |
7.75% Notes due 2031 | | | 252 | | | | 369 | |
8.75% Notes due 2032 | | | 445 | | | | 686 | |
Various - 5.5% to 10.25% Notes and Debentures due 2011 to 2033 | | | 90 | | | | 152 | |
Other, including secured capital lease obligations | | | 4 | | | | 13 | |
Net unamortized debt discount | | | (32 | ) | | | (38 | ) |
| | | | | | | | |
Total long-term debt, including current portion | | | 8,722 | | | | 9,108 | |
Long-term debt due within one year | | | (353 | ) | | | (508 | ) |
| | | | | | | | |
Long-term debt | | $ | 8,369 | | | $ | 8,600 | |
| | | | | | | | |
Certain of our debtat December 31, 2008 agreements contain covenants that restrict or limit, among other things, our ability to create liens supporting indebtedness, sell assets, and 2007, is:
| | | | | | | | | | | | | |
| | | Weighted-
| | | | | | | |
| | | Average
| | | | | | | |
| | | Interest
| | | December 31, | |
| | | Rate(1) | | | 2008(2) | | | 2007 | |
| | | | | | (Millions) | |
| |
| Secured(3) | | | | | | | | | | | | |
| 6.62%-9.45%, payable through 2016 | | | 8.0 | % | | $ | 123 | | | $ | 148 | |
| Adjustable rate, payable through 2016 | | | 3.9 | % | | | 54 | | | | 64 | |
| Capital lease obligations | | | 6.0 | % | | | 5 | | | | 10 | |
| Unsecured | | | | | | | | | | | | |
| 5.5%-10.25%, payable through 2033(4) | | | 7.6 | % | | | 7,447 | | | | 7,103 | |
| Revolving credit loans | | | — | | | | — | | | | 250 | |
| Adjustable rate, payable through 2012 | | | 1.2 | % | | | 250 | | | | 325 | |
| | | | | | | | | | | | | |
| Total long-term debt, including current portion | | | | | | | 7,879 | | | | 7,900 | |
| Long-term debt due within one year | | | | | | | (196 | ) | | | (143 | ) |
| | | | | | | | | | | | | |
| Long-term debt | | | | | | $ | 7,683 | | | $ | 7,757 | |
| | | | | | | | | | | | | |
| | |
(1) | | At December 31, 2008. |
|
(2) | | Certain of our debt agreements contain covenants that restrict or limit, among other things, our ability to create liens supporting indebtedness, sell assets, make certain distributions, repurchase equity and incur additional debt. |
|
(3) | | Includes $177 million and $212 million at December 31, 2008 and 2007, respectively, collateralized by certain fixed assets of two of our Venezuelan subsidiaries with a net book value of $324 million and $351 million at December 31, 2008 and 2007, respectively. The non-recourse debt at both subsidiaries is currently in technical default triggered by past due payments from their sole customer, Petróleos de Venezuela S.A. (PDVSA), under the related services contracts. We are in discussion with the associated lenders to obtain waivers. This has no impact on our other debt agreements or our liquidity. |
|
(4) | | 2007 includes Transco’s $100 million 6.25 percent notes, due on January 15, 2008, that were reclassified as long-term debt as a result of a subsequent refinancing under the $1.5 billionincur additional debt. Default of these agreements could also restrict our ability to make certain distributions or repurchase equity.117
THE WILLIAMS COMPANIES, INC. NOTES TO CONSOLIDATED FINANCIAL STATEMENTS – (Continued) Credit Facilities In June 2011, we entered into two new separate five-year senior unsecured revolving credit facility. |
Revolving credit facility agreements. The replacements of our previous $900 million credit facility and letter of credit facilities (credit facilities)
We have an unsecured, $1.5WPZ’s $1.75 billion credit facility,
withas discussed further below, are considered modifications for accounting purposes.We established a maturity date ofnew $900 million unsecured revolving credit facility agreement which replaced our existing unsecured $900 million credit facility agreement that was scheduled to expire May 1, 2012. There were no outstanding borrowings under the existing agreement at the time it was terminated. The new credit facility may, under certain conditions, be increased up to an additional $250 million. Significant financial covenants require our ratio of debt to EBITDA (each as defined in the credit facility) to be no greater than 4.5 to 1. For the fiscal quarter and the two following fiscal quarters in which one or more acquisitions for a total aggregate purchase price equal to or greater than $50 million has been executed, we are required to maintain a ratio of debt to EBITDA of no greater than 5 to 1. At December 31, 2011, we are in compliance with these financial covenants. On November 1, 2011, the new credit facility was amended primarily to revise certain defined terms for further clarity and to accommodate our revised reorganization plan related to the spin-off of WPX.
WPZ also established a new $2 billion unsecured revolving credit facility agreement that includes Transco and Northwest Pipeline as co-borrowers that replaced an existing unsecured $1.75 billion credit facility agreement that was scheduled to expire on February 17, 2013. This credit facility is only available to named borrowers. At the closing, WPZ refinanced $300 million outstanding under the existing facility via a noncash transfer of the obligation to the new credit facility. The new credit facility may, under certain conditions, be increased up to an additional $400 million. The full amount of the credit facility is available to WPZ to the extent not otherwise utilized by Transco and Northwest Pipeline. Transco and Northwest Pipeline each have access to borrow up to $400 million under the credit facility to the extent not otherwise utilized by us. Lehman Commercial Paper Inc., which is committedthe other co-borrowers. Significant financial covenants include:
WPZ’s ratio of debt to fund up to $70 million of our $1.5 billion credit facility, filed for bankruptcyEBITDA (each as defined in 2008. We expect that our ability to borrow under the credit facilityfacility) must be no greater than 5 to 1. For the fiscal quarter and the two following fiscal quarters in which one or more acquisitions for a total aggregate purchase price equal to or greater than $50 million has been executed, WPZ is reduced by this committed amount. required to maintain a ratio of debt to EBITDA of no greater than 5.5 to 1;
The committed amountsratio of other participating banks under this agreement remaindebt to capitalization (defined as net worth plus debt) must be no greater than 65 percent for each of Transco and Northwest Pipeline.
At December 31, 2011, WPZ is in effectcompliance with these financial covenants.
The two new credit agreements contain the following terms and conditions:
Each time funds are not impacted byborrowed, the above. Interest is calculated based on a choiceapplicable borrower may choose from two methods of two methods:calculating interest: a fluctuating base rate equal to the lender’sCitibank N.A.’s alternate base rate plus an applicable margin or a periodic fixed rate equal to LIBOR plus an applicable margin. We areThe applicable borrower is required to pay a commitment fee (currently 0.1250.25 percent) based on the unused portion of thetheir respective credit facility. The applicable margin and the commitment fee are determined for each borrower by reference to a pricing schedule based on such borrower’s senior unsecured long-term debt ratings.
112
Various covenants may limit, among other things, a borrower’s and its material subsidiaries’ ability to grant certain liens supporting indebtedness, a borrower’s ability to merge or consolidate, sell all or substantially all of its assets, enter into certain affiliate transactions, make certain distributions during an event of default, make investments, and allow any material change in the nature of its business.
118
THE WILLIAMS COMPANIES, INC.
NOTES TO CONSOLIDATED FINANCIAL STATEMENTS —– (Continued)
The marginsIf an event of default with respect to a borrower occurs under their respective credit facility agreement, the lenders will be able to terminate the commitments for the respective borrowers and commitment fee are generally based onaccelerate the specific borrower’s senior unsecured long-term debt ratings. Significant financial covenantsmaturity of any loans of the defaulting borrower under the respective credit facility agreement include the following:and exercise other rights and remedies.
| | |
| • | Our ratio of debt to capitalization must be no greater than 65 percent. At December 31, 2008, we are in compliance with this covenant as our ratio of debt to capitalization, as calculated under this covenant, is approximately 40 percent. |
|
| • | Ratio of debt to capitalization must be no greater than 55 percent for Northwest Pipeline and Transco. At December 31, 2008, they are in compliance with this covenant as their ratio of debt to capitalization, as calculated under this covenant, is approximately 36 percent for Northwest Pipeline and 26 percent for Transco. |
We have unsecured $400 million, $100Letter of credit capacity under our $900 million and WPZ’s $2 billion credit facilities is $700 million credit facilities. The $400 million credit facility matures in April 2009, the $100 million credit facility matures in May 2009 and the $700 million credit facility matures in September 2010. These credit facilities provide for both borrowings and issuing$1.3 billion, respectively. At December 31, 2011, no letters of credit but are expected to be used primarily for issuing letters of credit. We are required to pay the funding bank fixed fees at a weighted-average interest rate of 3.64 percent, 3.64 percenthave been issued and 2.29 percent for the $400 million, $100 million and $700 million credit facilities, respectively, on the total committed amount of the facilities. In addition, we pay interest on any borrowings at a fluctuating rate comprised of either a base rate or LIBOR.
The funding bank, an affiliate of Citibank N.A., syndicated its associated credit risk through a private offering that allows for the resale of certain restricted securities to qualified institutional buyers. To facilitate the syndication of these credit facilities, the bank established trusts funded by the institutional investors. The assets of the trusts serve as collateral to reimburse the bank for our borrowings in the event that the credit facilities are delivered to the investors as described below. Thus, we have no asset securitization or collateral requirements under the credit facilities. Upon the occurrence of certain credit events, letters of credit under the agreement become cash collateralized creating a borrowing under the credit facilities. Concurrently, the funding bank can deliver the credit facilities to the institutional investors, whereby the investors replace the funding bank as lender under the credit facilities. Upon such occurrence, we will pay:
| | | | | | | | | | | | | | | | |
| | $500 Million Facility | | | $700 Million Facility | |
| | $400 million | | | $100 million | | | $500 million | | | $200 million | |
|
Interest Rate | | | 3.57 percent | | | | LIBOR | | | | 4.35 percent | | | | LIBOR | |
Facility Fixed Fee | | 3.19 percent | | 2.29 percent |
Williams Partners L.P. has an unsecured $450 million credit facility with a maturity date of December 2012. This $450 million credit facility is comprised initially of a $200 million credit facility available for borrowings and letters of credit and a $250 million term loan. Under certain conditions, the credit facility may be increased up to an additional $100 million. The parent company and certain affiliates of Lehman Brothers Commercial Bank, who is committed to fund up to $12 million of this credit facility, filed for bankruptcy in 2008. They expect that their ability to borrow under this credit facility is reduced by this committed amount. The committed amounts of the other participating banks under this agreement remain in effect and are not impacted by this reduction. Interest on borrowings under this agreement will be payable at rates per annum equal to either (1) a fluctuating base rate equal to the lender’s prime rate plus the applicable margin, or (2) a periodic fixed rate equal to LIBOR plus the applicable margin. At December 31, 2008, they had a $250 million term loan outstanding and no amounts outstanding under the $200 million credit facility. Significant financial covenants under this credit agreement include the following:
| | |
| • | Williams Partners L.P. is required to maintain a ratio of indebtedness to EBITDA (each as defined in the credit agreement) of no greater than 5.0 to 1.0. At December 31, 2008, they are in compliance with this covenant as their ratio is 2.98. |
113
THE WILLIAMS COMPANIES, INC.
NOTES TO CONSOLIDATED FINANCIAL STATEMENTS — (Continued)
| | |
| • | Williams Partners L.P. is required to maintain an EBITDA to interest expense (as defined in the credit agreement) of not less than 2.75 to 1.0 as of the last day of any fiscal quarter. At December 31, 2008, they are in compliance with this covenant as their ratio is 5.13. |
However, since the ratios are calculated on a rolling four-quarter basis, the ratios at December 31, 2008, do not reflect the full-year impact of lower commodity prices in the fourth quarter which have continued into 2009.
At December 31, 2008, no loans are outstanding under our credit facilities. Letterson either facility. We have issued letters of credit issued under our credit facilities are:
| | | | | |
| | | Letters of Credit at
| |
| | | December 31, 2008 | |
| | | (Millions) | |
| |
| $500 million unsecured credit facilities | | $ | — | |
| $700 million unsecured credit facilities | | $ | 220 | |
| $1.5 billion unsecured credit facility | | $ | 71 | |
Exploration & Production’s credit agreement
Exploration & Production has an unsecured credit agreement with certain banks in order to reduce margin requirements related to our hedging activitiestotaling $21 million as well as lower transaction fees. The agreement extends throughof December 2013. Under the credit agreement, Exploration & Production is not required to post collateral as long as the value of its domestic natural gas reserves, as determined under the provisions of the agreement, exceeds by a specified amount certain of its obligations including any outstanding debt and the aggregate out-of-the-money positions on hedges entered into under the credit agreement. Exploration & Production is subject to additional covenants under the credit agreement including restrictions on hedge limits, the creation of liens, the incurrence of debt, the sale of assets and properties, and making certain payments, such as dividends,31, 2011, under certain circumstances.
bilateral bank agreements.Issuances and retirementsRetirements
On January 15, 2008, TranscoUtilizing cash on hand, WPZ retired $100$150 million of 6.257.5 percent senior unsecured notes that matured on June 15, 2011.
In August 2011, Transco issued $375 million of 5.4 percent senior unsecured notes due January 15, 2008, with proceeds borrowed under our $1.5 billion unsecured credit facility.
On April 15, 2008, Transco retired a $75 million adjustable rate unsecured note due April 15, 2008, with proceeds borrowed under our $1.5 billion unsecured credit facility.
On May 22, 2008, Transco issued $250 million aggregate principal amount of 6.05 percent senior unsecured notes due 20182041 to certain institutional investors in a Rule 144A private debt placement. A portion of these proceeds was used to repay Transco’s $100$300 million and $75 million loans from January 2008 and April 2008, respectively, under our $1.5 billion7 percent senior unsecured credit facility. In September 2008,notes that matured on August 15, 2011. As part of the new issuance, Transco completed anentered into a registration rights agreement with the initial purchasers of the unsecured notes. An offer to exchange of these unregistered notes for substantially identical new notes that are registered under the Securities Act of 1933, as amended.
On May 22, 2008, Northwest Pipeline issued $250 million aggregateamended, was commenced in February 2012 and is expected to be completed in March 2012. If Transco fails to complete the exchange within certain time periods required by the registration rights agreement, additional interest will accrue on the affected securities. The rate of additional interest will be 0.25 percent per annum on the principal amount of
6.05the affected securities for the first 90-day period immediately following the occurrence of default, increasing by an additional 0.25 percent per annum with respect to each subsequent 90-day period thereafter. Following the cure of any registration defaults, the accrual of additional interest will cease.In November 2011, WPZ completed a public offering of $500 million of its 4 percent senior unsecured notes due 2018 to certain institutional investors in a Rule 144A private debt placement. These2021. WPZ used the net proceeds were usedprimarily to repay Northwest Pipeline’s $250 million loan from December 2007 under ouroutstanding borrowings on its senior unsecured revolving credit facility.
In November 2011, WPX completed the issuance of $1.5 billion of senior unsecured credit facility.notes and subsequently distributed $981 million of the proceeds to us. As a result of the spin-off, these WPX notes are not included in our consolidated debt balance at December 31, 2011. Primarily utilizing the distribution we received related to the WPX debt issuance, we retired $746 million of debt in December 2011. In September 2008, Northwest Pipeline completed an exchangeconjunction with the retirement, we paid $254 million in related premiums.
Other Debt Disclosures
As of these notes for substantially identical new notes that are registered under the Securities Act of 1933, as amended.
114
THE WILLIAMS COMPANIES, INC.
NOTES TO CONSOLIDATED FINANCIAL STATEMENTS — (Continued)
AggregateDecember 31, 2011, aggregate minimum maturities oflong-term debt(excluding (excluding capital leases and unamortized discount and premium) for each of the next five years are as follows:
| | | | | |
| | | (Millions) | |
| |
| 2009(1) | | $ | 192 | |
| 2010 | | | — | |
| 2011 | | | 927 | |
| 2012 | | | 1,203 | |
| 2013 | | | — | |
| | |
(1) | | Maturities for 2009 includes $177 million related to the non-recourse debt of two of our Venezuela subsidiaries. Only $38 million of this debt has a stated maturity in 2009, but the entire balance is reflected in 2009 as the debt is currently in technical default triggered by past due payments from their sole customer, PDVSA, under the related services contracts. We are in discussion with the associated lenders to obtain waivers. This has no impact on our other debt agreements or our liquidity. |
| | | | |
| | | (Millions) | |
2012 | | $ | 352 | |
2013 | | $ | — | |
2014 | | $ | — | |
2015 | | $ | 750 | |
2016 | | $ | 375 | |
Cash payments for interest (net of amounts capitalized) were as follows: 2008 —$599 million in 2011, $614 million in 2010 and $592 million; 2007 — $634 million;million in 2009.
119
THE WILLIAMS COMPANIES, INC.
NOTES TO CONSOLIDATED FINANCIAL STATEMENTS – (Continued)
We have considered the guidance in the Securities and 2006 — $611 million.
Exchange Commission’s Regulation S-X related to restricted net assets of subsidiaries. In accordance with Rule 4-08(e) of Regulation S-X, we have determined that certain net assets of our subsidiaries are considered restricted under this guidance and exceed 25 percent of our consolidated net assets. Substantially all of these restricted net assets relate to the net assets of WPZ, which are technically considered restricted under this accounting rule due to terms within WPZ’s partnership agreement that govern the partnership’s assets. Our interest in WPZ’s net assets at December 31, 2011 was $3.9 billion.Leases-Lessee
Future minimum annual rentals under noncancelable operating leases as of December 31, 2008,2011 are payable as follows:
| | | | | |
| | | (Millions) | |
| |
| 2009 | | $ | 69 | |
| 2010 | | | 53 | |
| 2011 | | | 26 | |
| 2012 | | | 23 | |
| 2013 | | | 19 | |
| Thereafter | | | 45 | |
| | | | | |
| Total | | $ | 235 | |
| | | | | |
| | | | |
| | | (Millions) | |
2012 | | $ | 43 | |
2013 | | | 35 | |
2014 | | | 33 | |
2015 | | | 29 | |
2016 | | | 26 | |
Thereafter | | | 148 | |
| | | | |
Total | | $ | 314 | |
| | | | |
Under our right-of-way agreement with the Jicarilla Apache Nation (JAN), we make annual payments of approximately $8 million and an additional annual payment which varies depending on the prior year’s per-unit NGL margins and the volume of gas gathered by our Williams Partners gathering facilities subject to the agreement. Depending primarily on the per-unit NGL margins for any given year, the additional annual payments could exceed the fixed amount. This agreement expires March 31, 2029.
Total rent expense was $87$49 million in 2008 and $682011, $45 million in 20072010, and 2006. Rent expense reported as discontinued operations, primarily related to a tolling agreement, was $148 million and $175$45 million in 20072009.
Note 12.Stockholders’ Equity
Cash dividends declared per common share were $.775, $.485 and 2006,$.44 for 2011, 2010, and 2009, respectively. Rent expense in discontinued operations was offset by approximately $276 million in 2007 and $264 million in 2006 resulting from sales and other transactions made possible by the tolling agreement. This tolling agreement was included in the sale of our power business in 2007. (See Note 2.)
| |
Note 12. | Stockholders’ Equity |
In July 2007, our Board of Directors authorized the repurchase of up to $1 billion of our common stock. During 2007, we purchased 16 million shares for $526 million (including transaction costs) at an average cost of $33.08 per share. During 2008, we purchased 13 million shares of our common stock for $474 million (including transaction costs) at an average cost of $36.76 per share. We completed our $1 billion stock repurchase program in July 2008. Our overall average cost per share was $34.74. This stock repurchase is recorded intreasury stockon our Consolidated Balance Sheet.
In November 2005, we initiated an offer to convert our 5.5 percent junior subordinated convertible debentures into our common stock. In January 2006, we converted $220 million of the debentures in exchange for 20 million
115
THE WILLIAMS COMPANIES, INC.
NOTES TO CONSOLIDATED FINANCIAL STATEMENTS — (Continued)
shares of common stock, a $26 million cash premium, and $2 million of accrued interest. During 2008, $27 million of debentures were exchanged for 2 million shares of common stock. At December 31, 2008,2011, approximately $53$8 million of our original $300 million, 5.5 percent junior subordinated convertible debentures, convertible into approximately 5one million shares of common stock, are outstanding.
At December 31, 2007, we held all of Williams Partners L.P.’s seven million subordinated unitsremain outstanding. In February 2008, these subordinated units were2011, 2010 and 2009, we converted into common units of Williams Partners L.P. due to the achievement of certain financial targets that resulted in the early termination$14 million, $2 million and $28 million, respectively, of the subordination period. While these subordinated units were outstanding, other issuancesdebentures in exchange for approximately one million, less than one million and three million shares, respectively, of partnership units by Williams Partners L.P. had preferential rights andcommon stock. In conjunction with the proceeds from these issuances in excessspin-off of the book basis of assets acquired by Williams Partners L.P. were therefore reflected as minority interest on our Consolidated Balance Sheet rather than as equity. Due toWPX, the conversion ofrate for the subordinated units, these original issuances of partnership units no longer have preferential rights and now represent the lowest level of equity securities issued by Williams Partners L.P. In accordance with our policy regarding the issuance of equity of a consolidated subsidiary, such issuances of nonpreferential equity are accounted for as capital transactions and no gain or loss is recognized. Therefore, as a result of the first-quarter conversion, we recognized a decrease to minority interest and a corresponding increase to stockholders’ equity of approximately $1.2 billion.
remaining debentures outstanding has been modified.We maintain a Stockholder Rights Plan, as amended and restated on September 21, 2004, and further amended May 18, 2007, and October 12, 2007, under which each outstanding share of our common stock has a right (as defined in the plan) attached. Under certain conditions, each right may be exercised to purchase, at an
120
THE WILLIAMS COMPANIES, INC.
NOTES TO CONSOLIDATED FINANCIAL STATEMENTS – (Continued)
exercise price of $50 (subject to adjustment), one two-hundredth of a share of Series A Junior Participating Preferred Stock. The rights may be exercised only if an Acquiring Person acquires (or obtains the right to acquire) 15 percent or more of our common stock or commences an offer for 15 percent or more of our common stock. The plan contains a mechanism to divest of shares of common stock if such stock in excess of 14.9 percent was acquired inadvertently or without knowledge of the terms of the rights. The rights, which until exercised do not have voting rights, expire in 2014 and may be redeemed at a price of $.01 per right prior to their expiration, or within a specified period of time after the occurrence of certain events. In the event a person becomes the owner of more than 15 percent of our common stock, each holder of a right (except an Acquiring Person) shall have the right to receive, upon exercise, our common stock having a value equal to two times the exercise price of the right. In the event we are engaged in a merger, business combination, or 50 percent or more of our assets, cash flow or earnings power is sold or transferred, each holder of a right (except an Acquiring Person) shall have the right to receive, upon exercise, common stock of the acquiring company having a value equal to two times the exercise price of the right.
| |
On December 31, 2011, we completed the tax-free spin-off of our interest in WPX to our shareholders. (See Note 2.) Note 13. Stock-Based Compensation Note 13.
| Stock-Based Compensation |
Plan Information
On May 17, 2007, our stockholders approved a plan that provides common-stock-based awards to both employees and nonmanagement directors. Thedirectors and reserved 19 million new shares for issuance. On May 20, 2010, our stockholders approved an amendment and restatement of the 2007 plan generally contains terms and provisions consistent withto increase by 11 million the previous plans.number of new shares authorized for making awards under the plan, among other changes. The plan permits the granting of various types of awards including, but not limited to, restricted stock units and stock options and reserves 19 million shares for issuance. Restricted stock units are valued at market value on the grant date of the award and generally vest over three years. The purchase price per share for stock options may not be less than the market price of the underlying stock on the date of grant. Stock options generally become exercisable over a three-year period from the date of the grant and can be subject to accelerated vesting if certain future stock prices or if specific financial performance targets are achieved. Stock options generally expire 10 years after grant.options. At December 31, 2008, 332011, 35 million shares of our common stock were reserved for issuance pursuant to existing and future stock awards, of which 1620 million shares were available for future grants. At December 31, 2007, 37 million shares of our common stock were reserved for issuance pursuant to existing and future stock awards, of which 19 million shares were available for future grants.
116
THE WILLIAMS COMPANIES, INC.
NOTES TO CONSOLIDATED FINANCIAL STATEMENTS — (Continued)
Additionally, on May 17, 2007, our stockholders approved an Employee Stock Purchase Plan (ESPP) which authorizes up to 2 million
new shares of our common stock to be available for sale under the plan. The ESPP enables eligible participants to purchase our common stock through payroll deductions not exceeding an annual amount of $15,000 per participant. The ESPP provides for offering periods during which shares may be purchased and continues until the earliest of: (1) the Board of Directors terminates the ESPP, (2) the sale of all shares available under the ESPP, or (3) the tenth anniversary of the date the Plan was approved by the stockholders. The first offering under the ESPP commenced on October 1, 2007 and ended on December 31, 2007. Subsequent offering periods are from January through June and from July through December. Generally, all employees are eligible to participate in the ESPP, with the exception of executives and international employees. The number of shares eligible for an employee to purchase during each offering period is limited to 750 shares. The purchase price of the stock is 85 percent of the lower closing price of either the first or the last day of the offering period. The ESPP requires a one-year holding period before the stock can be sold. Employees purchased
242239 thousand shares at an average price of
$17.80$21.19 per share during
2008.2011. Approximately
1.7 million and 2 million809 thousand shares were available for purchase under the ESPP at December 31,
20082011.Total stock-based compensation expense for the years ended December 31, 2011, 2010 and 2007,2009 was $52 million, $48 million, and $43 million, respectively, .
Stock Options
Stock options are valuedof which $18 million, $14 million, and $13 million is included in income (loss) from discontinued operations for each respective year. Measured but unrecognized stock-based compensation expense at
the date of award,December 31, 2011, was $35 million, which does not
precedeinclude the
approval date, and compensation cost is recognized on a straight-line basis, neteffect of estimated forfeitures
over the requisite service period. Stockof $2 million. This amount is comprised of $3 million related to stock options
generally become exercisableand $32 million related to restricted stock units. These amounts are expected to be recognized over a
three-yearweighted-average period
fromof 1.8 years.121
THE WILLIAMS COMPANIES, INC.
NOTES TO CONSOLIDATED FINANCIAL STATEMENTS – (Continued)
WPX Spin Off
As provided in the dateEmployee Matters Agreement related to the spin-off of grantWPX (see Note 1), except for options awards granted prior to 2006, stock-based awards previously held by WPX employees were forfeited and generally expire ten years afterreplaced with WPX stock-based awards while awards held by our ongoing employees were adjusted upon the grant.
spin-off. All stock options granted previous to 2006 were converted into options to acquire both WPX common stock and our common stock. The adjusted awards maintain their original terms and conditions with regard to vesting schedules and expiration dates. These modifications to our stock-based compensation awards resulted in an insignificant amount of incremental expense. Both the shares and weighted-average prices presented below are on a post-spin basis.Stock Options
The following summary reflects stock option activity and related information for the year endingended December 31, 2008.
| | | | | | | | | | | | | |
| | | | | | Weighted-
| | | | |
| | | | | | Average
| | | Aggregate
| |
| | | | | | Exercise
| | | Intrinsic
| |
Stock Options | | Options | | | Price | | | Value | |
| | | (Millions) | | | | | | (Millions) | |
| |
| Outstanding at December 31, 2007 | | | 13.2 | | | $ | 16.62 | | | | | |
| Granted | | | 1.0 | | | $ | 36.50 | | | | | |
| Exercised | | | (2.3 | ) | | $ | 14.45 | | | $ | 49 | |
| | | | | | | | | | | | | |
| Cancelled | | | (.4 | ) | | $ | 33.44 | | | | | |
| | | | | | | | | | | | | |
| Outstanding at December 31, 2008 | | | 11.5 | | | $ | 18.10 | | | $ | 35 | |
| | | | | | | | | | | | | |
| Exercisable at December 31, 2008 | | | 9.6 | | | $ | 15.44 | | | $ | 35 | |
| | | | | | | | | | | | | |
2011. | | | | | | | | | | | | |
Stock Options | | Options | | | Weighted-
Average
Exercise
Price | | | Aggregate
Intrinsic
Value | |
| | | (Millions) | | | | | | (Millions) | |
Outstanding at December 31, 2010 | | | 12.3 | | | $ | 14.18 | | | | | |
Granted | | | 0.9 | | | $ | 24.21 | | | | | |
Exercised | | | (3.3 | ) | | $ | 11.13 | | | | | |
Expired | | | (0.3 | ) | | $ | 28.56 | | | | | |
| | | | | | | | | | | | |
Outstanding at December 31, 2011 | | | 9.6 | | | $ | 15.63 | | | $ | 111 | |
| | | | | | | | | | | | |
Exercisable at December 31, 2011 | | | 7.8 | | | $ | 14.87 | | | $ | 97 | |
| | | | | | | | | | | | |
The total intrinsic value of options exercised during the years ended December 31, 2008, 2007,2011, 2010, and 20062009 was $49$55 million, $74$20 million, and $36$2 million, respectively; and the tax benefit realized was $21 million, $7 million, and $1 million, respectively.
Cash received from stock option exercises was $45 million, $7 million, and $2 million during 2011, 2010, and 2009, respectively.The following summary provides additional information about stock options that are outstanding and exercisable at December 31, 2008.
2011.
117
| | | | | | | | | | | | | | | | | | | | | | | | |
| | | Stock Options Outstanding | | | Stock Options Exercisable | |
Range of Exercise Prices | | Options | | | Weighted-
Average
Exercise
Price | | | Weighted-
Average
Remaining
Contractual
Life | | | Options | | | Weighted-
Average
Exercise
Price | | | Weighted-
Average
Remaining
Contractual
Life | |
| | | (Millions) | | | | | | (Years) | | | (Millions) | | | | | | (Years) | |
$1.85 to $9.94 | | | 3.6 | | | $ | 7.49 | | | | 3.8 | | | | 3.3 | | | $ | 7.33 | | | | 3.4 | |
$12.79 to $19.80 | | | 3.3 | | | $ | 16.56 | | | | 4.5 | | | | 2.7 | | | $ | 16.42 | | | | 3.8 | |
$22.11 to $24.21 | | | 1.8 | | | $ | 23.62 | | | | 6.8 | | | | 0.9 | | | $ | 23.03 | | | | 4.5 | |
$26.10 to $29.72 | | | 0.9 | | | $ | 29.68 | | | | 5.4 | | | | 0.9 | | | $ | 29.68 | | | | 5.4 | |
| | | | | | | | | | | | | | | | | | | | | | | | |
Total | | | 9.6 | | | $ | 15.63 | | | | 4.7 | | | | 7.8 | | | $ | 14.87 | | | | 3.9 | |
| | | | | | | | | | | | | | | | | | | | | | | | |
122
THE WILLIAMS COMPANIES, INC.
NOTES TO CONSOLIDATED FINANCIAL STATEMENTS —– (Continued)
| | | | | | | | | | | | | | | | | | | | | | | | | |
| | | Stock Options Outstanding | | | Stock Options Exercisable | |
| | | | | | | | | Weighted-
| | | | | | | | | Weighted-
| |
| | | | | | Weighted-
| | | Average
| | | | | | Weighted-
| | | Average
| |
| | | | | | Average
| | | Remaining
| | | | | | Average
| | | Remaining
| |
| | | | | | Exercise
| | | Contractual
| | | | | | Exercise
| | | Contractual
| |
Range of Exercise Prices | | Options | | | Price | | | Life | | | Options | | | Price | | | Life | |
| | | (Millions) | | | | | | (Years) | | | (Millions) | | | | | | (Years) | |
| |
| $2.27 to $12.92 | | | 4.7 | | | $ | 7.12 | | | | 4.1 | | | | 4.7 | | | $ | 7.12 | | | | 4.1 | |
| $12.93 to $23.72 | | | 3.8 | | | $ | 19.51 | | | | 6.0 | | | | 3.5 | | | $ | 19.32 | | | | 5.8 | |
| $23.73 to $34.52 | | | 1.1 | | | $ | 28.11 | | | | 7.5 | | | | .5 | | | $ | 27.79 | | | | 6.6 | |
| $34.53 to $42.29 | | | 1.9 | | | $ | 37.06 | | | | 5.4 | | | | .9 | | | $ | 37.64 | | | | 1.4 | |
| | | | | | | | | | | | | | | | | | | | | | | | | |
| Total | | | 11.5 | | | $ | 18.10 | | | | 5.3 | | | | 9.6 | | | $ | 15.44 | | | | 4.6 | |
| | | | | | | | | | | | | | | | | | | | | | | | | |
The estimated fair value at date of grant of options for our common stock granted in 2008, 2007, and 2006,each respective year, using the Black-Scholes option pricing model, is as follows:
| | | | | | | | | | | | | |
| | | 2008 | | | 2007 | | | 2006 | |
| |
| Weighted-average grant date fair value of options for our common stock granted during the year | | $ | 12.83 | | | $ | 9.09 | | | $ | 8.36 | |
| | | | | | | | | | | | | |
| Weighted-average assumptions: | | | | | | | | | | | | |
| Dividend yield | | | 1.2 | % | | | 1.5 | % | | | 1.4 | % |
| Volatility | | | 33.4 | % | | | 28.7 | % | | | 36.3 | % |
| Risk-free interest rate | | | 3.5 | % | | | 4.6 | % | | | 4.7 | % |
| Expected life (years) | | | 6.5 | | | | 6.3 | | | | 6.5 | |
| | | | | | | | | | | | |
| | | 2011 | | | 2010 | | | 2009 | |
Weighted-average grant date fair value of options for our common stock granted during the year, per share | | $ | 6.28 | | | $ | 5.71 | | | $ | 4.56 | |
| | | | | | | | | | | | |
Weighted-average assumptions: | | | | | | | | | | | | |
Dividend yield | | | 3.6 | % | | | 2.6 | % | | | 1.6 | % |
Volatility | | | 34.6 | % | | | 39.0 | % | | | 60.8 | % |
Risk-free interest rate | | | 2.8 | % | | | 3.0 | % | | | 2.3 | % |
Expected life (years) | | | 6.5 | | | | 6.5 | | | | 6.5 | |
The expected dividend yield is based on the average annual dividend yield as of the grant date. Expected volatility is based on the historical volatility of our stock and the implied volatility of our stock based on traded options. In calculating historical volatility, returns during calendar year 2002 were excluded as the extreme volatility during that time is not reasonably expected to be repeated in the future. The risk-free interest rate is based on the U.S. Treasury Constant Maturity rates as of the grant date. The expected life of the option is based on historical exercise behavior and expected future experience.
Cash received from stock option exercises was $32 million, $56 million and $34 million during 2008, 2007 and 2006, respectively. The tax benefit realized from stock options exercised during 2008 was $17 million, $27 million for 2007, and $14 million for 2006.
Nonvested Restricted Stock Units
Restricted stock units are generally valued at market value on the grant date and generally vest over three years. Restricted stock unit expense, net of estimated forfeitures, is generally recognized over the vesting period on a straight-line basis.
The following summary reflects nonvested restricted stock unit activity and related information for the year ended December 31, 2008.
118
| | | | | | | | |
Restricted Stock Units | | Shares | | | Weighted-
Average
Fair Value* | |
| | | (Millions) | | | | |
Nonvested at December 31, 2010 | | | 5.2 | | | $ | 12.91 | |
Granted | | | 1.4 | | | $ | 23.31 | |
Forfeited | | | (0.2 | ) | | $ | 15.16 | |
Cancelled | | | (0.3 | ) | | $ | — | |
Vested | | | (0.9 | ) | | $ | 26.46 | |
| | | | | | | | |
Nonvested at December 31, 2011 | | | 5.2 | | | $ | 14.12 | |
| | | | | | | | |
THE WILLIAMS COMPANIES, INC.
NOTES TO CONSOLIDATED FINANCIAL STATEMENTS — (Continued)
| | | | | | | | | |
| | | | | | Weighted-
| |
| | | | | | Average
| |
Restricted Stock Units | | Shares | | | Fair Value* | |
| | | (Millions) | | | | |
| |
| Nonvested at December 31, 2007 | | | 4.4 | | | $ | 27.78 | |
| Granted | | | 1.4 | | | $ | 30.13 | |
| Forfeited | | | (.2 | ) | | $ | 27.52 | |
| Vested | | | (1.2 | ) | | $ | 27.51 | |
| | | | | | | | | |
| Nonvested at December 31, 2008 | | | 4.4 | | | $ | 22.91 | |
| | | | | | | | | |
* | | |
* | | Performance-based shares are primarily valued atusing a valuation pricing model. However, certain of these shares were valued using the end-of-period market price until certification that the performance objectives have been completed. Upon certification, these shares are valued atwere completed or a value of zero once it was determined that day’s end-of-period market price.it was unlikely that performance objectives would be met. All other shares are valued at the grant-date market price.price, less dividends projected to be paid over the vesting period. |
Other restricted stock unit information
| | | | | | | | | | | | | |
| | | 2008 | | | 2007 | | | 2006 | |
| |
| Weighted-average grant date fair value of restricted stock units granted during the year, per share | | $ | 30.13 | | | $ | 30.79 | | | $ | 23.39 | |
| | | | | | | | | | | | | |
| Total fair value of restricted stock units vested during the year ($’s in millions) | | $ | 48 | | | $ | 33 | | | $ | 15 | |
| | | | | | | | | | | | | |
| | | | | | | | | | | | |
| | | 2011 | | | 2010 | | | 2009 | |
Weighted-average grant date fair value of restricted stock units granted during the year, per share | | $ | 23.31 | | | $ | 16.37 | | | $ | 7.70 | |
| | | | | | | | | | | | |
Total fair value of restricted stock units vested during the year ($’s in millions) | | $ | 35 | | | $ | 29 | | | $ | 28 | |
| | | | | | | | | | | | |
123
THE WILLIAMS COMPANIES, INC.
NOTES TO CONSOLIDATED FINANCIAL STATEMENTS – (Continued)
Performance-based shares granted under the Plan represent 3330 percent of nonvested restricted stock units outstanding at December 31, 2008.2011. These grants aremay be earned at the end of a three-year period based on actual performance against a performance target. Expense associated with these performance-based grants is recognized in periods after performance targets are established. Based on the extent to which certain financial targets are achieved, vested shares may range from zero percent to 200 percent of the original grant amount.
| |
Note 14. | Fair Value Measurements |
Adoption of SFAS No. 157
SFAS No. 157, “Fair Value
Measurements” (SFAS No. 157), establishes a framework forMeasurementsThe following table presents, by level within the fair value measurements in the financial statements by providing a definition of fair value, provides guidance on the methods used to estimate fair value and expands disclosures about fair value measurements. On January 1, 2008, we applied SFAS No. 157 forhierarchy, our assets and liabilities that are measured at fair value on a recurring basis, primarily our energy derivatives. Upon applying SFAS No. 157,basis.
| | | | | | | | | | | | | | | | | | | | | | | | | | | | | | | | |
| | | December 31, 2011 | | | December 31, 2010 | |
| | | Level 1 | | | Level 2 | | | Level 3 | | | Total | | | Level 1 | | | Level 2 | | | Level 3 | | | Total | |
| | | (Millions) | |
ARO Trust investments (see Note 15) | | $ | 25 | | | $ | — | | | $ | — | | | $ | 25 | | | $ | 40 | | | $ | — | | | $ | — | | | $ | 40 | |
Available-for-sale equity securities (see Note 3) | | | 24 | | | | — | | | | — | | | | 24 | | | | — | | | | — | | | | — | | | | — | |
Energy derivatives | | | 1 | | | | — | | | | — | | | | 1 | | | | — | | | | — | | | | — | | | | — | |
| | | | | | | | | | | | | | | | | | | | | | | | | | | | | | | | |
Total assets | | $ | 50 | | | $ | — | | | $ | — | | | $ | 50 | | | $ | 40 | | | $ | — | | | $ | — | | | $ | 40 | |
| | | | | | | | | | | | | | | | | | | | | | | | | | | | | | | | |
ARO Trust investments: Transco deposits a portion of its collected rates into an external trust (ARO Trust) that is specifically designated to fund future asset retirement obligations pursuant to its 2008 rate case settlement. The ARO Trust invests in a portfolio of actively traded mutual funds.
Available-for-sale marketable equity securities: At December 31, 2011 we changed our valuation methodology to consider our nonperformance riskheld certain equity securities that were subsequently sold in estimating the fair value of our liabilities. The initial adoption of SFAS No. 157 had no material impact on our Consolidated Financial Statements. In February 2008, the FASB issued FSPFAS 157-2, permitting entities to delay application of SFAS No. 157 to fiscal years beginning after November 15, 2008, for nonfinancial assets and nonfinancial liabilities, except for items thatJanuary 2012. These securities are recognized or disclosed at fair value in the financial statements on a recurring basis (at least annually). Beginning January 1, 2009, we will apply SFAS No. 157 fair value requirements to nonfinancial assets and nonfinancial liabilities that are not recognized or disclosed at fair value on a recurring basis. SFAS No. 157 requires two distinct transition approaches: (1) cumulative-effect adjustment to beginning retained earnings for certain financial instrument transactions and (2) prospectively as of the date of adoption through earnings or other comprehensive income, as applicable, for all other instruments. Upon adopting SFAS No. 157, we applied a prospective transition as we did not have financial instrument transactions that required a cumulative-effect adjustment to beginning retained earnings.
119
THE WILLIAMS COMPANIES, INC.
NOTES TO CONSOLIDATED FINANCIAL STATEMENTS — (Continued)
Fair value is the price that would be received to sell an asset or the amount paid to transfer a liability in an orderly transaction between market participants (an exit price) at the measurement date. Fair value is a market based measurement considered from the perspective of a market participant. We use market data or assumptions that market participants would use in pricing the asset or liability, including assumptions about risk and the risks inherent in the inputs to the valuation. These inputs can be readily observable, market corroborated, or unobservable. We apply both market and income approaches for recurring fair value measurements using the best available information while utilizing valuation techniques that maximize the use of observable inputs and minimize the use of unobservable inputs.
SFAS No. 157 establishes a fair value hierarchy that prioritizes the inputs used to measure fair value. The hierarchy gives the highest priority to quoted prices in active markets for identical assets or liabilities (Level 1 measurement) and the lowest priority to unobservable inputs (Level 3 measurement). We classify fair value balances basedtraded on the observability of those inputs. The three levels of the fair value hierarchy are as follows:
| | |
| • | Level 1 — Quoted prices in active markets for identical assets or liabilities that we have the ability to access. Active markets are those in which transactions for the asset or liability occur in sufficient frequency and volume to provide pricing information on an ongoing basis. Our Level 1 primarily consists of financial instruments that are exchange traded, including certain instruments that were part of sales transactions in 2007 and remain to be assigned to the purchaser. These unassigned instruments are entirely offset by reciprocal positions entered into directly with the purchaser. These reciprocal positions have also been included in Level 1. |
|
| • | Level 2 — Inputs are other than quoted prices in active markets included in Level 1, that are either directly or indirectly observable. These inputs are either directly observable in the marketplace or indirectly observable through corroboration with market data for substantially the full contractual term of the asset or liability being measured. Our Level 2 primarily consists of over-the-counter (OTC) instruments such as forwards and swaps. |
|
| • | Level 3 — Includes inputs that are not observable for which there is little, if any, market activity for the asset or liability being measured. These inputs reflect management’s best estimate of the assumptions market participants would use in determining fair value. Our Level 3 consists of instruments valued using industry standard pricing models and other valuation methods that utilize unobservable pricing inputs that are significant to the overall fair value. Instruments in this category primarily include OTC options. |
In valuing certain contracts, the inputs used to measure fair value may fall into different levels of the fair value hierarchy. For disclosure purposes, assets and liabilities are classified in their entirety in the fair value hierarchy level based on the lowest level of input that is significant to the overall fair value measurement. Our assessment of the significance of a particular input to the fair value measurement requires judgment and may affect the placement within the fair value hierarchy levels.
120
THE WILLIAMS COMPANIES, INC.
NOTES TO CONSOLIDATED FINANCIAL STATEMENTS — (Continued)
The following table sets forth by level within the fair value hierarchy our assets and liabilities that are measured at fair value on a recurring basis.
Fair Value Measurements at December 31, 2008 Using:
| | | | | | | | | | | | | | | | | |
| | | Quoted Prices
| | | | | | | | | | |
| | | in Active
| | | | | | | | | | |
| | | Markets for
| | | Significant
| | | | | | | |
| | | Identical
| | | Other
| | | Significant
| | | | |
| | | Assets or
| | | Observable
| | | Unobservable
| | | | |
| | | Liabilities
| | | Inputs
| | | Inputs
| | | | |
| | | (Level 1) | | | (Level 2) | | | (Level 3) | | | Total | |
| | | (Millions) | |
| |
| Assets: | | | | | | | | | | | | | | | | |
| Energy derivatives | | $ | 680 | | | $ | 1,223 | | | $ | 547 | | | $ | 2,450 | |
| Other assets | | | 13 | | | | — | | | | 7 | | | | 20 | |
| | | | | | | | | | | | | | | | | |
| Total assets | | $ | 693 | | | $ | 1,223 | | | $ | 554 | | | $ | 2,470 | |
| | | | | | | | | | | | | | | | | |
| Liabilities: | | | | | | | | | | | | | | | | |
| Energy derivatives | | $ | 615 | | | $ | 1,313 | | | $ | 40 | | | $ | 1,968 | |
| | | | | | | | | | | | | | | | | |
| Total liabilities | | $ | 615 | | | $ | 1,313 | | | $ | 40 | | | $ | 1,968 | |
| | | | | | | | | | | | | | | | | |
Energy derivatives:Energy derivatives include commodity based exchange-traded contracts, and OTC contracts. Exchange-traded contracts include futures and options. OTC contracts include forwards,which consist of swaps and options.
Many contracts have bid and ask prices that can be observed in the market. Our policy is to use a mid-market pricing (the mid-point price between bid and ask prices) convention to value individual positions and then adjust on a portfolio level to a point within the bid and ask range that represents our best estimate of fair value. For offsetting positions by location, the mid-market price is used to measure both the long and short positions.
The determination of fair value also incorporates the time value of money and credit risk factors including the credit standing of the counterparties involved, master netting arrangements, the impact of credit enhancements (such as cash deposits and letters of credit) and our nonperformance risk on our liabilities.
Exchange-traded contracts include New York Mercantile Exchange and Intercontinental Exchange contracts and are valued based on quoted prices in these active markets and are classified within Level 1.
Contracts for which fair value can be estimated from executed transactions or broker quotes corroborated by other market data are generally classified within Level 2. These broker quotes are based on observable market prices at which transactions could currently be executed. In certain instances where these inputs are not observable for all periods, relationshipsmarkets. The tenure of
observable market data and historical observations are used as a means to estimate fair value. Where observable inputs are available for substantially the full term of the asset or liability, the instrument is categorized in Level 2. Ourour energy derivatives portfolio is
largely comprised ofexchange-traded products or like products and the tenurerelatively short with all of our derivatives
portfolio is short with 99 percent expiring
in the next 36 months. Due to the nature of the products and tenure, we are consistently able to obtain market pricing. All pricing is reviewedby March 31, 2013.The following table presents assets measured on a dailynonrecurring basis and is formally validated with broker quotes and documented on a monthly basis by management.
Certain instruments trade in less active markets with lower availability of pricing information requiring valuation models using inputs that may not be readily observable or corroborated by other market data. These instruments are classified within Level 3 when these inputs have a significant impact on the measurement of fair value. The fair value of options is estimated using an industry standard Black-Scholes option pricing model. Certain inputs into the model are generally observable, such as commodity prices and interest rates, whereas other model inputs, such as implied volatility by location, is unobservable and requires judgment in estimating. The instruments
121
THE WILLIAMS COMPANIES, INC.
NOTES TO CONSOLIDATED FINANCIAL STATEMENTS — (Continued)
included in Level 3 at December 31, 2008, predominantly consist of options that primarily hedge future sales of production from our Exploration & Production segment, are structured as costless collars and are financially settled.
The following table sets forth a reconciliation of changes in the fair value of net derivatives and other assets classifiedhierarchy as Level 3 in the fair value hierarchy.
Level 3 Fair Value Measurements Using Significant Unobservable Inputs
Year Endedof December 31, 2008
| | | | | | | | | |
| | | Net Derivatives | | | Other Assets | |
| | | (Millions) | |
| |
| Balance as of January 1, 2008 | | $ | (14 | ) | | $ | 10 | |
| Realized and unrealized gains (losses): | | | | | | | | |
Included inincome from continuing operations | | | 88 | | | | (3 | ) |
Included inother comprehensive income | | | 486 | | | | — | |
| Purchases, issuances, and settlements | | | (51 | ) | | | — | |
| Transfers into Level 3 | | | 3 | | | | — | |
| Transfers out of Level 3 | | | (5 | ) | | | — | |
| | | | | | | | | |
| Balance as of December 31, 2008 | | $ | 507 | | | $ | 7 | |
| | | | | | | | | |
Unrealized gains (losses) included inincome from continuing operationsrelating to instruments still held at December 31, 2008 | | $ | — | | | $ | — | |
| | | | | | | | | |
Realized2010. | | | | | | | | |
| | | Fair Value | | | Total | |
| | | Measurement | | | Impairments | |
| | | (Millions) | |
Certain gathering assets – Williams Partners | | $ | 3 | | | $ | 9 | |
Note 15. Financial Instruments, Derivatives, Guarantees, and unrealized gains (losses) included inincome from continuing operationsfor the above period are reported inrevenuesin our Consolidated StatementConcentration of Income. Reclassification of fair value into and out of Level 3 is made at the end of each quarter.
| |
| Credit Risk Note 15.
| Financial Instruments, Derivatives, Guarantees and Concentration of Credit Risk |
Financial Instruments
We use the following methods and assumptions in estimating our fair-value disclosures for financial instruments:
Cash and cash equivalents and restricted cash: The carrying amounts reported in the balance sheetConsolidated Balance Sheet approximate fair value due to the short-term maturity of these instruments.
Notes and other noncurrent receivables, margin deposits, and customer margin deposits payable: The carrying amounts reported in the balance sheet approximate fair value as these instruments have interest rates approximating market.
Cost-based investments and other securities: This includes cost-based investments, auction rate securities, ARO Trust investments and held-to-maturity securities. These are carried at fair value with the exception of certain international investments that are not publicly traded. In 2007, auction rate securities and held-to-maturity securities are reported Restricted cash is included in
other current assets and deferred chargesin the Consolidated Balance Sheet.
InARO Trust investments: Transco deposits a portion of its collected rates, pursuant to its 2008 auction rate securitiescase settlement, into the ARO Trust. The ARO Trust invests in a portfolio of mutual funds that are classified withinreported at fair value, based on quoted net asset values, ininvestmentsregulatory assets, deferred charges, and otherin the Consolidated Balance Sheet due to auction failures. The ARO Trust investmentsand are classified as available-for-saleavailable-for-sale. However, both realized and unrealized gains and losses are reported inotherultimately recorded as regulatory assets and deferred chargesin the Consolidated Balance Sheet. (See Note 9.)
or liabilities.124
THE WILLIAMS COMPANIES, INC.
NOTES TO CONSOLIDATED FINANCIAL STATEMENTS – (Continued)
Long-term debt: The fair value of our publicly traded long-term debt is valueddetermined using indicative year-endperiod-end traded bond market prices. PrivateThe fair value of our private debt is valued based on market rates and the prices of similar securities with
122
THE WILLIAMS COMPANIES, INC.
NOTES TO CONSOLIDATED FINANCIAL STATEMENTS — (Continued)
similar terms and credit ratings. At December 31, 20082011 and 2007,December 31, 2010, approximately 9596 percent and 90100 percent, respectively, of our long-term debt was publicly traded.
GuaranteesGuarantee: Theguaranteesguaranteerepresented in the following table below consist primarilyconsists of guaranteesa guarantee we have provided in the event of nonpayment by our previously owned communications subsidiary, Williams Communications Group (WilTel), on certaina lease performance obligations.obligation. To estimate the fair value of the guarantees,guarantee, the estimated default rate is determined by obtaining the average cumulative issuer-weighted corporate default rate for each guarantee based on the credit rating of WilTel’s current owner and the term of the underlying obligation. The default rates arerate is published by Moody’s Investors Service.
This guarantee is included inaccrued liabilities in the Consolidated Balance Sheet.Other: Includes current and noncurrent notes receivable, margin deposits, customer margin deposits payable, and cost-based investments. Other also includes available-for-sale equity securities. These securities are reported withinother current assets and deferred charges in the Consolidated Balance Sheet and are carried at fair value based upon the publicly traded equity prices.
Energy derivatives: Energy derivatives include futures, forwards swaps, and options.swaps. These are carried at fair value in the Consolidated Balance Sheet. See Note 14 for a discussion of the valuation of our energy derivatives.
Carrying amounts and fair values of our financial instruments
| | | | | | | | | | | | | | | | | |
| | | 2008 | | | 2007 | |
| | | Carrying
| | | | | | Carrying
| | | | |
Asset (Liability) | | Amount | | | Fair Value | | | Amount | | | Fair Value | |
| | | (Millions) | |
| |
| Cash and cash equivalents | | $ | 1,439 | | | $ | 1,439 | | | $ | 1,699 | | | $ | 1,699 | |
| Restricted cash (current and noncurrent) | | | 133 | | | | 133 | | | | 127 | | | | 127 | |
| Cost-based investments and other securities | | | 37 | | | | 20 | (a) | | | 45 | | | | 20 | (a) |
| Notes and other noncurrent receivables | | | 2 | | | | 2 | | | | 4 | | | | 4 | |
| Margin deposits | | | 8 | | | | 8 | | | | 76 | | | | 76 | |
| Long-term debt, including current portion(b) | | | (7,874 | ) | | | (6,285 | ) | | | (7,890 | ) | | | (8,729 | ) |
| Guarantees | | | (38 | ) | | | (32 | ) | | | (40 | ) | | | (34 | ) |
| Customer margin deposits payable | | | (30 | ) | | | (30 | ) | | | (10 | ) | | | (10 | ) |
| Net energy derivatives(c): | | | | | | | | | | | | | | | | |
| Energy commodity cash flow hedges | | | 458 | | | | 458 | | | | (268 | ) | | | (268 | ) |
| Other energy derivatives | | | 24 | | | | 24 | | | | (100 | ) | | | (100 | ) |
| | | | | | | | | | | | | | | | |
| | | December 31, 2011 | | | December 31, 2010 | |
Asset (Liability) | | Carrying
Amount | | | Fair
Value | | | Carrying
Amount | | | Fair
Value | |
| | | (Millions) | |
Cash and cash equivalents | | $ | 889 | | | $ | 889 | | | $ | 758 | | | $ | 758 | |
Restricted cash | | $ | — | | | $ | — | | | $ | 4 | | | $ | 4 | |
ARO Trust investments | | $ | 25 | | | $ | 25 | | | $ | 40 | | | $ | 40 | |
Long-term debt, including current portion (a) | | $ | (8,718 | ) | | $ | (10,043 | ) | | $ | (9,104 | ) | | $ | (9,990 | ) |
Guarantee | | $ | (34 | ) | | $ | (32 | ) | | $ | (35 | ) | | $ | (34 | ) |
Other | | $ | 82 | | | $ | 81 | (b) | | $ | 2 | | | $ | — | (b) |
Energy derivatives | | $ | 1 | | | $ | 1 | | | $ | — | | | $ | — | |
(a) | Excludes capital leases. |
(b) | |
(a) | | Excludes certain internationalcost-based investments in companies that are not publicly traded and therefore it is not practicable to estimate fair value. (See Note 3.) |
|
(b) | | Excludes capital leases. (See Note 11.) |
|
(c) | | A portionThe carrying value of these derivatives is included in assetsinvestments was $1 million and liabilities of discontinued operations. (See Note 2.)$2 million at December 31, 2011 and December 31, 2010, respectively. |
Energy Commodity Derivatives
Our energy derivative contracts include the following:
Futures contracts: Futures contracts are standardized commitments through an organized commodity exchange to either purchase or sell a commodity at a future date for a specified price. Futures are generally settled in cash, but may be settled through delivery of the underlying commodity. The fair value of these contacts is generally determined using quoted prices.
Forward contracts: Forward contracts are over-the-counter commitments to either purchase or sell a commodity at a future date for a specified price, which involve physical delivery of energy commodities, and may contain either fixed or variable pricing terms. Forward contracts are generally valued based on prices of the underlying energy commodities over the contract life and contractual or notional volumes with the resulting expected future cash flows discounted to a present value using a risk-free market interest rate.
123
Risk management activitiesTHE WILLIAMS COMPANIES, INC.
NOTES TO CONSOLIDATED FINANCIAL STATEMENTS — (Continued)
Swap agreements: Swap agreements require us to make payments to (or receive payments from) counterparties based upon the differential between a fixed and variable price or between variable prices of energy commodities at different locations. Swap agreements are generally valued based on prices of the underlying energy commodities over the contract life and contractual or notional volumes with the resulting expected future cash flows discounted to a present value using a risk-free market interest rate.
Option contracts: Physical and financial option contracts give the buyer the right to exercise the option and receive the difference between a predetermined strike price and a market price at the date of exercise. An option to purchase and an option to sell can be combined in an instrument called a collar to set a minimum and maximum transaction price. These contracts are generally valued based on option pricing models considering prices of the underlying energy commodities over the contract life, volatility of the commodity prices, contractual volumes, estimated volumes under option and other arrangements, and a risk-free market interest rate.
Energy commodity cash flow hedges
We are exposed to market risk from changes in energy commodity prices within our operations. We may utilize derivatives to manage our exposure to the variability in expected future cash flows from forecasted purchases and sales of natural gas and forecasted sales of NGLs attributable to commodity price risk. Certain of these derivatives utilized for risk management purposes have been designated as cash flow hedges, under SFAS No. 133.
Our Exploration & Production segment produces, buyswhile other derivatives have not been designated as cash flow hedges or do not qualify for hedge accounting despite hedging our future cash flows on an economic basis.125
THE WILLIAMS COMPANIES, INC.
NOTES TO CONSOLIDATED FINANCIAL STATEMENTS – (Continued)
We produce and sells natural gassell NGLs and olefins at different locations throughout North America. We also buy natural gas to satisfy the United States.required fuel and shrink needed to generate NGLs and olefins. In addition, we buy NGLs as feedstock to generate olefins. To reduce exposure to a decrease in revenues from fluctuations in NGL market prices or increases in costs and operating expenses from fluctuations in natural gas and NGL market prices, we may enter into NGL or natural gas futures contracts, swap agreements, financial forward contracts, and financial option contracts to mitigate the price risk on forecasted sales of NGLs and purchases of natural gas. We have also entered into basis swap agreements to reduce the locational price risk associated with our producing basins. Exploration & Production’sgas and NGLs. Those designated as cash flow hedges are expected to be highly effective in offsetting cash flows attributable to the hedged risk during the term of the hedge. However, ineffectiveness may be recognized primarily as a result of locational differences between the hedging derivative and the hedged item.
Volumes
Our Midstream segment produces, buysenergy commodity derivatives are comprised of both contracts to purchase the commodity (long positions) and sells NGLs at different locations throughoutcontracts to sell the United States. Our Midstream segment also buys the required fuel and shrink needed to generate NGLs. To reduce exposure to a decrease in revenues from fluctuations in NGL market prices, we may hedge price risk by enteringcommodity (short positions). Derivative transactions are categorized into NGL swap agreements, financial forward contracts,two types:
Central hub risk: Includes physical and financial optionderivative exposures to Henry Hub for natural gas and Mont Belvieu for NGLs;
Basis risk: Includes physical and financial derivative exposures to the difference in value between the central hub and another specific delivery point.
The following table depicts the notional quantities of the net long (short) positions in our commodity derivatives portfolio as of December 31, 2011. NGLs are presented in barrels.
| | | | | | | | | | | | |
Derivative Notional Volumes | | Unit of
Measure | | | Central Hub
Risk | | | Basis
Risk | |
Not Designated as Hedging Instruments | | | | | | | | | | | | |
Williams Partners | | | Barrels | | | | 45,000 | | | | 240,000 | |
Midstream Canada & Olefins | | | Barrels | | | | (25,000 | ) | | | | |
Fair values and gains (losses)
At December 31, 2011, the fair value of our energy commodity derivatives was an asset of $1 million. These derivative contracts were not designated as hedging instruments. Our derivatives are included inother current assets and deferred charges in our Consolidated Balance Sheet. Derivatives are classified as current or noncurrent based on the contractual timing of expected future net cash flows of individual contracts. The expected future net cash flows for derivatives classified as current are expected to mitigateoccur within the price risknext 12 months. The fair value amount is on forecasted salesa gross basis and does not reflect the netting of NGLs. Midstream’sasset and liability positions permitted under the terms of our master netting arrangements. Further, the amount does not include cash held on deposit in margin accounts that we have received or remitted to collateralize certain derivative positions.
126
THE WILLIAMS COMPANIES, INC.
NOTES TO CONSOLIDATED FINANCIAL STATEMENTS – (Continued)
The following table presents pre-tax gains and losses for our energy commodity derivatives designated as cash flow hedges, are expected to be highly effectiveas recognized in offsetting cash flows attributable to the hedged risk during the term of the hedge. However, ineffectiveness may beAOCI,revenues,orcosts and operating expenses.
| | | | | | | | | | | | |
| | | Years ended December 31, | | | | |
| | | 2011 | | | 2010 | | | Classification | |
| | | (Millions) | | | | |
Net gain (loss) recognized in other comprehensive income (loss) (effective portion) | | $ | (18 | ) | | $ | (12 | ) | | | AOCI | |
Net gain (loss) reclassified from accumulated other comprehensive income (loss) into income (effective portion) | | $ | (18 | ) | | $ | (13 | ) | |
| Revenues or Costs and
Operating Expenses |
|
Gain (loss) recognized in income (ineffective portion) | | $ | — | | | $ | — | | |
| Revenues or Costs and
Operating Expenses |
|
There were no gains or losses recognized primarilyin income as a result of locational differences betweenexcluding amounts from the assessment of hedge effectiveness or as a result of reclassifications to earnings following the discontinuance of any cash flow hedges.
We recognized losses of $2 million and $1 million inrevenues for the years ended December 31, 2011 and 2010, respectively, on our energy commodity derivatives not designated as hedging instruments.
The cash flow impact of our derivative activities is presented in the Consolidated Statement of Cash Flows aschanges in current and noncurrent derivative assets and liabilities.
Credit-risk-related features
Certain of our derivative contracts contain credit-risk-related provisions that would require us, in certain circumstances, to post additional collateral in support of our net derivative liability positions. These credit-risk-related provisions require us to post collateral in the hedged item. Midstream doesform of cash or letters of credit when our net liability positions exceed an established credit threshold. The credit thresholds are typically based on our senior unsecured debt ratings from Standard and Poor’s and/or Moody’s Investors Service. Under these contracts, a credit ratings decline would lower our credit thresholds, thus requiring us to post additional collateral. We also have contracts that contain adequate assurance provisions giving the counterparty the right to request collateral in an amount that corresponds to the outstanding net liability.
As of December 31, 2011 and December 31, 2010, we did not have any commodity-relatedcollateral posted, either in the form of cash or letters of credit, to derivative counterparties since we had respective net derivative asset positions with all of our counterparties.
Cash flow hedges at December 31, 2008.
Changes in the fair value of our cash flow hedges, to the extent effective, are deferred in other comprehensive incomeAOCI and are reclassified intorevenues earnings in the same period or periods in which the hedged forecasted purchases or sales affect earnings, or when it is probable that the hedged forecasted transaction will not occur by the end of the originally specified time period. During 2008, we reclassified approximately $2 million of net losses from other comprehensive income to earnings as a result of the discontinuance of cash flow hedges because the forecasted transaction did not occur by the end of the originally specified time period. In second-quarter 2007, we recognized a net gain of $429 million (reported inrevenuesof discontinued operations) associated with the reclassification of deferred net hedge gains of our former power business fromaccumulated other comprehensive income/lossto earnings. This reclassification was based on the determination that the hedged forecasted transactions were probable of not occurring. See Note 2 for further discussion. Approximately $2 million and $14 million of net losses from hedge ineffectiveness are included inrevenuesduring 2008 and 2007, respectively. For 2008 and 2007, there are no derivative gains or losses excluded from the assessment of hedge effectiveness. As of December 31, 2008,2011, we have realized all of our hedged portions of future cash flows associated with anticipated energy commodity purchases and sales for up to four years.purchases. Based on recorded values at December 31, 2008, approximately $189 million of2011, no net gains (net of income
124
THE WILLIAMS COMPANIES, INC.
NOTES TO CONSOLIDATED FINANCIAL STATEMENTS — (Continued)
tax provision of $115 million)or losses will be reclassified into earnings within the next year. These recorded values are based on market prices of the commodities as of December 31, 2008. Due to the volatile nature of commodity prices and changes in the creditworthiness of counterparties, actual gains or losses realized in 2009 will likely differ from these values. These gains or losses will offset net losses or gains that will be realized in earnings from previous unfavorable or favorable market movements associated with underlying hedged transactions.
127
Other energy derivativesTHE WILLIAMS COMPANIES, INC.
Our Gas Marketing Services and Exploration & Production segments have other energy derivatives that have not been designated or do not qualify as SFAS No. 133 hedges. As such, the net change in their fair value is recognized inrevenuesin the Consolidated Statement of Income. Even though they do not qualify for hedge accounting (seederivative instruments and hedging activities in Note 1 for a description of hedge accounting), certain of these derivatives hedge our future cash flows on an economic basis.
Other energy-related contractsNOTES TO CONSOLIDATED FINANCIAL STATEMENTS – (Continued)
We also hold significant nonderivative energy-related contracts, such as storage and transportation agreements, in our Gas Marketing Services portfolio. These have not been included in the financial instruments table above or in our Consolidated Balance Sheet because they are not derivatives as defined by SFAS No. 133.
In addition to the guarantees and payment obligations discussed elsewhere in these footnotes (see Notes 3Note 2 and 16),Note 16, we have issued guarantees and other similar arrangements as discussed below.
In connection with agreements executed to resolve take-or-pay and other contract claims and to amend gas purchase contracts, Transco entered into certain settlements with producers that may require the indemnification of certain claims for additional royalties that the producers may be required to pay as a result of such settlements. Transco, through its agent, Gas Marketing Services, continues to purchase gas under contracts which extend, in some cases, through the life of the associated gas reserves. Certain of these contracts contain royalty indemnification provisions that have no carrying value. Producers have received certain demands and may receive other demands, which could result in claims pursuant to royalty indemnification provisions. Indemnification for royalties will depend on, among other things, the specific lease provisions between the producer and the lessor and the terms of the agreement between the producer and Transco. Consequently, the potential maximum future payments under such indemnification provisions cannot be determined. However, management believes that the probability of material payments is remote.
In connection with the 1993 public offering of units in the Williams Coal Seam Gas Royalty Trust (Royalty Trust), our Exploration & Production segment entered into a gas purchase contract for the purchase of natural gas in which the Royalty Trust holds a net profits interest. Under this agreement, we guarantee a minimum purchase price that the Royalty Trust will realize in the calculation of its net profits interest. We have an annual option to discontinue this minimum purchase price guarantee and pay solely based on an index price. The maximum potential future exposure associated with this guarantee is not determinable because it is dependent upon natural gas prices and production volumes. No amounts have been accrued for this contingent obligation as the index price continues to exceed the minimum purchase price.
We are required by certainour revolving credit agreements to indemnify lenders to ensure that the interest rates received by them under various loan agreements are not reduced by taxes by providing for the reimbursement of any taxes required to be paidwithheld from payments due to the lenders and for any tax payments made by the lender.lenders. The maximum potential amount of future payments under these indemnifications is based on the related borrowings.borrowings and such future payments cannot currently be determined. These indemnifications generally continue indefinitely unless limited by the underlying tax regulations and have no carrying value. We have never been called upon to perform under these indemnifications.
125
THE WILLIAMS COMPANIES, INC.
NOTES TO CONSOLIDATED FINANCIAL STATEMENTS — (Continued)
We have provided guaranteesa guarantee in the event of nonpayment by our previously owned communications subsidiary, WilTel, on a certain lease performance obligationsobligation that extendextends through 2042. The maximum potential exposure is approximately $42$38 million at December 31, 2008,2011 and $44$39 million at December 31, 2007.2010. Our exposure declines systematically throughout the remaining term of WilTel’s obligations.obligation. The carrying value of these guaranteesthe guarantee included inaccrued liabilities on the Consolidated Balance Sheet is approximately $38$34 million at December 31, 2008.
Former managing directors of Gulf Liquids are involved in litigation related2011 and $35 million at December 31, 2010.At December 31, 2011, we do not expect these guarantees to the construction of gas processing plants. Gulf Liquids has indemnity obligations to the former managing directors for legal fees and potential losses that may result from this litigation. Claims against these former managing directors have been settled and dismissed after paymentsa material impact on their behalf by directors and officers insurers. Some unresolved issues remain between us and these insurers, but no amounts have been accrued for any potential liability.
We have guaranteed the performance of a former subsidiary of our wholly owned subsidiary MAPCO Inc., under a coal supply contract. This guarantee was granted by MAPCO Inc. upon the sale of its former subsidiary to a third-party in 1996. The guaranteed contract provides for an annual supply of a minimum of 2.25 million tons of coal. Our potential exposure is dependent on the difference between current market prices of coal and the pricing terms of the contract, both of which are variable, and the remaining term of the contract. Given the variability of the terms, the maximum future potential payments cannot be determined. We believe that our likelihood of performance under this guarantee is remote. In the eventliquidity or financial position. However, if we are required to perform we are fully indemnified byon these guarantees in the purchaserfuture, it may have an adverse effect on our results of MAPCO Inc.’s former subsidiary. This guarantee expires in December 2010 and has no carrying value.
operations.Concentration of Credit Risk
Our cash equivalents are primarily invested in funds with high-quality, short-term securities and instruments that are issued or guaranteed by the U.S. government.
Accounts and notes receivable
The following table summarizes concentration of receivables, including those related to discontinued operations (see Note 2), net of allowances, by product or service at December 31, 20082011 and 2007:
| | | | | | | | | |
| | | 2008 | | | 2007 | |
| | | (Millions) | |
| |
| Receivables by product or service: | | | | | | | | |
| Sale of natural gas and related products and services | | $ | 653 | | | $ | 882 | |
| Transportation of natural gas and related products | | | 158 | | | | 177 | |
| Joint interest | | | 86 | | | | 80 | |
| Sales of power and related services | | | — | | | | 55 | |
| Other | | | 49 | | | | 53 | |
| | | | | | | | | |
| Total | | $ | 946 | | | $ | 1,247 | |
| | | | | | | | | |
2010: | | | | | | | | |
| | | December 31, | |
| | | 2011 | | | 2010 | |
| | | (Millions) | |
Receivables by product or service: | | | | | | | | |
Sale of NGLs and related products and services | | $ | 446 | | | $ | 345 | |
Transportation of natural gas and related products | | | 164 | | | | 149 | |
Other, including certain amounts due from WPX | | | 27 | | | | 3 | |
| | | | | | | | |
Total | | $ | 637 | | | $ | 497 | |
| | | | | | | | |
Natural gas and NGL customers include pipelines, distribution companies, producers, gas marketers and industrial users primarily located in the central, eastern and northwestern United States, Rocky Mountains, Gulf Coast, Venezuela and Canada. As a general policy, collateral is not required for receivables, but customers’ financial condition and credit worthiness are evaluated regularly.
Our Venezuelan operations are operated for the exclusive benefit of PDVSA. As energy commodity prices have sharply declined, PDVSA has failed to make regular payments to many service providers, including us. Included withinsale of natural gas and related products and servicesin the table above at December 31, 2008, is a $57 million net receivable from PDVSA, none of which was 60 days old or older at that date. We continue to
126
128
THE WILLIAMS COMPANIES, INC.
NOTES TO CONSOLIDATED FINANCIAL STATEMENTS —– (Continued)
monitor the situationRevenues
In 2011 and are actively seeking resolution with PDVSA. The collection of receivables from PDVSA has historically been slower2010, we had one customer that accounted for 17 percent and more time consuming than our other customers due to their policies and the political unrest in Venezuela. We expect, at this time, that the amounts will ultimately be paid.
Derivative assets and liabilities
We have a risk of loss as a result of counterparties not performing pursuant to the terms of their contractual obligations. Counterparty performance can be influenced by changes in the economy and regulatory issues, among other factors. Risk of loss results from items including credit considerations and the regulatory environment for which a counterparty transacts. We attempt to minimize credit-risk exposure to derivative counterparties and brokers through formal credit policies, consideration of credit ratings from public ratings agencies, monitoring procedures, master netting agreements and collateral support under certain circumstances. Additional collateral support could include letters of credit, payment under margin agreements, and guarantees of payment by credit worthy parties.
We also enter into master netting agreements to mitigate counterparty performance and credit risk. During 2008 and 2007, we did not incur any significant losses due to counterparty bankruptcy filings.
The gross credit exposure from our derivative contracts, a portion of which is included in assets of discontinued operations (see Note 2), as of December 31, 2008, is summarized as follows.
| | | | | | | | | |
| | | Investment
| | | | |
Counterparty Type | | Grade(a) | | | Total | |
| | | (Millions) | |
| |
| Gas and electric utilities | | $ | 2 | | | $ | 2 | |
| Energy marketers and traders | | | 127 | | | | 896 | |
| Financial institutions | | | 1,558 | | | | 1,559 | |
| | | | | | | | | |
| | | $ | 1,687 | | | | 2,457 | |
| | | | | | | | | |
| Credit reserves | | | | | | | (6 | ) |
| | | | | | | | | |
| Gross credit exposure from derivatives | | | | | | $ | 2,451 | |
| | | | | | | | | |
We assess our credit exposure on a net basis to reflect master netting agreements in place with certain counterparties. We offset our credit exposure to each counterparty with amounts we owe the counterparty under derivative contracts. The net credit exposure from our derivatives as of December 31, 2008, excluding collateral support discussed below, is summarized as follows.
| | | | | | | | | |
| | | Investment
| | | | |
Counterparty Type | | Grade(a) | | | Total | |
| | | (Millions) | |
| |
| Gas and electric utilities | | $ | — | | | $ | 1 | |
| Energy marketers and traders | | | 79 | | | | 80 | |
| Financial institutions | | | 600 | | | | 600 | |
| | | | | | | | | |
| | | $ | 679 | | | | 681 | |
| | | | | | | | | |
| Credit reserves | | | | | | | (6 | ) |
| | | | | | | | | |
| Net credit exposure from derivatives | | | | | | $ | 675 | |
| | | | | | | | | |
| | |
(a) | | We determine investment grade primarily using publicly available credit ratings. We include counterparties with a minimum Standard & Poor’s of BBB- or Moody’s Investors Service rating of Baa3 in investment grade. |
127
THE WILLIAMS COMPANIES, INC.
NOTES TO CONSOLIDATED FINANCIAL STATEMENTS — (Continued)
Our ten largest net counterparty positions represent approximately 9915 percent of our net credit exposure from derivatives and are all with investment grade counterparties. Included within this group are five counterparty positions, representing 72 percent of our net credit exposure from derivatives, associated with Exploration & Production’s hedging facility. (See Note 11.) Under certain conditions, the terms of this credit agreement may require the participating financial institutions to deliver collateral support with a designated collateral agent (which is another participating financial institution in the agreement). The level of collateral support required is dependent on whether the net position of the counterparty financial institution exceeds specified thresholds. The thresholds may be subject to prescribed reductions based changes in the credit rating of the counterparty financial institution.
At December 31, 2008, the designated collateral agent held $198 million of collateral support on our behalf under Exploration & Production’s hedging facility. In addition, we held collateral support, including letters of credit, of $36 million related to our other derivative positions.
Revenues
In 2008, 2007 and 2006, thereconsolidated revenues, respectively. There were no customers for which our sales exceeded 10 percent of our consolidated revenues.
| |
| revenues in 2009. Note 16. Contingent Liabilities and Commitments Note 16.
| Contingent Liabilities and Commitments |
Indemnification of WPX MattersWe have agreed to indemnify our former affiliate, WPX and its subsidiaries, related to the following matters. In connection with this indemnification, we have retained applicable accrued asset and liability balances associated with these matters, and as a result, have an indirect exposure to future developments in these matters.
Issues Resulting from California Energy Crisis
OurWPX’s former power business was engaged in power marketing in various geographic areas, including California. Prices charged for power by usWPX and other traders and generators in California and other western states in 2000 and 2001 were challenged in various proceedings, including those before the U.S. Federal Energy Regulatory Commission (FERC). These challenges included refund proceedings, summer 200290-day contracts, investigations of alleged market manipulation including withholding, gas indices and other gaming of the market, new long-term power sales to the State of California that were subsequently challenged and civil litigation relating to certain of these issues. We haveWPX has entered into settlements with the State of California (State Settlement), major California utilities (Utilities Settlement), and others that substantially resolved each of these issues with these parties.
AsAlthough the State Settlement and Utilities Settlement resolved a resultsignificant portion of a June 2008 U.S. Supreme Court decision,the refund issues among the settling parties, WPX continues to have potential refund exposure to nonsettling parties, including various California end users that did not participate in the Utilities Settlement. WPX is currently in settlement negotiations with certain contracts that we entered into during 2000California utilities aimed at eliminating or substantially reducing this exposure. If successful, and 2001 may be subject to partial refunds dependinga final “true-up” mechanism, the settlement agreement would also resolve WPX’s collection of accrued interest from counterparties as well as their payment of accrued interest on the results of further proceedings at the FERC. These contracts, under which we sold electricity, totaled approximately $89 million in revenue. While we are not a party to the cases involved in the U.S. Supreme Court decision, the buyer of electricity from us is a party to the cases and claims that we must refund to the buyer any loss it suffers due to the FERC’s reconsideration of the contract terms at issue in the decision. The FERC has directedamounts. Thus, as currently contemplated by the parties, the settlement agreement would resolve most, if not all, of WPX’s legal issues arising from the 2000-2001 California Energy Crisis. We currently have a net receivable from WPX related to provide additional information on certain issues remanded by the U.S. Supreme Court, but delayed the submission of this information to permit the parties to explore possible settlements of the contractual disputes.
these matters.Certain other issues also remain open at the FERC and for other nonsettling parties.
Refund proceedings
Although we entered into the State Settlement and Utilities Settlement, which resolved the refund issues among the settling parties, we continue to have potential refund exposure to nonsettling parties, such as the counterparty to the contracts described above and various California end users that did not participate in the Utilities Settlement. As a part of the Utilities Settlement, we funded escrow accounts that we anticipate will satisfy any ultimate refund determinations in favor of the nonsettling parties including interest on refund amounts that we might owe to settling and nonsettling parties. We are also owed interest from counterparties in the California market during the refund period for which we have recorded a receivable totaling approximately $24 million at December 31, 2008. Collection of the interest and the payment of interest on refund amounts from the escrow accounts is
128
THE WILLIAMS COMPANIES, INC.
NOTES TO CONSOLIDATED FINANCIAL STATEMENTS — (Continued)
subject to the conclusion of this proceeding. Therefore, we continue to participate in the FERC refund case and related proceedings.
Challenges to virtually every aspect of the refund proceedings, including the refund period, continue to be made. Because of our settlements, we do not expect that the final resolution of refund obligations will have a material impact on us. Despite two FERC decisions that will affect the refund calculation, significant aspects of the refund calculation process remain unsettled, and the final refund calculation has not been made.
Reporting of Natural Gas-Related Information to Trade Publications
Civil suits based on allegations of manipulating published gas price indices have been brought against usWPX and others, in each case seeking an unspecified amount of damages. We areWPX is currently a defendant in:
| | |
| • | State court litigation in California brought on behalf of certain business and governmental entities that purchased gas for their use. |
|
| • | Classin class action litigation and other litigation originally filed in state court in Colorado, Kansas, Missouri, Tennessee and Wisconsin brought on behalf of direct and indirect purchasers of gas in those states. |
| | |
| • | A Missouri class action and the cases from other jurisdictions were transferred to the federal court in Nevada. In 2008, the federal court in Nevada granted summary judgment in the Colorado case in favor of us and most of the other defendants, and on January 8, 2009, the court denied the plaintiffs’ request for reconsideration of the Colorado dismissal. We expect that the Colorado plaintiffs will appeal. |
|
| • | On October 29, 2008, the Tennessee appellate court reversed the state court’s dismissal of the plaintiffs’ claims on federal preemption grounds and sent the case back to the lower court for further proceedings. We and other defendants appealed the reversal to the Tennessee Supreme Court. |
|
| • | On January 13, 2009, the Missouri state court dismissed a case for lack of standing. We expect that the decision will be appealed. |
Environmental Matters
Continuing operations
Since 1989, our Transco subsidiary has had studies underway to test certain of its facilities for the presence of toxic and hazardous substances to determine to what extent, if any, remediation may be necessary. Transco has responded to data requests from the U.S. Environmental Protection Agency (EPA) and state agencies regarding such potential contamination of certain of its sites. Transco has identified polychlorinated biphenyl (PCB) contamination in compressor systems, soils and related properties at certain compressor station sites. Transco has also been involved in negotiations with the EPA and state agencies to develop screening, sampling and cleanup programs. In addition, Transco commenced negotiations with certain environmental authorities and other
parties concerning investigativelitigation originally filed in state court in Colorado, Kansas, Missouri and
remedial actions relativeWisconsin brought on behalf of direct and indirect purchasers of natural gas in those states. These cases were transferred to
potential mercury contamination at certain gas metering sites. The coststhe federal court in Nevada. In 2008, the court granted summary judgment in the Colorado case in favor of
any such remediation will depend upon the scopeWPX and most of the
remediation. At December 31, 2008, we had accrued liabilitiesother defendants based on plaintiffs’ lack of
$5 million relatedstanding. In 2009, the court denied the plaintiffs’ request for reconsideration of the Colorado dismissal and entered judgment in WPX’s favor. The court’s order became final on July 18, 2011, and the Colorado plaintiffs might appeal the order.In the other cases, on July 18, 2011, the Nevada district court granted WPX’s joint motions for summary judgment to PCB contamination, potential mercury contamination, and other toxic and hazardous substances. Transco has been identifiedpreclude the plaintiffs’ state law claims because the federal Natural Gas Act gives the FERC exclusive jurisdiction to resolve those issues. The court also denied the plaintiffs’ class certification motion as a potentially responsible party at various Superfund and state waste disposal sites. Based on present volumetric estimates and other factors, we have estimated our aggregate exposure for remediation of these sites to be less than $500,000, which is included in the environmental accrual discussed above. We expect that these costs will be recoverable through Transco’s rates.
Beginning in the mid-1980s, our Northwest Pipeline subsidiary evaluated many of its facilities for the presence of toxic and hazardous substances to determine to what extent, if any, remediation might be necessary. Consistent with other natural gas transmission companies, Northwest Pipeline identified PCB contamination in air compressor systems, soils and related properties at certain compressor station sites. Similarly, Northwest Pipeline identified
129
THE WILLIAMS COMPANIES, INC.
NOTES TO CONSOLIDATED FINANCIAL STATEMENTS —– (Continued)
hydrocarbon impacts at these facilities duemoot. On July 22, 2011, the plaintiffs’ appealed the court’s ruling to the former useNinth Circuit Court of earthen pitsAppeals, and mercury contamination at certain gas metering sites. The PCBs were remediated pursuant to a Consent Decree with the EPA inparties are briefing the late 1980s and Northwest Pipeline conducted a voluntaryclean-upissues. Because of the hydrocarbonuncertainty around these current pending unresolved issues, including an insufficient description of the purported classes and mercury impactsother related matters, we cannot reasonably estimate a range of potential exposures at this time. However, it is reasonably possible that the ultimate resolution of these items and our related indemnification obligation could result in the early 1990s. In 2005, the Washington Departmentfuture charges that may be material to our results of Ecology required Northwest Pipeline to reevaluate its previous mercuryoperations.
clean-upsEnvironmental Matters
We are a participant in Washington. Consequently, Northwest Pipeline is conducting additional remediationcertain environmental activities in various stages including assessment studies, cleanup operations and remedial processes at certain sites, to comply with Washington’s current environmental standards. At December 31, 2008,some of which we have accrued liabilities of $9 million for these costs. We expect that these costs will be recoverable through Northwest Pipeline’s rates.
In March 2008, the EPA issued a new air quality standard for ground level ozone. The new standard will likely impact the operations of our interstate gas pipelines and cause us to incur additional capital expenditures to comply. At this time we are unable to estimate the cost of these additions that may be required to meet the new regulations. We expect that costs associated with these compliance efforts will be recoverable through rates.
We also accrue environmental remediation costs for natural gas underground storage facilities, primarily related to soil and groundwater contamination. At December 31, 2008, we have accrued liabilities totaling $6 million for these costs.
In April 2007, the New Mexico Environment Department’s Air Quality Bureau (NMED) issued an NOV to Williams Four Corners, LLC (Four Corners) that alleged various emission and reporting violations in connection with our Lybrook gas processing plant’s flare and leak detection and repair program. In December 2007, the NMED proposed a penalty of approximately $3 million. In July 2008, the NMED issued an NOV to Four Corners that alleged air emissions permit exceedances for three glycol dehydrators at one of our compressor facilities and proposed a penalty of approximately $103,000.currently do not own. We are discussing the proposed penaltiesmonitoring these sites in a coordinated effort with the NMED.
In March 2008, the EPA proposed a penalty of $370,000 for alleged violations relating to leak detection and repair program delays at our Ignacio gas plant in Colorado and for alleged permit violations at a compressor station. We met withother potentially responsible parties, the EPA, and other governmental authorities. We are exchanging informationjointly and severally liable along with unrelated third parties in order to resolve the issues.
In September 2007, the EPA requested,some of these activities and our Transco subsidiary later provided, information regarding natural gas compressor stationssolely responsible in the states of Mississippi and Alabama as part of the EPA’s investigation of our compliance with the Clean Air Act. On March 28, 2008, the EPA issued NOVs alleging violations of Clean Air Act requirements at these compressor stations. We met with the EPA in May 2008 and submitted our response denying the allegations in June 2008.
Former operations, including operations classified as discontinued
In connection with the sale of certain assets and businesses, we have retained responsibility, through indemnification of the purchasers, for environmental and other liabilities existing at the time the sale was consummated, as described below.
Agrico
In connection with the 1987 sale of the assets of Agrico Chemical Company, we agreed to indemnify the purchaser for environmental cleanup costs resulting from certain conditions at specified locations to the extent such costs exceed a specified amount. At December 31, 2008, we have accrued liabilities of $9 million for such excess costs.
Other
At December 31, 2008, we have accrued environmental liabilities of $14 million related primarily to our:
| | |
| • | Potential indemnification obligations to purchasers of our former retail petroleum and refining operations; |
|
| • | Former propane marketing operations, bio-energy facilities, petroleum products and natural gas pipelines; |
130
THE WILLIAMS COMPANIES, INC.
NOTES TO CONSOLIDATED FINANCIAL STATEMENTS — (Continued)
| | |
| • | Discontinued petroleum refining facilities; and |
|
| • | Former exploration and production and mining operations. |
others. Certain of our subsidiaries have been identified as potentially responsible parties at various Superfund and state waste disposal sites. In addition, these subsidiaries have incurred, or are alleged to have incurred, various other hazardous materials removal or remediation obligations under environmental laws.
Summary As of environmental matters
Actual costs incurredDecember 31, 2011, we have accrued liabilities totaling $47 million for these matters,
couldas discussed below. Our accrual reflects the most likely costs of cleanup, which are generally based on completed assessment studies, preliminary results of studies or our experience with other similar cleanup operations. Certain assessment studies are still in process for which the ultimate outcome may yield significantly different estimates of most likely costs. Any incremental amount in excess of amounts currently accrued cannot be
substantially greater than amounts accrued depending onreasonably estimated at this time due to uncertainty about the actual number of contaminated sites
ultimately identified, the actual amount and extent of contamination discovered
and the final cleanup standards mandated by the EPA and other governmental
authorities.The EPA and various state regulatory agencies routinely promulgate and propose new rules, and issue updated guidance to existing rules. These new rules and rulemakings include, but are not limited to, rules for reciprocating internal combustion engine maximum achievable control technology, new air quality standards for ground level ozone, and one hour nitrogen dioxide emission limits. We are unable to estimate the costs of asset additions or modifications necessary to comply with these new regulations due to uncertainty created by the various legal challenges to these regulations and the need for further specific regulatory guidance.
Continuing operations
Our interstate gas pipelines are involved in remediation activities related to certain facilities and locations for polychlorinated biphenyl, mercury contamination, and other hazardous substances. These activities have involved the EPA, various state environmental authorities and other factors, but the amount cannotidentification as a potentially responsible party at various Superfund waste disposal sites. At December 31, 2011, we have accrued liabilities of $10 million for these costs. We expect that these costs will be reasonably estimated at this time.
Other Legal Matters
Will Price (formerly Quinque)
In 2001, fourteen of our entities were named as defendants in a nationwide class action lawsuit in Kansas state court that had been pending against other defendants, generally pipeline and gathering companies, since 2000. The plaintiffs alleged that the defendants have engaged in mismeasurement techniques that distort the heating content ofrecoverable through rates.We also accrue environmental remediation costs for natural gas resulting in an alleged underpayment of royaltiesunderground storage facilities, primarily related to the class of producer plaintiffssoil and sought an unspecified amount of damages. The fourth amended petition, which was filed in 2003, deleted all of our defendant entities except two Midstream subsidiaries. All remaining defendantsgroundwater contamination. At December 31, 2011, we have opposed class certification and a hearing on plaintiffs’ second motion to certify the class was held in April 2005. We are awaiting a decision from the court. The amount of any possible liability cannot be reasonably estimated at this time.
Grynberg
In 1998, the U.S. Department of Justice (DOJ) informed us that Jack Grynberg, an individual, had filed claims on behalf of himself and the federal government, in the United States District Courtaccrued liabilities totaling $8 million for the District of Colorado under the False Claims Act against us and certain of our wholly owned subsidiaries. The claims sought an unspecified amount of royalties allegedly not paid to the federal government, treble damages, a civil penalty, attorneys’ fees, andthese costs. In connection with our sales of Kern River Gas Transmission in 2002 and Texas Gas Transmission Corporation in 2003, we agreed to indemnify the purchasers for any liability relating to this claim, including legal fees. The maximum amount of future payments that we could potentially be required to pay under these indemnifications depends upon the ultimate resolution of the claim and cannot currently be determined. Grynberg had also filed claims against approximately 300 other energy companies alleging that the defendants violated the False Claims Act in connection with the measurement, royalty valuation and purchase of hydrocarbons. In 1999, the DOJ announced that it would not intervene in any of the Grynberg cases. Also in 1999, the Panel on Multi-District Litigation transferred all of these cases, including those filed against us, to the federal court in Wyoming for pre-trial purposes. The District Court dismissed all claims against us and our wholly owned subsidiaries. The matter is on appeal to the Tenth Circuit Court of Appeals.
In August 2002, Jack J. Grynberg, and Celeste C. Grynberg, Trustee on Behalf of the Rachel Susan Grynberg Trust, and the Stephen Mark Grynberg Trust, served us and one of our Exploration & Production subsidiaries with a complaint in state court in Denver, Colorado. The plaintiffs alleged we used mismeasurement techniques that distorted the British Thermal Unit heating content of natural gas resulting in the underpayment of royalties to them and other independent natural gas producers. They also alleged we took inappropriate deductions from the gross value of their natural gas and made other royalty valuation errors. Under various theories of relief, they were seeking actual damages between $2 million and $20 million based on interest rate variations and punitive damages in the amount of approximately $1 million. In 2005, the parties agreed to dismiss mismeasurement claims. In September
131
130
THE WILLIAMS COMPANIES, INC.
NOTES TO CONSOLIDATED FINANCIAL STATEMENTS —– (Continued)
2008,Former operations, including operations classified as discontinued
We have potential obligations in connection with assets and businesses we no longer operate. These potential obligations include the court ruled in our favor on motionsindemnification of the purchasers of certain of these assets and businesses for summary judgment dismissing various claims. Trial onenvironmental and other liabilities existing at the remaining breachtime the sale was consummated. Our responsibilities relate to the operations of contractthe assets and accounting claims occurred in November 2008. The jury found against usbusinesses described below.
Former agricultural fertilizer and awarded less than $2 million, which we believe materially concludes the matter. The plaintiffs seek to increase the total award by approximately $1 million, whichchemical operations and former retail petroleum and refining operations;
Former petroleum products and natural gas pipelines;
Former petroleum refining facilities;
Former exploration and production and mining operations;
Former electricity and natural gas marketing and trading operations.
At December 31, 2011, we have contested.
Securities class actions
Numerous shareholder class action suits were filed against us in 2002 in the United States District Court for the Northern Districtaccrued environmental liabilities of Oklahoma. The majority of the suits alleged that we and co-defendants, WilTel, previously a subsidiary known as Williams Communications, and certain corporate officers, acted jointly and separately$29 million related to inflate the price of WilTel securities. WilTel was dismissed as a defendant as a result of its bankruptcy.
On July 6, 2007, the court granted various defendants’ motions for summary judgment and entered judgment for us and the other defendants in the WilTel matter. On February 18, 2009, the Tenth Circuit Court of Appeals affirmed the lower court’s decision. The plaintiffs might seek rehearing before the Tenth Circuit or request a writ of certiorari from the United States Supreme Court. Any obligation of ours to the WilTel equity holders as a result of a settlement, or as a result of trial in the event of a successful appeal of the court’s judgment, will not likely be covered by insurance because our insurance coverage has been fully utilized by the settlement described above. The extent of any such obligation is presently unknown and cannot be estimated, but it is reasonably possible that our exposure could materially exceed amounts accrued for this matter.
these matters.Other Legal Matters
TAPS Quality Bank
One of our subsidiaries, Williams Alaska Petroleum, Inc. (WAPI), has been engaged in administrative litigation being conducted jointly by the FERC and the Regulatory Commission of Alaska (RCA) concerning the Trans-Alaska Pipeline System (TAPS) Quality Bank. In 2004, the FERC and RCA presiding administrative law judges rendered their joint and individual initial decisions, and we accrued approximately $134 million based on our computation and assessment of ultimate ruling terms that were considered probable. Our additional potential refund liability terminated on March 31, 2004, when WAPI sold the Alaska refinery and ceased shipping on the TAPS pipeline. We subsequently accrued additional amounts for interest.
In 2006, the FERC entered its final order, which the RCA adopted. On February 15, 2008, the Alaska Supreme Court upheld the RCA’s order and on March 16, 2008, the D.C. Circuit Court of Appeals upheld the FERC’s order. We have paid substantially all amounts invoiced by the Quality Bank Administrator and third parties, except certain disputed amounts which remain accrued.
In 2008, we concluded that the likelihood of successful appeal by the counterparties was remote, and we reduced remaining amounts accrued in excess of our estimated remaining obligation by $54 million. On January 12, 2009, this matter concluded when the U.S. Supreme Court denied a counterparty’s request for a writ of certiorari to appeal the ruling of the D.C. Circuit Court of Appeals.
Gulf Liquids litigation
Gulf Liquids contracted with Gulsby Engineering Inc. (Gulsby) and Gulsby-Bay (a joint venture between Gulsby and Bay Ltd.) for the construction of certain gas processing plants in Louisiana. National American Insurance Company (NAICO) and American Home Assurance Company provided payment and performance bonds for the projects. In 2001, the contractors and sureties filed multiple cases in Louisiana and Texas against Gulf Liquids and us.
In 2006, at the conclusion of the consolidated trial of the asserted contract and tort claims, the jury returned its actual and punitive damages verdict against us and Gulf Liquids. Based on our interpretation of the jury verdicts, we recorded a charge based on our estimated exposure for actual damages of approximately $68 million plus potential interest of approximately $20 million. In addition, we concluded that it was reasonably possible that any ultimate
132
THE WILLIAMS COMPANIES, INC.
NOTES TO CONSOLIDATED FINANCIAL STATEMENTS — (Continued)
judgment might have included additional amounts of approximately $199 million in excess of our accrual, which primarily represented our estimate of potential punitive damage exposure under Texas law.
From May through October 2007, the court entered seven post-trial orders in the case (interlocutory orders) which, among other things, overruled the verdict award of tort and punitive damages as well as any damages against us. The court also denied the plaintiffs’ claims for attorneys’ fees. On January 28, 2008, the court issued its judgment awarding damages against Gulf Liquids of approximately $11 million in favor of Gulsby and approximately $4 million in favor of Gulsby-Bay. Gulf Liquids, Gulsby, Gulsby-Bay, Bay Ltd., and NAICO appealed the judgment. In February 2009, we settled with certain of these parties and reduced our accrued liability as of December 31, 2008, by $43 million, including $11 million of interest. IfOn February 17, 2011, the judgment isTexas Court of Appeals upheld on appeal, our remaining liability will be substantially less than the amountdismissals of our accrualthe tort and punitive damages claims and reversed and remanded the contract claim and attorney fee claims for these matters.
Wyoming severance taxes
In August 2006,further proceedings. None of the
Wyoming Department of Audit (DOA) assessed our subsidiary, Williams Production RMT Company, additional severance tax and interestparties filed a petition for
the production years 2000 through 2002. In addition, the DOA notified us of an increasereview in the
taxable valueTexas Supreme Court. As a result, we reduced our accrued liability as of
our interests for ad valorem tax purposes.December 31, 2011 by $33 million, including $14 million of interest. We
disputedare awaiting the
DOA’s interpretationTexas Court of
Appeals to issue a mandate remanding the
statutory obligation and appealed this assessmentcase to the
Wyoming State Board of Equalization (SBOE). The SBOE upheldtrial court.131
THE WILLIAMS COMPANIES, INC.
NOTES TO CONSOLIDATED FINANCIAL STATEMENTS – (Continued)
James West v. Williams Alaska Petroleum, Inc., et al
In January 2010, the assessment and remanded it to the DOA to address the disallowance of a credit. We appealed to the Wyoming Supreme Court. In December 2008, the Wyoming Supreme Court ruled against us. The negative assessment for the2000-2002 time period resulted in additional severance and ad valorem taxes of $4 million. We have accrued a total liability of $39 million related to this matter representing our exposure, including interest, through the end of 2008. We have petitioned for rehearing of a portion of the ruling.
Royalty litigation
In September 2006, royalty interest owners in Garfield County, Colorado,plaintiff originally filed a class action
suitlawsuit in
Colorado state court
alleging thatin Fairbanks, Alaska on behalf of individual property owners whose water contained sulfolane contamination allegedly emanating from the Flint Hills Oil Refinery in North Pole, Alaska. The suit named our subsidiary Williams Alaska Petroleum Inc. (WAPI) and Flint Hills Resources Alaska, LLC (FHRA) as defendants. We owned and operated the refinery until 2004 when we
improperly calculated oilsold it to FHRA. We and
gas royalty payments, failed to account forFHRA have made claims under the
proceeds that we received frompollution liability insurance policy issued in connection with the sale of
gasthe North Pole refinery to FHRA. We and
extracted products, improperly chargedFHRA also filed claims against each other seeking, among other things, contractual indemnification alleging that the other party caused the sulfolane contamination.In August 2010, the court denied the plaintiff’s request for class certification. On May 5, 2011, we and FHRA settled the James West claim, leaving FHRA and WAPI claims. On November 17, 2011, we filed motions for summary judgment on FHRA’s claims against us, but the motions are unlikely to resolve all the outstanding claims. Similarly, FHRA has filed motions for summary judgment that would resolve some, but not all, of our claims against it. We await the court’s ruling on those motions and the new scheduling order.
While significant uncertainty still exists due to, among other things, ongoing proceedings and expert evaluations, we currently estimate that our reasonably possible loss exposure in this matter could range from an insignificant amount up to $32 million. We might have the ability to recover any such losses under the pollution liability policy if FHRA has not exhausted the policy limits.
Other
In 2003, we entered into an agreement to sublease certain expenses,underground storage facilities to Liberty Gas Storage (Liberty). We have asserted claims against Liberty for prematurely terminating the sublease and failedfor damage caused to refund amounts withheldthe facilities. In February 2011, Liberty asserted a counterclaim for costs in excess of ad valorem tax obligations. The plaintiffs claim that$200 million associated with its use of the class might be in excessfacilities. Due to the lack of 500 individualsinformation currently available, we are unable to evaluate the merits of the counterclaim and seek an accounting and damages. The parties have reached a partial settlement agreement for an amount that was previously accrued. The partial settlement has received preliminary approval by the court, and we anticipate trial in late 2009 on remaining issues related to royalty payment calculation and obligations under specific lease provisions. We are not able to estimatedetermine the amount of any additional exposure at this time.
Certain other royalty matters are currently being litigated by other producers with a federal regulatory agency in Colorado and with a state agency in New Mexico. Although we are not a party to these matters, the final outcome of those cases might lead to a future unfavorable impact on our results of operations.
possible liability.Other Divestiture Indemnifications
Pursuant to various purchase and sale agreements relating to divested businesses and assets, we have indemnified certain purchasers against liabilities that they may incur with respect to the businesses and assets acquired from us. The indemnities provided to the purchasers are customary in sale transactions and are contingent upon the purchasers incurring liabilities that are not otherwise recoverable from third parties. The indemnities generally relate to breach of warranties, tax, historic litigation, personal injury, property damage, environmental matters, right of way and other representations that we have provided.
At December 31, 2008,2011, other than as previously disclosed, we are not aware of any material claims involving the indemnities; thus, we do not expect any of the indemnities provided pursuant to the sales agreements to have a material impact on our future financial position. However, if aAny claim for indemnity is brought against us in the future it may have a material adverse effect on our results of operations in the period in which the claim is made.
133
THE WILLIAMS COMPANIES, INC.
NOTES TO CONSOLIDATED FINANCIAL STATEMENTS — (Continued)
In addition to the foregoing, various other proceedings are pending against us which are incidental to our operations.
Litigation, arbitration, regulatoryWe estimate that for all matters for which we are able to reasonably estimate a range of loss, including those noted above and environmental mattersothers that are subjectnot individually significant, our aggregate reasonably possible losses beyond
132
THE WILLIAMS COMPANIES, INC.
NOTES TO CONSOLIDATED FINANCIAL STATEMENTS – (Continued)
amounts accrued for all of our contingent liabilities are immaterial to inherent uncertainties. Were an unfavorable ruling to occur, there exists the possibility of a material adverse impact on theour expected future annual results of operations, in the period in which the ruling occurs. Management, including internal counsel, currently believes that the ultimate resolution of the foregoing matters, taken as a wholeliquidity and afterfinancial position. These calculations have been made without consideration of amounts accrued, insurance coverage,any potential recovery from customers or other indemnification arrangements, will notthird-parties. We have disclosed all significant matters for which we are unable to reasonably estimate a material adverse effect upon our future financial position.
range of possible loss.Commitments
Commitments for construction and acquisition of property, plant and equipment are approximately $472$830 million at December 31, 2008.
134
Note 17. Accumulated Other Comprehensive Income (Loss)THE WILLIAMS COMPANIES, INC.
NOTES TO CONSOLIDATED FINANCIAL STATEMENTS — (Continued)
| |
Note 17. | Accumulated Other Comprehensive Loss |
The table below presents changes in the components ofaccumulated other comprehensive loss.income (loss)
| | | | | | | | | | | | | | | | | | | | | | | | | | | | | | | | | |
| | | Income (Loss) | |
| | | | | | | | | | | | | | | Other
| | | | |
| | | | | | | | | | | | | | | Postretirement
| | | | |
| | | | | | | | | | | | Pension Benefits | | | Benefits | | | | |
| | | | | | Foreign
| | | Minimum
| | | Prior
| | | Net
| | | Prior
| | | Net
| | | | |
| | | Cash Flow
| | | Currency
| | | Pension
| | | Service
| | | Actuarial
| | | Service
| | | Actuarial
| | | | |
| | | Hedges | | | Translation | | | Liability | | | Cost | | | Gain (Loss) | | | Cost | | | Gain (Loss) | | | Total | |
| | | (Millions) | |
| |
| Balance at December 31, 2005 | | $ | (374 | ) | | $ | 80 | | | $ | (4 | ) | | $ | — | | | $ | — | | | $ | — | | | $ | — | | | $ | (298 | ) |
| | | | | | | | | | | | | | | | | | | | | | | | | | | | | | | | | |
2006 Change: | | | | | | | | | | | | | | | | | | | | | | | | | | | | | | | | |
| Pre-income tax amount | | | 423 | | | | (4 | ) | | | (1 | ) | | | — | | | | — | | | | — | | | | — | | | | 418 | |
| Income tax provision | | | (162 | ) | | | — | | | | — | | | | — | | | | — | | | | — | | | | — | | | | (162 | ) |
| Net reclassification into earnings of derivative instrument losses (net of a $82 million income tax benefit) | | | 133 | | | | — | | | | — | | | | — | | | | — | | | | — | | | | — | | | | 133 | |
| | | | | | | | | | | | | | | | | | | | | | | | | | | | | | | | | |
| | | | 394 | | | | (4 | ) | | | (1 | ) | | | — | | | | — | | | | — | | | | — | | | | 389 | |
| | | | | | | | | | | | | | | | | | | | | | | | | | | | | | | | | |
Adjustment to initially apply SFAS No. 158: | | | | | | | | | | | | | | | | | | | | | | | | | | | | | | | | |
| Pre-income tax amount | | | — | | | | — | | | | 8 | | | | (6 | ) | | | (243 | )* | | | (7 | ) | | | (8 | ) | | | (256 | ) |
| Income tax (provision) benefit | | | — | | | | — | | | | (3 | ) | | | 2 | | | | 93 | | | | 3 | | | | 10 | | | | 105 | |
| | | | | | | | | | | | | | | | | | | | | | | | | | | | | | | | | |
| | | | — | | | | — | | | | 5 | | | | (4 | ) | | | (150 | ) | | | (4 | ) | | | 2 | | | | (151 | ) |
| | | | | | | | | | | | | | | | | | | | | | | | | | | | | | | | | |
| Balance at December 31, 2006 | | | 20 | | | | 76 | | | | — | | | | (4 | ) | | | (150 | ) | | | (4 | ) | | | 2 | | | | (60 | ) |
| | | | | | | | | | | | | | | | | | | | | | | | | | | | | | | | | |
2007 Change: | | | | | | | | | | | | | | | | | | | | | | | | | | | | | | | | |
| Pre-income tax amount | | | 201 | | | | 53 | | | | — | | | | — | | | | 68 | | | | — | | | | 15 | | | | 337 | |
| Income tax provision | | | (77 | ) | | | — | | | | — | | | | — | | | | (26 | ) | | | — | | | | (6 | ) | | | (109 | ) |
| Net reclassification into earnings of derivative instrument gains (net of a $187 million income tax provision) | | | (303 | )** | | | — | | | | — | | | | — | | | | — | | | | — | | | | — | | | | (303 | ) |
| Amortization included in net periodic benefit expense | | | — | | | | — | | | | — | | | | — | | | | 19 | | | | 2 | | | | — | | | | 21 | |
| Income tax provision on amortization | | | — | | | | — | | | | — | | | | — | | | | (8 | ) | | | (1 | ) | | | — | | | | (9 | ) |
| | | | | | | | | | | | | | | | | | | | | | | | | | | | | | | | | |
| | | | (179 | ) | | | 53 | | | | — | | | | — | | | | 53 | | | | 1 | | | | 9 | | | | (63 | ) |
| | | | | | | | | | | | | | | | | | | | | | | | | | | | | | | | | |
| Allocation of other comprehensive loss to minority interest | | | 2 | | | | — | | | | — | | | | — | | | | — | | | | — | | | | — | | | | 2 | |
| | | | | | | | | | | | | | | | | | | | | | | | | | | | | | | | | |
| Balance at December 31, 2007 | | | (157 | ) | | | 129 | | | | — | | | | (4 | ) | | | (97 | ) | | | (3 | ) | | | 11 | | | | (121 | ) |
| | | | | | | | | | | | | | | | | | | | | | | | | | | | | | | | | |
2008 Change: | | | | | | | | | | | | | | | | | | | | | | | | | | | | | | | | |
| Pre-income tax amount | | | 714 | | | | (76 | ) | | | — | | | | — | | | | (565 | ) | | | 16 | | | | (15 | ) | | | 74 | |
| Income tax (provision) benefit | | | (270 | ) | | | — | | | | — | | | | — | | | | 213 | | | | (8 | ) | | | 6 | | | | (59 | ) |
| Net reclassification into earnings of derivative instrument losses (net of a $7 million income tax benefit) | | | 11 | | | | — | | | | — | | | | — | | | | — | | | | — | | | | — | | | | 11 | |
| Amortization included in net periodic benefit expense | | | — | | | | — | | | | — | | | | 1 | | | | 13 | | | | 1 | | | | — | | | | 15 | |
| Income tax provision on amortization | | | — | | | | — | | | | — | | | | — | | | | (5 | ) | | | — | | | | — | | | | (5 | ) |
| | | | | | | | | | | | | | | | | | | | | | | | | | | | | | | | | |
| | | | 455 | | | | (76 | ) | | | — | | | | 1 | | | | (344 | ) | | | 9 | | | | (9 | ) | | | 36 | |
| | | | | | | | | | | | | | | | | | | | | | | | | | | | | | | | | |
| Allocation of other comprehensive income (loss) to minority interest | | | (2 | ) | | | — | | | | — | | | | — | | | | 7 | | | | — | | | | — | | | | 5 | |
| | | | | | | | | | | | | | | | | | | | | | | | | | | | | | | | | |
| Balance at December 31, 2008 | | $ | 296 | | | $ | 53 | | | $ | — | | | $ | (3 | ) | | $ | (434 | ) | | $ | 6 | | | $ | 2 | | | $ | (80 | ) |
| | | | | | | | | | | | | | | | | | | | | | | | | | | | | | | | | |
| | |
* | | Includes $1 million for the Net Actuarial Loss of an equity method investee. |
|
** | | Includes a $429 million reclassification into earnings of deferred net hedge gains related to the sale of our power business. (See Note 2.) |
.
135
| | | | | | | | | | | | | | | | | | | | | | | | | | | | | | | | |
| | | Income (Loss) | |
| | | | | | | | | Pension Benefits | | | Other Postretirement
Benefits | | | | | | | |
| | | Cash
Flow
Hedges | | | Foreign
Currency
Translation | | | Prior
Service
Cost | | | Net
Actuarial
Gain (Loss) | | | Prior
Service
Cost | | | Net
Actuarial
Gain (Loss) | | | Other | | | Total | |
| | | (Millions) | |
Balance at December 31, 2008 | | $ | 296 | | | $ | 53 | | | $ | (3 | ) | | $ | (434 | ) | | $ | 6 | | | $ | 2 | | | $ | — | | | $ | (80 | ) |
2009 Change: | | | | | | | | | | | | | | | | | | | | | | | | | | | | | | | | |
Pre-income tax amount | | | 262 | | | | 83 | | | | — | | | | 44 | | | | 7 | | | | (1 | ) | | | — | | | | 395 | |
Income tax (provision) benefit | | | (99 | ) | | | — | | | | — | | | | (17 | ) | | | — | | | | 1 | | | | — | | | | (115 | ) |
Net reclassification into earnings of derivative instrument gains (net of a $234 million income tax provision) | | | (384 | ) | | | — | | | | — | | | | — | | | | — | | | | — | | | | — | | | | (384 | ) |
Amortization included in net periodic benefit expense | | | — | | | | — | | | | 1 | | | | 42 | | | | (4 | ) | | | — | | | | — | | | | 39 | |
Income tax (provision) benefit on amortization | | | — | | | | — | | | | (1 | ) | | | (16 | ) | | | 1 | | | | — | | | | — | | | | (16 | ) |
| | | | | | | | | | | | | | | | | | | | | | | | | | | | | | | | |
| | | (221 | ) | | | 83 | | | | — | | | | 53 | | | | 4 | | | | — | | | | — | | | | (81 | ) |
| | | | | | | | | | | | | | | | | | | | | | | | | | | | | | | | |
Allocation of other comprehensive income (loss) to noncontrolling interests | | | — | | | | — | | | | — | | | | (7 | ) | | | — | | | | — | | | | — | | | | (7 | ) |
| | | | | | | | | | | | | | | | | | | | | | | | | | | | | | | | |
Balance at December 31, 2009 | | | 75 | | | | 136 | | | | (3 | ) | | | (388 | ) | | | 10 | | | | 2 | | | | — | | | | (168 | ) |
| | | | | | | | | | | | | | | | | | | | | | | | | | | | | | | | |
2010 Change: | | | | | | | | | | | | | | | | | | | | | | | | | | | | | | | | |
Pre-income tax amount | | | 488 | | | | 29 | | | | — | | | | (71 | ) | | | — | | | | (12 | ) | | | — | | | | 434 | |
Income tax (provision) benefit | | | (185 | ) | | | — | | | | — | | | | 24 | | | | — | | | | 3 | | | | — | | | | (158 | ) |
Net reclassification into earnings of derivative instrument gains (net of a $131 million income tax provision) | | | (211 | ) | | | — | | | | — | | | | — | | | | — | | | | — | | | | — | | | | (211 | ) |
Amortization included in net periodic benefit expense | | | — | | | | — | | | | 1 | | | | 35 | | | | (5 | ) | | | 1 | | | | — | | | | 32 | |
Income tax (provision) benefit on amortization | | | — | | | | — | | | | — | | | | (13 | ) | | | 2 | | | | — | | | | — | | | | (11 | ) |
| | | | | | | | | | | | | | | | | | | | | | | | | | | | | | | | |
| | | 92 | | | | 29 | | | | 1 | | | | (25 | ) | | | (3 | ) | | | (8 | ) | | | — | | | | 86 | |
| | | | | | | | | | | | | | | | | | | | | | | | | | | | | | | | |
133
THE WILLIAMS COMPANIES, INC.
NOTES TO CONSOLIDATED FINANCIAL STATEMENTS —– (Continued)
| |
Note 18. | Segment Disclosures |
| | | | | | | | | | | | | | | | | | | | | | | | | | | | | | | | |
| | | Income (Loss) | |
| | | | | | | | | Pension Benefits | | | Other
Postretirement
Benefits | | | | | | | |
| | | Cash
Flow
Hedges | | | Foreign
Currency
Translation | | | Prior
Service
Cost | | | Net
Actuarial
Gain
(Loss) | | | Prior
Service
Cost | | | Net
Actuarial
Gain
(Loss) | | | Other | | | Total | |
| | | (Millions) | |
Allocation of other comprehensive income to noncontrolling interests | | | — | | | | — | | | | — | | | | — | | | | — | | | | — | | | | — | | | | — | |
| | | | | | | | | | | | | | | | | | | | | | | | | | | | | | | | |
Balance at December 31, 2010 | | | 167 | | | | 165 | | | | (2 | ) | | | (413 | ) | | | 7 | | | | (6 | ) | | | — | | | | (82 | ) |
| | | | | | | | | | | | | | | | | | | | | | | | | | | | | | | | |
2011 Change: | | | | | | | | | | | | | | | | | | | | | | | | | | | | | | | | |
Pre-income tax amount | | | 395 | | | | (18 | ) | | | — | | | | (220 | ) | | | 2 | | | | (21 | ) | | | — | | | | 138 | |
Income tax (provision) benefit | | | (152 | ) | | | — | | | | — | | | | 82 | | | | (1 | ) | | | 7 | | | | — | | | | (64 | ) |
Net reclassification into earnings of derivative instrument gains (net of a $124 million income tax provision) | | | (190 | ) | | | — | | | | — | | | | — | | | | — | | | | — | | | | — | | | | (190 | ) |
Amortization included in net periodic benefit expense | | | — | | | | — | | | | 1 | | | | 42 | | | | (4 | ) | | | 1 | | | | — | | | | 40 | |
Income tax (provision) benefit on amortization | | | — | | | | — | | | | — | | | | (16 | ) | | | 1 | | �� | | — | | | | — | | | | (15 | ) |
Unrealized gain(loss) on equity securities | | | — | | | | — | | | | — | | | | — | | | | — | | | | — | | | | 3 | | | | 3 | |
Distribution of WPX Energy, Inc. to shareholders | | | (220 | ) | | | — | | | | — | | | | 1 | | | | — | | | | — | | | | — | | | | (219 | ) |
| | | | | | | | | | | | | | | | | | | | | | | | | | | | | | | | |
| | | (167 | ) | | | (18 | ) | | | 1 | | | | (111 | ) | | | (2 | ) | | | (13 | ) | | | 3 | | | | (307 | ) |
| | | | | | | | | | | | | | | | | | | | | | | | | | | | | | | | |
Allocation of other comprehensive income to noncontrolling interests | | | — | | | | — | | | | — | | | | — | | | | — | | | | — | | | | — | | | | — | |
| | | | | | | | | | | | | | | | | | | | | | | | | | | | | | | | |
Balance at December 31, 2011 | | $ | — | | | $ | 147 | | | $ | (1 | ) | | $ | (524 | ) | | $ | 5 | | | $ | (19 | ) | | $ | 3 | | | $ | (389 | ) |
| | | | | | | | | | | | | | | | | | | | | | | | | | | | | | | | |
Note 18. Segment Disclosures
Our reportablereporting segments are strategic business units that offer different products and services. The segments are managed separately because each segment requires different technology, marketing strategies and industry knowledge. Our master limited partnerships, Williams Partners L.P. and Williams Pipeline Partners L.P.,Midstream Canada & Olefins. All remaining business activities are consolidated within our Midstream and Gas Pipeline segments, respectively.included in Other. (See Note 1.) Other primarily consists
Our segment presentation of corporate operations.
Williams Partners is reflective of the parent-level focus by our chief operating decision-maker, considering the resource allocation and governance provisions associated with this master limited partnership structure. WPZ maintains a capital and cash management structure that is separate from ours. WPZ is self-funding and maintains its own lines of bank credit and cash management accounts. These factors, coupled with a different cost of capital from our other businesses, serve to differentiate the management of this entity as a whole.134
THE WILLIAMS COMPANIES, INC.
NOTES TO CONSOLIDATED FINANCIAL STATEMENTS – (Continued)
Performance Measurement
We currently evaluate performance based onuponsegment profit (loss)from operations, which includessegment revenuesfrom external and internal customers,segment costs and expenses,equity earnings (losses)andincome (loss) from investments. The accounting policies of the segments are the same as those described in Note 1. Intersegment sales are generally accounted for at current market prices as if the sales were to unaffiliated third parties.
The primary types of costs and operating expenses by segment can be generally summarized as follows:
| | |
| • | Exploration & Production — depletion, depreciation and amortization, lease operating expenses and operating taxes; |
|
| • | Gas Pipeline — depreciation and operation and maintenance expenses; |
|
| • | Midstream Gas & Liquids — commodity purchases (primarily for NGL, crude and olefin marketing, shrink, feedstock and fuel), depreciation, and operation and maintenance expenses; |
|
| • | Gas Marketing Services — commodity purchases primarily in support of commodity marketing and risk management activities. |
Energy Williams Partners—commodity hedging by our business units may be done through intercompany derivatives with our Gas Marketing Services segment which, in turn, enters into offsetting derivative contracts with unrelated third parties. Gas Marketing Services bears the counterparty performance risks associated with the unrelated third parties in these transactions. Additionally, Explorationpurchases (primarily for NGL and crude marketing, shrink and fuel), depreciation and operation and maintenance expenses;
Midstream Canada & Production may enter into transactions directly with third parties under their credit agreement. (See Note 11.) Exploration & Production bears the counterparty performance risks associated with the unrelated third parties in these transactions.
External revenues of our Exploration & Production segment include third-party oilOlefins—commodity purchases (primarily for shrink, feedstock and gas sales, which are more than offset by transportation expensesNGL and royalties due third parties on intersegment sales.olefin marketing activities), depreciation and operation and maintenance expenses.
The following geographic area data includesrevenues from external customersbased on product shipment origin andlong-lived assetsbased upon physical location.
| | | | | | | | | | | | | |
| | | United States | | | Other | | | Total | |
| | | (Millions) | |
| |
| Revenues from external customers: | | | | | | | | | | | | |
| 2008 | | $ | 11,924 | | | $ | 428 | | | $ | 12,352 | |
| 2007 | | | 10,065 | | | | 421 | | | | 10,486 | |
| 2006 | | | 8,905 | | | | 394 | | | | 9,299 | |
| Long-lived assets: | | | | | | | | | | | | |
| 2008 | | $ | 18,419 | | | $ | 659 | | | $ | 19,078 | |
| 2007 | | | 16,279 | | | | 713 | | | | 16,992 | |
| 2006 | | | 14,487 | | | | 682 | | | | 15,169 | |
136
| | | | | | | | | | | | |
| | | United States | | | Other | | | Total | |
| | | (Millions) | |
Revenues from external customers: | | | | | | | | | | | | |
2011 | | $ | 7,728 | | | $ | 202 | | | $ | 7,930 | |
2010 | | | 6,470 | | | | 168 | | | | 6,638 | |
2009 | | | 5,163 | | | | 115 | | | | 5,278 | |
Long-lived assets: | | | | | | | | | | | | |
2011 | | $ | 12,041 | | | $ | 583 | | | $ | 12,624 | |
2010 | | | 11,384 | | | | 408 | | | | 11,792 | |
2009 | | | 11,064 | | | | 310 | | | | 11,374 | |
THE WILLIAMS COMPANIES, INC.
NOTES TO CONSOLIDATED FINANCIAL STATEMENTS — (Continued)
Our foreign operations are primarily located in Venezuela, Canada, and Argentina.Canada.Long-lived assetsare comprised of property, plant, and equipment, goodwill and other intangible assets.
As discussed in Notes 1 and 2, our former exploration and production business was spun-off on December 31, 2011 and has been reported as discontinued operations in all periods presented. Revenues derived from intercompany sales to our former exploration and production business, previously reported as internal, have been recast and are now shown as external. These sales were $310 million, $264 million, and $164 million for the years ended 2011, 2010, and 2009, respectively. In addition, costs attributable to activities with our former exploration and production business, previously reported as internal, have been recast and are now shown as external. Such costs were $845 million, $797 million, and $541 million for the years ended 2011, 2010, and 2009, respectively. The following table reflects the reconciliation ofsegment revenuesandsegment profit (loss)torevenuesandoperating income (loss)as reported in the Consolidated Statement of IncomeOperations andother financial informationrelated tolong-lived assets.assets
| | | | | | | | | | | | | | | | | | | | | | | | | | | | | |
| | | | | | | | | Midstream
| | | Gas
| | | | | | | | | | |
| | | Exploration &
| | | Gas
| | | Gas &
| | | Marketing
| | | | | | | | | | |
| | | Production | | | Pipeline | | | Liquids | | | Services | | | Other | | | Eliminations | | | Total | |
| | | (Millions) | |
| |
2008 | | | | | | | | | | | | | | | | | | | | | | | | | | | | |
| Segment revenues: | | | | | | | | | | | | | | | | | | | | | | | | | | | | |
| External | | $ | (215 | ) | | $ | 1,600 | | | $ | 5,586 | | | $ | 5,371 | | | $ | 10 | | | $ | — | | | $ | 12,352 | |
| Internal | | | 3,336 | | | | 34 | | | | 56 | | | | 1,041 | | | | 14 | | | | (4,481 | ) | | | — | |
| | | | | | | | | | | | | | | | | | | | | | | | | | | | | |
| Total revenues | | $ | 3,121 | | | $ | 1,634 | | | $ | 5,642 | | | $ | 6,412 | | | $ | 24 | | | $ | (4,481 | ) | | $ | 12,352 | |
| | | | | | | | | | | | | | | | | | | | | | | | | | | | | |
| Segment profit (loss) | | $ | 1,260 | | | $ | 689 | | | $ | 963 | | | $ | 3 | | | $ | (3 | ) | | $ | — | | | $ | 2,912 | |
| Less: | | | | | | | | | | | | | | | | | | | | | | | | | | | | |
| Equity earnings | | | 20 | | | | 59 | | | | 58 | | | | — | | | | — | | | | — | | | | 137 | |
| Income from investments | | | — | | | | — | | | | 1 | | | | — | | | | — | | | | — | | | | 1 | |
| | | | | | | | | | | | | | | | | | | | | | | | | | | | | |
| Segment operating income (loss) | | $ | 1,240 | | | $ | 630 | | | $ | 904 | | | $ | 3 | | | $ | (3 | ) | | $ | — | | | | 2,774 | |
| | | | | | | | | | | | | | | | | | | | | | | | | | | | | |
| General corporate expenses | | | | | | | | | | | | | | | | | | | | | | | | | | | (149 | ) |
| | | | | | | | | | | | | | | | | | | | | | | | | | | | | |
| Total operating income | | | | | | | | | | | | | | | | | | | | | | | | | | $ | 2,625 | |
| | | | | | | | | | | | | | | | | | | | | | | | | | | | | |
| Other financial information: | | | | | | | | | | | | | | | | | | | | | | | | | | | | |
| Additions to long-lived assets | | $ | 2,563 | | | $ | 413 | | | $ | 679 | | | $ | — | | | $ | 42 | | | $ | — | | | $ | 3,697 | |
| Depreciation, depletion & amortization | | $ | 737 | | | $ | 321 | | | $ | 233 | | | $ | 1 | | | $ | 18 | | | $ | — | | | $ | 1,310 | |
2007 | | | | | | | | | | | | | | | | | | | | | | | | | | | | |
| Segment revenues: | | | | | | | | | | | | | | | | | | | | | | | | | | | | |
| External | | $ | (167 | ) | | $ | 1,576 | | | $ | 5,142 | | | $ | 3,924 | | | $ | 11 | | | $ | — | | | $ | 10,486 | |
| Internal | | | 2,188 | | | | 34 | | | | 38 | | | | 709 | | | | 15 | | | | (2,984 | ) | | | — | |
| | | | | | | | | | | | | | | | | | | | | | | | | | | | | |
| Total revenues | | $ | 2,021 | | | $ | 1,610 | | | $ | 5,180 | | | $ | 4,633 | | | $ | 26 | | | $ | (2,984 | ) | | $ | 10,486 | |
| | | | | | | | | | | | | | | | | | | | | | | | | | | | | |
| Segment profit (loss) | | $ | 756 | | | $ | 673 | | | $ | 1,072 | | | $ | (337 | ) | | $ | (1 | ) | | $ | — | | | $ | 2,163 | |
| Less equity earnings | | | 25 | | | | 51 | | | | 61 | | | | — | | | | — | | | | — | | | | 137 | |
| | | | | | | | | | | | | | | | | | | | | | | | | | | | | |
| Segment operating income (loss) | | $ | 731 | | | $ | 622 | | | $ | 1,011 | | | $ | (337 | ) | | $ | (1 | ) | | $ | — | | | | 2,026 | |
| | | | | | | | | | | | | | | | | | | | | | | | | | | | | |
| General corporate expenses | | | | | | | | | | | | | | | | | | | | | | | | | | | (161 | ) |
| | | | | | | | | | | | | | | | | | | | | | | | | | | | | |
| Total operating income | | | | | | | | | | | | | | | | | | | | | | | | | | $ | 1,865 | |
| | | | | | | | | | | | | | | | | | | | | | | | | | | | | |
| Other financial information: | | | | | | | | | | | | | | | | | | | | | | | | | | | | |
| Additions to long-lived assets | | $ | 1,717 | | | $ | 546 | | | $ | 610 | | | $ | — | | | $ | 27 | | | $ | — | | | $ | 2,900 | |
| Depreciation, depletion & amortization | | $ | 535 | | | $ | 315 | | | $ | 214 | | | $ | 7 | | | $ | 10 | | | $ | — | | | $ | 1,081 | |
2006 | | | | | | | | | | | | | | | | | | | | | | | | | | | | |
| Segment revenues: | | | | | | | | | | | | | | | | | | | | | | | | | | | | |
| External | | $ | (266 | ) | | $ | 1,336 | | | $ | 4,094 | | | $ | 4,128 | | | $ | 7 | | | $ | — | | | $ | 9,299 | |
| Internal | | | 1,677 | | | | 12 | | | | 65 | | | | 921 | | | | 20 | | | | (2,695 | ) | | | — | |
| | | | | | | | | | | | | | | | | | | | | | | | | | | | | |
| Total revenues | | $ | 1,411 | | | $ | 1,348 | | | $ | 4,159 | | | $ | 5,049 | | | $ | 27 | | | $ | (2,695 | ) | | $ | 9,299 | |
| | | | | | | | | | | | | | | | | | | | | | | | | | | | | |
| Segment profit (loss) | | $ | 552 | | | $ | 467 | | | $ | 675 | | | $ | (195 | ) | | $ | (13 | ) | | $ | — | | | $ | 1,486 | |
| Less equity earnings | | | 22 | | | | 37 | | | | 40 | | | | — | | | | — | | | | — | | | | 99 | |
| | | | | | | | | | | | | | | | | | | | | | | | | | | | | |
| Segment operating income (loss) | | $ | 530 | | | $ | 430 | | | $ | 635 | | | $ | (195 | ) | | $ | (13 | ) | | $ | — | | | | 1,387 | |
| | | | | | | | | | | | | | | | | | | | | | | | | | | | | |
| General corporate expenses | | | | | | | | | | | | | | | | | | | | | | | | | | | (132 | ) |
| Securities litigation settlement and related costs | | | | | | | | | | | | | | | | | | | | | | | | | | | (167 | ) |
| | | | | | | | | | | | | | | | | | | | | | | | | | | | | |
| Total operating income | | | | | | | | | | | | | | | | | | | | | | | | | | $ | 1,088 | |
| | | | | | | | | | | | | | | | | | | | | | | | | | | | | |
| Other financial information: | | | | | | | | | | | | | | | | | | | | | | | | | | | | |
| Additions to long-lived assets | | $ | 1,496 | | | $ | 913 | | | $ | 279 | | | $ | 1 | | | $ | 18 | | | $ | — | | | $ | 2,707 | |
| Depreciation, depletion & amortization | | $ | 360 | | | $ | 282 | | | $ | 203 | | | $ | 7 | | | $ | 11 | | | $ | — | | | $ | 863 | |
137
135
THE WILLIAMS COMPANIES, INC.
NOTES TO CONSOLIDATED FINANCIAL STATEMENTS —– (Continued)
| | | | | | | | | | | | | | | | | | | | |
| | | Williams
Partners | | | Midstream
Canada &
Olefins | | | Other | | | Eliminations | | | Total | |
| | | (Millions) | |
2011 | | | | | | | | | | | | | | | | | | | | |
Segment revenues: | | | | | | | | | | | | | | | | | | | | |
External | | $ | 6,614 | | | $ | 1,302 | | | $ | 14 | | | $ | — | | | $ | 7,930 | |
Internal | | | 115 | | | | 10 | | | | 11 | | | | (136 | ) | | | — | |
| | | | | | | | | | | | | | | | | | | | |
Total revenues | | $ | 6,729 | | | $ | 1,312 | | | $ | 25 | | | $ | (136 | ) | | $ | 7,930 | |
| | | | | | | | | | | | | | | | | | | | |
Segment profit (loss) | | $ | 1,896 | | | $ | 296 | | | $ | 24 | | | $ | — | | | $ | 2,216 | |
Less: | | | | | | | | | | | | | | | | | | | | |
Equity earnings (losses) | | | 142 | | | | — | | | | 13 | | | | — | | | | 155 | |
Income (loss) from investments | | | — | | | | (4 | ) | | | 11 | | | | — | | | | 7 | |
| | | | | | | | | | | | | | | | | | | | |
Segment operating income (loss) | | $ | 1,754 | | | $ | 300 | | | $ | — | | | $ | — | | | | 2,054 | |
| | | | | | | | | | | | | | | | | | | | |
General corporate expenses | | | | | | | | | | | | | | | | | | | (187 | ) |
| | | | | | | | | | | | | | | | | | | | |
Total operating income (loss) | | | | | | | | | | | | | | | | | | $ | 1,867 | |
| | | | | | | | | | | | | | | | | | | | |
Other financial information: | | | | | | | | | | | | | | | | | | | | |
Additions to long-lived assets | | $ | 1,242 | | | $ | 242 | | | $ | 46 | | | $ | — | | | $ | 1,530 | |
Depreciation and amortization | | $ | 611 | | | $ | 26 | | | $ | 25 | | | $ | — | | | $ | 662 | |
2010 | | | | | | | | | | | | | | | | | | | | |
Segment revenues: | | | | | | | | | | | | | | | | | | | | |
External | | $ | 5,609 | | | $ | 1,017 | | | $ | 12 | | | $ | — | | | $ | 6,638 | |
Internal | | | 106 | | | | 16 | | | | 12 | | | | (134 | ) | | | — | |
| | | | | | | | | | | | | | | | | | | | |
Total revenues | | $ | 5,715 | | | $ | 1,033 | | | $ | 24 | | | $ | (134 | ) | | $ | 6,638 | |
| | | | | | | | | | | | | | | | | | | | |
Segment profit (loss) | | $ | 1,574 | | | $ | 172 | | | $ | 68 | | | $ | — | | | $ | 1,814 | |
Less: | | | | | | | | | | | | | | | | | | | | |
Equity earnings (losses) | | | 109 | | | | — | | | | 34 | | | | — | | | | 143 | |
Income (loss) from investments | | | — | | | | — | | | | 43 | | | | — | | | | 43 | |
| | | | | | | | | | | | | | | | | | | | |
Segment operating income (loss) | | $ | 1,465 | | | $ | 172 | | | $ | (9 | ) | | $ | — | | | | 1,628 | |
| | | | | | | | | | | | | | | | | | | | |
General corporate expenses | | | | | | | | | | | | | | | | | | | (221 | ) |
| | | | | | | | | | | | | | | | | | | | |
Total operating income (loss) | | | | | | | | | | | | | | | | | | $ | 1,407 | |
| | | | | | | | | | | | | | | | | | | | |
Other financial information: | | | | | | | | | | | | | | | | | | | | |
Additions to long-lived assets(1) | | $ | 904 | | | $ | 104 | | | $ | 25 | | | $ | — | | | $ | 1,033 | |
Depreciation and amortization | | $ | 568 | | | $ | 23 | | | $ | 21 | | | $ | — | | | $ | 612 | |
2009 | | | | | | | | | | | | | | | | | | | | |
Segment revenues: | | | | | | | | | | | | | | | | | | | | |
External | | $ | 4,524 | | | $ | 737 | | | $ | 17 | | | $ | — | | | $ | 5,278 | |
Internal | | | 78 | | | | 16 | | | | 10 | | | | (104 | ) | | | — | |
| | | | | | | | | | | | | | | | | | | | |
Total revenues | | $ | 4,602 | | | $ | 753 | | | $ | 27 | | | $ | (104 | ) | | $ | 5,278 | |
| | | | | | | | | | | | | | | | | | | | |
136
THE WILLIAMS COMPANIES, INC.
NOTES TO CONSOLIDATED FINANCIAL STATEMENTS – (Continued)
| | | | | | | | | | | | | | | | | | | | |
| | | Williams
Partners | | | Midstream
Canada &
Olefins | | | Other | | | Eliminations | | | Total | |
| | | (Millions) | |
Segment profit (loss) | | $ | 1,317 | | | $ | 37 | | | $ | (41 | ) | | $ | — | | | $ | 1,313 | |
Less: | | | | | | | | | | | | | | | | | | | | |
Equity earnings (losses) | | | 81 | | | | — | | | | 37 | | | | — | | | | 118 | |
Income (loss) from investments | | | — | | | | — | | | | (75 | ) | | | — | | | | (75 | ) |
| | | | | | | | | | | | | | | | | | | | |
Segment operating income (loss) | | $ | 1,236 | | | $ | 37 | | | $ | (3 | ) | | $ | — | | | | 1,270 | |
| | | | | | | | | | | | | | | | | | | | |
General corporate expenses | | | | | | | | | | | | | | | | | | | (164 | ) |
| | | | | | | | | | | | | | | | | | | | |
Total operating income (loss) | | | | | | | | | | | | | | | | | | $ | 1,106 | |
| | | | | | | | | | | | | | | | | | | | |
Other financial information: | | | | | | | | | | | | | | | | | | | | |
Additions to long-lived assets | | $ | 1,023 | | | $ | 42 | | | $ | 27 | | | $ | — | | | $ | 1,092 | |
Depreciation and amortization | | $ | 553 | | | $ | 21 | | | $ | 19 | | | $ | — | | | $ | 593 | |
(1) | Does not include WPZ’s purchase of a business represented by certain gathering and processing assets in Colorado’s Piceance basin from our former Exploration & Production segment now included in discontinued operations. |
The following table reflectstotal assetsandequity method investmentsby reporting segment.
| | | | | | | | | | | | | | | | | | | | | | | | | |
| | | Total Assets | | | Equity Method Investments | |
| | | December 31,
| | | December 31,
| | | December 31,
| | | December 31,
| | | December 31,
| | | December 31,
| |
| | | 2008 | | | 2007 | | | 2006 | | | 2008 | | | 2007 | | | 2006 | |
| | | (Millions) | |
| |
| Exploration & Production(1) | | $ | 10,286 | | | $ | 8,692 | | | $ | 7,851 | | | $ | 87 | | | $ | 72 | | | $ | 59 | |
| Gas Pipeline | | | 9,149 | | | | 8,624 | | | | 8,332 | | | | 570 | | | | 483 | | | | 432 | |
| Midstream Gas & Liquids | | | 7,024 | | | | 6,604 | | | | 5,562 | | | | 290 | | | | 321 | | | | 323 | |
| Gas Marketing Services(2) | | | 3,064 | | | | 4,437 | | | | 5,519 | | | | — | | | | — | | | | — | |
| Other | | | 3,532 | | | | 3,592 | | | | 3,923 | | | | — | | | | — | | | | — | |
| Eliminations | | | (7,055 | ) | | | (7,073 | ) | | | (7,187 | ) | | | — | | | | — | | | | — | |
| | | | | | | | | | | | | | | | | | | | | | | | | |
| | | | 26,000 | | | | 24,876 | | | | 24,000 | | | | 947 | | | | 876 | | | | 814 | |
| Discontinued operations | | | 6 | | | | 185 | | | | 1,402 | | | | — | | | | — | | | | — | |
| | | | | | | | | | | | | | | | | | | | | | | | | |
| Total | | $ | 26,006 | | | $ | 25,061 | | | $ | 25,402 | | | $ | 947 | | | $ | 876 | | | $ | 814 | |
| | | | | | | | | | | | | | | | | | | | | | | | | |
| | | | | | | | | | | | | | | | | | | | |
| | | Total Assets | | | Equity Method Investments | |
| | | December 31,
2011 | | | December 31,
2010 | | | December 31,
2011 | | | December 31,
2010 | | | December 31,
2009 | |
| | | (Millions) | |
Williams Partners | | $ | 14,380 | | | $ | 13,404 | | | $ | 1,383 | | | $ | 1,045 | | | $ | 593 | |
Midstream Canada & Olefins | | | 1,138 | | | | 922 | | | | — | | | | — | | | | — | |
Other (a) | | | 1,275 | | | | 3,553 | | | | 7 | | | | 193 | | | | 196 | |
Eliminations (a) | | | (291 | ) | | | (2,632 | ) | | | — | | | | — | | | | — | |
Discontinued operations (see Note 2) | | | — | | | | 9,725 | | | | — | | | | 104 | | | | 95 | |
| | | | | | | | | | | | | | | | | | | | |
Total | | $ | 16,502 | | | $ | 24,972 | | | $ | 1,390 | | | $ | 1,342 | | | $ | 884 | |
| | | | | | | | | | | | | | | | | | | | |
(a) | | |
(1) | | The 2008 increase in Exploration & Production’s total assets is due to an increase in property, plant and equipment — net as a result of increased drilling activity. |
|
(2) | | The decrease in Gas Marketing Services’the total assets for 2008of Other and 2007 is due primarilyEliminations as compared to the fluctuationsprior year-end is substantially due to the forgiveness of an intercompany long-term receivable in derivative assets as a resultthe second-quarter of the impact of changes in commodity prices on existing forward derivative contracts. Gas Marketing Services’ derivative assets are substantially offset by their derivative liabilities.2011. |
138
137
THE WILLIAMS COMPANIES, INC.
NOTES TO CONSOLIDATED FINANCIAL STATEMENTS – (Continued)
Note 19. Subsequent Events
In January 2012, WPZ completed an equity issuance of 7 million common units representing limited partner interests at a price of $62.81 per unit. In February 2012, the underwriters exercised their option to purchase an additional 1.05 million common units for $62.81 per unit.
On February 17, 2012, Williams Partners completed the acquisition of 100 percent of the ownership interests in certain entities from Delphi Midstream Partners, LLC in exchange for $325 million in cash, net of cash acquired in the transaction and subject to certain closing adjustments, and approximately 7.5 million in WPZ common units valued at $465 million. Our valuation of the assets acquired and liabilities assumed has not been completed because the acquisition is very recent. We expect the significant components of the valuation to include property, plant and equipment, intangible contract assets and goodwill. The goodwill relates primarily to enhancing our strategic platform for expansion in the area. Revenues and earnings for the acquired companies are insignificant for the periods presented primarily because the Laser Gathering System began operations in October 2011.
138
THE WILLIAMS COMPANIES, INC.
QUARTERLY FINANCIAL DATA
Summarized quarterly financial data are as follows (millions, except per-share amounts).
| | | | | | | | | | | | | | | | | |
| | | First
| | | Second
| | | Third
| | | Fourth
| |
| | | Quarter | | | Quarter | | | Quarter | | | Quarter | |
| |
2008 | | | | | | | | | | | | | | | | |
| Revenues | | $ | 3,204 | | | $ | 3,701 | | | $ | 3,245 | | | $ | 2,202 | |
| Costs and operating expenses | | | 2,353 | | | | 2,719 | | | | 2,364 | | | | 1,720 | |
| Income from continuing operations | | | 416 | | | | 419 | | | | 369 | | | | 130 | |
| Net income | | | 500 | | | | 437 | | | | 366 | | | | 115 | |
| Basic earnings per common share: | | | | | | | | | | | | | | | | |
| Income from continuing operations | | | .71 | | | | .72 | | | | .63 | | | | .23 | |
| Diluted earnings per common share: | | | | | | | | | | | | | | | | |
| Income from continuing operations | | | .70 | | | | .70 | | | | .62 | | | | .23 | |
2007 | | | | | | | | | | | | | | | | |
| Revenues | | $ | 2,348 | | | $ | 2,805 | | | $ | 2,844 | | | $ | 2,489 | |
| Costs and operating expenses | | | 1,823 | | | | 2,161 | | | | 2,206 | | | | 1,817 | |
| Income from continuing operations | | | 170 | | | | 243 | | | | 228 | | | | 206 | |
| Net income | | | 134 | | | | 433 | | | | 198 | | | | 225 | |
| Basic earnings per common share: | | | | | | | | | | | | | | | | |
| Income from continuing operations | | | .28 | | | | .40 | | | | .38 | | | | .35 | |
| Diluted earnings per common share: | | | | | | | | | | | | | | | | |
| Income from continuing operations | | | .28 | | | | .40 | | | | .38 | | | | .34 | |
follows: | | | | | | | | | | | | | | | | |
| | | First
Quarter | | | Second
Quarter | | | Third
Quarter | | | Fourth
Quarter | |
| | | (Millions, except per-share amounts) | |
2011 | | | | | | | | | | | | | | | | |
Revenues | | $ | 1,871 | | | $ | 1,984 | | | $ | 1,972 | | | $ | 2,103 | |
Costs and operating expenses | | | 1,309 | | | | 1,394 | | | | 1,389 | | | | 1,458 | |
Income (loss) from continuing operations | | | 360 | | | | 239 | | | | 321 | | | | 158 | |
Net income (loss) | | | 384 | | | | 297 | | | | 342 | | | | (362 | ) |
Amounts attributable to The Williams Companies, Inc.: | | | | | | | | | | | | | | | | |
Income (loss) from continuing operations | | | 300 | | | | 171 | | | | 253 | | | | 79 | |
Net income (loss) | | | 321 | | | | 227 | | | | 272 | | | | (444 | ) |
Basic earnings (loss) per common share: | | | | | | | | | | | | | | | | |
Income (loss) from continuing operations | | | 0.51 | | | | 0.29 | | | | 0.43 | | | | 0.14 | |
Diluted earnings (loss) per common share: | | | | | | | | | | | | | | | | |
Income (loss) from continuing operations | | | 0.50 | | | | 0.29 | | | | 0.43 | | | | 0.13 | |
2010 | | | | | | | | | | | | | | | | |
Revenues | | $ | 1,724 | | | $ | 1,630 | | | $ | 1,543 | | | $ | 1,741 | |
Costs and operating expenses | | | 1,241 | | | | 1,175 | | | | 1,087 | | | | 1,209 | |
Income (loss) from continuing operations | | | (245 | ) | | | 177 | | | | 179 | | | | 160 | |
Net income (loss) | | | (146 | ) | | | 222 | | | | (1,226 | ) | | | 228 | |
Amounts attributable to The Williams Companies, Inc.: | | | | | | | | | | | | | | | | |
Income (loss) from continuing operations | | | (291 | ) | | | 143 | | | | 144 | | | | 108 | |
Net income (loss) | | | (193 | ) | | | 185 | | | | (1,263 | ) | | | 174 | |
Basic earnings (loss) per common share: | | | | | | | | | | | | | | | | |
Income (loss) from continuing operations | | | (0.50 | ) | | | 0.25 | | | | 0.25 | | | | 0.19 | |
Diluted earnings (loss) per common share: | | | | | | | | | | | | | | | | |
Income (loss) from continuing operations | | | (0.50 | ) | | | 0.24 | | | | 0.25 | | | | 0.18 | |
The sum of earnings per share for the four quarters may not equal the total earnings per share for the year due to changes in the average number of common shares outstanding and rounding.
Prior period amounts reported above have139
THE WILLIAMS COMPANIES, INC.
QUARTERLY FINANCIAL DATA – (Continued)
(Unaudited)
On December 31, 2011, we completed the spin-off of our former exploration and production business. (See Note 1 of Notes to Consolidated Financial Statements.) Summarized quarterly financial data has been retrospectively adjusted to reflect the presentationhistorical results of certain revenuesthe exploration and costs for Exploration & Production on a net basis. These adjustments reducedrevenuesand reducedcosts and operating expensesby the same amount, with no net impact on segment profit.production business as discontinued operations. The reductionsincreases (decreases) to amounts previously reported were as follows (in millions):
| | | | | | | | | | | | | | | | | |
| | | First
| | | Second
| | | Third
| | | Fourth
| |
| | | Quarter | | | Quarter | | | Quarter | | | Quarter | |
| |
2008 | | $ | 20 | | | $ | 28 | | | $ | 22 | | | $ | 10 | |
2007 | | $ | 20 | | | $ | 19 | | | $ | 16 | | | $ | 17 | |
follows: | | | | | | | | | | | | | | | | |
| | | First
Quarter | | | Second
Quarter | | | Third
Quarter | | | Fourth
Quarter | |
| | | (Millions, except per-share amounts) | |
2011 | | | | | | | | | | | | | | | | |
Revenues | | $ | (704 | ) | | $ | (685 | ) | | $ | (731 | ) | | $ | N/A | |
Costs and operating expenses | | | (599 | ) | | | (544 | ) | | | (636 | ) | | | N/A | |
Income (loss) from continuing operations | | | (32 | ) | | | (61 | ) | | | (26 | ) | | | N/A | |
Net income (loss) | | | — | | | | — | | | | — | | | | N/A | |
Amounts attributable to The Williams Companies, Inc.: | | | | | | | | | | | | | | | | |
Income (loss) from continuing operations | | | (29 | ) | | | (59 | ) | | | (24 | ) | | | N/A | |
Net income (loss) | | | — | | | | — | | | | — | | | | N/A | |
Basic earnings (loss) per common share: | | | | | | | | | | | | | | | | |
Income (loss) from continuing operations | | | (0.05 | ) | | | (0.10 | ) | | | (0.04 | ) | | | N/A | |
Diluted earnings (loss) per common share: | | | | | | | | | | | | | | | | |
Income (loss) from continuing operations | | | (0.05 | ) | | | (0.09 | ) | | | (0.04 | ) | | | N/A | |
2010 | | | | | | | | | | | | | | | | |
Revenues | | $ | (867 | ) | | $ | (659 | ) | | $ | (757 | ) | | $ | (679 | ) |
Costs and operating expenses | | | (676 | ) | | | (542 | ) | | | (661 | ) | | | (573 | ) |
Income (loss) from continuing operations | | | (97 | ) | | | (48 | ) | | | 1,400 | | | | (72 | ) |
Net income (loss) | | | — | | | | — | | | | — | | | | — | |
Amounts attributable to The Williams Companies, Inc.: | | | | | | | | | | | | | | | | |
Income (loss) from continuing operations | | | (96 | ) | | | (45 | ) | | | 1,402 | | | | (70 | ) |
Net income (loss) | | | — | | | | — | | | | — | | | | — | |
Basic earnings (loss) per common share: | | | | | | | | | | | | | | | | |
Income (loss) from continuing operations | | | (0.17 | ) | | | (0.07 | ) | | | 2.40 | | | | (0.12 | ) |
Diluted earnings (loss) per common share: | | | | | | | | | | | | | | | | |
Income (loss) from continuing operations | | | (0.17 | ) | | | (0.07 | ) | | | 2.40 | | | | (0.12 | ) |
Net incomelossfor fourth-quarter 20082011 includes both the unfavorable impact of the significant decline in energy commodity prices and the following pre-tax items:
| | |
| • | $129$271 million of early debt retirement costs consisting primarily of cash premiums of $254 million impairment of certain natural gas producing properties at Exploration & Production (see Note 4 of Notes to Consolidated Financial Statements); |
|
| • | $43 million of income including associated interest related to the partial settlement of the Gulf Liquids litigation at Midstream (see Notes 4 and 16); |
|
| • | $38 million accrual for Wyoming severance taxes and associated interest expense at Exploration & Production (see Notes 4 and 16); |
|
| • | $12 million gain related to the favorable resolution of a matter involving pipeline transportation rates associated with our former Alaska operations (see summarized results of discontinued operations at Note 2). |
139
$560 million of impairment charges primarily related to impairments of certain properties of our discontinued exploration and production business in the Powder River basin and Barnett Shale (see summarized results of discontinued operations at Note 2);
$179 million of impairment charges associated with our investment in WPX (see summarized results of discontinued operations at Note 2);
$33 million of income including associated interest related to the reduction of the Gulf Liquids litigation contingency accrual at Midstream Canada & Olefins (See Notes 4 and 16);
$30 million of transaction costs related to the spin-off of our exploration and production former business (see summarized results of discontinued operations at Note 2).
140
THE WILLIAMS COMPANIES, INC.
QUARTERLY FINANCIAL DATA —– (Continued)
Net incomelossfor fourth-quarter 20082011 also includes a $46$26 million adjustmentnet tax benefit associated with the write-down of certain indebtedness related to our former power operations (see summarized results of discontinued operations at Note 2).
Net income for third-quarter 2011 includes a $66 million tax benefit to reverse taxes on undistributed earnings of certain foreign operations that are now considered to be permanently reinvested (see Note 5).
Net income for first-quarter 2011 includes the following pre-tax items:
$11 million gain related to the sale of our 50 percent interest in Accroven at Other (see Note 3);
$10 million related to the reversal of project feasibility costs from expense to capital at Williams Partners (see Note 4).
Net income for first-quarter 2011 also includes a $124 million tax benefit related to finalized settlements and a revised assessment on an international matter (see Note 5).
Net income for fourth-quarter 2010 includes the following tax adjustments:
$66 million provision to reflect taxes on undistributed earnings of certain foreign operations that were no longer consider permanently reinvested (see Note 5). These taxes were reversed in the third quarter of 2011;
$65 million benefit to decrease state income taxes (net of federal benefit) due to a reduction in our estimate of the effective deferred state rate, including state income tax carryovers (see Note 5).
Net incomelossfor third-quarter 20082010 includes the following pre-tax items:
$1,003 million impairment of goodwill related to our former exploration and production business (see summarized results of discontinued operations at Note 2);
$678 million of impairments of certain producing properties and acquired unproved reserves related to our former exploration and production business (see summarized results of discontinued operations at Note 2);
| | |
| • | $14 million impairment of certain natural gas producing properties at Exploration & Production (see Note 4); |
|
| • | $10 million gain from the sale of certain south Texas assets at Gas Pipeline (see Note 4). |
$30 million gain related to the sale of our 50 percent interest in Accroven at Other (see Note 3);
$12 million gain on the sale of certain assets at Williams Partners (see Note 4).
Net incomefor second-quarter 20082010 includes the following pre-tax items:
$13 million gain related to the sale of our 50 percent interest in Accroven at Other (see Note 3);
$11 million of involuntary conversion gains due to insurance recoveries that are in excess of the carrying value of assets at Williams Partners (see Note 4).
| | |
| • | $54 million gain related to the favorable resolution of a matter involving pipeline transportation rates associated with our former Alaska operations (see summarized results of discontinued operations at Note 2); |
|
| • | $30 million gain recognized upon receipt of the remaining proceeds related to the sale of a contractual right to a production payment on certain future international hydrocarbon production at Exploration & Production (see Note 4); |
|
| • | $10 million charge associated with a settlement primarily related to the sale of natural gas liquids pipeline systems in 2002 (see summarized results of discontinued operations at Note 2); |
|
| • | $10 million charge associated with an oil purchase contract related to our former Alaska refinery (see summarized results of discontinued operations at Note 2). |
Net incomelossfor first quarter 2008first-quarter 2010 includes the following pre-tax items:
| | |
| • | $118 million gain on the sale of a contractual right to a production payment on certain future international hydrocarbon production at Exploration & Production (see Note 4); |
|
| • | $74 million gain related to the favorable resolution of a matter involving pipeline transportation rates associated with our former Alaska operations (see summarized results of discontinued operations at Note 2); |
|
| • | $54 million of income related to a reduction of remaining amounts accrued in excess of our obligation associated with the Trans-Alaska Pipeline System Quality Bank (see summarized results of discontinued operations at Note 2). |
Net incomefor fourth-quarter 2007 includes a $23$606 million adjustmentof early debt retirement costs consisting primarily of cash premiums of $574 million (see Note 4);
$39 million of other transaction costs associated with our strategic restructuring transaction, of which $4 million are attributable to increase the tax provision relating to an income tax contingency and the following pre-tax items:
| | |
| • | $156 million mark-to-market loss recognized at Gas Marketing Services on a legacy derivative natural gas sales contract that we expect to assign to another party in 2008 under an asset transfer agreement that we executed in December 2007; |
|
| • | $20 million accrual for litigation contingencies at Gas Marketing Servicesnoncontrolling interests (see Note 4); |
|
| • | $19 million in premiums, fees and expenses related to early debt retirement; |
|
| • | $12 million of income related to a favorable litigation outcome at Midstream (see Note 4); |
|
| • | $10 million charge related to an impairment of the Carbonate Trend pipeline at Midstream (see Note 4); |
|
| • | $9 million charge related to the reserve for certain international receivables at Midstream; |
|
| • | $6 million net loss, including transaction expenses, related to the sale of our discontinued power business (see summarized results of discontinued operations at Note 2). |
140
THE WILLIAMS COMPANIES, INC.
QUARTERLY FINANCIAL DATA — (Continued)
(Unaudited)
Net incomefor third-quarter 2007 includes the following pre-tax items:
| | |
| • | $17$4 million of expenses related to the sale of our discontinued power business (see summarized results of discontinued operations at Note 2); |
|
| • | $12 million of income associated with the payments received for a terminated firm transportation agreement on Northwest Pipeline’s Grays Harbor lateral (see Note 4). |
Net incomefor second-quarter 2007 includes the following pre-tax items:
| | |
| • | $429 million gain associated with the reclassification of deferred net hedge gains to earnings related to the sale of our discontinued power business (see summarized results of discontinued operations at Note 2); |
|
| • | $111 million impairment of the carrying value of certain derivative contracts related to the sale of our discontinued power business (see summarized results of discontinued operations at Note 2); |
|
| • | $17 million of income associated with a change in estimate related to a regulatory liability at Northwest Pipeline (see Note 4); |
|
| • | $15 million impairment of our Hazelton facility included in discontinued operations (see summarized results of discontinued operations at Note 2); |
|
| • | $14 million of gains from the sales of cost-based investments (see Note 3); |
|
| • | $14 million of expenses related to the sale of our discontinued power business (see summarized results of discontinued operations at Note 2); |
|
| • | $6 million of income associated with the payments received for a terminated firm transportation agreement on Northwest Pipeline’s Grays Harbor lateral (see Note 4). |
Net incomefor the first-quarter 2007 includes the following pre-tax items:
| | |
| • | $8 million of income due to the reversal of a planned major maintenance accrual at Midstream. |
141
THE WILLIAMS COMPANIES, INC.
SUPPLEMENTAL OIL AND GAS DISCLOSURES
(Unaudited)
The following information pertains to our oil and gas producing activities and is presented in accordance with SFAS No. 69, “Disclosures About Oil and Gas Producing Activities.” The information is required to be disclosed by geographic region. We have significant oil and gas producing activities primarily in the Rocky Mountain and Mid-continent areas of the United States. Additionally, we have international oil- and gas-producing activities, primarily in Argentina. However, proved reserves and revenuesaccelerated amortization of debt costs related to international activities are approximately 3.6 percent and 2.3 percent, respectively,amendments of our total international and domestic proved reserves and revenues. The following information relates only to the oil and gas activities in the United States.
Capitalized Costs
| | | | | | | | | |
| | | As of December 31, | |
| | | 2008 | | | 2007 | |
| | | (Millions) | |
| |
| Proved properties | | $ | 8,099 | | | $ | 6,409 | |
| Unproved properties | | | 806 | | | | 542 | |
| | | | | | | | | |
| | | | 8,905 | | | | 6,951 | |
| Accumulated depreciation, depletion and amortization and valuation provisions | | | (2,353 | ) | | | (1,754 | ) |
| | | | | | | | | |
| Net capitalized costs | | $ | 6,552 | | | $ | 5,197 | |
| | | | | | | | | |
| | |
| • | Excluded from capitalized costs are equipment and facilities in support of oil and gas production of $726 million and $505 million, net, for 2008 and 2007, respectively. The capitalized cost amounts for 2008 and 2007 do not include approximately $1 billion of goodwill related to the purchase of Barrett Resources Corporation (Barrett) in 2001. |
|
| • | Proved properties include capitalized costs for oil and gas leaseholds holding proved reserves; development wells including uncompleted development well costs; and successful exploratory wells. |
|
| • | Unproved properties consist primarily of acreage related to probable/possible reserves acquired through transactions in 2001 and 2008. |
Costs Incurred
| | | | | | | | | | | | | |
| | | For the Year Ended
| |
| | | December 31, | |
| | | 2008 | | | 2007 | | | 2006 | |
| | | | | | (Millions) | | | | |
| |
| Acquisition | | $ | 543 | | | $ | 82 | | | $ | 84 | |
| Exploration | | | 38 | | | | 38 | | | | 20 | |
| Development | | | 1,699 | | | | 1,374 | | | | 1,173 | |
| | | | | | | | | | | | | |
| | | $ | 2,280 | | | $ | 1,494 | | | $ | 1,277 | |
| | | | | | | | | | | | | |
| | |
| • | Costs incurred include capitalized and expensed items. |
|
| • | Acquisition costs are as follows: The 2008 and 2007 costs are primarily for additional leasehold and reserve acquisitions in the Piceance and Fort Worth basins. Included in the 2008 acquisition amounts are $140 million of proved property values and $71 million related to an interest in a portion of acquired assets that a third party subsequently exercised its contractual option to purchase from us, on the same terms and conditions. The 2006 cost is primarily for additional leasehold and reserve acquisitions in the Fort Worth basin. |
142credit facilities (see Note 4).
141
THE WILLIAMS COMPANIES, INC.
SUPPLEMENTAL OIL AND GAS DISCLOSURES — (Continued)
(Unaudited)
| | |
| • | Exploration costs include the costs of geological and geophysical activity, drilling and equipping exploratory wells determined to be dry holes, and the cost of retaining undeveloped leaseholds including lease amortization and impairments. |
|
| • | Development costs include costs incurred to gain access to and prepare development well locations for drilling and to drill and equip development wells. |
Results of Operations
| | | | | | | | | | | | | |
| | | For the Year Ended December 31, | |
| | | 2008 | | | 2007 | | | 2006 | |
| | | | | | (Millions) | | | | |
| |
| Revenues: | | | | | | | | | | | | |
| Oil and gas revenues | | $ | 2,644 | | | $ | 1,725 | | | $ | 1,238 | |
| Other revenues | | | 405 | | | | 232 | | | | 109 | |
| | | | | | | | | | | | | |
| Total revenues | | | 3,049 | | | | 1,957 | | | | 1,347 | |
| | | | | | | | | | | | | |
| Costs: | | | | | | | | | | | | |
| Production costs | | | 555 | | | | 360 | | | | 309 | |
| General & administrative | | | 169 | | | | 144 | | | | 111 | |
| Exploration expenses | | | 27 | | | | 21 | | | | 18 | |
| Depreciation, depletion & amortization | | | 724 | | | | 523 | | | | 351 | |
| (Gains)/Losses on sales of interests in oil and gas properties | | | 1 | | | | (1 | ) | | | — | |
| Impairment of certain natural gas properties in the Arkoma basin | | | 143 | | | | — | | | | — | |
| Other expenses | | | 349 | | | | 198 | | | | 59 | |
| | | | | | | | | | | | | |
| Total costs | | | 1,968 | | | | 1,245 | | | | 848 | |
| | | | | | | | | | | | | |
| Results of operations | | | 1,081 | | | | 712 | | | | 499 | |
| Provision for income taxes | | | (406 | ) | | | (273 | ) | | | (174 | ) |
| | | | | | | | | | | | | |
| Exploration and production net income | | $ | 675 | | | $ | 439 | | | $ | 325 | |
| | | | | | | | | | | | | |
| | |
| • | Results of operations for producing activities consist of all related domestic activities within the Exploration & Production reporting unit and excludes the $148 million gain on sale of a contractual right to a production payment on certain future international hydrocarbon production. |
|
| • | Prior period amounts have been adjusted to reflect the presentation of certain revenues and costs on a net basis. These adjustments reduced other revenues and reduced other expenses by the same amount, with no net impact on segment profit. The reductions were $72 million in 2007 and $77 million in 2006. |
|
| • | Oil and gas revenues consist primarily of natural gas production sold to the Gas Marketing Services subsidiary and includes the impact of hedges, including intercompany hedges. |
|
| • | Other revenues and other expenses consist of activities within the Exploration & Production segment that are not a direct part of the producing activities. These nonproducing activities include acquisition and disposition of other working interest gas and the movement of gas from the wellhead to the tailgate of the respective plants for sale to the Gas Marketing Services subsidiary or third-party purchasers. In addition, other revenues include recognition of income from transactions which transferred certain nonoperating benefits to a third party. |
143
THE WILLIAMS COMPANIES, INC.
SUPPLEMENTAL OIL AND GAS DISCLOSURES — (Continued)
(Unaudited)
| | |
| • | Production costs consist of costs incurred to operate and maintain wells and related equipment and facilities used in the production of petroleum liquids and natural gas. These costs also include production taxes other than income taxes and administrative expenses in support of production activity. Excluded are depreciation, depletion and amortization of capitalized costs. |
|
| • | Exploration expenses include the costs of geological and geophysical activity, drilling and equipping exploratory wells determined to be dry holes, and the cost of retaining undeveloped leaseholds including lease amortization and impairments. |
|
| • | Depreciation, depletion and amortization includes depreciation of support equipment. |
Proved Reserves
| | | | | | | | | | | | | |
| | | 2008 | | | 2007 | | | 2006 | |
| | | | | | (Bcfe) | | | | |
| |
| Proved reserves at beginning of period | | | 4,143 | | | | 3,701 | | | | 3,382 | |
| Revisions | | | (220 | ) | | | (106 | ) | | | (113 | ) |
| Purchases | | | 31 | | | | 19 | | | | 41 | |
| Extensions and discoveries | | | 791 | | | | 863 | | | | 669 | |
| Wellhead production | | | (406 | ) | | | (334 | ) | | | (277 | ) |
| Sale of minerals in place | | | — | | | | — | | | | (1 | ) |
| | | | | | | | | | | | | |
| Proved reserves at end of period | | | 4,339 | | | | 4,143 | | | | 3,701 | |
| | | | | | | | | | | | | |
| Proved developed reserves at end of period | | | 2,456 | | | | 2,252 | | | | 1,945 | |
| | | | | | | | | | | | | |
| | |
| • | The SEC defines proved oil and gas reserves(Rule 4-10(a) ofRegulation S-X) as the estimated quantities of crude oil, natural gas, and natural gas liquids which geological and engineering data demonstrate with reasonable certainty are recoverable in future years from known reservoirs under existing economic and operating conditions. Our proved reserves consist of two categories, proved developed reserves and proved undeveloped reserves. Proved developed reserves are currently producing wells and wells awaiting minor sales connection expenditure, recompletion, additional perforations or borehole stimulation treatments. Proved undeveloped reserves are those reserves which are expected to be recovered from new wells on undrilled acreage or from existing wells where a relatively major expenditure is required for recompletion. Proved reserves on undrilled acreage are limited to those drilling units offsetting productive units that are reasonably certain of production when drilled or where it can be demonstrated with certainty that there is continuity of production from the existing productive formation. |
|
| • | Approximately one-half of the revisions for 2008 relate to the impact of lower average year-end natural gas prices used in 2008 compared to the prior year. |
|
| • | Natural gas reserves are computed at 14.73 pounds per square inch absolute and 60 degrees Fahrenheit. Crude oil reserves are insignificant and have been included in the proved reserves on a basis of billion cubic feet equivalents (Bcfe). |
Standardized Measure of Discounted Future Net Cash Flows Relating to Proved Oil and Gas Reserves
The following is based on the estimated quantities of proved reserves and the year-end prices and costs. The average year-end natural gas prices used in the following estimates were $4.41, $5.78, and $4.81 per MMcfe at December 31, 2008, 2007, and 2006, respectively. Future income tax expenses have been computed considering available carry forwards and credits and the appropriate statutory tax rates. The discount rate of 10 percent is as prescribed by SFAS No. 69. Continuation of year-end economic conditions also is assumed. The calculation is
144
THE WILLIAMS COMPANIES, INC.
SUPPLEMENTAL OIL AND GAS DISCLOSURES — (Continued)
(Unaudited)
based on estimates of proved reserves, which are revised over time as new data becomes available. Probable or possible reserves, which may become proved in the future, are not considered. The calculation also requires assumptions as to the timing of future production of proved reserves, and the timing and amount of future development and production costs. Of the $3,772 million of future development costs, approximately 72 percent is estimated to be spent in 2009, 2010 and 2011.
Numerous uncertainties are inherent in estimating volumes and the value of proved reserves and in projecting future production rates and timing of development expenditures. Such reserve estimates are subject to change as additional information becomes available. The reserves actually recovered and the timing of production may be substantially different from the reserve estimates.
Standardized Measure of Discounted Future Net Cash Flows
| | | | | | | | | |
| | | At December 31, | |
| | | 2008 | | | 2007 | |
| | | (Millions) | |
| |
| Future cash inflows | | $ | 19,127 | | | $ | 23,937 | |
| Less: | | | | | | | | |
| Future production costs | | | 5,516 | | | | 5,345 | |
| Future development costs | | | 3,772 | | | | 3,497 | |
| Future income tax provisions | | | 3,284 | | | | 5,416 | |
| | | | | | | | | |
| Future net cash flows | | | 6,555 | | | | 9,679 | |
| Less 10 percent annual discount for estimated timing of cash flows | | | 3,382 | | | | 4,876 | |
| | | | | | | | | |
| Standardized measure of discounted future net cash flows | | $ | 3,173 | | | $ | 4,803 | |
| | | | | | | | | |
Sources of Change in Standardized Measure of Discounted Future Net Cash Flows
| | | | | | | | | | | | | |
| | | 2008 | | | 2007 | | | 2006 | |
| | | (Millions) | |
| |
| Standardized measure of discounted future net cash flows beginning of period | | $ | 4,803 | | | $ | 2,856 | | | $ | 5,281 | |
| Changes during the year: | | | | | | | | | | | | |
| Sales of oil and gas produced, net of operating costs | | | (2,091 | ) | | | (1,426 | ) | | | (1,179 | ) |
| Net change in prices and production costs | | | (2,548 | ) | | | 2,019 | | | | (4,052 | ) |
| Extensions, discoveries and improved recovery, less estimated future costs | | | 1,423 | | | | 2,163 | | | | 647 | |
| Development costs incurred during year | | | 817 | | | | 738 | | | | 881 | |
| Changes in estimated future development costs | | | (724 | ) | | | (931 | ) | | | (1,022 | ) |
| Purchase of reserves in place, less estimated future costs | | | 55 | | | | 48 | | | | 63 | |
| Sales of reserves in place, less estimated future costs | | | — | | | | — | | | | (2 | ) |
| Revisions of previous quantity estimates | | | (395 | ) | | | (266 | ) | | | (140 | ) |
| Accretion of discount | | | 714 | | | | 434 | | | | 790 | |
| Net change in income taxes | | | 1,108 | | | | (1,108 | ) | | | 1,468 | |
| Other | | | 11 | | | | 276 | | | | 121 | |
| | | | | | | | | | | | | |
| Net changes | | | (1,630 | ) | | | 1,947 | | | | (2,425 | ) |
| | | | | | | | | | | | | |
| Standardized measure of discounted future net cash flows end of period | | $ | 3,173 | | | $ | 4,803 | | | $ | 2,856 | |
| | | | | | | | | | | | | |
145
THE WILLIAMS COMPANIES, INC.
SCHEDULE I - CONDENSED FINANCIAL INFORMATION OF REGISTRANT
STATEMENT OF OPERATIONS (PARENT)
| | | | | | | | | | | | |
| | | Years Ended December 31, | |
| | | 2011 | | | 2010 | | | 2009 | |
| | | (Millions) | |
Equity in earnings of consolidated subsidiaries | | $ | 1,962 | | | $ | 1,457 | | | $ | 948 | |
Interest accrued - external | | | (186 | ) | | | (235 | ) | | | (448 | ) |
Interest accrued - affiliate | | | (622 | ) | | | (460 | ) | | | (367 | ) |
Interest income - affiliate | | | 84 | | | | 76 | | | | 285 | |
Early debt retirement costs | | | (271 | ) | | | (606 | ) | | | (1 | ) |
Other income (expense) — net | | | (45 | ) | | | (41 | ) | | | (11 | ) |
| | | | | | | | | | | | |
Income from continuing operations before income taxes | | | 922 | | | | 191 | | | | 406 | |
Provision for income taxes | | | 119 | | | | 87 | | | | 200 | |
| | | | | | | | | | | | |
Income (loss) from continuing operations | | | 803 | | | | 104 | | | | 206 | |
Income (loss) from discontinued operations | | | (427 | ) | | | (1,201 | ) | | | 79 | |
| | | | | | | | | | | | |
Net income (loss) | | $ | 376 | | | $ | (1,097 | ) | | $ | 285 | |
| | | | | | | | | | | | |
Basic earnings (loss) per common share: | | | | | | | | | | | | |
Income (loss) from continuing operations | | $ | 1.36 | | | $ | 0.17 | | | $ | .35 | |
Income (loss) from discontinued operations | | | (.72 | ) | | | (2.05 | ) | | | .14 | |
| | | | | | | | | | | | |
Net income (loss) | | $ | .64 | | | $ | (1.88 | ) | | $ | .49 | |
| | | | | | | | | | | | |
Weighted-average shares (thousands) | | | 588,553 | | | | 584,552 | | | | 581,674 | |
| | | | | | | | | | | | |
Diluted earnings (loss) per share common share: | | | | | | | | | | | | |
Income (loss) from continuing operations | | $ | 1.34 | | | $ | .17 | | | $ | .35 | |
Income (loss) from discontinued operations | | | (.71 | ) | | | (2.03 | ) | | | .14 | |
| | | | | | | | | | | | |
Net income (loss) | | $ | .63 | | | $ | (1.86 | ) | | $ | .49 | |
| | | | | | | | | | | | |
Weighted-average shares (thousands) | | | 598,175 | | | | 590,699 | | | | 585,955 | |
| | | | | | | | | | | | |
See accompanying notes.
142
THE WILLIAMS COMPANIES, INC.
SCHEDULE I - CONDENSED FINANCIAL INFORMATION OF REGISTRANT - (Continued)
BALANCE SHEET (PARENT)
| | | | | | | | |
| | | December 31,
2011 | | | December 31,
2010 | |
| | | (Millions) | |
ASSETS | | | | | | | | |
Current assets: | | | | | | | | |
Cash and cash equivalents | | $ | 292 | | | $ | 102 | |
Other current assets | | | 128 | | | | 18 | |
| | | | | | | | |
Total current assets | | | 420 | | | | 120 | |
Investments in and advances to consolidated subsidiaries | | | 13,602 | | | | 20,815 | |
Property, plant, and equipment - net | | | 61 | | | | 62 | |
Other noncurrent assets | | | 142 | | | | 58 | |
| | | | | | | | |
Total assets | | $ | 14,225 | | | $ | 21,055 | |
| | | | | | | | |
| | |
LIABILITIES AND STOCKHOLDERS’ EQUITY | | | | | | | | |
Current liabilities: | | | | | | | | |
Accounts payable and accrued liabilities | | $ | 143 | | | $ | 292 | |
Long-term debt due within one year | | | 28 | | | | 49 | |
Other current liabilities | | | 58 | | | | 40 | |
| | | | | | | | |
Total current liabilities | | | 229 | | | | 381 | |
Long-term debt | | | 1,456 | | | | 2,235 | |
Notes payable - affiliates | | | 8,418 | | | | 9,008 | |
Pension, other post-retirement and other liabilities | | | 732 | | | | 460 | |
Deferred income taxes | | | 1,597 | | | | 1,683 | |
Contingent liabilities and commitments | | | | | | | | |
Equity: | | | | | | | | |
Common stock | | | 626 | | | | 620 | |
Other stockholders’ equity | | | 1,167 | | | | 6,668 | |
| | | | | | | | |
Total stockholders’ equity | | | 1,793 | | | | 7,288 | |
| | | | | | | | |
Total liabilities and stockholders’ equity | | $ | 14,225 | | | $ | 21,055 | |
| | | | | | | | |
See accompanying notes.
143
THE WILLIAMS COMPANIES, INC.
SCHEDULE I - CONDENSED FINANCIAL INFORMATION OF REGISTRANT - (Continued)
STATEMENT OF CASH FLOWS (PARENT)
| | | | | | | | | | | | |
| | | Years Ended December 31, | |
| | | 2011 | | | 2010 | | | 2009 | |
| | | (Millions) | |
NET CASH FLOWS PROVIDED (USED) BY OPERATING ACTIVITIES | | $ | (286 | ) | | $ | 3,371 | | | $ | (159 | ) |
| | | | | | | | | | | | |
FINANCING ACTIVITIES: | | | | | | | | | | | | |
Proceeds from long-term debt | | | 75 | | | | 100 | | | | 595 | |
Payments of long-term debt | | | (871 | ) | | | (3,102 | ) | | | (15 | ) |
Changes in notes payable to affiliate | | | (590 | ) | | | 1,422 | | | | 227 | |
Tax benefit of stock-based awards | | | 22 | | | | 7 | | | | 1 | |
Premiums paid on early debt retirement | | | (254 | ) | | | (574 | ) | | | — | |
Proceeds from issuance of common stock | | | 49 | | | | 12 | | | | 6 | |
Dividends paid | | | (457 | ) | | | (284 | ) | | | (256 | ) |
Other — net | | | (5 | ) | | | (12 | ) | | | (1 | ) |
| | | | | | | | | | | | |
Net cash provided (used) by financing activities | | | (2,031 | ) | | | (2,431 | ) | | | 557 | |
| | | | | | | | | | | | |
INVESTING ACTIVITIES: | | | | | | | | | | | | |
Capital expenditures | | | (28 | ) | | | (15 | ) | | | (14 | ) |
Changes in investments in and advances to consolidated subsidiaries | | | 2,553 | | | | (2,054 | ) | | | (1 | ) |
Other — net | | | (18 | ) | | | — | | | | 1 | |
| | | | | | | | | | | | |
Net cash provided (used) by investing activities | | | 2,507 | | | | (2,069 | ) | | | (14 | ) |
| | | | | | | | | | | | |
Increase (decrease) in cash and cash equivalents | | | 190 | | | | (1,129 | ) | | | 384 | |
Cash and cash equivalents at beginning of period | | | 102 | | | | 1,231 | | | | 847 | |
| | | | | | | | | | | | |
Cash and cash equivalents at end of period | | $ | 292 | | | $ | 102 | | | $ | 1,231 | |
| | | | | | | | | | | | |
See accompanying notes.
144
THE WILLIAMS COMPANIES, INC.
SCHEDULE I – CONDENSED FINANCIAL INFORMATION OR REGISTRANT
NOTES TO FINANCIAL INFORMATION (PARENT)
Note 1. Guarantees
In addition to the guarantees disclosed in the accompanying consolidated financial statements in Item 8, we have financially guaranteed the performance of certain consolidated subsidiaries. The duration of these guarantees varies and we estimate the maximum undiscounted potential future payment obligation related to these guarantees as of December 31, 2011, is approximately $233 million. We estimate that the fair value of these guarantees is not material.
Note 2. Cash Dividends Received
We receive dividends and distributions either directly from our subsidiaries or indirectly through dividends received by subsidiaries and subsequent transfers of cash to us through our corporate cash management system. The total of such receipts ultimately related to dividends and distributions for the years ended December 31, 2011, 2010 and 2009 was approximately $1.2 billion, $5.0 billion, and $635 million, respectively.
145
THE WILLIAMS COMPANIES, INC.
SCHEDULE II —- VALUATION AND QUALIFYING ACCOUNTS
| | | | | | | | | | | | | | | | | | | | | |
| | | | | | ADDITIONS | | | | | | | |
| | | | | | Charged to
| | | | | | | | | | |
| | | Beginning
| | | Cost and
| | | | | | | | | Ending
| |
| | | Balance | | | Expenses | | | Other | | | Deductions | | | Balance | |
| | | | | | | | | (Millions) | | | | | | | |
| |
| Year ended December 31, 2008: | | | | | | | | | | | | | | | | | | | | |
| Allowance for doubtful accounts — accounts and notes receivable(a) | | $ | 27 | | | $ | 15 | | | $ | — | | | $ | 2 | (d) | | $ | 40 | |
| Deferred tax asset valuation allowance(a) | | | 57 | | | | (9 | ) | | | — | | | | 33 | (d) | | | 15 | |
| Price-risk management credit reserves — assets(a) | | | 1 | | | | 1 | (e) | | | 4 | (g) | | | — | | | | 6 | |
| Price-risk management credit reserves — liabilities(b) | | | — | | | | (16 | )(e) | | | 1 | (g) | | | — | | | | (15 | ) |
| Year ended December 31, 2007: | | | | | | | | | | | | | | | | | | | | |
| Allowance for doubtful accounts — accounts and notes receivable(a) | | | 15 | | | | 12 | | | | — | | | | — | | | | 27 | |
| Deferred tax asset valuation allowance(a) | | | 36 | | | | 21 | | | | — | | | | — | | | | 57 | |
| Price-risk management credit reserves — assets(a) | | | 7 | | | | (6 | )(e) | | | — | | | | — | | | | 1 | |
| Processing plant major maintenance accrual | | | 8 | | | | — | | | | — | | | | 8 | (c) | | | — | |
| Year ended December 31, 2006: | | | | | | | | | | | | | | | | | | | | |
| Allowance for doubtful accounts — accounts and notes receivable(a) | | | 86 | | | | 4 | | | | (66 | )(f) | | | 9 | (d) | | | 15 | |
| Deferred tax asset valuation allowance(a) | | | 37 | | | | (1 | ) | | | — | | | | — | | | | 36 | |
| Price-risk management credit reserves — assets(a) | | | 15 | | | | (8 | )(e) | | | — | | | | — | | | | 7 | |
| Processing plant major maintenance accrual(h) | | | 7 | | | | 2 | | | | — | | | | 1 | | | | 8 | |
| | | | | | | | | | | | | | | | | | | | |
| | | | | | Additions | | | | | | | |
| | | Beginning
Balance | | | Charged
(Credited)
To Costs
and
Expenses | | | Other | | | Deductions | | | Ending
Balance | |
| | | (Millions) | |
2011 | | | | | | | | | | | | | | | | | | | | |
Allowance for doubtful accounts - accounts and notes receivable(b) | | $ | 15 | | | $ | 1 | | | $ | — | | | $ | 15 | (g) | | $ | 1 | |
Deferred tax asset valuation allowance(a) | | | 249 | | | | (33 | ) | | | — | | | | 71 | (g) | | | 145 | |
2010 | | | | | | | | | | | | | | | | | | | | |
Allowance for doubtful accounts - accounts and notes receivable(b) | | | 22 | | | | (6 | ) | | | — | | | | 1 | (f) | | | 15 | |
Deferred tax asset valuation allowance(a) | | | 289 | | | | (40 | ) | | | — | | | | — | | | | 249 | |
Price-risk management credit reserves - liabilities(c) | | | (3 | ) | | | 3 | (d) | | | — | | | | — | | | | — | |
2009 | | | | | | | | | | | | | | | | | | | | |
Allowance for doubtful accounts - accounts and notes receivable(b) | | | 29 | | | | 4 | | | | — | | | | 11 | (f) | | | 22 | |
Deferred tax asset valuation allowance(a) | | | 224 | | | | 65 | | | | — | | | | — | | | | 289 | |
Price-risk management credit reserves - assets(b) | | | 6 | | | | (3 | )(d) | | | (3 | )(e) | | | — | | | | — | |
Price-risk management credit reserves - liabilities(c) | | | (15 | ) | | | 12 | (d) | | | — | | | | — | | | | (3 | ) |
(a) | Deducted primarily from related assets, with a portion included in assets of discontinued operations. |
(b) | |
(a) | | Deducted from related assets.assets, primarily included in assets of discontinued operations. |
|
(b)(c) | | Deducted from related liabilities.liabilities, included in liabilities of discontinued operations. |
(d) | Included inincome (loss) from discontinued operations. |
(c)(e) | Included inaccumulated other comprehensive income (loss). |
(f) | Effective January 1, 2007, we adopted FASB Staff Position (FSP) No. AUG AIR-1,Accounting for Planned Major Maintenance Activities. As a result, we recognized as other income an $8 million reversal of an accrual for major maintenance on our Geismar ethane cracker. We did not apply the FSP retrospectively because the impact to our 2007 earnings, as well as the impact to prior periods, is not material. We have adopted the deferral method of accounting for these costs going forward. |
|
(d) | | Represents balances written off, reclassifications, and recoveries. |
|
(e)(g) | | Included inrevenues. |
|
(f) | | During 2006, $66 million in previously reserved Enron receivables were sold. |
|
(g) | | Included inaccumulated other comprehensive loss. |
|
(h) | | Included inaccrued liabilitiesin 2006.Includes balance deductions due to the spin-off of our exploration and production business on December 31, 2011. |
146
| |
Item 9. | Changes in and Disagreements with Accountants on Accounting and Financial Disclosure |
| |
Item 9A. | Controls and Procedures |
Disclosure Controls and Procedures
Our management, including our Chief Executive Officer and Chief Financial Officer, does not expect that our disclosure controls and procedures (as defined inRules 13a-15(e) and15d-15(e) of the Securities Exchange ActAct) (Disclosure Controls) will prevent all errors and all fraud. A control system, no matter how well conceived and operated, can provide only reasonable, not absolute, assurance that the objectives of the control system are met. Further, the design of a control system must reflect the fact that there are resource constraints, and the benefits of controls must be considered relative to their costs. Because of the inherent limitations in all control systems, no evaluation of controls can provide absolute assurance that all control issues and instances of fraud, if any, within the company have been detected. These inherent limitations include the realities that judgments in decision-making can be faulty, and that breakdowns can occur because of simple error or mistake. Additionally, controls can be circumvented by the individual acts of some persons, by collusion of two or more people, or by management override of the control. The design of any system of controls also is based in part upon certain
146
assumptions about the likelihood of future events, and there can be no assurance that any design will succeed in achieving its stated goals under all potential future conditions. Because of the inherent limitations in a cost-effective control system, misstatements due to error or fraud may occur and not be detected. We monitor our Disclosure Controls and make modifications as necessary; our intent in this regard is that the Disclosure Controls will be modified as systems change and conditions warrant.
An evaluation of the effectiveness of the design and operation of our Disclosure Controls was performed as of the end of the period covered by this report. This evaluation was performed under the supervision and with the participation of our management, including our Chief Executive Officer and Chief Financial Officer. Based upon that evaluation, our Chief Executive Officer and Chief Financial Officer concluded that these Disclosure Controls are effective at a reasonable assurance level.
Management’s Annual Report on Internal Control over Financial Reporting
See report set forth above in Item 8, “Financial Statements and Supplementary Data.”
Report of Independent Registered Public Accounting Firm on Internal Control Over Financial Reporting
See report set forth above in Item 8, “Financial Statements and Supplementary Data.”
Changes in Internal Controls Over Financial Reporting
There have been no changes during the fourth quarter of 20082011 that have materially affected, or are reasonably likely to materially affect, our Internal Controls over financial reporting.
| |
Item 9B. | Other Information |
147
PART III
| |
Item 10. | Directors, Executive Officers and Corporate Governance |
The information regarding our directors and nominees for director required by Item 401 ofRegulation S-K will be presented under the heading.heading “Proposal 1 — Election of Directors” in our Proxy Statement prepared for the solicitation of proxies in connection with our Annual Meeting of Stockholders to be held May 21, 200917, 2012 (Proxy Statement), which information is incorporated by reference herein.
Information regarding our executive officers required by Item 401(b) ofRegulation S-K is presented at the end of Part I herein and captioned “Executive Officers of the Registrant” as permitted by General Instruction G(3) toForm 10-K and Instruction 3 to Item 401(b) ofRegulation S-K.
Information required by Item 405 ofRegulation S-K will be included under the heading “Compliance with Section“Section 16(a) of the Securities Exchange Act of 1934”Beneficial Ownership Reporting Compliance” in our Proxy Statement, which information is incorporated by reference herein.
Information required by paragraphs (c)(3), (d)(4) and (d)(5) of Item 407 ofRegulation S-K will be included under the heading “Questions and Answers About the Annual Meeting and Voting” and “Corporate Governance and Board Matters” in our Proxy Statement, which information is incorporated by reference herein.
We have adopted a Code of Ethics for Senior Officers that applies to our Chief Executive Officer, Chief Financial Officer, and Controller, or persons performing similar functions. The Code of Ethics for Senior Officers, together with our Corporate Governance Guidelines, the charters for each of our board committees, and our Code of Business Conduct applicable to all employees are available on our Internet website athttp://www.williams.com.We will provide, free of charge, a copy of our Code of Ethics or any of our other corporate documents listed above upon written request to our Corporate Secretary at Williams, One Williams Center, Suite 4700, Tulsa, Oklahoma 74172. We intend to disclose any amendments to or waivers of the Code of Ethics on behalf of our Chief Executive Officer, Chief Financial Officer, Controller, and persons performing similar functions on our Internet website athttp://www.williams.comunder the Investor Relations caption, promptly following the date of any such amendment or waiver.
| |
Item 11. | Executive Compensation |
The information required by Item 402 and paragraphs (e)(4) and (e)(5) of Item 407 ofRegulation S-K regarding executive compensation will be presented under the headings “Compensation Discussion and Analysis”Analysis,” “Executive Compensation and Other Information,” and“Compensation of Directors,” “Compensation Committee Report on Executive Compensation”Compensation,” and “Compensation Committee Interlocks and Insider Participation” in our Proxy Statement, which information is incorporated by reference herein. Notwithstanding the foregoing, the information provided under the heading “Compensation Committee Report on Executive Compensation” in our Proxy Statement is furnished and shall not be deemed to be filed for purposes of Section 18 of the Securities Exchange Act of 1934, as amended, is not subject to the liabilities of that section and is not deemed incorporated by reference in any filing under the Securities Act of 1933, as amended.
| |
Item 12. | Security Ownership of Certain Beneficial Owners and Management and Related Stockholder Matters |
The information regarding securities authorized for issuance under equity compensation plans required by Item 201(d) ofRegulation S-K and the security ownership of certain beneficial owners and management required by Item 403 ofRegulation S-K will be presented under the headings “Equity Compensation Stock Plans” and “Security Ownership of Certain Beneficial Owners and Management” in our Proxy Statement, which information is incorporated by reference herein.
148
| |
Item 13. | Certain Relationships and Related Transactions, and Director Independence |
The information regarding certain relationships and related transactions required by Item 404 and Item 407(a) ofRegulation S-K will be presented under the heading “Corporate Governance and Board Matters” in our Proxy Statement, which information is incorporated by reference herein.
148
| |
Item 14. | Principal AccountantAccounting Fees and Services |
The information regarding our principal accountantaccounting fees and services required by Item 9(e) of Schedule 14A will be presented under the heading “Principal AccountantAccounting Fees and Services” in Proposal 2 Ratification of the Appointment of Independent Auditors of our Proxy Statement, which information is incorporated by reference herein.
| |
Item 15. | Exhibits and Financial Statement Schedules |
All other schedules have been omitted since the required information is not present or is not present in amounts sufficient to require submission of the schedule, or because the information required is included in the financial statements and notes thereto.
(a) 3 and (b). The exhibits listed below are filed as part of this annual report.
| | | | | | | |
Exhibit
| | | | |
No. | | | | Description |
| |
| | 3 | .1 | | — | | Restated Certificate of Incorporation, as supplemented (filed on March 11, 2005 as Exhibit 3.1 to The Williams Companies, Inc.’s Form 10-K) and incorporated herein by reference. |
| | 3 | .2 | | — | | Restated By-Laws (filed on September 24, 2008 as Exhibit 3.1 to The Williams Companies, Inc.’sForm 8-K) and incorporated herein by reference. |
| | 4 | .1 | | — | | Form of Senior Debt Indenture between Williams and Bank One Trust company, N.A. (formerly The First National Bank of Chicago), as Trustee (filed on September 8, 1997 as Exhibit 4.1 to The Williams Companies, Inc.’s Form S-3) and incorporated herein by reference. |
| | 4 | .2 | | — | | Trust Company, N.A., as Trustee, dated as of January 17, 2001 (filed on March 12, 2001 as Exhibit 4(j) to The Williams Companies, Inc.’s Form 10-K) and incorporated herein by reference. |
| | 4 | .3 | | — | | Fifth Supplemental Indenture between Williams and Bank One Trust Company, N.A., as Trustee, dated as of January 17, 2001 (filed on March 12, 2001 as Exhibit 4(k) to The Williams Companies, Inc.’sForm 10-K) and incorporated herein by reference. |
| | 4 | .4 | | — | | Seventh Supplemental Indenture dated March 19, 2002, between The Williams Companies, Inc. as Issuer and Bank One Trust Company, National Association, as Trustee (filed on May 9, 2002 as Exhibit 4.1 to The Williams Companies, Inc.’s Form 10-Q) and incorporated herein by reference. |
149
| | | | | | | |
Exhibit
| | | | |
No. | | | | Description |
| |
| | 4 | .5 | | — | | Form of Senior Debt Indenture between Williams Holdings of Delaware, Inc. and Citibank, N.A., as Trustee (filed on October 18, 1995 as Exhibit 4.1 to Williams Holdings of Delaware, Inc.’s Form 10-Q) and incorporated herein by reference. |
| | 4 | .6 | | — | | First Supplemental Indenture dated as of July 31, 1999, among Williams Holdings of Delaware, Inc., Citibank, N.A., as Trustee (filed on March 28, 2000 as Exhibit 4(o) to The Williams Companies, Inc.’s Form 10-K) and incorporated herein by reference. |
| | 4 | .7 | | — | | Senior Indenture dated February 25, 1997, between MAPCO Inc. and Bank One Trust Company, N.A. (formerly The First National Bank of Chicago), as Trustee (filed February 25, 1997 as Exhibit 4.4.1 to MAPCO Inc.’s Amendment No. 1 to Form S-3) and incorporated herein by reference. |
| | 4 | .8 | | — | | Supplemental Indenture No. 1 dated March 5, 1997, between MAPCO Inc. and Bank One Trust Company, N.A. (formerly The First National Bank of Chicago), as Trustee (filed as Exhibit 4(o) to MAPCO Inc.’s Form 10-K for the fiscal year ended December 31, 1997) and incorporated herein by reference. |
| | 4 | .9 | | — | | Supplemental Indenture No. 2 dated March 5, 1997, between MAPCO Inc. and Bank One Trust Company, N.A. (formerly The First National Bank of Chicago), as Trustee (filed as Exhibit 4(p) to MAPCO Inc.’s Form 10-K for the fiscal year ended December 31, 1997) and incorporated herein by reference. |
| | 4 | .10 | | — | | Supplemental Indenture No. 3 dated March 31, 1998, among MAPCO Inc., Williams Holdings of Delaware, Inc. and Bank One Trust Company, N.A. (formerly The First National Bank of Chicago), as Trustee (filed as Exhibit 4(j) to Williams Holdings of Delaware, Inc.’s Form 10-K for the fiscal year ended December 31, 1998) and incorporated herein by reference. |
| | 4 | .11 | | — | | Supplemental Indenture No. 4 dated as of July 31, 1999, among Williams Holdings of Delaware, Inc., Williams and Bank One Trust Company, N.A. (formerly The First National Bank of Chicago), as Trustee (filed on March 28, 2000 as Exhibit 4(q) to The Williams Companies, Inc.’s Form 10-K) and incorporated herein by reference. |
| | 4 | .12 | | — | | Indenture dated as of May 28, 2003, by and between The Williams Companies, Inc. and JPMorgan Chase Bank, as Trustee for the issuance of the 5.50% Junior Subordinated Convertible Debentures due 2033 (filed on August 12, 2003 as Exhibit 4.2 to The Williams Companies, Inc.’s Form 10-Q) and incorporated herein by reference. |
| | 4 | .13 | | — | | Amended and Restated Rights Agreement dated September 21, 2004 by and between The Williams Companies, Inc. and EquiServe Trust Company, N.A., as Rights Agent (filed on September 24, 2004 as Exhibit 4.1 to The Williams Companies, Inc.’s Form 8-K) and incorporated herein by reference. |
| | 4 | .14 | | — | | Amendment No. 1 dated May 18, 2007 to the Amended and Restated Rights Agreement dated September 21, 2004 (filed on May 22, 2007 as Exhibit 4.1 to The Williams Companies, Inc.’s Form 8-K) and incorporated herein by reference. |
| | 4 | .15 | | — | | Amendment No. 2 dated October 12, 2007 to the Amended and Restated Rights Agreement dated September 21, 2004 (filed on October 15, 2007 as Exhibit 4.1 to The Williams Companies, Inc.’sForm 8-K) and incorporated herein by reference. |
| | 4 | .16 | | — | | Senior Indenture, dated as of November 30, 1995, between Northwest Pipeline Corporation and Chemical Bank, Trustee with regard to Northwest Pipeline’s 7.125% Debentures, due 2025 (filed September 14, 1995 as Exhibit 4.1 to Northwest Pipeline’s Form S-3) and incorporated herein by reference. |
| | 4 | .17 | | — | | Indenture dated as of June 22, 2006, between Northwest Pipeline Corporation and JPMorgan Chase Bank, N.A., as Trustee, with regard to Northwest Pipeline’s $175 million aggregate principal amount of 7.00% Senior Notes due 2016 (filed on June 23, 2006 as Exhibit 4.1 to Northwest Pipeline’sForm 8-K) and incorporated herein by reference. |
| | 4 | .18 | | — | | Indenture, dated as of April 5, 2007, between Northwest Pipeline Corporation and The Bank of New York (filed on April 5, 2007 as Exhibit 4.1 to Northwest Pipeline Corporation’s Form 8-K) (Commission File number 001-07414) and incorporated herein by reference. |
150
| | | | | | | |
Exhibit
| | | | |
No. | | | | Description |
| |
| | 4 | .19 | | — | | Registration Rights Agreement, dated as of April 5, 2007, among Northwest Pipeline Corporation and Greenwich Capital Markets, Inc. and Banc of America Securities LLC, acting on behalf of themselves and the several initial purchasers listed on Schedule I thereto (filed on April 6, 2007 as Exhibit 10.1 to Northwest Pipeline Corporation’sForm 8-K) and incorporated herein by reference. |
| | 4 | .20 | | — | | Indenture dated May 22, 2008, between Northwest Pipeline GP and The Bank of New York Trust Company, N.A., as Trustee (filed on May 23, 2008 as Exhibit 4.1 to Northwest Pipeline GP’sForm 8-K) and incorporated herein by reference. |
| | 4 | .21 | | — | | Registration Rights Agreement, dated as of May 23, 2008, among Northwest Pipeline GP and Banc of America Securities, LLC, BNP Paribas Securities Corp, and Greenwich Capital Markets, Inc., acting on behalf of themselves and the several initial purchasers listed on Schedule I thereto (filed on May 23, 2008 as Exhibit 10.1 to Northwest Pipeline GP’s Form 8-K) and incorporated herein by reference. |
| | 4 | .22 | | — | | Senior Indenture dated as of July 15, 1996 between Transcontinental Gas Pipe Line Corporation and Citibank, N.A., as Trustee (filed on April 2, 1996 as Exhibit 4.1 to Transcontinental Gas Pipe Line Corporation’s Form S-3) and incorporated herein by reference. |
| | 4 | .23 | | — | | Senior Indenture dated as of January 16, 1998 between Transcontinental Gas Pipe Line Corporation and Citibank, N.A., as Trustee (filed on September 8, 1997 as Exhibit 4.1 to Transcontinental Gas Pipe Line Corporation’s Form S-3) and incorporated herein by reference. |
| | 4 | .24 | | — | | Indenture dated as of August 27, 2001 between Transcontinental Gas Pipe Line Corporation and Citibank, N.A., as Trustee (filed on November 8, 2001 as Exhibit 4.1 to Transcontinental Gas Pipe Line Corporation’s Form S-4) and incorporated herein by reference. |
| | 4 | .25 | | — | | Indenture dated as of July 3, 2002 between Transcontinental Gas Pipe Line Corporation and Citibank, N.A., as Trustee (filed August 14, 2002 as Exhibit 4.1 to The Williams Companies Inc.’s Form 10-Q) and incorporated herein by reference. |
| | 4 | .26 | | — | | Indenture dated December 17, 2004 between Transcontinental Gas Pipe Line Corporation and JPMorgan Chase Bank, N.A., as Trustee (filed on December 21, 2004 as Exhibit 4.1 to Transcontinental Gas Pipe Line Corporation’s Form 8-K) and incorporated herein by reference. |
| | 4 | .27 | | — | | Indenture dated as of April 11, 2006, between Transcontinental Gas Pipe Line Corporation and JPMorgan Chase Bank, N.A., as Trustee with regard to Transcontinental Gas Pipe Line’s $200 million aggregate principal amount of 6.4% Senior Note due 2016 (filed on April 11, 2006 as Exhibit 4.1 to Transcontinental Gas Pipe Line Corporation’s Form 8-K) and incorporated herein by reference. |
| | 4 | .28 | | — | | Indenture dated May 22, 2008, between Transcontinental Gas Pipe Line Corporation and The Bank of New York Trust Company, N.A., as Trustee (filed on May 23, 2008 as Exhibit 4.1 to Transcontinental Gas Pipe Line Corporation’s Form 8-K) and incorporated herein by reference. |
| | 4 | .29 | | — | | Registration Rights Agreement, dated as of May 22, 2008, among Transcontinental Gas Pipe Line Corporation and Banc of America Securities LLC, Greenwich Capital Markets, Inc., and J. P. Morgan Securities Inc., acting on behalf of themselves and the several initial purchasers listed on Schedule I thereto (filed on May 23, 2008 as Exhibit 10.1 to Transcontinental Gas Pipe Line Corporation’s
Form 8-K) and incorporated herein by reference. |
| | 4 | .30 | | — | | Indenture dated June 20, 2006, by and among Williams Partners L.P., Williams Partners Finance Corporation and JPMorgan Chase Bank, N.A. (filed on June 20, 2006 as Exhibit 4.1 to Williams Partners L.P. Form 8-K) and incorporated herein by reference. |
| | 4 | .31 | | — | | Indenture dated December 13, 2006, by and among Williams Partners L.P., Williams Partners Finance Corporation and The Bank of New York (filed on December 19, 2006 as Exhibit 4.1 to Williams Partners L.P. Form 8-K) and incorporated herein by reference. |
| | 10 | .1* | | — | | The Williams Companies Amended and Restated Retirement Restoration Plan effective January 1, 2008. |
| | 10 | .2 | | — | | The Williams Companies, Inc. Stock Plan for Non-Officer Employees (filed on March 27, 1996 as Exhibit 10(iii)(g) to The Williams Companies, Inc.’s Form 10-K) and incorporated herein by reference. |
151
| | | | | | | |
Exhibit
| | | | |
No. | | | | Description |
| |
| | 10 | .3 | | — | | The Williams Companies, Inc. 1996 Stock Plan (filed on March 27, 1996 as Exhibit A to The Williams Companies, Inc.’s Proxy Statement) and incorporated herein by reference. |
| | 10 | .4 | | — | | The Williams Companies, Inc. 1996 Stock Plan for Non-employee Directors (filed on March 27, 1996 as Exhibit B to The Williams Companies, Inc.’s Proxy Statement) and incorporated herein by reference. |
| | 10 | .5 | | — | | Form of Director and Officer Indemnification Agreement (filed on September 24, 2008 as Exhibit 10.1 to The Williams Companies, Inc.’s Form 8-K) and incorporated herein by reference. |
| | 10 | .6 | | — | | Form of 2008 Performance-Based Restricted Stock Unit Agreement among Williams and certain employees and officers (filed on February 29, 2008 as Exhibit 99.1 to The Williams Companies, Inc.’s Form 8-K) and incorporated herein by reference. |
| | 10 | .7 | | — | | Form of 2008 Restricted Stock Unit Agreement among Williams and certain employees and officers (filed on February 29, 2008 as Exhibit 99.2 to The Williams Companies, Inc.’s Form 8-K) and incorporated herein by reference. |
| | 10 | .8 | | — | | Form of 2008 Nonqualified Stock Option Agreement among Williams and certain employees and officers (filed on February 29, 2008 as Exhibit 99.1 to The Williams Companies, Inc.’s Form 8-K) and incorporated herein by reference. |
| | 10 | .9* | | — | | Form of 2008 Restricted Stock Unit Agreement among Williams and non-management directors. |
| | 10 | .10 | | — | | The Williams Companies, Inc. 2002 Incentive Plan as amended and restated effective as of January 23, 2004 (filed on August 5, 2004 as Exhibit 10.1 to The Williams Companies, Inc.’s Form 10-Q) and incorporated herein by reference. |
| | 10 | .11* | | — | | Amendment No. 1 to The Williams Companies, Inc. 2002 Incentive Plan. |
| | 10 | .12* | | — | | Amendment No. 2 to The Williams Companies, Inc. 2002 Incentive Plan. |
| | 10 | .13 | | — | | The Williams Companies, Inc. 2007 Incentive Plan (filed on April 10, 2007 as Appendix C to The Williams Companies, Inc.’s Definitive Proxy Statement 14A) and incorporated herein by reference. |
| | 10 | .14* | | — | | Amendment No. 1 to The Williams Companies, Inc. 2007 Incentive Plan. |
| | 10 | .15 | | — | | The Williams Companies, Inc. Employee Stock Purchase Plan (filed on April 10, 2007 as Appendix D to The Williams Companies, Inc.’s Definitive Proxy Statement 14A) and incorporated herein by reference. |
| | 10 | .16* | | — | | Amendment No. 1 to The Williams Companies, Inc. Employee Stock Purchase Plan. |
| | 10 | .17* | | — | | Amendment No. 2 to The Williams Companies, Inc. Employee Stock Purchase Plan. |
| | 10 | .18* | | — | | Amended and Restated Change-in-Control Severance Agreement between the Company and certain executive officers. |
| | 10 | .19* | | — | | The Williams Companies, Inc. Severance Pay Plan. |
| | 10 | .20* | | — | | Confidential Separation Agreement and Release between The Williams Companies, Inc. and Michael P. Johnson dated April 2, 2008 (filed on May 1, 2008 as Exhibit 10.4 to The Williams Companies, Inc.’s Form 10-Q) and incorporated herein by reference. |
| | 10 | .21 | | — | | Amendment Agreement, dated May 9, 2007, among The Williams Companies, Inc., Williams Partners L.P., Northwest Pipeline Corporation, Transcontinental Gas Pipe Line Corporation, certain banks, financial institutions and other institutional lenders and Citibank, N.A., as administrative agent (filed on May 15, 2007 as Exhibit 10.1 to The Williams Companies, Inc.’s Form 8-K) and incorporated herein by reference. |
| | 10 | .22 | | — | | Amendment Agreement dated November 21, 2007 among The Williams Companies, Inc., Williams Partners L.P., Northwest Pipeline GP, Transcontinental Gas Pipe Line Corporation, certain banks, financial institutions and other institutional lenders and Citibank, N.A., as administrative agent (filed on November 28, 2007 as Exhibit 10.1 to The Williams Companies, Inc.’s Form 8-K) and incorporated herein by reference. |
| | 10 | .23 | | — | | Credit Agreement dated as of May 1, 2006, among The Williams Companies, Inc., Northwest Pipeline Corporation, Transcontinental Gas Pipe Line Corporation, and Williams Partners L.P., as Borrowers and Citibank, N.A., as Administrative Agent (filed on May 1, 2006 as Exhibit 10.1 to The Williams Companies, Inc.’s Form 8-K) and incorporated herein by reference. |
152
| | | | | | | |
Exhibit
| | | | |
No. | | | | Description |
| |
| | 10 | .24 | | — | | U.S. $400,000,000 Five Year Credit Agreement dated January 20, 2005 among The Williams Companies, Inc., as Borrower, the Initial Lenders named herein, as Initial Lenders, the Initial Issuing Banks named herein, as Initial Issuing Banks and Citibank, N.A., as Agent (filed on January 26, 2005 as Exhibit 10.3 to The Williams Companies, Inc.’s Form 8-K) and incorporated herein by reference. |
| | 10 | .25 | | — | | U.S. $100,000,000 Five Year Credit Agreement dated January 20, 2005 among The Williams Companies, Inc., as Borrower, the Initial Lenders named herein, as Initial Lenders, the Initial Issuing Banks named herein, as Initial Issuing Banks and Citibank, N.A., as Agent (filed on January 26, 2005 as Exhibit 10.4 to The Williams Companies, Inc.’s Form 8-K) and incorporated herein by reference. |
| | 10 | .26 | | — | | U.S. $500,000,000 Five Year Credit Agreement dated September 20, 2005 among The Williams Companies, Inc., as Borrower, the Initial Lenders named herein, as Initial Lenders, the Initial Issuing Banks named herein, as Initial Issuing Banks and Citibank, N.A., as Agent (filed on September 26, 2005 as Exhibit 10.1 to The Williams Companies, Inc.’s Form 8-K) and incorporated herein by reference. |
| | 10 | .27 | | — | | U.S. $200,000,000 Five Year Credit Agreement dated September 20, 2005 among The Williams Companies, Inc., as Borrower, the Initial Lenders named herein, as Initial Lenders, the Initial Issuing Banks named herein, as Initial Issuing Banks and Citibank, N.A., as Agent (filed on September 26, 2005 as Exhibit 10.2 to The Williams Companies, Inc.’s Form 8-K) and incorporated herein by reference. |
| | 10 | .28 | | — | | Master Professional Services Agreement dated as of June 1, 2004, by and between The Williams Companies, Inc. and International Business Machines Corporation (filed on August 5, 2004 as Exhibit 10.2 to The Williams Companies, Inc.’s Form 10-Q) and incorporated herein by reference. |
| | 10 | .29 | | — | | Amendment No. 1 to the Master Professional Services Agreement dated June 1, 2004, by and between The Williams Companies, Inc. and International Business Machines Corporation made as of June 1, 2004 (filed on August 5, 2004 as Exhibit 10.3 to The Williams Companies, Inc.’s Form 10-Q) and incorporated herein by reference. |
| | 10 | .30 | | — | | Purchase and Sale Agreement, dated November 16, 2006, by and among Williams Energy Services, LLC, Williams Field Services Group, LLC, Williams Field Services Company, LLC, Williams Partners GP LLC, Williams Partners L.P. and Williams Partners Operating, LLC (filed on November 21, 2006 as Exhibit 2.1 to Williams Partners L.P.’s Form 8-K) and incorporated herein by reference. |
| | 10 | .31 | | — | | Credit Agreement dated February 23, 2007 among Williams Production RMT Company, Williams Production Company, LLC, Citibank, N.A., Citigroup Energy Inc., Calyon New York Branch, and the banks named therein, and Citigroup Global Markets Inc. and Calyon New York Branch as joint lead arrangers and co-book runners (filed on February 28, 2007 as Exhibit 10.41 to The Williams Companies, Inc.’s Form 10-K) and incorporated herein by reference. |
| | 10 | .32 | | — | | Asset Purchase Agreement between Williams Power Company, Inc. and Bear Energy LP dated May 20, 2007 (filed on May 22, 2007 as Exhibit 99.1 to The Williams Companies, Inc.’s Form 8-K) and incorporated herein by reference. |
| | 10 | .33 | | — | | Credit Agreement dated as of December 11, 2007, by and among Williams Partners L.P., the lenders party hereto, Citibank, N.A., as Administrative Agent and Issuing Bank, and The Bank of Nova Scotia, as Swingline Lender (filed on December 17, 2007 as Exhibit 10.5 to Williams Partners L.P. Form 8-K) and incorporated herein by reference. |
| | 10 | .34 | | — | | Contribution Conveyance and Assumption Agreement, dated January 24, 2008, among Williams Pipeline Partners L.P., Williams Pipeline Operating LLC, WPP Merger LLC, Williams Pipeline Partners Holdings LLC, Northwest Pipeline GP, Williams Pipeline GP LLC, Williams Gas Pipeline Company, LLC, WGPC Holdings LLC and Williams Pipeline Services Company (filed on January 30, 2008 as Exhibit 10.2 to 1 to Williams Pipeline Partners L.P.’s Form 8-K) and incorporated herein by reference. |
| | 12* | | | — | | Computation of Ratio of Earnings to Combined Fixed Charges and Preferred Stock Dividend Requirements. |
| | 14 | | | — | | Code of Ethics (filed on March 15, 2004 as Exhibit 14 to The Williams Companies, Inc.’s Form 10-K) and incorporated herein by reference. |
| | 21* | | | — | | Subsidiaries of the registrant. |
153
| | | | |
Exhibit No. | | | | Description |
| | |
3.1 | | — | | Amended and Restated Certificate of Incorporation, as supplemented (filed on May 26, 2010 as Exhibit 3.1 to the Company’s Form 8-K) and incorporated herein by reference. |
| | |
3.2 | | — | | By-Laws (filed on May 26, 2010 as Exhibit
3.2 to the Company’s Current Report on Form 8-K) and incorporated herein by reference. |
| | |
4.1 | | — | | Form of Senior Debt Indenture between Williams and Bank One Trust company, N.A. (formerly The First National Bank of Chicago), as Trustee (filed on September 8, 1997 as Exhibit 4.1 to The Williams Companies, Inc.’s Form S-3) and incorporated herein by reference. |
| | |
4.2 | | — | | Fifth Supplemental Indenture between Williams and Bank One Trust Company, N.A., as Trustee, dated as of January 17, 2001 (filed on March 12, 2001 as Exhibit 4(k) to The Williams Companies, Inc.’s Form 10-K) and incorporated herein by reference. |
| | |
4.3 | | — | | Seventh Supplemental Indenture dated March 19, 2002, between The Williams Companies, Inc. as Issuer and Bank One Trust Company, National Association, as Trustee (filed on May 9, 2002 as Exhibit 4.1 to The Williams Companies, Inc.’s Form 10-Q) and incorporated herein by reference. |
| | |
4.4 | | — | | Senior Indenture dated February 25, 1997, between MAPCO Inc. and Bank One Trust Company, N.A. (formerly The First National Bank of Chicago), as Trustee (filed February 25, 1997 as Exhibit 4.4.1 to MAPCO Inc.’s Amendment No. 1 to Form S-3) and incorporated herein by reference. |
150
| | | | |
Exhibit No. | | | | Description |
| | |
4.5 | | — | | Supplemental Indenture No. 1 dated March 5, 1997, between MAPCO Inc. and Bank One Trust Company, N.A. (formerly The First National Bank of Chicago), as Trustee (filed as Exhibit 4(o) to MAPCO Inc.’s Form 10-K for the fiscal year ended December 31, 1997) and incorporated herein by reference. |
| | |
4.6 | | — | | Supplemental Indenture No. 2 dated March 5, 1997, between MAPCO Inc. and Bank One Trust Company, N.A. (formerly The First National Bank of Chicago), as Trustee (filed as Exhibit 4(p) to MAPCO Inc.’s Form 10-K for the fiscal year ended December 31, 1997) and incorporated herein by reference. |
| | |
4.7 | | — | | Supplemental Indenture No. 3 dated March 31, 1998, among MAPCO Inc., Williams Holdings of Delaware, Inc. and Bank One Trust Company, N.A. (formerly The First National Bank of Chicago), as Trustee (filed as Exhibit 4(j) to Williams Holdings of Delaware, Inc.’s Form 10-K for the fiscal year ended December 31, 1998) and incorporated herein by reference. |
| | |
4.8 | | — | | Supplemental Indenture No. 4 dated as of July 31, 1999, among Williams Holdings of Delaware, Inc., Williams and Bank One Trust Company, N.A. (formerly The First National Bank of Chicago), as Trustee (filed on March 28, 2000 as Exhibit 4(q) to The Williams Companies, Inc.’s Form 10-K) and incorporated herein by reference. |
| | |
4.9 | | — | | Indenture dated as of May 28, 2003, by and between The Williams Companies, Inc. and JPMorgan Chase Bank, as Trustee for the issuance of the 5.50% Junior Subordinated Convertible Debentures due 2033 (filed on August 12, 2003 as Exhibit 4.2 to The Williams Companies, Inc.’s Form 10-Q) and incorporated herein by reference. |
| | |
4.10 | | — | | Indenture dated as of March 5, 2009, among The Williams Companies, Inc. and The Bank of New York Mellon Trust Company, N.A., as Trustee (filed on March 11, 2009 as Exhibit 4.1 to The Williams Companies, Inc.’s Form 8-K) and incorporated herein by reference. |
| | |
4.11 | | — | | Eleventh Supplemental Indenture dated as of February 1, 2010 between The Williams Companies, Inc. and The Bank of New York Mellon Trust Company, N.A. (filed on February 2, 2010 as Exhibit 4.1 to The Williams Companies, Inc.’s Form 8-K) and incorporated herein by reference. |
| | |
4.12 | | — | | First Supplemental Indenture dated as of February 1, 2010 between The Williams Companies, Inc. and The Bank of New York Mellon Trust Company, N.A. (filed on February 2, 2010 as Exhibit 4.2 to The Williams Companies, Inc.’s Form 8-K) and incorporated herein by reference. |
| | |
4.13 | | — | | Fifth Supplemental Indenture dated as of February 1, 2010 between The Williams Companies, Inc. and The Bank of New York Mellon Trust Company, N.A. (filed on February 2, 2010 as Exhibit 4.3 to The Williams Companies, Inc.’s Form 8-K) and incorporated herein by reference. |
| | |
4.14 | | — | | Amended and Restated Rights Agreement dated September 21, 2004 by and between The Williams Companies, Inc. and EquiServe Trust Company, N.A., as Rights Agent (filed on September 24, 2004 as Exhibit 4.1 to The Williams Companies, Inc.’s Form 8-K) and incorporated herein by reference. |
| | |
4.15 | | — | | Amendment No. 1 dated May 18, 2007 to the Amended and Restated Rights Agreement dated September 21, 2004 (filed on May 22, 2007 as Exhibit 4.1 to The Williams Companies, Inc.’s Form 8-K) and incorporated herein by reference. |
| | |
4.16 | | — | | Amendment No. 2 dated October 12, 2007 to the Amended and Restated Rights Agreement dated September 21, 2004 (filed on October 15, 2007 as Exhibit 4.1 to The Williams Companies, Inc.’s Form 8-K) and incorporated herein by reference. |
151
| | | | |
Exhibit No. | | | | |
| | |
| 23 | .1*4.17 | | — | | Senior Indenture, dated as of November 30, 1995, between Northwest Pipeline Corporation and Chemical Bank, Trustee with regard to Northwest Pipeline’s 7.125% Debentures, due 2025 (filed September 14, 1995 as Exhibit 4.1 to Northwest Pipeline’s Form S-3) and incorporated herein by reference. |
| | |
4.18 | | — | | Indenture dated as of June 22, 2006, between Northwest Pipeline Corporation and JPMorgan Chase Bank, N.A., as Trustee, with regard to Northwest Pipeline’s $175 million aggregate principal amount of 7.00% Senior Notes due 2016 (filed on June 23, 2006 as Exhibit 4.1 to Northwest Pipeline’s Form 8-K) and incorporated herein by reference. |
| | |
4.19 | | — | | Indenture, dated as of April 5, 2007, between Northwest Pipeline Corporation and The Bank of New York (filed on April 5, 2007 as Exhibit 4.1 to Northwest Pipeline Corporation’s Form 8-K) (Commission File number 001-07414) and incorporated herein by reference. |
| | |
4.20 | | — | | Indenture dated May 22, 2008, between Northwest Pipeline GP and The Bank of New York Trust Company, N.A., as Trustee (filed on May 23, 2008 as Exhibit 4.1 to Northwest Pipeline GP’s Form 8-K) and incorporated herein by reference. |
| | |
4.21 | | — | | Senior Indenture dated as of July 15, 1996 between Transcontinental Gas Pipe Line Corporation and Citibank, N.A., as Trustee (filed on April 2, 1996 as Exhibit 4.1 to Transcontinental Gas Pipe Line Corporation’s Form S-3) and incorporated herein by reference. |
| | |
4.22 | | — | | Indenture dated as of August 27, 2001 between Transcontinental Gas Pipe Line Corporation and Citibank, N.A., as Trustee (filed on November 8, 2001 as Exhibit 4.1 to Transcontinental Gas Pipe Line Corporation’s Form S-4) and incorporated herein by reference. |
| | |
4.23 | | — | | Indenture dated as of July 3, 2002 between Transcontinental Gas Pipe Line Corporation and Citibank, N.A., as Trustee (filed August 14, 2002 as Exhibit 4.1 to The Williams Companies Inc.’s Form 10-Q) and incorporated herein by reference. |
| | |
4.24 | | — | | Indenture dated as of April 11, 2006, between Transcontinental Gas Pipe Line Corporation and JPMorgan Chase Bank, N.A., as Trustee with regard to Transcontinental Gas Pipe Line’s $200 million aggregate principal amount of 6.4% Senior Note due 2016 (filed on April 11, 2006 as Exhibit 4.1 to Transcontinental Gas Pipe Line Corporation’s Form 8-K) and incorporated herein by reference. |
| | |
4.25 | | — | | Indenture dated May 22, 2008, between Transcontinental Gas Pipe Line Corporation and The Bank of New York Trust Company, N.A., as Trustee (filed on May 23, 2008 as Exhibit 4.1 to Transcontinental Gas Pipe Line Corporation’s Form 8-K) and incorporated herein by reference. |
| | |
4.26 | | — | | Indenture, dated as of August 12, 2011, between Transcontinental Gas Pipe Line Company, LLC and The Bank of New York Mellon Trust Company, N.A., as trustee (filed on August 12, 2011 as Exhibit 4.1 to Transcontinental Gas Pipe Line Company, LLC’s Form 8-K (File No. 001-07584)) and incorporated herein by reference. |
| | |
4.27 | | — | | Indenture dated December 13, 2006, by and among Williams Partners L.P., Williams Partners Finance Corporation and The Bank of New York (filed on December 19, 2006 as Exhibit 4.1 to Williams Partners L.P. Form 8-K) and incorporated herein by reference. |
| | |
4.28 | | — | | Indenture dated as of February 9, 2010, between Williams Partners L.P. and The Bank of New York Mellon Trust Company, N.A. (filed on February 10, 2010 as Exhibit 4.1 to The Williams Companies, Inc.’s Form 8-K) and incorporated herein by reference. |
| | |
4.29 | | — | | Indenture, dated as of November 9, 2010, between Williams Partners L.P. and The Bank of New York Mellon Trust Company, N.A., as trustee (filed on November 12, 2010 as Exhibit 4.1 to Williams Partners L.P.’s current report on Form 8-K (File No. 001-32599)) and incorporated herein by reference. |
152
| | | | |
Exhibit No. | | | | Description |
| | |
4.30 | | — | | First Supplemental Indenture, dated as of November 9, 2010, between Williams Partners L.P. and The Bank of New York Mellon Trust Company, N.A., as trustee (filed on November 12, 2010 as Exhibit 4.1 to Williams Partners L.P.’s current report on Form 8-K (File No. 001-32599)) and incorporated herein by reference. |
| | |
4.31 | | — | | Second Supplemental Indenture, dated as of November 17, 2011, between Williams Partners L.P. and The Bank of New York Mellon Trust Company, N.A., as trustee (filed November 18, 2011 as Exhibit 4.1 to Williams Partners L.P.’s current report on Form 8-K (File No. 001-32599)) and incorporated herein by reference. |
| | |
10.1§ | | — | | The Williams Companies Amended and Restated Retirement Restoration Plan effective January 1, 2008 (filed on February 25, 2009 as Exhibit 10.1 to The Williams Companies, Inc.’s Form 10-K) and incorporated herein by reference. |
| | |
10.2§ | | — | | Form of Director and Officer Indemnification Agreement (filed on September 24, 2008 as Exhibit 10.1 to The Williams Companies, Inc.’s Form 8-K) and incorporated herein by reference. |
| | |
10.3§ | | — | | Form of 2011 Restricted Stock Unit Agreement among Williams and certain employees and officers (filed on February 24, 2011 as Exhibit 10.6 to The Williams Companies, Inc.’s Form 10-K) and incorporated herein by reference. |
| | |
10.4*§ | | — | | Form of 2012 Performance-Based Restricted Stock Unit Agreement among Williams and certain employees and officers. |
| | |
10.5*§ | | — | | Form of 2012 Restricted Stock Unit Agreement among Williams and certain employees and officers. |
| | |
10.6*§ | | — | | Form of 2012 Nonqualified Stock Option Agreement among Williams and certain employees and officers. |
| | |
10.7* | | — | | Form of 2011 Restricted Stock Unit Agreement among Williams and nonmanagement directors. |
| | |
10.8 | | — | | The Williams Companies, Inc. 1996 Stock Plan for Nonemployee Directors (filed on March 27, 1996 as Exhibit B to The Williams Companies, Inc.’s Proxy Statement) and incorporated herein by reference. |
| | |
10.9§ | | — | | The Williams Companies, Inc. 2002 Incentive Plan as amended and restated effective as of January 23, 2004 (filed on August 5, 2004 as Exhibit 10.1 to The Williams Companies, Inc.’s Form 10-Q) and incorporated herein by reference. |
| | |
10.10§ | | — | | Amendment No. 1 to The Williams Companies, Inc. 2002 Incentive Plan (filed on February 25, 2009 as Exhibit 10.11 to The Williams Companies, Inc.’s Form 10-K) and incorporated herein by reference. |
| | |
10.11§ | | — | | Amendment No. 2 to The Williams Companies, Inc. 2002 Incentive Plan (filed on February 25, 2009 as Exhibit 10.12 to The Williams Companies, Inc.’s Form 10-K) and incorporated herein by reference. |
| | |
10.12*§ | | — | | The Williams Companies, Inc. 2007 Incentive Plan as amended and restated effective January 19, 2012. |
| | |
10.13§ | | — | | Amended and Restated Change-in-Control Severance Agreement between the Company and certain executive officers (Tier I Executives) (filed on February 25, 2009 as Exhibit 10.18 to The Williams Companies, Inc.’s Form 10-K) and incorporated herein by reference. |
| | |
10.14*§ | | — | | Amended and Restated Change-in-Control Severance Agreement between the Company and certain executive officers (Tier II Executives). |
153
| | | | |
Exhibit No. | | | | Description |
| | |
10.15 | | — | | Contribution Agreement, dated as of January 15, 2010, by and among Williams Energy Services, LLC, Williams Gas Pipeline Company, LLC, WGP Gulfstream Pipeline Company, L.L.C., Williams Partners GP LLC, Williams Partners L.P., Williams Partners Operating LLC and, for a limited purpose, The Williams Companies, Inc, including exhibits thereto (filed on January 19, 2010 as Exhibit 10.1 to The Williams Companies Inc.’s Form 8-K) and incorporated herein by reference. |
| | |
10.16 | | — | | Credit Agreement, dated as of June 3, 2011, by and among The Williams Companies, Inc., the lenders named therein, and Citibank, N.A., as Administrative Agent (filed on August 4, 2011 as Exhibit 10.1 to The Williams Companies, Inc.’s Form 10-Q) and incorporated herein by reference. |
| | |
10.17 | | — | | First Amendment to The Williams Companies, Inc. June 3, 2011 Credit Agreement, dated as of November 1, 2011, by and among The Williams Companies, Inc., the lenders named therein, and Citibank, N.A. as Administrative Agent (filed on November 1, 2011 as Exhibit 10.1 to The Williams Companies, Inc.’s Form 8-K) and incorporated herein by reference |
| | |
10.18 | | — | | Credit Agreement, dated as of June 3, 2011, by and among Williams Partners L.P., Northwest Pipeline GP, Transcontinental Gas Pipe Line Company, LLC, as co-borrowers, the lenders named therein, and Citibank N.A., as Administrative Agent (filed on August 4, 2011 as Exhibit 10.2 to The Williams Companies, Inc.’s Form 8-K) and incorporated herein by reference. |
| | |
10.19* | | — | | Separation and Distribution Agreement, dated as of December 30, 2011, between The Williams Companies, Inc. and WPX Energy, Inc. |
| | |
10.20 | | — | | Employee Matters Agreement, dated as of December 30, 2011, between The Williams Companies, Inc. and WPX Energy, Inc. (filed on January 6, 2012 as Exhibit 10.2 to The Williams Companies, Inc.’s Form 8-K) and incorporated herein by reference. |
| | |
10.21 | | — | | Tax Sharing Agreement, dated as of December 30, 2011, between The Williams Companies, Inc. and WPX Energy, Inc. (filed on January 6, 2012 as Exhibit 10.3 to The Williams Companies, Inc.’s Form 8-K) and incorporated herein by reference. |
| | |
12* | | — | | Computation of Ratio of Earnings to Combined Fixed Charges and Preferred Stock Dividend Requirements. |
| | |
14 | | — | | Code of Ethics for Senior Officers (filed on March 15, 2004 as Exhibit 14 to The Williams Companies, Inc.’s Form 10-K) and incorporated herein by reference. |
| | |
21* | | — | | Subsidiaries of the registrant. |
| | |
23.1* | | — | | Consent of Independent Registered Public Accounting Firm, Ernst & Young LLP. |
| 23 | .2* |
23.2* | | — | | Consent of Independent Petroleum Engineers and Geologists, Netherland, SewellRegistered Public Accounting Firm, Deloitte & Associates, Inc.Touche LLP. |
| 23 | .3* |
24* | | — | | ConsentPower of Independent Petroleum Engineers and Geologists, Miller and Lents, LTD.Attorney. |
| 24* | |
31.1* | | | — | | Power of Attorney. |
| 31 | .1* | | — | | Certification of the Chief Executive Officer pursuant to Rules 13a-14(a) and 15d-14(a) promulgated under the Securities Exchange Act of 1934, as amended, and Item 601(b)(31) of Regulation S-K, as adopted pursuant to Section 302 of the Sarbanes-Oxley Act of 2002. |
| 31 | .2* |
31.2* | | — | | Certification of the Chief Financial Officer pursuant to Rules 13a-14(a) and 15d-14(a) promulgated under the Securities Exchange Act of 1934, as amended, and Item 601(b)(31) of Regulation S-K, as adopted pursuant to Section 302 of the Sarbanes-Oxley Act of 2002. |
154
| | | | |
| 32*Exhibit No. | | | — | Description |
| | |
32** | | — | | Certification of the Chief Executive Officer and the Chief Financial Officer pursuant to 18 U.S.C. Section 1350, as adopted pursuant to Section 906 of the Sarbanes-Oxley Act of 2002. |
| | |
*101.INS* | | — | | XBRL Instance Document |
| | Filed herewith |
101.SCH* | | — | | XBRL Taxonomy Extension Schema |
| | |
101.CAL* | | — | | XBRL Taxonomy Extension Calculation Linkbase |
| | |
101.DEF* | | — | | XBRL Taxonomy Extension Definition Linkbase |
| | |
101.LAB* | | — | | XBRL Taxonomy Extension Label Linkbase |
| | |
101.PRE* | | — | | XBRL Taxonomy Extension Presentation Linkbase |
154
§ | Management contract or compensation plan or arrangement |
SIGNATURES
Pursuant to the requirements of Section 13 or 15(d) of the Securities Exchange Act of 1934, the registrant has duly caused this report to be signed on its behalf by the undersigned, thereunto duly authorized.
The Williams Companies, Inc.
(Registrant)
| | |
THE WILLIAMS COMPANIES, INC. |
(Registrant) |
| |
By: | | /s/ S/ TED T. TIMMERMANS |
| | Ted T. Timmermans |
| | Vice President, Controller and Chief Accounting Officer |
Ted T. Timmermans
Controller
27, 2012Pursuant to the requirements of the Securities Exchange Act of 1934, this report has been signed below by the following persons on behalf of the registrant and in the capacities and on the dates indicated.
| | | | |
Signature | | Title | | Date |
| | |
/S/ ALAN S. ARMSTRONG Alan S. Armstrong | | President, Chief Executive Officer
and Director (Principal Executive Officer) | | February 27, 2012 |
| | |
/S/ DONALD R. CHAPPEL Donald R. Chappel | | Senior Vice President and Chief Financial Officer (Principal Financial Officer) | | February 27, 2012 |
| | |
/S/ TED T. TIMMERMANS Ted T. Timmermans | | Vice President, Controller and Chief Accounting Officer (Principal Accounting Officer) | | February 27, 2012 |
| | |
/S/ JOSEPH R. CLEVELAND* Joseph R. Cleveland* | | Director | | February 27, 2012 |
| | |
/S/ KATHLEEN B. COOPER* Kathleen B. Cooper* | | Director | | February 27, 2012 |
| | |
/S/ IRL F. ENGELHARDT* Irl F. Engelhardt* | | Director | | February 27, 2012 |
| | |
/S/ WILLIAM E. GREEN* William E. Green* | | Director | | February 27, 2012 |
| | |
/S/ JOHN A. HAGG* John A. Hagg* | | Director | | February 27, 2012 |
| | |
/S/ JUANITA H. HINSHAW* Juanita H. Hinshaw* | | Director | | February 27, 2012 |
| | |
/S/ FRANK T. MACINNIS* Frank T. MacInnis* | | Chairman of the Board | | February 27, 2012 |
| | |
/S/ STEVEN W. NANCE* Steven W. Nance* | | Director | | February 27, 2012 |
| | |
/S/ MURRAY D. SMITH* Murray D. Smith* | | Director | | February 27, 2012 |
| | | | | | |
Signature | | Title | | Date |
| | |
/S/ JANICE D. STONEY* Janice D. Stoney* | | Director | | February 27, 2012 |
| | |
/S/ LAURA A. SUGG* Laura A. Sugg* | | Director | | February 27, 2012 |
| | | |
*By: | | /S/ SARAH C. MILLER Sarah C. Miller Attorney-in-Fact | | | | February 27, 2012 |
INDEX TO EXHIBITS
| | | | |
Exhibit No. | | | | Description |
| | |
| 3.1 | | |
Signature
— | | Title
Amended and Restated Certificate of Incorporation, as supplemented (filed on May 26, 2010 as Exhibit 3.1 to the Company’s Form 8-K) and incorporated herein by reference. |
| | |
| 3.2 | | Date
— | | By-Laws (filed on May 26, 2010 as Exhibit 3.2 to the Company’s Current Report on Form 8-K) and incorporated herein by reference. |
| | |
| 4.1 | | — | | Form of Senior Debt Indenture between Williams and Bank One Trust company, N.A. (formerly The First National Bank of Chicago), as Trustee (filed on September 8, 1997 as Exhibit 4.1 to The Williams Companies, Inc.’s Form S-3) and incorporated herein by reference. |
| | |
| 4.2 | | — | | Fifth Supplemental Indenture between Williams and Bank One Trust Company, N.A., as Trustee, dated as of January 17, 2001 (filed on March 12, 2001 as Exhibit 4(k) to The Williams Companies, Inc.’s Form 10-K) and incorporated herein by reference. |
| | |
| 4.3 | | — | | Seventh Supplemental Indenture dated March 19, 2002, between The Williams Companies, Inc. as Issuer and Bank One Trust Company, National Association, as Trustee (filed on May 9, 2002 as Exhibit 4.1 to The Williams Companies, Inc.’s Form 10-Q) and incorporated herein by reference. |
| | |
| 4.4 | | — | | Senior Indenture dated February 25, 1997, between MAPCO Inc. and Bank One Trust Company, N.A. (formerly The First National Bank of Chicago), as Trustee (filed February 25, 1997 as Exhibit 4.4.1 to MAPCO Inc.’s Amendment No. 1 to Form S-3) and incorporated herein by reference. |
| | |
| 4.5 | | — | | Supplemental Indenture No. 1 dated March 5, 1997, between MAPCO Inc. and Bank One Trust Company, N.A. (formerly The First National Bank of Chicago), as Trustee (filed as Exhibit 4(o) to MAPCO Inc.’s Form 10-K for the fiscal year ended December 31, 1997) and incorporated herein by reference. |
| | |
| 4.6 | | — | | Supplemental Indenture No. 2 dated March 5, 1997, between MAPCO Inc. and Bank One Trust Company, N.A. (formerly The First National Bank of Chicago), as Trustee (filed as Exhibit 4(p) to MAPCO Inc.’s Form 10-K for the fiscal year ended December 31, 1997) and incorporated herein by reference. |
| | |
| 4.7 | | — | | Supplemental Indenture No. 3 dated March 31, 1998, among MAPCO Inc., Williams Holdings of Delaware, Inc. and Bank One Trust Company, N.A. (formerly The First National Bank of Chicago), as Trustee (filed as Exhibit 4(j) to Williams Holdings of Delaware, Inc.’s Form 10-K for the fiscal year ended December 31, 1998) and incorporated herein by reference. |
| | |
| 4.8 | | — | | Supplemental Indenture No. 4 dated as of July 31, 1999, among Williams Holdings of Delaware, Inc., Williams and Bank One Trust Company, N.A. (formerly The First National Bank of Chicago), as Trustee (filed on March 28, 2000 as Exhibit 4(q) to The Williams Companies, Inc.’s Form 10-K) and incorporated herein by reference. |
| | |
| 4.9 | | — | | Indenture dated as of May 28, 2003, by and between The Williams Companies, Inc. and JPMorgan Chase Bank, as Trustee for the issuance of the 5.50% Junior Subordinated Convertible Debentures due 2033 (filed on August 12, 2003 as Exhibit 4.2 to The Williams Companies, Inc.’s Form 10-Q) and incorporated herein by reference. |
| | |
| 4.10 | | — | | Indenture dated as of March 5, 2009, among The Williams Companies, Inc. and The Bank of New York Mellon Trust Company, N.A., as Trustee (filed on March 11, 2009 as Exhibit 4.1 to The Williams Companies, Inc.’s Form 8-K) and incorporated herein by reference. |
| | | | |
Exhibit No. | | | | Description |
/s/ Steven J. Malcolm
Steven J. Malcolm | | |
| 4.11 | | President, Chief Executive Officer
and Chairman of the Board
(Principal Executive Officer)— | | Eleventh Supplemental Indenture dated as of February 24, 20091, 2010 between The Williams Companies, Inc. and The Bank of New York Mellon Trust Company, N.A. (filed on February 2, 2010 as Exhibit 4.1 to The Williams Companies, Inc.’s Form 8-K) and incorporated herein by reference. |
| | |
| 4.12 | | — | | First Supplemental Indenture dated as of February 1, 2010 between The Williams Companies, Inc. and The Bank of New York Mellon Trust Company, N.A. (filed on February 2, 2010 as Exhibit 4.2 to The Williams Companies, Inc.’s Form 8-K) and incorporated herein by reference. |
| | |
| 4.13 | | — | | Fifth Supplemental Indenture dated as of February 1, 2010 between The Williams Companies, Inc. and The Bank of New York Mellon Trust Company, N.A. (filed on February 2, 2010 as Exhibit 4.3 to The Williams Companies, Inc.’s Form 8-K) and incorporated herein by reference. |
| | |
| 4.14 | | — | | Amended and Restated Rights Agreement dated September 21, 2004 by and between The Williams Companies, Inc. and EquiServe Trust Company, N.A., as Rights Agent (filed on September 24, 2004 as Exhibit 4.1 to The Williams Companies, Inc.’s Form 8-K) and incorporated herein by reference. |
| | |
| 4.15 | | — | | Amendment No. 1 dated May 18, 2007 to the Amended and Restated Rights Agreement dated September 21, 2004 (filed on May 22, 2007 as Exhibit 4.1 to The Williams Companies, Inc.’s Form 8-K) and incorporated herein by reference. |
| | |
| 4.16 | | — | | Amendment No. 2 dated October 12, 2007 to the Amended and Restated Rights Agreement dated September 21, 2004 (filed on October 15, 2007 as Exhibit 4.1 to The Williams Companies, Inc.’s Form 8-K) and incorporated herein by reference. |
| | |
| 4.17 | | — | | Senior Indenture, dated as of November 30, 1995, between Northwest Pipeline Corporation and Chemical Bank, Trustee with regard to Northwest Pipeline’s 7.125% Debentures, due 2025 (filed September 14, 1995 as Exhibit 4.1 to Northwest Pipeline’s Form S-3) and incorporated herein by reference. |
| | |
| 4.18 | | — | | Indenture dated as of June 22, 2006, between Northwest Pipeline Corporation and JPMorgan Chase Bank, N.A., as Trustee, with regard to Northwest Pipeline’s $175 million aggregate principal amount of 7.00% Senior Notes due 2016 (filed on June 23, 2006 as Exhibit 4.1 to Northwest Pipeline’s Form 8-K) and incorporated herein by reference. |
| | |
| 4.19 | | — | | Indenture, dated as of April 5, 2007, between Northwest Pipeline Corporation and The Bank of New York (filed on April 5, 2007 as Exhibit 4.1 to Northwest Pipeline Corporation’s Form 8-K) (Commission File number 001-07414) and incorporated herein by reference. |
| | |
| 4.20 | | — | | Indenture dated May 22, 2008, between Northwest Pipeline GP and The Bank of New York Trust Company, N.A., as Trustee (filed on May 23, 2008 as Exhibit 4.1 to Northwest Pipeline GP’s Form 8-K) and incorporated herein by reference. |
| | |
| 4.21 | | — | | Senior Indenture dated as of July 15, 1996 between Transcontinental Gas Pipe Line Corporation and Citibank, N.A., as Trustee (filed on April 2, 1996 as Exhibit 4.1 to Transcontinental Gas Pipe Line Corporation’s Form S-3) and incorporated herein by reference. |
| | |
| 4.22 | | — | | Indenture dated as of August 27, 2001 between Transcontinental Gas Pipe Line Corporation and Citibank, N.A., as Trustee (filed on November 8, 2001 as Exhibit 4.1 to Transcontinental Gas Pipe Line Corporation’s Form S-4) and incorporated herein by reference. |
| | |
| 4.23 | | — | | Indenture dated as of July 3, 2002 between Transcontinental Gas Pipe Line Corporation and Citibank, N.A., as Trustee (filed August 14, 2002 as Exhibit 4.1 to The Williams Companies Inc.’s Form 10-Q) and incorporated herein by reference. |
| | | | |
Exhibit No. | | | | Description |
/s/ Donald R. Chappel
Donald R. Chappel | | |
| 4.24 | | Senior Vice President and Chief
Financial Officer
(Principal Financial Officer)— | | Indenture dated as of April 11, 2006, between Transcontinental Gas Pipe Line Corporation and JPMorgan Chase Bank, N.A., as Trustee with regard to Transcontinental Gas Pipe Line’s $200 million aggregate principal amount of 6.4% Senior Note due 2016 (filed on April 11, 2006 as Exhibit 4.1 to Transcontinental Gas Pipe Line Corporation’s Form 8-K) and incorporated herein by reference. |
| | |
| 4.25 | | — | | Indenture dated May 22, 2008, between Transcontinental Gas Pipe Line Corporation and The Bank of New York Trust Company, N.A., as Trustee (filed on May 23, 2008 as Exhibit 4.1 to Transcontinental Gas Pipe Line Corporation’s Form 8-K) and incorporated herein by reference. |
| | |
| 4.26 | | — | | Indenture, dated as of August 12, 2011, between Transcontinental Gas Pipe Line Company, LLC and The Bank of New York Mellon Trust Company, N.A., as trustee (filed on August 12, 2011 as Exhibit 4.1 to Transcontinental Gas Pipe Line Company, LLC’s Form 8-K (File No. 001-07584)) and incorporated herein by reference. |
| | |
| 4.27 | | — | | Indenture dated December 13, 2006, by and among Williams Partners L.P., Williams Partners Finance Corporation and The Bank of New York (filed on December 19, 2006 as Exhibit 4.1 to Williams Partners L.P. Form 8-K) and incorporated herein by reference. |
| | |
| 4.28 | | — | | Indenture dated as of February 9, 2010, between Williams Partners L.P. and The Bank of New York Mellon Trust Company, N.A. (filed on February 10, 2010 as Exhibit 4.1 to The Williams Companies, Inc.’s Form 8-K) and incorporated herein by reference. |
| | |
| 4.29 | | — | | Indenture, dated as of November 9, 2010, between Williams Partners L.P. and The Bank of New York Mellon Trust Company, N.A., as trustee (filed on November 12, 2010 as Exhibit 4.1 to Williams Partners L.P.’s current report on Form 8-K (File No. 001-32599)) and incorporated herein by reference. |
| | |
| 4.30 | | — | | First Supplemental Indenture, dated as of November 9, 2010, between Williams Partners L.P. and The Bank of New York Mellon Trust Company, N.A., as trustee (filed on November 12, 2010 as Exhibit 4.1 to Williams Partners L.P.’s current report on Form 8-K (File No. 001-32599)) and incorporated herein by reference. |
| | |
| 4.31 | | — | | Second Supplemental Indenture, dated as of November 17, 2011, between Williams Partners L.P. and The Bank of New York Mellon Trust Company, N.A., as trustee (filed November 18, 2011 as Exhibit 4.1 to Williams Partners L.P.’s current report on Form 8-K (File No. 001-32599)) and incorporated herein by reference. |
| | |
| 10.1§ | | — | | The Williams Companies Amended and Restated Retirement Restoration Plan effective January 1, 2008 (filed on February 25, 2009 as Exhibit 10.1 to The Williams Companies, Inc.’s Form 10-K) and incorporated herein by reference. |
| | |
| 10.2§ | | — | | Form of Director and Officer Indemnification Agreement (filed on September 24, 2008 as Exhibit 10.1 to The Williams Companies, Inc.’s Form 8-K) and incorporated herein by reference. |
| | |
| 10.3§ | | — | | Form of 2011 Restricted Stock Unit Agreement among Williams and certain employees and officers (filed on February 24, 20092011 as Exhibit 10.6 to The Williams Companies, Inc.’s Form 10-K) and incorporated herein by reference. |
| | |
| 10.4*§ | | — | | Form of 2012 Performance-Based Restricted Stock Unit Agreement among Williams and certain employees and officers. |
| | |
| 10.5*§ | | — | | Form of 2012 Restricted Stock Unit Agreement among Williams and certain employees and officers. |
| | | | |
Exhibit No. | | | | Description |
/s/ Ted T. Timmermans
Ted T. Timmermans | | |
| 10.6*§ | | Controller (Principal Accounting
Officer)— | | February 24, 2009Form of 2012 Nonqualified Stock Option Agreement among Williams and certain employees and officers. |
| | |
| 10.7* | | — | | Form of 2011 Restricted Stock Unit Agreement among Williams and nonmanagement directors. |
| | |
| 10.8 | | — | | The Williams Companies, Inc. 1996 Stock Plan for Nonemployee Directors (filed on March 27, 1996 as Exhibit B to The Williams Companies, Inc.’s Proxy Statement) and incorporated herein by reference. |
| | |
| 10.9§ | | — | | The Williams Companies, Inc. 2002 Incentive Plan as amended and restated effective as of January 23, 2004 (filed on August 5, 2004 as Exhibit 10.1 to The Williams Companies, Inc.’s Form 10-Q) and incorporated herein by reference. |
| | |
| 10.10§ | | — | | Amendment No. 1 to The Williams Companies, Inc. 2002 Incentive Plan (filed on February 25, 2009 as Exhibit 10.11 to The Williams Companies, Inc.’s Form 10-K) and incorporated herein by reference. |
| | |
| 10.11§ | | — | | Amendment No. 2 to The Williams Companies, Inc. 2002 Incentive Plan (filed on February 25, 2009 as Exhibit 10.12 to The Williams Companies, Inc.’s Form 10-K) and incorporated herein by reference. |
| | |
| 10.12*§ | | — | | The Williams Companies, Inc. 2007 Incentive Plan as amended and restated effective January 19, 2012. |
| | |
| 10.13§ | | — | | Amended and Restated Change-in-Control Severance Agreement between the Company and certain executive officers (Tier I Executives) (filed on February 25, 2009 as Exhibit 10.18 to The Williams Companies, Inc.’s Form 10-K) and incorporated herein by reference. |
| | |
| 10.14*§ | | — | | Amended and Restated Change-in-Control Severance Agreement between the Company and certain executive officers (Tier II Executives). |
| | |
| 10.15 | | — | | Contribution Agreement, dated as of January 15, 2010, by and among Williams Energy Services, LLC, Williams Gas Pipeline Company, LLC, WGP Gulfstream Pipeline Company, L.L.C., Williams Partners GP LLC, Williams Partners L.P., Williams Partners Operating LLC and, for a limited purpose, The Williams Companies, Inc, including exhibits thereto (filed on January 19, 2010 as Exhibit 10.1 to The Williams Companies Inc.’s Form 8-K) and incorporated herein by reference. |
| | |
| 10.16 | | — | | Credit Agreement, dated as of June 3, 2011, by and among The Williams Companies, Inc., the lenders named therein, and Citibank, N.A., as Administrative Agent (filed on August 4, 2011 as Exhibit 10.1 to The Williams Companies, Inc.’s Form 10-Q) and incorporated herein by reference. |
| | |
| 10.17 | | — | | First Amendment to The Williams Companies, Inc. June 3, 2011 Credit Agreement, dated as of November 1, 2011, by and among The Williams Companies, Inc., the lenders named therein, and Citibank, N.A. as Administrative Agent (filed on November 1, 2011 as Exhibit 10.1 to The Williams Companies, Inc.’s Form 8-K) and incorporated herein by reference |
| | |
| 10.18 | | — | | Credit Agreement, dated as of June 3, 2011, by and among Williams Partners L.P., Northwest Pipeline GP, Transcontinental Gas Pipe Line Company, LLC, as co-borrowers, the lenders named therein, and Citibank N.A., as Administrative Agent (filed on August 4, 2011 as Exhibit 10.2 to The Williams Companies, Inc.’s Form 8-K) and incorporated herein by reference. |
| | |
| 10.19* | | — | | Separation and Distribution Agreement, dated as of December 30, 2011, between The Williams Companies, Inc. and WPX Energy, Inc. |
| | | | |
Exhibit No. | | | | Description |
/s/ Joseph R. Cleveland*
Joseph R. Cleveland* | | Director | | February 24, 2009 |
| | | | |
/s/ Kathleen B. Cooper*
Kathleen B. Cooper* | | Director | | February 24, 2009 |
| | | | |
/s/ Irl F. Engelhardt*
Irl F. Engelhardt* | | Director | | February 24, 2009 |
| | | | |
/s/ William R. Granberry*
William R. Granberry* | | Director | | February 24, 2009 |
| | | | |
/s/ William E. Green*
William E. Green* | | Director | | February 24, 2009 |
| | | | |
/s/ Juanita H. Hinshaw*
Juanita H. Hinshaw* | | Director | | February 24, 2009 |
| | | | |
/s/ W.R. Howell*
W.R. Howell* | | Director | | February 24, 2009 |
155
| | | | | | |
Signature
| | Title
| | Date
|
|
| | | | |
/s/ Charles M. Lillis*
Charles M. Lillis* | | Director | | February 24, 2009 |
| | | | |
/s/ George A. Lorch*
George A. Lorch* | | Director | | February 24, 2009 |
| | | | |
/s/ William G. Lowrie*
William G. Lowrie* | | Director | | February 24, 2009 |
| | | | |
/s/ Frank T. MacInnis*
Frank T. MacInnis* | | Director | | February 24, 2009 |
| | | | |
/s/ Janice D. Stoney*
Janice D. Stoney* | | Director | | February 24, 2009 |
| | | | | | |
*By: | | /s/ La Fleur C. Browne
La Fleur C. Browne
Attorney-in-Fact | | | | February 24, 2009 |
156
INDEX TO EXHIBITS
| | | | | | | |
Exhibit
| | | | |
No. | | | | Description |
| |
| | 3 | .1 | | — | | Restated Certificate of Incorporation, as supplemented (filed on March 11, 2005 as Exhibit 3.1 to The Williams Companies, Inc.’s Form 10-K) and incorporated herein by reference. |
| | 3 | .2 | | — | | Restated By-Laws (filed on September 24, 2008 as Exhibit 3.1 to The Williams Companies, Inc.’sForm 8-K) and incorporated herein by reference. |
| | 4 | .1 | | — | | Form of Senior Debt Indenture between Williams and Bank One Trust company, N.A. (formerly The First National Bank of Chicago), as Trustee (filed on September 8, 1997 as Exhibit 4.1 to The Williams Companies, Inc.’s Form S-3) and incorporated herein by reference. |
| | 4 | .2 | | — | | Trust Company, N.A., as Trustee, dated as of January 17, 2001 (filed on March 12, 2001 as Exhibit 4(j) to The Williams Companies, Inc.’s Form 10-K) and incorporated herein by reference. |
| | 4 | .3 | | — | | Fifth Supplemental Indenture between Williams and Bank One Trust Company, N.A., as Trustee, dated as of January 17, 2001 (filed on March 12, 2001 as Exhibit 4(k) to The Williams Companies, Inc.’sForm 10-K) and incorporated herein by reference. |
| | 4 | .4 | | — | | Seventh Supplemental Indenture dated March 19, 2002, between The Williams Companies, Inc. as Issuer and Bank One Trust Company, National Association, as Trustee (filed on May 9, 2002 as Exhibit 4.1 to The Williams Companies, Inc.’s Form 10-Q) and incorporated herein by reference. |
| | 4 | .5 | | — | | Form of Senior Debt Indenture between Williams Holdings of Delaware, Inc. and Citibank, N.A., as Trustee (filed on October 18, 1995 as Exhibit 4.1 to Williams Holdings of Delaware, Inc.’s Form 10-Q) and incorporated herein by reference. |
| | 4 | .6 | | — | | First Supplemental Indenture dated as of July 31, 1999, among Williams Holdings of Delaware, Inc., Citibank, N.A., as Trustee (filed on March 28, 2000 as Exhibit 4(o) to The Williams Companies, Inc.’s Form 10-K) and incorporated herein by reference. |
| | 4 | .7 | | — | | Senior Indenture dated February 25, 1997, between MAPCO Inc. and Bank One Trust Company, N.A. (formerly The First National Bank of Chicago), as Trustee (filed February 25, 1997 as Exhibit 4.4.1 to MAPCO Inc.’s Amendment No. 1 to Form S-3) and incorporated herein by reference. |
| | 4 | .8 | | — | | Supplemental Indenture No. 1 dated March 5, 1997, between MAPCO Inc. and Bank One Trust Company, N.A. (formerly The First National Bank of Chicago), as Trustee (filed as Exhibit 4(o) to MAPCO Inc.’s Form 10-K for the fiscal year ended December 31, 1997) and incorporated herein by reference. |
| | 4 | .9 | | — | | Supplemental Indenture No. 2 dated March 5, 1997, between MAPCO Inc. and Bank One Trust Company, N.A. (formerly The First National Bank of Chicago), as Trustee (filed as Exhibit 4(p) to MAPCO Inc.’s Form 10-K for the fiscal year ended December 31, 1997) and incorporated herein by reference. |
| | 4 | .10 | | — | | Supplemental Indenture No. 3 dated March 31, 1998, among MAPCO Inc., Williams Holdings of Delaware, Inc. and Bank One Trust Company, N.A. (formerly The First National Bank of Chicago), as Trustee (filed as Exhibit 4(j) to Williams Holdings of Delaware, Inc.’s Form 10-K for the fiscal year ended December 31, 1998) and incorporated herein by reference. |
| | 4 | .11 | | — | | Supplemental Indenture No. 4 dated as of July 31, 1999, among Williams Holdings of Delaware, Inc., Williams and Bank One Trust Company, N.A. (formerly The First National Bank of Chicago), as Trustee (filed on March 28, 2000 as Exhibit 4(q) to The Williams Companies, Inc.’s Form 10-K) and incorporated herein by reference. |
| | 4 | .12 | | — | | Indenture dated as of May 28, 2003, by and between The Williams Companies, Inc. and JPMorgan Chase Bank, as Trustee for the issuance of the 5.50% Junior Subordinated Convertible Debentures due 2033 (filed on August 12, 2003 as Exhibit 4.2 to The Williams Companies, Inc.’s Form 10-Q) and incorporated herein by reference. |
| | 4 | .13 | | — | | Amended and Restated Rights Agreement dated September 21, 2004 by and between The Williams Companies, Inc. and EquiServe Trust Company, N.A., as Rights Agent (filed on September 24, 2004 as Exhibit 4.1 to The Williams Companies, Inc.’s Form 8-K) and incorporated herein by reference. |
| | 4 | .14 | | — | | Amendment No. 1 dated May 18, 2007 to the Amended and Restated Rights Agreement dated September 21, 2004 (filed on May 22, 2007 as Exhibit 4.1 to The Williams Companies, Inc.’s Form 8-K) and incorporated herein by reference. |
| | | | | | | |
Exhibit
| | | | |
No. | | | | Description |
| |
| | 4 | .15 | | — | | Amendment No. 2 dated October 12, 2007 to the Amended and Restated Rights Agreement dated September 21, 2004 (filed on October 15, 2007 as Exhibit 4.1 to The Williams Companies, Inc.’sForm 8-K) and incorporated herein by reference. |
| | 4 | .16 | | — | | Senior Indenture, dated as of November 30, 1995, between Northwest Pipeline Corporation and Chemical Bank, Trustee with regard to Northwest Pipeline’s 7.125% Debentures, due 2025 (filed September 14, 1995 as Exhibit 4.1 to Northwest Pipeline’s Form S-3) and incorporated herein by reference. |
| | 4 | .17 | | — | | Indenture dated as of June 22, 2006, between Northwest Pipeline Corporation and JPMorgan Chase Bank, N.A., as Trustee, with regard to Northwest Pipeline’s $175 million aggregate principal amount of 7.00% Senior Notes due 2016 (filed on June 23, 2006 as Exhibit 4.1 to Northwest Pipeline’sForm 8-K) and incorporated herein by reference. |
| | 4 | .18 | | — | | Indenture, dated as of April 5, 2007, between Northwest Pipeline Corporation and The Bank of New York (filed on April 5, 2007 as Exhibit 4.1 to Northwest Pipeline Corporation’s Form 8-K) (Commission File number 001-07414) and incorporated herein by reference. |
| | 4 | .19 | | — | | Indenture dated May 22, 2008, between Northwest Pipeline GP and The Bank of New York Trust Company, N.A., as Trustee (filed on May 23, 2008 as Exhibit 4.1 to Northwest Pipeline GP’sForm 8-K) and incorporated herein by reference. |
| | 4 | .20 | | — | | Registration Rights Agreement, dated as of May 23, 2008, among Northwest Pipeline GP and Banc of America Securities, LLC, BNP Paribas Securities Corp, and Greenwich Capital Markets, Inc., acting on behalf of themselves and the several initial purchasers listed on Schedule I thereto (filed on May 23, 2008 as Exhibit 10.1 to Northwest Pipeline GP’s Form 8-K) and incorporated herein by reference. |
| | 4 | .21 | | — | | Senior Indenture dated as of July 15, 1996 between Transcontinental Gas Pipe Line Corporation and Citibank, N.A., as Trustee (filed on April 2, 1996 as Exhibit 4.1 to Transcontinental Gas Pipe Line Corporation’s Form S-3) and incorporated herein by reference. |
| | 4 | .22 | | — | | Senior Indenture dated as of January 16, 1998 between Transcontinental Gas Pipe Line Corporation and Citibank, N.A., as Trustee (filed on September 8, 1997 as Exhibit 4.1 to Transcontinental Gas Pipe Line Corporation’s Form S-3) and incorporated herein by reference. |
| | 4 | .23 | | — | | Indenture dated as of August 27, 2001 between Transcontinental Gas Pipe Line Corporation and Citibank, N.A., as Trustee (filed on November 8, 2001 as Exhibit 4.1 to Transcontinental Gas Pipe Line Corporation’s Form S-4) and incorporated herein by reference. |
| | 4 | .24 | | — | | Indenture dated as of July 3, 2002 between Transcontinental Gas Pipe Line Corporation and Citibank, N.A., as Trustee (filed August 14, 2002 as Exhibit 4.1 to The Williams Companies Inc.’s Form 10-Q) and incorporated herein by reference. |
| | 4 | .25 | | — | | Indenture dated December 17, 2004 between Transcontinental Gas Pipe Line Corporation and JPMorgan Chase Bank, N.A., as Trustee (filed on December 21, 2004 as Exhibit 4.1 to Transcontinental Gas Pipe Line Corporation’s Form 8-K) and incorporated herein by reference. |
| | 4 | .26 | | — | | Indenture dated as of April 11, 2006, between Transcontinental Gas Pipe Line Corporation and JPMorgan Chase Bank, N.A., as Trustee with regard to Transcontinental Gas Pipe Line’s $200 million aggregate principal amount of 6.4% Senior Note due 2016 (filed on April 11, 2006 as Exhibit 4.1 to Transcontinental Gas Pipe Line Corporation’s Form 8-K) and incorporated herein by reference. |
| | 4 | .27 | | — | | Indenture dated May 22, 2008, between Transcontinental Gas Pipe Line Corporation and The Bank of New York Trust Company, N.A., as Trustee (filed on May 23, 2008 as Exhibit 4.1 to Transcontinental Gas Pipe Line Corporation’s Form 8-K) and incorporated herein by reference. |
| | 4 | .28 | | — | | Registration Rights Agreement, dated as of May 22, 2008, among Transcontinental Gas Pipe Line Corporation and Banc of America Securities LLC, Greenwich Capital Markets, Inc., and J. P. Morgan Securities Inc., acting on behalf of themselves and the several initial purchasers listed on Schedule I thereto (filed on May 23, 2008 as Exhibit 10.1 to Transcontinental Gas Pipe Line Corporation’s
Form 8-K) and incorporated herein by reference. |
| | 4 | .29 | | — | | Indenture dated June 20, 2006, by and among Williams Partners L.P., Williams Partners Finance Corporation and JPMorgan Chase Bank, N.A. (filed on June 20, 2006 as Exhibit 4.1 to Williams Partners L.P. Form 8-K) and incorporated herein by reference. |
| | | | | | | |
Exhibit
| | | | |
No. | | | | Description |
| |
| | 4 | .30 | | — | | Indenture dated December 13, 2006, by and among Williams Partners L.P., Williams Partners Finance Corporation and The Bank of New York (filed on December 19, 2006 as Exhibit 4.1 to Williams Partners L.P. Form 8-K) and incorporated herein by reference. |
| | 10 | .1* | | — | | The Williams Companies Amended and Restated Retirement Restoration Plan effective January 1, 2008. |
| | 10 | .2 | | — | | The Williams Companies, Inc. Stock Plan for Non-Officer Employees (filed on March 27, 1996 as Exhibit 10(iii)(g) to The Williams Companies, Inc.’s Form 10-K) and incorporated herein by reference. |
| | 10 | .3 | | — | | The Williams Companies, Inc. 1996 Stock Plan (filed on March 27, 1996 as Exhibit A to The Williams Companies, Inc.’s Proxy Statement) and incorporated herein by reference. |
| | 10 | .4 | | — | | The Williams Companies, Inc. 1996 Stock Plan for Non-employee Directors (filed on March 27, 1996 as Exhibit B to The Williams Companies, Inc.’s Proxy Statement) and incorporated herein by reference. |
| | 10 | .5 | | — | | Form of Director and Officer Indemnification Agreement (filed on September 24, 2008 as Exhibit 10.1 to The Williams Companies, Inc.’s Form 8-K) and incorporated herein by reference. |
| | 10 | .6 | | — | | Form of 2008 Performance-Based Restricted Stock Unit Agreement among Williams and certain employees and officers (filed on February 29, 2008 as Exhibit 99.1 to The Williams Companies, Inc.’s Form 8-K) and incorporated herein by reference. |
| | 10 | .7 | | — | | Form of 2008 Restricted Stock Unit Agreement among Williams and certain employees and officers (filed on February 29, 2008 as Exhibit 99.2 to The Williams Companies, Inc.’s Form 8-K) and incorporated herein by reference. |
| | 10 | .8 | | — | | Form of 2008 Nonqualified Stock Option Agreement among Williams and certain employees and officers (filed on February 29, 2008 as Exhibit 99.1 to The Williams Companies, Inc.’s Form 8-K) and incorporated herein by reference. |
| | 10 | .9* | | — | | Form of 2008 Restricted Stock Unit Agreement among Williams and non-management directors. |
| | 10 | .10 | | — | | The Williams Companies, Inc. 2002 Incentive Plan as amended and restated effective as of January 23, 2004 (filed on August 5, 2004 as Exhibit 10.1 to The Williams Companies, Inc.’s Form 10-Q) and incorporated herein by reference. |
| | 10 | .11* | | — | | Amendment No. 1 to The Williams Companies, Inc. 2002 Incentive Plan. |
| | 10 | .12* | | — | | Amendment No. 2 to The Williams Companies, Inc. 2002 Incentive Plan. |
| | 10 | .13 | | — | | The Williams Companies, Inc. 2007 Incentive Plan (filed on April 10, 2007 as Appendix C to The Williams Companies, Inc.’s Definitive Proxy Statement 14A) and incorporated herein by reference. |
| | 10 | .14* | | — | | Amendment No. 1 to The Williams Companies, Inc. 2007 Incentive Plan. |
| | 10 | .15 | | — | | The Williams Companies, Inc. Employee Stock Purchase Plan (filed on April 10, 2007 as Appendix D to The Williams Companies, Inc.’s Definitive Proxy Statement 14A) and incorporated herein by reference. |
| | 10 | .16* | | — | | Amendment No. 1 to The Williams Companies, Inc. Employee Stock Purchase Plan. |
| | 10 | .17* | | — | | Amendment No. 2 to The Williams Companies, Inc. Employee Stock Purchase Plan. |
| | 10 | .18* | | — | | Amended and Restated Change-in-Control Severance Agreement between the Company and certain executive officers. |
| | 10 | .19* | | — | | The Williams Companies, Inc. Severance Pay Plan. |
| | 10 | .20* | | — | | Confidential Separation Agreement and Release between The Williams Companies, Inc. and Michael P. Johnson dated April 2, 2008 (filed on May 1, 2008 as Exhibit 10.4 to The Williams Companies, Inc.’s Form 10-Q) and incorporated herein by reference. |
| | 10 | .21 | | — | | Amendment Agreement, dated May 9, 2007, among The Williams Companies, Inc., Williams Partners L.P., Northwest Pipeline Corporation, Transcontinental Gas Pipe Line Corporation, certain banks, financial institutions and other institutional lenders and Citibank, N.A., as administrative agent (filed on May 15, 2007 as Exhibit 10.1 to The Williams Companies, Inc.’s Form 8-K) and incorporated herein by reference. |
| | | | | | | |
Exhibit
| | | | |
No. | | | | Description |
| |
| | 10 | .22 | | — | | Amendment Agreement dated November 21, 2007 among The Williams Companies, Inc., Williams Partners L.P., Northwest Pipeline GP, Transcontinental Gas Pipe Line Corporation, certain banks, financial institutions and other institutional lenders and Citibank, N.A., as administrative agent (filed on November 28, 2007 as Exhibit 10.1 to The Williams Companies, Inc.’s Form 8-K) and incorporated herein by reference. |
| | 10 | .23 | | — | | Credit Agreement dated as of May 1, 2006, among The Williams Companies, Inc., Northwest Pipeline Corporation, Transcontinental Gas Pipe Line Corporation, and Williams Partners L.P., as Borrowers and Citibank, N.A., as Administrative Agent (filed on May 1, 2006 as Exhibit 10.1 to The Williams Companies, Inc.’s Form 8-K) and incorporated herein by reference. |
| | 10 | .24 | | — | | U.S. $400,000,000 Five Year Credit Agreement dated January 20, 2005 among The Williams Companies, Inc., as Borrower, the Initial Lenders named herein, as Initial Lenders, the Initial Issuing Banks named herein, as Initial Issuing Banks and Citibank, N.A., as Agent (filed on January 26, 2005 as Exhibit 10.3 to The Williams Companies, Inc.’s Form 8-K) and incorporated herein by reference. |
| | 10 | .25 | | — | | U.S. $100,000,000 Five Year Credit Agreement dated January 20, 2005 among The Williams Companies, Inc., as Borrower, the Initial Lenders named herein, as Initial Lenders, the Initial Issuing Banks named herein, as Initial Issuing Banks and Citibank, N.A., as Agent (filed on January 26, 2005 as Exhibit 10.4 to The Williams Companies, Inc.’s Form 8-K) and incorporated herein by reference. |
| | 10 | .26 | | — | | U.S. $500,000,000 Five Year Credit Agreement dated September 20, 2005 among The Williams Companies, Inc., as Borrower, the Initial Lenders named herein, as Initial Lenders, the Initial Issuing Banks named herein, as Initial Issuing Banks and Citibank, N.A., as Agent (filed on September 26, 2005 as Exhibit 10.1 to The Williams Companies, Inc.’s Form 8-K) and incorporated herein by reference. |
| | 10 | .27 | | — | | U.S. $200,000,000 Five Year Credit Agreement dated September 20, 2005 among The Williams Companies, Inc., as Borrower, the Initial Lenders named herein, as Initial Lenders, the Initial Issuing Banks named herein, as Initial Issuing Banks and Citibank, N.A., as Agent (filed on September 26, 2005 as Exhibit 10.2 to The Williams Companies, Inc.’s Form 8-K) and incorporated herein by reference. |
| | 10 | .28 | | — | | Master Professional Services Agreement dated as of June 1, 2004, by and between The Williams Companies, Inc. and International Business Machines Corporation (filed on August 5, 2004 as Exhibit 10.2 to The Williams Companies, Inc.’s Form 10-Q) and incorporated herein by reference. |
| | 10 | .29 | | — | | Amendment No. 1 to the Master Professional Services Agreement dated June 1, 2004, by and between The Williams Companies, Inc. and International Business Machines Corporation made as of June 1, 2004 (filed on August 5, 2004 as Exhibit 10.3 to The Williams Companies, Inc.’s Form 10-Q) and incorporated herein by reference. |
| | 10 | .30 | | — | | Purchase and Sale Agreement, dated November 16, 2006, by and among Williams Energy Services, LLC, Williams Field Services Group, LLC, Williams Field Services Company, LLC, Williams Partners GP LLC, Williams Partners L.P. and Williams Partners Operating, LLC (filed on November 21, 2006 as Exhibit 2.1 to Williams Partners L.P.’s Form 8-K) and incorporated herein by reference. |
| | 10 | .31 | | — | | Credit Agreement dated February 23, 2007 among Williams Production RMT Company, Williams Production Company, LLC, Citibank, N.A., Citigroup Energy Inc., Calyon New York Branch, and the banks named therein, and Citigroup Global Markets Inc. and Calyon New York Branch as joint lead arrangers and co-book runners (filed on February 28, 2007 as Exhibit 10.41 to The Williams Companies, Inc.’s Form 10-K) and incorporated herein by reference. |
| | 10 | .32 | | — | | Asset Purchase Agreement between Williams Power Company, Inc. and Bear Energy LP dated May 20, 2007 (filed on May 22, 2007 as Exhibit 99.1 to The Williams Companies, Inc.’s Form 8-K) and incorporated herein by reference. |
| | 10 | .33 | | — | | Credit Agreement dated as of December 11, 2007, by and among Williams Partners L.P., the lenders party hereto, Citibank, N.A., as Administrative Agent and Issuing Bank, and The Bank of Nova Scotia, as Swingline Lender (filed on December 17, 2007 as Exhibit 10.5 to Williams Partners L.P. Form 8-K) and incorporated herein by reference. |
| | | | | | | |
Exhibit
| | | | |
No. | | | | Description |
| |
| | 10 | .34 | | — | | Contribution Conveyance and Assumption Agreement, dated January 24, 2008, among Williams Pipeline Partners L.P., Williams Pipeline Operating LLC, WPP Merger LLC, Williams Pipeline Partners Holdings LLC, Northwest Pipeline GP, Williams Pipeline GP LLC, Williams Gas Pipeline Company, LLC, WGPC Holdings LLC and Williams Pipeline Services Company (filed on January 30, 2008 as Exhibit 10.2 to 1 to Williams Pipeline Partners L.P.’s Form 8-K) and incorporated herein by reference. |
| | 12* | | | — | | Computation of Ratio of Earnings to Combined Fixed Charges and Preferred Stock Dividend Requirements. |
| | 14 | | | — | | Code of Ethics (filed on March 15, 2004 as Exhibit 14 to The Williams Companies, Inc.’s Form 10-K) and incorporated herein by reference. |
| | 21* | | | — | | Subsidiaries of the registrant. |
| | 23 | .1* | | — | | Consent of Independent Registered Public Accounting Firm, Ernst & Young LLP. |
| | 23 | .2* | | — | | Consent of Independent Petroleum Engineers and Geologists, Netherland, Sewell & Associates, Inc. |
| | 23 | .3* | | — | | Consent of Independent Petroleum Engineers and Geologists, Miller and Lents, LTD. |
| | 24* | | | — | | Power of Attorney. |
| | 31 | .1* | | — | | Certification of the Chief Executive Officer pursuant to Rules 13a-14(a) and 15d-14(a) promulgated under the Securities Exchange Act of 1934, as amended, and Item 601(b)(31) of Regulation S-K, as adopted pursuant to Section 302 of the Sarbanes-Oxley Act of 2002. |
| | 31 | .2* | | — | | Certification of the Chief Financial Officer pursuant to Rules 13a-14(a) and 15d-14(a) promulgated under the Securities Exchange Act of 1934, as amended, and Item 601(b)(31) of Regulation S-K, as adopted pursuant to Section 302 of the Sarbanes-Oxley Act of 2002. |
| | 32* | | | — | | Certification of the Chief Executive Officer and the Chief Financial Officer pursuant to 18 U.S.C. Section 1350, as adopted pursuant to Section 906 of the Sarbanes-Oxley Act of 2002. |
| | |
*10.20 | | — | | Employee Matters Agreement, dated as of December 30, 2011, between The Williams Companies, Inc. and WPX Energy, Inc. (filed on January 6, 2012 as Exhibit 10.2 to The Williams Companies, Inc.’s Form 8-K) and incorporated herein by reference. |
| | Filed herewith |
| 10.21 | | — | | Tax Sharing Agreement, dated as of December 30, 2011, between The Williams Companies, Inc. and WPX Energy, Inc. (filed on January 6, 2012 as Exhibit 10.3 to The Williams Companies, Inc.’s Form 8-K) and incorporated herein by reference. |
| | |
| 12* | | — | | Computation of Ratio of Earnings to Combined Fixed Charges and Preferred Stock Dividend Requirements. |
| | |
| 14 | | — | | Code of Ethics for Senior Officers (filed on March 15, 2004 as Exhibit 14 to The Williams Companies, Inc.’s Form 10-K) and incorporated herein by reference. |
| | |
| 21* | | — | | Subsidiaries of the registrant. |
| | |
| 23.1* | | — | | Consent of Independent Registered Public Accounting Firm, Ernst & Young LLP. |
| | |
| 23.2* | | — | | Consent of Independent Registered Public Accounting Firm, Deloitte & Touche LLP. |
| | |
| 24* | | — | | Power of Attorney. |
| | |
| 31.1* | | — | | Certification of the Chief Executive Officer pursuant to Rules 13a-14(a) and 15d-14(a) promulgated under the Securities Exchange Act of 1934, as amended, and Item 601(b)(31) of Regulation S-K, as adopted pursuant to Section 302 of the Sarbanes-Oxley Act of 2002. |
| | |
| 31.2* | | — | | Certification of the Chief Financial Officer pursuant to Rules 13a-14(a) and 15d-14(a) promulgated under the Securities Exchange Act of 1934, as amended, and Item 601(b)(31) of Regulation S-K, as adopted pursuant to Section 302 of the Sarbanes-Oxley Act of 2002. |
| | |
| 32** | | — | | Certification of the Chief Executive Officer and the Chief Financial Officer pursuant to 18 U.S.C. Section 1350, as adopted pursuant to Section 906 of the Sarbanes-Oxley Act of 2002. |
| | |
| 101.INS* | | — | | XBRL Instance Document |
| | |
| 101.SCH* | | — | | XBRL Taxonomy Extension Schema |
| | |
| 101.CAL* | | — | | XBRL Taxonomy Extension Calculation Linkbase |
| | |
| 101.DEF* | | — | | XBRL Taxonomy Extension Definition Linkbase |
| | |
| 101.LAB* | | — | | XBRL Taxonomy Extension Label Linkbase |
| | |
| 101.PRE* | | — | | XBRL Taxonomy Extension Presentation Linkbase |
| § | Management contract or compensation plan or arrangement |