Financial information relating to our international operations for the years ended December 31, 2008, 20072011, 2010 and 20062009 is incorporated by reference to “ITEM 8. FINANCIAL STATEMENTS AND SUPPLEMENTARY DATA — Notes to Consolidated Financial Statements — Note 19”15”.
Executive Officers of the Registrant(1)
The following table sets forth certain information concerning our executive officers on March 14, 2012:
Name | Age | Position | ||
| Paul D. Arling | 49 | Chairman of the Board and Chief Executive Officer | ||
| Paul J.M. Bennett | 56 | Executive Vice President, Managing Director, Europe | ||
| Mark S. Kopaskie | 54 | Executive Vice President, General Manager U.S. Operations | ||
| Richard A. Firehammer, Jr. | 54 | Senior Vice President, General Counsel and Secretary | ||
| Bryan M. Hackworth | 42 | Senior Vice President and Chief Financial Officer |
| (1) | Included pursuant to Instruction 3 to Item 401(b) of Regulation S-K. |
Paul D. Arlingis our Chairman and Chief Executive Officer. He joined us in May 1996 as Chief Financial Officer and was named to our Board of Directors in August 1996. He was appointed President and COO in September 1998, was promoted to Chief Executive Officer in October 2000 and appointed as Chairman in July 2001. At the 2011Annual Meeting of Stockholders, Mr. Arling was re-elected as our Chairman to serve until the 2012 Annual Meeting of Stockholders. From 1993 through May 1996, he served in various capacities at pages 69–70.
Paul J.M. Bennettis www.uei.com. We make available freeour Executive Vice President and Managing Director, Europe. He was our Managing Director and Senior Vice President, Managing Director, Europe from July 1996 to December 2006. He was promoted to his current position in December 2006. Prior to joining us, he held various positions at Philips Consumer Electronics over a seven year period, first as Product Marketing Manager for the Accessories Product Group, initially set up to support Philip’s Audio division, and then as head of charge throughthat division.
Mark S. Kopaskieis our Executive Vice President and General Manager, U.S. Operations. He rejoined us in September 2006 as our Senior Vice President and General Manager, U.S. Operations and was promoted to his current position in December 2006. He was our Executive Vice President and Chief Operating Officer from 1995 to 1997. From 2003 until November 2005, Mr. Kopaskie was President and Chief Executive Officer of Packaging Advantage Corporation (PAC), a personal care and household products manufacturer, which was acquired by Marietta Corporation in November 2005. Following the websiteacquisition, he served as Senior Vice President, Business Development for Marietta Corporation. From 1997 to 2003, he held senior management positions at Birdair Inc., a world leader in the engineering, manufacturing, and construction of tensioned membrane structures, and OK International, a manufacturer and marketer of fluid dispensing equipment, solder and de-solder systems, and wire wrap products. Prior to joining us in 1995, Mr. Kopaskie was Senior Vice President of Operations at Mr. Coffee Inc.
Richard A. Firehammer, Jr., Esq.has been our annual report on Form 10-K,Senior Vice President since February 1999. He has been our quarterly reports on Form 10-Q,General Counsel since October 1993 and Secretary since February 1994. He was our current reports on Form 8-K and any amendmentsVice President from May 1997 until August 1998. He was outside counsel to these reports as soon as reasonably practical after we electronically file such reportsus from September 1998 until being rehired in February 1999. From November 1992 to September 1993, he was associated with the SecuritiesChicago, Illinois law firm, Shefsky & Froelich, Ltd. From 1987 to 1992, he was with the law firm, Vedder, Price, Kaufman & Kammholz in Chicago, Illinois.
Bryan M. Hackworthis our Senior Vice President and Exchange Commission. These reports may be found on our websiteChief Financial Officer. He was promoted to Chief Financial Officer in August 2006. Mr. Hackworth joined us in June 2004 as Corporate Controller and subsequently assumed the role of Chief Accounting Officer in May 2006. Before joining us in 2004, he spent five years at www.uei.com underMars, Inc., a privately held international manufacturer and distributor of consumer products and served in several financial and strategic roles (Controller — Ice Cream Division; Strategic Planning Manager for the caption “SEC Filings” onWHISKAS® Brand) and various other financial management positions. Prior to joining Mars Inc., Mr. Hackworth spent six years at Deloitte & Touche LLP as an auditor, specializing in the Investor page. Investors may also obtain copies of our SEC filings from the SEC website at www.sec.gov.
Forward Looking Statements
We caution that the following important factors, among others (including, but not limited to, factors discussed below in “ITEM 7. MANAGEMENT’S DISCUSSION AND ANALYSIS OF FINANCIAL CONDITION AND RESULTS OF OPERATIONS,” as well as those factors discussed elsewhere in this Annual Report on Form 10-K, or in our other reports filed from time to time with the Securities and Exchange Commission), may affect our actual results and may contribute to or cause our actual consolidated results to differ materially from those expressed in any of our forward-looking statements. The factors included here are not exhaustive. Further, any forward-looking statement speaks only as of the date on which such statement is made, and we undertake no obligation to update any forward-looking statement to reflect events or circumstances after the date on which such statement is made or to reflect the occurrence of unanticipated events. New factors emerge from time to time, and it is not possible for management to predict all such factors, nor can we assess the impact of each such factor on the business or the extent to which any factor, or combination of factors, may cause actual results to differ materially from those contained in any forward-looking statements. Therefore, forward-looking statements should not be relied upon as a prediction of actual future results.
While we believe that the forward-looking statements made in this report are based on reasonable assumptions, the actual outcome of such statements is subject to a number of risks and uncertainties, including the failure of our markets to continue growing and expanding in the manner we anticipated; the failure of our customers to grow and expand as we anticipated; the effects of natural or other events beyond our control, including the effects aof political unrest, war or terrorist activities may have on us or the economy; the economic environment’s effect on us or our customers; the growth of, acceptance of and the demand for our products and technologies in various markets and geographical regions, including cable, satellite, consumer electronics, retail, digital media/technology, CEDIA, and interactive TV automotive, and cellular industries not materializing or growing as we believed; our inability to add profitable complementary products which are accepted by the marketplace; our inability to attract and retain quality workforce at adequate
levels in all regions of the world, and particularly Asia; our inability to continue to maintain our operating costs at acceptable levels through our cost containment efforts; our inability to realize tax benefits from various tax projects initiated from time to time; our inability to continue selling our products or licensing our technologies at higher or profitable margins; our inability to obtain orders or maintain our order volume with new and existing customers; the possible dilutive effect our stock incentive programs may have on our earnings per share and stock price; our inability to continue to obtain adequate quantities of component parts or secure adequate factory production capacity on a timely basis; and other factors listed from time to time in our press releases and filings with the Securities and Exchange Commission.
Risks Related to Doing Business in the People’s Republic of China
Changes in the policies of the People’s Republic of China (“PRC”) government may have a significant impact upon the business we may be able to conduct in the PRC and the profitability of such business.
Our business operations may be adversely affected by the current and future political environment in the PRC. The PRC has operated as a socialist state since the mid-1900s and is controlled by the PRC’s Communist Party. The Chinese government exerts substantial influence and control over the manner in which we must conduct our business activities. The PRC has only permitted provincial and local economic autonomy and private economic activities since 1988. The government of the PRC has exercised and continues to exercise substantial control over virtually every sector of the Chinese economy, through regulation and state ownership. Our ability to operate in the PRC may be adversely affected by changes in Chinese laws and regulations, including those relating to taxation, labor and social insurance, import and export tariffs, raw materials, environmental regulations, land use rights, property and other matters. Under current leadership, the government of the PRC has been pursuing economic reform policies that encourage private economic activity and greater economic decentralization. There is no assurance, however, that the government of the PRC will continue to pursue these policies, or that it will not significantly alter these policies from time to time without notice.
The PRC’s economy is in a transition from a planned economy to a market oriented economy subject to five-year and annual plans adopted by the government that set national economic development goals. Policies of the PRC government may have significant effects on the economic conditions of the PRC. The PRC government has confirmed that economic development will follow the model of a market economy. Under this direction, we believe that the PRC will continue to strengthen its economic and trading relationships with foreign countries and business development in the PRC will follow market forces. While we believe that this trend will continue, there can be no assurance that this will be the case.
A change in policies by the PRC government may adversely affect our interests by, among other factors: changes in laws, regulations or the interpretation thereof, confiscatory taxation, restrictions on currency conversion, imports or sources of supplies, or the expropriation or nationalization of private enterprises. Although the PRC government has been pursuing economic reform policies for more than two decades, there is no assurance that the government will continue to pursue such policies or that such policies may not be significantly altered, especially in the event of a change in leadership, social or political disruption, or other circumstances affecting the PRC’s political, economic and social life.
The PRC laws and regulations governing our current business operations are sometimes vague and uncertain. Any changes in such PRC laws and regulations may harm our business.
The PRC laws and regulations governing our current business operations are sometimes vague and uncertain. The PRC’s legal system is a civil law system based on written statutes, in which decided legal cases have little value as precedents unlike the common law system prevalent in the United States. There are substantial uncertainties regarding the interpretation and application of PRC laws and regulations, including but not limited to the laws and regulations governing our business, or the enforcement and performance of our arrangements with customers in the event of the imposition of statutory liens, death, bankruptcy and criminal proceedings. The Chinese government has been developing a comprehensive system of commercial laws, and considerable progress has been made in introducing laws and regulations dealing with economic matters such as foreign investment, corporate organization and governance, labor and social insurance, commerce, taxation and trade. However, because these laws and regulations are relatively new, and because of the limited volume of published cases and judicial interpretation and their lack of force as precedents, interpretation and enforcement of these laws and regulations involve significant uncertainties. New laws and regulations that affect existing and proposed future businesses may also be applied
retroactively. We are considered a foreign person or foreign funded enterprise under PRC laws, and as a result, we are required to comply with PRC laws and regulations. We cannot predict what effect the interpretation of existing or new PRC laws or regulations may have on our businesses. If the relevant authorities find that we are in violation of PRC laws or regulations, they would have broad discretion in dealing with such a violation, including, without limitation:
levying fines;
10
revoking our business and other licenses;
requiring that we restructure our ownership or operations; and
requiring that we discontinue any portion or all of our business.
The fluctuation of the Chinese Yuan Renminbi may harm your investment.
Under Chinese monetary policy, the Chinese Yuan Renminbi is permitted to fluctuate within a narrow and managed band against a basket of certain foreign currencies. This policy, which was initiated during 2005, has resulted in an approximately 28.9% appreciation of the Chinese Yuan Renminbi against the U.S. dollar as of December 31, 2011. While the international reaction to the Chinese Yuan Renminbi revaluation has been positive, there remains significant international pressure on the PRC government to adopt an even more flexible currency policy, which could result in a further and more significant appreciation of the Chinese Yuan Renminbi against the U.S. dollar.
The PRC’s legal and judicial system may not adequately protect our business and operations and the rights of foreign investors.
The promulgation of new laws, changes to existing laws and the pre-emption of local regulations by national laws may adversely affect foreign investors. However, the trend of legislation since the amendment to the PRC’s Constitution has significantly enhanced the protection of foreign investment and allowed for more control by foreign parties of their investments in Chinese enterprises. There can be no assurance that a change in leadership, social or political disruption, or unforeseen circumstances affecting the PRC’s political, economic or social life, will not affect the PRC government’s ability to continue to support and pursue these reforms. Such a shift may have a material adverse effect on our business and prospects.
We faceAvailability of adequate workforce levels
Presently, the vast majority of workers at our PRC factories are obtained from third-party employment agencies. As the labor laws, social insurance and wage levels continue to mature and grow and the workers become more sophisticated, our costs to employ these and other workers in the PRC may grow beyond that anticipated by management. In addition, as the PRC market continues to open up and grow, with the advent of more companies opening plants and businesses in the PRC, we could experience an increase in competing for the same workers, resulting in either an inability to attract and retain an adequate number of qualified workers or an increase in our employment costs to obtain and retain these workers.
Expansion in the PRC
As our global business grows, we may decide to expand in China to meet demand. This would be dependent on our ability to locate suitable facilities to support this expansion, to obtain the necessary permits and funding, to attract and retain adequate levels of qualified workers, and to enter into a long term land lease that is common in the PRC.
Any recurrence of severe acute respiratory syndrome, or SARS, or other widespread public health problems, could harm our operations.
A renewed outbreak of SARS or other widespread public health problems (such as bird flu and swine flu) in the PRC could significantly harm our operations. Our operations may be impacted by a number of risks relatedhealth-related factors, including quarantines or closures of some of our offices that would adversely disrupt our operations. Any of the foregoing events or other unforeseen consequences of public health problems could significantly harm our operations.
Risks Related to the recent financial crisisRecent Financial Crisis and severe tighteningSevere Tightening in the global credit markets.Global Credit Markets
General economic conditions, both domestic and international, have an impact on our business and financial results. The ongoing global financial crisis affecting the banking system and financial markets has resulted in a severe tightening in the credit markets, a low level of liquidity in many financial markets, and extreme volatility in credit and equity markets. This financial crisis may impact our business in a number of ways, including:
Potential Defermentdeferment of Purchasespurchases and Ordersorders by Customers:customers
Uncertainty about current and future global economic conditions may cause consumers, businesses and governments to defer purchases in response to tighter credit, decreased cash availability and declining consumer confidence. Accordingly, future demand for our products may differ materially from our current expectations.
Customers’ Inabilityinability to Obtain Financingobtain financing to Make Purchasesmake purchases from Usus and/or Maintain Their Business:maintain their business
Some of our customers require substantial financing in order to fund their operations and make purchases from us. The inability of these customers to obtain sufficient credit to finance purchases of our products may adversely impact our financial results. In addition, if the financial crisis results in insolvencies for our customers, it may adversely impact our financial results.
Potential Impactimpact on Trade Receivables:trade receivables
Credit market conditions may slow our collection efforts as customers experience increased difficulty in obtaining requisite financing, leading to higher than normal accounts receivable balances and longer DSOs. This may result in greater expense associated with collection efforts and increased bad debt expense.
Negative Impactimpact from Increased Financial Pressuresincreased financial pressures on Third-Party Dealers, Distributorsthird-party dealers, distributors and Retailers:retailers
We make sales in certain regions of the world through third-party dealers, distributors and retailers. Although many of these third parties have significant operations and maintain access to available credit, others are smaller and more likely to be impacted by the significant decrease in available credit that has resulted from the current financial crisis. If credit pressures or other financial difficulties result in insolvency for these third parties and we are unable to successfully transition our end customers to purchase products from other third parties or from us directly, it may adversely impact our financial results.
Negative Impactimpact from Increased Financial Pressuresincreased financial pressures on Key Suppliers:key suppliers
Our ability to meet customers’ demands depends, in part, on our ability to obtain timely and adequate delivery of quality materials, parts and components from our suppliers. Certain of our components are available only from a single source or limited sources. If certain key suppliers were to become capacity constrained or insolvent as a result of the financial crisis, it may result in a reduction or interruption in supplies or a significant increase in the price of supplies and adversely impact our financial results. In addition, credit constraints at key suppliers may result in accelerated payment of accounts payable by us, impacting our cash flow.
Dependence upon Key Suppliers
During 2008, four sources,2011, Samsung provided $29.1 million, or 10.2%, of our total inventory purchases. During 2010, Samsung and Computime each provided over 10% of our total inventory purchases. Purchases from these suppliers collectively amounted to $67.0 million, or 34.2%, of our total inventory purchases in 2010. During 2009, Samsung, Computime, C.G. Development, Samsung and Samjin each provided over 10% of our total inventory purchases. Purchases from these suppliers collectively amounted to $135.5$147.8 million, or 73.1%77.4%, of total inventory purchases during 2008. During 2007, Computime, C.G. Development and Samsung, each provided over 10% of our total inventory purchases. Purchases from these suppliers collectively amounted to $100.7 million, representing 63.2% of total inventory purchases in 2007. During 2006, Computime, C.G. Development, Freescale and Jetta each provided over 10% of our total inventory purchases. Purchases from these suppliers collectively amounted to $82.6 million or 60.9% of our total inventory purchases in 2006.
Most of the components used in our products are available from multiple sources. However, we have elected to purchase integrated circuits, used principally in our wireless control products, from two sources, Freescale and Samsung.primarily three sources. To reduce our dependence on our integrated circuits suppliers we continually seek additional sources, such as our new relationship with Maxim.sources. We generally maintain inventories of our integrated chips,circuits, which may be used in part to mitigate, but not eliminate, delays resulting from supply interruptions.
We have identified alternative sources of supply for our integrated circuit, component parts, and finished goods needs; however, there can be no assurance that we will be able to continue to obtain these inventory purchases on a timely basis. Any extended interruption, shortage or termination in the supply of any of the components used in our products, or a reduction in their quality or reliability, or a significant increase in prices of components, would have an adverse effect on our operating results, financial position and cash flows.
Disruption of our supply chain could have an adverse effect on our business, financial condition and results of operations
Our ability, including manufacturing or distribution capabilities, and cash flows.
11
Even after our acquisition of the factories in the PRC, third-party manufacturers located in Asiathe PRC will continue to manufacture a majority of our products. Our arrangements with ourthese foreign manufacturers are subject to the risks of doing business abroad, such as tariffs, environmental and trade restrictions, intellectual property protection and enforcement, export license requirements, work stoppages, political and social instability, economic and labor conditions, foreign currency exchange rate fluctuations, changes in laws and policies (including fiscal policies), and other factors, which may have a material adverse effect on our business, results of operations and cash flows. We believe that the loss of any one or more of our manufacturers would not have a long-term material adverse effect on our business, results of operations and cash flows, because numerous other manufacturers are available to fulfill our requirements; however, the loss of any of our major manufacturers may adversely affect our business, operating results, financial condition and cash flows until alternative manufacturing arrangements are secured.
Potential Fluctuations in Quarterly Results
We may from time to time increase our operating expenses to fund greater levels of research and development, sales and marketing activities, development of new distribution channels, improvements in our operational and financial systems and development of our customer support capabilities, and to support our efforts to comply with various government regulations. To the extent such expenses precede or are not subsequently followed by increased revenues, our business, operating results, financial condition and cash flows will be adversely affected.
In addition, we may experience significant fluctuations in future quarterly operating results that may be caused by many other factors, including demand for our products, introduction or enhancement of products by us and our competitors, the loss or acquisition of any significant customers, market acceptance of new products, price reductions by us or our competitors, mix of distribution channels through which our products are sold, product or supply constraints, level of product returns, mix of customers and products sold, component pricing, mix of international and domestic revenues, foreign currency exchange rate fluctuations and general economic conditions. In addition, as a strategic response to changes in the competitive environment, we may from time to time make certain pricing or marketing decisions or acquisitions that may have a material adverse effect on our business, results of operations or financial condition. As a result, we believe period-to-period comparisons of our results of operations are not necessarily meaningful and should not be relied upon as an indication of future performance.
Due to all of the foregoing factors, it is possible that in some future quarters our operating results will be below the expectations of public market analysts and investors. If this happens the price of our common stock may be materially adversely affected.
Dependence on Consumer Preference
We are susceptible to fluctuations in our business based upon consumer demand for our products. In addition, we cannot guarantee that increases in demand for our products associated with increases in the deployment of new technology will continue. We believe that our success depends on our ability to anticipate, gauge and respond to fluctuations in consumer preferences. However, it is impossible to predict with complete accuracy the occurrence and effect of fluctuations in consumer demand over a product’s life cycle. Moreover, we caution that any growth in revenues that we achieve may be transitory and should not be relied upon as an indication of future performance.
Demand for Consumer Service and Support
We have continually provided domestic and international consumer service and support to our customers to add overall value and to help differentiate us from our competitors. We continually review our service and support group
12
In addition, certain of our products have more features and are more complex than others and therefore require more end-user technical support. In some instances, we rely on distributors or dealers to provide the initial level of technical support to the end-users. We provide the second level of technical support for bug fixes and other issues at no additional charge. Therefore, as the mix of our products includes more of these complex product lines, support costs may increase, which wouldmay have an adverse effect on our business, operating results, financial condition and cash flows.
Dependence Upon Timelyupon New Product Introduction
Our ability to remain competitive in the wireless control and AV accessory products market will depend considerably upon our ability to successfully identify new product opportunities, as well as develop and introduce these products and enhancements on a timely and cost effective basis. There can be no assurance that we will be successful at developing and marketing new products or enhancing our existing products, or that these new or enhanced products will achieve consumer acceptance and, if achieved, will sustain that acceptance. In addition, there can be no assurance that products developed by others will not render our products non-competitive or obsolete or that we will be able to obtain or maintain the rights to use proprietary technologies developed by others which are incorporated in our products. Any failure to anticipate or respond adequately to technological developments and customer requirements, or any significant delays in product development or introduction, may have a material adverse effect on our operating results, financial condition and cash flows.
In addition, the introduction of new products may require significant expenditures for research and development, tooling, manufacturing processes, inventory and marketing. In order to achieve high volume production of any new product, we may have to make substantial investments in inventory and expand our production capabilities.
Dependence on Major Customers
The economic strength and weakness of our worldwide customers affect our performance. We sell our wireless control products, AV accessory products, and proprietary technologies to private label customers,subscription broadcasters, original equipment manufacturers, and companies involved in the subscription broadcasting industry.private label customers. We also supply our products to our wholly owned, non-U.S. subsidiaries and to independent foreign distributors, who in turn distribute our products worldwide, with Europe Asia, South Africa, Australia, and ArgentinaAsia currently representing our principal foreign markets.
During the yearsyear ended December 31, 2008, 2007 and 2006,2011, we had sales to one customer, Comcast Communications Inc., that amountedSony and its sub-contractors and to more than 10% of our net sales for the year. In addition, in each of these years, we had sales to DirecTVDIRECTV and its sub-contractors, that when combined, each totaled 10% or more of our net sales. In each of the year ended December 31, 2010 and 2009, we had sales to DIRECTV and its sub-contractors and to Comcast and its sub-contractors, that when combined, each exceeded 10% of our net sales. The loss of eitherany of these customers or of any other key customer, either in the United States or abroad or our inability to maintain order volume with these customers, may have an adverse effect on our operating results, financial condition results of operations and cash flows.
Change in Warranty Claim Costs
We rely on third-party companies to service a large portion of our customer warranty claims. If the cost to service these warranty claims increases unexpectedly, or these outside services cease to be available, we may be required to increase our estimate of future claim costs, which may have a material adverse effect on our operating results, financial condition and cash flows.
Outsourced Labor
We employ a small number of personnel to develop and market additional products that are part of the Nevo®Nevo® platform as well as products that are based on the Zigbee®Zigbee®, Z-Wave®Z-Wave® and other radio frequency technology. Even after these hires, we continue to use outside resources to assist us in the development of these products. While we believe that such outside services shouldwill continue to be available to us, if they cease to be available, the
13
Competition
Competition with the wireless control industry is characterized by intense competition based primarily on product availability, price, speed of delivery, ability to tailor specific solutions to customer needs, quality, and depth of product lines. Our competition is fragmented across our products, and, accordingly, we do not compete with any one company across all product lines. We compete with a variety of entities, some of which have greater financial resources. Our ability to remain competitive in this industry depends in part on our ability to successfully identify new product opportunities, develop and introduce new products and enhancements on a timely and cost effective basis, as well as our ability to successfully identify and enter into strategic alliances with entities doing business within the industries we serve. There can be no assurance that our product offerings will be, and/or remain, competitive or that strategic alliances, if any, will achieve the type, extent, and amount of success or business that we expect them to achieve. The sales of our products and technology may not occur or grow in the manner we expect, and thus we may not recoup costs incurred in the research and development of these products as quickly as we expect, if at all.
Patents, Trademarks, and Copyrights
The procedures by which we identify, document and file for patent, trademark, and copyright protection are based solely on engineering and management judgment, with no assurance that a specific filing will be issued, or if issued, will deliver any lasting value to us. Because of the rapid innovation of products and technologies that is characteristic of our industry, there iscan be no assurance that rights granted under any patent will provide competitive advantages to us or will be adequate to safeguard and maintain our proprietary rights. Moreover, the laws of certain countries in which our products are or may be manufactured or sold may not offer protection on such products and associated intellectual property to the same extent that the U.S.United States legal system may offer.
In our opinion, our intellectual property holdings as well as our engineering, production, and marketing skills and the experience of our personnel are of equal importance to our market position. We further believe that none of our businesses are materially dependent upon any single patent, copyright, trademark, or trade secret.
Some of our products include or use technology and/or components of third parties. While it may be necessary in the future to seek or renew licenses relating to various aspects of such products, we believe that, based upon past experience and industry practice, such licenses generally may be obtained on commercially reasonable terms; however, there iscan be no guarantee that such licenses may be obtained on such terms or at all. Because of technological changes in the wireless and home control industry, current extensive patent coverage, and the rapid rate of issuance of new patents, it is possible certain components of our products and business methods may unknowingly infringe upon the patents of others.
Potential for Litigation
As is typical in our industry and for the nature and kind of business in which we are engaged, from time to time various claims, charges and litigation are asserted or commenced by third parties against us or by us against third parties, arising from or related to product liability, infringement of patent or other intellectual property rights, breach of warranty, contractual relations or employee relations. The amounts claimed may be substantial, but they may not bear any reasonable relationship to the merits of the claims or the extent of any real risk of court awards assessed against us or in our favor.
Risks of Conducting Business Internationally
Risks of doing business internationally may adversely affect our sales, operations, earnings and cash flows due to a variety of factors, including, but not limited to:
changes in a country or region’s economic or political conditions, including inflation, recession, interest rate fluctuations, forced political actions or elections, coops, and actual or anticipated military conflicts;
14
currency fluctuations affecting sales, particularly in the Euro, British Pound the Chinese Yuan Renminbi , Indian Rupee, Singapore dollar, and the Brazilian Real which contribute to variations in sales of products and services in impacted jurisdictions and also affect our reported results expressed in U.S. dollars;
currency fluctuations affecting costs, particularly the Euro, British Pound the Chinese Yuan Renminbi , Indian Rupee, Singapore dollar, and the Brazilian Real which contribute to variances in costs in impacted jurisdictions and also affect our reported results expressed in U.S. dollars;
longer accounts receivable cycles and financial instability among customers;
trade regulations and procedures and actions affecting production, pricing and marketing of products;
local labor conditions, customs, and regulations;
changes in the regulatory or legal environment;
differing technology standards or customer requirements;
import, export or other business licensing requirements or requirements related to making foreign direct investments, which may affect our ability to obtain favorable terms for components or lead to penalties or restrictions;
difficulties associated with repatriating cash generated or held abroad in a tax-efficient manner and changes in tax laws; and
fluctuations in freight costs and disruptions at important geographic points of exit and entry.
Effectiveness of Our Internal Control Over Financial Reporting
Pursuant to Section 404 of the Sarbanes-Oxley Act of 2002, we are required to include in our Annual Report on Form 10-K our assessment of the effectiveness of our internal control over financial reporting. Furthermore, our independent registered public accounting firm is required to audit our internal control over financial reporting and separately report on whether it believes we maintain, in all material respects, effective internal control over financial reporting. Although we believe that we currently have adequate internal control procedures in place, we cannot be certain that future material changes to our internal control over financial reporting will be effective. If we cannot adequately maintain the effectiveness of our internal control over financial reporting, we mightmay be subject to sanctions or investigation by regulatory authorities, such as the Securities and Exchange Commission. Any such action may adversely affect our financial results and the market price of our common stock.
Changes in Generally Accepted Accounting Principles
Our financial statements are prepared in accordance with U.S. generally accepted accounting principles. These principles are subject to revision and interpretation by various governing bodies, including the FASB and the SEC. A change in current accounting standards or their interpretation may have a significant adverse effect on our operating results, financial condition and cash flows.
Unanticipated Changes in Tax Provisions or Income Tax Liabilities
We are subject to income taxes in the United States and numerous foreign jurisdictions. Our tax liabilities are affected by the amounts we charge for inventory and other items in intercompany transactions. From time to time, we are subject to tax audits in various jurisdictions. Tax authorities may disagree with our intercompany charges or other matters and assess additional taxes. We assess the likely outcomes of these audits in order to determine the appropriateness of the tax provision. However, there can be no assurance that we will accurately predict the
outcomes of these audits, and the actual outcomes of these audits may have a material impact on our financial condition, results of operations and cash flows. In addition, our effective tax rate in the future may be adversely affected by changes in the mix of earnings in countries with differing statutory tax rates, changes in the valuation of
15
Inability to Use Deferred Tax Assets
We have deferred tax assets that we may not be able to use under certain circumstances. If we are unable to generate sufficient future taxable income in certain jurisdictions, or if there is a significant change in the actual effective tax rates or a significant change in the time period within which the underlying temporary differences become taxable or deductible, we may be required to increase our valuation allowances against our deferred tax assets resulting in an increase in our effective tax rate and an adverse impact on our future operating results, financial condition and cash flows.
Environmental Matters
Many of our products are subject to various federal, state, local and international laws governing chemical substances in products, including laws regulating the manufacture and distribution of chemical substances and laws restricting the presence of certain substances in electronics products. With the passageIn addition, many of the European Union’s Restriction of Hazardous Substances Directive, which makesthese laws and regulations make producers of electrical goods responsible for collection, recycling, treatment and disposal of recovered products, similar restrictions in China effective March 2007 and the European Union’s Waste Electrical and Electronic Equipment Directive,products. As a result, we may face significant costs and liabilities in complying with these laws and any future laws and regulations or enforcement policies that may have a material adverse effect upon our capital expenditures, earnings oroperating results, financial condition.
Leased Property
We lease all of the properties used in our business. We can give no assurance that we will enter into new or renewal leases, or that, if entered into, the new lease terms will be similar to the existing terms or that the terms of any such new or renewal leases will not have a significant and material adverse effect on our operating results, financial condition and cash flows.
Technology Changes in Wireless Control
We currently derive substantial revenue from the sale of wireless remote controls based on infrared (“IR”)IR and RF technology. Other control technologies exist or may be developed that may compete with IR.this technology. In addition, we develop and maintain our own database of IR and RF codes. There are several competing IR and RF libraries offered by companies that we compete with in the marketplace. The advantage that we may have compared to our competitors is difficult to measure. IfIn addition, if other wireless control technology gains acceptance and starts to be integrated into home electronics devices currently controlled through our IR remote controllers, demand for our products may decrease, resulting in decreased revenue, earningsoperating results, financial condition, and cash flow.
Failure to Recruit, Hire, and Retain Key Personnel
Our ability to achieve growth in the future will depend, in part, on our success at recruiting, hiring, and retaining highly skilled engineering, managerial, operational, sales and marketing personnel. Our corporate office, includingIf our advance technology engineering group, is based in Southern California. The high cost of living in Southern California makes it difficult to attract talent from outside the regionsalary and may also put pressure on overall employment related expense. Additionally, our competitors seek to recruit and hire the same key personnel. Therefore, if webenefits fail to stay competitive in salary and benefits within the industry it may negatively impact our ability to hire and retain key personnel. The inability to recruit, hire, and retain qualified personnel in a timely manner, or the loss of any key personnel, may make it difficult to meet key objectives, such as timely and effective product introductions.
16
Even after our recent acquisition of the PRC factories, we will continue to rely on third-party manufacturers to build our universal wireless control products, based on our extensive IR code library and patented technology.products. Price is always an issue in winning and retaining business. If customers become increasingly price sensitive, new competition may arise from manufacturers who decide to go into direct competition with us or from current competitors who perform their own manufacturing. If such a trend develops, we may experience downward pressure on our pricing or lose sales, which may have a material adverse effect on our operating results, financial condition and cash flows.
Transportation Costs; Impact of Oil Prices
We ship products from our foreign manufacturers via ocean and air transport. It is sometimes difficult to forecast swings in demand or delays in production and, as a result, products may be shipped via air which is more costly than ocean shipments. Often, weWe typically cannot recover the increased cost of air freight from our customers. Additionally, tariffs and other export fees may be incurred to ship products from foreign manufacturers to the customer. The inability to predict swings in demand or delays in production may increase the cost of freight which may have a material adverse effect on our product margins.
In addition, we have an exposure to oil prices in two forms. The first is indue to the pricesuse of the oil-based materials that we use in our products, which are primarily the plastics and other components that we include in our finished products. The second is inproducts, the cost of delivery and freight, which would be passed on by the carriers that we use in the form of higher rates.rates, political unrest in oil producing countries that could cause a cessation of production and/or delivery of oil resulting in higher costs. We record freight-in as a cost of sales and freight-out in operating expenses. Rising oil prices may have an adverse effect on cost of sales and operating expenses.
Proprietary Technologies
We produce highly complex products that incorporate leading-edge technology, including hardware, firmware, and software. Firmware and software may contain bugs that canmay unexpectedly interfere with product operation. There can be no assurance that our testing programs will detect all defects in individual products or defects that may affect numerous shipments. The presence of defects may harm customer satisfaction, reduce sales opportunities, or increase returns. An inability to cure or repair such a defect may result in the failure of a product line, temporary or permanent withdrawal from a product or market, damage to our reputation, increased inventory costs, or product reengineering expenses, any of which may have a material impact on our revenues, marginsoperating results, financial condition and net income.
Strategic Business Transactions
We may, from time to time, pursue strategic alliances, joint ventures, business acquisitions, products or technologies (“strategic business transactions”) that complement or expand our existing operations, including those that may be material in size and scope. Strategic business transactions including our recent acquisition of patents, intellectual property and other assets from Zilog, involve many risks, including the diversion of management’s attention away from day-to-day operations. There is also the risk that we will not be able to successfully integrate the strategic business transaction with our operations, personnel, customer base, products or technologies. Such strategic business transactions may also have adverse short-term effects on our operating results, and may result in dilutive issuances of equity securities, the incurrence of debt, and the loss of key employees. In addition, these strategic business transactions are generally subject to specific accounting guidelines that may adversely affect our financial condition, results of operations and cash flow. For instance, business acquisitions must be accounted for as purchases and, because most technology-related acquisitions involve the purchase of significant intangible assets, these acquisitions
17
Growth Projections
Management has made the projections required for the preparation of financial statements in conformity with accounting principles generally accepted in the United States of America regarding future events and the financial performance of the company, including those involving:
the benefits the company expects as a result of the development and success of products and technologies, including new products and technologies;
the benefits expected by entering into emerging markets such as Asia and Brazil, without which, we may not be able to recover the costs we incur to enter into such markets;
the recently announced new contracts with new and existing customers and new market penetrations;
the expected continued growth in digital TVs, DVRs, PVRs and overall growth in the company’s industry; and
the effects we may experience due to the continued softness in worldwide markets driven by the current economic environment.
Actual events or results may be unfavorable to management’s projections, which wouldmay have a material adverse effect on our projected operating results, financial condition and cash flows.
We have no unresolved staff comments as ofon the filing date of filing this Form 10-K.
Our corporateglobal headquarters is located in Cypress, California. We utilize the following office facilities:
Location | Purpose or Use | Square Feet | Status | ||||||||
| Cypress, California(1) | Corporate headquarters, engineering, research and development | 34,080 | Leased, expires | ||||||||
| Twinsburg, Ohio | 21,509 | Leased, expires May | |||||||||
| 31,2014 | |||||||||||
| Enschede, Netherlands | 18,292 | Leased, expires September 30, 2013 | |||||||||
| Bangalore, India(2) | Engineering, research and development | 17,713 | Leased, expired January 31, 2012 | ||||||||
| San Mateo, California | Engineering, research and development | 4,785 | Leased, expires | ||||||||
| Hong Kong, PRC | Asian headquarters | 12,000 | |||||||||
| Leased, expires | |||||||||||
| Guangzhou, PRC(3) | Manufacturing facility | 710,203 | Land leased, expires June 30, 2044 | ||||||||
| Yangzhou, PRC(3) | Manufacturing facility | 1,204,697 | Land leased, expires July 31, 2055 | ||||||||
| Qinzhou, PRC(3) | Manufacturing facility under development | 980,646 | Land leased, expires January 31, 2017 | ||||||||
| Manaus, Brazil | Manufacturing facility | 21,709 | Leased, expires September 30, 2014 | ||||||||
| (1) | Our lease for the Cypress Corporate headquarters expires on July 31, 2012. We are currently investigating a renewal of this lease and other alternative facilities. |
| (2) | Our lease for the Bangalore office expired on January 31, 2012. We are currently paying on a month-to-month basis while we are negotiating a renewal. |
| (3) | Private ownership of land in mainland PRC is not allowed. All land in the PRC is owned by the government and cannot be sold to any individual or entity. These facilities were developed on land which we lease from the PRC government. |
In addition to the facilities listed above, we lease space in various international locations, primarily for use as sales offices.
We planbelieve we will obtain lease agreements under similar terms; however, there can be no assurance that we will receive similar terms or that any offer to renew our lease for the Hong Kong office which expires in November 2009. Furthermore, in order to support the growth of our company, during 2008 we completed renovations to expand our corporate headquarters.
See “ITEM 8. FINANCIAL STATEMENTS AND SUPPLEMENTARY DATA — Notes to Consolidated Financial Statements — Note 13”12” for additional information regarding our obligations under leases.
18
We are subject to lawsuits arising out of the conduct of our business. The discussion of our litigation matters in “ITEM 8. FINANCIAL STATEMENTS AND SUPPLEMENTARY DATA — Notes to Consolidated Financial Statements — Note 21” at page 7013” is incorporated by reference.
19
Not applicable.
ITEM 5. MARKET FOR REGISTRANT’S COMMON EQUITY, RELATED STOCKHOLDER MATTERS AND ISSUER PURCHASES OF EQUITY SECURITIES
Our common stock trades on the NASDAQ Global Select Market under the symbol UEIC. The closing price of our common stock as reported by NASDAQ on March 11, 20099, 2012 was $16.32.$19.30. Our stockholders of record on March 11, 20099, 2012 numbered approximately 68.120. We have never paid cash dividends on our common stock, nor do we currently intend to pay any cash dividends on our common stock in the foreseeable future. We intend to retain our earnings, if any, for the future operation and expansion of our business. In addition, the terms of our revolving Credit Facility limit our ability to pay cash dividends on our common stock. For further information regarding our revolving Credit Facility see “ITEM 7. MANAGEMENT’S DISCUSSION AND ANALYSIS OF FINANCIAL CONDITION AND RESULTS OF OPERATIONS-Liquidity and Capital Resources” at pages 33–35 and “ITEM 8. FINANCIAL STATEMENTS AND SUPPLEMENTARY DATA — Notes to Consolidated Financial Statements — Note 7” at page 56.
The following table sets forth, for the periods indicated, the high and low sale prices for our common stock, as reported by NASDAQ:
| 2008 | 2007 | |||||||||||||||
| High | Low | High | Low | |||||||||||||
| First Quarter | $ | 35.50 | $ | 18.04 | $ | 29.89 | $ | 19.25 | ||||||||
| Second Quarter | 28.20 | 20.67 | 38.09 | 26.66 | ||||||||||||
| Third Quarter | 27.99 | 19.02 | 39.33 | 25.20 | ||||||||||||
| Fourth Quarter | 26.49 | 12.33 | 38.50 | 31.29 | ||||||||||||
| 2011 | 2010 | |||||||||||||||
| High | Low | High | Low | |||||||||||||
First Quarter | $ | 29.85 | $ | 25.11 | $ | 26.55 | $ | 20.25 | ||||||||
Second Quarter | 30.00 | 23.84 | 23.90 | 16.49 | ||||||||||||
Third Quarter | 25.71 | 14.20 | 20.93 | 16.12 | ||||||||||||
Fourth Quarter | 20.00 | 14.01 | 30.27 | 20.04 | ||||||||||||
Purchases of Equity Securities
The following table sets forth, for the fourth quarter, our total stock repurchases, average price paid per share and the maximum number of shares that may yet be purchased under our plans or programs:
| Total Number of | Maximum | |||||||||||||||
| Shares | Number of | |||||||||||||||
| Purchased | Shares that May | |||||||||||||||
| as Part of | Yet Be | |||||||||||||||
| Publicly | Purchased | |||||||||||||||
| Total Number of | Weighted Average | Announced | Under the | |||||||||||||
| Shares | Price Paid | Plans | Plans or | |||||||||||||
| Period | Purchased | per Share | or Programs | Programs | ||||||||||||
| 10/1/08 – 10/31/08 | 204,604 | $ | 25.04 | — | 313,782 | |||||||||||
| 11/1/08 – 11/30/08 | — | — | — | 313,782 | ||||||||||||
| 12/1/08 – 12/31/08 | — | — | — | 313,782 | ||||||||||||
| Total during fourth quarter | 204,604 | $ | 25.04 | — | ||||||||||||
Period | Total Number of Shares Purchased | Weighted Average Price Paid per Share | Total Number of Shares Purchased as Part of Publicly Announced Plans or Programs | Maximum Number of Shares that May Yet Be Purchased Under the Plans or Programs | ||||||||||||
10/1/2011 — 10/31/2011 | 11,460 | $ | 17.59 | 11,460 | 1,074,343 | |||||||||||
11/1/2011 — 11/30/2011 | 85 | 15.96 | 85 | 1,074,258 | ||||||||||||
12/1/2011 — 12/31/2011 | 4,348 | 15.95 | 4,348 | 1,069,910 | ||||||||||||
|
|
|
|
|
| |||||||||||
Total during fourth quarter | 15,893 | $ | 17.13 | 15,893 | 1,069,910 | |||||||||||
|
|
|
|
|
| |||||||||||
During the year ended December 31, 20062011, we repurchased 456,964 shares of our issued and outstanding common stock for $9.8 million under an ongoing and systematic program approved by our Board of Directors authorized the repurchase of 2.0 million shares of outstanding commonon February 11, 2010. We make stock under an ongoing systematic programrepurchases to manage the dilution created by shares issued under employeeour stock plans. Duringincentive plans or when we deem a repurchase is a good use of our cash and the year endedprice to be paid is at or below a threshold approved by our Board from time to time. On December 31, 2008,2011, we repurchased 1,118,318 shares for $26.7 million. As of December 31, 2008, we have 313,782had 69,910 shares available for repurchase under the program.
20
Information regarding our equity compensation plans, including both stockholder approved plans and plans not approved by stockholders, is incorporated by reference to “ITEM 12. SECURITY OWNERSHIP OF CERTAIN BENEFICIAL OWNERS AND MANAGEMENT AND RELATED STOCKHOLDER MATTERS” at pages 79–80, under the caption “Equity Compensation Plan Information” and “ITEM 8. FINANCIAL STATEMENTS AND SUPPLEMENTARY DATA — Notes to Consolidated Financial Statements — Note 11” at pages 58–63,16” under the caption “Stock Incentive Plans.“Stock-Based Compensation.”
Performance Chart
The following graph and table compares the cumulative total stockholder return with respect to our common stock versus the cumulative total return of our Peer Group Indexthe Standard & Poor’s Small Cap 600 (the “Peer Group Index”“S&P Small Cap 600”) and the NASDAQ Composite Index (the “NASDAQ Composite Index”) for the five (5) year period ended December 31, 2008.2011. The comparison assumes that $100
is invested on December 31, 20032006 in each of our common stock, the Peer Group IndexS&P Small Cap 600 and the NASDAQ Composite Index and that all dividends are reinvested. We have not paid any dividends and, therefore, our cumulative total return calculation is based solely upon stock price appreciation and not upon reinvestment of dividends. The graph and table depicts year-end values based on actual market value increases and decreases relative to the initial investment of $100, based on information provided for each calendar year by the NASDAQ Stock Market and the New York Stock Exchange.
The comparisons in the graph and table below are based on historical data and are not intended to forecast the possible future performance of our common stock.
Comparison of Stockholder Returns Amountof Universal Electronics Inc.,
the Peer Group Index(1),S&P Small Cap 600 and the NASDAQ Composite Index
| 12/31/2003 | 12/31/2004 | 12/31/2005 | 12/31/2006 | 12/31/2007 | 12/31/2008 | |||||||||||||||||||
| Universal Electronics Inc. | $ | 100 | $ | 138 | $ | 135 | $ | 165 | $ | 262 | $ | 127 | ||||||||||||
| Peer Group Index | $ | 100 | $ | 134 | $ | 133 | $ | 131 | $ | 102 | $ | 39 | ||||||||||||
| NASDAQ Composite Index | $ | 100 | $ | 109 | $ | 110 | $ | 121 | $ | 132 | $ | 79 | ||||||||||||
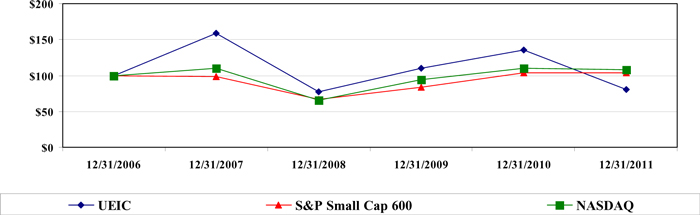
| 12/31/2006 | 12/31/2007 | 12/31/2008 | 12/31/2009 | 12/31/2010 | 12/31/2011 | |||||||||||||||||||
Universal Electronics Inc. | $ | 100 | $ | 159 | $ | 77 | $ | 110 | $ | 135 | $ | 81 | ||||||||||||
S&P Small Cap 600 | $ | 100 | $ | 99 | $ | 67 | $ | 83 | $ | 104 | $ | 104 | ||||||||||||
NASDAQ Composite Index | $ | 100 | $ | 110 | $ | 65 | $ | 94 | $ | 110 | $ | 108 | ||||||||||||
The information presented above is as of the end of each calendar year for the period December 31, 20032006 through 2008.2011. This information shallshould not be deemed to be “solicited“soliciting material” or to be “filed” with the Securities and Exchange Commission or subject to the liabilities of Section 18 of the Securities Exchange Act of 1934 (the “Exchange Act”) nor shallshould this information be incorporated by reference into any prior or future filings under the Securities Act of 1933 or the Exchange Act, except to the extent that we specifically incorporate it by reference into a filing.
21
The information set forth below is not necessarily indicative of the results of future operations and should be read in conjunction with “ITEM 7. MANAGEMENT’S DISCUSSION AND ANALYSIS OF FINANCIAL CONDITION AND RESULTS OF OPERATIONS,” and the Consolidated Financial Statements and notes thereto included in “ITEM 8. FINANCIAL STATEMENTS AND SUPPLEMENTARY DATA,” of this Form 10-K, which are incorporated herein by reference, in order to further understand further the factors that may affect the comparability of the financial data presented below.
| Year Ended December 31, | ||||||||||||||||||||
| (in thousands, except per share data) | 2008 | 2007 | 2006 | 2005 | 2004 | |||||||||||||||
| Net sales | $ | 287,100 | $ | 272,680 | $ | 235,846 | $ | 181,349 | $ | 158,380 | ||||||||||
| Operating income | $ | 20,761 | $ | 26,451 | $ | 18,517 | $ | 11,677 | $ | 13,540 | ||||||||||
| Net income | $ | 15,806 | $ | 20,230 | $ | 13,520 | $ | 9,701 | $ | 9,114 | ||||||||||
| Earnings per share: | ||||||||||||||||||||
| Basic | $ | 1.13 | $ | 1.40 | $ | 0.98 | $ | 0.72 | $ | 0.67 | ||||||||||
| Diluted | $ | 1.09 | $ | 1.33 | $ | 0.94 | $ | 0.69 | $ | 0.65 | ||||||||||
| Shares used in calculating earnings per share: | ||||||||||||||||||||
| Basic | 14,015 | 14,410 | 13,818 | 13,462 | 13,567 | |||||||||||||||
| Diluted | 14,456 | 15,177 | 14,432 | 13,992 | 14,100 | |||||||||||||||
| Cash dividend declared per common share | — | — | — | — | — | |||||||||||||||
| Gross margin | 33.5 | % | 36.4 | % | 36.4 | % | 37.0 | % | 38.9 | % | ||||||||||
| Selling, general, administrative, research and development expenses as a % of net sales | 26.3 | % | 26.7 | % | 28.5 | % | 30.6 | % | 30.3 | % | ||||||||||
| Operating margin | 7.2 | % | 9.7 | % | 7.9 | % | 6.4 | % | 8.6 | % | ||||||||||
| Net income as a % of net sales | 5.5 | % | 7.4 | % | 5.7 | % | 5.4 | % | 5.8 | % | ||||||||||
| Return on average assets | 7.3 | % | 10.2 | % | 8.3 | % | 6.8 | % | 6.8 | % | ||||||||||
| Working capital | $ | 122,303 | $ | 140,330 | $ | 106,179 | $ | 77,201 | $ | 75,081 | ||||||||||
| Ratio of current assets to current liabilities | 3.0 | 4.0 | 3.4 | 2.8 | 3.1 | |||||||||||||||
| Total assets | $ | 217,555 | $ | 217,285 | $ | 178,608 | $ | 146,319 | $ | 140,400 | ||||||||||
| Cash and cash equivalents | $ | 75,238 | $ | 86,610 | $ | 66,075 | $ | 43,641 | $ | 42,472 | ||||||||||
| Long-term debt | — | — | — | — | — | |||||||||||||||
| Stockholders’ equity | $ | 153,353 | $ | 168,242 | $ | 134,217 | $ | 103,292 | $ | 103,881 | ||||||||||
Book value per share(a) | $ | 11.24 | $ | 11.55 | $ | 9.58 | $ | 7.63 | $ | 7.66 | ||||||||||
| Ratio of liabilities to liabilities and stockholders’ equity | 29.5 | % | 22.6 | % | 24.9 | % | 29.4 | % | 26.0 | % | ||||||||||
| Year Ended December 31, | ||||||||||||||||||||
| (in thousands, except per share data) | 2011 | 2010 | 2009 | 2008 | 2007 | |||||||||||||||
Net sales | $ | 468,630 | $ | 331,780 | $ | 317,550 | $ | 287,100 | $ | 272,680 | ||||||||||
Operating income | $ | 26,576 | $ | 21,301 | $ | 21,947 | $ | 20,761 | $ | 26,451 | ||||||||||
Net income | $ | 19,946 | $ | 15,081 | $ | 14,675 | $ | 15,806 | $ | 20,230 | ||||||||||
Earnings per share: | ||||||||||||||||||||
Basic | $ | 1.34 | $ | 1.10 | $ | 1.07 | $ | 1.13 | $ | 1.40 | ||||||||||
Diluted | $ | 1.31 | $ | 1.07 | $ | 1.05 | $ | 1.09 | $ | 1.33 | ||||||||||
Shares used in calculating earnings per share: | ||||||||||||||||||||
Basic | 14,912 | 13,764 | 13,667 | 14,015 | 14,410 | |||||||||||||||
Diluted | 15,213 | 14,106 | 13,971 | 14,456 | 15,177 | |||||||||||||||
Cash dividend declared per common share | — | — | — | — | — | |||||||||||||||
Gross margin | 27.8 | % | 31.3 | % | 32.0 | % | 33.5 | % | 36.4 | % | ||||||||||
Selling, general, administrative, research and development expenses as a % of net sales | 19.5 | % | 24.9 | % | 25.1 | % | 26.3 | % | 26.7 | % | ||||||||||
Operating margin | 5.7 | % | 6.4 | % | 6.9 | % | 7.2 | % | 9.7 | % | ||||||||||
Net income as a % of net sales | 4.3 | % | 4.6 | % | 4.6 | % | 5.5 | % | 7.4 | % | ||||||||||
Return on average assets | 5.4 | % | 5.0 | % | 6.5 | % | 7.3 | % | 10.2 | % | ||||||||||
Working capital | $ | 84,761 | $ | 66,101 | $ | 127,086 | $ | 122,303 | $ | 140,330 | ||||||||||
Ratio of current assets to current liabilities | 1.7 | 1.4 | 3.1 | 3.0 | 4.0 | |||||||||||||||
Total assets | $ | 369,488 | $ | 372,533 | $ | 233,307 | $ | 217,555 | $ | 217,285 | ||||||||||
Cash and cash equivalents | $ | 29,372 | $ | 54,249 | $ | 29,016 | $ | 75,238 | $ | 86,610 | ||||||||||
Stockholders’ equity | $ | 229,989 | $ | 211,204 | $ | 169,730 | $ | 153,353 | $ | 168,242 | ||||||||||
Book value per share(a) | $ | 15.55 | $ | 14.13 | $ | 12.40 | $ | 11.24 | $ | 11.55 | ||||||||||
Ratio of liabilities to liabilities and stockholders’ equity | 37.8 | % | 43.3 | % | 27.3 | % | 29.5 | % | 22.6 | % | ||||||||||
| (a) | ||
Book value per share is defined as stockholders’ equity divided by common shares issued less treasury stock. |
The comparability of information between 20042011 and the otherprior years presented is affected by the acquisition of SimpleDevices Inc. inEnson during the fourth quarter of 2004.
The following discussion should be read in conjunction with the Consolidated Financial Statements and the related notes that appear elsewhere in this document.
Overview
We have developeddevelop and manufacture a broad line of pre-programmed universal wirelessremote control products, and audio-video accessories, and software that are marketed to enhance home entertainment systems. Our customers operate in the consumer electronics market and include subscription broadcasters, OEMs, MSOs (cable and satellite service providers), international retailers, CEDIA (Custom Electronic Design and Installation Association), U.S. retailers,custom installers, private labels, and companies in the computing industry. We also sell integrated circuits, on which our software and IR code database, or library, is embedded, to OEMs that manufacture wireless control devices, cable converters or satellite receivers for resale in their products. We believe that
Since our universal remote control database contains device codes that are capable of controlling virtually all infrared remote (“IR”) controlled TVs, VCRs, DVD players, cable converters, CD players, audio components and satellite receivers, as well as most other infrared remote controlled devices worldwide.
22
We operate as one business segment. We have twelvetwenty-four subsidiaries located in Argentina, Cayman Islands, France, Germany, Hong Kong (6), India, Italy, the Netherlands, Singapore, Spain, Brazil, British Virgin Islands (3), People’s Republic of China (4) and the United Kingdom.
To recap our results for 2008:2011:
Our net sales grew 41.2% to $468.6 million for 2011 from $331.8 million for 2010, due primarily to the acquisition of Enson during November 2010, which added $150.1 million of net sales during 2011.
Excluding Enson’s net sales, our 2011 net sales increased 3.8% to $318.6 million from $306.8 million for 2010. This is due primarily to the increase in net sales within the Latin America subscription broadcasting market and our acquisition of new domestic customers in our business category throughout 2011.
Our 2011 operating income increased 24.8% to $26.6 million for 2011 from $21.3 million for 2010. Our operating margin percentage decreased to 5.7% for 2011 from 6.4% for 2010 due primarily to the decrease in our gross margin percentage to 27.8% for 2011 from 31.3% for 2010. The decrease in our gross margin rate was due primarily to sales mix, as a higher percentage of our total sales were comprised of our lower-margin Business category. Partially offsetting the decrease in our gross margin percentage was a 2.8% improvement in operating expenses as a percentage of net sales for 2011 compared to 2010.
Our strategic business objectives for 20092012 include the following:
continue to develop industry-leading technologies and products with attractive gross margins in order to improve profitability;
further penetrate the growing Asian and Latin American subscription broadcasting markets;
acquire new customers in historically strong regions;
increase our share with existing customers;
increase the utilization of Enson’s factories by becoming less dependent on third party contract manufacturers;
place more operations, logistics, quality, program management, engineering, sales, and marketing personnel in the Asia region: and
Continue to seek acquisitions or strategic partners that complement and strengthen our existing business.
We intend for the following discussion of our financial condition and results of operations to provide information that will assist in understanding our consolidated financial statements, the changes in certain key items in those financial statements from period to period, and the primary factors that accounted for those changes, as well as how certain accounting principles, policies and estimates affect our consolidated financial statements.
Critical Accounting Policies and Estimates
The preparation of financial statements in conformity with accounting principles generally accepted in the United States of America requires us to make estimates and judgments that affect the reported amounts of assets and liabilities, disclosure of contingent assets and liabilities at the date of the financial statements and the reported amounts of revenues and expenses during the reporting period. On an on-going basis, we evaluate our estimates and judgments, including those related to revenue recognition, allowance for sales returns and doubtful accounts, warranties, inventory valuation, business combination purchase price allocations, our review for impairment of long-lived assets, intangible assets and goodwill, income taxes and stock-based compensation expense. Actual results
23
An accounting policy is deemed to be critical if it requires an accounting estimate to be made based on assumptions about matters that are highly uncertain at the time the estimate is made, if different estimates reasonably may have been used, or if changes in the estimate that are reasonably likely to occur may materially impact the financial statements. Management believes the following critical accounting policies affect our more significant judgments and estimates used in the preparation of our consolidated financial statements.
Revenue recognition
We recognize revenue on the sale of products when deliverytitle of the goods has occurred,transferred, there is persuasive evidence of an arrangement (such as a purchase order from the customer), the sales price is fixed or determinable and collectability is reasonably assured.
We record a provision for estimated retail sales returns on retail product sales in the same period as the related revenues are recorded. These estimates are based on historical sales returns, analysis of credit memo data and other known factors.returns. The provision recorded for estimated sales returns and allowances is deducted from gross sales to arrive at net sales in the period the related revenue is recorded. These estimates are based on historical sales returns, analysis of credit memo data and other known factors. Actual returns and claims in any future period are inherently uncertain and thus may differ from our estimates. If actual or expected future returns and claims are significantly greater or lower than the reserves that we have established, we will record a reduction or increase to net revenues in the period in which we make such a determination. The allowance for sales returns balance at December 31, 20082011 and 2007 contained reserves for items returned prior to year-end, but that were not completely processed,2010 was $1.0 million and therefore not yet removed from the allowance for sales returns balance. We estimate that if these returns had been fully processed the allowance for sales returns balance would have been approximately $0.8$1.4 million, on December 31, 2008 and 2007. The value of these returned goods was included in our inventory balance at December 31, 2008 and 2007.
We accrue for discounts and rebates on product sales in the same period as the related revenues are recorded based on our current expectations, after considering historical experience. Changes in such accruals may be required if future rebates and incentives differ from our estimates. Rebates and incentives are recognized as a reduction of sales if distributed in cash or customer account credits. Rebates and incentives are recognized as cost of sales if we provide products or services for payment.
We maintain an allowance for doubtful accounts for estimated losses resulting from the inability of our customers to make payments for products sold or services rendered. The allowance for doubtful accounts is estimated based on a variety of factors, including credit reviews, historical experience, length of time receivables are past due, current economic trends and changes in customer payment behavior. Also,Our historical reserves have been sufficient to cover losses from uncollectible accounts. However, because we record specific provisions for individualcannot predict future changes in the financial stability of our customers, actual future losses from uncollectible accounts when we become awaremay differ from our estimates and may have a material effect on our consolidated financial position, results of a customer’soperations and cash flows. If the financial conditions of our customers deteriorate resulting in their inability to meet its financial obligationsmake payments, a larger allowance may be required resulting in a charge to us, such asselling, general, and administrative expense in the case of bankruptcy filings or deteriorationperiod in the customer’s operating results or financial position.which we make this determination. We increased our allowance for doubtful accounts byincurred $0.3 million, $0.9 million, and $0.4 million of bad debt expense in 20082011, 2010, and 2009, respectively, to reflect certain customer accounts where collection iswas highly uncertain in the current economic environment. If circumstances related to a customer change, our estimates of the recoverability of the receivables would be further adjusted, either upward or downward.
We have not made any material changes in our methodology for recognizing revenue during the past threefour fiscal years. We do not believe there is a reasonable likelihood that there will be a material change in the estimates or assumptions we use to recognize revenue. However, if actual results are not consistent with our estimates or assumptions, we may be exposed to losses or gains that may be material.
24
We warrant our products against defects in materials and workmanship arising during normal use. We service warranty claims directly through our customer service department or contracted third-party warranty repair facilities. Our warranty period rangesperiods range up to three years. We estimate and recognize product warranty costs, which are included in cost of sales, as we sell the related products. Warranty costs are forecasted based on the best available information, primarily historical claims experience and the expected cost per claim. The costs we have incurred to service warranty claims have been minimal. Historically, product defects have been less than 0.5% of the net units sold. As a result the balance of our reserve for estimated warranty costs is not significant.
We have not made any material changes in our warranty reserve methodology during the past three fiscal years. We do not believe there is a reasonable likelihood that there will be a material change in the estimates or assumptions we use to calculate the warranty reserve. However, actual claim costs may differ from the amounts estimated. If a significant product defect were to be discovered on a high volume product, our financial statements may be materially impacted. Historically, product defects have been less than 0.5% of the net units sold.
Inventories
Our inventories consist of primarily wireless remote control devicesdevice, component part, and the related component parts, including integrated circuits, andraw material inventories are valued at the lower of cost or market. Costmarket value. The approximate cost is determined using the first-in, first-out method.basis. We write-down our inventory for the estimated difference between the inventory’s approximate cost and its estimated market value based upon our best estimates about future demand andof market conditions.
We carry inventory in amounts necessary to satisfy our customers’ inventory requirements on a timely basis. We continually monitor our inventory status to control inventory levels and write-down any excess or obsolete inventories on hand. Our total excess and obsolete inventory reserve as ofon December 31, 20082011 and 20072010 was $1.5$3.4 million and $1.8$2.1 million, respectively, or 3.5%3.8% and 5.0%3.2% of total inventory. The decreaseincrease in our excess and obsolete reserve in 2008during 2011 was the result of $2.4$4.6 million of additional write-downs offset by $2.7$1.3 million of scrapping.sell-through, $2.0 million of scrapping and foreign currency translation effects. This compared to additional write-downs of $2.1$2.9 million of additional write-downs offset by $1.0 million of sell-through, $1.5 million of scrapping and scrapping of $2.5 million in 2007.
We have not made any material changes in the accounting methodology used to establish our excess and obsolete inventory reserve during the past three fiscal years. We do not believe there is a reasonable likelihood that there will be a material change in the future estimates or assumptions we useduse to calculate our excess and obsolete inventory reserve. If actual market conditions are less favorable than those projected by management, additional inventory write-downs may be required which may have a material impact on our financial statements. Such circumstances may include, but are not limited to, the development of new competing technology that impedes the marketability of our products or the occurrence of significant price decreases in our raw material or component parts, such as integrated circuits. Each percentage point change in the ratio of excess and obsolete inventory reserve to inventory would impact cost of sales by approximately $0.5$0.9 million.
Business Combinations
We are required to allocate the purchase price of acquired companies to the tangible and intangible assets and the liabilities assumed, as well as in-process research and development (“IPR&D”), based upon their estimated fair values. We engage independent third-party appraisal firms to assist us in determining the fair values of assets acquired and liabilities assumed. Such valuations require management to make significant fair value estimates and assumptions, especially with respect to intangible assets. Management estimates the fair value of certain intangible assets by utilizing the following (but not limited to):
future free cash flow from customer contracts, customer lists, distribution agreements, acquired developed technologies, trademarks, trade names and patents;
expected costs to develop IPR&D into commercially viable products and cash flows from the products once they are completed; brand awareness and market position, as well as assumptions regarding the period of time the brand will continue to be used in our product portfolio; and discount rates utilized in discounted cash flow models. |
25
Valuation of Long-Lived Assets and Intangible Assets
We assess long-lived and intangible assets for impairment whenever events or changes in circumstances indicate that their carrying value may not be recoverable. Factors considered important which may trigger an impairment review, if significant, include the following:
underperformance relative to historical or projected future operating results;
changes in the manner of use | |||
changes in the strategy of impairment we perform an impairment review. our overall business;
negative industry or economic trends;
a decline in our stock price for a sustained period; and
a variance between our market capitalization relative to net book value.
If the carrying value of the asset is larger than theits undiscounted cash flows, the asset is impaired. We measure anThe impairment based onis measured as the difference between the net book value of the asset and the assets estimated fair value. Fair value is estimated utilizing the assets projected discounted cash flow method using a discount rate determined by our management to be commensurate with the risk inherent in our current business model.flows. In assessing the recoverability,fair value, we must make assumptions regarding estimated future cash flows, the discount rate and other factors to determine the fair value of the respective assets.
We have not made any material changes in our impairment loss assessment methodology during the past three fiscal years. We do not believe there is a reasonable likelihood that there will be a material change in the estimates or assumptions we use to calculate the impairment of long-lived assets and intangible assets. However, if actual results are not consistent with our estimates and assumptions we may be exposed to material impairment charges.
Capitalized Software Development Costs
At each balance sheet date, we compare the unamortized capitalized software development costs of a software product to itsthe net realizable value.value of the related product. The amount by which the unamortized capitalized costs of a software productdevelopment costs exceed the net realizable value of that assetthe related product is written off. The net realizable value is the estimated future gross revenues attributable to each product reduced by its estimated future completion costs and disposal.disposal costs. Any remaining amount of capitalized software development costs that have been written down are considered to be the cost for subsequent accounting purposes, and the amount of the write-down is not subsequently restored.
We do not believe there is a reasonable likelihood that there will be a material change in the future estimates of net realizable value we use to test for impairment losses on capitalized software development.development costs. However, if actual results are not consistent with our estimates and assumptions we may be exposed to impairment charges.
Goodwill
We evaluate the carrying value of goodwill as ofon December 31 of each year and between annual evaluations if events occur or circumstances change that would more likely than not reduce the fair value of the reporting unit below its carrying amount. Such circumstances may include, but are not limited to: (1) a significant adverse change in legal factors or in business climate, (2) unanticipated competition or (3) an adverse action or assessment by a regulator.
26
To evaluate whether goodwill is impaired, we compare the estimated fair value of the reporting unit to which the goodwill is assigned to the reporting unit’s carrying amount, including goodwill. We estimate the fair value of eachour reporting unit usingbased on income and market approaches. Under the income approach, we calculate the fair value of a reporting unit based on the present value of expectedestimated future cash flowsflows. Under the market approach, we estimate the fair value based on market multiples of Enterprise Value to EBITDA for that reporting unit.comparable companies. If the carrying amount of a reporting unit exceeds its fair value, the amount of the impairment loss must be measured.
The impairment loss would be calculated by comparing the implied fair value of goodwill to its carrying amount. In calculating the implied fair value of the reporting unitunit’s goodwill, the presentfair value of the reporting unit’s expected future cash flowsunit is allocated to all of the other assets and liabilities of that unit based on their fair values. The excess of the present value of the reporting unit’s expected future cash flowsfair value over the amount assigned to its other assets and liabilities is the implied fair value of goodwill. An impairment loss would be recognized when the carrying amount of goodwill exceeds its implied fair value.
Determining the fair value of a reporting unit or an indefinite-lived purchased intangible asset is judgmental in nature and involves the use of significant estimates and assumptions. These estimates and assumptions include revenue growth rates and operating margins used to calculate projected future cash flows, risk-adjusted discount rates, future economic and market conditions and the determination of appropriate market comparables. In addition, we make certain judgments and assumptions in determining our reporting units. We base our fair value estimates on assumptions we believe to be reasonable but that are unpredictable and inherently uncertain. Actual future results may differ from those estimates.
We have not made any material changes in our impairment loss assessment methodology during the past three fiscal years. We continue to estimate the fair value of our reporting unitsunit to be in excess of theirits carrying value, and therefore have not recorded any impairment. However, we noted a decrease inThe amount by which the amount of excess fair value over the carrying value of our reporting units caused primarily byunit exceeded its book value utilizing the slowing economyincome and credit market disruptions.approaches ranged from 41 percent to 50 percent and therefore we concluded our goodwill was not impaired at December 31, 2011. We do not believe there is a reasonable likelihood that there will be a material change in the future estimates or assumptions we use to test for impairment losses on goodwill. However, if actual results are not consistent with our estimates and assumptions we may be exposed to material impairment charges.
Income Taxes
We calculate our current and deferred tax provisions based on estimates and assumptions that may differ from the actual results reflected in our income tax returns filed during the subsequent year. We record adjustments based on filed returns when we have identified and finalized them, which is generally in the third and fourth quarters of the subsequent year for U.S. federal and state provisions, respectively.
We recognize deferred tax assets and liabilities for the expected tax consequences of temporary differences between the tax basis of assets and liabilities and their reported amounts using enacted tax rates in effect for the year in which we expect the differences to reverse. We record a valuation allowance to reduce the deferred tax assets to the amount that we are more likely than not to realize. We have considered future market growth, forecasted earnings, future taxable income, the mix of earnings in the jurisdictions in which we operate and prudent and feasible tax planning strategies in determining the need for a valuation allowance. In the event we were to determine that we would not be able to realize all or part of our net deferred tax assets in the future, we would increase the valuation allowance and make a corresponding charge to earnings in the period in which we make such determination. Likewise, if we later determine that we are more likely than not to realize the net deferred tax assets, we would reverse the applicable portion of the previously provided valuation allowance. In order for us to realize our deferred tax assets we must be able to generate sufficient taxable income in the tax jurisdictions in which the deferred tax assets are located.
Our effective tax rate includes the impact of certain undistributed foreign earnings for which we have not provided U.S. taxes because we plan to reinvest such earnings indefinitely outside the United States. The decision to reinvest our foreign earnings indefinitely outside the United States is based on our projected cash flow needs as well as the working capital and long-term investment requirements of our foreign subsidiaries and our domestic operations. Material changes in our estimates of cash, working capital and long-term investment requirements in the various jurisdictions in which we do business may impact our effective tax rate.
We are subject to income taxes in the United States and foreign countries, and we are subject to routine corporate income tax audits in many of these jurisdictions. We believe that our tax return positions are fully supported, but tax
27
expense includes amounts intended to satisfy income tax assessments that result from these challenges in accordance with Financial Accounting Standards Board (“FASB”) Interpretation No. 48, “Accountingthe accounting for Uncertaintyuncertainty in Income Taxes, an interpretation of FASB Statement No. 109” (“FIN 48”).income taxes prescribed by U.S. GAAP. Determining the income tax expense for these potential assessments and recording the related assets and liabilities requires management judgments and estimates.
We evaluate ourhave recorded a liability for uncertain tax positions in accordance with FIN 48.of $5.6 million at December 31, 2011. We believe that our reserve for uncertain tax positions, including related interest and penalties, is adequate. We have recorded a liability for uncertain tax positions of $8.7 million at December 31, 2008. The amounts ultimately paid upon resolution of audits may be materially different from the amounts previously included in our income tax expense and, therefore, may have a material impact on our tax provision, net income and cash flows. Our reserve for uncertain tax positions is primarily attributable primarily to uncertainties concerning the tax treatment of our international operations, including the allocation of income among different jurisdictions, and any related interest. We review our reserves quarterly, and we may adjust such reserves due to proposed assessments by tax authorities, changes in facts and circumstances, issuance of new regulations or new case law, previously unavailable information obtained during the course of an examination, negotiations between tax authorities of different countries concerning our transfer prices, execution of advanced pricing agreements, resolution with respect to individual audit issues, the resolution of entire audits, or the expiration of statutes of limitations.
Stock-Based Compensation Expense
Stock-based compensation expense for each employee and director is presented in the same income statement caption as their cash compensation. During the year ended December 31, 2008, 2007 and 2006, we recorded $4.2 million, $3.5 million and $3.1 million, respectively, in pre-tax stock-based compensation expense. The income tax benefit associated with stock-based compensation expense was $1.5 million, $1.2 million and $1.0 million for the years ended December 31, 2008, 2007 and 2006, respectively.
| (in thousands) | 2008 | 2007 | 2006 | |||||||||
| Cost of sales | $ | 17 | $ | 31 | $ | 26 | ||||||
| Research and development | 356 | 418 | 370 | |||||||||
| Selling, general and administrative | 3,870 | 3,072 | 2,721 | |||||||||
| Total stock-based compensation expense | $ | 4,243 | $ | 3,521 | $ | 3,117 | ||||||
| (in thousands) | 2011 | 2010 | 2009 | |||||||||
Cost of sales | $ | 15 | $ | 55 | $ | 33 | ||||||
Research and development | 267 | 452 | 434 | |||||||||
Selling, general and administrative | 4,229 | 4,459 | 3,845 | |||||||||
|
|
|
|
|
| |||||||
Total stock-based compensation expense | $ | 4,511 | $ | 4,966 | $ | 4,312 | ||||||
|
|
|
|
|
| |||||||
Selling, general and board members and 8,000 stock options to non-executive employees.
Selling, general and administrative expense includes pre-tax stock-based compensation related to stock option awards granted to outside directors of $0.1 million, $0.3 million and $0.3 million for the years ended December 31, 2011, 2010 and 2009, respectively. We issue stock option awards to the outside directors for services performed. Compensation expense for these stock option awards is recognized on a straight-line basis over the requisite service period of three years.
Stock Option Grants
During the first quarter of 2008, as part of our annual compensation review cycle,year ended December 31, 2011, the Compensation Committee of theand Board of Directors granted 115,926 shares of restricted107,600 stock options to our executivesemployees with an aggregate grant date fair value of $1.5 million under various stock incentive plans. The stock options granted to employees during 2011 consisted of the 2006 Stock Incentive Plan. These awardsfollowing:
| (in thousands, except share amounts) | ||||||||||
Stock Option Grant Date | Number of Shares Underlying Options | Grant Date Fair Value | Vesting Period | |||||||
| January 26,2011 | 15,000 | $ | 192 | 4 -Year Vesting Period (25% each year) | ||||||
| April 6, 2011 | 92,600 | 1,286 | 3 -Year Vesting Period (8.33% each quarter) | |||||||
|
|
|
| |||||||
| 107,600 | $ | 1,478 | ||||||||
|
|
|
| |||||||
During the year ended December 31, 2011, we recognized $0.3 million of pre-tax stock-based compensation expense related to our 2011 stock option grants.
At December 31, 2011, there was $2.2 million of unrecognized pre-tax stock-based compensation expense related to non-vested stock options which we expect to recognize over a weighted-average period of 2.0 years.
During the annual review cycle for 2011, the Compensation Committee granted our Named Executives 148,200 stock options. The options were granted as part of long-term incentive compensation to assist us in meeting our performance and retention objectives. Each executive’sThe grant, dated February 8, 2012, is subject to a three-year vesting period.period (8.33% each quarter). The stock-based compensation expense included in SG&A related to this awardtotal grant date fair value of these awards was $0.9 million for$1.4 million.
Restricted Stock Grants
During the year ended December 31, 2008.
| (in thousands, except share amounts) | ||||||||||
Restricted Stock Grant Date | Number of Shares Granted | Grant Date Fair Value | Vesting Period | |||||||
| April 6, 2011 | 43,900 | $ | 1,284 | 3 -Year Vesting Period (8.33% each quarter) | ||||||
| July 15, 2011 | 100,000 | 2,454 | 3 -Year Vesting Period (8.33% each quarter) | |||||||
| October 10, 2011 | 2,540 | 45 | 3 -Year Vesting Period (8.33% each quarter) | |||||||
|
|
|
| |||||||
| 146,440 | $ | 3,783 | ||||||||
|
|
|
| |||||||
In accordanceaddition to the grants to employees, 30,000 shares of restricted stock with SFAS 123R,a grant date fair value of $0.8 million were granted to our outside directors on July 1, 2011 as a part of their annual compensation package. These shares are subject to a one-year vesting period (25% each quarter).
During the year ended December 31, 2011, we recognized $1.1 million of pre-tax stock-based compensation expense related to our 2011 restricted stock awards is determined based on the fair value of the shares awarded on the grant date. We determined the fair value of the restricted stock utilizing the
28
During the annual review cycle for 2011, the Compensation Committee granted our Named Executives 71,300 restricted stock awards. The awards were granted as part of long-term incentive compensation to assist us in meeting our performance and retention objectives. The grant, dated February 8, 2012, is subject to a three-year vesting period (8.33% each quarter). The total grant date fair value of these awards was $1.4 million.
Determining the appropriate fair value model and calculating the fair value of share-based payment awards requires the utilization of highly subjective assumptions, including the expected life and forfeiture rate of the share-based payment awards and stock price volatility. Management determined that historical volatility calculated based on our actively traded common stock is a better indicator of expected volatility and future stock price trends than implied volatility. The assumptions used in calculating the fair value of share-based payment awards represent management’s best estimates, but these estimates involve inherent uncertainties and the application of management’s judgment. As a result, if factors change and we use different assumptions, our stock-based compensation expense may be materially different in the future.
We do not believe it is reasonably likely that there will be a material change in the future estimates or assumptions used to determine stock-based compensation expense. However, if actual results are not consistent with our estimates and assumptions we may be exposed to material stock-based compensation expense. Refer to “ITEM 8. FINANCIAL STATEMENTS AND SUPPLEMENTARY DATA -— Notes to Consolidated Financial Statements — Note 11”16” for additional disclosure regarding stock-based compensation expense.
Results of Operations
The following table sets forth our results of operations expressed as a percentage of net sales for the periods indicated.
| Year Ended December 31, | ||||||||||||||||||||||||
| (in thousands) | 2008 | 2007 | 2006 | |||||||||||||||||||||
| Net sales | $ | 287,100 | 100.0 | % | $ | 272,680 | 100.0 | % | $ | 235,846 | 100.0 | % | ||||||||||||
| Cost of sales | 190,910 | 66.5 | 173,329 | 63.6 | 149,970 | 63.6 | ||||||||||||||||||
| Gross profit | 96,190 | 33.5 | 99,351 | 36.4 | 85,876 | 36.4 | ||||||||||||||||||
| Research and development expenses | 8,160 | 2.8 | 8,820 | 3.2 | 7,412 | 3.1 | ||||||||||||||||||
| Selling, general and administrative expenses | 67,269 | 23.5 | 64,080 | 23.5 | 59,947 | 25.4 | ||||||||||||||||||
| Operating income | 20,761 | 7.2 | 26,451 | 9.7 | 18,517 | 7.9 | ||||||||||||||||||
| Interest income | 3,017 | 1.1 | 3,104 | 1.1 | 1,401 | 0.5 | ||||||||||||||||||
| Other income (expense), net | 311 | 0.1 | 7 | 0.0 | (498 | ) | (0.2 | ) | ||||||||||||||||
| Income before income taxes | 24,089 | 8.4 | 29,562 | 10.8 | 19,420 | 8.2 | ||||||||||||||||||
| Provision for income taxes | 8,283 | 2.9 | 9,332 | 3.4 | 5,900 | 2.5 | ||||||||||||||||||
| Net income | $ | 15,806 | 5.5 | % | $ | 20,230 | 7.4 | % | $ | 13,520 | 5.7 | % | ||||||||||||
| Year Ended December 31, | ||||||||||||||||||||||||
| (in thousands) | 2011 | 2010 | 2009 | |||||||||||||||||||||
Net sales | $ | 468,630 | 100.0 | % | $ | 331,780 | 100.0 | % | $ | 317,550 | 100.0 | % | ||||||||||||
Cost of sales | 338,569 | 72.2 | 227,931 | 68.7 | 215,938 | 68.0 | ||||||||||||||||||
|
|
|
|
|
|
|
|
|
|
|
| |||||||||||||
Gross profit | 130,061 | 27.8 | 103,849 | 31.3 | 101,612 | 32.0 | ||||||||||||||||||
Research and development expenses | 12,267 | 2.6 | 10,709 | 3.2 | 8,691 | 2.7 | ||||||||||||||||||
Selling, general and administrative expenses | 91,218 | 19.5 | 71,839 | 21.7 | 70,974 | 22.4 | ||||||||||||||||||
|
|
|
|
|
|
|
|
|
|
|
| |||||||||||||
Operating income | 26,576 | 5.7 | 21,301 | 6.4 | 21,947 | 6.9 | ||||||||||||||||||
Interest (expense) income, net | (270 | ) | (0.1 | ) | 34 | 0.0 | 471 | 0.1 | ||||||||||||||||
Other (expense) income, net | (1,075 | ) | (0.2 | ) | 523 | 0.2 | (241 | ) | (0.0 | ) | ||||||||||||||
|
|
|
|
|
|
|
|
|
|
|
| |||||||||||||
Income before income taxes | 25,231 | 5.4 | 21,858 | 6.6 | 22,177 | 7.0 | ||||||||||||||||||
Provision for income taxes | 5,285 | 1.1 | 6,777 | 2.0 | 7,502 | 2.4 | ||||||||||||||||||
|
|
|
|
|
|
|
|
|
|
|
| |||||||||||||
Net income | $ | 19,946 | 4.3 | % | $ | 15,081 | 4.6 | % | $ | 14,675 | 4.6 | % | ||||||||||||
|
|
|
|
|
|
|
|
|
|
|
| |||||||||||||
The comparability of information between 2011 and prior years is affected by the acquisition of Enson during the fourth quarter of 2010. See “ITEM 7. MANAGEMENT’S DISCUSSION AND ANALYSIS OF FINANCIAL CONDITION AND RESULTS OF OPERATIONS” and “ITEM 8. FINANCIAL STATEMENTS AND SUPPLEMENTARY DATA — Notes to Consolidated Financial Statements — Note 21” for further information.
Year Ended December 31, 20082011 Compared to Year Ended December 31, 2007
Consolidated
Net sales for the year ended December 31, 20082011 were $287.1$468.6 million, an increase of 5%41.2% compared to $272.7$331.8 million for the same period last year. Net income for 20082011 was $15.8$19.9 million or $1.09$1.31 per diluted share compared to $20.2$15.1 million or $1.33$1.07 per diluted share for 2007.
| 2008 | 2007 | |||||||||||||||
| $ (millions) | % of total | $ (millions) | % of total | |||||||||||||
| Net sales: | ||||||||||||||||
| Business | $ | 231.5 | 80.6 | % | $ | 214.7 | 78.7 | % | ||||||||
| Consumer | 55.6 | 19.4 | % | 58.0 | 21.3 | % | ||||||||||
| Total net sales | $ | 287.1 | 100.0 | % | $ | 272.7 | 100.0 | % | ||||||||
| 2011 | 2010 | |||||||||||||||
| $ (millions) | % of total | $ (millions) | % of total | |||||||||||||
Net sales: | ||||||||||||||||
Business | $ | 421.4 | 89.9 | % | $ | 282.9 | 85.3 | % | ||||||||
Consumer | 47.2 | 10.1 | % | 48.9 | 14.7 | % | ||||||||||
|
|
|
|
|
|
|
| |||||||||
Total net sales | $ | 468.6 | 100.0 | % | $ | 331.8 | 100.0 | % | ||||||||
|
|
|
|
|
|
|
| |||||||||
Net sales in our Business lines (subscription broadcasting, OEM, and computing companies) were approximately 81%90% of net sales for 20082011 compared to approximately 79%85% for 2007.2010. Net sales in our business lines for 2008
29
Net sales in our Consumer lines (One For All®retail, private label, custom installers, and direct import) were approximately 19%10% of net sales for 20082011 compared to approximately 21%15% for 2007. Net sales in our consumer lines for 2008 decreased by 4% to $55.6 million from $58.0 million in 2007. The sales were negatively impacted by the weakening of the British Pound compared to the U.S. dollar, which resulted in a decrease in net sales of approximately $2.1 million. The strengthening of the Euro compared to the U.S. dollar positively impacted sales, which resulted in an increase of $1.0 million. Net of the currency effect, retail sales outside of the United States were down by $3.1 million, primarily due to lower sales in the UK, Spain and France. Additionally, Private Label sales in the United States decreased by $1.2 million, or 38%, to $2.0 million in 2008 from $3.2 million in 2007. Partially offsetting these decreases is our expanding presence in the custom electronic design & installation association (“CEDIA”) market which increased sales by $2.2 million, or 47%, from 2007. In addition, other US Retail increased by $0.8 million, from $1.2 million in 2007 to $2.0 million in 2008, due to customer wins.
30
| 2007 | 2006 | |||||||||||||||
| $ (millions) | % of total | $ (millions) | % of total | |||||||||||||
| Net sales: | ||||||||||||||||
| Business | $ | 214.7 | 78.7 | % | $ | 178.8 | 75.8 | % | ||||||||
| Consumer | 58.0 | 21.3 | % | 57.0 | 24.2 | % | ||||||||||
| Total net sales | $ | 272.7 | 100.0 | % | $ | 235.8 | 100.0 | % | ||||||||
31
Gross profit for 2007, which decreased by $0.9 million, or 44%, to $1.2 million in 2007, down from $2.1 million in 2006. This2011 was due to a decline in royalty revenue and a decline in the volume of Kameleon sales. Additionally, Private Label sales decreased by $0.3 million, or 9%, to $3.2 million in 2007 from $3.5 million in 2006. This was due to a decline in the volume of Kameleon sales in the United States.
Research and development expenses increased 15% to $12.3 million in 2011 from $10.7 million in 2010. The increase is comparableprimarily due to 2006.additional labor dedicated to general research & development activities in an effort to continue to develop new technologies and products.
Selling, general and administrative (“SG&A”) expenses increased 27% to $91.2 million in 2011 from $71.8 million in 2010. The gross profitstrengthening of the Euro compared to the U.S. dollar resulted in an increase of $1.2 million. Excluding the currency effect, SG&A expenses increased by $18.2 million, primarily due to an increase of $17.2 million of operating expenses from Enson, which included an increase of $2.1 million of intangibles’ amortization expense during 2011. In addition, total wages increased by $0.9 million and our newly established operating entity in Brazil increased operating expenses by $1.8 million. Partially offsetting these increases was a reduction in bonus expense of $1.8 million.
Net interestwas $270 thousand of expense in 2011 compared to $34 thousand of income in 2010. The increase in interest expense is due to the drawing on our line of credit during 2011.
Income tax expense was $5.3 million in 2011 compared to $6.8 million in 2010. Our effective tax rate was positively21.0% in 2011 compared to 31.0% in 2010. The decrease in our effective tax rate was due primarily to a higher percentage of income earned in lower tax rate jurisdictions, the statute of limitations expiring during 2011 on certain tax positions recorded in the United States, and lower interest expense resulting from fewer uncertain tax positions.
Year Ended December 31, 2010 Compared to Year Ended December 31, 2009
Consolidated
Net sales for the year ended December 31, 2010 were $331.8 million, an increase of 4% compared to $317.6 million for the same period last year. Net income for 2010 was $15.1 million or $1.07 per diluted share compared to $14.7 million or $1.05 per diluted share for 2009.
| 2010 | 2009 | |||||||||||||||
| $ (millions) | % of total | $ (millions) | % of total | |||||||||||||
Net sales: | ||||||||||||||||
Business | $ | 282.9 | 85.3 | % | $ | 262.5 | 82.7 | % | ||||||||
Consumer | 48.9 | 14.7 | % | 55.1 | 17.3 | % | ||||||||||
|
|
|
|
|
|
|
| |||||||||
Total net sales | $ | 331.8 | 100.0 | % | $ | 317.6 | 100.0 | % | ||||||||
|
|
|
|
|
|
|
| |||||||||
Net sales in our Business lines (subscription broadcasting, OEM, and computing companies) were approximately 85% of net sales for 2010 compared to approximately 83% for 2009. Net sales in our business lines for 2010 increased by approximately 8% to $282.9 million from $262.5 million in 2009. This increase in net sales resulted primarily from the November 2010 acquisition of Enson, which added several significant customers and contributed $25.0 million in sales in 2010. Excluding the net sales which resulted from the acquisition of Enson, the business category decreased by $4.6 million. This was the result of a significant customer returning to a more traditional dual source arrangement during the first quarter of 2010 after purchasing the majority of its remotes from us during 2009. We were able to partially offset this loss by acquiring new customers both domestically and internationally.
Net sales in our Consumer lines (One For All®retail, private label, custom installers, and direct import) were approximately 15% of net sales for 2010 compared to approximately 17% for 2009. Net sales in our Consumer lines for 2010 decreased by 11% to $48.9 million from $55.1 million in 2009. Net sales in North American retail decreased by $4.0 million, or 46%, from $8.8 million in 2009 to $4.8 million in 2010. In addition, our custom installer sales decreased by $3.3 million, from $6.2 million in 2009 to $2.9 million in 2010. Partially offsetting these decreases was a $1.1 million increase in international retail sales, from $40.1 million in 2009 to $41.2 million in 2010. The 2010 net sales in our Consumer lines were negatively impacted by the strengtheningweakening of both the Euro and the British Pound compared to the U.S. dollar, which resulted in an increasea decrease in net sales of approximately $3.6$1.4 million. Net of the unfavorable currency effect, international retail sales increased by $2.5 million due primarily to the analog to digital transition that took place in grosssome European countries.
Gross profit or an increase for 2010 was $103.8 million compared to $101.6 million for 2009. Gross profit as a percent of 0.8%sales decreased to 31.3% in 2010 from 32.0% in 2009, due primarily to the following:
A fair value adjustment made to inventory and fixed assets acquired in the Enson acquisition resulted in a decrease of 0.5% in the gross profit rate. A decrease in royalty expense of $1.4 million, due to lower sales of SKY-branded retail product in Europe, increased the gross profit rate by 0.7%. Offsetting the increases in the gross profit rate was an increase in freight and handling expense of $2.7 million in 2007 as compared to 2006, which reduced the gross profit rate by 0.8%. Themargin rate;
An increase in freight expense is due primarily to an increasecaused a decrease of 0.4% in the percentage of units that were shipped by air; air freight is significantly more costly than ocean freight. Additionally, subscription broadcast sales, which generally havegross margin rate;
Sales mix, as a lower gross profit rate as compared to our other sales, represented a largerhigher percentage of our total business. The impactsales was comprised of this changeour lower margin Business category, resulted in mix was a 0.7% reductiondecrease of 0.3% in the gross profit rate.margin rate;
Foreign currency fluctuations caused a decrease of 0.2% in the gross margin rate, driven by the weakening of the Euro and British Pound as compared to the U.S. dollar;
A decrease in inventory scrap expense, resulting from a lower return rate, improved the gross margin rate by 0.4%; and
A decrease in sub-contract labor, resulting primarily from less rework, caused an increase of 0.3% in the gross margin.
Research and development expenses increased 19%23% from $7.4$8.7 million in 20062009 to $8.8$10.7 million in 2007.2010. The increase is primarily relateddue to internal, as well as, third party costs associated with the continued expansion of the Nevo® platformadditional labor dedicated to general research & development activities in an effort to continue to develop new technologies and the development of products for sale in our subscription broadcasting, retail, and OEM channels.
Selling, general and administrative expenses increased 7%1% from $59.9$71.0 million in 20062009 to $64.1$71.8 million in 2007. Payroll and benefits increased by $2.6 million due to new hires and merit increases;2010. The weakening of the strengthening of both the Euro and British Pound compared to the U.S. dollar resulted in a decrease of $1.3 million; net of the currency effect, selling, general and administrative expenses increased by $2.1 million. This increase was driven primarily by an increase in employee bonus expense of $2.4$1.5 million. Additionally, travel expense increased $0.5 million; long-term incentive compensation increased by $1.0 million; delivery, freight, and handling costs increased by $0.7 million; additional travel resulted in an increase of $0.6 million; director’s fees and expensesadvertising expense increased by $0.4 million; and bad debt expense increased $0.4 million. Partially offsetting these increases was a decline in commission expense increased by $0.2 million. These items were partially offset by lower employee bonus expense, which decreased by $4.0 million.
Net interest income compared to $1.4 million net for 2006. This increase is due to higher money market rates and a higher average cash balance.
Income tax expense of $9.3was $6.8 million in 20072010 compared to $5.9$7.5 million in 2006.2009. Our effective tax rate was 31.6%31.0% in 20072010 compared to 30.4%33.8% in 2006.2009. The increasedecrease in our effective tax rate iswas due primarily to additionala higher percentage of income earned in higher tax-rate jurisdictions.
32lower tax rate jurisdictions, the statute of limitations expiring during 2010 on certain tax positions recorded in the United States, and lower interest expense resulting from fewer uncertain tax positions.
Sources and Uses of Cash
| Year Ended | Year Ended | Year Ended | ||||||||||||||||||
| December 31, | Increase | December 31, | Increase | December 31, | ||||||||||||||||
| (In thousands) | 2008 | (Decrease) | 2007 | (Decrease) | 2006 | |||||||||||||||
| Cash provided by operating activities | $ | 30,152 | $ | 10,215 | $ | 19,937 | $ | 2,725 | $ | 17,212 | ||||||||||
| Cash used for investing activities | (7,420 | ) | (1,237 | ) | (6,183 | ) | (1,115 | ) | (5,068 | ) | ||||||||||
| Cash (used for) provided by financing activities | (25,187 | ) | (26,585 | ) | 1,398 | (3,785 | ) | 5,183 | ||||||||||||
| Effect of exchange rate changes on cash | (8,917 | ) | (14,300 | ) | 5,383 | 276 | 5,107 | |||||||||||||
| December 31, 2008 | (Decrease) | December 31, 2007 | ||||||||||
| Cash and cash equivalents | $ | 75,238 | $ | (11,372 | ) | $ | 86,610 | |||||
| Working capital | 122,303 | (18,027 | ) | 140,330 | ||||||||
| (In thousands) | Year Ended December 31, 2011 | Increase (Decrease) | Year Ended December 31, 2010 | Increase (Decrease) | Year Ended December 31, 2009 | |||||||||||||||
Cash provided by operating activities | $ | 14,800 | $ | (23,339 | ) | $ | 38,139 | $ | 14,152 | $ | 23,987 | |||||||||
Cash used for investing activities | (14,694 | ) | 20,149 | (34,843 | ) | 31,248 | (66,091 | ) | ||||||||||||
Cash (used for) provided by financing activities | (26,269 | ) | (49,544 | ) | 23,275 | 27,497 | (4,222 | ) | ||||||||||||
Effect of exchange rate changes on cash | 1,286 | 2,624 | (1,338 | ) | (1,442 | ) | 104 | |||||||||||||
| December 31, 2011 | Increase (Decrease) | December 31, 2010 | ||||||||||
Cash and cash equivalents | $ | 29,372 | $ | (24,877 | ) | $ | 54,249 | |||||
Working capital | 84,761 | 19,158 | 65,603 | |||||||||
Net cash provided by operating activitiesin 2008 was $30.2 decreased $23.3 million compared to $19.9 million and $17.2 million during 2007 and 2006, respectively. The increase in cash flows from operating activities in 2008 compared to 2007 was primarily due to an increase in accounts payable. Accounts payable increased at a higher ratefor the twelve months ended December 31, 2011 compared to the prior yeartwelve months ended December 31, 2010. Cash flows decreased by $25.5 million during 2011 due to improved vendor management, including negotiating better paymentincreased inventories. In the second quarter of 2011, we altered our shipping terms with a significant customer that results in us holding title to inventories until the shipments are received by this particular customer. We also increased our investment in safety stock on certain significant vendors.
Net cash provided by operating activities for 2007in 2010 was $19.9$38.1 million compared to $17.2$24.0 million during 2006.2009. The increaseimprovement in cash flowsflow from operations in 2007 comparedfrom 2009 to 2006 was2010 is due primarily due to the increasestrong collection of receivables that were acquired in net incomethe acquisition of 50%Enson Assets Limited. We acquired approximately $37.6 million of receivables from $13.5Enson Assets Limited on November 4, 2010; however, Enson’s receivable balance as of December 31, 2010 was approximately $26.0 million, in 2006 to $20.2reflecting cash inflows of approximately $11.6 million in 2007, offset partially by an increase in days sales outstanding and a decrease in inventory turns. Days sales outstanding were approximately 82 for the aforementioned two month period. Inventories increased from December 31, 2009 to December 31, 2010 as a result of anticipated increased demand in 2011. In addition, our fourth quarter 2007 compared to approximately 67 for2010 net sales were towards the fourth quarter 2006. Our days sales outstanding increased due to certain customers delaying payment beyond their respective payment terms.
Net cash used for investing activitiesduring 20082011 was $7.4$14.7 million as compared to $6.2$34.8 million and $5.1$66.1 million of net cash used during 20072010 and 2006,2009, respectively. The increase inDuring 2011, cash used for investing activities in 2008 compared to 2007 was due to increased capital expenditures. Capital expenditures in 2008, 2007, and 2006 were $5.9 million, $4.8 million and $4.1 million, respectively. During the first quarter of 2008, we completed our renovation and expansionconsisted of our corporate headquarters. The total cost of this renovation was approximately $2.0investments in property, plant, and equipment as well as internally developed patents. During 2010, our $49.2 million time deposit investment matured, which was financed throughinitially entered into during 2009. The cash proceeds from the time deposit were used to purchase Enson during 2010, which amounted to a $74.1 million cash outflow net of cash acquired. During 2009, we acquired intangible assets and goodwill of $9.5 million from Zilog. Please refer to “ITEM 8. FINANCIAL STATEMENTS AND SUPPLEMENTARY DATA — Notes to Consolidated Financial Statements — Notes 7 and 21” for additional disclosure regarding our operationsacquisition of Enson and a $0.4 million tenant improvement allowance from our lessor. In 2008, we also began to make a significant investment to upgrade our information systems, which we expect to cost approximately $1.0 million. We had $0.3 million of capitalized costs related to this system upgrade at December 31, 2008. The strategic planning for the upgrade of our information systems commenced in the second quarter of 2007 and we expect implementation to be completed in 2009. In addition, in order to support our sales growth, the annual purchase of tooling equipment has increased throughout the years.
Net cash used for financing activitieswas $25.2$26.3 million during 20082011 compared to net cash provided by financing activities of $1.4 million and $5.2$23.3 million during 20072010 and 2006, respectively.net cash used for financing activities of 4.2 million during 2009. During 2011, we made debt payments totaling $22.8 million of the $41.0 million of debt we incurred during 2010 to fund the acquisition of Enson Assets Limited. We drew $4.2 million from our line of credit during the second half of 2011. Proceeds from stock option exercises were $1.2$1.7 million during 2008,2011 compared to proceeds of $12.6$2.0 million and $7.5$3.3 million during 20072010 and 2006, respectively. In 2008, gains from stock option exercises resulted in a $0.3 million excess tax benefit compared to $3.3 million and $0.3 million for 2007 and 2006,2009, respectively. In addition, we purchased 1,118,318456,964 shares of our common stock at a cost of $26.7$9.8 million during 2008,2011, compared to 471,300505,692 and 127,326404,643 shares at a cost of $14.5$10.1 million and $2.6$7.7 million during 20072010 and 2006,2009, respectively. We hold these shares as treasury stock and they are available for reissue. Presently, except for using a minimal number of these treasury shares to compensate our
33
On February 11, 2010, our Board of Directors authorized management to continue repurchasing up to 1,000,000 shares of our issued and outstanding common stock. Repurchases may be made to manage dilution created by shares issued under our stock incentive plans or whenever we deem a repurchase is a good use of our cash and the price to be paid is at or below a threshold approved by our Board. As of December 31, 2006, we amended our original Credit Facility with Comerica Bank, extending our line of credit through August 31, 2009. Under the amended Credit Facility,2011, we have the authority to acquire up to an additional 2.0 millionrepurchased 930,090 shares of our common stock in the open market. From August 31, 2006 through December 31, 2008, we purchased 1,686,218under this authorization, leaving 69,910 shares available for repurchase.
On October 26, 2011, our Board of Directors authorized management to repurchase an additional 1,000,000 shares of our issued and outstanding common stock, leaving 313,782stock. We did not repurchase any shares available for purchase under the Credit Facility. During 2009, we may continue to purchase sharesBoard authorization approved on October 26, 2011 as of our common stock if we believe conditions are favorable and to offset the dilutive effect of our stock-based compensation.
Contractual Obligations
The following table summarizes our contractual obligations and the effect these obligations are expected to have on our liquidity and cash flow in future periods.
| Payments Due by Period | ||||||||||||||||||||
| Less than | 1 - 3 | 4 - 5 | After | |||||||||||||||||
| (in thousands) | Total | 1 year | Years | years | 5 years | |||||||||||||||
| Contractual obligations: | ||||||||||||||||||||
| Operating lease obligations | $ | 5,253 | $ | 1,762 | $ | 2,660 | $ | 831 | $ | — | ||||||||||
Purchase obligations(1) | 60,772 | 8,212 | 27,040 | 21,520 | 4,000 | |||||||||||||||
| Total contractual obligations | $ | 66,025 | $ | 9,974 | $ | 29,700 | $ | 22,351 | $ | 4,000 | ||||||||||
| Payments Due by Period | ||||||||||||||||||||
| (in thousands) | Total | Less than 1 year | 1 - 3 years | 4 - 5 years | After 5 years | |||||||||||||||
Contractual obligations: | ||||||||||||||||||||
Operating lease obligations | $ | 7,452 | $ | 2,366 | $ | 3,311 | $ | 1,696 | $ | 79 | ||||||||||
Purchase obligations(1) | 55,926 | 1,926 | 14,400 | 39,600 | — | |||||||||||||||
|
|
|
|
|
|
|
|
|
| |||||||||||
Total contractual obligations | $ | 63,378 | $ | 4,292 | $ | 17,711 | $ | 41,296 | $ | 79 | ||||||||||
|
|
|
|
|
|
|
|
|
| |||||||||||
| (1) | Purchase obligations primarily include contractual payments to purchase |
Liquidity
Historically, we have utilized cash provided from operations as our primary source of liquidity, as internally generated cash flows have been sufficient to support our business operations, capital expenditures acquisitions and discretionary share repurchases. We believe our current cash balances and anticipated cash flow to be generated from operations will be sufficient to cover cash outlays expected during 2012.
We are able to supplement this near termnear-term liquidity, if necessary, with credit line facilities made available to us. Our liquidity is subject to various risks including the market risks identified in the section entitled “Qualitative and Quantitative Disclosures about Market Risk” in Item 7A.
| On December 31, | ||||||||||||
| 2011 | 2010 | 2009 | ||||||||||
Cash and cash equivalents | $ | 29,372 | $ | 54,249 | $ | 29,016 | ||||||
Term deposit | — | — | 49,246 | |||||||||
Total debt | 16,400 | 35,000 | — | |||||||||
Available borrowing resources | 18,000 | 33,766 | 15,000 | |||||||||
On December 31, 2011, we had an outstanding balance of $14.4 million related to our Credit Facility, as discussed below.
During 2011, the maximum balance on our line of credit was $2.2 million and the average principal outstanding was $0.6 million. We had a drawing of $2.2 million during September 2011. The interest rate was constant at 3.25% during the 23 calendar days the $2.2 million was outstanding. We paid the $2.2 million back during September 2011. We had a drawing of $2.0 million during October 2011 and paid it back during the first quarter of 2012. The average interest rate was 2.05% during the 87 calendar days the $2.0 million was outstanding. These drawings were utilized to supplement our cash flows from operations.
Our U.S. Bank credit agreement is secured by sixty-five percent of Enson Assets Limited. Amounts available for borrowing are reduced by the balance of any outstanding import letters of credit and are subject to certain quarterly financial covenants related to our cash flow, fixed charges, quick ratio, and net income. On March 2, 2012, we entered into an amendment adjusting the quick ratio effective December 31, 2011. We were not in breach of our debt covenants on December 31, 2011.
Our working capital needs have typically been greatest during the third and fourth quarters when accounts receivable and inventories increase in connection with the fourth quarter holiday selling season. At December 31, 2008,2011, we had $122.3$84.8 million of working capital as compared to $140.3$65.6 million at December 31, 2007.
Our cash and cash equivalent balances are held in numerous locations throughout the world. The majority of our cash is held outside of the United States Europe, and Asia. Atmay be repatriated to the United States but, under current law, would be subject to United States federal income taxes, less applicable foreign tax credits. Repatriation of some foreign balances is restricted by local laws. We have not provided for the United States federal tax liability on these amounts for financial statement purposes as this cash is considered indefinitely reinvested outside of the United States. Our intent is to meet our domestic liquidity needs through ongoing cash flows, external borrowings, or both. We utilize a variety of tax planning strategies in an effort to ensure that our worldwide cash is available in the locations in which it is needed.
On December 31, 2008,2011, we had approximately $8.4$4.1 million, $6.1$7.6 million, $16.5 million, $0.1 million, and $60.7$1.1 million of cash and cash equivalents in the United States, Europe, Asia, Cayman Islands and Asia,South America, respectively. We maintain our cash and cash equivalents with various financial institutions located
34
For further information regarding our original Credit Facility with Comerica, extending our line of credit through August 31, 2009. The amended Credit Facility provides a $15 million unsecured revolving credit agreement with Comerica. Under the Credit Facility, the interest payable is variable and is based on the bank’s cost of funds or the 12-month LIBOR plus a fixed margin of 1.25%. The interest rate in effect as of December 31, 2008 using the 12-month LIBOR plus the fixed margin was 3.25%. We pay a commitment fee ranging from zero to a maximum rate of 0.25% per year on the unused portion of the credit line depending on the amount of cash investment retained with Comerica during each quarter. At December 31, 2008, the commitment fee rate was 0.25%. Under the terms of the Credit Facility, dividend payments are allowed for up to 100% of the prior fiscal year’s net income, to be paid within 90 days of the current fiscal year end. We are subject to certain financial covenants related to our net worth, quick ratio, and net income. Amounts available for borrowing under the Credit Facility are reduced by the outstanding balance of import letters of credit. As of December 31, 2008, we did not have any outstanding import letters of credit and the available balance on the line of credit was $15 million. Furthermore, as of December 31, 2008, we were in compliance with all financial covenants required by the Credit Facility.
It is our policy to carefully monitor the state of our business, cash requirements and capital structure. As previously mentioned, weWe believe that the cash generated from our operations and upon renewal, funds from our Credit Facilitycredit facilities will be sufficient to fundsupport our current business operations as well as anticipated growth at least through the end of 2009;2012; however, there can be no assurance that such funds will be adequate for that purpose. In addition, our Credit Facility is set to expire on August 31, 2009. We are currently negotiating another extension, however we cannot make any assurances that our Credit Facility will be extended to us beyond its expiration date of August 31, 2009 under comparable terms or at all. If this or any other Credit Facility is not available to us at any time when we need to borrow, we would have to use our cash reserves which may have a material adverse effect on our earnings, cash flow and financial position.
Off Balance Sheet Arrangements
Other than the contractual obligations disclosed above, we do not participate in any off balance sheet arrangements.
New Accounting Pronouncements
See “ITEM 8. FINANCIAL STATEMENTS AND SUPPLEMENTARY DATA — Notes to Consolidated Financial Statements — Note 2” for a discussion of new accounting pronouncements.
35
We are exposed to various market risks, including interest rate and foreign currency exchange rate fluctuations. We have established policies, procedures and internal processes governing our management of these risks and the use of financial instruments to mitigate our risk exposure.
Interest Rate Risk
We are exposed to interest rate risk related to our debt. We may withdraw either U.S. dollars or foreign currencies from our credit facilities. Our market risk exposures in connection with the debt are primarily U.S. dollar LIBOR-based floating interest. We estimate that if the 1-month LIBOR or the bank’s prime rate fluctuates 1% from December 31, 2011, interest expense in the first quarter of 2012 would be between approximately $34 thousand and $116 thousand.
On AugustDecember 31, 2006,2011, we amendedhad an outstanding balance of $14.4 million related to our Credit Facility to extendU.S. Bank 1-year term loan facility. The term loan maturity date is November 1, 2012, after extending the term for an additional three years, expiring on August12 months effective October 31, 2009. We are currently negotiating another extension. The2011. Under the U.S. Bank term loan, we may elect to pay interest payable under our revolving Credit Facility with our bank is variable and based on either (i) the bank’s cost of fundsprime rate or (ii) the 12-month LIBOR plus a fixed margin of 1.25%1.5%. The costapplicable LIBOR (1, 3, 6, or 12-month LIBOR) corresponds with the loan period we select. On December 31, 2011, the 1-month LIBOR plus the fixed margin was approximately 1.78% and the bank’s prime rate was 3.25%. If a LIBOR rate loan is prepaid prior to the completion of the Credit Facility is affected by changesloan period, we must pay the bank the difference between the interest the bank would have earned had prepayment not occurred and the interest the bank actually earned. We may prepay prime rate loans in marketwhole or in part at any time without a premium or penalty.
On December 31, 2011, we had an outstanding balance of $2.0 million related to our U.S. Bank secured revolving credit line. Under the U.S. Bank secured revolving credit line, we may elect to pay interest rates, credit risk spreads and credit availability. The interest rate in effectbased on the Credit Facility as of December 31, 2008 using the 12-monthbank’s prime rate or LIBOR option plus a fixed margin of 1.25% was 3.25%1.8%.
Our U.S. Bank credit agreement is secured by sixty-five percent of Enson Assets Limited. Amounts available for borrowing are reduced by the balance of any outstanding import letters of credit and are subject to certain quarterly financial covenants related to our cash flow, fixed charges, quick ratio, and net income. On March 2, 2012, we entered into an amendment adjusting the quick ratio effective December 31, 2011. We were not in breach of our debt covenants on our Credit Facility, however weDecember 31, 2011.
We cannot make any assurances that we will not need to borrow additional amounts under this facilityin the future or that this facilityfunds will be extended to us beyond its expiration date of August 31, 2009 under comparable terms or at all. If this or any other Credit Facilityfunding is not available to us at a time when we need to borrow, we would have to use our cash reserves, including potentially repatriating cash from foreign jurisdictions, which may have a material adverse effect on our earnings,operating results, financial position and cash flow and financial position.
Foreign Currency Exchange Rate Risk
At December 31, 20082011 we had wholly owned subsidiaries in the Argentina, Brazil, Cayman Islands, France, Germany, Hong Kong, India, Italy, the Netherlands, People’s Republic of China, Singapore, Spain, and the United Kingdom. On February 18, 2009, we acquired certain patents, intellectual propertyWe are exposed to foreign currency exchange rate risk inherent in our sales commitments, anticipated sales, anticipated purchases, assets and other assets related to the universal remote control business from Zilog Inc. (“Zilog” — NASDAQ: ZILG) for approximately $9.5 million in cash. In connection with this transaction, we formed a subsidiary in the Cayman Islands. Sales are typicallyliabilities denominated in local currencies thereby creating exposureother than the U.S. dollar. The most significant foreign currencies to changes in exchange rates. Changes in localour operations during 2011 were the Euro, British Pound, Chinese Yuan Renminbi, Indian Rupee, Singapore dollar, and Brazilian Real. For most currencies, we are a net receiver of the foreign currency exchange ratesand therefore benefit from a weaker U.S. dollar and are adversely affected by a stronger U.S. dollar relative to the foreign currency. Even where we are a net receiver, a weaker U.S. dollar and, in some cases, to each other, may positively or negativelyadversely affect our sales, gross margins, operating expenses and net income. The value of our net balance sheet positions held in foreign currency may also be impacted by fluctuating exchange rates.
36
It is difficult to estimate the impact of fluctuations on reported income, as it depends on the opening and closing rates, the average net balance sheet positions held in a foreign currency and the amount of income generated in local currency. We routinely forecast what these balance sheet positions and income generated in local currency may be and we take steps to minimize exposure as we deem appropriate.
The sensitivity of earnings and cash flows to the variability in exchange rates is assessed by applying an approximate range of potential rate fluctuations to our assets, obligations and projected results of operations denominated in foreign currency.currency with all other variables held constant. The analysis covers all of our foreign currency contracts offset by the underlying exposures. Based on our overall foreign currency rate exposure at December 31, 2008,2011, we believe that movements in foreign currency rates may have a material affecteffect on our financial position. We estimate that if the exchange rates for the Euro, British Pound, Chinese Yuan Renminbi, Indian Rupee, and Singapore dollar, and the British PoundBrazilian Real relative to the U.S. dollar fluctuate 10% from December 31, 2008,2011, net income and total cash flows in the first quarter of 20092012 would fluctuate by approximately $0.3$2.6 million and $8.0$2.8 million, respectively.
37
| Page | ||||
| 39 | ||||
| 40 | ||||
| 41 | ||||
| 42 | ||||
| 43 | ||||
| 44 | ||||
All other schedules are omitted because they are not applicable or the required information is shown in the financial statements or notes thereto.
38
Board of Directors and Shareholders
Universal Electronics Inc.
We have audited the accompanying consolidated balance sheets of Universal Electronics Inc. (a Delaware corporation) as of December 31, 20082011 and 2007,2010, and the related consolidated statements of income, stockholders’ equity, and cash flows for each of the three years in the period ended December 31, 2008. Our audits of the basic financial statements included the financial statement schedule listed in the index to consolidated financial statements.2011. These financial statements and financial statement schedule are the responsibility of the Company’s management. Our responsibility is to express an opinion on these financial statements and financial statement schedule based on our audits.
We conducted our audits in accordance with the standards of the Public Company Accounting Oversight Board (United States). Those standards require that we plan and perform the audit to obtain reasonable assurance about whether the financial statements are free of material misstatement. An audit includes examining, on a test basis, evidence supporting the amounts and disclosures in the financial statements. An audit also includes assessing the accounting principles used and significant estimates made by management, as well as evaluating the overall financial statement presentation. We believe that our audits provide a reasonable basis for our opinion.
In our opinion, the consolidated financial statements referred to above present fairly, in all material respects, the financial position of Universal Electronics Inc. as of December 31, 20082011 and 2007,2010, and the results of its operations and its cash flows for each of the three years in the period ended December 31, 2008,2011, in conformity with accounting principles generally accepted in the United States of America. Also in our opinion, the related financial statement schedule, when considered in relation to the basic financial statements taken as a whole, presents fairly, in all material respects, the information set forth therein.
We also have audited, in accordance with the standards of the Public Company Accounting Oversight Board (United States), Universal Electronics Inc.’s internal control over financial reporting as of December 31, 2008,2011, based on criteria established in Internal Control—IntegratedControl-Integrated Framework issued by the Committee of Sponsoring Organizations of the Treadway Commission (COSO) and our report dated March 3, 200914, 2012 expressed an unqualified opinion.
/s/ Grant Thornton LLP
Irvine, California
March 3, 2009
3914, 2012
CONSOLIDATED BALANCE SHEETS
(In thousands, except share-related data)
| December 31, | ||||||||
| 2008 | 2007 | |||||||
ASSETS | ||||||||
| Current assets: | ||||||||
| Cash and cash equivalents | $ | 75,238 | $ | 86,610 | ||||
| Accounts receivable, net | 59,825 | 60,146 | ||||||
| Inventories, net | 43,675 | 34,906 | ||||||
| Prepaid expenses and other current assets | 3,461 | 1,874 | ||||||
| Deferred income taxes | 2,421 | 2,871 | ||||||
| Total current assets | 184,620 | 186,407 | ||||||
| Equipment, furniture and fixtures, net | 8,686 | 7,558 | ||||||
| Goodwill | 10,757 | 10,863 | ||||||
| Intangible assets, net | 5,637 | 5,700 | ||||||
| Other assets | 609 | 369 | ||||||
| Deferred income taxes | 7,246 | 6,388 | ||||||
| Total assets | $ | 217,555 | $ | 217,285 | ||||
LIABILITIES AND STOCKHOLDERS’ EQUITY | ||||||||
| Current liabilities: | ||||||||
| Accounts payable | $ | 44,705 | $ | 29,382 | ||||
| Accrued sales discounts, rebates and royalties | 4,848 | 4,671 | ||||||
| Accrued income taxes | 2,334 | 1,720 | ||||||
| Accrued compensation | 3,617 | 3,737 | ||||||
| Other accrued expenses | 6,813 | 6,567 | ||||||
| Total current liabilities | 62,317 | 46,077 | ||||||
| Long-term liabilities: | ||||||||
| Deferred income taxes | 130 | 127 | ||||||
| Income tax payable | 1,442 | 1,506 | ||||||
| Other long term liabilities | 313 | 1,333 | ||||||
| Total liabilities | 64,202 | 49,043 | ||||||
| Commitments and contingencies | ||||||||
| Stockholders’ equity: | ||||||||
| Preferred stock, $.01 par value, 5,000,000 shares authorized; none issued or outstanding | — | — | ||||||
| Common stock, $.01 par value, 50,000,000 shares authorized; 18,715,833 and 18,547,019 shares issued at December 31, 2008 and 2007, respectively | 187 | 185 | ||||||
| Paid-in capital | 120,551 | 114,441 | ||||||
| Accumulated other comprehensive income | 750 | 11,221 | ||||||
| Retained earnings | 104,314 | 88,508 | ||||||
| 225,802 | 214,355 | |||||||
| Less cost of common stock in treasury, 5,070,319 and 3,975,439 shares at December 31, 2008 and 2007, respectively | (72,449 | ) | (46,113 | ) | ||||
| Total stockholders’ equity | 153,353 | 168,242 | ||||||
| Total liabilities and stockholders’ equity | $ | 217,555 | $ | 217,285 | ||||
| December 31, 2011 | December 31, 2010 | |||||||
| ASSETS | ||||||||
Current assets: | ||||||||
Cash and cash equivalents | $ | 29,372 | $ | 54,249 | ||||
Accounts receivable, net | 82,184 | 86,304 | ||||||
Inventories, net | 90,904 | 65,402 | ||||||
Prepaid expenses and other current assets | 3,045 | 2,582 | ||||||
Deferred income taxes | 6,558 | 5,896 | ||||||
|
|
|
| |||||
Total current assets | 212,063 | 214,433 | ||||||
Property, plant, and equipment, net | 80,449 | 78,097 | ||||||
Goodwill | 30,820 | 30,877 | ||||||
Intangible assets, net | 32,814 | 35,994 | ||||||
Other assets | 5,350 | 5,464 | ||||||
Deferred income taxes | 7,992 | 7,806 | ||||||
|
|
|
| |||||
Total assets | $ | 369,488 | $ | 372,671 | ||||
|
|
|
| |||||
| LIABILITIES AND STOCKHOLDERS’ EQUITY | ||||||||
Current liabilities: | ||||||||
Accounts payable | $ | 55,430 | $ | 56,086 | ||||
Line of credit | 2,000 | — | ||||||
Notes payable | 14,400 | 35,000 | ||||||
Accrued sales discounts, rebates and royalties | 6,544 | 7,942 | ||||||
Accrued income taxes | 5,707 | 5,873 | ||||||
Accrued compensation | 29,204 | 30,634 | ||||||
Deferred income taxes | 50 | 57 | ||||||
Other accrued expenses | 13,967 | 13,238 | ||||||
|
|
|
| |||||
Total current liabilities | 127,302 | 148,830 | ||||||
Long-term liabilities: | ||||||||
Deferred income taxes | 11,056 | 11,369 | ||||||
Income tax payable | 1,136 | 1,212 | ||||||
Other long-term liabilities | 5 | 56 | ||||||
|
|
|
| |||||
Total liabilities | 139,499 | 161,467 | ||||||
|
|
|
| |||||
Commitments and contingencies | ||||||||
Stockholders’ equity: | ||||||||
Preferred stock, $0.01 par value, 5,000,000 shares authorized; none issued or outstanding | — | — | ||||||
Common stock, $0.01 par value, 50,000,000 shares authorized; 21,142,915 and 20,877,248 shares issued on December 31, 2011 and 2010, respectively | 211 | 209 | ||||||
Paid-in capital | 173,701 | 166,940 | ||||||
Accumulated other comprehensive income (loss) | 938 | (489 | ) | |||||
Retained earnings | 154,016 | 134,070 | ||||||
|
|
|
| |||||
| 328,866 | 300,730 | |||||||
Less cost of common stock in treasury, 6,353,035 and 5,926,071 shares on December 31, 2011 and 2010, respectively | (98,877 | ) | (89,526 | ) | ||||
|
|
|
| |||||
Total stockholders’ equity | 229,989 | 211,204 | ||||||
|
|
|
| |||||
Total liabilities and stockholders’ equity | $ | 369,488 | $ | 372,671 | ||||
|
|
|
| |||||
See Note 5 for further information concerning our purchases from a related party vendor.
The accompanying notes are an integral part of these consolidated financial statements.
40
CONSOLIDATED INCOME STATEMENTS
(In thousands, except per share amounts)
| Year Ended December 31, | ||||||||||||
| 2008 | 2007 | 2006 | ||||||||||
| Net sales | $ | 287,100 | $ | 272,680 | $ | 235,846 | ||||||
| Cost of sales | 190,910 | 173,329 | 149,970 | |||||||||
| Gross profit | 96,190 | 99,351 | 85,876 | |||||||||
| Research and development expenses | 8,160 | 8,820 | 7,412 | |||||||||
| Selling, general and administrative expenses | 67,269 | 64,080 | 59,947 | |||||||||
| Operating income | 20,761 | 26,451 | 18,517 | |||||||||
| Interest income | 3,017 | 3,104 | 1,401 | |||||||||
| Other income (expense), net | 311 | 7 | (498 | ) | ||||||||
| Income before provision for income taxes | 24,089 | 29,562 | 19,420 | |||||||||
| Provision for income taxes | 8,283 | 9,332 | 5,900 | |||||||||
| Net income | $ | 15,806 | $ | 20,230 | $ | 13,520 | ||||||
| Earnings per share: | ||||||||||||
| Basic | $ | 1.13 | $ | 1.40 | $ | 0.98 | ||||||
| Diluted | $ | 1.09 | $ | 1.33 | $ | 0.94 | ||||||
| Shares used in computing earnings per share: | ||||||||||||
| Basic | 14,015 | 14,410 | 13,818 | |||||||||
| Diluted | 14,456 | 15,177 | 14,432 | |||||||||
| Year Ended December 31, | ||||||||||||
| 2011 | 2010 | 2009 | ||||||||||
Net sales | $ | 468,630 | $ | 331,780 | $ | 317,550 | ||||||
Cost of sales | 338,569 | 227,931 | 215,938 | |||||||||
|
|
|
|
|
| |||||||
Gross profit | 130,061 | 103,849 | 101,612 | |||||||||
Research and development expenses | 12,267 | 10,709 | 8,691 | |||||||||
Selling, general and administrative expenses | 91,218 | 71,839 | 70,974 | |||||||||
|
|
|
|
|
| |||||||
Operating income | 26,576 | 21,301 | 21,947 | |||||||||
Interest (expense) income, net | (270 | ) | 34 | 471 | ||||||||
Other (expense) income, net | (1,075 | ) | 523 | (241 | ) | |||||||
|
|
|
|
|
| |||||||
Income before provision for income taxes | 25,231 | 21,858 | 22,177 | |||||||||
Provision for income taxes | 5,285 | 6,777 | 7,502 | |||||||||
|
|
|
|
|
| |||||||
Net income | $ | 19,946 | $ | 15,081 | $ | 14,675 | ||||||
|
|
|
|
|
| |||||||
Earnings per share: | ||||||||||||
Basic | $ | 1.34 | $ | 1.10 | $ | 1.07 | ||||||
|
|
|
|
|
| |||||||
Diluted | $ | 1.31 | $ | 1.07 | $ | 1.05 | ||||||
|
|
|
|
|
| |||||||
Shares used in computing earnings per share: | ||||||||||||
Basic | 14,912 | 13,764 | 13,667 | |||||||||
|
|
|
|
|
| |||||||
Diluted | 15,213 | 14,106 | 13,971 | |||||||||
|
|
|
|
|
| |||||||
See Note 5 for further information concerning our purchases from a related party vendor.
The accompanying notes are an integral part of these consolidated financial statements.
41
CONSOLIDATED STATEMENTS OF STOCKHOLDERS’ EQUITY
(In thousands)
| Accumulated | ||||||||||||||||||||||||||||||||||||||||
| Common Stock | Common Stock | Other | Deferred | |||||||||||||||||||||||||||||||||||||
| Issued | in Treasury | Paid-in | Comprehensive | Retained | Stock-Based | Comprehensive | ||||||||||||||||||||||||||||||||||
| Shares | Amount | Shares | Amount | Capital | Income (Loss) | Earnings | Compensation | Totals | Income | |||||||||||||||||||||||||||||||
| Balance at December 31, 2005 | 16,964 | 169 | (3,421 | ) | (29,663 | ) | 83,220 | (5,265 | ) | 54,994 | (163 | ) | $ | 103,292 | ||||||||||||||||||||||||||
| Comprehensive income: | ||||||||||||||||||||||||||||||||||||||||
| Net income | 13,520 | $ | 13,520 | |||||||||||||||||||||||||||||||||||||
| Currency translation adjustment | 8,024 | 8,024 | ||||||||||||||||||||||||||||||||||||||
| Total comprehensive income | $ | 21,544 | ||||||||||||||||||||||||||||||||||||||
| Shares issued for employee benefit plan | 29 | 1 | 528 | 529 | ||||||||||||||||||||||||||||||||||||
| Purchase of treasury shares | (127 | ) | (2,589 | ) | (2,589 | ) | ||||||||||||||||||||||||||||||||||
| Stock options exercised | 550 | 5 | 7,492 | 7,497 | ||||||||||||||||||||||||||||||||||||
| Shares issued to Directors | 19 | 288 | (288 | ) | — | |||||||||||||||||||||||||||||||||||
| Stock-based compensation expense under SFAS 123R | 3,117 | 3,117 | ||||||||||||||||||||||||||||||||||||||
| Tax benefit from exercise of non — qualified stock options | 827 | 827 | ||||||||||||||||||||||||||||||||||||||
| Reclassification of deferred stock-based compensation on adoption of SFAS 123(R) | (163 | ) | 163 | — | ||||||||||||||||||||||||||||||||||||
| Balance at December 31, 2006 | 17,543 | 175 | (3,529 | ) | (31,964 | ) | 94,733 | 2,759 | 68,514 | — | 134,217 | |||||||||||||||||||||||||||||
| Comprehensive income: | ||||||||||||||||||||||||||||||||||||||||
| Net income | 20,230 | $ | 20,230 | |||||||||||||||||||||||||||||||||||||
| Currency translation adjustment | 8,462 | 8,462 | ||||||||||||||||||||||||||||||||||||||
| Total comprehensive income | $ | 28,692 | ||||||||||||||||||||||||||||||||||||||
| Shares issued for employee benefit plan | 23 | 1 | 630 | 631 | ||||||||||||||||||||||||||||||||||||
| Purchase of treasury shares | (471 | ) | (14,519 | ) | (14,519 | ) | ||||||||||||||||||||||||||||||||||
| Stock options exercised | 981 | 9 | 12,588 | 12,597 | ||||||||||||||||||||||||||||||||||||
| Shares issued to Directors | 25 | 370 | (370 | ) | — | |||||||||||||||||||||||||||||||||||
| Stock-based compensation expense under SFAS 123R | 3,521 | 3,521 | ||||||||||||||||||||||||||||||||||||||
| Adoption of FIN 48 (Note 16) | (236 | ) | (236 | ) | ||||||||||||||||||||||||||||||||||||
| Tax benefit from exercise of non — qualified stock options | 3,339 | 3,339 | ||||||||||||||||||||||||||||||||||||||
| Balance at December 31, 2007 | 18,547 | 185 | (3,975 | ) | (46,113 | ) | 114,441 | 11,221 | 88,508 | — | 168,242 | |||||||||||||||||||||||||||||
| Comprehensive income: | ||||||||||||||||||||||||||||||||||||||||
| Net income | 15,806 | $ | 15,806 | |||||||||||||||||||||||||||||||||||||
| Currency translation adjustment | (10,471 | ) | (10,471 | ) | ||||||||||||||||||||||||||||||||||||
| Total comprehensive income | $ | 5,335 | ||||||||||||||||||||||||||||||||||||||
| Shares issued for employee benefit plan and compensation | 55 | 1 | 632 | 633 | ||||||||||||||||||||||||||||||||||||
| Purchase of treasury shares | (1,118 | ) | (26,689 | ) | (26,689 | ) | ||||||||||||||||||||||||||||||||||
| Stock options exercised | 114 | 1 | 1,157 | 1,158 | ||||||||||||||||||||||||||||||||||||
| Shares issued to Directors | 23 | 353 | (353 | ) | — | |||||||||||||||||||||||||||||||||||
| Stock-based compensation expense under SFAS 123R | 4,243 | 4,243 | ||||||||||||||||||||||||||||||||||||||
| Tax benefit from exercise of non — qualified stock options and vested restricted stock | 431 | 431 | ||||||||||||||||||||||||||||||||||||||
| Balance at December 31, 2008 | 18,716 | $ | 187 | (5,070 | ) | $ | (72,449 | ) | $ | 120,551 | $ | 750 | $ | 104,314 | $ | — | $ | 153,353 | ||||||||||||||||||||||
| Common Stock Issued | Common Stock in Treasury | Paid-in | Accumulated Other Comprehensive | Retained | Comprehensive | |||||||||||||||||||||||||||||||
| Shares | Amount | Shares | Amount | Capital | Income (Loss) | Earnings | Totals | Income | ||||||||||||||||||||||||||||
Balance at December 31, 2008 | 18,716 | $ | 187 | (5,070 | ) | $ | (72,449 | ) | $ | 120,551 | $ | 750 | $ | 104,314 | $ | 153,353 | ||||||||||||||||||||
Comprehensive income: | ||||||||||||||||||||||||||||||||||||
Net income | 14,675 | $ | 14,675 | |||||||||||||||||||||||||||||||||
Currency translation adjustment | 713 | 713 | ||||||||||||||||||||||||||||||||||
|
| |||||||||||||||||||||||||||||||||||
Total comprehensive income | $ | 15,388 | ||||||||||||||||||||||||||||||||||
Shares issued for employee benefit plan and compensation | 145 | 1 | 740 | 741 | ||||||||||||||||||||||||||||||||
Purchase of treasury shares | (405 | ) | (7,747 | ) | (7,747 | ) | ||||||||||||||||||||||||||||||
Stock options exercised | 279 | 3 | 3,272 | 3,275 | ||||||||||||||||||||||||||||||||
Shares issued to Directors | 25 | 370 | (370 | ) | — | |||||||||||||||||||||||||||||||
Stock-based compensation expense | 4,312 | 4,312 | ||||||||||||||||||||||||||||||||||
Tax benefit from exercise of non-qualified stock options and vested restricted stock | 408 | 408 | ||||||||||||||||||||||||||||||||||
|
|
|
|
|
|
|
|
|
|
|
|
|
|
|
| |||||||||||||||||||||
Balance at December 31, 2009 | 19,140 | $ | 191 | (5,450 | ) | $ | (79,826 | ) | $ | 128,913 | $ | 1,463 | $ | 118,989 | $ | 169,730 | ||||||||||||||||||||
|
|
|
|
|
|
|
|
|
|
|
|
|
|
|
| |||||||||||||||||||||
Comprehensive income: | ||||||||||||||||||||||||||||||||||||
Net income | 15,081 | $ | 15,081 | |||||||||||||||||||||||||||||||||
Currency translation adjustment | (1,952 | ) | (1,952 | ) | ||||||||||||||||||||||||||||||||
|
| |||||||||||||||||||||||||||||||||||
Total comprehensive income | $ | 13,129 | ||||||||||||||||||||||||||||||||||
Shares issued for employee benefit plan and compensation | 156 | 2 | 564 | 566 | ||||||||||||||||||||||||||||||||
Shares issued for purchase of Enson | 1,460 | 15 | 30,748 | 30,763 | ||||||||||||||||||||||||||||||||
Purchase of treasury shares | (506 | ) | (10,145 | ) | (10,145 | ) | ||||||||||||||||||||||||||||||
Stock options exercised | 121 | 1 | 1,963 | 1,964 | ||||||||||||||||||||||||||||||||
Shares issued to Directors | 30 | 445 | (445 | ) | — | |||||||||||||||||||||||||||||||
Stock-based compensation expense | 4,966 | 4,966 | ||||||||||||||||||||||||||||||||||
Tax benefit from exercise of non-qualified stock options and vested restricted stock | 231 | 231 | ||||||||||||||||||||||||||||||||||
|
|
|
|
|
|
|
|
|
|
|
|
|
|
|
| |||||||||||||||||||||
Balance at December 31, 2010 | 20,877 | $ | 209 | (5,926 | ) | $ | (89,526 | ) | $ | 166,940 | $ | (489 | ) | $ | 134,070 | $ | 211,204 | |||||||||||||||||||
|
|
|
|
|
|
|
|
|
|
|
|
|
|
|
| |||||||||||||||||||||
Comprehensive income: | ||||||||||||||||||||||||||||||||||||
Net income | 19,946 | $ | 19,946 | |||||||||||||||||||||||||||||||||
Currency translation adjustment | 1,427 | 1,427 | ||||||||||||||||||||||||||||||||||
|
| |||||||||||||||||||||||||||||||||||
Total comprehensive income | $ | 21,373 | ||||||||||||||||||||||||||||||||||
Shares issued for employee benefit plan and compensation | 164 | 1 | 728 | 729 | ||||||||||||||||||||||||||||||||
Purchase of treasury shares | (457 | ) | (9,785 | ) | (9,785 | ) | ||||||||||||||||||||||||||||||
Stock options exercised | 102 | 1 | 1,676 | 1,677 | ||||||||||||||||||||||||||||||||
Shares issued to Directors | 30 | 434 | (434 | ) | — | |||||||||||||||||||||||||||||||
Stock-based compensation expense | 4,511 | 4,511 | ||||||||||||||||||||||||||||||||||
Tax benefit from exercise of non-qualified stock options and vested restricted stock | 280 | 280 | ||||||||||||||||||||||||||||||||||
|
|
|
|
|
|
|
|
|
|
|
|
|
|
|
| |||||||||||||||||||||
Balance at December 31, 2011 | 21,143 | $ | 211 | (6,353 | ) | $ | (98,877 | ) | $ | 173,701 | $ | 938 | $ | 154,016 | $ | 229,989 | ||||||||||||||||||||
|
|
|
|
|
|
|
|
|
|
|
|
|
|
|
| |||||||||||||||||||||
The accompanying notes are an integral part of these consolidated financial statements.
42
CONSOLIDATED STATEMENTS OF CASH FLOWS
(In thousands)
| Year Ended December 31, | ||||||||||||
| 2008 | 2007 | 2006 | ||||||||||
| Cash provided by operating activities: | ||||||||||||
| Net income | $ | 15,806 | $ | 20,230 | $ | 13,520 | ||||||
| Adjustments to reconcile net income to net cash provided by operating activities: | ||||||||||||
| Depreciation and amortization | 6,084 | 4,675 | 4,187 | |||||||||
| Provision for doubtful accounts | 442 | 23 | 210 | |||||||||
| Provision for inventory write-downs | 2,671 | 2,146 | 1,810 | |||||||||
| Deferred income taxes | (448 | ) | 219 | (637 | ) | |||||||
| Tax benefit from exercise of stock options and vested restricted stock | 431 | 3,339 | 827 | |||||||||
| Excess tax benefit from stock-based compensation | (344 | ) | (3,320 | ) | (275 | ) | ||||||
| Shares issued for employee benefit plan | 633 | 631 | 529 | |||||||||
| Stock-based compensation | 4,243 | 3,521 | 3,117 | |||||||||
| Changes in operating assets and liabilities: | ||||||||||||
| Accounts receivable | (1,478 | ) | (5,033 | ) | (7,120 | ) | ||||||
| Inventories | (12,219 | ) | (9,194 | ) | (280 | ) | ||||||
| Prepaid expenses and other assets | (1,888 | ) | 837 | 1,459 | ||||||||
| Accounts payable and accrued expenses | 15,557 | 3,982 | 2,546 | |||||||||
| Accrued income and other taxes | 662 | (2,119 | ) | (2,681 | ) | |||||||
| Net cash provided by operating activities | 30,152 | 19,937 | 17,212 | |||||||||
| Cash used for investing activities: | ||||||||||||
| Acquisition of equipment, furniture and fixtures | (5,945 | ) | (4,802 | ) | (4,057 | ) | ||||||
| Acquisition of intangible assets | (1,475 | ) | (1,381 | ) | (1,011 | ) | ||||||
| Net cash used for investing activities | (7,420 | ) | (6,183 | ) | (5,068 | ) | ||||||
| Cash (used for) provided by financing activities: | ||||||||||||
| Proceeds from stock options exercised | 1,158 | 12,597 | 7,497 | |||||||||
| Treasury stock purchased | (26,689 | ) | (14,519 | ) | (2,589 | ) | ||||||
| Excess tax benefit from stock-based compensation | 344 | 3,320 | 275 | |||||||||
| Net cash (used for) provided by financing activities | (25,187 | ) | 1,398 | 5,183 | ||||||||
| Effect of exchange rate changes on cash | (8,917 | ) | 5,383 | 5,107 | ||||||||
| Net (decrease) increase in cash and cash equivalents | (11,372 | ) | 20,535 | 22,434 | ||||||||
| Cash and cash equivalents at beginning of year | 86,610 | 66,075 | 43,641 | |||||||||
| Cash and cash equivalents at end of year | $ | 75,238 | $ | 86,610 | $ | 66,075 | ||||||
| Year Ended December 31, | ||||||||||||
| 2011 | 2010 | 2009 | ||||||||||
Cash provided by operating activities: | ||||||||||||
Net income | $ | 19,946 | $ | 15,081 | $ | 14,675 | ||||||
Adjustments to reconcile net income to net cash provided by operating activities: | ||||||||||||
Depreciation and amortization | 17,335 | 8,059 | 6,801 | |||||||||
Provision for doubtful accounts | 277 | 931 | 435 | |||||||||
Provision for inventory write-downs | 5,625 | 3,514 | 4,179 | |||||||||
Deferred income taxes | (1,043 | ) | (559 | ) | (1,036 | ) | ||||||
Tax benefit from exercise of stock options and vested restricted stock | 280 | 231 | 408 | |||||||||
Excess tax benefit from stock-based compensation | (439 | ) | (290 | ) | (250 | ) | ||||||
Shares issued for employee benefit plan | 729 | 566 | 741 | |||||||||
Stock-based compensation | 4,511 | 4,966 | 4,312 | |||||||||
Changes in operating assets and liabilities, net of acquired assets and assumed liabilities: | ||||||||||||
Accounts receivable | 3,142 | 13,192 | (4,278 | ) | ||||||||
Inventories | (30,597 | ) | (5,102 | ) | (1,053 | ) | ||||||
Prepaid expenses and other assets | (345 | ) | 950 | 552 | ||||||||
Accounts payable and accrued expenses | (4,319 | ) | 922 | (2,201 | ) | |||||||
Accrued income and other taxes | (302 | ) | (4,322 | ) | 702 | |||||||
|
|
|
|
|
| |||||||
Net cash provided by operating activities | 14,800 | 38,139 | 23,987 | |||||||||
|
|
|
|
|
| |||||||
Cash used for investing activities: | ||||||||||||
Acquisition of Enson, net of cash acquired | — | (74,271 | ) | — | ||||||||
Term deposit | — | 49,246 | (49,246 | ) | ||||||||
Acquisition of property, plant, and equipment | (13,630 | ) | (8,440 | ) | (6,171 | ) | ||||||
Acquisition of intangible assets | (1,064 | ) | (1,378 | ) | (1,172 | ) | ||||||
Acquisition of assets from Zilog | — | — | (9,502 | ) | ||||||||
|
|
|
|
|
| |||||||
Net cash used for investing activities | (14,694 | ) | (34,843 | ) | (66,091 | ) | ||||||
|
|
|
|
|
| |||||||
Cash (used for) provided by financing activities: | ||||||||||||
Issuance of debt | 4,200 | 41,000 | — | |||||||||
Payment of debt | (22,800 | ) | (9,834 | ) | — | |||||||
Proceeds from stock options exercised | 1,677 | 1,964 | 3,275 | |||||||||
Treasury stock purchased | (9,785 | ) | (10,145 | ) | (7,747 | ) | ||||||
Excess tax benefit from stock-based compensation | 439 | 290 | 250 | |||||||||
|
|
|
|
|
| |||||||
Net cash (used for) provided by financing activities | (26,269 | ) | 23,275 | (4,222 | ) | |||||||
Effect of exchange rate changes on cash | 1,286 | (1,338 | ) | 104 | ||||||||
|
|
|
|
|
| |||||||
Net (decrease) increase in cash and cash equivalents | (24,877 | ) | 25,233 | (46,222 | ) | |||||||
Cash and cash equivalents at beginning of year | 54,249 | 29,016 | 75,238 | |||||||||
|
|
|
|
|
| |||||||
Cash and cash equivalents at end of year | $ | 29,372 | $ | 54,249 | $ | 29,016 | ||||||
|
|
|
|
|
| |||||||
Supplemental Cash Flow Information —Income taxes paid were $8.2 million, $8.1 million, $11.7 million, and $8.7$8.1 million in 2008, 2007,2011, 2010, and 2006,2009, respectively. We had interest payments of $0.4 million in 2011 and $0 in both 2010 and 2009.
See Note 5 for further information concerning our purchases from a related party vendor.
The accompanying notes are an integral part of these consolidated financial statements.
43
NOTES TO CONSOLIDATED FINANCIAL STATEMENTS
DECEMBER 31, 2011
Note 1 — Description of Business
Universal Electronics Inc., based in Southern California, has developeddevelops and manufactures a broad line of easy-to-use, pre-programmed universal wireless control products and audio-video accessories that are marketed to enhance home entertainment systems as well as software designed to enable consumers to wirelessly connect, control and interact with an increasingly complex home entertainment environment. Our primary markets include retail, private label, original equipment manufacturers (“OEMs”), custom installers, cable and satellite service providers, and companies in the personal computing industry. OverIn addition, over the past 2124 years we have developed a broad portfolio of patented technologies and a database of home connectivity software that we license to our customers, including many leading Fortune 500 companies. In addition,
Our primary markets include cable and satellite television service provider, original equipment manufacturer (“OEM”), retail, custom installer, private label, and personal computing companies. We sell directly to our customers, and for retail and custom installers we also sell our universal wireless control products and other audio/visual accessories through our European headquarters in the Netherlands, and to distributors and retailers in Europe, Australia, New Zealand, South Africa, the Middle East, Mexico, and selected countries in Asia and Latin America under theOne For All® and Nevo® brand name.
As used herein, the terms “we”, “us” and “our” refer to Universal Electronics Inc. and its subsidiaries unless the context indicates to the contrary.
Note 2 — Summary of Significant Accounting Policies
Principles of Consolidation
The consolidated financial statements include our accounts and those of our wholly-owned subsidiaries. All the intercompany accounts and significant transactions have been eliminated in the consolidated financial statements.
Segment RealignmentReclassification
Certain prior period amounts in the third quarter of 2006, we integratedaccompanying consolidated financial statements have been reclassified to conform to the SimpleDevices business segment into our Core Business segment in order to more closely align our financial reporting with our business structure. The segment integration did not impactcurrent year presentation. These reclassifications had no effect on previously reported consolidated net revenue, income from operations, net income or earnings per share.
Estimates and Assumptions
The preparation of financial statements in conformity with accounting principles generally accepted in the United States of America requires us to make estimates and judgmentsassumptions that affect the reported amounts of assets and liabilities, disclosure of contingent assets and liabilities at the date of the financial statements, and the reported amounts of revenues and expenses during the reporting period. On an on-going basis, we evaluate our estimates and judgments,assumptions, including those related to revenue recognition, allowance for sales returns and doubtful accounts, warranties, inventory valuation, business combination purchase price allocations, our review for impairment of long-lived assets, intangible assets and goodwill, income taxes and stock-based compensation expense. Actual results may differ from these judgmentsassumptions and estimates, and they may be adjusted as more information becomes available. Any adjustment may be material.
Revenue Recognition and Sales Allowances
We recognize revenue on the sale of products when deliverytitle of the goods has occurred,transferred, there is persuasive evidence of an arrangement (such as when a purchase order is received from the customer), the sales price is fixed or determinable, and collectability is reasonably assured.
The provision recorded for estimated sales returns on retail productis deducted from gross sales to arrive at net sales in the same period as the related revenues arerevenue is recorded. These estimates are based on historical sales returns, analysis of credit memo data and other known factors. The provision recordedWe have no obligations after delivery of our products other than the associated warranties. See Note 13 for estimated sales returns and allowances is deducted from gross sales to arrive at net sales in the period the related revenue is recorded.
We accrue foroffer discounts and rebates on product sales in the same period as the related revenuesthat are recorded based on historical experience.experience and our expectation regarding future sales by a customer. Changes in such accruals may be required if future rebates and incentives differ from our
44
UNIVERSAL ELECTRONICS INC.
NOTES TO CONSOLIDATED FINANCIAL STATEMENTS
DECEMBER 31, 2011
Trade accounts receivable are recorded at the invoiced amount and do not bear interest. Sales allowances reduceare recognized as reductions of gross accounts receivable to arrive at accounts receivable, net if the sales allowances are distributed in the same period the related receivable is recorded. We have no obligations after delivery ofcustomer account credits. See Note 4 for further information concerning our products other than the associated warranties (see Note 21). sales allowances.
We maintain an allowance for doubtful accounts for estimated losses resulting from the inability of our customers to make payments for products sold or services rendered. The allowance for doubtful accounts is based on a variety of factors, including historical experience, length of time receivables are past due, current economic trends and changes in customer payment behavior. Also, we record specific provisions for individual accounts when we become aware of a customer’s inability to meet its financial obligations to us, such as in the case of bankruptcy filings or deterioration in the customer’s operating results or financial position. If circumstances related to a customer change, our estimates of the recoverability of the receivables would be further adjusted, either upward or downward.
We generate service revenue, which is paid monthly, as a result of providing consumer support programs to some of our customers through our call centers. These service revenues are recognized when services are performed, persuasive evidence of an arrangement exists (such as when a signed agreement is received from the customer), the sales price is fixed or determinable, and collectability is reasonably assured.
We recognize revenue for the sale of tooling when the related services have been provided, customer acceptance documentation has been obtained, the sales price is fixed or determinable, and collectability is reasonably assured.
We also license our intellectual property including our patented technologies, trade secrets, trademarks, and database of infrared codes. WeWhen our license fees are paid on a per unit basis we record license revenue when our customers ship a product incorporating our intellectual property, persuasive evidence of an arrangement exists, the sales price is fixed or determinable, and collectability is reasonably assured.
We may from time to time initiate the sale or license of certain intellectual property, including patented technologies, trademarks, or a particular database of infrared codes. When a fixed upfront fee is received in exchange for the conveyance of a patent, trademark, or database delivered that represents the culmination of the earnings process, we record revenue when delivery has occurred, persuasive evidence of an arrangement exists, the sales price is fixed or determinable and collectibilitycollectability is reasonably assured.
We present all non-income government-assessed taxes (sales, use and value added taxes) collected from our customers and remitted to governmental agencies on a net basis (excluded from revenue) in our financial statements. The government-assessed taxes are recorded in other accrued expenses until they are remitted to the government agency.
Income Taxes
Income tax expense includes U.S. and foreign income taxes. We account for income taxes using the liability method. We record deferred tax assets and deferred tax liabilities on our balance sheet for expected future tax consequences of events recognized in our financial statements in a different period than our tax return using enacted tax rates that will be in effect when these differences reverse. We record a valuation allowance to reduce net deferred tax assets if we determine that it is more likely than not that the deferred tax assets will not be realized. A current tax asset or liability is recognized for the estimated taxes refundable or payable for the current year.
Accounting standards prescribe a recognition threshold and a measurement attribute for the financial statement recognition and measurement of the positions taken or expected to be taken in a tax return. For those benefits to be recognized, a tax position must be more likely than not to be sustained upon examination by taxing authorities. A “more likely than not” tax position is measured as the largest amount of benefit that is greater than fifty percent likely of being realized upon ultimate settlement, or else a full reserve is established against the tax asset or a liability is recorded. See Note 9 for further information concerning income taxes.
Research and Development
Research and development costs are expensed as incurred and consist primarily of salaries, employee benefits, supplies and materials.
UNIVERSAL ELECTRONICS INC.
NOTES TO CONSOLIDATED FINANCIAL STATEMENTS
DECEMBER 31, 2011
Advertising
Advertising costs are expensed as incurred. Advertising expense totaled $1.2 million, $1.7 million, and $1.3 million for the years ended December 31, 2011, 2010 and 2009, respectively.
Shipping and Handling Fees and Costs
We include shipping and handling fees billed to customers in net sales. Shipping and handling costs associated with in-bound freight are recorded in cost of goods sold. Other shipping and handling costs are included in selling, general and administrative expenses and totaled $9.7 million, $7.5 million and $7.9 million for the years ended December 31, 2011, 2010 and 2009, respectively.
Stock-Based Compensation
We recognize the grant date fair value of stock-based compensation awards as expense, net of estimated forfeitures, in proportion to vesting during the requisite service period, which ranges from one to four years.
We determine the fair value of the restricted stock awards utilizing the average of the high and low trade prices of our Company’s shares on the date they were granted.
We have evaluated the available option pricing models and the assumptions we may utilize to estimate the grant date fair value of stock options granted to employees and directors. We have elected to utilize the Black-Scholes option pricing model. The assumptions utilized in the Black-Scholes model include the following:
risk-free interest rate;
expected volatility; and
expected life in years.
Our risk-free interest rate over the expected term is equal to the prevailing U.S. Treasury note rate over the same period. As part of our assessment of possible expected volatility assumptions, management determined that historical volatility calculated based on our actively traded common stock is a better indicator of expected volatility and future stock price trends than implied volatility. Therefore, we calculate the expected volatility of our common stock utilizing its historical volatility over a period of time equal to the expected term of the stock option. To determine our expected life assumption, we examined the historical pattern of stock option exercises in an effort to determine if there were any discernible patterns based on employee classification. From this analysis, we identified two classifications: (1) Executives and Board of Directors and (2) Non-Executives. Our estimate of expected life is computed utilizing historical exercise patterns and post-vesting behavior within each of the two identified classifications. See Notes 14 and 16 for further information regarding stock-based compensation.
Foreign Currency Translation and Foreign Currency Transactions
We use the U.S. dollar as our functional currency for financial reporting purposes. The functional currency for most of our foreign operationssubsidiaries is their local currency. The translation of foreign currencies into U.S. dollars is performed for balance sheet accounts using exchange rates in effect at the balance sheet dates and for revenue and expense accounts using the average exchange rate during each period. The gains and losses resulting from the translation are included in the foreign currency translation adjustment account, a component of accumulated other comprehensive
45
We recorded a foreign currency translation gain of $1.4 million, a loss of $10.5$2.0 million and a gain of $0.7 million for the years ended December 31, 2011, 2010 and 2009, respectively. The foreign currency translation gain of $1.4 million for the year ended December 31, 20082011 was driven by the weakening of the U.S. dollar versus the Chinese Yuan Renminbi. The U.S. dollar/Chinese Yuan Renminbi spot rate was 0.159 and a foreign currency translation gain of $8.5 million and $8.0 million for the years ended0.152 at December 31, 20072011 and 2006,2010, respectively.
UNIVERSAL ELECTRONICS INC.
NOTES TO CONSOLIDATED FINANCIAL STATEMENTS
DECEMBER 31, 2011
The foreign currency translation loss of $10.5$2.0 million for the year ended December 31, 20082010 was driven by the strengthening of the U.S. dollar versus the Euro. The U.S. dollar/Euro spot rate was 1.391.34 and 1.461.43 at December 31, 20082010 and December 31, 2007,2009, respectively. The foreign currency translation loss during 2008 was compounded by our transfer of€47.0 million, or $60.2 million, into Hong Kong dollars (which are indexed to the U.S. dollar) in November 2008. The U.S. dollar/Euro spot rate at the time of transfer was 1.28. This composed approximately $7.2 million of the foreign currency translation loss for 2008.
The foreign currency translation gain of $8.5$0.7 million for the year ended December 31, 20072009 was driven by the weakening of the U.S. dollar versus the Euro. The U.S. dollar/Euro spot rate was 1.461.43 and 1.321.39 at December 31, 20072009 and December 31, 2006,2008, respectively. The foreign currency translation gain of $8.0 million for the year ended December 31, 2006 was driven by the weakening of the U.S. dollar versus the Euro. The U.S. dollar/Euro spot rate was 1.32 and 1.18 at December 31, 2006 and December 31, 2005, respectively.
Transaction gains and losses generated by the effect of changes in foreign currency exchange rates on recorded assets and liabilities denominated in a currency different than the functional currency of the applicable entity are recorded in other (expense) income, (expense), net (seenet. See Note 15).
Financial Instruments
Our financial instruments consist primarily of investments in cash and cash equivalents, accounts receivable, accounts payable and accrued liabilities. The carrying value of our financial instruments approximates fair value as a result of their short maturities. See Notes 3, 4, 5, 8, 10, and 11 for further information concerning our financial instruments.
Cash and Cash Equivalents
Cash and cash equivalents include cash accounts and all investments purchased with initial maturities of three3 months or less. We maintain cash and cash equivalents with various financial institutions. Weattempt to mitigate our exposure to liquidity, credit riskand other relevant risks by placing our cash and cash equivalents with financial institutions we believe are high quality financial institutions.quality. These financial institutions are located in many different geographic regions. As part of our cash and risk management processes, we perform periodic evaluations of the relative credit standing of theour financial institutions. We have not sustained credit losses from instruments held at financial institutions.
Inventories
Inventories consist of remote controls, audio-video accessories andas well as the related component parts.parts and raw materials. Inventoriable costs includedinclude materials, labor, freight-in and manufacturing overhead related to the purchase and production of inventories. We value our inventories at the lower of cost or market. Cost is determined using the first-in, first-out method. We attempt to carry inventories in amounts necessary to satisfy our customer requirements on a timely basis.
Product innovations and technological advances may shorten a given product’s life cycle. We continually monitor our inventories to identify any excess or obsolete items on hand. We write-down our inventories for estimated excess and obsolescence in an amount equal to the difference between the cost of the inventories and its estimated net realizable value. These estimates are based upon management’s judgment about future demand and market conditions. Actual results may differ from management’s judgments and additional write-downs may be required. Our total excess and obsolete inventory reserve as ofon December 31, 20082011 and 20072010 was $1.5$3.4 million and $1.8$2.1 million, respectively, or 3.5%3.8% and 5.0%3.3 % of our total inventory balance.
46
Property, Plant, and Equipment
We capitalize certain internal and external costs incurred to acquire or create internal use software, principally related to software coding, designing system interfaces and installation and testing of the software.
UNIVERSAL ELECTRONICS INC.
NOTES TO CONSOLIDATED FINANCIAL STATEMENTS
DECEMBER 31, 2011
For financial reporting purposes, depreciation is calculated using the straight-line method over the estimated useful lives of the respective assets. When assets are retired or otherwise disposed of, the cost and accumulated depreciation are removed from the appropriate accounts and any gain or loss is included as a component of depreciation expense in operating income.
Estimated useful lives consist of the following:
Buildings | 25 Years | |||
Tooling and equipment | 2-7 Years | |||
Computer equipment | 3-7 Years | |||
Software | 3-5 Years | |||
Furniture and fixtures | 5-7 Years | |||
Leasehold improvements | Lesser of lease term or useful life (approximately 2 to 6 years) | |||
See Note 6 for further information concerning our property, plant, and equipment.
Goodwill
We record the excess purchase price of net tangible and intangible assets acquired over their estimated fair value as goodwill. We evaluate the carrying value of goodwill on December 31 of each year and between annual evaluations if events occur or circumstances change that may reduce the fair value of the reporting unit below its carrying amount. Such circumstances may include, but are not limited to: (1) a significant adverse change in legal factors or in business climate, (2) unanticipated competition, or (3) an adverse action or assessment by a regulator.
When performing the impairment review, we determine the carrying amount of each reporting unit by assigning assets and liabilities, including the existing goodwill, to those reporting units. A reporting unit is defined as an operating segment or one level below an operating segment (referred to as a component). A component of an operating segment is deemed a reporting unit if the component constitutes a business for which discrete financial information is available, and segment management regularly reviews the operating results of that component. We have a single reporting unit.
To evaluate whether goodwill is impaired, we compare the estimated fair value of the reporting unit to which the goodwill is assigned to the reporting unit’s carrying amount, including goodwill. We estimate the fair value of our reporting unit based on income and market approaches. Under the income approach, we calculate the fair value of a reporting unit based on the present value of estimated future cash flows. Under the market approach, we estimate the fair value based on market multiples of Enterprise Value to EBITDA for comparable companies. If the carrying value of the net assets assigned to the reporting unit exceeds the fair value of the reporting unit, then we must perform the second step of the impairment test in order to determine the implied fair value of the reporting unit’s goodwill. If the carrying value of a reporting unit’s goodwill exceeds its implied fair value, then we record an impairment loss equal to the difference.
To calculate the implied fair value of the reporting unit’s goodwill, the fair value of the reporting unit is first allocated to all of the other assets and liabilities of that unit based on their fair values. The excess of the reporting unit’s fair value over the amount assigned to its other assets and liabilities is the implied fair value of goodwill. An impairment loss would be recognized when the carrying amount of goodwill exceeds its implied fair value.
We conducted annual goodwill impairment reviews on December 31, 2011, 2010 and 2009. Based on the analysis performed, we determined that the fair values of our reporting unit exceeded its carrying amount, including goodwill, and therefore it was not impaired. See Notes 7 and 21 for further information concerning goodwill.
Long-Lived Assets and Intangible Assets Impairment
Intangible assets consist principally of distribution rights, patents, trademarks, trade names, and developed and core technologies.technologies, capitalized software development costs (see also Note 2 under the captionCapitalized Software Development Costs) and customer relationships. Capitalized amounts related to patents represent external legal costs for the application and maintenance of patents. Intangible assets are amortized using the straight-line method over their estimated period of benefit, ranging from twoone to tenfifteen years.
UNIVERSAL ELECTRONICS INC.
NOTES TO CONSOLIDATED FINANCIAL STATEMENTS
DECEMBER 31, 2011
We assess the impairment of long-lived assets and intangible assets whenever events or changes in circumstances indicate that the carrying value may not be recoverable. Factors considered important which may trigger an impairment review include the following: (1) significant underperformance relative to expected historical or projected future operating results; (2) significant changes in the manner or use of the assets or strategy for the overall business; (3) significant negative industry or economic trends and (4) a significant decline in our stock price for a sustained period.
We conduct an impairment review when we determine that the carrying value of a long-lived or intangible asset may not be recoverable based upon the existence of one or more of the above indicators of impairment, we conduct an impairment review.impairment. The asset is impaired if its carrying value exceeds the sum of the undiscounted cash flows expected to result from the use and eventual disposition of the asset. In assessing recoverability, we must make assumptions regarding estimated future cash flows and other factors.
The impairment loss is the amount by which the carrying value of the asset exceeds its fair value. We estimate fair value utilizing the projected discounted cash flow method and a discount rate determined by our management to be commensurate with the risk inherent in our current business model. When calculating fair value, we must make assumptions regarding estimated future cash flows, discount rates and other factors. For the years ended December 31, 2008, 2007
See Notes 6 and 2006 we recorded impairment charges of $0.2 million, $0.1 million and $0.1 million, respectively, related to our15 for further information concerning long-lived assets. The impairment charges are recorded in depreciation expense. We recorded impairment charges related to ourSee Notes 7 and 21 for further information concerning intangible assets of $0.1 million for each of the years ended December 31, 2008, 2007 and 2006. The impairment charges are recorded in amortization expense.
47
48
Costs incurred internally while creating a computerto develop software productfor resale are expensed when incurred as research and development until technological feasibility has been established. We have determined that technological feasibility for our products is established when a working modelprototype is complete. Once technological feasibility is established, software development costs are capitalized until the product is available for general release to customerscustomers.
Capitalized software development costs are amortized on a product-by-product basis. Amortization is recorded in cost of sales and is then amortized using the greater of (i) the ratio that current gross revenues for a product bear to the total current and anticipated future gross revenues or (ii) the straight-line method over the remaining estimated economic life of the product. amount computed using:
| a. | the net book value at the beginning of the period multiplied by the ratio that current gross revenues for a product bear to the total of current and anticipated future gross revenues for that product; or |
| b. | the straight-line method over the remaining estimated economic life of the product including the period being reported on. |
The straight-line amortization periods forof capitalized software development costs begins when the related product is available for general release to customers. The amortization periods normally range from 1one to 2two years. Software development costs consist primarily of salaries and employee benefits.
We compare the unamortized costcapitalized software development costs of a software product to its net realizable value.value at each balance sheet date. The amount by which the unamortized cost of acapitalized software product exceedsdevelopment costs exceed the product’s net realizable value of that asset is written off. The net realizable value is the estimated future gross revenues attributable to eachof a product reduced by its estimated future completion costs and disposal.disposal costs. Any remaining amount of capitalized software development costs that have been written down are considered to be the cost for subsequent accounting purposes and the amount of the write-down is not subsequently restored.
Derivatives
Our foreign currency exposures are primarily concentrated in the Euro,Brazilian Real, British Pound, andChinese Yuan Renminbi, Euro, Hong Kong dollar, Indian Rupee, and Singapore dollar. We periodically enter into foreign currency exchange contracts with terms normally lasting less than nine months to protect against the adverse effects that exchange-rate fluctuations may have on our foreign currency-denominated receivables, payables, cash flows and reported income. We do not enter into financial instruments for speculation or trading purposes. Such contracts involve the risk of non-performance by the counterparty, which may result in a material loss.
49
UNIVERSAL ELECTRONICS INC.
NOTES TO CONSOLIDATED FINANCIAL STATEMENTS
DECEMBER 31, 2011
Stock-Based CompensationFair-Value Measurements
We measure fair value recognition provisions of SFAS No. 123(R), “Share-Based Payment” (“SFAS 123R”) using the modified-prospective transition method. Under this transition method, compensation expense recognizedframework established by the FASB accounting guidance for the year ended December 31, 2006 includes: (a) compensation expense for all share-based awards granted priorfair value measurements and disclosures. This framework requires fair value to but not yet vested as of January 1, 2006be determined based on the grant date fair value estimatedexchange price that would be received for an asset or paid to transfer a liability (an exit price) in accordance with the original provisions of SFAS 123principal or most advantageous market for the asset or liability in an orderly transaction between market participants.
The valuation techniques are based upon observable and (b) compensation expense for all share-based awards granted subsequentunobservable inputs. Observable or market inputs reflect market data obtained from independent sources. Unobservable inputs require management to December 31, 2005make certain assumptions and judgments based on the grant-datebest information available. Observable inputs are the preferred data source. These two types of inputs result in the following fair value estimated in accordance with the provisions of SFAS 123R.
| Level 1: | Quoted prices (unadjusted) for identical instruments in active markets. | |
| Level 2: | Quoted prices for similar instruments in active markets, quoted prices for identical or similar instruments in markets that are not active, and model-based valuation techniques for which all significant assumptions are observable in the market or can be corroborated by observable market data for substantially the full term of the assets or liabilities. | |
| Level 3: | Prices or valuations that require management inputs that are both significant to the fair value measurement and unobservable. | |
New Accounting Pronouncements
During December 2011, the FASBFinancial Accounting Standards Board (“FASB”) issued SFASAccounting Standards Update (“ASU”) 2011-12, “Deferral of the Effective Date for Amendments to the Presentation of Reclassifications of Items Out of Accumulated Other Comprehensive Income in Accounting Standards Update No. 157, “Fair Value Measurements” (“SFAS 157”), which defines fair value, establishes a framework for measuring fair value2011-05.” Under the amendments in accordance with generally accepted accounting principles in the United StatesASU 2011-05 “Presentation of America, and expands disclosures about fair value measurements for assets and liabilities. SFAS 157 applies when other accounting pronouncements require or permit assets or liabilities to be measured at fair value. Accordingly, SFAS 157 does not require new fair value measurements. In February 2008, the FASB issued their first Staff Position for SFAS 157 (“FSP FAS 157-1”) to amend SFAS 157 to exclude SFAS 13, “Accounting for Leases”, and other accounting pronouncements that address fair value measurements for purposes of lease classification or measurement under SFAS 13. However, this scope exception does not apply to assets acquired and liabilities assumed in a business combination thatComprehensive Income,” entities are required to be measured at fair value under SFAS 141, “Business Combinations”, or SFAS 141R, “Business Combinations”, regardlesspresent reclassification adjustments and the effect of whether those assetsreclassification adjustments on the face of the financial statements where net income is presented, by component of net income, and liabilities are related to leases.on the face of the financial statements where other comprehensive income is presented, by component of other comprehensive income. In addition, the amendments in February 2008,ASU 2011-05 require that reclassification adjustments be presented in interim financial periods. The amendments in ASU 2011-12 supersede changes to those paragraphs in ASU 2011-05 that pertain to how, when, and where reclassification adjustments are presented. ASU 2011-12 is issued to allow FASB time to redeliberate whether to present on the FASB issued their second Staff Position for SFAS 157 (“FSP FAS 157-2”), which delaysface of the effective date of SFAS 157 for non-financial assets and non-financial liabilities, except for items that are recognized or disclosed at fair value in an entity’s financial statements the effects of reclassifications out of accumulated other comprehensive income on a recurring basis (at least annually), until fiscal years beginning after November 15, 2008. We adopted the provisionscomponents of SFAS 157 in the first quarter of 2008, exceptnet income and other comprehensive income for those items within scope of FSP FAS 157-2, which we will adopt in the first quarter of 2009.all periods presented. The adoption of SFAS 157 didASU 2011-12 will result in changes to our presentation and disclosure only and will not have a material effectan impact on our consolidated results of operations and financial condition duringcondition.
During December 2011, the year ended December 31, 2008 (see Note 22 forFASB issued ASU 2011-11, “Disclosures about Offsetting Assets and Liabilities.” The amendments in ASU 2011-11 require an entity to disclose information about offsetting and related disclosure). In addition, we do not believe thatarrangements to enable users of its financial statements to understand the effect of those arrangements on its financial position. The adoption of FSP FAS 157-2ASU 2011-11 will result in changes to our presentation and disclosure only and will not have a material effectan impact on our consolidated results of operations and financial condition.
During September 2011, the FASB issued SFAS No. 159, “The Fair Value OptionASU 2011-08, “Testing Goodwill for Financial AssetsImpairment.” The amendments in ASU 2011-08 are intended to reduce the cost and Financial Liabilities—Includingcomplexity associated with goodwill impairment tests required under the Accounting Standard Codification Topic 350 Intangibles – Goodwill and Other. The update permits an amendment of FASB Statement No. 115” (“SFAS 159”). SFAS 159 expandsentity to first assess qualitative factors to determine whether it is more likely than not that the use of fair value accounting but does not affect existing standards that require assets or liabilities to be carried at fair value. Under SFAS 159,of a company may elect to use fair value to measure accounts and loans receivable, available-for-sale and held-to-maturity securities, equity method investments, accounts payable, guarantees and issued debt. Other eligible items include firm commitments for financial instruments that otherwise would not be recognized at
50
During June 2011, the FASB issued SFAS No. 141 (revised 2007), “Business Combinations” (“SFAS 141R”). SFAS 141R establishes principlesASU 2011-05, “Presentation of Comprehensive Income.” ASU 2011-05 eliminates the option to report other comprehensive income and requirements for how an acquirer recognizes and measures in its financial statements the identifiable assets acquired, the liabilities assumed, any noncontrolling interestcomponents in the acquireestatement of changes in
UNIVERSAL ELECTRONICS INC.
NOTES TO CONSOLIDATED FINANCIAL STATEMENTS
DECEMBER 31, 2011
stockholders’ equity and requires an entity to present the total of comprehensive income, the components of net income and the goodwill acquired. SFAS 141R also establishes disclosure requirements to enable the evaluationcomponents of the nature and financial effects of the business combination. SFAS 141R is effective as of the beginning of an entity’s fiscal year that begins after December 15, 2008, and will be adopted by us in the first quarter of fiscal 2009. The adoption of Statement 141R will effect the total purchase price of future acquisitions, as acquisition costs will now be expensed, and the allocation of fair value to specific assets and liabilities will be different. We are continuing to evaluate the impact the adoption of SFAS 141R will have on our consolidated results of operations and financial condition.
51
During May 2011, the FASB issued Staff Position 142-3 “DeterminationASU No. 2011-04, “Amendments to Achieve Common Fair Value Measurement and Disclosure Requirements in U.S. GAAP and International Financial Reporting Standards (“IFRS”).” This pronouncement was issued to provide a consistent definition of the Useful Life of Intangible Assets” (“FSP FAS 142-3”). FSP FAS 142-3 amends the factorsfair value and ensure that should be considered while developing renewal or extension assumptions to be utilized when determining the useful life of a recognized intangible asset under SFAS No. 142, “Goodwill and Other Intangible Assets” (“SFAS 142”). The intent of this FSP is to improve the consistency between the useful life of a recognized intangible asset under SFAS 142 and the period of expected cash flows used to measure the fair value ofmeasurement and disclosure requirements are similar between U.S. GAAP and IFRS. ASU 2011-04 changes certain fair value measurement principles and enhances the asset under SFAS 141R and other U.S. GAAP. The FSP FAS 142-3disclosure requirements will be applied prospectively to all intangible assets recognized as of, and subsequent to, the effective date. Early adoption is prohibited. FSP FAS 142-3particularly for level 3 fair value measurements. This pronouncement is effective for usreporting periods beginning January 1, 2009. We are currently assessing the impact that FSP FAS 142-3 will have on our consolidated results of operations and financial condition.
Recently Adopted Accounting Pronouncements
We adopted the following accounting standards during 2011, none of which had a material effect on our consolidated financial position and results of operations.
During January 2010, the FASB issued FSP 133-1ASU No. 2010-6 to improve the disclosure and FIN 45-4, “Disclosurestransparency of fair value measurements. These amendments clarify the level of disaggregation required, and the necessary disclosures about Credit Derivativesthe valuation techniques and Certain Guarantees: An Amendment ofinputs used to measure fair value for both recurring and nonrecurring fair value measurements. We adopted this ASU beginning January 1, 2011.
During December 2010, the FASB Statementissued ASU No. 133 and FASB Interpretation No. 45; and Clarification2010-29 to address diversity in practice regarding the interpretation of the Effective Date of FASB Statement No. 161” (FSP 133-1pro forma revenue and FIN 45-4). FSP 133-1 and FIN 45-4 amends and enhancesearnings disclosure requirements for sellers of credit derivatives and financial guarantees. It also clarifies that the disclosure requirements of SFAS 161 are effective for quarterly periodsbusiness combinations. We adopted this ASU beginning after November 15, 2008, and fiscal years that include those periods. FSP 133-1 and FIN 45-4 is effective for reporting periods (annual or interim) ending after November 15, 2008. The implementation of this standard is not expected to have a material effect on our consolidated financial position and results of operations.January 1, 2011.
During October 2008,2009, the FASB issued FSP 157-3 “Determining Fair Value ofASU No. 2009-14 to address accounting for arrangements that contain tangible products and software. We adopted this ASU beginning January 1, 2011.
During October 2009, the FASB issued ASU No. 2009-13 to address the accounting for multiple-deliverable arrangements to enable vendors to account for products or services (deliverables) separately rather than as a Financial Asset in a Market That Is Not Active” (“FSP 157-3”). FSP 157-3 clarifies the application of SFAS 157 in an inactive marketcombined accounting unit. We adopted this ASU beginning January 1, 2011.
Note 3 — Cash and demonstrates how theCash Equivalents
The following table sets forth our cash and cash equivalents that were accounted for at fair value on a recurring basis on December 31, 2011 and 2010:
| December 31, 2011 | December 31, 2010 | |||||||||||||||||||||||||||||||
| (In thousands) | Fair Value Measurement Using | Total | Fair Value Measurement Using | Total | ||||||||||||||||||||||||||||
| Description | (Level 1) | (Level 2) | (Level 3) | Balance | (Level 1) | (Level 2) | (Level 3) | Balance | ||||||||||||||||||||||||
Cash and cash equivalents | $ | 29,372 | $ | — | $ | — | $ | 29,372 | $ | 54,249 | $ | — | $ | — | $ | 54,249 | ||||||||||||||||
On December 31, 2011, we had approximately $4.1 million, $7.6 million, $16.5 million, $0.1 million, and $1.1 million of a financial asset is determined whencash and cash equivalents in the market United States, Europe, Asia, Cayman Islands and South America, respectively.
On December 31, 2010, we had approximately $6.5 million, $15.0 million, $27.8 million, $4.0 million, and $0.9 million of cash and cash equivalents in the United States, Europe, Asia, Cayman Islands and South America, respectively.
See Note 2 under the captionCash and Cash Equivalentsfor that financial asset is inactive. FSP 157-3
52
NOTES TO CONSOLIDATED FINANCIAL STATEMENTS
DECEMBER 31, 2011
Note 4 — Accounts Receivable, Net and Revenue Concentrations
Accounts receivable, net consisted of the following on December 31, 2011 and 2010:
| (in thousands) | 2011 | 2010 | ||||||
Trade receivables, gross | �� | $ | 82,305 | $ | 88,485 | |||
Allowance for doubtful accounts | (1,021 | ) | (878 | ) | ||||
Allowance for sales returns | (981 | ) | (1,366 | ) | ||||
|
|
|
| |||||
Net trade receivables | 80,303 | 86,241 | ||||||
Other | 1,881 | 63 | ||||||
|
|
|
| |||||
Accounts receivable, net | $ | 82,184 | $ | 86,304 | ||||
|
|
|
| |||||
Allowance for which financial statements had not been issued. Doubtful Accounts
The implementation of this standard did not have a material effect on our consolidated financial position and results of operations.
| December 31, | ||||||||
| (in thousands) | 2008 | 2007 | ||||||
| Goodwill: | ||||||||
| Unites States | $ | 8,314 | $ | 8,314 | ||||
International(1) | 2,443 | 2,549 | ||||||
| Total goodwill | $ | 10,757 | $ | 10,863 | ||||
53
| (in thousands) | 2008(1) | 2007(1) | ||||||
| Carrying amount: | ||||||||
| Distribution rights (10 years) | $ | 399 | $ | 419 | ||||
| Patents (10 years) | 7,115 | 6,335 | ||||||
| Trademark and trade names (10 years) | 840 | 840 | ||||||
| Core technology (5 years) | 1,630 | 1,630 | ||||||
| Capitalized software development (1-2 years) | 1,030 | 499 | ||||||
| Other (5 years) | — | 370 | ||||||
| Total carrying amount | $ | 11,014 | $ | 10,093 | ||||
| Accumulated amortization: | ||||||||
| Distribution rights | $ | 53 | $ | 56 | ||||
| Patents | 3,292 | 2,695 | ||||||
| Trademark and trade names | 357 | 273 | ||||||
| Core technology | 1,386 | 1,060 | ||||||
| Capitalized software development | 289 | 68 | ||||||
| Other | — | 241 | ||||||
| Total accumulated amortization | $ | 5,377 | $ | 4,393 | ||||
| Net carrying amount: | ||||||||
| Distribution rights | $ | 346 | $ | 363 | ||||
| Patents | 3,823 | 3,640 | ||||||
| Trademark and trade names | 483 | 567 | ||||||
| Core technology | 244 | 570 | ||||||
| Capitalized software development | 741 | 431 | ||||||
| Other | — | 129 | ||||||
| Total net carrying amount | $ | 5,637 | $ | 5,700 | ||||
54
(in thousands) Description | Balance at Beginning of Period | Additions to Costs and Expenses | (Write-offs)/ FX Effects | Balance at End of Period | ||||||||||||
Year Ended December 31, 2011 | $ | 878 | $ | 277 | $ | (134 | ) | $ | 1,021 | |||||||
Year Ended December 31, 2010 | $ | 2,423 | $ | 931 | $ | (2,476 | ) | $ | 878 | |||||||
Year Ended December 31, 2009 | $ | 2,439 | $ | 435 | $ | (451 | ) | $ | 2,423 | |||||||
| (in thousands) | ||||
| 2009 | $ | 1,491 | ||
| 2010 | 1,042 | |||
| 2011 | 773 | |||
| 2012 | 773 | |||
| 2013 | 773 | |||
| Thereafter | 785 | |||
| $ | 5,637 | |||
| (in thousands) | 2008 | 2007 | ||||||
| Trade receivable, gross | $ | 65,014 | $ | 63,528 | ||||
| Allowance for doubtful accounts | (2,439 | ) | (2,330 | ) | ||||
| Allowance for sales returns | (2,823 | ) | (1,482 | ) | ||||
| Net trade receivable | 59,752 | 59,716 | ||||||
Other(1) | 73 | 430 | ||||||
| Accounts receivable, net | $ | 59,825 | $ | 60,146 | ||||
The allowance for sales returns balance at December 31, 20082011 and 20072010 contained reserves for items returned prior to year-end but that were not completely processed, and therefore had not yet been removed from the allowance for sales returns balance. We estimate that ifIf these returns had been fully processed, the allowance for sales returns balance would have been approximately $0.8$0.7 million and $0.9 million on December 31, 20082011 and 2007.2010, respectively. The value of these returned goods was included in our inventory balance at December 31, 20082011 and 2007.
55
Significant Customers
| (in thousands) | Balance at | Additions | Balance at | |||||||||||||
| Beginning of | to Costs and | (Write-offs)/ | End of | |||||||||||||
| Description | Period | Expenses | FX Effects | Period | ||||||||||||
| Year Ended December 31, 2008 | $ | 2,330 | $ | 442 | $ | (333 | ) | $ | 2,439 | |||||||
| Year Ended December 31, 2007 | $ | 2,602 | $ | 23 | $ | (295 | ) | $ | 2,330 | |||||||
| Year Ended December 31, 2006 | $ | 2,296 | $ | 210 | $ | 96 | $ | 2,602 | ||||||||
| (in thousands) | 2008 | 2007 | ||||||
| Components | $ | 7,879 | $ | 6,750 | ||||
| Finished goods | 37,331 | 29,982 | ||||||
| Reserve for inventory obsolescence | (1,535 | ) | (1,826 | ) | ||||
| Inventories, net | $ | 43,675 | $ | 34,906 | ||||
| (in thousands) | 2008 | 2007 | ||||||
| Tooling | $ | 10,567 | $ | 9,998 | ||||
| Computer equipment | 2,588 | 2,581 | ||||||
| Software | 2,937 | 2,583 | ||||||
| Furniture and fixtures | 1,740 | 1,660 | ||||||
| Leasehold improvements | 2,824 | 1,056 | ||||||
| Machinery and equipment | 1,040 | 911 | ||||||
| 21,696 | 18,789 | |||||||
| Accumulated depreciation | (14,275 | ) | (13,725 | ) | ||||
| 7,421 | 5,064 | |||||||
| Construction in progress | 1,265 | 2,494 | ||||||
| Total equipment, furniture and fixtures, net | $ | 8,686 | $ | 7,558 | ||||
56
| (in thousands) | 2008 | 2007 | ||||||
| Accrued freight | $ | 1,846 | $ | 1,435 | ||||
| Accrued professional fees | 1,245 | 580 | ||||||
| Accrued advertising and marketing | 644 | 735 | ||||||
| Deferred income taxes | 356 | 511 | ||||||
| Accrued third-party commissions | 262 | 204 | ||||||
| Accrued sales and VAT taxes | 410 | 499 | ||||||
| Other | 2,050 | 2,603 | ||||||
| Total other accrued expenses | $ | 6,813 | $ | 6,567 | ||||
57
| Compensation Expense | ||||||||||||||||||||||||
| Shares | Fair Market | |||||||||||||||||||||||
| Grant Date | Granted | Value(1) | 2008 | 2007 | 2006 | Unvested | ||||||||||||||||||
| July 1, 2005 | 20,000 | $ | 325,800 | $ | — | $ | — | $ | 162,900 | $ | — | |||||||||||||
| July 1, 2006 | 15,000 | 272,100 | — | 136,050 | 136,050 | — | ||||||||||||||||||
| August 14, 2006 | 4,375 | 79,406 | — | 45,375 | 34,031 | — | ||||||||||||||||||
| October 23, 2006 | 3,438 | 72,679 | — | 52,850 | 19,829 | — | ||||||||||||||||||
| July 1, 2007 | 22,500 | 815,512 | 362,449 | 453,063 | — | — | ||||||||||||||||||
| April 24, 2008 | 938 | 24,834 | 24,834 | — | — | — | ||||||||||||||||||
| July 1, 2008 | 25,000 | 524,375 | 262,188 | — | — | 262,187 | ||||||||||||||||||
| Total Amortization Expense | $ | 649,471 | $ | 687,338 | $ | 352,810 | $ | 262,187 | ||||||||||||||||
58
| (in thousands) | 2008 | 2007 | 2006 | |||||||||
| Cost of sales | $ | 17 | $ | 31 | $ | 26 | ||||||
| Research and development | 356 | 418 | 370 | |||||||||
| Selling, general and administrative | 3,870 | 3,072 | 2,721 | |||||||||
| Total stock-based compensation expense | $ | 4,243 | $ | 3,521 | $ | 3,117 | ||||||
| December 31,(1) | ||||||||||||
| 2008 | 2007 | 2006 | ||||||||||
| Weighted average fair value of grants | $ | 9.08 | $ | 11.77 | $ | 7.50 | ||||||
| Risk-free interest rate | 2.75 | % | 4.56 | % | 4.72 | % | ||||||
| Expected volatility | 40.85 | % | 39.06 | % | 39.27 | % | ||||||
| Expected life in years | 4.74 | 5.25 | 4.89 | |||||||||
59
| 2008 | 2007 | 2006 | ||||||||||||||||||||||||||||||||||||||||||||||
| Average | Average | Average | ||||||||||||||||||||||||||||||||||||||||||||||
| Weighted- | Remaining | Aggregate | Weighted- | Remaining | Aggregate | Weighted- | Remaining | Aggregate | ||||||||||||||||||||||||||||||||||||||||
| Number of | Average | Contractual | Intrinsic | Number of | Average | Contractual | Intrinsic | Number of | Average | Contractual | Intrinsic | |||||||||||||||||||||||||||||||||||||
| Options | Exercise | Term | Value | Options | Exercise | Term | Value | Options | Exercise | Term | Value | |||||||||||||||||||||||||||||||||||||
| (in 000’s) | Price | (in years) | (in 000’s) | (in 000’s) | Price | (in years) | (in 000’s) | (in 000’s) | Price | (in years) | (in 000’s) | |||||||||||||||||||||||||||||||||||||
| Outstanding at beginning of the year | 1,739 | $ | 16.83 | 2,480 | $ | 13.73 | 3,151 | $ | 13.70 | |||||||||||||||||||||||||||||||||||||||
| �� | ||||||||||||||||||||||||||||||||||||||||||||||||
| Granted | 140 | 23.46 | 329 | 27.80 | 46 | 18.15 | ||||||||||||||||||||||||||||||||||||||||||
| Exercised | (114 | ) | 10.19 | $ | 1,562 | (981 | ) | 12.83 | $ | 17,263 | (550 | ) | 13.58 | $ | 3,036 | |||||||||||||||||||||||||||||||||
| Forfeited/cancelled/ expired | (36 | ) | 24.70 | (89 | ) | 14.91 | (167 | ) | 16.08 | |||||||||||||||||||||||||||||||||||||||
| Outstanding at end of year | 1,729 | $ | 17.64 | 5.06 | $ | 3,045 | 1,739 | $ | 16.83 | 5.58 | $ | 28,884 | 2,480 | $ | 13.73 | 5.51 | $ | 18,096 | ||||||||||||||||||||||||||||||
| Vested and expected to vest at end of year | 1,688 | $ | 17.42 | 4.98 | $ | 3,045 | 1,650 | $ | 16.43 | 5.41 | $ | 28,079 | 2,411 | $ | 13.64 | 5.43 | $ | 17,783 | ||||||||||||||||||||||||||||||
| Exercisable at end of year | 1,267 | $ | 15.34 | 3.97 | $ | 3,044 | 1,081 | $ | 13.84 | 4.05 | $ | 21,187 | 1,848 | $ | 12.91 | 4.67 | $ | 14,994 | ||||||||||||||||||||||||||||||
60
| Weighted- | ||||||||
| Shares | Average | |||||||
| Granted | Grant Date | |||||||
| (in 000’s) | Fair Value | |||||||
| Non-vested at December 31, 2005 | 10 | $ | 16.29 | |||||
| Granted | 23 | 18.59 | ||||||
| Vested | (20 | ) | 17.37 | |||||
| Forfeited | — | — | ||||||
| Non-vested at December 31, 2006 | 13 | $ | 18.74 | |||||
| Granted | 25 | 36.25 | ||||||
| Vested | (25 | ) | 27.49 | |||||
| Forfeited | (3 | ) | 36.25 | |||||
| Non-vested at December 31, 2007 | 10 | $ | 36.25 | |||||
| Granted | 142 | 23.15 | ||||||
| Vested | (62 | ) | 25.15 | |||||
| Forfeited | — | — | ||||||
| Non-vested at December 31, 2008 | 90 | $ | 23.23 | |||||
61
62
| Options Outstanding | Options Exercisable | |||||||||||||||||||
| Number | Number | |||||||||||||||||||
| Outstanding | Weighted-Average | Weighted-Average | Exercisable | Weighted-Average | ||||||||||||||||
| Range of | At 12/31/08 | Remaining Years of | Exercise | At 12/31/08 | Exercise | |||||||||||||||
| Exercise Prices | (in 000’s) | Contractual Life | Price | (in 000’s) | Price | |||||||||||||||
| $ 7.50 to $9.83 | 180 | 3.38 | $ | 8.65 | 180 | $ | 8.65 | |||||||||||||
| 10.92 to 13.08 | 377 | 3.28 | 11.91 | 377 | 11.91 | |||||||||||||||
| 14.85 to 16.88 | 222 | 4.05 | 16.06 | 207 | 16.02 | |||||||||||||||
| 17.11 to 17.62 | 289 | 6.05 | 17.58 | 201 | 17.58 | |||||||||||||||
| 18.01 to 21.95 | 327 | 4.39 | 20.03 | 227 | 19.50 | |||||||||||||||
| 23.66 to 28.08 | 327 | 8.46 | 27.58 | 74 | 28.08 | |||||||||||||||
| 32.40 to 35.35 | 7 | 8.94 | 34.51 | 1 | 35.35 | |||||||||||||||
| $ 7.50 to $35.35 | 1,729 | 5.06 | $ | 17.64 | 1,267 | $ | 15.34 | |||||||||||||
63
| Year Ended December 31, | ||||||||||||||||||||||||
| 2011 | 2010 | 2009 | ||||||||||||||||||||||
| $ (thousands) | % of Net Sales | $ (thousands) | % of Net Sales | $ (thousands) | % of Net Sales | |||||||||||||||||||
DIRECTV | $ | 57,371 | 12.2 | % | $ | 45,367 | 13.7 | % | $ | 66,849 | 21.1 | % | ||||||||||||
Comcast | — | — | $ | 42,716 | 12.9 | % | $ | 35,382 | 11.1 | % | ||||||||||||||
Sony | $ | 48,483 | 10.3 | % | — | — | — | — | ||||||||||||||||
Trade receivables with these customers were the following on December 31, 2011 and 2010:
| December 31, 2011 | December 31, 2010 | |||||||||||||||
| $ (thousands) | % of Accounts receivable, net | $ (thousands) | % of Accounts Receivable, net | |||||||||||||
DIRECTV | $ | 7,599 | 9.2 | % | $ | 9,481 | 11.0 | % | ||||||||
Comcast | — | — | $ | 4,786 | 5.5 | % | ||||||||||
Sony | $ | 7,064 | 8.6 | % | — | — | ||||||||||
Echostar accounted for greater than 10% of accounts receivable, net on December 31, 2010, but did not account for greater than 10% of net sales for the year then ended. Trade receivables with this customer amounted to $9.1 million and $2.3 million,$10,458 thousand, or 15.3% and 3.8%12.1%, of our accounts receivable, net trade receivables aton December 31, 2008 and 2007, respectively. The December 31, 2008 trade receivables balance for this customer increased compared to December 31, 2007 as the result of an increase in large orders shipped late in the fourth quarter 2008 as compared to fourth quarter 2007.
The loss of any of these customers or any other customer, either in the United States or abroad, due to their financial weakness or bankruptcy, or our inability to obtain orders or maintain our order volume with them, may have a material adverse effect on our financial condition, results of operations and cash flows.
UNIVERSAL ELECTRONICS INC.
NOTES TO CONSOLIDATED FINANCIAL STATEMENTS
DECEMBER 31, 2011
Note 5 — Inventories, Net and Significant Suppliers
Inventories, net consisted of the following on December 31, 2011 and 2010:
| (in thousands) | 2011 | 2010 | ||||||
Raw materials | $ | 17,014 | $ | 15,864 | ||||
Components(1) | 21,819 | 10,358 | ||||||
Work in process | 1,071 | 2,885 | ||||||
Finished goods(2) | 54,447 | 38,430 | ||||||
Reserve for excess and obsolete inventory | (3,447 | ) | (2,135 | ) | ||||
|
|
|
| |||||
Inventories, net | $ | 90,904 | $ | 65,402 | ||||
|
|
|
| |||||
| (1) | During 2011, we increased our investment in safety stock for certain components, including integrated circuits, as a result of uncertainties regarding the effect that the Tsunami in Japan and the 2012 Chinese New Year holiday would have on our supply chain. |
| (2) | Finished goods increased $16 million, or 42%, from $38.4 million on December 31, 2010 to $54.4 million on December 31, 2011. During the second quarter of 2011, we altered our shipping terms with a significant customer which resulted in us holding title to inventories until shipments are received by them. Prior to altering our shipping terms, title transferred to this significant customer at the shipping point. In addition, we increased our investment in safety stock for certain products, as a result of uncertainties regarding the effect that the 2012 Chinese New Year holiday would have on our supply chain. |
Reserve for Excess and Obsolete Inventory
Changes in the reserve for excess and obsolete inventory during the years ended December 30, 2011, 2010 and 2009 were composed of the following:
(In thousands) Description | Balance at Beginning of Period | Additions Charged to Costs and Expenses(1) | Sell Through(2) | Write-offs/FX Effects | Balance at End of Period | |||||||||||||||
Reserve for excess and obsolete inventory: | ||||||||||||||||||||
Year Ended December 31, 2011 | $ | 2,135 | $ | 4,568 | $ | (1,295 | ) | $ | (1,961 | ) | $ | 3,447 | ||||||||
Year Ended December 31, 2010 | $ | 1,750 | $ | 2,887 | $ | (1,043 | ) | $ | (1,459 | ) | $ | 2,135 | ||||||||
Year Ended December 31, 2009 | $ | 1,535 | $ | 3,340 | $ | (865 | ) | $ | (2,260 | ) | $ | 1,750 | ||||||||
| (1) | The additions charged to costs and expenses do not include inventory directly written-off that was scrapped during production totaling $1.0 million, $0.6 million, and $0.8 million for the years ended December 31, 2011, 2010, and 2009. These amounts are production waste and are not included in management’s reserve for excess and obsolete inventory. |
| (2) | This column represents the gross book value of inventory items sold during the period that had been previously written down to zero net book value. Sell through is the result of differences between our judgment concerning the salability of inventory items during the excess and obsolete inventory review process and our subsequent experience. |
See Note 2 under the captionInventoriesfor further information regarding our accounting principles.
Significant Suppliers
We have elected to purchase integrated circuits, (“IC”), used principally in our wireless control products, from two main sources. Purchasessuppliers. The total purchased from one of these suppliers amounted to morewas greater than 10% of our total inventory purchases in 2008. Purchasesfor each of the years ended December 31, 2011, 2010, and 2009. In addition, our purchases from these suppliersone component and finished good supplier amounted to $28.2 million and $18.6 million, representing 15.2% and 10.0%, respectively,greater than 10% of our total inventory purchases for the year ended December 31, 2008. Accounts payable with these2010. Our purchases from three component and finished good suppliers each amounted to $3.6 million and $5.4 million, representing 8.1% and 12.0% of total accounts payable at December 31, 2008, respectively.
UNIVERSAL ELECTRONICS INC.
NOTES TO CONSOLIDATED FINANCIAL STATEMENTS
DECEMBER 31, 2007.
During the years ended December 31, 2008, 20072011, 2010 and 2006, purchases2009, the amounts purchased from two of our component and finished goodthese four suppliers amounted to more than 10% of total inventory purchases.
| Year Ended December 31, | ||||||||||||||||||||||||
| 2011 | 2010 | 2009 | ||||||||||||||||||||||
| $ (thousands) | % of Total Inventory Purchases | $ (thousands) | % of Total Inventory Purchases | $ (thousands) | % of Total Inventory Purchases | |||||||||||||||||||
Integrated circuit supplier A | $ | 29,124 | 10.2 | % | $ | 30,047 | 15.3 | % | $ | 28,290 | 14.8 | % | ||||||||||||
Component and finished good supplier A | — | — | $ | 36,966 | 18.9 | % | $ | 44,590 | 23.3 | % | ||||||||||||||
Component and finished good supplier B (1) | — | — | — | — | $ | 46,004 | 24.1 | % | ||||||||||||||||
Component and finished good supplier C | — | — | — | — | $ | 28,879 | 15.1 | % | ||||||||||||||||
The total accounts payable atto each of these suppliers on December 31, 20082011 and 2007, respectively.
| December 31, 2011 | December 31, 2010 | |||||||||||||||
| $ (thousands) | % of Accounts Payable | $ (thousands) | % of Accounts Payable | |||||||||||||
Integrated circuit supplier A | $ | 1,725 | 3.1 | % | $ | 3,731 | 6.7 | % | ||||||||
Component and finished good supplier A | — | — | $ | 9,172 | 16.4 | % | ||||||||||
Component and finished good supplier B(1) | — | — | — | — | ||||||||||||
Component and finished good supplier C | — | — | — | — | ||||||||||||
| (1) | Component and finished good supplier B is Enson and its subsidiaries. See Note 21 for further information regarding our acquisition of Enson. |
We have identified alternative sources of supply for these integrated circuits, components, and finished goods; however, there can be no assurance that we will be able to continue to obtain these inventory purchases on a timely basis. We generally maintain inventories of our integrated circuits, which may be used in partutilized to mitigate, but not eliminate, delays resulting from supply interruptions. An extended interruption, shortage or termination in the supply of any of the components used in our products, or a reduction in their quality or reliability, or a significant increase in the prices of components, would have an adverse effect on our business,operating results, of operationsfinancial condition and cash flows.
64
Related Party Vendor
We purchase certain printed circuit board assemblies (“PCBAs”) from a related party vendor. The vendor is considered a related party for financial reporting purposes because the Senior Vice President of Manufacturing of Enson owns 40% of this vendor. Our purchases from this vendor for the year ended December 31, 2011 totaled approximately $8.7 million, or 3.0% of total inventory purchases. Our purchases from this vendor for the year ended December 31, 2010 totaled $1.3 million, or 0.7% of total inventory purchases. Payable amounts outstanding to this vendor were approximately $1.9 million and $1.6 million on December 31, 2011 and 2010, respectively. Our payable terms and pricing with this vendor are consistent with the terms offered by other vendors in the ordinary course of business. The accounting policies that we apply to our transactions with our related party are consistent with those applied in transactions with independent third parties. Corporate management routinely monitors purchases from our related party vendor to ensure these purchases remain consistent with our business objectives.
UNIVERSAL ELECTRONICS INC.
NOTES TO CONSOLIDATED FINANCIAL STATEMENTS
DECEMBER 31, 2011
Note 6 — Property, Plant, and Equipment, Net
Property, plant, and equipment, net consisted of the following at December 31, 2008 we had contractual obligations to purchase $20.8 million of inventory from various suppliers over the subsequent five year period.
| (in thousands) | 2011 | 2010 | ||||||
Buildings | $ | 42,904 | $ | 41,679 | ||||
Tooling | 23,320 | 21,287 | ||||||
Computer equipment | 2,741 | 3,681 | ||||||
Software | 7,149 | 6,489 | ||||||
Furniture and fixtures | 4,757 | 3,486 | ||||||
Leasehold improvements | 15,611 | 14,654 | ||||||
Machinery and equipment | 41,206 | 35,348 | ||||||
|
|
|
| |||||
| 137,688 | 126,624 | |||||||
Accumulated depreciation | (66,291 | ) | (54,868 | ) | ||||
|
|
|
| |||||
| 71,397 | 71,756 | |||||||
Construction in progress | 9,052 | 6,341 | ||||||
|
|
|
| |||||
Total property, plant, and equipment, net | $ | 80,449 | $ | 78,097 | ||||
|
|
|
| |||||
Depreciation expense, for the total contractual obligation utilizing the straight-line method over the lease term, ranging from 36 to 73 months. The related liabilityincluding tooling depreciation which is recorded in other accrued expenses (see Note 8). The liability related to rent escalationscost of goods sold, was $0.1$13.1 million, at both December 31, 2008 and 2007.
The following table summarizes future minimum non-cancelablenet book value of property, plant, and equipment located within the People’s Republic of China was $71.0 million and $70.3 million on December 31, 2011 and 2010, respectively.
On December 31, 2011, construction in progress included $6.9 million of building and building improvements, $0.4 million of tooling, $0.4 million of internal use software costs and $1.4 million of machinery and equipment. We expect that approximately 96% of the construction in progress costs will be placed in service during the first and second quarters of 2012. We will begin to depreciate these assets once the assets are placed in service. On December 31, 2010, construction in progress included $2.2 million of building and building improvements, $0.8 million of tooling, $1.7 million of internal use software costs and $1.6 million of machinery and equipment
See Note 2 under the captionsProperty, plant, and equipmentandLong-Lived and Intangible Assets Impairmentfor further information regarding our accounting principles.
Note 7 — Goodwill and Intangible Assets, Net
Goodwill
Under the accounting guidance, the unit of accounting for goodwill is at a level of reporting referred to as a “reporting unit.” A reporting unit is either (1) an operating lease paymentssegment or (2) one level below an operating segment — referred to as a component. During the fourth quarter 2010, as a result of us flattening our management structure, we merged our international component with initial terms greater than one yearour domestic component. We no longer have segment management of the international component and the financial results of our international component are not separate. In addition, these components have similar economic characteristics. As a result of these changes, our domestic and international components have been merged into our single operating segment.
The goodwill on December 31, 2011 and changes in the carrying amount of goodwill during the two years ended December 31, 2011 were the following:
| (in thousands) | ||||
Balance at December 31, 2009 | $ | 13,724 | ||
Goodwill acquired during the period(1) | 17,336 | |||
Goodwill adjustments(2) | (183 | ) | ||
|
| |||
Balance at December 31, 2010 | $ | 30,877 | ||
Goodwill acquired during the period | — | |||
Goodwill adjustments(2) | (57 | ) | ||
|
| |||
Balance at December 31, 2011 | $ | 30,820 | ||
|
| |||
| (1) | During the fourth quarter of 2010, we recorded $17.3 million of goodwill related to the Enson acquisition. Please refer to Note 21 for further information about this acquisition. |
| (2) | The adjustment included in international goodwill was the result of fluctuations in the foreign currency exchange rates used to translate the balance into U.S. dollars. |
UNIVERSAL ELECTRONICS INC.
NOTES TO CONSOLIDATED FINANCIAL STATEMENTS
DECEMBER 31, 2011
We conducted annual goodwill impairment reviews on December 31, 2011, 2010, and 2009 utilizing significant unobservable inputs (level 3). Based on the analysis performed, we determined that our goodwill was not impaired.
Please see Note 2 under the captionsGoodwillandFair-Value Measurementsfor further information regarding our accounting principles and the valuation methodology utilized.
Intangible Assets, Net
The components of intangible assets, net at December 31, 2008:
| (in thousands) | Amount | |||
| Year ending December 31: | ||||
| 2009 | $ | 1,762 | ||
| 2010 | 1,461 | |||
| 2011 | 1,199 | |||
| 2012 | 541 | |||
| 2013 | 290 | |||
| Thereafter | — | |||
| Total operating lease commitments | $ | 5,253 | ||
| 2011 | 2010 | |||||||||||||||||||||||
| (in thousands) | Gross | Accumulated Amortization | Net | Gross | Accumulated Amortization | Net | ||||||||||||||||||
Carrying amount(1): | ||||||||||||||||||||||||
Distribution rights (10 years) | $ | 372 | $ | (50 | ) | $ | 322 | $ | 384 | $ | (51 | ) | $ | 333 | ||||||||||
Patents (10 years) | 9,488 | (5,306 | ) | 4,182 | 8,612 | (4,589 | ) | 4,023 | ||||||||||||||||
Trademark and trade names (10 years)(2) | 2,837 | (821 | ) | 2,016 | 2,836 | (565 | ) | 2,271 | ||||||||||||||||
Developed and core technology (5 -15 years)(3) | 3,500 | (671 | ) | 2,829 | 3,500 | (438 | ) | 3,062 | ||||||||||||||||
Capitalized software development costs (1-2 years) | 1,515 | (1,108 | ) | 407 | 1,896 | (1,165 | ) | 731 | ||||||||||||||||
Customer relationships (10-15 years)(4) | 26,367 | (3,309 | ) | 23,058 | 26,349 | (775 | ) | 25,574 | ||||||||||||||||
|
|
|
|
|
|
|
|
|
|
|
| |||||||||||||
Total carrying amount | $ | 44,079 | $ | (11,265 | ) | $ | 32,814 | $ | 43,577 | $ | (7,583 | ) | $ | 35,994 | ||||||||||
|
|
|
|
|
|
|
|
|
|
|
| |||||||||||||
| (1) | This table excludes the gross value of fully amortized intangible assets totaling $8.1 million and $7.6 million on December 31, 2011 and 2010, respectively. |
| (2) | As part of our acquisition of Enson during the fourth quarter of 2010, we purchased trademark and trade names valued at $2.0 million, which are being amortized ratably over ten years. Refer to Note 21 for further information regarding our purchase of trademark and trade names. |
| (3) | During the first quarter of 2009, we purchased core technology from Zilog Inc. valued at $3.5 million, which is being amortized ratably over fifteen years. Refer to Note 21 for further information about this acquisition. |
| (4) | During the first quarter of 2009, we purchased customer relationships from Zilog valued at $3.1 million, which are being amortized ratably over fifteen years. During the fourth quarter of 2010 as part of the Enson acquisition we purchased customer relationships valued at $23.3 million, which are being amortized ratably over ten years. Refer to Note 21 for further information regarding our purchase of these customer relationships. |
Amortization expense is recorded in selling, general and administrative expenses, except amortization expense related to capitalized software development costs which is recorded in cost of sales. Amortization expense by income statement caption during the Internal Revenue Code for allyears ended December 31, 2011, 2010 and 2009 is the following:
| Year Ended December 31, | ||||||||||||
| (in thousands) | 2011 | 2010 | 2009 | |||||||||
Cost of sales | $ | 451 | $ | 492 | $ | 450 | ||||||
Selling, general and administrative | 3,795 | 1,686 | 1,397 | |||||||||
|
|
|
|
|
| |||||||
Total amortization expense | $ | 4,246 | $ | 2,178 | $ | 1,847 | ||||||
|
|
|
|
|
| |||||||
UNIVERSAL ELECTRONICS INC.
NOTES TO CONSOLIDATED FINANCIAL STATEMENTS
DECEMBER 31, 2011
Estimated future amortization expense related to our intangible assets at December 31, 2011, is the following:
| (in thousands) | ||||
2012 | $ | 4,182 | ||
2013 | 4,000 | |||
2014 | 3,867 | |||
2015 | 3,804 | |||
2016 | 3,766 | |||
Thereafter | 13,195 | |||
|
| |||
| $ | 32,814 | |||
|
| |||
The remaining weighted average amortization period of our domestic employees that meet certain qualifications. Participants in the plan may elect to contribute up to the maximum allowed by law. We match 50% of the participants’ contributions up to 15% of their gross salary in the form of newly issued shares of our common stock. We may also make other discretionary contributions to the plan. intangible assets is 8.8 years.
Intangibles Measured at Fair Value on a Nonrecurring Basis
We recorded $0.7impairment charges related to our intangible assets of $0.01 million, $0.6$0.02 million and $0.6$0.01 million of expense for company contributions for the years ended December 31, 2008, 20072011, 2010, and 2006,2009, respectively.
| (in thousands) | 2008 | 2007 | 2006 | |||||||||
| Net gain (loss) on foreign currency exchange transactions | $ | 315 | $ | (35 | ) | $ | (508 | ) | ||||
| Other (expense) income | (4 | ) | 42 | 10 | ||||||||
| Other income (expense), net | $ | 311 | $ | 7 | $ | (498 | ) | |||||
65
| Fair Value Measurement Using | ||||||||||||||||||||
(In thousands) Description | December 31, 2011 | Quoted Prices in Active Markets for Identical Assets (Level 1) | Significant Other Observable Inputs (Level 2) | Significant Unobservable Inputs (Level 3) | Total Gains (Losses) | |||||||||||||||
Patents, trademarks and trade names | $ | 6,198 | — | — | $ | 6,198 | $ | (10 | ) | |||||||||||
We disposed of five patents and sixteen trademarks with an aggregate carrying amount of $10 thousand resulting in impairment charges of $10 thousand during 2011. We disposed of thirteen patents and eight trademarks with an aggregate carrying amount of $21 thousand resulting in impairment charges of $21 thousand during 2010. We disposed of patents and trademarks with a carrying amount of $13 thousand in 2009. These assets no longer held any probable future economic benefits and were written-off.
See Note 2 under the captionsLong-Lived and Intangible Assets Impairment, Capitalized Software Development Costs,andFair-Value Measurementsfor further information regarding our accounting principles and the valuation methodology utilized.
UNIVERSAL ELECTRONICS INC.
NOTES TO CONSOLIDATED FINANCIAL STATEMENTS
DECEMBER 31, 2011
Note 168 — Notes Payable and Line of Credit
Notes payable and line of credit on December 31, 2011 and 2010 were comprised of the following:
| Amount Outstanding | ||||||||
| (In thousands) | 2011 | 2010 | ||||||
U.S. Bank Term Loan Facility(1) | $ | 14,400 | $ | 35,000 | ||||
U.S. Bank Revolving Credit Line(2) | 2,000 | — | ||||||
|
|
|
| |||||
Total Debt | $ | 16,400 | $ | 35,000 | ||||
|
|
|
| |||||
| (1) | Under the U.S. Bank term loan, we may elect to pay interest based on the bank’s prime rate or LIBOR plus a fixed margin of 1.5%. The applicable LIBOR (1, 3, 6, or 12-month LIBOR) corresponds with the loan period we select. On December 31, 2011, the 1-month LIBOR plus the fixed margin was approximately 1.78% and the bank’s prime rate was 3.25%. If a LIBOR rate loan is prepaid prior to the completion of the loan period, we must pay the bank the difference between the interest the bank would have earned had prepayment not occurred and the interest the bank actually earned. We may prepay prime rate loans in whole or in part at any time without a premium or penalty. |
| (2) | Under the U.S. Bank secured revolving credit line, we may elect to pay interest based on the bank’s prime rate or LIBOR plus a fixed margin of 1.8%. The applicable LIBOR (1, 3, 6, or 12-month LIBOR) corresponds with the loan period we select. At December 31, 2011, the 12-month LIBOR plus the fixed margin was 2.90% and the bank’s prime rate was 3.25%. If a LIBOR rate loan is prepaid prior to the completion of the loan period, we must pay the bank the difference between the interest the bank would have earned had prepayment not occurred and the interest the bank actually earned. We may prepay prime rate loans in whole or in part at any time without a premium or penalty. |
Our total interest expense on borrowings was $0.4 million and $0.1 million during the years ended December 31, 2011 and 2010, respectively.
U.S. Bank Credit Facility
On November 1, 2010, we amended and restated our existing credit agreement with U.S. Bank. The amendments added a new $35.0 million secured term loan facility (“Term Loan”) for the purpose of financing a portion of our acquisition of Enson Assets Limited. In addition, our existing $15.0 million unsecured revolving credit line with U.S. Bank (“Credit Facility”) became a secured facility, the amount available for borrowing was increased to $20.0 million, and the expiration date was extended from October 31, 2011 to November 1, 2013.
Our U.S. Bank credit agreement is secured by sixty-five percent of Enson Assets Limited. Amounts available for borrowing are reduced by the balance of any outstanding import letters of credit and are subject to certain quarterly financial covenants related to our cash flow, fixed charges, quick ratio, and net income. On March 2, 2012, we entered into an amendment adjusting the quick ratio effective December 31, 2011. We were not in breach of our debt covenants on December 31, 2011.
Secured 1-year Term Loan
On December 31, 2011, we had an outstanding balance of $14.4 million related to our U.S. Bank 1-year term loan facility. Our term loan, along with our line of credit and available cash, was utilized to finance the acquisition of Enson and to pay related transaction costs, fees, and expenses. Amounts paid or prepaid on the term loan may not be re-borrowed. The minimum principal payments for the term loan are $2.2 million each quarter, and began on January 5, 2011. On October 31, 2011, we extended the maturity date of this term loan to November 1, 2012.
Secured Revolving Credit Line
On December 31, 2011, we had an outstanding balance of $2.0 million related to our U.S. Bank secured revolving credit line. The drawing on our credit line was utilized to supplement our cash flows from operations.
UNIVERSAL ELECTRONICS INC.
NOTES TO CONSOLIDATED FINANCIAL STATEMENTS
DECEMBER 31, 2011
Note 9 — Income Taxes
During 2011, 2010, and 2006,2009, pre-tax income was attributed to the following jurisdictions:
| Year Ended December 31, | ||||||||||||
| (in thousands) | 2008 | 2007 | 2006 | |||||||||
| Domestic operations | $ | 16,650 | $ | 18,332 | $ | 7,932 | ||||||
| Foreign operations | 7,439 | 11,230 | 11,488 | |||||||||
| Total | $ | 24,089 | $ | 29,562 | $ | 19,420 | ||||||
| Year Ended December 31, | ||||||||||||
| (in thousands) | 2011 | 2010 | 2009 | |||||||||
Domestic operations | $ | 3,279 | $ | 10,878 | $ | 17,060 | ||||||
Foreign operations | 21,952 | 10,980 | 5,117 | |||||||||
|
|
|
|
|
| |||||||
Total | $ | 25,231 | $ | 21,858 | $ | 22,177 | ||||||
|
|
|
|
|
| |||||||
The provision for income taxes charged to operations was as follows:
| Year Ended December 31, | ||||||||||||
| (in thousands) | 2008 | 2007 | 2006 | |||||||||
| Current tax expense: | ||||||||||||
| U.S. federal | $ | 5,407 | $ | 5,537 | $ | 2,934 | ||||||
| State and local | 1,230 | 490 | 687 | |||||||||
| Foreign | 2,205 | 3,130 | 2,997 | |||||||||
| Total current | 8,842 | 9,157 | 6,618 | |||||||||
| Deferred tax expense/(benefit): | ||||||||||||
| U.S. federal | 206 | (60 | ) | (297 | ) | |||||||
| State and local | (627 | ) | 84 | (578 | ) | |||||||
| Foreign | (138 | ) | 151 | 157 | ||||||||
| Total deferred | (559 | ) | 175 | (718 | ) | |||||||
| Total provision | $ | 8,283 | $ | 9,332 | $ | 5,900 | ||||||
| Year Ended December 31, | ||||||||||||
| (in thousands) | 2011 | 2010 | 2009 | |||||||||
Current tax expense: | ||||||||||||
U.S. federal | $ | 1,319 | $ | 3,814 | $ | 7,003 | ||||||
State and local | 12 | 391 | 631 | |||||||||
Foreign | 5,122 | 3,483 | 904 | |||||||||
|
|
|
|
|
| |||||||
Total current | 6,453 | 7,688 | 8,538 | |||||||||
|
|
|
|
|
| |||||||
Deferred tax (benefit) expense: | ||||||||||||
U.S. federal | 153 | (40 | ) | (918 | ) | |||||||
State and local | (409 | ) | (294 | ) | (376 | ) | ||||||
Foreign | (912 | ) | (577 | ) | 258 | |||||||
|
|
|
|
|
| |||||||
Total deferred | (1,168 | ) | (911 | ) | (1,036 | ) | ||||||
|
|
|
|
|
| |||||||
Total provision for income taxes | $ | 5,285 | $ | 6,777 | $ | 7,502 | ||||||
|
|
|
|
|
| |||||||
Net deferred tax assets were comprised of the following aton December 31, 20082011 and 2007:
| (in thousands) | 2008 | 2007 | ||||||
| Deferred tax assets: | ||||||||
| Inventory reserves | $ | 258 | $ | 308 | ||||
| Allowance for doubtful accounts | 117 | 23 | ||||||
| Capitalized research costs | 19 | 184 | ||||||
| Capitalized inventory costs | 757 | 540 | ||||||
| Net operating losses | 2,473 | 2,974 | ||||||
| Amortization of intangibles | 686 | 755 | ||||||
| Accrued liabilities | 764 | 796 | ||||||
| Income tax credits | 1,476 | 1,157 | ||||||
| Depreciation | 786 | 700 | ||||||
| Stock based compensation | 2,270 | 1,327 | ||||||
| Long term incentive compensation | 201 | 402 | ||||||
| Other | 530 | 466 | ||||||
| Total deferred tax assets | 10,337 | 9,632 | ||||||
| Deferred tax liability: | ||||||||
| Intangible assets | (292 | ) | (509 | ) | ||||
| Other | (675 | ) | (238 | ) | ||||
| Total deferred tax liabilities | (967 | ) | (747 | ) | ||||
| Net deferred tax assets before valuation allowance | 9,370 | 8,885 | ||||||
| Less: Valuation allowance | (189 | ) | (264 | ) | ||||
| Net deferred tax assets | $ | 9,181 | $ | 8,621 | ||||
| (in thousands) | 2011 | 2010 | ||||||
Deferred tax assets: | ||||||||
Inventory reserves | $ | 1,011 | $ | 605 | ||||
Allowance for doubtful accounts | 205 | 302 | ||||||
Capitalized research costs | 178 | 155 | ||||||
Capitalized inventory costs | 1,206 | 661 | ||||||
Net operating losses | 1,525 | 1,764 | ||||||
Accrued liabilities | 3,243 | 3,452 | ||||||
Income tax credits | 2,335 | 2,058 | ||||||
Stock-based compensation | 3,326 | 3,210 | ||||||
Other | 176 | 381 | ||||||
|
|
|
| |||||
Total deferred tax assets | 13,205 | 12,588 | ||||||
|
|
|
| |||||
Deferred tax liability: | ||||||||
Depreciation | (4,883 | ) | (5,273 | ) | ||||
Amortization of intangible assets | (3,190 | ) | (3,565 | ) | ||||
Acquired intangible assets | (30 | ) | (121 | ) | ||||
Other | (1,522 | ) | (1,214 | ) | ||||
|
|
|
| |||||
Total deferred tax liabilities | (9,625 | ) | (10,173 | ) | ||||
|
|
|
| |||||
Net deferred tax assets before valuation allowance | 3,580 | 2,415 | ||||||
Less: Valuation allowance | (136 | ) | (139 | ) | ||||
|
|
|
| |||||
Net deferred tax assets | $ | 3,444 | $ | 2,276 | ||||
|
|
|
| |||||
At December 31, 20082011 and 2007, $0.4 million and $0.5 million, respectively, of2010, current deferred tax liabilities were recorded in other accrued expenses (see Note 8).
66
NOTES TO CONSOLIDATED FINANCIAL STATEMENTS
DECEMBER 31, 2011
The provision for income taxes differs from the amount of income tax determined by applying the applicable U.S. statutory federal income tax rate to pre-tax income from operations as a result of the following:
| Year Ended December 31, | ||||||||||||
| (in thousands) | 2008 | 2007 | 2006 | |||||||||
| Tax provision at statutory U.S. rate | $ | 8,431 | $ | 10,347 | $ | 6,603 | ||||||
| Increase (decrease) in tax provision resulting from: | ||||||||||||
| State and local taxes, net | 392 | 373 | 110 | |||||||||
| Foreign tax rate differential | (154 | ) | (649 | ) | (391 | ) | ||||||
| Nondeductible items | 251 | 302 | 207 | |||||||||
| Federal research and development credits | (424 | ) | (918 | ) | (872 | ) | ||||||
| Change in tax rate related to deferred taxes | — | (147 | ) | — | ||||||||
| Other | (213 | ) | 24 | 243 | ||||||||
| Tax provision | $ | 8,283 | $ | 9,332 | $ | 5,900 | ||||||
| Year Ended December 31, | ||||||||||||
| (in thousands) | 2011 | 2010 | 2009 | |||||||||
Tax provision at statutory U.S. rate | $ | 8,578 | $ | 7,650 | $ | 7,764 | ||||||
Increase (decrease) in tax provision resulting from: | ||||||||||||
State and local taxes, net | (262 | ) | 63 | 166 | ||||||||
Foreign tax rate differential | (3,528 | ) | (484 | ) | (36 | ) | ||||||
Nondeductible items | 407 | 231 | 682 | |||||||||
Federal research and development credits | (503 | ) | (723 | ) | (272 | ) | ||||||
Settlements | — | (110 | ) | (449 | ) | |||||||
Other | 593 | 150 | (353 | ) | ||||||||
|
|
|
|
|
| |||||||
Tax provision | $ | 5,285 | $ | 6,777 | $ | 7,502 | ||||||
|
|
|
|
|
| |||||||
At December 31, 2008,2011, we had state Research and Experimentation (“R&E”) income tax credit carryforwardscarry forwards of approximately $2.2$2.1 million. The state R&E income tax credits do not have an expiration date.
At December 31, 2008,2011, we had federal, state and foreign net operating losses of approximately $5.9$3.5 million, $5.0 million and $0.5$0.1 million, respectively. All of the federal and state net operating loss carryforwardscarry forwards were acquired as part of the acquisition of SimpleDevices. The federal and state net operating loss carryforwardscarry forwards begin to expire induring 2020 and 2012,2016, respectively. Approximately $0.3$0.2 million of the foreign net operating losses will begin to expire in 2020 and the remaining $0.2 million have an unlimited carryforward.
Internal Revenue Code Section 382 places certain limitations on the annual amount of net operating loss carryforwardscarry forwards that may be utilized if certain changes to a company’s ownership occur. Our acquisition of SimpleDevices was a change in ownership pursuant to Section 382 of the Internal Revenue Code, and the federal and state net operating loss carryforwardscarry forwards of SimpleDevices are limited but considered realizable in future periods. The annual federal limitation is as follows: approximately $1.2$0.6 million for 20092011 and approximately $0.6 million thereafter. California has suspended utilization of net operating losses for 20082010 and 2009.
At December 31, 2008,2011, we believed it was more likely than not that certain deferred tax assets related to the impairment of theour investment in a private company (a capital asset) would not be realized due to uncertainties as to the timing and amounts of future capital gains. Accordingly, a valuation allowance of approximately $0.1 million was recorded as of December 31, 2008.2011 and 2010. Additionally, we recorded $0.1 million$20 thousand of various state and foreign valuation allowances at December 31, 2008.
During the years ended December 31, 2008, 20072011, 2010 and 20062009 we recognized a credit to paid-in capital and a reduction to income taxes payable of $0.4$0.3 million, $3.30.2 million and $0.8$0.4 million, respectively, related to the tax benefit from the exercises of non-qualified stock options under our stock option plans and vesting of restricted stock.
During 2010, we settled an audit in France by the French Tax Authorities for fiscal years 2005 and 2006 which resulted in the reversal of $0.1 million of previously recorded uncertain tax positions being credited into income.
The undistributed earnings of our foreign subsidiaries are considered to be indefinitely reinvested. Accordingly, no provision for U.S. federal and state income taxes or foreign withholding taxes has been provided on such undistributed earnings. Determination of the potential amount of unrecognized deferred U.S. income tax liability and foreign withholding taxes is not practicable because of the complexities associated with its hypothetical calculation; however, unrecognized foreign tax credits would be available to reduce some portion of the U.S. liability.
67
NOTES TO CONSOLIDATED FINANCIAL STATEMENTS
DECEMBER 31, 2011
Uncertain Tax Positions
At December 31, 20082011 and 2007,2010, we had unrecognized tax benefits of approximately $8.7$5.6 million and $8.8$5.6 million, including interest and penalties, respectively.
Our gross unrecognized tax benefits (excluding interestat December 31, 2011, 2010 and penalties) at2009, and the beginning and end ofchanges during those years then ended, are the period is as follows:
| (in thousands) | 2008 | 2007 | ||||||
| Beginning balance | $ | 7,817 | $ | 6,778 | ||||
| Additions as a result of tax provisions taken during the current year | 404 | 485 | ||||||
| Foreign currency translation | (410 | ) | 609 | |||||
| Lapse in statute of limitations | (307 | ) | (54 | ) | ||||
| Other | — | (1 | ) | |||||
| Ending balance | $ | 7,504 | $ | 7,817 | ||||
| (in thousands) | 2011 | 2010 | 2009 | |||||||||
Beginning balance | $ | 5,411 | $ | 2,580 | $ | 7,504 | ||||||
Additions as a result of tax provisions taken during the current year | 138 | 159 | 324 | |||||||||
Subtractions as a result of tax provisions taken during the prior year | (67 | ) | (123 | ) | (82 | ) | ||||||
Foreign currency translation | 133 | 174 | 146 | |||||||||
Lapse in statute of limitations | (224 | ) | (317 | ) | (80 | ) | ||||||
Settlements | (15 | ) | (99 | ) | (5,232 | ) | ||||||
Acquisition | 11 | 3,037 | — | |||||||||
|
|
|
|
|
| |||||||
Ending balance | $ | 5,387 | $ | 5,411 | $ | 2,580 | ||||||
|
|
|
|
|
| |||||||
Approximately $8.0$5.0 million and $8.2$5.1 million of the total amount of gross unrecognized tax benefits at December 31, 20082011 and 2007,2010, respectively, would affect the annual effective tax rate, if recognized. Further,Furthermore, we are unaware of any positions for which it is reasonably possible that the total amounts of unrecognized tax benefits will significantly increase within the next twelve months. We anticipate a decrease in gross unrecognized tax benefits of approximately $0.1$0.2 million within the next twelve months based on federal, state, and foreign statute expirations in various jurisdictions.
We file income tax returns in the U.S. federal jurisdictionjurisdictions and in various state and foreign jurisdictions. As ofAt December 31, 2008,2011 the open statutes of limitations for our significant tax jurisdictions are as follows:the following: federal and state for 2004are 2006 through 20082011 and non-U.S. for 2001are 2002 through 2008. Unrecognized tax benefits at2010. At December 31, 2008 of $6.0 million are classified as short term as we expect to settle certain foreign audits during 2009. The remainder of the2011, our gross unrecognized tax benefits of $2.7$5.6 million, which included $0.2 million of interest, are classified as long term as prescribed by FIN 48 because we do not anticipate payment of cash related to those unrecognized tax benefits within one yearyear.
Please see Note 2 under the captionIncome Taxesfor further information regarding our accounting principles.
UNIVERSAL ELECTRONICS INC.
NOTES TO CONSOLIDATED FINANCIAL STATEMENTS
DECEMBER 31, 2011
Note 10 — Accrued Compensation
The components of accrued compensation on December 31, 2011 and 2010 are listed below:
| (in thousands) | 2011 | 2010 | ||||||
Accrued social insurance(1) | $ | 20,027 | $ | 20,360 | ||||
Accrued salary/wages | 4,084 | 4,045 | ||||||
Accrued vacation/holiday | 1,943 | 1,748 | ||||||
Accrued bonus(2) | 1,140 | 2,832 | ||||||
Accrued commission | 461 | 249 | ||||||
Accrued medical insurance claims | 300 | 112 | ||||||
Other accrued compensation | 1,249 | 1,288 | ||||||
|
|
|
| |||||
Total accrued compensation | $ | 29,204 | $ | 30,634 | ||||
|
|
|
| |||||
| (1) | Effective January 1, 2008, the Chinese Labor Contract Law was enacted in the People’s Republic of China (“PRC”). This law mandated that PRC employers remit the applicable social insurance payments to their local government. Social insurance is comprised of various components such as pension, medical insurance, job injury insurance, unemployment insurance, and a housing assistance fund, and is administered in a manner similar to social security in the United States. This amount represents our estimate of the amounts due to the PRC government for social insurance on December 31, 2011 and 2010. |
| (2) | Accrued bonus contains an accrual for an extra month of salary (“13th month salary”) to be paid to employees in certain geographies where it is the customary business practice. This 13th month salary is paid to these employees if they remain employed with us through December 31, 2011. The total accrued for the 13th month salary is $0.4 million. The remaining accrued bonus will to be paid to non-executive level employees. Executive management was not paid bonuses related to the year ended December 31, 2011. |
Note 11 — Other Accrued Expenses
The components of other accrued expenses on December 31, 2011 and 2010 are listed below:
| (In thousands) | 2011 | 2010 | ||||||
Amount due to CG International Holdings Limited(1) | $ | 5,138 | $ | 5,138 | ||||
Accrued freight | 2,220 | 1,350 | ||||||
Accrued professional fees | 992 | 1,158 | ||||||
Accrued duties | 667 | 256 | ||||||
Utilities | 327 | 340 | ||||||
Accrued advertising and marketing | 415 | 467 | ||||||
Tooling(2) | 459 | 1,567 | ||||||
Accrued third-party commissions | 401 | 252 | ||||||
Accrued sales taxes, VAT and ICMS | 557 | 678 | ||||||
Property, plant, and equipment(2) | 30 | 20 | ||||||
Interest | 81 | 99 | ||||||
Other | 2,680 | 1,913 | ||||||
|
|
|
| |||||
Total other accrued expenses | $ | 13,967 | $ | 13,238 | ||||
|
|
|
| |||||
| (1) | We made a payment of $2.0 million to CG International Holdings Limited during January 2012. We made an additional payment of $1.0 million during February 2012. See Note 21 for further information regarding our acquisition of Enson. |
| (2) | The tooling and property, plant and equipment accrual balances relate to amounts capitalized within property, plant, and equipment, net on December 31, 2011 and 2010, respectively. |
UNIVERSAL ELECTRONICS INC.
NOTES TO CONSOLIDATED FINANCIAL STATEMENTS
DECEMBER 31, 2011
Note 12 — Leases
We lease land, office and warehouse space, and certain office equipment under operating cycle.
Rent expense for our common shares outstanding during the period. Diluted earnings per share is computed by dividing net income by the weighted average number of common sharesoperating leases was $3.2 million, $2.5 million and dilutive potential common shares, which includes the dilutive effect of stock options and restricted stock grants. Dilutive potential common shares for all periods presented are computed utilizing the treasury stock method. In the computation of diluted earnings per common share$2.5 million for the years ended December 31, 2008, 20072011, 2010 and 2006,2009, respectively.
The following table summarizes future minimum non-cancelable operating lease payments at December 31, 2011:
| (in thousands) | Amount | |||
Year ending December 31: | ||||
2012 | $ | 2,366 | ||
2013 | 1,921 | |||
2014 | 1,390 | |||
2015 | 1,012 | |||
2016 | 684 | |||
Thereafter | 79 | |||
|
| |||
Total operating lease commitments | $ | 7,452 | ||
|
| |||
Non-level Rents and Lease Incentives
Some of our leases are subject to rent escalations. For these leases, we have excluded 534,418, 153,705recognize rent expense for the total contractual obligation utilizing the straight-line method over the lease term, ranging from 12 to 60 months. The related short term liability is recorded in other accrued expenses (see Note 11) and 854,265 stock options, respectively, with exercise prices greater than the average market pricerelated long term liability is recorded in other long term liabilities. The total liability related to rent escalations was $0.03 million at both December 31, 2011 and 2010.
The lease agreement for our corporate headquarters contains an allowance for tenant improvements of $0.4 million, which was paid to us upon completion of the underlying common stock, because their inclusion wouldrenovation in 2008. This tenant improvement allowance is being amortized as a credit against rent expense over the 73-month term of the lease, which began on January 1, 2006.
Rental Costs During Construction
Rental costs associated with building and ground operating leases incurred during a construction period are expensed.
Prepaid Leases
Private ownership of land in the People’s Republic of China (“PRC”) is not allowed. All land in the PRC is owned by the government and cannot be sold to any individual or entity. Land use rights are allocated for free, granted or transferred for consideration by the PRC State Land Administration Bureau or its authorized branches. Our subsidiary Enson operates two factories within the PRC on which the land is leased from the government as of December 31, 2011. These land leases were prepaid to the PRC government at the time Enson occupied the land. We have been antidilutive.
The first factory is located in the city of Guangzhou in the Guangdong province. The unamortized value of this prepaid lease is $1.6 million on December 31, 2008, 20072011, and 2006 was calculated as follows:
| (in thousands, except per-share amounts) | 2008 | 2007 | 2006 | |||||||||
BASIC | ||||||||||||
| Net income | $ | 15,806 | $ | 20,230 | $ | 13,520 | ||||||
| Weighted-average common shares outstanding | 14,015 | 14,410 | 13,818 | |||||||||
| Basic earnings per share | $ | 1.13 | $ | 1.40 | $ | 0.98 | ||||||
68
The second factory is located in the city of Yangzhou in the Jiangsu province. The remaining net book value of this prepaid lease is $3.0 million on December 31, 2011, and will be amortized on a straight-line basis over the remaining term of approximately 47 years. The buildings located on this land have a net book value of $18.3 million on December 31, 2011 and are being amortized over an estimated remaining life of 27 years. In addition, the facility under construction located on this land has a net book value of $6.4 million on December 31, 2011 and will be amortized over an estimated remaining life of 25 years upon completion. We estimate this construction-in-process will be placed into service during the second quarter of 2012.
NOTES TO CONSOLIDATED FINANCIAL STATEMENTS
| (in thousands, except per-share amounts) | 2008 | 2007 | 2006 | |||||||||
DILUTED | ||||||||||||
| Net income | $ | 15,806 | $ | 20,230 | $ | 13,520 | ||||||
| Weighted-average common shares outstanding for basic | 14,015 | 14,410 | 13,818 | |||||||||
| Dilutive effect of stock options and restricted stock | 441 | 767 | 614 | |||||||||
| Weighted-average common shares outstanding on a diluted basis | 14,456 | 15,177 | 14,432 | |||||||||
| Diluted earnings per share | $ | 1.09 | $ | 1.33 | $ | 0.94 | ||||||
DECEMBER 31, 2011
Note 1813 — Business Segment
| (in thousands) | 2008 | 2007 | 2006 | |||||||||
| Net sales: | ||||||||||||
| United States | $ | 162,855 | $ | 151,034 | $ | 126,522 | ||||||
| International: | ||||||||||||
| Asia | 48,511 | 31,624 | 30,285 | |||||||||
| Australia | 4,190 | 2,772 | 3,028 | |||||||||
| France | 5,359 | 4,940 | 4,846 | |||||||||
| Germany | 7,771 | 6,228 | 7,014 | |||||||||
| South Africa | 5,827 | 7,192 | 8,140 | |||||||||
| Spain | 7,523 | 8,483 | 7,513 | |||||||||
| Switzerland | 1,099 | 6,473 | 851 | |||||||||
| United Kingdom | 21,234 | 31,290 | 29,025 | |||||||||
| All Other | 22,731 | 22,644 | 18,622 | |||||||||
| Total international | 124,245 | 121,646 | 109,324 | |||||||||
| Total net sales | $ | 287,100 | $ | 272,680 | $ | 235,846 | ||||||
69
Indemnifications
| 2008 | 2007 | 2006 | ||||||||||
| Long-lived tangible assets: | ||||||||||||
| United States | $ | 6,292 | $ | 5,238 | $ | 3,921 | ||||||
| All other countries | 2,770 | 2,689 | 2,199 | |||||||||
| Total | $ | 9,062 | $ | 7,927 | $ | 6,120 | ||||||
Fair Price Provisions and Other Anti-Takeover Measures
Our Restated Certificate of Incorporation, as amended, contains certain provisions restricting business combinations with interested stockholders under certain circumstances and imposing higher voting requirements for the approval of certain transactions (“fair price” provisions). Any of these provisions may delay or prevent a change in control.
The “fair price” provisions require that holders of at least two-thirds of our outstanding shares of voting stock approve certain business combinations and significant transactions with interested stockholders.
Product Warranties
70
| Accruals for | Settlements | |||||||||||||||
| Balance at | Warranties | (in Cash or in | Balance at | |||||||||||||
| Beginning of | Issued During | Kind) During | End of | |||||||||||||
| Description | Period | the Period | the Period | Period | ||||||||||||
| Year Ended December 31, 2008 | $ | 178 | $ | (31 | )(1) | $ | (57 | ) | $ | 90 | ||||||
| Year Ended December 31, 2007 | $ | 416 | $ | (146 | )(1) | $ | (92 | ) | $ | 178 | ||||||
| Year Ended December 31, 2006 | $ | 414 | $ | 202 | $ | (200 | ) | $ | 416 | |||||||
(in thousands) Description | Balance at Beginning of Period | Accruals for Warranties Issued During the Period | Settlements (in Cash or in Kind) During the Period | Balance at End of Period | ||||||||||||
Year Ended December 31, 2011 | $ | 71 | $ | (27 | ) | $ | (38 | ) | $ | 6 | ||||||
Year Ended December 31, 2010 | $ | 82 | $ | 4 | $ | (15 | ) | $ | 71 | |||||||
Year Ended December 31, 2009 | $ | 90 | $ | (4 | ) | $ | (4 | ) | $ | 82 | ||||||
Litigation
On July 15, 2011, we filed a lawsuit against Logitech, Inc., Logitech International S.A. and Logitech Europe S.A. in the United States District Court, Central District of California (Universal Electronics Inc. v. Logitech, Inc., Logitech International S.A. and Logitech Europe S.A., SACV 11-1056-JVS(ANx)) alleging that the Logitech companies are infringing seventeen of our subsidiaries (One For All S.A.S.) brought an action against a former distributorpatents related to remote control technology. We have alleged that this complaint relates to multiple Logitech remote control products, including the Harmony H300, H650, H700, H900, One, H1100, Logitech Revue (for Google TV), Harmony remote apps for iOS and Android platforms, and other applications and/or programming for touch screen mobile devices. We are seeking monetary relief for the infringement, including enhanced damages due to the willfulness of the subsidiary’s products seeking a recovery of accounts receivable. The distributorLogitech companies’ actions, injunctive relief to enjoin the Logitech companies from further infringing, including contributory infringement and/or inducing infringement, and attorneys’ fees. In its answer, filed a counterclaim against our subsidiary seeking payment for amounts allegedly owed for administrative and other services rendered byon November 3, 2011, the distributor for our subsidiary. In January 2005, the parties agreed to include in that action all claims between the distributor and two of our other subsidiaries, Universal Electronics BV and One For All Iberia SL. As a result, the single action covers all claims and counterclaims between the various parties. The parties further agreed that, before any judgment is paid, all disputes between the various parties would be concluded. These additional claims involve nonpayment for products and damages resulting from the alleged wrongful termination of agency agreements. On March 15, 2005, the court in one of the litigation matters brought by the distributor against one of our subsidiaries, rendered judgment against our subsidiary and awarded damages and costs to the distributor in the amount of approximately $102,000. The amount of this judgment was charged to operations during the second quarter of 2005 and has been paid. With respect to the remaining matters before the court, we are awaiting the expert to finalize and file his pre-trial report with the court and when completed, we will respond. Management is unable to estimate the likelihood of an unfavorable outcome, and the amount of loss, if any, in the case of an unfavorable outcome.
On January 6, 2009,March 2, 2012, we filed a motion for partial summary judgment which remains pending.lawsuit against Universal Remote Control, Inc. (“URC”) in the United States District Court, Central District of California (Universal Electronics Inc. v. Universal Remote Control, Inc., SACV12-0039 AG (JPRx)) alleging that URC is
UNIVERSAL ELECTRONICS INC.
NOTES TO CONSOLIDATED FINANCIAL STATEMENTS
DECEMBER 31, 2011
infringing, directly and indirectly, four of our patents related to remote control technology. We disagree vigorouslyhave alleged that this complaint relates to multiple URC remote control products, including the URC model numbers UR5U-9000L, WR7 and other remote controls with their denials of liabilitydifferent model names or numbers, but with substantially the same designs, features, and with their counterclaims and will continue to pursue this matter.functionalities. We are inseeking monetary relief for the early stagesinfringement, including enhanced damages due to the willfulness of discoveryURC’s actions, injunctive relief to enjoin URC from further infringing, including contributory infringement and/or inducing infringement, and are unable to estimate the likely outcome of this matter and the amount of recovery of the balance due us or damages awarded Gibson, if any, at this time.
There are no other material pending legal proceedings other than litigation that is incidental to the ordinary course of our business, to which we or any of our subsidiaries is a party or of which our respective property is the subject. We doHowever, as is typical in our industry and to the nature and kind of business in which we are engaged, from time to time, various claims, charges and litigation are asserted or commenced by third parties against us or by us against third parties arising from or related to product liability, infringement of patent or other intellectual property rights, breach of warranty, contractual relations, or employee relations. The amounts claimed may be substantial but may not believe thatbear any reasonable relationship to the merits of the claims or the extent of any real risk of court awards assessed against us or in our favor. However, no assurances can be made as to the outcome of any of these matters, nor can we estimate the range of potential losses to us. In our opinion, final judgments, if any, which might be rendered against us in potential or pending litigation would not have a material adverse effect on our financial condition or results of operations. Moreover, we believe that our products do not infringe any of the pending matters have merit and we intend to vigorously defend ourselves against them.
71
Long-Term Incentive Plan
During the secondfirst quarter of 2007, we adopted an Executive Long-Term Incentive Plan (“ELTIP”). The ELTIP provided a bonus pool for our executive management team contingent on achieving certain performance goals during a two-year performance period commencing on January 1, 2007 and ending on December 31, 2008. The performance goals were based on the compound annual growth rate of net sales and earnings per diluted share during the performance period. The ELTIP had a maximum pay out of $12 million if the highest performance goals were met. Management did not earn a bonus under the ELTIP based on our results through December 31, 2008. As a result, we lowered our ELTIP accrual from $1.0 million at December 31, 2007 to $0 at December 31, 2008. This adjustment resulted in a $1.0 million benefit to pre-tax income for the twelve months ended December 31, 2008.
Non-Qualified Deferred Compensation Plan
We have adopted a non-qualified deferred compensation plan for the benefit of a select group of highly compensated employees. For each plan year a participant terminatesmay elect to defer compensation in fixed dollar amounts or percentages subject to the minimums and maximums established under the plan. An election to defer compensation is irrevocable for the entire plan year. A participant is always fully vested in their employment duringelective deferrals and may direct these funds into various investment options available under the service period (January 1, 2009 throughplan. These investment options are utilized for measurement purposes only, and may not represent the actual investment made by us. In this respect, the participant is an unsecured creditor of ours. At December 31, 2010), they will forfeit their right2011, the amounts deferred under the plan were immaterial to any remaining installments where the payment date has not yet occurred.
Defined Benefit Plan
Our subsidiary in India maintains a defined benefit pension plan (“SFAS 157”India Plan”), for local employees, which defines fair value, establishes a framework for measuring fair value in accordanceis consistent with generally accepted accounting principles in the United States of America,local statutes and expands disclosures about fair value measurements for assets and liabilities. SFAS 157 applies when other accounting pronouncements require or permit assets or liabilities to be measured at fair value. Accordingly, SFAS 157 does not require new fair value measurements. Effective January 1, 2008, we implemented the requirements of SFAS 157.
72
NOTES TO CONSOLIDATED FINANCIAL STATEMENTS
DECEMBER 31, 2011
Note 14 — Treasury Stock
During the years ended December 31, 2011, 2010, and 2009, we repurchased 456,964, 505,692, and 404,643 shares of our common stock at a cost of $9.8 million, $10.1 million and $7.7 million, respectively. Repurchased shares are recorded as shares held in treasury at cost. We hold these shares for future use as management and the Board of Directors deem appropriate, which has included compensating our outside directors. During the years ended December 31, 2011, 2010, and 2009, we issued 30,000, 29,583, and 25,000 shares from treasury, respectively, to outside directors for services performed (see Note 16). Repurchases may be made whenever we deem a repurchase is a good use of our cash and the price to be paid is at or below a threshold approved by our Board.
On February 11, 2010, our Board of Directors authorized management to repurchase up to 1,000,000 shares of our issued and outstanding common stock. As of December 31, 2011, we have repurchased 930,090 shares of our common stock under this authorization, leaving 69,910 shares available for repurchase.
On October 26, 2011, our Board of Directors authorized management to repurchase an additional 1,000,000 shares of our issued and outstanding common stock. We did not repurchase any shares under the Board authorization approved on October 26, 2011.
Stock Awards to Outside Directors
We issue restricted stock awards to our outside directors as compensation for services performed. We grant each of our outside directors 5,000 shares of our common stock annually each July 1st. When an additional outside director is appointed to our Board of Directors, they receive a prorated number of shares based on the number of months they will serve during the initial year. Compensation expense related to restricted stock awards is based on the grant date fair value the shares awarded. The fair value of these shares is amortized on a straight-line basis over the requisite service period of one year (see Note 2 under the captionStock-BasedCompensation and Note 16). The shares are issued from treasury stock using a first-in-first-out cost basis, which amounted to $0.4 million and $0.4 million in 2011 and 2010, respectively.
UNIVERSAL ELECTRONICS INC.
NOTES TO CONSOLIDATED FINANCIAL STATEMENTS
DECEMBER 31, 2011
Note 15 — Business Segment and Foreign Operations
Reportable Segment
An operating segment, in part, is a component of an enterprise whose operating results are regularly reviewed by the chief operating decision maker to make decisions about resources to be allocated to the segment and assess its performance. Operating segments may be aggregated only to a limited extent. Our chief operating decision maker, the Chief Executive Officer, reviews financial information presented on a consolidated basis, accompanied by disaggregated information about revenues for purposes of making operating decisions and assessing financial performance. Accordingly, we only have a single operating and reportable segment.
Foreign Operations
Our net sales to external customers by geographic area for the years ended December 31, 2011, 2010, and 2009 were the following:
| (in thousands) | 2011 | 2010 | 2009 | |||||||||
Net sales: | ||||||||||||
United States | $ | 137,654 | $ | 119,284 | $ | 142,876 | ||||||
International: | ||||||||||||
People’s Republic of China | 106,080 | 34,222 | 27,791 | |||||||||
United Kingdom | 23,251 | 41,575 | 21,756 | |||||||||
Argentina | 6,603 | 4,791 | 1,544 | |||||||||
Australia | 1,415 | 1,451 | 1,558 | |||||||||
Brazil | 7,520 | 1,791 | 1,904 | |||||||||
Canada | 17,201 | 13,419 | 11,586 | |||||||||
France | 3,683 | 3,768 | 3,603 | |||||||||
Germany | 7,560 | 7,996 | 6,752 | |||||||||
Israel | 3,419 | 3,161 | 1,941 | |||||||||
Italy | 2,341 | 2,474 | 3,471 | |||||||||
Japan | 42,908 | 10,724 | 3,162 | |||||||||
Korea | 6,834 | 6,325 | 6,771 | |||||||||
Malaysia | 15,866 | 1,806 | 1,439 | |||||||||
Netherlands | 1,723 | 2,094 | 755 | |||||||||
Portugal | 1,642 | 4,641 | 4,167 | |||||||||
Singapore | 15,388 | 16,419 | 8,505 | |||||||||
Spain | 3,800 | 4,480 | 3,929 | |||||||||
South Africa | 6,416 | 5,900 | 6,495 | |||||||||
Taiwan | 20,278 | 12,426 | 18,315 | |||||||||
Thailand | 13,949 | 10,582 | 7,939 | |||||||||
All other | 23,099 | 22,451 | 31,291 | |||||||||
|
|
|
|
|
| |||||||
Total international | 330,976 | 212,496 | 174,674 | |||||||||
|
|
|
|
|
| |||||||
Total net sales | $ | 468,630 | $ | 331,780 | $ | 317,550 | ||||||
|
|
|
|
|
| |||||||
Specific identification of the customer billing location was the basis used for attributing revenues from external customers to individual countries.
Long-lived asset information on December 31, 2011 and 2010 were the following:
| 2011 | 2010 | |||||||
Long-lived tangible assets: | ||||||||
United States | $ | 3,530 | $ | 4,654 | ||||
People’s Republic of China | 78,466 | 75,053 | ||||||
All other countries | 3,803 | 3,854 | ||||||
|
|
|
| |||||
Total | $ | 85,799 | $ | 83,561 | ||||
|
|
|
| |||||
UNIVERSAL ELECTRONICS INC.
NOTES TO CONSOLIDATED FINANCIAL STATEMENTS
DECEMBER 31, 2011
Note 16 — Stock-Based Compensation
Stock-based compensation expense for each employee and director is presented in the same income statement caption as their cash compensation. Stock-based compensation expense by income statement caption for the years ended December 31, 2011, 2010, and 2009 is the following:
| (in thousands) | 2011 | 2010 | 2009 | |||||||||
Cost of sales | $ | 15 | $ | 55 | $ | 33 | ||||||
Research and development | 267 | 452 | 434 | |||||||||
Selling, general and administrative | 4,229 | 4,459 | 3,845 | |||||||||
|
|
|
|
|
| |||||||
Total stock-based compensation expense | $ | 4,511 | $ | 4,966 | $ | 4,312 | ||||||
|
|
|
|
|
| |||||||
Selling, general and administrative expense includes pre-tax stock-based compensation related to stock option awards granted to outside directors of $0.1 million, $0.3 million, and $0.3 million for the years ended December 31, 2011, 2010, and 2009, respectively. Selling, general and administrative expense includes stock-based compensation related to restricted stock awards granted to outside directors of $0.6 million, $0.6 million, and $0.5 million for the years ended December 31, 2011, 2010, and 2009, respectively.
The income tax benefit from the recognition of stock-based compensation was $1.5 million, $1.7 million, and $1.5 million for the years ended December 31, 2011, 2010, and 2009, respectively.
Stock Options
During the year ended December 31, 2011, the Compensation Committee and Board of Directors awarded 107,600 stock options to our employees with an aggregate grant date fair value of $1.5 million under various stock incentive plans. The stock option granted to employees during 2011 consisted of the following:
| (in thousands, except share amounts) | ||||||||||
Stock Option Grant Date | Number of Shares Underlying Options | Grant Date Fair Value | Vesting Period | |||||||
January 26, 2011 | 15,000 | $ | 192 | 4 -Year Vesting Period (25% each year) | ||||||
April 6, 2011 | 92,600 | 1,286 | 3 -Year Vesting Period (8.33% each quarter) | |||||||
|
|
|
| |||||||
| 107,600 | $ | 1,478 | ||||||||
|
|
|
| |||||||
During the year ended December 31, 2011, we recognized $0.3 million of pre-tax stock-based compensation expense related to our 2011 stock option grants.
The assumptions we utilized in the Black-Scholes option pricing model and the resulting weighted average fair value of stock option grants were the following:
| December 31,(1) | ||||||||||||
| 2011 | 2010 | 2009 | ||||||||||
Weighted average fair value of grants | $ | 13.74 | $ | 10.83 | $ | 7.20 | ||||||
Risk-free interest rate | 2.29 | % | 2.27 | % | 1.95 | % | ||||||
Expected volatility | 52.25 | % | 50.07 | % | 49.54 | % | ||||||
Expected life in years | 5.03 | 4.95 | 4.85 | |||||||||
| (1) | The weighted average fair value of grants was calculated utilizing the stock options granted during each respective period. |
We recognize the compensation expense related to stock option awards net of estimated forfeitures over the service period of the award, which is the option vesting term of three to four years. On December 31, 2011, 2010, and 2009, we estimated the annual forfeiture rate for our executives and board of directors will be 2.45%, 2.53% and 2.65%, respectively, based upon our historical forfeitures. On December 31, 2011, 2010, and 2009, we estimated the annual forfeiture rate for our non-executive employees to be 6.86%, 6.59% and 6.51%, respectively, based on our historical forfeitures.
UNIVERSAL ELECTRONICS INC.
NOTES TO CONSOLIDATED FINANCIAL STATEMENTS
DECEMBER 31, 2011
Stock option activity during the years ended December 31, 2011, 2010, and 2009 were the following:
| 2011 | 2010 | 2009 | ||||||||||||||||||||||||||||||||||||||||||||||
| Number of Options (in 000’s) | Weighted- Average Exercise Price | Weighted- Average Remaining Contractual Term (in years) | Aggregate Intrinsic Value (in 000’s) | Number of Options (in 000’s) | Weighted- Average Exercise Price | Weighted- Average Remaining Contractual Term (in years) | Aggregate Intrinsic Value (in 000’s) | Number of Options (in 000’s) | Weighted- Average Exercise Price | Weighted- Average Remaining Contractual Term (in years) | Aggregate Intrinsic Value (in 000’s) | |||||||||||||||||||||||||||||||||||||
Outstanding at beginning of the year | 1,525 | $ | 18.78 | 1,693 | $ | 18.37 | 1,729 | $ | 17.64 | |||||||||||||||||||||||||||||||||||||||
Granted | 108 | 28.97 | 120 | 23.80 | 253 | 16.26 | ||||||||||||||||||||||||||||||||||||||||||
Exercised | (102 | ) | 16.51 | $ | 820 | (121 | ) | 16.20 | $ | 1,238 | (278 | ) | 11.75 | $ | 2,320 | |||||||||||||||||||||||||||||||||
Forfeited/cancelled/ expired | (29 | ) | 25.53 | (167 | ) | 20.16 | (11 | ) | 22.43 | |||||||||||||||||||||||||||||||||||||||
|
|
|
|
|
| |||||||||||||||||||||||||||||||||||||||||||
Outstanding at end of year | 1,502 | $ | 19.53 | 4.81 | $ | 1,972 | 1,525 | $ | 18.78 | 5.37 | $ | 14,669 | 1,693 | $ | 18.37 | 5.40 | $ | 9,677 | ||||||||||||||||||||||||||||||
|
|
|
|
|
| |||||||||||||||||||||||||||||||||||||||||||
Vested and expected to vest at end of year | 1,494 | $ | 19.51 | 4.78 | $ | 1,971 | 1,503 | $ | 18.72 | 5.32 | $ | 14,547 | 1,655 | $ | 18.30 | 5.33 | $ | 9,532 | ||||||||||||||||||||||||||||||
Exercisable at end of year | 1,229 | $ | 18.71 | 4.05 | $ | 1,889 | 1,140 | $ | 17.89 | 4.46 | $ | 11,983 | 1,239 | $ | 17.33 | 4.30 | $ | 8,034 | ||||||||||||||||||||||||||||||
The aggregate intrinsic value in the table above represents the total pre-tax value (the difference between our closing stock price on the last trading day of 2011, 2010, and 2009 and the exercise price, multiplied by the number of in-the-money options) that would have been received by the option holders had they all exercised their options on December 31, 2011, 2010, and 2009. This amount will change based on the fair market value of our stock. The actual intrinsic value of stock options exercised in 2011, 2010, and 2009 was $0.8 million, $1.2 million and $2.3 million, respectively.
During 2011, 2010, and 2009, there were no modifications made to outstanding stock options.
Cash received from option exercises for the years ended December 31, 2011, 2010, and 2009 was $1.7 million, $2.0 million, and $3.3 million, respectively. The actual tax benefit realized from option exercises was $0.3 million, $0.2 million and $0.4 million for the years ended December 31, 2011, 2010, and 2009, respectively.
As of December 31, 2011, we expect to recognize $2.2 million of total unrecognized pre-tax stock-based compensation expense related to non-vested stock options over a remaining weighted-average life of 2.0 years.
During the annual review cycle for 2011, the Compensation Committee granted our Named Executives 148,200 stock options. The options were granted as part of long-term incentive compensation to assist us in meeting our performance and retention objectives. The grant, dated February 8, 2012, is subject to a three-year vesting period (8.33% each quarter). The total grant date fair value of these awards was $1.4 million.
Financial AssetsRestricted Stock
During the year ended December 31, 2011, the Compensation Committee and Board of Directors awarded 146,440 shares of restricted stock to our employees with an aggregate grant date fair value of $3.8 million under various stock incentive plans. The restricted stock awards granted to employees during 2011 consisted of the following:
| (in thousands, except share amounts) | ||||||||||
Restricted Stock Grant Date | Number of Shares Granted | Grant Date Fair Value | Vesting Period | |||||||
April 6, 2011 | 43,900 | $ | 1,284 | 3 -Year Vesting Period (8.33% each quarter) | ||||||
July 15, 2011 | 100,000 | 2,454 | 3 -Year Vesting Period (8.33% each quarter) | |||||||
October 10, 2011 | 2,540 | 45 | 3 -Year Vesting Period (8.33% each quarter) | |||||||
|
|
|
| |||||||
| 146,440 | $ | 3,783 | ||||||||
|
|
|
| |||||||
In addition to the grants awarded to employees, 30,000 shares of restricted stock with a grant date fair value of $0.8 million were awarded to our outside directors on July 1, 2011 as a part of their annual compensation package. These shares are subject to a one-year vesting period (25% each quarter).
During the year ended December 31, 2011, we recognized $1.1 million of pre-tax stock-based compensation expense related to our 2011 restricted stock grants.
UNIVERSAL ELECTRONICS INC.
NOTES TO CONSOLIDATED FINANCIAL STATEMENTS
DECEMBER 31, 2011
Non-vested restricted stock award activity during the years ended December 31, 2011, 2010, and 2009 (including restricted stock awarded to directors as described in Note 14) were the following:
| Shares Granted (in 000’s) | Weighted- Average Grant Date Fair Value | |||||||
Non-vested at December 31, 2008 | 90 | $ | 23.23 | |||||
Granted | 326 | 15.58 | ||||||
Vested | (136 | ) | 18.66 | |||||
Forfeited | — | — | ||||||
|
| |||||||
Non-vested at December 31, 2009 | 280 | 16.54 | ||||||
Granted | 76 | 21.58 | ||||||
Vested | (160 | ) | 18.00 | |||||
Forfeited | (1 | ) | 16.61 | |||||
|
| |||||||
Non-vested at December 31, 2010 | 195 | 17.30 | ||||||
Granted | 176 | 25.76 | ||||||
Vested | (162 | ) | 17.53 | |||||
Forfeited | (4 | ) | 16.24 | |||||
|
| |||||||
Non-vested at December 31, 2011 | 205 | $ | 24.43 | |||||
|
| |||||||
As of December 31, 2011, we expect to recognize $4.3 million of total unrecognized pre-tax stock-based compensation expense related to non-vested restricted stock awards over a weighted-average life of 2.1 years. See Note 2 under the captionStock-Based Compensationfor further information regarding our accounting principles.
During the annual review cycle for 2011, the Compensation Committee granted our Named Executives 71,300 restricted stock awards. The awards were granted as part of long-term incentive compensation to assist us in meeting our performance and retention objectives. The grant, dated February 8, 2012, is subject to a three-year vesting period (8.33% each quarter). The total grant date fair value of these awards was $1.4 million.
Stock Incentive Plans
Our active stock-based incentive plans include those adopted in 1993, 1996, 1998, 1999, 2002, 2003, 2006, and 2010 (“stock incentive plans”). Under the stock incentive plans, we may grant stock options, stock appreciation rights, restricted stock units, performance stock units, or any combination thereof for a period of ten years from the approval date of each respective plan, unless the plan is terminated by resolution of our Board of Directors. No stock appreciation rights or performance stock units have been awarded under our stock incentive plans. Only directors and employees meeting certain employment qualifications are eligible to receive stock-based awards.
The grant price of stock option and restricted stock awards granted under our stock incentive plans is the average of the high and low trades of our stock on the grant date. We prohibit the re-pricing or backdating of stock options. Our stock options become exercisable ratably, on an annual or quarterly basis, over three or four years. Stock options have a maximum ten-year term. Restricted stock awards vest in various proportions over a three or four year time period.
UNIVERSAL ELECTRONICS INC.
NOTES TO CONSOLIDATED FINANCIAL STATEMENTS
DECEMBER 31, 2011
Detailed information regarding our active stock incentive plans is as follows:
Name | Approval Date | Initial Shares Available for Grant Under the Plan | Remaining Shares Available for Grant Under the Plan | Outstanding Shares Granted Under the Plan | ||||||||||||
1993 Stock Incentive Plan | 1/19/1993 | 400,000 | — | 17,400 | ||||||||||||
1996 Stock Incentive Plan | 12/1/1996 | 800,000 | — | 20,834 | ||||||||||||
1998 Stock Incentive Plan | 5/27/1998 | 630,000 | — | 55,031 | ||||||||||||
1999 Stock Incentive Plan | 1/27/1999 | 630,000 | — | 6,510 | ||||||||||||
1999A Stock Incentive Plan | 10/7/1999 | 1,000,000 | — | 80,497 | ||||||||||||
2002 Stock Incentive Plan | 2/5/2002 | 1,000,000 | 9,251 | 245,700 | ||||||||||||
2003 Stock Incentive Plan | 6/18/2003 | 1,000,000 | 11,563 | 531,894 | ||||||||||||
2006 Stock Incentive Plan | 6/13/2006 | 1,000,000 | 5,460 | 595,823 | ||||||||||||
2010 Stock Incentive Plan | 6/15/2010 | 1,000,000 | 841,650 | 150,000 | ||||||||||||
|
|
|
| |||||||||||||
| 867,924 | 1,703,689 | |||||||||||||||
|
|
|
| |||||||||||||
Significant option groups outstanding at December 31, 2011 and the related weighted average exercise price and life information are listed below:
| Options Outstanding | Options Exercisable | |||||||||||||||||||
Range of Exercise Prices | Number Outstanding At 12/31/2011 (in 000’s) | Weighted-Average Remaining Years of Contractual Life | Weighted-Average Exercise Price | Number Exercisable At 12/31/2011 (in 000’s) | Weighted-Average Exercise Price | |||||||||||||||
$8.45 to $9.83 | 113 | 0.89 | $ | 8.62 | 113 | $ | 8.62 | |||||||||||||
12.58 to 13.27 | 197 | 2.78 | 12.62 | 185 | 12.61 | |||||||||||||||
14.85 to 16.67 | 315 | 4.90 | 16.22 | 250 | 16.20 | |||||||||||||||
17.38 to 17.62 | 232 | 3.05 | 17.59 | 232 | 17.59 | |||||||||||||||
18.03 to 21.95 | 148 | 6.27 | 20.61 | 127 | 20.89 | |||||||||||||||
23.66 to 29.25 | 490 | 6.83 | 27.33 | 315 | 27.51 | |||||||||||||||
32.40 to 35.35 | 7 | 5.94 | 34.51 | 7 | 34.51 | |||||||||||||||
|
|
|
| |||||||||||||||||
$8.45 to $35.35 | 1,502 | 4.81 | $ | 19.53 | 1,229 | $ | 18.71 | |||||||||||||
|
|
|
| |||||||||||||||||
Note 17 — Other (Expense) Income, Net
Other (expense) income, net consisted of the following:
| (in thousands) | 2011 | 2010 | 2009 | |||||||||
Net (loss) gain on foreign currency exchange contracts(1) | $ | (271 | ) | $ | (329 | ) | $ | (653 | ) | |||
Net (loss) gain on foreign currency exchange transactions | (1,141 | ) | $ | 568 | 407 | |||||||
Other income | 337 | 284 | 5 | |||||||||
|
|
|
|
|
| |||||||
Other (expense) income, net | $ | (1,075 | ) | $ | 523 | $ | (241 | ) | ||||
|
|
|
|
|
| |||||||
| (1) | This represents the losses incurred on foreign currency hedging derivatives (see Note 19 for further details). |
Note 18 — Earnings Per Share
Basic earnings per share is computed by dividing net income available to common stockholders by the weighted average number of common shares outstanding during the period. Diluted earnings per share is computed by dividing net income by the weighted average number of common shares and dilutive potential common shares, including the dilutive effect of stock option and restricted stock awards, outstanding during the period. Dilutive potential common shares for all periods presented are computed utilizing the treasury stock method.
In the computation of diluted earnings per common share for the years ended December 31, 2011, 2010, and 2009, we have excluded 592,874, 517,827 and 785,186 stock options, respectively, with exercise prices greater than the average market price of the underlying common stock, because their inclusion would have been anti-dilutive. Furthermore, for the years ended December 31, 2011, 2010, and 2009, we have excluded 119,659, 159,889 and 235,887 shares of restricted stock, respectively, whose combined unamortized fair value and excess tax benefits were greater in each of those periods than the average market price of the underlying common stock, as their effect would be anti-dilutive.
UNIVERSAL ELECTRONICS INC.
NOTES TO CONSOLIDATED FINANCIAL STATEMENTS
DECEMBER 31, 2011
Earnings per share for the years ended December 31, 2011, 2010, and 2009 were calculated as follows:
| (in thousands, except per-share amounts) | 2011 | 2010 | 2009 | |||||||||
BASIC | ||||||||||||
Net income | $ | 19,946 | $ | 15,081 | $ | 14,675 | ||||||
|
|
|
|
|
| |||||||
Weighted-average common shares outstanding | 14,912 | 13,764 | 13,667 | |||||||||
|
|
|
|
|
| |||||||
Basic earnings per share | $ | 1.34 | $ | 1.10 | $ | 1.07 | ||||||
|
|
|
|
|
| |||||||
DILUTED | ||||||||||||
Net income | $ | 19,946 | $ | 15,081 | $ | 14,675 | ||||||
|
|
|
|
|
| |||||||
Weighted-average common shares outstanding for basic | 14,912 | 13,764 | 13,667 | |||||||||
Dilutive effect of stock options and restricted stock | 301 | 342 | 304 | |||||||||
|
|
|
|
|
| |||||||
Weighted-average common shares outstanding on a diluted basis | 15,213 | 14,106 | 13,971 | |||||||||
|
|
|
|
|
| |||||||
Diluted earnings per share | $ | 1.31 | $ | 1.07 | $ | 1.05 | ||||||
|
|
|
|
|
| |||||||
Note 19 — Derivatives
Derivatives Measured at Fair Value on a Recurring Basis
We are exposed to market risks from foreign currency exchange rates, which may adversely affect our operating results and financial position. Our foreign currency exposures are primarily concentrated in the Euro,Brazilian Real, British Pound, andChinese Yuan Renminbi, Euro, Hong Kong dollar, Indian Rupee, and Singapore dollar. We periodically enter into foreign currency exchange contracts with terms normally lasting less than nine months to protect against the adverse effects that exchange-rate fluctuations may have on our foreign currency-denominated receivables, payables, cash flows and reported income. Derivative financial instruments are used to manage risk and are not used for trading or other speculative purposes. We do not use leveraged derivative financial instruments and these derivatives have not qualified for hedge accounting.
The gains and losses on both the derivatives and the foreign currency-denominated balances are recorded as foreign exchange transaction gains or losses and are classified in other (expense) income, net. Derivatives are recorded on the balance sheet at fair value. The estimated fair values of our derivative financial instruments represent the amount required to enter into offsetting contracts with similar remaining maturities based on quoted market prices.
We have determined that the fair value of our financial assets and liabilitiesderivatives are derived from level 2 inputs in the fair value hierarchy. See Note 2 under the captionsDerivatives andFair-ValueMeasurements for further information concerning the accounting principles and valuation methodology utilized. The following table sets forth our financial assets that were accounted for at fair value on a recurring basis as ofon December 31, 2008:
| Fair Value Measurement Using | ||||||||||||||||
| Quoted Prices in | Significant | |||||||||||||||
| Active Markets | Other | Significant | ||||||||||||||
| Year | for Identical | Observable | Unobservable | |||||||||||||
| Ended | Assets | Inputs | Inputs | |||||||||||||
| Description | 12/31/08 | (Level 1) | (Level 2) | (Level 3) | ||||||||||||
| Foreign currency exchange futures contract | $ | 833 | $ | — | $ | 833 | $ | — | ||||||||
| Foreign currency exchange put option contract | 606 | — | 606 | — | ||||||||||||
| $ | 1,439 | $ | — | $ | 1,439 | $ | — | |||||||||
| Fair Value Measurement Using | ||||||||||||||||
(In thousands) Description | December 31, 2011 | Quoted Prices in Active Markets for Identical Assets (Level 1) | Significant Other Observable Inputs (Level 2) | Significant Unobservable Inputs (Level 3) | ||||||||||||
Foreign currency exchange futures contracts | $ | (21 | ) | $ | — | $ | (21 | ) | $ | — | ||||||
|
|
|
|
|
|
|
| |||||||||
| $ | (21 | ) | $ | — | $ | (21 | ) | $ | — | |||||||
|
|
|
|
|
|
|
| |||||||||
We held foreign currency exchange contracts which resulted in a net pre-tax loss of approximately $0.5$0.3 million, for the year ended December 31, 2008, a net pre-tax gainloss of approximately $0.8$0.3 million, for the year ended December 31, 2007 and a net pre-tax loss of $0.1$0.7 million for the yearyears ended December 31, 2006.
Futures Contracts
We held one US dollar/EuroUSD/Chinese Yuan Renminbi futures contract with a notional value of $9.0$10.0 million and a forward rate of $1.277 USD/EuroCNY6.353 CNY/USD at December 31, 2008.2011. We held the EuroUSD position on this contract, which settled on January 7, 2009.13, 2012. The gain on this contract as of December 31, 20082011 was $0.8 million$46 thousand and is included in prepaid expenses and other current assets. This contract was settled at $0.4 milliona gain of $59 thousand resulting in a lossgain of $0.4 million$13 thousand in January 2009.
UNIVERSAL ELECTRONICS INC.
NOTES TO CONSOLIDATED FINANCIAL STATEMENTS
DECEMBER 31, 2007, we had2011
We held one foreign currency exchange contract outstanding, aUSD/Euro futures contract with a notional value of $5.0$6.5 million and a forward rate of $1.3091 USD/Euro at December 31, 2011. We held the Euro position on this contract, which settled on January 25, 2008.20, 2012. The fairloss on this contract as of December 31, 2011 was $67 thousand and is included in other accrued expenses. This contract was settled at a loss of $125 thousand resulting in a loss of $58 thousand in January 2012.
We held one USD/Euro futures contract with a notional value of this futures contract on$4.0 million and a forward rate of $1.3073 USD/Euro at December 31, 2007,2010. We held the Euro position on this contract, which settled on January 28, 2011. The gain on this contract as of December 31, 2010, was $0.01 million, which$87 thousand and is included in prepaid expenses and other current assets.
We entered into aheld one USD/GBP put optionIndian Rupee futures contract with a notional value of $5.0INR133.5 million in August 2008. The strike priceand a forward rate of the put is $1.85 USD/GBP. The contract expired onINR45.47 INR/USD at December 31, 2008 and2010. We held the USD position on this contract, which settled on January 5, 2009.28, 2011. The gain recorded related toloss on this contract was $0.5 million during the year endedas of December 31, 2008. The fair2010, was $43 thousand and is included in other accrued expenses. This contract was settled at a gain of $10 thousand resulting in a gain of $53 thousand in January 2011.
We held one USD/Chinese Yuan Renminbi futures contract with a notional value of this put option was approximately $0.6$1.0 million and a forward rate of CNY6.6819 CNY/USD at December 31, 2008. This put option2010. We held the USD position on this contract, which settled on January 24, 2011. The loss on this contract as of December 31, 2010, was $11 thousand and is included in prepaid expensesother accrued expenses. This contract was settled at a loss of $14 thousand resulting in a loss of $3 thousand in January 2011.
We held one USD/Chinese Yuan Renminbi futures contract with a notional value of $1.0 million and a forward rate of CNY6.6681 CNY/USD at December 31, 2010. We held the USD position on this contract, which was scheduled to settle on February 24, 2011. The contract was terminated on January 21, 2011. The loss on this contract as of December 31, 2010, was $13 thousand and is included in other current assets.
73
Note 20 — Employee Benefit Plans
Note 21 — Business Combinations
Enson Assets Limited
On November 3, 2010, our subsidiary, UEI Hong Kong Private Limited, entered into a stock purchase agreement with CG International Holdings Limited (“CG”) to acquire all of the issued shares in the capital of Enson Assets Limited (“Enson”) for total consideration of approximately $125.9 million. This transaction closed on November 4, 2010. The consideration consisted of $95.1 million in cash and 1,460,000 of newly issued shares of UEI common stock. A total of $5.0 million of the purchase price was held back at the closing to provide for any additional payments required by CG as a result of Enson’s failure to meet both a net asset target and an earnings target (see “Contingent Consideration”below). We have included the $5.0 million that was held back in the purchase price allocation, since it is probable that we will owe the full amount to CG. The $5.0 million is included in our other accrued liabilities balance on December 31, 2010 and 2011. During January 2012, we paid $2.0 million of the $5.0 million to CG International Holdings Limited, and during February 2012, we made an additional payment of $1.0 million.
Our consolidated income statement for the twelve months ended December 31, 2011 includes net sales of $150.1 million and net income of $4.5 million attributable to Enson. Our consolidated income statement for the twelve months ended December 31, 2010 includes net sales of $25.0 million and net income of $1.3 million attributable to Enson for the period commencing on November 4, 2010.
UNIVERSAL ELECTRONICS INC.
NOTES TO CONSOLIDATED FINANCIAL STATEMENTS
DECEMBER 31, 2011
Enson Description
Enson is a leading manufacturer of remote controls. Prior to the acquisition, Enson was also one of our significant suppliers (see Note 5). The Enson corporate office, located in Hong Kong, is approximately 12,000 square feet and employs 58 people. Enson controls two factories located in the People’s Republic of China (“PRC”).
The southern factory is located in Guangdong Province, PRC within the city of Guangzhou. The Guangzhou factory is approximately 710,203 square feet and employs 761 people, with an additional 3,845 factory workers contracted through an agency agreement.
The northern factory is located in Jiangsu Province, PRC within the city of Yangzhou. The Yangzhou factory is approximately 1,204,697 square feet and employs 442 people, with an additional 4,090 factory workers contracted through an agency agreement.
Consideration
The sources of the consideration were the following:
(In thousands) Source Description | Amount | Percentage of Consideration | ||||||
Existing cash and cash equivalents | $ | 54,138 | 43.0 | % | ||||
Funds from new U.S. Bank Secured Term Loan (see Note 8) | 35,000 | 27.8 | ||||||
Funds from new U.S. Bank Secured Revolving Credit Line (see Note 8) | 6,000 | 4.8 | ||||||
Newly issued shares of Universal Electronics Inc. common stock | 30,762 | 24.4 | ||||||
|
|
|
| |||||
| $ | 125,900 | 100 | % | |||||
|
|
|
| |||||
Contingent Consideration
Net Asset Target on November 3, 2010
To the extent that Enson’s net assets were less than $68.5 million on November 3, 2010, CG would have had to pay us the difference, plus interest. To the extent that the Enson net assets were greater than $68.5 million we would pay CG the difference, plus interest. This calculation was finalized during the first quarter of 2011 when the auditor issued their report on Enson’s November 3, 2010 Statement of Net Assets. On November 3, 2010, Enson’s net assets, as defined by the stock purchase agreement, were $68.6 million. As such, the total consideration and the goodwill recognized to acquire Enson increased $0.1 million from December 31, 2010 to December 31, 2011. The $0.1 million is included in our other accrued liabilities balance at December 31, 2011 and 2010.
On May 5, 2011, we received a Dispute Notice from CG, pursuant to the Stock Purchase Agreement, outlining their disagreement with certain tax estimates included within Enson’s Statement of Net Assets on November 3, 2010. We responded by disagreeing with CG’s dispute and have not heard from CG regarding our response; however, depending on the ultimate resolution of this dispute, the total purchase consideration may increase by up to $1.5 million.
Earnings Target for the Twelve Months Ending March 31, 2011
To the extent that Enson’s earnings for the twelve months ended March 31, 2011 were less than $16.2 million, CG would have paid us an amount equal to the product of (a) the difference between Enson’s earnings and $16.2 million, multiplied by (b) one and one half, plus interest.
For the purposes of this calculation, Enson’s earnings are presented below:
During the fourth quarter of 2011, the auditors issued their report on Enson’s accounts, and CG did not owe any amounts related to the earnings target.
Acquisition Costs
We recognized $0.7 million of total acquisition costs related to the Enson transaction in selling, general and administrative expenses during the quarter ended December 31, 2010. The acquisition costs consisted primarily of legal and investment banking services.
UNIVERSAL ELECTRONICS INC.
NOTES TO CONSOLIDATED FINANCIAL STATEMENTS
DECEMBER 31, 2011
In thousands, except per share amounts)
| 2008 | ||||||||||||||||
| March | June | September | December | |||||||||||||
| 31, | 30, | 30, | 31, | |||||||||||||
| Net sales | $ | 61,191 | $ | 70,684 | $ | 76,532 | $ | 78,693 | ||||||||
| Gross profit | 21,735 | 24,212 | 24,928 | 25,315 | ||||||||||||
| Operating income | 2,683 | 4,357 | 5,910 | 7,811 | ||||||||||||
| Net income | 2,473 | 3,495 | 4,005 | 5,833 | ||||||||||||
Earnings per share(1): | ||||||||||||||||
| Basic | $ | 0.17 | $ | 0.25 | $ | 0.29 | $ | 0.43 | ||||||||
| Diluted | $ | 0.17 | $ | 0.24 | $ | 0.28 | $ | 0.42 | ||||||||
| Shares used in computing earnings per share: | ||||||||||||||||
| Basic | 14,474 | 14,033 | 13,919 | 13,638 | ||||||||||||
| Diluted | 14,957 | 14,547 | 14,420 | 13,903 | ||||||||||||
| 2007 | ||||||||||||||||
| March | June | September | December | |||||||||||||
| 31, | 30, | 30, | 31, | |||||||||||||
| Net sales | $ | 66,019 | $ | 71,478 | $ | 68,961 | $ | 66,222 | ||||||||
| Gross profit | 24,341 | 24,626 | 25,737 | 24,647 | ||||||||||||
| Operating income | 6,186 | 5,972 | 6,274 | 8,019 | ||||||||||||
| Net income | 4,637 | 4,546 | 4,915 | 6,132 | ||||||||||||
Earnings per share(1): | ||||||||||||||||
| Basic | $ | 0.33 | $ | 0.31 | $ | 0.34 | $ | 0.42 | ||||||||
| Diluted | $ | 0.31 | $ | 0.30 | $ | 0.32 | $ | 0.40 | ||||||||
| Shares used in computing earnings per share: | ||||||||||||||||
| Basic | 14,130 | 14,437 | 14,508 | 14,565 | ||||||||||||
| Diluted | 14,908 | 15,262 | 15,280 | 15,257 | ||||||||||||
Purchase Price Allocation
Under the acquisition method of accounting, the acquisition date fair value of the consideration transferred is allocated to the net tangible and intangible assets acquired and liabilities assumed based on their estimated fair values on the acquisition date. Management’s purchase price allocation on November 4, 2010, (the Enson acquisition date) is the following:
| (in thousands) | Weighted Average Estimated Lives | Fair Value | ||||||
Cash and cash equivalents | $ | 20,866 | ||||||
Inventories | 23,469 | |||||||
Accounts receivable | 37,625 | |||||||
Prepaid expenses and other current assets | 738 | |||||||
Property, plant and equipment | 20 years | 66,644 | ||||||
Deferred income taxes | 2,619 | |||||||
Other assets | 3,409 | |||||||
Interest bearing liabilities | (4,227 | ) | ||||||
Non-interest bearing liabilities | (67,879 | ) | ||||||
|
| |||||||
Net tangible assets acquired | 83,264 | |||||||
Customer relationships | 10 years | 23,300 | ||||||
Trademark and trade name | 10 years | 2,000 | ||||||
Goodwill | 17,336 | |||||||
|
| |||||||
Total estimated purchase price | $ | 125,900 | ||||||
|
| |||||||
Intangible Assets Subject to Amortization
Of the total estimated purchase price, $83.3 million has been allocated to net tangible assets acquired, $17.3 million has been allocated to goodwill, and $25.3 million has been allocated to identifiable intangible assets acquired. The identified intangible assets consist of $23.3 million assigned to customer relationships and $2.0 million assigned to trademark and trade name. UEI expects to amortize the fair value of Enson’s customer relationships on a straight-line basis over an estimated life of 10 years. UEI expects to amortize the value of Enson’s trademark and trade name on a straight-line basis over an estimated life of 10 years. The customer relationships and trademark and trade name amortization will not be deductible for tax purposes.
Goodwill
Goodwill represents the excess of the purchase consideration over the estimated fair value of identifiable tangible and intangible assets acquired. Goodwill from this transaction of $17.3 million will not be amortized, but will be analyzed for impairment on at least an annual basis in accordance with U.S. GAAP. We review our goodwill for impairment annually on December 31 and whenever events or changes in circumstances indicate that an impairment loss may have occurred. Of the total goodwill recorded, none is expected to be deductible for tax purposes.
Note 24 — Subsequent EventZilog, Inc.
On February 18, 2009, we acquired certain patents, intellectual property and other assets related to the universal remote control business from Zilog, Inc. (NASDAQ: ZILG) for approximately $9.5 million in cash. The purchase included Zilog’s full library and database of infrared codes, software tools and software tools.certain fixed assets. We also hired 115116 of Zilog’s sales and engineering personnel, including all 103107 of Zilog’s personnel located in India. In a related transaction, Maxim Integrated Products (NASDAQ: MXIM) acquired two of Zilog’s product lines, namely, the hardware portion of Zilog’s remote control business and Zilog’s secured transaction product line.
We have cross–licensedcross-licensed the remote control technology and intellectual property with Maxim Integrated Products for the purpose of conducting our respective businesses. The arrangement involves an agreement to source silicon chips from Maxim. For the first yearIn addition, during 2009 we willagreed to be theMaxim’s exclusive sales agent, of universal remote control chips for Maxim, selling the Zilog designs to Zilog’s current listformer customers, in return for a sales agency fee. The sales agency fee during the years ended December 31, 2011, 2010 and 2009 was $1.0 million, $4.1 million, and $4.4 million, respectively. During 2011, we continued to slowly transition from the Zilog chip platform to the Maxim chip platform. As we progressively take over full
UNIVERSAL ELECTRONICS INC.
NOTES TO CONSOLIDATED FINANCIAL STATEMENTS
DECEMBER 31, 2011
sales and distribution rights, procuring and selling the chips directly to Zilog’s former customers, the revenue recognized as a result of customers.
The total purchase price allocation analysis, which requires the cost of an acquisition to beapproximately $9.5 million has been allocated to the individualnet assets acquired and liabilities assumed based on their estimated fair values. Although we believevalues as follow:
| (In thousands) | ||||||||
| Weighted Average Estimated Lives | Fair Value | |||||||
Intangible assets: | ||||||||
Database | 15 years | $ | 3,500 | |||||
Customer relationships | 15 years | 3,100 | ||||||
Goodwill | 2,902 | |||||||
Property, plant, and equipment | 44 | |||||||
|
| |||||||
Purchase price | $ | 9,546 | ||||||
|
| |||||||
Intangible Assets Subject to Amortization
Of the total purchase price, approximately $6.6 million was allocated to identifiable intangible assets subject to amortization including the database and customer relationships. We are amortizing the database on a straight-line basis over an estimated useful life of approximately 15 years. We are amortizing the customer relationships intangible on a straight-line basis over an estimated useful life of approximately 15 years. The database and customer relationships amortization will not be deductible for tax purposes.
Goodwill
Goodwill represents the excess of the cost (purchase price) over the estimated fair value of identifiable tangible and intangible assets acquired. Goodwill from this transaction of $2.9 million will not be amortized, but will be analyzed for impairment at least on an annual basis in accordance with U.S. GAAP. We review our goodwill for impairment annually on December 31 and whenever events or changes in circumstances indicate that an impairment loss may have occurred. We have not recorded any impairment related to the goodwill recognized as a result of the Zilog transaction will be mildly accretive in the first year and grow more significantly in the long term, most technology related acquisitions involve the purchase of significant intangible assets which typically result in
74
Acquisition Costs
We recognized $1.1 million of total acquisition related costs related to the Zilog transaction to range between $0.8 million and $1.0 million. These costs will be expensed during the first quarter of 2009 in selling, general and administrative expenses in accordanceduring the year ended December 31, 2009. The acquisition costs consisted primarily of SFAS 141R.
75
UNIVERSAL ELECTRONICS INC.
NOTES TO CONSOLIDATED FINANCIAL STATEMENTS
| Additions | ||||||||||||||||
| Balance at | Charged to | Balance at | ||||||||||||||
| Beginning of | Costs and | End of | ||||||||||||||
| Description | Period | Expenses | Write-offs | Period | ||||||||||||
| Valuation account for inventory: | ||||||||||||||||
| Year Ended December 31, 2008 | $ | 1,826 | $ | 2,411 | $ | (2,702 | ) | $ | 1,535 | |||||||
| Year Ended December 31, 2007 | $ | 2,179 | $ | 2,146 | $ | (2,499 | ) | $ | 1,826 | |||||||
| Year Ended December 31, 2006 | $ | 2,274 | $ | 1,810 | $ | (1,905 | ) | $ | 2,179 | |||||||
| Additions | ||||||||||||||||
| Balance at | Charged to | Balance at | ||||||||||||||
| Beginning of | Costs and | Reduction/ | End of | |||||||||||||
| Description | Period | Expenses | Write-offs | Period | ||||||||||||
| Valuation account for income tax: | ||||||||||||||||
| Year Ended December 31, 2008 | $ | 264 | — | $ | (75 | ) | $ | 189 | ||||||||
| Year Ended December 31, 2007 | $ | 620 | — | $ | (356 | ) | $ | 264 | ||||||||
| Year Ended December 31, 2006 | $ | 620 | — | — | $ | 620 | ||||||||||
762011
Pro forma Results (Unaudited)
Pro forma results were as follows for the years ended December 31, 2010 and 2009:
| 2010 | 2009 | |||||||
Revenue: | $ | 458,492 | $ | 409,475 | ||||
Net income: | $ | 31,686 | $ | 21,230 | ||||
Basic and diluted net income per share: | ||||||||
Basic | $ | 2.30 | $ | 1.40 | ||||
Diluted | $ | 2.25 | $ | 1.38 | ||||
The unaudited pro forma financial information is not intended to represent or be indicative of the consolidated results of operations that would have been achieved had the acquisition actually been completed as of the date presented, and should not be taken as a projection of the future consolidated results of our operations.
Enson Adjustments
Enson adjustments to reduce net income of $2.6 million for the year ended December 31, 2010, have been made to the combined results of operations. The $2.6 million reduction to net income reflects interest on the term loan, amortization of acquired intangible assets, amortization and depreciation of the fair value adjustments to prepaid land and property, plant, and equipment that would have occurred had the acquisition date been January 1, 2009.
Enson adjustments to reduce net income of $5.4 million for the year ended December 31, 2009, have been made to the combined results of operations. The $5.4 million reduction to net income primarily reflects acquisition costs, interest on the term loan and line of credit, amortization of acquired intangible assets, amortization and depreciation of the fair value adjustments to prepaid land and property, plant, and equipment that would have occurred had the acquisition date been January 1, 2009.
All adjustments have been made net of their related tax effects.
Zilog Adjustments
Zilog adjustments netting $0.7 million for the year ended December 31, 2009 have been made to the combined results of operations, primarily reflecting acquisition costs, net sales, salary costs and the amortization of purchased intangible assets that would have occurred had the acquisition date been January 1, 2009.
All adjustments have been made net of their related tax effects.
UNIVERSAL ELECTRONICS INC.
NOTES TO CONSOLIDATED FINANCIAL STATEMENTS
DECEMBER 31, 2011
Note 22 — Quarterly Financial Data (Unaudited)
Summarized quarterly financial data for the years ended December 31, 2011 and 2010, are presented below:
| 2011 | ||||||||||||||||
| (In thousands, except per share amounts) | March 31, | June 30, | September 30, | December 31, | ||||||||||||
Net sales | $ | 105,712 | $ | 121,746 | $ | 123,527 | $ | 117,645 | ||||||||
Gross profit | 27,579 | 34,944 | 34,178 | 33,360 | ||||||||||||
Operating income | 2,535 | 8,310 | 9,465 | 6,266 | ||||||||||||
Net income | 1,827 | 6,121 | 7,084 | 4,914 | ||||||||||||
Earnings per share(1): | ||||||||||||||||
Basic | $ | 0.12 | $ | 0.41 | $ | 0.48 | $ | 0.33 | ||||||||
|
|
|
|
|
|
|
| |||||||||
Diluted | $ | 0.12 | $ | 0.40 | $ | 0.47 | $ | 0.33 | ||||||||
|
|
|
|
|
|
|
| |||||||||
Shares used in computing earnings per share: | ||||||||||||||||
Basic | 14,976 | 15,025 | 14,887 | 14,763 | ||||||||||||
|
|
|
|
|
|
|
| |||||||||
Diluted | 15,383 | 15,407 | 15,147 | 14,919 | ||||||||||||
|
|
|
|
|
|
|
| |||||||||
| 2010 | ||||||||||||||||
| (In thousands, except per share amounts) | March 31, | June 30, | September 30, | December 31, | ||||||||||||
Net sales | $ | 71,376 | $ | 78,892 | $ | 79,007 | $ | 102,505 | ||||||||
Gross profit | 22,064 | 27,425 | 25,718 | 28,642 | ||||||||||||
Operating income | 2,687 | 7,316 | 6,566 | 4,732 | ||||||||||||
Net income | 1,836 | 4,777 | 4,702 | 3,766 | ||||||||||||
Earnings per share(1): | ||||||||||||||||
Basic | $ | 0.13 | $ | 0.35 | $ | 0.35 | $ | 0.26 | ||||||||
|
|
|
|
|
|
|
| |||||||||
Diluted | $ | 0.13 | $ | 0.34 | $ | 0.34 | $ | 0.26 | ||||||||
|
|
|
|
|
|
|
| |||||||||
Shares used in computing earnings per share: | ||||||||||||||||
Basic | 13,700 | 13,601 | 13,417 | 14,344 | ||||||||||||
|
|
|
|
|
|
|
| |||||||||
Diluted | 14,093 | 13,929 | 13,671 | 14,737 | ||||||||||||
|
|
|
|
|
|
|
| |||||||||
| (1) | The earnings per common share calculations for each of the quarters were based upon the weighted average number of shares and share equivalents outstanding during each period, and the sum of the quarters may not be equal to the full year earnings per share amounts. |
None.
Disclosure Controls and Procedures
Exchange Act Rule 13a-15(d) defines “disclosure controls and procedures” to mean controls and procedures of a company that are designed to ensure that information required to be disclosed by the company in the reports that it files or submits under the Exchange Act is recorded, processed, summarized and reported, within the time periods specified in the Commission’s rules and forms. The definition further states that disclosure controls and procedures include, without limitation, controls and procedures designed to ensure that the information required to be disclosed by a company in the reports that it files or submits under the Exchange Act is accumulated and communicated to the company’s management, including its principal executive and principal financial officers, or persons performing similar functions, as appropriate to allow timely decisions regarding required disclosure.
An evaluation was performed under the supervision and with the participation of our management, including our principal executive and principal financial officers, of the effectiveness of the design and operation of our disclosure controls and procedures as of the end of the period covered by this report. Based on that evaluation, our principal executive and principal financial officers have concluded that our disclosure controls and procedures were effective, as of the end of the period covered by this report, to provide reasonable assurance that information required to be disclosed by us in reports that we file or submit under the Exchange Act is recorded, processed, summarized and reported within the time periods specified in Securities and Exchange Commission rules and forms and is accumulated and communicated to our management to allow timely decisions regarding required disclosures.
Management’s Annual Report on Internal Control Over Financial Reporting
Management is responsible for establishing and maintaining adequate internal control over financial reporting, as such term is defined in Exchange Act Rule 13a-15(f). Our internal control over financial reporting is a process designed to provide reasonable assurance regarding the reliability of financial reporting and preparation of financial statements for external purposes in accordance with accounting principles generally accepted in the United States of America. Because of inherent limitations, internal control over financial reporting may not prevent or detect misstatements. Also, projections of any evaluation of effectiveness to future periods are subject to the risk that controls may become inadequate because of changes in conditions, or that the degree of compliance with the policies or procedures may deteriorate.
Under the supervision and with the participation of our management, including our principal executive and principal financial officers, we evaluated the effectiveness of our internal control over financial reporting based on the Internal Control-Integrated Framework issued by the Committee of Sponsoring Organizations of the Treadway Commission (“COSO”) in Internal Control Integrated Framework. Based on our evaluation under this framework, our management concluded that our internal control over financial reporting was effective as of December 31, 2008.
The effectiveness of our internal control over financial reporting as of December 31, 20082011 has been audited by Grant Thornton LLP, an independent registered public accounting firm, as stated in its attestation report which is included herein.
Changes in Internal Control Over Financial Reporting
There have been no changes in internal controls or in other factors that may significantly affect our internal controls during the fourth quarter.
772011.
Board of Directors and Shareholders
Universal Electronics Inc.
We have audited Universal Electronics Inc.’s (a Delaware Corporation) internal control over financial reporting as of December 31, 2008,2011, based on criteria established in Internal Control—IntegratedControl-Integrated Framework issued by the Committee of Sponsoring Organizations of the Treadway Commission (COSO). Universal Electronics Inc.’s management is responsible for maintaining effective internal control over financial reporting and for its assessmentassertion of the effectiveness of internal control over financial reporting, included in the accompanying Management’s Annual Report on Internal Control Over Financial Reporting. Our responsibility is to express an opinion on Universal Electronics Inc.’s internal control over financial reporting based on our audit.
We conducted our audit in accordance with the standards of the Public Company Accounting Oversight Board (United States). Those standards require that we plan and perform the audit to obtain reasonable assurance about whether effective internal control over financial reporting was maintained in all material respects. Our audit included obtaining an understanding of internal control over financial reporting, assessing the risk that a material weakness exists, testing and evaluating the design and operating effectiveness of internal control based on the assessed risk, and performing such other procedures as we considered necessary in the circumstances. We believe that our audit provides a reasonable basis for our opinion.
A company’s internal control over financial reporting is a process designed to provide reasonable assurance regarding the reliability of financial reporting and the preparation of financial statements for external purposes in accordance with generally accepted accounting principles. A company’s internal control over financial reporting includes those policies and procedures that (1) pertain to the maintenance of records that, in reasonable detail, accurately and fairly reflect the transactions and dispositions of the assets of the company; (2) provide reasonable assurance that transactions are recorded as necessary to permit preparation of financial statements in accordance with generally accepted accounting principles, and that receipts and expenditures of the company are being made only in accordance with authorizations of management and directors of the company; and (3) provide reasonable assurance regarding prevention or timely detection of unauthorized acquisition, use, or disposition of the company’s assets that could have a material effect on the financial statements.
Because of its inherent limitations, internal control over financial reporting may not prevent or detect misstatements. Also, projections of any evaluation of effectiveness to future periods are subject to the risk that controls may become inadequate because of changes in conditions, or that the degree of compliance with the policies or procedures may deteriorate.
In our opinion, Universal Electronics Inc. maintained, in all material respects, effective internal control over financial reporting as of December 31, 2008,2011, based on criteria established in Internal Control—IntegratedControl-Integrated Framework issued by COSO.
We also have audited, in accordance with the standards of the Public Company Accounting Oversight Board (United States), the consolidated balance sheets of Universal Electronics Inc. as of December 31, 20082011 and 2007,2010, and the related consolidated statements of income, stockholders’ equity, and cash flows for each of the three years in the period ended December 31, 2008,2011, and our report dated March 3, 200914, 2012 expressed an unqualified opinion.
/s/ Grant Thornton LLP
Irvine, California
March 3, 2009
7814, 2012
None
PART III
Information required by Item 401 of Regulation S-K with respect to our directors will be contained in and is hereby incorporated by reference to our definitive Proxy Statement for our 20092012 Annual Meeting of Stockholders to be filed pursuant to Regulation 14A promulgated by the Securities and Exchange Commission under the Exchange Act. Information regarding executive officers of the Company is set forth in Part I of this Form 10-K.
Information required by Item 405 of Regulation S-K will be contained in and is hereby incorporated by reference to our definitive Proxy Statement for our 20092012 Annual Meeting of Stockholders to be filed subsequent to the date of filing this Form 10-K, under the caption “Section 16(a) Beneficial Ownership Reporting Compliance.” Copies of Section 16 reports, Forms 3, 4 and 5, are available on our website,www.uei.com under the caption “SEC Filings” on the Investor page.
Code of Conduct.We have adopted a code of conduct that applies to all of our employees, including without limitation our principal executive officer, principal financial officer and principal accounting officer. A copy of the Code of Conduct is included as Exhibit 14.1 to our Annual Report on Form 10-K for the year ended December 31, 2003 filed on March 14, 2004 (File No. 0-21044). The Code of Conduct is also available on our website,www.uei.com under the caption “Corporate Governance” on the Investor page. We will post on our website information regarding any amendment to, or waiver from, any provision of the Code of Conduct that applies to our principal executive officer, principal financial officer or principal accounting officer.
Information required by Items 407(c)(3), (d)(4) and (d)(5) of Regulation S-K will be contained in and is hereby incorporated by reference to our definitive Proxy Statement for our 20092012 Annual Meeting of Stockholders to be filed pursuant to Regulation 14A promulgated by the Securities and Exchange Commission under the Exchange Act.
Information required by Items 402 and 407(e)(4) and (e)(5) of Regulation S-K will be contained in and is hereby incorporated by reference to our definitive Proxy Statement for our 20092012 Annual Meeting of Stockholders to be filed pursuant to Regulation 14A promulgated by the Securities and Exchange Commission under the Exchange Act.
ITEM 12. SECURITY OWNERSHIP OF CERTAIN BENEFICIAL OWNERS AND MANAGEMENT AND RELATED STOCKHOLDER MATTERS
Information required by Item 403 of Regulation S-K will be contained in and is hereby incorporated by reference to our definitive Proxy Statement for our 20092012 Annual Meeting of Stockholders to be filed pursuant to Regulation 14A promulgated by the Securities and Exchange Commission under the Exchange Act.
79
Equity Compensation Plan Information
| (a) | (b) | (c) | ||||||||||
| Number of | ||||||||||||
| securities | ||||||||||||
| remaining available | ||||||||||||
| Number of | for future issuance | |||||||||||
| Securities to be | under equity | |||||||||||
| issued upon | Weighted-average | compensation plans | ||||||||||
| exercise of | exercise price of | (excluding | ||||||||||
| outstanding | outstanding | securities | ||||||||||
| options, warrants | options, warrants | reflected in column | ||||||||||
| Plan Category | and rights | and rights | (a)) | |||||||||
| Equity compensation plans approved by security holders | 1,045,159 | $ | 19.40 | 787,471 | ||||||||
| Equity compensation plans not approved by security holders | 771,197 | 15.87 | 6,788 | |||||||||
Total | 1,816,356 | $ | 17.90 | 794,259 | ||||||||
| (a) | (b) | (c) | ||||||||||
Plan Category | Number of Securities to be issued upon exercise of outstanding options, warrants and rights | Weighted-average exercise price of outstanding options, warrants and rights | Number of securities remaining available for future issuance under equity compensation plans (excluding securities reflected in column (a)) | |||||||||
Equity compensation plans approved by security holders | 1,377,492 | $ | 19.99 | 858,673 | ||||||||
|
|
|
|
|
| |||||||
Equity compensation plans not approved by security holders | 326,197 | 17.11 | 9,251 | |||||||||
|
|
|
|
|
| |||||||
Total | 1,703,689 | $ | 19.99 | 867,924 | ||||||||
|
|
|
|
|
| |||||||
See “ITEM 8. FINANCIAL STATEMENTS AND SUPPLEMENTARY DATA- Notes to Consolidated Financial Statements— -Note 11”16” for a description of each of our stock incentive plans.
Information required by Items 404 and 407(a) of Regulation S-K will be contained in and is hereby incorporated by reference to our definitive Proxy Statement for our 20092012 Annual Meeting of Stockholders to be filed pursuant to Regulation 14A promulgated by the Securities and Exchange Commission under the Exchange Act.
Information required by this item will be contained in and is hereby incorporated by reference to our definitive Proxy Statement for our 20092012 Annual Meeting of Stockholders to be filed pursuant to Regulation 14A promulgated by the Securities and Exchange Commission under the Exchange Act.
PART IV
(a)(1)List of Financial Statements
See “ITEM 8. FINANCIAL STATEMENTS AND SUPPLEMENTARY DATA-Index to Consolidated Financial Statements” for a list of the consolidated financial statements included herein.
(a)(2)List of Financial Statement Schedules
See “ITEM 8. FINANCIAL STATEMENTS AND SUPPLEMENTARY DATA-Index to Consolidated Financial Statements” for a list of the consolidated financial statement schedules included herein.
(a)(3)List of Exhibits required to be filed by Item 601(a) of the Regulation S-K are included as Exhibits to this Report:
See EXHIBIT INDEX at page 8284 of Form 10-K.
80
| UNIVERSAL ELECTRONICS INC. | ||||
By: | ||||
/s/ Paul D. Arling | ||||
| Paul D. Arling | ||||
| Chairman and Chief Executive Officer | ||||
POWER OF ATTORNEY
Each person whose signature appears below constitutes and appoints Paul D. Arling and Bryan M. Hackworth as true and lawful attorneys-in-fact and agents, each acting alone, with full powers of substitution, for him and in his name, place and stead, in any and all capacities, to sign any and all amendments to this Annual Report on Form 10-K, and to file the same, with all exhibits thereto and other documents in connection therewith, with the Securities and Exchange Commission, granting unto said attorneys-in-fact and agents, each acting alone, full power and authority to do and perform each and every act and thing requisite and necessary to be done in and about the premises, as fully for all intents and purposes as he might or may do in person, thereby ratifying and confirming all that said attorneys-in-fact and agents, each acting alone, or his substitutes, may lawfully do or cause to be done by virtue hereof.
Pursuant to the requirements of the Securities Exchange Act of 1934, this report has been signed below on the 13th14th day of March, 2009,2012, by the following persons on behalf of the registrant and in the capacities indicated.
| NAME & TITLE | SIGNATURE | ||||
Paul D. Arling | |||||
Chairman and Chief Executive Officer (principal executive officer) | /s/ Paul D. Arling | ||||
Bryan M. Hackworth | |||||
Chief Financial Officer | |||||
(principal financial officer and principal accounting officer) | /s/ Bryan M. Hackworth | ||||
Satjiv S. Chahil Director | |||||
/s/ Satjiv S. Chahil | |||||
William C. Mulligan Director | |||||
/s/ William C. Mulligan | |||||
J. C. Sparkman Director | |||||
/s/ J.C. Sparkman | |||||
Gregory P. Stapleton Director | |||||
/s/ Gregory P. Stapleton | |||||
Carl E. Vogel Director | /s/ Carl E. Vogel | ||||
Edward K. Zinser Director | |||||
/s/ Edward K. Zinser | |||||
Exhibit | Document Description | |||
81
| 2.1 | Asset Purchase Agreement dated as of February 17, 2009 by and among Zilog, Inc., Zilog India Electronics Pvt Ltd, Maxim Integrated Products, Inc., UEI Cayman Inc., Universal Electronics Inc., and UEI Electronics Private Limited (incorporated by reference to Exhibit 2.1 to the Company’s Annual Report on Form 10-K for the year ended December 31, 2008 filed | ||
| 2.2 | Stock Purchase Agreement dated as of November 3, 2010, among Universal Electronics Inc., UEI Hong Kong Private Limited and CG International Holdings Limited** (incorporated by reference to Exhibit 2.1 to the Company’s Current Report on Form 8-K filed on November 4, 2010 (File No. 0-12044)) | ||
| 3.1 | Restated Certificate of Incorporation of Universal Electronics Inc., as amended (Incorporated by reference to Exhibit 3.1 to the Company’s Form S-1 Registration filed on or about December 24, 1992 (File No. 33-56358)) | ||
| 3.2 | Amended and Restated By-laws of Universal Electronics Inc. (Incorporated by reference to Exhibit 3.2 to the Company’s Form S-1 Registration filed on or about December 24, 1992 (File No. 33-56358)) | ||
| 3.3 | Certificate of Amendment to Restated Certificate of Incorporation of Universal Electronics Inc. (Incorporated by reference to Exhibit 3.3 to the Company’s Annual Report on Form 10-K for the year ended December 31, 1995 filed on April 1, 1996 (File No. 0-21044)) | ||
| 4.1 | Article Eighth of our Restated Certificate of Incorporation, as amended, contains certain provisions restricting business combinations with interested stockholders under certain circumstances and imposing higher voting requirements for the approval of certain transactions unless the transaction has been approved by two-thirds of the disinterested directors or fair price provisions have been met. (Incorporated by reference to Exhibit 3.3 to the Company’s Annual Report on Form 10-K for the year ended December 31, 1995 filed on April 1, 1996 (File No. 0-21044)) | ||
| *10.1 | Form of Universal Electronics Inc. 1993 Stock Incentive Plan (Incorporated by reference to Exhibit 10.13 to Amendment No. 1 to the Company’s Form S-1 Registration filed on or about January 21, 1993 (File No. 33-56358)) | ||
| *10.2 | Form of Universal Electronics Inc. 1995 Stock Incentive Plan (Incorporated by reference to Exhibit B to the Company’s Definitive Proxy Materials for the 1995 Annual Meeting of Stockholders of Universal Electronics Inc. filed on May 1, 1995 (File No. 0-21044)) | ||
| *10.3 | Form of Stock Option Agreement by and between Universal Electronics Inc. and certain employees used in connection with options granted to the employees pursuant to the Universal Electronics Inc. 1995 Stock Incentive Plan (Incorporated by reference to Exhibit 10.20 to the Company’s Annual Report on Form 10-K for the year ended December 31, 1996 filed on March 28, 1997 (File No. 0-21044)) | ||
| *10.4 | Form of Stock Option Agreement by and between Universal Electronics Inc. and certain non-affiliated directors used in connection with options granted to the non-affiliated directors pursuant to the Universal Electronics Inc. 1995 Stock Incentive Plan (Incorporated by reference to Exhibit 10.21 to the Company’s Annual Report on Form 10-K for the year ended December 31, 1996 filed on March 28, 1997 (File No. 0-21044)) | ||
| *10.5 | Form of Universal Electronics Inc. 1996 Stock Incentive Plan (Incorporated by reference to Exhibit 4.5 to the Company’s Form S-8 Registration Statement filed on March 26, 1997 (File No. 333-23985)) | ||
| *10.6 | Form of Stock Option Agreement by and between Universal Electronics Inc. and certain employers used in connection with options granted to the employees pursuant to the Universal Electronics Inc. 1996 Stock Incentive Plan (Incorporated by reference to Exhibit 4.6 to the Company’s Form S-8 Registration Statement filed on March 26, 1997 (File No. 333-23985)) | ||
Exhibit | Document Description | ||
| *10.7 | Form of Salary Continuation Agreement by and between Universal Electronics Inc. and certain employees (Incorporated by reference to Exhibit 10.25 to the Company’s Annual Report on Form 10-K for the year ended December 31, 1997, filed on March 30, 1998 (File No. 0-21044)) | ||
| *10.8 | Form of Amendment to Salary Continuation Agreement by and between Universal Electronics Inc. and certain employees (Incorporated by reference to Exhibit 10.26 to the Company’s Annual Report on Form 10-K for the year ended December 31, 1997, filed on March 30, 1998 (File No. 0-21044)) | ||
82
| *10.9 | Form of Universal Electronics Inc. 1998 Stock Incentive Plan (Incorporated by reference to Exhibit A to the Company’s Definitive Proxy Materials for the 1998 Annual Meeting of Stockholders of Universal Electronics Inc. filed on April 20, 1998 (File No. 0-21044)) | ||
| *10.10 | Form of Stock Option Agreement by and between Universal Electronics Inc. and certain employees used in connection with options granted to the employees pursuant to the Universal Electronics Inc. 1998 Stock Incentive Plan(Incorporated by reference to Exhibit 10.24 to the Company’s Annual Report on Form 10-K for the year ended December 31, 1998 filed on March 31, 1999 (File No. 0-21044)) | ||
| *10.11 | Form of Universal Electronics Inc. 1999 Stock Incentive Plan (Incorporated by reference to Exhibit A to the Company’s Definitive Proxy Materials for the 1999 Annual Meeting of Stockholders of Universal Electronics Inc. filed on April 29, 1999 (File No. 0-21044)) | ||
| *10.12 | Form of Stock Option Agreement by and between Universal Electronics Inc. and certain employees used in connection with options granted to the employees pursuant to the Universal Electronics Inc. 1999 Stock Incentive Plan (Incorporated by reference to Exhibit A to the Company’s Definitive Proxy Materials for the 1999 Annual Meeting of Stockholders of Universal Electronics Inc. filed on April 29, 1999 (File No. 0-21044)) | ||
| *10.13 | Form of Salary Continuation Agreement by and between Universal Electronics Inc. and certain employees (Incorporated by reference to Exhibit 10.39 to the Company’s Annual Report on Form 10-K for the year ended December 31, 1999 filed on March 30, 2000 (File No. 0-21044)) | ||
| *10.14 | Form of Universal Electronics Inc. 1999A Nonqualified Stock Plan effective October 7, 1999 and subsequently amended February 1, 2000 (Incorporated by reference to Exhibit 10.42 to the Company’s Annual Report on Form 10-K for the year ended December 31, 1999 filed on March 30, 2000 (File No. 0-21044)) | ||
| *10.15 | Form of Stock Option Agreement by and between Universal Electronics Inc. and certain employees used in connection with options granted to the employees pursuant to the Universal Electronics Inc. 1999A Nonqualified Stock Plan (Incorporated by reference to Exhibit 10.43 to the Company’s Annual Report on Form 10-K for the year ended December 31, 1999 filed on March 30, 2000 (File No. 0-21044)) | ||
| *10.16 | Form of Universal Electronics Inc. 2002 Stock Incentive Plan (Incorporated by reference to Exhibit 10.49 to the Company’s Quarterly Report on Form 10-Q for the quarter ended June 30, 2002 filed on August 14, 2002 (File No. 0-21044)) | ||
| *10.17 | Form of Stock Option Agreement by and between Universal Electronics Inc. and certain directors, officers and other employees used in connection with options granted to the employees pursuant to the Universal Electronics Inc. 2002 Stock Incentive Plan (Incorporated by reference to Exhibit 10.50 to the Company’s Quarterly Report on Form 10-Q for the quarter ended June 30, 2002 filed on August 14, 2002 (File No. 0-21044)) | ||
| *10.18 | Form of Universal Electronics Inc. 2003 Stock Incentive Plan (Incorporated by reference to Appendix B to the Company’s Definitive Proxy Materials for the 2003 Annual Meeting of Stockholders of Universal Electronics Inc. filed on April 28, 2003 (File No. 0-21044)) | ||
Exhibit | Document Description | ||
| * | Form of Executive Officer Employment Agreement dated April 23, 2003 by and between Universal Electronics Inc. and Paul D. Arling (incorporated by reference to Exhibit 10.42 to the Company’s Annual Report on Form 10-K for the year ended December 31, 2003 filed on March 14, 2004 (File No. 0-21044)) | ||
83
| * | |||
| Form of First Amendment to Executive Officer Employment Agreement dated October 21, 2005 by and between Universal Electronics Inc. and Paul D. Arling (incorporated by reference to Exhibit 10.24 to the Company’s Annual Report on Form 10-K for the year ended December 31, 2005 filed on March 16, 2006 (File No. 0-21044)) | |||
| * | Form of Universal Electronics Inc. 2006 Stock Incentive Plan (incorporated by reference to Appendix C to the Company’s Definitive Proxy Materials for the 2006 Annual Meeting of Stockholders of Universal Electronics Inc. filed on April 26, 2006 (File No. 0-21044) | ||
| Form of Lease dated January 31, 2007 between FirstCal Industrial 2 Acquisition, LLC and Universal Electronics Inc. (incorporated by reference to Exhibit 10.26 to the Company’s Annual Report on Form 10-K for the year ended December 31, 2006 filed on March 16, 2007 (File No. 02-21044)) | |||
| * | Form of Indemnification Agreements, dated as of January 2, 2007 between the Company and each director and certain officers of the Company (incorporated by reference to Exhibit 10.28 to the Company’s Annual Report on Form 10-K for the year ended December 31, 2006 filed on March 16, 2007 (File No. 02-21044)) | ||
| * | Form of Restricted Stock Unit Agreement (incorporated herein by reference to Exhibit 4.5 to the Company’s Form S-8 Registration Statement filed on March 27, 2008 (File No. 333-149926)) | ||
| 10.25 | Credit Agreement dated December 23, 2009 between U.S. Bank National Association and Universal Electronics Inc. (incorporated by reference to Exhibit 10.31 to the Company’s Annual Report on Form 10-K for the year ended December 31, 2009 filed on March 15, 2010 (File No. 02-21044)) | ||
| 10.26 | Revolving Note dated December 23, 2009 from Universal Electronics Inc. to U.S. Bank National Association ((incorporated by reference to Exhibit 10.32 to the Company’s Annual Report on Form 10-K for the year ended December 31, 2009 filed on March 15, 2010 (File No. 02-21044)) | ||
| 10.27 | Amended and Restated Credit Agreement dated as of November 1, 2010 between Universal Electronics Inc. and U.S. Bank National Association ((incorporated by reference to Exhibit 10.27 to the Company’s Annual Report on Form 10-K for the year ended December 31, 2010 filed on March 16, 2011 (File No. 02-21044)) | ||
| 10.28 | Revolving Note dated November 1, 2010 between Universal Electronics Inc. and U.S. Bank National Association ((incorporated by reference to Exhibit 10.28 to the Company’s Annual Report on Form 10-K for the year ended December 31, 2010 filed on March 16, 2011 (File No. 02-21044)) | ||
| 10.29 | Term Note dated November 1, 2010 from Universal Electronics Inc. to U.S. Bank National Association ((incorporated by reference to Exhibit 10.29 to the Company’s Annual Report on Form 10-K for the year ended December 31, 2010 filed on March 16, 2011 (File No. 02-21044)) | ||
| 10.30 | Pledge Agreement dated November 1, 2010 between UEI Hong Kong Private Limited and Enson Assets Limited to U.S. Bank National Association ((incorporated by reference to Exhibit 10.30 to the Company’s Annual Report on Form 10-K for the year ended December 31, 2010 filed on March 16, 2011 (File No. 02-21044)) | ||
| 10.31 | Security Agreement dated November 1, 2010 from Universal Electronics Inc. to U.S. Bank National Association ((incorporated by reference to Exhibit 10.31 to the Company’s Annual Report on Form 10-K for the year ended December 31, 2010 filed on March 16, 2011 (File No. 02-21044)) | ||
| *10.32 | Universal Electronics Inc. 2010 Stock Incentive Plan (incorporated by reference to Appendix C to the Company’s Proxy Statement for its 2010 Annual Meeting of Stockholders filed on April 30, 2010 (File No. 02-21044)) | ||
Exhibit | Document Description | ||
| *10.33 | Form of Option Agreement used in connection with the Universal Electronics Inc. 2010 Stock Incentive Plan (incorporated by reference to Exhibit 4.6 to the Company’s Registration Statement on Form S-8 filed on July 5, 2011 (File No. 333-175345)) | ||
| *10.34 | Form of Restricted Stock Unit Agreement used in connection with the Universal Electronics Inc. 2010 Stock Incentive Plan (incorporated by reference to Exhibit 4.6 to the Company’s Registration Statement on Form S-8 filed on July 5, 2011 (File No. 333-175345)) | ||
| 10.35 | First Amendment to Amended and Restated Credit Agreement dated October 26, 2011 between Universal Electronics Inc. and U.S. Bank National Association (filed herewith) | ||
| 10.36 | Acknowledgment and Agreement of Pledgor dated October 26, 2011 from UEI Hong Kong Private Limited (filed herewith) | ||
| 10.37 | Second Amendment to Amended and Restated Credit Agreement dated March 2, 2012 between Universal Electronics Inc. and U.S. Bank National Association (filed herewith) | ||
| 14.1 | Code of Conduct (incorporated by reference to Exhibit 14.1 to the Company’s Annual Report on Form 10-K for the year ended December 31, 2003 filed on March 14, 2004 (File No. 0-21044)) | ||
| 21.1 | List of Subsidiaries of the Registrant (filed herewith) | ||
| 23.1 | Consent of Independent Registered Public Accounting Firm | ||
| 24.1 | Power of Attorney (filed as part of the signature page hereto) | ||
| 31.1 | Rule 13a-14(a) Certifications of the Chief Executive Officer (filed herewith) | ||
| 31.2 | Rule 13a-14(a) Certifications of the Chief Financial Officer (principal financial officer and principal accounting officer) (filed herewith) | ||
| 32.1 | Section 1350 Certifications of the Chief Executive Officer (filed herewith) | ||
| 32.2 | Section 1350 Certifications of the Chief Financial Officer (principal financial officer and principal accounting officer) (filed herewith) | ||
| ***101.INS | XBRL Instance Document | ||
| ***101.SCH | XBRL Taxonomy Extension Schema Document | ||
| ***101.CAL | XBRL Taxonomy Extension Calculation Linkbase Document | ||
| ***101.DEF | XBRL Taxonomy Extension Linkbase Document | ||
| ***101.LAB | XBRL Taxonomy Extension Label Linkbase Document | ||
| ***101.PRE | XBRL Taxonomy Extension Presentation Linkbase Document | ||
| * | Management contract or compensation plan or arrangement identified pursuant to Items 15(a)(3) and 15(c) of Form 10-K. |
| ** | Attachments to the Purchase Agreement, identified on Exhibit 2.2, have been omitted as permitted by Item 601(b)(2) of Regulation S-K. UEI hereby undertakes to furnish supplementally to the Securities and Exchange Commission a copy of any omitted attachment upon request. |
| *** | XBRL (Extensible Business Reporting Language) information is furnished and not filed or a part of a registration statement or prospectus for purposes of Sections 11 or 12 of the Securities Act of 1933, is deemed not filed for purposes of Section 18 of the Securities Exchange Act of 1934, and otherwise is not subject to liability under these sections. |
84
87