
UNITED STATES
SECURITIES AND EXCHANGE COMMISSION
FORM 10–K
(Mark One)
x | | ANNUAL REPORT PURSUANT TO SECTION 13 OR 15(d) OF THE SECURITIES EXCHANGE ACT OF 1934 |
For the fiscal year ended May 31, 20042006
OR
¨ | | |
o | | TRANSITION REPORT PURSUANT TO SECTION 13 OR 15(d) OF THE SECURITIES EXCHANGE ACT OF 1934 |
For the transition period from to
Commission File Number 1-8399
WORTHINGTON INDUSTRIES, INC.
(Exact name of Registrant as specified in its Charter)
charter) | | | | |
| Ohio | | 31-1189815 |
| |
31-1189815 |
(State or Other Jurisdictionother jurisdiction of Incorporationincorporation or Organization)organization) | | | | (IRSI.R.S. Employer Identification No.) |
| | |
| 200 Old Wilson Bridge Road, Columbus, Ohio | | 43085 |
| |
43085 |
(Address of Principal Executive Offices)principal executive offices) | | | | (Zip Code) |
| | |
Registrant’s telephone number, including area code | | (614) 438-3210 |
| |
|
Securities Registered Pursuantregistered pursuant to Section 12(b) of the Act:
| | |
Title of Each Class | | Name of Each Exchange on Which Registered |
| |
|
| each class Common Shares, Without Par Value | | Name of each exchange on which registered New York Stock Exchange |
Securities Registered Pursuantregistered pursuant to Section 12(g) of the Act: None
Indicate by check mark if the Registrant is a well-known seasoned issuer, as defined in Rule 405 of the Securities Act.
YES x NO ¨
Indicate by check mark if the Registrant is not required to file reports pursuant to Section 13 or Section 15(d) of the Act.
YES ¨ NO x
Indicate by check mark whether the Registrant (1) has filed all reports required to be filed by Section 13 or 15(d) of the Securities Exchange Act of 1934 during the preceding 12 months (or for such shorter period that the Registrant was required to file such reports), and (2) has been subject to such filing requirements for the past 90 days.
YESx NOo¨
Indicate by check mark if disclosure of delinquent filers pursuant to Item 405 of Regulation S-K is not contained herein, and will not be contained, to the best of Registrant’s knowledge, in definitive proxy or information statements incorporated by reference in Part III of this Form 10-K or any amendment to this Form 10-K.
o¨
Indicate by check mark whether the Registrant is a large accelerated filer, an accelerated filer, or a non-accelerated filer. See definition of “accelerated filer and large accelerated filer” in Rule 12b-2 of the Exchange Act. (Check one):
Large accelerated filerx Accelerated filer¨ Non-accelerated filer¨
Indicate by check mark whether the Registrant is a shell company (as defined in Rule 12b-2 of the Exchange Act).
YES¨ NOx NOo
Based upon the closing price of the Common Shares on November 28, 2003, as reported on the New York Stock Exchange composite tape (as reported byThe Wall Street Journal), the aggregate market value of the Common Shares (the only common equity) of the Registrant held by non-affiliates of the Registrant, as of such datebased on the closing price on the New York Stock Exchange on November 30, 2005 was approximately $983,340,000.$1,757,447,872.
The number of Registrant’s Common Shares issued and outstanding as of August 5, 2004,1, 2006, was 87,309,123.88,807,354.
DOCUMENT INCORPORATED BY REFERENCE
Selected portions of the Registrant’s Proxy Statement to be furnished to shareholders of the Registrant in connection with the Annual Meeting of Shareholders to be held on September 30, 2004,27, 2006, are incorporated by reference into Part III of this Form 10-K to the extent provided herein.
SAFE HARBOR STATEMENT
Selected statements contained in this Annual Report onForm 10-K,, including, without limitation, in “PART I–Item 1.–Business” and “PART II–Item 7.–Management’s Discussion and Analysis of Financial Condition and Results of Operations”,Operations,” constitute “forward-looking statements” as that term is used in the Private Securities Litigation Reform Act of 1995. Such forward-looking statements are based, in whole or in part, on management’s beliefs, estimates, assumptions and currently available information and can often be identified by the words “will”, “may”, “designed to”, “outlook”, “believes”, “should”, “plans”, “expects”, “intends”, “estimates” and similar expressions.1995 (the “Act”). These forward-looking statements include, without limitation, statements relating to:
| | • | | future estimated or expected earnings, charges, working capital,performance, sales, operating results and earnings per share or the earnings impact of certain matters;share; |
|
| | • | | projected capacity and working capital needs; |
| • | | pricing trends for raw materials and finished goods; |
|
| | • | | anticipated capital expenditures and asset sales; |
|
| | • | | projected timing, results, costs, charges and expenditures related to asset transfers,acquisitions or to facility dispositions, shutdowns and consolidations; |
|
| | • | | new products and markets; |
|
| | • | | expectations for customer inventories, jobs and orders; |
| • | | expectations for the economy and markets; and |
|
| | • | | expected benefits from new initiatives, such as the Enterprise Resource Planning System; |
| • | | effects of judicial rulings; and |
| • | | other non-historical trends.matters. |
Because they are based on beliefs, estimates and assumptions, forward-looking statements are inherently subject to risks and uncertainties that could cause actual results to differ materially from those projected. Any number of factors could affect actual results, including, without limitation:
| | • | | product demand and pricing, pricing; |
| • | | changes in product mix and market acceptance of our products; |
|
| | • | | fluctuations in pricing, quality or availability of raw materials (particularly steel), supplies, transportation, utilities and other items required by operations; |
|
| | • | | effects of facility closures and the consolidation of operations; |
|
| | • | | the effect of consolidation within the steel and related industries; |
| • | | failure to maintain appropriate levels of inventories; |
| • | | the ability to realize price increases, cost savings and operational efficiencies on a timely basis; |
|
| | • | | the overall success of or our ability to integrate newly acquired businesses and achieve synergies therefrom;from newly-acquired businesses; |
|
| | • | | the timing of and changes to matters related to the segregation of the retained and sold assets of the Decatur, Alabama, facility; |
|
| • | | capacity levels and efficiencies within our facilities and within the industry as a whole; |
|
| | • | | financial difficulties (including bankruptcy filings) of customers, suppliers, joint venture partners and others with whom we do business; |
|
| | • | | the effect of national, regional and worldwide economic conditions generally and within our major product markets, including a prolonged or substantial economic downturn; |
|
| | • | | the effect of disruptions in the business of suppliers, customers, facilities and shipping operations due to adverse weather, on facility and shipping operations;casualty events, equipment breakdown, acts of war or terrorist activities or other causes; |
|
| | • | | changes in customer inventories, spending patterns, product choices, and supplier choices and choices; |
| • | | risks associated with doing business internationally, including economical,economic, political and social instability, and foreign currency exposure;exposures; |
|
| | • | | acts of war and terrorist activities; |
|
| • | | the ability to improve and maintain processes, and business practices and technologies to keep pace with the economic, competitive and technological environment; |
|
| | • | | Adverse claims experience with respect to worker’s compensation, products recall or liability, casualty events or other matters; |
| • | | deviation of actual results from estimates and/or assumptions used by us in the application of our significant accounting policies; |
|
| | • | | level of imports and import prices in our markets; |
|
| • | | the impact of judicial rulings and governmental regulations, both in the United States and abroad; and |
|
| | • | | other risks described from time to time in our filings with the United States Securities and Exchange Commission.Commission, including those described in “PART I – Item 1A. – Risk Factors” of this Annual Report on Form 10-K. |
Any forward-looking statements in this Annual Report on Form 10-K are based on current information as of the date of this Form 10-K, and we assume no obligation to correct or update any such statements in the future, except as required by applicable law.
ii
PART I
Item 1. –— Business
General Overview
Worthington Industries, Inc., an Ohio corporation (individually, the “Registrant” or “Worthington Industries” or, together with its subsidiaries, “Worthington”), is headquartered in Columbus, Ohio. Founded in 1955, Worthington is primarily a diversified metal processing company, focused on value-added steel processing and manufactured metal products, such as metal framing, pressure cylinders, automotive partpast-model service stampings and, through joint ventures, metal ceiling grid systems and laser weldedlaser-welded blanks.
Worthington currentlywas founded in 1955 and as of August 1, 2006, operates 4446 manufacturing facilities worldwide and holds equity positions in eightseven joint ventures, which operate an additional 1715 manufacturing facilities worldwide.
Worthington is headquartered at 200 Old Wilson Bridge Road, Columbus, Ohio 43085, telephone (614) 438-3210. The common shares of Worthington Industries maintains an Internet website at www.worthingtonindustries.com. (This uniform resource locator, or URL,are traded on the New York Stock Exchange under the symbol WOR.
Worthington made changes during the second quarter of the fiscal year ended May 31, 2006 (“fiscal 2006”) to the internal organizational and reporting structure, affecting the composition of its business segments. The Automotive Body Panels reporting segment, consisting of The Gerstenslager Company, which was previously combined with Steel Processing in the Processed Steel Products reportable segment, was moved to the “Other” category and the Processed Steel Products reportable segment was renamed Steel Processing. Dietrich Construction Group was formed and includes Dietrich Building Systems, which was previously included in the Metal Framing reportable segment, Dietrich Residential Construction, and a research and development project in China. Dietrich Construction Group is an inactive textual reference onlynow included in the Construction Services reporting segment, and is not intendedreported in the “Other” category. All segment financial information for the prior periods has been reclassified to incorporate Worthington Industries’ website intoreflect these changes.
Operations are currently reported in three principal reportable segments: Steel Processing, Metal Framing and Pressure Cylinders. All financial information included in this Annual Report on Form 10-K.) We make available, free10-K for periods prior to the second quarter of charge, on or through our website, our annual reports on Form 10-K, quarterly reports on Form 10-Q, current reports on Form 8-K, and amendmentsfiscal 2006 has been reclassified to those reports filed or furnished pursuant to Section 13(a) or 15(d)reflect the segment changes discussed in the immediately preceding paragraph. The Steel Processing segment consists of the Securities Exchange Act of 1934 (the “Exchange Act”), as soon as reasonably practicable after we electronically file such material with, or furnish it to, the Securities and Exchange Commission (the “SEC”).
We report our operations in three principal business segments: Processed Steel Products, Metal Framing and Pressure Cylinders. The Processed Steel Products segment includes The Worthington Steel Company business unit (“Worthington Steel”) and The Gerstenslager Company business unit (“Gerstenslager”). The Metal Framing segment is comprisedconsists of the Dietrich Industries, Inc.Metal Framing business unit (“Dietrich”). The Pressure Cylinders segment consists of the Worthington Cylinder Corporation business unit (“Worthington Cylinders”). The “Other” category includes the Automotive Body Panels, Construction Services and Steel Packaging operating segments and also includes income and expense items not allocated to the reportable segments.
Worthington holds equity positions in eightseven joint ventures, further identifieddiscussed below under the subheading “Joint Ventures”. Two of our“Joint Ventures.” One joint venture is consolidated while the remaining six joint ventures are consolidated into our consolidated financial statements which are included in “Item 8. – Financial Statements and Supplementary Data.” unconsolidated.
During fiscal 2006, the fiscal year ended May 31, 2004 (“fiscal 2004”), our Processed Steel Products,Processing, Metal Framing and Pressure Cylinders segments served over 1,200, 2,400approximately 1,050, 2,075 and 3,4502,325 customers, respectively, located primarily in the United States. Foreign sales account for less than 10% of consolidated net sales and are comprised primarily of sales to customers in Canada and Europe. No single customer accounts for over 10%5% of our consolidated net sales. Our reportable business segments offer different
Worthington Industries maintains an Internet web site at www.worthingtonindustries.com. This uniform resource locator, or URL, is an inactive textual reference only and is not intended to incorporate Worthington Industries’ web site into this Annual Report on Form 10-K. Annual reports on Form 10-K, quarterly reports on Form 10-Q, current reports on Form 8-K and amendments to those reports, filed or furnished pursuant to Section 13(a) or 15(d) of the Securities Exchange Act of 1934, as amended (the “Exchange Act”), are available free of charge, on or through the web site, as soon as reasonably practicable after such material is electronically filed with, or furnished to, the Securities and Exchange Commission (the “SEC”).
Recent Developments
On June 13, 2005, Worthington Industries announced that its board of directors had authorized the repurchase of up to 10.0 million of the outstanding common shares of Worthington Industries. The purchases may be made from time to time, on the open market or in private transactions, with consideration given to the market price of the common shares, the nature of other investment opportunities, cash flows from operations and general economic conditions. No repurchases of common shares pursuant to this authorization occurred during fiscal 2006.
On September 27, 2005, Dietrich entered into a joint development agreement with NOVA Chemicals Corporation to evaluate and commercialize novel construction products that combine the structural benefits of light-gauge steel framing with the thermal and moisture retardant properties of expandable polystyrene. On July 20, 2006, Worthington announced that Dietrich had formed a 50:50 joint venture with NOVA Chemicals Corporation that is intended to develop and manufacture durable, energy-saving composite construction products and servicessystems. The joint venture’s current focus is on developing cost-effective insulated metal framing panels intended to remove significant obstacles to using steel framing products for exterior walls in areas where interior/exterior temperature variations may cause condensation.
On September 29, 2005, Worthington Industries amended and restated its $435,000,000 long-term unsecured revolving credit facility. The amended and restated facility provides for an extension of the same customer base.revolving credit commitments to September 2010; replaces the leverage ratio (debt-to-EBITDA) financial covenant with an interest coverage ratio (EBITDA-to-interest expense) financial covenant; and reduces the facility fees payable. Borrowings under the amended and restated facility may be used to fund general corporate purposes including working capital, capital expenditures, acquisitions and dividends. The facility was unused at May 31, 2006.
On October 17, 2005, Worthington acquired the remaining 50% interest in Dietrich Residential Construction, LLC from its partner, Pacific Steel Construction, for $3,773,000 cash and debt assumption of $4,153,000. This acquisition provides panelizing capabilities and further opens the door to United States military housing and residential housing markets.
In November 2005, Dietrich launched the “UltraSTEEL™” drywall metal framing line in Florida. As of May 27, 2004, we signed31, 2006, the “UltraSTEEL™” product line had been introduced into markets in the Southeast and Northeast and machinery conversions were underway to make “UltraSTEEL™” products in the Midwest and Southwest. A license from Hadley Industries PLC (“Hadley”) grants Dietrich the exclusive rights to manufacture and sell metal framing using Hadley’s patented “UltraSTEEL™” technology in North America. In February 2006, Dietrich entered into an agreementexclusive sublicensing arrangement with Clark-Western, which will become the only other producer of “UltraSTEEL™” metal framing products for the North American market.
On November 30, 2005, Worthington acquired the remaining 40% interest in Dietrich Metal Framing Canada, Inc. from the minority shareholder, Encore Coils Holdings Ltd., for $3,003,000 cash.
On April 25, 2006, Worthington Steel sold its 50% equity interest in Acerex, S.A. de C.V., a joint venture operating a steel processing facility in Monterrey, Mexico, to sell our Decatur facility and its cold-rolling assets to Nucor Corporation (“Nucor”)partner Ternium, S.A. for $82.0 million cash while retaining the slitting and cut-to-length assets and net working capital. $44,604,000 cash.
Steel Processing
The transaction closed effective as of August 1, 2004. For further discussion on this matter, see “Item 7. – Management’s Discussion and Analysis of Financial Condition and Results of Operations.”
Processed Steel Products
Our Processed Steel ProductsProcessing reportable segment consists of two business units,the Worthington Steel and Gerstenslager.business unit. For fiscal 2004,2006, the fiscal year ended May 31, 20032005 (“fiscal 2003”2005”), and the fiscal year ended May 31, 20022004 (“fiscal 2002”2004”), the percentage of consolidated net sales generated by our Processedthe Steel ProductsProcessing segment was 57.7%51.3%, 60.5%58.8%, and 64.9%53.2%, respectively.
Both Worthington Steel and Gerstenslager areis one of America’s largest independent intermediate processors of flat-rolled steel. Worthington SteelIt occupies a niche in the steel industry by focusing on products requiring exact specifications. These products typically cannot be supplied as efficiently by steel mills or steel end-users. We believe that Worthington
The Steel is one of the largest independent flat-rolled steel processors in the United States. Gerstenslager is a leading independent supplier of automotive quality exterior body panels to the North American automotive original equipmentProcessing segment owns and past model service markets. Gerstenslager’s strength is its ability to handle a large number of past model service and current model production automotive and heavy-duty truck body parts.
1
Our Processed Steel Products segment operates 10eight manufacturing facilities, throughout the United Statesone each located in Alabama, Indiana, Kentucky, Maryland and oneMichigan, and three located in Ohio. The consolidated joint venture, Spartan Steel Coating, LLC (“Spartan”). We serve over 1,200, owns and operates a manufacturing facility in Michigan.
Worthington Steel serves approximately 1,050 customers from these facilities, principally in the automotive, construction, lawn and garden, hardware, furniture, office equipment, electrical control, tubing, leisure and recreation, appliance, farm implement,implements, HVAC, container, and aerospace markets. During fiscal 2004, noNo single customer represented greater than 10%8% of net sales for the segment.Steel Processing segment during fiscal 2006.
Worthington Steel buys coils of steel from major integrated steel mills and mini-mills and processes them to the precise type, thickness, length, width, shape, temper and surface quality required by customer specifications. Our computer-aidedComputer-aided processing capabilities include, among others:
| • | | pickling, a chemical process using an acidic solution to remove surface oxide which develops on hot-rolled steel; |
|
| • | | slitting, which cuts steel to specific widths; |
|
| • | | cold reduction, which achieves close tolerances of thickness and temper by rolling; |
|
| • | | hot-dipped galvanizing, which coats steel with zinc and zinc alloys through a hot-dipped process; |
|
| • | | hydrogen annealing, a thermal process that changes the hardness and certain metallurgical characteristics of steel; |
|
| • | | cutting-to-length, which cuts flattened steel to exact lengths; |
|
| • | | tension leveling, a method of applying pressure to achieve precise flatness tolerances for steel; |
|
| • | | edging, which conditions the edges of the steel by imparting round, smooth or knurled edges; |
|
| • | | CleanCoat™, a dry lubrication process; and |
|
| • | | configured blanking, by which steel is stamped into specific shapes. |
pickling, a chemical process using an acidic solution to remove surface oxide which develops on hot-rolled steel;
slitting, which cuts steel to specific widths;
cold reduction, which achieves close tolerances of thickness and temper by rolling;
hot-dipped galvanizing, which coats steel with zinc and zinc alloys through a hot-dipped process;
hydrogen annealing, a thermal process that changes the hardness and certain metallurgical characteristics of steel;
cutting-to-length, which cuts flattened steel to exact lengths;
tension leveling, a method of applying pressure to achieve precise flatness tolerances for steel;
edging, which conditions the edges of the steel by imparting round, smooth or knurled edges;
non-metallic coatings including dry lube, acrylic and paint; and
configured blanking, which stamps steel into specific shapes.
Worthington Steel also “toll processes”toll processes steel for steel mills, large end-users, service centers, and other processors. Toll processing is different from our typical steel processing because the mill, end-user, or end-userother party retains title to the steel and has the responsibility for selling the end product. Toll processing enhances Worthington’sWorthington Steel’s participation in the market for wide sheet steel and large standard orders, which is a market generally served by steel mills rather than by intermediate steel processors.
Gerstenslager stamps, assembles, primes and packages exterior automotive body parts and panels. We primarily own theThe steel used in our Gerstenslager operations but occasionally process consigned material, similar to toll processing. Gerstenslager processes a large number of past model service and current model production automotive and heavy-duty truck parts, managing over 3,000 finished good part numbers and over 25,000 die/fixture sets.
The Processed Steel Productsprocessing industry is fragmented and highly competitive. We compete withThere are many competitors, including other independent intermediate processors and, with respect to automotive stamping, captive processors owned by the automotive companies, independent tier-one suppliers of current model components and a number of smaller competitors. We competeprocessors. Competition is primarily on the basis of product quality, our ability to meet delivery requirements, and price. Our technicalTechnical service and support for material testing and customer specificcustomer-specific applications enhance the quality of our products. However, we have not quantified the extent to which our technical service capability has improved our competitive position. Seeproducts (See “Item 1. – Business – Technical Services.” We believe that ourServices”). However, the extent to which technical service capability has improved Worthington Steel’s competitive position has not been quantified. Worthington Steel’s ability to meet tight delivery schedules is, in part, based on the proximity of our facilities to customers, suppliers, and one another. Again, we have not quantified theThe extent to which plant location has impacted ourWorthington Steel’s competitive position. Our processedposition has not been quantified. Processed steel products are priced competitively, primarily based on market factors, including, among other things, the cost and availability of raw materials, transportation and shipping costs, and overall economic conditions in the United States and abroad.
2
On May 27, 2004, we entered into an agreement to sell our Decatur, Alabama, facility and its cold rolling assets to Nucor Corporation. This transaction closed on August 1, 2004. For further discussion on this matter, see “Item 7. – Management’s Discussion and Analysis of Financial Condition and Results of Operation”.
We use our “Worthington Steel” and “Gerstenslager” trade names in our Processed Steel Products segment, and we use the unregistered trademark “CleanCoat™” in connection with our dry lubrication process. We intend to continue the use of our intellectual property. The “CleanCoat™” trademark is important to our Processed Steel Products segment, but we do not consider it material.
Metal Framing
OurThe Metal Framing reportable segment, consistsconsisting of onethe Dietrich Metal Framing business unit, Dietrich, which designs and produces metal framing components and systems and related accessories for the commercial and residential construction markets within the United States.States and Canada. For fiscal 2004,2006, fiscal 20032005, and fiscal 2002,2004, the percentage of consolidated net sales generated by ourthe Metal Framing segment was 27.8%27.5%, 24.3%27.4%, and 17.5%27.4%, respectively.
Our Metal Framing products include steel studs and track, floor and wall system components, roof trusses and other metal framing accessories. Some of our specific products include “TradeReady®” Floor Systems, “Spazzer®” bars, “Clinch-On®”building product accessories, such as metal corner bead, lath, lath accessories, clips, fasteners and trimvinyl beads and “Ultra Span®trim.
In November 2005, Dietrich successfully launched its “UltraSTEEL™” trusses through our unconsolidated joint venture, Aegis Metal Framing, LLC (“Aegis”).drywall metal framing product line in Florida. The “UltraSTEEL™” product line is being readily accepted by architects, engineers and material specifiers for its performance capabilities and by contractors for its ease of use. As of May 31, 2006, “UltraSTEEL™” had also been introduced into additional markets in the Southeast and Northeast and machinery conversions were underway to make “UltraSTEEL™” products in the Midwest and Southwest for sales in those markets. In February 2006, Dietrich entered into an exclusive sublicensing agreement with Clark-Western, which will become the only other producer of “UltraSTEEL™” metal framing products for the North American market.
OurThe Metal Framing segment has 2723 operating facilities located throughout the United States. We believe that States: one each in Colorado, Georgia, Hawaii, Illinois, Kansas, Maryland, Massachusetts, New Jersey, South Carolina and Washington; two each in Arizona, California, Indiana, Ohio and Texas; and three in Florida. This segment also has three operating facilities in Canada: one each in British Columbia, Ontario and Quebec.
Dietrich is the largest national supplier of metal framing productsmanufacturer in the United States, supplying between 40% and supplies, supplying approximately halfAssumed to be a 1.25-1.3B market.45% of the metal framing products and accessories sold in the United States. We have over 2,400Dietrich is the second largest metal framing manufacturer in Canada with a market share of between 15% and 20%. Dietrich serves approximately 2,075 customers, primarily consisting of wholesale distributors, commercial and residential building contractors, and big box material retailers.mass merchandisers. During fiscal 2004,2006, Dietrich’s two largest customers represented 26%approximately 15% and 12%, respectively, of the net sales for the segment, while no other customer represented more than 4%5% of net sales for the segment.
The light gaugelight-gauge metal framing industry is very competitive. We competeDietrich competes with fiveseven large regional or national competitors and numerous small, more localized competitors. We competecompetitors, primarily on the basis of quality, service and price. Similar to our ProcessedAs is the case in the Steel ProductsProcessing segment, the proximity of our facilities to our customers and their project sites provides us with a service advantage and impacts our freight and shipping costs. OurThe products sold are transported almost exclusively by both common carrier. We have not quantified theand dedicated carriers. The extent to which facility location has impacted ourDietrich’s competitive position.position has not been quantified.
Dietrich uses numerous trademarks and patents in its business. Dietrich licenses from Hadley the registered trademarks “Spazzer®”, “TradeReady®“UltraSTEEL™” trademark and “Clinch-On®.the United States and Canadian patents to manufacture “UltraSTEEL™” metal framing and accessory products. The “Spazzer®” trademark is used in connection with wall component products that are the subject of twofour United States patents, fourone foreign patent, one pending United States patent applicationsapplication, and several pending foreign patent applications. The trademark “TradeReady®” is used in connection with floor systemfloor-system products that are the subject of twofour United States patents, threeseventeen foreign patents, threeone pending United States patent applicationsapplication, and five pending foreign patent applications. The “Clinch-On®” trademark is used east of the Rockies in connection with corner bead and metal trim products for gypsum wallboard that are subjectwallboard. Dietrich licenses the “SLP-TRK®” trademark as well as the patent to manufacture “SLP-TRK®” slotted track in the United States patents.from Brady Construction Innovations, Inc. Aegis Metal Framing, LLC, an unconsolidated joint venture, uses the “Ultra-Span®” registered trademark in connection with certain patents for proprietary roof trusses. We intendDietrich intends to continue to use and renew each of ourthese registered trademarks. Dietrich also has a number of other patents and trade names relating to specialized products. Although trademarks, trade names and patents are important to our Metal Framing segment, none is considered material.
Pressure Cylinders
OurThe Pressure Cylinders segment consists of onethe Worthington Cylinders business unit, Worthington Cylinders.unit. For fiscal 2004,2006, fiscal 2003,2005, and fiscal 2002,2004, the percentage of consolidated net sales generated by Worthington Cylinders was 13.8%15.9%, 14.5%13.3%, and 16.8%13.8%, respectively.
Worthington Cylinders operates sixeight manufacturing facilities,facilities: three in Ohio, one in Wisconsin, and one each in Austria, Canada, and Portugal. The segment also operates one consolidated joint venture, Worthington Cylinders a.s., in the Czech Republic.Republic, and Portugal.
3
OurThe Pressure Cylinders segment produces a diversified line of pressure cylinders, including low-pressure liquefied petroleum gas (“LPG”) and refrigerant gas cylinders and high-pressure and industrial/specialty gas cylinders. Our LPG cylinders are sold to manufacturers, distributors and/orand mass merchandisers and are used for gas barbecue grills, recreational vehicle equipment, residential heating systems, industrial forklifts, propane-fueled camping equipment, hand torches, and commercial/residential cooking (the latter, generally outside North America).
Refrigerant gas cylinders are sold primarily to major refrigerant gas producers and distributors and are used to hold refrigerant gases for commercial and residential air conditioning and refrigeration systems and for automotive air conditioning systems. High-pressure and industrial/specialty gas cylinders are sold primarily to gas producers and distributors as containers for gases used in: cutting and welding metals; breathing (medical, diving and firefighting); semiconductor production; beverage delivery; and compressed natural gas systems. Worthington Cylinders also produces recovery tanks for refrigerant gases, air reservoirs for truck and trailer original equipment manufacturers, and non-refillable cylinders for “Balloon Time®Time®” helium kits.kits which include non-refillable cylinders. While a large percentage of our cylinder sales are made to major accounts, Worthington Cylinders has over 3,450approximately 2,325 customers. During fiscal 2004, one2006, no single customer represented more than 9% of net sales for the segment, while no other single customer represented more than 6% of net sales for the segment.
Worthington Cylinders’ primaryCylinders produces low-pressure cylinder products are steel cylinders with refrigerant gas capacities of 15 to 1,000 lbs. and steel and aluminum cylinders with LPG capacities of 4-1/414.1 oz. to 420 lbs. In the United States and Canada, our high-pressure and low-pressure cylinders are manufactured in accordance with U.S. Department of Transportation and Transport Canada safety requirements, respectively. Outside the United States and Canada, we manufacture cylinders according to European Union specifications, as well as various other international requirements and standards. Low-pressure cylinders are produced by precision stamping, drawing, and welding and/or brazing component parts to customer specifications. They are then tested, painted and packaged, as required. Our high-pressureHigh-pressure steel cylinders are manufactured by several processes, including deep drawing, tube spinning and billet piercing. In the United States and Canada, high-pressure and low-pressure cylinders are primarily manufactured in accordance with U.S. Department of Transportation and Transport Canada specifications. Outside the United States and Canada, cylinders are manufactured according to European norm specifications, as well as various other international standards.
In the United States and Canada, Worthington Cylinders has one principal domestic competitor in the low-pressure non-refillable refrigerant market, one principal domestic competitor in the low-pressure LPG cylinder market, and two principal domestic competitors andin the high-pressure cylinder market. There are also several smaller foreign competitors in its major low-pressure cylinder markets; however we believethese markets. Worthington Cylinders believes that we haveit has the largest domestic market share.share in both low-pressure cylinder markets. In ourthe European high-pressure cylinder market, we compete against two principal domestic competitorsthere are several competitors. Worthington Cylinders believes that it is a leading producer in both the high-pressure cylinder and nine European competitors. We believe that we have the leading market share of the European industrial gaslow-pressure non-refillable cylinder market and the European non-refillable refrigerant cylinder market.markets in Europe. As with ourWorthington’s other segments, we competecompetition is on the basis of service, price and quality.
OurThe Pressure Cylinders segment uses the trade name “Worthington Cylinders” to conduct business and the registered trademark “Balloon Time®Time®” to market our low-pressure helium balloon kits. We intendkits and intends to continue to use and renew ourthis registered trademark. We also hold domestic and foreign patents applicable to the non-refillable valve used for our refrigerant cylinders. This intellectual property is important to ourthe Pressure Cylinders segment but is not considered material.
Other
The “Other” category consists of reporting segments that do not meet the materiality tests for purposes of separate disclosure and other corporate related entities. These reporting segments are Automotive Body Panels, Construction Services and Steel Packaging, which includes the Worthington Steelpac business unit (“Steelpac”).
The Automotive Body Panels reporting segment, consisting of the Gerstenslager business unit, provides stamping, blanking, assembly, painting, packaging, die management, warehousing, distribution management and other services to customers, primarily in the automotive industry. Gerstenslager is a major supplier to the automotive past-model market and manages more than 3,000 finished good part numbers and more than 11,000 stamping dies/fixture sets for the past- and current-model year automotive and truck manufacturers, both domestic and transplant.
The Construction Services reporting segment consists of Dietrich Building Systems, which designs and builds mid-rise light-gauge steel framed commercial structures and multi-family housing units; Dietrich Residential Construction, which is involved in the supply and construction of metal framing products for, and in the framing of, single family housing, with a focus on military; and a mid-rise light-gauge steel framed construction project in China entered into primarily for research and development purposes.
Steel Packaging consists of Steelpac, which is an ISO-9001: 2000 certified manufacturer of engineered, recyclable steel shipping solutions, designs and manufactures reusable custom crates, racks, and pallets made of steel for supporting, protecting and handling products throughout the shipping process for industries such as automotive, lawn and garden and recreational vehicles.
Segment Financial Data
Financial information for ourthe reportable segments is provided in “Item 8. – Financial Statements and Supplementary Data – Notes to Consolidated Financial Statements – Note H – Industry Segment Data.”
Financial Information About Geographic Areas
Foreign operations and exports represent less than 10% of our production and consolidated net sales. Summary information about our foreign operations is set forth in “Item 8. – Financial Statements and Supplementary Data – Notes to Consolidated Financial Statements – Note A – Summary of Significant Accounting Policies – Risks and Uncertainties.” For fiscal 20042006 and fiscal 2003, we2005, Worthington had operations in North America and Europe, andwhile prior years also included operations in South America. Net sales by geographic region are provided in “Item 8. – Financial Statements and Supplementary Data – Notes to Consolidated Financial Statements – Note H – Industry Segment Data.”
4
Suppliers
In fiscal 2004, we2006, Worthington purchased over 3.5approximately four million tons of steel for use as raw material for our Processedon a consolidated basis. Steel Products, Pressure Cylinders and Metal Framing segments. We purchase steelis purchased in large quantities at regular intervals from major primary producers, both domestic and foreign. In our Processedthe Steel ProductsProcessing segment, westeel is primarily purchasepurchased and process steelprocessed based on specific customer orders and do not typically purchase steel for inventory. Ourorders. The Metal Framing and Pressure Cylinders segments purchase steel to meet our production schedules. Our rawRaw materials are generally purchased in the open market on a negotiated spot marketspot-market basis at prevailing market prices, weprices. Supply contracts are also enterentered into, long-term contracts, some of which have fixed pricing. During fiscal 2004, our2006, major suppliers of steel were, in alphabetical order: Gallatin Steel Company; International Steel Group; Ispat Inland, Inc.;Mittal Steel; North Star BlueScope Steel LLC; Nucor Corporation; SeverstalSeverStal North America, Inc.; US Steel Corporation; and WCI Steel, Inc. Alcoa, Inc. was ourthe primary aluminum supplier for ourthe Pressure Cylinders segment in fiscal 2004. We believe that our2006. Worthington believes its supplier relationships are good.
Technical Services
We employWorthington employs a staff of engineers and other technical personnel and maintain fully equippedmaintains fully-equipped modern laboratories to support our operations. These facilities enable us to verify, analyzeverification, analysis and documentdocumentation of the physical, chemical, metallurgical, and mechanical properties of our raw materials and products. Technical service personnel also work in conjunction with ourthe sales force to determine the types of flat-rolled steel required for our customers’ particularcustomer needs. Additionally, technical service personnel design and engineer metal framing structures and provide sealed shop drawings to the building construction markets. To provide these services, we maintainWorthington maintains a continuing program of developmental engineering with respect to theproduct characteristics and performance of our products under varying conditions. Laboratory facilities also perform metallurgical and chemical testing as dictated by the regulations of the U.S. Department of Transportation, Transport Canada, and other associated agencies, along with International Organization for Standardization (ISO), and customer requirements. All design work complies with current local and national building code requirements. Our ICBOIAS (International Conference of Building Officials)Accreditations Service, Incorporated) accredited product-testing laboratory supports these design efforts.
Seasonality
Our financial results are generally lower in the third quarter of our fiscal year, primarily due to reduced activity in the building and construction industry as a result of the weather, as well as customer plant shutdowns in the automotive industry due to holidays.
Employees
As of May 31, 2004, we2006, Worthington employed approximately 6,7008,200 employees in ourits operations, excluding the unconsolidated joint ventures, approximately 11% of whom were covered by collective bargaining agreements. We believe that we haveagreements, including those at the Hammond facility as discussed below. Worthington believes it has good relationships with our employees.its employees in general, including those covered by collective bargaining agreements. However, the union employees at the Dietrich facility in Hammond, Indiana have been on strike since May 5, 2006, as the parties have not reached
agreement on a new contract covering the facility. The Hammond facility has continued to operate during this time period at approximately 90% of pre-strike production levels.
Joint Ventures
As part of oura strategy to selectively develop new products, markets, and technological capabilities and to expand ouran international presence, while mitigating the risks and costs associated with those activities, we participateWorthington participates in twoone consolidated and six unconsolidated joint ventures.
Consolidated
| • | | Spartan Steel Coating, LLC, (“Spartan”) a 52%-owned consolidated joint venture with Severstal North America, Inc., operates a cold-rolled, hot-dipped galvanizing facility in Monroe, Michigan. |
|
| • | | Worthington Cylinders a.s., a 51%-owned consolidated joint venture with a local Czech Republic entrepreneur, operates a pressure cylinder manufacturing facility in Hustopece, Czech Republic. |
Unconsolidated
Aegis Metal Framing, LLC, a 60%-owned joint venture with MiTek Industries, Inc., headquartered in Chesterfield, Missouri, offers design, estimating and management software, a full line of metal framing products, and integrated professional engineering services to light-gauge metal component manufacturers and contractors.
Unconsolidated
| • | | Acerex, S.A. de C.V. (“Acerex”), a 50%-owned joint venture with Hylsa S.A. de C.V., operates a steel processing facility in Monterrey, Mexico. |
|
| • | | Aegis Metal Framing, LLC, a 60%-owned joint venture with MiTek Industries, Inc., headquartered in Chesterfield, Missouri, offers light gauge metal component manufacturers and contractors design, estimating and management software, a full line of metal framing products and integrated professional engineering services. |
5Dietrich/NOVA, LLC, a 50%-owned joint venture with NOVA Chemicals Corporation, evaluates, develops, tests, manufactures, sells and otherwise commercializes construction products which combine or use in combination light-gauge steel framing products and styrenic and copolymer resin products.
| • | | TWB Company, LLC (“TWB”), a 50%-owned joint venture with ThyssenKrupp Steel North America, Inc., produces laser weldedTWB Company, LLC (“TWB”), a 50%-owned joint venture with ThyssenKrupp Steel North America, Inc., produces laser-welded blanks for use in the automotive industry for products such as inner-door panels. TWB operates facilities in Monroe, Michigan; Columbus, Indiana; and Saltillo and Hermosillo, Mexico. |
|
| • | | Worthington Armstrong Venture (“WAVE”), a 50%-owned joint venture with Armstrong World Industries, Inc., is one of the three leading global manufacturers of suspended ceiling systems for concealed and lay-in panel ceilings. WAVE operates facilities in Sparrows Point, Maryland; Benton Harbor, Michigan; North Las Vegas, Nevada; Malvern, Pennsylvania; Shanghai, China; Team Valley, United Kingdom; Valenciennes, France; and Madrid, Spain. |
|
| • | | Worthington Specialty Processing (“WSP”), a 50%-owned general partnership with U.S. Steel Corporation (“U.S. Steel”) in Jackson, Michigan, operates primarily as a toll processor for U.S. Steel. |
|
| • | | Viking & Worthington Steel Enterprise, LLC (“VWS”), a 49%-owned joint venture with Bainbridge Steel, LLC (“Bainbridge”), an affiliate of Viking Industries, LLC, operates a steel processing facility in Valley City, Ohio, and is a qualified minority business enterprise. |
Viking & Worthington Steel Enterprise, LLC, a 49%-owned joint venture with Bainbridge Steel, LLC, an affiliate of Viking Industries, LLC, operates a steel processing facility in Valley City, Ohio, and is a qualified minority business enterprise.
Worthington Armstrong Venture (“WAVE”), a 50%-owned joint venture with Armstrong World Industries, Inc., is one of the three leading global manufacturers of suspended ceiling grid systems for concealed and lay-in panel ceilings. WAVE operates facilities in Aberdeen, Maryland; Benton Harbor, Michigan; North Las Vegas, Nevada; Shanghai, China; Team Valley, United Kingdom; Valenciennes, France; and Madrid, Spain.
Worthington Specialty Processing, a 50%-owned joint venture with U.S. Steel Corporation (“U.S. Steel”) in Jackson, Michigan, operates primarily as a toll processor for U.S. Steel.
See “Item 8. – Financial Statements and Supplementary Data – Notes to Consolidated Financial Statements – Note J – Investments in Unconsolidated Affiliates” for further information about Worthington’s participation in unconsolidated joint ventures.
Environmental Regulation
OurWorthington’s manufacturing facilities, generally in common with those of similar industries making similar products, are subject to many federal, state and local requirements relating to the protection of the environment. WeWorthington continually examineexamines ways to reduce emissions and waste and to decrease costs related to environmental compliance. We do not anticipate thatThe cost of compliance or capital expenditures for environmental control facilities required to meet environmental requirements willare not anticipated to be material when compared with our overall costs and capital expenditures and, accordingly, willare not anticipated to have a material effect on our financial position, results of operations or cash flows, or the competitive position of the Company.
Item 1A. — Risk Factors
Future results and the market price for Worthington Industries’ common shares are subject to numerous risks, many of which are driven by factors that cannot be controlled or predicted. The following discussion, as well as other sections of this Annual Report on Form 10-K, including “Item 7. – Management’s Discussion and Analysis of Financial Condition and Results of Operations,” describe certain business risks. Consideration should be given to the risk factors described below as well as those in the Safe Harbor Statement at the beginning of this Form 10-K, in conjunction with reviewing the forward-looking statements and other information contained in this Form 10-K.
Raw Material Prices
Our future operating results may be affected by fluctuations in raw material prices.Our principal raw material is flat-rolled steel, which we purchase from multiple primary steel producers. The steel industry as a whole is very cyclical, and at times availability and pricing can be volatile due to a number of factors beyond our control. These factors include general economic conditions, domestic and worldwide demand, curtailed production at major mills due to factors such as equipment breakdowns, repairs or catastrophic events, labor costs or problems, competition, import duties, tariffs, energy costs, availability and cost of steel inputs (e.g. ore, scrap, coke, energy, etc.), currency exchange rates and those other factors described under “Raw Material Availability.” This volatility can significantly affect our steel costs. In an environment of increasing prices for steel and other raw materials, competitive conditions may impact how much of the price increases we can pass on to our customers and to the extent we are unable to pass on future price increases in our raw materials to our customers, our financial results could be adversely affected. Also, if steel prices in general decrease, competitive conditions may impact how quickly we must reduce our prices to our customers and we could be forced to use higher-priced raw materials to complete orders for which the sales prices have decreased.
Raw Material Availability
The costs of manufacturing our products and the ability to supply our customers could be negatively impacted if we experience interruptions in deliveries of needed raw materials or supplies.If for any reason our supply of flat-rolled steel or other key raw materials, such as aluminum and zinc, is curtailed or we are otherwise unable to obtain the quantities we need at competitive prices, our business could suffer and our financial results could be adversely affected. Such interruptions might result from a number of factors including events such as a shortage of capacity in the supplier base or of the raw materials, energy or the inputs needed to make steel or other supplies, financial difficulties of suppliers, significant events affecting their facilities, significant weather events, those factors listed under “Raw Material Prices” or other factors beyond our control. Further, the number of suppliers has decreased in recent years due to industry consolidation and the financial difficulties of certain suppliers, and consolidation may continue. Accordingly, if delivery from a major supplier is disrupted, it may be more difficult to obtain an alternative supply than in the past.
Inventories
Our business could be harmed if we fail to maintain proper inventory levels.We are required to maintain substantial inventories to accommodate the needs of our customers, including in many cases, short lead times and just-in-time delivery requirements. Although we typically have customer orders in hand prior to placement of our raw material orders for Steel Processing, we anticipate and forecast customer demand for all business segments. We purchase raw materials on a regular basis in an effort to maintain our inventory at levels that we believe are sufficient to satisfy the anticipated needs of our customers based upon orders, customers volume expectations, historic buying practices and market conditions. Inventory levels in excess of customer demand may result in the use of higher-priced inventory to fill orders reflecting lower sales prices, if steel prices have significantly decreased. These events could adversely affect our financial results. Conversely, if we underestimate demand for our products or if our suppliers fail to supply quality products in a timely manner, we may experience inventory shortages. Inventory shortages might result in unfilled orders, negatively impact customer relationships, and result in lost revenues, any of which could harm our business and adversely affect our financial results.
Economic or Industry Downturns
Downturns or weakness in the economy in general or in key industries, such as commercial construction or automotive, may adversely affect our customers, which may cause the demand for our products and services to decline and adversely affect our financial results.Many of our customers are in industries and businesses that are cyclical in nature and affected by changes in general economic conditions or conditions specific to their respective markets, such as the commercial construction and automotive industries. Product demand in our customer’s end markets is based on numerous factors such as interest rates, general economic conditions, consumer confidence, and other factors beyond our control. Downturns in demand from the commercial construction industry, the automotive industry or any of the other industries we serve, or a decrease in the margins that we can realize from sales of our products to customers in any of these industries, could adversely affect our financial results.
Reduced commercial construction activity, especially office building, could negatively impact our financial results. The commercial construction market is a key end market with approximately 41% of our net sales going to that market in fiscal 2006. If commercial construction activity in the United States, in general, or by one or more of our major customers, in particular, were to be reduced significantly, it could negatively affect our sales and financial results.
Reduced automotive/truck production and the financial difficulties of customers in this market could negatively impact our financial results. The automotive and truck market remains a key customer group with approximately 33% of our net sales derived from that market in fiscal 2006. Total domestic automotive production in fiscal 2006 was at a relatively high level on an historical basis. If domestic automotive production, in general, or by one or more of our major domestic customers, in particular, were to be reduced significantly, it could negatively affect our sales and financial results.
The financial difficulties and internal strategies of customers could adversely affect us.A portion of our business is highly dependent on automotive manufacturers, many of which have publicly announced plans to reduce production levels and eliminate excess manufacturing capacity including plans to eliminate jobs and reduce costs. The financial difficulties of certain customers and the efforts under way by our customers to improve their overall financial condition could result in numerous changes that are beyond our control, including additional unannounced customer plant closings, decreased production, changes in product mix or distribution patterns, volume reductions, labor disruptions, changes or disruptions in our accounts receivable, mandatory reductions or other unfavorable changes in our pricing, terms or service conditions or market share losses, as well as other changes we may not accurately anticipate. These events could adversely impact our financial results.
The loss of significant volume from key customers could adversely affect us.In fiscal 2006, our largest customer accounted for approximately 5% of our gross sales, and our ten largest customers accounted for approximately 25% of our gross sales. A significant loss of or decrease in business from customers could have an adverse effect on our sales and financial results if we cannot obtain replacement business. Also, due to consolidation in the industries we serve, including the commercial construction, automotive and retail industries, our gross sales may be increasingly sensitive to deterioration in the financial condition of, or other adverse developments with respect to, one or more of our top customers.
Competition
Our business is highly competitive, and increased competition could negatively impact our financial results. Generally, the markets in which we conduct business are highly competitive. Competition for most of our products is primarily on the basis of product quality, ability to meet delivery requirements, and price. Increased competition could cause us to lose market share, increase expenditures, lower our margins or offer additional services at a higher cost to us, which could adversely impact our financial results.
Material Substitution
In certain applications, steel competes with other materials, such as aluminum (particularly in the automobile industry), cement and wood (particularly in the construction industry), composites, glass and plastic.Prices of all of these materials fluctuate widely and differences between them and steel prices may adversely affect
demand for our products and/or encourage substitution, which could adversely affect prices and demand for steel products.
Freight and Energy
The availability and cost of freight and energy, such as electricity, natural gas, and diesel fuel, is important in the manufacture and transport of our products.Our operating costs increase when energy costs rise. During periods of increasing freight and energy costs, we might not be able to fully recover our operating cost increases through price increases without reducing demand for our products. Our financial results could be adversely affected if we are unable to pass all of the increases on to our customers or if we are unable to obtain the necessary freight and energy.
Information Systems
We are subject to information system security risks and systems integration issues that could disrupt our internal operations.We are dependent upon information technology for the distribution of information internally and also to our customers and suppliers. This information technology is subject to damage or interruption from a variety of sources, including but not limited to computer viruses, security breaches and defects in design. There also could be system or network disruptions if new or upgraded business management systems are defective or are not installed properly. We are currently in the process of implementing a new software-based enterprise resource planning system (“ERP”). For more information related to the new ERP, see “Part II – Item 9A. – Controls and Procedures – New ERP System.” Various measures have been implemented to manage our risks related to information system and network disruptions, but a system failure or failure to implement new systems properly could negatively impact our operations and financial results.
Business Disruptions
Disruptions to our business or the business of our customers or suppliers, could adversely impact our operations and financial results.Business disruptions, including increased costs for or interruptions in the supply of energy or raw materials, resulting from severe weather events such as hurricanes, floods, blizzards, from casualty events, such as fires or material equipment breakdown, from acts of terrorism, or from other events such as required maintenance shutdowns, can cause interruptions to our businesses as well as the operations of our customers and suppliers. Such interruptions can have an adverse effect on our operations and financial results.
Foreign
Economic, political and other risks associated with foreign operations could adversely affect our international financial results.Although the majority of our business activity takes place in the United States, we derive a portion of our revenues and earnings from operations in foreign countries, and are subject to risks associated with doing business internationally. Our sales originating outside the United States represented approximately 10% of our consolidated net sales in fiscal 2006. We have wholly-owned facilities in Austria, Canada, the Czech Republic, and Portugal and joint venture facilities in China, France, Mexico, Spain and the United Kingdom. The risks of doing business in foreign countries include the potential for adverse changes in the local political climate, in diplomatic relations between foreign countries and the United States or competitive position.in government policies, laws or regulations, terrorist activity that may cause social disruption, logistical and communications challenges, costs of complying with a variety of laws and regulations, difficulty in staffing and managing geographically diverse operations, deterioration of foreign economic conditions, currency rate fluctuations, foreign exchange restrictions, differing local business practices and cultural considerations, restrictions on imports and exports or sources of supply and changes in duties or taxes. We believe that our business activities outside of the United States involve a higher degree of risk than our domestic activities.Acquisitions
We may not be able to manage and integrate future acquisitions successfully.Some of our growth has been through acquisitions. We continue to seek additional businesses to acquire in the future. There are no assurances, however, that any acquisition opportunities will arise or if they do, that they will be consummated, or that any
needed additional financing will be available on satisfactory terms when required. In addition, acquisitions involve risks that the businesses acquired will not perform in accordance with expectations, that business judgments concerning the value, strengths and weaknesses of businesses acquired will prove incorrect, that the acquired businesses may not be integrated successfully and that the acquisitions may strain our management resources.
Accounting & Tax Estimates
We are required to make accounting and tax-related estimates and judgments in preparing our consolidated financial statements. In preparing our consolidated financial statements in accordance with accounting principles generally accepted in the United States, we make certain estimates and assumptions that affect the accounting for and recognition of assets, liabilities, revenues and expenses. These estimates and assumptions must be made because certain information that is used in the preparation of our consolidated financial statements is dependent on future events, cannot be calculated with a high degree of precision from data available or is not capable of being readily calculated based on generally accepted methodologies. In some cases, these estimates are particularly difficult to determine and we must exercise significant judgment. The estimates and the assumptions having the greatest amount of uncertainty, subjectivity and complexity are related to our accounting for bad debts, returns and allowances, self-insurance, derivatives, deferred income taxes, and asset impairments. Actual results could differ materially from the estimates and assumptions that we use, which could have a material adverse effect on our financial condition and results of operations.
Claims and Insurance
Adverse claims experience, to the extent not covered by insurance, may have an adverse effect on our financial results. We self-insure a significant portion of our potential liability for workers’ compensation costs, product liability claims and recall exposure, general liability claims, employee medical claims and casualty risks. In order to reduce risk and better manage our overall loss exposure, we purchase stop-loss or other insurance from licensed insurance carriers that covers most claims in excess of the deductible or retained amounts. We maintain an accrual for the estimated cost to resolve open claims as well as an estimate of the cost of claims that have been incurred but not reported. The occurrence of a significant claims, losses on recalls, our failure to adequately reserve for such claims, a significant cost increase to maintain our insurance, or the failure of our insurance provider to perform, could have an adverse impact on our financial results.
Principal Shareholder
Our principal shareholder may have the ability to exert significant influence in matters requiring a shareholder vote and could delay, deter or prevent a change in control of Worthington Industries.Pursuant to our charter documents, certain matters such as those in which a person would attempt to acquire or take control of the Company, must be approved by the vote of 75% of Worthington Industries’ outstanding voting power. Approximately 15.9% of our outstanding common shares may be voted by John H. McConnell, our Founder. As a result of his voting power, John H. McConnell may have the ability to exert significant influence in these matters and other proposals which our shareholders vote upon.
Item 1B. — Unresolved Staff Comments
Worthington Industries has no unresolved SEC staff comments.
Item 2. –— Properties
General
In October 2003, we moved ourThe principal corporate offices, as well as the corporate offices for Worthington Cylinders and Worthington Steel, intoare located in a leased three-story office building in Columbus, Ohio. The prior corporate office space on Dearborn Drive now accommodates our Information Technology and Training Departments. As of May 31, 2004, we2006, Worthington owned or leased a total of approximately 10,250,0009,200,000 square feet of space for our operations, of which approximately 9,700,0008,800,000 square feet is devoted to manufacturing, product distribution and sales offices. Our majorMajor leases contain renewal options for periods of up to ten years. For information concerning our rental obligations, see the discussion of contractual obligations under “Item
“Item 7. – Management’s Discussion and Analysis of Financial ConditionsCondition and Results of Operations – Contractual Cash Obligations and Other Commercial Commitments” as well as “Item 8. – Financial Statements and Supplementary Data – Notes to Consolidated Financial Statements – Note L – Operating Leases.” We believe that our distributionDistribution and office facilities are well maintained, are suitable and provide adequate space for our operations.operations and are well maintained and suitable.
Excluding our unconsolidated joint ventures, we have 44Worthington operates 46 manufacturing facilities and two warehouses. All of ourThe facilities are generally well maintained and in good operating condition, and we believe they are believed to be sufficient to meet our current needs.
Processed Steel ProductsProcessing
The Processed Steel ProductsProcessing reportable segment operates 10eight manufacturing facilities, allseven of which are owned.owned and one of which is leased. These facilities are located in Alabama, Indiana, Kentucky, Maryland, Michigan and Ohio (5)(3). This segment also
6
maintains a warehouse in Columbus, Ohio. ThisIn addition, the segment also includes Spartan, oura consolidated joint venture which owns and operates a manufacturing facility in Michigan.
Metal Framing
The Metal Framing segment operates 27 facilities. These26 manufacturing facilities: 23 in the United States and three in Canada. In the United States, these facilities are located in Arizona (2), California (2), Colorado, Florida (4)(3), Georgia, (2), Hawaii, Illinois, Indiana (3)(2), Kansas, Maryland, Massachusetts, New Jersey, Ohio (3)(2), South Carolina, Texas (2), and Washington. The facilities in Canada are located in British Columbia, Ontario and Quebec. Of these facilities, 1312 are leased and 14 are owned. This segment also leases administrative offices in Pittsburgh and Blairsville, Pennsylvania.
Pressure Cylinders
The Pressure Cylinders segment operates six fully-owned,eight manufacturing facilities. TheseThe manufacturing facilities are located in Ohio (3), Austria, Canada, and Portugal. This segment alsothe Czech Republic are all owned, and the manufacturing facilities located in Wisconsin and Portugal are leased.
Other
Steelpac operates an owned,one leased manufacturing facility located in Pennsylvania. Gerstenslager owns and operates two manufacturing facilities, both located in Ohio. Construction Services has administrative offices in Ohio, Tennessee and China.
Joint Ventures
The Spartan consolidated joint venture facility in the Czech Republicowns and leases aoperates one manufacturing facility in Portugal.
Joint Ventures
OurMichigan which is included in the Steel Processing segment. The unconsolidated joint ventures operate 1714 manufacturing facilities, including those mentioned above. These facilities are located in Ohio, Indiana, Maryland, Michigan (4)(3), Missouri, Nevada and PennsylvaniaOhio, domestically, and in China, the Czech Republic, France, Mexico (2), Spain, and the United Kingdom. Ten of these facilities are leased, and seven are owned, three of which are subject to mortgages in favor of the joint venture’s lender. See “Item 1. – Business – Joint Ventures.”
Kingdom, internationally.
Item 3. –— Legal Proceedings
Various legal actions, which generally have arisen in the ordinary course of business, are pending against Worthington. None of this pending litigation, individually or collectively, is expected to have a material adverse effect on Worthington.
our financial position, results of operation or cash flows.
Item 4.– — Submission of Matters to a Vote of Security Holders
None.None
7
Supplemental Item. –— Executive Officers of the RegistrantRegistrant.
The following table lists the names, positions held and ages of the Registrant’s executive officers as of May 31, 2004:
| | | | | | | | | | | |
| | | | | | | | | Present Office |
Name
| | Age
| | Position(s) with the Registrant
| | Held Since
|
| John P. McConnell | | | 50 | | | Chairman of the Board and Chief Executive Officer | | | 1996 | |
| John S. Christie | | | 54 | | | President and Chief Financial Officer | | | 2004 | |
| Dale T. Brinkman | | | 51 | | | Vice President-Administration, General Counsel and Secretary | | | 2000 | |
| Joe W. Harden | | | 54 | | | President, The Worthington Steel Company | | | 2003 | |
| Edmund L. Ponko, Jr. | | | 46 | | | President, Dietrich Industries, Inc. | | | 2001 | |
| Ralph V. Roberts | | | 57 | | | Senior Vice President-Marketing | | | 2001 | |
| George P. Stoe | | | 58 | | | President, Worthington Cylinder Corporation | | | 2003 | |
| Virgil L. Winland | | | 56 | | | Senior Vice President-Manufacturing | | | 2001 | |
| Richard G. Welch | | | 46 | | | Controller | | | 2000 | |
| Randal I. Rombeiro | | | 36 | | | Treasurer | | | 2002 | |
| | | | | | |
Name | | Age | | Position(s) with the Registrant | | Present Office Held Since |
John P. McConnell | | 52 | | Chairman of the Board and Chief Executive Officer | | 1996 |
| | | |
John S. Christie | | 56 | | President and Chief Financial Officer | | 2004 |
| | | |
Dale T. Brinkman | | 53 | | Vice President-Administration, General Counsel and Secretary | | 2000 |
| | | |
Harry A. Goussetis | | 52 | | President, Worthington Cylinder Corporation | | 2006 |
| | | |
Joe W. Harden | | 56 | | President, The Worthington Steel Company | | 2003 |
| | | |
Lester V. Hess | | 51 | | Treasurer | | 2006 |
| | | |
Edmund L. Ponko, Jr. | | 48 | | President, Dietrich Industries, Inc. | | 2001 |
| | | |
Ralph V. Roberts | | 59 | | Senior Vice President-Marketing | | 2001 |
| | | |
George P. Stoe | | 60 | | Executive Vice President and Chief Operating Officer | | 2006 |
| | | |
Richard G. Welch | | 48 | | Controller | | 2000 |
| | | |
Virgil L. Winland | | 58 | | Senior Vice President-Manufacturing | | 2001 |
John P. McConnell has served as Worthington Industries’ Chief Executive Officer since June 1993, as a director of Worthington Industries continuously since 1990, and as Chairman of the Board of Worthington Industries since September 1996. Mr. McConnell also serves as the Chairman of the Executive Committee of Worthington Industries’ Board of Directors. Mr. McConnell has served in various positions with Worthington Industries since 1975.
John S. Christie has served as President Chief Operating Officer and as a director of Worthington Industries continuously since June 1999. He became interim Chief Financial Officer of Worthington Industries in September 2003 and President and Chief Financial Officer in January 2004. He also served as Chief Operating Officer of Worthington Industries from June 1999 until September 2003.
Dale T. Brinkman has served as Worthington Industries’ Vice President-Administration since 1998 and General Counsel of Worthington Industries since 1998.1982. He has also been Secretary of Worthington Industries since 2000 and served as Assistant Secretary of Worthington Industries from 1982 to 2000.
Harry A. Goussetis has served as President of Worthington Cylinder Corporation since December 2005. He served as Vice President Human Resources for Worthington Industries from January 2001 to December 2005, and held various other positions with Worthington Industries from November 1983 to January 2001.
Joe W. Harden has served as President of The Worthington Steel Company since February 2003. From February 1999 through February 2003, Mr. Harden served as President of Buckeye Steel Castings Company in Columbus, Ohio, which filed a voluntary petition under the Federal Bankruptcy Act in December 2002.
Lester V. Hess has served Worthington Industries as Treasurer since February 2006. Prior thereto he served Worthington Industries as Assistant Treasurer from November 2003 to February 2006; and as Director of Treasury from August 2002 to November 2003. Prior to August 2002, Mr. Hess served in various accounting and finance positions with MeadWestvaco Corporation (formerly, The Mead Corporation), a $6 billion global packaging company, for more than five years.
Edmund L. Ponko, Jr. has served as President of Dietrich Industries, Inc. since June 2001. From 1981 through June 2001, hePrior thereto, Mr. Ponko served Dietrich Industries, Inc. in various positions.as Executive Vice President from 1998 to 2001, as marketing manager from 1987 to 1998, and as a sales representative from 1981 to 1987.
Ralph V. Roberts has served as Senior Vice President-Marketing of Worthington Industries since January 2001. From June 1998 through January 2001, he served as President of The Worthington Steel Company. Prior to that time, Mr. Roberts served Worthington Industries since 1973 in various positions, including Vice President-Corporate Development and President of ourthe WAVE joint venture.
George P. Stoe has served as Executive Vice President and Chief Operating Officer of Worthington Industries since December 2005 and as President of Worthington Cylinder Corporation sincefrom January 2003.2003 to December 2005. Mr. Stoe served as President of Zinc Corporation of America, the nation’s largest zinc producer, located in Monaca, Pennsylvania, from November 2000 until DecemberMay 2002. From April
Richard G. Welch has served as Controller of Worthington Industries since March 2000. He served as Assistant Controller of Worthington Industries from September 1999 to November 2000, he served as President of Wise Alloys, LLC, a rolling mill and cast house beverage can recycling and coating operation.March 2000.
Virgil L. Winland has served as Senior Vice President-Manufacturing of Worthington Industries since January 2001. He has served in various positions with Worthington Industries since 1971, including President of Worthington Cylinder Corporation from June 1996 through January 2001.
8
Richard G. Welch has served as Controller of Worthington Industries since March 2000 and as its Assistant Controller from September 1999 to March 2000. Before joining Worthington Industries, Mr. Welch served in various accounting and financial reporting capacities with Time Warner Cable, a distributor of cable programming, including Assistant Controller from March 1999 through September 1999.
Randal I. Rombeiro has served as Treasurer of Worthington Industries since November 2002 and as Assistant Treasurer from 1999 through November 2002. Before joining Worthington Industries, Mr. Rombeiro served as Assistant Treasurer with Mettler-Toledo International, Inc., a global supplier of precision instruments and services, from 1998 to 1999.
Executive officers serve at the pleasure of the directors.directors of the Registrant. There are no family relationships among any of the Registrant’s executive officers or directors. No arrangements or understandings exist pursuant to which any individual has been, or is to be, selected as an executive officer.
officer of the Registrant.
PART II
Item 5. — –Market for Registrant’s Common Equity, Related ShareholderStockholder Matters, and Issuer Purchases of Equity Securities
The common shares of Worthington Industries, Inc. (“Worthington Industries”) trade on the New York Stock Exchange (“NYSE”) under the symbol “WOR” and are listed in most newspapers as “WorthgtnInd.” As of June 30, 2004,August 1, 2006, Worthington Industries had 8,718approximately 8,200 registered shareholders. The following table sets forth (i) the low and high and closing prices and the closing price for Worthington Industries’ common shares for each quarter of fiscal 20032005 and fiscal 2004,2006, and (ii) the cash dividends per share paiddeclared on Worthington Industries’ common shares during each quarter of fiscal 20032005 and fiscal 2004.
| | | | | | | | | | | | | | | | | |
| | | Market Price
| | Cash |
| | | Low
| | High
| | Closing
| | Dividends
|
Fiscal 2003 | | | | | | | | | | | | | | | | |
Quarter Ended | | | | | | | | | | | | | | | | |
| August 31, 2002 | | $ | 14.43 | | | $ | 18.45 | | | $ | 17.75 | | | $ | 0.16 | |
| November 30, 2002 | | $ | 16.80 | | | $ | 19.88 | | | $ | 17.62 | | | $ | 0.16 | |
| February 28, 2003 | | $ | 13.45 | | | $ | 18.00 | | | $ | 13.78 | | | $ | 0.16 | |
| May 31, 2003 | | $ | 11.93 | | | $ | 14.93 | | | $ | 14.93 | | | $ | 0.16 | |
| |
Fiscal 2004 | | | | | | | | | | | | | | | | |
Quarter Ended | | | | | | | | | | | | | | | | |
| August 31, 2003 | | $ | 13.39 | | | $ | 16.23 | | | $ | 15.10 | | | $ | 0.16 | |
| November 30, 2003 | | $ | 12.47 | | | $ | 15.35 | | | $ | 14.32 | | | $ | 0.16 | |
| February 29, 2004 | | $ | 14.59 | | | $ | 18.10 | | | $ | 17.33 | | | $ | 0.16 | |
| May 31, 2004 | | $ | 17.00 | | | $ | 19.37 | | | $ | 19.14 | | | $ | 0.16 | |
Dividend Policy2006.
| | | | | | | | | | |
| | | | | | | | | | | Cash Dividends Declared |
| | | | | Market Price | |
| | | | | Low | | High | | Closing | |
Fiscal 2005 Quarter Ended | | | | | | | | | | |
August 31, 2004 | | $18.62 | | $20.59 | | $20.35 | | $0.16 |
November 30, 2004 | | $19.32 | | $22.71 | | $21.51 | | $0.16 |
February 28, 2005 | | $18.93 | | $21.48 | | $20.95 | | $0.17 |
May 31, 2005 | | $15.36 | | $21.01 | | $16.76 | | $0.17 |
| | | | | |
Fiscal 2006 Quarter Ended | | | | | | | | | | |
August 31, 2005 | | $15.56 | | $18.11 | | $18.10 | | $0.17 |
November 30, 2005 | | $18.29 | | $21.08 | | $20.29 | | $0.17 |
February 28, 2006 | | $18.96 | | $20.89 | | $19.60 | | $0.17 |
May 31, 2006 | | $16.85 | | $21.19 | | $17.03 | | $0.17 |
Dividends are declared at the discretion of the Boardboard of Directors.directors. Worthington Industries paiddeclared quarterly dividends of $0.16$0.17 per share in fiscal 2004.2006. The Boardboard of Directorsdirectors reviews the dividend quarterly and establishes the dividend rate based upon Worthington’sWorthington Industries’ financial condition, results of operations, capital requirements, current and projected cash flows, business prospects, and other factors which theythe directors may deem relevant. While Worthington Industries has paid a dividend every quarter since becoming a public company in 1968, there is no guarantee that this will continue in the future.
9
The following table provides information about purchases made by, or on behalf of, Worthington Industries or any “affiliated purchaser” (as defined in Rule 10b – 18(a) (3) under the Securities Exchange Act of 1934) of common shares of Worthington Industries during each month of the fiscal quarter ended May 31, 2006:
| | | | | | | | | | |
Period | | | | Total Number
of Common
Shares Purchased | | Average
Price Paid
per Common
Share | | Total Number of Common Shares Purchased as Part of Publicly Announced Plans or
Programs | | Maximum Number (or Approximate
Dollar Value) of
Common Shares that May Yet Be
Purchased Under the
Plans or Programs (1) |
March 1-31, 2006 | | - | | - | | - | | 10,000,000 |
| | | | |
April 1-30, 2006 | | - | | - | | - | | 10,000,000 |
| | | | |
May 1-31, 2006 | | - | | - | | - | | 10,000,000 |
| | | | |
Total | | - | | - | | - | | 10,000,000 |
On June 13, 2005, Worthington Industries announced that the board of directors had authorized the repurchase of up to 10,000,000 of its outstanding common shares. The common shares may be purchased from time to time, with consideration given to the market price of the common shares, the nature of other investment opportunities, cash flows from operations and general economic conditions. Repurchases may be made on the open market or through privately negotiated transactions. During the fourth quarter of fiscal 2006, there were no repurchases of common shares.
Item 6. - Selected Financial Data
| | | | | | | | | | | | | | | | | | | | | |
| | | Year ended May 31,
|
| In thousands, except per share | | 2004
| | 2003
| | 2002
| | 2001
| | 2000
|
FINANCIAL RESULTS | | | | | | | | | | | | | | | | | | | | |
| Net sales | | $ | 2,379,104 | | | $ | 2,219,891 | | | $ | 1,744,961 | | | $ | 1,826,100 | | | $ | 1,962,606 | |
| Cost of goods sold | | | 2,003,734 | | | | 1,916,990 | | | | 1,480,184 | | | | 1,581,178 | | | | 1,629,455 | |
| | | |
| | | |
| | | |
| | | |
| | | |
| |
| Gross margin | | | 375,370 | | | | 302,901 | | | | 264,777 | | | | 244,922 | | | | 333,151 | |
| Selling, general and administrative expense | | | 195,785 | | | | 182,692 | | | | 165,885 | | | | 173,264 | | | | 163,662 | |
| Impairment charges and other | | | 69,398 | | | | (5,622 | ) | | | 64,575 | | | | 6,474 | | | | — | |
| | | |
| | | |
| | | |
| | | |
| | | |
| |
| Operating income | | | 110,187 | | | | 125,831 | | | | 34,317 | | | | 65,184 | | | | 169,489 | |
| Miscellaneous income (expense) | | | (1,589 | ) | | | (7,240 | ) | | | (3,224 | ) | | | (928 | ) | | | 2,653 | |
| Nonrecurring losses | | | — | | | | (5,400 | ) | | | (21,223 | ) | | | — | | | | (8,553 | ) |
| Interest expense | | | (22,198 | ) | | | (24,766 | ) | | | (22,740 | ) | | | (33,449 | ) | | | (39,779 | ) |
| Equity in net income of unconsolidated affiliates | | | 41,064 | | | | 29,973 | | | | 23,110 | | | | 25,201 | | | | 26,832 | |
| | | |
| | | |
| | | |
| | | |
| | | |
| |
| Earnings from continuing operations before income taxes | | | 127,464 | | | | 118,398 | | | | 10,240 | | | | 56,008 | | | | 150,642 | |
| Income tax expense | | | 40,712 | | | | 43,215 | | | | 3,738 | | | | 20,443 | | | | 56,491 | |
| | | |
| | | |
| | | |
| | | |
| | | |
| |
| Earnings from continuing operations | | | 86,752 | | | | 75,183 | | | | 6,502 | | | | 35,565 | | | | 94,151 | |
| Discontinued operations, net of taxes | | | — | | | | — | | | | — | | | | — | | | | — | |
| Extraordinary item, net of taxes | | | — | | | | — | | | | — | | | | — | | | | — | |
| Cumulative effect of accounting change, net of taxes | | | — | | | | — | | | | — | | | | — | | | | — | |
| | | |
| | | |
| | | |
| | | |
| | | |
| |
| Net earnings | | $ | 86,752 | | | $ | 75,183 | | | $ | 6,502 | | | $ | 35,565 | | | $ | 94,151 | |
| | | |
| | | |
| | | |
| | | |
| | | |
| |
| Earnings per share - diluted: | | | | | | | | | | | | | | | | | | | | |
| Continuing operations | | $ | 1.00 | | | $ | 0.87 | | | $ | 0.08 | | | $ | 0.42 | | | $ | 1.06 | |
| Discontinued operations, net of taxes | | | — | | | | — | | | | — | | | | — | | | | — | |
| Extraordinary item, net of taxes | | | — | | | | — | | | | — | | | | — | | | | — | |
| Cumulative effect of accounting change, net of taxes | | | — | | | | — | | | | — | | | | — | | | | — | |
| | | |
| | | |
| | | |
| | | |
| | | |
| |
| Net earnings per share | | $ | 1.00 | | | $ | 0.87 | | | $ | 0.08 | | | $ | 0.42 | | | $ | 1.06 | |
| | | |
| | | |
| | | |
| | | |
| | | |
| |
| Continuing operations: | | | | | | | | | | | | | | | | | | | | |
| Depreciation and amortization | | $ | 67,302 | | | $ | 69,419 | | | $ | 68,887 | | | $ | 70,582 | | | $ | 70,997 | |
| Capital expenditures (including acquisitions and investments)* | | | 30,088 | | | | 139,673 | | | | 60,100 | | | | 64,943 | | | | 72,649 | |
| Cash dividends declared | | | 55,312 | | | | 54,938 | | | | 54,677 | | | | 54,762 | | | | 53,391 | |
| Per share | | $ | 0.64 | | | $ | 0.64 | | | $ | 0.64 | | | $ | 0.64 | | | $ | 0.61 | |
| Average shares outstanding - diluted | | | 86,950 | | | | 86,537 | | | | 85,929 | | | | 85,623 | | | | 88,598 | |
FINANCIAL POSITION | | | | | | | | | | | | | | | | | | | | |
| Current assets | | $ | 833,110 | | | $ | 506,246 | | | $ | 490,340 | | | $ | 449,719 | | | $ | 624,229 | |
| Current liabilities | | | 475,060 | | | | 318,171 | | | | 339,351 | | | | 306,619 | | | | 433,270 | |
| | | |
| | | |
| | | |
| | | |
| | | |
| |
| Working capital | | $ | 358,050 | | | $ | 188,075 | | | $ | 150,989 | | | $ | 143,100 | | | $ | 190,959 | |
| | | |
| | | |
| | | |
| | | |
| | | |
| |
| Net fixed assets | | $ | 555,394 | | | $ | 743,044 | | | $ | 766,596 | | | $ | 836,749 | | | $ | 862,512 | |
| Total assets | | | 1,643,139 | | | | 1,478,069 | | | | 1,457,314 | | | | 1,475,862 | | | | 1,673,873 | |
| Total debt** | | | 289,768 | | | | 292,028 | | | | 295,613 | | | | 324,750 | | | | 525,072 | |
| Shareholders’ equity | | | 680,374 | | | | 636,294 | | | | 606,256 | | | | 649,665 | | | | 673,354 | |
| Per share | | $ | 7.83 | | | $ | 7.40 | | | $ | 7.09 | | | $ | 7.61 | | | $ | 7.85 | |
| Shares outstanding | | | 86,856 | | | | 85,949 | | | | 85,512 | | | | 85,375 | | | | 85,755 | |
All financial data include the results of The Gerstenslager Company, which was acquired in February 1997 through a pooling of interests. |
|
* | | Includes $113,000 of Worthington Industries, Inc. common shares exchanged for shares of The Gerstenslager Company during the fiscal year ended May 31, 1997. |
|
** | | Excludes Debt Exchangeable for Common Stock of Rouge Industries, Inc. of $52,497, $75,745 and $88,494 at May 31, 1999, 1998 and 1997, respectively. |
| | | | | | | | | | | | | | | | | | | | |
| | | Fiscal Years Ended May 31, | |
| In thousands, except per share | | 2006 | | | 2005 | | | 2004 | | | 2003 | | | 2002 | |
FINANCIAL RESULTS | | | | | | | | | | | | | | | | | | | | |
Net sales | | $ | 2,897,179 | | | $ | 3,078,884 | | | $ | 2,379,104 | | | $ | 2,219,891 | | | $ | 1,744,961 | |
Cost of goods sold | | | 2,525,545 | | | | 2,580,011 | | | | 2,003,734 | | | | 1,916,990 | | | | 1,480,184 | |
| | | | | | | | | | | | | | | | | | | | |
Gross margin | | | 371,634 | | | | 498,873 | | | | 375,370 | | | | 302,901 | | | | 264,777 | |
Selling, general and administrative expense | | | 214,030 | | | | 225,915 | | | | 195,785 | | | | 182,692 | | | | 165,885 | |
Impairment charges and other | | | - | | | | 5,608 | | | | 69,398 | | | | (5,622 | ) | | | 64,575 | |
| | | | | | | | | | | | | | | | | | | | |
Operating income | | | 157,604 | | | | 267,350 | | | | 110,187 | | | | 125,831 | | | | 34,317 | |
Miscellaneous income (expense) | | | (1,524 | ) | | | (7,991 | ) | | | (1,589 | ) | | | (7,240 | ) | | | (3,224 | ) |
Nonrecurring losses | | | - | | | | - | | | | - | | | | (5,400 | ) | | | (21,223 | ) |
Gain on sale of Acerex | | | 26,609 | | | | | | | | | | | | | | | | | |
Interest expense | | | (26,279 | ) | | | (24,761 | ) | | | (22,198 | ) | | | (24,766 | ) | | | (22,740 | ) |
Equity in net income of unconsolidated affiliates | | | 56,339 | | | | 53,871 | | | | 41,064 | | | | 29,973 | | | | 23,110 | |
| | | | | | | | | | | | | | | | | | | | |
Earnings from continuing operations before income
taxes | | | 212,749 | | | | 288,469 | | | | 127,464 | | | | 118,398 | | | | 10,240 | |
Income tax expense | | | 66,759 | | | | 109,057 | | | | 40,712 | | | | 43,215 | | | | 3,738 | |
| | | | | | | | | | | | | | | | | | | | |
Earnings from continuing operations | | | 145,990 | | | | 179,412 | | | | 86,752 | | | | 75,183 | | | | 6,502 | |
Discontinued operations, net of taxes | | | - | | | | - | | | | - | | | | - | | | | - | |
Extraordinary item, net of taxes | | | - | | | | - | | | | - | | | | - | | | | - | |
Cumulative effect of accounting change, net of taxes | | | - | | | | - | | | | - | | | | - | | | | - | |
| | | | | | | | | | | | | | | | | | | | |
Net earnings | | $ | 145,990 | | | $ | 179,412 | | | $ | 86,752 | | | $ | 75,183 | | | $ | 6,502 | |
| | | | | | | | | | | | | | | | | | | | |
Earnings per share - diluted: | | | | | | | | | | | | | | | | | | | | |
Continuing operations | | $ | 1.64 | | | $ | 2.03 | | | $ | 1.00 | | | $ | 0.87 | | | $ | 0.08 | |
Discontinued operations, net of taxes | | | - | | | | - | | | | - | | | | - | | | | - | |
Extraordinary item, net of taxes | | | - | | | | - | | | | - | | | | - | | | | - | |
Cumulative effect of accounting change, net of taxes | | | - | | | | - | | | | - | | | | - | | | | - | |
| | | | | | | | | | | | | | | | | | | | |
Net earnings per share | | $ | 1.64 | | | $ | 2.03 | | | $ | 1.00 | | | $ | 0.87 | | | $ | 0.08 | |
| | | | | | | | | | | | | | | | | | | | |
Continuing operations: | | | | | | | | | | | | | | | | | | | | |
Depreciation and amortization | | $ | 59,116 | | | $ | 57,874 | | | $ | 67,302 | | | $ | 69,419 | | | $ | 68,887 | |
Capital expenditures (including acquisitions and
investments)* | | | 66,904 | | | | 112,937 | | | | 30,089 | | | | 139,673 | | | | 60,100 | |
Cash dividends declared | | | 60,110 | | | | 57,942 | | | | 55,312 | | | | 54,938 | | | | 54,667 | |
Per share | | $ | 0.68 | | | $ | 0.66 | | | $ | 0.64 | | | $ | 0.64 | | | $ | 0.64 | |
Average shares outstanding - diluted | | | 88,976 | | | | 88,503 | | | | 86,950 | | | | 86,537 | | | | 85,929 | |
| | | | | |
FINANCIAL POSITION | | | | | | | | | | | | | | | | | | | | |
Current assets | | $ | 996,241 | | | $ | 938,333 | | | $ | 833,110 | | | $ | 506,246 | | | $ | 490,340 | |
Current liabilities | | | 490,786 | | | | 545,443 | | | | 475,060 | | | | 318,171 | | | | 339,351 | |
| | | | | | | | | | | | | | | | | | | | |
Working capital | | $ | 505,455 | | | $ | 392,890 | | | $ | 358,050 | | | $ | 188,075 | | | $ | 150,989 | |
| | | | | | | | | | | | | | | | | | | | |
Net fixed assets | | $ | 546,904 | | | $ | 552,956 | | | $ | 555,394 | | | $ | 743,044 | | | $ | 766,596 | |
Total assets | | | 1,900,397 | | | | 1,830,005 | | | | 1,643,139 | | | | 1,478,069 | | | | 1,457,314 | |
Total debt** | | | 252,684 | | | | 388,432 | | | | 289,768 | | | | 292,028 | | | | 295,613 | |
Shareholders’ equity | | | 945,306 | | | | 820,836 | | | | 680,374 | | | | 636,294 | | | | 606,256 | |
Per share | | $ | 10.66 | | | $ | 9.33 | | | $ | 7.83 | | | $ | 7.40 | | | $ | 7.09 | |
Shares outstanding | | | 88,691 | | | | 87,933 | | | | 86,856 | | | | 85,949 | | | | 85,512 | |
The acquisition of the Western Cylinder Assets has been included since September 2004. The disposition of certain Decatur assets has been reflected since August 2004. The acquisition of Unimast Incorporated has been included since July 2002. All financial data includes the results of The Gerstenslager Company, which was acquired in February 1997 through a pooling of interests. The acquisition of Dietrich Industries, Inc. has been included since February 1996.
10
** Excludes Debt Exchangeable for Common Stock of Rouge Industries, Inc. of $52,497, $75,745 and $88,494 at May 31, 1999, 1998 and 1997, respectively. | | | | | | | | | | | | | | | | | | | | | | | | |
| | | Fiscal Years Ended May 31, | |
| In thousands, except per share | | 2001 | | | 2000 | | | 1999 | | | 1998 | | | 1997 | | | 1996 | |
FINANCIAL RESULTS | | | | | | | | | | | | | | | | | | | | | | | | |
Net sales | | $ | 1,826,100 | | | $ | 1,962,606 | | | $ | 1,763,072 | | | $ | 1,624,449 | | | $ | 1,428,346 | | | $ | 1,126,492 | |
Cost of goods sold | | | 1,581,178 | | | | 1,629,455 | | | | 1,468,886 | | | | 1,371,841 | | | | 1,221,078 | | | | 948,505 | |
| | | | | | | | | | | | | | | | | | | | | | | | |
Gross margin | | | 244,922 | | | | 333,151 | | | | 294,186 | | | | 252,608 | | | | 207,268 | | | | 177,987 | |
Selling, general and administrative expense | | | 173,264 | | | | 163,662 | | | | 147,990 | | | | 117,101 | | | | 96,252 | | | | 78,852 | |
Impairment charges and other | | | 6,474 | | | | - | | | | - | | | | - | | | | - | | | | - | |
| | | | | | | | | | | | | | | | | | | | | | | | |
Operating income | | | 65,184 | | | | 169,489 | | | | 146,196 | | | | 135,507 | | | | 111,016 | | | | 99,135 | |
Miscellaneous income (expense) | | | (928 | ) | | | 2,653 | | | | 5,210 | | | | 1,396 | | | | 906 | | | | 1,013 | |
Nonrecurring losses | | | - | | | | (8,553 | ) | | | - | | | | - | | | | - | | | | - | |
Gain on sale of Acerex | | | (33,449 | ) | | | (39,779 | ) | | | (43,126 | ) | | | (25,577 | ) | | | (18,427 | ) | | | (8,687 | ) |
Interest expense | | | | | | | | | | | | | | | | | | | | | | | | |
Equity in net income of unconsolidated
affiliates | | | 25,201 | | | | 26,832 | | | | 24,471 | | | | 19,316 | | | | 13,959 | | | | 28,710 | |
| | | | | | | | | | | | | | | | | | | | | | | | |
Earnings from continuing operations
before income taxes | | | 56,008 | | | | 150,642 | | | | 132,751 | | | | 130,642 | | | | 107,454 | | | | 120,171 | |
Income tax expense | | | 20,443 | | | | 56,491 | | | | 49,118 | | | | 48,338 | | | | 40,844 | | | | 46,130 | |
| | | | | | | | | | | | | | | | | | | | | | | | |
Earnings from continuing operations | | | 35,565 | | | | 94,151 | | | | 83,633 | | | | 82,304 | | | | 66,610 | | | | 74,041 | |
Discontinued operations, net of taxes | | | - | | | | - | | | | (20,885 | ) | | | 17,337 | | | | 26,708 | | | | 26,932 | |
Extraordinary item, net of taxes | | | - | | | | - | | | | - | | | | 18,771 | | | | - | | | | - | |
Cumulative effect of accounting change, net of taxes | | | - | | | | - | | | | (7,836 | ) | | | - | | | | - | | | | - | |
| | | | | | | | | | | | | | | | | | | | | | | | |
Net earnings | | $ | 35,565 | | | $ | 94,151 | | | $ | 54,912 | | | $ | 118,412 | | | $ | 93,318 | | | $ | 100,973 | |
| | | | | | | | | | | | | | | | | | | | | | | | |
Earnings per share - diluted: | | | | | | | | | | | | | | | | | | | | | | | | |
Continuing operations | | $ | 0.42 | | | $ | 1.06 | | | $ | 0.90 | | | $ | 0.85 | | | $ | 0.69 | | | $ | 0.76 | |
Discontinued operations, net of taxes | | | - | | | | - | | | | (0.23 | ) | | | 0.18 | | | | 0.27 | | | | 0.28 | |
Extraordinary item, net of taxes | | | - | | | | - | | | | - | | | | 0.19 | | | | - | | | | - | |
Cumulative effect of accounting change, net of taxes | | | - | | | | - | | | | (0.08 | ) | | | - | | | | - | | | | - | |
| | | | | | | | | | | | | | | | | | | | | | | | |
Net earnings per share | | $ | 0.42 | | | $ | 1.06 | | | $ | 0.59 | | | $ | 1.22 | | | $ | 0.96 | | | $ | 1.04 | |
| | | | | | | | | | | | | | | | | | | | | | | | |
Continuing operations: | | | | | | | | | | | | | | | | | | | | | | | | |
Depreciation and amortization | | $ | 70,582 | | | $ | 70,997 | | | $ | 64,087 | | | $ | 41,602 | | | $ | 34,150 | | | $ | 26,931 | |
Capital expenditures (including
acquisitions and investments)* | | | 64,943 | | | | 72,649 | | | | 132,458 | | | | 297,516 | | | | 287,658 | | | | 275,052 | |
Cash dividends declared | | | 54,762 | | | | 53,391 | | | | 52,343 | | | | 51,271 | | | | 45,965 | | | | 40,872 | |
Per share | | $ | 0.64 | | | $ | 0.61 | | | $ | 0.57 | | | $ | 0.53 | | | $ | 0.49 | | | $ | 0.45 | |
Average shares outstanding - diluted | | | 85,623 | | | | 88,598 | | | | 93,106 | | | | 96,949 | | | | 96,841 | | | | 96,822 | |
| | | | | | |
FINANCIAL POSITION | | | | | | | | | | | | | | | | | | | | | | | | |
Current assets | | $ | 449,719 | | | $ | 624,229 | | | $ | 624,255 | | | $ | 642,995 | | | $ | 594,128 | | | $ | 505,104 | |
Current liabilities | | | 306,619 | | | | 433,270 | | | | 427,725 | | | | 410,031 | | | | 246,794 | | | | 167,585 | |
| | | | | | | | | | | | | | | | | | | | | | | | |
Working capital | | $ | 143,100 | | | $ | 190,959 | | | $ | 196,530 | | | $ | 232,964 | | | $ | 347,334 | | | $ | 337,519 | |
| | | | | | | | | | | | | | | | | | | | | | | | |
Net fixed assets | | $ | 836,749 | | | $ | 862,512 | | | $ | 871,347 | | | $ | 933,158 | | | $ | 691,027 | | | $ | 544,052 | |
Total assets | | | 1,475,862 | | | | 1,673,873 | | | | 1,686,951 | | | | 1,842,342 | | | | 1,561,186 | | | | 1,282,424 | |
Total debt** | | | 324,750 | | | | 525,072 | | | | 493,313 | | | | 501,950 | | | | 417,883 | | | | 317,997 | |
Shareholders’ equity | | | 649,665 | | | | 673,354 | | | | 689,649 | | | | 780,273 | | | | 715,518 | | | | 667,318 | |
Per share | | $ | 7.61 | | | $ | 7.85 | | | $ | 7.67 | | | $ | 8.07 | | | $ | 7.40 | | | $ | 6.91 | |
Shares outstanding | | | 85,375 | | | | 85,755 | | | | 89,949 | | | | 96,657 | | | | 96,711 | | | | 96,505 | |
* Includes $113,000 of Worthington Industries, Inc. common shares exchanged for shares of The Gerstenslager Company during fiscal year ended May 31, 1997.
| | | | | | | | | | | | | | | | | | | | | | | | | |
| | | Year ended May 31,
|
| In thousands, except per share | | 1999
| | 1998
| | 1997
| | 1996
| | 1995
| | 1994
|
FINANCIAL RESULTS | | | | | | | | | | | | | | | | | | | | | | | | |
| Net sales | | $ | 1,763,072 | | | $ | 1,624,449 | | | $ | 1,428,346 | | | $ | 1,126,492 | | | $ | 1,125,495 | | | $ | 996,329 | |
| Cost of goods sold | | | 1,468,886 | | | | 1,371,841 | | | | 1,221,078 | | | | 948,505 | | | | 942,672 | | | | 840,639 | |
| | | |
| | | |
| | | |
| | | |
| | | |
| | | |
| |
| Gross margin | | | 294,186 | | | | 252,608 | | | | 207,268 | | | | 177,987 | | | | 182,823 | | | | 155,690 | |
| Selling, general and administrative expense | | | 147,990 | | | | 117,101 | | | | 96,252 | | | | 78,852 | | | | 67,657 | | | | 57,696 | |
| Impairment charges and other | | | — | | | | — | | | | — | | | | — | | | | — | | | | — | |
| | | |
| | | |
| | | |
| | | |
| | | |
| | | |
| |
| Operating income | | | 146,196 | | | | 135,507 | | | | 111,016 | | | | 99,135 | | | | 115,166 | | | | 97,994 | |
| Miscellaneous income (expense) | | | 5,210 | | | | 1,396 | | | | 906 | | | | 1,013 | | | | 648 | | | | 955 | |
| Nonrecurring losses | | | — | | | | — | | | | — | | | | — | | | | — | | | | — | |
| Interest expense | | | (43,126 | ) | | | (25,577 | ) | | | (18,427 | ) | | | (8,687 | ) | | | (6,673 | ) | | | (3,460 | ) |
| Equity in net income of unconsolidated affiliates | | | 24,471 | | | | 19,316 | | | | 13,959 | | | | 28,710 | | | | 37,395 | | | | 18,091 | |
| | | |
| | | |
| | | |
| | | |
| | | |
| | | |
| |
| Earnings from continuing operations before income taxes | | | 132,751 | | | | 130,642 | | | | 107,454 | | | | 120,171 | | | | 146,536 | | | | 113,580 | |
| Income tax expense | | | 49,118 | | | | 48,338 | | | | 40,844 | | | | 46,130 | | | | 55,190 | | | | 42,678 | |
| | | |
| | | |
| | | |
| | | |
| | | |
| | | |
| |
| Earnings from continuing operations | | | 83,633 | | | | 82,304 | | | | 66,610 | | | | 74,041 | | | | 91,346 | | | | 70,902 | |
| Discontinued operations, net of taxes | | | (20,885 | ) | | | 17,337 | | | | 26,708 | | | | 26,932 | | | | 31,783 | | | | 17,996 | |
| Extraordinary item, net of taxes | | | — | | | | 18,771 | | | | — | | | | — | | | | — | | | | — | |
| Cumulative effect of accounting change, net of taxes | | | (7,836 | ) | | | — | | | | — | | | | — | | | | — | | | | — | |
| | | |
| | | |
| | | |
| | | |
| | | |
| | | |
| |
| Net earnings | | $ | 54,912 | | | $ | 118,412 | | | $ | 93,318 | | | $ | 100,973 | | | $ | 123,129 | | | $ | 88,898 | |
| | | |
| | | |
| | | |
| | | |
| | | |
| | | |
| |
| Earnings per share - diluted: | | | | | | | | | | | | | | | | | | | | | | | | |
| Continuing operations | | $ | 0.90 | | | $ | 0.85 | | | $ | 0.69 | | | $ | 0.76 | | | $ | 0.94 | | | $ | 0.73 | |
| Discontinued operations, net of taxes | | | (0.23 | ) | | | 0.18 | | | | 0.27 | | | | 0.28 | | | | 0.33 | | | | 0.19 | |
| Extraordinary item, net of taxes | | | — | | | | 0.19 | | | | — | | | | — | | | | — | | | | — | |
| Cumulative effect of accounting change, net of taxes | | | (0.08 | ) | | | — | | | | — | | | | — | | | | — | | | | — | |
| | | |
| | | |
| | | |
| | | |
| | | |
| | | |
| |
| Net earnings per share | | $ | 0.59 | | | $ | 1.22 | | | $ | 0.96 | | | $ | 1.04 | | | $ | 1.27 | | | $ | 0.92 | |
| | | |
| | | |
| | | |
| | | |
| | | |
| | | |
| |
| Continuing operations: | | | | | | | | | | | | | | | | | | | | | | | | |
| Depreciation and amortization | | $ | 64,087 | | | $ | 41,602 | | | $ | 34,150 | | | $ | 26,931 | | | $ | 23,741 | | | $ | 23,716 | |
| Capital expenditures (including acquisitions and investments)* | | | 132,458 | | | | 297,516 | | | | 287,658 | | | | 275,052 | | | | 55,876 | | | | 23,513 | |
| Cash dividends declared | | | 52,343 | | | | 51,271 | | | | 45,965 | | | | 40,872 | | | | 37,212 | | | | 33,161 | |
| Per share | | $ | 0.57 | | | $ | 0.53 | | | $ | 0.49 | | | $ | 0.45 | | | $ | 0.41 | | | $ | 0.37 | |
| Average shares outstanding - diluted | | | 93,106 | | | | 96,949 | | | | 96,841 | | | | 96,822 | | | | 96,789 | | | | 96,508 | |
FINANCIAL POSITION | | | | | | | | | | | | | | | | | | | | | | | | |
| Current assets | | $ | 624,255 | | | $ | 642,995 | | | $ | 594,128 | | | $ | 505,104 | | | $ | 474,853 | | | $ | 435,465 | |
| Current liabilities | | | 427,725 | | | | 410,031 | | | | 246,794 | | | | 167,585 | | | | 191,672 | | | | 171,991 | |
| | | |
| | | |
| | | |
| | | |
| | | |
| | | |
| |
| Working capital | | $ | 196,530 | | | $ | 232,964 | | | $ | 347,334 | | | $ | 337,519 | | | $ | 283,181 | | | $ | 263,474 | |
| | | |
| | | |
| | | |
| | | |
| | | |
| | | |
| |
| Net fixed assets | | $ | 871,347 | | | $ | 933,158 | | | $ | 691,027 | | | $ | 544,052 | | | $ | 358,579 | | | $ | 323,649 | |
| Total assets | | | 1,686,951 | | | | 1,842,342 | | | | 1,561,186 | | | | 1,282,424 | | | | 964,299 | | | | 837,707 | |
| Total debt** | | | 493,313 | | | | 501,950 | | | | 417,883 | | | | 317,997 | | | | 108,916 | | | | 73,306 | |
| Shareholders’ equity | | | 689,649 | | | | 780,273 | | | | 715,518 | | | | 667,318 | | | | 608,142 | | | | 525,137 | |
| Shares outstanding | | $ | 7.67 | | | $ | 8.07 | | | $ | 7.40 | | | $ | 6.91 | | | $ | 6.30 | | | $ | 5.46 | |
| Shares outstanding | | | 89,949 | | | | 96,657 | | | | 96,711 | | | | 96,505 | | | | 96,515 | | | | 96,236 | |
11** Excludes Debt Exchangeable for Common Stock of Rouge Industries, Inc. of $52,497, $75,745 and $88,494 at May 31, 1999, 1998 and 1997, respectively.
Item 7. – Management’s Discussion and Analysis of Financial Condition and Results of Operations
Selected statements contained in this “Item 7.–Management’s Discussion and Analysis of Financial Condition and Results of Operations” constitute “forward-looking statements” as that term is used in the Private Securities Litigation Reform Act of 1995. Such forward-looking statements are based, in whole or in part, on management’s beliefs, estimates, assumptions and currently available information. For a more detailed discussion of what constitutes a forward-looking statement and of some of the factors that could cause actual results to differ materially from such forward-looking statements, please refer to the “Safe Harbor Statement” in the beginning of this Annual Report on Form 10-K and “Part I - Item 1A. – Risk Factors” of this Annual Report on Form 10-K.
Overview
Worthington Industries, Inc., together with its subsidiaries (collectively, “we,” “our,” “Worthington,” or the “Company”), is a diversified metal processing company that focuses on value-added steel processing and manufactured metal products. As of May 31, 2006, excluding our joint ventures, we operated 47 manufacturing facilities worldwide, principally in three reportable business segments: Steel Processing, Metal Framing and Pressure Cylinders. We also held equity positions in 6 joint ventures, which operated 15 manufacturing facilities worldwide as of May 31, 2006.
Several changes occurred during fiscal 2006 in our internal organizational and reporting structures. The Automotive Body Panels operating segment, consisting of The Gerstenslager Company, which was previously combined with Steel Processing in the Processed Steel Products segment, was moved to the “Other” category, and the Processed Steel Products segment was renamed Steel Processing. Dietrich Construction Group was formed and includes Dietrich Building Systems, Inc. (which was previously included in the Metal Framing segment), Dietrich Residential Construction, LLC (“DRC”), and a research and development project in China. Dietrich Construction Group is now included in the Construction Services operating segment, which is reported in the “Other” category. The “Other” category now includes the Automotive Body Panels, Construction Services and Steel Packaging operating segments and also includes income and expense items not allocated to the reportable segments. All prior period segment financial information has been restated to reflect the changes mentioned above.
The following discussion and analysis of financial conditionbusiness strategy, key economic and industry indicators, steel pricing, and the results of operations and financial condition of Worthington, should be read in conjunction with our consolidated financial statements included in “Item 8. – Financial Statements and Supplementary Data.”
Worthington Industries, Inc., together withBusiness Strategy
Our number one goal is to increase shareholder value. We believe that our business strategy, centered on our core competency of adding value to flat-rolled steel, provides an excellent platform to deliver that value. Our focus is to grow shareholder value by effectively managing and growing our Company’s downstream, value-added capabilities. Each of our reportable business segments—Steel Processing, Metal Framing, Pressure Cylinders—and our largest joint venture holds a leadership position in its subsidiaries,market, which we expect to leverage and grow. We have the capacity in each of our business segments to handle additional sales growth without significantly increasing capital investment.
The three primary ways we seek to accomplish our strategic goal are optimizing existing operations; developing and commercializing new products and applications; and pursuing strategic acquisitions and joint ventures. Over the last several years, this focus has resulted in investing in growth markets and products, consolidating facilities and divesting certain non-strategic assets or other assets that were not delivering appropriate returns. We will continue our efforts to optimize existing operations by improving efficiencies, consolidating operations when necessary, and reducing the costs and risks of our existing operations.
Although no individual customer provides more than five percent of our consolidated net sales, diversifying our customer base through new products and new applications for existing products is a diversifiedpriority. We are developing new products and services in our Steel Processing segment. We are developing and testing innovative building products and systems to expand the application of metal processing company that focuses on value-added steel processingframing, and manufactured metalwe have developed and acquired, and will continue to develop and acquire, new pressure cylinder products. As of May 31, 2004, we operated 44 facilities worldwide, principally in three reportable business segments: Processed Steel Products, Metal Framing
We have added products and Pressure Cylinders. We also held equity positions in eightoperations, including joint ventures, which operatedwe believe complement our existing business and strengths. Our strong balance sheet provides the financial flexibility to acquire or invest in companies that further extend our product lines or penetrate new markets. Because of our success with joint ventures and alliances, we continue to look for additional opportunities where we can bring together complementary skill sets, manage our risk and effectively invest our capital. Some of these joint ventures and alliances have served as entry points into markets not previously served and have resulted in later buyouts of the other joint venture parties.
During fiscal 2006, we took the following actions:
On September 22, 2005, we announced to the North American market, Dietrich “UltraSTEEL™” metal framing products using patented technology of Hadley Industries PLC. The licensing agreement grants us the exclusive rights to manufacture and sell light-gauge steel framing using the “UltraSTEEL™” technology in North America. Our Metal Framing plants are converting a significant portion of their manufactured products to “UltraSTEEL™”. On February 27, 2006, Dietrich Metal Framing announced an exclusive sublicensing agreement with Clark-Western for the “UltraSTEEL™” products. Having a second manufacturer of these products should help to make them more readily available in the marketplace and accelerate their adoption as a preferred product.
On September 27, 2005, Dietrich entered into a joint development agreement with NOVA Chemicals Corporation to evaluate and commercialize novel construction products that combine the structural benefits of light-gauge steel framing with the thermal and moisture retardant properties of expandable polystyrene. The relationship became an 50:50 unconsolidated joint venture in July 2006. The joint venture’s current focus is on developing cost-effective, insulated metal framing panels intended to remove significant obstacles to using steel framing products for exterior walls in areas where interior/exterior temperature variations may cause condensation.
On October 17, facilities worldwide2005, we acquired the remaining 50% interest in Dietrich Residential Construction, LLC (“DRC”) from our partner, Pacific Steel Construction (“Pacific”) for cash of $3.8 million and debt assumption of $4.2 million. The acquisition was recorded using the purchase accounting method, and the results of DRC, which were previously reported as an unconsolidated joint venture, have been included in the consolidated results of the “Other” category since the date of acquisition. DRC provides panelizing capabilities and opens the door to United States military and residential housing markets.
On November 30, 2005, we acquired the remaining 40% interest in Dietrich Metal Framing Canada, Inc. (“DMFC”), from the minority shareholder, Encore Coils Holdings Ltd. (“Encore”) for $3.0 million cash. The joint venture had been formed in November 2004 as a platform to provide our Metal Framing segment’s light-gauge steel framing, proprietary products, building systems and services to the Canadian construction market. The acquisition was recorded using the purchase accounting method, and 100% of the results of DMFC, which had been previously reduced by the minority interest, have been included in the consolidated results of the Metal Framing segment since the date of acquisition.
On March 2, 2006, we announced the planned closure of our Metal Framing manufacturing facility in LaPorte, Indiana. Forty-nine people were employed at this location. Operations ceased during June 2006. The facility processed small-walled, galvanized steel coils, which have become increasingly scarce over the past several years. The move to “UltraSTEEL™” further decreased our need for the processing capabilities of the LaPorte facility.
On April 25, 2006, we sold our 50% equity interest in Acerex, S.A. de C.V. (“Acerex”), a joint venture operating a steel processing facility in Monterrey, Mexico, to our partner Ternium, S.A. (“Ternium”) for $44.6 million cash. This sale resulted in a pre-tax gain of $26.6 million. The joint venture was formed in 1994 with Hylsa, S.A. de C.V., which was recently acquired by
Ternium. This ownership change prompted the sale of the joint venture. We remain interested in the Mexican steel processing market and are exploring opportunities to continue the success that we have enjoyed there for over a decade.
Key Economic and Industry Indicators
To better understand the markets in which each of our business segments operates and the performance of those segments, we monitor certain economic and industry data. During the fiscal year ended May 31, 2004.2006 (“fiscal 2006”), Gross Domestic Product continued to expand, up 3.4% over the fiscal year ended May 31, 2005 (“fiscal 2005”).
The resultsCommercial construction, the end market for approximately 41% of our operationsnet sales, improved in fiscal 2006 as indicated by the U.S. Census Bureau’s Index of Private Construction Spending, which was 8% above fiscal 2005. According to this same index, our largest construction market sector, office buildings, improved 11%. These improvements increased demand, which generally leads to rising prices.
The hurricanes that hit the Gulf Coast states during the first part of fiscal 2006 had no direct impact on our facilities. However, some Metal Framing customers’ plants, representing approximately 2-3% of Metal Framing’s business, were shut down temporarily. While we estimate that recovery in the region may take several years, the rebuilding effort should benefit demand. The hurricanes were also a factor in the increase in zinc, energy and transportation costs. Excluding the impact of volume, these costs were $17.4 million higher than in fiscal 2005.
The automotive end market, which represents approximately 33% of our net sales, had mixed results. Total North American vehicle production was 3% higher than last year. However, “Big Three” automotive (collectively, DaimlerChrysler AG, Ford Motor Co. and General Motors Corp.) production was down 2% compared to last year. While our tons shipped directly to the Big Three increased 29% over last year, our total automotive volumes decreased slightly from fiscal 2005. The financial condition of some automotive manufacturers and suppliers has deteriorated and the debt of several automotive manufacturers and automotive suppliers has been rated below investment grade. In recent years, certain automotive suppliers have filed voluntary petitions for Chapter 11 bankruptcy protection. We are mainly driven by two factors, demandconcerned about the viability of several other automotive suppliers and spread. While increased volumes positively impacted operating income duringcontinue to monitor their status.
Steel Pricing
During the last several fiscal years, the steel industry experienced unprecedented steel price fluctuations. Early in the fiscal year ended May 31, 2004 (“fiscal 2004”), spread, or the difference between the cost of the raw material and the selling price of the finished product, was the main reason for the improvement in the results this year compared to the prior year, with most of the benefit occurring in the fourth quarter. Generally, our operations are favorably impacted in a rising steel-price environment (which typically occurs when demand is increasing), as we are able to raise our selling prices due to the increased cost of steel while lower-priced inventory on hand flows through cost of goods sold. However, the opposite may occur when steel prices fall.
While pricing in the steel industry historically has been unpredictable, the industry experienced unprecedented steel price increases during the second half of fiscal 2004 for three main reasons. First, the People’s Republic of China experienced strong growth in(“China”) was a net importer of steel as its demand for steel exceeded its production which required more raw materials. This contributed to U.S. shortagescapabilities, increasing the demand for steel in the supplyworldwide market and reducing the availability of foreign steel scrap and coke, two key materials used in the manufactureUnited States of steel. Thus, prices soared for these commodities, in turn raising the cost of steel. Second, the weakenedAmerica (“U.S.”). A weaker U.S. dollar and higher transportation costs made foreign steel more expensive than domestic steel, therebyfurther reducing the supply of imports to the U.S. As China increased its production capabilities, it required more steel-making raw materials, especially coke and scrap steel. This resulted in shortages of these key raw materials, fueling further increases in steel prices. Finally, the consolidation of the steel industry within the U.S. reduced the availability of steel. BecauseAll of these conditions, obtainingfactors combined during this period of time to cause an unprecedented increase in steel prices, which peaked in September 2004.
Since then, China increased steel production significantly, contributing to global supply and placing significant downward pressure on steel prices. In addition, excess inventories and lower production from automotive and other key metalworking sectors reduced demand. As a result, benchmark commodity steel prices began to weaken and continued to decline through the end of our fiscal 2006 first quarter. However, since our fiscal 2006 first quarter, steel prices have increased 23% due to improved overall demand, constrained domestic supply, and lower levels of available imports. On average, published benchmark commodity steel prices for our fiscal 2006 were lower by $119 per ton, or 18% from last fiscal year, because of generally weaker demand and greater supply.
The following graph shows the volatility of steel prices over the last four years:
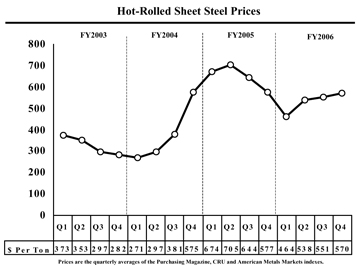
The consolidation of the industry around the globe has set the stage for a more disciplined approach to production and pricing. Domestically, the concentration of steel production owned by the top three producers has doubled, along with their market share, to approximately 70%. Globally, consolidation has resulted in a significant shift in the amount of production capacity owned by the private sector. Prior to 2000, approximately 25% of steel-producing assets were privately owned versus more than 75% today. Combined with strong regional growth in Asia and Eastern Europe, industry consolidation has produced an environment which may lead to steel pricing being much less volatile than was challenging, butexperienced during the preceding 10 years.
Volatile steel prices combined with our long-term relationships withfirst-in first-out (“FIFO”) inventory flow, can have a dramatic affect on the mills were advantageous.
results of our operations. In a rising steel-price environment, our reported income is often favorably impacted as lower-priced inventory, acquired during the previous two to three months, flows through cost of goods sold while our selling prices increase to meet the rising cost of steel. In a decreasing steel-price environment, the inverse often occurs as higher-priced inventory on hand flows through cost of goods sold and our selling prices decrease. This results in what we refer to as inventory holding gains or losses. We strive to manage the peaks and valleys associated with rapid changes in steel pricinglimit this impact by effectively controlling inventory. This has been a critical focus for the last several years. With inventory levels consistently under 60 days during fiscal 2004, we reduced some of the benefit we might have realized in the year. We intend to continue to manageand monitoring our inventory to reduce the negative impact from the downside of this cycle.selling prices.
Our focus over the last several years has been to improve our return on capital by investing in growth markets and products, consolidating facilities, and divesting non-strategic assets or those that were not delivering appropriate returns. Our plant consolidation plan, announced during January 2002, was substantially completed in fiscal 2004, and resulted in closed facilities and approximately $12.0 million in annualized savings. We also completed the integration of Unimast Incorporated (together with its subsidiaries, “Unimast”), acquired in July 2002, into our Metal Framing segment, which is expected to generate future savings.
On May 27, 2004, we signed an agreement to sell our Decatur, Alabama, steel-processing facility and its cold-rolling assets to Nucor Corporation (“Nucor”) for $82.0 million cash while retaining the slitting and cut-to-length assets and net working capital associated with this facility. This transaction closed effective as of August 1, 2004.
12
Equity income from our six unconsolidated joint ventures was up significantly in fiscal 2004. All six joint ventures increased net income, including record years for WAVE, TWB, Acerex and Aegis. Joint venture income has been a consistent and significant contributor to our profitability. Collectively, the unconsolidated joint ventures generated $604.2 million in annual sales, which are not reflected in our consolidated sales. More importantly, over the last three years, our aggregate annual return on the investment in these joint ventures has averaged 36%. The joint ventures are also a source of cash to us, with aggregate annual distributions averaging more than $20.0 million over the same time period. Because of our success with joint ventures, we are regularly looking for additional opportunities where we can bring together complementary skill sets and minimize our risk and capital requirements.
We formed our newest joint venture during fiscal 2004. On June 27, 2003, Worthington Steel joined with Bainbridge Steel, LLC (“Bainbridge”), an affiliate of Viking Industries LLC, a qualified minority business enterprise (“MBE”), to create Viking & Worthington Steel Enterprise, LLC (“VWS”), an unconsolidated joint venture in which Worthington Steel has a 49% interest and
Bainbridge has a 51% interest. VWS purchased substantially all of the assets of Valley City Steel, LLC in Valley City, Ohio, for approximately $5.7 million. Bainbridge manages the operations of the joint venture, and Worthington Steel provides assistance in operations, selling and marketing. VWS operates as an MBE.
Results of Operations
Fiscal 20042006 Compared to Fiscal 20032005
Consolidated Operations
The impact of inventory holding gains and losses continued to be a major factor when comparing our results against the prior year. Average hot-roll prices were 18% lower during fiscal 2006 versus fiscal 2005. Operating income for the twelve months ended May 31, 2006, was negatively impacted by an inventory holding loss estimated at $7.9 million, while operating income for fiscal 2005 contained an estimated inventory holding gain of $78.5 million.
A majority of our full-time employees receive a significant portion of their compensation through profit sharing and bonuses, which are tied to the performance of our Company. When earnings are up, so is profit sharing
and bonus expense, and when earnings are down, so is profit sharing and bonus expense. Because of this relationship, profit sharing and bonus expense tends to minimize the volatility of earnings.
The following table presents our consolidated operating results for the fiscal years indicated:
| | | | | | | | | | | | | | | | | | | | | |
| | | 2004
| | 2003
|
| | | | | | | % of | | % | | | | | | % of |
| In millions, except per share | | Actual
| | Net Sales
| | Change
| | Actual
| | Net Sales
|
| Net sales | | $ | 2,379.1 | | | | 100.0 | % | | | 7 | % | | $ | 2,219.9 | | | | 100.0 | % |
| Cost of goods sold | | | 2,003.7 | | | | 84.2 | % | | | 5 | % | | | 1,917.0 | | | | 86.4 | % |
| | | |
| | | | | | | | | | | |
| | | | | |
| Gross margin | | | 375.4 | | | | 15.8 | % | | | 24 | % | | | 302.9 | | | | 13.6 | % |
| Selling, general and administrative expense | | | 195.8 | | | | 8.2 | % | | | 7 | % | | | 182.7 | | | | 8.2 | % |
| Impairment charges and other | | | 69.4 | | | | 3.0 | % | | | | | | | (5.6 | ) | | | -0.3 | % |
| | | |
| | | | | | | | | | | |
| | | | | |
| Operating income | | | 110.2 | | | | 4.6 | % | | | -12 | % | | | 125.8 | | | | 5.7 | % |
| Other income (expense): | | | | | | | | | | | | | | | | | | | | |
| Miscellaneous expense | | | (1.6 | ) | | | | | | | | | | | (7.2 | ) | | | | |
| Nonrecurring loss | | | — | | | | | | | | | | | | (5.4 | ) | | | | |
| Interest expense | | | (22.2 | ) | | | -0.9 | % | | | -10 | % | | | (24.8 | ) | | | -1.1 | % |
| Equity in net income of unconsolidated affiliates | | | 41.1 | | | | 1.7 | % | | | 37 | % | | | 30.0 | | | | 1.4 | % |
| | | |
| | | | | | | | | | | |
| | | | | |
| Earnings before income taxes | | | 127.5 | | | | 5.4 | % | | | 8 | % | | | 118.4 | | | | 5.3 | % |
| Income tax expense | | | 40.7 | | | | 1.8 | % | | | -6 | % | | | 43.2 | | | | 1.9 | % |
| | | |
| | | | | | | | | | | |
| | | | | |
| Net earnings | | $ | 86.8 | | | | 3.6 | % | | | 15 | % | | $ | 75.2 | | | | 3.4 | % |
| | | |
| | | | | | | | | | | |
| | | | | |
| Average common shares outstanding - diluted | | | 86.9 | | | | | | | | | | | | 86.5 | | | | | |
| | | |
| | | | | | | | | | | |
| | | | | |
| Earnings per share - diluted | | $ | 1.00 | | | | | | | | 15 | % | | $ | 0.87 | | | | | |
| | | |
| | | | | | | | | | | |
| | | | | |
| | | | | | | | | | | | | | |
| | | 2006 | | 2005 |
| In millions, except per share | | Actual | | | % of
Net Sales | | %
Change | | Actual | | | % of
Net Sales |
Net sales | | $ | 2,897.2 | | | 100.0% | | -6% | | $ | 3,078.9 | | | 100.0% |
Cost of goods sold | | | 2,525.6 | | | 87.2% | | -2% | | | 2,580.0 | | | 83.8% |
| | | | | | | | | | | | | | |
Gross margin | | | 371.6 | | | 12.8% | | -26% | | | 498.9 | | | 16.2% |
Selling, general and administrative expense | | | 214.0 | | | 7.4% | | -5% | | | 225.9 | | | 7.3% |
Impairment charges and other | | | - | | | | | | | | 5.6 | | | 0.2% |
| | | | | | | | | | | | | | |
Operating income | | | 157.6 | | | 5.4% | | -41% | | | 267.4 | | | 8.7% |
Other income (expense): | | | | | | | | | | | | | | |
Miscellaneous expense | | | (1.5 | ) | | | | | | | (8.0 | ) | | |
Gain on sale of Acerex | | | 26.6 | | | 0.9% | | | | | - | | | |
Interest expense | | | (26.3 | ) | | -0.9% | | 6% | | | (24.8 | ) | | -0.8% |
Equity in net income of unconsolidated affiliates | | | 56.3 | | | 1.9% | | 4% | | | 53.9 | | | 1.7% |
| | | | | | | | | | | | | | |
Earnings before income taxes | | | 212.7 | | | 7.3% | | -26% | | | 288.5 | | | 9.4% |
Income tax expense | | | 66.7 | | | 2.3% | | -39% | | | 109.1 | | | 3.5% |
| | | | | | | | | | | | | | |
| | | | | |
Net earnings | | $ | 146.0 | | | 5.0% | | -19% | | $ | 179.4 | | | 5.8% |
| | | | | | | | | | | | | | |
| | | | | |
Average common shares outstanding - diluted | | | 89.0 | | | | | | | | 88.5 | | | |
| | | | | | | | | | | | | | |
| | | | | |
Earnings per share - diluted | | $ | 1.64 | | | | | -19% | | $ | 2.03 | | | |
| | | | | | | | | | | | | | |
Net earnings increased $11.6decreased $33.4 million, to $86.8 million in fiscal 2004, from $75.2$146.0 million for the year ended May 31, 2003 (“fiscal 2003”). Fiscal 2004 diluted2006, from $179.4 million for fiscal 2005. Diluted earnings per share increased $0.13decreased $0.39 per share to $1.00$1.64 per share from $0.87$2.03 per share infor the prior fiscal 2003.
13
year. Net sales increased 7%decreased 6%, or $159.2$181.7 million, to $2,379.1$2,897.2 million infor fiscal 20042006 from $2,219.9$3,078.9 million infor fiscal 2003. In the second half of fiscal 2004, we raised our2005. The decrease was due to lower selling prices, to meetreflecting the dramatic increase inlower steel prices. This accounted for approximately 60%prices that prevailed during fiscal 2006 versus fiscal 2005, which reduced net sales by $228.9 million. Higher overall volumes slightly offset the negative impact of the year-over-year increasedecline in sales.selling prices. The remainingvolume increase was primarily due to an increase inincreased volumes in the Metal Framing causedand Pressure Cylinders segments and in Construction Services, which is included in the Other category, but the impact of these volume increases was somewhat offset by slightly lower volumes in the acquisitionSteel Processing segment, due largely to the sale of Unimast, which closed July 31, 2002, and contributed two additional monthsthe cold mill in Decatur, Alabama, in the first quarter of sales in fiscal 2004 compared to fiscal 2003.2005.
Gross margin increased 24%decreased 26%, or $72.5$127.3 million, to $375.4$371.6 million for fiscal 2006 from $498.9 million for fiscal 2005. The decrease was due to a $138.2 million decline in fiscal 2004 from $302.9 million in fiscal 2003. Favorable pricing accounted for $64.5 million of the increase with higher volumes contributing an additional $26.6 million. These increases were partially offset by an $18.6spread and a $7.2 million increase in direct labor and manufacturing expenses, partially offset by an increase in overall volume of $18.1 million. The increase in direct labor and manufacturing expenses was mainly due to increases in freight, zinc, and energy expenses. Gross margin as a percentage of net sales decreased to 12.8% for fiscal 2006 compared to 16.2% for fiscal 2005.
SG&A expense, as a percentage of net sales, increased to 7.4% for fiscal 2006 compared to 7.3% of net sales for the prior year. In total, SG&A expense decreased 5%, or $11.9 million, to $214.0 million for fiscal 2006 from $225.9 million for fiscal 2005. This decrease was primarily due to a $19.6 million decrease in profit sharing and bonus expense resulting from lower earnings and a $9.7 million reduction in bad debt expense, offset by increases in professional fees of $7.4 million, wages of $7.3 million, and insurance and taxes of $1.9 million. The reduction in bad debt expense reflects the favorable settlement of our claim in a large bankruptcy case in fiscal 2006.
Miscellaneous expense decreased $6.5 million in fiscal 2006 compared to fiscal 2005. This was due to an increase in, and higher returns on, cash and short-term investments and the reduced minority interest elimination for our consolidated joint venture due to its lower earnings.
Results for fiscal 2006 include a $26.6 million pre-tax gain on the sale of our 50% equity interest in Acerex to our partner, Ternium.
Interest expense increased 6% or $1.5 million due to higher average borrowings.
Equity in net income of unconsolidated affiliates increased to $56.3 million for fiscal 2006 from $53.9 million for fiscal 2005, primarily due to increased earnings of the WAVE joint venture, partially offset by a $6.0 million adjustment for the under-accrual of income taxes over the last five years at our Acerex joint venture. The unconsolidated joint ventures generated $810.3 million in sales and net income of $108.7 million during fiscal 2006. Joint venture income has been a consistent and significant contributor to our profitability over the last several years. Our aggregate annual return on the investment in these joint ventures has averaged 43%. The joint ventures are also a source of cash to us, and aggregate annual distributions have ranged from $12 to $57 million.
Income tax expense decreased 39%, or $42.4 million, mainly due to lower earnings. However, the effective tax rate also decreased to 31.4% for fiscal 2006 from 37.8% for fiscal 2005. The rate decrease was due to higher foreign earnings that were taxed at a lower rate, modifications to the corporate tax laws for the state of Ohio that reduced tax expense, deferred tax adjustments for foreign earnings, offset by special taxes on foreign earnings repatriations and the sale of Acerex. The rate was further reduced by the elimination of the reserves established for the disallowance of investment tax credits in the State of Ohio when the program was ruled unconstitutional by the Sixth Circuit Court of Appeals in fiscal 2005. This reserve became unnecessary due to the recent ruling by the U.S. Supreme Court, which vacated the Sixth Circuit’s ruling.
Segment Operations
Steel Processing
Our Steel Processing segment represented approximately 51% of consolidated net sales in fiscal 2006. The steel-pricing environment and the automotive industry, which accounts for approximately 60% of this segment’s net sales, significantly impacted the results of this segment. After having risen steadily for the first four months of fiscal 2005 to an all time high in September 2004, steel prices declined significantly for the next twelve months. As a result, average steel prices were significantly lower in fiscal 2006 than in fiscal 2005, which led to a reduced spread between our average selling price and material cost. In addition, sales to the automotive market in fiscal 2006 were 8% lower than in fiscal 2005.
Effective August 1, 2004, we sold our Decatur, Alabama, steel-processing facility and its cold-rolling assets (“Decatur”) to Nucor Corporation (“Nucor”) for $80.4 million cash. The assets sold at Decatur included the land and buildings, the four-stand tandem cold mill, the temper mill, the pickle line and the annealing furnaces. The sale excluded the slitting and cut-to-length assets and net working capital. The retained assets provide basic steel-processing services to our customers at the Decatur site, which is leased from Nucor. A pre-tax charge of $5.6 million, mainly related to contract termination costs, was recognized during the first quarter of fiscal 2005.
The following table presents a summary of operating results for the Steel Processing segment for the fiscal years indicated:
| | | | | | | | | | | | |
| | | 2006 | | 2005 |
| Dollars in millions, tons in thousands | | Actual | | % of
Net Sales | | %
Change | | Actual | | % of
Net Sales |
Net sales | | $ | 1,486.2 | | 100.0% | | -14% | | $ | 1,719.3 | | 100.0% |
Cost of goods sold | | | 1,347.6 | | 90.7% | | -10% | | | 1,492.2 | | 86.8% |
| | | | | | | | | | | | |
Gross margin | | | 138.6 | | 9.3% | | -39% | | | 227.1 | | 13.2% |
Selling, general and administrative expense | | | 76.8 | | 5.2% | | -19% | | | 94.4 | | 5.5% |
Impairment charges and other | | | - | | | | | | | 5.6 | | 0.3% |
| | | | | | | | | | | | |
Operating income | | $ | 61.8 | | 4.2% | | -51% | | $ | 127.1 | | 7.4% |
| | | | | | | | | | | | |
| | | | | |
Tons shipped | | | 3,611 | | | | -1% | | | 3,663 | | |
| | | | | |
Material cost | | $ | 1,139.1 | | 76.6% | | -10% | | $ | 1,267.9 | | 73.7% |
Operating income decreased 51%, or $65.3 million, to $61.8 million, or 4.2% of net sales, in fiscal 2006 from $127.1 million, or 7.4% of net sales, for fiscal 2005. Net sales decreased 14%, or $233.1 million, to $1,486.2 million from $1,719.3 million, due to a decrease in pricing of $144.5 million and a decrease in volume of $88.6 million, of which $79.6 million was due to the sale of certain Decatur assets. Gross margin declined 39%, or $88.5 million, to $138.6 million, or 9.3% of net sales, for fiscal 2006 versus $227.1 million, or 13.2% of net sales, for fiscal 2005. A narrower spread between average selling price and material cost, and a decrease in volume, reduced gross margin by $81.5 million and $12.3 million, respectively. Gross margin was favorably impacted by a $13.7 million decrease in profit sharing and bonus expense due to lower earnings and a $3.8 million reduction in manufacturing expenses at our Decatur facility, partially offset by increases for freight, zinc and natural gas expense. SG&A expense decreased $17.6 million, to 5.2% of net sales in fiscal 2006, down from 5.5% of net sales for fiscal 2005. The decline in SG&A expense was largely due to a decrease of $13.1 million in profit sharing and bonus expense, resulting from lower earnings, and a $9.4 million decrease in bad debt expense compared to the additionprior year. The reduction in bad debt expense reflects the favorable settlement of Unimast.our claim in a large bankruptcy case in fiscal 2006.
Metal Framing
Our Metal Framing segment represented approximately 28% of consolidated net sales during fiscal 2006. Volumes for fiscal 2006 increased 7% compared to fiscal 2005. We believe the improved demand reflects a combination of factors including a general increase in commercial construction, rebuilding in Florida after the hurricanes of fiscal 2005, and an expansion into Canada.
The following table presents a summary of operating results for the Metal Framing segment for the fiscal years indicated:
| | | | | | | | | | | | |
| | | 2006 | | 2005 |
| Dollars in millions, tons in thousands | | Actual | | % of Net Sales | | %
Change | | Actual | | % of
Net Sales |
Net sales | | $ | 796.3 | | 100.0% | | -6% | | $ | 843.9 | | 100.0% |
Cost of goods sold | | | 673.3 | | 84.6% | | 4% | | | 648.4 | | 76.8% |
| | | | | | | | | | | | |
Gross margin | | | 123.0 | | 15.4% | | -37% | | | 195.5 | | 23.2% |
Selling, general and administrative expense | | | 76.3 | | 9.6% | | -7% | | | 81.7 | | 9.7% |
| | | | | | | | | | | | |
Operating income | | $ | 46.7 | | 5.9% | | -59% | | $ | 113.8 | | 13.5% |
| | | | | | | | | | | | |
| | | | | |
Tons shipped | | | 704 | | | | 7% | | | 657 | | |
| | | | | |
Material cost | | $ | 508.6 | | 63.9% | | 2% | | $ | 498.0 | | 59.0% |
Operating income decreased $67.1 million to $46.7 million, or 5.9% of net sales, in fiscal 2006 from $113.8 million, or 13.5% of net sales, for fiscal 2005. The primary driver of the decrease was the narrower spread between average selling price and material cost of $84.9 million, partially offset by an increase in volume of $20.5 million. Net sales decreased 6%, or $47.6 million, to $796.3 million in fiscal 2006 from $843.9 million for fiscal 2005 due to the impact of lower pricing of $117.0 million, partially offset by the impact of an increase in volume of $69.4 million. Gross margin decreased $72.5 million from $195.5 million to $123.0 million and, as a percentage of net sales, was 15.4% compared to 23.2% for the comparable period in the prior year. SG&A expense decreased because of a reduction in profit sharing and bonus expense of $10.6 million resulting from lower earnings.
Pressure Cylinders
Our Pressure Cylinders segment represented approximately 16% of consolidated net sales during fiscal 2006. This segment had an increase in net sales and record operating income in fiscal 2006.
The following table presents a summary of operating results for the Pressure Cylinders segment for the fiscal years indicated:
| | | | | | | | | | | | |
| | | 2006 | | 2005 |
| Dollars in millions, units in thousands | | Actual | | % of
Net Sales | | %
Change | | Actual | | % of
Net Sales |
Net sales | | $ | 461.9 | | 100.0% | | 13% | | $ | 408.3 | | 100.0% |
Cost of goods sold | | | 367.2 | | 79.5% | | 10% | | | 334.1 | | 81.8% |
| | | | | | | | | | | | |
Gross margin | | | 94.7 | | 20.5% | | 28% | | | 74.2 | | 18.2% |
Selling, general and administrative expense | | | 45.4 | | 9.8% | | 12% | | | 40.6 | | 10.0% |
| | | | | | | | | | | | |
Operating income | | $ | 49.3 | | 10.7% | | 47% | | $ | 33.6 | | 8.2% |
| | | | | | | | | | | | |
| | | | | |
Units shipped | | | 48,621 | | | | | | | 36,704 | | |
| | | | | |
Material cost | | $ | 221.8 | | 48.0% | | 12% | | $ | 197.5 | | 48.4% |
Operating income increased 47%, or $15.7 million, to $49.3 million, or 10.7% of net sales, in fiscal 2006 from $33.6 million, or 8.2% of net sales, for fiscal 2005. Net sales increased 13%, or $53.6 million, to $461.9 million in fiscal 2006 from $408.3 million for fiscal 2005. The full-year impact of the September 2004 acquisition of the net assets of the propane and specialty gas cylinder business of Western Industries, Inc. (“Western Cylinder Assets”) contributed $23.0 million to this increase, other North American net sales contributed $12.6 million and improved European sales contributed $18.0 million. Unit volumes were flat, excluding units from the Western Cylinder Assets. Gross margin was 20.5% of net sales in fiscal 2006 compared to 18.2% for fiscal 2005. The
improved gross margin was primarily due to the full-year contribution of the Western Cylinder Assets and improved operating results of our European operations. The Austrian facility experienced increased unit volumes and expanded operating margins compared to fiscal 2005. The Portugal facility ceased production of its unprofitable liquefied petroleum gas cylinders in the first quarter of fiscal 2005, resulting in significantly improved gross margin in fiscal 2006 as a percentage of net sales. The Czech Republic facility expanded its air tank production in fiscal 2005, but incurred high labor and manufacturing expense during the expansion start-up in fiscal 2005. SG&A expense increased $4.8 million in fiscal 2006 from the prior year due the settlement of two product liability claims totaling $2.4 million and a $2.1 million increase in costs related to the full-year operation of the acquired Western Cylinder Assets.
Other
The “Other” category includes the Automotive Body Panels, Construction Services and Steel Packaging operating segments, which are immaterial for separate disclosure, and also includes income and expense items not allocated to the operating segments.
The following table presents a summary of operating results for the Other category for the fiscal years indicated:
| | | | | | | | | | | | | | |
| | | 2006 | | 2005 |
| Dollars in millions | | Actual | | | % of
Net Sales | | %
Change | | Actual | | | % of
Net Sales |
Net sales | | $ | 152.9 | | | 100.0% | | 42% | | $ | 107.4 | | | 100.0% |
Cost of goods sold | | | 137.4 | | | 89.9% | | 30% | | | 105.3 | | | 98.0% |
| | | | | | | | | | | | | | |
Gross margin | | | 15.5 | | | 10.1% | | 638% | | | 2.1 | | | 2.0% |
Selling, general and administrative expense | | | 15.7 | | | 10.3% | | 71% | | | 9.2 | | | 8.6% |
| | | | | | | | | | | | | | |
Operating loss | | $ | (0.2 | ) | | -0.1% | | 97% | | $ | (7.1 | ) | | -6.6% |
| | | | | | | | | | | | | | |
Operating loss decreased by $6.9 million to $0.2 million in fiscal 2006 from an operating loss of $7.1 million in fiscal 2005 for all three operating segments in the Other category, primarily due to an improvement in results for Auto Body Panels, which offset losses in Construction Services. Net sales increased 42%, or $45.5 million, to $152.9 million in fiscal 2006 from $107.4 million in fiscal 2005 due primarily to increased sales in the Construction Services operating segment. Gross margin was 10.1% of net sales in fiscal 2006 compared to 2.0% in fiscal 2005. SG&A expense increased $6.5 million from the prior year due to sales growth in the Construction Services operating segment.
Fiscal 2005 Compared to Fiscal 2004
Consolidated Operations
The following table presents our consolidated operating results for the fiscal years indicated:
| | | | | | | | | | | | | | |
| | | 2005 | | 2004 |
| In millions, except per share | | Actual | | | % of
Net Sales | | %
Change | | Actual | | | % of
Net Sales |
Net sales | | $ | 3,078.9 | | | 100.0% | | 29% | | $ | 2,379.1 | | | 100.0% |
Cost of goods sold | | | 2,580.0 | | | 83.8% | | 29% | | | 2,003.7 | | | 84.2% |
| | | | | | | | | | | | | | |
Gross margin | | | 498.9 | | | 16.2% | | 33% | | | 375.4 | | | 15.8% |
Selling, general and administrative expense | | | 225.9 | | | 7.3% | | 15% | | | 195.8 | | | 8.2% |
Impairment charges and other | | | 5.6 | | | 0.2% | | | | | 69.4 | | | 3.0% |
| | | | | | | | | | | | | | |
Operating income | | | 267.4 | | | 8.7% | | 143% | | | 110.2 | | | 4.6% |
Other income (expense): | | | | | | | | | | | | | | |
Miscellaneous expense | | | (8.0 | ) | | | | | | | (1.6 | ) | | |
Interest expense | | | (24.8 | ) | | -0.8% | | 12% | | | (22.2 | ) | | -0.9% |
Equity in net income of unconsolidated affiliates | | | 53.9 | | | 1.7% | | 31% | | | 41.1 | | | 1.7% |
| | | | | | | | | | | | | | |
Earnings before income taxes | | | 288.5 | | | 9.4% | | 126% | | | 127.5 | | | 5.4% |
Income tax expense | | | 109.1 | | | 3.5% | | 168% | | | 40.7 | | | 1.8% |
| | | | | | | | | | | | | | |
Net earnings | | $ | 179.4 | | | 5.8% | | 107% | | $ | 86.8 | | | 3.6% |
| | | | | | | | | | | | | | |
Average common shares outstanding - diluted | | | 88.5 | | | | | | | | 86.9 | | | |
| | | | | | | | | | | | | | |
Earnings per share - diluted | | $ | 2.03 | | | | | 103% | | $ | 1.00 | | | |
| | | | | | | | | | | | | | |
Net earnings increased $92.6 million to $179.4 million for fiscal 2005, from $86.8 million for fiscal 2004. Fiscal 2005 diluted earnings per share increased $1.03 to $2.03 per share from $1.00 per share in fiscal 2004.
Net sales increased 29%, or $699.8 million, to $3,078.9 million in fiscal 2005 from $2,379.1 million for fiscal 2004. Virtually all of the increase in net sales was due to higher pricing, as volumes, excluding acquisitions and divestitures, were down on a comparative year-over-year basis for Metal Framing and Pressure Cylinders and up slightly for Steel Processing.
Gross margin increased 33%, or $123.5 million, to $498.9 million for fiscal 2005 from $375.4 million for fiscal 2004. A favorable pricing spread accounted for $127.6 million of the increase, offset by a $5.3 million increase in direct labor and manufacturing expenses. Collectively, these factors increased gross margin as a percentage of net sales to 16.2% in fiscal 2005 from 15.8% in fiscal 2004 from 13.6%2004.
SG&A expense decreased to 7.3% of net sales in fiscal 2003.
Selling, general and administrative (“SG&A”) expense remained a consistent2005 compared to 8.2% of net sales.sales in fiscal 2004. In total, SG&A expense increased $13.1$30.1 million, to $225.9 million in fiscal 2005 from $195.8 million in fiscal 2004 from $182.7 million in fiscal 2003.2004. This was mainly due to a $6.3$16.6 million increase in profit sharing expense, which was up significantly due to record earnings. In addition, the acquisition of Unimast, anearnings; a $9.9 million increase in professional fees; and a $2.7 million increase in bad debt expense and higherexpense. The increase in professional fees contributedwas due to $5.5 million of additional expenses associated with meeting the requirements of the Sarbanes-Oxley Act of 2002 (“SOX”) and $5.3 million was due to the increase.ongoing implementation of our enterprise resource planning system (“ERP”). The increase in bad debt expense iswas a result of higher receivables balances, and the increase in professional fees is related to our implementationincreased collection risk of a new enterprise resource planning system. For more information on the system implementation, see the discussion on capital spending in the Liquidity and Capital Resources section.certain customers.
Impairment charges and other for fiscal 2004 includesincluded a $67.4 million pre-tax charge in fiscal 2004 for the impairment of certain assets and other related costs at the Decatur, Alabama, steel-processing facility and a $2.0 million pre-tax charge in fiscal 2004 for the impairment of certain assets related to the European operations of Pressure Cylinders. In fiscal 2003, a favorable adjustmentAn additional pre-tax charge of $5.6 million, was mademainly due to contract termination costs related to the sale of the Decatur facility,
was recognized during the first quarter of fiscal 2002 plant consolidation restructuring charge.2005. Refer to “Item 8. – Financial Statements and Supplementary Data – Notes to Consolidated Financial Statements – Note N – Impairment Charges and Restructuring Expense” for more information.
Miscellaneous expense decreased $5.6in fiscal 2005 increased $6.4 million from fiscal 20032004, largely due to a $4.3 million higher elimination for the minority shareholder’s interest in part tothe net earnings of our consolidated joint ventures. Fiscal 2004 included a $3.6 million gain from the settlement of a hedge position with the Enron bankruptcy estate. In addition, lower usage of the accounts receivable securitization facility duringestate while fiscal 2004 resulted2005 also included a $1.1 million increase in a $1.7 million reduction in related fees.interest income.
A nonrecurring loss of $5.4 million was recognized in fiscal 2003 for potential liabilities relating to certain workers’ compensation claims of Buckeye Steel Castings Company (“Buckeye Steel”) for the period prior to its sale by Worthington in fiscal 1999, when a Worthington guaranty was in place.
Interest expense decreased 10%increased 12%, or $2.6 million, to $24.8 million in fiscal 2005 from $22.2 million in fiscal 2004, from $24.8 million in fiscal 2003 due to lowerhigher average debt balances and lower average interest rates.balances.
Equity in net income of unconsolidated affiliates increased 37%31%, or $11.1$12.8 million, to $53.9 million in fiscal 2005 from $41.1 million in fiscal 2004 from $30.02004. Five of our seven unconsolidated joint ventures had strong double-digit increases in earnings. Collectively, the unconsolidated joint ventures generated approximately $767.0 million in sales in fiscal 2003. The main reasons for the increase2005, which were not reflected in consolidated net sales.
Income tax expense increased in fiscal 2005 compared to fiscal 2004 due to a higher net saleslevel of income and margins at each of our six unconsolidated affiliates. WAVE, TWB, Acerex and Aegis all had record years.
various tax adjustments. Our effective tax rate was 37.8% for fiscal 2005 and 31.9% for fiscal 2004. DuringThe rate change was mainly due to a net unfavorable adjustment of $2.6 million in fiscal 2005 compared to favorable adjustments of $7.7 million recorded in fiscal 2004. The fiscal 2005 net adjustment was comprised of an unfavorable $4.3 million adjustment due to a ruling by the Sixth Circuit Court of Appeals that the state of Ohio’s investment tax credit program was unconstitutional and was partially offset by a $1.7 million favorable adjustment for the revision of estimated tax liabilities resulting from tax audit settlements and related developments. The $7.7 million favorable adjustments in fiscal 2004 a $7.7 million credit was recorded to income tax expense,were comprised of a $6.3 million credit for the favorable resolution of certain tax audits and a $1.4 million credit for an adjustment to deferred taxes. Excluding this $7.7 million credit, the effective tax rate was 38.0%. This increase from 36.5% in fiscal 2003 was due to higher state and local tax rates and a change in our mix of income.
14
Segment Operations
Processed Steel ProductsProcessing
Our Processed Steel ProductsProcessing segment represents approximately 60%represented 56% of consolidated net sales. Its results are significantly impacted bysales in fiscal 2005. The steel pricing environment and the automotive industry which accountssignificantly impacted this segment’s results. After rising steadily in early fiscal 2005, steel prices declined from their peak in September of 2004. Overall, the price of steel in fiscal 2005 was significantly higher than in fiscal 2004. Our ability to raise prices to our customers contributed to an improved spread between our average selling price and material cost. Sales volume to the automotive market for approximately 60% of its net sales,fiscal 2005 was 3% higher than for fiscal 2004, due to market share gains and the steel pricing environment. With theinvolvement in better selling product lines. Big 3Three automotive production volumes were down from fiscal 2003, our volumes have decreased as well. However,about 4% for the increased demandsame period, while North American vehicle production for steel in the latter part of fiscal 2004 led to higher steel prices and an environment that enabled us to significantly improve the spread between our selling prices and material costs, which resulted in a 14% increase in our gross margin.all manufacturers stayed relatively flat.
On May 27,Effective August 1, 2004, we signed an agreement to sellsold our Decatur, Alabama, steel-processing facility and its cold-rolling assets to Nucor for $82.0$80.4 million cash (the “Decatur Sale Transaction”). This transaction closed as of August 1, 2004.in cash. The Decatur assets sold includeat Decatur included the land and buildings, the four-stand tandem cold mill, the temper mill, the pickle line and the annealing furnaces. The sale excluded the slitting and cut-to-length assets and net working capital. We will continue to serve customers requiringby providing steel-processing services in our core business of slitting and cutting-to-length at the currentDecatur site under a long-term building lease with Nucor. Both companies are working closely to provide current customers a seamless transition and uninterrupted supply. The repositioning of our efforts to serve the growing southeastern market will now enable us to focus on our core value-added processing strengths supported by a supply relationship with Nucor, one of our country’s strongest steel producers.
As a result of the sale, agreement, we recorded a $67.4 million pre-tax charge during ourthe fourth quarter ended May 31,of fiscal 2004, primarily for the impairment of assets at the Decatur, Alabama, facility. All but an estimated $0.8 million of the pre-tax charge was non-cash. An additional pre-tax charge estimated at $5.7of $5.6 million, mainly relating to contract termination costs, will bewas recognized during the first quarter of fiscal 2005 ending August 31, 2004.2005.
The following table presents a summary of operating results for the Processed Steel ProductsProcessing segment for the fiscal years indicated:
| | | | | | | | | | | | | | | | | | | | | |
| | | 2004
| | 2003
|
| | | | | | | % of | | % | | | | | | % of |
| Dollars in millions, tons in thousands | | Actual
| | Net Sales
| | Change
| | Actual
| | Net Sales
|
| Net sales | | $ | 1,373.1 | | | | 100.0 | % | | | 2 | % | | $ | 1,343.4 | | | | 100.0 | % |
| Cost of goods sold | | | 1,199.0 | | | | 87.3 | % | | | 1 | % | | | 1,190.4 | | | | 88.6 | % |
| | | |
| | | | | | | | | | | |
| | | | | |
| Gross margin | | | 174.1 | | | | 12.7 | % | | | 14 | % | | | 153.0 | | | | 11.4 | % |
| Selling, general and administrative expense | | | 88.7 | | | | 6.5 | % | | | 10 | % | | | 80.7 | | | | 6.0 | % |
| Impairment charges and other | | | 67.4 | | | | 4.9 | % | | | | | | | (8.7 | ) | | | -0.6 | % |
| | | |
| | | | | | | | | | | |
| | | | | |
| Operating income | | $ | 18.0 | | | | 1.3 | % | | | -78 | % | | $ | 81.0 | | | | 6.0 | % |
| | | |
| | | | | | | | | | | |
| | | | | |
| Tons shipped | | | 3,806 | | | | | | | | -2 | % | | | 3,890 | | | | | |
| Material cost | | $ | 893.7 | | | | 65.1 | % | | | 1 | % | | $ | 883.5 | | | | 65.8 | % |
| | | | | | | | | | | | |
| | | 2005 | | 2004 |
| Dollars in millions, tons in thousands | | Actual | | % of
Net Sales | | %
Change | | Actual | | % of
Net Sales |
Net sales | | $ | 1,719.3 | | 100.0% | | 36% | | $ | 1,265.3 | | 100.0% |
Cost of goods sold | | | 1,492.2 | | 86.8% | | 36% | | | 1,099.0 | | 86.9% |
| | | | | | | | | | | | |
Gross margin | | | 227.1 | | 13.2% | | 37% | | | 166.3 | | 13.1% |
Selling, general and administrative expense | | | 94.4 | | 5.5% | | 14% | | | 83.1 | | 6.6% |
Impairment charges and other | | | 5.6 | | 0.3% | | | | | 67.4 | | 5.3% |
| | | | | | | | | | | | |
Operating income | | $ | 127.1 | | 7.4% | | 704% | | $ | 15.8 | | 1.2% |
| | | | | | | | | | | | |
Tons shipped | | | 3,663 | | | | -3% | | | 3,766 | | |
| | | | | |
Material cost | | $ | 1,267.9 | | 73.7% | | 50% | | $ | 843.7 | | 66.7% |
Operating income decreased $63.0increased $111.3 million, to $18.0$127.1 million in fiscal 20042005 from $81.0$15.8 million in fiscal 2003. The decline was due to the $67.4 million impairment and other charge for the Decatur sale transaction recorded in fiscal 2004 versus the $8.7 million restructuring credit recorded in fiscal 2003.2004. Excluding the effect of the impairment“impairment charges and otherother” line item from each year, operating income increased $13.1$49.5 million, to $85.4$132.7 million, or 7.7% of net sales, in fiscal 20042005 from $72.3$83.2 million, or 6.6% of net sales, in fiscal 2003. A $28.12004. This increase was due to a larger spread of $51.2 million favorable impactbetween average selling price and material cost and a decrease in expenses largely due to operating income resultedthe sale of the Decatur assets. Net sales increased 36%, or $454.0 million, to $1,719.3 million from $1,265.3 million because of increased pricing. Volumes declined slightly compared to the prior fiscal year, but excluding the volumes associated with the assets sold at Decatur in each year, tons shipped increased 3.7% compared to the prior period. SG&A expense for fiscal 2005 was $94.4 million, an increase in the spread between selling prices and material costs, as higher average selling prices were matched against lower-cost inventory. This,of $11.3 million from $83.1 million for fiscal 2004; however, was reduced by an $8.0 million increase in SG&A expense, a $5.2 million increase in labor and manufacturing expenses and a slight decrease in volume, primarily as a result of a drop in tolling tons. SG&A expense as a percentage of net sales, increasedSG&A declined due to 6.5%the significant increase in fiscal 2004 from 6.0%net sales. The increase in fiscal 2003, reflecting higherSG&A was largely due to an increase in profit sharing and bonus expense and an increase inof $6.5 million; higher bad debt expense. The $5.2expense of $3.4 million increaseresulting from the increased collection risk of certain customers, including Tower Automotive; and additional expenses of $2.7 million associated with meeting SOX requirements.
Metal Framing
Fiscal 2005 represented the best year in labor and manufacturing expense isthe history of the Metal Framing segment. This was primarily due to increased profit sharing expense.the wider spread between average selling price and material cost. During fiscal 2005, as spread continued to drive profitability, volumes slowed due to the weak commercial and office construction market. Even though volumes declined in fiscal 2005 compared to fiscal 2004, there were signs that the commercial construction market was improving late in the year. Certain commercial construction indices generally trended higher in fiscal 2005 compared to fiscal 2004, while our largest market, office buildings, declined in activity. In general, commercial construction activity had been depressed for over three years.
15
During the second quarter of fiscal 2005, we entered into an unconsolidated joint venture with Pacific. The focus of this joint venture was on the military housing construction market. Our Metal Framing segment sold steel framing products to the joint venture for its projects. The operating results of the joint venture were included in “Equity in net income of unconsolidated affiliates” on the Consolidated Statement of Earnings for fiscal 2005. During the second quarter of fiscal 2006, we purchased the interest of Pacific (see “Item 8 – Financial Statements and Supplementary Data - Notes to Consolidated Financial Statements – Note Q-Acquisitions” and “Business Strategy” above).
InAlso during the second quarter of fiscal 2004,2005, we formed a consolidated joint venture with Encore, operating under the name Dietrich Metal Framing Canada. This joint venture was formed to manufacture steel framing products for the Canadian market and to offer a variety of proprietary products supplied by our Metal Framing segment posted its best performance ever. From August 2002 untilfacilities in the third quarterU. S. During fiscal 2005, this joint venture was a 60%-owned Canadian limited liability company for which the assets and results of fiscal 2004, we experienced a depressed commercial construction market and deteriorating spreads between average selling prices and material costs. In the first half of fiscal 2004, we also incurred approximately $4.0 million of unanticipated integration costs related to the Unimast acquisition, primarily for temporary labor and repairs and maintenance of equipment and facilities. During the third quarter of fiscal 2004, we began to realize synergies from the acquisition and, aided by an improving economy, spreads widened and demand began to pick up. This trend continued into the fourth quarter of fiscal 2004 as spreads improved dramatically and volume continued to increase. Through the integration, weoperations were able to maintain the combined market shares of Dietrich and Unimast.consolidated in our Metal Framing segment.
The following table presents a summary of operating results for the Metal Framing segment for the fiscal years indicated:
| | | | | | | | | | | | | | | | | | | | | |
| | | 2004
| | 2003
|
| | | | | | | % of | | % | | | | | | % of |
| Dollars in millions, tons in thousands | | Actual
| | Net Sales
| | Change
| | Actual
| | Net Sales
|
| Net sales | | $ | 662.0 | | | | 100.0 | % | | | 23 | % | | $ | 539.4 | | | | 100.0 | % |
| Cost of goods sold | | | 528.2 | | | | 79.8 | % | | | 17 | % | | | 452.4 | | | | 83.9 | % |
| | | |
| | | | | | | | | | | |
| | | | | |
| Gross margin | | | 133.8 | | | | 20.2 | % | | | 54 | % | | | 87.0 | | | | 16.1 | % |
| Selling, general and administrative expense | | | 70.0 | | | | 10.6 | % | | | 11 | % | | | 62.9 | | | | 11.7 | % |
| Impairment charges and other | | | — | | | | | | | | | | | | 1.6 | | | | 0.2 | % |
| | | |
| | | | | | | | | | | |
| | | | | |
| Operating income | | $ | 63.8 | | | | 9.6 | % | | | 183 | % | | $ | 22.5 | | | | 4.2 | % |
| | | |
| | | | | | | | | | | |
| | | | | |
| Tons shipped | | | 781 | | | | | | | | 13 | % | | | 694 | | | | | |
| Material cost | | $ | 364.6 | | | | 55.1 | % | | | 16 | % | | $ | 315.5 | | | | 58.5 | % |
| | | | | | | | | | | | |
| | | 2005 | | 2004 |
| Dollars in millions, tons in thousands | | Actual | | % of
Net Sales | | %
Change | | Actual | | % of
Net Sales |
Net sales | | $ | 843.9 | | 100.0% | | 30% | | $ | 651.6 | | 100.0% |
Cost of goods sold | | | 648.4 | | 76.8% | | 26% | | | 515.7 | | 79.1% |
| | | | | | | | | | | | |
Gross margin | | | 195.5 | | 23.2% | | 44% | | | 135.9 | | 20.9% |
Selling, general and administrative expense | | | 81.7 | | 9.7% | | 22% | | | 67.1 | | 10.3% |
| | | | | | | | | | | | |
Operating income | | $ | 113.8 | | 13.5% | | 65% | | $ | 68.8 | | 10.6% |
| | | | | | | | | | | | |
Tons shipped | | | 657 | | | | -16% | | | 781 | | |
| | | | | |
Material cost | | $ | 498.0 | | 59.0% | | 38% | | $ | 359.7 | | 55.2% |
Operating income increased $41.3$45.0 million, to a record $63.8$113.8 million in fiscal 20042005 from $22.5$68.8 million in fiscal 2003. A volume2004. The primary driver for the increase of 13% included the impact of twelve months of Unimast activity in fiscal 2004 compared to only ten months during fiscal 2003, and was better than the 8% improvementa $95.1 million expansion in the U.S. Census Bureau’s index of office construction. Averagespread between average selling prices increased 9%price and as a result, netmaterial cost. Net sales increased 23%30%, or $122.6$192.3 million, to $662.0$843.9 million in fiscal 20042005 from $539.4$651.6 million in fiscal 2003.2004. This increase was due to a 54% increase in average selling price, which increased net sales by $286.0 million, offset by a 16% volume decrease, which reduced net sales by $93.8 million. Gross margin increased 54%44% to $133.8$195.5 million from $87.0$135.9 million in fiscal 20032004, mostly due to an increase in the spread between average selling pricesprice and material costs and the volume increase mentioned above. Gross margin ascost, partially offset by a percentage of net$41.2 million impact due to lower sales increased to 20.2% in fiscal 2004 from 16.1% in fiscal 2003.volume. Even though SG&A expense increased $7.1$14.6 million, it decreased as a percentage of net sales to 10.6%9.7% in fiscal 20042005 from 11.7%10.3% in fiscal 20032004 due to the significant increase in net sales. SG&A expense increased primarily due to a $3.4$9.2 million increase in profit sharing and bonus expense, related to higher income and a $3.1additional expenses of $3.7 million increase in wagesfor professional fees mainly due mainly to the Unimast acquisition. In addition, a $1.6ERP implementation and $1.3 million restructuring charge was recorded during the second quarter of fiscal 2003.associated with meeting SOX requirements. The combined impact of the factors discussed above was an increase in operating income as a percentage of net sales to 9.6%13.5% in fiscal 20042005 from 4.2%10.6% in fiscal 2003.2004.
Pressure Cylinders
We consideracquired the pressureWestern Cylinder Assets on September 17, 2004. This business manufactures 14.1 oz. and 16.4 oz. disposable cylinders market to be stable. Whilefor products such as hand torches, propane-fueled camping equipment, portable heaters and tabletop grills. These new product lines generated $45.8 million of net sales for us in fiscal 2005 after the acquisition.
In Europe, we have seen reduced demand for certainbeen successful with high-pressure and refrigerant cylinders, but struggled with the liquefied petroleum gas (“LPG”) cylinders during fiscal 2004 and 2003 due to the diminishing impact of the regulations effective April 2002 requiring overfill prevention devices on these cylinders, the impact has not been as significant as originally expected. Increases in total North American unit sales, which represent approximately 80% of total units sales, were offset by declines at our European facilities where the strong Euro has made it unattractive for our customers to export their products. We have had success in the European market with our high-pressure and refrigerant cylinders, but we have struggled with LPG cylinder sales due to overcapacity and declining demand. As a result, an impairment charge of $2.0 million on certain of our EuropeanPortugal LPG assets was recorded duringin the fourth
16
quarter of fiscal 2004. Despite2004 and production of the charge, this segment continues to provide consistent and excellent profitability and returns on capital.LPG cylinders at the Portugal facility ceased during the first quarter of fiscal 2005.
On October 13, 2004, we purchased the 49% interest of our minority partner in the joint venture that operates a pressure cylinder manufacturing facility in Hustopece, Czech Republic.
The following table presents a summary of operating results for the Pressure Cylinders segment for the fiscal years indicated:
| | | | | | | | | | | | | | | | | | | | | |
| | | 2004
| | 2003
|
| | | | | | | % of | | % | | | | | | % of |
| Dollars in millions, units in thousands | | Actual
| | Net Sales
| | Change
| | Actual
| | Net Sales
|
| Net sales | | $ | 328.7 | | | | 100.0 | % | | | 2 | % | | $ | 321.8 | | | | 100.0 | % |
| Cost of goods sold | | | 262.6 | | | | 79.9 | % | | | 3 | % | | | 255.4 | | | | 79.4 | % |
| | | |
| | | | | | | | | | | |
| | | | | |
| Gross margin | | | 66.1 | | | | 20.1 | % | | | 0 | % | | | 66.4 | | | | 20.6 | % |
| Selling, general and administrative expense | | | 34.7 | | | | 10.6 | % | | | 6 | % | | | 32.7 | | | | 10.2 | % |
| Impairment charges and other | | | 2.0 | | | | 0.6 | % | | | | | | | 1.4 | | | | 0.4 | % |
| | | |
| | | | | | | | | | | |
| | | | | |
| Operating income | | $ | 29.4 | | | | 8.9 | % | | | -9 | % | | $ | 32.3 | | | | 10.0 | % |
| | | |
| | | | | | | | | | | |
| | | | | |
| Units shipped | | | 14,670 | | | | | | | | -4 | % | | | 15,235 | | | | | |
| Material cost | | $ | 142.6 | | | | 43.4 | % | | | 0 | % | | $ | 142.0 | | | | 44.1 | % |
| | | | | | | | | | | | |
| | | 2005 | | 2004 |
| Dollars in millions, units in thousands | | Actual | | % of
Net Sales | | %
Change | | Actual | | % of
Net Sales |
Net sales | | $ | 408.3 | | 100.0% | | 24% | | $ | 328.7 | | 100.0% |
Cost of goods sold | | | 334.1 | | 81.8% | | 27% | | | 262.6 | | 79.9% |
| | | | | | | | | | | | |
Gross margin | | | 74.2 | | 18.2% | | 12% | | | 66.1 | | 20.1% |
Selling, general and administrative expense | | | 40.6 | | 9.9% | | 17% | | | 34.7 | | 10.6% |
Impairment charges and other | | | - | | | | | | | 2.0 | | 0.6% |
| | | | | | | | | | | | |
Operating income | | $ | 33.6 | | 8.2% | | 14% | | $ | 29.4 | | 8.9% |
| | | | | | | | | | | | |
Units shipped | | | 36,704 | | | | 150% | | | 14,670 | | |
| | | | | |
Material cost | | $ | 197.5 | | 48.4% | | 38% | | $ | 142.6 | | 43.4% |
Operating income decreased 9%increased 14%, or $2.9$4.2 million, to $33.6 million in fiscal 2005 from $29.4 million in fiscal 2004 from $32.3 million in fiscal 2003. Excluding the impairment charges and other from each year, operating income decreased $2.3 million, to $31.4 million in fiscal 2004 from $33.7 million in fiscal 2003. Net sales increased 2%, or $6.9 million, to $328.7 million in fiscal 2004 from $321.8 million in fiscal 2003. This2004. The increase was primarily due to the benefithigher volumes of a $12.0$19.6 million, gain related to the translation of European sales to U.S. dollars, partially offset by a decline in the spread between average selling price and material cost of steel portable and refrigerant cylinders in North America. Higher unit$11.6 million. Net sales in North America were offset by lower unitincreased 24%, or $79.6 million, to $408.3 million due to higher sales in Europe.volumes, with $45.8 million of this increase attributable to the purchase of the Western Cylinder Assets. The strength of foreign currencies against the U.S. dollar also contributed $10.2 million to net sales. Gross margin wasincreased $8.1 million to $74.2 million for fiscal 2005 from $66.1 million for fiscal 2004. Although SG&A expense decreased slightly lower than in fiscal 2003 because of higher labor and manufacturing expenses in Europe and lower average selling prices in North America, partially offset by favorable pricing in Europe. Operating income was minimally impacted by the favorable exchange rate. The previously mentioned factors decreased operating income as a percentage of net sales, to 8.9% in fiscal 2004 from 10.0% in fiscal 2003.
17
Fiscal 2003 Compared to Fiscal 2002
Consolidated Operations
The following table presents our consolidated operating results for the fiscal years indicated:
| | | | | | | | | | | | | | | | | | | | | |
| | | 2003
| | 2002
|
| | | | | | | % of | | % | | | | | | % of |
| In millions, except per share | | Actual
| | Net Sales
| | Change
| | Actual
| | Net Sales
|
| Net sales | | $ | 2,219.9 | | | | 100.0 | % | | | 27 | % | | $ | 1,745.0 | | | | 100.0 | % |
| Cost of goods sold | | | 1,917.0 | | | | 86.4 | % | | | 30 | % | | | 1,480.2 | | | | 84.8 | % |
| | | |
| | | | | | | | | | | |
| | | | | |
| Gross margin | | | 302.9 | | | | 13.6 | % | | | 14 | % | | | 264.8 | | | | 15.2 | % |
| Selling, general and administrative expense | | | 182.7 | | | | 8.2 | % | | | 10 | % | | | 165.9 | | | | 9.5 | % |
| Impairment charges and other | | | (5.6 | ) | | | -0.3 | % | | | | | | | 64.6 | | | | 3.7 | % |
| | | |
| | | | | | | | | | | |
| | | | | |
| Operating income | | | 125.8 | | | | 5.7 | % | | | 267 | % | | | 34.3 | | | | 2.0 | % |
| Other income (expense): | | | | | | | | | | | | | | | | | | | | |
| Miscellaneous expense | | | (7.2 | ) | | | | | | | | | | | (3.3 | ) | | | | |
| Nonrecurring losses | | | (5.4 | ) | | | | | | | | | | | (21.2 | ) | | | | |
| Interest expense | | | (24.8 | ) | | | -1.1 | % | | | 9 | % | | | (22.7 | ) | | | -1.3 | % |
| Equity in net income of unconsolidated affiliates | | | 30.0 | | | | 1.4 | % | | | 30 | % | | | 23.1 | | | | 1.3 | % |
| | | |
| | | | | | | | | | | |
| | | | | |
| Earnings before income taxes | | | 118.4 | | | | 5.3 | % | | | 1056 | % | | | 10.2 | | | | 0.6 | % |
| Income tax expense | | | 43.2 | | | | 1.9 | % | | | 1056 | % | | | 3.7 | | | | 0.2 | % |
| | | |
| | | | | | | | | | | |
| | | | | |
| Net earnings | | $ | 75.2 | | | | 3.4 | % | | | 1056 | % | | $ | 6.5 | | | | 0.4 | % |
| | | |
| | | | | | | | | | | |
| | | | | |
| Average common shares outstanding - diluted | | | 86.5 | | | | | | | | | | | | 85.9 | | | | | |
| | | |
| | | | | | | | | | | |
| | | | | |
| Earnings per share - diluted | | $ | 0.87 | | | | | | | | 1048 | % | | $ | 0.08 | | | | | |
| | | |
| | | | | | | | | | | |
| | | | | |
Net earningsdollar expense increased $68.7$5.9 million to $75.2 million in fiscal 2003, from $6.5 million in the year ended May 31, 2002 (“fiscal 2002”). Fiscal 2003 diluted earnings per share increased $0.79 per share to $0.87 per share from diluted earnings per share of $0.08 in fiscal 2002. The increase in fiscal 2003 net earnings primarily was due to the inclusion$2.9 million of two significant charges in fiscal 2002 results: a $64.6 million pre-tax restructuring expense and a $21.2 million pre-tax chargeexpenses related to the impairmentpurchase of certain assets. See below for a detailed description of these items.
On July 31, 2002, we acquired the stock of Unimast, a wholly-owned subsidiary of WHX Corporation, for $114.7 million in cash (net of cash acquired) and $9.3Western Cylinder Assets (which included $1.7 million of assumed debt. Unimast manufactures construction steel products, including light gauge steel framing, plastering steel and trim accessories, and serves the construction industry. The resultsamortization expense of Unimast have been included in our Metal Framing segment since the acquisition date.
Net sales increased 27%customer list intangible assets), or $474.9 million, to $2,219.9 million in fiscal 2003 from $1,745.0 million in fiscal 2002. The increase primarily was due to the addition of Unimast and higher average selling prices in Metal Framing combined with higher average selling prices and volumes in Processed Steel Products.
Gross margin increased 14%, or $38.1 million, to $302.9 million in fiscal 2003 from $264.8 million in fiscal 2002. Higher volumes, primarily in Metal Framing due to the Unimast acquisition, contributed $94.2 million. However, the improvement in gross margin was partially offset by an 8%, or $41.9 million, increase in conversion expenses. Furthermore, the net impact of higher material costs in excess of higher average selling prices reduced gross margin by $14.2 million. Together, these factors decreased gross margin as a percentage of net sales to 13.6% in fiscal 2003 from 15.2% in fiscal 2002.
18
SG&A expense decreased as a percentage of net sales to 8.2% in fiscal 2003 from 9.5% in fiscal 2002. In total, SG&A expense increased 10%, or $16.8 million, to $182.7 million in fiscal 2003 from $165.9 million in fiscal 2002. The main reason for the increase was the $14.7 million in additional SG&A expenses due to the acquisition of Unimast. Most of this increase was attributable to compensation and benefits costs. In addition, the prior year results included the favorable impact of $3.7 million in legal settlements. A $10.2 million decrease in bad debt expense partially offset the overall increase.
During the third quarter ended February 28, 2002 (the “third quarter”) of fiscal 2002, we recorded a $64.6 million pre-tax restructuring charge as a result of the consolidation plan announced in January 2002. This plan included the reduction of approximately 542 employees, the closing of six of our facilities and the restructuring of two other facilities. The eight facilities impacted by the consolidation plan affected each of our three business segments - - Processed Steel Products (4), Metal Framing (1) and Pressure Cylinders (3). In our Processed Steel Products segment, we closed facilities located in Malvern, Pennsylvania, and Jackson, Michigan, and we reduced overhead costs at our facility in Louisville, Kentucky. We converted the Rock Hill, South Carolina, facility into a Metal Framing facility serving both Metal Framing and Processed Steel Products. The Metal Framing facility in Fredericksburg, Virginia, was closed and its operations moved to Rock Hill. In our Pressure Cylinders segment, we discontinued the operations of two partnerships in Itu, Brazil, and we closed a production facility in Claremore, Oklahoma. See “Item 8. – Financial Statements and Supplementary Data – Note N – Impairment Charges and Restructuring Expense” for more information.
During the second quarter ended November 30, 2002 (the “second quarter”) of fiscal 2003, we recorded a $5.6 million favorable pre-tax adjustment to the original restructuring charge in fiscal 2002 mentioned above. This credit was the result of higher-than-estimated proceeds from the sale of real estate at our former facility in Malvern, Pennsylvania, and the net reduction of previously established reserves, partially offset by estimated charges for the announced closure of three additional facilities. See “Item 8. – Financial Statements and Supplementary Data – Note N – Impairment Charges and Restructuring Expense” for more information.
As part of our sale of Buckeye Steel in the fiscal year ended May 31, 1999 (“fiscal 1999”), the acquirer assumed certain workers’ compensation liabilities which arose while our workers’ compensation guarantee was in place. The acquirer agreed to indemnify us against claims made on our guarantee related to the assumed workers’ compensation claims. During the second quarter of fiscal 2003, economic conditions caused Buckeye Steel to cease operations and file for bankruptcy thereby raising the issue of the acquirer’s ability to fulfill its obligations. As a result, we recorded a $5.4 million reserve for the estimated potential liability relating to these workers’ compensation claims.
During the third quarter of fiscal 2002, we also recorded a $21.2 million pre-tax charge for the impairment of certain preferred stock and subordinated debt that we received as partial payment from four acquirers when we sold the assets of our Custom Products and Cast Products business segments during fiscal 1999. As economic conditions deteriorated, each of the issuers encountered difficulty making scheduled payments under the terms of the preferred stock and subordinated debt.
Interest expense increased 9%, or $2.1 million, to $24.8 million in fiscal 2003 from $22.7 million in fiscal 2002 due to higher average short-term debt balances, partially offset by lower average interest rates.
Equity in net income of unconsolidated affiliates increased 30%, or $6.9 million, to $30.0 million in fiscal 2003 from $23.1 million in fiscal 2002. The main reasons for the increase were higher net sales at each unconsolidated affiliate and improved margins at WAVE, WSP and TWB. In addition, during fiscal 2003, TWB acquired the ownership interests of Rouge Steel, LTV Steel and Bethlehem Steel, thereby increasing our ownership interest from 33% to 50% and resulting in an increase in equity in netprofit sharing and bonus expense of $1.7 million, and additional expenses of $0.6 million associated with meeting SOX requirements.
Other
The “Other” category includes the Automotive Body Panels, Construction Services and Steel Packaging reporting segments, which are immaterial for purposes of separate disclosure, and also includes income of unconsolidated affiliates of $0.8 million.and expense items not allocated to the operating segments.
Our effective tax rate of 36.5% in fiscal 2003 was unchanged from fiscal 2002.
19
Segment Operations
Processed Steel Products
The following table presents a summary of operating results for the Other category for the fiscal years indicated:
| | | | | | | | | | | | | | | | | | | | | |
| | | 2003
| | 2002
|
| | | | | | | % of | | % | | | | | | % of |
| Dollars in millions, tons in thousands | | Actual
| | Net Sales
| | Change
| | Actual
| | Net Sales
|
| Net sales | | $ | 1,343.4 | | | | 100.0 | % | | | 19 | % | | $ | 1,132.7 | | | | 100.0 | % |
| Cost of goods sold | | | 1,190.4 | | | | 88.6 | % | | | 21 | % | | | 980.6 | | | | 86.6 | % |
| | | |
| | | | | | | | | | | |
| | | | | |
| Gross margin | | | 153.0 | | | | 11.4 | % | | | 1 | % | | | 152.1 | | | | 13.4 | % |
| Selling, general and administrative expense | | | 80.7 | | | | 6.0 | % | | | -7 | % | | | 86.4 | | | | 7.6 | % |
| Impairment charges and other | | | (8.7 | ) | | | -0.6 | % | | | | | | | 52.1 | | | | 4.6 | % |
| | | |
| | | | | | | | | | | |
| | | | | |
| Operating income | | $ | 81.0 | | | | 6.0 | % | | | 495 | % | | $ | 13.6 | | | | 1.2 | % |
| | | |
| | | | | | | | | | | |
| | | | | |
| Tons shipped | | | 3,890 | | | | | | | | 4 | % | | | 3,727 | | | | | |
| Material cost | | $ | 883.5 | | | | 65.8 | % | | | 34 | % | | $ | 658.8 | | | | 58.2 | % |
| | | | | | | | | | | | | | |
| | | 2005 | | 2004 |
| Dollars in millions | | Actual | | | % of
Net Sales | | %
Change | | Actual | | | % of
Net Sales |
Net sales | | $ | 107.4 | | | 100.0% | | -20% | | $ | 133.5 | | | 100.0% |
Cost of goods sold | | | 105.3 | | | 98.0% | | -17% | | | 126.4 | | | 94.7% |
| | | | | | | | | | | | | | |
Gross margin | | | 2.1 | | | 2.0% | | -70% | | | 7.1 | | | 5.3% |
Selling, general and administrative expense | | | 9.2 | | | 8.6% | | -16% | | | 10.9 | | | 8.2% |
| | | | | | | | | | | | | | |
Operating loss | | $ | (7.1 | ) | | -6.6% | | -87% | | $ | (3.8 | ) | | -2.8% |
| | | | | | | | | | | | | | |
Operating incomeloss increased $67.4$3.3 million to $81.0$7.1 million, or 6.6% of net sales, for the year from $3.8 million, or 2.8% of net sales, for fiscal 2004. Net sales were $107.4 million for the year compared to $133.5 million in fiscal 2003 from $13.6 million in fiscal 2002. Most of the improvement was2004 due to the $52.1impact of lower volume of $25.8 million. Gross margin decreased $5.0 million, restructuring expense included in fiscal 2002 resultsto $2.1 million, from $7.1 million and, the $8.7 million restructuring credit recorded in the second quarter of fiscal 2003. In addition, SG&A expense as a percentage of net sales, declinedwas 2.0% compared to 6.0%5.3% in the prior year, primarily due to a narrower spread between average selling price and material cost and the decrease in volume. SG&A expense decreased from $10.9 million in fiscal 2003 from 7.6%2004 to $9.2 million in fiscal 2002. This decrease of $5.7 million primarily was due to the reduction of $5.5 million in bad debt expense. However, despite higher net sales, the decline in the spread between selling prices and material costs decreased gross margin2005, but increased as a percentage of net sales to 11.4%from 8.2% in fiscal 2003 from 13.4%2004 to 8.6% in fiscal 2002. Net sales rose 19%, or $210.7 million, to $1,343.4 million in fiscal 2003 from $1,132.7 million in fiscal 2002. Higher average selling prices, reflecting the rising cost of steel, increased net sales by $124.0 million. Increased shipments to most markets, particularly the automotive industry, contributed $86.7 million in additional net sales. The net result of the factors mentioned above was an increase in operating income as a percentage of net sales to 6.0% in fiscal 2003 from 1.2% in fiscal 2002.2005.
Metal Framing
The following table presents a summary of operating results for the fiscal years indicated:
| | | | | | | | | | | | | | | | | | | | | |
| | | 2003
| | 2002
|
| | | | | | | % of | | % | | | | | | % of |
| Dollars in millions, tons in thousands | | Actual
| | Net Sales
| | Change
| | Actual
| | Net Sales
|
| Net sales | | $ | 539.4 | | | | 100.0 | % | | | 76 | % | | $ | 306.0 | | | | 100.0 | % |
| Cost of goods sold | | | 452.4 | | | | 83.9 | % | | | 84 | % | | | 246.5 | | | | 80.5 | % |
| | | |
| | | | | | | | | | | |
| | | | | |
| Gross margin | | | 87.0 | | | | 16.1 | % | | | 46 | % | | | 59.5 | | | | 19.5 | % |
| Selling, general and administrative expense | | | 62.9 | | | | 11.7 | % | | | 59 | % | | | 39.5 | | | | 12.9 | % |
| Impairment charges and other | | | 1.6 | | | | 0.2 | % | | | | | | | 0.9 | | | | 0.3 | % |
| | | |
| | | | | | | | | | | |
| | | | | |
| Operating income | | $ | 22.5 | | | | 4.2 | % | | | 18 | % | | $ | 19.1 | | | | 6.3 | % |
| | | |
| | | | | | | | | | | |
| | | | | |
| Tons shipped | | | 694 | | | | | | | | 30 | % | | | 532 | | | | | |
| Material cost | | $ | 315.5 | | | | 58.5 | % | | | 105 | % | | $ | 153.8 | | | | 50.3 | % |
20
Operating income increased 18%, or $3.4 million, to $22.5 million in fiscal 2003 from $19.1 million in fiscal 2002 due to higher net sales. The combined impact of increased volumes, attributable to the Unimast acquisition, and higher average selling prices, which were instituted in response to rising raw material costs, resulted in an increase in net sales of 76%, or $233.4 million, to $539.4 million in fiscal 2003 from $306.0 million in fiscal 2002. Excluding Unimast, volumes actually decreased due to a weak commercial construction market. This volume decline, combined with the aforementioned increase in raw material costs, decreased gross margin as a percentage of net sales to 16.1% in fiscal 2003 from 19.5% in fiscal 2002. SG&A expense decreased as a percentage of net sales to 11.7% in fiscal 2003 from 12.9% in fiscal 2002. Overall, SG&A expense increased primarily due to the Unimast acquisition which added $14.7 million, comprised mainly of compensation and benefits expenses. In addition, a $1.6 million restructuring expense was recorded during the second quarter of fiscal 2003. These items partially offset the overall improvement in operating income. The combined impact of the factors discussed above was a decrease in operating income as a percentage of net sales to 4.2% in fiscal 2003 from 6.3% in fiscal 2002.
Pressure Cylinders
The following table presents a summary of operating results for the fiscal years indicated:
| | | | | | | | | | | | | | | | | | | | | |
| | | 2003
| | 2002
|
| | | | | | | % of | | % | | | | | | % of |
| Dollars in millions, units in thousands | | Actual
| | Net Sales
| | Change
| | Actual
| | Net Sales
|
| Net sales | | $ | 321.8 | | | | 100.0 | % | | | 10 | % | | $ | 292.8 | | | | 100.0 | % |
| Cost of goods sold | | | 255.4 | | | | 79.4 | % | | | 8 | % | | | 236.9 | | | | 80.9 | % |
| | | |
| | | | | | | | | | | |
| | | | | |
| Gross margin | | | 66.4 | | | | 20.6 | % | | | 19 | % | | | 55.9 | | | | 19.1 | % |
| Selling, general and administrative expense | | | 32.7 | | | | 10.2 | % | | | -5 | % | | | 34.2 | | | | 11.7 | % |
| Impairment charges and other | | | 1.4 | | | | 0.4 | % | | | | | | | 10.7 | | | | 3.6 | % |
| | | |
| | | | | | | | | | | |
| | | | | |
| Operating income | | $ | 32.3 | | | | 10.0 | % | | | 193 | % | | $ | 11.0 | | | | 3.8 | % |
| | | |
| | | | | | | | | | | |
| | | | | |
| Units shipped | | | 15,235 | | | | | | | | 7 | % | | | 14,280 | | | | | |
| Material cost | | $ | 142.0 | | | | 44.1 | % | | | 9 | % | | $ | 130.9 | | | | 44.7 | % |
Operating income increased 193%, or $21.3 million, to $32.3 million in fiscal 2003 from $11.0 million in fiscal 2002. The improvement primarily was due to higher net sales and the $10.7 million restructuring expense in fiscal 2002, partially offset by the $1.4 million restructuring expense from the second quarter of fiscal 2003. Net sales increased 10%, or $29.0 million, to $321.8 million in fiscal 2003 from $292.8 million in fiscal 2002. Higher European net sales, due to increased volumes and the strengthening of the Euro against the U.S. dollar, contributed $24.6 million to the increase. Strong domestic demand in fiscal 2003 for LPG cylinders increased net sales by $12.4 million and was driven by new regulations that required overfill prevention devices in most states on certain sizes of LPG cylinders. These regulations also positively impacted net sales upon their inception in the fourth quarter of fiscal 2002. Gross margin as a percentage of net sales increased to 20.6% in fiscal 2003 from 19.1% in fiscal 2002. Together, the previously mentioned factors increased operating income as a percentage of net sales to 10.0% in fiscal 2003 from 3.8% in fiscal 2002.
Liquidity and Capital Resources
InDuring fiscal 2004,2006, we generated $79.4$227.1 million in cash from operating activities. This was primarily the result of $146.0 million in net earnings, an $11.6 million increase in accounts receivable and an $81.7 million increase of in accounts payable during the period. The difference between the net cash provided by operating activities representing a $101.3in fiscal 2006 compared to fiscal 2005 was primarily the result of changes in accounts receivable and inventory, which were reflective of the decline of steel prices, discussed above, and increased accounts payable.
Consolidated net working capital was $505.5 million decrease from fiscal 2003.at May 31, 2006, compared to $392.9 million at May 31, 2005. The decrease primarily$112.6 million increase was duemainly attributable to an increase in net working capitalinventory of $33.6 million and a decrease in current maturities of long-term debt of $143.4 million, partially offset by higher net earnings.
Consolidated net working capital of $358.1 million at May 31, 2004 increased $170.0 million from May 31, 2003. The increase was due to a $179.9 millionan increase in receivables caused by higher selling prices and volumes. Lower usage of the accounts receivable securitization facility also contributed to the increase as usage of the facility declined to $60.0 million from $140.0 million at May 31, 2003. Additionally, inventory increased $94.1 million and accounts payable increased $162.4of $82.7 million. These increases were driven by the higher volume of sales and significantly higher steel prices.
21
Our primary investing and financing activities during fiscal 2004 included disbursing $55.2distributing $60.0 million in dividends to shareholders, and spending $29.6$60.1 million on capital projects. These transactions were funded byprojects, including $14.3 million for our ERP system, $7.4 million for a furnace upgrade at our Spartan joint venture galvanizing facility and $5.5 million for the cash flows from our operations, $10.6UltraSTEELTMconversion project. We also invested $16.4 million in proceedsa new aircraft which represented progress payments on an estimated purchase price of $l9.3 million. This investment is recorded in assets held for sale as the aircraft will be sold and leased back during fiscal 2007. It will replace an existing leased aircraft.
We generated $9.1 million in cash from the saleissuance of common shares in connection with stockthrough option exercises and $5.6$47.8 million from the sale of assets, related toincluding the sale of our restructuring effortsinterest in Acerex. Major ongoing projects include our ERP project, the furnace upgrade at Spartan, and the aforementioned sale of certain Metal Framing assets.
Capital spending during fiscal 2004 included the following: $6.1 million in our Processed Steel Products segment; $10.3 million inconversion to UltraSTEELTM production for our Metal Framing segment; $3.2 million in our Pressure Cylinders segment; and $10.0 million in Other. In our Other category, $5.2 million of the $10.0 million in capital spending was related to our new corporate headquarters. In addition, we spent $3.9 million as we began implementing a new enterprise resource planning (“ERP”) system. Over the three-year life of this ERP system implementation, we expect to incrementally spend approximately $35.0 million, with $21.0 million being capitalized and $14.0 million being charged to SG&A expense. For the fiscal year ending May 31, 2005, we expect to spend approximately $10.0 million, of which $6.0 million will be capitalized. Our annual capital spending, barring acquisitions, should remain at or below our annual depreciation expense.segment.
Our short-term liquidity needs are primarily servedmet by a $190.0 million short-term trade accounts receivable securitization (“TARS”) facility, $45.0 million in short-term uncommitted credit lines and a $435.0 million long-term revolving credit facility; a $100.0 million trade accounts receivable securitization facility which maturesand $40.0 million in uncommitted discretionary credit lines. During the third quarter of fiscal 2006, a $20.0 million discretionary credit line was terminated. All credit facilities and lines were unused as of May 2007. The31, 2006 and May 31, 2005. Our 7 1/8% Senior Notes matured on May 15, 2006, and were fully paid.
On September 29, 2005, we amended and restated our $435.0 million long-term revolving credit facility serves asto extend the maturity to September 2010 and to replace the leverage ratio (debt-to-EBITDA) financial covenant with an informal committed backstop tointerest coverage ratio (EBITDA-to-interest expense) financial covenant of not less than 3.25 times. The amended and restated facility also reduces the TARS facility fees payable and uncommitted credit lines while also providing additional credit capacityprovides liquidity beyond the maturity of our 6.70% Notes due in December 2009. The proceeds of the amended and restated facility may be used for general corporate purposes. Our decision to utilize the TARS facilitypurposes including working capital, capital expenditures, acquisitions and uncommitted lines versus the long-term revolving credit facility is dependent on the relative cost of capital obtained through each source.dividends.
The TARS facility has been in place since November 2000 and renews every 364 days. The next renewal will occur in November 2004. Pursuant to the terms of the facility, certain of our subsidiaries sell their accounts receivable, on a revolving basis, to Worthington Receivables Corporation (“WRC”), a wholly-owned, consolidated, bankruptcy-remote subsidiary. In turn, WRC sells, on a revolving basis, undivided ownership interests in this pool of accounts receivable to independent third parties. We retain an undivided interest in this pool and are subject to risk of loss based on the collectibility of the receivables from this retained interest. Because the amount eligible to be sold excludes receivables past due, balances with foreign customers, concentrations over limits with specific customers, and certain reserve amounts, we believe additional risk of loss is minimal. Also because of these exclusions, no discount occurs on the sale, and no gain or loss is recorded. Facility fees of $1.6 million and $3.3 million were incurred during fiscal 2004 and fiscal 2003, respectively, and were recorded as miscellaneous expense. The book value of the retained portion of the pool of accounts receivable approximates fair value. We continue to service the accounts receivable. No servicing asset or liability has been recognized, as our cost to service the accounts receivable is expected to approximate the servicing income. As of May 31, 2004, a $60.0 million undivided interest in this pool had been sold, down from $140.0 million at May 31, 2003.
During fiscal 2004, we increased our available short-term uncommitted lines of credit from $30.0 million with two banks to $45.0 million with three banks. The uncommittedUncommitted lines of credit are extended to us on a discretionary basis. Because the outstanding principal amounts can be reset and adjusted daily, these uncommitted lines typically provide us with the greatest amount of funding flexibility compared to our other sources of short-term capital. These lines supplement our short-term liquidity and allow us to reduce short-term borrowing costs.
At May 31, 2004, we had no borrowings outstanding under the uncommitted lines of credit.
Our $435.0 million long-term revolving credit facility, provided by a group of 15 banks, matures in May 2007. In July 2004, we amended this facility to increase the borrowing limit and eliminate certain covenants. As a result of the restructuring, the facility size was increased from $235.0 million to $435.0 million with the same group of 15 banks. The increase in the facility was necessitated by several factors including higher working capital needs, capital expenditures related to our ERP implementation, and potential acquisitions. In addition, the larger facility significantly enhances our flexibility related to the upcoming long-term note maturity on May 15, 2006. At May 31, 2004, we had no borrowings outstanding under the revolving credit facility.
22
At May 31, 2004,2006, our total debt was $288.4$252.7 million compared to $292.0$388.4 million at the end of fiscal 2003.May 31, 2005. Our debt to total capitalization ratio improved to 29.9%was 21.1% at May 31, 2004,2006, down from 31.5%32.1% at May 31, 2005.
On June 13, 2005, we announced that our board of directors authorized the endrepurchase of up to 10.0 million of our outstanding common shares. The purchases may be made from time to time, on the open market or in private transactions, with consideration given to the market price of the common shares, the nature of other investment opportunities, cash flows from operations and general economic conditions. During fiscal 2003 due to higher net earnings in fiscal 2004.2006, there were no repurchases of common shares.
We expect to continue to assess acquisition opportunities as they arise. Additional financing may be required if we decide to make additional acquisitions. There can be no assurance, however, that any such opportunities will arise, that any such acquisitions will be consummated, or that any needed additional financing will be available on satisfactory terms when required. Absent any othernew acquisitions, we anticipate that cash, flows from operationsshort-term investments, cash provided
by operating activities and unused borrowing capacity should be sufficient to fund expected normal operating costs, dividends, working capital, and capital expenditures for our existing businesses.
Dividend Policy
Dividends are declared at the discretion of our board of directors. Our board of directors reviews the dividend quarterly and establishes the dividend rate based upon our financial condition, results of operations, capital requirements, current and projected cash flows, business prospects and other factors which are deemed relevant. While we have paid a dividend every quarter since becoming a public company in 1968, there is no guarantee that this will continue in the future.
Contractual Cash Obligations and Other Commercial Commitments
The following table summarizes our contractual cash obligations as of May 31, 2004.2006. Certain of these contractual obligations are reflected on our consolidated balance sheet, while others are disclosed as future obligations under accounting principles generally accepted in the United States.
| | | | | | | | | | | | | | | | | | | | | |
| | | Payments Due by Period
|
| | | | | | | Less Than | | 1 - 3 | | 4 - 5 | | After |
| In millions | | Total
| | 1 Year
| | Years
| | Years
| | 5 Years
|
| Long-term debt | | $ | 289.8 | | | $ | 1.4 | | | $ | 143.4 | | | $ | 145.0 | | | $ | — | |
| Capital lease obligations | | | — | | | | — | | | | — | | | | — | | | | — | |
| Operating leases | | | 49.5 | | | | 8.6 | | | | 12.3 | | | | 10.5 | | | | 18.1 | |
| Unconditional purchase obligations | | | 35.5 | | | | 2.4 | | | | 4.7 | | | | 4.7 | | | | 23.7 | |
| Other long-term obligations | | | — | | | | — | | | | — | | | | — | | | | — | |
| | | |
| | | |
| | | |
| | | |
| | | |
| |
| Total contractual cash obligations | | $ | 374.8 | | | $ | 12.4 | | | $ | 160.4 | | | $ | 160.2 | | | $ | 41.8 | |
| | | |
| | | |
| | | |
| | | |
| | | |
| |
| | | | | | | | | | | | | | | |
| | | Payments Due by Period |
| In millions | | Total | | Less Than
1 Year | | 1 - 3
Years | | 4 - 5
Years | | After
5 Years |
Long-term debt | | $ | 245.0 | | $ | - | | $ | - | | $ | 145.0 | | $ | 100.0 |
Interest expense on long-term debt | | | 86.9 | | | 15.0 | | | 30.1 | | | 20.4 | | | 21.4 |
Operating leases | | | 68.3 | | | 10.9 | | | 21.0 | | | 16.4 | | | 20.0 |
Unconditional purchase obligations | | | 30.7 | | | 2.4 | | | 4.7 | | | 4.7 | | | 18.9 |
| | | | | | | | | | | | | | | |
Total contractual cash obligations | | $ | 430.9 | | $ | 28.3 | | $ | 55.8 | | $ | 186.5 | | $ | 160.3 |
| | | | | | | | | | | | | | | |
The interest expense on long-term debt is computed by using the fixed rates of the debt including the interest rate swap hedge. The unconditional purchase obligations are to secure access to a facility used to regenerate acid used in three steel processing facilities. These three facilities are to deliver their spent acid for processing annually through fiscal 2019.
The following table summarizes our other commercial commitments as of May 31, 2004. Certain of these2006. These commercial commitments are not reflected on our consolidated balance sheet.
| | | | | | | | | | | | | | | |
| | | Commitment Expiration per Period |
| In millions | | Total | | Less Than
1 Year | | 1 - 3
Years | | 4 - 5
Years | | After
5 Years |
Lines of credit | | $ | 435.0 | | $ | - | | $ | - | | $ | 435.0 | | $ | - |
Standby letters of credit | | | 11.5 | | | 11.5 | | | - | | | - | | | - |
Guarantees | | | 4.7 | | | 4.7 | | | - | | | - | | | - |
| | | | | | | | | | | | | | | |
| | | | | |
Total commercial commitments | | $ | 451.2 | | $ | 16.2 | | $ | - | | $ | 435.0 | | $ | - |
| | | | | | | | | | | | | | | |
Off Balance Sheet Arrangements
We had no material off balance sheet while others are disclosed as future obligations underarrangements at May 31, 2006.
Recently Issued Accounting Standards
In November 2004, the Financial Accounting Standards Board (“FASB”) issued Statement of Financial Accounting Standards (“SFAS”) No. 151,Inventory Costs, an amendment of ARB No. 43, Chapter 4 (“SFAS 151”).
SFAS 151 amends the guidance in Accounting Research Bulletin No. 43, Chapter 4,Inventory Pricing to clarify the accounting principles generally acceptedfor abnormal amounts of idle facility expense, freight, handling cost and wasted material (spoilage). In addition, SFAS 151 requires that allocation of fixed production overhead to the costs of conversion be based on the normal capacity of the production facilities. SFAS 151 is effective for inventory costs incurred beginning June 1, 2006. We do not expect the adoption of SFAS 151 to have a material impact on our financial position or results of operations.
In December 2004, the FASB issued SFAS No. 123 (revised 2004),Share-Based Payment(“SFAS 123(R)”).SFAS 123(R) is a revision of SFAS 123 and it supercedes APB No. 25 and amends SFAS No. 95,Statement of Cash Flows.Generally, the approach in SFAS 123(R) is similar to the approach described in SFAS 123. However, SFAS 123(R) requires all share-based payments to employees, including grants of employee stock options, to be recognized in the United States.| | | | | | | | | | | | | | | | | | | | | |
| | | Commitment Expiration per Period
|
| | | | | | | Less Than | | 1 - 3 | | 4 - 5 | | After |
| In millions | | Total
| | 1 Year
| | Years
| | Years
| | 5 Years
|
| Lines of credit | | $ | 235.0 | | | $ | — | | | $ | 235.0 | | | $ | — | | | $ | — | |
| Standby letters of credit | | | 10.6 | | | | 10.6 | | | | — | | | | — | | | | — | |
| Guarantees | | | 5.4 | | | | 5.0 | | | | 0.4 | | | | — | | | | — | |
| Standby repurchase obligations | | | — | | | | — | | | | — | | | | — | | | | — | |
| Other commercial commitments | | | — | | | | — | | | | — | | | | — | | | | — | |
| | | |
| | | |
| | | |
| | | |
| | | |
| |
| Total commercial commitments | | $ | 251.0 | | | $ | 15.6 | | | $ | 235.4 | | | $ | — | | | $ | — | |
| | | |
| | | |
| | | |
| | | |
| | | |
| |
23
Environmental
We believe environmental issues will not have a material effect on capital expenditures, future results of operations or financial position.
Inflation
The effects of inflation on our operations were not significant during the periods presented in the consolidated financial statements.
Critical Accounting Policies
The discussion and analysis of our financial condition and results of operations are based upon our consolidated financial statements, which have been prepared in accordance with accounting principles generally accepted in the United States.U.S. The preparation of these consolidated financial statements requires us to make estimates and assumptions that affect the reported amounts of assets and liabilities and the disclosure of contingent assets and liabilities at the date of the consolidated financial statements and the reported amounts of revenues and expenses during the reporting period. We continually evaluate our estimates, including those related to our allowance for doubtful accounts,valuation of receivables, intangible assets, accrued liabilities, income and other tax accruals, and contingencies and litigation. We base our estimates on historical experience and various other assumptions that we believe to be reasonable under the circumstances. These results form the basis for making judgments about the carrying values of assets and liabilities that are not readily apparent from other sources. Critical accounting policies are defined as those that reflect our significant judgments and uncertainties that could potentially result in materially different results under different assumptions and conditions. Although actual results historically have not deviated significantly from those determined using our estimates, as discussed below, our financial position or results of operations could be materially different if we were to report under different conditions or to use different assumptions in the application of such policies. We believe the following accounting policies are the most critical to us since these are the primary
areas where financial information is subject to our estimates, assumptions and judgment in the preparation of our consolidated financial statements.
Revenue Recognition:We recognize revenue upon transfer of title and risk of loss provided evidence of an arrangement exists, pricing is fixed and determinable, and collectibility is probable. In circumstances where the collection of payment is highly questionable at the time of shipment, we defer recognition of revenue until payment is collected. We provide an allowance for returns based on experience and current customer activities. Within Construction Services, we recognize revenue on a percentage-of-completion method.
Receivables:We review our receivables on a monthly basis to ensure that they are properly valued and collectible. This is accomplished through two contra-receivable accounts: returns and allowances and allowance for doubtful accounts. Returns and allowances isare used to record estimates of returns or other allowances resulting from quality, delivery, discounts or other issues affecting the value of receivables. This account is estimated based on historical trends and current market conditions, with the offset recorded to net sales.
The allowance for doubtful accounts is used to record the estimated risk of loss related to the customers’ ability to pay, including the risk associated with our retained interest in the pool of receivables sold through our TARS facility.pay. This allowance is maintained at a level that we consider appropriate based on factors that affect collectibility, such as the financial health of the customer, historical trends of charge-offs and recoveries, and current and projected economic and market conditions. As we monitor our receivables, we identify customers that may have a problem paying, and we adjust the allowance accordingly, with the offset to SG&A expense.
The recent rise in steel prices and related increase in our receivables has increased the risk of collectibility. We have evaluated this risk and have made appropriate adjustments to these two allowance accounts. While we believe these allowances are adequate, deteriorationchanges in economic conditions, the financial health of customers, and bankruptcy settlements could adversely impact our future earnings.
Impairment of Long-Lived Assets: We review the carrying value of our long-lived assets, including intangible assets, whenever events or changes in circumstances indicate that the carrying value of an asset or a group of assets may not be realizable.recoverable. Accounting standards require an impairment charge to be recognized in the financial statements if the carrying amount of an asset or group of assets exceeds the undiscounted cash flows generated by that asset or group of assets would generate.assets. The loss recognized would be the difference between the fair value and the carrying amount of the asset or group of assets.
24
Annually at the end of our fiscal third quarter, we review goodwill for impairment using the present value technique to determine the estimated fair value of goodwill associated with each reporting entity. There are three significant sets of values used to determine the fair value: estimated future discounted cash flows, capitalization rate and tax rates. The estimated future discounted cash flows used in the model are based on planned growth with an assumed perpetual growth rate. The capitalization rate is based on our current cost of debt and equity capital. Tax rates are maintained at current levels.
Accounting for Derivatives and Other Contracts at Fair Value:We use derivatives in the normal course of business to manage our exposure to fluctuations in commodity prices, and foreign currency and interest rates. These derivatives are based on quoted market values. These estimates are based upon valuation methodologies deemed appropriate in the circumstances; however, the use of different assumptions could affect the estimated fair values.
Restructuring Reserves:We periodically evaluate a number of factors to determine the appropriateness and reasonableness of our restructuring reserves. These estimates involve a number of risks and uncertainties, some of which may be beyond our control. Actual results may differ from our estimates and may require adjustments to our restructuring reserves and operating results in future periods.
Stock-Based Compensation:The possible treatmentWe currently account for employee and non-employee stock option plans under the recognition and measurement principles of employee stock options and employee stock purchase plan shares as compensation expenseAPB Opinion No. 25,Accounting for Stock Issued to Employees, and the resulting proper valuationrelated interpretations.No stock-based employee compensation cost is reflected in net earnings, as all options granted under our plans had an exercise price equal to the fair market value of such charges is currently a controversial issue. Ifthe underlying common shares on the grant date. Beginning in fiscal 2007, we elected, or werewill be required to record an expense for our stock-based compensation plans using the fair value method our results would be affected. For example,prescribed in fiscal 2004, fiscal 2003 and fiscal 2002, hadSFAS No. 123(R). Had we accounted for stock-based compensation plans using thethis fair value method, prescribed in SFAS No. 123 as amended by SFAS No. 148, basicwe estimate that diluted earnings per share would have been reduced by $0.02$0.03 per share in each year. Although we are not currently required to record any compensation expense using the fair value methodfiscal 2006, $0.03 in connection with option grants that have an exercise price at or above fair market value at the grant date, it is possible that future laws or regulations will require us to treat all stock-based compensation as an expense using the fair value method. See “Item 8. – Financial Statementsfiscal 2005 and Supplementary Data – Note A – Summary of Significant Accounting Policies – Stock-Based Compensation” and “Item 8. – Financial Statements and Supplementary Data – Note F – Stock-Based Compensation” for a more detailed presentation of accounting for stock-based compensation plans.$0.02 in fiscal 2004.
Income Taxes:In accordance with the provisions of SFAS No. 109,Accounting for Income Taxes, we account for income taxes using the asset and liability method. The asset and liability method requires the recognition of deferred tax assets and liabilities for expected future tax consequences of temporary differences that currently exist between the tax basesbasis and financial reporting basesbasis of our assets and liabilities. In assessing the
realizability of deferred tax assets, we consider whether it is more likely than not that some or a portion of the deferred tax assets will not be realized. We provide a valuation allowance for deferred income tax assets when, in our judgment, based upon currently available information and other factors, it is more likely than not that a portion of such deferred income tax assets will not be realized. The determination of the need for a valuation allowance is based on an on-going evaluation of current information including, among other things, estimates of future earnings in different tax jurisdictions and the expected timing of deferred income tax asset reversals. We believe that the determination to record a valuation allowance to reduce deferred income tax assets is a critical accounting estimate because it is based on an estimate of future taxable income in the United States,various tax jurisdictions in which we do business, which is susceptible to change and may or may not occur, and because the impact of adjusting a valuation allowance may be material.
We have a reserve for taxes that may become payable as a result of audits in future periods with respect to previously filed tax returns included in long-term liabilities. It is our policy to establish reserves for taxesand associated interest and penalties that may become payable in future years as a result of an examinationaudits by taxing authorities. WeWhile we believe the positions taken on previously filed tax returns are appropriate, we have established the reserves based upon our assessment of exposure associated with permanent tax differences, tax credits and interest expense applied to temporary difference adjustments.reserves in recognition that various taxing authorities may challenge our positions. The tax reserves are analyzed periodically and adjustments are made, as events occur to warrant adjustment to the reserve.reserve, such as lapsing of applicable statutes of limitations, conclusion of tax audits, additional exposure based on current calculations, identification of new issues, release of administrative guidance or court decisions affecting a particular tax issue.
Self-Insurance Reserves:We are largely self-insured with respect to workers’ compensation, general liability, property damage, employee medical claims and other potential losses. In order to reduce risk and better manage overall loss exposure, we purchase stop-loss insurance that covers individual claims in excess of the deductible amounts. We maintain reserves for the estimated cost to settle open claims as well as an estimate of the cost of claims that have been incurred but not reported. These estimates are based on third-party actuarial valuations that take into consideration the historical average claim volume, the average cost for settled claims, current trends in claim costs, changes in our business and workforce, general economic factors and other assumptions believed to be reasonable under the circumstances. The estimated reserves for these liabilities could be affected if future occurrences and claims differ from assumptions used and historical trends. Facility consolidations, focus on and investment in safety initiatives, and an emphasis on property loss prevention and product quality has resulted in an improvement in our loss history and the related assumptions used to analyze these reserves. This improvement resulted in a $5.3 million reduction to these insurance reserves that was recorded during the second quarter of fiscal 2006. We will continue to review these reserves on a quarterly basis, or more frequently if factors dictate a more frequent review is warranted.
The critical accounting policies discussed herein are not intended to be a comprehensive list of all of our accounting policies. In many cases, the accounting treatment of a particular transaction is specifically dictated by accounting principles generally accepted in the United States, with no need for our judgment in their application. There are also areas in which our judgment in selecting an available alternative would not produce a materially
25
different result. Other accounting policies also have a significant effect on our consolidated financial statements, and some of these policies require the use of estimates and assumptions. See “Item 8. – Financial Statements and Supplementary Data – Note A – Summary of Significant Accounting Policies” for more information.
Item 7A. – Quantitative and Qualitative Disclosures About Market Risk
In the normal course of business, we are exposed to various market risks. We continually monitor these risks and regularly develop appropriate strategies to manage them. Accordingly, from time to time, we may enter into certain derivative financial and commodity instruments. These instruments are used solely to mitigate market exposure and are not used for trading or speculative purposes.
Interest Rate Risk
At May 31,We entered into an interest rate swap in October 2004, which was amended December 17, 2004. The swap had a notional amount of $100 million to hedge changes in cash flows attributable to changes in the LIBOR rate associated with the December 17, 2004, issuance of the unsecured Floating Rate Senior Notes due December 2014. See “Item 8 – Financial Statements and Supplementary Data – Notes to Consolidated Financial Statements – Note C – Debt.” The critical terms of the derivative correspond with the critical terms of the underlying exposure. The interest rate swap was executed with a highly rated financial institution. We pay a fixed rate of 4.46% and receive a variable rate based on six-month LIBOR. A sensitivity analysis of changes in the interest rate yield curve associated
with our long-term debt was comprised primarily of fixed-rate instruments. Therefore, the fair value of this debt is sensitive to fluctuations in interest rates. We do not expectrate swap indicates that a 1% increase10% decline in interest ratesthe yield curve would materially impactreduce the fair value of our long-term debt, our results of operations or cash flows absent an election to repurchase or retire all or a portion of the fixed-rate debt at prices above carrying value.interest rate swap by $3.2 million.
Foreign Currency Risk
The translation of our foreign operations from their local currencies tointo U.S. dollars subjects the U.S. dollar subjects usCompany to exposure related to fluctuating exchange rates. We doDerivative instruments are not use derivative instrumentsused to manage this risk. However, we dothe Company does make limited use of forward contracts to manage our exposure to certain intercompany loans with our foreign affiliates. Such contracts limit our exposure to both favorable and unfavorable currency fluctuations. At May 31, 2004,2006, the difference between the contract and book value was not material to ourthe Company’s financial position, results of operations or cash flows. We do not expect that aA 10% change in the exchange rate to the U.S. dollar forward rate wouldis not expected to materially impact ourthe financial position, results of operations, or cash flows. A sensitivity analysis of changes in the U.S. dollar on these foreign currency-denominated contracts indicates that if the U.S. dollar uniformly weakened by 10% against all of ourthese currency exposures, the fair value of these instruments would decrease by $3.8$4.7 million. Any resulting changes in fair value would be offset by changes in the underlying hedged balance sheet position. The sensitivity analysis assumes a parallel shift in foreign currency exchange rates. The assumption that exchange rates change in parallel may overstate the impact of changing exchange rates on assets and liabilities denominated in a foreign currency.
Commodity Price Risk
We are exposed to market risk for price fluctuations on purchases of steel, natural gas, zinc (see additional information below regarding natural gas and zinc) and other raw materials and utility requirements. We attemptThe Company attempts to negotiate the best prices for our commodities and to competitively price our products and services to reflect the fluctuations in market prices for our commodities.prices.
We selectively use derivativeDerivative financial instruments are selectively used to manage our exposure to fluctuations in the cost of our supply of natural gas and zinc. These contracts cover periods commensurate with known or expected exposures through 2008. We do not hold anyNo derivatives are held for trading purposes. No credit loss is anticipated, as the counterparties to these agreements are major financial institutions with high credit ratings.that are highly rated. The derivatives are classified as cash flow hedges. The effective portions of the changes in the fair values of these derivatives are recorded in other comprehensive income and are reclassified to cost of goods sold in the period in which earnings are impacted by the hedged items or in the period that the transaction no longer qualifies as a cash flow hedge. There were no transactions that ceased to qualify as a cash flow hedge in fiscal 2004.2006.
Notional transaction amounts and fair values for our outstanding commodity derivative positions as of May 31, 2004 and 2003, are summarized below. Fair values of the derivatives do not consider the offsetting underlying hedged item.
26
| | | | | | | | | | | | | | | | | | | | | |
| | | 2004
| | 2003
| | Change |
| | | Notional | | Fair | | Notional | | Fair | | In |
| In millions | | Amount
| | Value
| | Amount
| | Value
| | Fair Value
|
| Zinc | | $ | 21.2 | | | $ | 5.0 | | | $ | 28.5 | | | $ | (0.8 | ) | | $ | 5.8 | |
| Natural gas | | | 4.1 | | | | 1.4 | | | | — | | | | — | | | | 1.4 | |
A sensitivity analysis of changes in the price of hedged commodities indicates that a 10% decline in zinc prices would reduce the fair value of our hedge position by $2.6$4.0 million. A similar 10% decline in natural gas prices would reduce the fair value of ourthe natural gas hedge position by $0.5$1.0 million. Any resulting changes in fair value would be recorded as adjustments to other comprehensive income.
27
Notional transaction amounts and fair values for the outstanding derivative positions as of May 31, 2006 and 2005 are summarized below. Fair values of the derivatives do not consider the offsetting underlying hedged item.
| | | | | | | | | | | | | | | | |
| | | May 31, 2006 | | May 31, 2005 | | | Change In Fair Value |
| In millions | | Notional
Amount | | Fair
Value | | Notional
Amount | | Fair
Value | | |
Zinc | | $ | 11.2 | | $ | 28.3 | | $ | 15.5 | | $ | 5.7 | | | $ | 22.6 |
Natural gas | | | 6.6 | | | 3.3 | | | 10.1 | | | 2.5 | | | | 0.8 |
Interest rate | | | 100.0 | | | 7.6 | | | 100.0 | | | (1.0 | ) | | | 8.6 |
Safe Harbor
This page intentionally left blankQuantitative and qualitative disclosures about market risk include forward-looking statements with respect to management’s opinion about risks associated with our use of derivative instruments. These statements are based on certain assumptions with respect to market prices and industry supply of, and demand for, steel products and certain raw materials. To the extent these assumptions prove to be inaccurate, future outcomes with respect to hedging programs may differ materially from those discussed in the forward-looking statements.
28
Item 8. – Financial Statements and Supplementary Data
Report of Independent Registered Public Accounting Firm
The Board of Directors and Shareholders
Worthington Industries, Inc.:
We have audited the accompanying consolidated balance sheets of Worthington Industries, Inc. and subsidiaries as of May 31, 20042006 and 2003,2005, and the related consolidated statements of earnings, shareholders’ equity, and cash flows for each of the years in the three-year period ended May 31, 2004.2006. In connection with our audits of the consolidated financial statements, we also have audited the financial statement schedule of valuation and qualifying accounts. These consolidated financial statements and the financial statement schedule are the responsibility of the Company’s management. Our responsibility is to express an opinion on these consolidated financial statements and the financial statement schedule based on our audits.
We conducted our audits in accordance with the standards of the Public Company Accounting Oversight Board (United States). Those standards require that we plan and perform the audit to obtain reasonable assurance about whether the financial statements are free of material misstatement. An audit includes examining, on a test basis, evidence supporting the amounts and disclosures in the financial statements. An audit also includes assessing the accounting principles used and significant estimates made by management, as well as evaluating the overall financial statement presentation. We believe that our audits provide a reasonable basis for our opinion.
In our opinion, the consolidated financial statements referred to above present fairly, in all material respects, the financial position of Worthington Industries, Inc. and subsidiaries as of May 31, 20042006 and 2003,2005, and the results of their operations and their cash flows for each of threethe years in the three-year period ended May 31, 20042006, in conformity with accounting principlesU.S. generally accepted in the United States of America.accounting principles. Also, in our opinion, the related financial statement schedule, when considered in relation to the basic consolidated financial statements taken as a whole, presents fairly, in all material respects, the information set forth therein.
We also have audited, in accordance with the standards of the Public Company Accounting Oversight Board (United States), the effectiveness of Worthington Industries, Inc. and subsidiaries’ internal control over financial reporting as of May 31, 2006, based on criteria established in Internal Control—Integrated Framework issued by the Committee of Sponsoring Organizations of the Treadway Commission (COSO), and our report dated August 11, 2006, expressed an unqualified opinion on management’s assessment of, and the effective operation of, internal control over financial reporting.
August 11, 2006
Columbus, Ohio
June 18, 2004, except as to Note C paragraph 3, which is as of July 22, 2004
29
WORTHINGTON INDUSTRIES, INC.
CONSOLIDATED BALANCE SHEETS
(Dollars in thousands)| | | | | | | | | |
| | | May 31,
|
| | | 2004
| | 2003
|
ASSETS | | | | | | | | |
| Current assets: | | | | | | | | |
| Cash and cash equivalents | | $ | 1,977 | | | $ | 1,139 | |
| Receivables, less allowances of $6,870 and $5,267 at May 31, 2004 and 2003 | | | 348,833 | | | | 169,967 | |
| Inventories | | | | | | | | |
| Raw materials | | | 185,426 | | | | 116,112 | |
| Work in process | | | 97,007 | | | | 77,975 | |
| Finished products | | | 80,473 | | | | 74,896 | |
| | | |
| | | |
| |
| | | | 362,906 | | | | 268,983 | |
| Income taxes receivable | | | — | | | | 11,304 | |
| Assets held for sale | | | 95,571 | | | | 5,307 | |
| Deferred income taxes | | | 3,963 | | | | 20,783 | |
| Prepaid expenses and other current assets | | | 19,861 | | | | 28,762 | |
| | | |
| | | |
| |
| Total current assets | | | 833,110 | | | | 506,246 | |
| Investments in unconsolidated affiliates | | | 109,040 | | | | 81,221 | |
| Goodwill | | | 117,769 | | | | 116,781 | |
| Other assets | | | 27,826 | | | | 30,777 | |
| Property, plant and equipment | | | | | | | | |
| Land | | | 20,456 | | | | 22,731 | |
| Buildings and improvements | | | 222,258 | | | | 258,241 | |
| Machinery and equipment | | | 768,160 | | | | 937,116 | |
| Construction in progress | | | 6,452 | | | | 3,061 | |
| | | |
| | | |
| |
| | | | 1,017,326 | | | | 1,221,149 | |
| Less accumulated depreciation | | | 461,932 | | | | 478,105 | |
| | | |
| | | |
| |
| | | | 555,394 | | | | 743,044 | |
| | | |
| | | |
| |
| Total assets | | $ | 1,643,139 | | | $ | 1,478,069 | |
| | | |
| | | |
| |
LIABILITIES AND SHAREHOLDERS’ EQUITY | | | | | | | | |
| Current liabilities: | | | | | | | | |
| Accounts payable | | $ | 313,909 | | | $ | 222,987 | |
| Notes payable | | | — | | | | 1,145 | |
| Accrued compensation, contributions to employee benefit plans and related taxes | | | 56,080 | | | | 40,438 | |
| Dividends payable | | | 13,899 | | | | 13,752 | |
| Other accrued items | | | 38,469 | | | | 38,655 | |
| Income taxes payable | | | 51,357 | | | | — | |
| Current maturities of long-term debt | | | 1,346 | | | | 1,194 | |
| | | |
| | | |
| |
| Total current liabilities | | | 475,060 | | | | 318,171 | |
| Other liabilities | | | 53,091 | | | | 50,039 | |
| Long-term debt | | | 288,422 | | | | 289,689 | |
| Deferred income taxes | | | 104,216 | | | | 143,444 | |
| Contingent liabilities and commitments - Note G | | | — | | | | — | |
| Minority interest | | | 41,975 | | | | 40,432 | |
| Shareholders’ equity: | | | | | | | | |
| Preferred shares, without par value; authorized - 1,000,000 shares; issued and outstanding - none | | | — | | | | — | |
| Common shares, without par value; authorized - 150,000,000 shares; issued and outstanding, 2004 - 86,855,642 shares, 2003 - 85,948,636 shares | | | — | | | | — | |
| Additional paid-in capital | | | 131,255 | | | | 121,390 | |
| Cumulative other comprehensive loss, net of taxes of $(1,414) and $1,004 at May 31, 2004 and 2003 | | | (2,393 | ) | | | (5,168 | ) |
| Retained earnings | | | 551,512 | | | | 520,072 | |
| | | |
| | | |
| |
| | | | 680,374 | | | | 636,294 | |
| | | |
| | | |
| |
| Total liabilities and shareholders’ equity | | $ | 1,643,139 | | | $ | 1,478,069 | |
| | | |
| | | |
| |
| | | | | | | |
| | | May 31, | |
| | | 2006 | | 2005 | |
| ASSETS | | | | | | | |
Current assets: | | | | | | | |
Cash and cash equivalents | | $ | 56,216 | | $ | 57,249 | |
Short-term investments | | | 2,173 | | | - | |
Receivables, less allowances of $4,964 and $11,225 at May 31, 2006 and 2005 | | | 404,553 | | | 404,506 | |
Inventories: | | | | | | | |
Raw materials | | | 266,818 | | | 227,718 | |
Work in process | | | 104,244 | | | 97,168 | |
Finished products | | | 88,295 | | | 100,837 | |
| | | | | | | |
| | | 459,357 | | | 425,723 | |
Assets held for sale | | | 23,535 | | | 4,644 | |
Deferred income taxes | | | 15,854 | | | 19,490 | |
Prepaid expenses and other current assets | | | 34,553 | | | 26,721 | |
| | | | | | | |
Total current assets | | | 996,241 | | | 938,333 | |
Investments in unconsolidated affiliates | | | 123,748 | | | 136,856 | |
Goodwill | | | 177,771 | | | 168,267 | |
Other assets | | | 55,733 | | | 33,593 | |
Property, plant and equipment: | | | | | | | |
Land | | | 19,595 | | | 20,632 | |
Buildings and improvements | | | 234,091 | | | 231,651 | |
Machinery and equipment | | | 815,638 | | | 801,289 | |
Construction in progress | | | 27,904 | | | 18,124 | |
| | | | | | | |
| | | 1,097,228 | | | 1,071,696 | |
Less accumulated depreciation | | | 550,324 | | | 518,740 | |
| | | | | | | |
| | | 546,904 | | | 552,956 | |
| | | | | | | |
Total assets | | $ | 1,900,397 | | $ | 1,830,005 | |
| | | | | | | |
| LIABILITIES AND SHAREHOLDERS’ EQUITY | | | | | | | |
Current liabilities: | | | | | | | |
Accounts payable | | $ | 362,883 | | $ | 280,181 | |
Notes payable | | | 7,684 | | | - | |
Accrued compensation, contributions to employee benefit plans and related taxes | | | 49,784 | | | 56,773 | |
Dividends payable | | | 15,078 | | | 14,950 | |
Other accrued items | | | 36,483 | | | 45,867 | |
Income taxes payable | | | 18,874 | | | 4,240 | |
Current maturities of long-term debt | | | - | | | 143,432 | |
| | | | | | | |
Total current liabilities | | | 490,786 | | | 545,443 | |
Other liabilities | | | 55,249 | | | 56,262 | |
Long-term debt | | | 245,000 | | | 245,000 | |
Deferred income taxes | | | 114,610 | | | 119,462 | |
Contingent liabilities and commitments - Note G | | | - | | | - | |
Minority interest | | | 49,446 | | | 43,002 | |
Shareholders’ equity: | | | | | | | |
Preferred shares, without par value; authorized - 1,000,000 shares; issued and outstanding - none | | | - | | | - | |
Common shares, without par value; authorized - 150,000,000 shares; issued and outstanding, 2006 - 88,691,204 shares, 2005 - 87,933,202 shares | | | - | | | - | |
Additional paid-in capital | | | 159,328 | | | 149,167 | |
Cumulative other comprehensive income (loss), net of taxes of $ (10,287) and $(2,628) at May 31, 2006 and 2005 | | | 27,116 | | | (1,313 | ) |
Retained earnings | | | 758,862 | | | 672,982 | |
| | | | | | | |
| | | 945,306 | | | 820,836 | |
| | | | | | | |
Total liabilities and shareholders’ equity | | $ | 1,900,397 | | $ | 1,830,005 | |
| | | | | | | |
See notes to consolidated financial statements
WORTHINGTON INDUSTRIES, INC.
CONSOLIDATED STATEMENTS OF EARNINGS
(In thousands, except per share)
| | | | | | | | | | | | |
| | | Fiscal Years Ended May 31, | |
| | | 2006 | | | 2005 | | | 2004 | |
Net sales | | $ | 2,897,179 | | | $ | 3,078,884 | | | $ | 2,379,104 | |
Cost of goods sold | | | 2,525,545 | | | | 2,580,011 | | | | 2,003,734 | |
| | | | | | | | | | | | |
Gross margin | | | 371,634 | | | | 498,873 | | | | 375,370 | |
Selling, general and administrative expense | | | 214,030 | | | | 225,915 | | | | 195,785 | |
Impairment charges and other | | | - | | | | 5,608 | | | | 69,398 | |
| | | | | | | | | | | | |
Operating income | | | 157,604 | | | | 267,350 | | | | 110,187 | |
Other income (expense): | | | | | | | | | | | | |
Miscellaneous expense | | | (1,524 | ) | | | (7,991 | ) | | | (1,589 | ) |
Gain on sale of Acerex | | | 26,609 | | | | - | | | | - | |
Interest expense | | | (26,279 | ) | | | (24,761 | ) | | | (22,198 | ) |
Equity in net income of unconsolidated affiliates | | | 56,339 | | | | 53,871 | | | | 41,064 | |
| | | | | | | | | | | | |
Earnings before income taxes | | | 212,749 | | | | 288,469 | | | | 127,464 | |
Income tax expense | | | 66,759 | | | | 109,057 | | | | 40,712 | |
| | | | | | | | | | | | |
| | | |
Net earnings | | $ | 145,990 | | | $ | 179,412 | | | $ | 86,752 | |
| | | | | | | | | | | | |
| | | |
Average common shares outstanding - basic | | | 88,288 | | | | 87,646 | | | | 86,312 | |
| | | | | | | | | | | | |
| | | |
Earnings per share - basic | | $ | 1.65 | | | $ | 2.05 | | | $ | 1.01 | |
| | | | | | | | | | | | |
| | | |
Average common shares outstanding - diluted | | | 88,976 | | | | 88,503 | | | | 86,950 | |
| | | | | | | | | | | | |
| | | |
Earnings per share - diluted | | $ | 1.64 | | | $ | 2.03 | | | $ | 1.00 | |
| | | | | | | | | | | | |
See notes to consolidated financial statements.
30
WORTHINGTON INDUSTRIES, INC.
CONSOLIDATED STATEMENTS OF EARNINGS
SHAREHOLDERS’ EQUITY
(Dollars in thousands, except per share)
| | | | | | | | | | | | | | | | | | | | | |
| | | | | | | Additional
Paid- in
Capital | | | Cumulative
Other
Comprehensive
Income (Loss),
Net of Tax | | | Retained
Earnings | | | Total | |
| | | Common Shares | | | | |
| | | Shares | | Amount | | | | |
Balance at June 1, 2003 | | 85,948,636 | | $ | - | | $ | 121,390 | | | $ | (5,168 | ) | | $ | 520,072 | | | $ | 636,294 | |
Comprehensive income: | | | | | | | | | | | | | | | | | | | | | |
Net earnings | | - | | | - | | | - | | | | - | | | | 86,752 | | | | 86,752 | |
Unrealized gain on investment | | - | | | - | | | - | | | | 94 | | | | - | | | | 94 | |
Foreign currency translation | | - | | | - | | | - | | | | (1,747 | ) | | | - | | | | (1,747 | ) |
Minimum pension liability | | - | | | - | | | - | | | | 1,015 | | | | - | | | | 1,015 | |
Cash flow hedges | | - | | | - | | | - | | | | 3,413 | | | | - | | | | 3,413 | |
| | | | | | | | | | | | | | | | | | | | | |
Total comprehensive income | | | | | | | | | | | | | | | | | | | | 89,527 | |
| | | | | | | | | | | | | | | | | | | | | |
Common shares issued | | 907,006 | | | - | | | 11,357 | | | | - | | | | - | | | | 11,357 | |
Cash dividends declared ($0.64 per share) | | - | | | - | | | - | | | | - | | | | (55,312 | ) | | | (55,312 | ) |
Other | | - | | | - | | | (1,492 | ) | | | - | | | | - | | | | (1,492 | ) |
| | | | | | | | | | | | | | | | | | | | | |
Balance at May 31, 2004 | | 86,855,642 | | | - | | | 131,255 | | | | (2,393 | ) | | | 551,512 | | | | 680,374 | |
Comprehensive income: | | | | | | | | | | | | | | | | | | | | | |
Net earnings | | - | | | - | | | - | | | | - | | | | 179,412 | | | | 179,412 | |
Unrealized gain on investment | | - | | | - | | | - | | | | 164 | | | | - | | | | 164 | |
Foreign currency translation | | - | | | - | | | - | | | | 698 | | | | - | | | | 698 | |
Minimum pension liability | | - | | | - | | | - | | | | (332 | ) | | | - | | | | (332 | ) |
Cash flow hedges | | - | | | - | | | - | | | | 550 | | | | - | | | | 550 | |
| | | | | | | | | | | | | | | | | | | | | |
Total comprehensive income | | | | | | | | | | | | | | | | | | | | 180,492 | |
| | | | | | | | | | | | | | | | | | | | | |
Common shares issued | | 1,077,560 | | | - | | | 17,917 | | | | - | | | | - | | | | 17,917 | |
Cash dividends declared ($0.66 per share) | | - | | | - | | | | | | | - | | | | (57,942 | ) | | | (57,942 | ) |
Other | | - | | | - | | | (5 | ) | | | - | | | | - | | | | (5 | ) |
| | | | | | | | | | | | | | | | | | | | | |
Balance at May 31, 2005 | | 87,933,202 | | | - | | | 149,167 | | | | (1,313 | ) | | | 672,982 | | | | 820,836 | |
Comprehensive income: | | | | | | | | | | | | | | | | | | | | | |
Net earnings | | - | | | - | | | - | | | | - | | | | 145,990 | | | | 145,990 | |
Unrealized gain on investment | | - | | | - | | | - | | | | 139 | | | | - | | | | 139 | |
Foreign currency translation | | - | | | - | | | - | | | | 8,711 | | | | - | | | | 8,711 | |
Minimum pension liability | | - | | | - | | | - | | | | 2,473 | | | | - | | | | 2,473 | |
Cash flow hedges | | - | | | - | | | - | | | | 17,106 | | | | - | | | | 17,106 | |
| | | | | | | | | | | | | | | | | | | | | |
Total comprehensive income | | | | | | | | | | | | | | | | | | | | 174,419 | |
| | | | | | | | | | | | | | | | | | | | | |
Common shares issued | | 758,002 | | | - | | | 10,161 | | | | - | | | | - | | | | 10,161 | |
Cash dividends declared ($0.68 per share) | | - | | | - | | | - | | | | - | | | | (60,110 | ) | | | (60,110 | ) |
| | | | | | | | | | | | | | | | | | | | | |
Balance at May 31, 2006 | | 88,691,204 | | $ | - | | $ | 159,328 | | | $ | 27,116 | | | $ | 758,862 | | | $ | 945,306 | |
| | | | | | | | | | | | | | | | | | | | | |
See notes to consolidated financial statements
WORTHINGTON INDUSTRIES, INC.
CONSOLIDATED STATEMENTS OF CASH FLOWS
(Dollars in thousands)| | | | | | | | | | | | | |
| | | Fiscal Years Ended May 31,
|
| | | 2004
| | 2003
| | 2002
|
| Net sales | | $ | 2,379,104 | | | $ | 2,219,891 | | | $ | 1,744,961 | |
| Cost of goods sold | | | 2,003,734 | | | | 1,916,990 | | | | 1,480,184 | |
| | | |
| | | |
| | | |
| |
| Gross margin | | | 375,370 | | | | 302,901 | | | | 264,777 | |
| Selling, general and administrative expense | | | 195,785 | | | | 182,692 | | | | 165,885 | |
| Impairment charges and other | | | 69,398 | | | | (5,622 | ) | | | 64,575 | |
| | | |
| | | |
| | | |
| |
| Operating income | | | 110,187 | | | | 125,831 | | | | 34,317 | |
| Other income (expense): | | | | | | | | | | | | |
| Miscellaneous expense | | | (1,589 | ) | | | (7,240 | ) | | | (3,224 | ) |
| Nonrecurring losses | | | — | | | | (5,400 | ) | | | (21,223 | ) |
| Interest expense | | | (22,198 | ) | | | (24,766 | ) | | | (22,740 | ) |
| Equity in net income of unconsolidated affiliates | | | 41,064 | | | | 29,973 | | | | 23,110 | |
| | | |
| | | |
| | | |
| |
| Earnings before income taxes | | | 127,464 | | | | 118,398 | | | | 10,240 | |
| Income tax expense | | | 40,712 | | | | 43,215 | | | | 3,738 | |
| | | |
| | | |
| | | |
| |
| Net earnings | | $ | 86,752 | | | $ | 75,183 | | | $ | 6,502 | |
| | | |
| | | |
| | | |
| |
| Average common shares outstanding - basic | | | 86,312 | | | | 85,785 | | | | 85,408 | |
| | | |
| | | |
| | | |
| |
| Earnings per share - basic | | $ | 1.01 | | | $ | 0.88 | | | $ | 0.08 | |
| | | |
| | | |
| | | |
| |
| Average common shares outstanding - diluted | | | 86,950 | | | | 86,537 | | | | 85,929 | |
| | | |
| | | |
| | | |
| |
| Earnings per share - diluted | | $ | 1.00 | | | $ | 0.87 | | | $ | 0.08 | |
| | | |
| | | |
| | | |
| |
| | | | | | | | | | | | |
| | | Fiscal Years Ended May 31, | |
| | | 2006 | | | 2005 | | | 2004 | |
Operating activities: | | | | | | | | | | | | |
Net earnings | | $ | 145,990 | | | $ | 179,412 | | | $ | 86,752 | |
Adjustments to reconcile net earnings to net cash provided by operating activities: | | | | | | | | | | | | |
Depreciation and amortization | | | 59,116 | | | | 57,874 | | | | 67,302 | |
Impairment charges and other | | | - | | | | 5,608 | | | | 69,398 | |
Provision for deferred income taxes | | | (12,645 | ) | | | (1,496 | ) | | | (22,508 | ) |
Equity in net income of unconsolidated affiliates, net of distributions received | | | 702 | | | | (25,351 | ) | | | (28,912 | ) |
Minority interest in net income of consolidated subsidiaries | | | 6,088 | | | | 8,963 | | | | 4,733 | |
Net loss (gain) on sale of assets | | | 6,079 | | | | 2,641 | | | | (3,127 | ) |
Gain on sale of Acerex | | | (26,609 | ) | | | - | | | | - | |
Changes in assets and liabilities: | | | | | | | | | | | | |
Accounts receivable | | | 11,616 | | | | (50,661 | ) | | | (175,290 | ) |
Inventories | | | (33,788 | ) | | | (59,236 | ) | | | (94,073 | ) |
Prepaid expenses and other current assets | | | (9,186 | ) | | | (10,195 | ) | | | 12,841 | |
Other assets | | | (563 | ) | | | (831 | ) | | | 90 | |
Accounts payable and accrued expenses | | | 79,114 | | | | (72,933 | ) | | | 162,383 | |
Other liabilities | | | 1,152 | | | | (1,524 | ) | | | (222 | ) |
| | | | | | | | | | | | |
Net cash provided by operating activities | | | 227,066 | | | | 32,271 | | | | 79,367 | |
| | | |
Investing activities: | | | | | | | | | | | | |
Investment in property, plant and equipment, net | | | (60,128 | ) | | | (46,318 | ) | | | (29,599 | ) |
Investment in aircraft | | | (16,435 | ) | | | - | | | | - | |
Acquisitions, net of cash acquired | | | (6,776 | ) | | | (65,119 | ) | | | - | |
Investment in unconsolidated affiliate | | | - | | | | (1,500 | ) | | | (490 | ) |
Proceeds from sale of assets | | | 3,225 | | | | 89,488 | | | | 5,662 | |
Proceeds from sale of Acerex | | | 44,604 | | | | - | | | | - | |
Purchases of short-term investments | | | (493,860 | ) | | | (72,875 | ) | | | - | |
Sales of short-term investments | | | 491,687 | | | | 72,875 | | | | - | |
| | | | | | | | | | | | |
Net cash used by investing activities | | | (37,683 | ) | | | (23,449 | ) | | | (24,427 | ) |
| | | |
Financing activities: | | | | | | | | | | | | |
Proceeds from short-term borrowings | | | 7,684 | | | | - | | | | (1,145 | ) |
Proceeds from long-term debt, net | | | - | | | | 99,409 | | | | - | |
Principal payments on long-term debt | | | (143,416 | ) | | | (2,381 | ) | | | (1,234 | ) |
Proceeds from issuance of common shares | | | 9,138 | | | | 14,673 | | | | 10,644 | |
Payments to minority interest | | | (3,840 | ) | | | (8,360 | ) | | | (7,200 | ) |
Dividends paid | | | (59,982 | ) | | | (56,891 | ) | | | (55,167 | ) |
| | | | | | | | | | | | |
Net cash provided (used) by financing activities | | | (190,416 | ) | | | 46,450 | | | | (54,102 | ) |
| | | | | | | | | | | | |
Increase (decrease) in cash and cash equivalents | | | (1,033 | ) | | | 55,272 | | | | 838 | |
Cash and cash equivalents at beginning of year | | | 57,249 | | | | 1,977 | | | | 1,139 | |
| | | | | | | | | | | | |
Cash and cash equivalents at end of year | | $ | 56,216 | | | $ | 57,249 | | | $ | 1,977 | |
| | | | | | | | | | | | |
See notes to consolidated financial statements.
31
WORTHINGTON INDUSTRIES, INC.
CONSOLIDATED STATEMENTS OF SHAREHOLDERS’ EQUITY
(Dollars in thousands, except per share)
| | | | | | | | | | | | | | | | | | | | | | | | | |
| | | | | | | | | | | | | | | Cumulative | | | | |
| | | | | | | | | | | | | | | Other | | | | |
| | | Common Stock
| | Additional
Paid- in | | Comprehensive
Loss, Net of | | Retained | | |
| | | Shares
| | Amount
| | Capital
| | Tax
| | Earnings
| | Total
|
| Balance at June 1, 2001 | | | 85,375,425 | | | $ | — | | | $ | 109,685 | | | $ | (8,024 | ) | | $ | 548,004 | | | $ | 649,665 | |
| Comprehensive income: | | | | | | | | | | | | | | | | | | | | | | | | |
| Net earnings | | | — | | | | — | | | | — | | | | — | | | | 6,502 | | | | 6,502 | |
| Unrealized gain (loss) on investment | | | — | | | | — | | | | — | | | | (45 | ) | | | — | | | | (45 | ) |
| Foreign currency translation | | | — | | | | — | | | | — | | | | 3,967 | | | | — | | | | 3,967 | |
| Unrealized gain on investment | | | — | | | | — | | | | — | | | | (32 | ) | | | — | | | | (32 | ) |
| Foreign currency translation | | | — | | | | — | | | | — | | | | (921 | ) | | | — | | | | (921 | ) |
| | | | | | | | | | | | | | | | | | | | | | | |
| |
| Total comprehensive income | | | | | | | | | | | | | | | | | | | | | | | 9,471 | |
| | | | | | | | | | | | | | | | | | | | | | | |
| |
| Common shares issued | | | 136,800 | | | | — | | | | 1,799 | | | | — | | | | — | | | | 1,799 | |
| Cash dividends declared ($0.64 per share) | | | — | | | | — | | | | — | | | | — | | | | (54,677 | ) | | | (54,677 | ) |
| Other | | | — | | | | — | | | | — | | | | — | | | | (2 | ) | | | (2 | ) |
| | | |
| | | |
| | | |
| | | |
| | | |
| | | |
| |
| Balance at May 31, 2002 | | | 85,512,225 | | | | — | | | | 111,484 | | | | (5,055 | ) | | | 499,827 | | | | 606,256 | |
| Comprehensive income: | | | | | | | | | | | | | | | | | | | | | | | | |
| Net earnings | | | — | | | | — | | | | — | | | | — | | | | 75,183 | | | | 75,183 | |
| Unrealized gain (loss) on investment | | | — | | | | — | | | | — | | | | (115 | ) | | | — | | | | (115 | ) |
| Foreign currency translation | | | — | | | | — | | | | — | | | | 2,909 | | | | — | | | | 2,909 | |
| Minimum pension liability | | | — | | | | — | | | | — | | | | (3,400 | ) | | | — | | | | (3,400 | ) |
| Cash flow hedges | | | — | | | | — | | | | — | | | | 493 | | | | — | | | | 493 | |
| | | | | | | | | | | | | | | | | | | | | | | |
| |
| Total comprehensive income | | | | | | | | | | | | | | | | | | | | | | | 75,070 | |
| | | | | | | | | | | | | | | | | | | | | | | |
| |
| Common shares issued | | | 436,411 | | | | — | | | | 5,964 | | | | — | | | | — | | | | 5,964 | |
| Cash dividends declared ($0.64 per share) | | | | | | | — | | | | — | | | | — | | | | (54,938 | ) | | | (54,938 | ) |
| Gain on TWB minority interest acquisition | | | — | | | | — | | | | 3,942 | | | | — | | | | — | | | | 3,942 | |
| | | |
| | | |
| | | |
| | | |
| | | |
| | | |
| |
| Balance at May 31, 2003 | | | 85,948,636 | | | | — | | | | 121,390 | | | | (5,168 | ) | | | 520,072 | | | | 636,294 | |
| Comprehensive income: | | | | | | | | | | | | | | | | | | | | | | | | |
| Net earnings | | | — | | | | — | | | | — | | | | — | | | | 86,752 | | | | 86,752 | |
| Unrealized gain (loss) on investment | | | — | | | | — | | | | — | | | | 94 | | | | — | | | | 94 | |
| Foreign currency translation | | | — | | | | — | | | | — | | | | (1,747 | ) | | | — | | | | (1,747 | ) |
| Minimum pension liability | | | — | | | | — | | | | — | | | | 1,015 | | | | — | | | | 1,015 | |
| Cash flow hedges | | | — | | | | — | | | | — | | | | 3,413 | | | | — | | | | 3,413 | |
| | | | | | | | | | | | | | | | | | | | | | | |
| |
| Total comprehensive income | | | | | | | | | | | | | | | | | | | | | | | 89,527 | |
| | | | | | | | | | | | | | | | | | | | | | | |
| |
| Common shares issued | | | 907,006 | | | | — | | | | 11,357 | | | | — | | | | — | | | | 11,357 | |
| Other | | | — | | | | — | | | | (1,492 | ) | | | — | | | | — | | | | (1,492 | ) |
| Cash dividends declared ($0.64 per share) | | | — | | | | — | | | | — | | | | — | | | | (55,312 | ) | | | (55,312 | ) |
| | | |
| | | |
| | | |
| | | |
| | | |
| | | |
| |
| Balance at May 31, 2004 | | | 86,855,642 | | | $ | — | | | $ | 131,255 | | | $ | (2,393 | ) | | $ | 551,512 | | | $ | 680,374 | |
| | | |
| | | |
| | | |
| | | |
| | | |
| | | |
| |
See notes to consolidated financial statements.
32
WORTHINGTON INDUSTRIES, INC.
CONSOLIDATED STATEMENTS OF CASH FLOWS
(Dollars in thousands)
| | | | | | | | | | | | | |
| | | Fiscal Years Ended May 31,
|
| | | 2004
| | 2003
| | 2002
|
Operating activities: | | | | | | | | | | | | |
| Net earnings | | $ | 86,752 | | | $ | 75,183 | | | $ | 6,502 | |
| Adjustments to reconcile net earnings to net cash provided by operating activities: | | | | | | | | | | | | |
| Depreciation and amortization | | | 67,302 | | | | 69,419 | | | | 68,887 | |
| Impairment charges and other | | | 69,398 | | | | (5,622 | ) | | | 64,575 | |
| Provision for deferred income taxes | | | (22,508 | ) | | | 16,411 | | | | (16,721 | ) |
| Nonrecurring losses | | | — | | | | 5,400 | | | | 21,223 | |
| Equity in net income of unconsolidated affiliates, net of distributions received | | | (28,912 | ) | | | 11,134 | | | | (8,929 | ) |
| Minority interest in net income (loss) of consolidated subsidiaries | | | 4,733 | | | | 4,283 | | | | (332 | ) |
| Net loss (gain) on sale of assets | | | (3,127 | ) | | | 1,227 | | | | 1,002 | |
| Changes in assets and liabilities: | | | | | | | | | | | | |
| Accounts receivable | | | (175,290 | ) | | | 60,012 | | | | (32,276 | ) |
| Inventories | | | (94,073 | ) | | | (13,675 | ) | | | 7,556 | |
| Prepaid expenses and other current assets | | | 12,841 | | | | (1,815 | ) | | | (6,521 | ) |
| Other assets | | | 90 | | | | (1,886 | ) | | | 1,171 | |
| Accounts payable and accrued expenses | | | 162,383 | | | | (49,507 | ) | | | 24,946 | |
| Other liabilities | | | (222 | ) | | | 10,157 | | | | 4,174 | |
| | | |
| | | |
| | | |
| |
| Net cash provided by operating activities | | | 79,367 | | | | 180,721 | | | | 135,257 | |
Investing activities: | | | | | | | | | | | | |
| Investment in property, plant and equipment, net | | | (29,599 | ) | | | (24,970 | ) | | | (39,100 | ) |
| Acquisitions, net of cash acquired | | | — | | | | (114,703 | ) | | | — | |
| Investment in unconsolidated affiliate | | | (490 | ) | | | — | | | | (21,000 | ) |
| Proceeds from sale of assets | | | 5,662 | | | | 27,814 | | | | 10,459 | |
| | | |
| | | |
| | | |
| |
| Net cash used by investing activities | | | (24,427 | ) | | | (111,859 | ) | | | (49,641 | ) |
Financing activities: | | | | | | | | | | | | |
| Payments on short-term borrowings | | | (1,145 | ) | | | (7,340 | ) | | | (8,513 | ) |
| Proceeds from long-term debt | | | — | | | | 735 | | | | — | |
| Principal payments on long-term debt | | | (1,234 | ) | | | (6,883 | ) | | | (20,872 | ) |
| Proceeds from issuance of common shares | | | 10,644 | | | | 5,419 | | | | 1,628 | |
| Payments to minority interest | | | (7,200 | ) | | | (5,281 | ) | | | (2,902 | ) |
| Dividends paid | | | (55,167 | ) | | | (54,869 | ) | | | (54,655 | ) |
| | | |
| | | |
| | | |
| |
| Net cash used by financing activities | | | (54,102 | ) | | | (68,219 | ) | | | (85,314 | ) |
| | | |
| | | |
| | | |
| |
| Increase in cash and cash equivalents | | | 838 | | | | 643 | | | | 302 | |
| Cash and cash equivalents at beginning of year | | | 1,139 | | | | 496 | | | | 194 | |
| | | |
| | | |
| | | |
| |
| Cash and cash equivalents at end of year | | $ | 1,977 | | | $ | 1,139 | | | $ | 496 | |
| | | |
| | | |
| | | |
| |
See notes to consolidated financial statements.
33
WORTHINGTON INDUSTRIES, INC.
NOTES TO CONSOLIDATED FINANCIAL STATEMENTS
Fiscal Years Ended May 31, 2004, 2003,2006, 2005 and 20022004
NOTENote A – Summary of Significant Accounting Policies
Consolidation:The consolidated financial statements include the accounts of Worthington Industries, Inc. and consolidated subsidiaries (the “Company”). Spartan Steel Coating, LLC (owned 52%) and Worthington Gastec a.s. (owned 51%) areis fully consolidated with the equity owned by the respective partnerspartner shown as minority interest on the balance sheet, and theirits portion of net income or loss is included in miscellaneous income or expense. Investments in unconsolidated affiliates are accounted for using the equity method. Significant intercompany accounts and transactions are eliminated. Certain reclassifications were made to prior year amounts to conform to the fiscal 2004 presentation.
During January 2003, the FASB issued Interpretation No. 46,Consolidation of Variable Interest Entities(“FIN 46”). FIN 46 was intended to provide guidance in determining whether consolidation is required under the “controlling financial interest” model of Accounting Research Bulletin No. 51,Consolidated Financial Statements(“ARB No. 51”), or whether the variable interest model under FIN 46 should be used to account for existing and new entities. However, FIN 46 was confusing to many companies. Consequently, during December 2003, the FASB released Interpretation No. 46 (revised December 2003),Consolidation of Variable Interest Entities – an interpretation of ARB No. 51(“FIN 46R”). FIN 46R clarifies certain provisions of FIN 46 and provides certain entities with exemptions from the requirements of FIN 46. Special provisions apply to companies that have fully or partially applied FIN 46 prior to issuance of FIN 46R. Otherwise, application of FIN 46R is required in financial statements of public entities that have interests in variable interest entities or potential variable interest entities commonly referred to as special purpose entities for periods ending after December 15, 2003. Application of FIN 46R for all other types of entities was required for periods ending after March 15, 2004. Adoption of FIN 46R did not have an impact on the Company’s financial position or results of operations.
Use of Estimates:The preparation of financial statements in conformity with accounting principles generally accepted in the United States requires management to make estimates and assumptions that affect the amounts reported in the financial statements and accompanying notes. Actual results could differ from those estimates.
Cash and Cash Equivalents:The Company considers all highly liquid investments purchased with a maturity of three months or less to be cash equivalents.
Inventories:Inventories are valued at the lower of cost or market. With the exception of steel coil inventories, which are accounted for using the specific identification method, costCost is determined using the first-in, first-out method or standard costing which approximates the first-in, first-out method for all inventories.
Derivative Financial Instruments:The Company does not engage in currency or commodity speculation and generally enters into derivatives only to hedge specific interest, foreign currency or commodity transactions. All derivatives are accounted for using mark-to-market accounting. Gains or losses from these transactions offset gains or losses of the assets, liabilities or transactions being hedged. Current assets and other assets include derivative fair values at May 31, 2006 of $13,868,000 and $25,307,000, respectively. If a cash flow derivative is terminated and the cash flows remain probable, the amount in other comprehensive income remains and will be reclassified to net earnings when the hedged cash flow occurs. Ineffectiveness of the hedges during the fiscal year ended May 31, 2006 (“fiscal 2006”), the fiscal year ended May 31, 2005 (“fiscal 2005”) and the fiscal year ended May 31, 2004 (“fiscal 2004”) was immaterial and was reported in other income (expense). The commodity derivatives hedge exposure through 2008.
Fair Value of Financial Instruments:The non-derivative financial instruments included in the carrying amounts of cash and cash equivalents, short-term investments, account and note receivables, other assets and account and note payables, approximate fair values. The fair value of long-term debt, including current maturities, based upon quoted market prices was $326,547,000$250,206,000 and $327,814,000$408,101,000 at May 31, 20042006 and 2003,2005, respectively.
Risks and Uncertainties: As of May 31, 2004,2006, the Company, including unconsolidated affiliates, operated 6162 production facilities in 2223 states and 10 countries. The Company’s largest markets are the construction and the automotive and automotive supply markets, which comprise approximately one-third41% and 33%, respectively, of the Company’s net sales. Foreign operations and exports represent less than 10% of the Company’s production, consolidated net sales and consolidated net assets. Approximately 11% of the Company’s consolidated labor force is covered by collective bargaining agreements. These numbers include 95 employees who were covered by a contract that expired on May 5, 2006 that is currently being renegotiated. Of thesethe remaining labor contracts, 69%none expire within one year from May 31, 2004.2006. The concentration of credit risks from financial instruments related
34
to the markets served by the Company is not expected to have a material adverse effect on the Company’s consolidated financial position, cash flows or future results of operations.
Property and Depreciation:Property, plant and equipment are carried at cost and depreciated using the straight-line method. Buildings and improvements are depreciated over 10 to 40 years and machinery and equipment over 3 to 20 years. Depreciation expense was $56,769,000 for fiscal 2006, $55,409,000 for fiscal 2005, and $66,545,000 for the fiscal year ended May 31, 2004 (“fiscal 2004”), $67,828,000 for the fiscal year ended May 31, 2003 (“fiscal 2003”), and $68,734,000 for the fiscal year ended May 31, 2002 (“fiscal 2002”).2004. Accelerated depreciation methods are used for income tax purposes.
Planned Maintenance Activities:The Company uses the deferral method to account for costs of planned maintenance shutdowns. Under this method the costs of a qualifying shutdown are capitalized and amortized on a straight-line basis, into maintenance expense, until the next anticipated shutdown. In no case will the amortization period exceed twelve months.
Leases:Certain lease agreements contain fluctuating or escalating payments and rent holiday periods. The related rent expense is recorded on a straight-line basis over the length of the lease term. Leasehold improvements made by the lessee that are funded by landlord allowances or incentives are recorded as leasehold improvement assets and will be amortized over the shorter of the economic life or the lease term. These incentives are also recorded as deferred rent and amortized as reductions in rent expense over the lease term.
Capitalized Interest:The Company capitalizes interest in connection with the construction of qualified assets. Under this policy, the Company capitalized interest of $638,000 in fiscal 2006, $158,000 in fiscal 2005 and $22,000 in fiscal 2004, $48,000 in fiscal 2003 and $358,000 in fiscal 2002.2004.
Stock-Based Compensation:At May 31, 2004,2006, the Company had stock option plans for employees and non-employee directors which are described more fully in “Note F – Stock-Based Compensation.” The Company accounts for these plans under the recognition and measurement principles of Accounting Principles Board (“APB”) Opinion No. 25,Accounting for Stock Issued to Employees,and the related interpretations. No stock-based employee compensation cost is reflected in net earnings, as all options granted under the plans had an exercise price equal to the fair market value of the underlying stockcommon shares on the date of the grant. Pro forma information regarding net earnings and earnings per share is required by Statement of Financial Accounting Standards (“SFAS”) No. 123,Accounting for Stock-Based Compensation, as amended by SFAS No. 148,Accounting for Stock-Based Compensation – Transition and Disclosure. This information is required to be determined as if the Company had accounted for its stock options granted after December 31, 1994, under the fair value method prescribed by that Statement.
In December 2004, the Financial Accounting Standards Board (“FASB”) issued SFAS No. 123 (revised 2004),Share-Based Payment(“SFAS 123(R)”).SFAS 123(R) is a revision of SFAS 123 and it supercedes APB No. 25 and amends SFAS No. 95,Statement of Cash Flows.Generally, the approach in SFAS 123(R) is similar to the approach described in SFAS 123. However, SFAS 123(R) requires all share-based payments to employees, including grants of employee options, to be recognized in the income statement based on their fair values. Pro forma disclosure will not be an alternative. SFAS 123(R) is effective for all fiscal years beginning after June 15, 2005, and thus will become effective for the Company beginning in fiscal 2007.
The adoption of SFAS 123(R)’s fair value method will not materially impact the Company’s results of operations or overall financial position. Stock option expense after the adoption of SFAS 123(R) is not expected to be materially different than the expense reported in the table below, but this will not be known until a full analysis of the impact of SFAS 123(R) is completed. The impact will largely depend on levels of share-based payments granted in the future.
On March 29, 2005, the Securities and Exchange Commission (“SEC”) issued Staff Accounting Bulletin No. 107 (“SAB 107”). SAB 107 provides interpretations expressing the views of the SEC staff regarding the interaction between SFAS 123(R) and certain SEC rules and regulations, and provides the staff’s views regarding the valuation of share-based payment arrangements for public companies. SAB 107 does not modify any of SFAS 123(R)’s conclusions or requirements.
The weighted average fair value of stock options granted in fiscal 2004,2006, fiscal 20032005 and fiscal 20022004 was $2.82, $2.71$3.62, $3.14, and $2.89,$2.82, respectively, based on the Black-Scholes option-pricingBlack Scholes option pricing model with the following weighted average assumptions:
| | | | | | | | | | | | | |
| | | 2004
| | 2003
| | 2002
|
| Assumptions used: | | | | | | | | | | | | |
| Dividend yield | | | 4.04 | % | | | 4.01 | % | | | 4.55 | % |
| Expected volatility | | | 26.00 | % | | | 25.00 | % | | | 23.00 | % |
| Risk-free interest rate | | | 3.88 | % | | | 2.63 | % | | | 4.38 | % |
| Expected lives (years) | | | 6.2 | | | | 6.5 | | | | 5.0 | |
| | | | | | |
| | | 2006 | | 2005 | | 2004 |
Assumptions used: | | | | | | |
Dividend yield | | 3.58% | | 3.33% | | 4.04% |
Expected volatility | | 25.00% | | 25.00% | | 26.00% |
Risk-free interest rate | | 4.38% | | 3.88% | | 3.88% |
Expected lives (years) | | 6.6 | | 6.6 | | 6.2 |
The following table illustrates the effect on net earnings and earnings per share if the Company had accounted for the stock option plans under the fair value method of accounting, as required by SFAS 123, for the years ended May 31:
| | | | | | | | | | | | | |
| In thousands, except per share | | 2004
| | 2003
| | 2002
|
| Net earnings, as reported | | $ | 86,752 | | | $ | 75,183 | | | $ | 6,502 | |
| Deduct: total stock-based employee compensation expense determined under fair value based method, net of tax | | | 1,328 | | | | 1,475 | | | | 1,430 | |
| | | |
| | | |
| | | |
| |
| Pro forma net earnings | | $ | 85,424 | | | $ | 73,708 | | | $ | 5,072 | |
| | | |
| | | |
| | | |
| |
| Earnings per share: | | | | | | | | | | | | |
| Basic, as reported | | $ | 1.01 | | | $ | 0.88 | | | $ | 0.08 | |
| Basic, pro forma | | | 0.99 | | | | 0.86 | | | | 0.06 | |
| Diluted, as reported | | | 1.00 | | | | 0.87 | | | | 0.08 | |
| Diluted, pro forma | | | 0.98 | | | | 0.86 | | | | 0.06 | |
| | | | | | | | | |
| In thousands, except per share | | 2006 | | 2005 | | 2004 |
Net earnings, as reported | | $ | 145,990 | | $ | 179,412 | | $ | 86,752 |
Deduct: total stock-based employee compensation expense determined
under fair value based method, net of tax | | | 2,381 | | | 1,977 | | | 1,328 |
| | | | | | | | | |
Pro forma net earnings | | $ | 143,609 | | $ | 177,435 | | $ | 85,424 |
| | | | | | | | | |
| | | |
Earnings per share: | | | | | | | | | |
Basic, as reported | | $ | 1.65 | | $ | 2.05 | | $ | 1.01 |
Basic, pro forma | | | 1.63 | | | 2.02 | | | 0.99 |
Diluted, as reported | | | 1.64 | | | 2.03 | | | 1.00 |
Diluted, pro forma | | | 1.61 | | | 2.00 | | | 0.98 |
Revenue Recognition:The Company recognizes revenue upon transfer of title and risk of loss provided evidence of an arrangement exists, pricing is fixed and determinable, and collectibility is probable. In circumstances where the collection of payment is highly questionable at the time of shipment, the Company defers recognition of
35
revenue until payment is collected. The Company provides an allowance for expected returns based on experience and current customer activities. Within the Construction Services operating segment, revenue is recognized on a percentage-of-completion method.
During December 2003, the Securities and Exchange Commission (“SEC”) issued Staff Accounting Bulletin (“SAB”) No. 104,Revenue Recognition, which supercedes SAB No. 101, Revenue Recognition in Financial Statements. This Bulletin’s primary purpose is to rescind accounting guidance contained in SAB No. 101 related to multiple element revenue arrangements, superceded as a result of the issuance of EITF 00-21,Accounting for Revenue Arrangements with Multiple Deliverables. While the wording of SAB No. 104 has changed to reflect the issuance of EITF 00-21, the revenue recognition principles of SAB No. 101 remain largely unchanged by the issuance of SAB No. 104. The issuance of this Bulletin did not impact the Company’s accounting policy for revenue recognition.
Advertising Expense:The Company expenses advertising costs as incurred. Advertising expense was $3,024,000, $2,520,000$3,571,000, $3,924,000 and $2,095,000$3,024,000 for fiscal 2004,2006, fiscal 20032005 and fiscal 2002,2004, respectively.
Shipping and Handling Fees and Costs:Shipping and handling fees billed to customers are included in net sales and shipping and handling costs incurred by the Company are included in cost of goods sold.
Environmental Costs:Environmental costs are capitalized if the costs extend the life of the property, increase its capacity, and/or mitigate or prevent contamination from future operations. Costs related to environmental contamination treatment and clean-up are charged to expense.
Statements of Cash Flows:Supplemental cash flow information for the years ended May 31 is as follows:| | | | | | | | | | | | | |
| In thousands | | 2004
| | 2003
| | 2002
|
| Interest paid | | $ | 21,889 | | | $ | 25,027 | | | $ | 23,485 | |
| Income taxes paid, net of refunds | | | 4,749 | | | | 37,909 | | | | 14,371 | |
Nonrecurring Losses:As part of the Company’s sale of Buckeye Steel Castings Company (“Buckeye Steel”) in the fiscal year ended May 31, 1999, the acquirer assumed liability for certain workers’ compensation liabilities which arose while the Company’s workers’ compensation guarantee was in place. The acquirer agreed to indemnify the Company against claims made on the guarantee related to the assumed workers’ compensation claims. During the second quarter of fiscal 2003, economic conditions caused Buckeye Steel to cease operations and file for bankruptcy thereby raising the issue of the acquirer’s ability to fulfill its obligations. As a result, the Company recorded a $5,400,000 reserve for the estimated potential liability relating to these workers’ compensation claims.
| | | | | | | | | |
| In thousands | | 2006 | | 2005 | | 2004 |
Interest paid | | $ | 28,372 | | $ | 25,039 | | $ | 21,889 |
Income taxes paid, net of refunds | | | 67,163 | | | 155,901 | | | 4,749 |
During January 2002, the Company recognized a $21,223,000 loss for the impairment of assets received in connection with the fiscal 1999 sale of certain discontinued operations. During fiscal 1999, the Company sold all of the assets of its Custom Products and Cast Products business segments for aggregate proceeds of $194,000,000 in cash and $30,000,000 in preferred stock and subordinated debt issued by four acquirers. As economic conditions deteriorated, each of the issuers encountered difficulty making scheduled payments under the terms of the preferred stock and subordinated debt.
Income Taxes:In accordance with the provisions of SFAS No. 109,Accounting for Income Taxes (“SFAS 109”,the Company accounts for income taxes using the asset and liability method. The asset and liability method
requires the recognition of deferred tax assets and liabilities for expected future tax consequences of temporary differences that currently exist between the tax basesbasis and financial reporting basesbasis of the Company’s assets and liabilities. In assessing the realizability of deferred tax assets, the Company considers whether it is more likely than not that some or a portion of the deferred tax assets will not be realized. The Company provides a valuation allowance for deferred income tax assets when it is more likely than not that a portion of such deferred income tax assets will not be realized.
The Company has a reserve for taxes that may become payable as a result of audits in future periods with respect to previously filed tax returns included in long-term liabilities. It is the Company’s policy to establish reserves for taxes that may become payable in future years as a result of an examination by taxing authorities. The Company establishes the reserves based upon management’s assessment of exposure associated with permanent tax differences, tax credits, and interest expense, and penalties applied to temporary difference adjustments. The tax reserves are analyzed periodically and adjustments are made, as events occur to warrant adjustment to the reserve.reserves.
36
Recently Issued Accounting Standards: In November 2004, the FASB issued SFAS No. 151,Inventory Costs (“SFAS 151”). SFAS 151 amends the guidance in ARB No. 43, Chapter 4,Inventory Pricing to clarify the accounting for abnormal amounts of idle facility expense, freight, handling cost and wasted material (spoilage). In addition, SFAS 151 requires that allocation of fixed production overhead to the costs of conversion be based on the normal capacity of the production facilities. SFAS 151 is effective for inventory costs incurred during fiscal years beginning after June 15, 2005. The Company does not expect the adoption of SFAS 151 to have a material impact on the financial position and results of operations.In July 2006, FASB issued FASB Interpretation No. 48,Accounting for Uncertainty in Income Taxes—an interpretation of FASB Statement No. 109(“FIN 48”), which clarifies the accounting for uncertainty in tax positions. This Interpretation requires that we recognize in our financial statements, the impact of a tax position, if that position is more likely than not of being sustained on audit, based on the technical merits of the position. The provisions of FIN 48 are effective as of the beginning of our 2007 fiscal year, with the cumulative effect of the change in accounting principle recorded as an adjustment to opening retained earnings. We are currently evaluating the impact of adopting FIN 48 on our financial statements.
NOTENote B – Shareholders’ Equity
Preferred Shares:The Company’sWorthington Industries, Inc. Amended Articles of Incorporation authorize two classes of preferred shares and their relative voting rights. The board of directors of Worthington Industries, Inc. is empowered to determine the issue prices, dividend rates, amounts payable upon liquidation, and other terms of the preferred shares when issued. No preferred shares are issued or outstanding.
Common Shares: Worthington Industries, Inc. announced on June 13, 2005, that its board of directors authorized the repurchase of up to ten million, or approximately 11%, of the then outstanding common shares. The purchases may be made from time to time, on the open market or in private transactions, with consideration given to the market price of the common shares, the nature of other investment opportunities, cash flows from operations and general economic conditions. No repurchases of common shares pursuant to this authorization occurred during fiscal 2006.
Comprehensive Income:The components of other comprehensive income (loss) and related tax effects for the years ended May 31 were as follows:| | | | | | | | | | | | | |
| In thousands | | 2004
| | 2003
| | 2002
|
| Other comprehensive income (loss): | | | | | | | | | | | | |
| Unrealized gain (loss) on investment | | $ | 94 | | | $ | (115 | ) | | $ | (45 | ) |
| Foreign currency translation, net of tax of $0, $(2,214) and $(2,136) in 2004, 2003 and 2002 | | | (1,747 | ) | | | 2,909 | | | | 3,967 | |
| Minimum pension liability, net of tax of $(492), $1,463 and $0 in 2004, 2003 and 2002 | | | 1,015 | | | | (3,400 | ) | | | (32 | ) |
| Cash flow hedges, net of tax of $(2,628), $(253) and $495 in 2004, 2003 and 2002 | | | 3,413 | | | | 493 | | | | (921 | ) |
| | | |
| | | |
| | | |
| |
| Other comprehensive income (loss) | | $ | 2,775 | | | $ | (113 | ) | | $ | 2,969 | |
| | | |
| | | |
| | | |
| |
| | | | | | | | | | | |
| In thousands | | 2006 | | 2005 | | | 2004 | |
Other comprehensive income (loss): | | | | | | | | | | | |
Unrealized gain on investment | | $ | 139 | | $ | 164 | | | $ | 94 | |
Foreign currency translation, net of tax of $677, $(756) and $0 in 2006, 2005 and 2004 | | | 8,711 | | | 698 | | | | (1,747 | ) |
Minimum pension liability, net of tax of $ 28, $203 and $(492) in 2006, 2005 and 2004 | | | 2,473 | | | (332 | ) | | | 1,015 | |
Cash flow hedges, net of tax of $(8,364), $ (661) and $(2,628) in 2006, 2005 and 2004 | | | 17,106 | | | 550 | | | | 3,413 | |
| | | | | | | | | | | |
Other comprehensive income, net of tax | | $ | 28,429 | | $ | 1,080 | | | $ | 2,775 | |
| | | | | | | | | | | |
The components of cumulative other comprehensive loss,income (loss), net of tax, at May 31 were as follows:
| | | | | | | | | |
| In thousands | | 2004
| | 2003
|
| Unrealized loss on investment | | $ | (12 | ) | | $ | (106 | ) |
| Foreign currency translation | | | (2,949 | ) | | | (1,202 | ) |
| Minimum pension liability | | | (2,417 | ) | | | (3,432 | ) |
| Cash flow hedges | | | 2,985 | | | | (428 | ) |
| | | |
| | | |
| |
| Cumulative other comprehensive loss | | $ | (2,393 | ) | | $ | (5,168 | ) |
| | | |
| | | |
| |
NOTE
| | | | | | | | |
| In thousands | | 2006 | | | 2005 | |
Unrealized gain on investment | | $ | 291 | | | $ | 152 | |
Foreign currency translation | | | 6,460 | | | | (2,251 | ) |
Minimum pension liability | | | (276 | ) | | | (2,749 | ) |
Cash flow hedges | | | 20,641 | | | | 3,535 | |
| | | | | | | | |
Cumulative other comprehensive income (loss), net of tax | | $ | 27,116 | | | $ | (1,313 | ) |
| | | | | | | | |
Reclassification adjustments for cash flow hedges in fiscal 2006, fiscal 2005, and fiscal 2004 were $4,382,000 (net of tax of $2,686,000), $1,402,000 (net of tax of $859,000) and $248,000 (net of tax of $152,000), respectively.
The estimated net amount of the existing gains or losses in other comprehensive income at May 31, 2006, expected to be reclassified into net earnings within the twelve months was $8,598,000 (net of tax of $5,270,000). This amount was computed using the fair value of the cash flow hedges at May 31, 2006, and will change before actual reclassification from other comprehensive income to net earnings during fiscal 2007.
Note C – Debt
Debt at May 31 is summarized as follows:
| | | | | | | | | |
| In thousands | | 2004
| | 2003
|
| Short-term notes payable | | $ | — | | | $ | 1,145 | |
| 7.125% senior notes due May 15, 2006 | | | 142,409 | | | | 142,409 | |
| 6.700% senior notes due December 1, 2009 | | | 145,000 | | | | 145,000 | |
| Other | | | 2,359 | | | | 3,474 | |
| | | |
| | | |
| |
| Total debt | | | 289,768 | | | | 292,028 | |
| Less current maturities and short-term notes payable | | | 1,346 | | | | 2,339 | |
| | | |
| | | |
| |
| Total long-term debt | | $ | 288,422 | | | $ | 289,689 | |
| | | |
| | | |
| |
Short-term notes payable represent notes payable to banks. The weighted average interest rate for all bank notes was 3.73% at May 31, 2004. As of May 31, 2004, the Company had a $235.0 million multi-year
| | | | | | |
| In thousands | | 2006 | | 2005 |
Short-term notes payable | | $ | 7,684 | | $ | - |
7.125% senior notes due May 15, 2006 | | | - | | | 142,409 |
6.700% senior notes due December 1, 2009 | | | 145,000 | | | 145,000 |
Floating rate senior notes due December 17, 2014 | | | 100,000 | | | 100,000 |
Other | | | - | | | 1,023 |
| | | | | | |
Total debt | | | 252,684 | | | 388,432 |
Less current maturities and short-term notes payable | | | 7,684 | | | 143,432 |
| | | | | | |
Total long-term debt | | $ | 245,000 | | $ | 245,000 |
| | | | | | |
On September 29, 2005, Worthington Industries, Inc. amended and restated its $435,000,000 long-term revolving credit facility. The amendment provides for an extension of the facility provided by a group of 15 banks, which matures in May 2007.commitments to September 2010; replaces the leverage ratio (debt-to-EBITDA) financial covenant with an interest coverage ratio (EBITDA-to-interest expense) financial covenant and reduces the facility fees payable. The Companyborrowings under the amended and
restated facility may be used to fund general corporate purposes including working capital, capital expenditures, acquisitions and dividends.
Worthington Industries, Inc. pays commitmentfacility fees on the unused credit amount under theits revolving credit facility. Interest rates on borrowings under the revolving credit facility and related facility fees are
37
determined by the Company’sWorthington Industries, Inc.’s senior unsecured long-term debt ratings as assigned by Standard & Poor’s Ratings Services and Moody’s Investors Service. The covenants in the revolving credit facility include, among others, maintenance of a debt-to-total capitalization ratio of not more than 55% and maintenance of an interest coverage ratio of not less than 3.25 times through maturity. The Company was in compliance with all covenants under the facility at May 31, 2006. There was no outstanding balance under the facility at May 31, 2006 and 2005.
In July 2004, Worthington Industries, Inc. amended its then $235,000,000 revolving credit facility to increase its size to $435,000,000 and 2003.to eliminate certain covenants.
Effective December 17, 2004, Worthington Industries, Inc. issued $100,000,000 in aggregate principal amount of unsecured Floating Rate Senior Notes due December 17, 2014 (the “2014 Notes”) through a private placement. The 2014 Notes bear interest at a variable rate equal to six-month LIBOR plus 80 basis points. This rate was 5.46% as of May 31, 2006. The 2014 Notes are callable at Worthington Industries, Inc.’s option, at par, on or after December 17, 2006. The covenants in the facility2014 Notes include, among others, maintenance of a debt-to-total capitalization ratio of not more than 55% and maintenance of a debt-to-EBITDA (Earnings Before Interest, Taxes, Depreciation and Amortization) ratio of not more than 3.25 times through February 2005, declining to 3.00 times in May 2005.maturity. The Company was in compliance with all covenants under the facility2014 Notes at May 31, 2004.2006.
During July 2004,In anticipation of the issuance of the 2014 Notes, the Company entered into an interest rate swap agreement in October 2004, which was amended in December 2004. Under the $235.0 millionterms of the agreement, the Company receives interest on a $100,000,000 notional amount at the six-month LIBOR rate and the Company pays interest on the same notional amount at a fixed rate of 4.46%.
At May 31, 2006, the Company’s short-term notes payable represented debt of foreign operations consisting of a term loan bearing interest at a variable rate of 3.4%, which is guaranteed by Worthington Industries, Inc. This rate is determined by Worthington Industries, Inc’s senior unsecured long-term debt ratings as assigned by Standard & Poor’s ratings Services and Moody’s Investors Service. The covenants reflect those of the $435,000,000 revolving credit facility to increase its size to $435.0 million and eliminate certain covenants. This facility is with the same group of 15 banks, matures in May 2007, and contains the same provisions mentionedlisted above.
At May 31, 2004, the Company’s “Other” debt represented debt from foreign operations with a weighted average interest rate of 0.36%. At May 31, 2004, the Company was not a party to any interest rate swap agreements or other interest rate derivatives.
Principal payments due on long-term debt in the next five fiscal years and the remaining years thereafter are as follows (in thousands):
| | | | |
| 2005 | | $ | 1,346 |
| 2006 | | | 143,422 |
| 2007 | | | — |
| 2008 | | | — |
| 2009 | | | — |
| Thereafter | | | 145,000 |
| | | |
|
| Total | | $ | 289,768 |
| | | |
|
NOTE
| | | |
| In thousands | | |
2007 | | $ | - |
2008 | | | - |
2009 | | | - |
2010 | | | 145,000 |
2011 | | | - |
Thereafter | | | 100,000 |
| | | |
Total | | $ | 245,000 |
| | | |
Note D – Income Taxes
Earnings before income taxes for the years ended May 31 include the following components:
| | | | | | | | | | | | | |
| In thousands | | 2004
| | 2003
| | 2002
|
| Pre-tax earnings: | | | | | | | | | | | | |
| United States based operations | | $ | 119,658 | | | $ | 107,948 | | | $ | 13,108 | |
| Non - United States based operations | | | 7,806 | | | | 10,450 | | | | (2,868 | ) |
| | | |
| | | |
| | | |
| |
| | | $ | 127,464 | | | $ | 118,398 | | | $ | 10,240 | |
| | | |
| | | |
| | | |
| |
38
| | | | | | | | | |
| In thousands | | 2006 | | 2005 | | 2004 |
Pre-tax earnings: | | | | | | | | | |
United States based operations | | $ | 194,427 | | $ | 271,831 | | $ | 119,658 |
Non - United States based operations | | | 18,322 | | | 16,638 | | | 7,806 |
| | | | | | | | | |
| | $ | 212,749 | | $ | 288,469 | | $ | 127,464 |
| | | | | | | | | |
Significant components of income tax expense for the years ended May 31 were as follows:
| | | | | | | | | | | | | |
| In thousands | | 2004
| | 2003
| | 2002
|
| Current: | | | | | | | | | | | | |
| Federal | | $ | 52,720 | | | $ | 20,391 | | | $ | 19,142 | |
| State and local | | | 7,061 | | | | 1,060 | | | | 2,051 | |
| Foreign | | | 3,439 | | | | 5,353 | | | | (734 | ) |
| | | |
| | | |
| | | |
| |
| | | | 63,220 | | | | 26,804 | | | | 20,459 | |
| Deferred: | | | | | | | | | | | | |
| Federal | | | (19,034 | ) | | | 16,963 | | | | (14,570 | ) |
| State | | | (2,229 | ) | | | 208 | | | | (2,151 | ) |
| Foreign | | | (1,245 | ) | | | (760 | ) | | | — | |
| | | |
| | | |
| | | |
| |
| | | | (22,508 | ) | | | 16,411 | | | | (16,721 | ) |
| | | |
| | | |
| | | |
| |
| | | $ | 40,712 | | | $ | 43,215 | | | $ | 3,738 | |
| | | |
| | | |
| | | |
| |
| | | | | | | | | | | | |
| In thousands | | 2006 | | | 2005 | | | 2004 | |
Current: | | | | | | | | | | | | |
Federal | | $ | 56,911 | | | $ | 94,295 | | | $ | 52,720 | |
State and local | | | 8,343 | | | | 13,387 | | | | 7,061 | |
Foreign | | | 14,150 | | | | 2,871 | | | | 3,439 | |
| | | | | | | | | | | | |
| | | 79,404 | | | | 110,553 | | | | 63,220 | |
Deferred: | | | | | | | | | | | | |
Federal | | | (6,051 | ) | | | (4,434 | ) | | | (19,034 | ) |
State | | | (1,950 | ) | | | 3,634 | | | | (2,229 | ) |
Foreign | | | (4,644 | ) | | | (696 | ) | | | (1,245 | ) |
| | | | | | | | | | | | |
| | | (12,645 | ) | | | (1,496 | ) | | | (22,508 | ) |
| | | | | | | | | | | | |
| | $ | 66,759 | | | $ | 109,057 | | | $ | 40,712 | |
| | | | | | | | | | | | |
Tax benefits related to the exercise of stock options that were credited to additional paid-in capital were $446,000, $489,000$1,279,000, $3,542,000 and $384,000$446,000 for fiscal 2004,2006, fiscal 20032005, and fiscal 2002,2004, respectively. Tax benefits (expenses) related to foreign currency translation adjustments that were credited to (deducted from) other comprehensive income were $0, $(2,214,000)$677,000, $(756,000), and $(2,136,000)$0 for fiscal 2004,2006, fiscal 20032005, and fiscal 2002,2004, respectively. The taxTax benefits (expenses) related to minimum pension liability that were credited to other comprehensive income were $(492,000)$28,000, $203,000, and $1,463,000$(492,000) for fiscal 20042006, fiscal 2005, and fiscal 2003,2004 respectively. Tax benefits (expenses)expenses related to cash flow hedges that were credited to other comprehensive income were $(2,628,000)$(8,364,000), $(253,000)$(661,000), and $495,000$(2,628,000) for fiscal 2004,2006, fiscal 20032005, and fiscal 2002,2004, respectively.
The reconciliation of the differences between the effective income tax rate and the statutory federal income tax rate for the years ended May 31 is as follows:
| | | | | | | | | | | | | |
| | | 2004
| | 2003
| | 2002
|
| Federal statutory rate | | | 35.0 | % | | | 35.0 | % | | | 35.0 | % |
| State and local income taxes, net of federal tax benefit | | | 2.5 | | | | 1.5 | | | | (0.6 | ) |
| Reversal of income tax accruals for favorable resolution of tax audits and change in estimate of deferred taxes | | | (6.1 | ) | | | — | | | | — | |
| Foreign and other | | | 0.5 | | | | — | | | | 2.1 | |
| | | |
| | | |
| | | |
| |
| Effective tax rate | | | 31.9 | % | | | 36.5 | % | | | 36.5 | % |
| | | |
| | | |
| | | |
| |
The Company has a reserve for taxes that may become payable as a result of audits in future periods with respect to previously filed tax returns included in long-term liabilities. It is the Company’s policy to establish reserves for taxes that may become payable in future years as a result of an examination by taxing authorities.
| | | | | | |
| | | 2006 | | 2005 | | 2004 |
Federal statutory rate | | 35.0% | | 35.0% | | 35.0% |
| | | |
State and local income taxes, net of federal tax benefit | | 3.6 | | 3.0 | | 2.5 |
| | | |
Reversal of income tax accruals for favorable resolution of tax audits and change in estimate of deferred tax | | (1.4) | | (0.2) | | (6.1) |
| | | |
Non-U.S. income taxes at other than 35% | | (4.1) | | (1.3) | | (0.4) |
| | | |
Ohio income tax law change | | (2.3) | | - | | - |
| | | |
Special foreign earnings repatriations and sale of non-U.S. company | | 2.5 | | - | | - |
| | | |
Deferred tax adjustment for foreign earnings | | (2.2) | | - | | - |
| | | |
Other | | 0.3 | | 1.3 | | 0.9 |
| | | | | | |
Effective tax rate | | 31.4% | | 37.8% | | 31.9% |
| | | | | | |
The Company establishes the reserves based upon management’s assessment of exposure associated with permanent tax differences, tax credits, and interest expense, and penalties applied to temporary difference adjustments.adjustments and tax return positions. The tax reserves are analyzed periodically and adjustments are made as events occur to warrant adjustment to the reserve. The Company decreased the tax reserve in the fourth quarter of fiscal 2004 asAs a result of the favorable resolution of certain tax audits resulting in a $6,364,000 reduction in incomeand related developments, the Company decreased the tax expense.reserve by $2,261,000, $2,112,000 and $3,377,000 for fiscal 2006, fiscal 2005 and fiscal 2004, respectively.
The Company adjusted deferred taxes in fiscal 2004,2006 and fiscal 2005, resulting in a $1,361,000 reduction$5,599,000 decrease and $1,628,000 increase, respectively, in income tax expense. Fiscal 2006 included a $4,623,000 adjustment for an over-accrual of deferred tax liabilities related to the foreign earnings of the WAVE joint venture and a $4,346,000 deferred tax liability adjustment for the Ohio tax law changes, discussed below, offset by a $3,370,000 adjustment for changes in estimated tax liabilities.
On June 30, 2005, the state of Ohio enacted various changes to its tax laws. One change is the phase-out of the Ohio franchise tax, which is generally based on federal taxable income. This phase-out is scheduled to occur at the rate of 20% per year for 2006 through 2010. The Company’s accrual for income taxes for fiscal 2005 included 100% of the expected Ohio franchise tax liability. As a result of the law change, only 80% of that liability was due. As such, the Company made an adjustment to reduce its accrued income taxes. In addition, as a result of various changes to Ohio’s tax laws, the Company adjusted its deferred taxes by $4,346,000.
American Jobs Creation Act
The American Jobs Creation Act of 2004 (“the Act”) provides a deduction for income from qualified domestic production activities, which is phased in from 2006 through 2011. The effect of the phase-in of this new deduction resulted in a decrease in the effective tax rate for fiscal year 2006 of less than 1 percentage-point. Under the guidance in FASB Staff Position SFAS 109-1,Application of FASB Statement No. 109, Accounting for Income Taxes, to the Tax Deduction on Qualified Production Activities Provided by the American Jobs Creation Act of 2004, the deduction will be treated as a “special deduction” as described in SFAS 109. As such, the special deduction has no effect on deferred tax assets and liabilities existing as of the enactment date. Rather, the impact of this deduction will be reported in the period in which the deduction is claimed on the Company’s tax return.
The Act also created a temporary incentive for U.S. corporations to repatriate accumulated income earned abroad by providing an 85 percent dividends-received deduction for certain dividends from controlled foreign corporations. During fiscal 2006, the Company both approved a plan for reinvestment and repatriated a cash dividend amount of $42,157,000, of which $41,395,000 qualified for the 85 percent dividends-received deduction. Pursuant to the plan for reinvestment, during 2006 the Company made expenditures for capital additions and improvements and other qualifying amounts at its domestic facilities in excess of the $42,157,000 cash dividend amount. As a result, the Company recorded a related tax expense of $1,702,000 for the cash dividend repatriation.
Taxes on Foreign Income
Pre-tax income for fiscal 2006, 2005 and 2004 attributable to foreign sources are as noted above. Without regard to the one-time repatriation discussed above, as of May 31, 2006, and based on the tax laws in effect at that time, it remains the Company’s intention to continue to indefinitely reinvest its undistributed foreign earnings, except for the foreign earnings of its TWB joint venture. Accordingly, where this election has been made, no deferred tax liability has been recorded for those foreign earnings. Undistributed earnings of the Company’sits consolidated foreign subsidiaries, net of the $42,157,000 repatriation, at May 31, 2004, are considered2006, amounted to be indefinitely reinvested. Accordingly, the calculation$34,420,000. If such earnings were not permanently reinvested, a deferred tax liability of and provision for deferred taxes are not practicable. Upon distribution of those earnings in the form of dividends or otherwise, the earnings may become taxable.approximately $13,160,000 would have been required.
39
The components of the Company’s deferred tax assets and liabilities as of May 31 were as follows:
| | | | | | | | | |
In thousands
| | 2004
| | 2003
|
| Deferred tax assets: | | | | | | | | |
| Accounts receivable | | $ | 6,312 | | | $ | 5,022 | |
| Inventories | | | 3,050 | | | | 3,568 | |
| Accrued expenses | | | 15,370 | | | | 12,870 | |
| Restructuring expense | | | 5,008 | | | | 1,171 | |
| Net operating loss carryforwards | | | 24,321 | | | | 23,237 | |
| Tax credit carryforwards | | | 3,060 | | | | 1,302 | |
| Other | | | — | | | | 255 | |
| | | |
| | | |
| |
| Total deferred tax assets | | | 57,121 | | | | 47,425 | |
| Valuation allowance for deferred tax assets | | | (21,127 | ) | | | (21,225 | ) |
| | | |
| | | |
| |
| Net deferred tax assets | | | 35,994 | | | | 26,200 | |
| Deferred tax liabilities: | | | | | | | | |
| Property, plant and equipment | | | 113,455 | | | | 119,023 | |
| Income taxes | | | 1,492 | | | | 9,139 | |
| Undistributed earnings of unconsolidated affiliates | | | 17,198 | | | | 13,171 | |
| Other | | | 4,102 | | | | 7,528 | |
| | | |
| | | |
| |
| Total deferred tax liabilities | | | 136,247 | | | | 148,861 | |
| | | |
| | | |
| |
| Net deferred tax liability | | $ | 100,253 | | | $ | 122,661 | |
| | | |
| | | |
| |
| | | | | | | | |
| In thousands | | 2006 | | | 2005 | |
Deferred tax assets: | | | | | | | | |
Accounts receivable | | $ | 3,204 | | | $ | 5,820 | |
Inventories | | | 3,535 | | | | 3,181 | |
Accrued expenses | | | 16,209 | | | | 20,642 | |
Net operating loss carryforwards | | | 17,841 | | | | 17,374 | |
Tax credit carryforwards | | | 2,841 | | | | 2,276 | |
Income taxes | | | 1,025 | | | | 1,277 | |
| | | | | | | | |
Total deferred tax assets | | | 44,655 | | | | 50,570 | |
Valuation allowance for deferred tax assets | | | (15,931 | ) | | | (17,858 | ) |
| | | | | | | | |
Net deferred tax assets | | | 28,724 | | | | 32,712 | |
Deferred tax liabilities: | | | | | | | | |
Property, plant and equipment | | | 98,505 | | | | 106,287 | |
Derivative contracts | | | 11,413 | | | | 2,969 | |
Undistributed earnings of unconsolidated affiliates | | | 13,557 | | | | 23,393 | |
Other | | | 38 | | | | 35 | |
| | | | | | | | |
Total deferred tax liabilities | | | 123,513 | | | | 132,684 | |
| | | | | | | | |
Net deferred tax liability | | $ | 94,789 | | | $ | 99,972 | |
| | | | | | | | |
The above amounts are classified in the consolidated balance sheets as of May 31 as follows:
| | | | | | | | | |
In thousands
| | 2004
| | 2003
|
| Current assets: | | | | | | | | |
| Deferred income taxes | | $ | 3,963 | | | $ | 20,783 | |
| Noncurrent liabilities: | | | | | | | | |
| Deferred income taxes | | | 104,216 | | | | 143,444 | |
| | | |
| | | |
| |
| Net deferred tax liabilities | | $ | 100,253 | | | $ | 122,661 | |
| | | |
| | | |
| |
| | | | | | |
| In thousands | | 2006 | | 2005 |
Current assets: | | | | | | |
Deferred income taxes | | $ | 15,854 | | $ | 19,490 |
Other assets: | | | | | | |
Deferred income taxes | | | 3,967 | | | - |
Noncurrent liabilities: | | | | | | |
Deferred income taxes | | | 114,610 | | | 119,462 |
| | | | | | |
Net deferred tax liabilities | | $ | 94,789 | | $ | 99,972 |
| | | | | | |
At May 31, 2004,2006, the Company had tax benefits for federal net operating loss carryforwards of $785,000 that expire from fiscal 20052007 to fiscal 2018.2019. These net operating loss carryforwards are subject to utilization limitations. At May 31, 2004,2006, the Company had tax benefits for state net operating loss carryforwards of $19,186,000$11,893,000 that expire from fiscal 20052007 to fiscal 20192024 and state credit carryforwards of $3,060,000.$30,000. At May 31, 2004,2006, the Company had tax benefits for foreign net operating loss carryforwards of $4,350,000$5,162,000 for income tax purposes that expire from fiscal 20052007 to fiscal 2011. At May 31, 2006, the Company had tax benefits for foreign tax credit carryforwards of $2,812,000.
A valuation allowance of $21,127,000$15,931,000 has been recognized to offset the deferred tax assets related to the net operating loss carryforwards, and foreign tax credit carryforwards. The valuation allowance includes $785,000$3,597,000 for federal, $15,992,000$11,251,000 for state and $4,350,000$1,083,000 for foreign. The majority of the state valuation allowance relates to a corporation which ownedowning the Decatur, Alabama, facility (see “Note N – Impairment Chargeswhile the majority of the foreign valuation allowance relates to operations in the Czech Republic and Restructuring Expense” for more information). As a result, theChina. The Company has determined that it is more likely than not that there will not be sufficient taxable income in future years to utilize all of the net operating loss carryforwards.
NOTENote E – Employee Pension Plans
During December 2003, the Financial Accounting Standards Board (“FASB”) issued SFAS No. 132 (revised 2003),Employers’ Disclosures about Pensions and Other Postretirement Benefits – an amendment of FASB Statements No. 87, 88, and 106. This Statement revised disclosure requirements about pension plans and other postretirement benefit plans. It did not change the measurement or recognition of those plans required by SFAS No.
40
87,Employers’ Accounting for Pensions,SFAS No. 88,Employers’ Accounting for Settlements and Curtailments of Defined Benefit Pension Plans and for Termination Benefits,and SFAS No. 106,Employers’ Accounting for Postretirement Benefits Other Than Pensions. This Statement required additional disclosures about the assets, obligations, cash flows and net periodic benefit cost of defined benefit pension plans and other postretirement benefit plans. In addition, the various elements of pension and other postretirement benefit costs must be disclosed on a quarterly basis. The annual disclosure provisions of SFAS No. 132 (revised 2003) generally are effective for fiscal years ending after December 15, 2003, while the interim disclosure provisions are effective for interim periods beginning after December 15, 2003. The required annual disclosures are made below and the required interim disclosures will be made starting with the quarter ending August 31, 2004.
The Company provides pensionretirement benefits to employees mainly through defined benefit orcontributory, deferred profit sharing plans. Company contributions to the deferred profit sharing plans are determined as a percentage of the
Company’s pre-tax income before profit sharing with contributions guaranteed to represent at least 3% of the participants’ compensation. Starting in January 2003, the Company began matching employee contributions at 50% up to defined maximums. The Company also has one defined benefit plan, The Gerstenslager Company Bargaining Unit Employees’ Pension Plan. That defined benefit plan is a non-contributory pension plan, which covers certain employees based on age and length of service. Company contributions to this plan comply with ERISA’s minimum funding requirements. The remaining employees are covered by deferred profit sharing plans to which employees may also contribute. Company contributions to the deferred profit sharing plans are determined as a percentage of the Company’s pre-tax income before profit sharing. In addition, the Company began matching employee contributions up to 2% of their pay starting in January 2003. The Company has one defined benefit plan, The Gerstenslager Company Bargaining Unit Employees’ Pension Plan.
As part of its consolidation plan announced in fiscal 2002, the Company recognized in the restructuring charge actual and curtailment losses on plan assets of $4,242,000 in fiscal 2002 and $3,135,000 in fiscal 2003. The loss primarily resulted from the recognition of prior service costs of terminated employees in the Malvern, the NRM Trucking and the Jackson defined benefit plans. During fiscal 2003 and fiscal 2004, the Internal Revenue Service and the Pension Benefit Guaranty Corporation approved The Notice of Intent to Terminate and Freeze the Malvern, NRM Trucking and Jackson plans. Annuity contracts were purchased in fiscal 2004 and fiscal 2003 to settle the liabilities under these plans. During fiscal 2004, the liabilities of the Malvern, NRM Trucking and Jackson plans were settled through annuity purchases requiring additional employer contributions of $5,991,000.
The following table summarizes the components of net periodic pension cost, excluding the amounts recorded as part of the restructuring charge, for the defined benefit and contribution plans for the years ended May 31:
| | | | | | | | | | | | | |
In thousands
| | 2004
| | 2003
| | 2002
|
| Defined benefit plans: | | | | | | | | | | | | |
| Service cost | | $ | 703 | | | $ | 645 | | | $ | 934 | |
| Interest cost | | | 600 | | | | 1,419 | | | | 1,333 | |
| Actual loss (return) on plan assets | | | (2,160 | ) | | | 3,032 | | | | 287 | |
| Net amortization and deferral | | | 2,222 | | | | (4,242 | ) | | | (1,218 | ) |
| | | |
| | | |
| | | |
| |
| Net pension cost on defined benefit plans | | | 1,365 | | | | 854 | | | | 1,336 | |
| Defined contribution plans | | | 9,920 | | | | 6,540 | | | | 6,735 | |
| | | |
| | | |
| | | |
| |
| Total pension cost | | $ | 11,285 | | | $ | 7,394 | | | $ | 8,071 | |
| | | |
| | | |
| | | |
| |
41
The following actuarial assumptions were used for the Company’s defined benefit pension plans:
| | | | | | | | | | | | | |
| | | 2004
| | 2003
| | 2002
|
| Terminated Plans: | | | | | | | | | | | | |
| Weighted average discount rate | | | — | | | | 5.37 | % | | | 7.00 | % |
| Weighted average expected long-term rate of return | | | — | | | | 1.00 | % | | | 7.75 | % |
| Continuing Plan: | | | | | | | | | | | | |
| To determine benefit obligation: | | | | | | | | | | | | |
| Discount rate | | | 5.75 | % | | | 6.00 | % | | | — | |
| To determine net periodic pension cost: | | | | | | | | | | | | |
| Discount rate | | | 6.00 | % | | | 7.00 | % | | | 7.00 | % |
| Expected long-term rate of return | | | 7.00 | % | | | 9.00 | % | | | 9.00 | % |
| Rate of compensation increase | | | n/a | | | | n/a | | | | n/a | |
| | | | | | | | | | | | |
| In thousands | | 2006 | | | 2005 | | | 2004 | |
Defined benefit plan: | | | | | | | | | | | | |
Service cost | | $ | 700 | | | $ | 696 | | | $ | 703 | |
Interest cost | | | 719 | | | | 646 | | | | 600 | |
Actual return on plan assets | | | (1,621 | ) | | | (622 | ) | | | (2,160 | ) |
Net amortization and deferral | | | 1,149 | | | | 323 | | | | 2,222 | |
| | | | | | | | | | | | |
Net pension cost on defined benefit plan | | | 947 | | | | 1,043 | | | | 1,365 | |
Defined contribution plans | | | 9,663 | | | | 10,776 | | | | 9,920 | |
| | | | | | | | | | | | |
Total pension cost | | $ | 10,610 | | | $ | 11,819 | | | $ | 11,285 | |
| | | | | | | | | | | | |
|
The following actuarial assumptions were used for the Company’s defined benefit plan: | |
| | | |
| | | 2006 | | | 2005 | | | 2004 | |
To determine benefit obligation: | | | | | | | | | | | | |
Discount rate | | | 6.03 | % | | | 5.61 | % | | | 5.75 | % |
To determine net periodic pension cost: | | | | | | | | | | | | |
Discount rate | | | 5.61 | % | | | 5.75 | % | | | 6.00 | % |
Expected long-term rate of return | | | 8.00 | % | | | 7.00 | % | | | 7.00 | % |
Rate of compensation increase | | | n/a | | | | n/a | | | | n/a | |
The expected long-term rate of return on the continuingdefined benefit plan in fiscal 2004 is2006 and fiscal 2005 was based on the actual historical returns adjusted for a change in the frequency of lump sum settlements upon retirement. The expected long-term rate of return on the continuingdefined benefit plan for fiscal 2003 and fiscal 20022004 was based on historical returns.
The following tables providesprovide a reconciliation of the changes in the projected benefit obligation and fair value of plan assets and the funded status for the defined benefit plan during fiscal 20042006 and fiscal 20032005 as of the March 31 measurement date:
| | | | | | | | | |
In thousands
| | 2004
| | 2003
|
| Change in benefit obligation | | | | | | | | |
| Benefit obligation, beginning of year | | $ | 24,913 | | | $ | 19,755 | |
| Service cost | | | 703 | | | | 645 | |
| Interest cost | | | 600 | | | | 1,419 | |
| Settlements | | | (14,660 | ) | | | — | |
| Actuarial loss | | | 358 | | | | 4,882 | |
| Benefits paid | | | (70 | ) | | | (1,788 | ) |
| | | |
| | | |
| |
| Benefit obligation, end of year | | $ | 11,844 | | | $ | 24,913 | |
| | | |
| | | |
| |
| Change in plan assets | | | | | | | | |
| Fair value, beginning of year | | $ | 15,037 | | | $ | 19,857 | |
| Actual return (loss) on plan assets | | | 2,160 | | | | (3,032 | ) |
| Company contributions | | | 821 | | | | — | |
| Settlements | | | (9,202 | ) | | | — | |
| Benefits paid | | | (70 | ) | | | (1,788 | ) |
| | | |
| | | |
| |
| Fair value, end of year | | $ | 8,746 | | | $ | 15,037 | |
| | | |
| | | |
| |
42
| | | | | | | | |
| In thousands | | 2006 | | | 2005 | |
Change in benefit obligation | | | | | | | | |
Benefit obligation, beginning of year | | $ | 13,356 | | | $ | 11,844 | |
Service cost | | | 700 | | | | 696 | |
Interest cost | | | 719 | | | | 646 | |
Actuarial (gain) loss | | | (935 | ) | | | 302 | |
Benefits paid | | | (144 | ) | | | (131 | ) |
| | | | | | | | |
Benefit obligation, end of year | | $ | 13,696 | | | $ | 13,357 | |
| | | | | | | | |
| | |
Change in plan assets | | | | | | | | |
Fair value, beginning of year | | $ | 9,237 | | | $ | 8,746 | |
Actual return on plan assets | | | 1,621 | | | | 622 | |
Company contributions | | | 2,659 | | | | - | |
Benefits paid | | | (144 | ) | | | (131 | ) |
| | | | | | | | |
Fair value, end of year | | $ | 13,373 | | | $ | 9,237 | |
| | | | | | | | |
| | |
Unrecognized net actuarial loss | | | 932 | | | | 2,776 | |
Unrecognized prior service cost | | | 700 | | | | 939 | |
Minimum pension liability | | | (1,632 | ) | | | (3,715 | ) |
| | | | | | | | |
Accrued benefit cost | | $ | (323 | ) | | $ | (4,120 | ) |
| | | | | | | | |
| | |
Plan with benefit obligation in excess of fair value of plan assets: | | | | | | | | |
Projected and accumulated benefit obligation | | $ | 13,696 | | | $ | 13,357 | |
Fair value of plan assets | | | 13,373 | | | | 9,237 | |
| | | | | | | | |
Funded status | | $ | (323 | ) | | $ | (4,120 | ) |
| | | | | | | | |
| | | | | | | | | |
| | | 2004
| | 2003
|
| Projected benefit obligation in excess of plan assets as of measurement date | | $ | (3,098 | ) | | $ | (9,876 | ) |
| Unrecognized net actuarial loss | | | 2,557 | | | | 3,814 | |
| Unrecognized prior service cost | | | 1,179 | | | | 1,420 | |
| Minimum pension liability | | | (3,736 | ) | | | (5,600 | ) |
| | | |
| | | |
| |
| Accrued benefit cost | | $ | (3,098 | ) | | $ | (10,242 | ) |
| | | |
| | | |
| |
| Plans with benefit obligations in excess of fair value of plan assets: | | | | | | | | |
| Projected and accumulated benefit obligation | | $ | 11,844 | | | $ | 24,913 | |
| Fair value of plan assets | | | 8,746 | | | | 15,037 | |
| | | |
| | | |
| |
| Funded status | | $ | (3,098 | ) | | $ | (9,875 | ) |
| | | |
| | | |
| |
Plan assets for the continuingdefined benefit plan consist principally of the following as of the March 31 measurement date:
| | | | | | | | | |
| | | 2004
| | 2003
|
| Asset category: | | | | | | | | |
| Equity securities | | | 71 | % | | | 69 | % |
| Debt securities | | | 29 | | | | 31 | |
| | | |
| | | |
| |
| Total | | | 100 | % | | | 100 | % |
| | | |
| | | |
| |
| | | | |
| | | 2006 | | 2005 |
Asset category | | | | |
Equity securities | | 70% | | 70% |
Debt securities | | 30% | | 30% |
| | | | |
Total | | 100% | | 100% |
| | | | |
Equity securities include no employer stock. The investment policiespolicy and strategiesstrategy for the continuingdefined benefit plan areis as follows: (i) The plan’s objectives are long-term in nature and liquidity requirements are anticipated to be minimal due to the projected normal retirement date of the average employee and the current average age of participants. (ii) The plan’s objective is to earn nominal returns, net of investment fees, equal to or in excess of the actuarial assumption of the plan. (iii) The strategic asset allocation includes 60-80% equities, including international, and 20-40% fixed income investments.
No contributions
Contributions to the continuingdefined benefit plan are expected to be approximately $2,000,000 during fiscal 2005.2007. The following estimated future benefits, which reflect expected future service, as appropriate, are expected to be paid:
| | | | | |
| In thousands | | | | |
| 2005 | | $ | 43 | |
| 2006 | | | 87 | |
| 2007 | | | 139 | |
| 2008 | | | 169 | |
| 2009 | | | 252 | |
| 2010-2014 | | | 2,244 | |
NOTE
| | | |
| In thousands | | |
2007 | | $ | 148 |
2008 | | | 166 |
2009 | | | 229 |
2010 | | | 256 |
2011 | | | 315 |
2012-2016 | | | 3,001 |
Austrian commercial law requires the Company to pay severance and service benefits to employees. Severance benefits must be paid to all employees hired before December 31, 2002. Employees hired after that date are covered under a governmental plan that requires the Company to pay benefits as a percentage of compensation (included in payroll tax withholdings). Service benefits are based on a percentage of compensation and years of service. The accrued liability for these plans was $5,361,000 and $5,017,000 at May 31, 2006 and 2005, respectively, and was included in ‘Other liabilities’. Net periodic pension cost for these plans was $580,000, $570,000, and $550,000 for fiscal 2006, 2005 and 2004, respectively. The assumed salary rate increase was 3.5 % for each of fiscal 2006, 2005, and 2004. The discount rate at May 31, 2006, 2005 and 2004 was 4.70%, 5.61% and 5.25%, respectively.
Note F – Stock-Based Compensation
Under its employee and non-employee director stock option plans, the Company may grant incentive or non-qualified stock options to employees to purchase common shares at not less than 100% of fair market value aton the date of grant and non-qualified stock options at a price determined by the Compensation and Stock Option Committee. The Company also has a plan for non-employee directors. Under this plan, the Company makes annual grants of non-qualified stock options to purchase common shares at an exercise price equal to 100% of the fair market value of the underlying common shares on the date of grant. All outstanding options are non-qualified stock options. The exercise price of all stock options granted ishas been set at 100% of the fair market pricevalue of the underlying common shares on the date of grant. Generally, stockthe options granted to employees vest and become exercisable at the rate of 20% per year beginning one year from the date of grant and expire ten years thereafter.after the date of grant. The non-qualified stock options granted to non-employee directors vest and become exercisable on the first to occur of (a) the first anniversary of the date of grant and (b) as to any option granted as of the date of an annual meeting of shareholders of Worthington Industries, Inc., the date on which the next annual meeting of shareholders is held following the date of grant.
43
The following table summarizes the Company’s activities in stock option plans’ activitiesplans for the years ended May 31:
| | | | | | | | | | | | | | | | | | | | | | | | | |
| | | 2004
| | 2003
| | 2002
|
| | | | | | | Weighted | | | | | | Weighted | | | | | | Weighted |
| | | Stock | | Average | | Stock | | Average | | Stock | | Average |
In thousands, except per share
| | Options
| | Price
| | Options
| | Price
| | Options
| | Price
|
| Outstanding, beginning of year | | | 5,942 | | | $ | 13.49 | | | | 5,417 | | | $ | 13.05 | | | | 5,839 | | | $ | 13.07 | |
| Granted | | | 762 | | | | 15.15 | | | | 1,086 | | | | 15.12 | | | | 12 | | | | 11.05 | |
| Exercised | | | (795 | ) | | | 11.58 | | | | (355 | ) | | | 11.86 | | | | (137 | ) | | | 12.10 | |
| Forfeited | | | (514 | ) | | | 14.80 | | | | (206 | ) | | | 13.88 | | | | (297 | ) | | | 13.90 | |
| | | |
| | | | | | | |
| | | | | | | |
| | | | | |
| Outstanding, end of year | | | 5,395 | | | | 13.86 | | | | 5,942 | | | | 13.49 | | | | 5,417 | | | | 13.05 | |
| | | |
| | | | | | | |
| | | | | | | |
| | | | | |
| Exercisable at end of year | | | 3,200 | | | | 14.18 | | | | 3,276 | | | | 14.30 | | | | 2,735 | | | | 14.92 | |
| | | |
| | | | | | | |
| | | | | | | |
| | | | | |
| | | | | | | | | | | | | | | | | | |
| | | 2006 | | 2005 | | 2004 |
| In thousands, except per share | | Stock Options | | | Weighted Average Price | | Stock Options | | | Weighted Average Price | | Stock Options | | | Weighted Average Price |
Outstanding, beginning of year | | 5,803 | | | $ | 15.48 | | 5,395 | | | $ | 13.86 | | 5,942 | | | $ | 13.49 |
Granted | | 762 | | | | 17.18 | | 2,035 | | | | 19.23 | | 762 | | | | 15.15 |
Exercised | | (773 | ) | | | 12.12 | | (1,040 | ) | | | 13.12 | | (795 | ) | | | 11.58 |
Forfeited | | (204 | ) | | | 18.16 | | (587 | ) | | | 17.75 | | (514 | ) | | | 14.80 |
| | | | | | | | | | | | | | | | | | |
Outstanding, end of year | | 5,588 | | | | 16.09 | | 5,803 | | | | 15.48 | | 5,395 | | | | 13.86 |
| | | | | | | | | | | | | | | | | | |
Exercisable at end of year | | 2,702 | | | | 14.33 | | 2,581 | | | | 13.41 | | 3,200 | | | | 14.18 |
| | | | | | | | | | | | | | | | | | |
The following table summarizes information for stock options outstanding and exercisable at May 31, 2004:
| | | | | | | | | | | | | | | | | | | | | |
| | | Outstanding
| | Exercisable
|
| | | | | | | | | | | Weighted | | | | | | |
| | | | | | | Weighted | | Average | | | | | | Weighted |
| | | | | | | Average | | Remaining | | | | | | Average |
| | | | | | | Exercise | | Contractual | | | | | | Exercise |
In thousands, except per share
| | Number
| | Price
| | Life
| | Number
| | Price
|
| Exercise prices between | | | | | | | | | | | | | | | | | | | | |
| $9.00 and $13.00 | | | 2,742 | | | $ | 11.26 | | | | 5.7 | | | | 1,994 | | | $ | 11.76 | |
| $14.68 and $20.88 | | | 2,653 | | | | 16.55 | | | | 5.9 | | | | 1,206 | | | | 18.17 | |
| | | | | | | | | | | | |
| | | Outstanding | | Exercisable |
| In thousands, except per share | | Number | | Weighted
Average
Exercise
Price | | Weighted
Average
Remaining
Contractual
Life | | Number | | Weighted
Average
Exercise
Price |
Exercise prices between | | | | | | | | | | | | |
$ 9.00 and $ 13.00 | | 1,315 | | $ | 11.32 | | 3.8 | | 1,315 | | $ | 11.32 |
$15.00 and $ 21.35 | | 4,273 | | | 17.55 | | 7.1 | | 1,387 | | | 17.18 |
Under APB No. 25, the Company doeshas not recognizerecognized compensation expense related to stock options, as no stock options have been granted at a price below the fair market price on the date of grant. See “Note A – Summary of Significant Accounting Policies – Stock-Based Compensation” for pro forma disclosures required by SFAS No. 148.
NOTENote G – Contingent Liabilities and Commitments
The Company is a defendant in certain legal actions. In the opinion of management, the outcome of these actions, which is not clearly determinable at the present time, would not significantly affect the Company’s consolidated financial position or future results of operations. The Company believes that environmental issues will not have a material effect on capital expenditures, consolidated financial position or future results of operations.
To secure access to facilitiesa facility used to regenerate acid used in certain steel processing locations, the Company has entered into unconditional purchase obligations with a third party under which requirethree of the Company toCompany’s steel processing facilities deliver certain quantities oftheir spent acid for processing annually through the yearfiscal 2019. In addition, the Company is required to pay for freight and utilities used in processing its acid. The aggregate amount of required future payments at May 31, 2004,2006, is as follows (in thousands):
| | | | | |
| 2005 | | $ | 2,367 | |
| 2006 | | | 2,367 | |
| 2007 | | | 2,367 | |
| 2008 | | | 2,367 | |
| 2009 | | | 2,367 | |
| Thereafter | | | 23,670 | |
| | | |
| |
| Total | | $ | 35,505 | |
| | | |
| |
44
| | | |
2007 | | $ | 2,367 |
2008 | | | 2,367 |
2009 | | | 2,367 |
2010 | | | 2,367 |
2011 | | | 2,367 |
Thereafter | | | 18,936 |
| | | |
Total | | $ | 30,771 |
| | | |
The Company may not terminate the unconditional purchase obligations withoutby assuming or otherwise repaying certain debt of the supplier, which was $14,630,000$12,805,000 at May 31, 2004.2006.
At the closing of the sale of the Decatur facility on August 1, 2004, the unconditional purchase obligation associated with Decatur was eliminated. The estimated termination cost will bewas recorded in 1stfirst quarter of fiscal 2005. See “Note N – Impairment Charges and Restructuring Expense” for more information.
NOTENote H – Industry Segment–Segment Data
Several changes occurred during the second quarter of fiscal 2006 in the Company’s internal organizational and reporting structures, affecting the composition of the Company’s reportable segments. The Automotive Body Panels operating segment, consisting of The Gerstenslager Company, which was previously combined with Steel Processing in the Processed Steel Products segment, was moved to the “Other” category, and the Processed Steel Products segment was renamed Steel Processing. Dietrich Construction Group was formed and includes Dietrich Building Systems (previously included in the Metal Framing segment), Dietrich Residential Construction (was an unconsolidated joint venture and is now wholly-owned), and a research and development project in China. The “Other” category now includes the Automotive Body Panels, Construction Services and Steel Packaging operating
segments and also includes income and expense items not allocated to the reportable segments. Summarized financial information for the Company’s reportable segments is shown in the following table. All prior period financial information has been reclassified to reflect the segment changes mentioned above.
The Company’s operations include three reportable segments: Processed Steel Products,Processing, Metal Framing and Pressure Cylinders. Factors used to identify these segments include the products and services provided by each segment as well as the management reporting structure used by the Company. A discussion of each segment is outlined below.
Processed Steel ProductsProcessing: ThisThe Steel Processing segment consists of two business units, Thethe Worthington Steel Company (“business unit. Worthington Steel”) and The Gerstenslager Company (“Gerstenslager”). Both areSteel is an intermediate processorsprocessor of flat-rolled steel. This segment’s processing capabilities include pickling, slitting, cold reduction, hot-dipped galvanizing, hydrogen annealing, cutting-to-length, tension leveling, edging, non-metallic coatings, including dry lubricating,lube, acrylic and paint, configured blanking and stamping. Worthington Steel sells to customers principally in the automotive, construction, lawn and garden, hardware, furniture, office equipment, electrical control, tubing, leisure and recreation, appliance, farm implement,implements, HVAC, container, and aerospace markets. Gerstenslager supplies exposed body panels and unexposed components for past model service and current model production primarily to domestic and transplant automotive and heavy-duty truck manufacturers in the United States.
Metal Framing: This segment consists of onethe Dietrich Metal Framing business unit, Dietrich Industries, Inc. (“Dietrich”), which designs and produces metal framing components and systems and related accessories for the commercial and residential construction markets inwithin the United States.States and Canada. Dietrich’s customers primarily consist of wholesale distributors, commercial and residential building contractors, and big box building material retailers.mass merchandisers.
Pressure Cylinders: This segment consists of onethe Worthington Cylinders business unit, Worthington Cylinder Corporation (“Worthington Cylinders”).unit. Worthington Cylinders produces a diversified line of pressure cylinders, including low-pressure liquefied petroleum gas (“LPG”) cylinders, refrigerant gas cylinders and high-pressure and industrial/specialty gas cylinders. The LPG cylinders are used for gas barbecue grills, recreational vehicle equipment, residential heating systems, industrial forklifts, hand torches, propane-fueled camping equipment and commercial/residential cooking (the latter, generally outside North America). Refrigerant gas cylinders are used to hold refrigerant gases for commercial and residential air conditioning and refrigeration systems and for automotive air conditioning systems. High-pressure and industrial/specialty gas cylinders are containers for gases used in the following: cutting and welding metals; breathing (medical, diving and firefighting); semiconductor production; beverage delivery; and compressed natural gas systems. Worthington Cylinders also produces recovery tanks for refrigerant gases, air reservoirs for truck and trailer manufacturers, and non-refillable cylinders for “Balloon Time®Time®” helium kits.
Other: This category consists of operating segments that do not fit into the reportable segments and are immaterial for purposes of separate disclosure and other corporate related entities. The operating segments are: Automotive Body Panels, which consists of The Gerstenslager Company (“Gerstenslager”); Construction Services, which consists of the Dietrich Construction Group companies; and Steel Packaging, which consists of Worthington Steelpac Systems, LLC (“Steelpac”).
Automotive Body Panels: This operating segment provides services including stamping, blanking, assembly, painting, packaging, warehousing, distribution management and other services to customers, primarily in the automotive industry.
Construction Services:Construction Services includes businesses focusing on the construction and supply of metal framing for mid-rise light-gauge steel framed commercial structures, military housing, single and multi-family housing and international construction opportunities with a focus on China. Construction Services is made up of Dietrich Building Systems, Dietrich Residential Construction and a research and development project in China.
Steel Packaging: This operating segment designs and manufactures custom steel platforms and pallets for supporting, protecting and handling products through the entire shipping process, servicing the lawn and garden and recreational vehicle markets.
The accounting policies of the operating segments are described in “Note A – Summary of Significant Accounting Policies.” The Company evaluates segment performance based on operating income. Inter-segment sales are not material.
45
Summarized financial information for the Company’s reportable segments as of, and for, the years ended May 31 is shown in the following table. The “Other” category includes corporate related items, results of immaterial operations, and income and expense not allocable to the reportable segments.
| | | | | | | | | | | | | |
In thousands
| | 2004
| | 2003
| | 2002
|
Net sales | | | | | | | | | | | | |
| Processed Steel Products | | $ | 1,373,145 | | | $ | 1,343,397 | | | $ | 1,132,697 | |
| Metal Framing | | | 661,999 | | | | 539,358 | | | | 305,994 | |
| Pressure Cylinders | | | 328,692 | | | | 321,790 | | | | 292,829 | |
| Other | | | 15,268 | | | | 15,346 | | | | 13,441 | |
| | | |
| | | |
| | | |
| |
| Total | | $ | 2,379,104 | | | $ | 2,219,891 | | | $ | 1,744,961 | |
| | | |
| | | |
| | | |
| |
Operating income | | | | | | | | | | | | |
| Processed Steel Products | | $ | 18,036 | | | $ | 80,998 | | | $ | 13,610 | |
| Metal Framing | | | 63,778 | | | | 22,537 | | | | 19,139 | |
| Pressure Cylinders | | | 29,376 | | | | 32,273 | | | | 11,020 | |
| Other | | | (1,003 | ) | | | (9,977 | ) | | | (9,452 | ) |
| | | |
| | | |
| | | |
| |
| Total | | $ | 110,187 | | | $ | 125,831 | | | $ | 34,317 | |
| | | |
| | | |
| | | |
| |
Depreciation and amortization | | | | | | | | | | | | |
| Processed Steel Products | | $ | 39,097 | | | $ | 41,796 | | | $ | 45,278 | |
| Metal Framing | | | 14,706 | | | | 14,786 | | | | 9,956 | |
| Pressure Cylinders | | | 8,749 | | | | 8,835 | | | | 9,812 | |
| Other | | | 4,750 | | | | 4,002 | | | | 3,841 | |
| | | |
| | | |
| | | |
| |
| Total | | $ | 67,302 | | | $ | 69,419 | | | $ | 68,887 | |
| | | |
| | | |
| | | |
| |
Total assets | | | | | | | | | | | | |
| Processed Steel Products | | $ | 888,661 | | | $ | 806,859 | | | $ | 903,280 | |
| Metal Framing | | | 471,972 | | | | 392,010 | | | | 244,286 | |
| Pressure Cylinders | | | 168,496 | | | | 164,833 | | | | 153,977 | |
| Other | | | 114,010 | | | | 114,367 | | | | 155,771 | |
| | | |
| | | |
| | | |
| |
| Total | | $ | 1,643,139 | | | $ | 1,478,069 | | | $ | 1,457,314 | |
| | | |
| | | |
| | | |
| |
Capital expenditures | | | | | | | | | | | | |
| Processed Steel Products | | $ | 6,136 | | | $ | 8,382 | | | $ | 17,822 | |
| Metal Framing | | | 10,269 | | | | 10,398 | | | | 13,764 | |
| Pressure Cylinders | | | 3,182 | | | | 3,462 | | | | 4,770 | |
| Other | | | 10,012 | | | | 2,728 | | | | 2,744 | |
| | | |
| | | |
| | | |
| |
| Total | | $ | 29,599 | | | $ | 24,970 | | | $ | 39,100 | |
| | | |
| | | |
| | | |
| |
46
| | | | | | | | | | | | |
| In thousands | | 2006 | | | 2005 | | | 2004 | |
Net sales | | | | | | | | | | | | |
Steel Processing | | $ | 1,486,165 | | | $ | 1,719,312 | | | $ | 1,265,276 | |
Metal Framing | | | 796,272 | | | | 843,866 | | | | 651,601 | |
Pressure Cylinders | | | 461,875 | | | | 408,271 | | | | 328,692 | |
Other | | | 152,867 | | | | 107,435 | | | | 133,535 | |
| | | | | | | | | | | | |
Total | | $ | 2,897,179 | | | $ | 3,078,884 | | | $ | 2,379,104 | |
| | | | | | | | | | | | |
Operating income | | | | | | | | | | | | |
Steel Processing | | $ | 61,765 | | | $ | 127,090 | | | $ | 15,752 | |
Metal Framing | | | 46,735 | | | | 113,747 | | | | 68,763 | |
Pressure Cylinders | | | 49,275 | | | | 33,575 | | | | 29,376 | |
Other | | | (171 | ) | | | (7,062 | ) | | | (3,704 | ) |
| | | | | | | | | | | | |
Total | | $ | 157,604 | | | $ | 267,350 | | | $ | 110,187 | |
| | | | | | | | | | | | |
Depreciation and amortization | | | | | | | | | | | | |
Steel Processing | | $ | 22,898 | | | $ | 21,914 | | | $ | 33,761 | |
Metal Framing | | | 16,231 | | | | 14,113 | | | | 14,661 | |
Pressure Cylinders | | | 10,853 | | | | 10,929 | | | | 8,749 | |
Other | | | 9,134 | | | | 10,918 | | | | 10,131 | |
| | | | | | | | | | | | |
Total | | $ | 59,116 | | | $ | 57,874 | | | $ | 67,302 | |
| | | | | | | | | | | | |
Total assets | | | | | | | | | | | | |
Steel Processing | | $ | 812,024 | | | $ | 781,049 | | | $ | 790,214 | |
Metal Framing | | | 498,409 | | | | 496,155 | | | | 468,881 | |
Pressure Cylinders | | | 277,300 | | | | 268,862 | | | | 168,496 | |
Other | | | 312,664 | | | | 283,939 | | | | 215,548 | |
| | | | | | | | | | | | |
Total | | $ | 1,900,397 | | | $ | 1,830,005 | | | $ | 1,643,139 | |
| | | | | | | | | | | | |
Capital expenditures | | | | | | | | | | | | |
Steel Processing | | $ | 14,303 | | | $ | 5,887 | | | $ | 4,622 | |
Metal Framing | | | 19,700 | | | | 20,549 | | | | 9,962 | |
Pressure Cylinders | | | 7,916 | | | | 4,925 | | | | 3,182 | |
Other | | | 18,209 | | | | 14,957 | | | | 11,833 | |
| | | | | | | | | | | | |
Total | | $ | 60,128 | | | $ | 46,318 | | | $ | 29,599 | |
| | | | | | | | | | | | |
Net sales by geographic region for the Company’s reportable segments for the years ended May 31 are shown in the following table:
| | | | | | | | | | | | | |
In thousands
| | 2004
| | 2003
| | 2002
|
North America | | | | | | | | | | | | |
| Processed Steel Products | | $ | 1,373,145 | | | $ | 1,343,397 | | | $ | 1,132,697 | |
| Metal Framing | | | 661,999 | | | | 539,358 | | | | 305,994 | |
| Pressure Cylinders | | | 233,877 | | | | 230,030 | | | | 221,756 | |
| Other | | | 15,268 | | | | 15,346 | | | | 13,441 | |
| | | |
| | | |
| | | |
| |
| Subtotal | | | 2,284,289 | | | | 2,128,130 | | | | 1,673,888 | |
| | | |
| | | |
| | | |
| |
South America | | | | | | | | | | | | |
| Processed Steel Products | | | — | | | | — | | | | — | |
| Metal Framing | | | — | | | | — | | | | — | |
| Pressure Cylinders | | | — | | | | — | | | | 4,600 | |
| Other | | | — | | | | — | | | | — | |
| | | |
| | | |
| | | |
| |
| Subtotal | | | — | | | | — | | | | 4,600 | |
| | | |
| | | |
| | | |
| |
Europe | | | | | | | | | | | | |
| Processed Steel Products | | | — | | | | — | | | | — | |
| Metal Framing | | | — | | | | — | | | | — | |
| Pressure Cylinders | | | 94,815 | | | | 91,760 | | | | 66,473 | |
| Other | | | — | | | | — | | | | — | |
| | | |
| | | |
| | | |
| |
| Subtotal | | | 94,815 | | | | 91,760 | | | | 66,473 | |
| | | |
| | | |
| | | |
| |
Total | | $ | 2,379,104 | | | $ | 2,219,891 | | | $ | 1,744,961 | |
| | | |
| | | |
| | | |
| |
NOTE
| | | | | | | | | |
| In thousands | | 2006 | | 2005 | | 2004 |
United States | | $ | 2,734,341 | | $ | 2,935,879 | | $ | 2,259,609 |
Canada | | | 24,760 | | | 22,906 | | | 24,680 |
Europe | | | 138,078 | | | 120,099 | | | 94,815 |
| | | | | | | | | |
Total | | $ | 2,897,179 | | $ | 3,078,884 | | $ | 2,379,104 |
| | | | | | | | | |
Net fixed assets by geographic region for the years ended May 31 are shown in the following table:
| | | | | | | | | |
| In thousands | | 2006 | | 2005 | | 2004 |
United States | | $ | 520,410 | | $ | 526,756 | | $ | 528,596 |
Canada | | | 2,218 | | | 2,378 | | | 2,552 |
Europe | | | 24,276 | | | 23,822 | | | 24,246 |
| | | | | | | | | |
Total | | $ | 546,904 | | $ | 552,956 | | $ | 555,394 |
| | | | | | | | | |
Note I – Related Party Transactions
The Company purchases from and sells to affiliated companies certain raw materials and services at prevailing market prices. Net sales to affiliated companies for fiscal 2004,2006, fiscal 20032005 and fiscal 20022004 totaled $30,503,000, $27,674,000, and $18,960,000, $12,534,000respectively. Purchases from affiliated companies for fiscal 2006, fiscal 2005, and $25,321,000,fiscal 2004 totaled $9,063,000, $13,652,000, and $9,669,000, respectively. Accounts receivable related to these transactionsfrom affiliated companies were $2,901,000$1,922,000 and $1,697,000$3,178,000 at May 31, 20042006 and 2003,2005, respectively. Accounts payable to affiliated companies were $18,000$1,674,000 and $2,168,000$1,520,000 at May 31, 20042006 and 2003,2005, respectively.
NOTENote J – Investments in Unconsolidated Affiliates
The Company’s investments in affiliated companies, which are not majority-ownedcontrolled through majority ownership or not controlled,otherwise, are accounted for using the equity method. TheseAt May 31, 2006, these equity investments and the percentage interest owned consistconsisted of Worthington Armstrong Venture (50%), TWB Company, LLC (50%), Acerex, S.A. de C.V. (50%), Worthington Specialty Processing, Inc. (50%), Aegis Metal Framing, LLC (60%), and Viking & Worthington Steel Enterprise, LLC (“VWS”) (49%).
On April 25, 2006, the Worthington Steel sold its 50% equity interest in Acerex, S.A. de C.V., a joint venture operating a steel processing facility in Monterrey, Mexico, to its partner Ternium, S.A. for $44,604,000 cash, resulting in a gain of pre-tax $26,609,000. As a result of the sale, a foreign currency translation loss of $5,875,000 was reclassified from cumulative other comprehensive income.
On October 17, 2005, the Company acquired the remaining 50% interest of Dietrich Residential Construction, LLC (“DRC”) from Pacific Steel Construction Inc. (“Pacific”) for $3,773,000 cash and debt assumption of $4,153,000. The results of DRC, which were previously reported as equity in net income of an unconsolidated affiliate, have been included in the consolidated results since the date of acquisition.
On June 27, 2003, Worthington Steel joined with Bainbridge Steel, LLC (“Bainbridge”), an affiliate of Viking Industries, LLC, a qualified minority business enterprise (“MBE”), to form Viking & Worthington Steel Enterprise, LLC, an unconsolidatedVWS as a joint venture in which Worthington Steel has a 49% interest and Bainbridge has a 51% interest. VWS purchased substantially all of the assets of Valley City Steel, LLC in Valley City, Ohio, for approximately $5,700,000. Bainbridge manages the operations of the joint venture, and Worthington Steel provides assistance in operations, selling and marketing. The parties operate VWS as an MBE.
During fiscal 2003, TWB acquired the ownership interests of the minority partners, thereby increasing the Company’s ownership interest from 33% to 50% and resulting in an increase to shareholders’ equity of $2,450,000 (net of deferred taxes of $1,492,000).
The Company received distributions from unconsolidated affiliates totaling $12,152,000$57,040,000 and $41,107,000$28,520,000 in fiscal 20042006 and fiscal 2003,2005, respectively.
47
Financial information for affiliated companies accounted for using the equity method as of, and for, the years ended May 31 was as follows:
| | | | | | | | | | | | | |
In thousands
| | 2004
| | 2003
| | 2002
|
| Current assets | | $ | 246,844 | | | $ | 173,195 | | | $ | 151,655 | |
| Noncurrent assets | | | 141,450 | | | | 145,446 | | | | 156,730 | |
| Current liabilities | | | 143,750 | | | | 70,044 | | | | 66,160 | |
| Noncurrent liabilities | | | 35,727 | | | | 94,239 | | | | 54,672 | |
| Net sales | | | 604,243 | | | | 484,078 | | | | 420,222 | |
| Gross margin | | | 133,218 | | | | 96,880 | | | | 81,913 | |
| Net income | | | 79,625 | | | | 60,816 | | | | 47,457 | |
| | | | | | | | | |
| In thousands | | 2006 | | 2005 | | 2004 |
Cash | | $ | 93,877 | | $ | 111,070 | | $ | 76,613 |
Other current assets | | | 163,718 | | | 204,238 | | | 170,231 |
Noncurrent assets | | | 109,841 | | | 142,065 | | | 141,449 |
Current maturities of long-term debt | | | 3,158 | | | 56,000 | | | 55,500 |
Other current liabilities | | | 81,176 | | | 99,894 | | | 88,250 |
Long-term debt | | | 37,813 | | | 33,362 | | | 32,687 |
Other noncurrent liabilities | | | 6,049 | | | 3,061 | | | 3,040 |
Net sales | | | 810,271 | | | 767,041 | | | 604,243 |
Gross margin | | | 188,109 | | | 163,947 | | | 133,218 |
Depreciation and amortization | | | 18,479 | | | 20,234 | | | 19,369 |
Interest expense | | | 3,346 | | | 3,421 | | | 2,804 |
Income tax expense | | | 18,318 | | | 4,168 | | | 2,650 |
Net earnings | | | 108,672 | | | 100,307 | | | 79,625 |
The Company’s share of undistributed earnings of unconsolidated affiliates was $35,643,000$44,294,000 at May 31, 2004.2006.
NOTENote K – Earnings Per Share
The following table sets forth the computation of basic and diluted earnings per share for the years ended May 31:
| | | | | | | | | | | | | |
In thousands, except per share
| | 2004
| | 2003
| | 2002
|
| Numerator (basic & diluted): | | | | | | | | | | | | |
| Net earnings – income available to common shareholders | | $ | 86,752 | | | $ | 75,183 | | | $ | 6,502 | |
| Denominator: | | | | | | | | | | | | |
| Denominator for basic earnings per share – weighted average shares | | | 86,312 | | | | 85,785 | | | | 85,408 | |
| Effect of dilutive securities – stock options | | | 638 | | | | 752 | | | | 521 | |
| | | |
| | | |
| | | |
| |
| Denominator for diluted earnings per share – adjusted weighted average shares | | | 86,950 | | | | 86,537 | | | | 85,929 | |
| | | |
| | | |
| | | |
| |
| Earnings per share – basic | | $ | 1.01 | | | $ | 0.88 | | | $ | 0.08 | |
| Earnings per share – diluted | | | 1.00 | | | | 0.87 | | | | 0.08 | |
| | | | | | | | | |
| In thousands, except per share | | 2006 | | 2005 | | 2004 |
Numerator (basic & diluted): | | | | | | | | | |
Net earnings – income available to common shareholders | | $ | 145,990 | | $ | 179,412 | | $ | 86,752 |
| | | |
Denominator: | | | | | | | | | |
Denominator for basic earnings per share – weighted average shares | | | 88,288 | | | 87,646 | | | 86,312 |
Effect of dilutive securities – stock options | | | 688 | | | 857 | | | 638 |
| | | | | | | | | |
Denominator for diluted earnings per share – adjusted weighted average shares | | | 88,976 | | | 88,503 | | | 86,950 |
| | | | | | | | | |
| | | |
Earnings per share – basic | | $ | 1.65 | | $ | 2.05 | | $ | 1.01 |
Earnings per share – diluted | | | 1.64 | | | 2.03 | | | 1.00 |
Stock options covering 854,935, 2,211,6002,137,798, 2,319,218, and 1,298,094854,935 common shares for fiscal 2004,2006, fiscal 20032005 and fiscal 20022004 have been excluded from the computation of diluted earnings per share because the effect would have been antidilutiveanti-dilutive for those periods.
48
NOTENote L – Operating Leases
The Company leases certain property and equipment from third parties under non-cancelable operating lease agreements. Rent expense under operating leases was $12,637,000 in fiscal 2006, $10,328,000 in fiscal 2005,
and $6,221,000 in fiscal 2004, $9,377,000 in fiscal 2003 and $7,732,000 in fiscal 2002.2004. Future minimum lease payments for non-cancelable operating leases having an initial or remaining term in excess of one year at May 31, 2004,2006, are as follows (in thousands):
| | | | | |
| 2005 | | $ | 8,638 | |
| 2006 | | | 6,536 | |
| 2007 | | | 5,801 | |
| 2008 | | | 5,643 | |
| 2009 | | | 4,826 | |
| Thereafter | | | 18,061 | |
| | | |
| |
| Total | | $ | 49,506 | |
| | | |
| |
NOTE
| | | |
| In thousands | | |
2007 | | $ | 10,881 |
2008 | | | 10,960 |
2009 | | | 10,085 |
2010 | | | 9,069 |
2011 | | | 7,347 |
Thereafter | | | 19,985 |
| | | |
Total | | $ | 68,327 |
| | | |
The Company invested $16,400,000 in a new aircraft, which represented progress payments on an estimated purchase price of $19,300,000. This investment was recorded in assets held for sale as the aircraft will be sold and leased back during fiscal 2007.
Note M – Sale of Accounts Receivable
The Company and certain of its subsidiaries maintain a $190,000,000$100,000,000 revolving trade receivablesaccounts receivable securitization facility. Pursuant to the terms of the facility, these subsidiaries sell their accounts receivable, on a revolving basis, to Worthington Receivables Corporation (“WRC”), a wholly-owned, consolidated, bankruptcy-remote subsidiary. In turn, WRC sells,may sell, on a revolving basis, up to $190,000,000$100,000,000 of undivided ownership interests in this pool of accounts receivable to independent third parties. The Company retains an undivided interest in this pool and is subject to risk of loss based on the collectibility of the receivables from this retained interest. Because the amount eligible to be sold excludes receivables more than 90 days past due, balances withreceivables offset by an allowance for doubtful accounts because of bankruptcy or other cause, receivables from foreign customers, concentrations over limits with specific customers and certain reserve amounts, the Company believes additional risk of loss is minimal. Also because of these exclusions, no discount occurs on the sale, and no gain or loss is recorded. Facility fees of $1,641,000$103,000, $887,000, and $3,292,000$1,641,000 were incurred during fiscal 20042006, fiscal 2005 and fiscal 2003,2004, respectively, and were recorded as miscellaneous expense. The book value of the retained portion of the pool of accounts receivable approximates fair value. The Company continues to service the accounts receivable. No servicing asset or liability has been recognized, as the Company’s cost to service the accounts receivable is expected to approximate the servicing income.
As of May 31, 2004, a $60,000,0002006, and 2005, no undivided interest in this pool of accounts receivable had been sold. TheIf sold, the proceeds from the sale werewould be reflected as a reduction of accounts receivable on the consolidated balance sheets and as operating cash flows in the consolidated statements of cash flows. The sale proceeds were used to pay down short-term debt.
NOTENote N – Impairment Charges and Restructuring Expense
On May 27,Effective August 1, 2004, the Company signed an agreement to sellclosed the sale of its Decatur, Alabama, steel-processing facility and its cold rollingcold-rolling assets to Nucor Corporation (“Nucor”) for $82,000,000$80,392,000 cash. The sale excludesexcluded the slitting and cut-to-length assets and net working capital. After the sale, thecapital associated with this facility. The Company will remainremains in a portion of the currentDecatur facility under a long-term lease fromwith Nucor and will continuecontinues to serve customers requiring steel processing services in itsthe Company’s core business of slitting and cutting-to-length. The transaction closed as of August 1, 2004. As a result of thea sale agreement entered into on May 26, 2004, the Company recorded a $67,400,000 pre-tax charge during its fourth quarter ended May 31, 2004. The charge included $66,642,000 for the impairment of assets at the Decatur facility and $758,000 for severance and employee related costs. The severance and employee related costs were due to the elimination of 40 administrative, production and other employee positions. The assets to be sold were classified as assets held for sale at May 31, 2004, at their selling price. The after-tax impact of this charge was $41,788,000 or $0.48 per diluted share. An additional pre-tax charge estimated at $5,749,000,of $5,608,000, mainly relating to contract termination costs, will bewas recognized during the first quarter of fiscal 2005. As of May 31, 2005, ending August 31, 2004.35 employees were terminated, and the Company paid severance and other employee related costs of $471,000.
Also during the fourth quarter ended May 31, 2004, the Company took an impairment charge of $1,998,000 on certain of its European LPG assets. The after-tax impact of this charge was $1,239,000 or $0.01 per diluted share. The European market has been difficult for more than just currency reasons. The Company has had success in high-
49
pressurethe European high-pressure and refrigerant cylinders,cylinder product lines, but the
LPG market iswas challenged by overcapacity and declining demand. The impairment was recorded as a write-down of original cost to fair market value with future depreciation expense to be based on this value.
During the quarter ended February 28, 2002, the Company announced a consolidation plan that affected each of the Company’s business segments and resulted in the closure of six facilities and the restructuring of two others. As a result, the Company recorded a $64,575,000 pre-tax restructuring expense, which included a write-down to estimated fair value of certain property and equipment, severance and employee related costs, and other items. The severance and employee related costs were due to the elimination of approximately 542 administrative, production and other employee positions. As of May 31, 2004, 499 employees had been terminated, 43 others had either retired or left through normal attrition, and the Company had paid severance of $7,047,000. All six of the facilities to be closed have been closed, and their related assets have been transferred, sold or are being marketed. The restructuring of the other two facilities is complete.
During the quarter ended November 30, 2002, the Company recorded a favorable pre-tax adjustment of $5,622,000 to the restructuring charge mentioned above. This credit was the result of higher-than-estimated proceeds from the sale of real estate at the Company’s former facility in Malvern, Pennsylvania, and the net reduction of previously established reserves, partially offset by estimated charges for the announced closure of three additional facilities discussed below.
The components of this adjustment are as follows:
| | | | | |
| In thousands | | | | |
| Gain on sale of Malvern assets | | $ | (4,965 | ) |
| Reductions to other reserves | | | (3,637 | ) |
| Charge for three additional facilities | | | 2,980 | |
| | | |
| |
| Total | | $ | (5,622 | ) |
| | | |
| |
The closure of three additional facilities was announced during the quarter ended November 30, 2002. Two facilities from the Metal Framing segment and one from the Pressure Cylinders segment were affected. The Metal Framing facilities in East Brunswick, New Jersey, and Atlanta, Georgia, were considered redundant following the July 31, 2002, acquisition of Unimast. The Pressure Cylinders facility, located in Citronelle, Alabama, produced acetylene cylinders. The production of these cylinders has been partially transferred to another plant and partially outsourced. The closure of these three facilities resulted in an additional $2,980,000 pre-tax restructuring charge. The restructuring charge included a write-down to estimated fair value of certain equipment, property related costs, severance and employee related costs and other items. The severance and employee related costs are due to the estimated elimination of 69 administrative, production and other employee positions. As of May 31, 2004, 69 employees had been terminated and severance of $604,000 had been paid.
The progression of the restructuring charge is summarized as follows:
| | | | | | | | | | | | | | | | | | | | | | | | | |
| | | Balance | | | | | | Charges to Net Earnings
| | Charges | | Balance |
| | | May 31, | | | | | | Adjust- | | | | | | Against | | May 31, |
In thousands
| | 2003
| | Payments
| | ments
| | Additions
| | Assets
| | 2004
|
| Property and equipment | | $ | 4,587 | | | $ | (4,232 | ) | | $ | (355 | ) | | $ | — | | | $ | — | | | $ | — | |
| Severance and employee related | | | 6,670 | | | | (6,485 | ) | | | (185 | ) | | | — | | | | — | | | | — | |
| Other | | | — | | | | — | | | | — | | | | — | | | | — | | | | — | |
| | | |
| | | |
| | | |
| | | |
| | | |
| | | |
| |
| Total | | $ | 11,257 | | | $ | (10,717 | ) | | $ | (540 | ) | | $ | — | | | $ | — | | | $ | — | |
| | | |
| | | |
| | | |
| | | |
| | | |
| | | |
| |
Sales that were historically generated by the closed plants were transferred to other Company facilities except for the sales from the Itu, Brazil, facility and sales related to the painted and coated products at the Malvern,
50
Pennsylvania, facility. Net sales not transferred were $0, $9,090,000 and $42,363,000 for fiscal 2004, fiscal 2003 and fiscal 2002, respectively. The related operating loss for these products was $105,000, $659,000 and $5,314,000 for fiscal 2004, fiscal 2003 and fiscal 2002, respectively.
NOTENote O – Goodwill and Other Intangibles
The Company adopted SFAS No. 141,Business Combinations, and SFAS No. 142,Goodwill and Other Intangible Assets, effective June 2001. SFAS No. 141 requires the use of the purchase method of accounting for any business combinations initiated after June 30, 2002, and further clarifies the criteria to recognize intangible assets separately from goodwill. Under SFAS No. 142,Goodwill and Other Intangible Assets, goodwill and indefinite-lived intangible assets are no longer amortized but are reviewed for impairment. The annual impairment test was performed during the fourth quarters of fiscal 20042006 and fiscal 2003,2005, and no goodwill was written off as a result. The Company has no intangibles with indefinite lives other than goodwill.
Goodwill by segment is summarized as follows at May 31:
| | | | | | | | | |
In thousands
| | 2004
| | 2003
|
| Metal Framing | | $ | 95,361 | | | $ | 95,001 | |
| Pressure Cylinders | | | 22,408 | | | | 21,780 | |
| | | |
| | | |
| |
| | | $ | 117,769 | | | $ | 116,781 | |
| | | |
| | | |
| |
| | | | | | |
| In thousands | | 2006 | | 2005 |
Metal Framing | | $ | 97,010 | | $ | 95,361 |
Pressure Cylinders | | | 74,357 | | | 72,906 |
Other | | | 6,404 | | | - |
| | | | | | |
Total | | $ | 177,771 | | $ | 168,267 |
| | | | | | |
The change in Metal Framing goodwill relatesis due to the Unimast acquisition.acquisition of the minority interest in Dietrich Metal Framing Canada, Inc. (“DMFC”). The change in Pressure Cylinders goodwill is due to foreign currency translation adjustments. The change in Other goodwill is due to the acquisition of the minority interest in DRC.
Other amortizable intangible assets are summarized as follows at May 31:
| | | | | | | | | | | | |
| | | 2006 | | 2005 |
| In thousands | | Cost | | Accumulated Amortization | | Cost | | Accumulated Amortization |
Patents and trademarks | | $ | 10,618 | | $ | 4,126 | | $ | 10,191 | | $ | 3,296 |
Customer relationships | | | 7,238 | | | 3,211 | | | 7,200 | | | 1,693 |
| | | | | | | | | | | | |
Total | | $ | 17,856 | | $ | 7,337 | | $ | 17,391 | | $ | 4,989 |
| | | | | | | | | | | | |
Amortization expense was $2,348,000, $2,465,000, and $757,000 for fiscal 2006, fiscal 2005 and fiscal 2004. These intangible assets are amortized on the straight-line method over their estimated useful lifes which range from 2 to 15 years.
Estimated amortization expense for these intangibles for the next five fiscal years is as follows:
| | | |
| In thousands | | |
2007 | | $ | 1,154 |
2008 | | | 1,154 |
2009 | | | 1,154 |
2010 | | | 1,154 |
2011 | | | 1,136 |
Note P – Guarantees and Warranties
During the quarter ended February 28, 2003, the Company adopted the provisions of FASB Interpretation No. 45,Guarantor’s Accounting and Disclosure Requirements for Guarantees, Including Indirect Guarantees of Indebtedness of Others(“FIN 45”). FIN 45 requires the Company to recognize the fair value of guarantee and indemnification arrangements issued or modified by the Company after December 31, 2002, if these arrangements are within the scope of the Interpretation. As of May 31, 2004, the Company had not issued or modified any of its guarantee or indemnification arrangements since December 31, 2002. In addition, consistent with previously existing generally accepted accounting principles, the Company continues to monitor its guarantees and indemnifications to identify whether it is probable that a loss has occurred and would recognize any such loss when estimable.
The Company has established reserves for anticipated sales returns and allowances including limited warranties on certain products. The liability for sales returns and allowances is primarily based on historical experience and current information. The liability amounts related to warranties were immaterial at May 31, 20042006 and 2003.2005.
See “Note A – Summary of Significant Accounting Policies – Nonrecurring Losses” for additional information on the Company’s nonrecurring loss related to guarantees.
Note Q – AcquisitionAcquisitions
On July 31, 2002,November 30, 2005, the Company acquired allthe remaining 40% interest in DMF Canada from the minority shareholder, Encore Coils Holdings Ltd., for $3,003,000 cash. The acquisition was recorded using the purchase accounting method, and 100% of the outstanding stockresults of Unimast Incorporated (together with its subsidiaries, “Unimast”) for $114,703,000DMF Canada, which were previously reduced by the minority interest, have been included in cash (netthe consolidated results of cash acquired) plus the assumption of $9,254,000 of debt. Unimast manufactures construction steel products, including light gauge steel framing, plastering steel and trim accessories, and serves the construction industry. The acquisition increased capacity for the Company’s existing products, expanded the Company’s product line to include Unimast’s complementary products and introduced new products to the Metal Framing segment includingsince the date of acquisition. The excess of the purchase price over the historical book value of $1,649,000 was allocated to goodwill. On November 5, 2004, the Company had formed a 60%-owned consolidated Canadian metal corner beadframing joint venture with Encore, operating under the name Dietrich Metal Framing Canada, Inc. At the time the Company contributed an aggregate of $1,700,000 to the joint venture.
On October 17, 2005, the Company acquired the remaining 50% interest in DRC from its partner, Pacific, for $3,773,000 cash and trim and vinyl construction accessories.debt assumption of $4,153,000. The acquisition was accounted forrecorded using the purchase accounting method, withand the results for Unimastof DRC, which were previously reported as equity in net income of an unconsolidated affiliate, have been included in the consolidated results of the “Other” category since the date of acquisition. The excess of the purchase date.price over the historical book value of $6,404,000 was allocated to goodwill.
51
On October 13, 2004, the Company purchased for $1,125,000 the 49% interest of the minority partner in the joint venture that operates a pressure cylinder manufacturing facility in Hustopece, Czech Republic. The purchase price was allocated to goodwill.On September 17, 2004, the Company purchased substantially all of the net assets of the propane and specialty gas cylinder business of Western Industries, Inc. (“Western Cylinder Assets”). This business operates in Wisconsin and manufactures 14.1 oz. and 16.4 oz. disposable cylinders for products such as hand torches, propane-fueled camping equipment, portable heaters and tabletop grills. The Western Cylinder Assets were purchased for $65,119,000 in cash and were included in the Company’s Pressure Cylinders segment as of September 17, 2004. Pro forma results, including the acquired business since the beginning of the earliest period presented, would not be materially different than actual results.
The purchase price was allocated to the acquired assets and assumed liabilities based on their estimated fair values at the date of acquisition. Goodwill is defined as the excess of the purchase price over the fair value allocated to the net assets.
The purchase price was allocated as follows:
| | | | | |
| In thousands | | | | |
| Current assets | | $ | 69,612 | |
| Goodwill | | | 37,248 | |
| Intangibles | | | 6,630 | |
| Other assets | | | 299 | |
| Property, plant and equipment | | | 36,815 | |
| | | |
| |
| Total assets | | | 150,604 | |
| | | |
| |
| Notes payable | | | 3,204 | |
| Other current liabilities | | | 26,647 | |
| | | |
| |
| Total current liabilities | | | 29,851 | |
| Long-term debt | | | 6,050 | |
| | | |
| |
| Total liabilities | | | 35,901 | |
| | | |
| |
| Net cash paid | | $ | 114,703 | |
| | | |
| |
| | | |
| In thousands | | |
Current assets | | $ | 8,376 |
Goodwill | | | 48,789 |
Intangibles | | | 7,200 |
Property, plant and equipment | | | 5,866 |
| | | |
Total assets | | | 70,231 |
| | | |
| |
Other current liabilities | | | 5,112 |
| | | |
Total liabilities | | | 5,112 |
| | | |
Net cash paid | | $ | 65,119 |
| | | |
All of the goodwill amount will be deductible for tax purposes. Intangibles include patentsrelationships, contracts, and trademarkscustomer lists that are being amortized generally over 102 -15 years.
The following pro forma data summarizes the results of operations of the Company for fiscal 2003 and fiscal 2002 assuming Unimast had been acquired at the beginning of each period presented. In preparing the pro forma data, adjustments have been made to conform Unimast’s accounting policies to those of the Company and to reflect purchase accounting adjustments and interest expense:
| | | | | | | | | |
In thousands, except per share
| | 2003
| | 2002
|
| Net sales | | $ | 2,267,510 | | | $ | 1,983,243 | |
| Net earnings | | | 80,203 | | | | 15,470 | |
| Earnings per share - basic | | $ | 0.93 | | | $ | 0.18 | |
| Earnings per share - diluted | | | 0.93 | | | | 0.18 | |
The pro forma information does not purport to be indicative of the results of operations that actually would have been obtained if the acquisition had occurred on the dates indicated or the results of operations that will be reported in the future.
52
NOTENote R – Quarterly Results of Operations (Unaudited)
The following is a summary of the unaudited quarterly results of operations for the years ended May 31:
| | | | | | | | | | | | | | | | | |
| | | Three Months Ended
|
In thousands, except per share
| | August 31
| | November 30
| | February 29
| | May 31
|
Fiscal 2004 | | | | | | | | | | | | | | | | |
| Net sales | | $ | 498,035 | | | $ | 540,078 | | | $ | 558,067 | | | $ | 782,924 | |
| Gross margin | | | 48,983 | | | | 67,242 | | | | 86,533 | | | | 172,612 | |
| Net earnings | | | 5,917 | | | | 16,883 | | | | 24,529 | | | | 39,423 | |
| Earnings per share - basic | | $ | 0.07 | | | $ | 0.20 | | | $ | 0.28 | | | $ | 0.45 | |
| Earnings per share - diluted | | | 0.07 | | | | 0.20 | | | | 0.28 | | | | 0.45 | |
| | | | | | | | | | | | | | | | | |
| | | August 31
| | November 30
| | February 28
| | May 31
|
Fiscal 2003 | | | | | | | | | | | | | | | | |
| Net sales | | $ | 525,464 | | | $ | 567,897 | | | $ | 536,584 | | | $ | 589,946 | |
| Gross margin | | | 89,424 | | | | 80,370 | | | | 65,483 | | | | 67,624 | |
| Net earnings | | | 27,490 | | | | 20,747 | | | | 11,331 | | | | 15,615 | |
| Earnings per share - basic | | $ | 0.32 | | | $ | 0.24 | | | $ | 0.13 | | | $ | 0.19 | |
| Earnings per share - diluted | | | 0.32 | | | | 0.24 | | | | 0.13 | | | | 0.18 | |
| | | | | | | | | | | | |
| In thousands, except per share | | Three Months Ended |
Fiscal 2006 | | August 31 | | November 30 | | February 28 | | May 31 |
Net sales | | $ | 694,147 | | $ | 699,516 | | $ | 681,548 | | $ | 821,968 |
Gross margin | | | 75,352 | | | 103,408 | | | 78,902 | | | 113,972 |
Net earnings | | | 28,407 | | | 39,028 | | | 19,157 | | | 59,398 |
| | | | |
Earnings per share - basic | | $ | 0.32 | | $ | 0.44 | | $ | 0.22 | | $ | 0.67 |
Earnings per share - diluted | | | 0.32 | | | 0.44 | | | 0.21 | | | 0.67 |
| | | | |
Fiscal 2005 | | August 31 | | November 30 | | February 28 | | May 31 |
Net sales | | $ | 769,340 | | $ | 745,168 | | $ | 747,414 | | $ | 816,962 |
Gross margin | | | 159,644 | | | 124,518 | | | 109,152 | | | 105,559 |
Net earnings | | | 57,859 | | | 47,623 | | | 33,122 | | | 40,808 |
| | | | |
Earnings per share - basic | | $ | 0.66 | | $ | 0.54 | | $ | 0.38 | | $ | 0.46 |
Earnings per share - diluted | | | 0.66 | | | 0.54 | | | 0.37 | | | 0.46 |
The sum of the quarterly earnings per share data presented in the table may not equal the annual results due to rounding and the impact of dilutive securities on the annual versus the quarterly earnings per share calculations.
Results for the first quarter of fiscal 2006 ended August 31, 2005, were positively impacted by a $5,251,000 reduction in taxes, or $0.06 per diluted share, related to the modification of corporate tax laws in the state of Ohio enacted June 30, 2005.
Results for the second quarter of fiscal 20042006 ended November 30, 2003, include2005, were positively impacted by a credit$5,300,000 reduction in insurance reserves, or $0.04 per diluted share. These reserves are supported by a third party actuarial analysis of loss history. Due to facility consolidations, focus on and investment in safety initiatives, and an emphasis on property loss prevention and product quality, loss history had improved significantly. This improvement was reflected in the actuarial analysis of loss history and resulted in this favorable reduction to reserves.
Results for the third quarter of fiscal 2006 ended February 28, 2006, included three corrections related to prior periods, which negatively impacted net earnings and diluted earnings per share by $3,200,000, and $0.04, respectively. A description of the issues and the impact of the corrections are as follows:
Under-accrual of income taxes over the last five years at the Acerex, S.A. de C.V. (“Acerex”) joint venture in Mexico resulted in a $6,062,000 decrease in equity in net income of unconsolidated affiliates.
Under-accrual of consulting expenses during the previous five quarters resulted in a $3,985,000 increase to selling, general and administrative (“SG&A”) expense.
Over-accrual in the consolidated income tax provision over the last nine years relating to the foreign earnings of our Worthington Armstrong Venture (“WAVE”) joint venture resulted in a $3,200,000 reduction to income tax expenseexpense.
The net impact of $1,361,000 ($0.01 per diluted share) from an adjustmentthese corrections was not material to deferred taxes.earnings for any previously reported fiscal year or to the trend of earnings.
Results for the fourth quarter of fiscal 20042006 ended May 31, 2004, include2006, were positively impacted by a $26,604,000 pre-tax restructuring charge in the aggregate amount of $69,398,000 ($0.49gain, or $0.14 per diluted share, netfrom the sale of tax)a 50% interest in a Mexican steel processing joint venture.
Results for the first quarter of fiscal 2005 ended August 31, 2004, were reduced by a $5,608,000 pre-tax charge related to impairmentthe sale of certain assets and other related costs at the Decatur, Alabama, steel-processing facilitycold mill and certain assets related assets. This charge was mainly due to contract termination costs that could not be accrued until the sale closed, which occurred on August 1, 2004, and other adjustments to the European operationscharge recorded at May 31, 2004. The impact of the Pressure Cylinders segment. This quarter also includedthis charge was a creditreduction in net earnings of $6,364,000$3,538,000 ($0.070.04 per diluted share) to income tax expense for the favorable resolution of certain tax audits..
Results for the second quarter of fiscal 20032005 ended November 30, 2002, include a pre-tax restructuring credit of $5,622,0002004, were increased by $1,735,000 ($0.040.01 per diluted share, netshare) due to a reduction in estimated tax liabilities from favorable tax audit settlements and related developments.
Results for the third quarter of tax) and a pre-tax charge related to the estimated potential liability relating to certain workers’ compensation claims of $5,400,000fiscal 2005 ended February 28, 2005, were reduced by $4,290,000 ($0.040.05 per diluted share, netshare) due to a one-time state tax adjustment recorded in that quarter. In January 2005, the Sixth Circuit Court of tax).Appeals held the state of Ohio’s investment tax credit program unconstitutional.
53
On July 20, 2006, the Company announced that it had formed a 50:50 joint venture with NOVA Chemicals Corporation that is intended to develop and manufacture durable, energy-saving composite construction products and systems.SCHEDULE II – VALUATION AND QUALIFYING ACCOUNTS
WORTHINGTON INDUSTRIES, INC. AND SUBSIDIARIES| | | | | | | | | | | | | | | | | | | | | |
COL. A.
| | COL. B.
| | COL. C.
| | COL. D.
| | COL. E.
|
| | | | | | | Additions
| | | | |
| | | Balance at | | | | | | Charged to Other | | | | |
| | | Beginning of | | Charged to Costs | | Accounts – | | Deductions - | | Balance at End of |
Description
| | Period
| | and Expenses
| | Describe
| | Describe
| | Period
|
| Year Ended May 31, 2004: | | | | | | | | | | | | | | | | | | | | |
| Deducted from asset accounts: | | | | | | | | | | | | | | | | | | | | |
| Allowance for possible losses on trade accounts receivable | | $ | 5,267,000 | | | $ | 2,491,000 | | | $ | 108,000 | (A) | | $ | 997,000 | (B) | | $ | 6,870,000 | |
| | | |
| | | |
| | | |
| | | |
| | | |
| |
| Year Ended May 31, 2003: | | | | | | | | | | | | | | | | | | | | |
| Deducted from asset accounts: | | | | | | | | | | | | | | | | | | | | |
| Allowance for possible losses on trade accounts receivable | | $ | 8,215,000 | | | $ | 178,000 | | | $ | 627,000 | (A) | | $ | 3,753,000 | (B) | | $ | 5,267,000 | |
| | | |
| | | |
| | | |
| | | |
| | | |
| |
| Year Ended May 31, 2002: | | | | | | | | | | | | | | | | | | | | |
| Deducted from asset accounts: | | | | | | | | | | | | | | | | | | | | |
| Allowance for possible losses on trade accounts receivable | | $ | 9,166,000 | | | $ | 10,287,000 | | | $ | 215,000 | (A) | | $ | 11,453,000 | (B) | | $ | 8,215,000 | |
| | | |
| | | |
| | | |
| | | |
| | | |
| |
| | | | | | | | | | |
| COL. A. | | COL. B. | | COL. C. | | COL. D. | | COL. E. |
| Description | | Balance at Beginning of Period | | Additions | | Deductions – Describe | | Balance at End of Period |
| | Charged to Costs and Expenses | | Charged to Other Accounts – Describe | | |
| | | | | | | | | | |
Year Ended May 31, 2006: | | | | | | | | | | |
Deducted from asset accounts: Allowance for possible losses on trade accounts receivable | | $11,225,000 | | $(4,685,000) | | $193,000(A) | | $1,769,000(B) | | $4,964,000 |
| | | | | | | | | | |
Year Ended May 31, 2005: | | | | | | | | | | |
Deducted from asset accounts: Allowance for possible losses on trade accounts receivable | | $6,870,000 | | $5,583,000 | | $104,000(A) | | $1,332,000(B) | | $11,225,000 |
| | | | | | | | | | |
Year Ended May 31, 2004: | | | | | | | | | | |
Deducted from asset accounts: Allowance for possible losses on trade accounts receivable | | $5,267,000 | | $2,491,000 | | $108,000(A) | | $997,000(B) | | $6,870,000 |
| | | | | | | | | | |
Note A – Miscellaneous amounts.
Note B – Uncollectible accounts charged to the allowance.
54
Item 9. —– Changes in and Disagreements Withwith Accountants on Accounting and Financial Disclosure
In “Item 4. – Changes in Registrant’s Certifying Accountant” of the Current Report on Form 8-K filed by the Worthington Industries, Inc. Deferred Profit Sharing Plan on June 9, 2004, as amended by a Current Report on Form 8-K/A filed on June 22, 2004, the change in the independent auditors of the Worthington Industries, Inc. Deferred Profit Sharing Plan was reported.
Item 9A. – Controls and Procedures
Evaluation of Disclosure Controls and Procedures
TheWe maintain disclosure controls and procedures (as defined in Rules 13a-15(e) and 15d-15(e) under the Securities Exchange Act of 1934, as amended (the “Exchange Act”)) that are designed to provide reasonable assurance that information required to be disclosed in the reports that we file or submit under the Exchange Act is recorded, processed, summarized and reported within the time periods specified in the Securities and Exchange Commission’s rules and forms, and that such information is accumulated and communicated to our management, including our principal executive officer and our principal financial officer, as appropriate, to allow timely decisions regarding required disclosure.
Because of inherent limitations, disclosure controls and procedures, no matter how well designed and operated, can only provide reasonable, and not absolute, assurance that the Registrant,objectives of disclosure controls and procedures are met.
Management, with the participation of the Registrant’sour principal executive officer and principal financial officer, performed an evaluation of the effectiveness of the Registrant’sour disclosure controls and procedures (as defined in Rule 13a-15(e) under the Securities Exchange Act of 1934) as of the end of the periodfiscal year covered by this Annual Report on Form 10-K. Based on that evaluation, the Registrant’sour principal executive officer and principal financial officer have concluded that such disclosure controls and procedures were effective as of the end of the periodfiscal year covered by this Annual Report on Form 10-K to ensure that material information relating to the RegistrantWorthington Industries, Inc. and itsour consolidated subsidiaries is made known to them, particularly during the period for which periodic reports of the Registrant,Worthington Industries, Inc., including this Annual Report on Form 10-K, are being prepared.
Annual Report of Management on Internal Control Over Financial Reporting
Management is responsible for establishing and maintaining adequate internal control over financial reporting to provide reasonable assurance regarding the reliability of our financial reporting and the preparation of financial statements for external purposes in accordance with accounting principles generally accepted in the United States. Internal control over financial reporting includes those policies and procedures that (i) pertain to the maintenance of records that, in reasonable detail, accurately and fairly reflect the transactions and dispositions of the assets of Worthington Industries, Inc. and our consolidated subsidiaries; (ii) provide reasonable assurance that transactions are recorded as necessary to permit preparation of financial statements in accordance with accounting principles generally accepted in the United States, and that receipts and expenditures of Worthington Industries, Inc. and our consolidated subsidiaries are being made only in accordance with authorizations of management and directors of Worthington Industries, Inc. and our consolidated subsidiaries, as appropriate; and (iii) provide reasonable assurance regarding prevention or timely detection of unauthorized acquisition, use or disposition of the assets of Worthington Industries, Inc. and our consolidated subsidiaries that could have a material effect on the financial statements.
Management, with the participation of our principal executive officer and principal financial officer, assessed the effectiveness of our internal control over financial reporting as of May 31, 2006, the end of our fiscal year. Management based its assessment on criteria established inInternal Control-Integrated Framework issued by the Committee of Sponsoring Organizations of the Treadway Commission. Management’s assessment included evaluation of such elements as the design and operating effectiveness of key financial reporting controls, process documentation, accounting policies and our overall control environment. This assessment is supported by testing and monitoring performed under the direction of management.
Because of inherent limitations, internal control over financial reporting may not prevent or detect misstatements. Also, projections of any evaluations of effectiveness to future periods are subject to the risk that controls may become inadequate because of changes in conditions, or that the degree of compliance with the
policies or procedures may deteriorate. Accordingly, even an effective system of internal control over financial reporting will provide only reasonable assurance with respect to financial statement preparation.
During fiscal 2006, we acquired the remaining 50% interest in Dietrich Residential Construction, LLC (“DRC”) and the remaining 40% interest in Dietrich Metal Framing Canada, Inc. (“DMFC”), from the minority shareholders. As permitted by the Securities and Exchange Commission, management excluded DRC and DMFC from management’s assessment of internal control over financial reporting as of May 31, 2006. Combined, these businesses constituted approximately 0.6% of consolidated net assets as of May 31, 2006, and 1.5% of consolidated net sales for the fiscal year ended May 31, 2006. DRC and DMFC will be included in management’s assessment of internal control over financial reporting for Worthington Industries, Inc. and its consolidated subsidiaries as of May 31, 2007.
Based on the assessment of our internal control over financial reporting, management has concluded that our internal control over financial reporting was effective as of May 31, 2006, to provide reasonable assurance regarding the reliability of financial reporting and the preparation of financial statements for external reporting purposes in accordance with accounting principles generally accepted in the United States. We reviewed the results of management’s assessment with the Audit Committee of Worthington Industries, Inc.
Report of Independent Registered Public Accounting Firm
The Board of Directors and Shareholders
Worthington Industries, Inc.:
We have audited management’s assessment, included in the accompanying Annual Report of Management on Internal Control over Financial Reporting, that Worthington Industries, Inc. and subsidiaries maintained effective internal control over financial reporting as of May 31, 2006, based on criteria established in Internal Control—Integrated Framework issued by the Committee of Sponsoring Organizations of the Treadway Commission (COSO). Worthington Industries, Inc. and subsidiaries’ management is responsible for maintaining effective internal control over financial reporting and for its assessment of the effectiveness of internal control over financial reporting. Our responsibility is to express an opinion on management’s assessment and an opinion on the effectiveness of the Company’s internal control over financial reporting based on our audit.
We conducted our audit in accordance with the standards of the Public Company Accounting Oversight Board (United States). Those standards require that we plan and perform the audit to obtain reasonable assurance about whether effective internal control over financial reporting was maintained in all material respects. Our audit included obtaining an understanding of internal control over financial reporting, evaluating management’s assessment, testing and evaluating the design and operating effectiveness of internal control, and performing such other procedures as we considered necessary in the circumstances. We believe that our audit provides a reasonable basis for our opinion.
A company’s internal control over financial reporting is a process designed to provide reasonable assurance regarding the reliability of financial reporting and the preparation of financial statements for external purposes in accordance with generally accepted accounting principles. A company’s internal control over financial reporting includes those policies and procedures that (1) pertain to the maintenance of records that, in reasonable detail, accurately and fairly reflect the transactions and dispositions of the assets of the company; (2) provide reasonable assurance that transactions are recorded as necessary to permit preparation of financial statements in accordance with generally accepted accounting principles, and that receipts and expenditures of the company are being made only in accordance with authorizations of management and directors of the company; and (3) provide reasonable assurance regarding prevention or timely detection of unauthorized acquisition, use, or disposition of the company’s assets that could have a material effect on the financial statements.
Because of its inherent limitations, internal control over financial reporting may not prevent or detect misstatements. Also, projections of any evaluation of effectiveness to future periods are subject to the risk that controls may become inadequate because of changes in conditions, or that the degree of compliance with the policies or procedures may deteriorate.
In our opinion, management’s assessment that Worthington Industries, Inc. and subsidiaries maintained effective internal control over financial reporting as of May 31, 2006, is fairly stated, in all material respects, based on criteria established in Internal Control—Integrated Framework issued by the Committee of Sponsoring Organizations of the Treadway Commission (COSO). Also, in our opinion, Worthington Industries, Inc. and subsidiaries maintained, in all material respects, effective internal control over financial reporting as of May 31, 2006, based on criteria established in Internal Control—Integrated Framework issued by the Committee of Sponsoring Organizations of the Treadway Commission (COSO).
Worthington Industries, Inc. and subsidiaries acquired the remaining 50% interest in Dietrich Residential Construction, LLC (“DRC”) and the remaining 40% interest in Dietrich Metal Framing Canada, Inc. (“DMFC”) during fiscal 2006. Management excluded from its assessment of the effectiveness of Worthington Industries, Inc. and subsidiaries’ internal control over financial reporting as of May 31, 2006, DRC’s and DMFC’s internal control over financial reporting. Combined, these businesses constituted approximately 0.6% of consolidated net assets as of May 31, 2006, and 1.5% of consolidated net sales for the year then ended. Our audit of internal control over financial reporting of Worthington Industries, Inc. and subsidiaries also excluded an evaluation of the internal control over financial reporting of DRC and DMFC.
We also have audited, in accordance with the standards of the Public Company Accounting Oversight Board (United States), the consolidated balance sheets of Worthington Industries, Inc. and subsidiaries as of May 31, 2006 and 2005, and the related consolidated statements of earnings, shareholders’ equity, and cash flows for each of the years in the three-year period ended May 31, 2006, and our report dated August 11, 2006 expressed an unqualified opinion on those consolidated financial statements.
Columbus, Ohio
August 11, 2006
Changes in Internal Control Over Financial Reporting
There were no changes, except for the continued implementation of the new enterprise resource planning (“ERP”) system mentioned below, which occurred during the Registrant’sour fourth fiscal quarter of the period covered by this Annual Report onof Form 10-K (the fiscal quarter ended May 31, 2006), in the Registrant’sour internal control over financial reporting (as defined in Rule 13a-15 (f)13a-15(f) under the Securities Exchange Act of 1934) that have materially affected, or are reasonably likely to materially affect, the Registrant’sour internal control over financial reporting.
We are in the process of implementing a new software-based ERP system throughout much of Worthington Industries, Inc. and our consolidated subsidiaries. Implementing a new system results in changes to business processes and related controls. We believe that we are adequately controlling the transition to the new processes and controls and that there will be no negative impact to our internal control environment. In fact, one of the expected benefits of the fully implemented ERP system is an enhancement of our internal control over financial reporting.
The Compensation and Stock Option Committee of the Board of Directors of Worthington Industries, Inc. (the “Compensation Committee”) has implemented a long-term incentive program in which executive officers and other key employees of Worthington Industries, Inc. and its subsidiaries (collectively, the “Company”) participate, which anticipates consideration of long-term performance awards based upon achieving measurable financial criteria over a multiple-year period. Under this program, performance awards have been granted under the Worthington Industries, Inc. 1997 Long-Term Incentive Plan (the “1997 LTIP”) with payouts based upon achieving performance levels over a three-year period. For corporate executives and employees, payouts of performance awards are generally tied to achieving specific levels (threshold, target and maximum) of corporate economic value added and earnings per share for the performance period with each performance measure carrying a 50% weighting. For business unit executives and employees, corporate economic value added and earnings per share measures
together carry a 50% weighting and an operating income measure for the appropriate business unit is weighted 50%. If the performance level falls between “threshold” and “target” or between “target” and “maximum”, the award is prorated. Under the 1997 LTIP, the level of payouts, if any, is determined by the Compensation Committee after financial results for the applicable performance period are available and are generally paid within three months following the end of the applicable performance period. Cash performance awards may be paid in cash, in common shares of Worthington Industries, Inc., or other property or any combination thereof, at the sole discretion of the Compensation Committee at the time of payment. Performance share awards will be paid in common shares of Worthington Industries, Inc.
Grants and payouts of long-term incentive awards under the 1997 LTIP have been shown in the Proxy Statements of Worthington Industries, Inc. under the heading “EXECUTIVE COMPENSATION.” Information on cash performance awards and performance share awards granted to named executive officers of Worthington Industries, Inc. on May 19, 2006 and payout of performance awards granted under the 1997 LTIP for the three-year period ended May 31, 2006 will be shown under the headings “EXECUTIVE COMPENSATION – Long-Term Incentive Plan Awards” and “EXECUTIVE COMPENSATION – Summary of Cash and Other Compensation,” respectively, in the Proxy Statement of Worthington Industries, Inc. for the Annual Meeting of Shareholders to be held on September 27, 2006 (the “2006 Proxy Statement”). In addition, Worthington Industries, Inc. reported the cash performance awards and performance share awards granted on May 19, 2006 to the named executive officers of Worthington Industries, Inc., in the Current Report on Form 8-K dated and filed May 25, 2006 (SEC File No. 1-8399) (the “May 25, 2006 Form 8-K”).
The relevant portions of the 2006 Proxy Statement are incorporated by reference into “Item 11. – Executive Compensation” of this Annual Report on Form 10-K. The 1997 LTIP is filed as Exhibit 10(e) of the Annual Report on Form 10-K filed by Worthington Industries, Inc., a Delaware corporation, for the fiscal year ended May 31, 1997 (SEC File No. 0-4016) and incorporated by reference as Exhibit 10.7 of this Annual Report on Form 10-K and the form of letter evidencing performance award granted under the 1997 LTIP with targets for the three-year period ending May 31, 2009, is filed as Exhibit 10.24 of this Annual Report on Form 10-K.
Part IIIPART III
Item 10. – Directors and Executive Officers of the Registrant
In accordance with General Instruction G(3) of Form 10-K, the information regarding directors required by Item 401 of SEC Regulation S-K is incorporated herein by reference from the material which will be included under the heading “PROPOSAL 1: ELECTION OF DIRECTORS” in the Registrant’s2006 Proxy Statement for the September 30, 2004, Annual Meeting of Shareholders (the “Proxy Statement”).Statement. The information regarding executive officers required by Item 401 of SEC Regulation S-K is included in Part I of this Form 10-K under the heading “Supplemental Item. –- Executive Officers of the Registrant.” The information required by Item 405 of SEC Regulation S-K is incorporated herein by reference from the material which will be included under the heading “SECTION 16(a) BENEFICIAL OWNERSHIP REPORTING COMPLIANCE” in the Registrant’s2006 Proxy Statement.
Information concerning the Registrant’s Audit Committee and the determination by the Registrant’s Board of Directors that at least one member of the Audit Committee qualifies as an “audit committee financial expert”, as that term is defined in Item 401(h)(2) of SEC Regulation S-K, is incorporated herein by reference from the information which will be included under the headings “PROPOSAL 1: ELECTION OF DIRECTORS —– Committees and Meetings of the Board —– Committees of the Board” and “PROPOSAL 1: ELECTION OF DIRECTORS - -– Committees and Meetings of the Board —– Audit Committee” in the Registrant’s2006 Proxy Statement. Information concerning the nomination process for director candidates is incorporated herein by reference from the information which will be included under the headings “PROPOSAL 1: ELECTION OF DIRECTORS —– Committees and Meetings of the Board —– Nominating and Governance Committee” and “PROPOSAL 1: ELECTION OF DIRECTORS —– Nominating Procedures” in the Registrant’s2006 Proxy Statement.
The Registrant’s Board of Directors has adopted Charters for each of the Audit Committee, the Compensation and Stock Option Committee, the Executive Committee and the Nominating and Governance Committee as well as Corporate Governance Guidelines as contemplated by the applicable sections of the New York Stock Exchange Listed Company Manual.
55
In accordance with the requirements of Section 303A(10)303A.10 of the New York Stock Exchange Listed Company Manual, the Board of Directors of the Registrant has adopted a Business Code of Conduct covering the directors, officers and employees of the Registrant, including the Registrant’s Chairman of the Board and Chief Executive Officer (the principal executive officer), the Registrant’s President and Chief Financial Officer (the principal financial officer) and the Registrant’s Controller (the principal accounting officer). The Registrant intends towill disclose the following events, if they occur, on the “Corporate Governance” page of its websitethe “Investor Relations” section of the Registrant’s web site located at www.worthingtonindustries.com within the time period following their occurrence as required by the applicable rules of the SEC and the requirements of Section 303A(10)303A.10 of the New York Stock Exchange Listed Company Manual: (A) the nature of any amendment to a provision of the Registrant’s Business Code of Conduct that (i) applies to the Registrant’s principal executive officer, principal financial officer, principal accounting officer or controller, or persons performing similar functions, (ii) relates to any element of the “code of ethics” definition enumerated in Item 406(b) of SEC Regulation S-K, and (iii) is not a technical, administrative or other non-substantive amendment; and (B) a description of any waiver (including the nature of the waiver, the name of the person to whom the waiver was granted and the date of the waiver), including an implicit waiver, from a provision of the Business Code of Conduct granted to the Registrant’s principal executive officer, principal financial officer, principal accounting officer or controller, or persons performing similar functions, that relates to one or more of the items set forth in Item 406(b) of SEC Regulation S-K.
The text of each of the Charter of the Audit Committee, the Charter of the Compensation and Stock Option Committee, the Charter of the Executive Committee, the Charter of the Nominating and Governance Committee, the Corporate Governance Guidelines and the Business Code of Conduct is posted on the “Corporate Governance” page of the “Investor Relations” section of the Registrant’s websiteweb site located at www.worthingtonindustries.com. Interested persons may also obtain copies of each of these documents, without charge, by writing to the Vice President-Administration, General Counsel and SecretaryInvestor Relations Department of the Registrant at Worthington Industries, Inc., 200 Old Wilson Bridge Road, Columbus, Ohio 43085, Attention: Dale T. Brinkman.Allison M. Sanders. In addition, a copy of the Business Code of Conduct is beingwas filed as Exhibit 14 to thisthe Registrant’s Annual Report on Form 10-K.
10-K for the fiscal year ended May 31, 2004.
Item 11. – Executive Compensation
In accordance with General Instruction G(3) of Form 10-K, the information required by this Item 11 is incorporated herein by reference from the material which will be containedincluded in the 2006 Proxy Statement under the headings “PROPOSAL 1: ELECTION OF DIRECTORS –- Compensation of Directors” and “EXECUTIVE COMPENSATION.” Such incorporation by reference shall not be deemed to specifically incorporate by reference the information referred to in Item 402(a)(8) of SEC Regulation S-K.
Item 12. – Security Ownership of Certain Beneficial Owners and Management and Related ShareholderStockholder Matters
In accordance with General Instruction G(3) of Form 10-K, the information required by this Item 12 with respect to the security ownership of certain beneficial owners and management is incorporated herein by reference from the material which will be containedincluded in the 2006 Proxy Statement under the heading “CERTAIN BENEFICIAL“SECURITY OWNERSHIP OF COMMON SHARES.CERTAIN BENEFICIAL OWNERS AND MANAGEMENT.” The information required by this Item 12 with respect to securities authorized for issuance under equity compensation plans is incorporated herein by reference from the material containedwhich will be included in the 2006 Proxy Statement under the heading “EXECUTIVE COMPENSATION – Equity Compensation Plan Information.”
Item 13. – Certain Relationships and Related Transactions
In accordance with General Instruction G(3) of Form 10-K, the information required by this Item 13 is incorporated herein by reference to the information for John H. McConnell and John P. McConnell which will be containedincluded under the heading “CERTAIN BENEFICIAL“SECURITY OWNERSHIP OF COMMON SHARES”CERTAIN BENEFICIAL OWNERS AND MANAGEMENT” in the 2006 Proxy Statement and by reference to the material set forthwhich will be included under the captionheading “TRANSACTIONS WITH CERTAIN RELATED PARTIES” in the 2006 Proxy Statement.
56
Item 14.–Principal Accountant Fees and Services
In accordance with General Instruction G(3) of Form 10-K, the information required by this Item 14 is incorporated herein by reference from the information which will be containedincluded in the 2006 Proxy Statement under the headings “AUDIT COMMITTEE MATTERS —– Fees of Independent Auditors”Registered Public Accounting Firm” and “AUDIT COMMITTEE MATTERS —– Pre-Approval of Services Performed by the Independent Auditors.Registered Public Accounting Firm.”
PART IV
Item 15. – Exhibits and Financial Statement Schedules and Reports on Form 8-K
(a) | | The following documents are filed as part of this Annual Report on Form 10-K: |
Consolidated Financial Statements:
Report of Independent Registered Public Accounting Firm (KPMG LLP)
Consolidated Balance Sheets as of May 31, 2006 and 2005
Consolidated Statements of Earnings for the fiscal years ended May 31, 2006, 2005 and 2004
Consolidated Statements of Shareholders’ Equity for the fiscal years ended May 31, 2006, 2005 and 2004
Consolidated Statements of Cash Flows for the fiscal years ended May 31, 2006, 2005 and 2004
Notes to Consolidated Financial Statements – fiscal years ended May 31, 2006, 2005 and 2004
| (1) | Financial Statement Schedule |
Schedule II – Valuation and Qualifying Accounts
All other financial statement schedules are omitted because they are not required or the information required has been presented in the aforementioned consolidated financial statements.
| | (1)(2) | | Consolidated Financial Statements: |
|
| | | Report of Independent Registered Public Accounting Firm (KPMG LLP)
Consolidated Balance Sheets as of May 31, 2004 and 2003
Consolidated Statements of Earnings for the years ended May 31, 2004, 2003 and 2002
Consolidated Statements of Shareholders’ Equity for the years ended May 31, 2004, 2003 and 2002
Consolidated Statements of Cash Flows for the years ended May 31, 2004, 2003 and 2002
Notes to Consolidated Financial Statements |
|
| (2) | | Financial Statement Schedule |
|
| | | Schedule II – Valuation and Qualifying Accounts |
|
| | | All other financial statement schedules are omitted because they are not required or the information required has been presented in the aforementioned financial statements. |
|
| (3) | | Listing of Exhibits: |
The exhibits listed on the “Index to Exhibits” beginning on page E-1 of this Annual Report on Form 10-K are filed with this Annual Report on Form 10-K or incorporated herein by reference as noted in the “Index to Exhibits.” The “Index to Exhibits” specifically identifies each management contract or compensatory plan or arrangement required to be filed as an exhibit to this Annual Report on Form 10-K or incorporated herein by reference.
|
(b) | | | The exhibits listed on the “Index to Exhibits” beginning on page E-1 of this Annual Report on Form 10-K are filed with this Annual Report on Form 10-K or incorporated herein by reference as noted in the “Index to Exhibits.” The “Index to Exhibits” specifically identifies each management contract or compensatory plan or arrangement required to be filed as an exhibit to this Form 10-K. |
(b)(c) | | The following reports on Form 8-K were filed with or furnished information to the Securities and Exchange Commission during the fiscal fourth quarter ended May 31, 2004: |
On March 17, 2004, Worthington Industries, Inc. furnished information to the Securities and Exchange Commission on a Current Report on Form 8-K dated March 17, 2004, reporting under “Item 12. – Results of Operations and Financial Conditions,” that on March 17, 2004, Worthington Industries, Inc. issued a press release announcing results for its fiscal third quarter ended February 29, 2004.
On May 27, 2004, Worthington Industries, Inc. issued a press release announcing an agreement to sell its Decatur, Alabama, cold rolling assets to Nucor Corporation, with closing expected to occur within sixty days, after receiving the necessary approvals from government agencies. The press release also included certain information concerning items expected to impact the Registrant’s operating results for the fourth fiscal quarter ending May 31, 2004. Information concerning the press release was furnished to the Securities and Exchange Commission on a Current Report on Form 8-K dated May 27, 2004, under “Item 9. – Regulation FD Disclosure” and “Item 12. – Results of Operations and Financial Condition.”
(c) | | The exhibits listed on the “Index to Exhibits” beginning on page E-1 of this report are filed with this Form 10-K or incorporated by reference as noted in the “Index to Exhibits.” |
|
(d) | | The financial statement schedule listed in Item 15(a)(2) is filed herewith. |
57
SIGNATURES
SIGNATURES
Pursuant to the requirements of Section 13 or 15(d) of the Securities Exchange Act of 1934, the Registrant has duly caused this report to be signed on its behalf by the undersigned, thereunto duly authorized.
| | | | |
| | WORTHINGTON INDUSTRIES, INC. |
| | |
Date: August 11, 2006 | | WORTHINGTON INDUSTRIES, INC. |
By: | | | | |
Date: August 16, 2004 | | By: | | /s/ /s/ John P. McConnell |
| | | | John P. McConnell |
| | | | Chairman of the Board and Chief Executive Officer |
Pursuant to the requirements of the Securities Exchange Act of 1934, this report has been signed below by the following persons on behalf of the Registrant and in the capacities and on the date indicated.
| | | | | | | | | | | | | | |
| | SIGNATURE | | | | | |
SIGNATUREDATE | | DATE | | TITLE | | |
| | | | |
| | |
/s/ John P. McConnell | | August 16, 200411, 2006 | | Director, Chairman of the Board and |
John P. McConnell | | | | Chief Executive Officer | | |
| | | | |
/s/ John S. Christie | | August 16, 200411, 2006 | | Director, President and |
John S. Christie | | | | Chief Financial Officer |
| | | | |
/s/ Richard G. Welch | | August 16, 200411, 2006 | | Controller |
Richard G. Welch | | | | (Principal Accounting Officer) |
| | |
| * | | * | | (Principal Accounting Officer)Director |
John B. Blystone | | | | |
| | |
| * | | * | | Director |
William S. Dietrich, II | | | | |
| | |
| * | | |
| * | | Director |
Michael J. Endres | | | | |
| | |
| * | | * | | Director |
John B. BlystonePeter Karmanos, Jr. | | | | |
| | |
| * | | * | | Director |
John R. Kasich | | | | |
| | |
| * | | * | | Director |
Carl A. Nelson, Jr. | | | | |
| | |
| * | | * | | Director |
Sidney A. Ribeau | | | | |
| | |
| * | | |
| * | | *Director |
Mary Schiavo | | Director |
William S. Dietrich | | | | |
| | | | |
* | | * | | Director |
Michael J. Endres | | | | |
| | | | |
* | | * | | Director |
Peter Karmanos, Jr. | | | | |
| | | | |
* | | * | | Director |
John R. Kasich | | | | |
| | | | |
* | | * | | Director |
Sidney A. Ribeau | | | | |
| | | | |
* | | * | | Director |
Mary Fackler Schiavo | | | | |
*The undersigned, by signing his name hereto, does hereby sign this report on behalf of each of the above-identified directors of the Registrant pursuant to powers of attorney executed by such directors.
directors and filed with this report. | | | | | | | | |
*By: | | /s/ John P. McConnell | | | | Date: August 11, 2006 | | |
| | John P. McConnell | | | | | | |
| | Attorney-In-Fact | | | | | | |
INDEX TO EXHIBITS
| | | | | | |
Exhibit | | Description | | | | | |
*By: | | /s/ John P. McConnell | Date: August 16, 2004Location |
| | John P. McConnell Attorney-In-Fact | |
3.1 | | |
58
INDEX TO EXHIBITS
| | | | |
Exhibit
| | Description
| | Location
|
2 | | Asset Purchase Agreement, entered into as of May 26, 2004, by and among Nucor Steel Decatur, LLC; Worthington Steel Company of Decatur, L.L.C.; Nucor Corporation; and Worthington Industries, Inc. (excluding exhibits and schedules) | | Filed herewith |
| | | | |
3(a) | | Amended Articles of Incorporation of Worthington Industries, Inc., as filed with Ohio Secretary of State on October 13, 1998 | | | | Incorporated herein by reference to Exhibit 3(a) of the Registrant’s Quarterly Report on Form 10-Q for the quarterly period ended August 31, 1998 (SEC File No. 0-4016) |
| | | |
3.2 | | | | |
3(b) | | Code of Regulations of Worthington Industries, Inc., as amended through September 28, 2000 [for SEC reporting compliance purposes only] | | | | Incorporated herein by reference to Exhibit 3(b) of the Registrant’s Quarterly Report on Form 10-Q for the quarterly period ended August 31, 2000 (SEC File No. 1-8399) |
| | | |
4.1 | | | | |
4(a) | | Form of Indenture, dated as of May 15, 1996, between Worthington Industries, Inc. and Bank of New York, as successor Trustee [Bank of New York succeeded J.P. Morgan Trust Company, National Association as successor Trustee; which was successor Trustee to Chase Manhattan Trust Company, National Association; which in turn was successor Trustee to PNC Bank, National Association, formerly known as PNC Bank, Ohio, National Association, as Trustee,Association], relating to up to $450,000,000 of debt securities | | | | Incorporated herein by reference to Exhibit 4(a) of the Annual Report on Form 10-K of Worthington Industries, Inc., a Delaware corporation (“Worthington Delaware”), for the fiscal year ended May 31, 1997 (SEC File No. 0-4016) |
| | | |
4.2 | | | | |
4(b) | | Form of 7-1/8% Note due May 15, 2006 | | Incorporated herein by reference to Exhibit 4(b) of the Annual Report on Form 10-K of Worthington Delaware for the fiscal year ended May 31, 1997 (SEC File No. 0-4016) |
| | | | |
4(c) | | First Supplemental Indenture, dated as of February 27, 1997, between Worthington Industries, Inc. and PNC Bank, Ohio, National Association, as Trustee | | Incorporated herein by reference to Exhibit 4(c) of the Annual Report on Form 10-K of Worthington Delaware for the fiscal year ended May 31, 1997 (SEC File No. 0-4016) |
| | | | |
4(d) | | Form of 6.7% Note due December 1, 2009 | | | | Incorporated herein by reference to Exhibit 4(f) of the Annual Report on Form 10-K of Worthington Delaware for the fiscal year ended May 31, 1998 (SEC File No. 0-4016) |
| | | |
4.3 | | | | |
4(e) | | Second Supplemental Indenture, dated as of December 12, 1997, between Worthington Industries, Inc. and Bank of New York, as successor Trustee [Bank of New York succeeded J.P. Morgan Trust Company, National Association, as successor Trustee; which was successor Trustee to Chase Manhattan Trust Company, National Association; which in turn was successor Trustee to PNC Bank, National Association, formerly known as PNC Bank, Ohio, National Association, as TrusteeAssociation] | | | | Incorporated herein by reference to Exhibit 4(g) of the Annual Report on Form 10-K of Worthington Delaware for the fiscal year ended May 31, 1998 (SEC File No. 0-4016) |
E-1
| | | |
4.4 | | | | |
Exhibit
| | Description
| | Location
|
4(f) | | Third Supplemental Indenture, dated as of October 13, 1998, amongbetween Worthington Industries, Inc., a Delaware corporation, Worthington Industries, Inc., an Ohio corporation, and Bank of New York, as successor Trustee [Bank of New York succeeded J.P. Morgan Trust Company, National Association, as successor Trustee; which was successor Trustee to Chase Manhattan Trust Company, National Association; which in turn was successor Trustee to PNC Bank, National Association, (formerlyformerly known as PNC Bank, Ohio, National Association)Association] | | | | Incorporated herein by reference to Exhibit 4(h) of the Registrant’s Annual Report on Form 10-K for the fiscal year ended May 31, 1999 (SEC File No. 0-4016) |
| | | | | | |
4.5 | | | | |
4(g) | | Fourth Supplemental Indenture, dated as of May 10, 2002, amongbetween Worthington Industries, Inc. and Bank of New York, as successor Trustee [Bank of New York succeeded J.P. Morgan Trust Company, National Association, as successor trusteeTrustee; which was successor Trustee to Chase Manhattan Trust Company, National Association (successorAssociation; which in turn was successor Trustee to PNC Bank, National Association, formerly known as PNC Bank, Ohio, National Association)Association] | | | | Incorporated herein by reference to Exhibit 4(h) of the Registrant’s Annual Report on Form 10-K for the fiscal year ended May 31, 2002 (SEC File No. 1-8399) |
| | | |
4.6 | | | | |
4(h)(i) | | $155,000,000 Five-Year435,000,000 Second Amended and Restated Revolving Credit Agreement, dated as of May 10, 2002,September 29, 2005, among Worthington Industries, Inc., as Borrower; the Lenders from time to time party thereto,thereto; PNC Bank, National Association, as Issuing Lender, Swingline Lender and Administrative Agent; and The Bank of Nova Scotia, as Syndication Agent and First Union Securities, Inc.Sole Bookrunner; with The Bank of Nova Scotia and PNC Capital Markets, Inc., serving as Co-SyndicationJoint Lead Arrangers, and U.S. Bank National Association, Wachovia Bank, National Association and Comerica Bank serving as Co-Documentation Agents and Co-Lead Arrangers | | | | Incorporated herein by reference to Exhibit 4(i)(i)4.1 of the Registrant’s Current Report on Form 8-K dated September 30, 2005 and filed with the SEC on that date (SEC File No. 1-8399) |
| | | |
4.7 | | Note Purchase Agreement, dated December 17, 2004, between Worthington Industries, Inc. and Allstate Life Insurance Company, Connecticut General Life Insurance Company, United of Omaha Life Insurance Company and Principal Life Insurance Company | | | | Incorporated herein by reference to Exhibit 4.1 of the Registrant’s Current Report on Form 8-K dated December 17, 2004 and filed with the SEC on December 21, 2004 (SEC File No. 1-8399) |
| | | |
4.8 | | Form of Floating Rate Senior Note due December 17, 2014 | | | | Incorporated herein by reference to Exhibit 4.2 of the Registrant’s Current Report on Form 8-K dated December 17, 2004 and filed with the SEC on December 21, 2004 (SEC File No. 1-8399) |
| | | |
4.9 | | Agreement to furnish instruments and agreements defining rights of holders of long-term debt | | | | Filed herewith |
| | | |
10.1 | | Worthington Industries, Inc. Non-Qualified Deferred Compensation Plan effective March 1, 2000* | | | | Incorporated herein by reference to Exhibit 10.1 of the Registrant’s Annual Report on Form 10-K for the fiscal year ended May 31, 20022005 (SEC File No. 1-8399) |
| | | |
10.2 | | | | |
4(h)(ii) | | Form of Revolving Note issued by Worthington Industries, Inc. to the various Lenders from time to time party to that certain $155,000,000 Five-Year Revolving Credit Agreement, dated as of May 10, 20022005 Non-Qualified Deferred Compensation Plan* | | | | Incorporated herein by reference to Exhibit 4(i)(ii) of the Registrant’s Annual Report on Form 10-K for the fiscal year ended May 31, 2002 (SEC File No. 1-8399) |
| | | | |
4(h)(iii) | | Swingline Note, dated May 10, 2002 issued by Worthington Industries, Inc. to PNC Bank, National Association, as Swingline Lender under that certain $155,000,000 Five-Year Revolving Credit Agreement, dated as of May 10, 2002 | | Incorporated herein by reference to Exhibit 4(i)(iii) of the Registrant’s Annual Report on Form 10-K for the fiscal year ended May 31, 2002 (SEC File No. 1-8399) |
| | | | |
Exhibit
| | Description
| | Location
|
4(h)(iv) | | Amendment to Five-Year Revolving Credit Agreement, dated as of August, 30, 2002, by and among Worthington Industries, Inc., as borrower, the banks and other financial institutions from time to time party to the Credit Agreement (defined therein) and PNC Bank, National Association, as Issuing Lender, Swingline Lender and Administrative Agent | | Incorporated herein by reference to Exhibit 4(j)(i)10.1 of the Registrant’s Quarterly Report on Form 10-Q for the quarterly period ended November 30, 20022004 (SEC File No. 1-8399) |
| | | | | | |
10.3 | | | | |
4(h)(v) | | Second Amendment datedNo. 1 to the Worthington Industries, Inc. 2005 Non-Qualified Deferred Compensation Plan, executed as of November 22, 2002, to the Five-Year Revolving Credit Agreement, dated17, 2005 and effective as of May 10, 2002, among Worthington Industries, Inc., the Lenders and PNC Bank, National Association, as Administrative Agent, Issuing Lender and Swingline LenderJanuary 1, 2005* | | | | Incorporated herein by reference to Exhibit 4(j)(v)10.1 of the Registrant’s QuarterlyCurrent Report on Form 10-Q for8-K dated November 17, 2005 and filed with the quarterly period endedSEC on November 30, 200218, 2005 (SEC File No. 1-8399) |
| | | |
10.4 | | | | |
4(i) | | Pledge Agreement, dated as of May 10, 2002, by Worthington Industries, Inc. in favor of Wells Fargo Bank Minnesota, National Association, as Collateral Agent for the Secured Parties as defined in the Trust Agreement, dated as of May 10, 2002 (See Exhibit 4(l) below) | | Incorporated herein by reference to Exhibit 4(k) of the Registrant’s Annual Report on Form 10-K for the fiscal year ended May 31, 2002 (SEC File No. 1-8399) |
| | | | |
4(j) | | Trust Agreement, dated as of May 10, 2002, among Worthington Industries, Inc., J.P. Morgan Trust Company, National Association (successor to Chase Manhattan Trust Company, N.A.), as Public Debt Trustee, Wells Fargo Bank Minnesota, National Association, as Collateral Agent, PNC Bank, National Association, as Administrative Agent, and Wells Fargo Bank Minnesota, National Association, as Trustee | | Incorporated herein by reference to Exhibit 4(l) of the Registrant’s Annual Report on Form 10-K for the fiscal year ended May 31, 2002 (SEC File No. 1-8399) |
| | | | |
4(k) | | Agreement to furnish instruments and agreements defining rights of holders of long-term debt | | Filed herewith |
| | | | |
Exhibit
| | Description
| | Location
|
10(a) | | Worthington Industries, Inc. 1990 Stock Option Plan, as amended* | | Incorporated herein by reference to Exhibit 10(b) of the Company’s Annual Report on Form 10-K for the fiscal year ended May 31, 1999 (SEC File No. 1-8399) |
| | | | |
10(b) | | Worthington Industries, Inc. Executive Deferred Compensation Plan, as Amended and Restated effective June 1, 2000* | | Incorporated herein by reference to Exhibit 10(c) of the Registrant’s Annual Report on Form 10-K for the fiscal year ended May 31, 2000 (SEC File No. 1-8399) |
| | | | |
10(c) | | Worthington Industries, Inc. Deferred Compensation Plan for Directors, as Amended and Restated, effective June 1, 2000* | | | | Incorporated herein by reference to Exhibit 10(d) of the Registrant’s Annual Report on Form 10-K for the fiscal year ended May 31, 2000 (SEC File No. 1-8399) |
| | | |
10.5 | | Worthington Industries, Inc. 2005 Deferred Compensation Plan for Directors* | | |
10(d) | | Incorporated herein by reference to Exhibit 10.2 of the Registrant’s Quarterly Report on Form 10-Q for the quarterly period ended November 30, 2004 (SEC File No. 1-8399) |
| | | |
10.6 | | Worthington Industries, Inc. 1990 Stock Option Plan, as amended* | | | | Incorporated herein by reference to Exhibit 10(b) of the Registrant’s Annual Report on Form 10-K for the fiscal year ended May 31, 1999 (SEC File No. 1-8399) |
| | | |
10.7 | | Worthington Industries, Inc. 1997 Long-Term Incentive Plan (material terms of performance goals most recently approved by shareholders on September 25, 2003) * | | | | Incorporated herein by reference to Exhibit 10(e) of the Registrant’sWorthington Delaware’s Annual Report on Form 10-K for the fiscal year ended May 31, 1997 (SEC File No. 0-4016) |
| | | |
10.8 | | | | |
10(e) | | Form of Non-Qualified Stock Option Agreement for non-qualified stock options granted under the Worthington Industries, Inc. Non-Qualified Deferred Compensation1997 Long-Term Incentive Plan* | | | | Incorporated herein by reference to Exhibit 10(f)10.1 of the Registrant’s Annual Report on Form 10-K10-Q for the fiscal yearquarterly period ended MayAugust 31, 20002004 (SEC File No. 1-8399) |
| | | |
10.9 | | | | |
10(f) | | Worthington Industries, Inc. 2000 Stock Option Plan for Non-Employee Directors (reflects amendments through September 25, 2003)* | | | | Incorporated herein by reference to Exhibit 10(l)10.1 of the Registrant’s Quarterly Report on Form 10-Q for the quarterly period ended August 31, 2003 (SEC File No. 1-8399) |
| | | |
10.10 | | Form of Non-Qualified Stock Option Agreement for non-qualified stock options granted under the Worthington Industries, Inc. 2000 Stock Option Plan for Non-Employee Directors* | | |
10(g)(i) | | Incorporated herein by reference to Exhibit 10.2 of the Registrant’s Form 10-Q for the quarterly period ended August 31, 2004 (SEC File No. 1-8399) |
| | | |
10.11 | | Worthington Industries, Inc. 2003 Stock Option Plan (as approved by shareholders on September 25, 2003)* | | | | Incorporated herein by reference to Exhibit 10.2 of the Registrant’s Quarterly Report on Form 10-Q for the quarterly period ended August 31, 2003 (SEC File No. 1-8399) |
| | | |
10.12 | | Form of Non-Qualified Stock Option Agreement for non-qualified stock options granted under the Worthington Industries, Inc. 2003 Stock Option Plan* | | | | Incorporated herein by reference to Exhibit 10.3 of the Registrant’s Form 10-Q for the quarterly period ended August 31, 2004 (SEC File No. 1-8399) |
| | | | | | |
10.13 | | Receivables Purchase Agreement, dated as of November 30, 2000, among Worthington Receivables Corporation, Worthington Industries, Inc., as Servicer, members of various purchaser groups from time to time party thereto and PNC Bank, National Association, as Administrator | | | | Incorporated herein by reference to Exhibit 10(h)(i) of the Registrant’s Annual Report on Form 10-K for the fiscal year ended May 31, 2001 (SEC File No. 1-8399) |
| | | |
10.14 | | | | |
10(g)(ii) | | Amendment No. 1 to Receivables Purchase Agreement, dated as of May 18, 2001, among Worthington Receivables Corporation, Worthington Industries, Inc., members of various purchaser groups from time to time party thereto and PNC Bank, National Association | | | | Incorporated herein by reference to Exhibit 10(h)(ii) of the Registrant’s Annual Report on Form 10-K for the fiscal year ended May 31, 2001 (SEC File No. 1-8399) |
| | | |
10.15 | | Amendment No. 2 to Receivables Purchase Agreement, dated as of May 31, 2004, among members of various purchaser groups from time to time party thereto and the various originators listed therein and PNC Bank, National Association, as Administrator | | |
10(g)(iii) | | Incorporated herein by reference to Exhibit 10(g)(x) of the Registrant’s Annual Report on Form 10-K for the fiscal year ended May 31, 2004 (File No. 1-8399) |
| | | |
10.16 | | Amendment No. 3 to Receivables Purchase Agreement, dated as of January 27, 2005, among Worthington Receivables Corporation, Worthington Industries, Inc., the members of the various purchaser groups from time to time party thereto and PNC Bank, National Association, as Administrator | | | | Incorporated herein by reference to Exhibit 10.15 of the Registrant’s Annual Report on Form 10-K for the fiscal year ended May 31, 2005 (SEC File No. 1-8399) |
| | | |
10.17 | | Purchase and Sale Agreement, dated as of November 30, 2000, between the various originators listed therein and Worthington Receivables Corporation | | | | Incorporated herein by reference to Exhibit 10(h)(iii) of the Registrant’s Annual Report on Form 10-K for the fiscal year ended May 31, 2001 (SEC File No. 1-8399) |
| | | |
10.18 | | | | |
Exhibit
| | Description
| | Location
|
10(g)(iv) | | Amendment No. 1, dated as of May 18, 2001, to Purchase and Sale Agreement, dated as of November 30, 2000, between the various originators listed therein and Worthington Receivables Corporation | | | | Incorporated herein by reference to Exhibit 10(g)10(h)(iv) of the Registrant’s Annual Report on Form 10-K for the fiscal year ended May 31, 20022001 (File No. 1-8399) |
| | | |
10.19 | | Description of the Worthington Industries, Inc. Executive Bonus Plan * | | |
10(g)(v) | | Assumption and Transfer Agreement, dated as of October 25, 2001, among Worthington Receivables Corporation, Fifth Third Bank, as a purchaser, a related committed purchaser, and an agent, Market Street Funding Corporation, as a purchaser, and PNC Bank, National Association, as agent for Market Street and as administrator | | Incorporated herein by reference to Exhibit 10(g)(v)10.19 of the Registrant’s Annual Report on Form 10-K for the fiscal year ended May 31, 2002 (File2005 (SEC File No. 1-8399) |
| | | |
10.20 | | Summary of Cash Compensation for Directors of Worthington Industries, Inc., for the period from June 1, 2003 to May 31, 2006 * | | |
10(g)(vi) | | Assumption and Transfer Agreement, dated as of April 24, 2002, among Worthington Receivables Corporation, Liberty Street Funding Corp., as a purchaser and a related committed purchaser, The Bank of Nova Scotia, as Agent for Liberty Street Purchasers, Market Street Funding Corporation, as a purchaser and PNC Bank, National Association, as agent for Market Street and as administrator | | Incorporated herein by reference to Exhibit 10(g)(vi)10.20 of the Registrant’s Annual Report on Form 10-K for the fiscal year ended May 31, 2002 (File2005 (SEC File No. 1-8399) |
| | | |
10.22 | | Summary of Cash Compensation for Directors of Worthington Industries, Inc., effective June 1, 2006 * | | |
10(g)(vii) | | Letter Agreement, dated as of November 29, 2001, among Worthington Receivables Corporation, members of various purchaser groups from time to time party thereto and PNC Bank, National Association, as Administrator, for the purpose of extending the facility termination dateFiled herewith |
| | | | | | |
10.23 | | Form of Letter Evidencing Cash Performance Awards Granted under the Worthington Industries, Inc. 1997 Long-Term Incentive Performance Plan * | | | | Incorporated herein by reference to Exhibit 10(a)10.21 of the Registrant’s QuarterlyAnnual Report on Form 10-Q10-K for the quarterly periodfiscal year ended November 30, 2003May 31, 2005 (SEC File No. 1-8399). |
| | | |
10.24 | | Form of Letter Evidencing Cash Performance Awards and Performance Share Awards Granted under the Worthington Industries, Inc. 1997 Long-Term Incentive Plan Performance Award* | | |
10(g)(viii) | | Letter Agreement, dated as of November 27, 2002, among Worthington Receivables Corporation, members of various purchaser groups from time to time party thereto and PNC Bank, National Association, as Administrator, for the purpose of extending the facility termination date | | Incorporated herein by reference to Exhibit 10(b)10.1 of the Registrant’s QuarterlyCurrent Report on Form 10-Q for8-K dated May 25, 2006 and filed with the quarterly period ended November 30, 2003SEC on the same date (SEC File No. 1-8399) |
| | | |
14 | | Worthington Industries, Inc. Code of Conduct | | |
10(g)(ix) | | Letter Agreement, dated as of November 25, 2003, among Worthington Receivables Corporation, members of various purchaser groups from time to time party thereto and PNC Bank, National Association, as Administrator, for the purpose of extending the facility termination date | | Incorporated herein by reference to Exhibit 10(c)14 of the Registrant’s QuarterlyAnnual Report on Form 10-Q10-K for the quarterly periodfiscal year ended November 30, 2003 (SEC File No. 1-8399) |
| | | | |
Exhibit
| | Description
| | Location
|
10(g)(x) | | Amendment No. 2, dated as of May 31, 2004 to Purchase and Sale Agreement, dated as of November 30, 2000, between the various originators listed therein and Worthington Receivables Corporation(File No. 1-8399) |
| | | |
21 | | Filed herewith |
| | | | |
10(h) | | Worthington Industries, Inc. 2003 Stock Option Plan (as approved by shareholders on September 25, 2003)* | | Incorporated herein by reference to Exhibit 10.2 of the Registrant’s Quarterly Report on Form 10-Q for the quarterly period ended August 31, 2003 (SEC File No. 1-8399). |
| | | | |
14 | | Code of Conduct | | Filed herewith |
| | | | |
21 | | Subsidiaries of Worthington Industries, Inc. | | Filed herewith |
| | Filed herewith |
| | | |
23.1 | | |
23Consent of Independent Registered Public Accounting Firm (KPMG LLP) | | Consent of KPMG LLP | | Filed herewith |
| | | |
23.2 | | Consent of Independent Registered Public Accounting Firm (KPMG LLP) | | |
24 | | Filed herewith |
| | | |
24 | | Powers of Attorney | | Filed herewith |
| | Filed herewith |
| | | |
31.1 | | |
31(a) | | Rule 13a - 14(a) / 15d - 14(a) Certification (Principal Executive Officer) | | Filed herewith |
| | Filed herewith |
| | | |
31.2 | | |
31(b) | | Rule 13a - 14(a) / 15d - 14(a) Certification (Principal Financial Officer) | | Filed herewith |
| | Filed herewith |
| | | |
32.1 | | |
32(a) | | Section 1350 Certification of Principal Executive Officer | | Filed herewith |
| | Filed herewith |
| | | |
32.2 | | |
32(b) | | Section 1350 Certification of Principal Financial Officer | | | | Filed herewith |
| | | |
99.1 | | Worthington Armstrong Venture consolidated financial statements as of December 31, 2005 and 2004 and for the years ended December 31, 2005, 2004 and 2003 | | | | Filed herewith |
| | | |
| | | | | | |
| | *Management Compensation PlanIndicates management contract, compensatory plan or other arrangement | �� | | | |
E-5