

UNITED STATES
SECURITIES AND EXCHANGE COMMISSION
WASHINGTON, D.C. 20549
FORM 10-K
☒ | ANNUAL REPORT PURSUANT TO SECTION 13 OR 15(d) OF THE SECURITIES EXCHANGE ACT OF 1934 |
For the fiscal year endedDecember 31, 20212023
OR
☐ | TRANSITION REPORT PURSUANT TO SECTION 13 OR 15(d) OF THE SECURITIES EXCHANGE ACT OF 1934 |
For the transition period from to .
Commission file number: 1-36313
TIMKENSTEEL CORPORATIONMETALLUS INC.
(Exact name of registrant as specified in its charter)
| ||
|
|
|
Ohio | 46-4024951 | |
(State or other jurisdiction of incorporation or organization) | (I.R.S. Employer Identification No.) | |
1835 Dueber Avenue SW, Canton, OH | 44706 | |
(Address of principal executive offices) | (Zip Code) | |
330.471.7000
(Registrant’s telephone number, including area code)
Securities registered pursuant to Section 12(b) of the Securities Exchange Act of 1934:
Title of each class |
| Trading symbol |
| Name of exchange in which registered |
Common shares |
|
|
| New York Stock Exchange |
Securities registered pursuant to Section 12(g) of the Act: None
Indicate by check mark if the registrant is a well-known seasoned issuer, as defined in Rule 405 of the Securities Act. Yes ☐ No ☒
Indicate by check mark if the registrant is not required to file reports pursuant to Section 13 or Section 15(d) of the Exchange Act. Yes ☐ No ☒
Indicate by check mark whether the registrant (1) has filed all reports required to be filed by Section 13 or 15(d) of the Securities Exchange Act of 1934 during the preceding 12 months (or for such shorter period that the registrant was required to file such reports), and (2) has been subject to such filing requirements for the past 90 days. Yes ☒ No ☐
Indicate by check mark whether the registrant has submitted electronically every Interactive Data File required to be submitted pursuant to Rule 405 of Regulation S-T (§232.405 of this Chapter) during the preceding 12 months (or for such shorter period that the registrant was required to submit such files). Yes ☒ No ☐
Indicate by check mark whether the registrant is a large accelerated filer, an accelerated filer, a non-accelerated filer or a smaller reporting company. See the definitions of “large accelerated filer,” “accelerated filer” and “smaller reporting company” in Rule 12b-2 of the Exchange Act.
Large accelerated filer |
|
| Accelerated filer |
|
Non-accelerated filer | ☐ |
| Smaller reporting company | ☐ |
|
|
| Emerging growth company | ☐ |
If an emerging growth company, indicate by check mark if the registrant has elected not to use the extended transition period for complying with any new or revised financial reporting accounting standards provided pursuant to Section 13(a) of the Exchange Act. ☐
Indicate by check mark whether the registrant has filed a report on and attestation to its management’s assessment of the effectiveness of its internal control over financial reporting under Section 404(b) of the Sarbanes-Oxley Act (15 U.S.C.7262(b)) by the registered public accounting firm that prepared or issued its audit report. ☒
If securities are registered pursuant to Section 12(b) of the Act, indicate by check mark whether the financial statements of the registrant included in the filing reflect the correction of an error to previously issued financial statements. ☐
Indicate by check mark whether any of those error corrections are restatements that required a recovery analysis of incentive-based compensation received by any of the registrant’s executive officers during the relevant recovery period pursuant to §240.10D-1(b). ☐
Indicate by check mark whether the registrant is a shell company (as defined in Rule 12b-2 of the Exchange Act). Yes ☐ No ☒
As of June 30, 2021,2023, the aggregate market value of the registrant’s common stock held by non-affiliates was $641,412,312903,279,470 based on the closing sale price as reported on the New York Stock Exchange for that date.
Indicate the number of shares outstanding of each of the issuer’s classes of common stock, as of the latest practicable date.
Class | Outstanding at February 15, | |
Common Shares, without par value |
|
DOCUMENTS INCORPORATED BY REFERENCE
Document | Parts Into Which Incorporated | |
Proxy Statement for the | Part III |
TimkenSteel CorporationMetallus Inc.
Table of Contents
Page | ||
| ||
3 | ||
| ||
| ||
| ||
| ||
| ||
| ||
| ||
| ||
Management’s Discussion and Analysis of Financial Condition and Results of Operations |
| |
| ||
| ||
Changes in and Disagreements with Accountants on Accounting and Financial Disclosure |
| |
| ||
| ||
| ||
| ||
| ||
Security Ownership of Certain Beneficial Owners and Management and Related Stockholder Matters |
| |
Certain Relationships and Related Transactions, and Director Independence |
| |
| ||
| ||
| ||
| ||
2
Part I.
Item 1. Business
Overview
Metallus Inc., formerly known as TimkenSteel Corporation, ("we", "us", "our", the "Company" or "TimkenSteel""Metallus") was incorporated in Ohio on October 24, 2013, and became an independent, publicly traded company as the result of a spinoff from The Timken Company ("Timken") on June 30, 2014. In the spinoff, Timken transferred to us all of the assets and generally all of the liabilities related to Timken’s steel business. On January 10, 2024, the Company announced its intent to change the name to Metallus, which became effective on February 26, 2024.
We manufacture alloy steel, as well as carbon and micro-alloy steel.steel, using electric arc furnace ("EAF") technology. Our portfolio includes special bar quality ("SBQ"(“SBQ”) bars, seamless mechanical tubing ("tubes"(“tubes”), manufactured components (formerly known as the "value-add" product type) such as precision steel components, and billets. In addition, we supply machining and thermal treatment services, andAdditionally, we manage raw material recycling programs, which are also used internally as a feeder system for our melt operations.operations and allow us to sell scrap not used in our operations to third parties. Our products and servicessolutions are used in a diverse range of demanding applications in the following market sectors:end-markets: industrial; automotive; oilaerospace & defense; and gas; industrial equipment; mining; construction; rail; defense; heavy truck; agriculture; power generation; and oil country tubular goods ("OCTG").energy.
SBQ steel is made to restrictive chemical compositions and high internal purity levels and is used in critical mechanical applications. We make these products from nearly 100% recycled steel, using our expertise in raw materials to create custom steelhigh-quality specialty metal products. We focus on creating tailored products and services for our customers’ most demanding applications.respective end-markets. Our engineers are experts in both materials and applications, so we can work closely with each customer to deliver flexible solutions related to our products as well as to their applications and supply chains.
The SBQ bar, tube, and billet production processes take place at our Canton, Ohio manufacturing location. This location accounts for all of the SBQ bars, seamless mechanical tubes and billets we produce and includes three manufacturing facilities: the Faircrest, Harrison, and Gambrinus facilities. Our production of manufactured components takes place at two downstream manufacturing facilities: Tryon Peak (Columbus, North Carolina) and St. Clair (Eaton, Ohio). Many of the production processes are integrated, and the manufacturing facilities produce products that are sold in all of our market sectors.end-markets. As a result, investments in our facilities and resource allocation decisions affecting our operations are designed to benefit the overall business, not any specific aspect of the business.
On February 16, 2021, management announced a plan to indefinitely idle our Harrison melt and casting assets, which was completed in the first quarter of 2021. All of our melt and casting activities now take place at the Faircrest location. We worked collaboratively with employees, suppliers and a number of customers to ensure a well-organized and efficient transition. Our rolling and finishing operations at Harrison were not impacted by this action. For additional details regarding this matter please refer to “Note 6 – Disposition of Non-Core Assets.”
Prior to indefinitely idling these assets, we had an annual melt capacity of approximately 2 million tons and shipment capacity of 1.5 million tons. After indefinitely idling these assets, our annual melt capacity is approximately 1.2 million tons and our shipment capacity is approximately 0.9 million tons.
Operating Segments
We conduct our business activities and report financial results as one business segment. The presentation of financial results as one reportable segment is consistent with the way we operate our business and is consistent with the manner in which the Chief Operating Decision Maker ("CODM") evaluates performance and makes resource and operating decisions for the business as described above. Furthermore, the Company notes that monitoring financial results as one reportable segment helps the CODM manage costs on a consolidated basis, consistent with the integrated nature of our operations.
Industry Segments and Geographical Financial Information
Information required by this Item is incorporated herein by reference to “Note 3 - Segment Information” in the Notes to the Consolidated Financial Statements.
Strengths and Strategy
Our customers depend on usare at the core of everything we do, from how we make our strong, sustainable steel to be the leader in solving their industries’ constantly evolving challenges. Our team, including engineersmarkets we serve.
We bring to every project a greater understanding of metallurgy and experienced manufacturing professionals in both materials and applications, works closelythe critical elements required for a quality product. We prioritize collaboration with our customers to ensure that the solutions we deliver flexible solutions relatedmeet their specifications and expectations. From design to delivery, and beyond, our products as well asknowledgeable customer service team supports the entire project lifecycle to keep our customers’ applicationscustomers informed and supply chains.preserve lasting partnerships.
3
The TimkenSteel business model delivers these
Special bar quality (SBQ) steel is our niche, and our capabilities extend into tubing and manufactured components. Our customers benefit from our expertise; over 70% of our sales representatives, account managers, and technical service team members have engineering backgrounds. We apply this knowledge through product design and investments in our manufacturing capabilities. We also care about our customers, and provide tailored solutions basedbuilt on the following foundation:a technical foundation through our:
Major Customers
We sell products and services that are used in a range of demanding applications around the world. We have overapproximately 350 diverse customers in the following market sectors:end-markets: industrial; automotive; oilaerospace & defense; and gas; industrial equipment; mining; construction; rail; defense; heavy truck; agriculture; power generation; and OCTG.energy. No one customer accounted for 10% or more of net sales in 2023.
Products
We believe we produce some of the cleanest, highest performing alloy air-melted steels in the world for our customers’ most demanding applications. We leverage our technical knowledge, development expertise and production and engineering capabilities across all of our products and market sectorsend-markets to deliver high-performance products to our customers.
SBQ Steel Bar, Seamless Mechanical Steel Tubes, and Billets. Our focus is on alloy steel, although in total we manufacture more than 400500 grades of high-performance alloy, carbon, micro-alloy and alloymicro-alloy steel, sold as ingots, bars, tubes and billets. These products are custom-made in a variety of chemistries, lengths and finishes. Our metallurgical expertise and what we believe to be unique operational capabilities drive high-value solutions for industrial, energyautomotive, aerospace & defense and mobileenergy customers. Our specialty steelsmetals are featured in a wide variety of end products including: gears; hubs; axles; crankshafts and connecting rods;motor shafts; oil country drill pipe; bits and collars; bearing races and rolling elements; bushings; fuel injectors; wind energy shafts; anti-friction bearings; artillery and mortar bodies; and other demanding applications where mechanical power transmission is critical to the end customer.
Manufactured Components. In addition to our customized steels, we also custom-make precision components that provide us with the opportunity to further expand our market for bar and tube products and capture additional sales. These products provide customers, especially those in the mobileautomotive end-market, sector, with ready-to-finish components that simplify vendor management, streamline supply chains and often cost less than other alternatives. We also customize products and services for the industrial, aerospace & defense and energy end-market sectors.end-markets.
Sales and Distribution
Our sales force is made up largely of engineers that are backed by a team of metallurgists and other technical experts. While most of our products are sold directly to original equipment ("OE") manufacturers, a portion of our sales are made through authorized distributors and steel service centers, representing approximately 22%25% of net sales during 2021.2023. The majority of our customers are served through individually negotiated price agreements.
Competition
The steel industry, both domestically and globally, is highly competitive and is expected to remain so. Maintaining high standards of asset reliability, product quality and reliability,customer service, while keeping production costs competitive, is essential to our ability to compete with domestic and foreign manufacturers of alloy steel and mechanical components. For bar products less than 6-inch in diameter, principal competitors includethe primary competitor is foreign-owned domestic producersproducer Gerdau Special Steel North America (a unit of Brazilian steelmaker Gerdau, S.A) and Republic Steel (a unit of Mexican steel producer ICH). For bar products up to 9-inch in diameter, domestic producers Steel Dynamics, Inc. and Nucor Corporation (in some cases up to 10-inch) are our principal competitors. For very large bars from 10 to 16 inches in diameter,
4
offshore producers as well as specialty forging companies in North America such as Scot Forge and Frisa are the primary competitors. For seamless mechanical tubing, offshore producers such as Tenaris, S.A., Vallourec, S.A. and TMK Group are our primary competitors, as well as the foreign-owned domestic producer ArcelorMittal Tubular Products (a unit of Luxembourg-based ArcelorMittal, S.A.). We also provide unique manufactured steel products and supply chain solutions to our customers in the mobile, industrial, automotive, aerospace & defense and energy end-market sectors.end-markets. Manufactured component competitors include both integrated and non-integrated component producers.
Lead Time
The lead time for our products varies based on product type and specifications. As of the date of this filing, our lead times for SBQ barsbar products currently extend to April and tubestube product lead times extend into the third quarter of 2022.
4
May 2024.
Raw Materials
The principal raw materials that we use to manufacture steel are recycled scrap metal, chrome, nickel, molybdenum oxide, vanadium and other alloy materials. Raw materials comprise a significant portion of the steelmaking cost structure and are subject to price and availability changes due to global demand fluctuations and local supply limitations. Proper selection and management of raw materials can have a significant impact on procurement cost, flexibility to supply changes, steelmaking energy costs, mill productivity and mill productivity.ability to adapt to supply chain constraints. In addition to accessing scrap and alloys through the open market, we have established a scrap return supply chain with many of our customers. This part of our business leverages our knowledge of the raw material supply industry and an extensive network of relationships that result in steady, reliable supply from our raw material sources.
ResearchIn the ordinary course of business, we are exposed to the volatility of the costs of our raw materials. For example, the impact of global conflicts could exacerbate inflationary pressures throughout the global economy and Developmentlead to potential market disruptions, such as significant volatility in commodity prices and supply chain disruptions. Although our business has not been materially impacted by current conflicts to date, it is difficult to predict the extent to which our operations, or those of our suppliers, will be impacted in the future.
Whenever possible, we manage our exposure to commodity risks primarily through the use of supplier pricing agreements that enable us to establish the purchase prices for certain inputs that are used in our manufacturing process. We also utilize a raw material and natural gas surcharge mechanism when pricing products to our customers.
There are two components of our raw material surcharge. One component is related to the scrap metal content in our finished product and is based on the published No. 1 busheling scrap index. The other component is related to alloy material content in our finished product and is based on published prices for nickel, molybdenum, vanadium, chrome, and manganese. The natural gas surcharge is only applicable when the price of natural gas exceeds a certain dollar amount per MMBtu.
Our engineers analyze customer application challenges and develop solutionssurcharge mechanisms are designed to addressmitigate the customers’ needs. Withimpact of increases or decreases in raw material costs, although generally with a centurylag effect. This timing effect can result in raw material spread whereby costs can be over- or under-recovered in certain periods. While the surcharge generally protects gross profit, it has the effect of experience in materials science and steelmaking, we leverage our technical know-how to improve the performancediluting gross margin as a percent of our customers’ products and supply chains.sales.
This expertise extends to advanced process technology in which material conversion, finishing, gaging and assembly enables high quality production of our products. With resources dedicated to studying, developing and implementing new manufacturing processes and technologies, we are able to support our customers’ requirements.Faircrest Melt Shop Unplanned Downtime
Our researchDuring the second half of 2022, the Faircrest melt shop experienced unplanned operational downtime. During the fourth quarter of 2022, the Company recognized an insurance recovery of $33.0 million related to the 2022 unplanned downtime, of which $13.0 million was received in the fourth quarter of 2022 and development expense$20.0 million was received in the first quarter of 2023. Additionally, during the third quarter of 2022, the Company recognized an insurance recovery of $1.5 million related to an unplanned outage at our Faircrest facility in November 2021.
During 2023, the Company recognized insurance recoveries of $31.3 million related to the 2022 Faircrest melt shop unplanned downtime, of which $11.3 million was received during 2023 and $20.0 million was received in the first quarter of 2024. The 2022 insurance claims were closed as of the first quarter of 2024.
For further information related to previous insurance recoveries, refer to "Note 7 - Other (Income) Expense, net" in the Notes to the Consolidated Financial Statements for the years ended December 31, 2021, 2020 and 2019 were $1.7 million, $1.8 million and $4.1 million, respectively.additional information.
5
Environmental Matters and Governmental Regulations
We consider compliance with environmental regulations and environmental sustainability a key strategic focus area and integral to our responsibility as a good corporate citizen. All our domestic steel making and processing operations, and our water treatment plant, have obtained and maintain ISO 14001 certification.
We believe we have established appropriate reserves to cover our environmental expenses. We have a well-established environmental compliance audit program that measures performance against applicable laws as well as against internal standards that have been established for all facilities. It is difficult to assess the possible effect of compliance with future requirements that differ from existing ones both domestically and internationally.
We have been identified as a potentially responsible partiesparty under the Clean Air Act ("CAA"), Clean Water Act ("CWA"), Toxic Substances Control Act ("TSCA"), the Resource Conservation and Recovery Act ("RCRA"), as well as other laws.
We continue to monitor regulations relevant to our Company to ensure we remain compliant. This includes, but is not limited to, regulations such as the CAA, CWA, TSCA, and the RCRA.
Additionally, we continue to monitor any future carbon regulation. On February 19, 2021, the U.S. rejoined the Paris Agreement, which includes pledging to reduce U.S. greenhouse gas ("GHG") emissions. To date, the U.S. Congress has not legislated carbon constraints on businesses. It is difficult to predict the possible effect of compliance with future requirements that differ from existing ones both domestically and internationally.
From time to time, we may be a party to lawsuits, claims or other proceedings related to environmental matters and/or receive notices of potential violations of environmental laws and regulations from the EPA and similar state or local authorities. We recorded reserves for such environmental matters of $0.2$0.6 million and $0.1 million as of both December 31, 20212023 and 2020.2022, respectively. Accruals related to such environmental matters represent management’s best estimate of the fees and costs associated with these matters. Although it is not possible to predict with certainty the outcome of such matters, management believes the ultimate disposition of these matters should not have a material adverse effect on our consolidated financial position, results of operations or cash flows.
Legal Proceedings
Information required by this section is incorporated herein by reference to “Item 3. Legal Proceedings.”
Patents, Trademarks and Licenses
While we own a number of U.S. and foreign patents, trademarks, licenses and copyrights, none are material to our products and production processes.
5
Governance and Environmental Stewardship
TimkenSteelMetallus is committed to promoting the long-term interests of shareholders and building public trust through good governance practices. We are committed to operating in accordance with the highest standards of ethics and integrity, and maintaining robust programs focused on compliance. WeTo ensure effective and responsive governance, we regularly review and update when necessary,our policies and procedures and the charters for our Board committees, and regularly evaluate director selection criteriaskills, qualifications, and procedures, board composition criteria, and various policies and procedures designed to ensure effective and responsive governance.experience.
The TimkenSteelMetallus Code of Conduct sets forth policies covering a broad range of subjects, including antitrust and competition, corruption and bribery, conflicts of interest, inside information, accurate financial records, harassment, environment, health and safety and intellectual property, among other matters, and requires strict adherence to laws and regulations applicable to the Company’s business. We have also adopted an insider trading policy, which prohibits insider trading in our securities while possessing material nonpublic information and applies to all employees, including officers and directors. In addition, in accordance with our Supplier Code of Conduct, we seek to work with suppliers that share our core values. We are also committed to the protection and advancement of human rights, as further described below under “Human Capital – Commitment to Human Rights.”
Our6
As part of our commitment to environmental stewardship, encompasses how we continuously seek to improve the efficiency and cleanliness of our electric arc furnace ("EAF")EAF operations while delivering quality projects and services that help our customers compete.succeed. We employ proactive environmental practices that focus on maintaining clean air, water and land, and comply with environmental rules and regulations. Innovation, collaboration and stakeholder engagement are embedded within our environmental programs. Our Board of Directors oversees our sustainability strategy, including receiving regular updates from senior leadership and reviewing sustainability-related risks and opportunities annually.
In October 2021, TimkenSteelthe Company announced environmental goals for 2030. The Company has established the following 2030 environmental goals, compared with a 2018 baseline:
The Company’s 2030 targets for greenhouse gasGHG emissions, energy consumption and fresh water withdrawn are based on an absolute or total reduction in the amount of greenhouse gasGHG emissions, energy consumption and fresh water withdrawn.withdrawn as compared to a 2018 baseline. In contrast, the Company’s waste-to-landfill target is based on an intensity or percentage reduction of waste-to-landfill per ton of steel shipped.shipped as compared to a 2018 baseline. All 2030 targets are based on the Company’s operating assets as of 2018 and do not account for any future inorganic growth or other expansion of itsthe Company's facilities or operating assets, for which an adjustment to the absolute reduction may be required. The Company selected 2018 as the baseline year as it aligns with the baseline used in the Company’s Sustainability Accounting Standards Board (SASB) disclosure. Following the publication of steel sector guidance and standards in 2023 by the Global Steel Climate Council (GSCC), the Company has evaluated its existing goals and performance. The Company intends to submit a science-based target aligned with the GSCC's Steel Climate Standard for validation by an accredited third-party organization, which may result in refreshed environmental goals.
During 2021, we did not have significant spend on capital expenditures related to environmental, social, and governance ("ESG") projects. Beginning in 2022, weWe have allocated approximately $3 million of capital expenditures per year through 2030 to achieve our long-term ESG goals.
sustainability goals, including safety- and environmental-related projects. In 2023, actual capital expenditure spend was approximately $4 million related to these initiatives, which primarily related to safety projects.
Learn more about our governance and environmental stewardship on the Corporate ResponsibilitySustainability section of our website at www.timkensteel.com.www.metallus.com.
Human Capital
Employment
At December 31, 2021,2023, we had approximately 1,8501,840 employees, with approximately 63%64% of our employees covered under a collective bargaining agreement.
On October 29, 2021, the United Steelworkers ("USW") Local 1123 voted to ratify a new four-year contract (the “Contract”). The Contract, which is in effect until September 27, 2025, offers TimkenSteel'sprovides Metallus' Canton-based bargaining employees an increase to base wages every year, competitive healthcare and retirement benefits for all members, and hasas well as a continued focus on employee wellbeing as well as safe and sustainable operations. The Contract covers approximately 1,170 bargaining employees at the Company’s Canton, Ohio operations.
Health and safety
At TimkenSteel, operating safelyMetallus, our core value of Safety First expresses our belief that the health and responsibly remainswell-being of our fellow employees is essential to our ability to achieve our mission to be an industry-leading provider of high-quality specialty metals and to deliver exceptional value for our customers, employees and investors. Building and maintaining a critical priority. culture of safety empowers each of us as individuals, and collectively as a Company, to successfully grow. Our commitment to safety is rooted in the recognition that our personal actions affect the safety and performance of others. This sense of responsibility drives engagement through increased
7
awareness of the vital role each team member plays in promoting a safe work environment while maintaining our commitment to best-in-class quality in our processes and products.
We recognize the need and are committed to improving the Company's safety culture. During 2022, we introduced new safety training focused on the core elements of improving the safety culture and performance while helping to understand the direct impact human factors have rigorouson all of us. In 2023, we built on this foundation with additional training regarding human factors which positively influence safety, policiesperformance and practices, which are supported by education,reliability outcomes. We invested approximately $10 million in 2023 in Company-wide safety training, evaluationequipment and enforcement,improved safety processes in an effort to ensure that our workspaces providewe are creating a secure environment for our employees.lasting culture of safety. We expect to invest approximately $7 million in 2024 to further expand these efforts. To reinforce the importance of operating safely and responsibly, a safety modifiermetric (comprised of both leading and lagging indicators beginning in 2023) is included in our annual incentive compensation plan for all salaried employees. The safety modifier is applied to the total calculated payout, resulting in a five percent increase or decrease against the payout calculation depending on whether the target safety metrics are achieved. For the year ended December 31, 2021, the target safety metrics were not achieved, resulting in the application of a five percent decrease against the total payout calculation.
6
DiversityBelonging and inclusion
Our commitmentAt Metallus, we believe our people are our strongest assets. Creating an atmosphere that provides a sense of belonging and inclusion are fundamental to diverseour strategic imperative to attract and retain top talent. We foster a culture that lends a variety of perspectives fuelsand expertise to our successoperations and has enabled us to deliver innovate solutions throughoutreflects the life of our business.communities in which we operate. We recognize that a diverse workforce and an inclusive, engaging culture has enabled us to deliver innovative solutions throughout the life of our business and is key to our continued business success. Within our organization, we maintain employee resource groups (ERGs) which further promote diversitybelonging and inclusion. TimkenSteelWe have an advisory council comprised of senior leaders in the Company and the executive sponsors of our ERGs to help establish priorities to advance the Company's objectives. In 2023, our ERGs expanded their programming and employee engagement with the support of the advisory council. Metallus is also proudly involved in several organizations that promote and foster diversitybelonging and inclusion in our community and industry.
Compensation and total rewards
We provide competitive compensation programs to help meet the needs of our employees. Our programs are designed to support the profitable growth of our business; attract, reward, and retain the talent we need to succeed; support the health and overall well-being of our employees; and reinforce a performance-based culture.
In addition to base compensation, we offer quarterly and annual incentive compensation, stock awards, and participation in various retirement plans. Furthermore, ourOur Company also provides employer-sponsored health and wellness benefits to our employees.
Employee retention
We seek to retain the best people by providing them with opportunities to grow, build skills and be appreciated for their contributions as they work to serve our customers. We are committed to living our Core Values and building a culture that embodies the principles of our Cultural Framework.
Core Values | Cultural Framework | |
Safety First | Care | |
Customer Driven | Communicate | |
Best in Class Quality | Collaborate | |
Innovative and Collaborative | Follow-Through | |
Ethical and Responsible | Follow-Up |
Our employees are critical to our success and are the reason we are able to execute at a high level. We believe a continuous focus on Company culture and employee engagement will help us provide high quality products to our customers. In 2023, we conducted quarterly surveys to gather insight into the level of employee engagement at Metallus and other factors that contribute to a successful workplace. These surveys help to ensure we are continuously listening to our employees and measuring our progress. We regularly communicate with our employees regarding survey results and actions being taken in response.
We diligently track our employee retention and management regularly evaluates our employees’ retention risk. For several years, the Company has aimed to maintain a voluntary turnover rate of 8% or less. For 2021, primarily as the result of a competitive labor market,2023, we ended the year with aan overall voluntary turnover rate of approximately 9%.8.9 percent, comprised of approximately 7.5 percent for
8
salaried and approximately 9.5 percent for hourly employees. This compares to an overall voluntary turnover rate of approximately 16 percent in 2022 and 10 percent in 2021. The voluntary turnover rate in 2023 was driven primarily by normal retirements and a continuing competitive labor market.
Employee training and development
At Metallus, we believe that our vision moves us forward and our people drive our success. That is why it is a core component of our strategy to invest in talent and leadership development at all levels of the Company. We invest significant resources to develop talent with the right capabilities to deliver the growth and innovation needed to support our business strategy. In 2023, we continued and expanded upon many of the programs first introduced in 2022 and aimed at developing leadership and other professional skills and capabilities, including Perpetual's High-Performing Teams, Thayer Leadership Principles, negotiation skills and supervisor training, as well as an apprentice program for mechanical and electric maintainers. We have designed curated training programs for employees at all levels in our SAP SuccessFactors learning software. For new managers, we have developed a rigorous trainingalso offer an educational reimbursement program to provide themassist employees with the resources needed to cultivate their skillset and aid them in becoming effective leaders in our business. TimkenSteelcost of obtaining certain undergraduate or graduate degrees. Metallus encourages our employees to constantly learn and grow and has aligned our performance management system to support this focus on continuous learning and development.
COVID-19 pandemicCommitment to Human Rights
At Metallus, we are committed to the onsetprotection and advancement of human rights. We recognize our responsibility for the COVID-19 pandemic, TimkenSteel was consideredCompany's culture and the impact our practices have on society as a whole. Being ethical and responsible at our core means that we believe in treating all people with dignity and respect, from our workplaces to our supply chain partners. Fundamental human rights go beyond any policy - they are inherent to all human beings, regardless of race, sex, nationality, ethnicity, religion or other status, and are embedded throughout our organization. As further detailed in our applicable policies, Metallus does not tolerate harassment or disrespect of an "essential business"individual for any reason, and therefore, we have continued to be fully operational and serving our customers while strictly following all public health directives to ensure the safetyforbid any form of child labor, forced labor or slavery, or human trafficking at any of our employees.facilities or within our supply chain. In 2023, Metallus published a new supplier code of conduct outlining our expectations for suppliers in the areas human rights, ethical business practices, responsible sourcing, environmental sustainability and information security. Our supplier code of conduct, along with standalone policies on human rights, child and forced labor, conflict minerals and human trafficking, can be found on the Sustainability page of our website at www.metallus.com. These policies, together with our Code of Conduct, include additional details regarding our commitment to human rights.
Our cross-functional pandemic response team continues to oversee and coordinate the Company’s overall response. The Company is committed to timely communications with our employees and their families as well as customers, suppliers and other key stakeholders of TimkenSteel.
We continue to take several necessary actions to keepMore information on Metallus' corporate responsibility can be found on the Sustainability page of our workforce safe. While onsite, employees follow strict safe workplace practices including guidelines established by federal, state and local authorities for the areas in which we operate. We continue to use enhanced cleaning procedures in all plants and offices using the best practices provided by the Centers for Disease Control and Prevention ("CDC")website at www.metallus.com. It is strongly encouraged that employees be vigilant with their personal hygiene and workplace hygiene and we regularly communicate the requirement for wearing of masks and that no one should come to work sick. To help reinforce these safety measures, we work closely with the USW. The Company also utilizes its onsite medical clinic - operated by a local health system - to provide additional support to its employees during the crisis. Since the onset of the COVID-19 pandemic, TimkenSteel has performed hundreds of audits in its plants to ensure its employees remain diligent in these efforts.
Available Information
We use our Investor Relations website at http://investors.timkensteel.com,investors.metallus.com, as a channel for routine distribution of important information, including news releases, analyst presentations and financial information. We post filings (including our annual, quarterly and current reports on Forms 10-K, 10-Q and 8-K, respectively; our proxy statements; and any amendments to those reports or statements) as soon as reasonably practicable after they are electronically filed with, or furnished to, the Securities and Exchange Commission ("SEC"). All such postings and filings are available on our website free of charge. In addition, our website allows investors and other interested persons to sign up to automatically receive e-mail alerts when we post news releases and financial information on our website. The SEC also maintains a website, www.sec.gov, which contains reports, proxy and information statements and other information regarding issuers that file electronically with the SEC. The contentinformation contained on or accessible through, including any reports available on, our website, or on any other website referred to in this Annual Report on Form 10-K is not incorporated by reference intointo this Annual Report unless expressly noted.
79
Item 1A. Risk Factors
The following are certain risk factors that could affect our business, financial condition and results of operations. The risks that are highlighted below are not the only ones we face. You should carefully consider each of the following risks and all of the other information contained in this Annual Report on Form 10-K. Some of these risks relate principally to our business and the industry in which we operate, while others relate principally to our debt, the securities markets in general, and ownership of our common shares. If any of the following risks actually occur, our business, financial condition or results of operations could be negatively affected.
Risks Relating to Our Industry and Our Business
Competition in the steel industry, together with potential global overcapacity, could result in significant pricing pressure for our products.
Competition within the steel industry, both domestically and worldwide, is intense and is expected to remain so. The steel industry has historically been characterized by periods of excess global capacity and supply. Excess global capacity and supply has negatively affected and could continue to negatively affect domestic steel prices, which could adversely impact our results of operations and financial condition. High levels of steel imports into the U.S. could exacerbate a decrease in domestic steel prices.
In an effort to protect the domestic steel industry, the United States government continues to implementmaintain tariffs, duties and quotas for certain steel products imported from a number of countries into the United States. As these tariffs, duties and quotas continue to change, or are repealed, it could result in substantial imports of foreign steel and create pressure on United States steel prices and the overall industry. This could have a material adverse effect on our operations.
Weakness in global economic conditions or in any of the industries or geographic regions in which we or our customers operate, as well as the cyclical nature of our customers’ businesses generally or sustained uncertainty in financial markets, could adversely impact our revenues and profitability by reducing demand and margins.
Our results of operations may be materially affected by conditions in the global economy generally and in global capital markets. There has been volatility in the capital markets and in the market sectors and geographic regions in which we or our customers operate, which has negatively affected our revenues. Many of the markets in which our customers participate are also cyclical in nature and experience significant fluctuations in demand for our steel products based on economic conditions, consumer demand, raw material and energy costs, and government actions, and many of these factors are beyond our control.
A decline in consumer and business confidence and spending, together with severe reductions in the availability and increased cost of credit, as well as volatility in the capital and credit markets, could adversely affect the business and economic environment in which we operate and the profitability of our business. We also are exposed to risks associated with the creditworthiness of our suppliers and customers. If the availability of credit to fund or support the continuation and expansion of our customers’ business operations is curtailed or if the cost of that credit is increased, the resulting inability of our customers or of their customers to either access credit or absorb the increased cost of that credit could adversely affect our business by reducing our sales or by increasing our exposure to losses from uncollectible customer accounts. These conditions and a disruption of the credit markets could also result in financial instability of some of our suppliers and customers. The consequences of such adverse effects could include the interruption of production at the facilities of our customers, the reduction, delay or cancellation of customer orders, delays or interruptions of the supply of raw materials or other inputs we purchase, and bankruptcy of customers, suppliers or other creditors. Any of these events could adversely affect our profitability, cash flow and financial condition.
We are dependent on our key customers.
As a result of our dependence on our key customers, we could experience a material adverse effect on our business, financial condition and results of operations if any of the following, among other things, were to occur: (a) a loss of any key customer, or a material amount of business from such key customer; (b) the insolvency or bankruptcy of any key customer; (c) a declining market in which customers reduce orders; or (d) a strike or work stoppage at a key customer facility, which could affect both its suppliers and customers. For the year ended December 31, 2021,2023, sales to our 10 largest customers accounted for approximately 44%46% of our net sales. Additionally, customers continue to demand stronger and lighter products, among other adaptations to traditional products. We may not be successful in meeting these technological challenges and there may be increased liability exposure connected with the supply of additional products and services.
Any change in the operation of our raw material surcharge mechanisms, a raw material market index or the availability or cost of raw materials could materially affect our revenues, earnings, and cash flows.
We require substantial amounts of raw materials, including scrap metal and alloys, to operate our business. The majority of our customer agreements contain surcharge pricing provisions that are designed to enable us to recover raw material cost increases. The surcharges are generally tied to a market index for that specific raw material. Historically, many raw material market indices have reflected significant fluctuations. Any change in a raw material market index could materially affect our revenues. Any change in the relationship between the
8
market indices and our underlying costs could materially affect our revenues, earnings, and cash flow. Additionally, fluctuation in the cost of certain alloys not covered by a raw material surcharge could materially affect outour revenues, earnings, and cash flow.
We rely on third parties to supply certain raw materials that are critical to the manufacture of our products. Purchase prices and availability of these critical raw materials are subject to volatility. At any given time we may be unable to obtain an adequate supply of these critical raw materials on a timely basis, on acceptable price and other terms, or at all. If suppliers increase the price of critical raw materials, we may not have alternative sources of supply. In addition, to the extent we have quoted prices to customers and accepted customer orders or entered into agreements for products prior to purchasing necessary raw materials, we may be unable to raise the price of products to cover all or part of the increased cost of the raw materials.
10
The cost and availability of electricity and natural gas are also subject to volatile market conditions.
Steel producers like us consume large amounts of energy. We rely on third parties for the supply of energy resources we consume in our steelmaking activities. The prices for and availability of electricity, natural gas, oil and other energy resources are also subject to volatile market conditions, often affected by weather conditions as well as political and economic factors beyond our control. Any increase in the prices for electricity, natural gas, oil and other energy resources could materially affect our costs and therefore our earnings and cash flows.
As a large consumer of electricity and gas, we must have dependable delivery in order to operate. Accordingly, we are at risk in the event of an energy disruption. Prolonged black-outs or brown-outs or disruptions caused by natural disasters or governmental action would substantially disrupt our production.
Moreover, many of our finished steel products are delivered by truck. Unforeseen fluctuations in the price of fuel would also have a negative impact on our costs or on the costs of many of our customers.
In addition, changes in certain environmental laws and regulations, including those that may impose output limitations or higher costs associated with climate change or greenhouse gas emissions, could substantially increase the cost of manufacturing and raw materials, such as energy, to us and other U.S. steel producers.
Unexpected equipment failures or other disruptions of our operations may increase our costs and reduce our sales and earnings due to production curtailments or shutdowns.
Interruptions in production capabilities would likely increase our production costs and reduce sales and earnings for the affected period. In addition to equipment failures, our facilities and information technology systems are also subject to the risk of catastrophic loss due to unanticipated events such as fires, explosions or violent weather conditions. Our manufacturing processes are dependent upon critical pieces of equipment for which there may be only limited or no production alternatives, such as furnaces, continuous casters and rolling equipment, as well as electrical equipment, such as transformers, and this equipment may, on occasion, be out of service as a result of unanticipated failures. In the future, we may experience material plant shutdowns or periods of reduced production as a result of these types of equipment failures, which could cause us to lose or prevent us from taking advantage of various business opportunities or prevent us from responding to competitive pressures. There can be no assurance that our insurance coverage for these types of events will be adequate or continue to be available on terms acceptable to us.
Our operating results depend in part on continued successful research, development and marketing of products and services.
The success of products and services depends on their initial and continued acceptance by our customers. Our business is affected, to varying degrees, by technological change and corresponding shifts in customer demand, which could result in unpredictable product transitions or shortened life cycles. We may experience difficulties or delays in the research, development, production, or marketing of products and services that may prevent us from recouping or realizing a return on the investments required to bring products and services to market.
New technologies in the steel industry may: (a) improve cost competitiveness; (b) increase production capabilities; or (c) improve operational efficiency compared to our current production methods. However, we may not have sufficient capital to invest in such technologies or to make certain capital improvements, and may, from time to time, incur cost over-runs and difficulties adapting and fully integrating these technologies or capital improvements into our existing operations. We may also encounter control or production restrictions, or not realize the cost benefit from such capital-intensive technology adaptations or capital improvements to our current production processes.
Product liability, warranty and product quality claims could adversely affect our operating results.
We produce high-performance carbon and alloy steel, sold as ingots, bars, tubes and billets in a variety of chemistries, lengths and finishes designed for our customers’ demanding applications. Failure of the materials that are included in our customers’ applications could give rise to product liability or warranty claims. There can be no assurance that our insurance coverage will be adequate or continue to be available on terms acceptable to us. If we fail to meet a customer’s specifications for its products, we may be subject to product quality costs and claims. A successful warranty or product liability claim against us could have a material adverse effect on our earnings.
We are subject to extensive environmental, health and safety laws and regulations, which impose substantial costs and limitations on our operations. Future environmental, health and safety compliance may include additional requirements related to sustainability, climate change, and greenhouse gas emissions, and be more costly than we expect.
We are subject to extensive federal, state, and local environmental, health and safety laws and regulations concerning matters such as worker health and safety, air emissions, wastewater discharges, hazardous material and solid and hazardous waste use, generation, handling, treatment and disposal and the investigation and remediation of contamination. We are subject to the risk of
11
substantial liability and limitations on our operations due to such laws and regulations. The risks of substantial costs and liabilities related to compliance with these laws and regulations, which tend to become more stringent over time, are an inherent part of our business, and future conditions may develop, arise or be discovered that create substantial environmental compliance or remediation or other liabilities and costs.
Compliance with environmental, health and safety legislation and regulatory requirements may prove to be more limiting and costly than we anticipate. To date, we have committed significant expenditures in our efforts to achieve and maintain compliance with these requirements, and we expect that we will continue to make significantthese expenditures related to such compliance in the future. From time to time, we may be subject to legal proceedings brought by private parties or governmental authorities with respect to environmental matters, including matters involving alleged contamination, property damage or personal injury. New laws and regulations, including those that may relate to emissions of greenhouse gases, stricter enforcement of existing laws and regulations, the discovery of previously unknown contamination or the imposition
9
of new clean-up requirements, could require us to incur costs or become the basis for new or increased liabilities that could have a material adverse effect on our business, financial condition or results of operations.
We may also see an increase in costs relating to our steelmaking assets that emit relatively significant amounts of greenhouse gases as a result of new and existing legal and regulatory initiatives related to climate change. The United States government and various government agencies have introduced or are considering regulatory changes in response to climate change, including regulations aimed at reducing greenhouse gases through emissions standards, renewable energy targets, carbon emission pricing, and similar initiatives, and requiring heightened environmental monitoring and disclosures. These initiatives aimed at reducing greenhouse gas emissions may impact our operations directly or through our suppliers or customers, including increased environmental reporting, emissions control, capital equipment, energy, and other costs to comply. Any future climate change and greenhouse gas regulations could negatively impact our ability (and that of our customers and suppliers) to compete with companies situated in areas not subject to such regulations. Until the timing, scope and extent of any future legal and regulatory initiatives become known, we cannot predict the effect on our business, financial condition or results of operations.
While we are taking steps to significantly reduce our greenhouse gas emissions, there is no guarantee that we will be able to achieve our goals. Additionally, any costs related to the reduction of greenhouse gas emissions may be higher than we anticipated.
Our business is capital-intensive,Product liability, warranty and if there are downturns in the industries we serve, we may be forced to significantly curtail or suspend operations with respect to those industries, which could result in our recording asset impairment charges or taking other measures that may adversely affect our results of operations and profitability.
Our business operations are capital-intensive. If there are downturns in the industries we serve, we may be forced to significantly curtail or suspend our operations with respect to those industries, including laying-off employees, recording asset impairment charges and other measures. In addition, we may not realize the benefits or expected returns from announced plans, programs, initiatives and capital investments. Any of these eventsproduct quality claims could adversely affect our operating results.
We produce high-performance carbon and alloy steel, sold as bars, tubes and billets in a variety of chemistries, lengths and finishes designed for our customers’ demanding applications. Failure of the materials that are included in our customers’ applications could give rise to product liability or warranty claims. If we fail to meet a customer’s specifications for its products, we may be subject to product quality costs and claims. A successful warranty or product liability claim against us could have a material adverse effect on our business ,financial condition and results of operations and profitability.
The cost and availability of electricity and natural gas are also subject to volatile market conditions.
Steel producers like us consume large amounts of energy. We rely on third parties for the supply of energy resources we consume in our steelmaking activities. The prices for and availability of electricity, natural gas, oil and other energy resources are also subject to volatile market conditions, often affected by weather conditions as well as political and economic factors beyond our control. Any increase in the prices for electricity, natural gas, oil and other energy resources could materially affect our costs and therefore our earnings and cash flows.
As a large consumer of electricity and gas, we must have dependable delivery in order to operate. Accordingly, we are at risk in the event of an energy disruption. Prolonged black-outs or brown-outs or disruptions caused by natural disasters or governmental action would substantially disrupt our production.
Moreover, many of our finished steel products are delivered by truck. Unforeseen fluctuations in the price of fuel would also have a negative impact on our costs or on the costs of many of our customers.
In addition, changes in certain environmental laws and regulations, including those that may impose output limitations or higher costs associated with climate change or greenhouse gas emissions, could substantially increase the cost of manufacturing and raw materials, such as energy, to us and other U.S. steel producers.operations.
Work stoppages or similar difficulties could significantly disrupt our operations, reduce our revenues and materially affect our earnings.
A work stoppage at one or more of our facilities could have a material adverse effect on our business, financial condition and results of operations. As of December 31, 2021,2023, approximately 63%64% of our employees were covered under a collective bargaining agreement that expires in September 2025. Any failure to negotiate and conclude a new collective bargaining agreement with the union when the existing agreement expires could cause work interruptions or stoppages. Also, if one or more of our customers were to experience a work stoppage, that customer may halt or limit purchases of our products, which could have a material adverse effect on our business, financial condition and results of operations.
A significant portion of our manufacturing facilities are located in Stark County, Ohio, which increases the risk of a significant disruption to our business as a result of unforeseeable developments in this geographic area.
It is possible that we could experience prolonged periods of reduced production due to unforeseen catastrophic events occurring in or around our manufacturing facilities in Stark County, Ohio. As a result, we may be unable to shift manufacturing capabilities to
12
alternate locations, accept materials from suppliers, meet customer shipment deadlines or address other significant issues, any of which could have a material adverse effect on our business, financial condition or results of operations.
10
We have significant pension and retiree health care costs, as well as future cash contribution requirements, which may negatively affect our results of operations and cash flows.
We maintain retiree health care and defined benefit pension plans covering many of our domestic employees and former employees upon their retirement. These benefit plans have significant liabilities that are not fully funded, which will require additional cash funding in future years. Minimum contributions to domestic qualified pension plans are regulated under the Employee Retirement Income Security Act of 1974 ("ERISA") and the Pension Protection Act of 2006 ("PPA").
The level of cash funding for our defined benefit pension plans in future years depends upon various factors, including voluntary contributions that we may make, future pension plan asset performance, actual interest rates, union negotiated benefit changes, future government regulations, and other factors, many of which are not within our control. In addition, assets held by the trusts for our pension plan and our trust for retiree health care and life insurance benefits are subject to the risks, uncertainties and variability of the financial markets. See “Note 15 - Retirement and Postretirement Plans” in the Notes to the Consolidated Financial Statements for a discussion of assumptions and further information associated with these benefit plans.
Our business is capital-intensive, and if there are downturns in the industries we serve, we may be forced to significantly curtail or suspend operations with respect to those industries, which could result in our recording asset impairment charges or taking other measures that may adversely affect our results of operations and profitability.
Our business operations are capital-intensive. If there are downturns in the industries we serve, we may be forced to significantly curtail or suspend our operations with respect to those industries, including laying-off employees, recording asset impairment charges and other measures. In addition, we may not realize the benefits or expected returns from announced plans, programs, initiatives and capital investments. Any of these events could adversely affect our results of operations and profitability.
We may incur restructuring and impairment charges that could materially affect our profitability.
Changes in business or economic conditions, or our business strategy, may result in actions that require us to incur restructuring and impairment charges in the future, which could have a material adverse effect on our earnings. For additional information on current restructuring and impairment charges, refer to “Note 5 - Restructuring Charges” and “Note 6 - Disposition of Non-Core Assets” in the Notes to Consolidated Financial Statements.
Our abilityWe may not be able to useexecute successfully on our net operating loss, interest, and credit carryforwards to offset future taxable income may be subject to certain limitations.strategic imperatives or achieve the intended results.
AsOur strategic imperatives are centered around people, profitability, process improvement, business development, and sustainability. These focus areas are intended to drive sustainable through-cycle profitability while maintaining a strong balance sheet and cash flow. If we are unsuccessful in executing on our strategic imperatives, it could negatively impact profitability and liquidity, requiring us to alter our strategy.
Expectations relating to environmental, social and governance (“ESG”) matters and/or our reporting of December 31, 2021, we have loss carryforwards totaling $224.6 million (of which $164.2 million relatessuch matters could expose us to the U.S. and $60.4 million relates to various non-U.S. jurisdictions), having various expiration dates, as well as certain credit carryforwards. The majority of the non-U.S. loss carryforwards represent local country net operating losses for entities treated as branches of TimkenSteel under U.S. tax law. Operating losses generated in the U.S. resulted in a decrease in the carrying value of our U.S. deferred tax liability to the point of a net U.S. deferred tax asset at December 31, 2016. At that time, we assessed, based upon operating performance in the U.S. and industry conditions that it was more likely than not we would not realize a portion of our U.S. deferred tax assets. The Company recorded a valuation allowance in 2016 and remained in a valuation allowance position in 2021. Going forward, the need to maintain valuation allowances against deferred tax assets in the U.S.potential liabilities, increased costs, reputational harm and other affected countries will cause variability innegative impacts on our effective tax rate. We will maintain a valuation allowance against our deferred tax assets in the U.S.business.
There is an increasing focus from investors, customers, employees, and applicable foreign countries until sufficient positive evidence existsother stakeholders concerning sustainability and ESG matters, and an increasing number of investors and customers are requiring companies to eliminate them.disclose sustainability and ESG policies, practices and metrics. Our abilitycustomers may require us to utilize our net operating loss, interest,implement sustainability and credit carryforwards is dependent upon our ability toESG responsibility procedures or standards before they continue to generate taxable income in future periodsdo business with us. In addition, some investors use ESG criteria to guide their investment strategies, and may be limited duenot invest in us, or divest their holdings of us, if they believe our policies relating to restrictions imposedESG matters are inadequate or, on utilizationthe other hand, have a negative response to such policies as a result of net operating loss, interest, and credit carryforwards under federal and state laws. We continue to monitor any changes within these tax laws for any additional limitations or impacts that they could have on our Company. Refer to “Note 8 - Income Tax Provision” in the Notes to the Consolidated Financial Statements for more information.
Section 382 and Section 383 of the Internal Revenue Code of 1986, as amended (the "Code"), provide an annual limitation on our ability to utilize our U.S. net operating loss and credit carryforwards against future U.S. taxable incomeanti-ESG sentiment. Additionally, we may face reputational challenges in the event that our sustainability and ESG policies, practices and metrics do not meet the standards set by certain constituencies, which are often inconsistent in approach. Furthermore, standards for tracking and reporting on sustainability and ESG matters have not been harmonized and continue to evolve. Our processes and controls for reporting of asustainability and ESG matters may not always comply with evolving and disparate standards for identifying,
13
measuring, and reporting such metrics, our interpretation of reporting standards may differ from those of others, and such standards may change in ownership, as defined in the Code,over time, any of which could result from onein significant revisions to our performance metrics, goals or more transactions involving our shares, including transactions that are outsidereported progress in achieving such goals. There can be no assurance of the extent to which any of our control, as well as the issuanceESG targets and goals will be achieved, if at all; we could fail, or be perceived to fail, in our achievement of shares upon conversion ofany such initiatives, targets or goals, or we could fail in fully and accurately reporting our 6.00% Convertible Senior Notes due 2025 ("Convertible Senior Notes due 2025"). Accordingly,progress on any such transactionsinitiatives, targets and goals. Any failure, or perceived failure, by us to achieve our goals, further our initiatives, adhere to our public statements, comply with federal, state or international ESG laws and regulations, or meet evolving and varied stakeholder expectations and standards could adversely impact our ability to offset future tax liabilitiesresult in legal and therefore,regulatory proceedings against us and materially adversely affect our business, reputation, results of operations, financial condition net income and cash flow. Referstock price.
We may not be able to “Note 14 - Financing Arrangements”complete or successfully integrate future acquisitions into our business, which could adversely affect our business and results of operations
We intend to consider growth opportunities through the acquisition of assets or companies and routinely review acquisition opportunities. We cannot predict whether we will be successful in identifying suitable acquisition candidates or pursuing acquisition opportunities or whether we will be able to achieve the strategic and other objectives related to such acquisitions. Acquisitions involve numerous risks, including difficulty determining appropriate valuation, integrating operations, information systems, technologies, services and products of the acquired product lines or business, personnel turnover, and the diversion of management’s attention from other business matters. Depending upon the nature, size, and timing of future acquisitions, we may be required to raise additional financing. Further, we may not be able to successfully integrate any acquired business with our existing businesses or recognize the expected benefits from a completed acquisition in the Notes to the Consolidated Financial Statements for more information.timeframe that we anticipate, or at all, which could adversely affect our business and results of operations.
Risks Related to Our Debt
Deterioration in our asset borrowing base could adversely affect our financial health and restrict our ability to borrow necessary cash to support the needs of our business and fulfill our pension obligations.
As of December 31, 2021,2023, we had outstanding debt of approximately $46.0 million. Our debt may:
11total liquidity was $539.4 million.
If our asset borrowing base, cash flows, and capital resources are insufficient to fundsupport the needs of our debt service obligations,business, we may be forced to reduce or delay investments and capital expenditures, or to sell assets, seek additional capital or restructure or refinance our debt. These alternative measures may not be successful and may not permit us to meet our scheduled debt service obligations. If our operating results and available cash are insufficient to meet our debt service obligations, we could face substantial liquidity problems andthat might be required to dispose of material assets or operations to meet our debt service and other obligations. We may not be able to consummate those dispositions or to obtain the proceeds that we could realize from them, and these proceeds may not be adequate to meet any debt service obligations then due. Further, we may needrequire us to refinance all or a portion of our debt on or before maturity, and we cannot assure you that we will be able to refinance any of our debt on commercially reasonable terms or at all.
Restrictive covenants in the agreements governing our indebtedness may restrict our ability to operate our business, which may affect the market price of our common shares.
On October 15, 2019,September 30, 2022, the Company, as borrower, and certain domestic subsidiaries of the Company, as subsidiary guarantors (the “Subsidiary Guarantors”), entered into a ThirdFourth Amended and Restated Credit Agreement (the "Amended“Amended Credit Agreement"Agreement”), with JP MorganJPMorgan Chase Bank, N.A., as administrative agent (the "Administrative Agent"“Administrative Agent”), Bank of America, N.A., as syndication agent, and the other lenders party thereto (collectively, the "Lenders"“Lenders”), which further amended and restated the Company’s existingsecured Third Amended and Restated Credit Agreement, dated as of January 26, 2018.October 15, 2019.
A breach of any of our covenants in the agreements governing our indebtedness could result in a default, which could allow the lenders to declare all amounts outstanding under the applicable debt immediately due and payable and which may affect the market price of our common shares. We may also be prevented from taking advantage of business opportunities that arise because of the limitations imposed on us by the restrictive covenants under our indebtedness. Refer to “Note 14 - Financing Arrangements” in the Notes to the Consolidated Financial Statements for more detail on the Amended Credit Agreement.
14
The conditional conversion feature of the Convertible Notes, if triggered, may adversely affect our financial condition and operating results.
In the event the conditional conversion feature of the Convertible Notes (refer to “Note 14 - Financing Arrangements” in the Notes to the Consolidated Financial Statements) is triggered, holders of Convertible Notes will be entitled to convert the Convertible Notes at any time during specified periods at their option. If one or more holders elect to convert their Convertible Notes, unless we elect to satisfy our conversion obligation by delivering solely our common shares (other than paying cash in lieu of delivering any fractional share), we would be required to settle a portion or all of our conversion obligation through the payment of cash, which could adversely affect our liquidity. In addition, under certain circumstances, we could be required under applicable accounting rules to reclassify all or a portion of the outstanding principal of the Convertible Notes as a current rather than long-term liability, which would result in a material reduction of our net working capital.
Our capital resources may not be adequate to provide for all of our cash requirements, and we are exposed to risks associated with financial, credit, capital and banking markets.
In the ordinary course of business, we will seek to access competitive financial, credit, capital and/or banking markets. Currently, we believe we have adequate capital available to meet our reasonably anticipated business needs based on our historic financial performance, as well as our expected financial position. However, if we need to obtain additional financing in the future, to the extent our access to competitive financial, credit, capital and/or banking markets was to be impaired, our operations, financial results and cash flows could be adversely impacted.
12
Risks Related to Our Common Shares
The price of our common shares may fluctuate significantly.
The market price of our common shares may fluctuate significantly in response to many factors, including:
Many of the factors listed above are beyond our control. These factors may cause the market price of our common shares to decline, regardless of our financial condition, results of operations, business or prospects.
15
Conversion of the Convertible Notes may dilute ownership interest of our shareholders or may otherwise depress the market price of our common shares.
The conversion of some or all of the Convertible Notes may dilute the ownership interest of our shareholders. On conversion of the Convertible Notes, we have the option to pay or deliver, as the case may be, cash, common shares, or a combination of cash and common shares. If we elect to settle our conversion obligation in common shares or a combination of cash and common shares, this could adversely affect prevailing market prices over our common shares.
We may issue preferred shares with terms that could dilute the voting power or reduce the value of our common shares.
Our articles of incorporation authorize us to issue, without the approval of our shareholders, one or more classes or series of preferred shares having such designation, powers, preferences and relative, participating, optional and other special rights, including preferences over our common shares respecting dividends and distributions, as our Board of Directors generally may determine. The terms of one or more classes or series of preferred shares could dilute the voting power or reduce the value of our common shares. For example, we could grant holders of preferred shares the right to elect some number of our directors in all events or on the happening of specified events or the right to veto specified transactions. Similarly, the repurchase or redemption rights or liquidation preferences we could assign to holders of preferred shares could affect the residual value of the common shares.
Provisions in our corporate documents and Ohio law could have the effect of delaying, deferring or preventing a change in control of us, even if that change may be considered beneficial by some of our shareholders, which could reduce the market price of our common shares.
The existence of some provisions of our articles of incorporation and regulations and Ohio law could have the effect of delaying, deferring or preventing a change in control of us that a shareholder may consider favorable. These provisions include:
13
As an Ohio corporation, we are subject to Chapter 1704 of the Ohio Revised Code. Chapter 1704 prohibits certain corporations from engaging in a “Chapter 1704 transaction” (described below) with an “interested shareholder” for a period of three years after the date of the transaction in which the person became an interested shareholder, unless, among other things, prior to the interested shareholder’s share acquisition date, the directors of the corporation have approved the transaction or the purchase of shares on the share acquisition date.
After the three-year moratorium period, the corporation may not consummate a Chapter 1704 transaction unless, among other things, it is approved by the affirmative vote of the holders of at least two-thirds of the voting power in the election of directors and the holders of a majority of the voting shares, excluding all shares beneficially owned by an interested shareholder or an affiliate or associate of an interested shareholder, or the shareholders receive certain minimum consideration for their shares. A Chapter 1704 transaction includes certain mergers, sales of assets, consolidations, combinations and majority share acquisitions involving an interested shareholder. An interested shareholder is defined to include, with limited exceptions, any person who, together with affiliates and associates, is the beneficial owner of a sufficient number of shares of the corporation to entitle the person, directly or indirectly, alone or with others, to exercise or direct the exercise of 10% or more of the voting power in the election of directors after taking into account all of the person’s beneficially owned shares that are not then outstanding.
We are also subject to Section 1701.831 of the Ohio Revised Code, which requires the prior authorization of the shareholders of certain corporations in order for any person to acquire, either directly or indirectly, shares of that corporation that would entitle the
16
acquiring person to exercise or direct the exercise of 20% or more of the voting power of that corporation in the election of directors or to exceed specified other percentages of voting power. The acquiring person may complete the proposed acquisition only if the acquisition is approved by the affirmative vote of the holders of at least a majority of the voting power of all shares entitled to vote in the election of directors represented at the meeting, excluding the voting power of all “interested shares.” Interested shares include any shares held by the acquiring person and those held by officers and directors of the corporation.
We believe these provisions protect our shareholders from coercive or otherwise unfair takeover tactics by requiring potential acquirors to negotiate with our Board of Directors and by providing our Board of Directors with more time to assess any acquisition proposal, and are not intended to make our Company immune from takeovers. However, these provisions apply even if the offer may be considered beneficial by some shareholders and could delay, defer or prevent an acquisition that our Board of Directors determines is not in the best interests of our Company and our shareholders, which under certain circumstances could reduce the market price of our common shares.
Risks Related to COVID-19
The COVID-19 pandemic could have a material, adverse impact on our operations and financial results including cash flows and liquidity.
Although it is not possible to predict the ongoing impact of COVID-19, including on our business, results of operations, financial position or cash flows, such impacts that may be material include, but are not limited to: (i) reduced sales and profit levels; (ii) slower collection of accounts receivable and potential increases in uncollectible accounts receivable; (iii) increased operational risks as a result of manufacturing facility disruptions; (iv) delays and disruptions in the availability of and timely delivery of materials and components used in our operations, as well as increased costs for such material and components, and (v) increased cybersecurity risks including vulnerability to security breaches, information technology disruptions and other similar events as a result of a substantial number of employees utilizing remote work arrangements. We will continue to monitor the impact of the COVID-19 pandemic on our Company.
General Risk Factors
Weakness in global economic conditions or in any of the industries or geographic regions in which we or our customers operate, as well as the cyclical nature of our customers’ businesses generally or sustained uncertainty in financial markets, could adversely impact our revenues and profitability by reducing demand and margins.
Our results of operations may be materially affected by conditions in the global economy generally and in global capital markets. There has been volatility in the capital markets and in the end-markets and geographic regions in which we or our customers operate, which has negatively affected our revenues at times. Many of the markets in which our customers participate are also cyclical in nature and experience significant fluctuations in demand for our steel products based on economic conditions, consumer demand, raw material and energy costs, and government actions, and many of these factors are beyond our control.
A decline in consumer and business confidence and spending, together with severe reductions in the availability and increased cost of credit, as well as volatility in the capital and credit markets, could adversely affect the business and economic environment in which we operate and the profitability of our business. We also are exposed to risks associated with the creditworthiness of our suppliers and customers. If the availability of credit to fund or support the continuation and expansion of our customers’ business operations is curtailed or if the cost of that credit is increased, the resulting inability of our customers or of their customers to either access credit or absorb the increased cost of that credit could adversely affect our business by reducing our sales or by increasing our exposure to losses from uncollectible customer accounts. These conditions and a disruption of the credit markets could also result in financial instability of some of our suppliers and customers. The consequences of such adverse effects could include the interruption of production at the facilities of our customers, the reduction, delay or cancellation of customer orders, delays or interruptions of the supply of raw materials or other inputs we purchase, and bankruptcy of customers, suppliers or other creditors. Any of these events could adversely affect our profitability, cash flow and financial condition.
We may be subject to risks relating to our information technology systems and cybersecurity.
We rely on information technology systems to process, transmit and store electronic information and manage and operate our business. We face the challenge of supporting our older systems and implementing upgrades when necessary. Additionally, a breach in security could expose us and our customers and suppliers to risks of misuse of confidential information, manipulation and destruction of data, production downtimes and operations disruptions, which in turn could adversely affect our reputation, competitive position, business or results of operations. While we have taken reasonable steps to protect the Company from cybersecurity risks and security breaches (including enhancing our firewall, workstation, email security and network monitoring and alerting capabilities, and training employees around phishing, malware and other cybersecurity risks), and we have policies and procedures to prevent or limit the impact of systems failures, interruptions, and security breaches, there can be no assurance that such events will not occur or that they will be adequately addressed if they do.do occur. Although we rely on
14
commonly used security and processing systems to provide the security and authentication necessary to effect the secure transmission of data, these precautions may not protect our systems from all potential compromises or breaches of security.
We may not be able to execute successfully on our strategic imperatives or achieve the intended results.17
Our strategic imperatives are centered around people, profitability, process improvement, business development, and ESG. These focus areas are intended to drive sustainable through-cycle profitability while maintaining a strong balance sheet and cash flow. If we are unsuccessful in executing on our strategic imperatives, it could negatively impact profitability and liquidity, requiring us to alter our strategy.
If we are unable to attract and retain key personnel, our business could be materially adversely affected.
Our business substantially depends on the continued service of key members of our management. The loss of the services of a significant number of members of our management could have a material adverse effect on our business. Modern steel-making uses specialized techniques and advanced equipment that requires experienced engineers and skilled laborers. Our future success will depend on our ability to attract and retain such highly skilled personnel as well as finance, marketing and senior management professionals. Competition for these employees is intense, and we could experience difficulty from time to time in hiring and retaining the personnel necessary to support our business. Additionally, costs to attract and retain employees may be increased given the competitive labor market. If we do not succeed in retaining our current employees and attracting new high-quality employees, our business could be materially adversely affected.
We are subject to a wide variety of domestic and foreign laws and regulations that could adversely affect our results of operations, cash flow or financial condition.
We are subject to a wide variety of domestic and foreign laws and regulations, and legal compliance risks, including securities laws, tax laws, employment and pension-related laws, competition laws, U.S. and foreign export and trading laws, privacy laws and laws governing improper business practices. We are affected by new laws and regulations, and changes to existing laws and regulations, including interpretations by courts and regulators. With respect to tax laws, with the finalization of specific actions ("Actions") contained within the Organization for Economic Co-operation and Development’s ("OECD") Base Erosion and Profit Shifting study, many OECD countries have acknowledged their intent to implement the Actions and update their local tax regulations. The extent, if any, to which countries in which we operate adopt and implement the Actions could affect our effective tax rate and our future results from non-U.S. operations.
Compliance with the laws and regulations described above or with other applicable foreign, federal, state and local laws and regulations currently in effect or that may be adopted in the future could materially adversely affect our competitive position, operating results, financial condition and liquidity.
Pandemics, epidemics, widespread illness or other health issues could adversely affect the Company's operations and financial results, including cash flows and liquidity.
Although it is not possible to predict the impact of pandemics, epidemics, widespread illness or other health issues, on our business, results of operations, financial position or cash flows, such impacts that may be material include, but are not limited to: (i) reduced sales and profit levels; (ii) slower collection of accounts receivable and potential increases in uncollectible accounts receivable; (iii) increased operational risks as a result of manufacturing facility disruptions; (iv) delays and disruptions in the availability of and timely delivery of materials and components used in our operations, as well as increased costs for such material and components, and (v) increased cybersecurity risks including vulnerability to security breaches, information technology disruptions and other similar events as a result of a substantial number of employees utilizing remote work arrangements.
If our internal controls are found to be ineffective, our financial results or our stock price may be adversely affected.
Our most recent evaluation resulted in our conclusion that, as of December 31, 2021,2023, our internal control over financial reporting was effective. We believe that we currently have adequate internal control procedures in place for future periods. However, if our internal control over financial reporting is found to be ineffective, investors may lose confidence in the reliability of our financial statements, which may adversely affect our stock price.
Item 1B. Unresolved Staff Comments
None.
15Item 1C. Cyber Security
Our cybersecurity program is led by a team of skilled cybersecurity professionals, including dedicated internal cybersecurity resources and external advisors. In the normal course of business, we may collect and store sensitive information, including proprietary and confidential business information, trade secrets, intellectual property, sensitive third-party information and employee information. We maintain a robust cybersecurity incident response plan, which details the incident response procedures, tactical and strategic team membership, and points of contact related to the response processes. The Company also
18
maintains a detailed decision-tree-based playbook which is a supplement to the plan and focuses on specific types of incidents and the appropriate response steps. Cybersecurity is an important part of our Enterprise Risk Management (“ERM”) program, and the Company seeks to address cybersecurity risks through a comprehensive, cross-functional approach. The Company’s cybersecurity policies, standards, processes, and practices for assessing, identifying and managing material risks from cybersecurity threats and responding to cybersecurity incidents are fully integrated into the Company’s ERM program. The plan and playbook are structured to align with the National Institute of Standards and Technology (“NIST”) Cybersecurity framework practices. The plan and playbook are reviewed at least annually. In addition, we maintain insurance that includes cybersecurity coverage.
The Company adheres to a periodic, third-party facilitated testing exercise of the cybersecurity incident response plan and playbook with the Company's tactical and strategic team members. The teams are comprised of key members of the organization and external advisors who hold critical importance in the handling of cybersecurity events. The exercise covers response procedures for prevalent cybersecurity incidents including but not limited to phishing, third-party breaches, and a standard incident response process. The documentation helps leaders make appropriate, pre-planned decisions. To assist, appendices detailing generalized incident response checklists and workflows from the Cybersecurity & Infrastructure Security Agency ("CISA") and the NIST are referenced and used as a framework. Lastly, the response plans contain instructions on collecting and incorporating lessons learned after a successful identification and remediation of a security event. The information security team also works in partnership with the Company's internal audit team to review information technology-related internal controls with our external auditor as part of our overall internal controls process.
In light of the pervasive and increasing threat from cyberattacks, the Board of Directors, with input from management, assesses the measures implemented by us to mitigate and prevent cyberattacks. The Company’s Information Technology (“IT”) leadership team consults with and provides regular updates to the Board of Directors, as well as our chief executive officer and other members of our senior management team, as appropriate, on technology and cybersecurity matters, the status of projects to strengthen our information security systems, assessments of the information security program, timely reports regarding any cybersecurity incident that meets established reporting thresholds, and emerging threat landscape. In addition, the Company has an IT governance committee, which is comprised of the chief executive officer, IT and other officers of the Company. The IT governance committee meets quarterly, and as necessary, to discuss the cybersecurity program and other relevant topics. The IT team also consults regularly with the Board of Director’s cybersecurity expert in between meetings. Our program is evaluated by internal and external experts with the results of those reviews reported to senior management and the Board of Directors, at least semi-annually. The Board of Directors has oversight responsibility for our data security practices and we believe the Board of Directors has the requisite skills and awareness into the design and operation of our data security practices to fulfill this responsibility effectively.
As of the date of this report, we are not aware of any material risks from cybersecurity threats that have materially affected or are reasonably likely to materially affect the Company, including our business strategy, results of operations or financial condition.
See “Risk Factors – General Risk Factors” for additional information about the risks to our business associated with a breach or compromise to our information security systems.
Item 2. Properties
We are headquartered in Canton, Ohio, aton a facility we own in fee. We havecampus of owned facilities in two countries: U.S. and Mexico.that are adjacent to our steelmaking operations.
We have manufacturing facilities at multiple locations in the U.S.United States. These manufacturing facilities are located in Canton and Eaton, Ohio and Columbus, North Carolina. In addition to these owned manufacturing facilities, we own or lease warehouses anda distribution facilitiesfacility in the U.S. and Mexico. The aggregate floor area of these facilities is 3.6 million square feet, of which approximately twelve thousand square feet is leased and the rest is owned in fee.owned. The buildings occupied by us are principally made of brick, steel, reinforced concrete and concrete block construction.
19
Our facilities vary in age and condition, and each of them has an active maintenance program to ensure a safe operating environment and to keep the facilities in good condition. We believe our facilities are in satisfactory operating condition and are suitable and adequate to conduct our business and support future growth.
Please refer to Management’s Discussion and Analysis of Financial Condition and Results of Operations for further discussion of ourOur melt capacity utilization.utilization was 70%, 63% and 73% for the years ended December 31, 2023, 2022 and 2021, respectively.
Item 3. Legal Proceedings
We are involved in various claims and legal actions arising in the ordinary course of business. In the opinion of our management, the ultimate disposition of these matters will not have a material adverse effect on our consolidated financial position, results of operations or cash flows.
Item 4A.
20
Information about our Executive Officers of the Registrant
The executive officers of our Company as of February 24, 2022,28, 2024, are as follows:
Name |
| Age |
| Current Position |
Michael S. Williams |
|
|
| President and Chief Executive Officer |
Kristopher R. Westbrooks |
|
|
| Executive Vice President and Chief Financial Officer |
Kristine C. Syrvalin |
|
|
| Executive Vice President, General Counsel and |
Kevin A. Raketich |
|
|
| Executive Vice President |
Michael S. Williams is the President and Chief Executive Officer, of TimkenSteel Corporation, a position he has held since January 2021. Previously, Mr. Williams served as CEO of Bayou Steel Group, a U.S. producer of structural steel and merchant bar, from May 2019 to September 2019, and as President of Outokumpu Americas for Outokumpu Oyj, a global leader in the stainless steel industry, from 2015 to 2019. Before that, Mr. Williams held a number of leadership roles at US Steel Corporation, a Fortune 500 company and leading integrated steel producer, from 2006 to 2015, including Senior Vice President, North American Flat Rolled and, most recently, Senior Vice President, Strategic Planning and Business Development. Earlier in his career, Mr. Williams served as Vice President of Commercial Products at Special Metals Corporation (a leader in the invention, production and supply of high-nickel alloys) and, prior to that, as Chairman and Chief Executive Officer of Ormet Corporation (a manufacturer of foil, sheet, billet and other aluminum products). Mr. Williams earned his bachelor’sbachelor of science degree in information science from the University of Pittsburgh.
Kristopher R. Westbrooks is Executive Vice President and Chief Financial Officer, a position he has held since September 2018. Previously, Mr. Westbrooks served from April 2015 until August 2018 as Vice President, Corporate Controller and Chief Accounting Officer at A. Schulman, Inc., a global supplier of high-performance plastic compounds, composites and powders. From 2011 until his appointment as Chief Accounting Officer in 2015, Mr. Westbrooks held various finance roles of increasing responsibility at A. Schulman, Inc. He earned his bachelor’sbachelor of science degree in business and master’s degree in accountancy from Miami University of Ohio and is a certified public accountant.
Kristine C. Syrvalin is Executive Vice President, General Counsel and Secretary of TimkenSteel Corporation,Chief Human Resources Officer, a position she has held since January 2021.May 2022. Prior to assuming her current role, she had served as Executive Vice President, General Counsel and Secretary since January 2021, and as Assistant General Counsel and Vice President - Ethics and Compliance for TimkenSteel since October 2014.2014, in each case for Metallus. Previously, Ms. Syrvalin served as Vice President, Assistant General Counsel and Corporate Secretary for OMNOVA Solutions Inc., a global manufacturer of emulsion polymers, specialty chemicals, and functional and decorative surfaces, from September 2001 until October 2014. She earned her bachelor’s degree from Miami University of Ohio and her juris doctor degree from Case Western Reserve University School of Law.
Kevin A. Raketich is Executive Vice President Sales, Marketing and Business Development,Chief Commercial Officer, a position he has held since May 2021.2022. Prior to assuming his current role, Mr. Raketich served as Executive Vice President, Sales, Marketing, and Business Development since May 2021 and as Executive Vice President, Strategy and Corporate Development from January 2017 until May 2021.2021, in each case for Metallus. Previously, he held a number of leadership roles at TimkenSteelMetallus since the spinoff from The Timken Company in 2014, including Vice President, Industrial and Energy, Vice President, Business Development, and Director-International. Prior to the spinoff, Mr. Raketich held various roles of increasing responsibility at The Timken Company. He earned his bachelor's degree in material science engineering from Michigan State University and his master's degree in business administration from Duke University's Fuqua School of Business.
1621
Part II.
Item 5. Market for Registrant's Common Equity, Related Stockholder Matters and Issuer Purchases of Equity Securities
Quarterly Common Stock Prices and Cash Dividends Per Share:
Our common shares are traded on the New York Stock Exchange ("NYSE") under the symbol “TMST.“MTUS.” The estimated number of record holders of our common shares at December 31, 20212023 was 3,287.3,040.
Our Amended Credit Agreement places certain limitations on the payment of cash dividends. Please refer to “Note 14 - Financing Arrangements” in the Notes to the Consolidated Financial Statements and the Results of Operations for additional discussion.
Issuer Purchases of Common Shares:
On December 20, 2021, TimkenSteelthe Company announced that its Board of Directors had authorized a share repurchase program under which the Company may repurchase up to $50$50.0 million of its outstanding common shares. Any repurchase would be in accordance with our Amended Credit Agreement, which places certain limitations on our ability to purchase our common shares. Please referAs of December 31, 2022, this authorization has been exhausted.
On November 2, 2022, the Board of Directors authorized an additional $75.0 million share repurchase program. This authorization reflects the continued confidence of the Board and senior leadership in the Company’s ability to Management’s Discussiongenerate sustainable through-cycle profitability while maintaining a strong balance sheet and Analysiscash flow.
The table below provides information concerning our repurchase of Financial Conditioncommon shares for the three months ended December 31, 2023.
(Dollars in millions, except per share data) |
| Total number of shares purchased (1) |
|
| Average price paid per share (2) |
|
| Total number of shares purchased as part of publicly announced plans or programs (1) |
|
| Maximum dollar value of shares that may yet be purchased under the plans or programs (3) |
| ||||
Beginning shares available |
|
|
|
|
|
|
|
|
|
| $ | 44.5 |
| |||
October, 2023 |
|
| 94,408 |
|
| $ | 20.53 |
|
|
| 94,408 |
|
| $ | 42.5 |
|
November, 2023 |
|
| 56,251 |
|
| $ | 20.25 |
|
|
| 56,251 |
|
| $ | 41.4 |
|
December, 2023 |
|
| 45,867 |
|
| $ | 21.76 |
|
|
| 45,867 |
|
| $ | 40.4 |
|
Quarter ended December 31, 2023 |
|
| 196,526 |
|
| $ | 20.74 |
|
|
| 196,526 |
|
| $ | 40.4 |
|
Subsequent to December 31, 2023, the Company repurchased 0.1 million additional common shares in the open market at an aggregate cost of $1.2 million, which equates to an average repurchase price of $21.07 per share. As of February 15, 2024, the Company has $39.2 million remaining under its authorized share repurchase program.
(1) The Company may utilize various methods to repurchase shares, which could include open market repurchases, including repurchases through Rule 10b5-1 plans, privately-negotiated transactions or by other means. The actual timing, number and Resultsvalue of Operations forshares repurchased under the program will depend on a number of factors, including the price of the Company's shares, general market and economic conditions, capital needs and other factors.
(2) The average price paid per share excludes any broker commissions.
(3) On December 20, 2021, the Company announced that its Board of Directors authorized a share repurchase program under which the Company may repurchase up to $50.0 million of its outstanding common shares. On November 2, 2022, the Board of Directors authorized an additional discussion.$75.0 million share repurchase program. The share repurchase program does not require the Company to acquire any dollar amount or number of shares and does not have an expiration date.
22
Securities Authorized for Issuance Under Equity Compensation Plans:
The following table sets forth certain information as of December 31, 2021,2023, regarding the equity compensation plan maintained by us on that date, the TimkenSteel Corporation Amended and Restated 2020 Equity and Incentive Compensation Plan (the "Amended 2020 Plan"), which amended the previous TimkenSteel Corporation 2020 Equity and Incentive Compensation Plan (the "TimkenSteel"Original 2020 Plan"). plus certain awards still outstanding under all plans preceding the Original 2020 Plan (as well as certain inducement awards granted to our CEO in 2021 that remained outstanding. Refer to "Note 16 - Stock-Based Compensation" in the Notes to the Consolidated Financial Statements and the Results of Operations for additional details.
|
| (a) |
|
| (b) |
|
| (c) |
|
| (a) |
|
| (b) |
|
| (c) |
| ||||||
Plan category |
| Number of |
|
| Weighted-average |
|
| Number of securities |
|
| Number of |
|
| Weighted-average |
|
| Number of securities |
| ||||||
Equity compensation plans approved by security holders(4) |
| 3,854,704 |
| $ | 20.41 |
| 4,041,178 |
|
|
| 3,583,065 |
|
| $ | 17.95 |
|
|
| 3,253,585 |
| ||||
Equity compensation plans not approved by security holders(5) |
| 1,058,500 |
| — |
| — |
|
|
| 1,058,500 |
|
|
| — |
|
|
| — |
| |||||
Total |
| 4,913,204 |
| $ | 20.41 |
| 4,041,178 |
|
|
| 4,641,565 |
|
| $ | 17.95 |
|
|
| 3,253,585 |
| ||||
(1) The amount shown in column (a) and covered under an equity compensation plan approved by security holders includes the following: nonqualified stock options - 2,054,088;621,350; deferred shares – 127,655;219,080; performance-based restricted stock units – 555,966;1,773,226 (based on potential maximum performance); and time-based restricted stock units – 1,116,995969,409 (which includes 914,860935,109 cliff-vested restricted stock units). As a result, this amount may overstate eventual actual dilution.
(2) The weighted average exercise price in column (b) includes nonqualified stock options only.
(3) The amount shown in column (c) represents common shares remaining available under the Amended 2020 Plan, under which the Compensation Committee is authorized to make awards of option rights, appreciation rights, restricted shares, restricted stock units, deferred shares, performance shares, performance units and cash incentive awards. Awards may be credited with dividend equivalents payable in the form of common shares.
(4) The Company also maintains the Director Deferred Compensation Plan pursuant to which non-employee Directors may defer receipt of common shares authorized for issuance under the Equity Plan.Company's equity plans. The table does not include separate information about this plan because it merely provides for the deferral, rather than the issuance, of common shares.
(5) These securities were granted to Michael S. Williams on January 5, 2021 and were approved by the Compensation Committee of TimkenSteel'sthe Company's Board of Directors. These securities were granted outside of the AmendedOriginal 2020 Plan as inducements material to Mr. Williams acceptance of employment with TimkenSteel.Metallus. The securities awarded consist of time-based restricted share units covering 423,400 of TimkenSteel'sMetallus' common shares and performance-based restricted share units covering a target number of 423,400 of TimkenSteel'sMetallus' common shares (with a maximum payout opportunity of 635,100 common shares).
1723
Performance Graph:
The following graph compares the cumulative total return of our common shares with the cumulative total return of the Standard & Poor’s ("S&P") MidCap 400 Index ("S&P MidCap 400"), S&P 500 Steel Sub-Industry Index ("S&P 500 Steel"), and S&P 1500 Steel GroupSub-Industry Index ("S&P 1500 Steel"), assuming $100 was invested and that cash dividends were reinvested for the period December 31, 20162018 through December 31, 2021.2023.
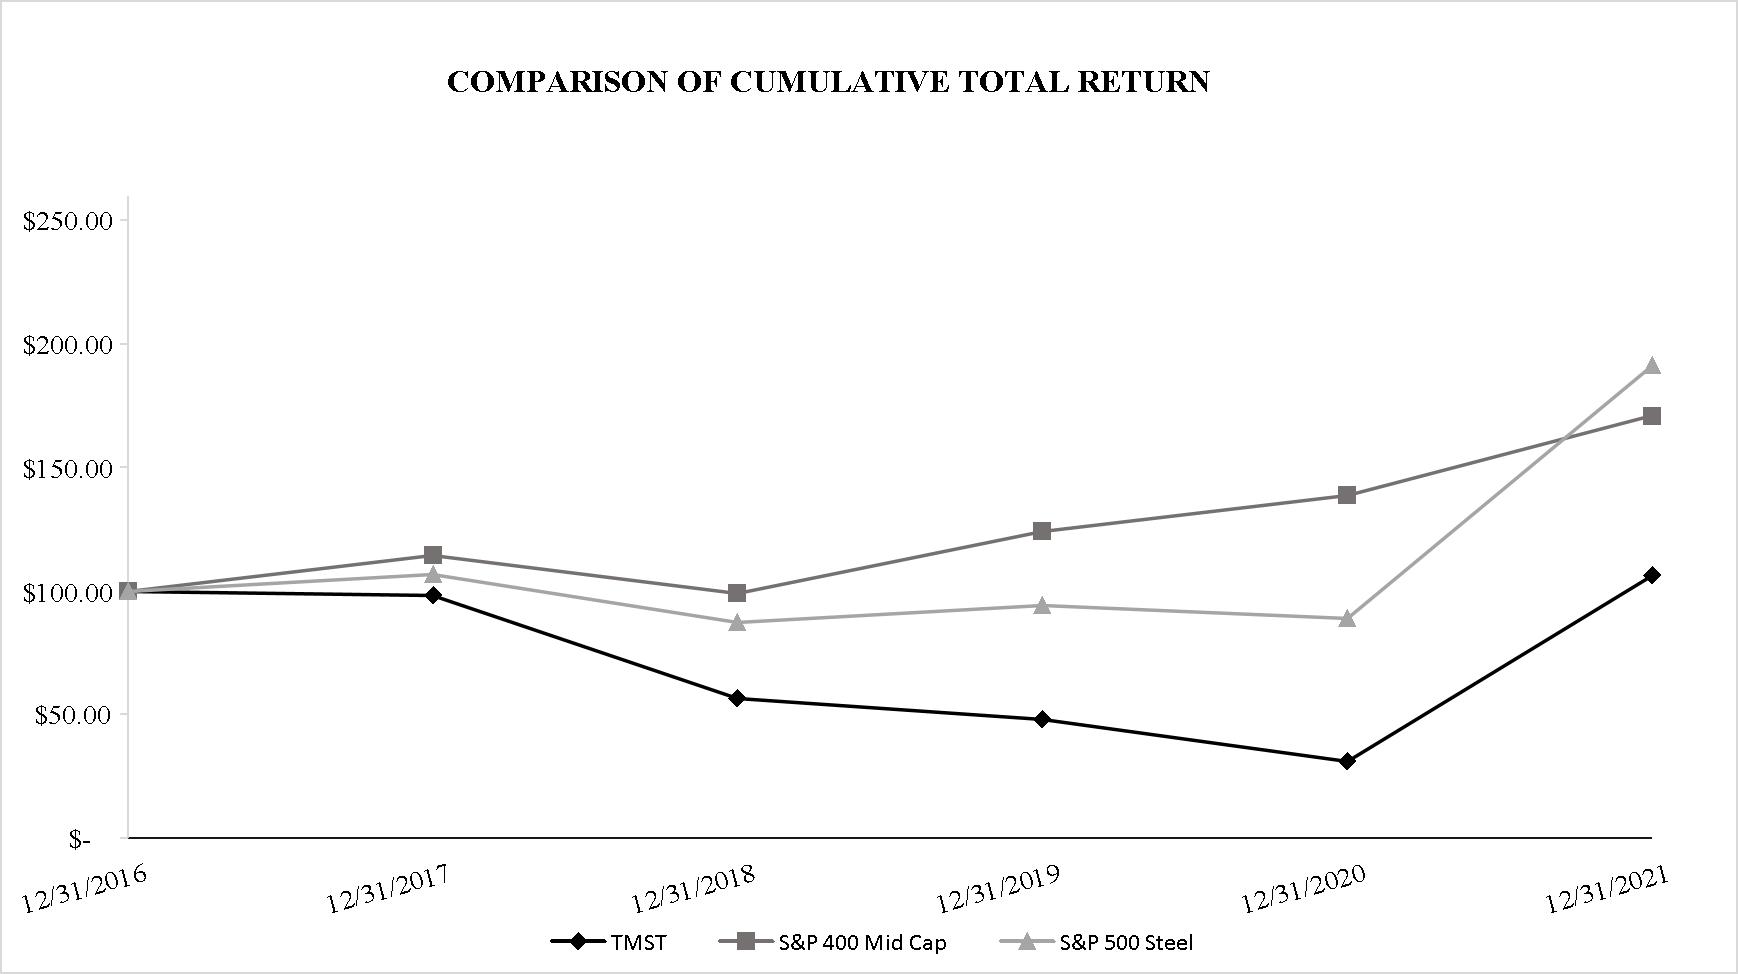

Date |
| TimkenSteel |
|
| S&P MidCap |
|
| S&P 500 |
|
| Metallus |
|
| S&P MidCap |
|
| S&P 500 |
|
| S&P 1500 |
| |||||||
December 31, 2016 |
| $ | 100.00 |
| $ | 100.00 |
| $ | 100.00 |
| ||||||||||||||||||
December 31, 2017 |
| $ | 98.13 |
| $ | 114.45 |
| $ | 106.82 |
| ||||||||||||||||||
December 31, 2018 |
| $ | 56.40 |
| $ | 99.15 |
| $ | 87.20 |
|
| $ | 100.00 |
|
| $ | 100.00 |
|
| $ | 100.00 |
|
| $ | 100.00 |
| ||
December 31, 2019 |
| $ | 48.06 |
| $ | 124.10 |
| $ | 94.22 |
|
| $ | 85.22 |
|
| $ | 109.21 |
|
| $ | 125.29 |
|
| $ | 115.36 |
| ||
December 31, 2020 |
| $ | 30.94 |
| $ | 138.68 |
| $ | 88.94 |
|
| $ | 53.26 |
|
| $ | 100.40 |
|
| $ | 140.27 |
|
| $ | 115.68 |
| ||
December 31, 2021 |
| $ | 106.33 |
| $ | 170.98 |
| $ | 191.28 |
|
| $ | 190.38 |
|
| $ | 220.52 |
|
| $ | 172.02 |
|
| $ | 195.82 |
| ||
December 31, 2022 |
| $ | 202.18 |
|
| $ | 256.51 |
|
| $ | 145.44 |
|
| $ | 236.70 |
| ||||||||||||
December 31, 2023 |
| $ | 273.31 |
|
| $ | 325.28 |
|
| $ | 170.48 |
|
| $ | 323.96 |
| ||||||||||||
This performance graph shall not be deemed to be “soliciting material” or to be “filed” with the SEC or subject to Regulation 14A or 14C, or to the liabilities of Section 18 of the Exchange Act.
Item 6. Selected Financial Data
Intentionally omitted.
1824
Item 7. Management's Discussion and Analysis of Financial Condition and Results of Operations
(dollars in millions, except per share data)
This Management’s Discussion and Analysis of Financial Condition and Results of Operations (“MD&A”) is intended to help investors understand our results of operations, financial condition and current business environment. The MD&A is provided as a supplement to, and should be read in conjunction with, our audited consolidated financial statements and related notes included elsewhere in this Annual Report on Form 10-K for the year ended December 31, 2023.
The MD&A is organized as follows:
Overview
Business Overview
We manufacture alloy steel, as well as carbon and micro-alloy steel.steel, using electric arc furnace ("EAF") technology. Our portfolio includes special bar quality ("SBQ"(“SBQ”) bars, seamless mechanical tubing ("tubes"(“tubes”), manufactured components (formerly known as the "value-add" product type) such as precision steel components, and billets. In addition, we supply machining and thermal treatment services, and we manage raw material recycling programs, which are also used as a feeder system for our melt operations. Our products and servicessolutions are used in a diverse range of demanding applications in the following market sectors: automotive; oilend-markets: industrial, automotive, aerospace & defense, and gas; industrial equipment; mining; construction; rail; defense; heavy truck; agriculture; power generation; and oil country tubular goods ("OCTG").
SBQ steel is made to restrictive chemical compositions and high internal purity levels and is used in critical mechanical applications. We make these products from nearly 100% recycled steel, using our expertise in raw materials to create custom steel products. We focus on creating tailored products and services for our customers’ most demanding applications. Our engineers are experts in both materials and applications, so we can work closely with each customer to deliver flexible solutions related to our products as well as to their applications and supply chains.
The SBQ bar, tube, and billet production processes take place at our Canton, Ohio manufacturing location. This location accounts for all of the SBQ bars, seamless mechanical tubes and billets we produce and includes three manufacturing facilities: the Faircrest, Harrison, and Gambrinus facilities. Our production of manufactured components takes place at two downstream manufacturing facilities: Tryon Peak (Columbus, North Carolina) and St. Clair (Eaton, Ohio). Many of the production processes are integrated, and the manufacturing facilities produce products that are sold in all of our market sectors. As a result, investments in our facilities and resource allocation decisions affecting our operations are designed to benefit the overall business, not any specific aspect of the business.
On February 16, 2021, management announced a plan to indefinitely idle our Harrison melt and casting assets, which was completed in the first quarter of 2021. All of our melt and casting activities now take place at the Faircrest location. We worked collaboratively with employees, suppliers and a number of customers to ensure a well-organized and efficient transition. Our rolling and finishing operations at Harrison were not impacted by this action. For additional details regarding this matter please refer to “Note 6 – Disposition of Non-Core Assets.”
Prior to indefinitely idling these assets, we had an annual melt capacity of approximately 2 million tons and shipment capacity of 1.5 million tons. After indefinitely idling these assets, our annual melt capacity is approximately 1.2 million tons and our shipment capacity is approximately 0.9 million tons.
On March 31, 2021, the Company entered into an agreement pursuant to which Daido Steel (Shanghai) Co., Ltd. agreed to acquire all of the Company’s ownership interest in TimkenSteel (Shanghai) Corporation Limited in an all-cash transaction. The sale closed on July 30, 2021. TimkenSteel’s consolidated financial statements include activity for TimkenSteel (Shanghai) Corporation Limited through July 30, 2021.
On October 29, 2021, the United Steelworkers ("USW") Local 1123 voted to ratify a new four-year contract (the “Contract”). The Contract, which is in effect until September 27, 2025, offers TimkenSteel's Canton-based bargaining employees an increase to base wages every year (3% beginning as of September 26, 2021 and thereafter 2.5% until 2024), competitive healthcare and retirement benefits for all members, and a continued focus on employee wellbeing as well as safe and sustainable operations. A contract ratification bonus was paid to bargaining employees during the fourth quarter of 2021 at a cost of approximately $2 million. The Contract covers approximately 1,170 bargaining employees at the Company’s Canton, Ohio operations.energy.
We conduct our business activities and report financial results as one business segment. The presentation of financial results as one reportable segment is consistent with the way we operate our business and is consistent with the manner in which the CODM Chief Operating Decision Maker ("CODM")evaluates performance and makes resource and operating decisions for the business as described above. Furthermore, the Company notes that monitoring financial results as one reportable segment helps the CODM manage costs on a consolidated basis, consistent with the integrated nature of our operations.
Markets We Serve
We sell products and services that are used in a diverse range of demanding applications around the world. No one customer accounted for 10% or more of net sales in 2021.2023 Business Highlights
Key indicators for our market include the U.S. light vehicle production Seasonally Adjusted Annual Rate, oil and gas rig count activity and U.S. footage drilled, and industrial production for agriculture and construction markets, distribution, and mining and oil field machinery products. In addition, we closely monitor the Purchasing Managers’ Index, which is a leading indicator for our overall business.
19The following items represent key trends and events during the year ended December 31, 2023:
(1) Please see discussion of non-GAAP financial measures in Form 10-K – Net Sales Adjusted to Exclude Surcharges
25
Shareholder returns: The Company repurchased approximately 1.7 million common shares at a cost of $32.9 million, or $19.03 per share. In addition, the ordinary courseCompany repurchased $7.5 million of business,its outstanding convertible notes at a cost of $18.7 million. Combined, the 2023 common share and convertible note repurchase activity reduced diluted shares outstanding by 2.7 million shares on a go-forward basis.
26
Net Sales
The charts below present net sales and shipments for the years ended December 31, 2021, 20202023, 2022 and 2019.2021.
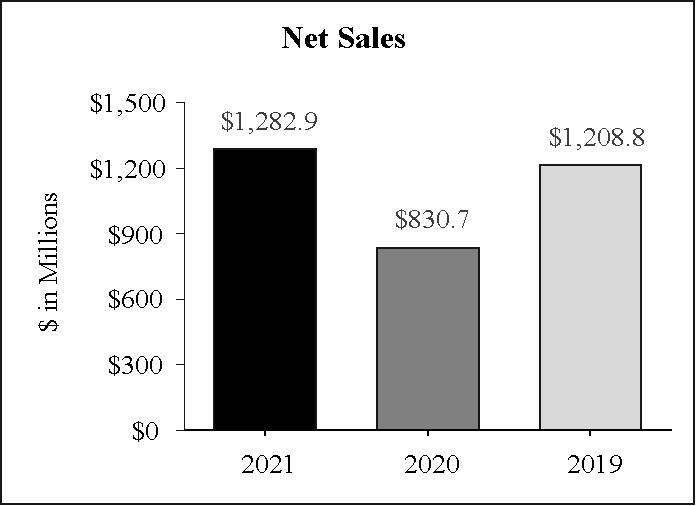

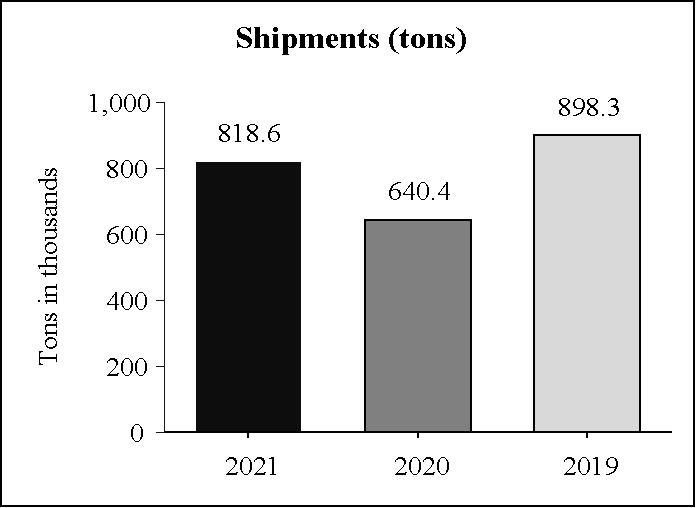

Net sales for the year ended December 31, 20212023 were $1,282.9$1,362.4 million, an increase of $452.2$32.5 million, or 54.4%2.4%, compared with the year ended December 31, 2020.2022. The increase in sales was primarily driven by an increasefavorable price/mix, partially offset by a decrease in surcharges and higher volumes, partially offset by unfavorablelower volume. Favorable price/mix. The increase in surchargesmix of $272.1$116.9 million was primarily due to higher base prices across all end-markets. Lower market prices for scrap anddrove the unfavorable surcharges of $75.0 million, partially offset by higher alloy across all end-market sectors. Higher volumesprices. Lower volume of 178.28.3 thousand ship tons resulted in a net sales increasedecrease of $220.5 million, primarily due to higher customer demand in the industrial, mobile and energy end-market sectors, despite an approximate 45 thousand ton decrease in expected ship tons for the year ended December 31, 2021 due to the semiconductor chip shortage in the mobile end-market sector. This increase in demand was partially offset by no OCTG billet shipments during the year ended December 31, 2021. Unfavorable price/mix of $40.4 million was driven primarily by unfavorable mix within the industrial end-market sector.$9.4 million. Excluding surcharges, net sales increased $180.1$107.5 million or 25.9%11.8%.
20
27
Gross Profit
The chart below presents the drivers of the gross profit variance from the year ended December 31, 20202022 to the year ended December 31, 2021.2023.
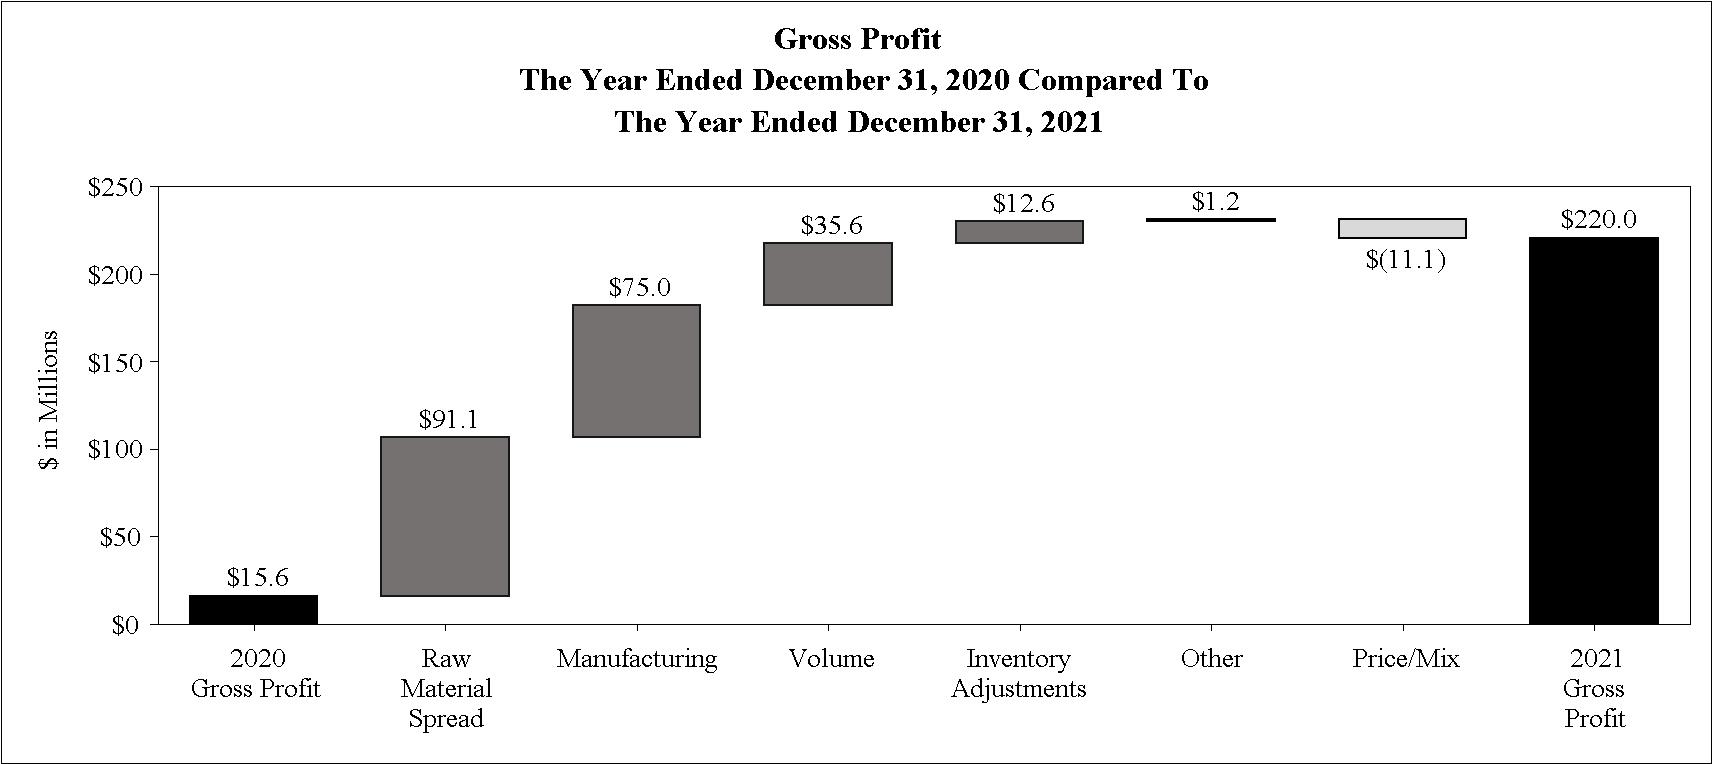

Gross profit for the year ended December 31, 20212023 increased $204.4$59.8 million, or 47.2%, compared with the year ended December 31, 2020.2022. The increase was driven by favorable raw material spread, lower manufacturing costs, increased volume, and favorable inventory adjustments,price/mix, partially offset by unfavorablehigher manufacturing costs. Favorable price/mix. Raw material spreadmix was favorable due to higher scrap and alloy spreads. Lowerbase prices across all end-markets. Higher manufacturing costs were primarily due to the Company’s significanthigher plant spend and inflationary cost reduction actions and a favorable impact of higher production levels on fixed cost leverage, partially offset by higher variable compensation costs. The increase in volume was due to higher customer demand in the industrial, mobile, and energy end-market sectors for the year ended December 31, 2021. Inventory adjustments were also favorable as additional reserves were recorded during the year ended December 31, 2020 due to market conditions at the time, specifically in the energy end-market sector, which were reversed throughout 2021 as the related inventory was sold or scrapped. These increases were partially offset by unfavorable price/mix, driven by unfavorable mix within the industrial end-market sector.increases.
2128
Selling, General and Administrative Expenses
The charts below present selling, general and administrative ("SG&A") expense for the years ended December 31, 2021, 20202023, 2022 and 2019.2021.
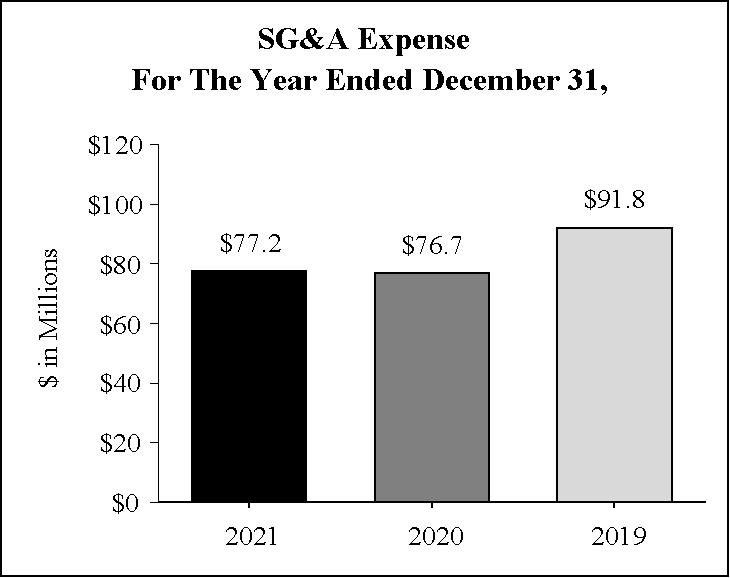

SG&A expense for the year ended December 31, 20212023 increased by $0.5$10.8 million, or 0.7%14.6%, compared with the year ended December 31, 2020.2022. This increase iswas primarily due to higher 2021stock-based compensation, variable compensation expense given the Company's improved financial performance, partially offset by lower wages and benefits expense as a result of a reduction in employee headcount following the Company’s restructuring actions.
Restructuring Charges
Over the past several years, TimkenSteel has made numerous organizational changes to enhance profitable and sustainable growth. These company-wide actions included the restructuring of its business support functions, the reduction of management layers throughout the organization and other domestic and international actions to further improve the Company’s overall cost structure. Restructuring charges for the year ended December 31, 2021 totaled $6.7 million. Approximately 75 salaried positions were eliminated through restructuring actions in 2021. Over half of these positions and approximately $4 million of the aforementioned 2021 restructuring charges were due to a voluntary exit incentive offeredprofessional services, primarily driven by the Company in the fourth quarter of 2021 to certain U.S.-based salaried non-operative employees who would have been eligible for retirement by December 31, 2023.
During this overall period of organizational changes, the Company has eliminated approximately 290 salaried positions through restructuring actions and recognized restructuring charges of $18.4 million. The Company expects to realize ongoing annual savings of approximately $39 million as a result of these actions.information technology transformation project.
Refer to “Note 5 - Restructuring Charges” in the Notes to the Consolidated Financial Statements for additional information.
Impairment Charges & Loss (Gain) on Sale or Disposal of Assets, net
TimkenSteelThe Company recorded no impairment charges for the years ended December 31, 2023 and 2022. During the year ended December 31, 2021, the Company recorded approximately $10.6 million of impairment charges for the year ended December 31, 2021.charges. This was driven by $7.9 million of impairment charges related to the indefinite idling of our Harrison melt and casting assets. Other impairment charges included $2.4 million related to the impairment of certain assets at our St. Clair facility due to the early termination of a customer program and $0.3 million related to the disposition of assets at ourthe Company’s former TMS facility. No impairment charge was recorded for the year ended December 31, 2020.TimkenSteel Material Services (“TMS”) facility in Houston.
Additionally, the Company recorded a net loss on sale of assets for the year ended December 31, 2021 of $1.3 million related to the disposition of excess assets. For the year ended December 31, 2020, TimkenSteel recorded a net2023, the gain on the sale andor disposal of assets, net, of $2.6$2.5 million primarily related to the sale of certainthe small-diameter seamless mechanical tubing machinery and equipment, partially offset by write-offs of aged assets removed from service. For the year ended December 31, 2022, the loss on sale or disposal of assets, net, of $1.9 million primarily related to our closedthe loss recognized on the sale of the remaining land and buildings at the Company's TMS facility.facility, as well as write-offs of aged assets removed from service.
Refer to “Note 6 - Disposition of Non-Core Assets” and “Note 11 - Property, Plant and Equipment” in the Notes to the Consolidated Financial Statements for additional information.
22
Interest (Income) Expense, net
Interest Expense
Interest expenseNet interest income for the year ended December 31, 20212023 was $5.9 million, a decrease of $6.3$7.1 million, compared with net interest expense of $0.6 million for the year ended December 31, 2020.2022. The decrease in interest expensechange was primarily due to interest earned on cash invested in a money market fund and deposits with financial institutions at a rate similar to the adoption of the Accounting Standard Update 2020-06 on January 1, 2021, which caused the Convertible Notes to no longer have a debt discount that is amortized. The remaining decrease is driven bymoney market fund during 2023, as well as a reduction in average outstanding borrowings.convertible notes compared to the same period in 2022. Refer to “Note 14 - Financing Arrangements” in the Notes to the Consolidated Financial Statements for additional information.
29
Other (Income) Expense, net
|
| Year Ended December 31, |
|
| Year Ended December 31, |
| ||||||||||||||||||
|
| 2021 |
|
| 2020 |
|
| $ Change |
|
| 2023 |
|
| 2022 |
|
| $ Change |
| ||||||
Pension and postretirement non-service benefit (income) loss |
| $ | (37.2 | ) |
| $ | (26.6 | ) |
| $ | (10.6 | ) |
| $ | (4.6 | ) |
| $ | (20.3 | ) |
| $ | 15.7 |
|
Loss (gain) from remeasurement of benefit plans |
| (20.1 | ) |
| 14.7 |
| (34.8 | ) |
|
| 40.6 |
|
|
| (35.4 | ) |
|
| 76.0 |
| ||||
Foreign currency exchange loss (gain) |
| 0.1 |
| 0.2 |
| (0.1 | ) |
|
| — |
|
|
| (0.2 | ) |
|
| 0.2 |
| |||||
Insurance recoveries |
|
| (31.3 | ) |
|
| (34.5 | ) |
|
| 3.2 |
| ||||||||||||
Sales and use tax refund |
| (2.5 | ) |
| — |
| (2.5 | ) |
|
| (1.4 | ) |
|
| — |
|
|
| (1.4 | ) | ||||
Employee retention credit |
| — |
| (2.3 | ) |
| 2.3 |
| ||||||||||||||||
Miscellaneous (income) expense |
| 0.2 |
| (0.2 | ) |
| 0.4 |
|
|
| 0.4 |
|
|
| (0.2 | ) |
|
| 0.6 |
| ||||
Total other (income) expense, net |
| $ | (59.5 | ) |
| $ | (14.2 | ) |
| $ | (45.3 | ) |
| $ | 3.7 |
|
| $ | (90.6 | ) |
| $ | 94.3 |
|
|
| Year Ended December 31, |
|
| Year Ended December 31, |
| ||||||||||||||||||
|
| 2020 |
|
| 2019 |
|
| $ Change |
|
| 2022 |
|
| 2021 |
|
| $ Change |
| ||||||
Pension and postretirement non-service benefit (income) loss |
| $ | (26.6 | ) |
| $ | (17.5 | ) |
| $ | (9.1 | ) |
| $ | (20.3 | ) |
| $ | (37.2 | ) |
| $ | 16.9 |
|
Loss (gain) from remeasurement of benefit plans |
| 14.7 |
| 40.6 |
| (25.9 | ) |
|
| (35.4 | ) |
|
| (20.1 | ) |
|
| (15.3 | ) | |||||
Foreign currency exchange loss (gain) |
| 0.2 |
| — |
| 0.2 |
|
|
| (0.2 | ) |
|
| 0.1 |
|
|
| (0.3 | ) | |||||
Employee retention credit |
| (2.3 | ) |
| — |
| (2.3 | ) | ||||||||||||||||
Sales and use tax refund |
|
| — |
|
|
| (2.5 | ) |
|
| 2.5 |
| ||||||||||||
Insurance recoveries |
|
| (34.5 | ) |
|
| — |
|
|
| (34.5 | ) | ||||||||||||
Miscellaneous (income) expense |
| (0.2 | ) |
| 0.2 |
| (0.4 | ) |
|
| (0.2 | ) |
|
| 0.2 |
|
|
| (0.4 | ) | ||||
Total other (income) expense, net |
| $ | (14.2 | ) |
| $ | 23.3 |
| $ | (37.5 | ) |
| $ | (90.6 | ) |
| $ | (59.5 | ) |
| $ | (31.1 | ) | |
Non-service related pension and other postretirement benefit income, for all years, consists primarily of the interest cost, expected return on plan assets and amortization components of net periodic cost.
The loss fromCompany's Bargaining Unit Pension Plan ("Bargaining Plan"), Retirement Plan (“Salaried Plan”), and the Supplemental Pension Plan ("Supplemental Plan") each have a provision that permits employees to elect to receive their pension benefits in a lump sum upon retirement. In the first quarter of 2023, the cumulative cost of all lump sum payments was projected to exceed the sum of the service costs and interest cost components of net periodic pension cost for the Salaried Plan. As a result, the Company completed a full remeasurement of its pension obligations and plan assets associated with the Salaried Plan during each quarter of 2023.
A net loss of $40.6 million from the remeasurement of these benefit plans iswas recognized for the year ended December 31, 2023. This loss was driven by a $36.6 million increase in the pension liability primarily due to a decrease in discount rate, updated census data and updates to certain underlying assumptions, as well as a loss of $4.0 million due to investment losses on plan assets.
A net gain of $35.4 million from the Company performing mark-to-market accountingremeasurement of these benefit plans was recognized for the year ended December 31, 2022. This gain was driven by a $359.9 million decrease in the pension liability primarily due to an increase in discount rates and a $2.7 million non-cash settlement related to the partial annuitization of the Bargaining Plan. This was partially offset by a loss of $327.2 million driven primarily by investment losses on itsplan assets and lump sum basis losses.
A net gain of $20.1 million from the remeasurement of these benefit plans was recognized for the year ended December 31, 2021. This gain was driven by a $55.7 million decrease in the pension and postretirement assets at year-end and upon the occurrenceliability primarily due to an increase in discount rates, partially offset by a loss of certain triggering events. $35.6 million driven primarily by investment losses on plan assets.
For more details on the remeasurementaforementioned remeasurements, refer to “Note 15 - Retirement and Postretirement Plans.”
During the second half of 2022, the Faircrest melt shop experienced unplanned operational downtime. During the fourth quarter of 2022, the Company recognized an insurance recovery of $33.0 million related to the 2022 unplanned downtime, of which $13.0 million was received in the fourth quarter of 2022 and $20.0 million was received in the first quarter of 2023. Additionally, during
30
the third quarter of 2022, the Company recognized an insurance recovery of $1.5 million related to an unplanned outage at our Faircrest facility in November 2021.
During 2023, the Company recognized insurance recoveries of $31.3 million related to the 2022 Faircrest melt shop unplanned downtime, of which $11.3 million was received during 2023 and $20.0 million was received in the first quarter of 2024. The 2022 insurance claims were closed as of the first quarter of 2024. Metallus recognizes an insurance recovery when it is realized or considered realizable, in accordance with the accounting guidance.
During the fourth quarter of 2023, the Company received a commitment from the State of Ohio related to the overpayment of sales and use taxes for the period of January 1, 2020 through March 31, 2023. This resulted in a gain recognized of $1.4 million, net of related professional fees, for the year ended December 31, 2023. During the second quarter of 2021, TimkenSteelthe Company received a refund from the State of Ohio related to an overpayment of sales and use taxes for the period of October 1, 2016 through September 30, 2019. This resulted in a gain recognized of $2.5 million, net of related professional fees, for the year ended December 31, 2021.
During the year ended December 31, 2020, the Company recognized a $2.3 million benefit related to the Employee Retention Credit in other (income) expense, net. For more details on this credit refer to "Note 2 - Significant Accounting Policies."
Provision for Income Taxes
|
| Year Ended December 31, |
|
| Year Ended December 31, |
| ||||||||||||||||||
|
| 2021 |
| 2020 |
| $ Change |
|
| 2023 |
| 2022 |
| $ Change |
| ||||||||||
Provision (benefit) for income taxes |
| $ | 5.7 |
| $ | 1.2 |
| $ | 4.5 |
|
| $ | 27.0 |
|
| $ | 32.0 |
|
| $ | (5.0 | ) | ||
Effective tax rate |
| 3.2 | % |
| (2.0 | )% |
| NM(1) |
|
|
| 28.0 | % |
|
| 32.9 | % |
|
| -4.9 | % | |||
|
| Year Ended December 31, |
|
| Year Ended December 31, |
| ||||||||||||||||||
|
| 2020 |
|
| 2019 |
|
| $ Change |
|
| 2022 |
|
| 2021 |
|
| $ Change |
| ||||||
Provision (benefit) for income taxes |
| $ | 1.2 |
| $ | (16.1 | ) |
| $ | 17.3 |
|
| $ | 32.0 |
|
| $ | 5.7 |
|
| $ | 26.3 |
| |
Effective tax rate |
| (2.0 | )% |
| 12.8 | % |
| NM(1) |
|
|
| 32.9 | % |
|
| 3.2 | % |
| NM(1) |
| ||||
(1) “NM” is data that is not meaningful.
The majority of the Company's income tax expense is derived from domestic state and local taxes. The Company remains in a full valuationprovision for incomes taxes for the U.S. jurisdiction for the yearsyear ended December 31, 20212023 was $27.0 million compared to a provision for income taxes of $32.0 million in 2022. The change from the prior year is primarily related to higher permanent items for the year ended December 31, 2022 compared with December 31, 2023. The provision for income taxes for the year ended December 31, 2022 was also impacted by the release of the Company’s income tax valuation allowance on domestic deferred tax assets due to consecutive years of positive net income and 2020.the utilization of the majority of loss carryforwards generated in prior years.
23
31
Non-GAAP Financial Measures
Net Sales Adjusted to Exclude Surcharges
The tabletables below presentspresent net sales by end-market sector,end-markets, adjusted to exclude surcharges, which represents a financial measure that has not been determined in accordance with accounting principles generally accepted in the United States ("(“U.S. GAAP"GAAP”). We believe presenting net sales by end-market sectorend-markets, both on a gross basis and on a per ton basis, adjusted to exclude raw material and natural gas surcharges, provides additional insight into key drivers of net sales such as base price and product mix. Due to the fact that the surcharge mechanism can introduce volatility to our net sales, net sales adjusted to exclude surcharges provides management and investors clarity of our core pricing and results. Presenting net sales by end-markets, adjusted to exclude surcharges including on a per ton basis, allows management and investors to better analyze key market indicators and trends and allows for enhanced comparison between our end-markets.
(dollars in millions, tons in thousands) |
|
|
|
|
|
|
|
|
|
|
|
|
| |||||||
|
| 2021 |
| |||||||||||||||||
|
| Mobile |
|
| Industrial |
|
| Energy |
|
| Other |
|
| Total |
| |||||
Tons |
|
| 370.4 |
|
|
| 408.9 |
|
|
| 39.3 |
|
|
| — |
|
|
| 818.6 |
|
|
|
|
|
|
|
|
|
|
|
|
|
|
|
|
| |||||
Net Sales |
| $ | 527.9 |
|
| $ | 661.2 |
|
| $ | 62.9 |
|
| $ | 30.9 |
|
| $ | 1,282.9 |
|
Less: Surcharges |
|
| 167.7 |
|
|
| 218.3 |
|
|
| 22.1 |
|
|
| — |
|
|
| 408.1 |
|
Base Sales |
| $ | 360.2 |
|
| $ | 442.9 |
|
| $ | 40.8 |
|
| $ | 30.9 |
|
| $ | 874.8 |
|
|
|
|
|
|
|
|
|
|
|
|
|
|
|
|
| |||||
Net Sales / Ton |
| $ | 1,425 |
|
| $ | 1,617 |
|
| $ | 1,601 |
|
| $ | — |
|
| $ | 1,567 |
|
Surcharges / Ton |
| $ | 453 |
|
| $ | 534 |
|
| $ | 563 |
|
| $ | — |
|
| $ | 498 |
|
Base Sales / Ton |
| $ | 972 |
|
| $ | 1,083 |
|
| $ | 1,038 |
|
| $ | — |
|
| $ | 1,069 |
|
|
|
|
|
|
|
|
|
|
|
|
|
|
|
|
| |||||
|
| 2020 |
| |||||||||||||||||
|
| Mobile |
|
| Industrial |
|
| Energy |
|
| Other |
|
| Total |
| |||||
Tons |
|
| 308.1 |
|
|
| 267.0 |
|
|
| 36.3 |
|
|
| 29.0 |
|
|
| 640.4 |
|
|
|
|
|
|
|
|
|
|
|
|
|
|
|
|
| |||||
Net Sales |
| $ | 346.0 |
|
| $ | 391.7 |
|
| $ | 53.2 |
|
| $ | 39.8 |
|
| $ | 830.7 |
|
Less: Surcharges |
|
| 59.3 |
|
|
| 61.1 |
|
|
| 8.4 |
|
|
| 7.2 |
|
|
| 136.0 |
|
Base Sales |
| $ | 286.7 |
|
| $ | 330.6 |
|
| $ | 44.8 |
|
| $ | 32.6 |
|
| $ | 694.7 |
|
|
|
|
|
|
|
|
|
|
|
|
|
|
|
|
| |||||
Net Sales / Ton |
| $ | 1,123 |
|
| $ | 1,467 |
|
| $ | 1,466 |
|
| $ | 1,372 |
|
| $ | 1,297 |
|
Surcharges / Ton |
| $ | 192 |
|
| $ | 229 |
|
| $ | 232 |
|
| $ | 248 |
|
| $ | 212 |
|
Base Sales / Ton |
| $ | 931 |
|
| $ | 1,238 |
|
| $ | 1,234 |
|
| $ | 1,124 |
|
| $ | 1,085 |
|
|
|
|
|
|
|
|
|
|
|
|
|
|
|
|
| |||||
|
| 2019 |
| |||||||||||||||||
|
| Mobile |
|
| Industrial |
|
| Energy |
|
| Other |
|
| Total |
| |||||
Tons |
|
| 397.6 |
|
|
| 348.2 |
|
|
| 90.6 |
|
|
| 61.9 |
|
|
| 898.3 |
|
|
|
|
|
|
|
|
|
|
|
|
|
|
|
|
| |||||
Net Sales |
| $ | 479.3 |
|
| $ | 486.3 |
|
| $ | 166.4 |
|
| $ | 76.8 |
|
| $ | 1,208.8 |
|
Less: Surcharges |
|
| 104.1 |
|
|
| 99.9 |
|
|
| 32.8 |
|
|
| 16.7 |
|
|
| 253.5 |
|
Base Sales |
| $ | 375.2 |
|
| $ | 386.4 |
|
| $ | 133.6 |
|
| $ | 60.1 |
|
| $ | 955.3 |
|
|
|
|
|
|
|
|
|
|
|
|
|
|
|
|
| |||||
Net Sales / Ton |
| $ | 1,205 |
|
| $ | 1,397 |
|
| $ | 1,837 |
|
| $ | 1,241 |
|
| $ | 1,346 |
|
Surcharges / Ton |
| $ | 261 |
|
| $ | 287 |
|
| $ | 362 |
|
| $ | 270 |
|
| $ | 283 |
|
Base Sales / Ton |
| $ | 944 |
|
| $ | 1,110 |
|
| $ | 1,475 |
|
| $ | 971 |
|
| $ | 1,063 |
|
When surcharges are included in a customer agreement and are applicable (i.e., reach the threshold amount), based on the terms outlined in the respective agreement, surcharges are then included as separate line items on a customer’s invoice. These additional surcharge line items adjust base prices to match cost fluctuations due to market conditions. Each month, the Company will post on the surcharges page of its external website, as well as our customer portal, the scrap, alloy, and natural gas surcharges that will be applied (as a separate line item) to invoices dated in the following month (based upon shipment volumes in the following month). All surcharges invoiced are included in GAAP net sales.
24In the fourth quarter of 2023, the Company split the aerospace & defense end-market out from the industrial end-market for greater visibility into a targeted area of growth for the Company. These changes have been retrospectively applied in the following tables.
32
(dollars in millions, tons in thousands) |
|
|
|
|
|
|
|
|
|
|
|
|
|
|
|
| ||||||||
|
| 2023 |
| |||||||||||||||||||||
|
| Industrial |
|
| Automotive |
|
| Aerospace & Defense |
|
| Energy |
|
| Other |
|
| Total |
| ||||||
Ship Tons |
|
| 264.6 |
|
|
| 306.4 |
|
|
| 45.6 |
|
|
| 67.2 |
|
|
| — |
|
|
| 683.8 |
|
|
|
|
|
|
|
|
|
|
|
|
|
|
|
|
|
|
| |||||||
Net Sales |
| $ | 533.3 |
|
| $ | 531.9 |
|
| $ | 115.0 |
|
| $ | 160.4 |
|
| $ | 21.8 |
|
| $ | 1,362.4 |
|
Less: Surcharges |
|
| 147.2 |
|
|
| 129.4 |
|
|
| 18.8 |
|
|
| 44.9 |
|
|
| — |
|
|
| 340.3 |
|
Base Sales |
| $ | 386.1 |
|
| $ | 402.5 |
|
| $ | 96.2 |
|
| $ | 115.5 |
|
| $ | 21.8 |
|
| $ | 1,022.1 |
|
|
|
|
|
|
|
|
|
|
|
|
|
|
|
|
|
|
| |||||||
Net Sales / Ton |
| $ | 2,015 |
|
| $ | 1,736 |
|
| $ | 2,522 |
|
| $ | 2,386 |
|
| $ | — |
|
| $ | 1,992 |
|
Surcharges / Ton |
| $ | 556 |
|
| $ | 422 |
|
| $ | 412 |
|
| $ | 668 |
|
| $ | — |
|
| $ | 498 |
|
Base Sales / Ton |
| $ | 1,459 |
|
| $ | 1,314 |
|
| $ | 2,110 |
|
| $ | 1,718 |
|
| $ | — |
|
| $ | 1,494 |
|
|
|
|
|
|
|
|
|
|
|
|
|
|
|
|
|
|
| |||||||
|
| 2022 |
| |||||||||||||||||||||
|
| Industrial |
|
| Automotive |
|
| Aerospace & Defense |
|
| Energy |
|
| Other |
|
| Total |
| ||||||
Ship Tons |
|
| 289.1 |
|
|
| 313.2 |
|
|
| 26.7 |
|
|
| 63.1 |
|
|
| — |
|
|
| 692.1 |
|
|
|
|
|
|
|
|
|
|
|
|
|
|
|
|
|
|
| |||||||
Net Sales |
| $ | 549.0 |
|
| $ | 539.1 |
|
| $ | 79.7 |
|
| $ | 136.6 |
|
| $ | 25.5 |
|
| $ | 1,329.9 |
|
Less: Surcharges |
|
| 185.4 |
|
|
| 171.6 |
|
|
| 15.2 |
|
|
| 43.1 |
|
|
| — |
|
|
| 415.3 |
|
Base Sales |
| $ | 363.6 |
|
| $ | 367.5 |
|
| $ | 64.5 |
|
| $ | 93.5 |
|
| $ | 25.5 |
|
| $ | 914.6 |
|
|
|
|
|
|
|
|
|
|
|
|
|
|
|
|
|
|
| |||||||
Net Sales / Ton |
| $ | 1,899 |
|
| $ | 1,721 |
|
| $ | 2,985 |
|
| $ | 2,165 |
|
| $ | — |
|
| $ | 1,922 |
|
Surcharges / Ton |
| $ | 641 |
|
| $ | 548 |
|
| $ | 569 |
|
| $ | 683 |
|
| $ | — |
|
| $ | 600 |
|
Base Sales / Ton |
| $ | 1,258 |
|
| $ | 1,173 |
|
| $ | 2,416 |
|
| $ | 1,482 |
|
| $ | — |
|
| $ | 1,322 |
|
|
|
|
|
|
|
|
|
|
|
|
|
|
|
|
|
|
|
| ||||||
|
| 2021 |
| |||||||||||||||||||||
|
| Industrial |
|
| Automotive |
|
| Aerospace & Defense |
|
| Energy |
|
| Other |
|
| Total |
| ||||||
Ship Tons |
|
| 388.8 |
|
|
| 370.4 |
|
|
| 20.1 |
|
|
| 39.3 |
|
|
| — |
|
|
| 818.6 |
|
|
|
|
|
|
|
|
|
|
|
|
|
|
|
|
|
|
| |||||||
Net Sales |
| $ | 601.0 |
|
| $ | 527.9 |
|
| $ | 60.2 |
|
| $ | 62.9 |
|
| $ | 30.9 |
|
| $ | 1,282.9 |
|
Less: Surcharges |
|
| 208.0 |
|
|
| 167.7 |
|
|
| 10.3 |
|
|
| 22.1 |
|
|
| — |
|
|
| 408.1 |
|
Base Sales |
| $ | 393.0 |
|
| $ | 360.2 |
|
| $ | 49.9 |
|
| $ | 40.8 |
|
| $ | 30.9 |
|
| $ | 874.8 |
|
|
|
|
|
|
|
|
|
|
|
|
|
|
|
|
|
|
| |||||||
Net Sales / Ton |
| $ | 1,546 |
|
| $ | 1,425 |
|
| $ | 2,995 |
|
| $ | 1,601 |
|
| $ | — |
|
| $ | 1,567 |
|
Surcharges / Ton |
| $ | 534 |
|
| $ | 453 |
|
| $ | 512 |
|
| $ | 563 |
|
| $ | — |
|
| $ | 498 |
|
Base Sales / Ton |
| $ | 1,012 |
|
| $ | 972 |
|
| $ | 2,483 |
|
| $ | 1,038 |
|
| $ | — |
|
| $ | 1,069 |
|
33
Liquidity and Capital Resources
Amended Credit Agreement
On October 15, 2019,September 30, 2022, the Company, as borrower, and certain domestic subsidiaries of the Company, as subsidiary guarantors (the “Subsidiary Guarantors”), entered into thea Fourth Amended and Restated Credit Agreement (the “Amended Credit Agreement”), with JP MorganJPMorgan Chase Bank, N.A., as administrative agent Bank of America, N.A.(the “Administrative Agent”), as syndication agent, and the other lenders party thereto (collectively, the “Lenders”), which further amended and restated the Company’s Secondsecured Third Amended and Restated Credit Agreement, dated as of January 26, 2018.October 15, 2019.
The Amended Credit Agreement increased capacity to $400 million compared to $300 million in the previous facility and extended the maturity date of the asset-based revolving credit facility (the “Credit Facility”) from October 2024 to October 15, 2024. Furthermore,September 2027. Following the amendment, Credit Facility capacity remained at $400.0 million. Pursuant to the terms of the Amended Credit Agreement, provided for an enhanced asset base with reappraised fixed assets and investment grade foreign accounts receivable collateral in the borrowing base (up to $30 million), improved interest rate spread pricingto be paid on any borrowings under the Credit Facility is now based on a two-tiered schedule rather than a three-tiered schedule with applicable rates decreasing by 50 basis points, and reduced the unused commitment fee to a fixed 25 basis points, references to LIBOR rates have been updated with references to SOFR rates, the advance rate on investment-grade eligible accounts receivable has been increased from 85% to 90%, and there has been an improvement in the previous 37.5springing fixed charge coverage ratio from 1.1x to 50 basis point range.1.0x. The Credit Facility remains undrawn at this time.
Refer to “Note 14 - Financing Arrangements” in the Notes to the unaudited Consolidated Financial Statements for additional information.
Convertible Notes
In May 2016, the Company issued $75.0 million aggregate principal amount of Convertible Senior Notes due 2021, plus an additional $11.3 million principal amount to cover over-allotments.
In December 2020, the Company entered into separate, privately negotiated exchange agreements with a limited number of holders of the Company’s then outstanding Convertible Senior Notes due 2021. Pursuant to the exchange agreements, the Company exchanged $46.0 million aggregate principal amount of Convertible Senior Notes due 2021 for $46.0 million aggregate principal amount of its new Convertible Senior Notes due 2025. The Company did not receive any cash proceeds from the issuance of the Convertible Senior Notes due 2025.
The remaining Convertible Senior Notes due 2021 matured on June 1, 2021 and were settled with a combination of cash of $38.9 million and 0.1 million shares, as most noteholders exercised their conversion option prior to maturity. The final cash payment for interest was also made to noteholders on June 1, 2021 in the amount of $1.2 million.
The Convertible Senior Notes due 2025 bear cash interest at a rate of 6.0% per year, payable semiannually on June 1 and December 1, beginning on June 1, 2021. The Convertible Senior Notes due 2025 will mature on December 1, 2025, unless earlier repurchased or converted. The net amount of this exchange was $44.5 million, after deducting the initial underwriters’ fees and paying other transaction costs.
The Convertible Senior Notes due 2025 are convertible at the option of holders in certain circumstances and during certain periods into the Company’s common shares, cash, or a combination thereof, at the Company’s election. The Indenture for the Convertible Senior Notes due 2025 provides that notes will become convertible during a quarter when the share price for 20 trading days during the final 30 trading days of the immediately preceding quarter was greater than 130% of the conversion price. This criterion was met during the fourth quarter of 20212023 (and each preceding quarter of 2023) and as such the notes can be converted at the option of the holders beginning January 1 through March 31, 2022.2024. Whether the notes will be convertible following such period will depend on if this criterion, or another conversion condition, is met in the future. To date, no holders have elected to convert their notes at any time during any optional conversion periods in the second half of 2021 orperiods.
In the first quarter of 2022.
In January 2022, TimkenSteel2023, the Company repurchased $5.0a total of $7.5 million aggregate principal amount of outstanding principal related to theits Convertible Senior Notes Due 2025. Total cash paid to noteholders was $12.4$18.7 million. A loss on extinguishment of debt will bewas recognized in the first quarter of 2022 in the amount of $7.5$11.4 million, which includesincluding a charge of $0.1$0.2 million for unamortized debt issuance costs related to the portion of debt extinguished, as well as the related transaction costs. There were no repurchases related to the Convertible Notes during the remainder of 2023. As of
34
December 31, 2023, the principal balance on the Convertible Senior Notes due 2025 is $13.3 million, while the Convertible Senior Notes due 2025, net is $13.2 million after consideration of unamortized debt issuance costs.
In the first half of 2022, the Company repurchased a total of $25.2 million aggregate principal amount of its Convertible Senior Notes Due 2025. There were no repurchases related to the Convertible Notes during the second half of 2022. Total cash paid to noteholders was $67.6 million. A loss on extinguishment of debt was recognized of $43.0 million, including a charge of $0.6 million for unamortized debt issuance costs related to the portion of debt extinguished, as well as the related transaction costs. The principal amount of the Convertible Senior Notes due 2025 as of December 31, 2022 was $20.8 million, while the Convertible Senior Notes due 2025, net was $20.4 million after consideration of unamortized debt issuance costs.
For additional details regarding the Amended Credit Agreement and the Convertible Notes, please refer to “Note 14 - Financing Arrangements” in the Notes to the Consolidated Financial Statements, and for our discussion regarding risk factors related to our business and our debt, see Risk Factors in this Annual Report on Form 10-K.
25
Additional Liquidity Considerations
The following represents a summary of keytotal liquidity measuresavailable under the credit agreementAmended Credit Agreement in effect as of December 31, 20212023 and December 31, 2020:2022:
|
| December 31, |
|
| December 31, |
| ||||||||||
|
| 2021 |
|
| 2020 |
|
| 2023 |
|
| 2022 |
| ||||
Cash and cash equivalents |
| $ | 259.6 |
| $ | 102.8 |
|
| $ | 280.6 |
|
| $ | 257.2 |
| |
Credit Agreement: |
|
|
|
|
|
|
|
|
|
|
|
| ||||
Maximum availability |
| $ | 400.0 |
| $ | 400.0 |
|
| $ | 400.0 |
|
| $ | 400.0 |
| |
Suppressed availability(1) |
| (143.5 | ) |
| (183.2 | ) |
|
| (135.8 | ) |
|
| (161.2 | ) | ||
Availability |
| 256.5 |
| 216.8 |
|
|
| 264.2 |
|
|
| 238.8 |
| |||
Credit facility amount borrowed |
| — |
| — |
|
|
| — |
|
|
| — |
| |||
Letter of credit obligations |
| (5.4 | ) |
| (5.5 | ) |
|
| (5.4 | ) |
|
| (5.3 | ) | ||
Availability not borrowed |
| 251.1 |
| 211.3 |
|
|
| 258.8 |
|
|
| 233.5 |
| |||
Total liquidity |
| $ | 510.7 |
| $ | 314.1 |
|
| $ | 539.4 |
|
| $ | 490.7 |
| |
(1) As of December 31, 20212023 and 2020, TimkenSteel2022, the Company had less than $400$400.0 million in collateral assets to borrow against.
Our principal sources of liquidity are cash and cash equivalents, cash flows from operations and available borrowing capacity under our credit agreement.Amended Credit Agreement. As of December 31, 2021,2023, taking into account our view of mobile, industrial, automotive, aerospace & defense and energy market demand for our products, and our 20222024 operating and long-range plan, we believe that our cash balance as of December 31, 2021,2023, projected cash generated from operations, and borrowings available under the Amended Credit Agreement, will be sufficient to satisfy our working capital needs, capital expenditures and other liquidity requirements associated with our operations, including servicing our debt and pension and postretirement benefit obligations, for at least the next twelve months.
To the extent our liquidity needs prove to be greater than expected or cash generated from operations is less than anticipated, and cash on hand or credit availability is insufficient, we would seek additional financing to provide additional liquidity. We regularly evaluate our potential access to the equity and debt capital markets as sources of liquidity and we believe additional financing would likely be available if necessary, although we can make no assurance as to the form or terms of any such financing.
We continue tocontinually evaluate the best use of our liquidity which would allow us to invest in profitable growth, maintain a strong balance sheet, and return capital to shareholders. Currently, weWe are currently anticipating capital expenditures to be approximately $40$60 million in 2022, with over half of this budget allocated to profitability improvement projects.2024.
We alsoIn the first quarter of 2023, we privately negotiated the early repurchaserepurchases of $5$7.5 million aggregate principal amount of our Convertible Senior Notes Due 2025 in the first quarter of 2022.2025. In addition to reducing outstanding debt and generating $0.3annual interest savings of $0.5
35
million, the repurchases of convertible notes reduced weighted average diluted shares outstanding for the year ended December 31, 2023 by 0.7 million shares and, on a go-forward basis, reduced diluted shares outstanding by 1.0 million shares.
During the first half of 2022, we privately negotiated early repurchases of $25.2 million aggregate principal amount of our Convertible Senior Notes Due 2025. In addition to reducing outstanding debt and generating $1.5 million of annual interest savings, the repurchases of convertible notes repurchase will havereduced diluted shares outstanding for the effect of reducingyear ended December 31, 2022 by 2.3 million shares and, on a go-forward basis, reduced diluted shares outstanding by approximately 0.63.2 million shares beginning in the first quarter of 2022.shares.
On December 20, 2021, TimkenSteelthe Company announced that its Board of Directors had authorized a share repurchase program under which the Company may repurchase up to $50$50.0 million of its outstanding common shares. OurThe share repurchase program iswas intended to return capital to shareholders while also offsetting dilution from annual equity compensation awards. The Company may utilize various methods toAs of December 31, 2022, we consumed the previously approved $50.0 million repurchase shares, which could include open market repurchases, including repurchases through Rule 10b5-1 plans, privately-negotiated transactions or by other means. The actual timing, number and valueprogram.
On November 2, 2022, the Board of shares repurchased underDirectors authorized an additional $75.0 million share repurchase program. This authorization reflects the program, if any, will depend on a number of factors, including the pricecontinued confidence of the Company's shares, general marketBoard and economic conditions, capital needssenior leadership in the Company’s ability to generate sustainable through-cycle profitability while maintaining a strong balance sheet and other factors.cash flow. The share repurchase program does not require the Company to acquire any dollar amount or number of shares and may be modified, suspended, extended or terminated by the Company at any time without prior notice.
Coronavirus Aid, Relief, and Economic Security Act
On March 27, 2020, the President of the United States signed the Coronavirus Aid, Relief, and Economic Security ("CARES") Act, an economic stimulus package intended to provide support, principally in the form of tax benefits, to companies and individuals negatively impacted by the COVID-19 pandemic. Although the majority of the provisions included in the CARES Act did not immediately benefit the Company from a cash tax perspective due to its significant net operating losses, the Company took advantage of the deferral of the employer share (6.2% of employee wages) of Social Security payroll taxes that would otherwise have been owed from the date of enactment of the legislation through December 31, 2020, as afforded by the Act. DuringFor the year ended December 31, 2020,2023, the Company repurchased approximately 1.7 million common shares in the open market at an aggregate cost of $32.6 million, which equates to an average repurchase price of $19.03 per share. As of December 31, 2023, the Company had deferred $6.4a balance of $40.4 million in cash payments and recorded reserves for such deferred payroll taxes in salaries, wages and benefits onremaining under its share repurchase program.
Subsequent to December 31, 2023, the Consolidated Balance Sheets, to be paid in two equal installments. The first installmentCompany repurchased 0.1 million additional common shares in the amountopen market at an aggregate cost of $3.2$1.2 million, was paid duringwhich equates to an average repurchase price of $21.07 per share. As of February 15, 2024, the fourth quarter of 2021. The second installment is due on December 31, 2022.
26
The CARES Act also provided for an employee retention credit (“Employee Retention Credit”), which is a refundable tax credit against certain employment taxes of up to five thousand dollars per employee for eligible employers. The tax credit is equal to 50% of qualified wages paid to employees during a quarter, capped at ten thousand dollars of qualified wages per employee throughout the year. The Company qualified for the tax credit in the second and third quarters of 2020 and accrued a benefit of $2.3 million in the fourth quarter of 2020 related to the Employee Retention Credit in other (income) expense, net on the Company’s Consolidated Statements of Operations. The Company filed for this credit in the second quarter of 2021 and received a portion of the proceeds from the Internal Revenue Service ("IRS") in the amount of $0.5 million during the fourth quarter of 2021. The Company received the remaining $1.8 million of cash proceeds in the first quarter of 2022, which was recorded as a receivable in other current assets on the Consolidated Balance Sheets as of December 31, 2021.
Consolidated Appropriations Act, 2021
On December 27, 2020, the President of the United States signed the Consolidated Appropriation Act, 2021 (“CAA”). The CAA includes additional COVID-19 relief that expands upon the relief provided in the CARES Act, including, but not limited to, the extension of tax deductions, credits, and incentives. The Company has evaluated the CAA for any potential impact. While it was determined that the CAA revised and extended the Employee Retention Credit into 2021, the CAA is not expected to have an impact on the Company as employee furloughs related to the COVID-19 pandemic ceased in 2020. Furthermore, the Company does not expect any of the other provisions within the CAA to provide a benefit.
American Rescue Plan Act of 2021
On March 11, 2021, the President of the United States signed the American Rescue Plan Act of 2021 (“ARPA”). The ARPA strengthens and extends certain programs enacted through the CARES Act and establishes new relief programs aimed at mitigating the financial impact of the COVID-19 pandemic. The provisions within the ARPA have been evaluated and at this time one provision, which offers funding relief for single-employer defined benefit pension plans, is expected to materially impact the Company.
Specifically, the ARPA provides enhanced interest rate stabilization, as well as extended amortization of funding shortfalls. The Company has evaluated and made final the elections permitted by the ARPA related to the required contributions for our TimkenSteel Corporation Bargaining Unit Pension Plan ("Bargaining Plan"). At this time based on current assumptions, the elections made$39.2 million remaining under ARPA and expected asset returns, we believe that required Company contributions to the Bargaining Plan have been delayed until after 2031. However, these estimates are subject to significant uncertainty. Prior to the ARPA, we had expected to make required pension contributions for the Bargaining Plan beginning in 2022.its authorized share repurchase program.
Cash Flows
The following table reflects the major categories of cash flows for the years ended December 31, 2021, 2020,2023, 2022, and 2019.2021. For additional details, please refer to the Consolidated Statements of Cash Flows included in Item 8, "Financial Statements and Supplemental Data" of this Annual Report on Form 10-K.
|
| Year Ended December 31, |
|
| Year Ended December 31, |
| ||||||||||||||||||
|
| 2021 |
|
| 2020 |
|
| 2019 |
|
| 2023 |
|
| 2022 |
|
| 2021 |
| ||||||
Net cash provided (used) by operating activities |
| $ | 196.9 |
| $ | 173.5 |
| $ | 70.3 |
|
| $ | 125.3 |
|
| $ | 134.5 |
|
| $ | 196.9 |
| ||
Net cash provided (used) by investing activities |
| (4.8 | ) |
| (6.0 | ) |
| (38.0 | ) |
|
| (49.9 | ) |
|
| (21.7 | ) |
|
| (4.8 | ) | |||
Net cash provided (used) by financing activities |
| (35.3 | ) |
| (91.8 | ) |
| (26.8 | ) |
|
| (51.9 | ) |
|
| (114.6 | ) |
|
| (35.3 | ) | |||
Increase (Decrease) in Cash and Cash Equivalents |
| $ | 156.8 |
| $ | 75.7 |
| $ | 5.5 |
|
| $ | 23.5 |
|
| $ | (1.8 | ) |
| $ | 156.8 |
| ||
Operating activities
Net cash provided by operating activities for the year ended December 31, 20212023 was $196.9$125.3 million compared to net cash provided of $173.5$134.5 million for the year ended December 31, 2020.2022. The change was primarily due to improved profitability,a higher use of cash for working capital in 2023, partially offset by an increase in working capital, principally inventory, during the year ended December 31, 2021 to support increasing customer demand and production levels, as compared to a drawdown of working capital based on economic conditions during the year ended December 31, 2020. Refer to the Consolidated Statements of Cash Flows for additional information.improved 2023 profitability.
Investing activities
Net cash used by investing activities for the year ended December 31, 20212023 was $4.8$49.9 million compared to net cash used of $6.0$21.7 million for the year ended December 31, 2020.2022. The change was primarily due to lowerhigher capital expenditures as well as proceeds from the sale of TimkenSteel (Shanghai) Corporation Limited. This was partially offset by lower proceeds on disposals of property, plant, and equipment, during the year ended December 31, 2021 compared to the same period of 2020 in which assets were sold primarily related to our closed TMS facility.2023.
27
Financing activities
Net cash used by financing activities for the year ended December 31, 20212023 was $35.3$51.9 million compared to net cash used of $91.8$114.6 million for the year ended December 31, 2020.2022. The change was primarily due to lower repayments on outstanding borrowingsrepurchases of common shares and increased
36
Convertible Notes in 2023, partially offset by decreased proceeds from the exercise of stock options during the year ended December 31, 20212023 compared to the same period of 2020.2022.
Contractual Obligations and Commitments
Our material cash commitments from known contractual and other obligations primarily consist of obligations for long-term debt and related interest, purchase commitments as part of normal operations, retirement benefits, and operating leases for property and equipment.
Refer to “Note 14 - Financing Arrangements” in the Notes to the Consolidated Financial Statements for more information regarding scheduled maturities of our long-term debt. Interest payments include interest on the Convertible Notes, as well as the unused commitment fee of 25 basis points related to the Amended Credit Agreement. Interest payable associated with our debt will be approximately $3.5$1.8 million due in the next twelve months and $9.0$3.5 million due in total starting in 2023 through 2025, the latest maturity date of our outstanding debt.maturity.
Purchase commitments are defined as agreements to purchase goods or services that are enforceable and legally binding. As of December 31, 2021,2023, our undiscounted purchase commitments will beare approximately $46.0$49.1 million due in the next twelve months and $81.6$67.4 million due thereafter. Included in purchase commitments are certain obligations related to capital asset commitments, service agreements and energy consumed in our production processes. These purchase commitments do not represent our entire anticipated purchases in the future but represent only those items for which we are contractually obligated as of December 31, 2021.2023. The majority of our products and services are purchased as needed, with no advance commitment. We do not have any off-balance sheet arrangements with unconsolidated entities or other persons.
Retirement benefits are paid from plan assets and our operating cash flow. These include payments to meet minimum funding requirements of our defined benefit pension plans, estimated benefit payments for our unfunded supplemental executive retirement pension, and estimated benefit payments for our postretirement plans. The retirement benefit funding requirements are estimated required contributions and are significantly affected by asset returns and several other variables. These amounts are subject to change year to year. These amounts are based on Company estimates and current funding laws; actual future payments may be different. Based on the results of the December 31, 2023 pension calculations, the Company estimates required Bargaining Plan contributions of approximately $40 million in 2024, with approximately $25 million of contributions in the first quarter. Refer to “Note 15 - Retirement and Postretirement Plans” in the Notes to the Consolidated Financial Statements for further information related to the total pension and other postretirement benefit plans and expected benefit payments.
Refer to “Note 13 – Leases” in the Notes to the Consolidated Financial Statement for additional information on leases.
Critical Accounting Policies and Estimates
Our financial statements are prepared in accordance with U.S. GAAP. The preparation of these financial statements requires management to make estimates and assumptions that affect the reported amounts of assets and liabilities at the date of the financial statements and the reported amounts of revenues and expenses during the periods presented. We review our critical accounting policies throughout the year.
New Accounting Guidance
See “Note 2 - Significant Accounting Policies” in the Notes to the Consolidated Financial Statements.
Revenue Recognition
We recognizeMetallus recognizes revenue from contracts at a point in time when we haveit has satisfied ourits performance obligationobligations and the customer obtains control of the goods, at the amount that reflects the consideration we expectthe Company expects to receive for those goods. We receive
Substantially all performance obligations arise from the sale of manufactured steel products. The Company receives and acknowledgeacknowledges purchase orders from ourits customers, which define the quantity, pricing, payment and other applicable terms and conditions. In some cases, we receivethe Company receives a blanket purchase order from ourits customer, which includes pricing, payment and other terms and conditions, with quantities defined at the time the customer issues periodic releases from the blanket purchase order.
37
Transfer of control and revenue recognition for substantially all the Company’s sales occur upon shipment or delivery of the product, which is when title, ownership, and risk of loss pass to the customer and is based on the applicable customer shipping terms.
The Company invoices its customers at the time of title transfer. Payment terms are generally 30 days from the invoice date. Invoiced amounts are usually inclusive of shipping and handling activities incurred. Shipping and handling activities billed are included in net sales in the Consolidated Statements of Operations. The related costs incurred by the Company for the delivery of goods are classified as cost of products sold in the Consolidated Statements of Operations.
Certain contracts contain variable consideration, which primarily consists of rebates that are accounted for in net sales and accrued based on the estimated probability of the requirements being met.
Sales returns and allowances are treated as a reduction to net sales and are provided for primarily based on historical experience. These reserves also capture any potential warranty claims, which normally result in returned or replaced product.
The Company’s contracts with certain Manufactured Components customers extend multiple years and generally average five years. While these contracts set the duration of time, they do not cover or guarantee volumes but rather are focused on piece prices, which are established at the inception of the contract. From time to time, subsequent pricing adjustments are agreed to through negotiation. Pricing adjustments are occasionally determined retroactively based on historical shipments. The Company recognizes revenue for these subsequent price adjustments when they are determined to be probable and estimable. For the year ended December 31, 2023, the Company recognized $16.0 million in subsequent pricing adjustments.
Inventory
Inventories are stated at lower of cost or net realizable value. All inventories, including raw materials, manufacturing supplies inventory as well as international (outside the U.S.) inventories, have been valued using the FIFO or average cost method.
28
Long-lived Assets
Long-lived assets (including tangible assets and intangible assets subject to amortization) are reviewed for impairment when events or changes in circumstances have occurred indicating the carrying value of the assets may not be recoverable.
We test recoverability of long-lived assets at the lowest level for which there are identifiable cash flows that are independent from the cash flows of other assets. Assets and asset groups held and used are measured for recoverability by comparing the carrying amount of the asset or asset group to the sum of future undiscounted net cash flows expected to be generated by the asset or asset group.
Assumptions and estimates about future values and remaining useful lives of our long-lived assets are complex and subjective. They can be affected by a variety of factors, including external factors such as industry and economic trends and internal factors such as changes in our business strategy and our internal forecasts.
If an asset or asset group is considered to be impaired, the impairment loss that would be recognized is the amount by which the carrying amount of the assets exceeds the fair value of the assets. To determine fair value, we use internal cash flow estimates discounted at an appropriate interest rate, third party appraisals as appropriate, and/or market prices of similar assets, when available.
As a result of the discontinued use of certain assets, we recorded an impairment charge of $10.6 million in 2021. No impairment charge was recorded in 2020. Refer to “Note 6 – Disposition of Non-Core Assets” in the Notes to the Consolidated Financial Statements for further information.
Income Taxes
We are subject to income taxes in the U.S. and non-U.S. jurisdictions, and we account for income taxes in accordance with applicable accounting guidance. Deferred tax assets and liabilities are recorded for the future tax consequences attributable to differences between financial statement carrying amounts of existing assets and liabilities and their respective tax bases, as well as net operating loss and tax credit carryforwards. Deferred tax assets and liabilities are measured using enacted tax rates expected to apply to taxable income in the years in which temporary differences are expected to be recovered or settled. We record valuation allowances against deferred tax assets by tax jurisdiction when it is more likely than not that such assets will not be realized. In determining the need for a valuation allowance, the historical and projected financial performance of the entity recording the net deferred tax asset is considered along with any other pertinent information. Net deferred tax assets relate primarily to net operating losses and pension and other postretirement benefit obligations in the U.S., which we believe are more likely than not to result in future tax benefits. As of December 31, 2021, we have recorded a valuation allowance on our net deferred tax assets in the U.S., as we do not believe it is more likely than not that a portion of our U.S. deferred tax assets will be realized.
In the ordinary course of our business, there are many transactions and calculations regarding which the ultimate income tax determination is uncertain. We are regularly under audit by tax authorities. Accruals for uncertain tax positions are provided for in accordance with the requirements of applicable accounting guidance. We record interest and penalties related to uncertain tax positions as a component of income tax expense.
Benefit Plans
We recognizeMetallus recognizes an overfunded status or underfunded status (i.e.(e.g., the difference between the fair value of plan assets and the benefit obligations) as either an asset or a liability for ourits defined benefit pension and other postretirement benefit plans on the Consolidated Balance Sheets. We recognizeThe Company recognizes actuarial gains and losses immediately through net periodic benefit cost in the Consolidated Statements of Operations upon the annual remeasurement at December 31, or on an interim basis as triggering events warrant remeasurement. An example of a potential triggering event would be settlements. The Company’s accounting policy is to recognize settlements during the quarter in which it is projected that the costs of all settlements during the
38
year will be greater than the sum of the service cost and interest cost components of net periodic benefit cost. In addition, we usethe Company uses fair value to account for the value of plan assets.
As of December 31, 2021,2023, our projected benefit obligations related to our pension and other postretirement benefit plans were $1,319.2$688.6 million and $117.8$84.9 million, respectively, and the underfunded status of our pension and other postretirement benefit obligations were $143.2$163.0 million and $41.0$31.1 million, respectively. These benefit obligations were valued using a weighted average discount rate of 2.96%5.33% for pension benefit plans and 3.00%5.43% for other postretirement benefit plans. The determination of the discount rate is generally based on an index created from a hypothetical bond portfolio consisting of high-quality fixed income securities with durations that match the timing of expected benefit payments. Changes in the selected discount rate could have a material impact on our projected benefit obligations and the unfunded status of our pension and other postretirement benefit plans.
For the year ended December 31, 2021,2023, net periodic pension expense was $49.1 million and postretirement benefit income was $28.8 million and $9.9$2.1 million, respectively. In 2021,2023, net periodic pension expense and other postretirement benefit income was calculated using a variety of assumptions, including a weighted average discount rate of 2.68%5.61% and 2.65%5.70%, respectively, and a weighted average expected return on plan assets of 5.76%7.13% and 4.50%6.25%, respectively. The expected return on plan assets is determined based on forward-looking current market pricing. The forward-looking analysis
29
is performed using a building block approach incorporating inputs such as current yields, valuations, economic data and broad macroeconomic themes.
The net periodic benefit income and benefit obligation are affected by applicable year-end assumptions. Sensitivities to these assumptions may be asymmetric and are specific to the time periods noted. The impact of changing multiple factors simultaneously cannot be calculated by combining the individual sensitivities. The sensitivity to changes in discount rate assumptions may not be linear. A sensitivity analysis of the projected incremental effect of a 0.25% increase (decrease), holding all other assumptions constant, is as follows:
|
| Hypothetical Rate |
|
| Hypothetical rate |
| ||||||||||
|
| Increase (decrease) |
|
| increase (decrease) |
| ||||||||||
|
| 0.25% |
|
| (0.25)% |
|
| 0.25% |
|
| (0.25)% |
| ||||
Discount Rate |
|
|
|
|
|
| ||||||||||
Discount rate |
|
|
|
|
|
| ||||||||||
Net periodic benefit income, prior to annual remeasurement gains or losses |
| $ | 1.9 |
| $ | (2.0 | ) |
| $ | 0.8 |
|
| $ | (0.8 | ) | |
Benefit obligation |
| $ | (36.3 | ) |
| $ | 38.0 |
|
| $ | (15.8 | ) |
| $ | 16.4 |
|
Return on plan assets |
|
|
|
|
|
|
|
|
|
|
|
| ||||
Net periodic benefit income, prior to annual remeasurement gains or losses |
| $ | (3.0 | ) |
| $ | 3.0 |
|
| $ | (1.4 | ) |
| $ | 1.4 |
|
AggregateIn 2024, net periodic pension and other postretirement benefit income for 2022expense is forecasted to be $11.5$8.4 million, and $5.0 million, respectively.while postretirement benefit income is forecasted to be $3.9 million. This estimate is based on a weighted average discount rate of 2.96%5.33% for the pension benefit plans and 3.00%5.43% for other postretirement benefit plans, as well as a weighted average expected return on assets of 5.96%7.15% for the pension benefit plans and 4.75%5.80% for the other postretirement benefit plans. Actual cost also is dependent on various other factors related to the employees covered by these plans. Adjustments to our actuarial assumptions could have a material adverse impact on our operating results.
Please refer to “Note 15 - Retirement and Postretirement Plans” in the Notes to the Consolidated Financial Statements for further information related to our pension and other postretirement benefit plans.
Other Loss Reserves
We have a number of loss exposures that are incurred in the ordinary course of business, such as environmental claims, product liability claims, product warranty claims, litigation and accounts receivable reserves. Establishing loss reserves for these matters requires management’s estimate and judgment with regard to risk exposure and ultimate liability or realization. These loss reserves are reviewed periodically and adjustments are made to reflect the most recent facts and circumstances. These other loss reserves have an immaterial impact on the Consolidated Financial Statements.
Forward-Looking Statements
Certain statements set forth in this Annual Report on Form 10-K (including our forecasts, beliefs and expectations) that are not historical in nature are “forward-looking” statements within the meaning of the Private Securities Litigation Reform Act of 1995. In particular, Management’s Discussion and Analysis of Financial Condition and Results of Operations contains numerous forward-looking statements. Forward-looking statements generally will be accompanied by words such as “anticipate,” “aspire,” “believe,” “could,” “estimate,” “expect,” “forecast,” “outlook,” “intend,” “may,” “plan,” “possible,” “potential,” “predict,” “project,” “seek,” “should,” "strategic“strategic direction," "strategy,"” “strategy,” “target,” “will,” “would,” or other similar words, phrases or expressions that convey the uncertainty of future events or outcomes. You
39
are cautioned not to place undue reliance on forward-looking statements, which speak only as of the date of this Form 10-K. We caution readers that actual results may differ materially from those expressed or implied in forward-looking statements made by or on behalf of us due to a variety of factors, such as:
•
30
40
You are cautioned that it is not possible to predict or identify all of the risks, uncertainties and other factors that may affect future results, and that the above list should not be considered to be a complete list. Except as required by the federal securities laws, we undertake no obligation to publicly update or revise any forward-looking statement, whether as a result of new information, future events or otherwise. Further, this report includes our current policy and intent and is not intended to create legal rights or obligations. Certain standards of measurement and performance contained in this report are developing and based on assumptions, and no assurance can be given that any plan, objective, initiative, projection, goal, mission, commitment, expectation, or prospect set forth in this report can or will be achieved. Inclusion of information in this report is not an indication that the subject or information is material to our business or operating results.
41
31
Item 7A. Quantitative and Qualitative Disclosures About Market Risk
Interest Rate Risk
Our borrowings include both fixed and variable-rate debt. The variable debt consists principally of borrowings under our Credit Agreement. We are exposed to the risk of rising interest rates to the extent we fund our operations with these variable-rate borrowings. As of December 31, 2021,2023, we have $46.0$13.3 million of aggregate debt outstanding. None of our outstanding debt as of December 31, 20212023 has variable interest rates, thus a rise in interest rates would not impact our interest expense at this point in time.
Foreign Currency Exchange Rate Risk
Fluctuations in the value of the U.S. dollar compared to foreign currencies may impact our earnings. Geographically, our sales are primarily made to customers in the United States. Currency fluctuations could impact us to the extent they impact the currency or the price of raw materials in foreign countries in which our competitors operate or have significant sales.
Commodity Price Risk
In the ordinary course of business, we are exposed to market risk with respect to commodity price fluctuations, primarily related to our purchases of raw materials and energy, principally scrap steel, other ferrous and non-ferrous metals, alloys, natural gas and electricity. Additionally, the current and potential future global conflicts could also exacerbate inflationary pressures throughout the global economy and lead to potential market disruptions, such as significant volatility in commodity prices and supply chain disruptions. Although our business has not been materially impacted by current conflicts to date, it is difficult to predict the extent to which our operations, or those of our suppliers, will be impacted in the future.
Whenever possible, we manage our exposure to commodity risks primarily through the use of supplier pricing agreements that enable us to establish the purchase prices for certain inputs that are used in our manufacturing business. We utilize a raw material surcharge as a component of pricing steel to pass through the cost increases of scrap, alloys and other raw materials, as well as natural gas. From time to time, we may use financial instruments to hedge a portion of our exposure to commodity price risk related to commodities.risk. In periods of stable demand for our products, the surcharge mechanism has worked effectively to reduce the normal time lag in passing through higher raw material costs so that we can maintain our gross margins. When demand and cost of raw materials are lower, however, the surcharge impacts sales prices to a lesser extent.
3242
Item 8. Financial Statements and Supplementary Data
Index to Consolidated Financial Statements
Page | |
Reports of Independent Registered Public Accounting Firm (Ernst & Young, LLP, PCAOB ID:42) |
|
Consolidated Statements of Operations |
|
| |
Consolidated Balance Sheets |
|
| |
| |
|
3343
Report of Independent Registered Public Accounting Firm
To the Shareholders and the Board of Directors of TimkenSteel CorporationMetallus Inc.
Opinion on the Financial Statements
We have audited the accompanying consolidated balance sheets of TimkenSteel CorporationMetallus Inc. (the Company) as of December 31, 20212023 and 2020,2022, and the related consolidated statements of operations, comprehensive income (loss), shareholders' equity and cash flows for each of the three years in the period ended December 31, 2021,2023, and the related notes and the financial statement schedule includedlisted in the Index at Item 15a (collectively referred to as the “consolidated financial statements”). In our opinion, the consolidated financial statements present fairly, in all material respects, the consolidated financial position of the Company at December 31, 20212023 and 2020,2022, and the consolidated results of its operations and its cash flows for each of the three years in the period ended December 31, 2021,2023, in conformity with U.S. generally accepted accounting principles.
We also have audited, in accordance with the standards of the Public Company Accounting Oversight Board (United States) (PCAOB), the Company's internal control over financial reporting as of December 31, 2021,2023, based on criteria established in Internal Control-IntegratedControl—Integrated Framework issued by the Committee of Sponsoring Organizations of the Treadway Commission (2013 framework), and our report dated February 24, 2022,28, 2024, expressed an unqualified opinion thereon.
Basis for Opinion
These financial statements are the responsibility of the Company's management. Our responsibility is to express an opinion on the Company’s financial statements based on our audits. We are a public accounting firm registered with the PCAOB and are required to be independent with respect to the Company in accordance with the U.S. federal securities laws and the applicable rules and regulations of the Securities and Exchange Commission and the PCAOB.
We conducted our audits in accordance with the standards of the PCAOB. Those standards require that we plan and perform the audit to obtain reasonable assurance about whether the financial statements are free of material misstatement, whether due to error or fraud. Our audits included performing procedures to assess the risks of material misstatement of the financial statements, whether due to error or fraud, and performing procedures that respond to those risks. Such procedures included examining, on a test basis, evidence regarding the amounts and disclosures in the financial statements. Our audits also included evaluating the accounting principles used and significant estimates made by management, as well as evaluating the overall presentation of the financial statements. We believe that our audits provide a reasonable basis for our opinion.
34Critical Audit Matter
The critical audit matter communicated below is a matter arising from the current period audit of Contentsthe financial statements that was communicated or required to be communicated to the audit committee and that: (1) relates to accounts or disclosures that are material to the financial statements and (2) involved our especially challenging, subjective or complex judgments. The communication of the critical audit matter does not alter in any way our opinion on the consolidated financial statements, taken as a whole, and we are not, by communicating the critical audit matter below, providing a separate opinion on the critical audit matter or on the accounts or disclosures to which it relates.
| ||
|
| Accounting for pension and other postretirement benefit obligations |
Description of the Matter |
| At December 31, |
44
financial statements, the Company recognizes actuarial gains and losses immediately through net periodic benefit cost upon the annual remeasurement in the fourth quarter, or on an interim basis if specific events trigger a remeasurement, through updating the estimates used to measure the defined benefit pension and other postretirement benefit obligations and plan assets to reflect the actual return on plan assets and updated actuarial assumptions. Auditing the defined benefit pension and other postretirement benefit obligations was complex due to the highly judgmental nature of the actuarial assumptions (e.g., discount rate and mortality | ||
How |
| We obtained an understanding, evaluated the design and tested the operating effectiveness of controls over the Company’s accounting for the measurement of defined benefit pension and other postretirement benefit obligations. For example, we tested controls over management’s review of the defined benefit pension and other postretirement benefit obligation calculations, the relevant data inputs and the significant actuarial assumptions, discussed above, used in the calculations. To test the defined benefit pension and other postretirement benefit obligations, our audit procedures included, among others, evaluating the methodology used, the significant actuarial assumptions discussed above, and the underlying data used by the Company. We compared the actuarial assumptions used by management to historical trends and evaluated the change in the defined benefit pension and other postretirement benefit obligations from prior year due to the change in service cost, interest cost, actuarial gains and losses, benefit payments, contributions and other activities. In addition, we involved an actuarial specialist to assist with our procedures. For example, we evaluated management’s methodology for determining the discount rate that reflects the maturity and duration of the benefit payments and is used to measure the defined benefit pension and other postretirement benefit obligations. In certain instances, as part of this assessment, we compared the projected cash flows to prior year and compared the current year benefits paid to the prior year projected cash flows. To evaluate the mortality rate, |
/s/ Ernst & Young LLP
We have served as the Company’s auditors since 2012.
Cleveland, Ohio
February 24, 202228, 2024
3545
Report of Independent Registered Public Accounting Firm
To the Shareholders and the Board of Directors of TimkenSteel CorporationMetallus Inc.
Opinion on Internal Control overOver Financial Reporting
We have audited TimkenSteel Corporation’sMetallus Inc.’s internal control over financial reporting as of December 31, 2021,2023, based on criteria established in Internal Control—Integrated Framework issued by the Committee of Sponsoring Organizations of the Treadway Commission (2013 framework) (the COSO criteria). In our opinion, TimkenSteel CorporationMetallus Inc. (the Company) maintained, in all material respects, effective internal control over financial reporting as of December 31, 2021,2022, based on the COSO criteria.
We also have audited, in accordance with the standards of the Public Company Accounting Oversight Board (United States) (PCAOB), the consolidated balance sheets of the Company as of December 31, 20212023 and 2020, and2022, the related consolidated statements of operations, comprehensive income (loss), shareholders' equity and cash flows for each of the three years in the period ended December 31, 2021,2023, and the related notes and the financial statement schedule includedlisted in the Index at Item 15a and our report dated February 24, 202228, 2024 expressed an unqualified opinion thereon.
Basis for Opinion
The Company’s management is responsible for maintaining effective internal control over financial reporting and for its assessment of the effectiveness of internal control over financial reporting included in the accompanying Report of Management on Internal Control overOver Financial Reporting. Our responsibility is to express an opinion on the Company’s internal control over financial reporting based on our audit. We are a public accounting firm registered with the PCAOB and are required to be independent with respect to the Company in accordance with the U.S. federal securities laws and the applicable rules and regulations of the Securities and Exchange Commission and the PCAOB.
We conducted our audit in accordance with the standards of the PCAOB. Those standards require that we plan and perform the audit to obtain reasonable assurance about whether effective internal control over financial reporting was maintained in all material respects.
Our audit included obtaining an understanding of internal control over financial reporting, assessing the risk that a material weakness exists, testing and evaluating the design and operating effectiveness of internal control based on the assessed risk, and performing such other procedures as we considered necessary in the circumstances. We believe that our audit provides a reasonable basis for our opinion.
Definition and Limitations of Internal Control Over Financial Reporting
A company’s internal control over financial reporting is a process designed to provide reasonable assurance regarding the reliability of financial reporting and the preparation of financial statements for external purposes in accordance with generally accepted accounting principles. A company’s internal control over financial reporting includes those policies and procedures that (1) pertain to the maintenance of records that, in reasonable detail, accurately and fairly reflect the transactions and dispositions of the assets of the company; (2) provide reasonable assurance that transactions are recorded as necessary to permit preparation of financial statements in accordance with generally accepted accounting principles, and that receipts and expenditures of the company are being made only in accordance with authorizations of management and directors of the company; and (3) provide reasonable assurance regarding prevention or timely detection of unauthorized acquisition, use, or disposition of the company’s assets that could have a material effect on the financial statements.
Because of its inherent limitations, internal control over financial reporting may not prevent or detect misstatements. Also, projections of any evaluation of effectiveness to future periods are subject to the risk that controls may become inadequate because of changes in conditions, or that the degree of compliance with the policies or procedures may deteriorate.
/s/ Ernst & Young LLP
Cleveland, Ohio
February 24, 202228, 2024
3646
TimkenSteel CorporationMetallus Inc.
Consolidated Statements of Operations
|
| Year Ended December 31, |
|
| Year Ended December 31, |
| ||||||||||||||||||
|
| 2021 |
|
| 2020 |
|
| 2019 |
|
| 2023 |
|
| 2022 |
|
| 2021 |
| ||||||
(Dollars in millions, except per share data) |
|
|
|
|
|
|
|
|
|
|
|
|
|
|
|
|
|
| ||||||
Net sales |
| $ | 1,282.9 |
| $ | 830.7 |
| $ | 1,208.8 |
|
| $ | 1,362.4 |
|
| $ | 1,329.9 |
|
| $ | 1,282.9 |
| ||
Cost of products sold |
| 1,062.9 |
| 815.1 |
| 1,186.2 |
|
|
| 1,175.9 |
|
|
| 1,203.2 |
|
|
| 1,062.9 |
| |||||
Gross Profit |
| 220.0 |
| 15.6 |
| 22.6 |
|
|
| 186.5 |
|
|
| 126.7 |
|
|
| 220.0 |
| |||||
|
|
|
|
|
|
|
|
|
|
|
|
|
|
| ||||||||||
Selling, general and administrative expenses |
| 77.2 |
| 76.7 |
| 91.8 |
|
|
| 84.6 |
|
|
| 73.8 |
|
|
| 77.2 |
| |||||
Restructuring charges |
| 6.7 |
| 3.1 |
| 8.6 |
|
|
| — |
|
|
| 0.8 |
|
|
| 6.7 |
| |||||
Loss on sale of consolidated subsidiary |
| 1.1 |
| — |
| — |
|
|
| — |
|
|
| — |
|
|
| 1.1 |
| |||||
Loss (gain) on sale or disposal of assets, net |
| 1.3 |
| (2.4 | ) |
| 2.0 |
|
|
| (2.5 | ) |
|
| 1.9 |
|
|
| 1.3 |
| ||||
Impairment charges |
| 10.6 |
| — |
| 7.3 |
|
|
| — |
|
|
| — |
|
|
| 10.6 |
| |||||
Interest expense |
| 5.9 |
| 12.2 |
| 15.7 |
| |||||||||||||||||
Interest (income) expense, net |
|
| (7.1 | ) |
|
| 0.6 |
|
|
| 5.9 |
| ||||||||||||
Loss on extinguishment of debt |
| — |
| 0.9 |
| — |
|
|
| 11.4 |
|
|
| 43.1 |
|
|
| — |
| |||||
Other (income) expense, net |
| (59.5 | ) |
| (14.2 | ) |
| 23.3 |
|
|
| 3.7 |
|
|
| (90.6 | ) |
|
| (59.5 | ) | |||
Income (Loss) Before Income Taxes |
| 176.7 |
| (60.7 | ) |
| (126.1 | ) |
|
| 96.4 |
|
|
| 97.1 |
|
|
| 176.7 |
| ||||
Provision (benefit) for income taxes |
| 5.7 |
| 1.2 |
| (16.1 | ) |
|
| 27.0 |
|
|
| 32.0 |
|
|
| 5.7 |
| |||||
Net Income (Loss) |
| $ | 171.0 |
| $ | (61.9 | ) |
| $ | (110.0 | ) |
| $ | 69.4 |
|
| $ | 65.1 |
|
| $ | 171.0 |
| |
|
|
|
|
|
|
|
|
|
|
|
|
|
|
|
|
|
|
| ||||||
Per Share Data: |
|
|
|
|
|
|
|
|
|
|
|
|
|
|
|
|
|
| ||||||
Basic earnings (loss) per share |
| $ | 3.73 |
| $ | (1.38 | ) |
| $ | (2.46 | ) |
| $ | 1.58 |
|
| $ | 1.42 |
|
| $ | 3.73 |
| |
Diluted earnings (loss) per share |
| $ | 3.18 |
| $ | (1.38 | ) |
| $ | (2.46 | ) |
| $ | 1.47 |
|
| $ | 1.30 |
|
| $ | 3.18 |
| |
See accompanying Notes to the Consolidated Financial Statements.
3747
TimkenSteel CorporationMetallus Inc.
Consolidated Statements of Comprehensive Income (Loss)
|
| Year Ended December 31, |
|
| Year Ended December 31, |
| ||||||||||||||||||
|
| 2021 |
|
| 2020 |
|
| 2019 |
|
| 2023 |
|
| 2022 |
|
| 2021 |
| ||||||
(Dollars in millions) |
|
|
|
|
|
|
|
|
|
|
|
|
|
|
|
|
|
| ||||||
Net income (loss) |
| $ | 171.0 |
| $ | (61.9 | ) |
| $ | (110.0 | ) |
| $ | 69.4 |
|
| $ | 65.1 |
|
| $ | 171.0 |
| |
Other comprehensive income (loss), net of tax of $0.1 million in 2020 and $16.7 million in 2019: |
|
|
|
|
|
|
|
|
| |||||||||||||||
Other comprehensive income (loss), net of tax of $0.2 million in 2023, $0.4 million in 2022, and none in 2021: |
|
|
|
|
|
|
|
|
| |||||||||||||||
Foreign currency translation adjustments |
| 0.3 |
| 1.4 |
| 0.5 |
|
|
| 0.3 |
|
|
| (1.7 | ) |
|
| 0.3 |
| |||||
Pension and postretirement liability adjustments |
| (20.0 | ) |
| (5.7 | ) |
| 53.1 |
|
|
| (2.6 | ) |
|
| (4.3 | ) |
|
| (20.0 | ) | |||
Other comprehensive income (loss), net of tax |
| (19.7 | ) |
| (4.3 | ) |
| 53.6 |
|
|
| (2.3 | ) |
|
| (6.0 | ) |
|
| (19.7 | ) | |||
Comprehensive Income (Loss), net of tax |
| $ | 151.3 |
| $ | (66.2 | ) |
| $ | (56.4 | ) |
| $ | 67.1 |
|
| $ | 59.1 |
|
| $ | 151.3 |
| |
See accompanying Notes to the Consolidated Financial Statements.
3848
TimkenSteel CorporationMetallus Inc.
Consolidated Balance Sheets
|
| December 31, |
|
| December 31, |
| ||||||||||
|
| 2021 |
|
| 2020 |
|
| 2023 |
|
| 2022 |
| ||||
(Dollars in millions) |
|
|
|
|
|
|
|
|
|
|
|
| ||||
ASSETS |
|
|
|
|
|
|
|
|
|
|
|
| ||||
Current Assets |
|
|
|
|
|
|
|
|
|
|
|
| ||||
Cash and cash equivalents |
| $ | 259.6 |
| $ | 102.8 |
|
| $ | 280.6 |
|
| $ | 257.2 |
| |
Accounts receivable, net of allowances (2021 - $1.9 million; 2020 - $1.3 million) |
| 100.5 |
| 63.3 |
| |||||||||||
Accounts receivable, net of allowances (2023 - $2.0 million; 2022 - $1.0 million) |
|
| 113.2 |
|
|
| 79.4 |
| ||||||||
Inventories, net |
| 210.9 |
| 178.4 |
|
|
| 228.0 |
|
|
| 192.4 |
| |||
Deferred charges and prepaid expenses |
| 3.9 |
| 4.0 |
|
|
| 10.3 |
|
|
| 6.4 |
| |||
Assets held for sale |
| 4.3 |
| 0.3 |
| |||||||||||
Other current assets |
| 3.1 |
| 8.8 |
|
|
| 24.7 |
|
|
| 21.2 |
| |||
Total Current Assets |
| 582.3 |
| 357.6 |
|
|
| 656.8 |
|
|
| 556.6 |
| |||
|
|
|
|
|
|
|
|
|
|
| ||||||
Property, plant and equipment, net |
| 510.2 |
| 569.8 |
|
|
| 492.5 |
|
|
| 486.1 |
| |||
Operating lease right-of-use assets |
| 14.5 |
| 21.0 |
|
|
| 11.4 |
|
|
| 12.5 |
| |||
Pension assets |
| 43.1 |
| 33.5 |
|
|
| 9.9 |
|
|
| 19.4 |
| |||
Intangible assets, net |
| 6.7 |
| 9.3 |
|
|
| 2.7 |
|
|
| 5.0 |
| |||
Other non-current assets |
| 2.1 |
| 2.8 |
|
|
| 2.0 |
|
|
| 2.4 |
| |||
Total Assets |
| $ | 1,158.9 |
| $ | 994.0 |
|
| $ | 1,175.3 |
|
| $ | 1,082.0 |
| |
|
|
|
|
|
|
|
|
|
|
|
|
| ||||
LIABILITIES AND SHAREHOLDERS’ EQUITY |
|
|
|
|
|
|
|
|
|
|
|
| ||||
Current Liabilities |
|
|
|
|
|
|
|
|
|
|
|
| ||||
Accounts payable |
| $ | 141.9 |
| $ | 89.5 |
|
| $ | 133.3 |
|
| $ | 113.2 |
| |
Salaries, wages and benefits |
| 37.9 |
| 29.4 |
|
|
| 26.8 |
|
|
| 21.2 |
| |||
Accrued pension and postretirement costs |
| 4.3 |
| 2.3 |
|
|
| 43.5 |
|
|
| 2.0 |
| |||
Current operating lease liabilities |
| 5.7 |
| 7.5 |
|
|
| 5.0 |
|
|
| 6.0 |
| |||
Current convertible notes, net |
| 44.9 |
| 38.9 |
|
|
| 13.2 |
|
|
| 20.4 |
| |||
Other current liabilities |
| 16.1 |
| 13.4 |
|
|
| 26.6 |
|
|
| 23.9 |
| |||
Total Current Liabilities |
| 250.8 |
| 181.0 |
|
|
| 248.4 |
|
|
| 186.7 |
| |||
|
|
|
|
|
|
|
|
|
|
| ||||||
Non-current convertible notes, net |
| — |
| 39.3 |
| |||||||||||
Credit Agreement |
| — |
| — |
|
|
| — |
|
|
| — |
| |||
Non-current operating lease liabilities |
| 8.8 |
| 13.5 |
|
|
| 6.4 |
|
|
| 6.5 |
| |||
Accrued pension and postretirement costs |
| 223.0 |
| 240.7 |
|
|
| 160.5 |
|
|
| 162.9 |
| |||
Deferred income taxes |
| 2.2 |
| 1.0 |
|
|
| 15.0 |
|
|
| 25.9 |
| |||
Other non-current liabilities |
| 9.5 |
| 11.0 |
|
|
| 13.4 |
|
|
| 13.5 |
| |||
Total Liabilities |
| 494.3 |
| 486.5 |
|
|
| 443.7 |
|
|
| 395.5 |
| |||
|
|
|
|
|
|
|
|
|
|
| ||||||
Shareholders’ Equity |
|
|
|
|
|
|
|
|
|
|
|
| ||||
Preferred shares, without par value; authorized 10.0 million shares, NaN issued |
| 0 |
| 0 |
| |||||||||||
Common shares, without par value; authorized 200.0 million shares; issued 2021 - 46.3 million shares; issued 2020 - 45.7 million shares |
| 0 |
| 0 |
| |||||||||||
Preferred shares, without par value; authorized 10.0 million shares, none issued |
|
| — |
|
|
| — |
| ||||||||
Common shares, without par value; authorized 200.0 million shares; issued 2023 - 47.1 million shares; issued 2022 - 47.1 million shares |
|
| — |
|
|
| — |
| ||||||||
Additional paid-in capital |
| 832.1 |
| 843.4 |
|
|
| 844.2 |
|
|
| 847.0 |
| |||
Retained deficit |
| (188.2 | ) |
| (363.4 | ) |
|
| (53.7 | ) |
|
| (123.1 | ) | ||
Treasury shares - 2021 - NaN; 2020 - 0.6 million |
| — |
| (12.9 | ) | |||||||||||
Treasury shares - 2023 - 4.0 million; 2022 - 3.0 million |
|
| (71.3 | ) |
|
| (52.1 | ) | ||||||||
Accumulated other comprehensive income (loss) |
| 20.7 |
| 40.4 |
|
|
| 12.4 |
|
|
| 14.7 |
| |||
Total Shareholders’ Equity |
| 664.6 |
| 507.5 |
|
|
| 731.6 |
|
|
| 686.5 |
| |||
Total Liabilities and Shareholders’ Equity |
| $ | 1,158.9 |
| $ | 994.0 |
|
| $ | 1,175.3 |
|
| $ | 1,082.0 |
| |
See accompanying Notes to the Consolidated Financial Statements.
3949
TimkenSteel CorporationMetallus Inc.
|
| Common |
|
| Additional |
|
| Retained |
|
| Treasury |
|
| Accumulated |
|
| Total |
| ||||||||||||||||||||||||||||||
Balance as of December 31, 2018 |
| 44,584,668 |
| $ | 846.3 |
| $ | (191.5 | ) |
| $ | (33.0 | ) | �� | $ | (8.9 | ) |
| $ | 612.9 |
| |||||||||||||||||||||||||||
Net income (loss) |
| — |
| — |
| (110.0 | ) |
| — |
| — |
| (110.0 | ) | ||||||||||||||||||||||||||||||||||
Other comprehensive income (loss) |
| — |
| — |
| — |
| — |
| 53.6 |
| 53.6 |
| |||||||||||||||||||||||||||||||||||
Stock-based compensation expense |
| — |
| 7.4 |
| — |
| — |
| — |
| 7.4 |
| |||||||||||||||||||||||||||||||||||
Stock option activity |
| — |
| 0.2 |
| — |
| — |
| — |
| 0.2 |
| |||||||||||||||||||||||||||||||||||
Issuance of treasury shares |
| 321,739 |
| (9.1 | ) |
| — |
| 9.1 |
| — |
| — |
| ||||||||||||||||||||||||||||||||||
Shares surrendered for taxes |
| (86,254 | ) |
| — |
| — |
| (1.0 | ) |
| — |
| (1.0 | ) | |||||||||||||||||||||||||||||||||
Balance at December 31, 2019 |
| 44,820,153 |
| $ | 844.8 |
| $ | (301.5 | ) |
| $ | (24.9 | ) |
| $ | 44.7 |
| $ | 563.1 |
| ||||||||||||||||||||||||||||
Net income (loss) |
| — |
| — |
| (61.9 | ) |
| — |
| — |
| (61.9 | ) | ||||||||||||||||||||||||||||||||||
Other comprehensive income (loss) |
| — |
| — |
| — |
| — |
| (4.3 | ) |
| (4.3 | ) | ||||||||||||||||||||||||||||||||||
Stock-based compensation expense |
| — |
| 6.6 |
| — |
| — |
| — |
| 6.6 |
| |||||||||||||||||||||||||||||||||||
Issuance of treasury shares |
| 486,260 |
| (12.6 | ) |
| — |
| 12.6 |
| — |
| — |
| ||||||||||||||||||||||||||||||||||
Shares surrendered for taxes |
| (142,105 | ) |
| — |
| — |
| (0.6 | ) |
| — |
| (0.6 | ) | |||||||||||||||||||||||||||||||||
Equity component of convertible notes, net |
| — |
| 4.6 |
| — |
| — |
| — |
| 4.6 |
| |||||||||||||||||||||||||||||||||||
(Dollars in millions) |
| Common |
|
| Additional |
|
| Retained |
|
| Treasury |
|
| Accumulated |
|
| Total |
| ||||||||||||||||||||||||||||||
Balance at December 31, 2020 |
| 45,164,308 |
| $ | 843.4 |
| $ | (363.4 | ) |
| $ | (12.9 | ) |
| $ | 40.4 |
| $ | 507.5 |
|
|
| 45,164,308 |
|
| $ | 843.4 |
|
| $ | (363.4 | ) |
| $ | (12.9 | ) |
| $ | 40.4 |
|
| $ | 507.5 |
| ||||
Net income (loss) |
| — |
| — |
| 171.0 |
| — |
| — |
| 171.0 |
|
|
| — |
|
|
| — |
|
|
| 171.0 |
|
|
| — |
|
|
| — |
|
|
| 171.0 |
| |||||||||||
Other comprehensive income (loss) |
| — |
| — |
| — |
| — |
| (19.7 | ) |
| (19.7 | ) |
|
| — |
|
|
| — |
|
|
| — |
|
|
| — |
|
|
| (19.7 | ) |
|
| (19.7 | ) | ||||||||||
Adoption of new accounting standard |
| — |
| (10.6 | ) |
| 4.2 |
| — |
| — |
| (6.4 | ) |
|
| — |
|
|
| (10.6 | ) |
|
| 4.2 |
|
|
| — |
|
|
| — |
|
|
| (6.4 | ) | ||||||||||
Stock-based compensation expense |
| 272,462 |
| 7.3 |
| — |
| — |
| — |
| 7.3 |
|
|
| 272,462 |
|
|
| 7.3 |
|
|
| — |
|
|
| — |
|
|
| — |
|
|
| 7.3 |
| |||||||||||
Stock option activity |
| 152,940 |
| 4.1 |
| — |
| — |
| — |
| 4.1 |
|
|
| 152,940 |
|
|
| 4.1 |
|
|
| — |
|
|
| — |
|
|
| — |
|
|
| 4.1 |
| |||||||||||
Issuance of treasury shares |
| 638,093 |
| (13.4 | ) |
| — |
| 13.4 |
| — |
| — |
|
|
| 638,093 |
|
|
| (13.4 | ) |
|
| — |
|
|
| 13.4 |
|
|
| — |
|
|
| — |
| ||||||||||
Shares surrendered for taxes |
| (72,174 | ) |
| — |
| — |
| (0.5 | ) |
| — |
| (0.5 | ) |
|
| (72,174 | ) |
|
| — |
|
|
| — |
|
|
| (0.5 | ) |
|
| — |
|
|
| (0.5 | ) | |||||||||
Convertible notes settlement |
| 113,226 |
| 1.3 |
| — |
| — |
| — |
| 1.3 |
|
|
| 113,226 |
|
|
| 1.3 |
|
|
| — |
|
|
| — |
|
|
| — |
|
|
| 1.3 |
| |||||||||||
Balance at December 31, 2021 |
| 46,268,855 |
|
| $ | 832.1 |
| $ | (188.2 | ) |
| $ | — |
| $ | 20.7 |
| $ | 664.6 |
|
|
| 46,268,855 |
|
| $ | 832.1 |
|
| $ | (188.2 | ) |
| $ | — |
|
| $ | 20.7 |
|
| $ | 664.6 |
| ||||
Net income (loss) |
|
| — |
|
|
| — |
|
|
| 65.1 |
|
|
| — |
|
|
| — |
|
|
| 65.1 |
| ||||||||||||||||||||||||
Other comprehensive income (loss) |
|
| — |
|
|
| — |
|
|
| — |
|
|
| — |
|
|
| (6.0 | ) |
|
| (6.0 | ) | ||||||||||||||||||||||||
Stock-based compensation expense |
|
| 342,805 |
|
|
| 8.8 |
|
|
| — |
|
|
| — |
|
|
| — |
|
|
| 8.8 |
| ||||||||||||||||||||||||
Stock option activity |
|
| 499,040 |
|
|
| 8.0 |
|
|
| — |
|
|
| — |
|
|
| — |
|
|
| 8.0 |
| ||||||||||||||||||||||||
Purchase of treasury shares |
|
| (3,026,491 | ) |
|
| — |
|
|
| — |
|
|
| (52.0 | ) |
|
| — |
|
|
| (52.0 | ) | ||||||||||||||||||||||||
Issuance of treasury shares |
|
| 97,475 |
|
|
| (1.7 | ) |
|
| — |
|
|
| 1.7 |
|
|
| — |
|
|
| — |
| ||||||||||||||||||||||||
Shares surrendered for taxes |
|
| (116,793 | ) |
|
| (0.2 | ) |
|
| — |
|
|
| (1.8 | ) |
|
| — |
|
|
| (2.0 | ) | ||||||||||||||||||||||||
Balance at December 31, 2022 |
|
| 44,064,891 |
|
| $ | 847.0 |
|
| $ | (123.1 | ) |
| $ | (52.1 | ) |
| $ | 14.7 |
|
| $ | 686.5 |
| ||||||||||||||||||||||||
Net income (loss) |
|
| — |
|
|
| — |
|
|
| 69.4 |
|
|
| — |
|
|
| — |
|
|
| 69.4 |
| ||||||||||||||||||||||||
Other comprehensive income (loss) |
|
| — |
|
|
| — |
|
|
| — |
|
|
| — |
|
|
| (2.3 | ) |
|
| (2.3 | ) | ||||||||||||||||||||||||
Stock-based compensation expense |
|
| — |
|
|
| 11.5 |
|
|
| — |
|
|
| — |
|
|
| — |
|
|
| 11.5 |
| ||||||||||||||||||||||||
Stock option activity |
|
| 322,074 |
|
|
| 2.8 |
|
|
| — |
|
|
| — |
|
|
| — |
|
|
| 2.8 |
| ||||||||||||||||||||||||
Purchase of treasury shares, including excise tax |
|
| (1,713,743 | ) |
|
| (0.3 | ) |
|
| — |
|
|
| (32.6 | ) |
|
| — |
|
|
| (32.9 | ) | ||||||||||||||||||||||||
Issuance of treasury shares |
|
| 640,549 |
|
|
| (16.8 | ) |
|
| — |
|
|
| 16.8 |
|
|
| — |
|
|
| — |
| ||||||||||||||||||||||||
Shares surrendered for taxes |
|
| (177,460 | ) |
|
| — |
|
|
| — |
|
|
| (3.4 | ) |
|
| — |
|
|
| (3.4 | ) | ||||||||||||||||||||||||
Balance at December 31, 2023 |
|
| 43,136,311 |
|
| $ | 844.2 |
|
| $ | (53.7 | ) |
| $ | (71.3 | ) |
| $ | 12.4 |
|
| $ | 731.6 |
| ||||||||||||||||||||||||
See accompanying Notes to the Consolidated Financial Statements.
4050
TimkenSteel CorporationMetallus Inc.
Consolidated Statements of Cash Flows
|
| Year Ended December 31, |
|
| Year Ended December 31, |
| ||||||||||||||||||
|
| 2021 |
|
| 2020 |
|
| 2019 |
|
| 2023 |
|
| 2022 |
|
| 2021 |
| ||||||
(Dollars in millions) |
|
|
|
|
|
|
|
|
|
|
|
|
|
|
|
|
|
| ||||||
CASH PROVIDED (USED) |
|
|
|
|
|
|
|
|
|
|
|
|
|
|
|
|
|
| ||||||
Operating Activities |
|
|
|
|
|
|
|
|
|
|
|
|
|
|
|
|
|
| ||||||
Net income (loss) |
| $ | 171.0 |
| $ | (61.9 | ) |
| $ | (110.0 | ) |
| $ | 69.4 |
|
| $ | 65.1 |
|
| $ | 171.0 |
| |
Adjustments to reconcile net income (loss) to net cash provided (used) by operating activities: |
|
|
|
|
|
|
|
|
|
|
|
|
|
|
|
|
|
| ||||||
Depreciation and amortization |
| 63.1 |
| 70.0 |
| 73.5 |
|
|
| 56.9 |
|
|
| 58.3 |
|
|
| 63.1 |
| |||||
Amortization of deferred financing fees and debt discount |
| 1.0 |
| 5.3 |
| 5.1 |
| |||||||||||||||||
Amortization of deferred financing fees |
|
| 0.5 |
|
|
| 0.7 |
|
|
| 1.0 |
| ||||||||||||
Loss on extinguishment of debt |
| — |
| 0.9 |
| — |
|
|
| 11.4 |
|
|
| 43.1 |
|
|
| — |
| |||||
Loss on sale of consolidated subsidiary |
| 1.1 |
| — |
| — |
|
|
| — |
|
|
| — |
|
|
| 1.1 |
| |||||
Loss (gain) on sale or disposal of assets |
| 1.3 |
| (2.4 | ) |
| 2.0 |
| ||||||||||||||||
Loss (gain) on sale or disposal of assets, net |
|
| (2.5 | ) |
|
| 1.9 |
|
|
| 1.3 |
| ||||||||||||
Impairment charges |
| 10.6 |
| — |
| 7.3 |
|
|
| — |
|
|
| — |
|
|
| 10.6 |
| |||||
Deferred income taxes |
| 1.2 |
| — |
| (16.6 | ) |
|
| (9.7 | ) |
|
| 24.9 |
|
|
| 1.2 |
| |||||
Stock-based compensation expense |
| 7.3 |
| 6.6 |
| 7.4 |
|
|
| 11.5 |
|
|
| 8.8 |
|
|
| 7.3 |
| |||||
Pension and postretirement expense (benefit), net |
| (38.7 | ) |
| 8.6 |
| 41.6 |
| ||||||||||||||||
Pension and postretirement (benefit) expense, net |
|
| 47.1 |
|
|
| (40.5 | ) |
|
| (38.7 | ) | ||||||||||||
Changes in operating assets and liabilities: |
|
|
|
|
|
|
|
|
|
|
|
|
|
|
|
|
|
| ||||||
Accounts receivable, net |
| (37.2 | ) |
| 14.2 |
| 85.9 |
|
|
| (33.4 | ) |
|
| 21.3 |
|
|
| (37.2 | ) | ||||
Inventories, net |
| (41.6 | ) |
| 103.5 |
| 92.6 |
|
|
| (34.9 | ) |
|
| 18.8 |
|
|
| (41.6 | ) | ||||
Accounts payable |
| 53.5 |
| 23.1 |
| (87.7 | ) |
|
| 15.3 |
|
|
| (33.2 | ) |
|
| 53.5 |
| |||||
Other accrued expenses |
| 9.7 |
| 9.4 |
| (26.0 | ) |
|
| 5.3 |
|
|
| (8.8 | ) |
|
| 9.7 |
| |||||
Deferred charges and prepaid expenses |
| 0.1 |
| (0.7 | ) |
| 0.2 |
|
|
| (3.9 | ) |
|
| (2.6 | ) |
|
| 0.1 |
| ||||
Pension and postretirement contributions and payments |
| (6.9 | ) |
| (4.1 | ) |
| (3.8 | ) |
|
| (2.8 | ) |
|
| (5.4 | ) |
|
| (6.9 | ) | |||
Other, net |
| 1.4 |
| 1.0 |
| (1.2 | ) |
|
| (4.9 | ) |
|
| (17.9 | ) |
|
| 1.4 |
| |||||
Net Cash Provided (Used) by Operating Activities |
| 196.9 |
| 173.5 |
| 70.3 |
|
|
| 125.3 |
|
|
| 134.5 |
|
|
| 196.9 |
| |||||
|
|
|
|
|
|
|
|
|
|
|
|
|
|
| ||||||||||
Investing Activities |
|
|
|
|
|
|
|
|
|
|
|
|
|
|
|
|
|
| ||||||
Capital expenditures |
| (12.2 | ) |
| (16.9 | ) |
| (38.0 | ) |
|
| (51.6 | ) |
|
| (27.1 | ) |
|
| (12.2 | ) | |||
Proceeds from sale of consolidated subsidiary, net |
| 6.2 |
| — |
| — |
|
|
| — |
|
|
| — |
|
|
| 6.2 |
| |||||
Proceeds from disposals of property, plant and equipment |
| 1.2 |
| 10.9 |
| — |
|
|
| 1.7 |
|
|
| 5.4 |
|
|
| 1.2 |
| |||||
Net Cash Provided (Used) by Investing Activities |
| (4.8 | ) |
| (6.0 | ) |
| (38.0 | ) |
|
| (49.9 | ) |
|
| (21.7 | ) |
|
| (4.8 | ) | |||
|
|
|
|
|
|
|
|
|
|
|
|
|
|
| ||||||||||
Financing Activities |
|
|
|
|
|
|
|
|
|
|
|
|
|
|
|
|
|
| ||||||
Purchase of treasury shares |
|
| (32.6 | ) |
|
| (52.0 | ) |
|
| — |
| ||||||||||||
Proceeds from exercise of stock options |
| 4.1 |
| — |
| 0.2 |
|
|
| 2.8 |
|
|
| 8.0 |
|
|
| 4.1 |
| |||||
Shares surrendered for employee taxes on stock compensation |
| (0.5 | ) |
| (0.6 | ) |
| (1.0 | ) |
|
| (3.4 | ) |
|
| (2.0 | ) |
|
| (0.5 | ) | |||
Repayments on convertible notes |
| (38.9 | ) |
| — |
| — |
|
|
| (18.7 | ) |
|
| (67.6 | ) |
|
| (38.9 | ) | ||||
Repayments on credit agreements |
| — |
| (90.0 | ) |
| (65.0 | ) | ||||||||||||||||
Borrowings on credit agreements |
| — |
| — |
| 40.0 |
| |||||||||||||||||
Debt issuance costs |
| — |
| (1.2 | ) |
| (1.0 | ) |
|
| — |
|
|
| (1.0 | ) |
|
| — |
| ||||
Net Cash Provided (Used) by Financing Activities |
| (35.3 | ) |
| (91.8 | ) |
| (26.8 | ) |
|
| (51.9 | ) |
|
| (114.6 | ) |
|
| (35.3 | ) | |||
Increase (Decrease) in Cash and Cash Equivalents |
| 156.8 |
| 75.7 |
| 5.5 |
| |||||||||||||||||
Cash and cash equivalents at beginning of period |
| 102.8 |
| 27.1 |
| 21.6 |
| |||||||||||||||||
Cash and Cash Equivalents at End of Period |
| $ | 259.6 |
| $ | 102.8 |
| $ | 27.1 |
| ||||||||||||||
Increase (Decrease) in Cash, Cash Equivalents, and Restricted Cash |
|
| 23.5 |
|
|
| (1.8 | ) |
|
| 156.8 |
| ||||||||||||
Cash, Cash Equivalents, and Restricted Cash at Beginning of Period |
|
| 257.8 |
|
|
| 259.6 |
|
|
| 102.8 |
| ||||||||||||
Cash, Cash Equivalents, and Restricted Cash at End of Period |
| $ | 281.3 |
|
| $ | 257.8 |
|
| $ | 259.6 |
| ||||||||||||
|
|
|
|
|
|
|
| |||||||||||||||||
The following table provides a reconciliation of cash, cash equivalents, and restricted cash reported within the Consolidated Balance Sheets that sum to the total of the same such amounts shown in the Consolidated Statements of Cash Flows: | The following table provides a reconciliation of cash, cash equivalents, and restricted cash reported within the Consolidated Balance Sheets that sum to the total of the same such amounts shown in the Consolidated Statements of Cash Flows: |
| ||||||||||||||||||||||
Cash and cash equivalents |
| $ | 280.6 |
|
| $ | 257.2 |
|
| $ | 259.6 |
| ||||||||||||
Restricted cash reported in other current assets |
|
| 0.7 |
|
|
| 0.6 |
|
|
| — |
| ||||||||||||
Total cash, cash equivalents, and restricted cash shown in the Consolidated Statements of Cash Flows |
| $ | 281.3 |
|
| $ | 257.8 |
|
| $ | 259.6 |
| ||||||||||||
See accompanying Notes to the Consolidated Financial Statements.
4151
TimkenSteel CorporationMetallus Inc.
Notes to Consolidated Financial Statements
(dollars in millions, except per share data)
Note1-Basis of Presentation
TimkenSteel CorporationMetallus Inc. (the "Company" or "TimkenSteel""Metallus") manufactures alloy steel, as well as carbon and micro-alloy steel. TimkenSteel’ssteel using electric arc furnace ("EAF") technology. Metallus' portfolio includes special bar quality ("SBQ") bars, seamless mechanical tubing ("tubes"), manufactured components, (formerly known as the "value-add" product type) such as precision steel components, and billets. In addition, TimkenSteel supplies machining and thermal treatment services andAdditionally, Metallus manages raw material recycling programs, which are also used internally as a feeder system for the Company’sour melt operations.operations and allow us to sell scrap not used in our operations to third parties. The Company’s products and services are used in a diverse range of demanding applications in the following market sectors: automotive; oilend-markets: industrial, which includes industrial equipment, mining, construction, rail, heavy truck, agriculture and gas; industrial equipment; mining; construction; rail; defense; heavy truck; agriculture; power generation; automotive; aerospace & defense; and oil country tubular goods ("OCTG").energy.
The SBQ bar, tube, and billet production processes take place at the Company’s Canton, Ohio manufacturing location. This location accounts for all of the SBQ bars, seamless mechanical tubes and billets the Company produces and includes three manufacturing facilities: the Faircrest, Harrison, and Gambrinus facilities. TimkenSteel’sMetallus' production of manufactured components takes place at two downstream manufacturing facilities: Tryon Peak (Columbus, North Carolina) and St. Clair (Eaton, Ohio). Many of the production processes are integrated, and the manufacturing facilities produce products that are sold in all of the Company’s market sectors.markets. As a result, investments in the Company’s facilities and resource allocation decisions affecting the Company’s operations are designed to benefit the overall business, not any specific aspect of the business.
Prior to indefinitely idling our Harrison melt and casting assets in the first quarter of 2021, we had an annual melt capacity of approximately 2 million tons and shipment capacity of 1.5 million tons. After indefinitely idling these assets, ourOur annual melt capacity is approximately 1.2 million tons and our shipment capacity is approximately 0.9 million tons. In addition to our internal melt capacity, the Company periodically purchases third party melt to supplement customer demand and leverage our downstream operations.
Basis of Consolidation:
The Consolidated Financial Statements include the consolidated assets, liabilities, revenues and expenses related to TimkenSteelMetallus as of December 31, 2021, 20202023, 2022 and 2019.2021. All significant intercompany accounts and transactions within TimkenSteelMetallus have been eliminated in the preparation of the Consolidated Financial Statements.
Use of Estimates:
The preparation of these Consolidated Financial Statements in conformity with accounting principles generally accepted in the United States requires management to make estimates and assumptions that affect the amounts reported in the Consolidated Financial Statements and accompanying notes. These estimates and assumptions are reviewed and updated regularly to reflect recent experience.
Presentation:
Certain items previously reported in specific financial statement captions have been reclassified to conform with current year presentation. In the fourth quarter of 2023, the Company split the aerospace & defense end-market out from the industrial end-market. These changes have been retrospectively applied. Refer to the fiscal 2021 presentation."Note 4 - Revenue Recognition" for further details.
Note2-Significant Accounting Policies
Revenue Recognition:
TimkenSteelMetallus recognizes revenue from contracts at a point in time when it has satisfied its performance obligation and the customer obtains control of the goods, at the amount that reflects the consideration the Company expects to receive for those goods.
52
Substantially all performance obligations arise from the sale of manufactured steel products. The Company receives and acknowledges purchase orders from its customers, which define the quantity, pricing, payment and other applicable terms and conditions. In some cases, the Company receives a blanket purchase order from its customer, which includes pricing, payment and other terms and conditions, with quantities defined at the time the customer issues periodic releases from the blanket purchase order.
Transfer of control and revenue recognition for substantially all the Company’s sales occur upon shipment or delivery of the product, which is when title, ownership, and risk of loss pass to the customer and is based on the applicable customer shipping terms.
The Company invoices its customers at the time of title transfer. Payment terms are generally 30 days from the invoice date. Invoiced amounts are usually inclusive of shipping and handling activities incurred. Shipping and handling activities billed are included in net sales in the Consolidated Statements of Operations. The related costs incurred by the Company for the delivery of goods are classified as cost of products sold in the Consolidated Statements of Operations.
Certain contracts contain variable consideration, which primarily consists of rebates that are accounted for in net sales and accrued based on the estimated probability of the requirements being met.
Sales returns and allowances are treated as a reduction to net sales and are provided for primarily based on historical experience. These reserves also capture any potential warranty claims, which normally result in returned or replaced product.
The Company’s contracts with certain Manufactured Components customers extend multiple years and generally average five years. While these contracts set the duration of time, they do not cover or guarantee volumes but rather are focused on piece prices, which are established at the inception of the contract. From time to time, subsequent pricing adjustments are agreed to through negotiation. Pricing adjustments are occasionally determined retroactively based on historical shipments. The Company recognizes revenue for these subsequent price adjustments when they are determined to be probable and estimable. For the year ended December 31, 2023, the Company recognized $16.0 million in subsequent pricing adjustments.
Cash Equivalents:Equivalents and Restricted Cash:
TimkenSteelMetallus considers all highly liquid investments with a maturity of three months or less when purchased to be cash equivalents.
42The Company's restricted cash balance represents an imprest cash account used for the funding of employee healthcare costs. Funding of this account began during the first quarter of 2022 when the Company changed its healthcare plan administrator. The balance of restricted cash as of December 31, 2023 was $0.7 million, which is included in other current assets on the Consolidated Balance Sheets. The Company had $0.6 million of restricted cash as of December 31, 2022.
Accounts Receivables, Net:
The Company’s accounts receivables arise from sales to customers across the mobile, industrial, automotive, aerospace & defense, and energy and other end-market sectors.end markets. The allowance for doubtful account reserve has been established using qualitative and quantitative methods. In general, account balances are fully reserved when greater than one year of age or sent to third party collection are fully reserved.collection. Account balances for customers that are viewed as higher risk are also analyzed for a reserve. In addition to these methods, the allowance for doubtful accounts is adjusted for forward lookingforward-looking estimates of uncollectible balances based on end-market sector outlook and dynamics. Historically, TimkenSteel’swrite-offs for Metallus' allowance for doubtful accounts write-offs have been immaterial.
Inventories, Net:
Inventories are stated at lower of cost or net realizable value. All inventories, including raw materials, manufacturing supplies inventory, as well as international (outside the U.S.) inventories, have been valued using the FIFO or average cost method.
53
Property, Plant and Equipment, Net:
Property, plant and equipment, net are valued at cost less accumulated depreciation. Maintenance and repairs are charged to expense as incurred. The provision for depreciation is computed principally by the straight-line method based upon the estimated useful lives of the assets. The useful lives are approximately 30 years for buildings and 3 to 20 years for machinery and equipment.
IntangibleImpairment and Disposal of Long-lived Assets, Net:
Intangible assets subject to amortization are amortized on a straight-line method over their legal or estimated useful lives, with useful lives ranging from 3 to 15 years.
In accordance with applicable accounting guidance, TimkenSteel capitalizes certain costs incurred for computer software developed or obtained for internal use. TimkenSteel capitalizes substantially all external costs and qualifying internal costs related to the purchase and implementation of software projects used for business operations. Capitalized software costs primarily include purchased software and external consulting fees. Capitalized software projects are amortized over the estimated useful lives of the software.
Long-lived Assets:
Long-lived assets (including property, plant and equipment, tangible assets and intangible assets subject to amortization) are reviewed for impairment when events or changes in circumstances have occurred indicating that the carrying value of the assets may not be recoverable.
TimkenSteelMetallus tests recoverability of long-lived assets at the lowest level for which there are identifiable cash flows that are independent from the cash flows of other assets. Assets and asset groups held and used are measured for recoverability by comparing the carrying amount of the asset or asset group to the sum of future undiscounted net cash flows expected to be generated by the asset or asset group.
Assumptions and estimates about future values and remaining useful lives of TimkenSteel’s long-lived assets are complex and subjective. They can be affected by a variety of factors, including external factors such as industry and economic trends and internal factors such as changes in TimkenSteel’s business strategy and internal forecasts.
If an asset or asset group is considered to be impaired, the impairment loss that would be recognized is the amount by which the carrying amount of the assets exceeds the fair value of the assets. To determine fair value, TimkenSteelMetallus uses internal cash flow estimates discounted at an appropriate interest rate, third party appraisals, as appropriate, and/or market prices of similar assets, when available.
Refer to “Note 6 - Disposition of Non-Core Assets” and “Note 11 - Property, Plant and Equipment” for additional information.
Product Warranties:
TimkenSteel accrues liabilities for warranties based upon specific claim incidents in accordance with accounting rules relating to contingent liabilities. Should TimkenSteel become aware of a specific potential warranty claim for which liability is probable and reasonably estimable, a specific charge is recorded and accounted for accordingly. TimkenSteel had warranty claims in the amount of $1.4 million that were resolved and paid primarily during the fourth quarter of 2021, which is included in cost of products sold on the Consolidated Statements of Operations. TimkenSteel had 0 significant warranty claims for the years ended December 31, 2020 or 2019.
43
Income Taxes:
Deferred tax assets and liabilities are recorded for the future tax consequences attributable to differences between financial statement carrying amounts of existing assets and liabilities and their respective tax bases, as well as net operating loss and tax credit carryforwards. TimkenSteelMetallus accounts for income taxes under the asset and liability method, which requires the recognition of deferred tax assets and liabilities for the expected future tax consequences of events that have been included in the financial statements. Under this method, deferred tax assets and liabilities are determined on the basis of the differences between the financial statement and tax bases of assets and liabilities using enacted tax rates in effect for the year in which the differences are expected to reverse. The effect of a change in tax rates on deferred tax assets and liabilities is recognized in income in the period that includes the enactment date. TimkenSteelMetallus recognizes deferred tax assets to the extent TimkenSteelMetallus believes these assets are more likely than not to be realized. In making such a determination, TimkenSteelMetallus considers all available positive and negative evidence, including future reversals of existing taxable temporary differences, projected future taxable income, tax-planning strategies, and results of recent operations. If TimkenSteelMetallus determines that it would be able to realize deferred tax assets in the future in excess of their net recorded amount, TimkenSteelMetallus would make an adjustment to the deferred tax asset valuation allowance, which would reduce the provision for income taxes.
TimkenSteelMetallus records uncertain tax positions in accordance with applicable accounting guidance, on the basis of a two-step process whereby (1) TimkenSteelMetallus determines whether it is more likely than not that the tax positions will be sustained on the basis of the technical merits of the position, and (2) for those tax positions that meet the more-likely-than-not recognition threshold, TimkenSteelMetallus recognizes the largest amount of tax benefit that is more than 50 percent likely to be realized upon ultimate settlement with the related tax authority.
TimkenSteelMetallus recognizes interest and penalties related to unrecognized tax benefits within the provision (benefit) for income taxes line in the accompanying Consolidated Statements of Operations.Operations, if applicable. Accrued interest and penalties are included within the related tax liability line in the Consolidated Balance Sheets.
Foreign Currency:54
Assets and liabilities of subsidiaries are translated at the rate of exchange in effect on the balance sheet date. Income and expenses are translated at the average rates of exchange prevailing during the year. The related translation adjustments are reflected as a separate component of accumulated other comprehensive loss. Gains and losses resulting from foreign currency transactions are included in other (income) expense, net in the Consolidated Statements of Operations. TimkenSteel realized a foreign currency exchange loss of $0.1 million and $0.2 million for the years ended December 31, 2021 and 2020, respectively. There were 0 foreign currency exchange gains or losses in 2019.
Pension and Other Postretirement Benefits:
TimkenSteelMetallus recognizes an overfunded status or underfunded status (e.g., the difference between the fair value of plan assets and the benefit obligations) as either an asset or a liability for its defined benefit pension and other postretirement benefit plans on the Consolidated Balance Sheets. The Company recognizes actuarial gains and losses immediately through net periodic benefit cost in the Consolidated Statements of Operations upon the annual remeasurement at December 31, or on an interim basis as triggering events warrant remeasurement. An example of a potential triggering event would be settlements. The Company’s accounting policy is to recognize settlements during the quarter in which it is projected that the costs of all settlements during the year will be greater than the sum of the service cost and interest cost components of net periodic benefit cost. In addition, the Company uses fair value to account for the value of plan assets.
Stock-Based Compensation:
TimkenSteelMetallus recognizes stock-based compensation expense based on the grant date fair value of the stock-based awards over their required vesting period on a straight-line basis, whether the awards were granted with graded or cliff vesting. Stock options are issued with an exercise price equal to the closing market price of TimkenSteelMetallus common shares on the date of grant. The fair value of stock options is determined using a Black-Scholes option pricing model, which incorporates assumptions regarding the expected volatility, the expected option life, the risk-free interest rate and the expected dividend yield.
Performance-basedAnnual grants of performance-based restricted stock units issued in 2021 and 2020 vest based on achievement of a relative total shareholder return ("TSR") metric. The TSR metric is considered a market condition, which requires TimkenSteelMetallus to reflect it in the fair value on grant date using an advanced option-pricing model. The fair value of each performance share was therefore determined using a Monte Carlo valuation model, a generally accepted lattice pricing model. The Monte Carlo valuation model, among other factors, uses commonly-accepted economic theory underlying all valuation models, estimates fair value using simulations of future share prices based on stock price behavior and considers the correlation of peer company returns in determining fair value.
In the fourth quarter, the Board approved and authorized a performance-based Transformation Incentive Grant program (the “Transformation Incentive Grant Program”). Under the Transformation Incentive Grant Program, certain employees were granted performance-based Restricted Share Unit awards designed to be earned from 0 percent to 200 percent of target levels depending on the degree to which the closing price performance of the Company's common shares satisfies specific average per share closing price goals during a performance period running from December 1, 2023 through December 31, 2026. Shares earned, if any, will then pay out in two equal installments in early 2027 and 2028, generally conditioned on continued employment with the Company until the applicable vesting date. Similar to the annual performance-based restricted stock units, the fair value of each share is determined using a Monte Carlo valuation model, a generally accepted lattice pricing model.
The fair value of stock-based awards that will settle in TimkenSteelMetallus common shares, other than stock options and performance-based restricted stock units, is based on the closing market price of TimkenSteelMetallus common shares on the grant date.
44
TimkenSteelMetallus recognizes all excess tax benefits and tax deficiencies as income tax expense or benefit in the Consolidated Statements of Operations. The excess tax benefits and tax deficiencies are considered discrete items in the reporting period they occur and are not included in the estimate of an entity’s annual effective tax rate.
Research and Development:
Expenditures for research and development at TimkenSteel amounted to $1.7 million, $1.8 million and $4.1 million for the years ended December 31, 2021, 2020, and 2019, respectively, and were recorded as a component of selling, general and administrative expenses in the Consolidated Statements of Operations. These expenditures may fluctuate from year to year depending on special projects and the needs of TimkenSteel and its customers.
Adoption of New Accounting Standards
The Company adopted the followingdid not adopt any Accounting Standard Updates ("ASU"(“ASU”) during the year ended December 31, 2021.2023.
Accounting Standards Issued But Not Yet Adopted
The Company has considered the recent ASU's issued by the Financial Accounting Standards Board summarized below:
55
Standard Adopted | Description | Effective Date | Impact |
ASU | The standard |
| The Company is currently evaluating the impact of the adoption of this |
ASU | The standard |
| The Company |
Upon adoption of ASU 2020-06 prospectively as of January 1, 2021, all outstanding Convertible Notes were fully classified as a liability, there was no longer a separate equity component and the Convertible Notes no longer have a debt discount that is amortized. This resulted in a decrease of $10.6 million to additional paid-in capital and an increase of $1.1 million and $5.3 million to current convertible notes, net and non-current convertible notes, net, respectively, on the Consolidated Balance Sheets as of January 1, 2021. Additionally, retained deficit was reduced by $4.2 million in the Consolidated Balance Sheets as of January 1, 2021 to remove amortization expense recognized in prior periods. The adoption of this standard did not have an effect on the Company’s cash flows, liquidity, or the methodology used for the earnings per share calculation. Refer to “Note 14 – Financing Arrangements” for additional information on the Company’s Convertible Notes.
Accounting Standards Issued But Not Yet Adopted
There are no current ASUs issued, but not adopted, that are expected to have an impact on the Company.
Legislation related to the COVID-19 Pandemic
Coronavirus Aid, Relief, and Economic Security Act
On March 27, 2020, the President of the United States signed the Coronavirus Aid, Relief, and Economic Security ("CARES") Act, an economic stimulus package intended to provide support, principally in the form of tax benefits, to companies and individuals negatively impacted by the COVID-19 pandemic. Although the majority of the provisions included in the CARES Act did not immediately benefit the Company from a cash tax perspective due to its significant net operating losses, the Company took advantage of the deferral of the employer share (6.2% of employee wages) of Social Security payroll taxes that would otherwise have been owed from the date of enactment of the legislation through December 31, 2020, as afforded by the Act. During the year ended December 31, 2020, the Company had deferred $6.4 million in cash payments and recorded reserves for such deferred payroll taxes in salaries, wages and benefits on the Consolidated Balance Sheets, to be paid in 2 equal installments. The first installment in the amount of $3.2 million was paid during the fourth quarter of 2021. The second installment is due on December 31, 2022.
The CARES Act also provided for an employee retention credit (“Employee Retention Credit”), which is a refundable tax credit against certain employment taxes of up to 5000 dollars per employee for eligible employers. The tax credit is equal to 50% of qualified wages paid to employees during a quarter, capped at 10 thousand dollars of qualified wages per employee throughout the year. The Company qualified for the tax credit in the second and third quarters of 2020 and accrued a benefit of $2.3 million in the fourth quarter of 2020 related to the Employee Retention Credit in other (income) expense, net on the Company’s Consolidated Statements of Operations. The Company filed for
45
this credit in the second quarter of 2021 and received a portion of the proceeds from the Internal Revenue Service ("IRS") in the amount of $0.5 million during the fourth quarter of 2021. The Company received the remaining $1.8 million of cash proceeds in the first quarter of 2022, which was recorded as a receivable in other current assets on the Consolidated Balance Sheets as of December 31, 2021.
Consolidated Appropriations Act, 2021
On December 27, 2020, the President of the United States signed the Consolidated Appropriation Act, 2021 (“CAA”). The CAA includes additional COVID-19 relief that expands upon the relief provided in the CARES Act, including, but not limited to, the extension of tax deductions, credits, and incentives. The Company has evaluated the CAA for any potential impact. While it was determined that the CAA revised and extended the Employee Retention Credit into 2021, the CAA is not expected to have an impact on the Company as employee furloughs related to the COVID-19 pandemic ceased in 2020. Furthermore, the Company does not expect any of the other provisions within the CAA to provide a benefit.
American Rescue Plan Act of 2021
On March 11, 2021, the President of the United States signed the American Rescue Plan Act of 2021 (“ARPA”). The ARPA strengthens and extends certain programs enacted through the CARES Act and establishes new relief programs aimed at mitigating the financial impact of the COVID-19 pandemic. The provisions within the ARPA have been evaluated and at this time 1 provision, which offers funding relief for single-employer defined benefit pension plans, is expected to materially impact the Company.
Specifically, the ARPA provides enhanced interest rate stabilization, as well as extended amortization of funding shortfalls. The Company has evaluated and made final the elections permitted by the ARPA related to the required contributions for our TimkenSteel Corporation Bargaining Unit Pension Plan ("Bargaining Plan"). At this time based on current assumptions, the elections made under ARPA and expected asset returns, we believe that required Company contributions to the Bargaining Plan have been delayed until after 2031. However, these estimates are subject to significant uncertainty.
Note3-Segment Information
We conduct our business activities and report financial results as one business segment. The presentation of financial results as one reportable segment is consistent with the way the Company operates its business and is consistent with the manner in which the Chief Operating Decision Maker ("CODM") evaluates performance and makes resource and operating decisions for the business as described above. Furthermore, the Company notes that monitoring financial results as one reportable segment helps the CODM manage costs on a consolidated basis, consistent with the integrated nature of the operations.
Geographic Information
Net sales by geographic area are reported by the country in which the customer is domiciled. Long-lived assets include property, plant and equipment and intangible assets subject to amortization. Long-lived assets by geographic area are reported by the location of the TimkenSteelMetallus operations to which the asset is attributed.
|
| Year Ended December 31, |
|
| Year Ended December 31, |
| ||||||||||||||||||
|
| 2021 |
|
| 2020 |
|
| 2019 |
|
| 2023 |
|
| 2022 |
|
| 2021 |
| ||||||
Net Sales: |
|
|
|
|
|
|
|
|
|
|
|
|
|
|
|
|
|
| ||||||
United States |
| $ | 1,166.1 |
| $ | 746.8 |
| $ | 1,096.8 |
|
| $ | 1,239.4 |
|
| $ | 1,201.3 |
|
| $ | 1,166.1 |
| ||
Foreign |
| 116.8 |
| 83.9 |
| 112.0 |
|
|
| 123.0 |
|
|
| 128.6 |
|
|
| 116.8 |
| |||||
|
| $ | 1,282.9 |
| $ | 830.7 |
| $ | 1,208.8 |
|
| $ | 1,362.4 |
|
| $ | 1,329.9 |
|
| $ | 1,282.9 |
| ||
|
| December 31, |
|
| December 31, |
| ||||||||||
|
| 2021 |
|
| 2020 |
|
| 2023 |
|
| 2022 |
| ||||
Long-lived Assets, net: |
|
|
|
|
|
|
|
|
|
|
|
| ||||
United States |
| $ | 530.7 |
| $ | 599.1 |
|
| $ | 506.2 |
|
| $ | 503.0 |
| |
Foreign |
| 0.7 |
| 1.0 |
|
|
| 0.4 |
|
|
| 0.6 |
| |||
|
| $ | 531.4 |
| $ | 600.1 |
|
| $ | 506.6 |
|
| $ | 503.6 |
| |
4656
Note4-Revenue Recognition
The following table provides the major sources of revenue by end-market sector for the years ended December 31, 2021, 20202023, 2022 and 2019:2021:
|
| Year Ended December 31, |
|
| Year Ended December 31, |
| ||||||||||||||||||
|
| 2021 |
|
| 2020 |
|
| 2019 |
|
| 2023 |
|
| 2022 |
|
| 2021 |
| ||||||
Mobile |
| $ | 527.9 |
| $ | 346.0 |
| $ | 479.3 |
| ||||||||||||||
Industrial |
| 661.2 |
| 391.7 |
| 486.3 |
|
| $ | 533.3 |
|
|
| 549.0 |
|
|
| 601.0 |
| |||||
Automotive |
|
| 531.9 |
|
|
| 539.1 |
|
| 527.9 |
| |||||||||||||
Aerospace & Defense(1) |
|
| 115.0 |
|
|
| 79.7 |
|
|
| 60.2 |
| ||||||||||||
Energy |
| 62.9 |
| 53.2 |
| 166.4 |
|
|
| 160.4 |
|
|
| 136.6 |
|
| 62.9 |
| ||||||
Other |
| 30.9 |
| 39.8 |
| 76.8 |
|
|
| 21.8 |
|
|
| 25.5 |
|
| 30.9 |
| ||||||
Total Net Sales |
| $ | 1,282.9 |
| $ | 830.7 |
| $ | 1,208.8 |
|
| $ | 1,362.4 |
|
| $ | 1,329.9 |
|
| $ | 1,282.9 |
| ||
(1) “Aerospace & Defense” sales by end-market were previously included in "Industrial."
(2)“Other” sales by end-market sector includes the Company’s scrap and oil country tubular goods (“OCTG”) billet sales.
The following table provides the major sources of revenue by product type for the years ended December 31, 2021, 20202023, 2022 and 2019:2021:
|
| Year Ended December 31, |
|
| Year Ended December 31, |
| ||||||||||||||||||
|
| 2021 |
|
| 2020 |
|
| 2019 |
|
| 2023 |
|
| 2022 |
|
| 2021 |
| ||||||
Bar |
| $ | 863.6 |
| $ | 502.5 |
| $ | 783.0 |
|
| $ | 917.1 |
|
| $ | 887.4 |
|
| $ | 863.6 |
| ||
Tube |
| 164.4 |
| 101.4 |
| 151.8 |
|
|
| 170.1 |
|
|
| 173.7 |
|
|
| 164.4 |
| |||||
Manufactured components(3) |
| 224.0 |
| 208.1 |
| 240.6 |
| |||||||||||||||||
Other(2) |
| 30.9 |
| 18.7 |
| 33.4 |
| |||||||||||||||||
Manufactured components |
|
| 253.4 |
|
|
| 243.3 |
|
|
| 224.0 |
| ||||||||||||
Other(3) |
|
| 21.8 |
|
|
| 25.5 |
|
|
| 30.9 |
| ||||||||||||
Total Net Sales |
| $ | 1,282.9 |
| $ | 830.7 |
| $ | 1,208.8 |
|
| $ | 1,362.4 |
|
| $ | 1,329.9 |
|
| $ | 1,282.9 |
| ||
(2)(3) “Other” for sales by product type relates to the Company’s scrap sales.
(3)Contract liabilities are recognized when the Company has received consideration from a customer to transfer goods at a future point in time. Contract liabilities are primarily related to deferred revenue resulting from cash payments received in advance from customers and are included in other current liabilities on the Consolidated Balance Sheets. Contract liabilities totaled $0.8 Formerly knownmillion and $3.6 million as the “Value-add” product type.of December 31, 2023 and 2022, respectively.
Note5-Restructuring Charges
Over the past several years, TimkenSteelMetallus has made numerous organizational changes to enhance profitable and sustainable growth. These company-wideCompany-wide actions included the restructuring of its business support functions, the reduction of management layers throughout the organization and other domestic and international actions to further improve the Company’s overall cost structure. There were no restructuring charges for the year ended December 31, 2023. Restructuring charges for the years ended December 31, 2022, and 2021 2020,totaled $0.8 million and 2019 totaled $6.7 million, $3.1 million, and $8.6 million, respectively.
DuringFor the years ended December 31, 2022 and 2021, $6.4 million of restructuring charges were primarily related to severance and employee-related benefits, as a result of continued organizational changes. The remaining $0.3
million57
TimkenSteel recorded reserves for such restructuring charges as other current liabilities on the Consolidated Balance Sheets. The reserve balance at December 31, 2021 is expected to be substantially used in the next twelve months.
The following is a summary of the restructuring reserve for the twelve months ended December 31, 20212023 and 2020:2022:
Balance at December 31, 2020 |
| $ | 1.5 |
|
Expenses |
|
| 6.7 |
|
Payments |
|
| (3.5 | ) |
Balance at December 31, 2021 |
| $ | 4.7 |
|
Balance at December 31, 2019 |
| $ | 6.0 |
| ||||
Balance at December 31, 2021 |
| $ | 4.7 |
| ||||
Expenses |
| 3.1 |
|
|
| 0.8 |
| |
Payments |
| (7.6 | ) |
|
| (5.0 | ) | |
Balance at December 31, 2020 |
| $ | 1.5 |
| ||||
Balance at December 31, 2022 |
| $ | 0.5 |
| ||||
Expenses |
|
| — |
| ||||
Payments |
|
| (0.5 | ) | ||||
Balance at December 31, 2023 |
|
| — |
| ||||
47
Note 6 - Disposition of Non-Core Assets
Scrap Processing Facility
During the fourth quarter of 2019, management signed a letter of intent to dispose of the Company’s scrap processing facility in Akron, Ohio for cash consideration of approximately $4.0 million. This letter of intent and cash consideration were for the land, buildings, machinery and equipment associated with this facility.
As a result of the agreement to sell the scrap processing facility, the Company ceased depreciation of the assets and recorded them as assets held for sale. This disposal did not represent a discontinued operation. Additionally, the Company recorded an impairment charge of $7.3 million in the fourth quarter of 2019 which represents the cash consideration to be received less cost to sell the assets compared with the $11.3 million carrying value of the assets being sold, including supplies inventory. An additional loss on disposal of $0.1 million was recognized in the first quarter of 2020 as the sale was completed.
TimkenSteel Material Services Facility
During the first quarter of 2020, management completed its previously announced plan to close the Company’s TimkenSteel Material Services (“TMS”) facility in Houston and began selling the assets at the facility. Accelerated depreciation and amortization on TMS assets of $2.8 million was recorded in the fourth quarter of 2019, with an additional $1.6 million of accelerated depreciation and amortization recorded in the first quarter of 2020, to reduce the net book value of the machinery and equipment to its estimated fair value. Subsequent to the closure, certain assets were sold and a gain on sale of $3.6 million was recognized for the year ended December 31, 2020.
Inventory write-downsLand and buildings of $4.8 million were recorded as of December 31, 2019, which represented the difference between the expected selling price and carrying value of the related inventory. The expected selling price was based upon the Company’s most recently published price lists related to this inventory. While the Company began selling the inventory associated with TMS in the first quarter of 2020 at prices that were in line with the net realizable value of the inventory established in the fourth quarter of 2019, excess inventory related to the energy end-market sector resulted in an additional reserve of approximately $3.1 million being recorded in the second quarter of 2020. The excess inventory was the result of continued weakness in this end-market sector, as well as the closures of several distributors that were holding considerable amounts of similar inventory. There was 0 inventory at December 31, 2021 associated with TMS, as the remaining inventory was sold throughout 2021. Furthermore, inventory reserves were reversed throughout 2021 as the related TMS inventory was sold or scrapped.
During 2021, the remaining associated machinery and equipment that was classified as held for sale was fully impaired as there was no longer an expected market value for these assets. This resulted in impairment charges of $0.3 million.
A small parcel of land associated with TMS was sold during the fourth quarter of 2021 for $0.3 million resulting in a gain on sale of $0.1 million. The remaining $4.3 million of land and buildings associated with TMS arewere classified as assets held for sale on the Consolidated Balance Sheets as of December 31, 2021, as it is probable that2021. All of these assets will bewere sold withinduring the next 12 months.third quarter of 2022. Net cash proceeds of $2.8 million were received and a loss on sale of assets of $1.5 million was recognized on the Consolidated Statements of Operations during 2022.
Small-Diameter Seamless Mechanical Tubing Machinery and Equipment
In the third quarter of 2020, TimkenSteelthe Company informed customers that as of December 31, 2020 the Company would discontinue the commercial offering of specific small-diameter seamless mechanical tubing products. As a result,
In the fourth quarter of 2022, the Company recognized accelerated depreciation of $1.8 million for the year ended December 31, 2020 onentered into an agreement to sell the machinery and equipment used in the manufacturing of these specific products. Additional accelerated depreciation ofThe Company received down payments totaling $1.53.4 million, was recognized in the first quarter of 2021 in alignment with the ramp down of this machinery and equipment. Spare parts related to this machinery and equipment of $0.51.7 million were also written downreceived in 2022 and the first quarter of 2021, as management determined there was no alternative use.remaining $
Property and Asset Sales1.7
In the fourth quarter of 2020, TimkenSteel sold portions of non-core property at the Canton, Ohio manufacturing location, resulting million received in 2023. The final payment resulted in a gain on saledisposal of assets of $0.53.4 million forin the year ended December 31, 2020.
During the fourthsecond quarter of 2021, TimkenSteel disposed2023. The gain, which has been recognized in the Consolidated Statement of older non-coreOperations, was partially offset by write-offs of aged assets through an auction process, resulting in a loss on sale of assets of $removed from service throughout 2023. 0.9
million for the year ended December 31, 2021.
Harrison Melt and Casting Assets
On February 16, 2021, management announced a plan to indefinitely idle its Harrison melt and casting assets, which was completed in the first quarter of 2021. Going forward, allAll of the Company’s melt and casting activities willnow take place at the Faircrest location. The Company worked
48
collaboratively with employees, suppliers and a number of customers to ensure a well-organized and efficient transition. The Company’s rolling and finishing operations at Harrison were not impacted by this action.
The Company recognized non-cash charges of $9.5 million related to the write-down of the associated Harrison melt and casting assets in the first quarter of 2021. These charges include $7.9 million related to the impairment of the associated machinery and equipment, which is classified as impairment charges on the Consolidated Statements of Operations, as well as a write-down of spare parts of $1.6 million, which is included in cost of products sold in the Consolidated Statements of Operations, as management determined there was no alternative use. The Company did not incur any cash expenditures related to these charges.
TimkenSteel (Shanghai) Corporation Limited
On March 31, 2021, the Company entered into an agreement pursuant to which Daido Steel (Shanghai) Co., Ltd. agreed to acquire all of the Company’s ownership interest in TimkenSteel (Shanghai) Corporation Limited in an all-cash transaction. The sale closed on July 30, 2021 and net cash proceeds of $6.2 million were received in the third quarter of 2021. As a result of this transaction, a loss on sale of consolidated subsidiary of $1.1 million was recognized on the Consolidated Statements of
58
Operations during the third quarter of 2021. TimkenSteel’sMetallus' consolidated financial statements include activity for TimkenSteel (Shanghai) Corporation Limited through July 30, 2021.
Customer Program Early Termination
During the fourth quarter of 2021, TimkenSteelthe Company received communication from a customer that 2two specific programs would end earlier than originally forecasted. There iswas machinery at the St. Clair facility designed for these programs, which hashad no alternative use. As such, the Company recognized impairment charges of $2.4 million for the year ended December 31, 2021. Related supplies inventory of $0.2 million was also written down, which is included in cost of products sold in the Consolidated Statements of Operations, as management determined there was no alternative use.
Additionally, cash previously received from the customer as reimbursement for capital investment for these early terminated programs was amortized as an expense reduction over the term of the related programs. With the early end to these programs, the remaining amount of capital recovery to be recognized of $1.1 million was accelerated and recognized within cost of products sold on the Consolidated Statements of Operations during the fourth quarter of 2021.
In the fourth quarter of 2022, the Company received a customer reimbursement related to the initial capital investment for these early terminated programs in the net amount of $4.3 million, which is included in cost of products sold in the Consolidated Statements of Operations.
Note7-Other (Income) Expense, net
The following table provides the components of other (income) expense, net for the years ended December 31, 2021, 20202023, 2022 and 2019:2021:
|
| Year Ended December 31, |
|
| Year Ended December 31, |
| ||||||||||||||||||
|
| 2021 |
|
| 2020 |
|
| 2019 |
|
| 2023 |
|
| 2022 |
|
| 2021 |
| ||||||
Pension and postretirement non-service benefit (income) loss |
| $ | (37.2 | ) |
| $ | (26.6 | ) |
| $ | (17.5 | ) |
| $ | (4.6 | ) |
| $ | (20.3 | ) |
| $ | (37.2 | ) |
Loss (gain) from remeasurement of benefit plans |
| (20.1 | ) |
| 14.7 |
| 40.6 |
|
|
| 40.6 |
|
|
| (35.4 | ) |
|
| (20.1 | ) | ||||
Foreign currency exchange loss (gain) |
| 0.1 |
| 0.2 |
| — |
|
|
| — |
|
|
| (0.2 | ) |
|
| 0.1 |
| |||||
Insurance recoveries |
|
| (31.3 | ) |
|
| (34.5 | ) |
|
| — |
| ||||||||||||
Sales and use tax refund |
| (2.5 | ) |
| — |
| — |
|
|
| (1.4 | ) |
|
| — |
|
|
| (2.5 | ) | ||||
Employee retention credit |
| — |
| (2.3 | ) |
| — |
| ||||||||||||||||
Miscellaneous (income) expense |
| 0.2 |
| (0.2 | ) |
| 0.2 |
|
|
| 0.4 |
|
|
| (0.2 | ) |
|
| 0.2 |
| ||||
Total other (income) expense, net |
| $ | (59.5 | ) |
| $ | (14.2 | ) |
| $ | 23.3 |
|
| $ | 3.7 |
|
| $ | (90.6 | ) |
| $ | (59.5 | ) |
Non-service related pension and other postretirement benefit income, for all years, consists primarily of the interest cost, expected return on plan assets and amortization components of net periodic cost.
The loss fromCompany's Bargaining Unit Pension Plan ("Bargaining Plan"), Retirement Plan (“Salaried Plan”), and the Supplemental Pension Plan ("Supplemental Plan") each have a provision that permits employees to elect to receive their pension benefits in a lump sum upon retirement. In the first quarter of 2023, the cumulative cost of all lump sum payments was projected to exceed the sum of the service cost and interest cost components of net periodic pension cost for the Salaried Plan. As a result, the Company completed a full remeasurement of its pension obligations and plan assets associated with the Salaried Plan during each quarter of 2023.
A net loss of $40.6 million from the remeasurement of these benefit plans iswas recognized for the year ended December 31, 2023. This loss was driven by a $36.6 million increase in the pension liability primarily due to a decrease in discount rate, updated census data and updates to certain underlying assumptions, as well as a loss of $4.0 million due to investment losses on plan assets.
A net gain of $35.4 million from the Company performing mark-to-market accountingremeasurement of these benefit plans was recognized for the year ended December 31, 2022. This gain was driven by a $359.9 million decrease in the pension liability primarily due to an increase in discount rates and a $2.7
59
million non-cash settlement related to the partial annuitization of the Bargaining Plan. This was partially offset by a loss of $327.2 million driven primarily by investment losses on itsplan assets and lump sum basis losses.
A net gain of $20.1 million from the remeasurement of these benefit plans was recognized for the year ended December 31, 2021. This gain was driven by a $55.7 million decrease in the pension and postretirement assets at year-end and upon the occurrenceliability primarily due to an increase in discount rates, partially offset by a loss of certain triggering events. $35.6 million driven primarily by investment losses on plan assets.
For more details on the remeasurementaforementioned remeasurements, refer to “Note 15 - Retirement and Postretirement Plans.”
During the second half of 2022, the Faircrest melt shop experienced unplanned operational downtime. During the fourth quarter of 2022, the Company recognized an insurance recovery of $33.0 million related to the 2022 unplanned downtime, of which $13.0 million was received in the fourth quarter of 2022 and $20.0 million was received in the first quarter of 2023. Additionally, during the third quarter of 2022, the Company recognized an insurance recovery of $1.5 million related to an unplanned outage at our Faircrest facility in November 2021.
During 2023, the Company recognized insurance recoveries of $31.3 million related to the 2022 Faircrest melt shop unplanned downtime, of which $11.3 million was received during 2023 and $20.0 million was received in the first quarter of 2024. The 2022 insurance claims were closed as of the first quarter of 2024.
During the fourth quarter of 2023, the Company received a commitment from the State of Ohio related to the overpayment of sales and use taxes for the period of January 1, 2020 through March 31, 2023. This resulted in a gain recognized of $1.4 million, net of related professional fees, for the year ended December 31, 2023. During the second quarter of 2021, TimkenSteelthe Company received a refund from the State of Ohio related to an overpayment of sales and use taxes for the period of October 1, 2016 through September 30, 2019. This resulted in a gain recognized of $2.5 million, net of related professional fees, for the year ended December 31, 2021.
During the year ended December 31, 2020, the Company recognized a $2.3 million benefit related to the Employee Retention Credit in other (income) expense, net. For more details on this credit refer to "Note 2 - Significant Accounting Policies."
49
Note8-Income Tax Provision
Income (loss) from operations before income taxes, based on geographic location of the operations to which such earnings are attributable, is provided below.
|
| Years Ended December 31, |
|
| Years Ended December 31, |
| ||||||||||||||||||
|
| 2021 |
|
| 2020 |
|
| 2019 |
|
| 2023 |
|
| 2022 |
|
| 2021 |
| ||||||
United States |
| $ | 171.2 |
| $ | (64.1 | ) |
| $ | (130.8 | ) |
| $ | 103.2 |
|
| $ | 108.5 |
|
| $ | 171.2 |
| |
Non-United States |
| 5.5 |
| 3.4 |
| 4.7 |
|
|
| (6.8 | ) |
|
| (11.4 | ) |
|
| 5.5 |
| |||||
Income (loss) from operations before income taxes |
| $ | 176.7 |
| $ | (60.7 | ) |
| $ | (126.1 | ) |
| $ | 96.4 |
|
| $ | 97.1 |
|
| $ | 176.7 |
| |
The provision (benefit) for income taxes consisted of the following:
|
| Years Ended December 31, |
|
| Years Ended December 31, |
| ||||||||||||||||||
|
| 2021 |
|
| 2020 |
|
| 2019 |
|
| 2023 |
|
| 2022 |
|
| 2021 |
| ||||||
Current: |
|
|
|
|
|
|
|
|
|
|
|
|
|
|
|
|
|
| ||||||
Federal |
| $ | 0.2 |
| $ | 0.6 |
| $ | — |
|
| $ | 30.4 |
|
| $ | 0.6 |
|
| $ | 0.2 |
| ||
State and local |
| 3.7 |
| — |
| 0.1 |
|
|
| 6.1 |
|
|
| 5.7 |
|
|
| 3.7 |
| |||||
Foreign |
| 0.6 |
| 0.5 |
| 0.4 |
|
|
| 0.2 |
|
|
| 0.8 |
|
|
| 0.6 |
| |||||
Total current tax expense (benefit) |
| $ | 4.5 |
| $ | 1.1 |
| $ | 0.5 |
|
| $ | 36.7 |
|
| $ | 7.1 |
|
| $ | 4.5 |
| ||
Deferred: |
|
|
|
|
|
|
|
|
|
|
|
|
|
|
|
|
|
| ||||||
Federal |
| $ | 0.8 |
| $ | (0.4 | ) |
| $ | (14.4 | ) |
| $ | (9.2 | ) |
| $ | 24.2 |
|
| $ | 0.8 |
| |
State and local |
| 0.3 |
| 0.5 |
| (2.0 | ) |
|
| (0.5 | ) |
|
| 0.7 |
|
|
| 0.3 |
| |||||
Foreign |
| 0.1 |
| — |
| (0.2 | ) |
|
| — |
|
|
| — |
|
|
| 0.1 |
| |||||
Total deferred tax expense (benefit) |
| 1.2 |
| 0.1 |
| (16.6 | ) |
|
| (9.7 | ) |
|
| 24.9 |
|
|
| 1.2 |
| |||||
Provision (benefit) for incomes taxes |
| $ | 5.7 |
| $ | 1.2 |
| $ | (16.1 | ) |
| $ | 27.0 |
|
| $ | 32.0 |
|
| $ | 5.7 |
| ||
60
For the year ended December 31, 2021, TimkenSteel2023, Metallus made $0.919.0 million in foreign taxU.S. federal payments, $4.64.9 million in state and local tax payments, $01.4 U.S. federalmillion in foreign tax payments, and had 0refundable overpayments of $0.3 million related to U.S. federal, state, and local income taxes. For the year ended December 31, 2020, TimkenSteel2022, the Company made $0.42.0 million in U.S. federal payments, $5.0 million in state and local tax payments, $0.2 million in foreign tax payments, $0.1 million in state tax payments, 0 U.S. federal payments, and had0 refundable overpayments of $2.2 million related to U.S. federal, state, and local income taxes.
The reconciliation between TimkenSteel’sMetallus' effective tax rate on income (loss) from continuing operations and the statutory tax rate is as follows:
|
| Years Ended December 31, |
|
| Years Ended December 31, |
| ||||||||||||||||||
|
| 2021 |
| 2020 |
| 2019 |
|
| 2023 |
| 2022 |
| 2021 |
| ||||||||||
U.S. federal income tax provision (benefit) at statutory rate |
| $ | 37.1 |
| $ | (12.7 | ) |
| $ | (26.5 | ) |
| $ | 20.2 |
|
| $ | 20.4 |
|
| $ | 37.1 |
| |
Adjustments: |
|
|
|
|
|
|
|
|
|
|
|
|
|
|
|
|
|
| ||||||
State and local income taxes, net of federal tax benefit |
| 4.1 |
| 2.3 |
| (1.3 | ) |
|
| 4.2 |
|
|
| 8.4 |
|
|
| 4.1 |
| |||||
Permanent differences |
| (0.2 | ) |
| 1.3 |
| 1.3 |
|
|
| 1.2 |
|
|
| 8.9 |
|
|
| (0.2 | ) | ||||
Foreign earnings taxed at different rates |
| (0.5 | ) |
| 0.1 |
| — |
|
|
| — |
|
|
| (3.6 | ) |
|
| (0.5 | ) | ||||
Valuation allowance |
| (34.8 | ) |
| 10.3 |
| 10.2 |
|
|
| 1.8 |
|
|
| (2.5 | ) |
|
| (34.8 | ) | ||||
U.S. research tax credit |
| — |
| — |
| 0.2 |
|
|
| (0.3 | ) |
|
| (0.6 | ) |
|
| — |
| |||||
Global intangible low-taxed income |
| — |
| — |
| 0.2 |
| |||||||||||||||||
Other items, net |
| — |
| (0.1 | ) |
| (0.2 | ) |
|
| (0.1 | ) |
|
| 1.0 |
|
|
| — |
| ||||
Provision (benefit) for income taxes |
| $ | 5.7 |
| $ | 1.2 |
| $ | (16.1 | ) |
| $ | 27.0 |
|
| $ | 32.0 |
|
| $ | 5.7 |
| ||
Effective tax rate |
| 3.2 | % |
| (2.0 | )% |
| 12.8 | % |
|
| 28.0 | % |
|
| 32.9 | % |
|
| 3.2 | % | |||
Income tax expense includes U.S. and international income taxes. Except as required under U.S. tax law, U.S. income and foreign withholding taxes have not been recognized on the excess of the amount for financial reporting over the tax basis of investments in foreign subsidiaries that is indefinitely reinvested outside the U.S. This amount becomes taxable upon a repatriation of assets from the subsidiary or a sale or liquidation of the subsidiary.
DuringThe permanent differences for the secondyear ended December 31, 2023 are due to limitations on the tax deductibility of the loss on extinguishment of debt on the Convertible Senior Notes due 2025 and third quarters of 2021, TimkenSteel (Shanghai) Corporation Limited declared and paid dividends of $0.8 million and $0.4 million, respectively, net of withholding taxes, to TimkenSteel. During the third quarter of 2020, TimkenSteel (Shanghai) Corporation Limited declared a dividend of $5.1 million, net of withholding taxes, to TimkenSteel.excess compensation.
5061
As of December 31, 2021, there was 0 deferred tax liability related to undistributed earnings. The Company had recognized a deferred tax liability in the amount of $0.3 million at December 31, 2020, for undistributed earnings at its TimkenSteel (Shanghai) Corporation Limited and TimkenSteel de Mexico S. de R.C. de C.V. subsidiaries.
The effect of temporary differences giving rise to deferred tax assets and liabilities at December 31, 20212023 and 20202022 was as follows:
|
| Years Ended December 31, |
|
| Years Ended December 31, |
| ||||||||||
|
| 2021 |
| 2020 |
|
| 2023 |
| 2022 |
| ||||||
Deferred tax liabilities: |
|
|
|
|
|
|
|
|
|
|
|
| ||||
Depreciation |
| $ | (89.0 | ) |
| $ | (97.5 | ) |
| $ | (75.0 | ) |
| $ | (81.4 | ) |
Inventory |
| (8.0 | ) |
| (16.2 | ) |
|
| — |
|
|
| — |
| ||
Convertible notes |
| — |
| (1.6 | ) | |||||||||||
Prepaid insurance |
|
| (1.9 | ) |
|
| — |
| ||||||||
Leases - right-of-use asset |
| (3.5 | ) |
| (5.0 | ) |
|
| (2.8 | ) |
|
| (3.1 | ) | ||
Other, net |
| — |
| (0.3 | ) | |||||||||||
Deferred tax liabilities |
| $ | (100.5 | ) |
| $ | (120.6 | ) |
| $ | (79.7 | ) |
| $ | (84.5 | ) |
Deferred tax assets: |
|
|
|
|
|
|
|
|
|
|
|
| ||||
Tax loss carryforwards |
| $ | 52.6 |
| $ | 94.4 |
|
| $ | 16.0 |
|
| $ | 20.5 |
| |
Pension and postretirement benefits |
| 44.3 |
| 50.3 |
|
|
| 46.8 |
|
|
| 35.5 |
| |||
Other employee benefit accruals |
| 8.2 |
| 8.7 |
|
|
| 8.0 |
|
|
| 6.6 |
| |||
Lease liability |
| 3.5 |
| 5.0 |
|
|
| 2.8 |
|
|
| 3.1 |
| |||
State decoupling |
| 1.3 |
| 2.8 |
|
|
| 1.2 |
|
|
| 0.8 |
| |||
Accrued restructuring |
| 1.1 |
| — |
|
|
| — |
|
|
| 0.1 |
| |||
Capital loss carryforward |
| 0.8 |
| — |
|
|
| 0.8 |
|
|
| 0.8 |
| |||
Intangible assets |
| 0.6 |
| 1.0 |
|
|
| 0.1 |
|
|
| 0.2 |
| |||
Inventory |
| 0.6 |
| 4.5 |
|
|
| 0.8 |
|
|
| 0.7 |
| |||
Allowance for doubtful accounts |
| 0.5 |
| 0.3 |
|
|
| 0.5 |
|
|
| 0.3 |
| |||
Accrued legal |
|
| — |
|
|
| 2.0 |
| ||||||||
Capitalized R&D |
|
| 3.2 |
|
|
| 0.9 |
| ||||||||
Other, net |
| 0.3 |
| 0.3 |
|
|
| — |
|
|
| 0.1 |
| |||
Deferred tax assets subtotal |
| $ | 113.8 |
| $ | 167.3 |
|
| $ | 80.2 |
|
| $ | 71.6 |
| |
Valuation allowances |
| (15.5 | ) |
| (47.7 | ) |
|
| (15.5 | ) |
|
| (13.0 | ) | ||
Deferred tax assets |
| 98.3 |
| 119.6 |
|
|
| 64.7 |
|
|
| 58.6 |
| |||
Net deferred tax assets (liabilities) |
| $ | (2.2 | ) |
| $ | (1.0 | ) |
| $ | (15.0 | ) |
| $ | (25.9 | ) |
As of December 31, 20212023 and 2020,2022, the Company had a net deferred tax liability of $2.215.0 million and $1.025.9 million, respectively, on the Consolidated Balance Sheets.
As of December 31, 2021, TimkenSteel2023, the Company had loss carryforwards in the U.S. and various non-U.S. jurisdictionsUK totaling $224.659.5 million (of which $164.2 million relates to the U.S. and $60.4 million relates to the UK jurisdiction), having various expiration dates. TimkenSteel has provided valuation allowances ofThere are no federal loss carryforwards in the U.S.; however, there are $15.515.8 million against these carryforwards. The majority of the non-U.S.in state and certain local loss carryforwards represent local country net operating losses for branches of TimkenSteel or entities treated as branches of TimkenSteel under U.S. tax law. Tax benefits have previously been recorded for these losses in the U.S. The related local country net operating loss carryforwards are offset fully by valuation allowances.with various expiration dates.
During 2016, operating losses generated in the U.S. resulted in a decrease in the carrying value of the Company’s U.S. deferred tax liability to the point that would result in a net U.S. deferred tax asset at December 31, 2016. In light of TimkenSteel’sthe Company's operating performance in the U.S. and current industry conditions, the Company assessed, based upon all available evidence at the time, and concluded that it was more likely than not that it would not realize a portion of its U.S. deferred tax assets. TheAs such, the Company recorded a valuation allowance in 20162016.
Each reporting period we assess available positive and negative evidence and estimate if sufficient future taxable income will be generated to utilize the Company’s deferred tax assets. Due to Metallus' historical operating performance in the U.S., we have historically been limited in our ability to rely on other subjective evidence such as a resultprojections of current year activity,our future profitability. However, as of December 31, 2022, based on consecutive years of profitability, utilization of the majority of previously generated loss carryforwards in the U.S., and forecasted future profitability, the Company remained inreleased a fullportion of its U.S. valuation allowance. The Company maintained a domestic partial valuation allowance position through 2021. Going forward,on a capital loss carryforward and certain state loss carryforwards that are expected to expire unused. Metallus has provided a valuation allowance on the aforementioned UK loss carryforward.
The need to maintain valuation allowances against deferred tax assets in the U.S. and other affected countries willmay cause variability in the Company’s effective tax rate. The Company will maintain a valuation allowance against its deferred tax assets in the U.S.majority of Metallus' income taxes are derived from federal, domestic state and applicable foreign countries until sufficient positive evidence exists to eliminate them.local taxes.
62
As of December 31, 2023, 2022 and 2021, 2020 and 2019, TimkenSteelthe Company had 0no total gross unrecognized tax benefits, and 0no amounts which represented unrecognized tax benefits that would favorably impact TimkenSteel’sMetallus' effective income tax rate in any future periods if such benefits were recognized. As of December 31, 2021, TimkenSteel2023, Metallus does not anticipate a change in its unrecognized tax positions during the next 12 months. TimkenSteelMetallus had 0no accrued interest and penalties related to uncertain tax positions as of December 31, 2021, 20202023, 2022 and 2019.2021.
As of December 31, 2021,2023, the tax years 20182020 to the present remain open to examination by the IRS.
51
Note 9 - Earnings (Loss) Per Share
Basic earnings (loss) per share is computed based upon the weighted average number of common shares outstanding. Diluted earnings (loss) per share is computed based upon the weighted average number of common shares outstanding plus the dilutive effect of common share equivalents calculated using the treasury stock method or if-converted method. For the Convertible Notes, the Company utilizes the if-converted method to calculate diluted earnings (loss) per share. Under the if-converted method, the Company adjusts net earnings to add back interest expense (including amortization of debt issuance costs) recognized on the Convertible Notes and includes the number of shares potentially issuable related to the Convertible Notes in the weighted average shares outstanding. Treasury stock, if any, is excluded from the denominator in calculating both basic and diluted earnings (loss) per share.
Equity-based Awards
Common share equivalents for shares issuable for equity-based awards amounted to 3.4 million shares for the year ended December 31, 2023. For the year ended December 31, 2023, 0.4 million shares were excluded from the computation of diluted earnings (loss) per share, primarily related to options with exercise prices above the average market price of our common shares (i.e., “underwater” options), because the effect of their inclusion would have been anti-dilutive. The difference between the remaining 3.0 million shares and 0.9 million shares assumed purchased with potential proceeds for the year ended December 31, 2023, were included in the denominator of the diluted earnings (loss) per share calculation.
Common share equivalents for shares issuable for equity-based awards amounted to 4.0 million shares for the year ended December 31, 2022. For the year ended December 31, 2022, 0.8 million shares were excluded from the computation of diluted earnings (loss) per share, primarily related to options with exercise prices above the average market price of our common shares (i.e., “underwater” options), because the effect of their inclusion would have been anti-dilutive. The difference between the remaining 3.2 million shares and 1.1 million shares assumed purchased with potential proceeds for the year ended December 31, 2022, were included in the denominator of the diluted earnings (loss) per share calculation.
Common share equivalents for shares issuable for equity-based awards amounted to 4.8 million shares for the year ended December 31, 2021. For the year ended December 31, 2021, 1.8 million shares were excluded from the computation of diluted earnings (loss) per share, primarily related to options with exercise prices above the average market price of our common shares (i.e., “underwater” options), because the effect of their inclusion would have been anti-dilutive. The difference between the remaining 3.0 million shares and 1.3 million shares assumed purchased with potential proceeds for the year ended December 31, 2021, were included in the denominator of the diluted earnings (loss) per share calculation.
Common share equivalents for shares issuable for equity-based awards amounted to 4.6 million shares and 3.7 million shares for the years ended December 31, 2020 and December 31, 2019, respectively. All common share equivalents for shares issuable for equity-based awards were excluded from the computation of diluted earnings (loss) per share for the years ended December 31, 2020 and December 31, 2019, because the effect of their inclusion would have been anti-dilutive.
Convertible Notes
Common share equivalents for shares issuable upon the conversion of outstanding convertible notes of 7.41.9 million for the year ended December 31, 2021,2023, were included in the computation of diluted earnings (loss) per share, as these shares would be dilutive.
In January 2022, TimkenSteelthe first quarter of 2023, the Company repurchased $5.07.5 million of outstanding principal related to the Convertible SeniorNotes. There were no repurchases related to the Convertible Notes Due 2025. The convertible notes repurchase will haveduring the effectremainder of reducing2023. These repurchases of Convertible Notes reduced weighted average diluted shares outstanding by approximately 0.60.7 million shares beginning in the first quarter of 2022.
Common share equivalents for shares issuable upon the conversion of outstanding convertible notes of 9.1 million and 6.9 million for the yearsyear ended December 31, 2020 and2023. Refer to “Note 14 – Financing Arrangements” for additional information on the Convertible Notes.
63
During the first half of 2022, the Company repurchased $25.2 million of outstanding principal related to the Convertible Notes. These repurchases of Convertible Notes reduced weighted average diluted shares outstanding by 2.3 million shares for the year ended December 31, 2019, respectively, were excluded from the computation of diluted earnings (loss) per share because the effect of their inclusion would have been anti-dilutive.2022.
The following table sets forth the reconciliation of the numerator and the denominator of basic and diluted earnings (loss) per share for the years ended December 31, 2021, 20202023, 2022 and 2019:2021:
|
| Year Ended December 31, |
|
| Year Ended December 31, |
| ||||||||||||||||||
|
| 2021 |
|
| 2020 |
|
| 2019 |
|
| 2023 |
|
| 2022 |
|
| 2021 |
| ||||||
Numerator: |
|
|
|
|
|
|
|
|
|
|
|
|
|
|
|
|
|
| ||||||
Net income (loss), basic |
| $ | 171.0 |
| $ | (61.9 | ) |
| $ | (110.0 | ) |
| $ | 69.4 |
|
| $ | 65.1 |
|
| $ | 171.0 |
| |
Add convertible notes interest |
| 4.1 |
| — |
| — |
|
|
| 1.0 |
|
|
| 1.9 |
|
|
| 4.1 |
| |||||
Net income (loss), diluted |
| $ | 175.1 |
| $ | (61.9 | ) |
| $ | (110.0 | ) |
| $ | 70.4 |
|
| $ | 67.0 |
|
| $ | 175.1 |
| |
|
|
|
|
|
|
|
|
|
|
|
|
|
|
|
|
|
|
| ||||||
Denominator: |
|
|
|
|
|
|
|
|
|
|
|
|
|
|
|
|
|
| ||||||
Weighted average shares outstanding, basic |
| 45.9 |
| 45.0 |
| 44.8 |
|
|
| 43.8 |
|
|
| 45.8 |
|
|
| 45.9 |
| |||||
Dilutive effect of equity-based awards |
| 1.7 |
| — |
| — |
|
|
| 2.1 |
|
|
| 2.1 |
|
|
| 1.7 |
| |||||
Dilutive effect of convertible notes |
| 7.4 |
| — |
| — |
|
|
| 1.9 |
|
|
| 3.6 |
|
|
| 7.4 |
| |||||
Weighted average shares outstanding, diluted |
| 55.0 |
| 45.0 |
| 44.8 |
|
|
| 47.8 |
|
|
| 51.5 |
|
|
| 55.0 |
| |||||
|
|
|
|
|
|
|
|
|
|
|
|
|
|
|
|
|
|
| ||||||
Basic earnings (loss) per share |
| $ | 3.73 |
| $ | (1.38 | ) |
| $ | (2.46 | ) |
| $ | 1.58 |
|
| $ | 1.42 |
|
| $ | 3.73 |
| |
Diluted earnings (loss) per share |
| $ | 3.18 |
| $ | (1.38 | ) |
| $ | (2.46 | ) |
| $ | 1.47 |
|
| $ | 1.30 |
|
| $ | 3.18 |
| |
52
Note10–Inventories
The components of inventories as of December 31, 20212023 and 20202022 were as follows:
|
| December 31, |
|
| December 31, |
| ||||||||||
|
| 2021 |
|
| 2020 |
|
| 2023 |
|
| 2022 |
| ||||
Manufacturing supplies |
| $ | 29.3 |
| $ | 37.6 |
|
| $ | 51.5 |
|
| $ | 36.9 |
| |
Raw materials |
| 37.3 |
| 20.0 |
|
|
| 17.5 |
|
|
| 23.9 |
| |||
Work in process |
| 89.3 |
| 79.1 |
|
|
| 109.6 |
|
|
| 94.7 |
| |||
Finished products |
| 55.8 |
| 55.6 |
|
|
| 50.1 |
|
|
| 37.4 |
| |||
Gross inventory |
| 211.7 |
| 192.3 |
|
|
| 228.7 |
|
|
| 192.9 |
| |||
Allowance for inventory reserves |
| (0.8 | ) |
| (13.9 | ) |
|
| (0.7 | ) |
|
| (0.5 | ) | ||
Total inventories, net |
| $ | 210.9 |
| $ | 178.4 |
|
| $ | 228.0 |
|
| $ | 192.4 |
| |
The allowance for inventory reserves decreased in 2021 due to sales of TMS inventory, along with the selling and scrapping of aged inventory.
Note11-Property, Plant and Equipment
The components of property, plant and equipment, net as of December 31, 20212023 and 20202022 were as follows:
|
| December 31, |
|
| December 31, |
| ||||||||||
|
| 2021 |
| 2020 |
|
| 2023 |
| 2022 |
| ||||||
Land |
| $ | 11.2 |
| $ | 13.3 |
|
| $ | 11.2 |
|
| $ | 11.2 |
| |
Buildings and improvements |
| 415.0 |
| 422.5 |
|
|
| 429.2 |
|
|
| 414.6 |
| |||
Machinery and equipment |
| 1,391.9 |
| 1,398.7 |
|
|
| 1,367.6 |
|
|
| 1,391.5 |
| |||
Construction in progress |
| 9.6 |
| 11.0 |
|
|
| 59.3 |
|
|
| 30.8 |
| |||
Subtotal |
| 1,827.7 |
| 1,845.5 |
|
|
| 1,867.3 |
|
|
| 1,848.1 |
| |||
Less allowances for depreciation |
| (1,317.5 | ) |
| (1,275.7 | ) |
|
| (1,374.8 | ) |
|
| (1,362.0 | ) | ||
Property, plant and equipment, net |
| $ | 510.2 |
| $ | 569.8 |
|
| $ | 492.5 |
|
| $ | 486.1 |
| |
64
Total depreciation expense was $59.854.6 million, $65.055.5 million, and $67.459.8 million for the years ended December 31, 2021, 2020,2023, 2022, and 2019,2021, respectively. Depreciation expense for the yearsyear ended December 31, 2021 2020 and 2019 includes $1.5 million $2.4 million and $1.9 million, respectively, of accelerated depreciation related to the closure of TMS which was announced in the fourth quarter of 2019 and the discontinuation of specific small-diameter seamless mechanical tube manufacturing announced in the third quarter of 2020. There was no accelerated depreciation for the years ended December 31, 2023 and 2022.
For the year ended December 31, 2023, the Company recorded a gain on sale and disposal of assets of $2.5 million primarily related to the sale of the small-diameter seamless mechanical tubing machinery and equipment, partially offset by assets removed from service. No impairment charges were recognized in 2023.
For the year ended December 31, 2022, the Company recorded a loss on sale and disposal of assets of $1.9 million primarily related to the sale of the remaining land and buildings at the Company's former TMS facility, as well as the disposition of excess and aged assets. No impairment charges were recognized in 2022.
For the year ended December 31, 2021, TimkenSteelthe Company recorded a net loss on sale of assets of $1.3 million related to the disposition of excess assets. During 2021, the Company also recorded approximately $10.6 million of impairment charges related to the indefinite idling of the Harrison melt and casting assets, the impairment of certain assets at our St. Clair facility due to the early termination of a customer program, and the disposition of assets at our former TMS facility. Additionally, the Company recorded a net loss on sale of assets for the year ended December 31, 2021 of $1.3 million related to the disposition of excess assets. For the year ended December 31, 2020, TimkenSteel recorded a net gain on the sale and disposal of assets of $2.6 million, primarily related to the sale of certain TMS assets. For the year ended December 31, 2019, TimkenSteel recorded impairments and loss on disposal of assets of $9.0 million primarily related to the abandonment of certain equipment and the impairment of assets held for sale. See “Note 6 - Disposition of Non-Core Assets” for additional information.
Supplemental cash flow information related to non-cash investing activity was as follows:
|
| Year Ended December 31, |
| |||||||||
|
| 2021 |
|
| 2020 |
|
| 2019 |
| |||
Accrued property, plant and equipment purchases |
| $ | 3.6 |
|
| $ | 2.0 |
|
| $ | 5.3 |
|
|
| Year Ended December 31, |
| |||||||||
|
| 2023 |
|
| 2022 |
|
| 2021 |
| |||
Accrued property, plant and equipment purchases |
| $ | 12.1 |
|
| $ | 10.6 |
|
| $ | 3.6 |
|
Note 12 - Intangible Assets
The components of intangible assets, net as of December 31, 20212023 and 20202022 were as follows:
|
| December 31, 2021 |
|
| December 31, 2020 |
| ||||||||||||||||||
|
| Gross |
|
| Accumulated |
|
| Net |
|
| Gross |
|
| Accumulated |
|
| Net |
| ||||||
Customer relationships |
| $ | 6.3 |
|
| $ | 5.8 |
|
| $ | 0.5 |
|
| $ | 6.3 |
|
| $ | 5.4 |
|
| $ | 0.9 |
|
Technology use |
|
| 9.0 |
|
|
| 9.0 |
|
|
| — |
|
|
| 9.0 |
|
|
| 9.0 |
|
|
| — |
|
Capitalized software |
|
| 57.4 |
|
|
| 51.2 |
|
|
| 6.2 |
|
|
| 58.0 |
|
|
| 49.6 |
|
|
| 8.4 |
|
Total intangible assets |
| $ | 72.7 |
|
| $ | 66.0 |
|
| $ | 6.7 |
|
| $ | 73.3 |
|
| $ | 64.0 |
|
| $ | 9.3 |
|
53
|
| December 31, 2023 |
|
| December 31, 2022 |
| ||||||||||||||||||
|
| Gross |
|
| Accumulated |
|
| Net |
|
| Gross |
|
| Accumulated |
|
| Net |
| ||||||
Customer relationships |
| $ | 6.3 |
|
| $ | 6.3 |
|
| $ | — |
|
| $ | 6.3 |
|
| $ | 6.2 |
|
| $ | 0.1 |
|
Technology use |
|
| 9.0 |
|
|
| 9.0 |
|
|
| — |
|
|
| 9.0 |
|
|
| 9.0 |
|
|
| — |
|
Capitalized software |
|
| 55.6 |
|
|
| 53.2 |
|
|
| 2.4 |
|
|
| 57.9 |
|
|
| 53.0 |
|
|
| 4.9 |
|
Total intangible assets |
| $ | 70.9 |
|
| $ | 68.5 |
|
| $ | 2.4 |
|
| $ | 73.2 |
|
| $ | 68.2 |
|
| $ | 5.0 |
|
Intangible assets subject to amortization are amortized using a straight-line method over their legal or estimated useful lives. The weighted average useful lives of the customer relationships, technology use and capitalized software intangible assets are 15 years, 15 years and 6 years, respectively. The weighted average useful life of total intangible assets is 8 years as of December 31, 2021.2023. Amortization expense for intangible assets for the years ended December 31, 2023, 2022, and 2021 2020,was $2.3 million, $2.8 million and 2019 was $3.3 million, $respectively.
There were 5.0no million and $6.1 million, respectively. Amortization expense in 2020 and 2019 associated with capitalized software includes accelerated amortization of $1.0 million and $0.9 million, respectively, related to the closure of TMS. See “Note 6 - Disposition of Non-Core Assets” for additional information. During the years ended December 31, 2020 and 2019, TimkenSteel recorded a loss on disposal of $0.2 million and $0.1 million, respectively, related to capitalized software. There was 0 lossmaterial losses on disposal of intangible assets for the yearyears ended December 31, 2023, 2022 and 2021.
65
Based upon the intangible assets subject to amortization as of December 31, 2021, TimkenSteel’s2023, Metallus' estimated annual amortization for the five succeeding years is shown below (in millions):
Year |
| Amortization |
|
| Amortization |
| ||
2022 |
| $ | 2.6 |
| ||||
2023 |
| 2.1 |
| |||||
2024 |
| 1.1 |
|
| $ | 1.3 |
| |
2025 |
| 0.1 |
|
|
| 0.3 |
| |
2026 |
| 0.1 |
|
|
| 0.2 |
| |
2027 |
|
| 0.1 |
| ||||
2028 |
|
| 0.1 |
| ||||
Note 13 - Leases
The Company has operating leases for office space, warehouses, land,primarily related to machinery and equipment, vehicles and information technology equipment. These leases have remaining lease terms of less than one year to approximately five years, some of which may include options to extend the lease for one or more years. Certain leases also include options to purchase the leased asset. As of December 31, 2021,2023, the Company has no financing leases. The weighted average remaining lease term for our operating leases as of December 31, 20212023 was 2.83.1 years.
Leases with an initial term of 12 months or less ("short-term leases") are not recorded on the balance sheet. Rather, the Company recognizes lease expense for these leases on a straight-line basis over the lease term in accordance with the applicable accounting guidance. For lease agreements entered into after the adoption of lease accounting guidance on January 1, 2019, the Company combines lease and non-lease components. The Company’s lease agreements do not contain material residual value guarantees or material restrictive covenants.
The Company recorded lease cost for the years ended December 31, 2021, 20202023, 2022 and 20192021 as follows:
|
| Year Ended December 31, |
|
| Year Ended December 31, |
| ||||||||||||||||||
|
| 2021 |
|
| 2020 |
|
| 2019 |
|
| 2023 |
|
| 2022 |
|
| 2021 |
| ||||||
Operating lease cost |
| $ | 8.2 |
| $ | 8.8 |
| $ | 7.4 |
|
| $ | 7.3 |
|
| $ | 6.7 |
|
| $ | 8.2 |
| ||
Short-term lease cost |
| 0.7 |
| 0.7 |
| 1.9 |
|
|
| 0.8 |
|
|
| 0.9 |
|
|
| 0.7 |
| |||||
Total lease cost |
| $ | 8.9 |
| $ | 9.5 |
| $ | 9.3 |
|
| $ | 8.1 |
|
| $ | 7.6 |
|
| $ | 8.9 |
| ||
When available, the rate implicit in the lease is used to discount lease payments to present value; however, the Company’s leases generally do not provide a readily determinable implicit rate. Therefore, the incremental borrowing rate to discount the lease payments is estimated using market-based information available at lease commencement. The weighted average discount rate used to measure our operating lease liabilities as of December 31, 20212023 and 20202022 was 2.74.3% and 3.23.1%, respectively.
Supplemental cash flow information related to leases was as follows:
|
| Year Ended December 31, |
|
| Year Ended December 31, |
| ||||||||||||||||||
|
| 2021 |
|
| 2020 |
|
| 2019 |
|
| 2023 |
|
| 2022 |
|
| 2021 |
| ||||||
Cash paid for amounts included in the measurement of operating lease liabilities |
| $ | 8.2 |
| $ | 8.8 |
| $ | 7.5 |
|
| $ | 7.1 |
|
| $ | 6.7 |
|
| $ | 8.2 |
| ||
Right-of-use assets obtained in exchange for operating lease obligations |
| $ | 3.1 |
| $ | 12.5 |
| $ | 4.3 |
|
| $ | 5.6 |
|
| $ | 4.5 |
|
| $ | 3.1 |
| ||
Future minimum lease payments under non-cancellable leases as of December 31, 20212023 were as follows:
2022 |
| $ | 6.0 |
|
2023 |
|
| 5.0 |
|
2024 |
|
| 2.8 |
|
2025 |
|
| 1.1 |
|
After 2025 |
|
| 0.2 |
|
Total future minimum lease payments |
|
| 15.1 |
|
Less amount of lease payment representing interest |
|
| (0.6 | ) |
Total present value of lease payments |
| $ | 14.5 |
|
66
54
2024 |
| $ | 5.5 |
|
2025 |
|
| 3.2 |
|
2026 |
|
| 1.7 |
|
2027 |
|
| 1.3 |
|
After 2028 |
|
| 0.8 |
|
Total future minimum lease payments |
|
| 12.5 |
|
Less amount of lease payment representing interest |
|
| (1.1 | ) |
Total present value of lease payments |
| $ | 11.4 |
|
As of December 31, 2021, we have additional operating leases that have not yet commenced for which the present value of the lease payments over the respective lease terms totals approximately $0.9 million. These leases are primarily related to equipment that will support our plant operations. Most of these operating leases will commence in the first half of 2022 with lease terms of approximately 1 year to 5 years. Accordingly, these leases are not recorded on the Consolidated Balance Sheets at December 31, 2021.
Note 14 - Financing Arrangements
The following table summarizes the current and non-current debt as of December 31, 20212023 and 2020:2022:
|
| December 31, |
|
| December 31, |
| ||||||||||
|
| 2021 |
|
| 2020 |
|
| 2023 |
|
| 2022 |
| ||||
Credit Agreement |
| $ | — |
| $ | — |
|
| $ | — |
|
| $ | — |
| |
Convertible Senior Notes due 2021 |
| — |
| 38.9 |
| |||||||||||
Convertible Senior Notes due 2025 |
| 44.9 |
| 39.3 |
|
|
| 13.2 |
|
|
| 20.4 |
| |||
Total debt |
| $ | 44.9 |
| $ | 78.2 |
|
| $ | 13.2 |
|
| $ | 20.4 |
| |
Less current portion of debt |
| 44.9 |
| 38.9 |
|
|
| 13.2 |
|
|
| 20.4 |
| |||
Total non-current portion of debt |
| $ | 0 |
| $ | 39.3 |
|
| $ | — |
|
| $ | — |
| |
Amended Credit Agreement
On October 15, 2019,September 30, 2022, the Company, as borrower, and certain domestic subsidiaries of the Company, as subsidiary guarantors (the “Subsidiary Guarantors”), entered into a ThirdFourth Amended and Restated Credit Agreement (the "Amended“Amended Credit Agreement"Agreement”), with JP MorganJPMorgan Chase Bank, N.A., as administrative agent (the "Administrative Agent"“Administrative Agent”), Bank of America, N.A., as syndication agent, and the other lenders party thereto (collectively, the "Lenders"“Lenders”), which further amended and restated the Company’s existingsecured Third Amended and Restated Credit Agreement, dated as of January 26, 2018.October 15, 2019.
The Amended Credit Agreement provides for a $400.0 million asset-based revolving credit facility (the "Credit Facility"“Credit Facility”), including a $15.0 million sublimit for the issuance of commercial and standby letters of credit and a $40.0 million sublimit for swingline loans. Pursuant to the terms of the Amended Credit Agreement, the Company is entitled, on up to two occasions and subject to the satisfaction of certain conditions, to request increases in the commitments under the Amended Credit Agreement in the aggregate principal amount of up to $100.0 million, to the extent that existing or new lenders agree to provide such additional commitments. In addition to and independent of any increase described in the preceding sentence, the Company is entitled, subject to the satisfaction of certain conditions, to request a separate first-in, last-out ("FILO"“first-in, last-out” tranche (the “Incremental FILO Tranche”) tranche in an aggregate principal amount of up to $30.0 million with a separate borrowing base and interest rate margins, in each case, to be agreed upon among the Company, the Administrative Agent and the Lenders providing the incrementalIncremental FILO tranche.Tranche.
The availability of borrowings under the Credit Facility is subject to a borrowing base calculation based upon a valuation of the eligible accounts receivable, inventory and machinery and equipment of the Company and the subsidiary guarantors,Subsidiary Guarantors, each multiplied by an applicable advance rate. The availability of borrowings may be further modified by reserves established from time to time by the Administrative Agent in its permitted discretion.
The interest rate per annum applicable to loans under the Credit Facility will be, at the Company’s option, equal to either (i) the alternate base rateAlternate Base Rate (as defined in the Amended Credit Agreement) plus the applicable margin or (ii) the relevant adjusted LIBO rate for an interest period of one, two, three or six monthsAdjusted Term SOFR Rate (as selected bydefined in the Company)Amended Credit Agreement) plus the applicable margin. The base rate will be a fluctuating rate per annum equal to the greatest of (i) the prime rate as quoted in The Wall Street Journal, (ii) the effective Federal Reserve Bank of New York rate plus 0.50% and (iii) the adjusted LIBO rate for a one-month interest period on the applicable date, plus 1.00%. The adjusted LIBO rate will be equal to the applicable London interbank offered rate for the selected interest period, as adjusted for statutory reserve requirements for eurocurrency liabilities. The applicable margin will be determined by a pricing grid based on the Company’s average quarterly availability. The Alternate Base Rate is subject to a 1.00% floor, and the Adjusted Term SOFR Rate is subject to a 0.00% floor. In addition, the Company will pay a 0.25% per annum commitment fee on the average daily unused amount of the Credit Facility. As
67
The Credit Agreement was $251.1 million, reflective of the Company’s asset borrowing base with no outstanding borrowings.
Facility may be used to finance working capital, capital expenditures, certain permitted acquisitions and for other general corporate purposes. All of the indebtedness under the Credit Facility is guaranteed by the Company’s material domestic subsidiaries, as well as any other domestic subsidiary that the Company elects to make a party to the Amended Credit Agreement, and is secured by substantially all of the personal property of the Company and the subsidiary guarantors.Subsidiary Guarantors.
The Credit Facility matures on October 15, 2024September 30, 2027. Prior to the maturity date, amounts outstanding are required to be repaid (without reduction of the commitments thereunder) from mandatory prepayment events from the proceeds of certain asset sales, equity or debt issuances or casualty events.
The Amended Credit Agreement contains certain customary covenants, including covenants that limit the ability of the Company and its subsidiaries to, among other things, (i) incur or suffer to exist certain liens, (ii) make investments, (iii) incur or guaranty additional
55
indebtedness (iv) enter into consolidations, mergers, acquisitions, sale-leaseback transactions and sales of assets, (v) make distributions and other restricted payments, (vi) change the nature of its business, (vii) engage in transactions with affiliates and (viii) enter into restrictive agreements, including agreements that restrict the ability to incur liens or make distributions.
In addition, the Amended Credit Agreement requires the Company to maintain a minimum specified fixed charge coverage ratio on a springing basis if minimum availability requirements as specified in the Amended Credit Agreement are not maintained. During 2021, the Amended Credit Agreement also required the Company to maintain certain minimum liquidity as specified in the Amended Credit Agreement from March 1 through June 1, 2021.
The Amended Credit Agreement contains certain customary events of default. If any event of default occurs and is continuing, the Lenders would be entitled to take various actions, including the acceleration of amounts due under the Amended Credit Agreement, and exercise other rights and remedies.
As of the year ended December 31, 2021,2023, the amount available under the Amended Credit Agreement was $258.8 million, reflective of the Company’s asset borrowing base with no outstanding borrowings. Additionally, the Company is in compliance with all covenants outlined in the Amended Credit Agreement.
Convertible Senior Notes due 2021
In May 2016, the Company issued $75.0 million aggregate principal amount of Convertible Senior Notes, and an additional $11.3 million principal amount to cover over-allotments ("Convertible Senior Notes due 2021"). The Indenture for the Convertible Senior Notes due 2021 dated May 31, 2016, which was filed with the Securities and Exchange Commission as an exhibit to a Form 8-K filed on May 31, 2016, contained a complete description of the terms of the Convertible Senior Notes due 2021. The key terms were as follows:
|
|
|
|
|
|
|
|
|
|
The net proceeds to the Company from the offering were $83.2 million, after deducting the initial underwriters’ discount and fees and the offering expenses payable by the Company. The Company used the net proceeds to repay a portion of the amounts outstanding under its revolving credit agreement.
The initial value of the principal amount recorded as a liability at the date of issuance was $66.9 million, using an effective interest rate of 12.0%. The remaining $19.4 million of principal amount was allocated to the conversion feature and recorded as a component of shareholders’ equity at the date of issuance. This amount represented a discount to the debt to be amortized through interest expense using the effective interest method through the maturity of the Convertible Senior Notes due 2021.
Transaction costs were allocated to the liability and equity components based on their relative values. Transaction costs attributable to the liability component of $2.4 million were amortized to interest expense over the term of the Convertible Senior Notes due 2021, and transaction costs attributable to the equity component of $0.7 million were included in shareholders’ equity.
Convertible Notes Exchange
In December 2020, TimkenSteel entered into separate, privately negotiated exchange agreements with a limited number of holders of the Company’s then outstanding Convertible Senior Notes due 2021. Pursuant to the exchange agreements, the Company exchanged $46.0 million aggregate principal amount of Convertible Senior Notes due 2021 for $46.0 million aggregate principal amount of its new 6.0% Convertible Senior Notes due 2025 ("Convertible Senior Notes due 2025" and, together with the Convertible Senior Notes due 2021, the "Convertible Notes"). The Company did 0t receive any cash proceeds from the issuance of the Convertible Senior Notes due 2025.
The Company evaluated this exchange and determined that $46.0 million of the Convertible Senior Notes due 2021 were deemed to be extinguished, as the present value of the cash flows under the terms of the Convertible Senior Notes due 2025 were at least 10 percent different from the present value of the remaining cash flows under the terms of the Convertible Senior Notes due 2021, as defined by the relevant accounting standards.
Pursuant to applicable accounting guidance, the fair value of the extinguished portion of Convertible Senior Notes due 2021 was calculated using a market rate of 9.0%, based on comparable debt instruments, and a remaining term of five and a half months. The difference between the
56
fair value and the net carrying amount of the liability component, calculated below, was recognized on the Consolidated Statements of Operations as a loss on extinguishment of debt for the year ended December 31, 2020.
Net carrying amount of extinguished Convertible Senior Notes due 2021 as of December 15, 2020 |
|
|
| |
Principal |
| $ | 46.0 |
|
Less: Debt issuance costs, net of amortization |
|
| (0.1 | ) |
Less: Debt discount, net of amortization |
|
| (1.5 | ) |
Fair value of extinguished Convertible Senior Notes due 2021 as of December 15, 2020 |
|
| 45.3 |
|
Loss on extinguishment of debt |
| $ | (0.9 | ) |
The amount allocated to the reacquisition of the equity component, included as a reduction to additional paid-in capital on the Consolidated Balance Sheets, was calculated as follows:
Fair value of extinguished Convertible Senior Notes due 2021 as of December 15, 2020 |
| $ | 45.3 |
|
Principal of extinguished Convertible Senior Notes due 2021 |
|
| 46.0 |
|
Reduction of additional paid-in capital in 2020 |
| $ | (0.7 | ) |
The remaining accrued and unpaid interest on the $46.0 million of the extinguished Convertible Senior Notes due 2021 was paid in the amount of $0.1 million to the holders on December 15, 2020.
The components of the Convertible Senior Notes due 2021 as of December 31, 2021 and December 31, 2020 were as follows:
|
| Year Ended December 31, |
| |||||
|
| 2021 |
|
| 2020 |
| ||
Principal |
| $ | — |
|
| $ | 40.2 |
|
Less: Debt issuance costs, net of amortization |
|
| — |
|
|
| (0.1 | ) |
Less: Debt discount, net of amortization |
|
| — |
|
|
| (1.2 | ) |
Convertible Senior Notes due 2021, net |
| $ | — |
|
| $ | 38.9 |
|
There was 0 outstanding principal amount for the Convertible Senior Notes due 2021 as of December 31, 2021, as the notes matured on June 1, 2021. The Convertible Senior Notes due 2021 were settled with a cash payment of $38.9 million and the issuance of shares of 0.1 million, as most noteholders exercised the conversion option prior to the date of maturity. For details regarding method of settlement for noteholders who exercised their conversion option prior to maturity, refer to the Indenture for the Convertible Senior Notes due 2021 filed as an exhibit to a Form 8-K on May 31, 2016. The final cash payment for interest in the amount of $1.2 million was also made to noteholders on June 1, 2021.
Convertible Senior Notes due 2025
The Convertible Senior Notes due 2025 were issued pursuant to the provisions of the indenture dated May 31, 2016, as supplemented by a supplemental indenture dated December 15, 2020, which was filed with the Securities and Exchange Commission as an exhibit to a Form 8-K on December 15, 2020. The indentures contain a complete description of the terms of the Convertible Senior Notes due 2025. The key terms are as follows:
Maturity Date: | December 1, 2025 unless repurchased or converted earlier |
Interest Rate: | 6.0% cash interest per year |
Interest Payments Dates: | June 1 and December 1 of each year, beginning on December 1, 2021 |
Initial Conversion Price: | $7.82 per common share of the Company |
Initial Conversion Rate: | 127.8119 common shares per $1,000 principal amount of Notes |
The principal amount of the Convertible Senior Notes due 2025 as of December 31, 20212023 is $46.013.3 million. Transaction costs related to the Convertible Senior Notes due 2025 incurred upon issuance were $1.5 million. These costs are amortized to interest expense over the term of the notes. The Convertible Senior Notes due 2025 are convertible at the option of the holders in certain circumstances and during certain periods into the Company's common shares, cash, or a combination thereof, at the Company's election.
The Indenture for the Convertible Senior Notes due 2025 provides that notes will become convertible during a quarter when the share price for 20 trading days during the final 30 trading days of the immediately preceding quarter was greater than 130% of the conversion price. This
57
criterion was met during the fourth quarter of 20212023 (and each preceding quarter of 2023) and as such the notes can be converted at the option of the holders beginning January 1 through March 31, 2022.2024. Whether the notes will be
68
convertible following such period will depend on if this criterion, or another conversion condition, is met in the future. As such, the Convertible Senior Notes due 2025 are classified as a current liability inon the Consolidated Balance Sheets as of December 31, 2021.2023. This criterion was also met as of December 31, 2022. To date, no holders have elected to convert their notes during any optional conversion periods.
For details regarding all conversion mechanics and methods of settlement, refer to the Indenture for the Convertible Senior Notes due 2025 filed as an exhibit to a Form 8-K on December 15, 2020.
The components of the Convertible Senior Notes due 2025 as of December 31, 20212023 and December 31, 20202022 were as follows:
|
| December 31, |
|
| December 31, |
| ||||||||||
|
| 2021 |
| 2020 |
|
| 2023 |
| 2022 |
| ||||||
Principal |
| $ | 46.0 |
| $ | 46.0 |
|
| $ | 13.3 |
|
| $ | 20.8 |
| |
Less: Debt issuance costs, net of amortization |
| (1.1 | ) |
| (1.3 | ) |
|
| (0.1 | ) |
|
| (0.4 | ) | ||
Less: Debt discount, net of amortization (1) |
| — |
| (5.4 | ) | |||||||||||
Less: Debt discount, net of amortization |
|
| — |
|
|
| — |
| ||||||||
Convertible Senior Notes due 2025, net |
| $ | 44.9 |
| $ | 39.3 |
|
| $ | 13.2 |
|
| $ | 20.4 |
| |
(1) There was no longer a debt discount associated withIn the Convertible Notes beginning in 2021, asfirst quarter of 2023, the Company early adopted ASU 2020-06. For more details refer to "Note 2 - Significant Accounting Policies."
In January 2022, TimkenSteel repurchased a total of $5.07.5 million aggregate principal amount of outstanding principal related to theits Convertible Senior Notes Duedue 2025. Total cash paid to noteholders was $12.418.7 million. A loss on extinguishment of debt will be recognized in the first quarter of 2022 in the amount of $7.511.4 million which includeswas recognized, including a charge of $0.10.2 million for unamortized debt issuance costs related to the portion of debt extinguished, as well as the related transaction costs.
In the first half of 2022, the Company repurchased a total of $25.2 million aggregate principal amount of its Convertible Senior Notes Due 2025. There were no repurchases related to the Convertible Notes during the second half of 2022. Total cash paid to noteholders was $67.6 million. A loss on extinguishment of debt was recognized of $43.0 million, including a charge of $0.6 million for unamortized debt issuance costs related to the portion of debt extinguished, as well as the related transaction costs.
Fair Value Measurement
The fair value of the Convertible Senior Notes due 2025 was approximately $107.041.5 million as of December 31, 2021.2023 and $53.4 million as of December 31, 2022. The fair value of the Convertible Senior Notes due 2025, which falls within Level 2 of the fair value hierarchy as defined by applicable accounting guidance, is based on a valuation model primarily using observable market inputs and requires a recurring fair value measurement on a quarterly basis.
TimkenSteel’sMetallus' Credit Facility is variable-rate debt. As such, any outstanding carrying value is a reasonable estimate of fair value as interest rates on these borrowings approximate current market rates. This valuation falls within Level 2 of the fair value hierarchy and is based on quoted prices for similar assets and liabilities in active markets that are observable either directly or indirectly. There were 0no outstanding borrowings on the Credit Facility as of December 31, 2023, 2022, and 2021.
Convertible Notes Interest Expense(income) expense, net
The following table provides the components of interest (income) expense, net for the years ended December 31, 2023, 2022 and 2021:
|
| Year Ended December 31, |
| |||||||||
|
| 2023 |
|
| 2022 |
|
| 2021 |
| |||
Interest expense |
| $ | 2.7 |
|
| $ | 3.9 |
|
| $ | 6.2 |
|
Interest income |
|
| (9.8 | ) |
|
| (3.3 | ) |
|
| (0.3 | ) |
Interest (income) expense, net |
| $ | (7.1 | ) |
| $ | 0.6 |
|
| $ | 5.9 |
|
Interest income primarily relates to interest earned on cash invested in a money market fund and deposits with financial institutions. As of December 31, 2023, the carrying value of the Company's money market investment was $139.7 million, which approximates the fair value. The Company had $209.5 million invested in a money market fund as of December 31, 2022, and no
69
cash invested in a money market fund as of December 31, 2021. The money market fund is a cash equivalent and is included in cash and cash equivalents on the Consolidated Balance Sheets. The fund consists of highly liquid investments with an average maturity of three months or less and falls within Level 1 of the fair value hierarchy as defined by applicable accounting guidance. Additionally, as of December 31, 2023, the Company has $119.9 million of cash held in other accounts which generate interest income at a rate similar to the money market fund.
The following table sets forth total interest expense recognized specifically related to the Convertible Notes:
|
| Year Ended December 31, |
| |||||||||
|
| 2021 |
|
| 2020 |
|
| 2019 |
| |||
Contractual interest expense |
| $ | 3.7 |
|
| $ | 5.2 |
|
| $ | 5.2 |
|
Amortization of debt issuance costs |
|
| 0.4 |
|
|
| 0.5 |
|
|
| 0.4 |
|
Amortization of debt discount |
|
| — |
|
|
| 4.4 |
|
|
| 4.0 |
|
Total |
| $ | 4.1 |
|
| $ | 10.1 |
|
| $ | 9.6 |
|
Cash Interest Paid
|
| Year Ended December 31, |
| |||||||||
|
| 2023 |
|
| 2022 |
|
| 2021 |
| |||
Contractual interest expense |
| $ | 0.9 |
|
| $ | 1.7 |
|
| $ | 3.7 |
|
Amortization of debt issuance costs |
|
| 0.1 |
|
|
| 0.1 |
|
|
| 0.4 |
|
Total |
| $ | 1.0 |
|
| $ | 1.8 |
|
| $ | 4.1 |
|
The total cash interest paid for the year ended December 31, 2023 , 2022, and 2021 , 2020,was $2.1 million, $3.1 million and 2019 was $5.1 million, respectively.
Treasury Shares
On December 20, 2021, the Company announced that its Board of Directors authorized a share repurchase program under which the Company may repurchase up to $7.650.0 million of its outstanding common shares. The share repurchase program is intended to return capital to shareholders while also offsetting dilution from annual equity compensation awards. The share repurchase program does not require the Company to acquire any dollar amount or number of shares and may be modified, suspended, extended or terminated by the Company at any time without prior notice. On November 2, 2022, the Board of Directors authorized an additional $11.575.0 million respectively.
share repurchase program. This authorization reflects the continued confidence of the Board and senior leadership in the Company’s ability to generate sustainable through-cycle profitability while maintaining a strong balance sheet and cash flow.
58For the year ended December 31, 2023, the Company repurchased approximately
Table1.7 million common shares in the open market at an aggregate cost of Contents$32.6 million, which equates to an average repurchase price of $19.03 per share. As of December 31, 2023, the Company had a balance of $40.4 million remaining under its share repurchase program. For the year ended December 31, 2022, the Company repurchased approximately 3.0 million common shares in the open market at an aggregate cost of $52.0 million, which equates to an average repurchase price of $17.18 per share. The Company did not repurchase shares during the year ended December 31, 2021.
Subsequent to December 31, 2023, the Company repurchased 0.1 million additional common shares in the open market at an aggregate cost of $1.2 million, which equates to an average repurchase price of $21.07 per share. As of February 15, 2024, the Company has $39.2 million remaining under its authorized share repurchase program.
Note 15 - Retirement and Postretirement Plans
Eligible TimkenSteel employees, including certain employees in foreign countries, participate in the following TimkenSteel-sponsoredCompany-sponsored plans: TimkenSteel Corporation Retirement Plan ("Salaried Plan"); TimkenSteel Corporation Bargaining Unit Pension Plan ("Bargaining Plan"), Supplemental Pension Plan of TimkenSteel Corporation ("Supplemental Plan"), TimkenSteel U.K.UK Pension Scheme ("Pension Scheme"), Mexico Pension Plan, and Postretirement Plans made up of TimkenSteel Corporationthe Company's Bargaining Unit Welfare Benefit Plan for Retirees and TimkenSteel Corporation Welfare Benefit Plan for Retirees.
Plan Amendments
Bargaining Plan
On October 29, 2021, the United Steelworkers ("USW") Local 1123 voted to ratify a new four-year contract (the “Contract”). The Contract is in effect until September 27, 2025 and resulted in several changes to the Bargaining Plan which increased the pension liability by $14.2 million in 2021. These plan amendments were recognized in other comprehensive income (loss) in 2021 and will be amortized as part of the pension net periodic benefit cost in future periods. The main change that drove the increase in the pension liability was the addition of a full lump sum form of payment for participants commencing benefits on or after January 1, 2022. In addition, the plan is now closed to new entrants effective January 1, 2022.
70
On July 7, 2022, the Company entered into an agreement with The Prudential Insurance Company of America ("Prudential") to purchase an irrevocable group annuity contract and transfer approximately $256.2 million of pension obligations under the Bargaining Plan. In connection with the agreement, Prudential began paying benefits under the group annuity contract as of October 1, 2022 for a specified group of approximately 1,900 participants and beneficiaries who previously received payments from the Bargaining Plan. Benefits payable to these participants and beneficiaries were not reduced as a result of this transaction. Plan participants and beneficiaries not included in the transaction remain in the Bargaining Plan. The Company recorded a non-cash settlement gain of approximately $2.7 million in the third quarter of 2022 related to this partial plan annuitization. This settlement is a significant event which also required remeasurement of the Bargaining Plan during the third quarter. The transaction was funded directly by the assets of the Bargaining Plan and required no cash contribution from the Company.
The timing and amount of future required pension contributions is significantly affected by asset returns and actuarial assumptions. Based on the results of the December 31, 2023 pension calculations, the Company estimates required Bargaining Plan contributions of approximately $40 million in 2024, with approximately $25 million of contributions required in the first quarter. Required future pension contribution timing and amounts are subject to significant change based on future investment performance, Company estimates and actuarial assumptions, as well as current funding laws.
Salaried Plan
During the fourth quarter of 2019, the Company amended the Salaried Plan, which provides payments of tax-qualified pension benefits to certain salaried employees of the Company and its subsidiaries, to cease benefit accruals under the Salaried Plan for all remaining active participants, effective as of December 31, 2020. This plan amendment reduced the pension liability, resulting in a curtailment gain of $8.1 million for the year ended December 31, 2019. This curtailment gain was recognized in other (income) expense, net in the Consolidated Statements of Operations. During the fourth quarter of 2021, termination of the Salaried Plan was approved by the TimkenSteelCompany's Board of Directors. Participants were notified in January 2022 and the plan will bewas terminated effective March 31, 2022., subject to regulatory approval, which was received in the fourth quarter of 2023. The purchase of an irrevocable annuity contract from an insurance company is expected to occur in 20232024., after which time the insurance company selected will be responsible for all participant benefit payments.
Supplemental Plan
During the fourth quarter of 2019, the Company amended the Supplemental Plan, which provides for the payment of nonqualified supplemental pension benefits to certain salaried participants in the Salaried Plan. The amendment providesprovided for the cessation of benefit accruals under the Supplemental Plan, effective as of December 31, 2020. Effective January 1, 2021, there were no new accruals of benefits, including with respect to service accruals and the final average compensation determination. Certain of the Company’s current and prior named executive officers are participants in the plan. Existing benefits under the plan, as of December 31, 2020, will otherwise continue in accordance with the terms of the plan. This amendment reduced the pension liability, resulting in a curtailment gain of $0.8 million for the year ended December 31, 2019. This curtailment gain was recognized in other (income) expense, net in the Consolidated Statements of Operations.
Postretirement Plans
During the second quarter of 2019, the Company amended the TimkenSteel Corporationits Bargaining Unit Welfare Plan for Retirees related to moving Medicare-eligible retirees to an individual plan on a Medicare healthcare exchange. The amendment reduced the postretirement liability by $70.2 million and required the Company to perform a full remeasurement of its obligation and plan assets as of April 30, 2019. The $70.2 million reduction in the APBO was recognized in other comprehensive income (loss) in 2019 and is being amortized as an offset to postretirement benefit cost over a period of 12 years (average remaining service period). In addition to the reduction of the APBO, the Company recognized a net remeasurement loss of $4.4 million for the year ended December 31, 2019.
During the fourth quarter of 2019, the Company also amended the TimkenSteel Corporationits Welfare Benefit Plan for Retirees, under which certain retired salaried employees of the Company and its subsidiaries are eligible to receive a Company contribution for their medical and prescription drug benefits under the retiree welfare plan. The amendment eliminated the retiree medical subsidy, effective as of December 31, 2019, for all remaining active salaried participants who retire after December 31, 2019 (provided, however, that participants who were laid off on or before March 31, 2020 and who otherwise qualified for the retiree medical subsidy under the terms of the retiree welfare plan remained entitled to receive the retiree medical subsidy). This plan amendment reduced the postretirement liability by $2.3 million in 2019, was recognized in other comprehensive income (loss) in 2019 and is being amortized as an offset to postretirement benefit cost in future periods.
Pension benefits earned are generally based on years of service and compensation during active employment. TimkenSteel’sMetallus' funding policy is consistent with the funding requirements of applicable laws and regulations. Asset allocations are established in a manner consistent with projected plan liabilities, benefit payments and expected rates of return for the various asset classes. The expected rate of return for the investment portfolio is based on expected rates of return for various asset classes, as well as historical asset class and fund performance.
59
The following table sets forth the change in benefit obligation for the definedpension and postretirement benefit pension plans as of December 31, 2021:2023:
|
| Pension |
|
|
|
|
|
|
| |||||||||||||||||||
|
| United States of America |
|
| United Kingdom |
|
| Mexico |
|
|
|
|
|
|
| |||||||||||||
Change in benefit obligation: |
| Bargaining |
|
| Salaried |
|
| Supplemental |
|
| Pension |
|
| Pension |
|
| Total |
|
| Postretirement |
| |||||||
Benefit obligation at the beginning of year |
| $ | 1,053.9 |
|
| $ | 228.7 |
|
| $ | 27.3 |
|
| $ | 84.8 |
|
| $ | 0.4 |
|
| $ | 1,395.1 |
|
| $ | 128.3 |
|
Service cost |
|
| 17.0 |
|
|
| 0.4 |
|
|
| — |
|
|
| — |
|
|
| — |
|
|
| 17.4 |
|
|
| 1.2 |
|
Interest cost |
|
| 28.4 |
|
|
| 5.9 |
|
|
| 0.8 |
|
|
| 1.1 |
|
|
| — |
|
|
| 36.2 |
|
|
| 3.2 |
|
Actuarial (gains) losses |
|
| (31.6 | ) |
|
| (5.1 | ) |
|
| (1.5 | ) |
|
| 0.3 |
|
|
| — |
|
|
| (37.9 | ) |
|
| (6.0 | ) |
Benefits paid |
|
| (56.5 | ) |
|
| (11.4 | ) |
|
| (3.0 | ) |
|
| (3.0 | ) |
|
| — |
|
|
| (73.9 | ) |
|
| (8.9 | ) |
Plan amendment |
|
| 14.2 |
|
|
| — |
|
|
| — |
|
|
| — |
|
|
| — |
|
|
| 14.2 |
|
|
| — |
|
Settlements |
|
| — |
|
|
| (31.1 | ) |
|
| — |
|
|
| — |
|
|
| — |
|
|
| (31.1 | ) |
|
| — |
|
Foreign currency translation adjustment |
|
| — |
|
|
| — |
|
|
| — |
|
|
| (0.8 | ) |
|
| — |
|
|
| (0.8 | ) |
|
| — |
|
Benefit obligation at the end of year |
| $ | 1,025.4 |
|
| $ | 187.4 |
|
| $ | 23.6 |
|
| $ | 82.4 |
|
| $ | 0.4 |
|
| $ | 1,319.2 |
|
| $ | 117.8 |
|
71
|
| Pension |
|
|
|
|
|
|
| |||||||||||||||||||
|
| United States of America |
|
| United Kingdom |
|
| Mexico |
|
|
|
|
|
|
| |||||||||||||
Change in benefit obligation: |
| Bargaining |
|
| Salaried |
|
| Supplemental |
|
| Pension |
|
| Pension |
|
| Total |
|
| Postretirement |
| |||||||
Benefit obligation at the beginning of year |
| $ | 474.9 |
|
| $ | 128.1 |
|
| $ | 15.5 |
|
| $ | 47.7 |
|
| $ | 0.4 |
|
| $ | 666.6 |
|
| $ | 87.4 |
|
Service cost |
|
| 9.5 |
|
|
| 0.9 |
|
|
| — |
|
|
| — |
|
|
| — |
|
|
| 10.4 |
|
|
| 0.7 |
|
Interest cost |
|
| 25.9 |
|
|
| 6.7 |
|
|
| 0.9 |
|
|
| 2.3 |
|
|
| — |
|
|
| 35.8 |
|
|
| 4.7 |
|
Actuarial (gains) losses |
|
| 19.1 |
|
|
| 5.7 |
|
|
| 0.7 |
|
|
| 7.3 |
|
|
| — |
|
|
| 32.8 |
|
|
| 3.8 |
|
Benefits paid |
|
| (38.5 | ) |
|
| (11.4 | ) |
|
| (0.6 | ) |
|
| (3.3 | ) |
|
| — |
|
|
| (53.8 | ) |
|
| (11.7 | ) |
Settlements |
|
| — |
|
|
| (6.0 | ) |
|
| — |
|
|
| — |
|
|
| — |
|
|
| (6.0 | ) |
|
| — |
|
Foreign currency translation adjustment |
|
| — |
|
|
| — |
|
|
| — |
|
|
| 2.7 |
|
|
| 0.1 |
|
|
| 2.8 |
|
|
| — |
|
Benefit obligation at the end of year |
| $ | 490.9 |
|
| $ | 124.0 |
|
| $ | 16.5 |
|
| $ | 56.7 |
|
| $ | 0.5 |
|
| $ | 688.6 |
|
| $ | 84.9 |
|
Significant actuarial losses related to changes in benefit obligations for 2023 primarily resulted from a decrease in discount rates.
The following table sets forth the change in benefit obligation for the definedpension and postretirement benefit pension plans as of December 31, 2020:2022:
|
| Pension |
|
|
|
|
|
|
| Pension |
|
|
|
|
|
| ||||||||||||||||||||||||||||||||||||||||
|
| United States of America |
|
| United Kingdom |
|
| Mexico |
|
|
|
|
|
|
|
| United States of America |
|
| United Kingdom |
|
| Mexico |
|
|
|
|
|
|
| ||||||||||||||||||||||||||
Change in benefit obligation: |
| Bargaining |
|
| Salaried |
|
| Supplemental |
|
| Pension |
|
| Pension |
|
| Total |
|
| Postretirement |
|
| Bargaining |
|
| Salaried |
|
| Supplemental |
|
| Pension |
|
| Pension |
|
| Total |
| Postretirement |
| |||||||||||||||
Benefit obligation at the beginning of year |
| $ | 973.3 |
| $ | 234.1 |
| $ | 25.2 |
| $ | 78.4 |
| $ | 0.4 |
| $ | 1,311.4 |
| $ | 126.2 |
|
| $ | 1,025.4 |
|
| $ | 187.4 |
|
| $ | 23.6 |
|
| $ | 82.4 |
|
| $ | 0.4 |
|
| $ | 1,319.2 |
|
| $ | 117.8 |
| ||||||
Service cost |
| 16.9 |
| 2.5 |
| — |
| — |
| — |
| 19.4 |
| 1.0 |
|
|
| 13.9 |
|
|
| 0.3 |
|
|
| — |
|
|
| — |
|
|
| — |
|
|
| 14.2 |
|
|
| 1.1 |
| |||||||||||||
Interest cost |
| 33.3 |
| 7.0 |
| 0.9 |
| 1.5 |
| — |
| 42.7 |
| 4.2 |
|
|
| 31.1 |
|
|
| 6.5 |
|
|
| 0.7 |
|
|
| 1.3 |
|
|
| — |
|
|
| 39.6 |
|
|
| 3.4 |
| |||||||||||||
Actuarial (gains) losses |
| 86.3 |
| 21.6 |
| 1.8 |
| 5.0 |
| 0.1 |
| 114.8 |
| 6.1 |
|
|
| (203.6 | ) |
|
| (34.0 | ) |
|
| (6.5 | ) |
|
| (25.3 | ) |
|
| — |
|
|
| (269.4 | ) |
|
| (24.0 | ) | |||||||||||||
Benefits paid |
| (55.9 | ) |
| (11.9 | ) |
| (0.6 | ) |
| (2.8 | ) |
| — |
| (71.2 | ) |
| (9.2 | ) |
|
| (51.0 | ) |
|
| (11.6 | ) |
|
| (0.6 | ) |
|
| (2.5 | ) |
|
| — |
|
|
| (65.7 | ) |
|
| (10.9 | ) | ||||||||
Plan amendment |
| — |
| — |
| — |
| — |
| — |
| — |
| — |
| |||||||||||||||||||||||||||||||||||||||||
Settlements |
| — |
| (24.6 | ) |
| — |
| — |
| (0.1 | ) |
| (24.7 | ) |
| — |
|
|
| (340.9 | ) |
|
| (20.5 | ) |
|
| (1.7 | ) |
|
| — |
|
|
| — |
|
|
| (363.1 | ) |
|
| — |
| ||||||||||
Foreign currency translation adjustment |
| — |
| — |
| — |
| 2.7 |
| — |
| 2.7 |
| — |
|
|
| — |
|
|
| — |
|
|
| — |
|
|
| (8.2 | ) |
|
| — |
|
|
| (8.2 | ) |
|
| — |
| |||||||||||||
Benefit obligation at the end of year |
| $ | 1,053.9 |
| $ | 228.7 |
| $ | 27.3 |
| $ | 84.8 |
| $ | 0.4 |
| $ | 1,395.1 |
| $ | 128.3 |
|
| $ | 474.9 |
|
| $ | 128.1 |
|
| $ | 15.5 |
|
| $ | 47.7 |
|
| $ | 0.4 |
|
| $ | 666.6 |
|
| $ | 87.4 |
| ||||||
Significant actuarial gains related to changes in benefit obligations for 20212022 primarily resulted from an increase in discount rates. Significant actuarial losses related to changes in benefit obligations for 2020 primarily resulted fromsettlements were a decrease in discount rates.result of the Bargaining Plan annuity purchase as well as lump sum payments during 2022.
72
60
The following table sets forth the change in plan assets and funded status for the definedpension and postretirement benefit pension plansplan as of December 31, 2021:2023:
|
| Pension |
|
|
|
|
|
|
| Pension |
|
|
|
|
|
| ||||||||||||||||||||||||||||||||||||||||
|
| United States of America |
|
| United Kingdom |
|
| Mexico |
|
|
|
|
|
|
|
| United States of America |
|
| United Kingdom |
|
| Mexico |
|
|
|
|
|
|
| ||||||||||||||||||||||||||
Change in plan assets: |
| Bargaining |
|
| Salaried |
|
| Supplemental |
|
| Pension |
|
| Pension |
|
| Total |
|
| Postretirement |
|
| Bargaining |
|
| Salaried |
|
| Supplemental |
|
| Pension |
|
| Pension |
|
| Total |
| Postretirement |
| |||||||||||||||
Fair value of plan assets at the beginning of year |
| $ | 884.3 |
| $ | 243.3 |
| $ | — |
| $ | 103.8 |
| $ | 0.3 |
| $ | 1,231.7 |
| $ | 82.2 |
|
| $ | 353.9 |
|
| $ | 137.7 |
|
| $ | — |
|
| $ | 57.5 |
|
| $ | 0.3 |
|
| $ | 549.4 |
|
| $ | 59.2 |
| ||||||
Actual return on plan assets |
| 35.0 |
| 4.9 |
| — |
| 4.7 |
| — |
| 44.6 |
| 2.4 |
|
|
| 19.3 |
|
|
| 9.3 |
|
|
| — |
|
|
| 2.5 |
|
|
| — |
|
|
| 31.1 |
|
|
| 5.3 |
| |||||||||||||
Company contributions / payments |
| — |
| — |
| 3.0 |
| 2.8 |
| — |
| 5.8 |
| 1.1 |
|
|
| — |
|
|
| — |
|
|
| 0.6 |
|
|
| 1.2 |
|
|
| — |
|
|
| 1.8 |
|
|
| 1.0 |
| |||||||||||||
Benefits paid |
| (56.5 | ) |
| (11.4 | ) |
| (3.0 | ) |
| (3.0 | ) |
| — |
| (73.9 | ) |
| (8.9 | ) |
|
| (38.5 | ) |
|
| (11.4 | ) |
|
| (0.6 | ) |
|
| (3.3 | ) |
|
| — |
|
|
| (53.8 | ) |
|
| (11.7 | ) | ||||||||
Settlements |
| — |
| (31.1 | ) |
| — |
| — |
| — |
| (31.1 | ) |
| — |
|
|
| — |
|
|
| (6.0 | ) |
|
| — |
|
|
| — |
|
|
| — |
|
|
| (6.0 | ) |
|
| — |
| |||||||||||
Foreign currency translation adjustment |
| — |
| — |
| — |
| (1.1 | ) |
| — |
| (1.1 | ) |
| — |
|
|
| — |
|
|
| — |
|
|
| — |
|
|
| 3.1 |
|
|
| — |
|
|
| 3.1 |
|
|
| — |
| |||||||||||
Fair value of plan assets at end of year |
| $ | 862.8 |
| $ | 205.7 |
| $ | — |
| $ | 107.2 |
|
| $ | 0.3 |
|
| $ | 1,176.0 |
|
| $ | 76.8 |
|
| $ | 334.7 |
|
| $ | 129.6 |
|
| $ | — |
|
| $ | 61.0 |
|
| $ | 0.3 |
|
| $ | 525.6 |
|
| $ | 53.8 |
| |||
Funded status at end of year |
| $ | (162.6 | ) |
| $ | 18.3 |
| $ | (23.6 | ) |
| $ | 24.8 |
|
| $ | (0.1 | ) |
| $ | (143.2 | ) |
| $ | (41.0 | ) |
| $ | (156.2 | ) |
| $ | 5.6 |
|
| $ | (16.5 | ) |
| $ | 4.3 |
|
| $ | (0.2 | ) |
| $ | (163.0 | ) |
| $ | (31.1 | ) | |
The following table sets forth the change in plan assets and funded status for the definedpension and postretirement benefit pension plansplan as of December 31, 2020:2022:
|
| Pension |
|
|
|
|
|
|
| Pension |
|
|
|
|
|
| ||||||||||||||||||||||||||||||||||||||||
|
| United States of America |
|
| United Kingdom |
|
| Mexico |
|
|
|
|
|
|
|
| United States of America |
|
| United Kingdom |
|
| Mexico |
|
|
|
|
|
|
| ||||||||||||||||||||||||||
Change in plan assets: |
| Bargaining |
|
| Salaried |
|
| Supplemental |
|
| Pension |
|
| Pension |
|
| Total |
|
| Postretirement |
|
| Bargaining |
|
| Salaried |
|
| Supplemental |
|
| Pension |
|
| Pension |
|
| Total |
| Postretirement |
| |||||||||||||||
Fair value of plan assets at the beginning of year |
| $ | 817.3 |
| $ | 243.6 |
| $ | — |
| $ | 94.1 |
| $ | 0.4 |
| $ | 1,155.4 |
| $ | 82.3 |
|
| $ | 862.8 |
|
| $ | 205.7 |
|
| $ | — |
|
| $ | 107.2 |
|
| $ | 0.3 |
|
| $ | 1,176.0 |
|
| $ | 76.8 |
| ||||||
Actual return on plan assets |
| 122.9 |
| 36.2 |
| — |
| 7.9 |
| — |
| 167.0 |
| 7.0 |
|
|
| (119.7 | ) |
|
| (35.9 | ) |
|
| — |
|
|
| (38.0 | ) |
|
| — |
|
|
| (193.6 | ) |
|
| (8.8 | ) | |||||||||||||
Company contributions / payments |
| — |
| — |
| 0.6 |
| 1.3 |
| — |
| 1.9 |
| — |
|
|
| — |
|
|
| — |
|
|
| 2.3 |
|
|
| 1.3 |
|
|
| — |
|
|
| 3.6 |
|
|
| 2.1 |
| |||||||||||||
Benefits paid |
| (55.9 | ) |
| (11.9 | ) |
| (0.6 | ) |
| (2.8 | ) |
| — |
| (71.2 | ) |
| (7.1 | ) |
|
| (51.0 | ) |
|
| (11.6 | ) |
|
| (0.6 | ) |
|
| (2.5 | ) |
|
| — |
|
|
| (65.7 | ) |
|
| (10.9 | ) | ||||||||
Settlements |
| — |
| (24.6 | ) |
| — |
| — |
| (0.1 | ) |
| (24.7 | ) |
| — |
|
|
| (338.2 | ) |
|
| (20.5 | ) |
|
| (1.7 | ) |
|
| — |
|
|
| — |
|
|
| (360.4 | ) |
|
| — |
| ||||||||||
Foreign currency translation adjustment |
| — |
| — |
| — |
| 3.3 |
| — |
| 3.3 |
| — |
|
|
| — |
|
|
| — |
|
|
| — |
|
|
| (10.5 | ) |
|
| — |
|
|
| (10.5 | ) |
|
| — |
| |||||||||||||
Fair value of plan assets at end of year |
| $ | 884.3 |
| $ | 243.3 |
| $ | — |
| $ | 103.8 |
|
| $ | 0.3 |
|
| $ | 1,231.7 |
|
| $ | 82.2 |
|
| $ | 353.9 |
|
| $ | 137.7 |
|
| $ | — |
|
| $ | 57.5 |
|
| $ | 0.3 |
|
| $ | 549.4 |
|
| $ | 59.2 |
| |||
Funded status at end of year |
| $ | (169.5 | ) |
| $ | 14.5 |
| $ | (27.3 | ) |
| $ | 19.0 |
|
| $ | (0.1 | ) |
| $ | (163.4 | ) |
| $ | (46.1 | ) |
| $ | (121.0 | ) |
| $ | 9.6 |
|
| $ | (15.5 | ) |
| $ | 9.8 |
|
| $ | (0.1 | ) |
| $ | (117.2 | ) |
| $ | (28.2 | ) | |
6173
The Bargaining Plan, Salaried Plan, hasand Supplemental Plan have a provision that permits employees to elect to receive their pension benefits in a lump sum. Insum upon retirement. The Company's accounting policy is to recognize settlements during the first quarter of 2021,in which it is projected that the cumulative costcosts of all lump sum payments was projected to exceedsettlements during the year will be greater than the sum of the service cost and interest cost componentscomponents.
In the first quarter of net periodic pension cost2023, in anticipation of receiving the regulatory approval to move forward with the plan termination process, the cumulative costs of all lump sum payments and other settlements were projected to exceed this threshold during 2023 for the Salaried Plan. Ultimately, these costs did not exceed this threshold for the Salaried Plan during 2023. The Salaried Plan's pension obligations and plan assets were remeasured during each quarter of 2023.
In the first quarter of 2022, the cumulative cost of all lump sum payments exceeded this threshold for the Supplemental Plan. Additionally, in the first quarter of 2022, the cumulative costs of all lump sum payments were projected to exceed this threshold during 2022 for the Salaried Plan. These costs did ultimately exceed this threshold for the Salaried Plan during the second quarter of 2022. Also, during the second quarter of 2022, the cumulative costs of all lump sum payments were projected to exceed this threshold in 2022 for the Bargaining Plan. These costs did ultimately exceed this threshold for the Bargaining Plan during the third quarter of 2022.
These payments constitute a partial settlement, which is a significant event requiring remeasurement of both plan assets and benefit obligations. As a result, the Company completed a full remeasurement of its pension obligations and plan assets associated with the SalariedSupplemental Plan during eachthe first quarter of 2021. A full2022. No further remeasurement ofwas required in 2022 related to the Supplemental Plan, as no further lump sum payments were made. The Salaried Plan's pension obligations and plan assets associated with the Salaried Plan was also required throughoutwere remeasured during each quarter of 2020. For2022. We also completed a full remeasurement of the years ended December 31, 2021Bargaining Plan's pension obligations and December 31, 2020, total settlements were $plan assets during the second, third, and fourth quarters of 2022.31.1 million and $24.7 million, respectively. These settlements are included in the tables above and in the net remeasurement losses (gains) as a component of net periodic benefit cost.
For the years ended December 31, 20212023 and 2020,2022, all pension plans had administrative expenses of $3.02.9 million and $3.85.1 million, respectively. These expenses are included in benefits paid in the tables above.
The accumulated benefit obligation at December 31, 2021 2023 exceeded the fair value of plan assets for the Bargaining Plan and the unfunded Supplemental Plan. For the Bargaining Plan and Supplemental Plan, the accumulated benefit obligation was $1,009.6486.1 million and $23.616.6 million, respectively, as of December 31, 2021.2023.
The total pension accumulated benefit obligation for all plans was $1,303.2683.7 million and $1,377.6660.6 million as of December 31, 20212023 and 2020,2022, respectively.
Amounts recognized on the balance sheet at December 31, 20212023 for TimkenSteel’sthe Company's pension and postretirement benefit plans include:
|
| Pension |
|
|
|
|
|
|
| Pension |
|
|
|
|
|
| ||||||||||||||||||||||||||||||||||||||||
|
| United States of America |
|
| United Kingdom |
|
| Mexico |
|
|
|
|
|
|
|
| United States of America |
|
| United Kingdom |
|
| Mexico |
|
|
|
|
|
|
| ||||||||||||||||||||||||||
|
| Bargaining |
|
| Salaried |
|
| Supplemental |
|
| Pension |
|
| Pension |
|
| Total |
|
| Postretirement |
|
| Bargaining |
|
| Salaried |
|
| Supplemental |
|
| Pension |
|
| Pension |
|
| Total |
| Postretirement |
| |||||||||||||||
Non-current assets |
| $ | — |
| $ | 18.3 |
| $ | — |
| $ | 24.8 |
|
| $ | — |
|
| $ | 43.1 |
|
| $ | — |
|
| $ | — |
|
| $ | 5.6 |
|
| $ | — |
|
| $ | 4.3 |
|
| $ | — |
|
| $ | 9.9 |
|
| $ | — |
| |||
Current liabilities |
| — |
| — |
| (2.6 | ) |
| — |
| — |
| (2.6 | ) |
| (1.7 | ) |
|
| (41.7 | ) |
|
| — |
|
|
| (0.6 | ) |
|
| — |
|
|
| — |
|
|
| (42.3 | ) |
|
| (1.2 | ) | |||||||||||
Non-current liabilities |
| (162.6 | ) |
| — |
| (21.0 | ) |
| — |
| (0.1 | ) |
| (183.7 | ) |
| (39.3 | ) |
|
| (114.5 | ) |
|
| — |
|
|
| (15.9 | ) |
|
| — |
|
|
| (0.2 | ) |
|
| (130.6 | ) |
|
| (29.9 | ) | |||||||||
Total |
| $ | (162.6 | ) |
| $ | 18.3 |
| $ | (23.6 | ) |
| $ | 24.8 |
|
| $ | (0.1 | ) |
| $ | (143.2 | ) |
| $ | (41.0 | ) |
| $ | (156.2 | ) |
| $ | 5.6 |
|
| $ | (16.5 | ) |
| $ | 4.3 |
|
| $ | (0.2 | ) |
| $ | (163.0 | ) |
| $ | (31.1 | ) | |
74
Amounts recognized on the balance sheet at December 31, 20202022 for TimkenSteel’sthe Company's pension and postretirement benefit plans include:
|
| Pension |
|
|
|
|
|
|
| Pension |
|
|
|
|
|
| ||||||||||||||||||||||||||||||||||||||||
|
| United States of America |
|
| United Kingdom |
|
| Mexico |
|
|
|
|
|
|
|
| United States of America |
|
| United Kingdom |
|
| Mexico |
|
|
|
|
|
|
| ||||||||||||||||||||||||||
|
| Bargaining |
|
| Salaried |
|
| Supplemental |
|
| Pension |
|
| Pension |
|
| Total |
|
| Postretirement |
|
| Bargaining |
|
| Salaried |
|
| Supplemental |
|
| Pension |
|
| Pension |
|
| Total |
| Postretirement |
| |||||||||||||||
Non-current assets |
| $ | — |
| $ | 14.5 |
| $ | — |
| $ | 19.0 |
|
| $ | — |
|
| $ | 33.5 |
|
| $ | — |
|
| $ | — |
|
| $ | 9.6 |
|
| $ | — |
|
| $ | 9.8 |
|
| $ | — |
|
| $ | 19.4 |
|
| $ | — |
| |||
Current liabilities |
| — |
| — |
| (0.6 | ) |
| — |
| — |
| (0.6 | ) |
| (1.7 | ) |
|
| — |
|
|
| — |
|
|
| (0.6 | ) |
|
| — |
|
|
| — |
|
|
| (0.6 | ) |
|
| (1.4 | ) | |||||||||||
Non-current liabilities |
| (169.5 | ) |
| — |
| (26.7 | ) |
| — |
| (0.1 | ) |
| (196.3 | ) |
| (44.4 | ) |
|
| (121.0 | ) |
|
| — |
|
|
| (15.0 | ) |
|
| — |
|
|
| (0.1 | ) |
|
| (136.1 | ) |
|
| (26.8 | ) | |||||||||
Total |
| $ | (169.5 | ) |
| $ | 14.5 |
| $ | (27.3 | ) |
| $ | 19.0 |
|
| $ | (0.1 | ) |
| $ | (163.4 | ) |
| $ | (46.1 | ) |
| $ | (121.0 | ) |
| $ | 9.6 |
|
| $ | (15.6 | ) |
| $ | 9.8 |
|
| $ | (0.1 | ) |
| $ | (117.3 | ) |
| $ | (28.2 | ) | |
Included in accumulated other comprehensive income (loss) at December 31, 20212023 were the following before-tax amounts that had not been recognized in net periodic benefit cost:
|
| Pension |
|
|
|
|
|
|
| |||||||||||||||||||
|
| United States of America |
|
| United Kingdom |
|
| Mexico |
|
|
|
|
|
|
| |||||||||||||
|
| Bargaining |
|
| Salaried |
|
| Supplemental |
|
| Pension |
|
| Pension |
|
| Total |
|
| Postretirement |
| |||||||
Unrecognized prior service (benefit) cost |
| $ | 13.6 |
|
| $ | — |
|
| $ | — |
|
| $ | 0.6 |
|
| $ | — |
|
| $ | 14.2 |
|
| $ | (55.9 | ) |
62
|
| Pension |
|
|
|
|
|
|
| |||||||||||||||||||
|
| United States of America |
|
| United Kingdom |
|
| Mexico |
|
|
|
|
|
|
| |||||||||||||
|
| Bargaining |
|
| Salaried |
|
| Supplemental |
|
| Pension |
|
| Pension |
|
| Total |
|
| Postretirement |
| |||||||
Unrecognized prior service (benefit) cost |
| $ | 11.1 |
|
| $ | — |
|
| $ | — |
|
| $ | 0.5 |
|
| $ | — |
|
| $ | 11.6 |
|
| $ | (44.0 | ) |
Included in accumulated other comprehensive income (loss) at December 31, 20202022 were the following before-tax amounts that had not been recognized in net periodic benefit cost:
|
| Pension |
|
|
|
|
|
|
| |||||||||||||||||||
|
| United States of America |
|
| United Kingdom |
|
| Mexico |
|
|
|
|
|
|
| |||||||||||||
|
| Bargaining |
|
| Salaried |
|
| Supplemental |
|
| Pension |
|
| Pension |
|
| Total |
|
| Postretirement |
| |||||||
Unrecognized prior service (benefit) cost |
| $ | (0.4 | ) |
| $ | — |
|
| $ | — |
|
| $ | 0.6 |
|
| $ | — |
|
| $ | 0.2 |
|
| $ | (61.9 | ) |
|
| Pension |
|
|
|
|
|
|
| |||||||||||||||||||
|
| United States of America |
|
| United Kingdom |
|
| Mexico |
|
|
|
|
|
|
| |||||||||||||
|
| Bargaining |
|
| Salaried |
|
| Supplemental |
|
| Pension |
|
| Pension |
|
| Total |
|
| Postretirement |
| |||||||
Unrecognized prior service (benefit) cost |
| $ | 12.4 |
|
| $ | — |
|
| $ | — |
|
| $ | 0.5 |
|
| $ | — |
|
| $ | 12.9 |
|
| $ | (49.9 | ) |
The weighted average assumptions used in determining benefit obligation as of December 31, 20212023 and 20202022 were as follows:
|
| Pension |
|
| Postretirement |
|
| Pension |
|
| Postretirement |
| ||||||||||||||||||||
Assumptions: |
| 2021 |
|
| 2020 |
|
| 2021 |
|
| 2020 |
|
| 2023 |
|
| 2022 |
|
| 2023 |
|
| 2022 |
| ||||||||
Discount rate |
| 2.96 | % |
| 2.68 | % |
| 3.00 | % |
| 2.65 | % |
|
| 5.33 | % |
|
| 5.61 | % |
|
| 5.43 | % |
|
| 5.70 | % | ||||
Future compensation assumption |
| 3.00 | % |
| 2.29 | % |
| n/a |
|
| n/a |
|
|
| 3.00 | % |
|
| 3.00 | % |
| n/a |
|
| n/a |
| ||||||
The weighted average assumptions used in determining benefit cost for the years ended December 31, 20212023 and 20202022 were as follows:
|
| Pension |
|
| Postretirement |
|
| Pension |
|
| Postretirement |
| ||||||||||||||||||||
Assumptions: |
| 2021 |
|
| 2020 |
|
| 2021 |
|
| 2020 |
|
| 2023 |
|
| 2022 |
|
| 2023 |
|
| 2022 |
| ||||||||
Discount rate |
| 2.68 | % |
| 3.42 | % |
| 2.65 | % |
| 3.42 | % |
|
| 5.61 | % |
|
| 2.96 | % |
|
| 5.70 | % |
|
| 3.00 | % | ||||
Future compensation assumption |
| 2.29 | % |
| 2.32 | % |
| n/a |
|
| n/a |
|
|
| 3.00 | % |
|
| 3.00 | % |
| n/a |
| n/a |
| |||||||
Expected long-term return on plan assets |
| 5.76 | % |
| 5.80 | % |
| 4.50 | % |
| 4.50 | % |
|
| 7.13 | % |
|
| 5.96 | % |
|
| 6.25 | % |
|
| 4.75 | % | ||||
75
The discount rate assumption is based on current rates of high-quality long-term corporate bonds over the same period that benefit payments will be required to be made. The expected rate of return on plan assets assumption is based on the weighted-average expected return on the various asset classes in the plans’ portfolios. The asset class return is developed using historical asset return performance as well as current market conditions such as inflation, interest rates and equity market performance.
For measurement purposes, TimkenSteel assumed athe weighted-average annual rate of increase in the per capita cost ("health care cost trend rate") of 10.00%was not applicable for the years 2023 and 5.50% for 2021 and 2020, respectively.2022.
The components of net periodic benefit cost (income) for the year ended December 31, 2023 were as follows:
|
| Pension |
|
|
|
|
|
|
| |||||||||||||||||||
|
| United States of America |
|
| United Kingdom |
|
| Mexico |
|
|
|
|
|
|
| |||||||||||||
Components of net periodic benefit cost (income): |
| Bargaining |
|
| Salaried |
|
| Supplemental |
|
| Pension |
|
| Pension |
|
| Total |
|
| Postretirement |
| |||||||
Service cost |
| $ | 9.5 |
|
| $ | 0.9 |
|
| $ | — |
|
| $ | — |
|
| $ | — |
|
| $ | 10.4 |
|
| $ | 0.7 |
|
Interest cost |
|
| 25.9 |
|
|
| 6.7 |
|
|
| 0.9 |
|
|
| 2.3 |
|
|
| — |
|
|
| 35.8 |
|
|
| 4.7 |
|
Expected return on plan assets |
|
| (26.9 | ) |
|
| (7.5 | ) |
|
| — |
|
|
| (2.7 | ) |
|
| — |
|
|
| (37.1 | ) |
|
| (3.4 | ) |
Amortization of prior service cost |
|
| 1.3 |
|
|
| — |
|
|
| — |
|
|
| — |
|
|
| — |
|
|
| 1.3 |
|
|
| (6.0 | ) |
Settlements |
|
| — |
|
|
| — |
|
|
| — |
|
|
| — |
|
|
| — |
|
|
| — |
|
|
| — |
|
Net remeasurement losses (gains) |
|
| 26.6 |
|
|
| 4.0 |
|
|
| 0.6 |
|
|
| 7.5 |
|
|
| — |
|
|
| 38.7 |
|
|
| 1.9 |
|
Net Periodic Benefit Cost (Income) |
| $ | 36.4 |
|
| $ | 4.1 |
|
| $ | 1.5 |
|
| $ | 7.1 |
|
| $ | — |
|
| $ | 49.1 |
|
| $ | (2.1 | ) |
The components of net periodic benefit cost (income) for the year ended December 31, 2022 were as follows:
|
| Pension |
|
|
|
|
|
|
| |||||||||||||||||||
|
| United States of America |
|
| United Kingdom |
|
| Mexico |
|
|
|
|
|
|
| |||||||||||||
Components of net periodic benefit cost (income): |
| Bargaining |
|
| Salaried |
|
| Supplemental |
|
| Pension |
|
| Pension |
|
| Total |
|
| Postretirement |
| |||||||
Service cost |
| $ | 13.9 |
|
| $ | 0.3 |
|
| $ | — |
|
| $ | — |
|
| $ | — |
|
| $ | 14.2 |
|
| $ | 1.1 |
|
Interest cost |
|
| 31.1 |
|
|
| 6.5 |
|
|
| 0.7 |
|
|
| 1.3 |
|
|
| — |
|
|
| 39.6 |
|
|
| 3.4 |
|
Expected return on plan assets |
|
| (46.7 | ) |
|
| (5.0 | ) |
|
| — |
|
|
| (3.2 | ) |
|
| — |
|
|
| (54.9 | ) |
|
| (3.4 | ) |
Amortization of prior service cost |
|
| 1.3 |
|
|
| — |
|
|
| — |
|
|
| — |
|
|
| — |
|
|
| 1.3 |
|
|
| (6.0 | ) |
Settlements |
|
| (2.7 | ) |
|
| — |
|
|
| — |
|
|
| — |
|
|
| — |
|
|
| (2.7 | ) |
|
| — |
|
Net remeasurement losses (gains) |
|
| (37.2 | ) |
|
| 6.9 |
|
|
| (6.5 | ) |
|
| 15.9 |
|
|
| — |
|
|
| (20.9 | ) |
|
| (11.8 | ) |
Net Periodic Benefit Cost (Income) |
| $ | (40.3 | ) |
| $ | 8.7 |
|
| $ | (5.8 | ) |
| $ | 14.0 |
|
| $ | — |
|
| $ | (23.4 | ) |
| $ | (16.7 | ) |
76
The components of net periodic benefit cost (income) for the year ended December 31, 2021 were as follows:
|
| Pension |
|
|
|
|
|
|
| |||||||||||||||||||
|
| United States of America |
|
| United Kingdom |
|
| Mexico |
|
|
|
|
|
|
| |||||||||||||
Components of net periodic benefit cost (income): |
| Bargaining |
|
| Salaried |
|
| Supplemental |
|
| Pension |
|
| Pension |
|
| Total |
|
| Postretirement |
| |||||||
Service cost |
| $ | 17.0 |
|
| $ | 0.4 |
|
| $ | — |
|
| $ | — |
|
| $ | — |
|
| $ | 17.4 |
|
| $ | 1.2 |
|
Interest cost |
|
| 28.4 |
|
|
| 5.9 |
|
|
| 0.8 |
|
|
| 1.1 |
|
|
| — |
|
|
| 36.2 |
|
|
| 3.2 |
|
Expected return on plan assets |
|
| (51.5 | ) |
|
| (12.6 | ) |
|
| — |
|
|
| (3.3 | ) |
|
| — |
|
|
| (67.4 | ) |
|
| (3.4 | ) |
Amortization of prior service cost |
|
| 0.2 |
|
|
| — |
|
|
| — |
|
|
| — |
|
|
| — |
|
|
| 0.2 |
|
|
| (6.0 | ) |
Curtailment |
|
| — |
|
|
| — |
|
|
| — |
|
|
| — |
|
|
| — |
|
|
| — |
|
|
| — |
|
Net remeasurement losses (gains) |
|
| (15.1 | ) |
|
| 2.5 |
|
|
| (1.5 | ) |
|
| (1.1 | ) |
|
| — |
|
|
| (15.2 | ) |
|
| (4.9 | ) |
Net Periodic Benefit Cost (Income) |
| $ | (21.0 | ) |
| $ | (3.8 | ) |
| $ | (0.7 | ) |
| $ | (3.3 | ) |
| $ | — |
|
| $ | (28.8 | ) |
| $ | (9.9 | ) |
63
The components of net periodic benefit cost (income) for the year ended December 31, 2020 were as follows:
|
| Pension |
|
|
|
|
|
|
| |||||||||||||||||||
|
| United States of America |
|
| United Kingdom |
|
| Mexico |
|
|
|
|
|
|
| |||||||||||||
Components of net periodic benefit cost (income): |
| Bargaining |
|
| Salaried |
|
| Supplemental |
|
| Pension |
|
| Pension |
|
| Total |
|
| Postretirement |
| |||||||
Service cost |
| $ | 16.9 |
|
| $ | 2.5 |
|
| $ | — |
|
| $ | — |
|
| $ | — |
|
| $ | 19.4 |
|
| $ | 1.0 |
|
Interest cost |
|
| 33.3 |
|
|
| 7.0 |
|
|
| 0.9 |
|
|
| 1.5 |
|
|
| — |
|
|
| 42.7 |
|
|
| 4.2 |
|
Expected return on plan assets |
|
| (47.5 | ) |
|
| (13.5 | ) |
|
| — |
|
|
| (3.3 | ) |
|
| — |
|
|
| (64.3 | ) |
|
| (3.5 | ) |
Amortization of prior service cost |
|
| 0.3 |
|
|
| — |
|
|
| — |
|
|
| — |
|
|
| — |
|
|
| 0.3 |
|
|
| (6.0 | ) |
Curtailment |
|
| — |
|
|
| — |
|
|
| — |
|
|
| — |
|
|
| — |
|
|
| — |
|
|
| — |
|
Net remeasurement losses (gains) |
|
| 10.8 |
|
|
| (1.0 | ) |
|
| 1.8 |
|
|
| 0.4 |
|
|
| 0.1 |
|
|
| 12.1 |
|
|
| 2.6 |
|
Net Periodic Benefit Cost (Income) |
| $ | 13.8 |
|
| $ | (5.0 | ) |
| $ | 2.7 |
|
| $ | (1.4 | ) |
| $ | 0.1 |
|
| $ | 10.2 |
|
| $ | (1.7 | ) |
The components of net periodic benefit cost (income) for the year ended December 31, 2019 were as follows:
|
| Pension |
|
|
|
|
|
|
| |||||||||||||||||||
|
| United States of America |
|
| United Kingdom |
|
| Mexico |
|
|
|
|
|
|
| |||||||||||||
Components of net periodic benefit cost (income): |
| Bargaining |
|
| Salaried |
|
| Supplemental |
|
| Pension |
|
| Pension |
|
| Total |
|
| Postretirement |
| |||||||
Service cost |
| $ | 14.9 |
|
| $ | 2.4 |
|
| $ | — |
|
| $ | 0.1 |
|
| $ | — |
|
| $ | 17.4 |
|
| $ | 1.1 |
|
Interest cost |
|
| 36.8 |
|
|
| 9.4 |
|
|
| 0.8 |
|
|
| 1.9 |
|
|
| — |
|
|
| 48.9 |
|
|
| 5.9 |
|
Expected return on plan assets |
|
| (47.0 | ) |
|
| (13.6 | ) |
|
| — |
|
|
| (4.4 | ) |
|
| — |
|
|
| (65.0 | ) |
|
| (3.9 | ) |
Amortization of prior service cost |
|
| 0.4 |
|
|
| — |
|
|
| — |
|
|
| — |
|
|
| — |
|
|
| 0.4 |
|
|
| (3.8 | ) |
Curtailment |
|
| — |
|
|
| (8.1 | ) |
|
| (0.8 | ) |
|
| — |
|
|
| — |
|
|
| (8.9 | ) |
|
| — |
|
Net remeasurement losses (gains) |
|
| 41.7 |
|
|
| (2.0 | ) |
|
| 4.2 |
|
|
| (0.9 | ) |
|
| 0.1 |
|
|
| 43.1 |
|
|
| 6.4 |
|
Net Periodic Benefit Cost (Income) |
| $ | 46.8 |
|
| $ | (11.9 | ) |
| $ | 4.2 |
|
| $ | (3.3 | ) |
| $ | 0.1 |
|
| $ | 35.9 |
|
| $ | 5.7 |
|
TimkenSteelMetallus recognizes its overall responsibility to ensure that the assets of its various defined benefit pension plans are managed effectively and prudently and in compliance with its policy guidelines and all applicable laws. Preservation of capital is important; however, TimkenSteelMetallus also recognizes that appropriate levels of risk are necessary to allow its investment managers to achieve satisfactory long-term results consistent with the objectives and the fiduciary character of the pension funds. Asset allocations are established in a manner consistent with projected plan liabilities, benefit payments and expected rates of return for various asset classes. The expected rate of return for the investment portfolios is based on expected rates of return for various asset classes, as well as historical asset class and fund performance.
The target allocations for each plan's assets are as follows:
|
| Pension |
|
|
|
|
|
|
| |||||||||||||||||
|
| United States of America |
| United Kingdom |
|
| Mexico |
|
|
|
|
|
|
| ||||||||||||
Target Allocations: |
| Bargaining |
|
| Salaried |
|
| Supplemental |
| Pension |
|
| Pension |
|
| Weighted |
|
| Weighted |
| ||||||
Equity securities |
|
| 35.0 | % |
|
| — |
|
| n/a |
|
| 16.7 | % |
|
| — |
|
|
| 27.2 | % |
|
| 20.0 | % |
Debt securities |
|
| 49.0 | % |
|
| 80.0 | % |
| n/a |
|
| 33.3 | % |
|
| 100.0 | % |
|
| 53.0 | % |
|
| 77.5 | % |
Other investments |
|
| 16.0 | % |
|
| 20.0 | % |
| n/a |
|
| 50.0 | % |
|
| — |
|
|
| 19.8 | % |
|
| 2.5 | % |
64
|
| Pension |
|
|
|
|
|
|
| |||||||||||||||||
|
| United States of America |
| United Kingdom |
|
| Mexico |
|
|
|
|
|
|
| ||||||||||||
Target Allocations: |
| Bargaining |
|
| Salaried |
|
| Supplemental |
| Pension |
|
| Pension |
|
| Weighted |
|
| Postretirement |
| ||||||
Equity securities |
|
| 38.0 | % |
|
| — |
|
| n/a |
|
| 17.5 | % |
|
| — |
|
|
| 26.2 | % |
|
| 26.0 | % |
Debt securities |
|
| 34.0 | % |
|
| 100.0 | % |
| n/a |
|
| 65.0 | % |
|
| 100.0 | % |
|
| 53.9 | % |
|
| 67.0 | % |
Other investments |
|
| 28.0 | % |
|
| — |
|
| n/a |
|
| 17.5 | % |
|
| — |
|
|
| 19.9 | % |
|
| 7.0 | % |
As of December 31, 2021, we were in the process of transitioning to these target investment allocations, which have been updated to reflect the respective risk profiles of each plan at the end of the year.
Fair value is defined as the price that would be received to sell an asset or paid to transfer a liability in an orderly transaction between market participants at the measurement date ("exit price"). The inputs used to measure fair value are classified into the following hierarchy:
Level 1 - Unadjusted quoted prices in active markets for identical assets or liabilities.
Level 2 - Unadjusted quoted prices in active markets for similar assets or liabilities, or unadjusted quoted prices for identical or similar assets or liabilities in markets that are not active, or inputs other than quoted prices that are observable for the asset or liability.
Level 3 - Unobservable inputs for the asset or liability.
77
The following table presents the fair value hierarchy for those investments of TimkenSteel’sthe Company's pension assets measured at fair value on a recurring basis as of December 31, 2021:2023:
|
| Total |
|
| Level 1 |
|
| Level 2 |
|
| Level 3 |
| ||||
Assets: |
|
|
|
|
|
|
|
|
|
|
|
| ||||
Cash and cash equivalents |
| $ | 87.6 |
|
| $ | 1.2 |
|
| $ | 86.4 |
|
| $ | — |
|
U.S government and agency securities |
|
| 173.9 |
|
|
| 166.7 |
|
|
| 7.2 |
|
|
| — |
|
Corporate bonds |
|
| 244.7 |
|
|
| — |
|
|
| 244.7 |
|
|
| — |
|
Equity securities |
|
| 25.3 |
|
|
| 25.3 |
|
|
| — |
|
|
| — |
|
Other |
|
| 0.3 |
|
|
| — |
|
|
| 0.3 |
|
|
| — |
|
Total Assets in the fair value hierarchy |
| $ | 531.8 |
|
| $ | 193.2 |
|
| $ | 338.6 |
|
| $ | — |
|
Assets measured at net asset value (1) |
|
| 644.2 |
|
|
| — |
|
|
| — |
|
|
| — |
|
Total Assets |
| $ | 1,176.0 |
|
| $ | 193.2 |
|
| $ | 338.6 |
|
| $ | — |
|
(1) Certain assets that are measured at fair value using the net asset value per share (or its equivalent) practical expedient have not been classified in the fair value hierarchy. Such assets include common collective trusts that invest in equity securities and fixed income securities, limited partnerships, real estate partnerships, hedge funds, and risk parity investments. As of December 31, 2021, these assets are redeemable at net asset value within 90 days.
The following table presents the fair value hierarchy for those investments of TimkenSteel’s pension assets measured at fair value on a recurring basis as of December 31, 2020:
|
| Total |
|
| Level 1 |
|
| Level 2 |
|
| Level 3 |
|
| Total |
|
| Level 1 |
|
| Level 2 |
|
| Level 3 |
| ||||||||
Assets: |
|
|
|
|
|
|
|
|
|
|
|
|
|
|
|
|
|
|
|
|
|
|
|
| ||||||||
Cash and cash equivalents |
| $ | 9.2 |
| $ | 0.9 |
| $ | 8.3 |
| $ | — |
|
| $ | 5.8 |
|
| $ | — |
|
| $ | 5.8 |
|
| $ | — |
| |||
U.S government and agency securities |
| 345.7 |
| 337.4 |
| 8.3 |
| — |
|
|
| 59.8 |
|
|
| 50.7 |
|
|
| 9.1 |
|
|
| — |
| |||||||
Corporate bonds |
| 276.9 |
| — |
| 276.9 |
| — |
|
|
| 39.8 |
|
|
| — |
|
|
| 39.8 |
|
|
| — |
| |||||||
Equity securities |
| 68.5 |
| 68.5 |
| — |
| — |
| |||||||||||||||||||||||
Mutual fund - equities |
|
| 83.3 |
|
|
| 83.3 |
|
|
| — |
|
|
| — |
| ||||||||||||||||
Mutual fund - fixed income |
| 0.1 |
| 0.1 |
| — |
| — |
|
|
| 12.2 |
|
|
| 12.2 |
|
|
| — |
|
|
| — |
| |||||||
Mutual fund - equities |
| 22.0 |
| 22.0 |
| — |
| — |
| |||||||||||||||||||||||
Mutual fund - tactical tilt |
|
| 10.6 |
|
|
| 10.6 |
|
|
| — |
|
|
| — |
| ||||||||||||||||
Real estate |
|
| 14.1 |
|
|
| — |
|
|
| — |
|
|
| 14.1 |
| ||||||||||||||||
Private debt |
|
| 25.7 |
|
|
| — |
|
|
| — |
|
|
| 25.7 |
| ||||||||||||||||
Other |
| 0.2 |
| — |
| 0.2 |
| — |
|
|
| 0.6 |
|
|
| — |
|
|
| 0.6 |
|
|
| — |
| |||||||
Total Assets in the fair value hierarchy |
| $ | 722.6 |
| $ | 428.9 |
| $ | 293.7 |
| $ | — |
|
| $ | 251.9 |
|
| $ | 156.8 |
|
| $ | 55.3 |
|
| $ | 39.8 |
| |||
Assets measured at net asset value (1) |
| 509.1 |
| — |
| — |
| — |
|
|
| 273.7 |
|
|
| — |
|
|
| — |
|
|
| — |
| |||||||
Total Assets |
| $ | 1,231.7 |
| $ | 428.9 |
| $ | 293.7 |
| $ | — |
|
| $ | 525.6 |
|
| $ | 156.8 |
|
| $ | 55.3 |
|
| $ | 39.8 |
| |||
(1) Certain assets that are measured at fair value using the net asset value per share (or its equivalent) practical expedient have not been classified in the fair value hierarchy. Such assets include common collective trusts that invest in equity securities and fixed income securities, limited partnerships, real estate partnerships, and risk parity investments.hedge funds. As of December 31, 2020,2023, these assets wereare redeemable at net asset value within 90 days.
65
Tabledays, except for certain private investments with an estimated liquidation period of Contents
one to ten years.
The following table presents the fair value hierarchy for those investments of TimkenSteel’s postretirementthe Company's pension assets measured at fair value on a recurring basis as of December 31, 2021:2022:
|
| Total |
|
| Level 1 |
|
| Level 2 |
|
| Level 3 |
| ||||
Assets: |
|
|
|
|
|
|
|
|
|
|
|
| ||||
Cash and cash equivalents |
| $ | 3.8 |
|
| $ | 3.8 |
|
| $ | — |
|
| $ | — |
|
Mutual fund - fixed income |
|
| 5.8 |
|
|
| 5.8 |
|
|
| — |
|
|
| — |
|
Total Assets in the fair value hierarchy |
| $ | 9.6 |
|
| $ | 9.6 |
|
| $ | — |
|
| $ | — |
|
Assets measured at net asset value (1) |
|
| 67.2 |
|
|
| — |
|
|
| — |
|
|
| — |
|
Total Assets |
| $ | 76.8 |
|
| $ | 9.6 |
|
| $ | — |
|
| $ | — |
|
(1) Certain assets that are measured at fair value using the net asset value per share (or its equivalent) practical expedient have not been classified in the fair value hierarchy. Such assets include common collective trusts that invest in equity securities and fixed income securities, limited partnerships, real estate partnerships, hedge funds, and risk parity investments. As of December 31, 2021, these assets are redeemable at net asset value within 90 days.
The following table presents the fair value hierarchy for those investments of TimkenSteel’s postretirement assets measured at fair value on a recurring basis as of December 31, 2020:
|
| Total |
|
| Level 1 |
|
| Level 2 |
|
| Level 3 |
|
| Total |
|
| Level 1 |
|
| Level 2 |
|
| Level 3 |
| ||||||||
Assets: |
|
|
|
|
|
|
|
|
|
|
|
|
|
|
|
|
|
|
|
|
|
|
|
| ||||||||
Cash and cash equivalents |
| $ | 3.0 |
| $ | 3.0 |
| $ | — |
| $ | — |
|
| $ | 58.4 |
|
| $ | 3.0 |
|
| $ | 55.4 |
|
| $ | — |
| |||
Mutual fund - fixed income |
| 11.7 |
| 11.7 |
| — |
| — |
| |||||||||||||||||||||||
Mutual fund - equities |
| 5.0 |
| 5.0 |
| — |
| — |
| |||||||||||||||||||||||
U.S government and agency securities |
|
| 53.7 |
|
|
| 49.4 |
|
|
| 4.3 |
|
|
| — |
| ||||||||||||||||
Corporate bonds |
|
| 113.0 |
|
|
| — |
|
|
| 113.0 |
|
|
| — |
| ||||||||||||||||
Equity securities |
|
| 14.5 |
|
|
| 14.5 |
|
|
| — |
|
|
| — |
| ||||||||||||||||
Real estate |
|
| 7.6 |
|
|
| — |
|
|
| — |
|
|
| 7.6 |
| ||||||||||||||||
Private debt |
|
| 18.8 |
|
|
| — |
|
|
| — |
|
|
| 18.8 |
| ||||||||||||||||
Total Assets in the fair value hierarchy |
| $ | 19.7 |
| $ | 19.7 |
| $ | — |
| $ | — |
|
| $ | 266.0 |
|
| $ | 66.9 |
|
| $ | 172.7 |
|
| $ | 26.4 |
| |||
Assets measured at net asset value (1) |
| 62.5 |
| — |
| — |
| — |
|
|
| 283.4 |
|
|
| — |
|
|
| — |
|
|
| — |
| |||||||
Total Assets |
| $ | 82.2 |
| $ | 19.7 |
| $ | — |
| $ | — |
|
| $ | 549.4 |
|
| $ | 66.9 |
|
| $ | 172.7 |
|
| $ | 26.4 |
| |||
(1) Certain assets that are measured at fair value using the net asset value per share (or its equivalent) practical expedient have not been classified in the fair value hierarchy. Such assets include common collective trusts that invest in equity securities and fixed income securities, limited partnerships, real estate partnerships, and risk parity investments.hedge funds. As of December 31, 2020,2022, these assets were redeemable at net asset value within 90 days.
78
The following table sets forth a summary of changes in the fair value of the Company's pension plan level three assets for the year ended December 31, 2023:
|
| Level 3 assets only |
| |
|
| 2023 |
| |
Balance at the beginning of year |
| $ | 26.4 |
|
Transfers in and/or out of Level 3 |
|
| — |
|
Actual return on plan assets: |
|
|
| |
Realized gain (loss) |
|
| (0.6 | ) |
Net unrealized gain (loss) |
|
| 2.1 |
|
Purchases, sales, issuances and settlements: |
|
|
| |
Purchases |
|
| 14.3 |
|
Sales |
|
| (2.4 | ) |
Balance at the end of year |
| $ | 39.8 |
|
The following table presents the fair value hierarchy for those investments of the Company's postretirement assets measured at fair value on a recurring basis as of December 31, 2023:
|
| Total |
|
| Level 1 |
|
| Level 2 |
|
| Level 3 |
| ||||
Assets: |
|
|
|
|
|
|
|
|
|
|
|
| ||||
Cash and cash equivalents |
| $ | 2.2 |
|
| $ | 2.2 |
|
| $ | — |
|
| $ | — |
|
Mutual fund - equities |
|
| 13.5 |
|
|
| 13.5 |
|
|
| — |
|
|
| — |
|
Mutual fund - fixed income |
|
| 7.3 |
|
|
| 7.3 |
|
|
| — |
|
|
| — |
|
Mutual fund - real assets |
|
| 1.1 |
|
|
| 1.1 |
|
|
| — |
|
|
| — |
|
Mutual fund - tactical tilt |
|
| 2.5 |
|
|
| 2.5 |
|
|
| — |
|
|
| — |
|
Total Assets in the fair value hierarchy |
| $ | 26.6 |
|
| $ | 26.6 |
|
| $ | — |
|
| $ | — |
|
Assets measured at net asset value (1) |
|
| 27.2 |
|
|
| — |
|
|
| — |
|
|
| — |
|
Total Assets |
| $ | 53.8 |
|
| $ | 26.6 |
|
| $ | — |
|
| $ | — |
|
(1) Certain assets that are measured at fair value using the net asset value per share (or its equivalent) practical expedient have not been classified in the fair value hierarchy. Such assets include common collective trusts that invest in equity securities and fixed income securities. As of December 31, 2023, these assets are redeemable at net asset value on a daily basis.
The following table presents the fair value hierarchy for those investments of the Company's postretirement assets measured at fair value on a recurring basis as of December 31, 2022:
|
| Total |
|
| Level 1 |
|
| Level 2 |
|
| Level 3 |
| ||||
Assets: |
|
|
|
|
|
|
|
|
|
|
|
| ||||
Cash and cash equivalents |
| $ | 1.4 |
|
| $ | 1.4 |
|
| $ | — |
|
| $ | — |
|
Mutual fund - fixed income |
|
| 4.7 |
|
|
| 4.7 |
|
|
| — |
|
|
| — |
|
Total Assets in the fair value hierarchy |
| $ | 6.1 |
|
| $ | 6.1 |
|
| $ | — |
|
| $ | — |
|
Assets measured at net asset value (1) |
|
| 53.1 |
|
|
| — |
|
|
| — |
|
|
| — |
|
Total Assets |
| $ | 59.2 |
|
| $ | 6.1 |
|
| $ | — |
|
| $ | — |
|
(1) Certain assets that are measured at fair value using the net asset value per share (or its equivalent) practical expedient have not been classified in the fair value hierarchy. Such assets include common collective trusts that invest in equity securities, fixed income securities, and limited partnerships. As of December 31, 2022, these assets were redeemable at net asset value within 90 days.
79
Future benefit payments are expected to be as follows:
|
| Pension |
|
|
|
|
|
|
| Pension |
|
|
|
|
|
| ||||||||||||||||||||||||||||||||||||||||
|
| United States of America |
|
| United Kingdom |
|
| Mexico |
|
|
|
|
|
|
|
| United States of America |
|
| United Kingdom |
|
| Mexico |
|
|
|
|
|
|
| ||||||||||||||||||||||||||
Benefit Payments: |
| Bargaining |
|
| Salaried |
|
| Supplemental |
|
| Pension |
|
| Pension |
|
| Total |
|
| Postretirement |
|
| Bargaining |
|
| Salaried |
|
| Supplemental |
|
| Pension |
|
| Pension |
|
| Total |
| Postretirement |
| |||||||||||||||
2022 |
| $ | 76.2 |
| $ | 15.4 |
| $ | 2.3 |
| $ | 2.2 |
| $ | — |
| $ | 96.1 |
| $ | 10.5 |
| ||||||||||||||||||||||||||||||||||
2023 |
| 71.1 |
| 15.8 |
| 0.5 |
| 2.3 |
| — |
| 89.7 |
| 9.7 |
| |||||||||||||||||||||||||||||||||||||||||
2024 |
| 70.1 |
| 14.2 |
| 0.6 |
| 2.4 |
| — |
| 87.3 |
| 8.9 |
|
|
| 39.4 |
|
|
| 30.3 |
|
|
| 0.6 |
|
|
| 2.8 |
|
|
| — |
|
|
| 73.1 |
|
|
| 9.7 |
| |||||||||||||
2025 |
| 71.7 |
| 12.9 |
| 0.6 |
| 2.5 |
| — |
| 87.7 |
| 8.4 |
|
|
| 40.3 |
|
|
| 10.5 |
|
|
| 0.6 |
|
|
| 2.8 |
|
|
| — |
|
|
| 54.2 |
|
|
| 8.9 |
| |||||||||||||
2026 |
| 72.8 |
| 12.5 |
| 0.5 |
| 2.4 |
| — |
| 88.2 |
| 8.0 |
|
|
| 43.1 |
|
|
| 10.1 |
|
|
| 0.5 |
|
|
| 2.7 |
|
|
| — |
|
|
| 56.4 |
|
|
| 8.3 |
| |||||||||||||
2027-2031 |
| 356.7 |
| 57.0 |
| 17.8 |
| 13.0 |
| 0.5 |
| 445.0 |
| 36.4 |
| |||||||||||||||||||||||||||||||||||||||||
2027 |
|
| 47.2 |
|
|
| 9.8 |
|
|
| 13.8 |
|
|
| 3.1 |
|
|
| — |
|
|
| 73.9 |
|
|
| 7.9 |
| ||||||||||||||||||||||||||||
2028 |
|
| 46.7 |
|
|
| 9.5 |
|
|
| 0.5 |
|
|
| 3.2 |
|
|
| — |
|
|
| 59.9 |
|
|
| 7.5 |
| ||||||||||||||||||||||||||||
2029-2033 |
|
| 206.9 |
|
|
| 41.4 |
|
|
| 2.0 |
|
|
| 18.6 |
|
|
| — |
|
|
| 268.9 |
|
|
| 33.1 |
| ||||||||||||||||||||||||||||
The Company expects to make required contributions and payments to its pension and postretirement plans of $5.345.5 million in the next 12 months and $33.0177.0 million from 20232025 through 2031.
Due to the provisions2033. The timing and amount of the ARPA,future required Companypension contributions related to the Bargaining Plan are not projected to begin until after 2031 based on current forecasts. As such, all Bargaining Plan benefit payments noted above are anticipated to be made from plan assets. Refer to "Note 2 - Significant Accounting Policies" for additional details.is significantly affected by asset returns and actuarial assumptions.
66(1)
Defined Contribution Plans
The Company recorded expense primarily related to employer matching and non-discretionary contributions to these defined contribution plans of $3.4 million in 2023, $3.3 million in 2022, and $2.8 million in 2021, $2021.3.2 million in 2020, and $7.1 million in 2019. Effective June 1, 2020, the Company suspended employer matching contributions for all salaried employees. The Company reinstated employer matching contributions effective March 1, 2021. Additionally, the Company discontinued non-discretionary contributions as of January 1, 2021.
Note 16 - Stock-Based Compensation
Description of the Plan
On May 6, 2020, the Company's shareholders of TimkenSteel approved the TimkenSteel Corporation 2020 Equity and Incentive Compensation Plan ("TimkenSteel 2020 Plan"), which replaced the previously approved TimkenSteel Corporation Amended and Restated 2014 Equity and Incentive Compensation Plan ("TimkenSteel 2014 Plan"). The TimkenSteel 2020 Plan authorizes the Compensation Committee to provide cash awards and equity-based compensation in the form of stock options, stock appreciation rights, restricted shares, restricted share units, performance shares, performance units, dividend equivalents, and certain other awards for the primary purpose of providing our employees, officers and directors incentives and rewards for service and/or performance. Subject to adjustment as described in the TimkenSteel 2020 Plan, and subject to the TimkenSteel 2020 Plan share counting rules, a total of 2.0 million common shares of the Company are available for awards granted under the TimkenSteel 2020 Plan (plus shares subject to awards granted under the TimkenSteel 2020 Plan or the TimkenSteel 2014 Plan that are canceled or forfeited, expire, are settled for cash, or are unearned to the extent of such cancellation, forfeiture, expiration, cash settlement or unearned amount, as further described in the TimkenSteel 2020 Plan). These shares may be shares of original issuance or treasury shares, or a combination of both. The aggregate number of shares available under the TimkenSteel 2020 Plan will generally be reduced by 1one common share for every one share subject to an award granted under the TimkenSteel 2020 Plan. The TimkenSteel 2020 Plan also provides that, subject to adjustment as described in the TimkenSteel 2020 Plan: (1) the aggregate number of common shares actually issued or transferred upon the exercise of incentive stock options will not exceed 2.0 million common shares; and (2) no non-employee director of the Company will be granted, in any period of one calendar year, compensation for such service having an aggregate maximum value (measured at the grant date as applicable, and calculating the value of any awards based on the grant date fair value for financial reporting purposes) in excess of $0.5 million.
On May 5, 2021, shareholders approved the TimkenSteel Corporation Amended and Restated 2020 Equity and Incentive Compensation Plan (the “Amended 2020 Plan”), which amended and restated the TimkenSteel 2020 plan. In general, the Amended 2020 Plan modified the TimkenSteel 2020 Plan to (1) increase the number of common shares, without par value, of the Company available for awards by 2,000,000 shares, (2) correspondingly increase the limit on shares that may be issued or transferred upon the exercise of incentive stock options by 2,000,000 shares, (3) remove the TimkenSteel 2020 Plan’s full value award limit of 1.8 million shares and (4) extend the plan term until May 5,
80
2031. In addition, the Amended 2020 Plan made certain other conforming, clarifying or non-substantive changes to the terms of the TimkenSteel 2020 Plan to implement the Amended 2020 Plan but did not make other material changes to the TimkenSteel 2020 Plan.
As of December 31, 2021, approximately 4.0 million shares of TimkenSteel common stock remained available for grants under the Amended 2020 Plan.
Stock Options
The following table provides the significant assumptions used to calculate the grant date fair values of stock options granted using a Black-Scholes option pricing method:
|
| 2020 |
|
|
| 2019 |
|
| ||
Weighted-average fair value per option |
| $ | 2.23 |
|
|
| $ | 5.54 |
|
|
Risk-free interest rate |
|
| 0.96 |
| % |
|
| 2.63 |
| % |
Dividend yield |
|
| 0 |
| % |
|
| 0 |
| % |
Expected stock volatility |
|
| 42.67 |
| % |
|
| 41.36 |
| % |
Expected life - years |
|
| 6 |
|
|
|
| 6 |
|
|
There were 0no stock options granted during 2021.
The risk-free rate for periods within the expected life of the option is based on the U.S. Treasury yield curve in effect at the time of the grant.Expected annual dividend yield is estimated using the most recent dividend payment per share as of the grant date, of which no dividends were paid in these grant periods. Because of the absence of adequate stock price history of TimkenSteel common stock, expected volatility related to stock option awards granted subsequent to the spinoff is based on the historical volatility of a selected group of peer companies’ stock. The expected life of stock option awards granted is based on historical datayears ended December 31, 2023, 2022 and represents the period of time that options granted are expected to be held prior to exercise.
67
2021.
The following summarizes TimkenSteelthe Company's stock option activity from January 1, 20212023 to December 31, 2021:2023:
|
| Number of |
|
| Weighted |
|
| Weighted |
|
| Aggregate |
| ||||
Outstanding as of December 31, 2020 |
|
| 2,931,065 |
|
| $ | 18.61 |
|
|
|
|
|
|
| ||
Granted |
|
| 0 |
|
|
| 0 |
|
|
|
|
|
|
| ||
Exercised |
|
| (527,870 | ) |
|
| 7.74 |
|
|
|
|
|
|
| ||
Canceled, forfeited or expired |
|
| (349,107 | ) |
|
| 24.42 |
|
|
|
|
|
|
| ||
Outstanding as of December 31, 2021 |
|
| 2,054,088 |
|
| $ | 20.41 |
|
|
| 4.4 |
|
| $ | 5.6 |
|
Options expected to vest |
|
| 314,180 |
|
|
| 7.53 |
|
|
| 7.8 |
|
|
| 2.8 |
|
Options exercisable |
|
| 1,739,908 |
|
| $ | 22.74 |
|
|
| 3.8 |
|
| $ | 2.8 |
|
|
| Number of |
|
| Weighted |
|
| Weighted |
|
| Aggregate |
| ||||
Outstanding as of December 31, 2022 |
|
| 1,119,523 |
|
| $ | 18.85 |
|
|
|
|
|
|
| ||
Granted |
|
| — |
|
|
| — |
|
|
| — |
|
|
| — |
|
Exercised |
|
| (291,928 | ) |
|
| 10.11 |
|
|
| — |
|
|
| — |
|
Canceled, forfeited or expired |
|
| (206,245 | ) |
|
| 33.93 |
|
|
| — |
|
|
| — |
|
Outstanding as of December 31, 2023 |
|
| 621,350 |
|
| $ | 17.95 |
|
|
| 3.5 |
|
| $ | 5.6 |
|
Options expected to vest |
|
| 66,360 |
|
|
| 5.26 |
|
|
| 6.2 |
|
|
| 1.2 |
|
Options exercisable |
|
| 554,990 |
|
| $ | 19.47 |
|
|
| 3.1 |
|
| $ | 4.4 |
|
Stock options presented in the table above represent TimkenSteel awards only, including those held by The Timken Company employees.
Time-Based Restricted Stock Units
Time-based restricted stock units are issued with the fair value equal to the closing market price of TimkenSteelMetallus common shares on the date of grant. These restricted stock units do not have any performance conditions for vesting. Expense is recognized over the service period, adjusted for any forfeitures that occur during the vesting period.
The following summarizes TimkenSteelthe Company's stock-settled, time-based restricted stock unit activity from January 1, 20212023 to December 31, 2021:2023:
|
| Number of |
|
| Weighted |
|
| Number of |
|
| Weighted |
| ||||
Outstanding as of December 31, 2020 |
| 1,372,326 |
| $ | 7.62 |
| ||||||||||
Outstanding as of December 31, 2022 |
|
| 1,546,002 |
|
| $ | 9.29 |
| ||||||||
Granted |
| 938,995 |
| 7.70 |
|
|
| 385,959 |
|
|
| 18.52 |
| |||
Vested |
| (545,453 | ) |
| 7.02 |
|
|
| (302,935 | ) |
|
| 11.41 |
| ||
Canceled, forfeited or expired |
| (97,818 | ) |
| 7.53 |
|
|
| (9,307 | ) |
|
| 18.19 |
| ||
Outstanding as of December 31, 2021 |
| 1,668,050 |
| $ | 7.92 |
| ||||||||||
Outstanding as of December 31, 2023 |
|
| 1,619,719 |
|
| $ | 11.99 |
| ||||||||
Performance-Based Restricted Stock Units
Performance-basedAnnual grants of performance-based restricted stock units issued in 2020 and 2021 are generally earned based on the average payout (determined under a Compensation Committee approved matrix) forbased on the Company’sCompany's relative total shareholder return as compared to an identified peer group of steel companies. The overall vesting period is generally three years, with relative total shareholder return measured for the one, two and three-year periods creating effectively a “nested” 1-year, 2-year, and 3-year plan to support rapid and sustained shareholder value creation.performance period. Relative total shareholder return is calculated for each nested performance period by taking the beginning and ending price points based off a 20-trading day average closing stock price as of December 31.
81
The following summarizes TimkenSteelthe Company's stock-settled performance-based restricted stock unit activity from January 1, 20212023 to December 31, 2021:2023:
|
| Number of |
|
| Weighted |
|
| Number of |
|
| Weighted |
| ||||
Outstanding as of December 31, 2020 |
| 175,964 |
| $ | 4.98 |
| ||||||||||
Outstanding as of December 31, 2022 |
|
| 968,415 |
|
| $ | 10.21 |
| ||||||||
Granted |
| 651,240 |
| 7.57 |
|
|
| 211,639 |
|
|
| 23.13 |
| |||
Vested |
|
| (167,694 | ) |
|
| 4.98 |
| ||||||||
Canceled, forfeited or expired |
| (33,160 | ) |
| 10.12 |
|
|
| 2,298 |
|
|
| 23.44 |
| ||
Outstanding as of December 31, 2021 |
| 794,044 |
| $ | 6.91 |
| ||||||||||
Outstanding as of December 31, 2023 |
|
| 1,014,658 |
|
| $ | 13.76 |
| ||||||||
Transformation Incentive Grant Program
68On December 15, 2023, the Board of approved and authorized a performance-based Transformation Incentive Grant program (the “Transformation Incentive Grant Program”). Under the Transformation Incentive Grant Program, effective December 15, 2023, certain employees of the Company were granted performance-based Restricted Share Unit awards designed to be earned from 0 percent to 200 percent of target levels depending on the degree to which the closing price performance of the Company's common shares satisfies specific average per share closing price goals (achieved if the goal price is met or exceeded by the 20-trading-day average closing price for each trading day in any 20-consecutive-day trading period) during a performance period running from December 1, 2023 through December 31, 2026. Any performance shares earned will pay out in two equal installments in early 2027 and 2028, generally conditioned on continued employment with the Company until the applicable vesting date. Different payout curves apply for each participant group (Tier 1-2 or Tier 3-4).
|
| Number of |
|
| Weighted |
| ||
Outstanding as of December 31, 2022 |
|
| — |
|
| $ | — |
|
Granted (Tier 1-2) |
|
| 200,000 |
|
|
| 22.22 |
|
Granted (Tier 3-4) |
|
| 150,000 |
|
|
| 22.78 |
|
Canceled, forfeited or expired |
|
| — |
|
|
| — |
|
Outstanding as of December 31, 2023 |
|
| 350,000 |
|
| $ | 22.46 |
|
Other Information
TimkenSteelMetallus recognized stock-based compensation expense of $7.311.5 million, $6.68.8 million and $7.47.3 million for the years ended December 31, 2021, 20202023, 2022 and 2019,2021, respectively.
As of December 31, 2021,2023, future stock-based compensation expense related to the unvested portion of all awards is approximately $9.719.9 million, which is expected to be recognized over a weighted average period of 1.62.4 years.
82
Note 17 - Accumulated Other Comprehensive Income (Loss)
Changes in accumulated other comprehensive income (loss) for the years ended December 31, 20212023 and 20202022 by component were as follows:
|
| Foreign Currency |
| Pension and |
| Total |
|
| Foreign Currency |
| Pension and |
| Total |
| ||||||||||
Balance as of December 31, 2020 |
| $ | (5.4 | ) |
| $ | 45.8 |
| $ | 40.4 |
| |||||||||||||
Balance as of December 31, 2022 |
| $ | (6.8 | ) |
| $ | 21.5 |
|
| $ | 14.7 |
| ||||||||||||
Other comprehensive income before reclassifications, before income tax |
| 0.3 |
| — |
| 0.3 |
|
|
| — |
|
|
| — |
|
|
| — |
| |||||
Amounts reclassified from accumulated other comprehensive income |
| — |
|
| (5.8 | ) |
| (5.8 | ) |
|
| 0.3 |
|
|
| (4.9 | ) |
|
| (4.6 | ) | |||
Amounts deferred to accumulated other comprehensive income |
| — |
|
| (14.2 | ) |
| (14.2 | ) |
| — |
|
|
| 2.3 |
|
|
| 2.3 |
| ||||
Tax effect |
| — |
|
| — |
| — |
|
| — |
|
|
| — |
|
|
| — |
| |||||
Net current period other comprehensive income (loss), net of income taxes |
| 0.3 |
| (20.0 | ) |
| (19.7 | ) |
|
| 0.3 |
|
|
| (2.6 | ) |
|
| (2.3 | ) | ||||
Balance as of December 31, 2021 |
| $ | (5.1 | ) |
| $ | 25.8 |
| $ | 20.7 |
| |||||||||||||
Balance as of December 31, 2023 |
| $ | (6.5 | ) |
| $ | 18.9 |
|
| $ | 12.4 |
| ||||||||||||
|
| Foreign Currency |
| Pension and |
| Total |
|
| Foreign Currency |
| Pension and |
| Total |
| ||||||||||
Balance as of December 31, 2019 |
| $ | (6.8 | ) |
| $ | 51.5 |
| $ | 44.7 |
| |||||||||||||
Balance as of December 31, 2021 |
| $ | (5.1 | ) |
| $ | 25.8 |
|
| $ | 20.7 |
| ||||||||||||
Other comprehensive income before reclassifications, before income tax |
| 1.4 |
| — |
| 1.4 |
|
|
| (1.7 | ) |
|
| — |
|
|
| (1.7 | ) | |||||
Amounts reclassified from accumulated other comprehensive income |
| — |
|
| (5.6 | ) |
| (5.6 | ) |
| — |
|
|
| (4.7 | ) |
|
| (4.7 | ) | ||||
Amounts deferred to accumulated other comprehensive income |
| — |
|
|
| — |
|
|
| — |
| |||||||||||||
Tax effect |
| — |
|
| (0.1 | ) |
| (0.1 | ) |
| — |
|
|
| 0.4 |
|
|
| 0.4 |
| ||||
Net current period other comprehensive income (loss), net of income taxes |
| 1.4 |
| (5.7 | ) |
| (4.3 | ) |
|
| (1.7 | ) |
|
| (4.3 | ) |
|
| (6.0 | ) | ||||
Balance as of December 31, 2020 |
| $ | (5.4 | ) |
| $ | 45.8 |
| $ | 40.4 |
| |||||||||||||
Balance as of December 31, 2022 |
| $ | (6.8 | ) |
| $ | 21.5 |
|
| $ | 14.7 |
| ||||||||||||
The amount reclassified from accumulated other comprehensive income (loss) for the years ended December 31, 20212023 and December 31, 20202022 for the pension and postretirement liability adjustment was included in other (income) expense, net in the Consolidated Statements of Operations. The amount deferred to accumulated other comprehensive income (loss) for the year ended December 31, 2021 was a result of a plan amendment to the Company's Bargaining Plan. For more details refer to "Note 15 - Retirement and Postretirement Plans."
Note 18 – Contingencies
TimkenSteelMetallus has a number of loss exposures incurred in the ordinary course of business, such as environmental claims, product warranty claims, employee-related matters, and other litigation. Establishing loss reserves for these matters requires management’s estimate and judgment regarding risk exposure and ultimate liability or realization. These loss reserves are
83
reviewed periodically and adjustments are made to reflect the most recent facts and circumstances. Accruals related to environmental claims represent management’s best estimate of the fees and costs associated with these claims. Although it is not possible to predict with certainty the outcome of such claims, management believes that their ultimate dispositions should not have a material adverse effect on our financial position, cash flows or results of operations. As ofAt both December 31, 20212023 and 2020, TimkenSteel2022, Metallus had a $0.3 million and $1.01.1 million contingency reserve respectively, related to loss exposures incurred in the ordinary course of business.
69
Note19 – Subsequent Event
On February 27, 2024, the Company entered an agreement with the United States Army. The agreement provides for up to $99 million in funding from the Army, half of which is currently committed with the balance subject to mutual agreement as the final project details are presented to the Army. This funding will support new assets aimed at bolstering the Army's mission of ramping up artillery shell production in the coming years. The Company is targeting late 2025 for the new assets to be operational with funding to be provided throughout the procurement and installation process.
84
Item 9. Changes in and Disagreements with Accountants on Accounting and Financial Disclosure
None.
Item 9A. Controls and Procedures
Evaluation of Disclosure Controls and Procedures
As of the end of the period covered by this Annual Report on Form 10-K, our management carried out an evaluation, under the supervision and with the participation of the Company’s principal executive officer and principal financial officer, of the effectiveness of the design and operation of the Company’s disclosure controls and procedures as defined in Exchange Act Rule 13a-15(e). Based upon that evaluation, the principal executive officer and principal financial officer concluded that the Company’s disclosure controls and procedures were effective as of the end of the period covered by this Annual Report on Form 10-K.
Report of Management on Internal Control Over Financial Reporting
The management of TimkenSteelMetallus is responsible for establishing and maintaining adequate internal control over financial reporting for the Company. TimkenSteel’sMetallus' internal control system is designed to provide reasonable assurance regarding the preparation and fair presentation of published financial statements. Because of its inherent limitations, internal control over financial reporting may not prevent or detect misstatements. Also, projections of any evaluation of effectiveness to future periods are subject to the risk that controls may become inadequate because of changes in conditions, or that the degree of compliance with the policies or procedures may deteriorate.
TimkenSteelThe Company's management assessed the effectiveness of the Company’s internal control over financial reporting as of December 31, 2021.2023. In making this assessment, it used the criteria set forth by the Committee of Sponsoring Organizations of the Treadway Commission ("COSO"). Based on this assessment under COSO’s “Internal Control-Integrated Framework (2013 framework),” management believes that, as of December 31, 2021, TimkenSteel’s2023, Metallus' internal control over financial reporting is effective.
Ernst & Young LLP (PCAOB ID: 42), an independent registered public accounting firm, has issued an audit report on our assessment of TimkenSteel’sMetallus' internal control over financial reporting as of December 31, 2021.2023. Please refer to Item 8, “Reports of Independent Registered Public Accounting Firm.”
Changes in Internal Controls
There have been no changes during the Company’s fourth quarter of 20212023 in our internal control over financial reporting that have materially affected, or are reasonably likely to materially affect, our internal control over financial reporting.
Item 9B. Other Information
None.During the quarter ended December 31, 2023, officers (as defined in Exchange Act Rule 16a-1(f)) of the Company adopted written plans for the sale of the Company’s common shares intended to satisfy the affirmative defense conditions of Exchange Act Rule 10b5-1(c) (“Rule 10b5-1 trading arrangements”) as follows:
70
On November 14, 2023, Nicholas A. Yacobozzi, Chief Accounting Officer, adopted a 10b5-1 trading arrangement that provides for the potential sale of up to 19,350 common shares that may be earned (net of shares withheld for taxes) upon the vesting of performance-based restricted stock units awarded for the 2021-2023 performance period, as well as up to 12,900 common shares expected to be received (net of shares withheld for taxes) upon vesting of restricted stock units on March 1, 2024, which trading arrangement is scheduled to terminate no later than August 25, 2024.
Each of the above-named officers is currently and is expected to remain in compliance with his or her share ownership guidelines following the sale of any common shares pursuant to his or her 10b5-1 trading arrangement.
85
Amendments to Articles of Incorporation or Bylaws; Change in Fiscal Year
On February 26, 2024, the Company amended its existing Amended and Restated Articles of Incorporation, as amended (the “Amended Articles”), to revise Article FIRST to change its corporate name to “Metallus Inc.” The amendment was approved by the Company’s Board of Directors and was effected by the filing of a Certificate of Amendment to the Amended Articles with the Ohio Secretary of State.
Also effective on February 26, 2024, the Company amended its existing Code of Regulations to reflect the new corporate name (the “Amended and Restated Regulations”). The Amended and Restated Regulations were approved by the Company’s Board of Directors.
The foregoing descriptions are qualified in their entirety by reference to the Certificate of Amendment to the Amended Articles and the Amended and Restated Regulations, copies of which are attached as Exhibits 3.1 and 3.2, respectively, to this Annual Report on Form 10-K and are incorporated by reference herein.
86
Part III.
Item 10. Directors, Executive Officers and Corporate Governance
Required information will be set forth under the captions “Proposal 1: Election of directors” in the proxy statement to be filed within 120 days of December 31, 20212023 in connection with the annual meeting of shareholders to be held on May 4, 2022,7, 2024, and is incorporated herein by reference. Information regarding the executive officers of the registrant is included in Part I hereof. Information regarding the Company’s Audit Committee and its Audit Committee Financial Expert is set forth under the caption “Board of directors information - Audit committee” in the proxy statement to be filed within 120 days of December 31, 20212023 in connection with the annual meeting of shareholders to be held on May 4, 2022,7, 2024, and is incorporated herein by reference. Information regarding compliance with Section 16(a) by the Company's section 16 reporting persons is set forth under the caption "Delinquent Section 16(a) reports" in the proxy statement to be filed within 120 days of December 31, 20212023 in connection with the annual meeting of shareholders to be held on May 4, 20227, 2024 and is incorporated herein by reference.
The Company’s Corporate Governance Guidelines and the charters of its Audit Committee, Compensation Committee and Nominating and Corporate Governance Committee are available on the Company’s website at www.timkensteel.com.www.metallus.com. The information on the Company’s website is not incorporated by reference into this Annual Report on Form 10-K.
The Company has adopted a code of ethics that applies to all of its employees, including its principal executive officer, principal financial officer and principal accounting officer or controller, as well as to its directors. The Company’s code of ethics, the TimkenSteelMetallus Code of Conduct, is available on its website at www.timkensteel.com.www.metallus.com. The Company intends to disclose any amendment to its code of ethics or waiver from its code of ethics that applies to its principal executive officer, principal financial officer, principal accounting officer or controller, or any director, by posting such amendment or waiver, as applicable, on its website at www.timkensteel.com.www.metallus.com.
Item 11. Executive Compensation
Required information will be set forth under the captions “Compensation discussion and analysis”; “2021“2023 Summary compensation table”; “2021“2023 Grants of plan-based awards table”; “Outstanding equity awards at 20212023 year-end table”; “2021“2023 Option exercises and stock vested table”; “Pension benefits”; “2021“2023 Nonqualified deferred compensation table”; “Potential payments upon termination or change in control”; “Director compensation”; “CEO pay ratio”; “Board of directors information - Compensation committee”; “Board of directors information - Compensation committee interlocks and insider participation”; and “Board of directors information - Compensation committee report” in the proxy statement to be filed within 120 days of December 31, 20212023 in connection with the annual meeting of shareholders to be held on May 4, 2022,7, 2024, and is incorporated herein by reference.
Item 12. Security Ownership of Certain Beneficial Owners and Management and Related Stockholder Matters
Required information, including with respect to institutional investors owningregarding beneficial owners of more than 5% of the Company’s common shares, will be set forth under the caption “Beneficial ownership of common stock” in the proxy statement to be filed within 120 days of December 31, 20212023 in connection with the annual meeting of shareholders to be held on May 4, 2022,7, 2024, and is incorporated herein by reference. Required information regarding securities authorized for issuance under the Company’s equity compensation plans is included in Item 5 of this Annual Report on Form 10-K and is incorporated herein by reference.
Required information will be set forth under the captions “Corporate governance - Director independence” and “Corporate governance - Related-party transactions approval policy” in the proxy statement to be filed within 120 days of December 31, 20212023 in connection with the annual meeting of shareholders to be held on May 4, 2022,7, 2024, and is incorporated herein by reference.
87
Item 14. Principal Accounting Fees and Services
Required information regarding fees paid to and services provided by the Company’s independent auditor during the years ended December 31, 20212023 and 20202022 and the pre-approval policies and procedures of the Audit Committee of the Company’s Board of Directors will be set forth under the captions “ Proposal 2: Ratification of appointment of independent auditors - Services of independent auditor for 2021“2023“ and “Proposal 2: Ratification of appointment of independent auditors - Audit committee pre-approval policies and procedures” in the proxy statement to be filed within 120 days of December 31, 20212023 in connection with the annual meeting of shareholders to be held on May 4, 2022,7, 2024, and is incorporated herein by reference.
7188
Part IV.
Item 15. Exhibits, Financial Statement Schedules
(a)(1) - Financial Statements are included in Part II, Item 8 of the Annual Report on Form 10-K.
(a)(2) - Schedule II - Valuation and Qualifying Accounts is submitted as a separate section of this report. Schedules I, III, IV and V are not applicable to the Company and, therefore, have been omitted.
(a)(3) Listing of Exhibits
| |||
|
|
|
|
Exhibit Number | Exhibit Description | ||
2.1† | |||
| |||
| |||
4.1 | |||
4.2 | |||
4.3 | |||
4.4 |
| ||
10.1† | |||
10.2† | |||
10.3 | |||
10.4† | |||
10.5 | |||
10.6 | |||
10.7 | |||
10.8 | |||
10.9†† | |||
10.10†† | |||
10.11†† | |||
10.12 | |||
| |||
| |||
89
| |||
| |||
| |||
72
| ||
| ||
| ||
| ||
| ||
| ||
| ||
| ||
| ||
|
| |
|
| |
|
| |
|
| |
|
| |
10.27 | ||
10.28 | ||
10.29 | ||
10.30* | ||
10.31* | ||
21.1* | ||
23.1* | ||
24.1* | ||
31.1* | ||
31.2* | ||
32.1** | ||
97.1* | ||
101.INS* | Inline XBRL Instance Document. |
90
101.SCH* | Inline XBRL Taxonomy Extension Schema Document. | |
101.PRE* | Inline XBRL Taxonomy Extension Presentation Linkbase Document. | |
101.CAL* | Inline XBRL Taxonomy Extension Calculation Linkbase Document. | |
101.LAB* | Inline XBRL Taxonomy Extension Label Linkbase Document. | |
101.DEF* | Inline XBRL Taxonomy Extension Definition Linkbase Document. | |
104 |
| Cover Page Interactive Data File (formatted as Inline XBRL and contained in Exhibit 101). |
† | Incorporated by reference to the exhibit filed under the corresponding Exhibit Number of the Company’s Current Report on Form 8-K filed on July 3, 2014, File No. 001-36313. | |
†† | Incorporated by reference to the exhibit filed under the corresponding Exhibit Number of Amendment No. 3 to the Company’s Registration Statement on Form 10 filed on May 15, 2014, File No. 001-36313. | |
* | Filed herewith. | |
** | Furnished herewith. |
91
73
Schedule II-Valuation and Qualifying Accounts
Allowance for uncollectible accounts: |
| 2021 |
| 2020 |
| 2019 |
|
| 2023 |
| 2022 |
| 2021 |
| ||||||||||
Balance at Beginning of Period |
| $ | 1.3 |
| $ | 1.5 |
| $ | 1.7 |
|
| $ | 1.0 |
|
| $ | 1.9 |
|
| $ | 1.3 |
| ||
Additions: |
|
|
|
|
|
|
|
|
|
|
|
|
|
|
|
|
|
| ||||||
Charged to Costs and Expenses (1) |
| 0.6 |
| — |
|
| — |
|
|
| 1.2 |
|
|
| — |
|
|
| 0.6 |
| ||||
Deductions (2) |
| — |
| (0.2 | ) |
| (0.2 | ) |
|
| (0.2 | ) |
|
| (0.9 | ) |
|
| — |
| ||||
Balance at End of Period |
| $ | 1.9 |
| $ | 1.3 |
| $ | 1.5 |
|
| $ | 2.0 |
|
| $ | 1.0 |
|
| $ | 1.9 |
| ||
Allowance for inventory reserves: |
| 2021 |
| 2020 |
| 2019 |
|
| 2023 |
| 2022 |
| 2021 |
| ||||||||||
Balance at Beginning of Period |
| $ | 13.9 |
| $ | 10.7 |
| $ | 6.1 |
|
| $ | 0.5 |
|
| $ | 0.8 |
|
| $ | 13.9 |
| ||
Additions: |
|
|
|
|
|
|
|
|
|
|
|
|
|
|
|
|
|
| ||||||
Charged to Costs and Expenses (3) |
| 2.8 |
| 4.1 |
| 9.0 |
|
|
| 1.1 |
|
|
| 0.5 |
|
|
| 2.8 |
| |||||
Deductions (4) |
| (15.9 | ) |
| (0.9 | ) |
| (4.4 | ) |
|
| (0.9 | ) |
|
| (0.8 | ) |
|
| (15.9 | ) | |||
Balance at End of Period |
| $ | 0.8 |
| $ | 13.9 |
| $ | 10.7 |
|
| $ | 0.7 |
|
| $ | 0.5 |
|
| $ | 0.8 |
| ||
Valuation allowance on deferred tax assets: |
| 2021 |
| 2020 |
| 2019 |
|
| 2023 |
| 2022 |
| 2021 |
| ||||||||||
Balance at Beginning of Period |
| $ | 47.7 |
| $ | 34.9 |
| $ | 43.7 |
|
| $ | 13.0 |
|
| $ | 15.5 |
|
| $ | 47.7 |
| ||
Additions: |
|
|
|
|
|
|
|
|
|
|
|
|
|
|
|
|
|
| ||||||
Charged to Costs and Expenses (5) |
| — |
|
| 12.4 |
| — |
|
|
| 2.5 |
|
| — |
|
| — |
| ||||||
Charged to Other Accounts (6) |
| 4.8 |
| 1.4 |
| 16.7 |
|
|
| — |
|
|
| — |
|
|
| 4.8 |
| |||||
Deductions (7) |
| (37.0 | ) |
| (1.0 | ) |
| (25.5 | ) |
|
| — |
|
|
| (2.5 | ) |
|
| (37.0 | ) | |||
Balance at End of Period |
| $ | 15.5 |
| $ | 47.7 |
| $ | 34.9 |
|
| $ | 15.5 |
|
| $ | 13.0 |
|
| $ | 15.5 |
| ||
(1) Provision for uncollectible accounts included in expenses.
(2) Actual accounts written off against the allowance, net of recoveries.
(3) Provisions for surplus and obsolete inventory and lower cost or net realizable value included in expenses.
(4) Inventory items released against the allowance, either via write-off or a recovery. The allowance for inventory reserves decreased in 2021 due to sales of TMS inventory, along with the selling and scrapping of aged inventory.
(5) Increase in valuation allowance is recorded as a component of the provision for income taxes.
(6) Amount relates to valuation allowances recorded against other comprehensive income (loss).
(7) For the year ended December 31, 2022, this amount related to the release of a portion of the U.S. valuation allowance. For the year ended December 31, 2021, this amount relates to the release of the valuation allowance against tax loss carryforwards used during 2021. For the year ended December 31, 2020, this amount relates to an additional paid-in capital adjustment associated with the Convertible Notes. For the year ended December 31, 2019, this amount relates to the change in accounting principle from LIFO to FIFO.
7492
Signatures
Pursuant to the requirements of the Securities Exchange Act of 1934, the registrant has duly caused this report to be signed on its behalf by the undersigned thereunto duly authorized.
| ||
Date: | February | /s/ Kristopher R. Westbrooks |
Kristopher R. Westbrooks Executive Vice President and Chief Financial Officer (Principal Financial Officer) |
Pursuant to the requirements of the Securities Exchange Act of 1934, this report has been signed by the following persons on behalf of the registrant and in the capacities and on the dates indicated.
Signature | Title | Date | ||
/s/ Michael S. Williams | President and Chief Executive Officer (Principal Executive Officer) | February | ||
Michael S. Williams | ||||
/s/ Kristopher R. Westbrooks | Executive Vice President and Chief Financial Officer (Principal Financial Officer) | February | ||
Kristopher R. Westbrooks | ||||
/s/ Nicholas A. Yacobozzi |
(Principal Accounting Officer) | February | ||
Nicholas A. Yacobozzi | ||||
* | Director | |||
Mary Ellen Baker | February 28, 2024 | |||
* | Director | |||
Nicholas J. Chirekos | February 28, 2024 | |||
* | Director |
| ||
Diane C. Creel | February 28, 2024 | |||
* | Director |
| ||
Randall H. Edwards | February 28, 2024 | |||
* | Director |
| ||
| February 28, 2024 | |||
* | Director |
| ||
Ellis A. Jones | February 28, 2024 | |||
* | Director |
| ||
Donald T. Misheff | February 28, 2024 | |||
* | Director | |||
Jamy P. Rankin | February | |||
* | Director | |||
Ronald A. Rice | February 28, 2024 | |||
* | Director |
| ||
| ||||
|
|
| ||
Randall A. Wotring | February 28, 2024 | |||
*Signed by the undersigned as attorney-in-fact and agent for the directors indicated. | ||||
/s/ Kristopher R. Westbrooks | Executive Vice President and Chief Financial Officer (Principal Financial Officer) | February | ||
Kristopher R. Westbrooks | ||||
7593