UNITED STATES

SECURITIES AND EXCHANGE COMMISSION

Washington, D.C. 20549

FORM 10-K

(Mark One)

ANNUAL REPORT PURSUANT TO SECTION 13 OR 15(d) OF THE SECURITIES EXCHANGE ACT OF 1934

FOR THE FISCAL YEAR ENDED December 31, 2023

For the fiscal year ended: December 31, 2021

OR

TRANSITION REPORT PURSUANT TO SECTION 13 OR 15(d) OF THE SECURITIES EXCHANGE ACT OF 1934

For the transition period fromCommission file number: to001-16577

Commission File Number 1-31565

NEW YORK COMMUNITY BANCORP, INC.

(Exact name of registrant as specified in its charter)

Delaware06-1377322

Delaware

06-1377322

(State or other jurisdiction

of incorporation or organization)

(I.R.S. Employer

Identification No.)

102 Duffy Avenue, Avenue, Hicksville,, New York11801

(Address of principal executive offices) (Zip code)

(Zip Code)

(516) 683-4100

(Registrant’s telephone number, including area code)code: (516) 683-4100

Securities
Shares registered pursuant to Section 12(b) of the Act:

Title of each class

Trading Symbol

Trading

Symbol(s)

Name of each exchange

on which registered

Common Stock,, $0.01 par value per share

NYCB

New York Stock Exchange

Bifurcated Option Note Unit SecuritiESSM

NYCB PU

New York Stock Exchange

Depositary Shares each representing a 1/40th40th interest in a share of Fixed-to-Floating Rate Series A Noncumulative Perpetual Preferred Stock

NYCB PA

New York Stock Exchange


Securities registered pursuant to Section 12(g) of the Act: None

Indicate by check mark if the registrant is a well-known seasoned issuer, as defined in Rule 405 of the Securities Act.Yes    Yes    No 


Indicate by check mark if the registrant is not required to file reports pursuant to Section 13 or Section 15(d) of the Act. Yes     No  ☒

Indicate by check mark whether the registrant (1) has filed all reports required to be filed by Section 13 or 15(d) of the Securities Exchange Act of 1934 during the preceding 12 months (or for such shorter period that the registrant was required to file such reports), and (2) has been subject to such filing requirements for the past 90 days. Yes   Yes      No  

Indicate by check mark whether the registrant has submitted electronically every Interactive Data File required to be submitted pursuant to Rule 405 of Regulation S-T (§232.405 of this chapter) during the preceding 12 months (or for such shorter period that the registrant was required to submit such files). Yes    Yes  ☒    No  

Indicate by check mark whether the registrant is a large accelerated filer, an accelerated filer, a non-accelerated filer, a smaller reporting company, or an emerging growth company. See the definitions of “large"large accelerated filer,” “accelerated" "accelerated filer,” “smaller" "smaller reporting company," and “emerging"emerging growth company”company" in Rule 12b-2 of the Exchange Act.

Large Accelerated Filer

Accelerated Filer

Non-Accelerated Filer

Smaller Reporting Company

Non-Accelerated Filer  

Emerging Growth Companygrowth company

If an emerging growth company, indicate by check mark if the registrant has elected not to use the extended transition period for complying with any new or revised financial accounting standards provided pursuant to Section 13(a) of the Exchange Act ☐Act.

 ☐.


Indicate by check mark whether the registrant has filed a report on and attestation to its management’smanagement's assessment of the effectiveness of its internal control over financial reporting under Section 404(b) of the Sarbanes-Oxley Act (15 U.S.C. 7262(b)) by the registered public accounting firm that prepared or issued its audit report.


If securities are registered pursuant to Section 12(b) of the Act, indicate by check mark whether the financial statements of the registrant included in the filing reflect the correction of an error to previously issued financial statements.

Indicate by check mark whether any of those error corrections are restatements that required a recovery analysis of incentive-based compensation received by any of the registrant’s executive officers during the relevant recovery period pursuant to §240.10D-1(b).

Indicate by check mark whether the registrant is a shell company (as defined in Rule 12b-2 of the Act).    Yes  ☐   No  

As of June 30, 2021,2023, the aggregate market value of the shares of common stock outstanding of the registrant was $wa5.0s $8.0 billion billion, excluding 13,992,695 10,040,722 shares held by all directors and executive officers of the registrant. This figure is based on the closing price of the registrant’s common stock on June 30, 2021, $11.022023, $11.24 per share, as reported by the New York Stock Exchange.

The number of shares of the registrant’s common stock outstanding as of February 18, 2022March 11, 2024 was 797,921,126 shares.

DOCUMENTS INCORPORATED BY REFERENCE
466,984,658
shares.

Documents Incorporated by Reference

Portions of the definitive Proxy Statement for the Annual Meeting of Shareholders to be held on June 1, 2022May 17, 2024 are incorporated by reference into Part III.


NEW YORK COMMUNITY BANCORP, INC.
FORM 10-K
FOR THE FISCAL YEAR ENDED December 31, 2023


CROSS REFERENCE INDEX

TABLE OF CONTENTS

Page

ITEM 1.

Glossary and Abbreviations

ITEM 1A.

ITEM 1B.

PART I

ITEM 1C.

ITEM 2.

Item 1.ITEM 3.

9

Item 1A.ITEM 4.

25

Unresolved Staff CommentsITEM 5.

4048

Item 2.ITEM 6.

40

Item 3ITEM 7..

40

Item 4ITEM 7A..

40

ITEM 8.

PART IIITEM 9.

ITEM 9A.

Item 5.ITEM 9B.

ITEM 9C.
ITEM 10.
ITEM 11.
ITEM 12.
ITEM 13.
ITEM 14.
ITEM 15.
ITEM 16.

3


GLOSSARY OF ABBREVIATIONS AND ACRONYMS

The following list of abbreviations and acronyms are provided as a tool for the reader and may be used throughout this Report, including the Consolidated Financial Statements and Notes:

TermDefinitionTermDefinition
ACLAllowance for Credit LossesFHLB-NYFederal Home Loan Bank of New York
ADCAcquisition, development, and construction loanFOMCFederal Open Market for Registrant’s CommonCommittee
ALCOAsset and Liability Management CommitteeFRBFederal Reserve Board
AOCLAccumulated other comprehensive lossFRB-NYFederal Reserve Bank of New York
ASCAccounting Standards CodificationFTEsFull-time equivalent employees
ASUAccounting Standards UpdateGAAPU.S. generally accepted accounting principles
BaaSBanking as a ServiceGLBAThe Gramm Leach Bliley Act
BOLIBank-owned life insuranceGNMAGovernment National Mortgage Association
BPBasis point(s)GSEGovernment-sponsored enterprises
BTFPBank Term Funding ProgramHELOCHome Equity Related Stockholder Matters,Line of Credit
C&ICommercial and Issuer Purchasesindustrial loanHELOANHome Equity Loan
CDsCertificates of depositHPIHousing Price Index
CECLCurrent Expected Credit LossLGGLoans with government guarantees
CFPBConsumer Financial Protection BureauLHFSLoans Held-for-Sale
CMOsCollateralized mortgage obligationsLIBORLondon Interbank Offered Rate
CMTConstant maturity treasury rateLTVLoan-to-value ratio
CPIConsumer Price IndexMBSMortgage-backed securities
CPRConstant prepayment rateMSRsMortgage servicing rights
CRACommunity Reinvestment ActNIMNet interest margin
CRECommercial real estate loanNOLNet operating loss
DIFDeposit Insurance FundNPAsNon-performing assets
DFADodd-Frank Wall Street Reform and Consumer Protection ActNPLsNon-performing loans
DSCRDebt service coverage ratioNPVNet Portfolio Value
EPSEarnings per common shareNYSENew York Stock Exchange
ERMEnterprise Risk ManagementOCCOffice of the Comptroller of the Currency
ESOPEmployee Stock Ownership PlanOREOOther real estate owned
EVEEconomic Value of Equity Securitiesat Risk

PAA

41Purchase accounting adjustments

Item 6.Fannie Mae

ReservedFederal National Mortgage Association

PSAs

43

Performance-Based Restricted Stock Units

Item 7.FASB

Management’s Discussion and AnalysisFinancial Accounting Standards BoardROURight of Financial Condition and Results of Operationsuse asset

44

Item 7A.FDI Act

Quantitative and Qualitative Disclosures about Market RiskFederal Deposit Insurance Act

RSAs

75

Restricted Stock Awards

Item 8.FDIC

Financial Statements and Supplementary DataFederal Deposit Insurance Corporation

SBA

80Small Business Administration

Item 9.FHA

Changes in and Disagreements with Accountants on Accounting and Financial DisclosureFederal Housing Administration

Signature

142Signature Bridge Bank, N.A.

Item 9A.FHFA

ControlsFederal Housing Finance AgencySECU.S. Securities and ProceduresExchange Commission

142

Item 9B.FHLB

Other InformationFederal Home Loan Bank

SOFR

143Secured Overnight Financing Rate

Item 9C.Freddie Mac

Disclosure Regarding Jurisdictions that Prevent InspectionsFederal Home Loan Mortgage Corporation

TDR

143Troubled debt restructurings

PART III

Item 10.

Directors, Executive Officers, and Corporate Governance

144

Item 11.

Executive Compensation

144

Item 12.

Security Ownership of Certain Beneficial Owners and Management, and Related Stockholder Matters

144

Item 13.

Certain Relationships and Related Transactions, and Director Independence

145

Item 14.

Principal Accounting Fees and Services

145

PART IV

Item 15.

Exhibits and Financial Statement Schedules

146

Item 16.

Form 10-K Summary (None)

148

Signatures

149

Certifications


4


GLOSSARY
BARGAIN PURCHASE GAIN

For

The amount by which the purpose of this Annual Report on Form 10-K, the words “we,” “us,” “our,” and the “Company” are used to refer to New York Community Bancorp, Inc. and our consolidated subsidiary, New York Community Bank (the “Bank”).

CAUTIONARY STATEMENT REGARDING FORWARD-LOOKING LANGUAGE

This report, like many written and oral communications presented by New York Community Bancorp, Inc. and our authorized officers, may contain certain forward-looking statements regarding our prospective performance and strategies within the meaning of Section 27A of the Securities Act of 1933, as amended, and Section 21E of the Securities Exchange Act of 1934, as amended. We intend such forward-looking statements to be covered by the safe harbor provisions for forward-looking statements contained in the Private Securities Litigation Reform Act of 1995, and are including this statement for purposes of said safe harbor provisions.

Forward-looking statements, which are based on certain assumptions and describe future plans, strategies, and expectations of the Company, are generally identified by use of the words “anticipate,” “believe,” “estimate,” “expect,” “intend,” “plan,” “project,” “seek,” “strive,” “try,” or future or conditional verbs such as “will,” “would,” “should,” “could,” “may,” or similar expressions. Although we believe that our plans, intentions, and expectations as reflected in these forward-looking statements are reasonable, we can give no assurance that they will be achieved or realized.

Our ability to predict results or the actual effects of our plans and strategies is inherently uncertain. Accordingly, actual results, performance, or achievements could differ materially from those contemplated, expressed, or implied by the forward-looking statements contained in this report.

There are a number of factors, many of which are beyond our control, that could cause actual conditions, events, or results to differ significantly from those described in our forward-looking statements. These factors include, but are not limited to:

general economic conditions, either nationally or in some or all of the areas in which we and our customers conduct our respective businesses;
conditions in the securities markets and real estate markets or the banking industry;
changes in real estate values, which could impact the quality of the assets securing the loans in our portfolio;
changes in interest rates, which may affect our net income, prepayment penalty income, and other future cash flows, or the marketfair value of our assets including our investment securities;
purchased exceeds the fair value of liabilities assumed and consideration given.

any uncertainty relating to the LIBOR calculation process;
BASIS POINT

changes in the quality or composition of our loan or securities portfolios;
changes in our capital management policies, including those regarding business combinations, dividends, and share repurchases, among others;
heightened regulatory focus on CRE concentrations;
changes in competitive pressures among financial institutions or from non-financial institutions;
changes in deposit flows and wholesale borrowing facilities;
changes in the demand for deposit, loan, and investment products and other financial services in the markets we serve;
our timely development of new lines of business and competitive products or services in a changing environment, and the acceptance of such products or services by our customers;

1


our ability to obtain timely shareholder and regulatory approvals of any merger transactions or corporate restructurings we may propose, including timely obtaining regulatory approvals for our pending acquisition of Flagstar Bancorp, Inc.;
our ability to successfully integrate any assets, liabilities, customers, systems, and management personnel we may acquire into our operations, and our ability to realize related revenue synergies and cost savings within expected time frames, including the pending acquisition of Flagstar Bancorp, Inc.;
potential exposure to unknown or contingent liabilities of companies we have acquired, may acquire, or target for acquisition, including the pending acquisition of Flagstar Bancorp, Inc.;
the success of our previously announced investment in, and partnership with, Figure Technologies, Inc., a FinTech company focusing on payments and lending via blockchain technology;
the success of our previously announced strategy related to digital banking and Banking as a Service, including the Company's digital stable coin initiative and our participation in the USDF Consortium;
the ability to invest effectively in new information technology systems and platforms;
changes in future ACL requirements under relevant accounting and regulatory requirements;
the ability to pay future dividends at currently expected rates;
the ability to hire and retain key personnel;
the ability to attract new customers and retain existing ones in the manner anticipated;
changes in our customer base or in the financial or operating performances of our customers’ businesses;
any interruption in customer service due to circumstances beyond our control;
the outcome of pending or threatened litigation, or of matters before regulatory agencies, whether currently existing or commencing in the future;
environmental conditions that exist or may exist on properties owned by, leased by, or mortgaged to the Company;
any interruption or breach of security resulting in failures or disruptions in customer account management, general ledger, deposit, loan, or other systems;
operational issues stemming from, and/or capital spending necessitated by, the potential need to adapt to industry changes in information technology systems, on which we are highly dependent;
the ability to keep pace with, and implement on a timely basis, technological changes;
changes in legislation, regulation, policies, or administrative practices, whether by judicial, governmental, or legislative action, and other changes pertaining to banking, securities, taxation, rent regulation and housing (the New York Housing Stability and Tenant Protection Act of 2019), financial accounting and reporting, environmental protection, insurance, and the ability to comply with such changes in a timely manner;
changes in the monetary and fiscal policies of the U.S. Government, including policies of the U.S. Department of the Treasury and the Board of Governors of the Federal Reserve System;
changes in accounting principles, policies, practices, and guidelines;
changes in regulatory expectations relating to predictive models we use in connection with stress testing and other forecasting or in the assumptions on which such modeling and forecasting are predicated;

2


changes to federal, state, and local income tax laws;
changes in our credit ratings or in our ability to access the capital markets;
increases in our FDIC insurance premium;
legislative and regulatory initiatives related to climate change;
the potential impact to the Company from climate change including higher regulatory compliance, increased expenses, operational changes, and reputational risks;
unforeseen or catastrophic events including natural disasters, war, terrorist activities, and the emergence of a pandemic;
the effects of COVID-19, which includes, but are not limited to, the length of time that the pandemic continues, the effectiveness of the COVID-19 vaccination program, the potential imposition of further restrictions on travel or movement in the future, the remedial actions and stimulus measures adopted by federal, state, and local governments, the health of our employees and the inability of employees to work due to illness, quarantine, or government mandates, the business continuity plans of our customers and our vendors, the increased likelihood of cybersecurity risk, data breaches, or fraud due to employees working from home, the ability of our borrowers to continue to repay their loan obligations, the lack of property transactions and asset sales, potential impact on collateral values, and the effect of the pandemic on the general economy and businesses of our borrowers; and
other economic, competitive, governmental, regulatory, technological, and geopolitical factors affecting our operations, pricing, and services.

In addition, the timing and occurrence or non-occurrence of events may be subject to circumstances beyond our control.

Furthermore, on an ongoing basis, we evaluate opportunities to expand through mergers and acquisitions and opportunities for strategic combinations with other banking organizations. Our evaluation of such opportunities involves discussions with other parties, due diligence, and negotiations. As a result, we may decide to enter into definitive arrangements regarding such opportunities at any time.

In addition to the risks and challenges described above, these types of transactions involve a number of other risks and challenges, including:

The ability to successfully integrate branches and operations and to implement appropriate internal controls and regulatory functions relating to such activities;
The ability to limit the outflow of deposits, and to successfully retain and manage any loans;
The ability to attract new deposits, and to generate new interest-earning assets, in geographic areas that have not been previously served;
The success in deploying any liquidity arising from a transaction into assets bearing sufficiently high yields without incurring unacceptable credit or interest rate risk;
The ability to obtain cost savings and control incremental non-interest expense;
The ability to retain and attract appropriate personnel;
The ability to generate acceptable levels of net interest income and non-interest income, including fee income, from acquired operations;
The diversion of management’s attention from existing operations;

3


The ability to address an increase in working capital requirements; and
Limitations on the ability to successfully reposition our post-merger balance sheet when deemed appropriate.

See Part I, Item 1A, “Risk Factors” in this annual report and in our other SEC filings for a further discussion of important risk factors that could cause actual results to differ materially from our forward-looking statements.

Readers should not place undue reliance on these forward-looking statements, which reflect our expectations only as of the date of this report. We do not assume any obligation to revise or update these forward-looking statements except as may be required by law.

4


GLOSSARY

BASIS POINT

Throughout this filing, the year-over-year changes that occur in certain financial measures are reported in terms of basis points. Each basis point is equal to one hundredth of a percentage point, or 0.01%.0.01 percent.


BOOK VALUE PER COMMON SHARE

Book value per common share refers to the amount of common stockholders’ equity attributable to each outstanding share of common stock, and is calculated by dividing total stockholders’ equity less preferred stock at the end of a period, by the number of shares outstanding at the same date.

BROKERED DEPOSITS

Refers to funds obtained, directly or indirectly, by or through deposit brokers that are then deposited into one or more deposit accounts at a bank.

CHARGE-OFF

CHARGE-OFF

Refers to the amount of a loan balance that has been written off against the allowance for credit losses.

COMMERCIAL REAL ESTATE LOAN

A mortgage loan secured by either an income-producing property owned by an investor and leased primarily for commercial purposes or, to a lesser extent, an owner-occupied building used for business purposes. The CRE loans in our portfolio are typically secured by either office buildings, retail shopping centers, light industrial centers with multiple tenants, or mixed-use properties.

COST OF FUNDS

The interest expense associated with interest-bearing liabilities, typically expressed as a ratio of interest expense to the average balance of interest-bearing liabilities for a given period.

CRE CONCENTRATION RATIO

Refers to the sum of multi-family, non-owner occupied CRE, and acquisition, development, and construction (“ADC”) loans divided by total risk-based capital.

DEBT SERVICE COVERAGE RATIO

An indication of a borrower’s ability to repay a loan, the DSCR generally measures the cash flows available to a borrower over the course of a year as a percentage of the annual interest and principal payments owed during that time.

DERIVATIVE

DERIVATIVE

A term used to define a broad base of financial instruments, including swaps, options, and futures contracts, whose value is based upon, or derived from, an underlying rate, price, or index (such as interest rates, foreign currency, commodities, or prices of other financial instruments such as stocks or bonds).

EFFICIENCY RATIO

Measures total operating expenses as a percentage of the sum of net interest income and non-interest income.


5

5


GOODWILL

GOODWILL

Refers to the difference between the purchase price and the fair value of an acquired company’s assets, net of the liabilities assumed. Goodwill is reflected as an asset on the balance sheet and is tested at least annually for impairment.impairment or when triggering events are identified.

GOVERNMENT-SPONSORED ENTERPRISES

Refers to a group of financial services corporations that were created by the United States Congress to enhance the availability, and reduce the cost of, credit to certain targeted borrowing sectors, including home finance. The GSEs include, but are not limited to, the Federal National Mortgage Association (“Fannie Mae”), the Federal Home Loan Mortgage Corporation (“Freddie Mac”), and the Federal Home Loan Banks (the “FHLBs”).

GSE OBLIGATIONS

Refers to GSE mortgage-related securities (both certificates and collateralized mortgage obligations) and GSE debentures.

INTEREST RATE SENSITIVITY

Refers to the likelihood that the interest earned on assets and the interest paid on liabilities will change as a result of fluctuations in market interest rates.

INTEREST RATE SPREAD

The difference between the yield earned on average interest-earning assets and the cost of average interest-bearing liabilities.

LOAN-TO-VALUE RATIO

Measures the balance of a loan as a percentage of the appraised value of the underlying property.

MULTI-FAMILY LOAN

A mortgage loan secured by a rental or cooperative apartment building with more than four units.

NET INTEREST INCOME

The difference between the interest income generated by loans and securities and the interest expense produced by deposits and borrowed funds.

NET INTEREST MARGIN

Measures net interest income as a percentage of average interest-earning assets.

NON-ACCRUAL LOAN

A loan generally is classified as a “non-accrual” loan when it is 90 days or more past due or when it is deemed to be impaired because we no longer expect to collect all amounts due according to the contractual terms of the loan agreement. When a loan is placed on non-accrual status, we cease the accrual of interest owed, and previously accrued interest is reversed and charged against interest income. A loan generally is returned to accrual status when the loan is current and we have reasonable assurance that the loan will be fully collectible.

NON-PERFORMING LOANS AND ASSETS

Non-performing loans consist of non-accrual loans and loans that are 90 days or more past due and still accruing interest. Non-performing assets consist of non-performing loans, OREO and other repossessed assets.


6

6


OREO AND OTHER REPOSSESSED ASSETS

Includes real estate owned by the Company which was acquired either through foreclosure or default. Repossessed assets are similar, except they are not real estate-related assets.

RENT-REGULATED APARTMENTS

In New York City, where the vast majority of the properties securing our multi-family loans are located, the amount of rent that tenants may be charged on the apartments in certain buildings is restricted under rent-stabilization laws. Rent-stabilized apartments are generally located in buildings with six or more units that were built between February 1947 and January 1974. Rent-regulated apartments tend to be more affordable to live in because of the applicable regulations, and buildings with a preponderance of such rent-regulated apartments are therefore less likely to experience vacancies in times of economic adversity.

TROUBLED DEBT RESTRUCTURINGMODIFICATION

A loan for which the terms have been modified resulting in a concession, and for which the borrower is experiencing financial difficulties.

WHOLESALE BORROWINGS

Refers to advances drawn by the Bank against its line(s) of credit with the FHLBs, their repurchase agreements with the FHLBs and various brokerage firms, and federal funds purchased.

YIELD

YIELD

The interest income associated with interest-earning assets, typically expressed as a ratio of interest income to the average balance of interest-earning assets for a given period.

7


For the purpose of this Annual Report on Form 10-K, the words “we,” “us,” “our,” and the “Company” are used to refer to New York Community Bancorp, Inc. and our consolidated subsidiary, Flagstar Bank, N.A. (the “Bank”).

CAUTIONARY STATEMENT REGARDING FORWARD-LOOKING LANGUAGE
This report, like many written and oral communications presented by New York Community Bancorp, Inc. and our authorized officers, may contain certain forward-looking statements regarding our prospective performance and strategies within the meaning of Section 27A of the Securities Act of 1933, as amended, and Section 21E of the Securities Exchange Act of 1934, as amended. We intend such forward-looking statements to be covered by the safe harbor provisions for forward-looking statements contained in the Private Securities Litigation Reform Act of 1995, and are including this statement for purposes of said safe harbor provisions.

Forward-looking statements, which are based on certain assumptions and describe future plans, strategies, and expectations of the Company, are generally identified by use of the words “anticipate,” “believe,” “estimate,” “expect,” “intend,” “plan,” “project,” “seek,” “strive,” “try,” or future or conditional verbs such as “will,” “would,” “should,” “could,” “may,” or similar expressions. Although we believe that our plans, intentions, and expectations as reflected in these forward-looking statements are reasonable, we can give no assurance that they will be achieved or realized.

Our ability to predict results or the actual effects of our plans and strategies is inherently uncertain. Accordingly, actual results, performance, or achievements could differ materially from those contemplated, expressed, or implied by the forward-looking statements contained in this report.

There are a number of factors, many of which are beyond our control, that could cause actual conditions, events, or results to differ significantly from those described in our forward-looking statements. These factors include, but are not limited to:

general economic conditions, including higher inflation and its impacts, either nationally or in some or all of the areas in which we and our customers conduct our respective businesses;

7


LIST OF ABBREVIATIONS AND ACRONYMSconditions in the securities markets and real estate markets or the banking industry;

changes in real estate values, which could impact the quality of the assets securing the loans in our portfolio;
changes in interest rates, which may affect our net income, prepayment penalty income, and other future cash flows, or the market value of our assets, including our investment securities;
changes in the quality or composition of our loan or securities portfolios;
changes in our capital management policies, including those regarding business combinations, dividends, and share repurchases, among others;
heightened regulatory focus on commercial real estate and on commercial real estate loan concentrations;
changes in competitive pressures among financial institutions or from non-financial institutions;
changes in deposit flows and wholesale borrowing facilities;
changes in the demand for deposit, loan, and investment products and other financial services in the markets we serve;
our timely development of new lines of business and competitive products or services in a changing environment, and the acceptance of such products or services by our customers;
our ability to obtain timely stockholder and regulatory approvals of any merger transactions, capital raise transactions, corporate restructurings or other significant transactions we may propose;
our ability to successfully integrate any assets, liabilities, customers, systems, and management personnel we may acquire into our operations, and our ability to realize related synergies and cost savings within expected time frames, including those related to our recent acquisition of Flagstar Bancorp, Inc. and the purchase and assumption of certain assets and liabilities of Signature Bridge Bank;
changes in the estimated fair value of the assets or final settlement with the FDIC that we recorded in connection with the purchase, assumption and ongoing servicing of certain assets and liabilities of Signature Bridge Bank;
potential exposure to unknown or contingent liabilities of companies we have acquired, may acquire, or target for acquisition, including our recent acquisition of Flagstar Bancorp, Inc. and the purchase and assumption of certain assets and liabilities of Signature Bridge Bank;
the ability to invest effectively in new information technology systems and platforms;
the more stringent regulatory framework and prudential standards we are subject to, including with respect to reporting, capital stress testing, and liquidity risk management, as a result of our transition to a Category IV banking organization, and the expenses we will incur to develop policies, programs, and systems that comply with these enhanced standards;
changes in future allowance for credit losses requirements under relevant accounting and regulatory requirements;

8


the ability to pay future dividends, including as a result of the failure to receive any required regulatory approval to pay a dividend, or for any other reasons;
the ability to hire and retain key personnel and qualified members of our board of directors;
the ability to attract new customers and retain existing ones in the manner anticipated;
changes in our customer base or in the financial or operating performances of our customers’ businesses;
any interruption in customer service due to circumstances beyond our control;
the outcome of pending or threatened litigation, or of investigations or any other matters before regulatory agencies, whether currently existing or commencing in the future, including with respect to any litigation, investigation or other regulatory actions related to (i) the business practices of acquired companies, including our recent acquisition of Flagstar Bancorp, Inc. and the purchase and assumption of certain assets and liabilities of Signature Bridge Bank and (ii) the capital raise transaction we completed in March of 2024;
environmental conditions that exist or may exist on properties owned by, leased by, or mortgaged to the Company;
cybersecurity incidents, including any interruption or breach of security resulting in failures or disruptions in customer account management, general ledger, deposit, loan, or other systems managed either by us or third parties;
operational issues stemming from, and/or capital spending necessitated by, the potential need to adapt to industry changes in information technology systems, on which we are highly dependent;
the ability to keep pace with, and implement on a timely basis, technological changes;
changes in legislation, regulation, policies, guidance, or administrative practices, whether by judicial, governmental, or legislative action, and other changes pertaining to banking, securities, taxation, rent regulation and housing (the New York Housing Stability and Tenant Protection Act of 2019), financial accounting and reporting, environmental protection, insurance, and the ability to comply with such changes in a timely manner;
changes in the monetary and fiscal policies of the U.S. Government, including policies of the U.S. Department of the Treasury and the Board of Governors of the Federal Reserve System;
changes in accounting principles, policies, practices, and guidelines;
changes in regulatory expectations relating to predictive models we use in connection with stress testing and other forecasting or in the assumptions on which such modeling and forecasting are predicated;
changes to federal, state, and local income tax laws;
changes in our credit ratings or in our ability to access the capital markets;
increases in our FDIC insurance premium;
legislative and regulatory initiatives related to climate change;
the potential impact to the Company from climate change, including higher regulatory compliance, increased expenses, operational changes, and reputational risks;
unforeseen or catastrophic events including natural disasters, war, terrorist activities, and pandemics, epidemics, and other health emergencies;
the impacts related to or resulting from Russia’s military action in Ukraine and conflicts in the Middle East, including the broader impacts to financial markets and the global macroeconomic and geopolitical environment; and
other economic, competitive, governmental, regulatory, technological, and geopolitical factors affecting our operations, pricing, and services.

In addition, the timing and occurrence or non-occurrence of events may be subject to circumstances beyond our control.

Furthermore, on an ongoing basis, we evaluate opportunities to expand through mergers and acquisitions and opportunities for strategic combinations with other banking organizations. Our evaluation of such opportunities involves discussions with other parties, due diligence, and negotiations. As a result, we may decide to enter into definitive arrangements regarding such opportunities at any time.

In addition to the risks and challenges described above, these types of transactions involve a number of other risks and challenges, including:

the ability to successfully integrate branches and operations and to implement appropriate internal controls and regulatory functions relating to such activities;
the ability to limit the outflow of deposits, and to successfully retain and manage any loans;
the ability to attract new deposits, and to generate new interest-earning assets, in geographic areas that have not been previously served;
our ability to effectively manage liquidity, including our success in deploying any liquidity arising from a transaction into assets bearing sufficiently high yields without incurring unacceptable credit or interest rate risk;
the ability to obtain cost savings and control incremental non-interest expense;
the ability to retain and attract appropriate personnel;

9


the ability to generate acceptable levels of net interest income and non-interest income, including fee income, from acquired operations;
the diversion of management’s attention from existing operations;
the ability to address an increase in working capital requirements; and
limitations on the ability to successfully reposition our post-merger balance sheet when deemed appropriate.

See Part I, Item 1A, "Risk Factors", in this annual report and in our other SEC filings for a further discussion of important risk factors that could cause actual results to differ materially from our forward-looking statements.

Readers should not place undue reliance on these forward-looking statements, which reflect our expectations only as of the date of this report. We do not assume any obligation to revise or update these forward-looking statements except as may be required by law.

10


PART I

ACL—Allowance for Credit LossesItem 1.

Business

FDIC—Federal Deposit Insurance Corporation

ADC—Acquisition, development, and construction loan

FHLB—Federal Home Loan Bank

ALCO—Asset and Liability Management Committee

FHLB-NY—Federal Home Loan Bank of New York

AMT—Alternative minimum tax

FOMC—Federal Open Market Committee

AOCL—Accumulated other comprehensive loss

FRB—Federal Reserve Board

ASC—Accounting Standards Codification

FRB-NY—Federal Reserve Bank of New York

ASU—Accounting Standards Update

Freddie Mac—Federal Home Loan Mortgage Corporation

BaaS—Banking as a Service

FTEs—Full-time equivalent employees

BOLI—Bank-owned life insurance

GAAP—U.S. generally accepted accounting principles

BP—Basis point(s)

GLBA—The Gramm Leach Bliley Act

CARES Act – Coronavirus Aid, Relief, and Economic Security Act

GNMA—Government National Mortgage Association

C&I—Commercial and industrial loan

GSE—Government-sponsored enterprises

CDs—Certificates of deposit

LIBOR—London Interbank Offered Rate

CECL—Current Expected Credit Loss

LTV—Loan-to-value ratio

CFPB—Consumer Financial Protection Bureau

MBS—Mortgage-backed securities

CMOs—Collateralized mortgage obligations

MSRs—Mortgage servicing rights

CMT—Constant maturity treasury rate

NIM—Net interest margin

CPI—Consumer Price Index

NOL—Net operating loss

CPR—Constant prepayment rate

NPAs—Non-performing assets

CRA—Community Reinvestment Act

NPLs—Non-performing loans

CRE—Commercial real estate loan

NPV—Net Portfolio Value

DIF—Deposit Insurance Fund

NYSDFS—New York State Department of Financial Services

DFA—Dodd-Frank Wall Street Reform and Consumer Protection Act

NYSE—New York Stock Exchange

DSCR - Debt service coverage ratio

OCC—Office of the Comptroller of the Currency

EAR—Earnings at Risk

OFAC—Office of Foreign Assets Control

EPS—Earnings per common share

OREO—Other real estate owned

ERM—Enterprise Risk Management

OTTI—Other-than-temporary impairment

ESOP—Employee Stock Ownership Plan

PPP—Paycheck Protection Program administered by the Small Business Administration

EVE—Economic Value of Equity at Risk

ROU—Right of use asset

Fannie Mae—Federal National Mortgage Association

SEC—U.S. Securities and Exchange Commission

FASB—Financial Accounting Standards Board

SIFI—Systemically Important Financial Institution

FCA—the United Kingdom's Financial Conduct Authority

SOFR—Secured Overnight Financing Rate

FDI Act—Federal Deposit Insurance Act

TDR—Troubled debt restructurings


General
8


PART I

ITEM 1. BUSINESS

General

New York Community Bancorp, Inc., (on a stand-alone basis, the “Parent Company” or, collectively with its subsidiaries, the “Company”) was organized under Delaware law on July 20, 1993 and is the bank holding company for New York CommunityFlagstar Bank, N.A. (hereinafter referred to as the “Bank”). FormerlyThe Company went public in 1993 and has grown organically and through a series of accretive mergers and acquisitions. Effective as of December 1, 2022, in connection with the Parent Company’s acquisition of Flagstar Bancorp, (i) Flagstar Bank, FSB converted to a national bank to be known as Queens County Savings“Flagstar Bank, the Bank converted from a state-chartered mutual savings bank to the capital stock form of ownership on November 23, 1993, at which date the Company completed its initial offering of common stock (par value: $0.01 per share) at a price of $25.00 per share ($0.93 per share on a split-adjusted basis, reflecting the impact of nine stock splits between 1994N.A.” and 2004).

(ii) New York Community Bank

Established in 1859, was merged with and into Flagstar Bank N.A., with Flagstar Bank N.A. continuing as the Bank is a surviving entity.


New York State-chartered savings bank with 237 branches that currently operates through eight local divisions: Queens County Savings Bank, Roslyn Savings Bank, Richmond County Savings Bank, Roosevelt Savings Bank,Community Bancorp, Inc. has market-leading positions in several national businesses, including multi-family lending, mortgage originations and Atlantic Bankservicing, and warehouse lending. The Company is the 2nd largest multi-family portfolio lender in New York; Garden State Community Bankthe country and the leading multi-family portfolio lender in New Jersey; Ohio Savings Bank in Ohio: and AmTrust Bank in Florida and Arizona. We compete for depositors in these diverse markets by emphasizing service and convenience, with a comprehensive menu of products and services, and access to multiple service channels, including online banking, mobile banking, and banking by phone.

We are a leading producer of multi-family loans inthe New York City market area, where it specializes in rent-regulated, non-luxury apartment buildings. Flagstar Mortgage is the 7th largest bank originator of residential mortgages for the 12-months ended December 31, 2023, while we are the industry’s 5th largest sub-servicer of mortgage loans nationwide, servicing 1.4 million accounts with an emphasis$382.2 billion in unpaid principal balances as of December 31, 2023. Additionally, the Company is the 2nd largest mortgage warehouse lender nationally based on non-luxury residential apartment buildings with rent-regulated units that feature rents that are below non-regulated units. In addition to multi-family loans, which are our principal asset, we originate CRE loans (primarily in New York City), specialty finance loans and leases, and, to a much lesser extent, ADC loans, and C&I loans (typically made to small and mid-size business in Metro New York).total commitments.


Online Information about the Company and the Bank

We serve our customers through our website: www.myNYCB.com.www.flagstar.com. In addition to providing our customers with 24-hour access to their accounts, and information regarding our products and services, hours of service, and locations, the website provides extensive information about the Company for the investment community. Earnings releases, dividend announcements, and other press releases are posted upon issuance to the Investor Relations portion of the website, which can be found at www.ir.myNYCB.com.

In addition, our filings with the SEC (including our annual report on Form 10-K; our quarterly reports on Form 10-Q; and our current reports on Form 8-K), and all amendments to those reports filed or furnished pursuant to Section 13(a) or 15(d) of the Securities Exchange Act of 1934, are available without charge, and are posted to the Investor Relations portion of our website. The website also provides information regarding our Board of Directors and management team, as well as certain Board Committee charters and our corporate governance policies. The content of our website shall not be deemed to be incorporated by reference into this Annual Report.

Our Market

Our current market for deposits consists of the 26 counties

Flagstar Bank, N.A. operates 420 branches including strong footholds in the five states that are served by our branchNortheast and Midwest and exposure to high growth markets in the Southeast and West Coast. Flagstar Mortgage operates nationally through a wholesale network including all five boroughs of approximately 3,000 third-party mortgage originators. In addition, the Bank has 134 private banking teams located in over 10 cities in the metropolitan New York City Nassauregion and Suffolk Counties on Long Island,the West Coast, which serve the needs of high-net worth individuals and Westchester County in New York; Essex, Hudson, Mercer, Middlesex, Monmouth, Ocean, and Union Counties in New Jersey; Maricopa and Yavapai Counties in Arizona; Cuyahoga, Lake, and Summit Counties in Ohio; and Broward, Collier, Lee, Miami-Dade, Palm Beach, and St. Lucie Counties in Florida.their businesses.

The market for the loans we produce varies, depending on the type of loan. For example, the vast majority of our multi-family loans are collateralized by rental apartment buildings in New York City, which is also home towhile the majority of the properties collateralizing our CRE and ADC loans. In contrast, ourloans are located in the Northeast and Midwest. Our specialty finance loans and leases are generally made to large corporate obligors that participate in stable industries nationwide.nationwide and our warehouse loans are made to mortgage lenders across the country.

9


Competition for Deposits

The combined population of the 26 counties where our branches are located is approximately 31.7 million, and the number of banks and thrifts we compete with currently exceeds 350. With total deposits of $35.1 billion at December 31, 2021, we ranked in the top 20 among all bank and thrift depositories serving these 26 counties. We also ranked third among all banks and thrifts in Richmond County in New York, fifth among all banks and thrifts in Queens County in New York, and second among all banks and thrifts in Nassau County in New York (market share information was provided by S&P Global Market Intelligence).

We compete for deposits and customers by placing an emphasis on convenience and service and, from time to time, by offering specific products at highly competitive rates. In addition to our 237420 branches, we have 333 385 ATM locations including 220 that operate 24 hours a day and 66 that are off-site ATMs.. Our customers also have 24-hour access to their accounts through our mobile banking app, online through our website, www.myNYCB.comwww.flagstar.com, or through our bank-by-phone service. We also offer certain money market accounts, certificates of deposit (“CDs”), and checking accounts through a dedicated website: www.myBankingDirect.com.


11


In addition to checking and savings accounts, retirement accounts, and CDs for both businesses and consumers, we offer a suite of cash management products to address the needs of small and mid-size businesses and professional associations. We also compete by complementing our broad selection of traditional banking products with an extensive menu of non-deposit investment products and insurance through a relationship with a third-party broker dealer and insurance agency.

Our ability to attract and retain deposits is not only a function of short-term interest rates and industry consolidation, but also the competitiveness of the rates being offered by other financial institutions within our marketplace, including credit unions, on-lineonline banks, and brokerage firms. Additionally, financial technology companies, also referred to as FinTechs, are providing nontraditional, but increasingly strong competition for deposits and customers.

Competition for deposits is also influenced by several internal factors, including the opportunity to assume or acquire deposits through business combinations; the cash flows produced through loan and securities repayments and sales; and the availability of attractively priced wholesale funds. In addition, the degree to which we seek to compete for deposits is influenced by the liquidity needed to fund our loan production and other outstanding commitments.

One of our competitive advantages is our strong community presence and commitment to providing a high level of customer service in each of our markets. In 2021, the Bank was named the number one bank in the country for best overall customer experience based on a survey conducted by American Banker and creative experience firm Monigle.

Competition for Commercial and Consumer Loans and Servicing

Our success as a lender is substantially tied to the economic health of the markets where we lend. Local economic conditions have a significant impact on loan demand, the value of the collateral securing our credits, and the ability of our borrowers to repay their loans.

The competition we face for loans also varies with the type of loan we are originating. In New York City, where the majority of the buildings collateralizing our multi-family loans are located, we compete for such loans on the basis of timely service and the expertise that stems from being a specialist in this lending niche. In addition to the money center, regional, and local banks we compete with in this market, we compete with insurance companies and other types of lenders. Certain of the banks we compete with sell the loans they produce to Fannie Mae and Freddie Mac.

Our ability to compete for CRE loans depends on the same factors that impact our ability to compete for multi-family credits, and the degree to which other CRE lenders choose to offer loan products similar to ours.

Competition for our specialty finance loans, which consist primarily of asset-based, equipment financing, and dealer floor plan loans, is driven by a variety of factors, including prevailing economic conditions and the level of interest rates. Moreover, since a majority of our customers in this category are mid-to-large size publicly traded companies, we also face competition for financing from the capital markets. In addition, the majority of specialty

10


finance loans that we originate are sourced from larger financial institutions who have many customers for these loans. Some of these customers are larger and have more capital and liquidity than the Company.


While

From a lending perspective, we continuecompete with many institutions including commercial banks, national mortgage lenders, local savings banks, financial technology companies, credit unions and commercial lenders offering mortgage loans and other consumer loans.

In servicing, we compete primarily against non-bank servicers. The subservicing market in which we operate is also highly competitive and we face competition related to originate ADCsubservicing pricing and C&Iservice delivery. We compete by offering quality servicing, a robust risk and compliance infrastructure and a model where our mortgage business allows for recapture services to replenish loans for investment, such loans represent a small portion of our loan portfolio as compared to multi-family, CRE loans, and specialty finance loans.subservicing clients.

Monetary Policy

The Company and the Bank are affected by fiscal and monetary policies of the federal government, including those of the FRB which regulates the national money supply in order to mitigate recessionary and inflationary pressures. Among the techniques available to the FRB are engaging in open market transactions of U.S. Government securities, changing the discount rate and changing reserve requirements against bank deposits. These techniques are used in varying combinations to influence the overall growth of bank loans, investments, and deposits. Their use may also affect interest rates charged on loans and paid on deposits. The effect of government policies on the earnings of the Company and the Bank cannot be predicted.


12


Environmental Issues

We encounter certain environmental risks in our lending activities and other operations. The existence of hazardous materials may make it unattractive for a lender to foreclose on the properties securing its loans. In addition, under certain conditions, lenders may become liable for the costs of cleaning up hazardous materials found on such properties. We attempt to mitigate such environmental risks by requiring either that a borrower purchase environmental insurance or that an appropriate environmental site assessment be completed as part of our underwriting review on the initial granting of CRE and ADC loans, regardless of location, and of any out-of-state multi-family loans we may produce. Depending on the results of an assessment, appropriate measures are taken to address the identified risks. In addition, we order an updated environmental analysis prior to foreclosing on such properties, and typically hold foreclosed multi-family, CRE, and ADC properties in subsidiaries.

Our attention to environmental risks also applies to the properties and facilities that house our bank operations. Prior to acquiring a large-scale property, a Phase 1 Environmental Property Assessment is typically performed by a licensed professional engineer to determine the integrity of, and/or the potential risk associated with, the facility and the property on which it is built. Properties and facilities of a smaller scale are evaluated by qualified in-house assessors, as well as by industry experts in environmental testing and remediation. This two-pronged approach identifies potential risks associated with asbestos-containing material, above and underground storage tanks, radon, electrical transformers (which may contain PCBs), ground water flow, storm and sanitary discharge, and mold, among other environmental risks. These processes assist us in mitigating environmental risk by enabling us to identify and address potential issues, including by avoiding taking ownership or control of contaminated properties.

Subsidiary Activities

We conduct business primarily through our wholly-owned bank subsidiary, Flagstar Bank, N.A. The Bank has formed, or acquired through merger transactions, 1939 active subsidiary corporations.subsidiaries. Of these, 1126 are direct subsidiaries of the Bank and eight13 are subsidiaries of Bank-owned entities.

11


The 11Parent Company also has four direct subsidiaries of the(including Flagstar Bank, are:

Name

Jurisdiction of Organization

Purpose

100 Duffy Realty, LLC

New York

Owns a building containing back-office and a branch.

Beta Investments, Inc.

Delaware

Holding company for Omega Commercial Mortgage Corp. and Long Island Commercial Capital Corp.

BSR 1400 Corp.

New York

Organized to own interests in real estate.

Ferry Development Holding Company

Delaware

Formed to hold and manage investment portfolios for the Company.

NYCB Specialty Finance Company, LLC

Delaware

Originates asset-based, equipment financing, and dealer-floor plan loans.

NYB Realty Holding Company, LLC

New York

Holding company for subsidiaries owning an interest in real estate.

NYCB Insurance Agency, Inc.

New York

Sells non-deposit investment products.

Pacific Urban Renewal, Inc.

New Jersey

Owns a branch building.

Synergy Capital Investments, Inc.

New Jersey

Formed to hold and manage investment portfolios for the Company.

NYCB Mortgage Company, LLC

Delaware

Holding company for Walnut Realty Holding Company, LLC.

Woodhaven Investments, LLC

Delaware

Holding company for Ironbound Investment Company, LLC. and 1400 Corp.

The eight subsidiaries of Bank-owned entities are:

Name

Jurisdiction of Organization

Purpose

1400 Corp.

New York

Holding company for Roslyn Real Estate Asset Corp.

Ironbound Investment Company, LLC.

Florida

Organized for the purpose of investing in mortgage-related assets.

Long Island Commercial Capital Corporation

New York

A REIT organized for the purpose of investing in mortgage-related assets.

Omega Commercial Mortgage Corp.

Delaware

A REIT organized for the purpose of investing in mortgage-related assets.

Prospect Realty Holding Company, LLC

New York

Owns a back-office building.

Rational Real Estate II, LLC

New York

Owns a back-office building.

Roslyn Real Estate Asset Corp.

Delaware

A REIT organized for the purpose of investing in mortgage-related assets.

Walnut Realty Holding Company, LLC

Delaware

Owns two back-office buildings.

N.A). NYB Realty Holding Company, LLC, a subsidiary of the Bank, owns interests in ten10 additional active entities organized as indirect wholly-owned subsidiaries to own interests in various real estate properties.


The Parent Company owns special business trusts that were formed for the purpose of issuing capital and common securities and investing the proceeds thereof in the junior subordinated debentures issued by the Company. See Note 9, “Borrowed12 - Borrowed Funds, in Item 8, “Financial Statements and Supplementary Data,” for a further discussion of the Company’s special business trusts. The Parent Company also has one non-banking subsidiary that was established in connection with the acquisition of Atlantic Bank of New York.York and two non-banking insurance subsidiaries that were acquired in connection with the Flagstar acquisition.

Human Capital Management

At December 31, 2021,2023, our workforce included 2,815 employees, including 1,493 retail employees and 1,322 back office8,766 employees. None of our employees are represented by a collective bargaining agreement. Weagreement and we believe our employee relations to be good.in good standing.

12


We believe our employees are among our most significant resources and that our employees are critical to our continued success. We focus significant attention on attracting and retaining talented and experienced individuals to manage and support our operations. We pay our employees competitively and offer a broad range of benefits, both of which we believe are competitive with our industry peers and with other firms in the locations in which we do business. Our employees receive salaries that are subject to annual review and periodic benchmarking. Our benefits program includes a 401(k) Plan with an employer matching contribution, healthcare and other insurance benefits, flexible spending accounts and paid time off. Many of our employees are also eligible to participate in the Company’s equity award program and the Company's annual incentive program.

We are proud to strive to maintain a diverse and inclusive workforce that reflects the demographics of the communities in which we do business. Our company recognizes that the talents of a diverse workforce are a key competitive advantage. To increase diversity within our talent pool, we work with key stakeholders in our business locations to deepen our understanding of the local labor market and better position the organization to recruit and retain talent within under-represented communities.

We strive to create and foster a supportive environment for all of our employees, and we are proud to share our business success with individuals whose cultural and personal differences support an innovative and productive workplace. OurApproximately two-thirds of our workforce is 33% male and 67% female and women represent 47% of the Company’s leadership (defined to include employees at the level of vice president and above). In addition, for those employees identifying as such, approximately 49%nearly half of our workforce have diverse ethnic backgrounds. Our policies and practices reflect our commitment to diversity and inclusion in the workplace.

13


A diverse workforce is critical to our long-term success. We strive to build and leverage a diverse, inclusive and engaged workforce that inspires all individuals to work together towards a common goal of superior business results by embracing the unique needs and objectives of our customers and community. We strive to achieve this by hiring great people who represent the talents, experiences, background and diversity of the communities we serve. Our commitment is reflected in the policies that govern our workforce, such as our Diversity Pledge and our Diversity, Equity and Inclusion Policy, and is evidenced in our recruiting strategies, diversity and inclusion training and Employee resource groups, which are key to our efforts. Our Employee resource groups provide our associates access to coaching, mentoring and professional development. As of December 31, 2023, our efforts have been focused on the following eleven employee resource groups which we intend to expand across our recently combined Company: African American, Asian-Indian, Environmental, Hispanic/Latino, Interfaith, LGBTQ, Military Veterans, Native American, People with Disabilities, Women and Young Professionals.

Our management teams and all of our employees are expected to exhibit and promote honest, ethical and respectful conduct in the workplace. All of our employees must adhere to a code of conduct that sets standards for appropriate behavior and all employees are required to complete annual training that focuses on preventing, identifying, reporting and stopping any type of unlawful discrimination.

The health and safety of our employees is also of critical importance. In response to the ongoing COVID-19 pandemic, we have implemented a flexible response plan that includes the transitioning of certain back office employees to a remote work model, as conditions warrant while implementing additional safety protocols for employees who, due to the nature of their positions, continue to work on-site. We maintain strict compliance with federal, state and local requirements that enhance workplace safety, such as masking and social distancing, and we provide employees who either contract or are exposed to COVID-19 with appropriate leave.

Federal, State, and Local Taxation

The Company is subject to federal, state, and local income taxes. See the discussion of "Income Taxes" in Note 2 "Summary- Summary of Significant Accounting Policies."Policies

Regulation and Supervision

The following is a brief summary of certain statutes and regulations that significantly affect the Company and its subsidiaries. A number of other statutes and regulations may affect the Company and the Bank but are not discussed in the following paragraphs.

General
General

The Bank is a New York State-chartered savings banknational banking association, subject to federal regulation and its deposit accountsoversight by the OCC. The activities of the Bank are insuredlimited to those specifically authorized under the DIFNational Bank Act and related interpretations of the FDIC upOCC. The OCC has authority to applicable legal limits. For the fiscal year ended December 31, 2021,bring an enforcement action against the Bank wasfor unsafe or unsound banking practices, which could include limiting the Bank’s ability to conduct otherwise permissible activities, or imposing corrective capital or managerial requirements on the bank. We are also subject to regulation and supervision by the NYSDFS, as its chartering agency;examination by the FDIC, as primary federal supervisor for all state-chartered banks and savings institutions that are not memberswhich insures the deposits of the Federal Reserve SystemBank to the extent permitted by law and the requirements established by the CFPB.

Federal Reserve. The Bank is requiredalso subject to file reports with the NYSDFS,supervision of the CFPB, which regulates the offering and provision of consumer financial products or services under federal consumer financial laws. The OCC, FDIC and the CFPB concerning itsmay take regulatory enforcement actions if we do not operate in accordance with applicable regulations, policies and directives. Proceedings may be instituted against us, or any "institution-affiliated party", such as a director, officer, employee, agent or controlling person, who engages in unsafe and unsound practices, including violations of applicable laws and regulations. The FDIC has additional authority to terminate insurance of accounts, if after notice and hearing, we are found to have engaged in unsafe and unsound practices, including violations of applicable laws and regulations. The federal system of regulation and supervision establishes a comprehensive framework of activities and financial condition,in which to operate and is periodically examined byprimarily intended for the NYSDFS, the FDIC,protection of depositors and the CFPB to assess compliance with various regulatory requirements, including with respect to safety and soundness and consumer financial protection regulations. The regulatory structure gives the regulatory authorities extensive discretion in connection with their supervisory and enforcement activities and examination policies, including policies with respect to the classificationFDIC's DIF rather than our shareholders.

13


of assets and the establishment of an adequate allowance for credit losses on loans and leases for regulatory purposes. Changes in such regulations or in banking legislation could have

As a material impact on the Company, the Bank, and their operations, as well as the Company’s stockholders.

The Company is subject to examination, regulation, and periodic reporting under the Bank Holding Company Act of 1956, as amended (the “BHCA”) by the FRB. Furthermore, the Company would be required to obtain the prior approval of the FRB to acquire all, or substantially all, of the assets of any bank or bank holding company.

In addition, the Company is periodically examined by the FRB-NY, and iscompany, we are required to file certain reports under, and otherwise comply with the rules and regulations of the SEC underFederal Reserve. We are required to file certain reports, and we are subject to examination by, and the enforcement authority of, the Federal Reserve. Under the federal securities laws. Certainlaws, we are also subject to the rules and regulations of the regulatory requirements applicableSEC.


Any change to the Bank and the Company are referred to below or elsewhere herein. However, such discussion is not meant to be a complete explanation of all laws and regulations, and is qualified in its entiretywhether by reference to the actual laws and regulations.Regulatory Agencies or Congress, could have a materially adverse impact on our operations.


14


The Dodd-Frank Wall Street Reform and Consumer Protection Act

Enacted in July 2010, the DFA significantly changed the bank regulatory structure and will continue to affect, into the immediate future, the lending and investment activities and general operations of depository institutions and their holding companies. The DFA is complex and comprehensive legislation that impacts practically all aspects of a banking organization, and represents a significant overhaul of many aspects of the regulation of the financial services industry.


The New York Housing Stability and Tenant Protection Act of 2019

On June 14,

In 2019, the New York State Legislature passed the Housing Stability and Tenant Protection Act of 2019 impacting about one million rent-regulated apartment units. Among other things, the new legislation: (i) curtails rent increases from material capital improvements and Individual Apartment Improvements; (ii) all but eliminates the ability for apartments to exit rent regulation; (iii) does away with vacancy decontrol and high income deregulation; and (iv) repealed the 20%20 percent vacancy bonus. While it will take several years for its full impact to be known, the legislation generally limits a landlord’s ability to increase rents on rent-regulated apartments and makes it more difficult to convert rent regulated apartments to market rent apartments.

Capital Requirements

In early July 2013, the FRB and the FDIC approved revisions to their capital adequacy guidelines and prompt corrective action rules to implement the revised standards of the Basel Committee on Banking Supervision, commonly called Basel III, and to address relevant provisions of the DFA. Basel III generally refers to two consultative documents released by the Basel Committee on Banking Supervision in December 2009. The Basel III rules generally refer to the rules adopted by U.S. banking regulators in December 2010 to align U.S. bank capital requirements with Basel III and with the related loss absorbency rules they issued in January 2011, which include significant changes to bank capital, leverage, and liquidity requirements.

The Basel III rules include new risk-based capital and leverage ratios, which became effective January 1, 2015, and revised the definition of what constitutes “capital” for the purposes of calculating those ratios. Under Basel III, the Company and the Bank are required to maintain minimum capital in accordance with the following ratios: (i) a common equity tier 1 capital ratio of 4.5%;4.5 percent; (ii) a tier 1 capital ratio of 6%6 percent (increased from 4%)4 percent); (iii) a total capital ratio of 8%8 percent (unchanged from the prior rules); and (iv) a tier 1 leverage ratio of 4%.4 percent.

In addition, the Basel III rules assign higher risk weights to certain assets, such as the 150%150 percent risk weighting assigned to exposures that are more than 90 days past due or are on non-accrual status, and to certain CRE facilities that finance the acquisition, development, or construction of real property. Basel III also eliminate the inclusion of certain instruments, such as trust preferred securities, from tier 1 capital. In addition, tier 2 capital is no longer limited to the amount of tier 1 capital included in total capital. Mortgage servicing rights, certain deferred tax assets, and investments in unconsolidated subsidiaries over designated percentages of common stock are required, subject to limitation, to be deducted from capital. Finally, tier 1 capital includes accumulated other comprehensive income, which includes all unrealized gains and losses on available-for-sale securities.

14


Basel III also established a “capital conservation buffer” (consisting entirely of common equity tier 1 capital) that is 2.5%2.5 percent above the new regulatory minimum capital requirements. This resulted in an increase in the minimum common equity tier 1, tier 1, and total capital ratios to 7.0%, 8.5%,7.0 percent, 8.5 percent, and 10.5%,10.5 percent, respectively. The capital conservation buffer is now at its fully phased-in level of 2.5%.2.5 percent. An institution can be subject to limitations on paying dividends, engaging in share repurchases, and paying discretionary bonuses if its capital levels fall below these amounts. Basel III also establish a maximum percentage of eligible retained income that can be utilized for such capital distributions.

On September 17, 2019, the FRB, the FDIC, and the OCC issued a final rule designed to reduce regulatory burden by simplifying several requirements in the agencies’ regulatory capital rule. Most aspects of the rule apply only to banking organizations that are not subject to the “advanced approaches” in the capital rule, which are generally firms with less than $250$250.0 billion in total consolidated assets and less than $10$10.0 billion in total foreign exposure. The rule simplifies and clarifies a number of the more complex aspects of the existing capital rule. Specifically, the rule simplifies the capital treatment for certain mortgage servicing assets, certain deferred tax assets, investments in the capital instruments of unconsolidated financial institutions, and minority interests.


15


Prompt Corrective Regulatory Action

The Federal Deposit Insurance Corporation Improvement Act of 1991 (“FDICIA”) requires, among other things, that federal bank regulatory authorities take “prompt corrective action” with respect to institutions that do not meet minimum capital requirements. For such purposes, the law establishes five capital tiers: well capitalized, adequately capitalized, undercapitalized, significantly undercapitalized, and critically undercapitalized. The five capital tiers are described in more detail below. Under the prompt corrective action regulations, an institution that fails to remain “well capitalized” becomes subject to a series of restrictions that increase in severity as its capital condition weakens. Such restrictions may include a prohibition on capital distributions, restrictions on asset growth, or restrictions on the ability to receive regulatory approval of applications. The FDICIA also provides for enhanced supervision authority over undercapitalized institutions, including authority for the appointment of a conservator or receiver for the institution.

As a result of the Basel III rules, new definitions of the relevant measures for the five capital categories took effect on January 1, 2015. An institution is deemed to be “well capitalized” if it has a total risk-based capital ratio of 10%10 percent or greater, a tier 1 risk-based capital ratio of 8%8 percent or greater, a common equity tier 1 risk-based capital ratio of 6.5%6.5 percent or greater, and a tier 1 leverage ratio of 5%5 percent or greater, and is not subject to a regulatory order, agreement, or directive to meet and maintain a specific capital level for any capital measure.

An institution is deemed to be “adequately capitalized” if it has a total risk-based capital ratio of 8%8 percent or greater, a tier 1 risk-based capital ratio of 6%6 percent or greater, a common equity tier 1 risk-based capital ratio of 4.5%4.5 percent or greater, and a tier 1 leverage ratio of 4%4 percent or greater.

An institution is deemed to be “undercapitalized” if it has a total risk-based capital ratio of less than 8%,8 percent, a tier 1 risk-based capital ratio of less than 6%,6 percent, a common equity tier 1 risk-based capital ratio of less than 4.5%,4.5 percent, or a tier 1 leverage ratio of less than 4%.4 percent. An institution is deemed to be “significantly undercapitalized” if it has a total risk-based capital ratio of less than 6%,6 percent, a tier 1 risk-based capital ratio of less than 4%,4 percent, a common equity tier 1 risk-based capital ratio of less than 3%,3 percent, or a tier 1 leverage ratio of less than 3%.3 percent. An institution is deemed to be “critically undercapitalized” if it has a ratio of tangible equity (as defined in the regulations) to total assets that is equal to or less than 2%.2 percent.

“Undercapitalized” institutions are subject to growth, capital distribution (including dividend), and other limitations, and are required to submit a capital restoration plan. An institution’s compliance with such a plan is required to be guaranteed by any company that controls the undercapitalized institution in an amount equal to the lesser of 5%5 percent of the bank’s total assets when deemed undercapitalized or the amount necessary to achieve the status of adequately capitalized. If an undercapitalized institution fails to submit an acceptable plan, it is treated as if it is “significantly undercapitalized.” Significantly undercapitalized institutions are subject to one or more additional restrictions including, but not limited to, an order by the FDIC to sell sufficient voting stock to become adequately capitalized; requirements to reduce total assets, cease receipt of deposits from correspondent banks, or dismiss directors or officers; and restrictions on interest rates paid on deposits, compensation of executive officers, and capital distributions by the parent holding company.

15


Beginning 60 days after becoming “critically undercapitalized,” critically undercapitalized institutions also may not make any payment of principal or interest on certain subordinated debt, extend credit for a highly leveraged transaction, or enter into any material transaction outside the ordinary course of business. In addition, subject to a narrow exception, the appointment of a receiver is required for a critically undercapitalized institution within 270 days after it obtains such status.

Failure to meet minimum capital requirements can initiate certain mandatory, and possibly additional discretionary, actions by regulators that could have a material effect on the Consolidated Financial Statements. For additional information, see

the Capital section of the MD&A and Note 17 - Capital. As of December 31, 2021,2023, each of the Bank’s capital ratios exceeded those required for an institution to be considered “well capitalized” under these regulations.


Enhanced Stress Testing and Prudential Standards

As a result of the Signature transaction, our total assets exceeded $100 billion and therefore we became classified as a Category IV banking organization under the rules issued by the federal banking agencies that tailor the application of enhanced prudential standards to large bank holding companies and the capital and liquidity rules to large bank holding companies and depository institutions under the Dodd-Frank Act and the Economic Growth, Regulatory Relief, and Consumer Protection Act. As a Category IV banking organization, we are subject to enhanced liquidity risk management requirements which include

16


reporting, liquidity stress testing, a liquidity buffer and resolution planning, subject to the applicable transition periods. If we were to meet or exceed certain other thresholds for asset size, we would become subject to additional requirements.

As a Category IV banking organization, we are subject to risk committee and risk management requirements, as well as capital planning, liquidity risk management, liquidity buffer and liquidity stress testing requirements.

Stress Testing for Category IV U.S. Banking Organizations

In 2019, the Board of Governors of the Federal Reserve System (the “Board”) finalized a framework that sorts large banking organizations into one of four categories of prudential standards based on their risk profiles (the “tailoring rule”). The most stringent prudential standards apply under Category I (defined as U.S. Global Systemically Important Banks and their depository institution subsidiaries), and the least stringent prudential standards apply under Category IV (defined as U.S. banking organizations with $100$100.0 billion or more but less than $250$250.0 billion in total assets and have less than $75$75.0 billion in cross-jurisdictional activity, weighted short-term wholesale funding, nonbank assets, or off-balance sheet exposure).

In January 2021, the Board finalized a rule to update capital planning requirements for large banks to be consistent with the tailoring rule. The Board's capital planning requirements for large banks help ensure they plan for and determine their capital needs under a range of different scenarios. The rule removes the company-run stress test requirement for banking organizations subject to Category IV standards. Therefore, banking organizations subject to Category IV standards are not required to calculate forward-looking projections of capital under scenarios provided by the Board.

The rule also aligns the frequency of the calculation of the stress capital buffer requirement with the frequency of the supervisory stress test (that is,(with both would occuroccurring every other year for banking organizations subject to Category IV standards). The rule allows a banking organization subject to Category IV standards to elect to participate in the supervisory stress test in a year in which the banking organization would not otherwise be subject to the supervisory stress test, and to receive an updated stress capital buffer requirement in that year.

Standards for Safety and Soundness

Federal law requires each federal banking agency to prescribe, for the depository institutions under its jurisdiction, standards that relate to, among other things, internal controls; information and audit systems; loan documentation; credit underwriting; the monitoring of interest rate risk; asset growth; compensation; fees and benefits; and such other operational and managerial standards as the agency deems appropriate. The federal banking agencies adopted final regulations and Interagency Guidelines Establishing Standards for Safety and Soundness (the “Guidelines”) to implement these safety and soundness standards. The Guidelines set forth the safety and soundness standards that the federal banking agencies use to identify and address problems at insured depository institutions before capital becomes impaired. If the appropriate federal banking agency determines that an institution fails to meet any standard prescribed by the Guidelines, the agency may require the institution to provide it with an acceptable plan to achieve compliance with the standard, as required by the Federal Deposit Insurance Act, as amended, (the “FDI Act”).

FDIC, OCC, and FRB Regulations

The discussion that follows pertains to FDIC, OCC, and FRB regulations other than those already discussed on the preceding pages.

Additional Regulations

The following pertains to regulations other than those already discussed on the preceding pages.
16


Real Estate Lending Standards

The FDIC and the other federal banking agencies have adopted regulations that prescribe standards for extensions of credit that (i) are secured by real estate, or (ii) are made for the purpose of financing construction or improvements on real estate. The FDIC regulations require each institution to establish and maintain written internal real estate lending standards that are consistent with safe and sound banking practices, and appropriate to the size of the institution and the nature and scope of its real estate lending activities. The standards also must be consistent with accompanying FDIC Guidelines, which include loan-to-value limitations for the different types of real estate loans. Institutions are also permitted to make a limited amount of loans that do not conform to the proposed loan-to-value limitations as long as such exceptions are reviewed and justified

17


appropriately. The FDIC Guidelines also list a number of lending situations in which exceptions to the loan-to-value standards are justified.

The FDIC, the OCC, and the FRB (collectively, the “Agencies”“Federal Banking Agencies”) also have issued joint guidance entitled “Concentrations in Commercial Real Estate Lending, Sound Risk Management Practices” (the “CRE Guidance”). The CRE Guidance, which addresses land development, construction, and certain multi-family loans, as well as CRE loans, does not establish specific lending limits but, rather, reinforces and enhances the Federal Banking Agencies’ existing regulations and guidelines for such lending and portfolio management. Specifically, the CRE Guidance provides that a bank has a concentration in CRE lending if (1) total reported loans for construction, land development, and other land represent 100%100 percent or more of total risk-based capital; or (2) total reported loans secured by multi-family properties, non-farm non-residential properties (excluding those that are owner-occupied), and loans for construction, land development, and other land represent 300%300 percent or more of total risk-based capital and the bank’s CRE loan portfolio has increased 50% or more during the prior 36 months.capital. If a concentration is present, management must employ heightened risk management practices that address key elements, including board and management oversight and strategic planning, portfolio management, development of underwriting standards, risk assessment and monitoring through market analysis and stress testing, and maintenance of increased capital levels as needed to support the level of CRE lending.

On December 13, 2019, the Federal Banking Agencies issued a final rule, which became effective on April 1, 2020, to modify the agencies’ capital rules for high volatility CRE (“HVCRE”) exposures, as required by the EGRRCPA. The final rule revises the definition of HVCRE exposure to make it consistent with the statutory definition of the term included in Section 214 of the EGRRCPA, which excludes any loan made before January 1, 2015. The revised HVCRE exposure definition differs from the previous definition primarily in two ways. First, the previous definition applied to loans that financed ADC activities, whereas the new definition only applies to loans that “primarily” finance ADC activities and that are secured by land or improved real estate. This change excludes multipurpose credit facilities that primarily finance the purchase of equipment or other non-ADC activities. Second, the new definition permits the full appraised value of borrower-contributed land (less the total amount of any liens on the real property securing the HVCRE exposure) to count toward the 15 percent capital contribution of the real property’s appraised “as completed” value, which is one of the criteria for an exemption from the heightened risk weight. The final rule includes a grandfathering provision, which will provideprovides banking organizations with the option to maintain their current capital treatment for ADC loans originated on or after January 1, 2015, and before April 1, 2020. Banking organizations also will have the option to reevaluate any or all of their ADC loans originated on or after January 1, 2015, using the revised HVCRE exposure definition.

Dividend Limitations

The Parent Company is a separate legal entity from the Bank and must provide for its own liquidity. In addition to operating expenses and any share repurchases, the Parent Company is responsible for paying any dividends declared to the Company’s shareholders. As a Delaware corporation, the Parent Company is able to pay dividends either from surplus or, in case there is no surplus, from net profits for the fiscal year in which the dividend is declared and/or the preceding fiscal year.

Various legal restrictions limit the extent to which the Company’s subsidiary bank can supply funds to the Parent Company and its non-bank subsidiaries. The Bank would require the approval of the OCC if the dividends it declares in any calendar year were to exceed the total of its respective net profits for that year combined with its respective retained net profits for

the preceding two calendar years, less any required transfer to paid-in capital. The FDIC has authorityterm “net profits” is defined as net income for a given period less any dividends paid during that period. As a result of our acquisition of Flagstar, we are also required to use its enforcement powers to prohibit a savings bank or commercial bankseek regulatory approval from paying dividends if, in its opinion,the OCC for the payment of any dividend to the Parent Company through at least the period ending November 1, 2024. In 2023, dividends would constitute an unsafe or unsound practice. Federal law prohibitsof $580 million were paid by the paymentBank to the Parent Company.


Investment Activities

National bank investment activities are governed by the National Bank Act and OCC regulations which, consistent with safe and sound banking practices, prescribe standards under which national banks may purchase, sell, deal in, underwrite, and hold securities. The types of dividendsinvestment activities that will resultare permissible for national banks, and the calculation of limits for investments in such covered securities, are set forth in regulations promulgated by the OCC (12 CFR Part 1), as further described in the institution failingOCC’s Investment Securities Policy Statement (OCC Bulletin 1998-20). A national bank must adhere to meet applicable capitalsafe and sound banking practices and the specific requirements on a pro forma basis. The Bank is also subject to dividend declaration restrictions imposed by, and as later discussed under, “New York State Law.”

Investment Activities

Since the enactment of the FDICIA, all state-chartered financial institutions, including savings banks, commercial banks,OCC's regulations in conducting such investment activities. A bank must consider, as appropriate, the interest rate, credit, liquidity, price, foreign exchange, transaction, compliance, strategic, and their subsidiaries, have generally been limitedreputation risks presented by a proposed activity, and the particular activities undertaken by the bank must be appropriate for that bank. If the OCC determines for safety and soundness reasons that a bank should calculate its investment limits more frequently than required by the OCC's Investment Securities regulations, the OCC may provide written notice to such activities as principalthe bank


18


directing the bank to calculate its investment limitations at a more frequent interval, and equity investments of the type, and inbank must thereafter calculate its investment limits at that interval until further notice from the amount, authorized for national banks. OCC.

The GLBA and FDIC regulations also impose certain quantitative and qualitative restrictions on such activities and on a bank’s dealings with a subsidiary that engages in specified activities.

Enforcement

17


In 1993,

The OCC has authority to bring an enforcement action against the Bank received grandfathering authority fromfor unsafe or unsound banking practices, which could include limiting the FDIC, which it continuesBank’s ability to use, to invest in listed stocks and/conduct otherwise permissible activities, or registered sharesimposing corrective capital or managerial requirements on the bank. In addition, the Parent Company is subject to the maximum permissible investments of 100% of tier 1 capital, as specified by the FDIC’s regulations, or the maximum amount permitted by New York State Banking Law, whichever is less. Such grandfathering authority is subject to termination upon the FDIC’s determination that such investments pose a safety and soundness risk to the Bank, or in the event that the Bank converts its charter or undergoes a change in control.

Enforcement

The FDIC has extensive enforcement authority over insured banks, includingof the Bank. ThisFederal Reserve. The enforcement authority of these regulatory agencies includes, among other things, the ability to assess civil money penalties, to issue cease and desist orders, and to remove directors and officers. In general, these enforcement actions may be initiated in response to violations of laws and regulations and unsafe or unsound practices.


Insurance of Deposit Accounts

The deposits of the Bank are insured up to applicable limits by the DIF. The maximum deposit insurance provided by the FDIC per account owner is $250,000 for all types of accounts.

Under the FDIC’s risk-based assessment system, insured institutions are assigned to one of four risk categories based upon supervisory evaluations, regulatory capital level, and certain other factors, with less risky institutions paying lower assessments based on the assigned risk levels. An institution’s assessment rate depends upon the category to which it is assigned and certain other factors. Assessment rates range from 1.5 to 40 basis points of the institution’s assessment base, which is calculated as average total assets minus average tangible equity. No institution may pay a dividend if in default of the federal deposit insurance assessment. Deposit insurance assessments are based on total average assets, excluding PPP loans, less average tangible common equity. The FDIC has authority to increase insurance assessments. Management cannot predict what insurance assessments rates will be in the future.

Insurance of deposits may be terminated by the FDIC upon a finding that an institution has engaged in unsafe or unsound practices, is in an unsafe or unsound condition to continue operations, or has violated any applicable law, regulation, rule, order, or condition imposed by the FDIC. Management does not know of any practice, condition, or violation that would lead to termination of the deposit insurance for the Bank.

On November 16, 2023, the FDIC published in the Federal Register its final rule that imposes special assessments to recover the loss to the Deposit Insurance Fund arising from the protection of uninsured depositors in connection with the systemic risk determination announced on March 12, 2023, following the closures of Silicon Valley Bank and Signature Bank. The assessment base for the special assessments is equal to an insured depository institution’s estimated uninsured deposits, reported as of December 31, 2022, adjusted to exclude the first $5 billion in estimated uninsured deposits from the insured depository institution, or for insured depository institutions that are part of a holding company with one or more subsidiary insured depository institutions, at the banking organization level. The final rule calls for the FDIC to collect special assessments at an annual rate of approximately 13.4 basis points, over eight quarterly assessment periods. Because the estimated loss pursuant to the systemic risk determination will be periodically adjusted, the FDIC retains the ability to cease collection early, extend the special assessment collection period one or more quarters beyond the initial eight-quarter collection period to collect the difference between actual or estimated losses and the amounts collected, and impose a final shortfall special assessment on a one-time basis after the receiverships for Silicon Valley Bank and Signature Bank terminate. The final rule set an effective date of April 1, 2024, with special assessments collected beginning with the first quarterly assessment period of 2024 (i.e., January 1 through March 31, 2024, with an invoice payment date of June 28, 2024).

In February 2024, we received notification from the FDIC that the estimated loss attributable to the protection of uninsured depositors at Silicon Valley Bank and Signature Bank is $20.4 billion, an increase of approximately $4.1 billion from the estimate of $16.3 billion described in the final rule. The FDIC plans to provide institutions subject to the special assessment an updated estimate of each institution’s quarterly and total special assessment expense with its first quarter 2024 special assessment invoice, to be released in June 2024.

We expect an increase in special assessment expense, which is not expected to be material, on or around June 2024 based on the FDIC’s modified loss estimate.


19


Holding Company Regulations

Federal RegulationRegulation.

The Company is currently subject to examination, regulation, and periodic reporting under the BHCA, as administered by the FRB.


Acquisition, Activities and Change in Control. The Company ismay only conduct, or acquire control of companies engaged in activities permissible for a bank holding company pursuant to the BHCA. Further, we generally are required to obtain the priorFederal Reserve approval of the FRB to acquire all, or substantially all, of the assets of any bank or bank holding company. Prior FRB approval would be required for the Company to acquirebefore acquiring direct or indirect ownership or control of any voting securitiesshares of anyanother bank, or bank holding company, savings associations or savings and loan holding company if after giving effect to such acquisition, itwe would directly or indirectly, own or control more than 5%5 percent of the outstanding shares of any class of voting sharessecurities of such bankthat entity. Additionally, we are prohibited from acquiring control of a depository institution that is not federally insured or bank holding company.retaining control for more than one year after the date that institution becomes uninsured.

We may not be acquired unless the transaction is approved by the Federal Reserve. In addition, before any bank acquisition can be completed, prior approval thereof may also be required to be obtainedthe GLBA generally restricts a company from other agencies having supervisory jurisdiction over the bank to be acquired, including the NYSDFS.

FRB regulations generally prohibitacquiring us if that company is engaged directly or indirectly in activities that are not permissible for a bank holding company from engagingor financial holding company.


Capital Requirements. The Company and the Bank are currently subject to the regulatory capital framework and guidelines reached by Basel III as adopted by the OCC and Federal Reserve. The OCC and Federal Reserve have risk-based capital adequacy guidelines intended to measure capital adequacy with regard to a banking organization’s balance sheet, including off-balance sheet exposures such as unused portions of loan commitments, letters of credit and recourse arrangements. Failure to meet minimum capital requirements can initiate certain mandatory, and possibly additional discretionary, actions by regulators that could have a material effect on the Consolidated Financial Statements. For additional information, see the Capital section of the MD&A and Note 17 -Capital.

Holding Company Limitations on Capital Distributions. Our ability to make any capital distributions to our stockholders, including dividends and share repurchases, is subject to the oversight of the Federal Reserve and contingent upon their non-objection to such planned distributions which typically considers our capital adequacy, comprehensiveness and effectiveness of capital planning and the prudence of the proposed capital action.

Acquisition of the Holding Company

Federal Restrictions

Under the Federal Change in Bank Control Act (“CIBCA”), a notice must be submitted to the FRB if any person (including a company), or acquiring, directgroup acting in concert, seeks to acquire 10 percent or indirectmore of the Company’s shares of outstanding common stock, unless the FRB has found that the acquisition will not result in a change in control of more than 5%the Company. Under the CIBCA, the FRB generally has 60 days within which to act on such notices, taking into consideration certain factors, including the financial and managerial resources of the acquirer; the convenience and needs of the communities served by the Company, the Bank; and the anti-trust effects of the acquisition. Under the BHCA, any company would be required to obtain approval from the FRB before it may obtain “control” of the Company within the meaning of the BHCA. Control generally is defined to mean the ownership or power to vote 25 percent or more of any class of voting securities of the Company, the ability to control in any company engaged in non-banking activities. Onemanner the election of a majority of the principal exceptionsCompany’s directors, or the power to exercise a controlling influence over the management or policies of the Company. Under the BHCA, an existing bank holding company would be required to obtain the FRB’s approval before acquiring more than 5 percent of the Company’s voting stock. See “Holding Company Regulation” earlier in this prohibition is for activities foundreport.

Banking Regulation

Limitation on Capital Distributions. The OCC and FRB regulate all capital distributions made by the FRBBank, directly or indirectly, to the holding company, including dividend payments. An application to the OCC by the Bank may be so closely relatedrequired based on a number of factors including whether the Bank would not be at least adequately capitalized following the distribution or if the total amount of all capital distributions (including each proposed capital distribution) for the applicable calendar year exceeds net income for that year to banking or managing or controlling banks asdate plus the retained net income for the preceding two years. As a result of our acquisition of Flagstar, we are required to be a proper incident thereto. Some ofseek regulatory approval from the principal activities that the FRB has determined by regulation to be so closely related to banking are: (i) making or servicing loans; (ii) performing certain data processing services; (iii) providing discount brokerage services; (iv) acting as fiduciary, investment, or financial advisor; (v) leasing personal or real property; (vi) making investments in corporations or projects designed primarily to promote community welfare; and (vii) acquiring a savings and loan association.

18


The FRB has issued a policy statement regardingOCC for the payment of dividends by bank holding companies. In general, the FRB’s policies provide that dividends should be paid only out of current earnings, and only if the prospective rate of earnings retention by the bank holding company appears consistent with the organization’s capital needs, asset quality, and overall financial condition. The FRB’s policies also require that a bank holding company serve as a source of financial strength to its subsidiary bank by standing ready to use available resources to provide adequate capital fundsany dividend to the bank during periods of financial stress or adversity, and by maintainingParent Company through at least the financial flexibility and capital-raising capacity to obtain additional resources for assisting its subsidiary bank where necessary.

Under FRB regulations, banks must adopt and maintain written policies that establish appropriate limits and standards for extension of credit secured by liens or interests in real estate or are made for the purpose of financing permanent improvements to real estate. These policies must establish loan portfolio diversification standards; prudent underwriting standards, including loan-to-value limits that are clear and measurable; loan administration procedures; and documentation, approval, and reporting requirements. A bank's real estate lending policy must reflect consideration of the Interagency Guidelines for Real Estate Lending Policies (the "Interagency Guidelines") adopted by the federal bank regulators. The Interagency Guidelines, among other things, call for internal loan-to-value limits for real estate loans that are not in excess of the limits specified in the guidelines. The Interagency Guidelines state, however, that it may be appropriate in individual cases to originate or purchase loans with loan-to-value ratios in excess of the supervisory loan-to-value limits.

Interchange fees, or "swipe" fees, are fees that merchants pay to credit card companies and debit card-issuing banks such as the Bank for processing electronic payment transactions on their behalf. The maximum permissible interchange fee that a non-exempt issuer may receive for an electronic debit transaction is the sum of 21 cents per transaction and five bps multiplied by the value of the transaction, subject to an upward adjustment of one cent if an issuer certifies that it has implemented policies and procedures reasonably designed to achieve the fraud-prevention standards set forth by the FRB. In addition, card issuers and networks are prohibited from entering into agreements requiring that debit card transactions be processed on a single network or only two affiliated networks, and allows merchants to determine transaction routing.

The DFA codified the source of financial strength policy and required regulations to facilitate its application. Under the prompt corrective action laws, theperiod ending November 1, 2024, which could restrict our ability of a bank holding company to pay dividends may be restricted if a subsidiary bank becomes undercapitalized. These regulatory policies could affect the ability of the Company to pay dividends or otherwise engage in capital distributions.common stock dividend.


The status of the Company as a registered bank holding company under the BHCA does not exempt it from certain federal and state laws and regulations applicable to corporations generally, including, without limitation, certain provisions of the federal securities laws.
20


Transactions with Affiliates

Under current federal law, transactions between depository institutions and their affiliates are governed by Sections 23A and 23B of the Federal Reserve Act and the FRB’s Regulation W promulgated thereunder. Generally, Section 23A limits the extent to which the institution or its subsidiaries may engage in “covered transactions” with any one affiliate to an amount equal to 10%10 percent of the institution’s capital stock and surplus, and contains an aggregate limit on all such transactions with all affiliates to an amount equal to 20%20 percent of such capital stock and surplus. Section 23A also establishes specific collateral requirements for loans or extensions of credit to, or guarantees or acceptances on letters of credit issued on behalf of, an affiliate. Section 23B requires that covered transactions and a broad list of other specified transactions be on terms substantially the same as, or at least as favorable to, the institution or its subsidiaries as similar transactions with non-affiliates.

The Sarbanes-Oxley Act of 2002 generally prohibits loans by the Company to its executive officers and directors. However, the Sarbanes-Oxley Act contains a specific exemption for loans made by an institution to its executive officers and directors in compliance with other federal banking laws. Section 22(h) of the Federal Reserve Act, and FRB Regulation O adopted thereunder, govern loans by a savings bank or commercial bank to directors, executive officers, and principal stockholders.

19


Community Reinvestment Act

Federal Regulation

Under the CRA, as implemented by FDICOCC regulations, an institution has a continuing and affirmative obligation consistent with its safe and sound operation to help meet the credit needs of its entire community, including low and moderate income neighborhoods. The CRA generally does not establish specific lending requirements or programs for financial institutions, nor does it limit an institution’s discretion to develop the types of products and services that it believes are best suited to its particular community, consistent with the CRA. InHowever, institutions are rated on their performance in meeting the needs of their communities. Performance is tested in three areas: (1) lending, to evaluate the institution’s record of making loans in its most recent FDICassessment areas; (2) investment, to evaluate the institution’s record of investing in community development projects, affordable housing, and programs benefiting low- or moderate-income individuals and businesses; and (3) service, to evaluate the institution’s delivery of services through its branches, ATMs and other offices. The CRA performance evaluation,requires each federal banking agency, in connection with its examination of a financial institution, to assess and assign one of four ratings to the Bank received overall state ratingsinstitution’s record of “Satisfactory” for Ohio, Florida, Arizona, and New Jersey, as well as for the New York/New Jersey multi-state region. Furthermore, the most recent overall FDIC CRA ratings for the Bank was “Satisfactory.”

New York State Regulation

The Bank is also subject to provisions of the New York State Banking Law that impose continuing and affirmative obligations upon a banking institution organized in New York State to servemeeting the credit needs of the community and to take such record into account in its local community. Such obligations are substantially similar to those imposedevaluation of certain applications by the CRA.institution, including applications for charters, branches and other deposit facilities, relocations, mergers, consolidations, acquisitions of assets or assumptions of liabilities, and bank holding company and savings and loan holding company acquisitions. The latest New York State CRA rating receivedalso requires that all institutions make public disclosure of their CRA ratings.


On October 24, 2023, the OCC, the FDIC and the Federal Reserve issued a final rule amending the agencies’ CRA regulations.The final rule (i) encourages banks to expand access to credit, investment and banking services in low- and moderate-income communities, (ii) adapts to changes in the banking industry, including mobile and online banking, (iii) provides greater clarity and consistency in the application of CRA regulations and (iv) tailors CRA evaluations and data collection to bank size and type.Under the final rule, the agencies will evaluate bank performance across the varied activities they conduct and communities in which they operate so that the CRA continues to be an effective tool to address inequities in access to credit and financial services.The final rule also updates existing CRA regulations to evaluate lending outside traditional assessment areas generated by the Bankgrowth of non-branch delivery systems, such as online and mobile banking, branchless banking, and hybrid models. In addition, the final rule implements a new metrics-based approach to evaluating bank retail lending and community development financing, using benchmarks based on peer and demographic data.Most of the final rule’s requirements will become effective beginning on January 1, 2026 and the remaining requirements, including the final rule’s data reporting requirements, will become effective on January 1, 2027.


21


Community Pledge Agreement with the National Community Reinvestment Coalition

On January 24, 2022, the Company and the National Community Reinvestment Coalition ("NCRC") announced the Company's commitment to provide $28.0 billion in loans, investments, and other financial support to communities and people of color, low- and moderate-income ("LMI") families and communities, and small businesses. The Company's Community Pledge Agreement was “Outstanding.”developed with NCRC and its members in conjunction with the Company's merger with Flagstar Bancorp, Inc. The agreement includes $22.0 billion in community lending and affordable housing commitments and $6.0 billion of residential mortgage originations to underserved and LMI borrowers, and in LMI and majority-minority neighborhoods over a five-year period. The Company will also provide $542 million in loans to small businesses with less than $1 million in revenues and in LMI and majority-minority communities; $16.5 million in philanthropic support to nonprofit organizations that meet the needs of LMI and majority-minority communities and individuals; greater access to banking products and services; and the continuation of the Company's responsible multi-family lending practices.

Bank Secrecy and Anti-Money Laundering

Federal

The Bank is subject to the Bank Secrecy Act (“BSA”) and other anti-money laundering laws and regulations, impose obligations on U.S.including the Uniting and Strengthening America by Providing Appropriate Tools Required to Intercept and Obstruct Terrorism Act, commonly referred to as the “USA PATRIOT Act” or the “Patriot Act”. The BSA requires all financial institutions including banks and broker/dealer subsidiaries, to, implement and maintain appropriate policies, procedures, andamong other things, establish a risk-based system of internal controls that are reasonably designed to prevent detect, and report instances of money laundering and the financing of terrorism,terrorism. The BSA includes various record keeping and reporting requirements such as cash transaction and suspicious activity reporting as well as due diligence requirements. The Bank is also required to verifycomply with the identityU.S. Treasury’s Office of their customers. In addition, these provisions requireForeign Assets Control imposed economic sanctions that affect transactions with designated foreign countries, nationals, individuals, entities and others. The USA PATRIOT Act contains prohibitions against specified financial transactions and account relationships, as well as enhanced due diligence standards intended to prevent the federaluse of the United States financial institution regulatory agencies to consider the effectiveness of a financial institution’s anti-money laundering activities when reviewing bank mergers and bank holding company acquisitions. Failure of a financial institution to maintain and implement adequate programs to combatsystem for money laundering and terrorist financing could have serious legal and reputational consequences for the institution.

activities. The Financial Crimes Enforcement Network ("Fin CEN"), a bureau of the U.S. Treasury, has the authority to implement, administer, and enforce compliance with the USA PATRIOTPatriot Act requires banks and other BSA legislation. Fin CEN has adopted regulations that require financialdepository institutions, brokers, dealers and certain other businesses involved in the transfer of money to among other things, obtain beneficial ownership information with respect to legal entities with which such institutions conduct business, subject to certain exemptions and exclusions.

The Anti-Money Laundering Act of 2020 ("AMLA"), which amends the BSA, was enacted in January 2021. The AMLA is intended to comprehensively reform and modernize U.S. bank secrecy andestablish anti-money laundering laws. Among other things, it codifiesprograms, including employee training and independent audit requirements meeting minimum standards specified by the Patriot Act, to follow standards for customer identification and maintenance of customer identification records, and to compare customer lists against lists of suspected terrorists, terrorist organizations and money launderers. The Patriot Act also requires federal bank regulators to evaluate the effectiveness of an applicant in combating money laundering in determining whether to approve a risk-based approach toproposed bank acquisition.

We have developed and operate an enterprise-wide anti-money laundering compliance; requires the U.S. Treasuryprogram designed to establish priorities forenable us to comply with all applicable anti-money laundering and counteringanti-terrorism financing laws and regulations. Our anti-money laundering program is also designed to prevent our products from being used to facilitate business in certain countries or territories, or with certain individuals or entities, including those on designated lists promulgated by the financingU.S. Department of terrorism policy; requires the developmentTreasury’s Office of standards for testing technologyForeign Assets Controls and internal processes for BSA compliance; expands enforcementother U.S. and investigation-related authority, including increasing availablenon-U.S. sanctions for certain BSA violations; and expands BSA whistleblower incentives and protections. In June 2021, Fin CEN issued the priorities forauthorities. Our anti-money laundering and counteringsanctions compliance programs include policies, procedures, reporting protocols, and internal controls designed to identify, monitor, manage, and mitigate the financingrisk of terrorism policy required under AMLA.money laundering and terrorist financing. These priorities include: corruption, cybercrime,controls include procedures and processes to detect and report potentially suspicious transactions, perform consumer due diligence, respond to requests from law enforcement, and meet all recordkeeping and reporting requirements related to particular transactions involving currency or monetary instruments. Our programs are designed to address these legal and regulatory requirements and to assist in managing risk associated with money laundering and terrorist financing, fraud, transactional crime, drug trafficking, human trafficking, and proliferation financing. The Company regularly reviews and monitors its anti-money laundering compliance program to ensure it complies with the changes reflected in AMLA and the regulations that implement it.

Office of Foreign Assets Control Regulation

The United States has imposed economic sanctions that affect transactions with designated foreign countries, foreign nationals, and others. These are typically known as the “OFAC” rules, based on their administration by the U.S. Treasury Department Office of Foreign Assets Control. The OFAC-administered sanctions targeting countries take many different forms. Generally, however, they contain one or more of the following elements: (i) restrictions on trade with, or investment in, a sanctioned country, including prohibitions against direct or indirect imports from, and exports to, a sanctioned country and prohibitions on “U.S. persons” engaging in financial transactions relating to making investments in, or providing investment-related advice or assistance to, a sanctioned country; and (ii) a blocking of assets in which the government or specially designated nationals of the sanctioned country have an interest,

20


by prohibiting transfers of property subject to U.S. jurisdiction (including property in the possession or control of U.S. persons). Blocked assets (e.g., property and bank deposits) cannot be paid out, withdrawn, set off, or transferred in any manner without a license from OFAC. Failure to comply with these sanctions could have serious legal and reputational consequences.


22


Data Privacy

Federal and state law contains extensive consumer privacy protection provisions. The GLBA requires financial institutions to periodically disclose their privacy practices and policies relating to sharing such information and enable retail customers to opt out of the Company’s ability to share certain information with affiliates and non-affiliates for marketing and/or non-marketing purposes, or to contact customers with marketing offers. The GLBA also requires financial institutions to implement a comprehensive information security program that includes administrative, technical, and physical safeguards to ensure the security and confidentiality of customer records and information.information, and imposes certain limitations on the ability to share consumers’ nonpublic personal information with non-affiliated third-parties. Privacy requirements, including notice and opt out requirements, under the GLBA and the FCRA are enforced by the FTC and by the CFPB through UDAAP laws and regulations, and are a standard component of CFPB examinations. State entities also may initiate actions for alleged violations of privacy or security requirements under state law.

Furthermore, an increasing number of state, federal, and international jurisdictions have enacted, or are considering enacting, privacy laws, such as the California Consumer Privacy Act (“CCPA”), which became effective on January 1, 2020, and the EU General Data Protection Regulation (“GDPR”), which regulates the collection, control, sharing, disclosure and use and other processing of personal information of data subjects in the EU and the European Economic Area. The CCPA gives residents of California expanded rights to access and delete their personal information, opt out of certain personal information sharing, and receive detailed information about how their personal information is used, and also provides for civil penalties for violations and private rights of action for data breaches. Meanwhile, the GDPR provides data subjects with greater control over the collection and use of their personal information (such as the “right to be forgotten”) and has specific requirements relating to cross-border transfers of personal information to certain jurisdictions, including to the United States, with fines for noncompliance of up to the greater of 20 million euros or up to 4 percent of the annual global revenue of the noncompliant company. In addition, California approved a new privacy law in 2020, the California Privacy Rights Act (“CPRA”), which significantly modifies the CCPA, including by expanding consumers’ rights with respect to certain personal information and creating a new state agency to oversee implementation and enforcement efforts.

Cybersecurity
Cybersecurity

The Cybersecurity Information Sharing Act (the “CISA”) is intended to improve cybersecurity in the U.S. through sharing of information about security threats between the U.S. government and private sector organizations, including financial institutions such as the Company. The CISA also authorizes companies to monitor their own systems, notwithstanding any other provision of law, and allows companies to carry out defensive measures on their own systems from potential cyber-attacks.

Sarbanes-Oxley Act of 2002

The Sarbanes-Oxley Act of 2002 was enacted to address, among other things, corporate governance, auditing and accounting, executive compensation, and enhanced and timely disclosure of corporate information. As directed by the Sarbanes-Oxley Act, our Chief Executive Officer and Chief Financial Officer are required to certify that our quarterly and annual reports do not contain any untrue statement of a material fact. The rules adopted by the SEC under the Sarbanes-Oxley Act have several requirements, including having those Officers certify that they are responsible for establishing, maintaining and regularly evaluating the effectiveness of our internal controls over financial reporting; that they have made certain disclosures to our auditors and the Audit Committee of the Board of Directors about our internal control over financial reporting; and they have included information in our quarterly and annual reports about their evaluation and whether there have been changes in our internal control over financial reporting or in other factors that could materially affect internal control over financial reporting.

Federal Home Loan Bank System

The Bank is a member of the FHLB-NY.FHLB-NY and FHLB-Indianapolis. As a member of the FHLB-NY, the Bank is required to acquire and hold shares of FHLB-NY capital stock. At December 31, 20212023 the Bank held $734$861 million of FHLB-NY stock.

New York State Law

The Bank derives its lending, investment,stock and other authority primarily from the applicable provisions$329 million of New York State Banking Law and the regulations of the NYSDFS, as limited by FDIC regulations. Under these laws and regulations, banks, including the Bank, may invest in real estate mortgages, consumer and commercial loans, certain types of debt securities (including certain corporate debt securities, and obligations of federal, state, and local governments and agencies), certain types of corporate equity securities, and certain other assets.FHLB-Indianapolis shares.


Under New York State Banking Law, New York State-chartered stock-form savings banks may declare and pay dividends out of their net profits, unless there is an impairment of capital. Approval of the Superintendent is required if the total of all dividends declared by the bank in a calendar year would exceed the total of its net profits for that year combined with its retained net profits for the preceding two years, less prior dividends paid.
23


New York State Banking Law gives the Superintendent authority to issue an order to a New York State-chartered banking institution to appear and explain an apparent violation of law, to discontinue unauthorized or unsafe practices, and to keep prescribed books and accounts. Upon a finding by the NYSDFS that any director, trustee, or officer of any banking organization has violated any law, or has continued unauthorized or unsafe practices in conducting the business of the banking organization after having been notified by the Superintendent to discontinue such practices, such director, trustee, or officer may be removed from office after notice and an opportunity to be heard. The

21


Superintendent also has authority to appoint a conservator or a receiver for a savings or commercial bank under certain circumstances.

Interstate Branching

Federal law allows the FDIC, and New York State Banking Law allows the Superintendent, to approve an application by a state banking institution to acquire interstate branches by merger, unless, in the case of the FDIC, the state of the target institution has opted out of interstate branching. New York State Banking Law authorizes savings banks and commercial banks to open and occupy de novo branches outside the state of New York. Pursuant to the DFA, the FDIC is authorized to approve a state bank’s establishment of a de novo interstate branch if the intended host state allows de novo branching by banks chartered by that state. The Bank currently maintains 40 branches in New Jersey, 26 branches in Florida, 28 branches in Ohio, and 14 branches in Arizona, in addition to its 129 branches in New York State.

Acquisition of the Holding Company

Federal Restrictions

Under the Federal Change in Bank Control Act (“CIBCA”), a notice must be submitted to the FRB if any person (including a company), or group acting in concert, seeks to acquire 10% or more of the Company’s shares of outstanding common stock, unless the FRB has found that the acquisition will not result in a change in control of the Company. Under the CIBCA, the FRB generally has 60 days within which to act on such notices, taking into consideration certain factors, including the financial and managerial resources of the acquirer; the convenience and needs of the communities served by the Company, the Bank; and the anti-trust effects of the acquisition. Under the BHCA, any company would be required to obtain approval from the FRB before it may obtain “control” of the Company within the meaning of the BHCA. Control generally is defined to mean the ownership or power to vote 25% or more of any class of voting securities of the Company, the ability to control in any manner the election of a majority of the Company’s directors, or the power to exercise a controlling influence over the management or policies of the Company. Under the BHCA, an existing bank holding company would be required to obtain the FRB’s approval before acquiring more than 5% of the Company’s voting stock. See “Holding Company Regulation” earlier in this report.

New York State Change in Control Restrictions

New York State Banking Law generally requires prior approval of the New York State Banking Board before any action is taken that causes any company to acquire direct or indirect control of a banking institution which is organized in New York.

Federal Securities Law

The Company’s common stock and certain other securities listed on the cover page of this report are registered with the SEC under the Securities Exchange Act of 1934, as amended (the “Exchange Act”). The Company is subject to the information and proxy solicitation requirements, insider trading restrictions, and other requirements under the Exchange Act.

Consumer Protection Regulations

The activities of the Company’s banking subsidiary, including its lending and deposit gathering activities, is subject to a variety of consumer laws and regulations designed to protect consumers. These laws and regulations mandate certain disclosure requirements, and regulate the manner in which financial institutions must deal with clients and monitor account activity when taking deposits from, making loans to, or engaging in other types of transactions with, such clients. Failure to comply with these laws and regulations could lead to substantial penalties, operating restrictions, and reputational damage to the financial institution.

Applicable consumer protection laws, and their implementing regulations, include, but may not be limited to, the DFA, Truth in Lending Act (Regulation Z), Truth in Savings Act (Regulation DD), Equal Credit Opportunity Act (Regulation B), Electronic Funds Transfer Act (Regulation E), Fair Housing Act, Home Mortgage Disclosure Act (Regulation C), Fair Debt Collection Practices Act (Regulation F), Fair Credit Reporting Act (Regulation V), as amended by the Fair and Accurate Credit Transactions Act, Expedited Funds Availability (Regulation CC), Reserve Requirements (Regulation D), Insider Transactions (Regulation O), Privacy of Consumer

22


Information (Regulation P), Margin Stock Loans (Regulation U), Right To Financial Privacy Act, Flood Disaster Protection Act, Homeowners Protection Act, Servicemembers Civil Relief Act, Real Estate Settlement Procedures Act (Regulation X), Telephone Consumer Protection Act, CAN-SPAM Act, Children’s Online Privacy Protection Act, the Military Lending Act, and the Homeownership Counseling Act. Additionally, we are subject to Section 5 of the Federal Trade Commission Act, which prohibits unfair and deceptive acts or practices in or affecting commerce, and Section 1031 of the Dodd-Frank Act, which prohibits unfair, deceptive, or abusive acts or practices (“UDAAP”) in connection with any consumer financial product or service.


In addition, the Bank and its subsidiaries are subject to certain state laws and regulations designed to protect consumers. Many states have consumer protection laws analogous to, or in addition to, the federal laws listed above, such as usury laws, state debt collection practices laws, and requirements regarding loan disclosures and terms, credit discrimination, credit reporting, money transmission, recordkeeping, and unfair or deceptive business practices.

Certain states have adopted laws regulating and requiring licensing, registration, notice filing, or other approval for parties that engage in certain activity regarding consumer finance transactions. Furthermore, certain states and localities have adopted laws requiring licensing, registration, notice filing, or other approval for consumer debt collection or servicing, and/or purchasing or selling consumer loans. The licensing statutes vary from state to state and prescribe different requirements, including but not limited to: restrictions on loan origination and servicing practices (including limits on the type, amount, and manner of our fees), interest rate limits, disclosure requirements, periodic examination requirements, surety bond and minimum specified net worth requirements, periodic financial reporting requirements, notification requirements for changes in principal officers, stock ownership or corporate control, restrictions on advertising, and requirements that loan forms be submitted for review. We may also be subject to supervision and examination by applicable state regulatory authorities in the jurisdictions in which we may offer consumer financial products or services.

Consumer Financial Protection Bureau

The Bank is subject to oversight by the CFPB within the Federal Reserve System. The CFPB was established under the DFA to implement and enforce rules and regulations under certain federal consumer protection laws with respect to the conduct of providers of certain consumer financial products and services. The CFPB has broad rulemaking authority for a wide range of consumer financial laws that apply to all banks, including, among other things, the authority to prohibit acts and practices that are deemed to be unfair, deceptive, or abusive. Abusive acts or practices are defined as those that (1) materially interfere with a consumer’s ability to understand a term or condition of a consumer financial product or service, or (2) take unreasonable advantage of a consumer’s (a) lack of understanding on the part of the consumer of the material risks, costs, or conditions of the product or service; (b) the inability of the consumer to protect his/her own interest in selecting or using a financial product or service; or (c) the reasonable reliance by the consumer on a financial institution to act in the interests of the consumer.

The CFPB has exclusive examination and primary enforcement authority with respect to compliance with federal consumer financial protection laws and regulations by institutions under its supervision and is authorized, individually or jointly

24


with the federal banking agencies, to conduct investigations to determine whether any person is, or has, engaged in conduct that violates such laws or regulations. The CFPB has the authority to investigate possible violations of federal consumer financial law, hold hearings, and commence civil litigation. The CFPB can issue cease-and-desist orders against banks and other entities that violate consumer financial laws. The CFPB also may institute a civil action against an entity in violation of federal consumer financial law in order to impose a civil penalty or an injunction.

The CFPB has examinationis also authorized to collect fines and enforcement authority over all banks with more than $10 billionprovide consumer restitution in assets,the event of violations, engage in consumer financial education, track consumer complaints, request data and promote the availability of financial services to underserved consumers and communities. The CFPB is authorized to pursue administrative proceedings or litigation for violations of federal consumer financial laws. In these proceedings, the CFPB can obtain cease and desist orders (which can include orders for restitution or rescission of contracts, as well as other kinds of affirmative relief) and monetary penalties which, for 2023, range from $6,813 per day for minor violations of federal consumer financial laws (including the CFPB’s own rules) to $34,065 per day for reckless violations and $1,362,567 per day for knowing violations. The CFPB monetary penalty amounts are adjusted annually for inflation. Also, where a company has violated Title X of the Dodd-Frank Act or CFPB regulations under Title X, the Dodd-Frank Act empowers state attorneys general and state regulators to bring civil actions for the kind of cease and desist orders available to the CFPB (but not for civil penalties).

In May 2022, the CFPB issued an Interpretive Rule to clarify the authority of states to enforce federal consumer financial protections laws under the Consumer Financial Protection Act of 2010 (“CFPA”). Specifically, the CFPB confirmed that (1) states can enforce the CFPA, including the provision making it unlawful for covered persons or service providers to violate any provision of federal consumer financial protection law; (2) the enforcement authority of states under section 1042 of the CFPA is generally not subject to certain limits applicable to the CFPB’s enforcement authority, such that States may be able to bring actions against a broader cross-section of companies than the CFPB; and (3) state attorneys general and regulators may bring (or continue to pursue) actions under their affiliates.CFPA authority even if the CFPB is pursuing a concurrent action against the same entity. See

President Biden's Executive Order on Promoting Competition in CFPB Interpretive Rule regarding Section 1042 of the American EconomyConsumer Financial Protection Act of 2010 (87 FR 31940, May 26, 2022).

On July 9, 2021, President Biden signed an Executive Order
Supervision and Regulation of Mortgage Banking Operations

Our mortgage banking business is subject to promote competition across various industries. The Order encourages the leading antitrust agenciesrules and regulations of the U.S. Department of Housing and Urban Development (“HUD”), the Federal Housing Administration, the Veterans’ Administration (“VA”) and Fannie Mae and Freddie Mac with respect to focus enforcement efforts on problems in key marketsoriginating, processing, selling and coordinates other agencies' ongoing response to corporate consolidation. Amongservicing mortgage loans. Those rules and regulations, among other things, prohibit discrimination and establish underwriting guidelines, which include provisions for inspections and appraisals, require credit reports on prospective borrowers, and fix maximum loan amounts. Lenders are required annually to submit audited financial statements to Fannie Mae, FHA and VA. Each of these regulatory entities has its own financial requirements. We are also subject to examination by Fannie Mae, FHA and VA to assure compliance with the Order: (a) calls on leading antitrust agencies,applicable regulations, policies and procedures. Mortgage origination activities are subject to, among others, the Department of Justice (the "DOJ") andEqual Credit Opportunity Act, the Federal Trade Commission (the "FTC") to enforce antitrust laws vigorously and recognize thatTruth-in-Lending Act, the law allows them to challenge prior bad mergers that past Administrations did not previously challenge; (b) announces a policy that enforcement should focus in particular on labor markets, agricultural markets, healthcare markets, andFair Housing Act, the tech sector; and (c) establishes a White House Competition Council, led by the Director ofFair Credit Report Act, the National Economic Council, to monitor progress on finalizing the initiatives in the Order and to coordinate the federal government's response to the rising power of large corporations in the economy. The Executive Order also urges the DOJ and the FTC to revisit their guidance on mergers and toughen scrutiny of future transactions. The Order also called for the review and revitalization of merger oversight under the Bank MergerFlood Insurance Act and the Bank Holding CompanyReal Estate Settlement Procedures Act and related regulations that prohibit discrimination and require the disclosure of 1956.certain basic information to mortgagors concerning credit terms and settlement costs. Our mortgage banking operations are also affected by various state and local laws and regulations and the requirements of various private mortgage investors.

Enterprise Risk Management

The Company’s and the Bank’s Boards of Directors are actively engaged in the process of overseeing the efforts made by the Enterprise Risk Management (“ERM”) department to identify, measure, monitor, mitigate, and report risk. The Company has established an ERM program that reinforces a strong risk culture to support sound risk management practices. The Board is responsible for the approval and oversight of the ERM program and framework.

ERM is responsible for setting and aligning the Company’s Risk Appetite Policy with the goals and objectives set forth in the budget, and the strategic and capital plans. Internal controls and ongoing monitoring processes capture and address heightened risks that threaten the Company’s ability to achieve our goals and objectives, including the recognition of safety and soundness concerns and consumer protection. Additionally, ERM monitors key risk indicators against the established risk warning levels and limits, as well as elevated risks identified by the Chief Risk Officer.


25

23


Current Operating Environment

COVID-19 Pandemic

The Company's business, financial condition, and results of operation have been and may continue to be affected by the outbreak of COVID-19. Both globally and within the United States, the pandemic continues to have various effects on economic and commercial activity and financial markets, both nationally and locally. Due to its high rate of contagion and mortality, state and local governments enacted numerous safeguards to contain the spread of the virus. These included, the shut-down of all businesses considered to be “non-essential,” restrictions on gatherings, social distancing requirements were put in place. Businesses continue to observe and modify their activities and behaviors to remain in compliance with the jurisdictional directives while concurrently providing consumers with goods and services. Certain actions taken by U.S. or other governmental authorities, including the Federal Reserve, that are intended to ameliorate the macroeconomic effects of COVID-19 may adversely impact our business.

The concentration and severity of COVID-19 infection in the New York City metro region, during the early stages of the pandemic, led it to be considered the epicenter of the pandemic in the country. This region is also the Company’s largest service area, having over 100 branches and 72% of the loan portfolio.

The Company has been very proactive throughout all stages of the pandemic, supporting employees, customers, and its communities. As an essential business, the Company implemented business continuity plans and continued to provide our financial services to customers, while taking health and safety measures into account.

In response to the pandemic and to ensure that the Company’s operations, during the term of the pandemic runs smoothly, senior management formed two committees: the COVID-19 Resiliency Committee and the COVID-19 Lending Committee. The COVID-19 Resiliency Committee meets as needed and is primarily focused on operational issues including employee safety and well-being, branch closings, PPE procurement, IT sustainability, and continuous monitoring of the COVID-19 pandemic. The COVID-19 Lending Committee meets weekly and focuses on our credit quality trends and our deferral program. Management continually monitors developments, evaluates strategic and tactical initiatives and solutions and allocates the necessary resources to mitigate the negative impact of this significant market disruption caused by the pandemic. For a description of the potential impacts of COVID-19 on the Company, see "Item 1A. Risk Factors".

Recent Events

Declaration of Dividend on Common Shares

On January 25, 2022,30, 2024, our Board of Directors declared a quarterly cash dividend on the Company’s common stock $0.05 per share, which represented a reduction from the prior quarterly cash dividend of $0.17 per share. The dividend is payablewas paid on February 17, 202228, 2024 to common stockholders of record as of February 14, 2024. On March 7, 2022.

Pending Acquisition of Flagstar Bancorp, Inc.

On April 26, 2021,2024, the Company announced it hadthat future quarterly cash dividends on shares of the Company’s common stock would be further reduced to $0.01 per share.


Equity Capital Raise

On March 7, 2024, we entered into separate investment agreements with (a) affiliates of funds managed by Liberty 77 Capital, L.P. (“Liberty”), (b) affiliates of funds managed by Hudson Bay Capital Management, LP (“Hudson Bay”), (c) affiliates of funds managed by Reverence Capital Partners L.P. (“Reverence”), and (d) certain other investors (the “Other Investors” and, collectively with Liberty, Reverence and Hudson Bay, the “Investors”, and the investments agreements entered into with each of the Investors on March 7, 2024, collectively, the “Original Investment Agreements”). On March 11, 2024, NYCB entered into separate amendments to the Original Investment Agreements with Liberty (such agreement, as amended, the “Liberty Investment Agreement”), Hudson Bay (such agreements, as amended, the “Hudson Bay Investment Agreements”) and Reverence (such agreement, as amended, the “Reverence Agreement” and, collectively with the Liberty Agreement, the Hudson Bay Agreements and the Original Investment Agreements of the Other Investors, the “Investment Agreements”).

Pursuant to the Investment Agreements, on March 11, 2024, the Investors invested an aggregate of approximately $1.05 billion in the Company in exchange for the sale and issuance by the Company of (a) 76,630,965 shares of our common stock, at a purchase price per share of $2.00, (b) 192,062 shares of a new series of our preferred stock, par value $0.01 per share, designated as Series B Noncumulative Convertible Preferred Stock (the “Series B Preferred Stock”), at a price per share of $2,000, each share of which is convertible into 1,000 shares of common stock (or, in certain limited circumstances, one share of Series C Preferred Stock (as defined below)), (c) 256,307 shares of a new series of our preferred stock, par value $0.01 per share, designated as Series C Noncumulative Convertible Preferred Stock (the “Series C Preferred Stock”, together with the Series B Preferred Stock, the “Preferred Stock”), at a price per share of $2,000, each share of which is convertible into 1,000 shares of common stock, and (d) warrants (the “Issued Warrants”), which may not be exercised until 180 days after issuance thereof, affording the holder thereof the right, until the seven-year anniversary of the issuance of such Issued Warrant, to purchase for $2,500 per share, shares of a new class of non-voting, common-equivalent preferred stock of the Company (the “Series D NVCE Stock”), each share of Series D NVCE Stock is convertible into 1,000 shares of common stock (or, in certain limited circumstances, one share of Series C Preferred Stock), and all of which shares of Series D NVCE Stock, upon issuance, will represent the right (on an as converted basis) to receive 315,000,000 million shares of common stock.

On March 11, 2024, we entered into a definitive merger agreementRegistration Rights Agreement with each Investor (the "Merger Agreement"Registration Rights Agreement) under, pursuant to which we would acquire Flagstar Bancorp, Inc. ("Flagstar") in a 100%will provide customary registration rights to the Investors and their affiliates and certain permitted transferees with respect to, among other things, (a) the shares of our common stock transaction valued atpurchased under the time, at $2.6 billion. Under termsInvestment Agreements, (b) shares of our common stock issued upon the conversion of shares of the MergerPreferred Stock and exercise of the Issued Warrants purchased under the Investment Agreements, (c) in certain circumstances, the shares of Preferred Stock and (d) the Warrants. Under the Registration Rights Agreement, the Investors are entitled to customary shelf registration rights (which will initially be on a Form S-1) and customary piggyback registration rights, in each case, subject to certain limitations as set forth in the Registration Rights Agreement. Liberty and Reverence will additionally be entitled to request a certain number of marketed and unmarketed underwritten shelf takedowns and shall have the right to select the managing underwriter to administer any underwritten shelf takedowns provided the selection is reasonably acceptable to us.

The foregoing description of the Investment Agreements, the Registration Rights Agreement, the Issued Warrant, and the transactions contemplated thereby are not complete and are qualified in their entirety by reference to the full text of the Investment Agreements, which are filed as Exhibits 10.18–20 to this Annual Report on Form 10-K, the Registration Rights Agreement, which is filed as Exhibit 10.21 to this Annual Report on Form 10-K, and the IssuedWarrant, which is filed as Exhibit 4.5 to this Annual Report on Form 10-K, and in each case incorporated by reference herein.

In connection with this capital raise, (i) Joseph Otting was unanimously approved byappointed as President and Chief Executive Officer of the BoardsCompany, effective as of April 1, 2024, (ii) Alessandro DiNello was named Non-Executive Chairman of the Company, effective as of April 1, 2024, (iii) the Board of Directors of both companies, Flagstar shareholders will receive 4.0151 sharesthe Company was reduced to ten members, and (iv) four new directors (Steven Mnuchin, Joseph Otting, Allen Puwalski and Milton Berlinski) were appointed to the Board.

Additionally, the Company announced on March 11, 2024 that it plans to submit to its stockholders a plan for the adoption and approval of New York Community Bancorp, Inc.at least a 1-3 reverse stock split of our common stock for each Flagstar share they own. Following completionand to increase the number of the merger, New York Community shareholders are expected to own 68% of the combined company, while Flagstar shareholders are expected to own 32% of the combined company. The new company will have $85 billion in total assets, operate nearly 400 traditional branches in nine states, 83 retail home lending offices across a 28-state footprint. It will be headquartered on Long Island, N.Y. with regional headquarters in Troy, Michigan, including Flagstar's mortgage operations.authorized shares

26

Both sets of shareholders approved the merger on August 4, 2021. The transaction is subject to the satisfaction of certain other customary closing conditions, including approvals from the NYSDFS, the FDIC, and the FRB.

24


Community Pledge Agreement with the National Community Reinvestment Coalition

On January 24, 2022, the Company and the National Community Reinvestment Coalition ("NCRC") announced the Company's commitment to provide $28 billion in loans, investments, and other financial support to communities and people of color, low- and moderate-income ("LMI") families and communities, and small businesses. The Company's Community Pledge Agreement was developed with NCRC and its members in conjunction with the Company's pending merger with Flagstar Bancorp, Inc. The agreement includes $22 billion in community lending and affordable housing commitments and $6 billion of residential mortgage originations to underserved and LMI borrowers, and in LMI and majority-minority neighborhoods over a five-year period. NYCB will also provide $542 million in loans to small businesses with less than $1 million in revenues and in LMI and majority-minority communities; $16.5 million in philanthropic support to nonprofit organizations that meet the needs of LMI and majority-minority communities and individuals; greater access to banking products and services; and the continuation of NYCB's responsible multi-family lending practices. The agreement is subject to the closing of the Flagstar merger. Absent the closing of the merger, the Company will continue to work with its community groups to provide financial and other support within its markets.

USDF Stablecoin Program Initiative

Part

of the Company's strategic initiatives unveiled duringcommon stock to at least 1,700,000,000 (or at least 566,670,000 in the second halfevent of 2021 is the development of a stablecoin infrastructure (the "USDF Stablecoin Program"). The report on stablecoins issued by the President's Working Group in November confirms our view that as an insured depository institution, the Company can play a vital role as digital currencies are brought within a regulated prudential framework. The Company, in conjunction with its strategic partner, Figure Technologies ("Figure") has been over the past several months, developing and assessing the USDF Stablecoin Program's systems, controls, processes, and features. Consistent with the development of any new product or program, this included three separate tests of those systems, controls, processes, and features during the third and fourth quarters of 2021 and earlier during the first quarter of 2022.

The Company has also engaged its regulators, including the NYSDFS and the FDIC, throughout this process and intends to request non-objection from the Superintendentapproval of the NYSDFS to engage in USDF Stablecoin Program activities, and any additional non-objection required by the FDIC. Assuming that timely non-objection is received, the Company expects to launch the USDF Stablecoin Program in late first-quarter 2022. At which point, the Bank's customers would be able to conduct USDF transactions upon demand, including (i) minting USDF stablecoin; (ii) transmitting and receiving USDF stablecoin; (iii) redeeming USDF stablecoin; and (iv) conducting any and all activities necessary or incidental to the USDF Stablecoin Program.reverse stock split).


ITEM

Item 1A. RISK FACTORSRisk Factors

There are various risks and uncertainties that are inherent to our business. Primary among these are (1) interest rate risk, which arises from movements in interest rates; (2) credit risk, which arises from an obligor’s failure to meet the terms of any contract with a bank or to otherwise perform as agreed; (3) risks related to our financial statements; (4) liquidity and dividend risk, which arises from a bank’s inability to meet its obligations when they come due without incurring unacceptable losses;losses, and related risks regarding our ability to pay dividends; (5) legal/compliance risk, which arises from violations of, or non-conformance with, laws, rules, regulations, prescribed practices, or ethical standards; (6) financial and market risk, which arises from changes in the value of portfolios of financial instruments;instruments, as well as other matters that may dilute the value of our securities; (7) strategic risk, which is the risk of loss arising from inadequate or failed internal processes, people,the execution of our strategic initiatives and systems;business strategies, including our acquisition and integration of other companies we acquire; (8) operational risk, which arises from problems with service or product delivery; and (9) reputational risk, which arises from negative public opinion resulting in a significant decline in stockholder value.

Following is a discussion of the material risks and uncertainties that could have a material adverse impact on our financial condition, results of operations, and the value of our shares. The failure to properly identify, monitor, and mitigate any of the below referenced risks, could result in increased regulatory risk and could potentially have an adverse impact on the Company. Additional risks that are not currently known to us, or that we currently believe to be immaterial, also may have a material effect on our financial condition and results of operations. This reportAnnual Report on Form 10-K is qualified in its entirety by those risk factors.

Summary of Risk Factors

Interest Rate Risks

COVID-19 Related Risk

COVID-19 has caused a significant global economic downturn which has adversely affectedChanges in interest rates could reduce our net interest income and is expected to continue to adversely affect many business.

25


Our business is dependent uponnegatively impact the ability and willingnessvalue of our customers to conduct bankingloans, securities, and other assets and have a material adverse effect on our cash flows, financial transactions, including the paymentcondition, results of their loan obligations. Specifically,operations, and capital.


Credit Risks
Our allowance for credit losses might not be sufficient to cover our actual losses, which would adversely impact our financial condition and results of operations.
Our concentration in multi-family loans and CRE loans could expose us to increased lending risks and related loan losses.
Our New York State multi-family loan portfolio could be adversely impacted by changes in legislation or regulations.
Economic weakness in the New York City metropolitan region could have an adverse impact on our financial condition.

Financial Statements Risks
Our accounting estimates and risk management processes rely on analytical and forecasting models.
Impairment in the carrying value of other intangible assets could negatively impact our financial condition.
We may fail to maintain effective internal controls, which could impact the accuracy and timeliness of financial reporting.

Liquidity and Dividend Risks
Failure to maintain an adequate level of liquidity could result in an inability to fulfill our financial obligations and also could subject us to material reputational and compliance risk.
Reduction or elimination of our quarterly cash dividend could have an adverse impact on the market price of our stock.
The inability to receive dividends from our subsidiary bank could have a material adverse effect on our financial condition or results of operations, and our ability to maintain or increase the current level of cash dividends we pay to our stockholders.
If we were to defer payments on our trust preferred capital debt securities or were in default under the related indentures, we would be prohibited from paying dividends or distributions on our common stock.
Dividends on our Series A, B and C Preferred Stock are discretionary and noncumulative, and may not be paid if such payment will result in our failure to comply with all applicable laws and regulations.

27


Our Series A, B, and C Preferred Stocks have preferential rights over common stockholders, potentially impacting our liquidity and financial condition.

Legal/Compliance Risks
Inability to fulfill minimum capital requirements could limit our ability to conduct or expand our business, pay a dividend, or result in termination of our FDIC deposit insurance, and thus impact our financial condition, our results of operations, and the market value of our stock.
Our results of operations could be materially affected by restrictions on our operations imposed by bank regulators, changes in bank regulation, or by our ability to comply with certain existing laws, rules, and regulations governing our industry.
As a Category IV banking organization, we are subject to stringent regulations, including reporting, capital stress testing, and liquidity risk management and non-compliance could result in regulatory risks and restrictions on our activities.
Noncompliance with the Bank Secrecy Act and anti-money laundering statutes/regulations could result in material financial loss.
Failure to comply with OFAC regulations could result in legal and reputational risks.
Our enterprise risk management framework may not be effective in mitigating the risks to which we are subject.
If tax authorities determine that we did not adequately provide for our taxes, our income tax expense could be increased.
We are subject to numerous consumer protection laws, and failure to comply with these laws could lead to sanctions.
Legislative and regulatory focus on data privacy and risks can subject us to heightened scrutiny and reputational damage.

Financial and Market Risks
Declines in economic conditions could adversely affect the values of loans we originate and securities in which we invest.
Rising mortgage rates and adverse changes in mortgage market conditions could reduce mortgage revenue.
We are highly dependent on the profitable operationAgencies to buy mortgage loans that we originate, and managementchanges in these entities or in the manner or volume of loans they purchase or their current roles could adversely affect our business and financial condition.
Changes in the servicing, origination, or underwriting guidelines or criteria required by the Agencies could adversely affect our business, financial condition and results of operations.
Future sales or issuances of our common stock or other securities (including warrants) or the issuance of securities pursuant to the exercise of warrants issued by us may dilute existing holders of our common stock and other securities, decrease the value of our common stock and other securities and adversely affect the market price of our common stock and other securities.

Strategic Risks
Extensive competition for loans and deposits could adversely affect the expansion of our business and our financial condition.
Limitations on our ability to grow our loan portfolios could adversely affect our ability to generate interest income.
The inability to engage in merger transactions, or to realize the anticipated benefits of acquisitions in which we might engage, could adversely affect our ability to compete with other financial institutions and weaken our financial performance.
We may be exposed to challenges in combining the operations of acquired or merged businesses, including our recent Flagstar acquisition and Signature acquisition, into our operations, which may prevent us from achieving the expected benefits from our merger and acquisition activities.
The success of the property securingSignature transaction will depend on a number of uncertain factors, including our decisions regarding the loan. If the impactfair value of the pandemic is prolonged, COVID-19assets acquired and the bargain purchase gain recorded on the transaction, which could have a significant adverse impact by reducingmaterially and adversely affect our financial condition, results of operations and future prospects.

Operational Risks
Our stress testing processes rely on analytical and forecasting models that may prove to be inadequate or inaccurate, which could adversely affect the revenue and cash flowseffectiveness of our borrowers, impacting the borrowers’strategic planning and our ability to repay their loan, increasing the riskpursue certain corporate goals.
The Company, entities that we have acquired, and certain of delinquenciesour service providers have experienced information technology security breaches and defaults,may be vulnerable to future security breaches, which have resulted in, and reducing the collateral value underlying the loans.

The COVID-19 pandemic has also ledcould result in, additional expenses, exposure to an increase in the numbercivil litigation, increased regulatory scrutiny, losses, and a loss of deferred loans the Company entered intocustomers.


28


We rely on third parties to perform certain key business functions, which may expose us to further operational risk.
Failure to keep pace with some of its borrowers in connection with the CARES Act-related loan deferral programs. At December 31, 2021, payment deferrals totaled $479 million or 1% of total loans compared to $2.6 billion or 6.1% of total loans at December 31, 2020. Despite the significant year-over-year improvement, the pandemic may continue totechnological changes could have a material adverse impact on our loan portfolio, particularly as businesses remain closed. Moreover, the New York City metropolitan region has been disproportionately impacted by COVID-19 relativeability to other regionscompete for loans and deposits, and therefore on our financial condition and results of the stateoperations.
The inability to attract and country. Accordingly, theretain key personnel could adversely impact from COVID-19 on the Companyour operations.
The transition to a new Chief Executive Officer will be critical to our success and our borrowersbusiness may be greater than on similar banks thatadversely impacted if we do not havesuccessfully manage the transition process in a similar geographic concentration.timely manner.

The Company has granted payment deferralsOur operations are dependent upon the soundness of other financial intermediaries and thus could expose us to borrowers that have experienced financial hardship due to COVID-19, and if those borrowers are unable to resume making payments, the Company will experience an increase in non-accrual loans, which could adversely affect the Company’s earnings and financial condition.systemic risk.

Consistent with the public encouragement provided generally by federal and state financial institution regulators after the spread of COVID-19 in the United States, the Company has attempted to work constructively with borrowers who have experienced financial hardshipWe may be terminated as a result of the pandemicservicer or subservicer or incur costs or liabilities if we do not satisfy servicing obligations.
We may be required to negotiate accommodationsrepurchase mortgage loans, pay fees or forbearance arrangements that temporarily reduce or defer the monthly payments dueindemnify buyers against losses.
We utilize third-party mortgage originators which subjects us to the Company. Generally, these accommodationsstrategic, reputation, compliance and operational risk.
We are for six months and allow customers to temporarily cease making principal and/or interest payments. In some cases, customers have received a second accommodation. As of December 31, 2021, $479 million of loans remained subject to a payment accommodation. If, upon the expiration of the deferral period, the borrower is still experiencing payment difficulties, the loan may become non-accrualvarious legal or regulatory investigations and the Company would begin collection activities. As a result, NPLs and related charge-offs may increase significantly in 2022. An increase in NPLs and charge-offs would cause the Company to increase its allowance for credit losses, which would adversely affect the Company’s earnings and financial condition.proceedings.

Customary means to collect non-performing assetsWe may be prohibited or impractical duringrequired to pay interest on mortgage escrow accounts under state law despite Federal preemption.
We could be exposed to fraud risks that affect our operations and reputation.

Reputational Risk
Damage to our reputation could significantly harm the COVID-19 pandemic,business we engage in, our competitive position and there is a risk that collateral securing a non-performing asset may deteriorate if the Company chooses not to, or is unable to, foreclose on a timely basis.growth prospects.

Governments in the areas in which the Company conducts its lending services have adopted or may adopt in the future regulations or promulgate executive orders that restrict or limit our ability to take certain actionsIncreasing scrutiny from customers, regulators, investors, and other stakeholders with respect to delinquent borrowers that we would otherwise take in the ordinary course of business, such as customary collectionour environmental, social, and foreclosure procedures. Executive orders that have been imposed restrict the ability of financial institutionsgovernance practices may impose additional costs on us or expose us to undertake residential and commercial foreclosures and evictions. There is a risk that the value of the collateral securing a non-accrual loan may deteriorate if the Company chooses not to,new or is unable to foreclose on the collateral on a timely basis.additional risks.


Interest Rate Risks

Changes in interest rates could reduce our net interest income and negatively impact the value of our loans, securities, and other assets. This could have a material adverse effect on our cash flows, financial condition, results of operations, and capital.

The cost of our deposits and short-term wholesale borrowings is largely based on short-term interest rates, the level of which is driven by the FOMC of the FRB. However, the yields generated by our loans and securities are typically driven by intermediate-term interest rates, which are set by the bond market and generally vary from day to day. The level of our net interest income is therefore influenced by movements in such interest rates, and the pace at which such movements occur. If the interest rates on our interest-bearing liabilities increase at a faster pace than the interest rates on our interest-earning assets, the result could be a reduction in net interest income and, with it, a

26


reduction in our earnings. Our net interest income and earnings would be similarly impacted were the interest rates on our interest-earning assets to decline more quickly than the interest rates on our interest-bearing liabilities.

In addition, such changes in interest rates could affect our ability to originate loans and attract and retain deposits; the fair values of our securities and other financial assets; the fair values of our liabilities; and the average lives of our loan and securities portfolios. Changes in interest rates also could have an effect on loan refinancing activity, which, in turn, would impact the amount of prepayment income we receive on our multi-family and CRE loans. Because prepayment income is recorded as interest income, the extent to which it increases or decreases during any given period could have a significant impact on the level of net interest income and net income we generate during that time.

Also, changes in interest rates could have an effect on the slope of the yield curve. If the yield curve were to invert or become flat, our net interest income and net interest margin could contract, adversely affecting our net income and cash flows, and the value of our assets. Moreover, higher inflation could lead to fluctuations in the value of our assets and liabilities and off-balance sheet exposures, and could result in lower equity market valuations of financial services companies.


Changes to and replacement of the LIBOR Benchmark Interest Rate may adversely affect our business, financial condition, and results of operations.

The Company has certain loans, interest rate swap agreements, investment securities, and debt obligations whose interest rate is indexed to LIBOR. In 2017, the FCA, which is responsible for regulating LIBOR, announced that the publication of LIBOR is not guaranteed beyond 2021. In December 2020, the administrator of LIBOR announced its intention to (i) cease the publication of the one-week and two-month U.S. dollar LIBOR after December 31, 2021, and (ii) cease the publication of all other tenors of U.S. dollar LIBOR (one, three, six, and 12-month LIBOR) after June 30, 2023, and on March 15, 2021, announced that it will permanently cease to publish most LIBOR settings beginning on January 1, 2022 and cease to publish the overnight, one-month, three-month, six-month, and 12-month U.S. dollar LIBOR settings on July 1, 2023. Accordingly, the FCA has stated that it does not intend to persuade or compel banks to submit to LIBOR after such respective dates. Until such time, however, FCA panel banks have agreed to continue to support LIBOR. In October 2021, the Federal bank regulatory agencies issued a Joint Statement on Managing the LIBOR Transition that offered their regulatory expectations and outlined potential supervisory and enforcement consequences for banks that fail to adequately plan for and implement the transition away from LIBOR. The failure to properly transition away from LIBOR may result in increased supervisory scrutiny. The implementation of a substitute index for the calculation of interest rates under the Company's loan agreements may result in disputes or litigation with counterparties over the appropriateness or comparability to LIBOR of the substitute index, which would have an adverse effect on the Company's results of operations. Even when robust fallback language is included, there can be no assurances that the replacement rate plus any spread adjustment will be economically equivalent to LIBOR, which could result in a lower interest rate being paid to the Company on such assets.

The Bank established a sub-committee of ALCO to address issues related to the phase out and transition from LIBOR. This sub-committee is led by our Chief Financial Officer and consists of personnel from various departments through the Bank including lending, loan administration, credit risk management, finance/treasury, including interest rate risk and liquidity management, information technology, and operations. The Company has LIBOR-based contracts that extend beyond June 20, 2023 included in loans and leases, securities, wholesale borrowings, derivative financial instruments, and long-term debt. The sub-committee has reviewed contract fallback language and noted that certain contracts will need updated provisions for the transition and is coordinating with impacted business lines. In complying with industry requirements, the Bank will not offer new LIBOR-based products after December 31, 2021.

The Alternative Reference Rates Committee (a group of private-market participants convened by the FRB and the FRB-NY) has identified SOFR as the recommended alternative to LIBOR. The use of SOFR as a substitute for LIBOR is voluntary and may not be suitable for all market participants. SOFR is calculated and observed differently than LIBOR. Given the manner in which SOFR is calculated, it is likely to be lower than LIBOR and is less likely to correlate with the funding costs of financial institutions. Market practices related to SOFR calculation conventions continue to develop and may vary. Inconsistent calculation conventions among financial products may expose is to increased basic rate and resultant costs.

27


Other alternatives to LIBOR also exist, but, because of the difference in how those alternatives are constructed, they may diverge significantly from LIBOR in a range of situations and market conditions.

Credit RisksRisk

A decline in the quality of our assets could result in higher losses and the need to set aside higher loan loss provisions, thus reducing our earnings and our stockholders’ equity.

The inability of our borrowers to repay their loans in accordance with their terms would likely necessitate an increase in our provision for credit losses, and therefore reduce our earnings.

The loans we originate for investment are primarily multi-family loans, CRE loans, and specialty finance loans and leases. Such loans are generally larger, and have higher risk-adjusted returns and shorter maturities, than the other loans we produce for investment. Our credit risk would ordinarily be expected to increase with the growth of our multi-family and CRE loan portfolios.

Payments on multi-family and CRE loans generally depend on the income generated by the underlying properties which, in turn, depends on their successful operation and management. The ability of our borrowers to repay these loans may be impacted by adverse conditions in the local real estate market and the local economy. While we seek to minimize these risks through our underwriting policies, which generally require that such loans be qualified on the basis of the collateral property’s cash flows, appraised value, and debt service coverage ratio, among other factors, there can be no assurance that our underwriting policies will protect us from credit-related losses or delinquencies.

To minimize the risks involved in our specialty finance lending and leasing, we participate in syndicated loans that are brought to us, and equipment loans and leases that are assigned to us, by a select group of nationally recognized sources, and generally are made to large corporate obligors, many of which are publicly traded, carry investment grade or near-investment grade ratings, and participate in stable industries nationwide. Each of our credits is secured with a perfected first security interest in the underlying collateral and structured as senior debt or as a non-cancelable lease.

We seek to minimize the risks involved in our other C&I lending by underwriting such loans on the basis of the cash flows produced by the business; by requiring that such loans be collateralized by various business assets, including inventory, equipment, and accounts receivable, among others; and by requiring personal guarantees. However, the capacity of a borrower to repay such a C&I loan is substantially dependent on the degree to which his or her business is successful. In addition, the collateral underlying other C&I loans may depreciate over time, may not be conducive to appraisal, or may fluctuate in value, based upon the results of operations of the business.

We also originate ADC loans, although to a far lesser degree than we originate multi-family and CRE loans. ADC financing typically involves a greater degree of credit risk than longer-term financing on multi-family and CRE properties. Risk of loss on an ADC loan largely depends upon the accuracy of the initial estimate of the property’s value at completion of construction or development, compared to the estimated costs (including interest) of construction. If the estimate of value proves to be inaccurate, the loan may be under-secured. While we seek to minimize these risks by maintaining consistent lending policies and procedures, and rigorous underwriting standards, an error in such estimates, among other factors, could have a material adverse effect on the quality of our ADC loan portfolio, thereby resulting in losses or delinquencies.

The ability of our borrowers to repay their loans could be adversely impacted by a decline in real estate values and/or an increase in unemployment, which not only could result in our experiencing losses, but also could necessitate our recording a provision for credit losses. Either of these events would have an adverse impact on our net income. Although losses on the loans we produce have been comparatively limited, even during periods of economic weakness in our markets, we cannot guarantee that this will be our experience in future periods.

In addition to loan losses due to borrowers’ inability to repay their loans, downgrades in our internal loan classifications may result in a higher provision for credit losses and the ACL, a higher level of net charge-offs, and/or higher non-interest expenses.

28


Our allowance for credit losses might not be sufficient to cover our actual losses, which would adversely impact our financial condition and results of operations.

In addition to mitigating credit risk through our underwriting processes, we attempt to mitigate such risk through the establishment of an allowance for credit losses. The process of determining whether or not the allowance is sufficient to cover potential credit losses is based on the current expected credit loss model or CECL. This methodology is described in detail under “Critical Accounting Policies”Estimates” in Item 7, “Management’s Discussion and Analysis of Financial Condition and Results of Operations” in this report. CECL may result in greater volatility in the level of the ACL, depending on various assumptions and factors used in this model.

If the judgments and assumptions we make with regard to the allowance are incorrect, our allowance for losses on such loans might not be sufficient, and an additional provision for credit losses might need to be made. Depending on the amount of such loan loss provisions, the adverse impact on our earnings could be material.

In addition,


29


growth in our loan portfolio may require us to increase the allowance for credit losses on such loans by making additional provisions, which would reduce our net income.

Furthermore, bank regulators have the authority to require us to make provisions for credit losses or otherwise recognize loan charge-offs following their periodic review of our loan portfolio, our underwriting procedures, and our allowance for losses on such loans. Any increase in the loan loss allowance or in loan charge-offs as required by such regulatory authorities could have a material adverse effect on our financial condition and results of operations.

Our concentration in multi-family loans and CRE loans could expose us to increased lending risks and related loan losses.

Our current business strategy is to continue to originate multi-family loans and to a lesser extent CRE loans.

At December 31, 2021, $34.62023, $37.3 billion or 76%44.0 percent of our total loans and leases, held for investment portfolio consisted of multi-family loans and $6.7$10.5 billion or 15%12.4 percent consisted of CRE loans. These types of loans generally expose a lender to greater risk of non-payment and loss than one-to-four family residential mortgage loans because repayment of the loans often depends on the successful operation of the properties and the sale of such properties securing the loans. Such loans typically involve larger loan balances to single borrowers or groups of related borrowers compared to one-to-four family residential loans. Also, many of our borrowers have more than one of these types of loans outstanding. Consequently, an adverse development with respect to one loan or one credit relationship can expose us to a significantly greater risk of loss compared to an adverse development with respect to a one-to-four family residential real estate loan. In addition, if loans that are collateralized by real estate become troubled and the value of the real estate has been significantly impaired, then we may not be able to recover the full contractual amount of principal and interest that we anticipated at the time we originated the loan, which could cause us to increase our provision for loan losses and adversely affect our operating results and financial condition.

The CRE loans we make are secured by income-producing properties such as office buildings, retail centers, mixed-use buildings, and multi-tenanted light industrial properties. At December 31, 2023, $3.4 billion, or 32.1 percent of our commercial real estate loan portfolio was secured by office buildings. We may incur future losses on commercial real estate loans due to declines in occupancy rates and rental rates in office buildings, which could occur as a result of less need for office space due to more people working from home or other factors.

Our New York State multi-family loan portfolio could be adversely impacted by changes in legislation or regulation which, in turn, could have a material adverse effect on our financial condition and results of operations.

On June 14, 2019, the New York State legislature passed the New York Housing Stability and Tenant Protection Act of 2019. This legislation represents the most extensive reform of New York State’s rent laws in several decades and generally limits a landlord’s ability to increase rents on rent regulated apartments and makes it more difficult to convert rent regulated apartments to market rate apartments. As a result, the value of the collateral located in New York State securing the Company’s multi-family loans or the future net operating income of such properties could potentially become impaired which, in turn, could have a material adverse effect on our financial condition and results of operations. To date, the Company has not experienced any material negative impacts as a result of this legislation.

Economic weakness in the New York City metropolitan region, where the majority of the properties collateralizing our multi-family, CRE, and ADC loans, and the majority of the businesses collateralizing our other C&I loans, are located could have an adverse impact on our financial condition and results of operations.

Our business depends significantly on general economic conditions in the New York City metropolitan region, where the majority of the buildings and properties securing the multi-family, CRE, and ADC loans we originate for investment and the businesses of the customers to whom we make our other C&I loans are located.

29


Accordingly, the ability of our borrowers to repay their loans, and the value of the collateral securing such loans, may be significantly affected by economic conditions in this region, including changes in the local real estate market. A significant decline in general economic conditions caused by inflation, recession, unemployment, acts of terrorism, extreme weather, or other factors beyond our control, could therefore have an adverse effect on our financial condition and results of operations. In addition, because multi-family and CRE loans represent the majority of the loans in our portfolio, a decline in tenant occupancy or rents, due to such factors, or for other reasons, such as new legislation, could adversely impact the ability of our borrowers to repay their loans on a timely basis, which could have a negative impact on our net income.

Furthermore, economic or market turmoil could occur in the near or long term. This could negatively affect our business, our financial condition, and our results of operations, as well as our ability to maintain or increase the level of cash dividends we currently pay to our stockholders.


30


Financial Statements Risk

Changes in accounting standards or interpretation of new or existing standards may affect how we report our financial condition and results of operations.

From time to time the FASB and the SEC change accounting regulations and reporting standards that govern the preparation of our financial statements. In addition, the FASB, SEC, and bank regulators, may revise their previous interpretations regarding existing accounting regulations and the application of these accounting standards. These changes can be difficult to predict and can materially impact how to record and report our financial condition and results of operations. In some cases, there could be a requirement to apply a new or revised accounting standard retroactively, resulting in the restatement of prior period financial statements.

Our accounting estimates and risk management processes rely on analytical and forecasting models.

The processes we use to estimate expected losses and to measure the fair value of financial instruments, as well as the processes used to estimate the effects of changing interest rates and other market measures on our financial condition and results of operations, depends upon the use of analytical and forecasting models. These models reflect assumptions that may not be accurate, particularly in times of market stress or other unforeseen circumstances. Even if these assumptions are adequate, the models may prove to be inadequate or inaccurate because of other flaws in their design or their implementation. If the models that we use for interest rate risk and asset-liability management are inadequate, we may incur increased or unexpected losses upon changes in market interest rates or other market measures. If the models that we use for determining our expected losses are inadequate, the allowance for loan losses may not be sufficient to support future charge-offs. If the models that we use to measure the fair value of financial instruments are inadequate, the fair value of such financial instruments may fluctuate unexpectedly or may not accurately reflect what we could realize upon sale or settlement of such financial instruments. Any such failure in our analytical or forecasting models could have a material adverse effect on our business, financial condition and results of operations.

Impairment in the carrying value of goodwill and other intangible assets could negatively impact our financial condition and results of operations.

At December 31, 2021, goodwill and2023, other intangible assets, primarily core deposit intangibles, totaled $2.4 billion. Goodwill is reviewed$625 million. We review our other intangible assets for impairment at least annually or more frequently if events or changes in circumstances indicate that the carrying value may not be recoverable. A significant decline in expected future cash flows, a material change in interest rates, a significant adverse change in the business climate, slower growth rates, or a significant or sustained decline in the price of our common stockdeposits may necessitate taking additional charges in the future related to the impairment of goodwill and other intangible assets. The amount of any impairment charge could be significant and could have a material adverse impact on our financial condition and results of operations.

We may fail to maintain effective internal controls, which could impact the accuracy and timeliness of financial reporting.

We recognize the critical importance of maintaining effective internal controls over financial reporting to ensure accurate and timely financial reporting, prevent fraud, and maintain investor confidence. We have implemented a system of internal controls that is regularly reviewed and updated. However, there is a risk that we may fail to maintain an effective system of internal controls, which could impair our ability to report financial results accurately and in a timely manner. These risks include human error, misconduct, inadequate processes, fraud, data breaches, and non-compliance with laws and regulations. We also acknowledge the challenges posed by changes in processes, procedures, technologies, employee turnover, and labor shortages. We have identified certain material weaknesses described in Item 9A of this Annual Report on Form 10-K and may discover additional future material weaknesses or significant deficiencies, which could divert management attention and increase our expenses, in order to correct the weaknesses or deficiencies in our controls. A "material weakness" is a deficiency, or a combination of deficiencies, in internal controls over financial reporting such that there is a reasonable possibility that a material misstatement of our annual or interim financial statements would not be prevented or detected on a timely basis. Control weaknesses or failures could result in financial losses, reputational harm, loss of investor confidence, regulatory actions, and limitations on our business activities.
30


Liquidity and Dividend Risks

Failure to maintain an adequate level of liquidity could result in an inability to fulfill our financial obligations and also could subject us to material reputational and compliance risk.

Our primary sources of liquidity are the retail and institutional deposits we gather or acquire in connection with acquisitions, and the brokered deposits we accept; borrowed funds, primarily in the form of wholesale borrowings from the FHLB-NY and various Wall Street brokerage firms; cash flows generated through the repayment and sale of loans; and cash flows generated through the repayment and sale of securities. In addition, and depending on current market conditions, we have the ability to access the capital markets from time to time to generate additional liquidity.

Deposit flows, calls of investment securities and wholesale borrowings, and the prepayment of loans and mortgage-related securities are strongly influenced by such external factors as the direction of interest rates, whether actual or perceived; local and national economic conditions; and competition for deposits and loans in the markets we serve. Deposit outflows can occur for a number of reasons, including clients seeking higher yields, clients with uninsured deposits may seek greater financial security or clients may simply prefer to do business with our competitors, or for other reasons. The withdrawal of more deposits than we anticipate could have an adverse impact on our profitability as this source of funding, if not replaced by similar deposit funding, would need to be


31


replaced with more expensive wholesale funding, the sale of interest-earning assets, other sources of funding, or a combination of the two.them all. The replacement of deposit funding with wholesale funding could cause our overall cost of funds to increase, which would reduce our net interest income and results of operations. A decline in interest-earning assets would also lower our net interest income and results of operations. As of December 31, 2023, approximately 35.9 percent of our total deposits of $81.5 billion were not FDIC-insured.

In addition, large-scale withdrawals of brokered or institutional deposits could require us to pay significantly higher interest rates on our retail deposits or on other wholesale funding sources, which would have an adverse impact on our net interest income and net income. Furthermore, changes to the FHLB-NY’s underwriting guidelines for wholesale borrowings or lending policies may limit or restrict our ability to borrow, and therefore could have a significant adverse impact on our liquidity. A decline in available funding could adversely impact our ability to originate loans, invest in securities, and meet our expenses, or to fulfill such obligations as repaying our borrowings or meeting deposit withdrawal demands.

A downgrade Downgrades of the credit ratings of the Company and the Bank, such as those announced by certain credit rating agencies in both February and March 2024, could alsoresult in an acceleration in deposit outflows and additional collateral needs, which this far have been modest. They could adversely affect our access to liquidity and capital, and could significantly increase our cost of funds, trigger additional collateral or funding requirements, and decrease the number of investors and counterparties willing to lend to us or to purchase our securities. This could affect our growth, profitability, and financial condition, including our liquidity.


Reduction or elimination of our quarterly cash dividend could have an adverse impact on the market price of our common stock.

The holders of our common stock are only entitled to receive such dividends as our Board of Directors may declare out of funds available for such payments under applicable law and regulatory guidance, and, although we have historically declared cash dividends on our common stock, we are not required to do so. Furthermore, the payment of dividends falls under federal regulations that have grown more stringent in recent years. While we pay our quarterly cash dividend in compliance with current regulations, such regulations could change in the future. As a result of our acquisitions of Flagstar and Signature, we are required to seek regulatory approval from the OCC for the payment of any dividend to the Parent Company through at least the period ending November 1, 2024, which could restrict our ability to pay the common stock dividend. In the Company’s January 31, 2024 earnings release for the fourth quarter and year ended December 31, 2023, the Company announced that its Board of Directors reduced the Company’s quarterly cash dividend to $0.05 per common share to accelerate the building of capital to support our balance sheet as a Category IV banking organization. Following the issuance of that earnings release, the market price of our common stock experienced a decline. On March 7, 2024, the Company announced that future quarterly cash dividends on shares of the Company's common stock would be further reduced to $0.01 per share. Any further reduction or elimination of our common stock dividend in the future due to actions to build capital or the inability to receive required regulatory approvals, or for any other reason, could adversely affect the market price of our common stock.

The inability to receive dividends from our subsidiary bank could have a material adverse effect on our financial condition or results of operations, as well as our ability to maintain or increase the current level of cash dividends we pay to our stockholders.

The Parent Company (i.e., the company on an unconsolidated basis) is a separate and distinct legal entity from the Bank, and a substantial portion of the revenues the Parent Company receives consists of dividends from the Bank. These dividends are the primary funding source for the dividends we pay on our common stock and the interest and principal payments on our debt. Various federal and state laws and regulations limit the amount of dividends that a bank may pay to its parent company. In addition, our right to participate in a distribution of assets upon the liquidation or reorganization of a subsidiary may be subject to the prior claims of the subsidiary’s creditors. As a result of our acquisitions of Flagstar and Signature, we are required to seek regulatory approval from the OCC for the payment of any dividend to the Bancorp through at least the period ending November 1, 2024. If the Bank is unable to pay dividends to the Parent Company, we might not be able to service our debt, pay our obligations, or pay dividends on our common stock.

If we were to defer payments on our trust preferred capital debt securities or were in default under the related indentures, we would be prohibited from paying dividends or distributions on our common stock.

The terms of our outstanding trust preferred capital debt securities prohibit us from (1) declaring or paying any dividends or distributions on our capital stock, including our common stock; or (2) purchasing, acquiring, or making a liquidation payment on such stock, under the following circumstances: (a) if an event of default has occurred and is continuing under the applicable indenture; (b) if we are in default with respect to a payment under the guarantee of the related trust preferred securities; or (c) if we have given notice of our election to defer interest payments but the related deferral period has not yet

32


commenced, or a deferral period is continuing. In addition, without notice to, or consent from, the holders of our common stock, we may issue additional series of trust preferred capital debt securities with similar terms, or enter into other financing agreements, that limit our ability to pay dividends on our common stock.

31


Dividends on theour Series A Preferred Stock, Series B Preferred Stock and Series C Preferred Stock are discretionary and noncumulative, and may not be paid if such payment will result in our failure to comply with all applicable laws and regulations.

Dividends on theour Series A Preferred Stock, Series B Preferred Stock and Series C Preferred Stock are discretionary and noncumulative. If our Board of Directors (or any duly authorized committee of the Board) does not authorize and declare a dividend on (a) the Series A Preferred Stock for any dividend period, holders of the depositarydepository shares will not be entitled to receive any dividend for that dividend period, and the unpaid dividend will cease to accrue and be payable. Wepayable, or (b)Series B Preferred Stock and Series C Preferred Stock, the holders thereof will not be entitled to receive any dividend for that dividend period. For our Series A Preferred Stock, we have no obligation to pay dividends accrued for a dividend period after the dividend payment date for that period if our Board of Directors (or any duly authorized committee thereof) has not declared a dividend before the related dividend payment date, whether or not dividends on the Series A Preferred Stock or any other series of our preferred stock or our common stock are declared for any future dividend period. Dividends on our Series B Preferred Stock and Series C Preferred Stock are payable at a rate of 13 percent per annum, payable quarterly and in arrears. Additionally, under the FRB’s capital rules, dividends on the Series A Preferred Stock, Series B Preferred Stock and Series C Preferred Stock may only be paid out of our net income, retained earnings, or surplus related to other additional tier 1 capital instruments.

If the non-payment of dividends on Series A Preferred Stock, Series B Preferred Stock and Series C Preferred Stock for any dividend period would cause the Company to fail to comply with any applicable law or regulation, or any agreement we may enter into with our regulators from time to time, then we would not be able to declare or pay a dividend for such dividend period. In such a case,


Our Series A Preferred Stock, Series B Preferred Stock and Series C Preferred Stock initially have rights, preferences and privileges that are not held by, and are preferential to the rights of, our common stockholders, which could adversely affect our liquidity and financial condition.

The holders of our Series A Preferred Stock, Series B Preferred Stock and Series C Preferred Stock initially have the depositary shares will not be entitledright to receive a payment on account of the distribution of assets on any dividend for that dividend period,voluntary or involuntary liquidation, dissolution or winding up of our business before any payment may be made to holders of our common stock. Following the satisfaction of the liquidation preference, the Series B Preferred Stock and Series C Preferred Stock participates with our common stock on an as-converted basis in a liquidation, dissolution or winding up of the unpaid dividend will ceaseCompany. Our obligations to accruethe holders of our Series A Preferred Stock, Series B Preferred Stock and be payable.Series C Preferred Stock could limit our ability to obtain additional financing, which could have an adverse effect on our financial condition. The preferential rights could also result in divergent interests between the holders of our common stock, Series A Preferred Stock, Series B Preferred Stock, Series C Preferred Stock and other classes of securities.

Legal/Compliance Risks

Inability to fulfill minimum capital requirements could limit our ability to conduct or expand our business, pay a dividend, or result in termination of our FDIC deposit insurance, and thus impact our financial condition, our results of operations, and the market value of our stock.

We are subject to the comprehensive, consolidated supervision and regulation set forth by the FRB.FRB and the OCC. Such regulation includes, among other matters, the level of leverage and risk-based capital ratios we are required to maintain. Depending on general economic conditions, changes in our capital position could have a materially adverse impact on our financial condition and risk profile, and also could limit our ability to grow through acquisitions or otherwise. Compliance with regulatory capital requirements may limit our ability to engage in operations that require the intensive use of capital and therefore could adversely affect our ability to maintain our current level of business or expand.

Furthermore, it is possible that future regulatory changes could result in more stringent capital or liquidity requirements, including increases in the levels of regulatory capital we are required to maintain and changes in the way capital or liquidity is measured for regulatory purposes, either of which could adversely affect our business and our ability to expand. For example, federal banking regulations adopted under Basel III standards require bank holding companies and banks to undertake significant activities to demonstrate compliance with higher capital requirements. Any additional requirements to increase our capital ratios or liquidity could necessitate our liquidating certain assets, perhaps on terms that are unfavorable to us or that are contrary to our business plans. In addition, such requirements could also compel us to issue additional securities, thus diluting the value of our common stock.

In addition, failure to meet established capital requirements could result in the FRB and/or OCC placing limitations or


33


conditions on our activities and further restricting the commencement of new activities. The failure to meet applicable capital guidelines could subject us to a variety of enforcement remedies available to the federal regulatory authorities, including limiting our ability to pay dividends; issuing a directive to increase our capital; and terminating our FDIC deposit insurance.

Our results of operations could be materially affected by the imposition of restrictions on our operations by bank regulators, further changes in bank regulation, or by our ability to comply with certain existing laws, rules, and regulations governing our industry.

We are subject to regulation, supervision, and examination by the following entities: (1) the NYSDFS;OCC; (2) the FDIC; (3) the FRB-NY; and (4) the CFPB, which was established under the Dodd-Frank Actas well as state licensing restrictions and given broad authority to regulate financial service providers and financiallimitations regarding certain consumer finance products.

Such regulation and supervision govern the activities in which a bank holding company and its banking subsidiaries may engage, and are intended primarily for the protection of the DIF, the banking system in general, and

32


bank customers, rather than for the benefit of a company’s stockholders. These regulatory authorities have extensive discretion in connection with their supervisory and enforcement activities, including with respect to the imposition of restrictions on the operation of a bank or a bank holding company, the imposition of significant fines, the ability to delay or deny merger or other regulatory applications, the payment of dividends, the classification of assets by a bank, and the adequacy of a bank’s allowance for loan losses, among other matters. Failure to comply (or to ensure that our agents and third-party service providers comply) with laws, regulations, or policies, including our failure to obtain any necessary state or local licenses, could result in enforcement actions or sanctions by regulatory agencies, civil money penalties, and/or reputational damage, which could have a material adverse effect on our business, financial condition, or results of operations. Penalties for such violations may also include: revocation of licenses; fines and other monetary penalties; civil and criminal liability; substantially reduced payments by borrowers; modification of the original terms of loans, permanent forgiveness of debt, or inability to, directly or indirectly, collect all or a part of the principal of or interest on loans provided by the Bank. Changes in such regulation and supervision, or changes in regulation or enforcement by such authorities, whether in the form of policy, regulations, legislation, rules, orders, enforcement actions, ratings, or decisions, could have a material impact on the Company, our subsidiary bank and other affiliates, and our operations. In addition, failure of the Company or the Bank to comply with such regulations could have a material adverse effect on our earnings and capital.

See “Regulation and Supervision” in Part I, Item 1, “Business” earlier in this filing for a detailed description of the federal, state, and local regulations to which the Company and the Bank are subject.


As a Category IV banking organization with over $100 billion in assets, we are subject to stringent regulations, including reporting, capital stress testing, and liquidity risk management. Non-compliance could result in regulatory risks and restrictions on our activities.

As a result of the Signature transaction, our total assets exceeded $100 billion and therefore we became classified as a Category IV banking organization under the rules issued by the federal banking agencies that tailor the application of enhanced prudential standards to large bank holding companies and the capital and liquidity rules to large bank holding companies and depository institutions under the Dodd-Frank Act and the Economic Growth, Regulatory Relief, and Consumer Protection Act. As a Category IV banking organization we are subject to enhanced liquidity risk management requirements which include reporting, liquidity stress testing, a liquidity buffer and resolution planning, subject to the applicable transition periods. If we were to meet or exceed certain other thresholds for asset size, we would become subject to additional requirements. Failure to meet these requirements could expose us to compliance risks, higher penalties, increased expectations, and limitations on our activities. As a Category IV banking organization, we are required to implement and maintain an adequate liquidity risk management and monitoring process to ensure compliance with these requirements, and our failure to ensure compliance may have adverse consequences on our operations, reputation and future profitability. We anticipate incurring significant expenses to develop policies, programs, and systems that comply with the enhanced standards applicable to us.

Noncompliance with the Bank Secrecy Act and other anti-money laundering statutes and regulations could result in material financial loss.

The BSA and the USA Patriot Act contain anti-money laundering and financial transparency provisions intended to detect and prevent the use of the U.S. financial system for money laundering and terrorist financing activities. The BSA, as amended by the USA Patriot Act, requires depository institutions to undertake activities including maintaining an anti-money laundering program, verifying the identity of clients, monitoring for and reporting suspicious transactions, reporting on cash transactions above a certain threshold, and responding to requests for information by regulatory authorities and law enforcement agencies. FINCEN, a unit of the U.S. Treasury Department that administers the BSA, is authorized to impose significant civil monetary penalties for violations of these requirements. FailureIf our BSA policies, procedures and systems are deemed to maintainbe deficient, or the BSA policies, procedures and implement adequate programssystems of the financial institutions that we acquire in the future are deficient, we would be subject to combat money laundering and terrorist financing activities could also result in reputational risk forand potential liability, including fines and regulatory actions such as restrictions on our ability to pay

34


dividends and the Company.necessity to obtain regulatory approvals to proceed with certain aspects of our business plan, including our acquisition plans, which would negatively impact our business, financial condition and results of operations.

Failure to comply with OFAC regulations could result in legal and reputational risks.

The United States has imposed economic sanctions that affect transactions with designated foreign countries, foreign nationals, and other potentially exposed persons. These are typically referred to as the "OFAC" rules, given their administration by the United States Treasury Department Office of Foreign Assets Control. Failure to comply with these sanctions could have serious legal and reputational consequences.

Our enterprise risk management framework may not be effective in mitigating the risks to which we are subject, based upon the size, scope, and complexity of the Company.

As a financial institution, we are subject to a number of risks, including interest rate, credit, liquidity, legal/compliance, market, strategic, operational, and reputational. Our ERM framework is designed to minimize the risks to which we are subject, as well as any losses stemming from such risks. Although we seek to identify, measure, monitor, report, and control our exposure to such risks, and employ a broad and diverse set of risk monitoring and mitigation techniques in the process, those techniques are inherently limited because they cannot anticipate the existence or development of risks that are currently unknown and unanticipated.

For example, economic and market conditions, heightened legislative and regulatory scrutiny of the financial services industry, and increases in the overall complexity of our operations, among other developments, have resulted in the creation of a variety of risks that were previously unknown and unanticipated, highlighting the intrinsic limitations of our risk monitoring and mitigation techniques. As a result, the further development of previously unknown or unanticipated risks may result in our incurring losses in the future that could adversely impact our financial condition and results of operations. Furthermore, an ineffective ERM framework, as well as other risk factors, could result in a material increase in our FDIC insurance premiums.


If federal, state, or local tax authorities were to determine that we did not adequately provide for our taxes, our income tax expense could be increased, adversely affecting our earnings.

The amount of income taxes we are required to pay on our earnings is based on federal, state, and local legislation and regulations. We provide for current and deferred taxes in our financial statements, based on our results of operations, business activity, legal structure, interpretation of tax statutes, assessment of risk of adjustment upon

33


audit, and application of financial accounting standards. We may take tax return filing positions for which the final determination of tax is uncertain, and our net income and earnings per share could be reduced if a federal, state, or local authority were to assess additional taxes that have not been provided for in our consolidated financial statements. In addition, there can be no assurance that we will achieve our anticipated effective tax rate. Unanticipated changes in tax laws or related regulatory or judicial guidance, or an audit assessment that denies previously recognized tax benefits, could result in our recording tax expenses that materially reduce our net income.


We are subject to numerous laws designed to protect consumers, including the Community Reinvestment Act and fair lending laws, and failure to comply with these laws could lead to a wide variety of sanctions.

The CRA requires the Federal Reserve and OCC to assess our performance in meeting the credit needs of the communities we serve, including low- and moderate-income neighborhoods. If the Federal Reserve or OCC determines that we need to improve our performance or are in substantial non-compliance with CRA requirements, various adverse regulatory consequences may ensue. In addition, the Equal Credit Opportunity Act, the Fair Housing Act and other fair lending laws and regulations impose nondiscriminatory lending requirements on financial institutions. The CFPB, the U.S. Department of Justice and other federal agencies are responsible for enforcing these laws and regulations. The CFPB is also authorized to prescribe rules applicable to any covered person or service provider, identifying and prohibiting acts or practices that are “unfair, deceptive, or abusive” in connection with any transaction with a consumer for a consumer financial product or service, or the offering of a consumer financial product or service. A successful regulatory challenge to an institution’s performance under the CRA, fair lending laws or regulations, or consumer lending laws and regulations could result in a wide variety of sanctions, including damages and civil money penalties, injunctive relief, restrictions on mergers and acquisitions activity, restrictions on expansion, and restrictions on entering new business lines. Private parties may also have the ability to challenge an institution’s performance under fair lending laws in private class action litigation. Such actions could have a material adverse effect on our business, financial condition and results of operations. Additionally, state attorneys general have indicated that they intend to take a more active role in enforcing consumer protection laws, including through use of Dodd-Frank Act provisions that authorize state attorneys general to enforce certain provisions of federal consumer financial laws and obtain civil money

35


penalties and other relief available to the CFPB. If we become subject to such investigation, the required response could result in substantial costs and a diversion of the attention and resources of our management.

Legislative and regulatory focus on data privacy and risks can subject us to heightened scrutiny and reputational damage.

Data privacy and cybersecurity risks have become a subject of heightened legislative and regulatory focus in recent years. Federal bank regulatory agencies have proposed regulations to enhance cyber risk management standards, which would apply to us and our third-party service providers. These regulations focus on areas such as cyber risk governance, management of dependencies, incident response, cyber resilience, and situational awareness. State-level legislation and regulations have also been proposed or adopted, requiring notification to individuals in the event of a security breach of their personal data. Examples include the California Consumer Privacy Act (CCPA) and other state-level privacy, data protection, and data security laws and regulations. We collect, maintain, and use non-public personal information of our customers, clients, employees, and others. The sharing, use, disclosure, and protection of this information are governed by federal and state laws. Compliance with these laws is essential to protect the privacy of personal information and avoid potential liability and reputational damage. Failure to comply with privacy laws and regulations may expose us to fines, litigation, or regulatory enforcement actions. It may also require changes to our systems, business practices, or privacy policies, which could adversely impact our operating results. Privacy initiatives have imposed and will continue to impose additional operational burdens on us. These initiatives may limit our ability to pursue desirable business initiatives and increase the risks associated with any future use of personal data. New privacy and data protection initiatives, such as the CCPA, may require changes to policies, procedures, and technology for information security and data segregation. Non-compliance with these initiatives may make us more vulnerable to operational failures and subject to monetary penalties, litigation, or regulatory enforcement actions.

Financial and Market Risks

A decline in economic conditions could adversely affect the value of the loans we originate and the securities in which we invest.

Declines in real estate values and an increase in the financial stress on borrowers stemming from high unemployment or other adverse economic conditions, could negatively affect our borrowers and, in turn, the repayment of the loans in our portfolio. Deterioration in economic conditions also could subject us and our industry to increased regulatory scrutiny, and could result in an increase in loan delinquencies, an increase in problem assets and foreclosures, and a decline in the value of the collateral for our loans, which could reduce our customers’ borrowing power. Deterioration in local economic conditions could drive the level of loan losses beyond the level we have provided for in our loan loss allowance; this, in turn, could necessitate an increase in our provisions for loan losses, which would reduce our earnings and capital.

Furthermore, declines in the value of our investment securities could result in our having to record losses based on the other-than-temporary impairment of securities, which would reduce our earnings and also could reduce our capital. In addition, continued economic weakness could reduce the demand for our products and services, which would adversely impact our liquidity and the revenues we produce.


Rising mortgage rates and adverse changes in mortgage market conditions could reduce mortgage revenue.

The residential real estate mortgage lending business is sensitive to changes in interest rates, especially long-term interest rates. Lower interest rates generally increase the volume of mortgage originations, while higher interest rates generally cause that volume to decrease. Therefore, our mortgage performance is typically correlated to fluctuations in interest rates, primarily the 10-year U.S. Treasury rate. Historically, mortgage origination volume and sales for the Bank and for other financial institutions have risen and fallen in response to these and other factors. An increase in interest rates and/or a decrease in our mortgage production volume could have a materially adverse effect on our operating results. The 10-year U.S. Treasury rate was 3.97 percent at

Higher inflationDecember 31, 2023, and averaged 2.96 percent during 2023, 101 basis points higher than average rates experienced during 2022. The sustained higher rates experienced throughout 2023 negatively impacted the mortgage market including our loan origination volume and refinancing activity. In addition to being affected by interest rates, the secondary mortgage markets are also subject to investor demand for residential mortgage loans and investor yield requirements for these loans. These conditions may fluctuate or worsen in the future. Adverse market conditions, including increased volatility, changes in interest rates and mortgage spreads and reduced market demand, could result in greater risk in retaining mortgage loans pending their sale to investors. A prolonged period of secondary market illiquidity may result in a reduction of our loan mortgage production volume and could have a materially adverse effect on our financial condition and results of operations.


Our mortgage origination business is also subject to the cyclical and seasonal trends of the real estate market. The cyclical nature of our industry could lead to periods of growth in the mortgage and real estate markets followed by periods of declines

36


and losses in such markets. Seasonal trends have historically reflected the general patterns of residential and commercial real estate sales, which typically peak in the spring and summer seasons. One of the primary influences on our mortgage business is the aggregate demand for mortgage loans, which is affected by prevailing interest rates, housing supply and demand, residential construction trends, and overall economic conditions. If we are unable to respond to the cyclical nature of our industry by appropriately adjusting our operations or relying on the strength of our other product offerings during cyclical downturns, our business, financial condition, and results of operations could be adversely affected. Additionally, the fair value of our MSRs is highly sensitive to changes in interest rates and changes in market implied interest rate volatility. Decreases in interest rates can trigger an increase in actual repayments and market expectation for higher levels of repayments in the future which have a negative impact on MSR fair value. Conversely, higher rates typically drive lower repayments which results in an increase in the MSR fair value. We utilize derivatives to manage the impact of changes in the fair value of the MSRs. We may have basis risk and our financial results and operations.

Inflation can negativelyrisk management strategies, which rely on assumptions or projections, may not adequately mitigate the impact the Company by increasing our labor costs, through higher wages and higherof changes in interest rates, which may negatively affectinterest rate volatility, convexity, credit spreads, or prepayment speeds, and, as a result, the marketchange in the fair value of securities on our balance sheet, higher interest expenses on our deposits, especially CDs, and a higher cost of our borrowings. Additionally, higher inflation levels could lead to higher oil and gas prices, whichMSRs may negatively impact the net operating incomeearnings.


We are highly dependent on the propertiesAgencies to buy mortgage loans that we originate. Changes in these entities and changes in the manner or volume of loans they purchase or their current roles could adversely affect our business, financial condition and results of operations.

We generate mortgage revenues primarily from gains on the sale of single-family residential loans pursuant to programs currently offered by Fannie Mae, Freddie Mac, Ginnie Mae and other investors. These entities account for a substantial portion of the secondary market in residential mortgage loans. Any future changes in these programs, our eligibility to participate in such programs, their concentration limits with respect to loans purchased from us, the criteria for loans to be accepted or laws that significantly affect the activity of such entities could, in turn, result in a lower volume of corresponding loan originations or other administrative costs which we lend on and could impair a borrower's ability to repay their mortgage.

Recent supply chain constraints have led to higher inflation, which if sustained couldmay have a negativematerially adverse effect on our results of operations or could cause us to take other actions that would be materially detrimental. Fannie Mae and Freddie Mac remain in conservatorship and a path forward for them to emerge from conservatorship is unclear. Their roles could be reduced, modified or eliminated as a result of regulatory actions and the nature of their guarantees could be limited or eliminated relative to historical measurements. The elimination or modification of the traditional roles of Fannie Mae or Freddie Mac could create additional competition in the market and significantly and adversely affect our business, financial condition and results of operations.


Changes in the servicing, origination, or underwriting guidelines or criteria required by the Agencies could adversely affect our business, financial condition and results of operations.

We are required to follow specific guidelines or criteria that impact on the Company's asset valuesway we originate, underwrite or service loans. Guidelines include credit standards for mortgage loans, our staffing levels and on loan demand.

Longer-lasting supply chain constraintsother servicing practices, the servicing and ancillary fees that we may charge, modification standards and procedures, and the amount of non-reimbursable advances. We cannot negotiate these terms, which are subject to change at any time, with the Agencies. A significant change in various productsthese guidelines, which decreases the fees we charge or requires us to expend additional resources in providing mortgage services, could decrease our revenues or increase our costs, adversely affecting our business, financial condition, and labor marketsresults of operations. In addition, changes in the nature or extent of the guarantees provided by Fannie Mae and Freddie Mac or the insurance provided by the FHA could potentially exacerbate inflationalso have broad adverse market implications. The fees that we are required to pay to the Agencies for these guarantees have changed significantly over time and sustain it at elevated levels, even as growth slows. The riskany future increases in these fees would adversely affect our business, financial condition and results of sustained high inflation would likely be accompanied by monetary policy tightening with potential negative effects on various elevated asset classes.operations.


The market price and liquidity

Future sales or issuances of our common stock could be adversely affected if the economy were to weakenor other securities (including warrants) or the capital markets wereissuance of securities pursuant to experience volatility.

Thethe exercise of warrants issued by us may dilute existing holders of our common stock and other securities, decrease the value of our common stock and other securities and adversely affect the market price of our common stock could beand other securities.


During the fourth quarter of 2023, the Company took decisive actions to build capital, reinforce our balance sheet, strengthen our risk management processes, and better align the Company with relevant bank peers. We significantly built our reserve levels by recording a $552 million provision for loan losses, bringing our allowance for credit losses to $992 million at December 31, 2023, reflecting our actions to build reserves during the quarter to address weakness in the office sector, potential repricing risk in the multi-family portfolio and an increase in classified assets, which better aligns the Company with its relevant bank peers, including Category IV banks. We are also subject to significant fluctuations dueregulatory capital requirements and regulatory changes could result in more stringent capital or liquidity requirements, including increases in the levels of regulatory capital we are required to maintain and changes in investor sentiment regardingthe way capital or liquidity is measured for regulatory purposes. Accordingly, we may seek to raise additional capital, including by pursuing or effecting additional issuances of our operations or business prospects. Amongsecurities. Our ability to

37


raise additional capital (and the associated terms) depends on conditions in the capital markets, economic conditions, and a number of other factors, these risks may be affected by:

Operating results that vary from the expectations of our management or of securities analysts and investors;
Developments in our business or inincluding investor perceptions regarding the financial services sector generally;
Regulatory or legislative changes affecting ourand banking industry, generally or our business and operations;
Operating and securities price performance of companies that investors consider to be comparable to us;
Changes in estimates or recommendations by securities analysts or rating agencies;
Announcements of strategic developments, acquisitions, dispositions, financings, and other material events by us or our competitors;
Changes or volatility in global financial markets and economies, general market conditions interest or foreign exchange rates, stock, commodity, credit, or asset valuations; and
Significant fluctuations in the capital markets.

34


Economic or market turmoil could occur in the near or long term, which could negatively affect our business, governmental activities, and on our financial condition and our results of operations, as well as volatilityperformance.


On March 11, 2024, we completed an approximately $1.05 billion equity investment in the priceCompany in connection with which we sold and trading volumeissued (a) 76,630,965 shares of our common stock, at a purchase price per share of $2.00, (b) 192,062 shares of a new series of our preferred stock, par value $0.01 per share, designated as Series B Noncumulative Convertible Preferred Stock, at a price per share of $2,000, each share of which is convertible into 1,000 shares of common stock, (c) 256,307 shares of a new series of our preferred stock, par value $0.01 per share, designated as Series C Noncumulative Convertible Preferred Stock, at a price per share of $2,000, each share of which is convertible into 1,000 shares of common stock, and (d) warrants, which may not be exercised until 180 days after issuance thereof, affording the holder thereof the right, until the seven-year anniversary of the issuance of such warrant, to purchase for $2,500 per share, shares of a new class of non-voting, common-equivalent preferred stock of the Company, each share of which is convertible into 1,000 shares of common stock, and all of which shares of Series D NVCE Stock, upon issuance, will represent the right (on an as converted basis) to receive 315 million shares of common stock. Additionally, if the Company is not able to obtain certain approvals from our stockholders on or before September 9, 2024, then the Company will be required to issue to the investors in the March 2024 capital raise cash-settled warrants, which would become exercisable 60 days after their issuance if the such stockholder approvals still have not been obtained at such time, that provide the holder thereof the right, until the ten-year anniversary of the issuance of such warrant, to receive from the Company cash in an amount equal to (i) from issuance thereof until (and including) November 5, 2024, 160 percent of such holder’s investment in the Company in the March 2024 capital raise; (ii) on (and including) November 6, 2024 until (and including) January 4, 2025, 180 percent of such holder’s investment in the Company in the March 2024 capital raise; (iii) on (and including) January 5, 2025 until (and including) March 5, 2025, 200 percent of such holder’s investment in the Company in the March 2024 capital raise; and (iv) from and after March 6, 2025, 220 percent of such holder’s investment in the Company in the March 2024 capital raise, in each case, net of the exercise price (which is the amount of such holder’s investment in the Company in the March 2024 capital raise).

Our Board of Directors has the authority, in many situations, to issue additional shares of authorized but unissued stock (including securities convertible or exchangeable for stock) in public or private offerings without any vote of our shareholders. If, in the future, the Company is required or otherwise determines to raise additional capital (including through the issuance of additional securities), any such capital raise or issuance may dilute the percentage of ownership interest of existing shareholders, may dilute the per share book value of our common stock and may adversely affect the market price of our common stock and other securities. No assurance can be given that, in the future, the Company will be able to (i) raise any required capital or (ii) raise capital on terms that are beneficial to shareholders.

Strategic Risks

Extensive competition for loans and deposits could adversely affect our ability to expand our business, as well as our financial condition and results of operations.

Because our profitability stems from our ability to attract deposits and originate loans, our continued ability to compete for depositors and borrowers is critical to our success. Our success as a competitor depends on a number of factors, including our ability to develop, maintain, and build long-term relationships with our customers by providing them with convenience, in the form of multiple branch locations, extended hours of service, and access through alternative delivery channels; a broad and diverse selection of products and services; interest rates and service fees that compare favorably with those of our competitors; and skilled and knowledgeable personnel to assist our customers by addressing their financial needs. External factors that may impact our ability to compete include, among others, the entry of new lenders and depository institutions in our current markets and, with regard to lending, an increased focus on multi-family and CRE lending by existing competitors.

Limitations on our ability to grow our loan portfolios of multi-family and CRE loans could adversely affect our ability to generate interest income, as well our financial condition and results of operations, perhaps materially.

Although we also originate C&I and ADC loans, and invest in securities, our

Our portfolios of multi-family and CRE loans represent the largest portion of our asset mix (91%(56 percent of total loans held for investment as of December 31, 2021)2023). Our leadership position in these markets has been instrumental to our production of solid earnings and our consistent record of exceptional asset quality. We monitor the ratio of our multi-family, CRE, and ADC loans (as defined in the CRE Guidance) to our total risk-based capital to ensure that we are infor compliance with regulatory guidance. Any inability to grow our multi-family and CRE loan portfolios, could negatively impact our ability to grow our earnings per share.


38


The inability to engage in merger transactions, or to realize the anticipated benefits of acquisitions in which we might engage, could adversely affect our ability to compete with other financial institutions and weaken our financial performance.

Our ability to engage in future mergers and acquisitions would dependdepends on our ability to identify suitable merger partners and acquisition opportunities, our ability to finance and complete negotiated transactions at acceptable prices and on acceptable terms, and our ability to obtain the necessary stockholder and regulatory approvals.

If we are unable to engage in or complete a desired acquisition or merger transaction, our financial condition and results of operations could be adversely impacted. As acquisitions have been a significant source of deposits, the inability to complete a business combination could require that we increase the interest rates we pay on deposits in order to attract such funding through our current branch network, or that we increase our use of wholesale funds. Increasing our cost of funds could adversely impact our net interest income and our net income. Furthermore, the absence of acquisitions could impact our ability to fulfill our loan demand.

In addition, mergers and acquisitions can lead to uncertainties about the future on the part of customers and employees. Such uncertainties could cause customers and others to consider changing their existing business relationships with the company to be acquired, and could cause its employees to accept positions with other companies before the merger occurs. As a result, the ability of a company to attract and retain customers, and to attract, retain, and motivate key personnel, prior to a merger’s completion could be impaired.

Furthermore, no assurance can be given that acquired operations would not adversely affect our existing profitability; that we would be able to achieve results in the future similar to those achieved by our existing banking business; that we would be able to compete effectively in the market areas served by acquired branches; or that we would be able to manage any growth resulting from a transaction effectively. In particular, our ability to compete effectively in new markets would be dependent on our ability to understand those markets and their competitive

35


dynamics, and our ability to retain certain key employees from the acquired institution who know those markets better than we do.


The failure to receive the necessary regulatory approvals for the Company's acquisition of Flagstar Bancorp, Inc. in a timely manner, would have a material negative impact on our financial results, operations, and reputation.

On April 26, 2021, the Company entered into a definitive merger agreement under which it will acquire Flagstar Bancorp, Inc. in a 100% stock transaction. On August 4, 2021, both sets of shareholders approved the merger. Completion of the proposed merger remains subject to the receipt of required approvals from NYSDFS, the FDIC, and the FRB.

While both companies remain committed to continuing to seek all such approvals, the aforementioned regulatory approvals could be delayed or not obtained at all, including due to: an adverse development in either company's regulatory standing or in any other factors considered by regulators when granting such approvals, including factors not known at the present time.

If the merger is not completed for any reason, there

We may be various adverse consequencesexposed to challenges in combining the operations of acquired or merged businesses, including our recent Flagstar acquisition and the CompanySignature acquisition, into our operations, which may experience negative reactionsprevent us from the financial markets and from its customers and employees. The Company could also be subject to litigation related to any failure to complete the merger.

Additionally, NYCB has incurred and will continue to incur substantial expenses in connection with the negotiation and completion of the transaction completed by the merger agreement, as well as the costs and expenses incurred in connection with the merger. If the merger is not completed, NYCB would have incurred these expenses without realizingachieving the expected benefits from our merger and acquisition activities.


We may not be able to fully achieve the strategic objectives and operating efficiencies that we anticipate in our merger and acquisition activities. Inherent uncertainties exist in integrating the operations of an acquired business. We may lose our customers or the customers of acquired entities as a result of the merger.

The inabilityacquisitions. We may also lose key personnel from the acquired entity as a result of an acquisition. We may not discover all known and unknown factors when examining a company for acquisition or merger during the due diligence period. These factors could produce unintended and unexpected consequences for us including, but not limited to, receive dividendsincreased compliance and legal risks, including increased litigation or regulatory actions such as fines or restrictions related to the business practices or operations of the combined business. Undiscovered factors as a result of an acquisition or merger could bring civil, criminal, and financial liabilities against us, our management, and the management of those entities we acquire or merge with. In addition, if difficulties arise with respect to the integration process, we may incur higher integration expenses than anticipated and the economic benefits expected to result from the acquisition, including revenue growth and cost savings, might not occur or might not occur to the extent we expected. Failure to successfully integrate businesses that we acquire or merge with could have an adverse effect on our subsidiary bankprofitability, return on equity, return on assets, or our ability to implement our strategy, any of which in turn could have a material adverse effect on our business, financial condition orand results of operations.


The success of the Signature transaction will depend on a number of uncertain factors, including our decisions regarding the fair value of the assets acquired and the bargain purchase gain recorded on the transaction, which could materially and adversely affect our financial condition, results of operations as well as our ability to maintain or increaseand future prospects.

Our acquisition of certain assets of Signature Bank in March 2023 was an FDIC-assisted transaction and the current level of cash dividends we pay to our stockholders.

The Parent Company (i.e., the company on an unconsolidated basis) is a separate and distinct legal entity from the Bank, and a substantial portionexpedited nature of the revenuesFDIC-assisted transaction did not allow bidders the Parent Company receives consiststime and access to information customarily associated with preparing for and evaluating a negotiated transaction. As a result, fair value estimates we have made in connection with the Signature transaction may be inaccurate and subject to change, which could adversely impact our financial condition, results of dividendsoperations and future prospects. In addition, we may obtain additional information and evidence during the period of one year from March 20, 2023, the Bank. These dividends aredate we completed the primary funding source forSignature transaction, that may result in changes to the dividends we pay on our common stock and the interest and principal payments on our debt. Various federal and state laws and regulations limitestimated amounts recorded as of December 31, 2023, which could change the amount of dividends that a bank may paythe bargain purchase gain we have recorded. Adjustments to its parent company. In addition, our right to participate in a distribution of assets upon the liquidation or reorganization of a subsidiarythis gain may be subject torecorded based on additional information received after the prior claimsacquisition date that affect the measurement of the subsidiary’s creditors. Ifassets acquired and liabilities assumed and any decrease in the Bank is unable to pay dividends to the Parent Company, we might not be able to service our debt, pay our obligations, or pay dividends on our common stock.

Reduction or eliminationamount of our quarterly cash dividend could have an adverse impact on the market price of our common stock.

Holders of our common stock are only entitled to receive such dividends as our Board of Directors may declare out of funds available for such payments under applicable law and regulatory guidance, and althoughbargain purchase gain we have historically declared cash dividends onrecorded could also adversely impact our common stock, we are not required to do so. Furthermore, the paymentfinancial condition, results of dividends falls under federal regulations that have grown more stringent in recent years. While we pay our quarterly cash dividend in compliance with current regulations, such regulations could change in the future. Any reduction or elimination of our common stock dividend in theoperations and future could adversely affect the market price of our common stock.prospects.


39


Operational Risks

Our stress testing processes rely on analytical and forecasting models that may prove to be inadequate or inaccurate, which could adversely affect the effectiveness of our strategic planning and our ability to pursue certain corporate goals.

The processes we use to estimate the effects of changing interest rates, real estate values, and economic indicators such as unemployment on our financial condition and results of operations depend upon the use of analytical and forecasting models. These models reflect assumptions that may not be accurate, particularly in times of market stress or other unforeseen circumstances. Furthermore, even if our assumptions are accurate predictors of future performance, the models they are based on may prove to be inadequate or inaccurate because of other flaws in their design or implementation. If the models we use in the process of managing our interest rate and other risks prove to

36


be inadequate or inaccurate, we could incur increased or unexpected losses which, in turn, could adversely affect our earnings and capital. Additionally, failure by the Company to maintain compliance with strict capital, liquidity, and other stress test requirements under banking regulations could subject us to regulatory sanctions, including limitations on our ability to pay dividends.


The occurrence of any failure, breach, or interruption in service involving our systems or thoseCompany, entities that we have acquired, and certain of our service providers have experienced information technology security breaches and may be vulnerable to future security breaches. These incidents have resulted in, and could damage our reputation, cause losses, increase our expenses, and result in, additional expenses, exposure to civil litigation, increased regulatory scrutiny, losses, and a loss of customers, an increase in regulatory scrutiny, heightened cyber risk, or expose us to civil litigation and possibly financial liability, any of which could adversely impact our financial condition, results of operations, and the market price of our stock.

Communication and information systems are essential to the conduct of our business, as we use such systems, and those maintained and provided to us by third-party service providers, to manage our customer relationships, our general ledger, our deposits, and our loans. In addition, our operations rely on the secure processing, storage, and transmission of confidential and other information in our computer systems and networks. Although we, and entities we have acquired, take and have taken protective measures and endeavor to modify them as circumstances warrant, the security of our computer systems, software, and networks, as well as the security of the computer systems, software, and networks of certain of our service providers, have been, and may in the future be, vulnerable to breaches, unauthorized access, misuse, computer viruses, or other malicious code and cyber-attacks that have had and could have an impact on information security. With the rise and permeation of online and mobile banking, the financial services industry in particular faces substantial cybersecurity risk due to the type of sensitive information provided by customers. We, and our third-party service providers, have been and may in the future be subject to cybersecurity incidents, including those that involve the unauthorized access to customer information affecting other financial institutions and industry groups. Our systems and those of our third-party service providers and customers are under constant threat,regularly the subject of attempted attacks that are increasingly sophisticated, and it is possible that we or they could experience a significant event in the future that could adversely affect our business or operations.

In addition, breaches of security have in the past and may in the future occur through intentional or unintentional acts by those having authorized or unauthorized access to our confidential or other information, or that of our customers, clients, or counterparties. If one or more ofCertain previously identified cyber incidents have resulted, and future such events were to occur,could result, in the breach of confidential and other information processed and stored in and transmitted through, our computer systems and networksnetworks. These events could potentially be jeopardized, or could otherwise cause interruptions or malfunctions in our operations or the operations of our customers, clients, or counterparties. Further, we may not know that an attack occurred until well after the event. Even after discovering an attempt or breach occurred, we may not know the extent of the impact of the attack for some period of time. This could cause us significant reputational damage or result in our experiencing significant losses.


While we diligently assess applicable regulatory and legislative developments affecting our business, laws and regulations relating to cybersecurity have been frequently changing, imposing new requirements on us. In light of these conditions, we face the potential for additional regulatory scrutiny that will lead to increasing compliance and technology expenses and, in some cases, possible limitations on the achievement of our plans for growth and other strategic objectives.

Furthermore, we We may also be required to expend significant additional resources to modify our protective measures or investigate and remediate vulnerabilities or other exposures arising from operational and security risks. Additional expenditures may be requiredrisks, including expenses for third-party expert consultants or outside counsel. We are currently subject to litigation regarding cyber incidents, and we also may be subject to future litigation and financial losses that either are not insured against or not fully covered through any insurance we maintain.maintain or any third-party indemnification or insurance. We believe that the impact of any previously identified cyber incidents, including those subject to ongoing investigation and remediation, will not have a material financial impact.


In addition, we routinely transmit and receive personal, confidential, and proprietary information by e-mail and other electronic means. We have discussed, and worked with our customers, clients, and counterparties to develop secure transmission capabilities, but we do not have, and may be unable to put in place, secure capabilities with all of these constituents, and we may not be able to ensure that these third parties have appropriate controls in place to protect the confidentiality of such information. We maintain disclosure controls and procedures to ensure we will timely and sufficiently

40


notify our investors of material cybersecurity risks and incidents, including the associated financial, legal, or reputational consequence of such an event, as well as reviewing and updating any prior disclosures relating to the risk or event.

While we have established information security policies, procedures and procedures,controls, including an Incident Response Plan, to prevent or limit the impact of systems failures and interruptions, we may not be able to anticipate all possible security breaches that could affect our systems or information and there can be no assurance that such events will not occur or will be adequately prevented or mitigated by our policies, procedures and controls if they do.


37


The Company and the Bank rely on third parties to perform certain key business functions, which may expose us to further operational risk.

We outsource certain key aspects of our data processing to certain third-party providers. While we have selected these third-party providers carefully, we cannot control their actions. Our ability to deliver products and services to our customers, to adequately process and account for our customers’ transactions, or otherwise conduct our business could be adversely impacted by any disruption in the services provided by these third parties; their failure to handle current or higher volumes of usage; or any difficulties we may encounter in communicating with them. Replacing these third-party providers also could entail significant delay and expense.

Our third-party providers may be vulnerable to unauthorized access, computer viruses, phishing schemes, and other security breaches. Threats to information security also exist in the processing of customer information through various other third-party providers and their personnel. We may be required to expend significant additional resources to protect against the threat of such security breaches and computer viruses, or to alleviate problems caused by such security breaches or viruses. To the extent that the activities of our third-party providers or the activities of our customers involve the storage and transmission of confidential information, security breaches and viruses could expose us to claims, regulatory scrutiny, litigation, and other possible liabilities.

These types of third-party relationships are subject to increasingly demanding regulatory requirements and oversight by federal bank regulators (such as the Federal Reserve Board, the Office of the Comptroller of the Currency, and the Federal Deposit Insurance Corporation) and the CFPB. As a result, if our regulators conclude that we have not exercised adequate oversight and control over vendors and subcontractors or other ongoing third-party business relationships or that such third-parties have not performed appropriately, we could be subject to enforcement actions, including civil money penalties or other administrative or judicial penalties or fines, as well as requirements for consumer remediation. In addition, the Company may not be adequately insured against all types of losses resulting from third-party failures, and our insurance coverage may be inadequate to cover all losses resulting from systems failures or other disruptions to our banking services.


Failure to keep pace with technological changes could have a material adverse impact on our ability to compete for loans and deposits, and therefore on our financial condition and results of operations.

Financial products and services have become increasingly technology-driven. To some degree, ourOur ability to meet the needs of our customers competitively, and in a cost-efficient manner, is dependent on our ability to keep pace with technological advances and to invest in new technology as it becomes available. Many of our competitors have greater resources to invest in technology than we do and may be better equipped to invest in and market new technology-driven products and services.

The inability to attract and retain key personnel could adversely impact our operations.

To a large degree, our success depends on our ability to attract and retain key personnel whose expertise, knowledge of our markets, and years of industry experience would make them difficult to replace. Competition for skilled leaders in our industry can be intense, and we may not be able to hire or retain the people we would like to have working for us. The unexpected loss of services of one or more of our key personnel could have a material adverse impact on our business, given the specialized knowledge of such personnel and the difficulty of finding qualified replacements on a timely basis. Furthermore, our ability to attract and retain personnel with the skills and knowledge to support our business may require that we offer additional compensation and benefits that would reduce our earnings.

The transition to a new Chief Executive Officer will be critical to our success and our business may be adversely impacted if we do not successfully manage the transition process in a timely manner.

Our success depends, in part, on the effectiveness of our transition to our new CEO, Joseph M. Otting, on April 1, 2024. The new CEO will be critical to executing on and achieving our vision, strategic direction, culture, products, and technology. If we are unable to execute an orderly transition and successfully integrate the new CEO into our leadership team, our operations and financial conditions may be adversely affected.


41


Many aspects of our operations are dependent upon the soundness of other financial intermediaries and thus could expose us to systemic risk.

The soundness of many financial institutions may be closely interrelated as a result of relationships between them involving credit, trading, execution of transactions, and the like. As a result, concerns about, or a default or threatened default by, one institution could lead to significant market-wide liquidity and credit problems, losses, or defaults by other institutions. As such “systemic risk” may adversely affect the financial intermediaries with which we interact on a daily basis (such as clearing agencies, clearing houses, banks, and securities firms and exchanges), we could be adversely impacted as well.

We may be terminated as a servicer or subservicer or incur costs, liabilities, fines and other sanctions if we fail to satisfy our servicing obligations, including our obligations with respect to mortgage loan foreclosure actions.

At December 31, 2023, we had relationships with

10 owners of MSRs, excluding ourselves, for which we act as subservicer for the mortgage loans they own. Due to the limited number of relationships, discontinuation of existing agreements with those third parties or adverse changes in contractual terms could have a significant negative impact to our mortgage servicing revenue. The terms and conditions in which a master servicer may terminate subservicing contracts are broad and could be exercised at the discretion of the master servicer without requiring cause. Additionally, the master servicer directs the oversight of custodial deposits associated with serviced loans and, to the extent allowable, could choose to transfer the oversight of the Bank's custodial deposits to another depository institution. Further, as servicer or subservicer of loans, we have certain contractual obligations, including foreclosing on defaulted mortgage loans or, to the extent applicable, considering alternatives to foreclosure. If we commit a material breach of our obligations as servicer, we may be subject to termination if the breach is not cured within a specified period of time following notice, causing us to lose servicing income.


We may be required to repurchase mortgage loans, pay fees or indemnify buyers against losses.

When selling mortgage loans, we provide customary representations and warranties to purchasers, guarantors and insurers, including the Agencies, regarding loan originations. Agreements may require repurchasing, substituting mortgage loans, or indemnify buyers against losses, in the event we breach these representations or warranties. We may also face litigation and associated costs. With respect to loans that are originated through our broker or correspondent channels, the remedies against originating brokers or correspondents may be limited, posing financial risk. If repurchase and indemnity demands increase, our liquidity, results of operations and financial condition may also be adversely affected. Additionally, servicing errors may lead to reimbursement obligations, we may have a significant reduction to noninterest income or an increase to noninterest expense. We may incur legal and document-related expenses from foreclosure actions. These challenges could harm our reputation or negatively affect our servicing business and, as a result, our profitability.

The pipeline represents the UPB for loans the Agencies identified as potentially needing to be repurchased, and the estimated probable loss associated with these loans is included in our representation and warranty reserve. While we believe the level of the reserve to be appropriate, the reserve may not be adequate to cover losses for loans that we have sold or securitized for which we may be subsequently required to repurchase, pay fines or fees, or indemnify purchasers and insurers because of violations of customary representations and warranties. Additionally, the pipeline could increase substantially without warning. Our regulators, as part of their supervisory function, may review our representation and warranty reserve for losses and may recommend or require us to increase our reserve, based upon their judgment, which may differ from that of Management.

We utilize third-party mortgage originators which subjects us to strategic, reputation, compliance, and operational risk.

We utilize third-party mortgage originators, i.e. mortgage brokers and correspondent lenders, who are not our employees. These third parties originate mortgages or provide services to many different banks and other entities. Accordingly, they may have relationships with, or loyalties to, such banks and other parties that are different from those they have with or to us. Failure to maintain effective internal control over financial reporting in accordancegood relations with Section 404 of the Sarbanes-Oxley Act of 2002such third-party mortgage originators could have a materialnegative impact on our market share which would negatively impact our results of operations. We rely on third-party mortgage originators to originate and document the mortgage loans we purchase or originate. While we perform due diligence on the mortgage companies with whom we do business as well as review the loan files and loan documents we purchase to attempt to detect any irregularities or legal noncompliance, we have less control over these originators than employees of the Bank. Due to regulatory scrutiny, our third-party mortgage originators could choose or be required to either reduce the scope of their business or exit the mortgage origination business altogether. The TILA-RESPA Integrated Disclosure Rule issued by the CFPB establishes comprehensive mortgage disclosure requirements for lenders and settlement agents in connection with most closed-end consumer credit transactions secured by real property. The rule requires certain disclosures to be provided to consumers in connection with applying for and closing on a mortgage loan. The rule also mandates the use of specific disclosure forms, timing of

42


communicating information to borrowers, and certain record keeping requirements. The ongoing administrative burden and the system requirements associated with complying with these rules or potential changes to these rules could impact our mortgage volume and increase costs. These arrangements with third-party mortgage originators and the fees payable by us to such third parties could also be subject to future regulatory scrutiny and restrictions.

The Equal Credit Opportunity Act, The Consumer Protection Act and the Fair Housing Act prohibit discriminatory and other lending practices by lenders, including financial institutions. Mortgage and consumer lending practices raise compliance risks resulting from the detailed and complex nature of mortgage and consumer lending laws and regulations imposed by federal Regulatory Agencies as well as the relatively independent and diverse operating channels in which loans are originated. As we originate loans through various channels, we, and our third-party originators, are especially impacted by these laws and regulations and are required to implement appropriate policies and procedures to help ensure compliance with fair lending laws and regulations and to avoid lending practices that result in the disparate treatment of, or disparate impact to, borrowers across our various locations under multiple channels. Failure to comply with these laws and regulations, by us, or our third-party originators, could result in the Bank being liable for damages to individual borrowers, changes in business practices, or other imposed penalties.

We are subject to various legal or regulatory investigations and proceedings.

At any given time, we are involved with a number of legal and regulatory examinations as a part of reviews conducted by regulators and other parties, which may involve banking, securities, consumer protection, employment, tort, and numerous other laws and regulations. Proceedings or actions brought against us may result in judgments, settlements, fines, penalties, injunctions, business improvement orders, consent orders, supervisory agreements, restrictions on our business activities, or other results adverse to us, which could materially and negatively affect our business. If such claims and other matters are not resolved in a manner favorable to us, they may result in significant financial liability and/or adversely affect the market perception of us and our products and services as well as impact customer demand for those products and services. Some of the laws and regulations to which we are subject may provide a private right of action that a consumer or class of consumers may pursue to enforce these laws and regulations. We are currently subject to stockholder class and derivative actions which seek significant damages and other relief, and may be subject to similar actions in the future. Any financial liability or reputational damage could have a materially adverse effect on our business and, stock price.

in turn, on our financial condition and results of operations. Claims asserted against us can be highly complicated and slow to develop, making the outcome of such proceedings difficult to predict or estimate early in the process. As a public company,participant in the financial services industry, it is likely that we arewill be exposed to a high level of litigation and regulatory scrutiny relating to our business and operations. Although we establish accruals for legal or regulatory proceedings when information related to the loss contingencies represented by those matters indicates both that a loss is probable and that the amount of loss can be reasonably estimated, we do not have accruals for all legal or regulatory proceedings where we face a risk of loss. Due to the inherent subjectivity of the assessments and unpredictability of the outcome of legal and regulatory proceedings, amounts accrued may not represent the ultimate loss to us from the legal and regulatory proceedings in question. As a result, our ultimate losses may be significantly higher than the amounts accrued for legal loss contingencies. For further information, see Note 19 - Commitments and Contingencies and Item 3 - Legal Proceedings.


We may be required to maintain effective internal control over financial reportingpay interest on certain mortgage escrow accounts in accordance with Section 404certain state laws despite the Federal preemption under the National Bank Act.

In 2018, the Ninth Circuit Federal Court of Appeals held that California state law requiring mortgage servicers to pay interest on certain mortgage escrow accounts was not, as a matter of law, preempted by the National Bank Act (Lusnak v. Bank of America). This ruling goes against the position that regulators, national banks, and other federally-chartered financial institutions have taken regarding the preemption of state-law mortgage escrow interest requirements. The opinion issued by the Ninth Circuit Federal Court of Appeals is legal precedent only in certain parts of the Sarbanes-Oxley Actwestern United States. We are defending similar litigation in California, and are currently appealing a federal district court judgment against us in that case to the Ninth Circuit. We are arguing that the Lusnak case was wrongly decided; we believe our situation can be distinguished from Lusnak as a matter of 2002. Internal control over financial reportinglaw and California’s interest on escrow law should be preempted as a matter of fact. If the Ninth Circuit’s holding is complex and may be revised over time to adapt to changes in our business,more broadly adopted by other Federal Circuits, including those covering states that currently have enacted, or changes in applicable accounting rules. We

38


cannot assure you that our internal control over financial reporting will be effective in the future may enact, statutes requiring the payment of interest on escrow balances or if we would be required to retroactively credit interest on escrow funds, the Company’s earnings could be adversely affected.


43


We could be exposed to fraud risks that affect our operations and reputation.

We face significant risks related to fraud, which could result in financial loss, expensive litigation, and damage to our reputation. Our organization is exposed to various types of fraud, including fraud or theft by colleagues or outsiders and unauthorized transactions. We rely heavily on information provided by clients and third parties, and misrepresentations in this information can lead to funding loans that do not meet our expectations or on unfavorable terms. We bear the risk of loss associated with misrepresentations, and it can be challenging to recover any monetary losses suffered. We have implemented various controls and security measures, but the failure of any of these controls could result in a material weakness will not be discovered with respectfailure to a prior period for which we had previously believed that our internal control over financial reporting was effective.

If we are not able to maintaindetect or document effective internal control over financial reporting, our independent registered public accounting firm will not be able to certify as to the effectiveness of our internal control over financial reporting. Matters impacting our internal control over financial reporting may cause us to be unable to report our financial information onmitigate fraud risks in a timely basis, or may cause usmanner. We are committed to restate previously issued financial information,ongoing investments and thereby subject usattention to adverse regulatory consequences, including sanctions or investigations by the SEC, or violations of applicable stock exchange listing rules.

There could also be a negative reaction in the financial markets duecombat fraud and enhance our security measures to a loss of investor confidence in us and the reliability of our financial statements. Confidence in the reliability of our financial statements is also likely to suffer if we or our independent registered public accounting firm reports a material weakness in the effectiveness of our internal control over financial reporting. This could materially adversely affect us by, for example, leading to a decline in our stock price and impairing our ability to raise capital.protect against these risks.


Reputational Risk

Damage to our reputation could significantly harm the businesses we engage in, as well as our competitive position and prospects for growth.

Our ability to attract and retain investors, customers, clients, and employees could be adversely affected by damage to our reputation resulting from various sources, including employee misconduct, litigation, or regulatory outcomes; failure to deliver minimum standards of service and quality; compliance failures; unintentional disproportionate assessment of fees to customers of protected classes; unethical behavior; unintended disclosure of confidential information; and the activities of our clients, customers, and/or counterparties. Actions by the financial services industry in general, or by certain entities or individuals within it, also could have a significantly adverse impact on our reputation.

Our actual or perceived failure to identify and address various issues also could give rise to reputational risk that could significantly harm us and our business prospects, including failure to properly address operational risks. These issues include legal and regulatory requirements; consumer protection, fair lending, and privacy issues; properly maintaining customer and associated personal information; record keeping; protecting against money laundering; sales and trading practices; and ethical issues.


Increasing scrutiny and evolving expectations from customers, regulators, investors, and other stakeholders with respect to our environmental, social, and governance practices may impose additional costs on us or expose us to new or additional risks.

Companies are facing increasing scrutiny from customers, regulators, investors, and other stakeholders related to their environmental, social, and governance ("ESG") practices and disclosure. Investor advocacy groups, investment funds, and influential investors are also increasingly focused on these practices, especially as they relate to the environment, health and safety, diversity, labor conditions, and human rights. Increased ESG-related compliance costs could result in increases to our overall operational costs. Failure to adapt to or comply with regulatory requirements or investor or stakeholder expectations and standards could negatively impact our reputation, ability to do business with certain partners, and our stock price. New government regulations could also result in new or more stringent forms of ESG oversight and expanding mandatory and voluntary reporting, diligence, and disclosure.

Additionally, concerns over the long-term impacts of climate change have led and will continue to lead to governmental efforts around the world to mitigate those impacts. Investors, consumers, and businesses also may change their behavior on their own as a result of these concerns. The Company and its customers will need to respond to new laws and regulations as well as investor, consumer and business preferences resulting from climate change concerns. The Company and its customers may face cost increases, asset value reductions, and operating process changes, among other impacts. The impact on the Company’s customers will likely vary depending on their specific attributes, including reliance on or role in carbon intensive activities. In addition, the Company would face reductions in credit worthiness on the part of some customers or in the value of assets securing loans. Investors could determine

39


not to invest in the Company’s securities due to various climate change related considerations. The Company’s efforts to take these risks into account in making lending and other decisions may not be effective in protecting the Company from the negative impact of new laws and regulations or changes in investor, consumer or business behavior.


Item 1B.Unresolved Staff Comments
ITEM 1B. UNRESOLVED STAFF COMMENTS
None.

Item 1C.Cybersecurity
None.
Risk Management and Strategy

44

ITEM 2. PROPERTIES

The importance of protecting against unauthorized access to or use of customer data that has been entrusted to us as part of the various services provided to our customers; as well as operational disruptions caused by cybersecurity events, is of paramount importance to us. The Bank relies upon a formalized Information/Cybersecurity Program (“ICP”) to ensure we are protecting the confidentiality, integrity and availability of confidential information. The ICP is approved by the Board of Directors or a Committee thereof annually, and is designed to identify reasonably foreseeable internal and external threats, assess the likelihood and potential damage these threats could cause, and assess the appropriateness of policies, standards and procedures used to identify and mitigate risk levels to within the documented risk appetite. The ICP has been designed to align with industry best practices, as well as Regulatory guidelines and laws; and leverages both the Secure Control and the National Institute of Standards and Technology Cybersecurity frameworks as its baselines.

The ICP incorporates formal policies and procedures to ensure established controls are subjected to testing and independent effective challenge, to provide for appropriate due diligence and ongoing oversight of third parties who have access to our confidential information and/or systems, and to provide information and cybersecurity training to our employee population to ensure awareness of risks facing the institution and latest techniques used by malicious actors. A key component of the training program is the performance of phishing and social engineering campaign, the result of which are used to gauge the training program’s effectiveness, as well as to identify employees that pose a potential higher level of phishing/social engineering susceptibility risk, with all such employees provided additional targeted training. The ICP also includes subject matter expert review of third-party servicing agreements to ensure provisions adequately protect the bank in the event of a cybersecurity event whenever the relationship involves sensitive customer information. Internal auditors and third-party security experts are relied upon to review and ensure that established controls are appropriately designed, effectively implemented, and operating as intended; with such reviews undertaken as part of the Bank’s internal audit and third-party penetration testing programs.

The information/cybersecurity risk management program relies upon a layered security model to protect against both internal and external threats; and is a component of the Bank’s formalized enterprise risk management program (“ERM Program”), which is reviewed and approved by the Board of Directors or Committee thereof at least annually. The ERM Program sets forth enterprise-wide operational practices to ensure consistency in the organizations approach to risk identification, documentation, measurement, management, and mitigation with all aspects of risk management documented within a centrally maintained risk management platform (“RMP”). A key aspect of the ERM Program is the risk and control self-assessment (“RCSA”) process, which is used to evaluate the mitigation effectiveness of implemented controls through an independent effective challenge program. Gaps or control weaknesses identified as part of the RCSA process require creation of issues and remediation strategies, both of which are formally documented within the RMP, where remediation efforts are managed and monitored from initial creation through ultimate completion of the respective work effort. Independent effective challenge has been embedded throughout this process and ensures that remediation efforts will, and have satisfactorily addressed the identified issue.

A formal Incident Response Plan (“Plan”) is maintained by the Information Security Department, and approved by the Board of Directors or designated Committee thereof at least annually. The Plan sets forth the Bank’s information/cybersecurity incident response framework, which has been designed to ensure a consistent, repeatable response to any actual or threatened cybersecurity incident (“Incident”). The framework sets forth the team structure utilized for the coordination, monitoring, oversight, and internal and external reporting in connection with any identified Incident; and delineates responsibilities for all team members involved in response activities, as well as guidance for all employees in connection with defining, discovering, reporting, investigating, containing, and recovering from an Incident. During the reporting period, we did not experience any cybersecurity risks or incidents that have materially or are reasonably likely to materially affect the Bank; including its business strategy, result of operations, or financial condition.

We believe that the impact of any previously identified cyber incidents, including those subject to ongoing investigation and remediation, will not have a material impact on the Company, including business strategy, results of operations or financial condition.

Governance

The Board of Directors, through its Risk Assessment (“RAC”) and Technology (“TEC”) Committees, (together the “Committees”) provides direction and oversight of both the enterprise risk management and information/cybersecurity risk management programs. The Committees meet monthly to review and discuss overall state, current developments, management and performance metrics, risk identification and mitigation status, and new initiatives associated with both the Enterprise Risk Management and Information/Cybersecurity Programs. The Committees rely upon various management level committees (e.g.

45


Enterprise Risk Management, Operational Risk Management, and Technology Management) for oversight and direct management of the overarching risk management framework, which includes the information/cybersecurity risk management program and direct reporting by the Chief Information Security Officer (“CISO”).

The CISO is responsible for administration, management, and oversight of the Information/Cybersecurity Program; and is supported by a team of individuals that possess various levels of educational and technical hands-on expertise to carry out daily responsibilities and to ensure the Program’s success and continued maturation. The CISO reports directly to the Chief Risk Officer, and has over 15 years of direct experience in designing, implementing, and maturing information and cybersecurity strategies within the financial sector. Prior to joining the Bank, the CISO served as a technology examiner for one of the three Federal banking regulatory agencies, with over ten years of experience performing technology examinations of financial institutions (“FI”) and FI service providers primarily within the New York metropolitan area.

Item 2.Properties

We own certain of our branch offices, as well as our headquarters on Long Island and certain other back-office buildings in New York, Ohio, Florida and Florida.Michigan. We also utilize other branch and back-office locations in those states, and in New Jersey, Arizona, California, Indiana, and Arizona,Wisconsin under various lease and license agreements that expire at various times. (See Note 7, “Leases”8 - Leases in Item 8, “Financial Statements and Supplementary Data.”) We believe that our facilities are adequate to meet our present and immediately foreseeable needs.

Item 3.Legal Proceedings

Following

The Company is involved in various legal actions arising in the announcementordinary course of its business. All such actions in the aggregate involve amounts that are believed by management to be immaterial to the financial condition and results of operations of the Merger Agreement, the first of four lawsuits wasCompany.

The Company and its President and Chief Executive Officer and Senior Executive Vice President and Chief Financial Officer have been named as defendants in a shareholder class action captioned Lemm, Jr. v. New York Community Bancorp, Inc., et al., Case No. 1:24-cv-00903, filed on June 23, 2021February 6, 2024 in the United States Federal District Courts by alleged stockholdersCourt for the Eastern District of NYCB against NYCB and the members of its board of directors challenging the accuracy or completenessNew York. This action, which seeks unspecified compensatory damages to be proven at trial, alleges violations of the disclosures contained in the Form S-4 filed on June 25, 2021 by NYCB with the SEC relating to the proposed Merger. Four additional lawsuits were filed by alleged Flagstar stockholders in statefederal securities laws, including Sections 10(b) and federal courts against Flagstar and its board of directors (and, in one instance, NYCB and 615 Corp.) challenging the proposed Merger or Flagstar’s disclosures relating to the Merger, and those four lawsuits have since been resolved and dismissed. The complaints in the actions against NYCB allege, among other things, that the defendants caused a materially incomplete and misleading Form S-4 relating to the proposed Merger to be filed with the SEC in violation of Section 14(a) and Section 20(a) of the Securities Exchange Act of 1934 (the “Exchange Act”) and SEC Rule 10b-5, with respect to disclosures concerning the Company’s business, operations and prospects, particularly regarding the impact of the Flagstar and Signature transactions and the Bank’s commercial real estate loan portfolio and related matters, that were made in the Company’s public SEC filings and press releases during the period beginning on March 1, 2023 and ending on January 30, 2024. The Company intends to vigorously defend this action and any related actions.

The Company and its President and Chief Executive Officer and Senior Executive Vice President and Chief Financial Officer have also been named as amended,defendants in a second shareholder class action captioned Miskey v. New York Community Bancorp, Inc., et al., Case No. 1:24-cv-01118, filed on February 13, 2024 in the United States District Court for the Eastern District of New York. This action also seeks unspecified compensatory damages to be proven at trial and alleges violations of the federal securities laws, including Sections 10(b) and 20(a) of the Exchange Act and SEC Rule 14a-9 promulgated thereunder. None10b-5, with respect to disclosures concerning the Company’s business, operations and prospects, particularly regarding the impact of NYCBthe Flagstar and Signature transactions and the Bank’s commercial real estate loan portfolio and related matters, that were made in the Company’s public SEC filings and press releases during the period beginning on March 1, 2023 and ending on February 5, 2024. The Company intends to vigorously defend this action and any related actions.

The Company’s President and Chief Executive Officer and Senior Executive Vice President and Chief Financial Officer, as well as all of the Company’s current directors, have also been named as defendants has been servedin a shareholder derivative action captioned Hauser v. Cangemi, et al., Case No. 1:24-cv-01207, filed on February 15, 2024 in the United States District Court for the Eastern District of New York. This action, which also names the Company as a nominal defendant and seeks unspecified compensatory damages and certain corporate governance and internal procedures reforms, alleges claims of breach of fiduciary duty, gross mismanagement, waste of corporate assets, unjust enrichment, aiding and abetting with respect to the director defendants, and violations of Sections 10(b) and 21D of the Exchange Act with respect to the officer defendants. The allegations in the complaint relate to disclosures concerning the Company’s business, operations and prospects, particularly regarding the impact of the Flagstar and Signature transactions and the Bank’s commercial real estate loan portfolio and related matters, that were made in the Company’s public SEC filings and press releases during the period beginning on March 1, 2023 and ending on January 31, 2024, as well as the defendants’ management of the Company during such period. The Company intends to vigorously defend this action and any related actions.


46


The outcome of the pending litigation described above is uncertain. There can be no assurance (i) that we will not incur material losses due to damages, penalties, costs and/or expenses as a result of such litigation, (ii) that the reserves we have established will be sufficient to cover such losses, or (iii) that such losses will not materially exceed such reserves and have a material impact on our financial condition or results of operations. The Company may incur significant legal expenses in defending the litigation described above during the pendency of these actions,matters, and NYCB believes that these claims are without merit.in connection with any other potential cases, including expenses for the potential reimbursement of legal fees of officers and directors under indemnification obligations.

ITEM 4. MINE SAFETY DISCLOSURES
Item 4.Mine Safety Disclosures

None.
Not applicable.

47


40


PART II

Item 5.Market For the Registrant's Common Equity, Related Stockholder Matters, and Issuer Purchases

ITEM 5. MARKET FOR REGISTRANT’S COMMON EQUITY, RELATED STOCKHOLDER MATTERS, AND ISSUER PURCHASES OF EQUITY SECURITIES

The common stock of New York Community Bancorp, Inc. trades on the New York Stock Exchange (the “NYSE”) under the symbol “NYCB.”

At December 31, 2021,2023, the number of outstanding shares was 465,015,643722,066,370 and the number of registered owners was approximately 10,430.11,746. The latter figure does not include those investors whose shares were held for them by a bank or broker at that date.

Stock Performance Graph

The following graph compares the cumulative total return on the Company’s stock in the five years ended December 31, 20212023 with the cumulative total returns on a broad market index (the S&P Mid-Cap 400 Index) and a peer group index (the S&P U.S. BMI Banks Index) during the same time. The S&P Mid-Cap 400 Index was chosen as the broad market index in connection with the Company’s trading activity on the NYSE; the S&P U.S. BMI Banks Index currently is comprised of 302258 bank and thrift institutions, including the Company. S&P Global Market Intelligence provided us with the data for both indices.

The performance graph is being furnished solely to accompany this report pursuant to Item 201(e) of Regulation S-K, and is not being filed for purposes of Section 18 of the Securities Exchange Act of 1934, as amended, and is not to be incorporated by reference into any filing of the Company, whether made before or after the date hereof, regardless of any general incorporation language in such filing.

The cumulative total returns are based on the assumption that $100.00 was invested in each of the three investments on December 31, 20162018 and that all dividends paid since that date were reinvested. Such returns are based on historical results and are not intended to suggest future performance.


48

41


Comparison of 5-Year Cumulative Total Return

Among New York Community Bancorp, Inc.,

S&P Mid-Cap 400 Index, and S&P U.S. BMI Banks Index*

img85695935_0.jpg 

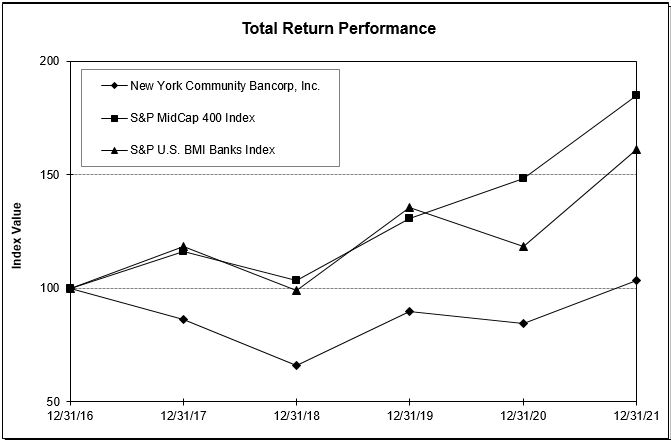
ASSUMES $100 INVESTED ON

CUMULATIVE TOTAL STOCKHOLDER RETURN
COMPARED WITH PERFORMANCE OF SELECTED INDICES
DECEMBER 31, 2016 AND DIVIDEND REINVESTED2018 THROUGH DECEMBER 31, 2023
2199023257926
12/31/201812/31/201912/31/202012/31/202112/31/202212/31/2023
New York Community Bancorp, Inc.$100.00 $135.38 $127.51 $156.41 $118.03 $149.75 
S&P Mid-Cap 400 Index$100.00 $126.20 $143.44 $178.95 $155.58 $181.15 
S&P U.S. BMI Banks Index$100.00 $137.36 $119.83 $162.92 $135.13 $147.41 


12/31/2016


12/31/2017


12/31/2018


12/31/2019


12/31/2020


12/31/2021


New York Community Bancorp, Inc.


$

100.00


$

86.12


$

66.11


$

89.50


$

84.30


$

103.41


S&P Mid-Cap 400 Index


$

100.00


$

116.24


$

103.36


$

130.44


$

148.26


$

184.97


S&P U.S. BMI Banks Index


$

100.00


$

118.21


$

98.75


$

135.64


$

118.33


$

160.89


*The SNL U.S. Bank & Thrift Index was renamed to the S&P U.S. BMI Banks Index.

Share Repurchases

Shares Repurchased Pursuant to the Company’s Stock-Based Incentive Plans

Participants in the Company’s stock-based incentive plans may have shares of common stock withheld to fulfill the income tax obligations that arise in connection with their exercise of stock options and the vesting of their stock awards. Shares that are withheld for this purpose are repurchased pursuant to the terms of the applicable stock-based incentive plan, rather than pursuant to the share repurchase program authorized by the Board of Directors, described below.

Shares Repurchased Pursuant to the Board of Directors’ Share Repurchase Authorization

On October 23, 2018, the Board of Directors authorized the repurchase of up to $300 million of the Company’s common stock. Under said authorization, shares may be repurchased on the open market or in privately negotiated transactions. As of December 31, 2021,2023, the Company has approximately $17$9 million remaining under this repurchase authorization.

42


49


Shares that are repurchased pursuant to the Board of Directors’ authorization, and those that are repurchased pursuant to the Company’s stock-based incentive plans, are held in our Treasury account and may be used for various corporate purposes, including, but not limited to, merger transactions and the vesting of restricted stock awards.

During the year December 31, 2021,2023, the Company repurchased $16$12 million or 1.41 million shares of its common stock, all of which was allocated toward the repurchase of shares tied to its stock-based incentive plans.stock:

(dollars in millions, except share data)
PeriodTotal Shares of Common Stock RepurchasedAverage Price Paid per Common ShareTotal AllocationTotal Shares of Common Stock Purchased as Part of Publicly Announced Plans or Programs
First Quarter 2023976,454 $9.33 $0
Second Quarter 2023190,177 10.3620
Third Quarter 202333,956 12.5000
Fourth Quarter 2023
October 1 - 31, 20231,525 10.29 0— 
November 1 - 30, 20234,897 9.34 — — 
December 1 - 31, 202350,526 9.92 — 
Total Fourth Quarter 202356,948 $16.57 — 
2023 Total1,257,535 $9.59 $12 — 

Item 6.Reserved

Item 7.Management's Discussion and Analysis of Financial Condition and Results of Operations


(dollars in millions, except per share data)
 
Period


Total Shares
of Common
Stock
Repurchased


Average Price
Paid per
Common
Share


Total
Allocation


First Quarter 2021


1,343,366


$


11.55


$


16


Second Quarter 2021


17,422


11.99


-


Third Quarter 2021


36,163


11.58


-


Fourth Quarter 2021


October


579


13.85


-


November


2,246


12.51


-


December


2,331


11.96


-


Total Fourth Quarter 2021


5,156


12.41


-


2021 Total


1,402,107


11.56


$


16


EXECUTIVE SUMMARY

ITEM 6. RESERVED

43


ITEM 7. MANAGEMENT’S DISCUSSION AND ANALYSIS OF FINANCIAL CONDITION AND RESULTS OF OPERATIONS

For the purpose of this discussion and analysis, the words “we,” “us,” “our,” and the “Company” are used to refer to New York Community Bancorp, Inc. and our consolidated subsidiaries, including New York Community Bank (the “Bank”).

Executive Summary

New York Community Bancorp, Inc. is the holding company for New York Community Bank, with 237 branches in Metro New York, New Jersey, Ohio, Florida, and Arizona.

At December 31, 2021, we had2023, total assets were $114.1 billion, up $23.9 billion compared to December 31, 2022. Total deposits were $81.5 billion at December 31, 2023, up $22.8 billion from December 31, 2022. These year-to-date increases were primarily due to our March 20, 2023, assumption of $59.5 billion, including total loansa substantial amount of $45.7 billion, totalthe deposits and certain identified liabilities and the acquisition of $35.1 billion,certain assets and total stockholders’ equitylines of $7.0 billion.

Chartered in the Statebusiness of New York, theSignature Bridge Bank, is subject to regulation byfrom the FDIC the CFPB, and the NYSDFS. In addition, the holding company is subject to regulation by the FRB, the SEC, andas receiver for Signature Bridge Bank (the “Signature Transaction”). See Note 3 - Business Combinations to the requirements ofConsolidated Financial Statements for further information regarding the NYSE, where shares of our common stock are traded under the symbol “NYCB” and shares of our preferred stock trade under the symbol “NYCB PA.” As a publicly traded company, our mission is to provide our stockholders with a solid return on their investment by producing a strong financial performance, maintaining a solid capital position, and engaging in corporate strategies that enhance the value of their shares.Signature Transaction.


For the twelve monthsyear ended December 31, 2021,2023, net loss was $79 million as compared to net income was $596of $650 million an increase of $85 million or 17% compared to the $511 million the Company reported for the twelve monthsyear ended December 31, 2020.2022. Net incomeloss available to common stockholders for the twelve monthsyear ended December 31, 20212023 was $563$112 million, compared to net income $617 million for the year ended December 31, 2022. Diluted (loss) earnings per share totaled $(0.16) for the year ended December 31, 2023 compared to $1.26 for the year ended December 31, 2022.

The net loss for 2023 primarily reflects a goodwill impairment of $2.4 billion recorded in the fourth quarter partially offset by a $2.1 billion bargain gain on the Signature Transaction. During the fourth quarter of 2023, management also took decisive actions to build capital, reinforce our balance sheet, strengthen our risk management processes, and better align ourselves with the relevant bank peers. We significantly built our reserve levels by recording a $552 million provision for loan losses, bringing our allowance for credit losses to $992 million at December 31, 2023, reflecting our actions to build reserves during the quarter to address weakness in the office sector, potential repricing risk in the multi-family portfolio and conditions leading to increases in classified assets, which better aligns the Company with its relevant bank peers, including Category IV banks. In addition, we added on-balance sheet liquidity as we prepare for the enhanced prudential standards that apply to banks with $100 billion or more in total assets.

Loan Portfolio

At December 31, 2023, total C&I loans were $25.3 billion compared to $12.3 billion at December 31, 2022. The majority of the increase is attributable to the $9.9 billion of C&I loans acquired in the Signature Transaction along with continued growth through new originations.


50


The multi-family loan portfolio was $37.3 billion at December 31, 2023, down slightly compared to $38.1 billion at December 31, 2022. At December 31, 2023, multi-family loans represented 44 percent of total loans, compared to 55 percent at December 31, 2022, further demonstrating the reduction of our concentration in this asset class.

Commercial loans (commercial real estate and acquisition, development and construction loans) increased $2.9 billion at December 31, 2023 to $13.4 billion compared to $10.5 billion at December 31, 2022 largely attributable to the Signature Transaction and growth in our home builder finance portfolio.

One-to-four family residential loans totaled $6.1 billion at December 31, 2023, representing 7 percent of total loans compared to $5.8 billion or eight percent of total loans at December 31, 2022. Other loans totaled $2.7 billion at December 31, 2023 compared to $2.3 billion at December 31, 2022. The other loan portfolio consists mostly of HELOC and other consumer loans.

Loans held-for-sale at December 31, 2023 totaled $1.2 billion, up $85 millionfrom $1.1 billion at December 31, 2022.

Deposit Base

Deposits at December 31, 2023 totaled $81.5 billion, up $22.8 billion compared to $58.7 billion at December 31, 2022 primarily driven by the Signature Transaction.

Our deposit base includes $29.3 billion of uninsured deposits at December 31, 2023, up $12.9 billion as compared to December 31, 2022 largely due to the Signature Transaction. This represents 35.9 percent of our total deposits. These amounts were determined based on the same methodologies and 18%assumptions used for regulatory reporting purposes and exclude internal accounts. At December 31, 2023 total liquidity (cash and cash equivalents, unpledged securities, and FHLB and FRB borrowing capacity) was $27.9 billion.

Net Interest Income

For the year ended December 31, 2023, net interest income totaled $3.1 billion, up $1.7 billion or 120 percent compared to the twelve monthsyear ended December 31, 2020. On a per share2022. The increase was primarily the result of the Flagstar acquisition, which closed in late 2022, and the Signature transaction, which closed in late March of 2023.

For the year ended December 31, 2023, net interest margin was 2.99 percent, up sixty-four basis this translates into diluted earnings per share of $1.20 in full-year 2021, up 18%points compared to the $1.02 we reported in full-year 2020. In termsyear ended December 31, 2022. The year-over-year increase was primarily the result of profitability, our full-year 2021 results reflect a return on average assetslarger balance sheet driven by both the Flagstar acquisition and the Signature transaction, and due to organic loan growth, along with the impact of 1.04% compared to 0.94% in full-year 2020 and a return on average common stockholders' equity of 8.75% versus 7.71%.higher interest rates.

Asset Quality
The key trends during 2021 were:

Strong Year-Over-Year Growth In Our Loan Portfolio

At December 31, 2023, NPA to total assets equaled 0.39 percent compared to 0.17 percent at December 31, 2022 while NPL to total loans equaled 0.51 percent compared to 0.20 percent at December 31, 2022. The increase in NPLs was primarily driven by a $125 million increase in multi-family loans and a $108 million in commercial real estate loans. Repossessed assets of $14 million were slightly higher compared to $12 million in the prior year.

Recent Events

Declaration of Dividend on Common Shares

On January 30, 2024, the Company's Board of Directors declared a quarterly cash dividend of $0.05 per share on the Company's common stock. The dividend is payable on February 28, 2024 to common stockholders of record as of February 14, 2024.

Appointment of Executive Chairman

On February 6, 2024, the Company appointed Alessandro (Sandro) DiNello as Executive Chairman, effective as of February 7, 2024.In this capacity, Mr. DiNello serves as the most senior executive officer of the Company.


51


RESULTS OF OPERATIONS

Net Interest Income

Net interest income is our primary source of income. Its level is a function of the average balance of our interest-earning assets, the average balance of our interest-bearing liabilities, and the spread between the yield on such assets and the cost of such liabilities. These factors are influenced by both the pricing and mix of our interest-earning assets and our interest-bearing liabilities which, in turn, are impacted by various external factors, including the local economy, competition for loans and deposits, the monetary policy of the FOMC, and market interest rates.

The cost of our deposits and borrowed funds is largely based on short-term rates of interest, the level of which is partially impacted by the actions of the FOMC.

While the target federal funds rate generally impacts the cost of our short-term borrowings and deposits, the yields on our held-for-investment loans and other interest-earning assets are not as sensitive to intermediate-term market interest rates.

Another factor that impacts the yields on our interest-earning assets—and our net interest income—is the income generated by our multi-family and CRE loans and securities when they prepay. Since prepayment income is recorded as interest income, an increase or decrease in its level will also be reflected in the average yields (as applicable) on our loans, securities, and interest-earning assets, and therefore in our net interest income, our net interest rate spread, and our net interest margin.

It should be noted that the level of prepayment income on loans recorded in any given period depends on the volume of loans that refinance or prepay during that time. Such activity is largely dependent on such external factors as current market conditions, including real estate values, and the perceived or actual direction of market interest rates. This impact is most prevalent in our multi-family and CRE portfolios, and to a lesser extent in our C&I and ADC portfolios. In addition, while a decline in market interest rates may trigger an increase in refinancing and, therefore, prepayment income, so too may an increase in market interest rates. It is not unusual for borrowers to lock in lower interest rates when they expect, or see, that market interest rates are rising rather than risk refinancing later at a still higher interest rate. The impact of prepayments on the current quarter and year was minimal.

Year-over-Year Comparison

For the year ended December 31, 2023, net interest income totaled $3.1 billion, up $1.7 billion or 120 percent compared to $1.4 billion for the year ended December 31, 2022.The year-over-year increase was primarily the result of the Flagstar acquisition, which closed late last year, and the Signature Transaction, which closed in late March of this year.

Interest income on mortgages and other loans increased $2.7 billion driven by a $32.5 billion or 65.8 percent increase in average loan balances to $81.9 billion. This is primarily driven by the December 2022 acquisition of Flagstar and the March 2023 Signature Transaction. Additionally, we had a 177 basis point increase in the average loan yield to 5.5 percent in the current year primarily due to higher yields on acquired loans and the rising interest rate environment. Prepayments in 2023 were $9 million.

Interest income on securities increased $244 million driven by a 149 basis point increase in the average yield to 4.2 percent from 2.7 percent along with a $3.2 billion or 42.5 percent increase in the average securities balance to $10.6 billion. The increase was driven by higher rates on new purchase and higher yields on acquired Flagstar securities.

Interest-earning cash and cash equivalents increased $487 million reflecting a 367 basis point increase in the average yield to 5.1 percent driven by higher short-term market rates and an increase in the average balance driven by the Signature Transaction and bolstering our on-balance sheet liquidity.

Interest expense on average interest-bearing deposits increased $1.4 billion to $1.8 billion during the year ended December 31, 2023, driven by a 206 basis point increase in the average cost of interest-bearing deposits due to rising interest rates. Average interest earning deposits grew $20.3 billion, or 56.4 percent, to $56.3 billion. The balance growth primarily reflects the December acquisition of Flagstar and the March Signature Transaction.


52


Interest expense on borrowed funds increased $343 million or 109.6 percent to $656 million driven by a 162 basis point increase in rates in addition to a $2.5 billion or 16.5 percent increase in the average balance to $17.9 billion.

Net Interest Margin
The following table sets forth certain information regarding our average balance sheet for the periods indicated, including the average yields on our interest-earning assets and the average costs of our interest-bearing liabilities. Average yields are calculated by dividing the interest income produced by the average balance of interest-earning assets. Average costs are calculated by dividing the interest expense produced by the average balance of interest-bearing liabilities. The average balances for the periods are derived from average balances that are calculated daily. The average yields and costs include fees, as well as premiums and discounts (including mark-to-market adjustments from acquisitions), that are considered adjustments to such average yields and costs.


For the Years Ended December 31,
202320222021
(dollars in millions)Average BalanceInterestAverage Yield/CostAverage BalanceInterestAverage Yield/CostAverage BalanceInterestAverage Yield/Cost
ASSETS:
Interest-earning assets:
Mortgage and other loans and leases , net (1)
$81,855 $4,509 5.51 %$49,376 $1,848 3.74 %$43,200 $1,525 3.53 %
Securities (2) (3)
10,6114444.18 %7,448 200 2.69 %6,625 156 2.35 %
Reverse repurchase agreements388225.77 %460 15 3.24 %430 1.05 %
Interest-earning cash and cash equivalents10,0255165.14 %1,988 29 1.47 %2,016 0.17 %
Total interest-earning assets$102,879 $5,491 5.34 %$59,272 $2,092 3.53 %$52,271 $1,689 3.23 %
Non-interest-earning assets7,6165,130 5,275 
Total assets$110,495 $64,402 $57,546 
LIABILITIES AND STOCKHOLDERS' EQUITY:
Interest-bearing deposits:
Interest-bearing checking and money market accounts$29,286 $943 3.22 %$17,910 $226 1.26 %$12,829 $31 0.24 %
Savings accounts9,9411691.70 %9,336 60 0.64 %7,612 28 0.36 %
Certificates of deposit17,0976463.78 %8,772 97 1.11 %9,094 55 0.60 %
Total interest-bearing deposits$56,324 $1,758 3.12 %$36,018 $383 1.06 %$29,535 $114 0.38 %
Short term borrowed funds7,2633054.20 %2,408 56 2.32 %2,343 0.34 %
Other borrowed funds10,6713513.29 %12,982 257 1.99 %13,366 278 2.08 %
Total borrowed funds$17,934 $656 3.66 %$15,390 $313 2.04 %$15,709 $286 1.82 %
Total interest-bearing liabilities$74,258 $2,414 3.25 %$51,408 $696 1.35 %$45,244 $400 0.88 %
Non-interest-bearing deposits21,5835,124 4,578 
Other liabilities4,073787 790 
Total liabilities$99,914 $57,319 $50,612 
Stockholders’ equity10,5817,083 6,934 
Total liabilities and stockholders’ equity$110,495 $64,402 $57,546 
Net interest income/interest rate spread$3,077 2.09 %$1,396 2.17 %$1,289 2.35 %
Net interest margin2.99 %2.35 %2.47 %
Ratio of interest-earning assets to interest-bearing liabilities1.39 x1.15 x1.16 x
(1)Amounts are net of net deferred loan origination costs/(fees) and includes loans held for sale and non-performing loans.
(2)Amounts are at amortized cost.
(3)Includes FHLB stock and FRB stock.

53


The following table presents the extent to which changes in interest rates and changes in the volume of interest-earning assets and interest-bearing liabilities affected our interest income and interest expense during the periods indicated. Information is provided in each category with respect to (i) the changes attributable to changes in volume (changes in volume multiplied by prior rate); (ii) the changes attributable to changes in rate (changes in rate multiplied by prior volume); and (iii) the net change. The changes attributable to the combined impact of volume and rate have been allocated proportionately to the changes due to volume and the changes due to rate on each separate line.

For the Years Ended December 31,
2023 compared to Year Ended 2022
Increase/(Decrease) Due to:
2022 compared to Year Ended 2021
Increase/(Decrease) Due to:
(in millions)VolumeRateNetVolumeRateNet
INTEREST-EARNING ASSETS:
Mortgage and other loans and leases, net$1789 $872 $2661 $231 $92 $323 
Securities132 112 244 22 22 44 
Reverse repurchase agreements(4)11 10 11 
Interest Earning cash and cash equivalents413 74 487 — 25 25 
Total interest-earnings assets2,327 1,0723,399 247 156 403 
INTEREST-BEARING LIABILITIES:
Interest-bearing checking and money market accounts366 351 717 64 131 195 
Savings accounts10 99 109 11 21 32 
Certificates of deposit315 234 549 (4)46 42 
Short term borrowed funds204 45 249 46 48 
Other borrowed funds(76)170 94 (8)(13)(21)
Total interest-bearing liabilities743 975 1,718 83 213 296 
Change in net interest income$1,584 $97 $1,681 $164 $(57)$107 

For the year ended December 31, 2023, the net interest margin was 2.99 percent, up 64 basis points compared to the year ended December 31, 2022. The year-over-year increase was primarily the result of a larger balance sheet with loans at higher yields driven by both the Flagstar acquisition and the Signature Transaction along with the impact of higher interest rates. Average interest-earning assets increased $43.6 billion, or 74 percent, on a year-over-year basis to $102.9 billion for the year ended December 31, 2023, while the average yield rose 181 basis points to 5.34 percent.

Average loan balances rose $32.5 billion, or 66 percent, to $81.9 billion while the average loan yield rose 177 basis points to 5.51 percent on a year-over-year basis. Average cash balances increased $8.0 billion to $10.0 billion, while the average yield rose to 5.14 percent from 1.47 percent. Average securities increased $3.2 billion, or 42 percent, to $10.6 billion, while the average yield improved to 4.18 percent from 2.69 percent.

Average interest-bearing liabilities increased $22.9 billion, or 44 percent, to $74.3 billion while the average cost increased to 3.25 percent from 1.35 percent. Average interest-bearing deposits rose $20.3 billion, or 56 percent, while the average cost of deposits increased to 3.12 percent compared to 1.06 percent. Average borrowed funds increased $2.5 billion to $17.9 billion while the average cost rose to 3.66 percent from 2.04 percent. Average non-interest-bearing deposits rose $16.5 billion to $21.6 billion.

Provision for Credit Losses

Comparison to Prior Year to Date

The year ended December 31, 2023 provision for credit losses was $833 million compared to $133 million for the year ended December 31, 2022. The 2023 provision primarily reflects an initial $132 million provision for credit losses for acquired loans and related commitments from the Signature Transaction and a net $483 million increase in ACL and unfunded commitment reserves which reflects our actions to build reserves during the fourth quarter to address weakness in the office sector, potential repricing risk in the multi-family portfolio and conditions leading to increases in classified assets. Lastly, the Company recorded a net $10 million provision related to net charge-offs on AFS securities.

Total net loan charge-offs amounted to $208 million, including $112 million for a co-operative loan, $40 million for a CRE loan, and $30 million for commercial loans, mainly from two C&I loans in the fourth quarter. The charged-off co-

54


operative loan was subsequently transferred to held-for-sale status. On February 29, the loan was sold, realizing a gain of $26 million from its previously written-down fair value estimate. This gain on sale will be recognized in the first quarter of 2024. For a more detailed discussion and analysis of the total allowance for credit losses, see the "Credit Quality" section of this MD&A and "Note 7 - Allowance for Credit Losses on Loans and Leases".

Non-Interest Income

We generate non-interest income through a variety of sources, including—among others—fee income (in the form of retail deposit fees and charges on loans); net return on our MSR asset; net gain on loan sales and securitizations, net loan administration income (including loan subservicing income); income from our investment in BOLI; and “other” sources, including the revenues produced through the sale of third-party investment products.

The following table summarizes our non-interest income for the respective periods:
For the Years Ended December 31,
(in millions)202320222021
Bargain purchase gain$2,131 $159 $— 
Fee income1722723
Net return on mortgage servicing rights1036
Net gain on loan sales and securitizations895
Other68179
Bank-owned life insurance433229
Net loan administration income823
Net loss on securities(1)(2)
Total non-interest income$2,687 $247 $61 

Non-interest income increased $2.4 billion for the year ended December 31, 2023 compared to the year ended December 31, 2022 primarily due to the bargain purchase gain of $2.1 billion related to the Signature Transaction. Excluding bargain purchase gains, non-interest income for the year ended December 31, 2023 totaled $556 million as compared to $88 million for the year ended December 31, 2022. For the year ended December 31, 2023, net gains on loan sales, net return on mortgage servicing rights and net loan administration income totaled $274 million compared to $14 million for the year ended December 31, 2022, all driven by a full year of the Flagstar acquisition. The two acquisitions also drove higher fee income, loan administration income and other income driven by mortgage and FDIC loan servicing along with a higher volume of customer based fees.

Non-Interest Expense

Non-interest expense increased $4.3 billion for the year ended December 31, 2023 compared to the year ended December 31, 2022, driven by goodwill impairment in the fourth quarter totaling $2.4 billion. Additionally, merger related expenses increased $223 million due to the closing of the Signature transaction and ongoing integration costs. Excluding the goodwill impairment and merger related expenses, non-interest expense for the year ended December 31, 2023 totaled $2.2 billion as compared to $0.6 billion for the year ended December 31, 2022.

Total operating expenses for the year ended December 31, 2023 were up approximately $1.5 billion compared to the year ended December 31, 2022 primarily driven by a full-year of Flagstar activity and the Signature transaction, which closed in late March of 2023. Included in total operating expenses is a $49 million expense for the FDIC special assessment issued to certain banks nationally related to deposit insurance fund shortfalls, including the assessment issued by the FDIC in February 2024..

Income Tax Expense

For the year ended December 31, 2023, the Company reported a provision for income taxes of $29 million, compared to $176 million for the year ended December 31, 2022. Income tax expense for the current year was impacted by the bargain purchase gain arising from the Signature transaction.


55


RESULTS OF OPERATIONS: 2022 AS COMPARED TO 2021

The results of operations comparison of 2022 compared to 2021 totalcan be found in the Company’s previously filed Annual Report on Form 10-K for the year-ended December 31, 2022 under Item 7 “Management’s Discussion and Analysis of Financial Condition and Results of Operations”- Results of Operations: 2022 As Compared to 2021.”

Signature Transaction - Certain Financial Information

In accordance with the guidance provided in Staff Accounting Bulletin Topic 1:K, “Financial Statements of Acquired Troubled Financial Institutions” (“SAB 1:K”) the Company has omitted certain financial information on the Signature Transaction required by Rule 3-05 of Regulation S-X and Article 11 of Regulation S-X. SAB 1:K provides relief from the requirements of Rule 3-05 and Article 11 of Regulation S-X under certain circumstances, including a transaction such as the Signature Transaction, in which the registrant engages in an acquisition of a troubled financial institution for which historical financial statements are not reasonably available or relevant and in which federal assistance is an essential and significant part of the transaction.

FINANCIAL CONDITION

Balance Sheet Summary

Total assets increased $23.9 billion to $114.1 billion as of December 31, 2023, compared to $90.1 billion at December 31, 2022 due to the Signature Transaction, which closed on March 20, 2023, and organic growth.

The Company acquired approximately $11.7 billion of loans, net of purchase accounting adjustments ("PAA"), $33.5 billion of deposits, net of PAA, and $2.1 billion of other liabilities related to the Signature Transaction.

Total loans and leases held for investment were $46$84.6 billion up $2.9at December 31, 2023 compared to $69.0 billion at December 31, 2022. The increase was driven by the aforementioned loans acquired from the Signature Transaction and organic loan growth.

The securities portfolio totaled $9.2 billion at December 31, 2023, compared to $9.1 billion at December 31, 2022. As of December 31, 2023, the Company has no held-to-maturity securities portfolio and all of the Company’s securities were designated as “Available-for-Sale”, consistent with December 31, 2022.

Total deposits grew $22.8 billion, or 7%39 percent to $81.5 billion at December 31, 2023 compared to $58.7 billion at December 31, 2022 primarily driven by the deposits assumed in the Signature Transaction. Included in the December 31, 2023 balance are $247 million in non-interest-bearing custodial deposits related to the Signature Transaction.

Wholesale borrowings at December 31, 2023 remained flat at $20.3 billion when compared to December 31, 2020. 2022.


56


Loans held-for-investment

The majorityfollowing table summarizes the composition of this growth took place duringour loan portfolio:

At December 31,
20232022
(in millions)AmountPercent of Loans Held for InvestmentAmountPercent of Loans Held for Investment
Mortgage Loans:
Multi-family$37,265 44.0 %$38,130 55.3 %
Commercial real estate10,47012.4 %8,52612.4 %
One-to-four family first mortgage6,0617.2 %5,8218.4 %
Acquisition, development, and construction2,9123.4 %1,9962.8 %
Total mortgage loans$56,708 67.0 %$54,473 78.9 %
Other Loans:
Commercial and industrial$25,254 29.9 %$12,276 17.8 %
Other loans2,6573.1 %2,2523.3 %
Total other loans held for investment$27,911 33.0 %$14,528 21.1 %
Total loans and leases held for investment$84,619 100.0 %$69,001 100.0 %
Allowance for credit losses on loans and leases(992)(393)
Total loans and leases held for investment, net$83,627 $68,608 
Loans held for sale1,1821,115
Total loans and leases, net$84,809 $69,723 

Loan Maturity and Repricing Analysis

The following table sets forth the fourth quartermaturity or period to repricing of the year, as totalour portfolio of loans and leases held for investment increased $2.1 billion compared to September 30, 2021. Both the year-over-year and linked-quarter increase were driven by our multi-family and specialty finance portfolios, offset by modest declines in the CRE portfolio.

At year-end 2021, multi-family loans increased $2.4 billion or 7% compared to year-end 2020 with most of this growth occurring in the fourth quarter. Multi-family loans grew $1.8 billion during the fourth quarter of 2021 compared to the third quarter of 2021. The growth in the multi-family portfolio was driven by increased activity on the part of both existing and new borrowers prompted by the expectation of higher interest rates in 2022, a strong rebound in property transactions, and the Company's ability to service and meet our borrowers' needs.

The specialty finance portfolio totaled $3.5 billion at December 31, 2021, up $451 million or 15% compared2023. Loans that have adjustable rates are shown as being due in the period during which their interest rates are next subject to change.


(in millions)Multi- FamilyCommercial Real EstateOne-to- Four FamilyAcquisition, Development, and ConstructionOtherTotal Loans
Amount due:
Within one year$3,530 $1,233 $14 $1,049 $8,323 $14,149 
After one year:
One to five years28,419 7,946 54 1,775 14,973 53,167 
Over five years to fifteen years5,314 1,263 297 25 3,280 10,179 
Over fifteen years28 5,696 63 1,335 7,124 
Total due or repricing after one year33,735 9,237 6,047 1,863 19,588 70,470 
Total amounts due or repricing, gross$37,265 $10,470 $6,061 $2,912 $27,911 $84,619 


57


The following table sets forth, as of December 31, 2020 and up $337 million compared to September 30, 2021. The increase in specialty finance loans was2023, the result of increased borrowers demand due to improved economic activity.

Our Deposit Base Continued to Show Solid Growth

Total deposits at December 31, 2021 were $35.1 billion, up $2.6 billion or 8% compared to December 31, 2020 and increased $438 million compared to September 30, 2021. Core deposits (total deposits excluding CDs) increased to $26.6 billion at year-end 2021, up $4.5 billion or 20% compared to year-end 2020 and $738 million compared to the third quarter of 2021.

44


The year-over-year growth was driven by higher levels of non-interest bearing accounts and savings accounts. Non-interest bearing accounts at December 31, 2021 totaled $4.5 billion, up $1.5 billion or 47% compared to December 31, 2020. Savings accounts totaled $8.9 billion at December 31, 2021, increasing $2.5 billion or 39% compared to the balance at December 31, 2020. This was offset by a $1.9 billion or 18% decrease in CDs, which totaled $8.4 billion at December 31, 2021. CDs at year-end 2021 represented 24% of total deposits compared to 32% at year-end 2020.

Total deposits at year-end 2021 also reflect the impact of various initiatives we undertook during the year: the launch of our Banking as a Service business and an increase in loan-related deposits. Loan-related deposits increased $475 million or 14% to $4 billion at year-end 2021 compared to year-end 2020. Loan-related deposits include business operating accounts, which increased 37% or $318 million to $1.2 billion, representing 30% of overall loan-related deposits. Banking as a Service-related deposits totaled $1 billion in its first year.

Continued Expense Discipline

For the twelve months ended December 31, 2021, total non-interest expenses were $541 million, up $30 million or 6% compared to the twelve months ended December 31, 2020. Included in the 2021 full-year results were $23 million of merger expenses related to our pending acquisition of Flagstar Bancorp, Inc. compared to no such expenses during full-year 2020. Excluding such merger-related expenses, total operating expenses during full-year 2021 were $518 million, up $7 million or 1% compared to full-year 2020. As a result of the modest increase in operating expenses and higher net income, the efficiency ratio in 2021 declined to 38.36% compared to 44.02% in 2020.

Continued Growth in our Net Interest Income and NIM Expansion

During the twelve months ended December 31, 2021, both our net interest income and the NIM continued to improve. Net interest income for full-year 2021 increased $189 million or 17% to $1.3 billion compared to full-year 2020. The year-over-year increase was primarily due to lower interest expense. Interest expense fell $208 million or 34% to $400 million for the twelve months ended December 31, 2021. Included in net interest income for the twelve months ended December 31, 2021 was $79 million of prepayment income, up $25 million or 46% compared to the twelve months ended December 31, 2020.

Our NIM also improved during full-year 2021. For the twelve months ended December 31, 2021, the NIM expanded 23 bp to 2.47% compared to the twelve months ended December 31, 2020. The improvement was driven by a decline in our cost of funding, which declined 51 bps to 0.88% in full-year 2021. Prepayment income added 15 bps to this year's NIM compared to 11 bps last year.

Our Asset Quality Metrics Remain Strong

NPAs at December 31, 2021 were $41 million or seven bps of total assets, down $5 million or 11% compared to $46 million or eight bps of total assets at December 31, 2020. Total NPLs also decreased $5 million or 13% to $33 million or seven bps of total loans compared to $38 million or nine bps of total loans at December 31, 2020.

Our CARES Act-related deferrals also improved. At December 31, 2021, deferred loans paying interest-only and escrow totaled $479 million, down $2.1 billion or 81% compared to year-end 2020. As of year-end 2021, the Company had zero full-payment deferrals.

Critical Accounting Policies

The preparation of these financial statements requires management to make estimates that affect the reported amounts of assets and liabilities and the reported amounts of income and expenses during the reporting periods. Actual results may differ from these estimates under varying conditions. On a quarterly basis, management evaluates its estimates, particularly those that involve the most difficult, subjective or complex judgments and are often about matters that are inherently uncertain. The most significant judgments and estimates relate to the accounting policy for the Allowance for Credit Losses that is discussed in more detail below.

45


The judgments used by management in applying these critical accounting policies may be influenced by adverse changes in the economic environment, which may result in changes to future financial results.

Allowance for Credit Losses

The Company’s January 1, 2020, adoption of ASU No. 2016-13, “Measurement of Credit Losses on Financial Instruments,” resulted in a significant change to our methodology for estimating the allowance since December 31, 2019. ASU No. 2016-13 replaced the incurred loss methodology with an expected loss methodology that is referred to as the CECL methodology. The measurement of expected credit losses under CECL is applicable to financial assets measured at amortized cost, including loan receivables. It also applies to off-balance sheet exposures not accounted for as insurance and net investments in leases accounted for under ASC Topic 842. At December 31, 2019, the allowance for credit losses on loans and leases totaled $148 million. On January 1, 2020, the Company adopted the CECL methodology under ASU Topic 326 and recognized an increase in the allowance for credit losses on loans and leases of $2 million as a “Day 1” transition adjustment from changes in methodology, with a corresponding decrease in retained earnings. Separately, at December 31, 2019, the Company had an allowance for unfunded commitments of $1 million. Upon adoption, the Company recognized an increase in the allowance for unfunded commitments of $13 million as a “Day 1” transition adjustment with a corresponding decrease in retained earnings.

The allowance for credit losses on loans and leases is deducted from the amortized cost basis of a financial asset or a group of financial assets so that the balance sheet reflects the net amount the Company expects to collect. Amortized cost is the unpaid loan balance, net of deferred fees and expenses, and includes negative escrow. Subsequent changes (favorable and unfavorable) in expected credit losses are recognized immediately in net income as a credit loss expense or a reversal of credit loss expense. Management estimates the allowance by projecting and multiplying together the probability-of-default, loss-given-default and exposure-at-default depending on economic parameters for each month of the remaining contractual term. Economic parameters are developed using available information relating to past events, current conditions, and economic forecasts. The Company’s economic forecast period is 24 months, and afterwards reverts to a historical average loss rate on a straight line basis over a 12 month period. Historical credit experience provides the basis for the estimation of expected credit losses, with qualitative adjustments made for differences in current loan-specific risk characteristics such as differences in underwriting standards, portfolio mix, delinquency levels and terms, as well as for changes in environmental conditions, such as changes in legislation, regulation, policies, administrative practices or other relevant factors. Expected credit losses are estimated over the contractual term of the loans, adjusted for forecasted prepayments when appropriate. The contractual term excludes potential extensions or renewals. The methodology used in the estimation of the allowance for loan and lease losses, which is performed at least quarterly, is designed to be dynamic and responsive to changes in portfolio credit quality and forecasted economic conditions. Each quarter the Company reassesses the appropriateness of the economic forecasting period, the reversion period and historical mean at the portfolio segment level, considering any required adjustments for differences in underwriting standards, portfolio mix, and other relevant data shifts over time.

The allowance for credit losses on loans and leases is measured on a collective (pool) basis when similar risk characteristics exist. The portfolio segment represents the level at which a systematic methodology is applied to estimate credit losses. Management believes the products within each of the entity’s portfolio segments exhibit similar risk characteristics. Smaller pools of homogenous financing receivables with homogeneous risk characteristics were modeled using the methodology selected for the portfolio segment. The macroeconomic data used in the quantitative models are based on a reasonable and supportable forecast period of 24 months. The Company leverages economic projections including property market and prepayment forecasts from established independent third parties to inform its loss drivers in the forecast. Beyond this forecast period, the Company reverts to a historical average loss rate. This reversion to the historical average loss rate is performed on a straight-line basis over 12 months.

Loans that do not share risk characteristics are evaluated on an individual basis. These include loans that are in nonaccrual status with balances above management determined materiality thresholds depending on loan class and also loans that are designated as TDR or “reasonably expected TDR” (criticized, classified, or maturing loans that will have a modification processed within the next three months). In addition, all taxi medallion loans are individually evaluated. If a loan is determined to be collateral dependent, or meets the criteria to apply the collateral dependent practical expedient, expected credit losses are determined based on the fair value of the collateral at the reporting date, less costs to sell as appropriate.

46


The Company maintains an allowance for credit losses on off-balance sheet credit exposures. The Company estimates expected credit losses over the contractual period in which the Company is exposed to credit risk via a contractual obligation to extend credit, unless that obligation is unconditionally cancellable by the Company. The allowance for credit losses on off-balance sheet credit exposures is adjusted as a provision for credit losses expense. The estimate includes consideration of the likelihood that funding will occur and an estimate of expected credit losses on commitments expected to be funded over their estimated life. The Company examined historical credit conversion factor (“CCF”) trends to estimate utilization rates, and chose an appropriate mean CCF based on both management judgment and quantitative analysis. Quantitative analysis involved examination of CCFs over a range of fund-up windows (between 12 and 36 months) and comparison of the mean CCF for each fund-up window with management judgment determining whether the highest mean CCF across fund-up windows made business sense. The Company applies the same standards and estimated loss rates to the credit exposures as to the related class of loans.

When applying this critical accounting policy we incorporate several inputs and judgments that may be influenced by changes period to period. These include, but are not limited to changes in the economic environment and forecasts, changes in the credit profile and characteristics of the loan portfolio, and changes in prepayment assumptions which will result in provisions to or recoveries from the balance of the allowance for credit losses.

While changes to the economic environment forecasts, and portfolio characteristics will change from period to period, portfolio prepayments are an integral assumption in estimating the allowance for credit losses on our mortgage loan portfolio, are subject to estimation uncertainty and changes in this assumption could have a material impact to our estimation process. Prepayment assumptions are sensitive to interest rates and existing loan terms and determine the weighted average life of the mortgage loan portfolio. Excluding other factors, as the weighted average life of the portfolio increases or decreases, so will the requireddollar amount of the allowance for credit losses on mortgage loans. A 20% decrease in prepayment assumptions would lead to an increase in the required allowance for credit losses on mortgageall loans of approximately 6%.

FINANCIAL CONDITION

Balance Sheet Summary

At December 31, 2021, total assets were $59.5 billion, up $3.2 billion or 6% compared to December 31, 2020 and up $1.6 billion compared to the third quarter of 2021. The growth compared to both periods was driven by high-single digit loan growth funded primarily through deposits and a fourth-quarter increase in the level of whole sale borrowings.

Total loans and leases held for investment of $45.7 billion increased $2.9 billion or 7% compared tothat are due after December 31, 20202024, and rose $2.1 billion compared to September 30, 2021. Both the year-over-year and linked-quarter was due to growth in both the multi-family and specialty finance portfolios, offset by modest declines in the CRE portfolio.

Total deposits for the full year were $35.1 billion, up $2.6 billionindicates whether such loans have fixed or 8% compared to last year and increased $438 million compared to the previous quarter. Core deposits (total deposits excluding CDs) increased to $26.6 billionadjustable rates of year-end 2021, up $4.5 billion or 20% compared to year-end 2020 and $738 million compared to the third quarter of 2021.interest:


(in millions)FixedAdjustableTotal
Mortgage Loans:
Multi-family$8,758 $24,977 $33,735 
Commercial real estate3,381 5,856 9,237 
One-to-four family first mortgage2,201 3,846 6,047 
Acquisition, development, and construction121 1,742 1,863 
Total mortgage loans14,461 36,421 50,882 
Other loans9,836 9,752 19,588 
Total loans$24,297 $46,173 $70,470 
Borrowed funds totaled $16.6 billion of year-end 2021, up $478 million or 3% compared to year-end 2020. Given the strong loan growth during the fourth quarter of 2021, the Company utilized borrowings of all which were FHLB-NY advances to fund some of this growth. Accordingly, borrowed funds during the fourth quarter increased $1.1 billion compared to the third quarter of 2021.

Loans Held for Investment

The majority of the loans we produce are multi-family loans. Ourfollowing table summarizes our production of multi-family loans began several decades ago in the five boroughs of New York City, where the majority of the rental units currently consist of rent-regulated apartments featuring below-market rents. In addition to multi-family loans, our loan portfolio contains a large number of CRE credits, most of which are secured by income-producing properties located in New York City and on Long Island.

47


In addition to multi-family loans and CRE loans, our specialty finance loans and leases have become an increasingly larger portion of our overall loan portfolio. The remainder of our portfolio includes smaller balances of C&I loan, one-to-four family loans, ADC loans, and other loans held for investment. The majority of our C&I loans consist of loans to small- and mid-size businesses.investment:


For the Years Ended December 31,
20232022
(in millions)AmountPercent of TotalAmountPercent of Total
Mortgage Loan Originated for Investment:
   Multi-family$839 4.0 %$8,387 49.2 %
Commercial real estate1,0925.3 %1,0866.4 %
One-to-four family first mortgage3,73918.1 %3281.9 %
Acquisition, development, and construction1,5717.6 %1490.9 %
Total mortgage loans originated for investment$7,241 35.0 %$9,950 58.4 %
Other Loans Originated for Investment:
Specialty finance$7,326 35.4 %$6,001 35.2 %
Commercial and industrial4,94223.9 %1,0166.0 %
Other1,1785.7 %830.4 %
Total other loans originated for investment$13,446 65.0 %$7,100 41.6 %
Total loans originated for investment$20,687 100.0 %$17,050 100.0 %
In 2021, we originated $13.1 billion of loans, a $276 million or a 2% increase from the prior year. The higher level of originations was largely driven by a 17% increase in specialty finance originations.

Multi-Family Loans

Multi-family loans are our principal asset.

The multi-family loans we produce are primarily secured by non-luxury residential apartment buildings in New York City that feature rent-regulated units and below-market rents—a market we refer to as our “primary lending niche.” Consistent with our emphasis on multi-family lending,rents.

The multi-family loan originations represented $8.3portfolio was $37.3 billion or 63%, of the loans we produced for investment in 2021.

Atat December 31, 2021, multi-family loans represented $34.62023, down slightly compared to $38.1 billion or 76%,at December 31, 2022 due to a combination of total loans held for investment, reflecting a year-over-year increase of $2.4 billion, or 7%.higher interest rates and our loan diversification strategy.


The majority of our multi-family loans were secured by rental apartment buildings.

At December 31, 2021, $22.12023, $21.1 billion or 64%57 percent of the Company’s total multi-family loan portfolio is secured by properties in New York State, and, therefore,of which $18.3 billion are subject to the new rent regulation laws.Of the $18.3 billion properties subject to rent regulation, approximately 38 percent are currently in an interest only period.The weighted average LTV of the NYSNew York State rent regulated multi-family portfolioportfolio was 55.62% 58 percent as of December 31, 2021,2023 as compared to a weighted average LTV of 59.29% for the entire multi-family loan portfolio57 percent at that date.

December 31, 2022.


In addition to underwriting multi-family loans on the basis of the buildings’ income and condition, we consider the borrowers’ credit history, profitability, and building management expertise. Borrowers are required to present evidence of their ability to repay the loan from the buildings’ current rent rolls, their financial statements, and related documents.

While a percentage of our multi-family loans are ten-year fixed rate credits, the vast majority of our multi-family loans feature a term of ten or twelve years, with a fixed rate of interest for the first five or seven years of the loan, and an alternative

58


rate of interest in years six through ten or eight through twelve. The rate charged in the first five or seven years is generally based on intermediate-term interest rates plus a spread.

During the remaining years, the loan resets to an annually adjustable rate that is tiedindexed to the prime rate of interest,CME Term SOFR or Prime, plus a spread. Alternately, the borrower may opt for a fixed rate that is tied to the five-year fixed advance rate of the FHLB-NY, plus a spread. The fixed-rate option also requires the payment of one percentage point of the then-outstanding loan balance. In either case, the minimum rate at repricing is equivalent to the rate in the initial five-or seven-year term. As the rent roll increases, the typical property owner seeks to refinance the mortgage, and generally does so before the loan reprices in year six or eight.

Multi-family loans that refinance within the first five or seven years are typically subject to an established prepayment penalty schedule. Depending on the remaining term of the loan at the time of prepayment, the penalties normally range from five percentage points to one percentage point of the then-current loan balance. If a loan extends past the fifth or seventh year and the borrower selects the fixed-rate option, the prepayment penalties typically reset to a range of five points to one point over years six through ten or eight through twelve. For example, a ten-year multi-family loan that prepays in year three would generally be expected to pay a prepayment penalty equal to three percentage points of the remaining principal balance. A twelve-year multi-family loan that prepays in year one or two would generally be expected to pay a penalty equal to five percentage points.

Because prepayment penalties assessed to the borrower are recorded as interest income, they are reflected in the average yields on our loans and interest-earning assets, our net interest rate spread and net interest margin, and the level of net interest income we record. No assumptions are involved in the recognition of prepayment income, as such income is only recorded when the cash is received.

48


Our success as a multi-family lender partly reflects the solid relationships we have developed with the market’s leading mortgage brokers and generational direct relationships, who are familiar with our lending practices, our underwriting standards, and our long-standing practice of basing our loans on the cash flows produced by the properties. The process of producing such loans is generally four to six weeks in duration and, because the multi-family market is largely broker-driven, the expense incurred in sourcing such loans is substantially reduced.

Our emphasis on multi-family loans is driven by several factors, including their structure, which reduces our exposure to interest rate volatility to some degree. Another factor driving our focus on multi-family lending has been the comparative quality of the loans we produce. Reflecting the nature of the buildings securing our loans, our underwriting standards, and the generally conservative LTV ratios our multi-family loans feature at origination, a relatively small percentage of the multi-family loans that have transitioned to non-performing status have actually resulted in losses, even when the credit cycle has taken a downward turn.

duration.

We primarily underwrite our multi-family loans based on the current cash flows produced by the collateral property, with a reliance on the “income” approach to appraising the properties, rather than the “sales” approach. The sales approach is subject to fluctuations in the real estate market, as well as general economic conditions, and is therefore likely to be more risky in the event of a downward credit cycle turn. We also consider a variety of other factors, including the physical condition of the underlying property; the net operating income of the mortgaged premises prior to debt service; the DSCR, which is the ratio of the property’s net operating income to its debt service; and the ratio of the loan amount to the appraised value (i.e., the LTV) of the property.

In addition to requiring a minimum DSCR of 120%120 percent on multi-family buildings at origination, we obtain a security interest in the personal property located on the premises, and an assignment of rents and leases. Our multi-family loans generally represent no more than 75%75 percent of the lower of the appraised value or the sales price of the underlying property, and typically feature an amortization period of 30 years. In addition, our multi-family loans may contain an initial interest-only period which typically does not exceed two years; however, these loans are underwritten on a fully amortizing basis. Exceptions to these levels are made to borrowers on a case by case basis and approved by the joint authority of credit and lending officers and when necessary, the Board Credit Committee of the Board.

Accordingly, while

We continue to monitor our loans held for investment portfolio and the related allowance for credit losses, particularly given the economic pressures facing the commercial real estate and multi-family lending niche has not been immune to downturns in the credit cycle, the limited number of losses we have recorded, even in adverse credit cycles, suggests that the multi-family loans we produce involve less credit risk than certain other types of loans.markets. In general, buildings that are subject to rent regulation have historically tended to be stable, with occupancy levels remaining more or less constant over time. Because the rents are typically below market and the buildings securing our loans are generally maintained in good condition, they have been more likely to retain their tenants in adverse economic times. In addition, we generally exclude any short-term property tax exemptions and abatement benefits the property owners receive when we underwrite our multi-family loans.


59


The following table presents a geographical analysis of the multi-family loans in our held-for-investment loan portfolio:

At December 31, 2023
Multi-Family Loans
(in millions)AmountPercent of Total
New York City:
Manhattan$6,893 18 %
Brooklyn5,840 16 %
Bronx3,619 10 %
Queens2,831 %
Staten Island133 — %
Total New York City$19,316 52 %
New Jersey5,064 14 %
Long Island509 %
Total Metro New York$24,889 67 %
Other New York State1,233 %
Pennsylvania3,682 10 %
Florida1,681 %
Ohio1,085 %
Arizona434 %
All other states4,261 11 %
Total$37,265 100 %

Commercial Real Estate Loans

At December 31, 2021,2023, CRE loans represented $6.7$10.5 billion, or 15%,12 percent, of total loans held for investment, reflecting a year-over-year decrease of $138 million or 2.0%$2.0 billion increase when compared to $8.5 billion at December 31, 2020.2022. Approximately $1.9 billion of CRE loans were acquired in the Signature Transaction.

CRE loans represented $893 million,$1.1 billion, or 7%,5 percent, of the loans we originated in 2021,for the year ended December 31, 2023 as compared to $958 million,$1.1 billion, or 7%, in6 percent for the prior year.year ended December 31, 2022.

The CRE loans we produce are secured by income-producing properties such as office buildings, retail centers, mixed-use buildings, and multi-tenanted light industrial properties. At December 31, 2021, 83.5%2023, the largest concentration of our CRE loans were secured by properties in the metro New York City area, whilearea. Refer to the Geographical Analysis table included below for additional details.

Approximately $3.4 billion of the CRE portfolio are office properties with an average balance of approximately $10 million and located primarily in other parts ofthe New York State accounted for 2.3%metro area.

The terms of the properties securing our CRE credits, while all other states accounted for 14.2%, combined.

49


The termsmore than half of our CRE loans are similar to the terms of our multi-family credits. While a small percentage of our CRE loans feature ten-year fixed-rate terms, they primarily feature a fixed rate of interest for the first five or seven years of the loan that is generally based on intermediate-term interest rates plus a spread. During years six through tenIn addition to customary fixed rate terms, we now also offer floating rates advances indexed to CME Term SOFR. These products are generally offered in combination with interest rate cap or eight through twelve,swaps that provide borrowers with additional optionality to manage their interest rate risk. Following the initial fixed rate period, the loan resets to an annually adjustable interest rate that is tiedindexed to the prime rate of interest,CME Term SOFR or Prime, plus a spread.spread. Alternately, the borrower may opt for a fixed rate that is tied to the five-year fixed advance rate of the FHLB-NY plus a spread. The fixed-rate option also requires the payment of an amount equal to one percentage point of the then-outstanding loan balance. In either case, the minimum rate at repricing is equivalent to the rate in the initial five- or seven-year term.


Prepayment penalties apply to certain of our CRE loans, as they do our multi-family credits.loans. Depending on the remaining term of the loan at the time of prepayment, the penalties normally range from five percentage points to one percentage point of the then-current loan balance.

60


If a loan extends past the fifth or seventh year and the borrower selects the fixed rate option, the prepayment penalties typically reset to a range of five points to one point over years six through ten or eight through twelve. Our CRE loans tend to refinance within two to three years of origination, as reflected in the expected weighted average life of the CRE portfolio noted above.

The repayment of loans secured by commercial real estate is often dependent on the successful operation and management of the underlying properties. To minimize our credit risk, we

We originate CRE loans in adherence with conservative underwriting standards, and require that such loans qualify on the basis of the property’s current income stream and DSCR. The approval of a loan alsoprimarily depends on the borrower’s credit history, profitability, and expertise in property management, and generally requires a minimum DSCR of 130%130 percent and a maximum LTV of 65%.65 percent. In addition, the origination of CRE loans typically requires a security interest in the fixtures, equipment, and other personal property of the borrower and/or an assignment of the rents and/or leases. In addition, certain of our CRE loans may contain an interest-only period which typically does not exceed three years; however, these loans are underwritten on a fully amortizing basis.

The following table presents a geographical analysis of the CRE loans in our held-for-investment loan portfolio:

At December 31, 2023
Commercial Real Estate Loans
(in millions)AmountPercent of Total
New York$5,319 51 %
Michigan1,000 10 %
New Jersey580 %
Florida457 %
Texas105 %
Pennsylvania374 %
Ohio132 %
All other states2,503 24 %
Total$10,470 100 %

Acquisition, Development, and Construction Loans

At December 31, 2023, our ADC loans represented $2.9 billion, or 3 percent, of total loans held for investment, reflecting an increase of $916 million compared to December 31, 2022.

Because ADC loans are generally considered to have a higher degree of credit risk, especially during a downturn in the credit cycle, borrowers are required to provide a guarantee of repayment and completion. The risk of loss on an ADC loan is largely dependent upon the accuracy of the initial appraisal of the property’s value upon completion of construction; the developer’s experience; the estimated cost of construction, including interest; and the estimated time to complete and/or sell or lease such property.

When applicable, as a condition to closing an ADC loan, it is our practice to require that properties meet pre-sale or pre-lease requirements prior to funding.

C&I Loans


At December 31, 2023 C&I loans totaled $25.3 billion or 30 percent of total loans held-for-investment. Included in this portfolio is $5.1 billion in warehouse loans that allow mortgage lenders to fund the closing of residential mortgage loans.

The non-warehouse C&I loans we produce are primarily made to small and mid-size businesses and finance companies. Such loans are tailored to meet the specific needs of our borrowers, and include term loans, demand loans, revolving lines of credit, and, to a much lesser extent, loans that are partly guaranteed by the Small Business Administration.

A broad range of C&I loans, both collateralized and unsecured, are made available to businesses for working capital (including inventory and accounts receivable), business expansion, the purchase of machinery and equipment, and other general corporate needs. In determining the term and structure of C&I loans, several factors are considered, including the purpose, the collateral, and the anticipated sources of repayment. C&I loans are typically secured by business assets and personal guarantees of the borrower, and include financial covenants to monitor the borrower’s financial stability.


61


Also included in our C&I portfolio is our national warehouse lending platform with relationship managers across the country. We offer warehouse lines of credit to other mortgage lenders which allow the lender to fund the closing of residential mortgage loans. Each extension, advance, or draw-down on the line is fully collateralized by residential mortgage loans and is paid off when the lender sells the loan to an outside investor or, in some instances, to the Bank.

Underlying mortgage loans are predominantly originated using the agencies' underwriting standards. The guideline for debt to tangible net worth is 15 to 1. At December 31, 2023, we had $5.1 billion outstanding warehouse loans to other mortgage lenders and have relationships in place to lend up to $11.8 billion at our discretion.

The interest rates on our C&I loans can be fixed or floating, with floating-rate loans being tied to SOFR, prime or some other market index, plus an applicable spread. Our floating-rate loans may or may not feature a floor rate of interest. The decision to require a floor on C&I loans depends on the level of competition we face for such loans from other institutions, the direction of market interest rates, and the profitability of our relationship with the borrower.

Specialty Finance Loans and Leases

At December 31, 2021,2023, specialty finance loans and leases totaled $3.5$5.2 billion or 8%6 percent of total loans held for investment, up $451$769 million or 15%17 percent compared to December 31, 2020.2022.


We produce our specialty finance loans and leases through a subsidiary that is staffed by a group of industry veterans with expertise in originating and underwriting senior securitized debt and equipment loans and leases. The subsidiary participates in syndicated loans that are brought to them, and equipment loans and leases that are assigned to them, by a select group of nationally recognized sources, and are generally made to large corporate obligors, many of which are publicly traded, carry investment grade or near-investment grade ratings, and participate in stable industries nationwide.

The specialty finance loans and leases we fund fall into three categories: asset-based lending, dealer floor-plan lending, and equipment loan and leaselease financing. Each of these credits is secured with a perfected first security interest in, or outright ownership of, the underlying collateral, and structured as senior debt or as a non-cancelable lease. As of December 31, 2021 NYCB Specialty Finance has $3.7 billion2023, 84 percent of loans outstanding versus $5.6 billion inspecialty finance loan commitments. Of the $5.6 billion in NYCB Specialty Finance commitments 69% or $3.9 billion are structured as floating rate obligations which will benefit in a rising rate environment. All floating rate obligations are being transitioned from LIBOR to an appropriate LIBOR replacement index in accordance with the regulatory guidance provided around LIBOR cessation.

During 2021,
As of December 31, 2023, the Company originated $3.2$7.3 billion of specialty finance loans and leases, representing 24%35 percent of total originations compared to $2.7$6.0 billion during 2020,for the same period in 2022, representing 21%35 percent of total originations.

Since launching our specialty finance business in the third quarter of 2013, no losses have been recorded on any of the loans or leases in this portfolio.

One-to-Four Family Loans

50


C&I Loans

In the twelve months ended December 31, 2021, C&I loans increased $132 million or 34% to $526 million, or 1% of total loans, and represented $536 million or 4% of the held for investment loans we originated.

In contrast to the loans produced by our specialty finance subsidiary, the C&I loans we produce are primarily made to small and mid-size businesses in the five boroughs of New York City and on Long Island. Such loans are tailored to meet the specific needs of our borrowers, and include term loans, demand loans, revolving lines of credit, and, to a much lesser extent, loans that are partly guaranteed by the Small Business Administration.

A broad range of C&I loans, both collateralized and unsecured, are made available to businesses for working capital (including inventory and accounts receivable), business expansion, the purchase of machinery and equipment, and other general corporate needs. In determining the term and structure of C&I loans, several factors are considered, including the purpose, the collateral, and the anticipated sources of repayment. C&I loans are typically secured by business assets and personal guarantees of the borrower, and include financial covenants to monitor the borrower’s financial stability.

The interest rates on our C&I loans can be fixed or floating, with floating-rate loans being tied to prime or some other market index, plus an applicable spread. Our floating-rate loans may or may not feature a floor rate of interest. The decision to require a floor on C&I loans depends on the level of competition we face for such loans from other institutions, the direction of market interest rates, and the profitability of our relationship with the borrower.

Acquisition, Development, and Construction Loans

At December 31, 2021, ADC2023, one-to-four family loans represented $209$6.1 billion, including $996 million of LGG, or 0.5%,7 percent, of total loans held for investment, as compared to $90 million, or 0.2%, atinvestment. As of December 31, 2023, the prior year-end. Originationsrepurchase liability on LGG loans was $456 million. As of ADCDecember 31, 2022 one-to-four family loans totaled $119 million$5.8 billion. These loans include various types of conforming and non-conforming fixed and adjustable rate loans underwritten using Fannie Mae and Freddie Mac guidelines for the purpose of purchasing or refinancing owner occupied and second home properties. We typically hold certain mortgage loans in 2021, up from $35 million at December 31, 2020.LHFI that do not qualify for sale to the Agencies and that have an acceptable yield and risk profile. The LTV requirements on our residential first mortgage loans vary depending on occupancy, property type, loan amount, and FICO scores. Loans with LTVs exceedi

Because ADC loans are generally considered to have a higher degree of credit risk, especially during a downturn in the credit cycle, borrowersng 80 percent are required to provide a guaranteeobtain mortgage insurance. As of repayment and completion. In the twelve months ended December 31, 20212023, non-government guaranteed loans in this portfolio had an average current FICO score of 741 and 2020, we did not recover any losses against guarantees. The riskan average LTV of loss on an ADC53.


Substantially all LGG are insured or guaranteed by the FHA or the U.S. Department of Veterans Affairs. Nonperforming repurchased loans in this portfolio earn interest at a rate based upon the 10-year U.S. Treasury note rate from the time the underlying loan becomes 60 days delinquent until the loan is largely dependent uponconveyed to HUD (if foreclosure timelines are met), which is not paid by the accuracy ofFHA until claimed. The Bank has a unilateral option to repurchase loans sold to GNMA if the initial appraisal ofloan is due, but unpaid, for three consecutive months (typically referred to as 90 days past due) and can recover losses through a claims process from the property’s value upon completion of construction; the developer’s experience; the estimated cost of construction, including interest; and the estimated time to complete and/or sell or lease such property.

When applicable, as a condition to closing an ADC loan, it is our practice to require that properties meet pre-sale or pre-lease requirements prior to funding.

One-to-Four Family Loans

At December 31, 2021, one-to-four familyguarantor. These loans represented $160 million, or 0.3%, of totalare recorded in loans held for investment and the liability to repurchase the loans is recorded in other liabilities on the Consolidated Statements of Condition. Certain loans within our portfolio may be subject to indemnifications and insurance limits which expose us to limited credit risk. We have reserved for these risks within other assets and as compared to $236 million, or 0.6%, at the prior year-end. These loan balances include certain mixed-use CRE loans with less than fivea component of our ACL on residential units classified as one-to-four family loans. Other than these types of loans, we do not currently originate traditional one-to-four family loans.first mortgages.


62


Other Loans

At December 31, 2021,2023, other loans totaled $6 million$2.7 billion and consisted primarily of home equity lines of credit, boat and recreational vehicle indirect lending, point of sale consumer loans most of which wereand other consumer loans, including overdraft loans.

Our home equity portfolio includes HELOANs, second mortgage loans, and HELOCs. These loans are underwritten and priced in an effort to non-profit organizations.ensure credit quality and loan profitability. Our debt-to-income ratio on HELOANs and HELOCs is capped at 43 percent and 45 percent, respectively. We currently do not offer home equitylimit the maximum CLTV to 89.99 percent and FICO scores to a minimum of 700. Second mortgage loans or linesand HELOANs are fixed rate loans and are available with terms up to 20 years. HELOC loans are primarily variable-rate loans that contain a 10-year interest only draw period followed by a 20-year amortizing period. As of credit.

Lending Authority


The Board of Directors updated certain aspects of the Company's lending authority as detailed below. These changes were effective as of July 21, 2021.

51


Multi-family, CRE, ADC, and specialty finance loans less than or equal to $10 million and C&I loans less than or equal to $5 million are approved by the joint authority of lending officers. C&IDecember 31, 2023, loans in excessthis portfolio had an average current FICO score of $5 million and all multi-family, CRE, ADC, and specialty finance loans in excess751.


As of $10 million are required to be presented to the Management Credit Committee for approval. Multi-family, CRE, ADC, and specialty finance loans in excess of $50 million and C&I loans in excess of $10 million are also required to be presented to the Board Credit Committee of the Board, so that the Committee can review the loan’s associated risks and approve the credit. The Board Credit Committee has authority to direct changes in lending practices as they deem necessary or appropriate in order to address individual or aggregate risks and credit exposures in accordance with the Bank’s strategic objectives and risk appetites.

In addition, all loans of $50 million or more originated by the Bank continue to be reported to the Board of Directors.

In 2021, 251 loans greater than $10 million were originated by the Bank, with an aggregate loan balance of $7.0 billion at origination. In 2020, by comparison, 252 loans greater than $10 million were originated, with an aggregate loan balance at origination of $7.5 billion.

At December 31, 2021 and 2020, the largest mortgage loan in our portfolio was a $329 million multi-family loan, which is collateralized by six properties located in Brooklyn, New York. As of the date of this report, the loan has been current since origination.

Geographical Analysis of the Portfolio of Loans Held for Investment

The following table presents a geographical analysis of the multi-family and CRE2023, loans in our held-for-investment loanindirect portfolio at December 31, 2021:had an average current FICO score of 743. Point of sale loans consist of unsecured consumer installment loans originated primarily for home improvement purposes throug


At December 31, 2021


Multi-Family Loans


Commercial Real Estate Loans


(dollars in millions)


Amount


Percent
of Total


Amount


Percent
of Total


New York City:


Manhattan

$


7,731


22.34


%


$


2,867


42.80


%

Brooklyn


6,144


17.76


363


5.42


Bronx


3,577


10.34


143


2.14


Queens


2,900


8.38


595


8.88


Staten Island


124


0.36


53


0.79


Total New York City

$


20,476


59.18


%


$


4,021


60.03


%

New Jersey


4,704


13.59


545


8.14


Long Island


563


1.63


1,026


15.32


Total Metro New York

$


25,743


74.40


%


$


5,592


83.49


%

Other New York State


1,093


3.16


157


2.34


Pennsylvania


3,266


9.44


323


4.82


Florida


1,390


4.02


219


3.27


Ohio


696


2.01


22


0.33


Arizona


412


1.19


10


0.15


All other states


2,003


5.80


375


5.60


Total

$


34,603


100.00


%


$


6,698


100.00


%

At December 31, 2021, the majorityh a third-party financial technology company who also provides us a level of our other loans held for investment, excluding specialty finance loans and leases, were secured by properties and/or businesses located in Metro New York.credit loss protection.

52


Loan Maturity and Repricing Analysis: Loans Held for Investment

The following table sets forth the maturity or period to repricing of our portfolio of loans held for investment at December 31, 2021. Loans that have adjustable rates are shown as being due in the period during which their interest rates are next subject to change.

(in millions)


Multi-
Family


Commercial
Real
Estate


One-to-
Four
Family


Acquisition,
Development,
and
Construction


Other


Total
Loans


Amount due:


Within one year


$


8,752


$


2,352


$


123


$


177


$


2,750


$


14,154


After one year:


One to five years


22,381


3,748


36


29


1,123


27,317


Over five years to fifteen years


3,445


598


1


3


101


4,148


Over fifteen years


25


37


62


Total due or repricing after one year


25,851


4,346


37


32


1,261


31,527


Total amounts due or repricing, gross


$


34,603


$


6,698


$


160


$


209


$


4,011


$


45,681


The following table sets forth, as of December 31, 2021, the dollar amount of all loans held for investment that are due after December 31, 2022, and indicates whether such loans have fixed or adjustable rates of interest:


Due after December 31, 2022


(in millions)


Fixed


Adjustable


Total


Mortgage Loans:


Multi-family


$


4,809


$


21,042


$


25,851


Commercial real estate


455


3,891


4,346


One-to-four family


37


-


37


Acquisition, development, and construction


32


-


32


Total mortgage loans


5,333


24,933


30,266


Other loans


1,192


69


1,261


Total loans


$


6,525


$


25,002


$


31,527


Loans Held for Sale

AtLoans held-for-sale at December 31, 2021,2023 totaled $1.2 billion, up from $1.1 billion at December 31, 2022. The Signature Transaction contributed $360 million of Small Business Administration ("SBA") loans to this increase. We classify loans as held for sale were zero comparedwhen we originate or purchase loans that we intend to $117 million at December 31, 2020. The balance at year-end 2020 consisted entirelysell. We have elected the fair value option for nearly all of Paycheck Protection Programthis portfolio, except the SBA loans. During 2020 andWe estimate the first halffair value of 2021, the Company was a participant in the Small Business Administration Paycheck Protection Program, a loan program established to help consumers and small businesses during the COVID-19 pandemic. During the second quarter of 2021, the Company transferred the $94 million of PPPmortgage loans remainingbased on the balance sheet that were heldquoted market prices for sale to the held for investment C&I portfolio.

53


Loan Origination Analysis

The following table summarizes our productionsecurities backed by similar types of loans, heldwhere available, or by discounting estimated cash flows using observable inputs inclusive of interest rates, prepayment speeds and loss assumptions for investment in the years ended December 31, 2021 and 2020:similar collateral.


For the Years Ended December 31,


2021


2020


(dollars in millions)


Amount


Percent
of Total


Amount


Percent
of Total


Mortgage Loan Originated for Investment:


Multi-family


$


8,256


62.87


%


$

8,712


67.78


%

Commercial real estate


893


6.80


958


7.45


One-to-four family residential


168


1.28


58


0.45


Acquisition, development, and construction


119


0.91


35


0.27


Total mortgage loans originated for investment


9,436


71.86


9,763


75.95


Other Loans Originated for Investment:


Specialty finance


3,153


24.01


2,695


20.96


Other commercial and industrial


536


4.08


393


3.06


Other


6


0.05


4


0.03


Total other loans originated for investment


3,695


28.14


3,092


24.05


Total loans originated for investment


$


13,131


100.00


%


$

12,855


100.00


%

Loan Portfolio Analysis

The following table summarizes the composition of our loan portfolio at each year-end for the three years ended December 31, 2021:


At December 31,


2021


2020


2019


(dollars in millions)

Amount


Percent
of Total
Loans


Amount


Percent
of Total
Loans


Amount


Percent
of Total
Loans


Mortgage Loans:


Multi-family

$

34,603


75.75

%

$

32,236


75.07

%

$

31,159


74.46

%

Commercial real estate


6,698


14.66


6,836


15.92


7,082


16.93


One-to-four family


160


0.35


236


0.55


380


0.91


Acquisition, development, and
   construction


209


0.46


90


0.21


201


0.48


Total mortgage loans


41,670


91.22


39,398


91.75


38,822


92.78


Other Loans:


Specialty finance


3,479


7.62


3,024


7.04


2,594


6.20


Other commercial and industrial


527


1.16


393


0.92


420


1.00


Other loans


5


0.01


7


0.02


8


0.02


Total other loans


4,011


8.78


3,424


7.98


3,022


7.22


Total loans held for investment

$

45,681


100.00


$

42,822


99.73


$

41,844


100.00


Loans held for sale


-


117


0.27


Total loans

$

45,681


100.00

%

$

42,939


100.00

%

$

41,844


100.00

%

Net deferred loan origination costs


57


62


50


Allowance for credit losses on loans and leases


(199

)


(194

)


(148

)


Total loans and leases, net

$

45,539


$

42,807


$

41,746


54


Asset Quality

Loans Held for Investment and Repossessed Assets

Total NPAs were $41 million or 0.07% of total assets at December 31, 2021, down 11% or $5 million compared to $46 million or 0.08% of total assets at December 31, 2020. Total non-accrual mortgage loans increased $9 million to $27 million, while other non-accrual loans, consisting mainly of taxi medallion-related loans, declined $14 million to $6 million compared to $20 million at December 31, 2020. Included in these amounts were non-accrual taxi medallion-related loans of $6 million and $19 million, respectively.

Repossessed assets totaled $8 million, unchanged compared to the balance at December 31, 2020. As is the case with other non-accrual loans, the majority of the Company’s repossessed assets consist of taxi medallions. Taxi medallions represented $5 million of total repossessed assets at December 31, 2021 compared to $7 million at December 31, 2020.

The following table presents our non-performing loans by loan type and the changes in the respective balances from December 31, 2020 to December 31, 2021:


Change from
December 31, 2020
to
December 31, 2021


(dollars in millions)


December 31,
2021


December 31,
2020


Amount


Percent


Non-Performing Loans:


Non-accrual mortgage loans:


Multi-family

$


10


$

4


$


6


150


%

Commercial real estate


16


12


4


33


One-to-four family


1


2


(1

)


(50

)


Acquisition, development, and construction


Total non-accrual mortgage loans


27


18


9


50


Non-accrual other loans (1)


6


20


(14

)


(70

)


Total non-performing loans

$


33


$

38


$


(5

)


(13

)


(1)
Includes $6 million and $19 million of non-accrual taxi medallion-related loans at December 31, 2021 and 2020, respectively.
Credit Quality

The following table sets forth the changes in non-performing loans over the twelve months ended December 31, 2021:

(in millions)

Balance at December 31, 2020

$

38

New non-accrual

31

Charge-offs

(10

)

Transferred to repossessed assets

Loan payoffs, including dispositions and principal
   pay-downs

(20

)

Restored to performing status

(6

)

Balance at December 31, 2021

$

33

A loan generally is classified as a “non-accrual” loan when it is 90 days or more past due or when it is deemed to be impaired because we no longer expect to collect all amounts due according to the contractual terms of the loan agreement. When a loan is placed on non-accrual status, we cease the accrual of interest owed, and previously accrued interest is reversed and charged against interest income. At December 31, 20212023 and 2020,December 31, 2022, all of our non-performing loans were non-accrual loans. A loan is generally returned to accrual status when the loan is current and we have reasonable assurance that the loan will be fully collectible.

55


We monitor non-accrual loans both within and beyond our primary lending area in the same manner. Monitoring loans generally involves inspecting and re-appraising the collateral properties; holding discussions with the principals and managing agents of the borrowing entities and/or retainedand retain legal counsel, as applicable; requesting financial, operating, and rent roll information; confirming that hazard insurance is in place or force-placing such insurance; monitoring tax payment status andstatus. advancing funds as needed; and appointingseeking approval from the courts to appoint a receiver, whenever possible,when necessary to protect the Bank’s interests, including to collect rents, manage theproperty operations, provide information, and maintainensure maintenance of the collateral properties.

It is our policy to order updated appraisals for all non-performing loans irrespective of loan type,90 days or more past due that are collateralized by multi-family buildings, CRE properties, or land, in the event that such a loan is 90 days or more past due, and if the most recent appraisal on file for the property is more than one year old. Appraisals are ordered annually until such time as the loan becomes performing and is returned to accrual status. It is not our policy to obtain updated appraisals for performing loans. However, appraisals may be ordered for performing loans when a borrower requests an increase in the loan amount, a modification in loan terms, or an extension of a maturing loan. We do not analyze current LTVs on a portfolio-wide basis.

Non-performing loans are reviewed regularly by management and discussed on a monthly basis with the Mortgage Committee, theBoard Credit Committee, and the Board of Directors of the Bank, as applicable. In accordance with our charge-off policy, collateral-dependent non-performing loans are written down to their current appraised values, less certain transaction costs. Workout specialists from our Loan Workout Unit actively pursue borrowers who are delinquent in repaying their loans in an effort to collect payment. In addition, outside counsel with experience in foreclosure proceedings are retained to institute such action with regard to such borrowers.

Properties and other assets that are acquired through foreclosure are classified as repossessed assets, and are recorded at fair value at the date of acquisition, less the estimated cost of selling the property. Subsequent declines in the fair value of the assets are charged to earnings and are included in non-interest expense. It is our policy to require an appraisal and an

63


environmental assessment of properties classified as OREO before foreclosure, and to re-appraise the properties on an as-needed basis, and not less than annually, until they are sold. We dispose of such properties as quickly and prudently as possible, given current market conditions and the property’s condition.

To mitigate the potential for credit losses, we underwrite our loans in accordance with credit standards that we consider to be prudent. In the case of multi-family and CRE loans, we look first at the consistency of the cash flows being generated by the property to determine its economic value using the “income approach,” and then at the market value of the property that collateralizes the loan. The amount of the loan is then based on the lower of the two values, with the economic value more typically used.

The condition of the collateral property is another critical factor. Multi-family buildings and CRE properties are inspected from rooftop to basement as a prerequisite to approval, with a member of the Mortgage or Credit Committee participating in inspections on multi-family loans to be originated in excess of $7.5 million, and a member of the Mortgage or Credit Committee participating in inspections on CRE loans to be originated in excess of $4.0 million.approval. Furthermore, independent appraisers, whose appraisals are carefully reviewed by our experienced in-house appraisal officers and staff, perform appraisals on collateral properties. In many cases, a second independent appraisal review is performed.

In addition, we work with a select group of mortgage brokers who are familiar with our credit standards and whose track record with our lending officers is typically greater than ten years. Furthermore, in New York City, where the majority of the buildings securing our multi-family loans are located, the rents that tenants may be charged on certain apartments are typically restricted under certain rent-control or rent-stabilization laws. As a result, the rents that tenants pay for such apartments are generally lower than current market rents. Buildings with a preponderance of such rent-regulated apartments are less likely to experience vacancies in times of economic adversity.

Reflecting the strength of the underlying collateral for these loans and the collateral structure, a relatively small percentage of our non-performing multi-family loans have resulted in losses over time.

To further manage our credit risk, our lending policies limit the amount of credit granted to any one borrower, and typically require minimum DSCRs of 120%120 percent for multi-family loans and 130%130 percent for CRE loans. AlthoughAt origination, we typically lend up to 75%75 percent of the appraised value on multi-family buildings and up to 65%65 percent on commercial properties,properties.

56


the average LTVs of such credits at origination were below those amounts at December 31, 2021. Exceptions to these DSCR and LTV limitations are minimal and are reviewed on a case-by-case basis.

The repaymentapproved by the joint authority of loans secured by commercial real estate is often dependent oncredit and lending officers and when necessary, the successful operation and managementBoard Credit Committee of the underlying properties. To minimize our credit risk, we originate CRE loans in adherence with conservative underwriting standards, and require that such loans qualify on the basis of the property’s current income stream and DSCR. The approval of a CRE loan also depends on the borrower’s credit history, profitability, and expertise in property management. Given that our CRE loans are underwritten in accordance with underwriting standards that are similar to those applicable to our multi-family credits, the percentage of our non-performing CRE loans that have resulted in losses has been comparatively small over time.Board.


Multi-family and CRE loans are generally originated at conservative LTVs and DSCRs, as previously stated. Low LTVs provide a greater likelihood of full recovery and reduce the possibility of incurring a severe loss on a credit; in many cases, they reduce the likelihood of the borrower “walking away” from the property. Although borrowers may default on loan payments, they have a greater incentive to protect their equity in the collateral property and to return their loans to performing status. Furthermore, in the case of multi-family loans, the cash flows generated by the properties are generally below-market and have significant value.

With regard to ADC loans, we typically lend up to 75%75 percent of the estimated as-completed market value of multi-family and residential tract projects; however, in the case of home construction loans to individuals, the limit is 80%.80 percent. With respect to commercial construction loans, we typically lend up to 65%65 percent of the estimated as-completed market value of the property. Credit risk is also managed through the loan disbursement process. Loan proceeds are disbursed periodically in increments as construction progresses, and as warranted by inspection reports provided to us by our own lending officers and/or consulting engineers.

To minimize the risk involved in specialty finance lending and leasing, each of our credits is secured with a perfected first security interest or outright ownership in the underlying collateral, and structured as senior debt or as a non-cancellable lease. To further minimize the risk involved in specialty finance lending and leasing, we re-underwrite each transaction. In addition, we retain outside counsel to conduct a further review of the underlying documentation.

Other C&I loans generally represent loans to commercial businesses which meet certain desired client characteristics and credit standards.The credit standards for commercial borrowers are typically underwrittenbased on the basisnumerous criteria, including historical and projected financial information, strength of the cash flows produced bymanagement, acceptable collateral, and market conditions and trends in the borrower’s business, andindustry.These loans are generally collateralized by various business assets, including, but not limited to, inventory, equipment, and accounts receivable. As a result, the capacity of the borrower to repay is substantially dependent on the degree tovariable rate loans in which the business is successful. Furthermore, the collateral underlying the loan may depreciate over time, may not be conducive to appraisal, and may fluctuate in value, based upon the operating results of the business. Accordingly, personal guarantees are alsointerest rate fluctuates with a normal requirement for other C&I loans.specified index rate.

The procedures we follow with respect to delinquent loans are generally consistent across all categories, with late charges assessed, and notices mailed to the borrower, at specified dates. We attempt to reach the borrower by telephone to ascertain the reasons for delinquency and the prospects for repayment. When contact is made with a borrower at any time prior to foreclosure or recovery against collateral property, we attempt to obtain full payment, and will consider a repayment schedule to avoid taking such action. Delinquencies are addressed by our Loan Workout Unit and every effort is made to collect rather than initiate foreclosure proceedings.

57


The following table presents our loans 30 to 89 days past due by loan type and the changes in the respective balances from December 31, 2021 to December 31, 2020:


Change from
December 31, 2020
to
December 31, 2021


(dollars in millions)


December 31,
2021


December 31,
2020


Amount


Percent


Loans 30-89 Days Past Due:


Multi-family


$

57


$

4


$

53


1325

%


Commercial real estate


2


10


(8

)


-80


One-to-four family


8


2


6


300


Acquisition, development, and construction


-


NM


Other loans


-


NM


Total loans 30-89 days past due


$

67


$

16


$

51


319

%


Fair values for all multi-family buildings, CRE properties, and land are determined based on the appraised value. If an appraisal is more than one year old and the loan is classified as either non-performing or as an accruing TDR,TDM, then an updated appraisal is required to determine fair value. Estimated disposition costs are deducted from the fair value of the property to determine estimated net realizable value. In the instance of an outdated appraisal on an impaired loan, we adjust the original appraisal by using a third-party index value to determine the extent of impairment until an updated appraisal is received.

While we strive to originate loans that will perform fully, adverse economic and market conditions, among other factors, can negatively impact a borrower’s ability to repay. Historically, our level of charge-offs has been relatively low in downward credit cycles, even when the volume of non-performing loans has increased. In 2021, we recorded a net recovery of $2 million, as compared to net charge-offs of $19 million in the previous year. Taxi medallion-related net charge-offs accounted for $2 million of this year's amount compared to $12 million of last year's amount.

64

Partially reflecting the net recoveries noted above, and the provision of $3 million for the allowance for loan losses, the allowance for losses on loans increased $5 million, equaling $199 million at December 31, 2021 from $194 million at December 31, 2020. Reflecting the decrease in non-performing loans cited earlier in this discussion, the allowance for credit losses represented 611.79% of non-performing loans at December 31, 2021, as compared to 513.55% at the prior year-end.
Asset Quality Measures

Based upon all relevant and available information at the end of this December, management believes that the allowance for losses on loans was appropriate at that date.

The following table presents information aboutthe Company's asset quality measures at the respective dates:

December 31, 2023December 31, 2022
Non-performing loans to total loans held for investment0.51 %0.20 %
Non-performing assets to total assets0.39 0.17 
Allowance for credit losses on loans and leases to non-performing loans231.51 278.87 
Allowance for credit losses on loans and leases to total loans held for investment1.17 0.57 

Non-Performing Loans

The following table presents our five largest non-performing loans at December 31, 2021:held for investment by loan type and the changes in the respective balances:

(dollars in millions)


Loan No. 1


Loan No. 2 (2)


Loan No. 3


Loan No. 4


Loan No. 5


Type of Loan


CRE


Multi-Family


CRE


Multi-Family


CRE


Origination date


06/20/14


07/28/2015


09/20/2016


07/24/2020


06/16/2003


Origination balance


$

10


$

8


$

10


$

2


$

2


Full commitment balance (1)


$

10


$

8


$

10


$

2


$

2


Balance at December 31, 2021


$

8


$

7


$

6


$

2


$

1


Associated allowance


$


$


$


$


$


Non-accrual date


October 2019


January 2021


November 2021


November 2021


October 2015


Origination LTV


65%


59%


72%


25%


68%


Current LTV


86%


84%


95%


26%


23%


Last appraisal


November 2021


August 2021


May 2021


December 2021


August 2021


Change from
December 31, 2022
to
December 31, 2023
(in millions)December 31, 2023December 31, 2022Amount
Non-Performing Loans(1)(2):
Non-accrual mortgage loans:
Multi-family$138 $13 $125 
Commercial real estate128 20 108 
One-to-four family first mortgage95 92 
Acquisition, development, and construction$$— 
Total non-accrual mortgage loans$363 $125 238 
Commercial and industrial43 40 
Other non-accrual loans(3)
22 13 
Total non-performing loans$428 $141 287 
Repossessed assets14 12 
Total non-performing assets$442 $153 289 
(1)
ThereExcludes LGG that are no funds available for further advances on the five largest non-performing loans.
insured by U.S government agencies.
(2)Unpaid principal balance.
Loan is a Troubled Debt Restructure.

58


The following is a description of the five loans identified in the preceding table.(3)

No. 1 - The borrower is an owner of real estateIncludes home equity, consumer and is based in New York. The loan is collateralized by an 8,566 square foot, retail condo unit located in New York, New York.other loans.

No. 2 - The borrower is an owner of real estate and is based in New York. The loan is collateralized by a 6 story plus basement walk-up, mixed use building, containing 50 residential units and 5 commercial units, located in New York, NY.

No. 3 - The borrower is an owner of real estate and is based in New Florida. The loan is collateralized by retail property containing 8,490 square feet of gross leasable area, located in Miami, Fl.

No. 4 - The borrower is an owner of real estate and is based in New York. This loan is collateralized by one three (3) story walk-up building containing 6 residential units, 1 four (4) story walk-up building containing 8 residential units and 1 four (4) story mixed use building containing 6 residential units and 1 commercial unit located in Brooklyn, New York.

No. 5 - The borrower is an owner of real estate and is based in New York. This loan is collateralized by a 19,508 square foot commercial building in Woodhaven, New York.

Troubled Debt Restructurings

In an effort to proactively manage delinquent loans, we have selectively extended such concessions as rate reductions and extensions of maturity dates, as well as forbearance agreements, to certain borrowers who have experienced financial difficulty. In accordance with GAAP, we are required to account for such loan modifications or restructurings as TDRs.

The eligibility of a borrower for work-out concessions of any nature depends upon the facts and circumstances of each transaction, which may change from period to period, and involve management’s judgment regarding the likelihood that the concession will result in the maximum recovery for the Company.

Loans modified as TDRs are placed on non-accrual status until we determine that future collection of principal and interest is reasonably assured. This generally requires that the borrower demonstrate performance according to the restructured terms for at least six consecutive months.

At December 31, 2021, loans modified as TDRs totaled $29 million, including accruing loans of $16 million and non-accrual loans of $13 million. At the prior year-end, loans modified as TDRs totaled $34 million, including accruing loans of $15 million and non-accrual loans of $19 million.

Analysis of Troubled Debt Restructurings

The following table sets forth the changes in our TDRs overnon-accrual loans for the twelve monthsyear ended December 31, 2021:2023:

(in millions)
Balance at December 31, 2022$141 
New non-accrual, including acquired from acquisition466 
Charge-offs(97)
Transferred to repossessed assets(3)
Loan payoffs, including dispositions and principal pay-downs(36)
Restored to performing status(43)
Balance at December 31, 2023$428 

(in millions)


Accruing


Non-
Accrual


Total


Balance at December 31, 2020

$


15


$


19


$


34


New TDRs


1


10


11


Charge-offs


(4

)


(4

)

Transferred from performing


Loan payoffs, including dispositions and
   principal pay-downs


(12

)


(12

)

Balance at December 31, 2021

$


16


$


13


$


29


Loans on which concessions were made with respect

At December 31, 2023 total non-accrual mortgage loans increased $238 million to rate reductions and/or extensions of maturity dates totaled $29$363 million, while commercial and industrial loans increased $40 million to $43 million and $18other non-accrual loans increased $9 million respectively,to $22 million compared to December 31, 2022.

At December 31, 2023, NPA to total assets equaled 0.39 percent compared to 0.17 percent at December 31, 2021 and 2020;2022 while NPL to total loans in connection with which forbearance agreements were reached amountedequaled 0.51 percent compared to $0 million and $16 million at the respective dates.

59


Based on the number of loans performing in accordance with their revised terms, our success rate for restructured CRE loans was 100%; for one-to-four loans it was 0% at the end of this December; our success rate for other loans was 15%, at that date.

On a limited basis, we may provide additional credit to a borrower after the loan has been placed on non-accrual status or modified as a TDR if, in management’s judgment, the value of the property after the additional loan funding is greater than the initial value of the property plus the additional loan funding amount. In 2021, no such additional credit was provided. Furthermore, the terms of our restructured loans typically would not restrict us from cancelling outstanding commitments for other credit facilities to a borrower in the event of non-payment of a restructured loan.

For additional information about our TDRs0.20 percent at December 31, 2021 and 2020, see the discussion of “Asset Quality”2022. The increase in Note 5, “Loans and Leases”NPLs was primarily driven by a $125 million increase in Item 8, “Financial Statements and Supplementary Data.”

Except for the non-accrualmulti-family loans and TDRs discloseda $108 million in this filing, we did not have any potential problemcommercial real estate loans, at December 31, 2021 that would have caused managementprimarily office. Repossessed assets of $14 million were slightly higher compared to have serious doubts as to the ability of a borrower to comply with present loan repayment terms and that would have resulted in such disclosure if that were the case.

Loan Deferrals

Under U.S. GAAP, banks are required to assess modifications to a loan’s terms for potential classification as a TDR. A loan to a borrower experiencing financial difficulty is classified as a TDR when a lender grants a concession that it would otherwise not consider, such as a payment deferral or interest concession. In order to encourage banks to work with impacted borrowers, the CARES Act and bank regulators have provided relief from TDR accounting. The main benefits of TDR relief include a capital benefit$12 million in the form of reduced risk-weighted assets, as TDRs are more heavily risk-weighted for capital purposes; aging of the loans is frozen, i.e., they will continue to be reported in the same delinquency bucket they were in at the time of modification; and the loans are generally not reported as non-accrual during the modification period.prior year.


65

Under the CARES Act, the Company made the election to deem that loan modifications do not result in TDRs if they are (1) related to the novel coronavirus disease (“COVID-19”); (2) executed on a loan that was not more than 30 days past due as of December 31, 2019; and (3) executed between March 1, 2020, and the earlier of (A) 60 days after the date of termination of the COVID-19 national emergency declaration or (B) December 31, 2020. In December 2020, Congress amended the CARES Act through the Consolidated Appropriations Act of 2021, which provided additional COVID-19 relief to American families and businesses, including extending TDR relief under the CARES Act. The CARES Act expired on December 31, 2021.

Delinquencies
During the second quarter of 2020, the Company implemented various loan modification programs with some of its borrowers, in accordance with the CARES Act and interagency regulatory guidance. These modifications were primarily full payment deferrals for an initial six month period, with the ability to extend again at the end of the deferral period, at the Bank’s discretion. Most of these deferrals were entered into during April and May, and were therefore, they were eligible to come off of their deferral period beginning in the fourth quarter of 2020, and the remaining were eligible to come off their deferral during the first quarter of 2021. Accordingly, at December 31, 2021, 100% of the Company's full-payment deferrals had returned to payment status.

In addition to the full-payment deferrals, the Company entered into certain modifications whereby the borrowers are paying interest and escrow only. At December 31, 2021, principal deferrals totaled $479 million, down $2.1 billion or 81% compared to $2.5 billion at December 31, 2020 and down $435 million or 48% compared to $914 million at September 30, 2021.

60


The following table reflects as of December 31, 2021, the aggregate amount of principal deferrals by various categories:


Deferred as


a % of


Weighted


Amount in


Outstanding


Total


Average


Deferral


Balance


Portfolio


LTV


(dollars in millions)


Multi-Family

$

351


$

34,571


1.0

%


56.8

%

CRE:


Office


113


3,112


3.6

%


74.3

%

   Retail


6


1,759


0.3

%


115.6

%

Mixed Use


3


543


0.6

%


55.3

%

Other


1,284


0.0

%


N/A


Sub-total CRE

$

122


$

6,698


1.8

%


75.7

%


Total multi-family and CRE

$

473


$

41,269


1.1

%


61.7

%


Other

$

6


Total

$

479


Additionally, the allowance for credit losses on accrued interest receivable on loans, including loans in the deferral program, was $1.0 million, as of December 31, 2021.

Asset Quality Analysis

The following table presents information regarding our asset quality measures at each year-endloans, 30 to 89 days past due by loan type and the changes in the three years ended December 31, 2021.respective balances:

Change from
December 31, 2023
to
December 31, 2022
(in millions)December 31, 2023December 31, 2022AmountPercent
Loans 30 to 89 Days Past Due(1):
Multi-family$121 $34 $87 256 %
Commercial real estate28 26 1300 %
One-to-four family first mortgage40 21 19 90 %
Acquisition, development, and construction— NM
Commercial and industrial37 35 1750 %
Other loans22 11 11 100 %
Total loans 30-89 days past due$250 $70 180 257 %
(1)Excludes LGG that are insured by U.S government agencies.


At or for the Years Ended December 31,


2021


2020


2019


Non-performing loans to total loans


0.07

%


0.09

%


0.15

%

Non-performing assets to total assets


0.07

%


0.08


0.14


Allowance for losses on loans to non-performing loans


611.79


513.55


241.07


Allowance for losses on loans to total loans


0.44


0.45


0.35


61


The following table presents information on the Company's net charge-offs as compared to average loans outstanding

Allowance for the three years ended December 31, 2021:Credit Losses


For the Year Ended


December 31,


(dollars in millions)

2021


2020


2019


Multi-family


Net charge-offs (recoveries) during the period

$

1


$

(1

)

$

1


Average amount outstanding

$

32,424


$

31,322


$

29,993


Net charge-offs (recoveries) as a percentage of average loans


0.00

%


0.00

%


0.00

%


Commercial real estate


Net charge-offs (recoveries) during the period

$

2


$

2


$

-


Average amount outstanding

$

5,489


$

6,009


$

6,220


Net charge-offs (recoveries) as a percentage of average loans


0.04

%


0.03

%


0.00

%


One-to-Four Family


Net charge-offs (recoveries) during the period

$

1


$

-


$

1


Average amount outstanding

$

191


$

314


$

415


Net charge-offs (recoveries) as a percentage of average loans


0.52

%


0.00

%


0.24

%


Acquisition, Development and Construction


Net charge-offs (recoveries) during the period

$

-


$

-


$

-


Average amount outstanding

$

152


$

116


$

311


Net charge-offs (recoveries) as a percentage of average loans


0.00

%


0.00

%


0.00

%


Other Loans


Net charge-offs (recoveries) during the period

$

(6

)

$

18


$

17


Average amount outstanding

$

4,944


$

4,267


$

3,446


Net charge-offs (recoveries) as a percentage of average loans


-0.12

%


0.42

%


0.49

%


Total loans


Net charge-offs (recoveries) during the period

$

(2

)

$

19


$

19


Average amount outstanding

$

43,200


$

42,028


$

40,385


Net charge-offs (recoveries) as a percentage of average loans


0.00

%


0.04

%


0.05

%

The following table sets forth the allocation of the consolidated allowance for losses on loans, at each year-endyear-end:

At December 31,
202320222021
(dollars in millions)AmountPercent of Total Loans and LeasesAmountPercent of Total Loans and LeasesAmountPercent of Total Loans and Leases
Multi-family loans$307 44 %$178 55 %$159 76 %
Commercial real estate loans36612 4612 1715 
One-to-four family first mortgage loans48461— 
Acquisition, development, and construction loans36202— 
Commercial and industrial13230 — — 
Other loans10310321 20
Total loans$992 100 %$393 100 %$199 100 %
(1)Percentages represent the percentage of each loan and lease category to total loans and leases

The allowance for the three years ended December 31, 2021:


2021


2020


2019


(dollars in millions)

Amount


Percent of
Loans in
Each
Category
to Total
Loans
Held
for
Investment


Amount


Percent of
Loans in
Each
Category
to Total
Loans
Held
for
Investment


Amount


Percent of
Loans in
Each
Category
to Total
Loans
Held
for
Investment


Multi-family loans

$

159


75.75

%


$

150


75.28

%


$

97


74.46

%

Commercial real estate loans


17


14.66


24


15.96


21


16.93


One-to-four family residential loans


1


0.35


1


0.55


1


0.91


Acquisition, development, and construction loans


2


0.46


1


0.21


4


0.48


Other loans


20


8.78


18


8.00


25


7.22


Total loans

$

199


100.00

%


$

194


100.00

%


$

148


100.00

%

Each of the preceding allocations was based upon an estimate of various factors, as discussed in “Critical Accounting Policies” earlier in this report, and a different allocation methodology may be deemed to be more appropriate in the future. In addition, it should be noted that the portion of the allowance forcredit losses on loans allocatedand leases increased $599 million from December 31, 2022 to each loan category does not representDecember 31, 2023. The day 1 impact of the total amount availableSignature Transaction that closed on March 20, 2023 added $127 million to absorbthe reserve. The remaining net increase of approximately $472 million primarily reflects our actions to build reserves during the fourth quarter to address weakness in the office sector, potential repricing risk in the multi-family portfolio and conditions leading to increases in classified assets, which better aligns the Company with its relevant bank peers, including Category IV banks. The allowance for credit losses that may occur within that category, since the total loan loss allowance is available for the entire loan portfolio.

62


The following table presents a geographical analysison loans and leases represented 232 percent of our non-performing loans at December 31, 2021:2023, as compared to 279 percent at the prior year-end.


Based on the acceleration of asset quality metric deterioration and collateral value trends observed during 4Q23, predominantly in office, management employed its judgment and qualitative reserves were increased to the higher end of the range as of December 31, 2023. In applying this judgement, management also considered the severity of emerging risks such as feedback from regulators, market information, the impact of potential internal loan review weaknesses on the identification of emerging risks, deterioration in collateral values or borrower financial statements, trends or indications of degradation in asset quality metrics such as problem loans, charge-offs and nonaccruals, and market indications.

Charge-offs

(in millions)

New York

$

25

New Jersey

1

All other states

7

Total non-performing loans

$

33

SecuritiesFor the year ended December 31, 2023, our gross charge-offs were $223 million and net charge-offs were $208 million, compared to gross charge-offs of $7 million and net recoveries of $4 million over the same period in 2022.


66


The following table presents information on the Company's net charge-offs:
For the Years Ended December 31,
20232022
(in millions)
Charge-offs:
Multi-family$119 $
Commercial real estate56 
One-to-four family residential— 
Commercial and industrial30 — 
Other14 
Total charge-offs$223 $
Recoveries:
Commercial real estate— (4)
One-to-four family residential— — 
Commercial and industrial(11)(7)
Other(4)— 
Total recoveries$(15)$(11)
Net charge-offs (recoveries)$208 $(4)


67


The following table presents information on the Company's net charge-offs as compared to average loans held for investment outstanding:

For the Years Ended December 31,
(in millions)202320222021
Multi-family
Net charge-offs during the period$119 $$
Average amount outstanding$37,839 $36,292 $32,424 
Net charge-offs as a percentage of average loans0.31 %0.00 %0.00 %
Commercial real estate
Net charge-offs during the period$56 $— $
Average amount outstanding$9,905 $6,964 $5,489 
Net charge-offs as a percentage of average loans0.57 %0.00 %0.04 %
One-to-Four Family first mortgage
Net charge-offs during the period$$— $
Average amount outstanding$5,907 $516 $191 
Net charge-offs as a percentage of average loans0.06 %0.00 %0.52 %
Acquisition, Development and Construction
Net charge-offs during the period$— $— $— 
Average amount outstanding$2,530 $203 $152 
Net charge-offs as a percentage of average loans0.00 %0.00 %0.00 %
Commercial and Industrial Loans
Net charge-offs during the period$19 $(7)$— 
Average amount outstanding$21,460 $— $— 
Net charge-offs as a percentage of average loans0.09 %0.00 %0.00 %
Other Loans
Net charge-offs (recoveries) during the period$10 $(5)$(6)
Average amount outstanding$2,552 $5,401 $4,944 
Net charge-offs (recoveries) as a percentage of average loans0.38 %(0.09)%(0.12)%
Total loans
Net charge-offs (recoveries) during the period$208 $(4)$(2)
Average amount outstanding$80,193 $49,376 $43,200 
Net charge-offs (recoveries) as a percentage of average loans0.26 %(0.01)%0.00 %

Lending Authority

We maintain credit limits in compliance with regulatory requirements. Under regulatory guidance, the Bank may not make a loan or extend credit to a single or related group of borrowers in excess of 15 percent of Tier 1 plus Tier 2 capital and any portion of the ACL not included in Tier 2 capital. We have a tracking and reporting process to monitor lending concentration levels, and all new commercial real estate credit exposures to relationships that exceed $200 million and all other commercial credit exposures to relationships that exceed $100 million must be approved by the Board Credit Committee of the Board. Exceptions to these levels are made to borrowers on a case by case basis, with the approval of the Board Credit Committee of the Board. Relationships less than the aforementioned limits including those discussed throughout the loans held for investment section of this document, are approved by the joint authority of credit officers and lending officers. The Board Credit Committee has authority to direct changes in lending practices as they deem necessary or appropriate in order to address individual or aggregate risks, including regulatory considerations, and credit exposures in accordance with the Bank’s strategic objectives and risk appetites.


68


At December 31, 2023 and December 31, 2022, the largest mortgage loan in our portfolio was a $329 million multi-family loan, which is collateralized by properties located in Brooklyn, New York. As of the date of this report, the loan has been current since origination.
Securities

Total securities were $5.8$9.2 billion, or 10%,8 percent, of total assets at December 31, 2021, unchanged 2023, compared to $9.1 billion, or 10 percent of total assets at December 31, 2020.2022. At December 31, 20212023 and December 31, 2020,2022, all of our securities were designated as “Available-for-Sale”. At December 31, 2021, 26%2023, 12 percent of our portfolio are floating rate securities.

As of December 31, 2023, the net unrealized loss on securities portfolioavailable for sale, net of tax, was tied$581 million as compared to floating rates, 25% of which are currently floating.$626 million at December 31, 2022, reflecting the rising interest rate environment.


At December 31, 2021,2023, available-for-sale securities had an estimated weighted average life of 6.9six years. Included in the year-endquarter-end amount were mortgage-related securities of $2.8$6.6 billion and other debt securities of $3.0$2.6 billion.

At the prior year-end, available-for-sale securities were $5.8$9.1 billion, and had an estimated weighted average life of 4.9six years. Mortgage-related securities accounted for $3.0$4.8 billion of the year-end balance, with other debt securities accounting for the remaining $2.8$4.3 billion.

The investment policies of the Company and the Bank are established by the Board of Directors and implemented by the ALCO. ALCO meets monthly or on an as-needed basis to review the portfolios and specific capital market transactions. In addition, the securities portfolios and investment activities are reviewed monthly by the Board of Directors. Furthermore, the policy governing the investment portfolio activities is reviewed at least annually by the ALCO and ratified by the Board of Directors.

Our general investment strategy is to purchase liquid investments with various maturities to ensure that our overall interest rate risk position stays within the required limits of our investment policies. We generally limit our investments to GSE obligations and U.S. Treasury obligations. At December 31, 2021 and 2020, GSE obligations and U.S. Treasury obligations together represented 83% and 82% of total securities, respectively. The remainder of the portfolio at those dates was comprised of corporate bonds, foreign notes, capital trust notes, and municipal obligations.

The following table summarizes the weighted average yields of debt securities for the maturities indicated at December 31, 2021:


Mortgage-
Related
Securities


U.S.
Government
and GSE
Obligations


State,
County,
and
Municipal


Other
Debt
Securities
(2)


Available-for-Sale Debt
   Securities:
(1)


Due within one year


2.72


%


0.06


%


%


1.01


%

Due from one to five years


3.23


3.52


1.83


Due from five to ten years


2.48


1.62


3.52


2.24


Due after ten years


1.84


1.60


3.33


1.09


Total debt securities available for sale


1.98


1.59


3.48


1.72


2023:
Mortgage-
Related
Securities
U.S.
Government
and GSE
Obligations
State,
County,
and
Municipal
Other
Debt
Securities (2)
Available-for-Sale Debt Securities: (1)
Due within one year— %4.65 %— %— %
Due from one to five years3.33 5.42 — 5.53 
Due from five to ten years2.73 1.61 3.16 5.05 
Due after ten years4.18 — — 5.74 
Total debt securities available for sale4.09 2.27 3.16 5.56 
(1)
The weighted average yields are calculated by multiplying each carrying value by its yield and dividing the sum of these results by the total carrying values and are not presented on a tax-equivalent basis.
(2)
Includes corporate bonds, capital trust notes, foreign notes, and asset-backed securities.

63


Federal Reserve and Federal Home Loan Bank Stock

As a member of the FHLB-NY, the Bank is required to acquire and hold shares of its capital stock.

At December 31, 2021,2023 the Bank heldCompany had $861 million and $329 million of FHLB-NY stock, in the amount of $734 million.at cost, and FHLB-Indianapolis stock, at cost, respectively. At December 31, 2020,2022, the Bank heldCompany had $762 million and $329 million of FHLB-NY stock, at cost and FHLB-Indianapolis stock, at cost, respectively. The Company maintains an investment in FHLB-NY stock and, as a result of the Flagstar acquisition, FHLB-Indianapolis stock, partly in conjunction with its membership in the amount of $714 million. Dividends from the FHLB-NYFHLB and partly related to its access to the FHLB funding it utilizes. In addition, the Company had Federal Reserve Bank totaled $32stock, at cost, of $203 million and $36$176 million respectively, in 2021at December 31, 2023 and 2020.December 31, 2022, respectively.

Bank-Owned Life Insurance

BOLI is recorded at the total cash surrender value of the policies in the Consolidated Statements of Condition, and the income generated by the increase in the cash surrender value of the policies is recorded in “Non-interest income” in the Consolidated Statements of Income and Comprehensive Income. Reflecting an increase in the cash surrender value of the underlying policies, our investment in BOLI rose $20 million year-over-year to $1.2 billion at December 31, 2021.2023 rose $19 million to$1.6 billion compared to December 31, 2022.


69


Goodwill


We record goodwill in our consolidated statements of condition in connection with certain of our business combinations. Goodwill, which is tested at least annually for impairment, refers to the difference between the purchase price and the fair value of an acquired company’s assets, net of the liabilities assumed.

For more information about As of December 31, 2023, the Company identified a triggering event and applied a market approach using the end of day stock price. We evaluated those conditions known and knowable by the Company and how a market participant would view the control premium as confirmed by the subsequent confirming market evidence. This adjusted market capitalization was then compared to the carrying value to determine the extent of the shortfall which was calculated to be in excess of the goodwill balance. The Company’s assessment concluded that goodwill seefrom historical transactions (2007 and prior) was fully impaired as of December 31, 2023. As a result, the discussionCompany recorded an impairment charge of “Summarythe entire goodwill balance of Significant Accounting Policies”$2.4 billion.


Parent Company Liquidity

The Parent Company is a separate legal entity from the Bank and must provide for its own liquidity. At December 31, 2023 the Parent Company held cash and cash equivalents of $158 million. In addition to operating expenses, the Parent Company is responsible for paying any dividends declared to our common and preferred stockholders. As a Delaware corporation, the Parent Company is able to pay dividends either from surplus or, in case there is no surplus, from net profits for the Footnote 2 of these consolidated statements.fiscal year in which the dividend is declared and/or the preceding fiscal year.

Sources of Funds

The Parent Company has fourthree primary funding sources for the payment of dividends, share repurchases, and other corporate uses: dividends paid to the Parent Company by the Bank; capital raised through the issuance of securities;equity; and funding raised through the issuance of debt instruments;instruments.

Various legal restrictions limit the extent to which the Company’s subsidiary bank can supply funds to the Parent Company and repaymentsits non-bank subsidiaries. The Bank would require the approval of the OCC if the dividends it declares in any calendar year were to exceed the total of its respective net profits for that year combined with its respective retained net profits for the preceding two calendar years, less any required transfer to paid-in capital. The term “net profits” is defined as net income for a given period less any dividends paid during that period. As a result of our acquisition of Flagstar, we are also required to seek regulatory approval from the OCC for the payment of any dividend to the Parent Company through at least the period ending November 1, 2024. In connection with receiving regulatory approval from the OCC for the Signature Transaction, the Bank has committed that (i) for a period of two years from the date of the Signature Transaction, it will not declare or pay any dividend without receiving a prior written determination of no supervisory objection from the OCC and income from, investment securities.(ii) it will not declare or pay dividends on the amount of retained earnings that represents any net bargain purchase gain that is subject to a conditional period that may be imposed by the OCC.

In 2023, dividends of $580 million were paid by the Bank to the Parent Company.


At December 31, 2023, we believe the Company has sufficient liquidity and capital resources to meet its cash flow obligations over the next 12 months and for the foreseeable future.

Bank Liquidity

We manage our liquidity to ensure that our cash flows are sufficient to support our operations, and to compensate for any temporary mismatches between sources and uses of funds caused by variable loan and deposit demand.

We monitor our liquidity daily to ensure that sufficient funds are available to meet our financial obligations. The following table presents available sources of liquidity as of December 31, 2023:

(Dollars in millions)
Cash and cash equivalents$11,475 
Unencumbered investment securities6,300 
FHLB borrowing availability8,400 
Federal Reserve Bank borrowing availability through the discount window1,700 
Total Ready Liquidity$27,875 
On a consolidated basis, our funding primarily stems from a combination of the following sources: retail, institutional, and brokered deposits; borrowed funds, primarily in the form of wholesale borrowings; cash flows generated through the repayment and sale of loans; and cash flows generated through the repayment and sale of securities.

70


In 2021, loan repayments and sales generated cash flows of $10.4 billion, as compared to $11.9 billion in 2020. Cash flows from repayments accounted for $10.4 billion and $11.9 billion of the respective totals, and cash flows from sales accounted for $37 million and $3 million in 2021 and 2020, respectively.

In 2021, cash flows from the repayment securities totaled $1.7 billion, while the purchase of securities amounted to $1.8 billion for the year. By comparison, cash flows from the repayment and sale of securities totaled $2.1 billion and $484 million, respectively, in 2020, and were offset by the purchase of securities totaling $2.5 billion.

In 2021, the cash flows from loans and securities were primarily deployed into the production of multi-family loans held for investment, as well as held-for-investment CRE loans and specialty finance loans and leases.

Deposits

Total deposits increased $2.6 billion or 8% on a year-over-year basis to $35.1 billion. Deposit growth was driven by growth in savings accounts and non-interest bearing accounts and offset by a decline in CDs. Compared to the fourth quarter of last year, CDs declined $1.9 billion or 18% to $8.4 billion, while savings accounts increased $2.5 billion or 39% to $8.9 billion and interest bearing checking and money market accounts increased over the same timeframe by $599 million or 5% to $13.2 billion. Non-interest-bearing accounts rose $1.5 billion or 47% to $4.5 billion at December 31, 2021.

64


While the vast majority of our deposits are retail in nature (i.e., they are deposits we have gathered through our branches or through business combinations), institutional deposits and municipal deposits are also part of our deposit mix. Retail deposits rose $2.4 billion year-over-year to $27.2 billion, while institutional deposits rose $161 million to $1.4 billion at year-end. Municipal deposits represented $751 million of total deposits at the end of this December, a $259 million decrease from the balance at December 31, 2020.

Included in total deposits at year-end 2021 were $4 billion in loan-related deposits compared to $3.5 billion at year-end 2020. Total deposits at December 31, 2021 also included $1 billion of deposits related to our Banking as a Service initiative, which was launched earlier in 2021.

Depending on their availability and pricing relative to other funding sources, we also include brokered deposits in our deposit mix. Brokered deposits accounted for $5.7 billion of our deposits at the end of this December, compared to $5.3 billion at December 31, 2020. Brokered money market accounts represented $2.9 billion of total brokered deposits at December 31, 2021 and $3.0 billion at December 31, 2020; brokered interest-bearing checking accounts represented $1.6 billion and $1.3 billion, respectively, at the corresponding dates. At December 31, 2021, we had $1.2 billion of brokered CDs, compared to $1.0 billion at December 31, 2020.

The following table indicates the amount of time deposits, by account, that are in excess of the FDIC insurance limit (currently $250,000) by time remaining until maturity as of December 31, 2021.


December 31,


(in millions)


2021


Portion of U.S. time deposits in excess of insurance limit


$

2,747


Time deposits otherwise uninsured with a maturity of:


3 months or less


$

787


Over 3 months through 6 months


467


Over 6 months through 12 months


519


Over 12 months


974


Total time deposits otherwise uninsured


$

2,747


Our uninsured deposits, on an unconsolidated basis, are the portion of deposit accounts that exceed the FDIC insurance limit (currently $250,000), were approximately $10.1 billion and $11.3 billion at December 31, 2021 and 2020, respectively. These amounts were estimated based on the same methodologies and assumptions used for regulatory reporting purposes.

Borrowed Funds

The majority of our borrowed funds are wholesale borrowings and consist of FHLB-NY advances, repurchase agreements, and federal funds purchased, and, to a lesser extent, junior subordinated debentures and subordinated notes. At December 31, 2021, total borrowed funds increased $478 million or 3% to $16.6 billion compared to the balance at December 31, 2020. The bulk of the year-over-year increase was driven by an increase in the balance of wholesale borrowings.

Wholesale Borrowings

Wholesale borrowings totaled $15.9 billion and $15.4 billion, respectively, at December 31, 2021 and 2020, representing 27% of total assets at both dates. FHLB-NY advances accounted for $15.1 billion of the year-end 2021 balance, as compared to $14.6 billion at the prior year-end. Pursuant to blanket collateral agreements with the Bank, our FHLB-NY advances and overnight advances are secured by pledges of certain eligible collateral in the form of loans and securities. (For more information regarding our FHLB-NY advances, see the discussion that appears earlier in this report regarding our membership and our ownership of stock in the FHLB-NY.) At December 31, 2021 and 2020, $8.3 billion of our wholesale borrowings had callable features.

65


Also included in wholesale borrowings were repurchase agreements of $800.0 million at December 31, 2021 and 2020. Repurchase agreements are contracts for the sale of securities owned or borrowed by the Bank with an agreement to repurchase those securities at agreed-upon prices and dates.

Our repurchase agreements are primarily collateralized by GSE obligations, and may be entered into with the FHLB-NY or certain brokerage firms. The brokerage firms we utilize are subject to an ongoing internal financial review to ensure that we borrow funds only from those dealers whose financial strength will minimize the risk of loss due to default. In addition, a master repurchase agreement must be executed and on file for each of the brokerage firms we use.

We had no federal funds purchased at both December 31, 2021 and 2020.

Junior Subordinated Debentures

Junior subordinated debentures totaled $361 million at December 31, 2021, slightly higher than the balance at the prior year-end reflecting discount accretion.

Subordinated Notes

At December 31, 2021, the balance of subordinated notes was $296 million, relatively unchanged from December 31, 2020.

See Note 9, “Borrowed Funds,” in Item 8, “Financial Statements and Supplementary Data” for a further discussion of our wholesale borrowings, our junior subordinated debentures and subordinated debt.

Liquidity, Contractual Obligations and Off-Balance Sheet Commitments, and Capital Position

Liquidity

We manage our liquidity to ensure that our cash flows are sufficient to support our operations, and to compensate for any temporary mismatches between sources and uses of funds caused by variable loan and deposit demand.

We monitor our liquidity daily to ensure that sufficient funds are available to meet our financial obligations. Our most liquid assets are cash and cash equivalents, which totaled $2.2 billion and $1.9 billion, respectively, at December 31, 2021 and 2020. As in the past, our loan and securities portfolios provided meaningful liquidity in 2021, with cash flows from the repayment and sale of loans totaling $10.4 billion and cash flows from the repayment and sale of securities totaling $1.7 billion.

Additional liquidity stems from deposits and from our use of wholesale funding sources, including brokered deposits and wholesale borrowings. In addition, we have access to the Bank’s approved lines of credit with various counterparties, including the FHLB-NY. The availability of these wholesale funding sources is generally based on the amount of mortgage loan collateral available under a blanket lien we have pledged to the respective institutions and, to a lesser extent, the amount of available securities that may be pledged to collateralize our borrowings. At December 31, 2021, our available borrowing capacity with the FHLB-NY was $8.4 billion. In addition, the Bank had available-for-sale securities of $5.8 billion, of which, $4.6 billion is unpledged.

Furthermore, the Bank has agreements with the FRB-NY that enable it to access the discount window as a further means of enhancing their liquidity. In connection with these agreements, the Bank has pledged certain loans and securities to collateralize any funds they may borrow. At December 31, 2021, the maximum amount the Bank could borrow from the FRB-NY was $1.0 billion. There were no borrowings against these lines of credit at December 31, 2021.

Our primary investing activity is loan production, and the volume of loans we originated for investment totaled $13.1 billion in 2021. During this time, the net cash used in investing activities totaled $2.8 billion; the net cash provided by our operating activities totaled $290 million. Our financing activities provided net cash of $2.7 billion.

CDs due to mature or reprice in one year or less from December 31, 20212023 totaled $7.5$17.3 billion, representing 88%80 percent of total CDs at that date. Our ability to attract and retain retail deposits, including CDs, depends on numerous factors,

66


including, among others, the convenience of our branches and our other banking channels; our customers’ satisfaction with the service they receive; the rates of interest we offer; the types of products we feature; and the attractiveness of their terms.

Our decision to compete for deposits also depends on numerous factors, including, among others, our access to deposits through acquisitions, the availability of lower-cost funding sources, the impact of competition on pricing, and the need to fund our loan demand.

Deposits

The Parent Company is a separate legal entity from the Bank and must provide for its own liquidity. In addition to operating expenses and any share repurchases, the Parent Company is responsible for paying any dividends declared to our stockholders. As a Delaware corporation, the Parent Company is able to pay dividends either from surplus or, in case there is no surplus, from net profits for the fiscal year in which the dividend is declared and/or the preceding fiscal year.

The Parent Company’s

Our ability to retain and attract deposits depends on numerous factors, including customer satisfaction, the rates of interest we pay, dividends may also depend, in part, upon dividends it receives from the Bank. The abilitytypes of the Bank to pay dividends and other capital distributions to the Parent Company is generally limited by New York State Banking Law and regulations, and by certain regulations of the FDIC. In addition, the Superintendent of the New York State Department of Financial Services (the “Superintendent”), the FDIC,products we offer, and the FRB,attractiveness of their terms. The vast majority of our deposits are retail in nature (i.e., they are deposits we have gathered through our branches or through business combinations).

Depending on their availability and pricing relative to other funding sources, we also include brokered deposits in our deposit mix. Brokered deposits accounted for reasons$9.5 billion of safety and soundness, may prohibit the payment of dividends that are otherwise permissible by regulations.

Under New York State Banking Law, a New York State-chartered stock-form savings bank or commercial bank may declare and pay dividends out of its net profits, unless there is an impairment of capital. However, the approval of the Superintendent is required if the total of all dividends declared in a calendar year would exceed the total of a bank’s net profits for that year, combined with its retained net profits for the preceding two years. In 2021, the Bank paid dividends totaling $380 million to the Parent Company, leaving $469 million that it could dividend to the Parent Company without regulatory approval at year-end. Additional sources of liquidity available to the Parent Companyour deposits at December 31, 2021 included $139 million in cash2023, compared to $5.1 billionat December 31, 2022. Brokered money market accounts represented $1.3 billion of total brokered deposits at December 31, 2023 and cash equivalents. If$2.8 billion at December 31, 2022; brokered interest-bearing checking accounts represented $1.6 billion and $1.0 billion, respectively. At December 31, 2023, we had $6.6 billion of brokered CDs, compared to $1.3 billion at December 31, 2022.


Our uninsured deposits are the Bank wasportion of deposit accounts that exceed the FDIC insurance limit (currently $250,000). These amounts were estimated based on the same methodologies and assumptions used for regulatory reporting purposes and excludes internal accounts. At December 31, 2023 our deposit base includes $29.3 billion of uninsured deposits, a net increase of $12.9 billion as compared to applyDecember 31, 2022 due to the Superintendent for approval to make a dividend or capital distributionSignature Transaction. This represents 36 percent of our total deposits.

The following table indicates the amount of time deposits, by account, that are in excess of the dividend amounts permitted underFDIC insurance limit (currently $250,000) by time remaining until maturity:

(in millions)December 31, 2023December 31, 2022
Portion of U.S. time deposits in excess of insurance limit$7,893 $3,749 
Time deposits otherwise uninsured with a maturity of:
3 months or less1,675 969 
Over 3 months through 6 months1,623 604 
Over 6 months through 12 months2,325 1,269 
Over 12 months2,271 907 
Total time deposits otherwise uninsured$7,894 $3,749 

Borrowed Funds

The majority of our borrowed funds are wholesale borrowings (FHLB-NY and FHLB-Indianapolis advances), Bank Term Funding Program of the regulations, there can beFRB of New York and, to a lesser extent, junior subordinated debentures and subordinated notes. At December 31, 2023, total borrowed funds decreased $65 million to $21.3 billion compared to the balance at December 31, 2022.

Wholesale Borrowings

Wholesale borrowings totaled $20.3 billion at December 31, 2023 and 2022.

FHLB-NY and FHLB-Indianapolis advances accounted for $19.3 billion and $20.3 billion at December 31, 2023 and December 31, 2022, respectively. Pursuant to blanket collateral agreements with the Bank, our FHLB-NY, FHLB-Indianapolis advances and overnight advances are secured by pledges of certain eligible collateral in the form of loans and securities. At December 31, 2023 and December 31, 2022, $2.0 billion and $6.8 billion of our wholesale borrowings had callable features, respectively.


71


The Company’s wholesale borrowings also include the $1.0 billion drawn on the BTFP. The BTFP draw is secured by pledges of certain eligible collateral in the form of securities eligible for purchase by the Federal Reserve Banks in open market operations (for example, U.S. Treasuries, U.S. agency securities, and U.S. agency mortgage-backed securities).

We had no assurance that such application would be approved.federal funds outstanding at December 31, 2023 and December 31, 2022.

Junior Subordinated Debentures

Junior subordinated debentures totaled $579 million at December 31, 2023 compared to $575 million

at December 31, 2022.


Subordinated Notes

At December 31, 2023, the balance of subordinated notes was $438 million compared to $432 million at December 31, 2022.

See Note 12 - Borrowed Funds,” in Item 8, “Financial Statements and Supplementary Data” for a further discussion of our wholesale borrowings, our junior subordinated debentures and subordinated debt.

Contractual Obligations and Off-Balance Sheet Commitments

In the normal course of business, we enter into a variety of contractual obligations in order to manage our assets and liabilities, fund loan growth, operate our branch network, and address our capital needs.

For example, we offer CDs with contractual terms to our customers, and borrow funds under contract from the FHLB-NY and various brokerage firms. These contractual obligations are reflected in the Consolidated Statements of Condition under “Deposits” and “Borrowed funds,” respectively. At December 31, 2021, we had CDs of $8.4 billion and long-term debt (defined as borrowed funds with an original maturity one year or more) of $13.4 billion.

We also are obligated under certain non-cancelable operating leases on the buildings and land we use in operating our branch network and in performing our back-office responsibilities. These obligations are included in the Consolidated Statements of Condition and totaled $249 million at December 31, 2021.

At December 31, 2021, we also hadinclude commitments to extend credit in the form of mortgage and other loan originations, as well as commercial, performance stand-by, and financial stand-by letters of credit, totaling $3.1 billion. credit.


These off-balance sheet commitments consist of agreements to extend credit, as long as there is no violation of any condition established in the contract under which the loan is made. Commitments generally have fixed expiration dates or other termination clauses and may require the payment of a fee.

The letters of credit we issue consist of performance stand-by, financial stand-by, and commercial letters of credit. Financial stand-by letters of credit primarily are issued for the benefit of other financial institutions, municipalities, or landlords on behalf of certain of our current borrowers, and obligate us to guarantee payment of a specified financial obligation.

Performance stand-by letters of credit are primarily issued for the benefit of local municipalities on behalf of certain of our borrowers. Performance letters of credit obligate us to make payments in the event that a specified third party fails to perform under non-financial contractual obligations. Commercial letters of

67


credit act as a means of ensuring payment to a seller upon shipment of goods to a buyer. Although commercial


Such letters of credit are used to effect payment for domestic transactions, the majority are used to settle payments in international trade. Typically, such letters of credittypically require the presentation of documents that describe the commercial transaction, and provide evidence of shipment and the transfer of title. The fees we collectFees collected in connection with the issuance of letters of credit are included in “Fee income” in the Consolidated Statements of Income and Comprehensive Income.

Based upon our current liquidity position, we expect that our funding will be sufficient to fulfill these cash obligations and commitments when they are due both in the short term and long term.

For the year ended December 31, 2021,2023, we did not engage in any off-balance sheet transactions reasonably likelythat we expect to have a material effect on our financial condition, results of operations or cash flows.

At December 31, 2021,2023, we had no commitments to purchase securities.

Regulatory Capital

The Bank is subject to regulation, examination, and supervision by the OCC and the Federal Reserve (the “Regulators”). The Bank is also governed by numerous federal and state laws and regulations, including the FDIC Improvement Act of 1991, which established five categories of capital adequacy ranging from “well capitalized” to “critically undercapitalized.” Such classifications are used by the FDIC to determine various matters, including prompt corrective action and each institution’s FDIC deposit insurance premium assessments. Capital Positionamounts and classifications are also subject to the Regulators’ qualitative judgments about the components of capital and risk weightings, among other factors.

The quantitative measures established to ensure capital adequacy require that banks maintain minimum amounts and ratios of leverage capital to average assets and of common equity tier 1 capital, tier 1 capital, and total capital to risk-weighted

72

As reflected
assets (as such measures are defined in the following table,regulations). At December 31, 2023, our capital measures continued to exceed the minimum federal requirements for a bank holding company and for a bank. The following table sets forth our common equity tier 1, tier 1 risk-based, total risk-based, and leverage capital amounts and ratios on a consolidated basis and for the Bank on a stand-alone basis, as well as the respective minimum regulatory capital requirements, at December 31, 2021that date:
The following tables present the actual capital amounts and 2020:ratios for the Company:

Risk-Based Capital
December 31, 2023Common Equity Tier 1Tier 1TotalLeverage Capital
(in millions)AmountRatioAmountRatioAmountRatioAmountRatio
Total capital$8,009 9.05 %$8,512 9.62 %$10,415 11.77 %$8,512 7.75 %
Minimum for capital adequacy purposes3,983 4.50 5,310 6.00 7,081 8.00 4,392 4.00 
Excess$4,026 4.55 %$3,202 3.62 %$3,334 3.77 %$4,120 3.75 %
December 31, 2022
Total capital$6,335 9.06 %$6,838 9.78 %$8,154 11.66 %$6,838 9.70 %
Minimum for capital adequacy purposes3,146 4.50 4,195 6.00 5,593 8.00 2,819 4.00 
Excess$3,189 4.56 %$2,643 3.78 %$2,561 3.66 %$4,019 5.70 %

The following tables present the actual capital amounts and ratios for the Bank:

At December 31, 2021


Actual


Minimum


(dollars in millions)


Amount


Ratio


Required
Ratio


Common equity tier 1 capital


$


4,226


9.68


%


4.50

%

Tier 1 risk-based capital


4,729


10.83


6.00


Total risk-based capital


5,558


12.73


8.00


Leverage capital


4,729


8.46


4.00


At December 31, 2020


Actual


Minimum


(dollars in millions)


Amount


Ratio


Required
Ratio


Common equity tier 1 capital


$


3,962


9.72


%


4.50

%

Tier 1 risk-based capital


4,465


10.95


6.00


Total risk-based capital


5,290


12.97


8.00


Leverage capital


4,465


8.52


4.00


Risk-Based Capital
December 31, 2023Common Equity Tier 1Tier 1TotalLeverage Capital
(dollars in millions)AmountRatioAmountRatioAmountRatioAmountRatio
Total capital$9,305 10.52 %$9,305 10.52 %$10,271 11.61 %$9,305 8.48 %
Minimum for capital adequacy purposes3,980 4.50 5,307 6.00 7,076 8.00 4,389 4.00 
Excess$5,325 6.02 %$3,998 4.52 %$3,195 3.61 %$4,916 4.48 %
December 31, 2022
Total capital$7,653 10.96 %$7,653 10.96 %$7,982 11.43 %$7,653 10.87 %
Minimum for capital adequacy purposes3,142 4.50 4,189 6.00 5,585 8.00 2,817 4.00 
Excess$4,511 6.46 %$3,464 4.96 %$2,397 3.43 %$4,836 6.87 %

At December 31, 2021,2023, our total risk-based capital ratio exceeded the minimum requirement for capital adequacy purposes by 377 basis points and the fully phased-in capital conservation buffer by 127 basis points.

The Bank also exceeded the minimum capital requirements to be categorized as “Well Capitalized.” To be categorized as well capitalized, a bank must maintain a minimum common equity tier 1 ratio of 6.50 percent; a minimum tier 1 risk-based capital ratio of 8 percent; a minimum total risk-based capital ratio of 10 percent; and a minimum leverage capital ratio of 5 percent.

On July 27, 2023, the Federal Banking Agencies, the FDIC, the Federal Reserve, and the OCC, released a notice of proposed rulemaking that would make significant amendments to the Basel III Capital Rules applicable to both the Company and the Bank. In general, the proposed rule would align the regulatory capital calculation methodology for Category III and IV banking organizations with the methodology applicable to Category I and II banking organizations. In addition to calculating risk-weighted assets under the current U.S. standardized approach, the proposal introduces a new “Expanded Risk-Based Approach,” including standardized approaches for credit risk, operational risk and credit valuation adjustment risk, as well as a new approach for market risk that would be based upon internal models and standardized supervisory models. If adopted as proposed, the Company would be required to calculate its risk-based capital ratios under both the current U.S. standardized approach and the Expanded Risk-Based Approach and would be subject to the lower of the two resulting ratios for each risk-based capital ratio. In addition, the proposal would require banking organizations to recognize most elements of AOCI in regulatory capital, including unrealized gains and losses on available-for-sale securities, and lower thresholds for deductions from CET1 capital for mortgage servicing assets and deferred tax assets, among other things. The proposal, if enacted, would have an effective date of July 1, 2025, with certain elements, such as the recognition of AOCI in regulatory capital and changes in risk-weighted assets calculated under the Expanded Risk-Based Approach, having a three-year phase-in period. We are in the process of evaluating this proposed rulemaking and assessing its potential impact on the Company and the Bank continuedif adopted as proposed.


73


Reportable Segment and Reporting Unit

In 2023, our chief operating decision maker assessed performance and allocated resources at the consolidated Company level. Following the acquisition of Flagstar Bank, N.A. and closing the Signature Transaction, we are currently in the process of operationalizing the financial reporting – both historical and prospective – for our reportable segments and reporting units, which may result in a change to exceedeither or both in future reporting periods.

Critical Accounting Estimates

Various elements of our accounting policies, by their nature, are subject to estimation techniques, valuation assumptions and other subjective assessments. Certain accounting policies that, due to the judgment, estimates and assumptions are critical to an understanding of our Consolidated Financial Statements and the Notes, are described in Item 1. These policies relate to: (a) the determination of our ACL, (b) fair value measurements and (c) the acquisition method of accounting. We believe the judgment, estimates and assumptions used in the preparation of our Consolidated Financial Statements and the Notes are appropriate given the factual circumstances at the time. However, given the sensitivity of our Consolidated Financial Statements and the Notes to these critical accounting policies, the use of other judgments, estimates and assumptions could result in material differences in our results of operations and/or financial condition.

Allowance for Credit Losses

The allowance for credit losses on loans and leases represents our current estimate of the lifetime credit losses expected from our loan and lease portfolio and our unfunded lending commitments. Management estimates the allowance by projecting and multiplying together the probability-of-default, loss-given-default and exposure-at-default depending on economic parameters for each month of the remaining contractual term, as well as credit ratings for certain loans within the commercial and industrial portfolio. The loss drivers for certain loans in the commercial and industrial portfolio are derived using credit ratings. The economic forecast and the related economic parameters are developed using multiple economic forecast scenarios, including related weightings, over the reasonable and supportable forecast period. The economic forecast scenarios and related economic parameters are sourced from independent third parties. Economic parameters are developed using available information relating to past events, current conditions, and economic forecasts. Historical credit loss experience over the historical loss observation period provides the basis for the estimation of expected credit losses, with qualitative adjustments made for differences in current loan-specific risk characteristics such as levels of and trends in delinquencies and performance of loans, levels of and trends in write-offs and recoveries collected, trends in volume and terms of loans, effects of any changes in reasonable and supportable economic forecasts, effects of any changes in risk selection and underwriting standards, and other changes in lending policies, procedures, and practices, experience, ability, and depth of lending management and other relevant staff, available relevant information sources that support or contradict the registrant’s own forecast, effects of changes in prepayment expectations or other factors affecting assessments of loan contractual term, industry conditions; and effects of changes in credit concentrations. Expected credit losses are estimated over the contractual term of the loans, adjusted for forecasted prepayments when appropriate. The methodology used in the estimation of the allowance for credit losses on loans and leases, which is performed at least quarterly, is designed to be dynamic and responsive to changes in portfolio credit quality and forecasted economic conditions. Each quarter the Company reassesses the appropriateness of the economic forecasting period, the reversion period and historical mean.

The allowance for credit losses on loans and leases is measured on a collective (pool) basis when similar risk characteristics exist. The portfolio segment represents the level at which a systematic methodology is applied to estimate credit losses. Management believes the products within each of the entity’s portfolio segments exhibit similar risk characteristics. Smaller pools of homogenous financing receivables with homogeneous risk characteristics were modeled using the methodology selected for the portfolio segment. The Company leverages economic projections including property market and prepayment forecasts from established independent third parties to inform its loss drivers in the forecast, as well as credit ratings for certain loans within the commercial and industrial portfolio.

Loans that do not share risk characteristics are evaluated on an individual basis, including nonaccrual loans. If a loan is determined to be collateral dependent, or meets the criteria to apply the collateral dependent practical expedient, expected credit losses are determined based on the fair value of the collateral at the reporting date, less costs to sell as appropriate.

The Company maintains an allowance for credit losses on off-balance sheet credit exposures. The Company estimates expected credit losses over the contractual period in which the Company is exposed to credit risk via a contractual obligation to extend credit, unless that obligation is unconditionally cancellable by the Company. The allowance for credit losses on off-balance sheet credit exposures is adjusted as a provision for credit losses expense. The estimate includes consideration of the

74


likelihood that funding will occur and an estimate of expected credit losses on commitments expected to be funded over their estimated life. The Company examined historical credit conversion factor (“CCF”) trends to estimate utilization rates, and chose an appropriate mean CCF based on both management judgment and quantitative analysis. Quantitative analysis involved examination of CCFs over a range of fund-up windows (between 12 and 36 months) and comparison of the mean CCF for each fund-up window with management judgment determining whether the highest mean CCF across fund-up windows made business sense. The Company applies the same standards and estimated loss rates to the credit exposures as to the related class of loans.

When applying this critical accounting estimate we incorporate several inputs and judgments that may be influenced by changes period to period. These include, but are not limited to changes in the economic environment and forecasts, changes in the credit profile and characteristics of the loan portfolio, property valuations and changes in prepayment assumptions.

While changes to the economic environment forecasts, and portfolio characteristics will change from period to period, portfolio prepayments are an integral assumption in estimating the allowance for credit losses on our commercial real estate portfolio (multi -family, CRE and ADC) which comprises 60 percent of the loan portfolio at December 31, 2023. Portfolio prepayments are subject to estimation uncertainty and changes in this assumption could have a material impact to our estimation process. Prepayment assumptions are sensitive to interest rates and existing loan terms and determine the weighted average life of the commercial mortgage loan portfolio. Excluding other factors, as the weighted average life of the portfolio increases or decreases, so will the required amount of the allowance for classification as “well capitalized” institutions, as defined undercredit losses on commercial real estate.

Valuation of Mortgage Servicing Rights

We purchase and originate mortgage loans for sale to the Federal Deposit Insurance Corporation Improvement Actsecondary market and often retain the right to service the loan at the time of 1991,sale upon which, a mortgage servicing right (MSR) is created. We have elected to report our MSR assets at fair value which is determined using an internal valuation model that utilizes an option-adjusted spread, constant prepayment rates, costs to service, and asother assumptions. The assumptions used in the MSR valuation are unobservable in nature, involve a higher degree of judgment and are estimated based on our judgment regarding the value that market participants would assign to the asset. To corroborate this estimate, we obtain third-party valuations of the MSR portfolio on a quarterly basis from independent valuation services to assess the reasonableness of the fair value calculated by the internal valuation model.

For further discussed in Note 19, “Capital,information and sensitivity analysis regarding the valuation of the MSR asset, see "Note 9 - Mortgage Servicing Rights,” in Item 8. “Financial Statements and Supplementary Data."

RESULTS OF OPERATIONS: 2021 AS COMPARED TO 2020

Net Interest Income

Net interest income is our primary source

Acquisition Method of income. Its level isAccounting

The acquisition method of accounting requires that acquired assets and liabilities in a functionbusiness combination be recorded at their fair values as of the average balanceacquisition date. This method often involves estimates, all of which are inherently subjective. We have elected to hold the measurement period open to allow for potential adjustments for up to one year after the acquisition date, for new information that existed at the acquisition date but may not have been known or available at that time. For further information, refer to Note 3 - Business Combinations in Item 8, "Financial Statements and Supplementary Data".

Goodwill

The Company evaluates goodwill for impairment at least annually or when triggering events are identified. We utilize a market approach to calculate the fair value of our interest-earning assets,single reporting unit, which considers how a market participant would view a control premium, complemented by an income approach if deemed necessary. The resulting value is then compared to our book value and any shortfalls would be recorded as an impairment.

As of December 31, 2023, the average balanceCompany identified a triggering event and applied a market approach using the end of our interest-bearing liabilities,day stock price, control premium for completed bank acquisitions, and the spread between the yield on such assets and the cost of such liabilities. These factors are influenced by both the pricing and mix of our interest-earning assets and our interest-bearing liabilities which, in turn, are impacted by various external factors, including the local economy, competitionan adjustment for loans and deposits, the monetary policy of the FOMC, and market interest rates.

The cost of our deposits and borrowed funds is largelyCompany-specific risk considerations based on short-term rates of interest, the level of which is partially impacted by the actions of the FOMC. The FOMC reduces, maintains, or increases the target federal funds rate (the rate at which banks borrow funds overnight from one another) as it deems necessary.

68


While the target federal funds rate generally impacts the cost of our short-term borrowings and deposits, the yields on our held-for-investment loans and other interest-earning assets are typically impacted by intermediate-termsubsequent confirming market interest rates.

Another factor that impacts the yields on our interest-earning assets—and our net interest income—is the income generated by our multi-family and CRE loans and securities when they prepay. Since prepayment income is recorded as interest income, an increase or decrease in its level will also be reflected in the average yields (as applicable) on our loans, securities, and interest-earning assets, and therefore in our net interest income, our net interest rate spread, and our net interest margin.

It should be noted that the level of prepayment income on loans recorded in any given period depends on the volume of loans that refinance or prepay during that time. Such activity is largely dependent on such external factors as currentevidence. This adjusted market conditions, including real estate values, and the perceived or actual direction of market interest rates. In addition, while a decline in market interest rates may trigger an increase in refinancing and, therefore, prepayment income, so too may an increase in market interest rates. It is not unusual for borrowers to lock in lower interest rates when they expect, or see, that market interest rates are rising rather than risk refinancing later at a still higher interest rate.

For the twelve months ended December 31, 2021, net interest income totaled $1.3 billion, up $189 million or 17%capitalization was then compared to the twelve months endedcarrying value to determine the extent of any shortfall which was calculated to be in excess of the goodwill balance. The Company’s assessment concluded that goodwill from historical transactions (2007 and prior) was fully impaired as of December 31, 2020. The year-over-year improvement was driven2023, as confirmed by a significant decline in interest expense due to lower funding costs, modestly offset by a yield-driven decline of $19 million in interest income.

Year-Over-Year Comparison

The following factors contributed to the year-over-year increase in net interest income:

Interest income on mortgage and other loans, net totaled $1.5 billion, down $17 million compared to full-year 2020, while interest income on securities declined $7 million to $156 million compared to last year. This was partially offset by a $5 million increase on interest income related to cash and cash equivalents.
Interest income on mortgages and other loans, net was driven by a $1.2 billion or 3% increase in average loan balances to $43.2 billion, offset by a 14 bps decrease in the average loan yield to 3.53% from 3.67% in 2020.
Interest income on securities was negatively impacted by a 38 bps decline in the average yield to 2.35% from 2.73%, offset by a $660 million or 11% increase in the average securities balance to $6.6 billion.
Average interest-earning cash and cash equivalent balances more than doubled during full-year 2021 to $2.4 billion compared to $1.1 billion during full-year 2020, while the average yield rose four bps to 0.32%.
Interest expense on average interest-bearing deposits declined $192 million or 63% to $114 million during full-year 2021, driven by a 68 bps decrease in the average cost of interest-bearing deposits, while the average balance of interest-bearing deposits rose $638 million or 2% to $29.5 billion.
Interest expense on borrowed funds declined $16 million or 5% to $286 million, despite an $876 million or 6% increase in the average balance to $15.7 billion.
The average cost of borrowed funds declined 21 bps to 1.82% during full-year 2021.

69


Net Interest Margin

The direction of the Company’s net interest margin was consistent with that of its net interest income, and generally was driven by the same factors as those described above. Adjusted net interest margin is a non-GAAP financial measure, as more fully discussed below.


For the Twelve
Months Ended


(dollars in millions)


December 31,
2021


December 31,
2020


Change (%)


Total Interest Income


$

1,689


$

1,708


-1


%

Prepayment Income:


Loans


$

70


$

52


35


%

Securities


9


2


350


%

Total prepayment income


$

79


$

54


46


%

GAAP Net Interest Margin


2.47


%

2.24


%


23


bp

Less:


Prepayment income from loans


-14


bp

-11


bp


-3


bp

Prepayment income from securities


-1


-1


bp

Total prepayment income contribution to net interest margin


-15


bp

-11


bp


-4


bp

Adjusted Net Interest Margin
   (non-GAAP)


2.32


%


2.13


%


19


bp

RECONCILIATION OF NET INTEREST MARGIN AND ADJUSTED NET INTEREST MARGIN

While our net interest margin, including the contribution of prepayment income and the impact from our recent subordinated notes offering, is recorded in accordance with GAAP, adjusted net interest margin, which excludes the contribution of prepayment income, is not. Nevertheless, management uses this non-GAAP measure in its analysis of our performance, and believes that this non-GAAP measure should be disclosed in this report and other investor communications for the following reasons:

1.
Adjusted net interest margin gives investors a better understanding of the effect of prepayment income on our net interest margin. Prepayment income in any given period depends on the volume of loans that refinance or prepay, or securities that prepay, during that period. Such activity is largely dependent on external factors such as current market conditions, including real estate values, and the perceived or actual direction of market interest rates.
2.
Adjusted net interest margin is among the measures considered by current and prospective investors, both independent of, and in comparison with, our peers.

Adjusted net interest margin should not be considered in isolation or as a substitute for net interest margin, which is calculated in accordance with GAAP. Moreover, the manner in which we calculate this non-GAAP measure may differ from that of other companies reporting a non-GAAP measure with a similar name.

The following table sets forth certain information regarding our average balance sheet for the years indicated, including the average yields on our interest-earning assets and the average costs of our interest-bearing liabilities. Average yields are calculated by dividing the interest income produced by the average balance of interest-earning assets. Average costs are calculated by dividing the interest expense produced by the average balance of interest-bearing liabilities. The average balances for the year are derived from average balances that are calculated daily. The average yields and costs include fees, as well as premiums and discounts (including mark-to-market adjustments from acquisitions), that are considered adjustments to such average yields and costs.

70


Net Interest Income Analysis


For the Years Ended December 31,


2021


2020


2019


Average


Average


Average


Average


Yield/


Average


Yield/


Average


Yield/


(dollars in millions)


Balance


Interest


Cost


Balance


Interest


Cost


Balance


Interest


Cost


ASSETS:


Interest-earning assets:


Mortgage and other loans and leases, net (1)

$


43,200


$


1,525


3.53


%


$

42,028


$

1,542


3.67

%


$

40,385


$

1,553


3.85

%

Securities (2)(3)


6,625


156


2.35


5,965


163


2.73


6,330


235


3.72


 Reverse repurchase agreements


430


4


1.05


20


0.32


Interest-earning cash and cash equivalents


2,016


4


0.17


1,088


3


0.27


744


17


2.23


Total interest-earning assets


52,271


1,689


3.23


49,101


1,708


3.48


47,459


1,805


3.80


Non-interest-earning assets


5,275


5,008


4,650


Total assets

$


57,546


$

54,109


$

52,109


LIABILITIES AND STOCKHOLDERS’ EQUITY:


Interest-bearing deposits:


Interest-bearing checking and money market
   accounts

$


12,829


$


31


0.24


%


$

10,965


$

57


0.52

%


$

10,597


$

174


1.65

%

Savings accounts


7,612


28


0.36


5,520


32


0.57


4,738


36


0.75


Certificates of deposit


9,094


55


0.60


12,412


217


1.75


13,532


320


2.37


Total interest-bearing deposits


29,535


114


0.38


28,897


306


1.06


28,867


530


1.84


Short term borrowed funds


2,343


8


0.34


2,319


16


0.70


62


1


1.93


Other borrowed funds


13,366


278


2.08


12,514


286


2.28


13,332


317


2.37


Total Borrowed funds


15,709


286


1.82


14,833


302


2.03


13,394


318


2.37


Total interest-bearing liabilities


45,244


400


0.88


43,730


608


1.39


42,261


848


2.01


Non-interest-bearing deposits


4,578


2,957


2,588


Other liabilities


790


714


596


Total liabilities


50,612


47,401


45,445


Stockholders’ equity


6,934


6,708


6,664


Total liabilities and stockholders’ equity

$


57,546


$

54,109


$

52,109


Net interest income/interest rate spread


$


1,289


2.35


%


$

1,100


2.09

%


$

957


1.79

%

Net interest margin


2.47


%


2.24

%


2.02

%

Ratio of interest-earning assets to interest-bearing
   liabilities


1.16x


1.12x


1.12x


(1)
Amounts are net of net deferred loan origination costs/(fees) and the allowances for loan losses and include loans held for sale non-performing loans.
(2)
Amounts are at amortized cost.
(3)
Includes FHLB stock.

The following table presents the extent to which changes in interest rates and changes in the volume of interest-earning assets and interest-bearing liabilities affected our interest income and interest expense during the periods indicated. Information is provided in each category with respect to (i) the changes attributable to changes in volume (changes in volume multiplied by prior rate); (ii) the changes attributable to changes in rate (changes in rate multiplied by prior volume); and (iii) the net change. The changes attributable to the combined impact of volume and rate have been allocated proportionately to the changes due to volume and the changes due to rate.

71


Rate/Volume Analysis


Year Ended


Year Ended


December 31, 2021


December 31, 2020


Compared to Year Ended


Compared to Year Ended


December 31, 2020


December 31, 2019


Increase/(Decrease)


Increase/(Decrease)


Due to


Due to


(in millions)


Volume


Rate


Net


Volume


Rate


Net


INTEREST-EARNING ASSETS:


Mortgage and other loans and leases, net


$

48


$

(65

)


$

(17

)


$

86


$

(97

)


$

(11

)

Securities


28


(35

)


(7

)


(13

)


(60

)


(73

)

Reverse repurchase agreements


4


4


Interest Earning Cash & Cash Equivalent


1


1


15


(28

)


(13

)

Total


81


(100

)


(19

)


88


(185

)


(97

)

INTEREST-BEARING LIABILITIES:


Interest-bearing checking and money
   market accounts


$

12


$

(38

)


$

(26

)


$

6


$

(124

)


$

(118

)

Savings accounts


(148

)


144


(4

)


9


(13

)


(4

)

Certificates of deposit


(47

)


(115

)


(162

)


(24

)


(78

)


(102

)

Short Term Borrowed Funds


(8

)


(8

)


15


15


Other Borrowed Funds


25


(33

)


(8

)


(19

)


(12

)


(31

)

Totals


(158

)


(50

)


(208

)


(13

)


(227

)


(240

)

Change in net interest income


$

239


$

(50

)


$

189


$

101


$

42


$

143


Provision for Credit Losses

During 2021, the provision for credit losses totaled $3 million, down $59 million compared to the $62 million we reported during 2020. For additional information about our methodologies for recording recoveries of, and provisions for, loan losses, see the discussion of the loan loss allowance under “Critical Accounting Policies” and the discussion of “Asset Quality” that appear earlier in this report.

Non-Interest Income

We generate non-interest income through a variety of sources, including—among others—fee income (in the form of retail deposit fees and charges on loans); income from our investment in BOLI; gains on sales of securities; and “other” sources, including the revenues produced through the sale of third-party investment products.

For the twelve months ended December 31, 2021, non-interest income totaled $61 million, unchanged compared to the twelve months ended December 31, 2020.

72


Non-Interest Income Analysis

The following table summarizes our sources of non-interest income for the years ended December 31, 2021, 2020, and 2019:


For the Years Ended December 31,


(in millions)


2021


2020


2019


Fee income


$

23


$

22


$

29


BOLI income


29


32


28


Net gain (loss) on securities


1


8


Other income:


Third-party investment product sales


5


4


7


Other


4


2


12


Total other income


9


6


19


Total non-interest income


$

61


$

61


$

84


Non-Interest Expense

For the twelve months ended December 31, 2021 total non-interest expense was $541 million up $30 million or 6% compared to the twelve months December 31, 2020. Included in the 2021 amount are $23 million of merger-related expenses. Excluding this item, operating expenses for the twelve months ended December 31, 2021 were $518 million, up $7 million or 1% compared to the previous year.

Income Tax Expense

Income tax expense includes federal, New York State, and New York City income taxes, as well as non-material income taxes from other jurisdictions where we operate our branches and/or conduct our mortgage banking business.

For the twelve months ended December 31, 2021, income tax expense totaled $210 million and the Company's effective tax rate was 26.09% compared to $77 million and an effective tax rate of 13.05% for the twelve months ended December 31, 2020. The year-over-year increase was due to higher pre-tax income and the non-deductibility of certain merger-related expenses, and an increase in the New York State corporate tax rate. Our full-year 2020 income tax expense included a $68 million income tax benefit related to certain tax provisions related to corporations under the CARES Act versus no such benefit during full-year 2021.

RESULTS OF OPERATIONS: 2020 AS COMPARED TO 2019

The results of operations comparison of 2020 compared to 2019 can be found in the Company’s previously filed Annual Report on Form 10-K for the year-ended December 31, 2020 under Item 7 “Management’s Discussion and Analysis of Financial Condition and Results of Operations”- Results of Operations: 2020 As Compared to 2019.”

IMPACT OF INFLATION

The consolidated financial statements and notes thereto presented in this report have been prepared in accordance with GAAP, which requires that we measure our financial condition and operating results in terms of historical dollars, without considering changes in the relative purchasing power of money over time due to inflation. The impact of inflation is reflected in the increased cost of our operations. Unlike industrial companies, nearly all of a bank’s assets and liabilities are monetary in nature.capitalization. As a result, the impactCompany recorded an impairment charge of interest rates on our performance is greater than the impactentire goodwill balance of general levels$2.4 billion. Refer to "Note 2 - Summary of inflation. Interest rates do not necessarily moveSignificant Accounting Policies" and "Note 16 - Intangible Assets" in Item 8, "Financial Statements and Supplementary Data" for the methodologies and assumptions used in the same direction, or to the same extent, as the prices of goods and services.

IMPACT OF RECENT ACCOUNTING PRONOUNCEMENTS

Recently Issued Accounting Standards

In January 2021, the FASB issued ASU No. 2021-01, an update to ASU 2020-04, which clarifies the scope of the optional relief for reference rate reform provided by ASC Topic 848. The ASU permits entities to apply certain of the optional practical expedients and exceptions in ASC 848 to the accounting for derivative contracts and hedging activities that may be affected by changes in interest rates used for discounting cash flows, computing variation margin

73


settlements and calculating price alignment interest (the “discounting transition”). These optional practical expedients and exceptions may be applied to derivative instruments impacted by the discounting transition even if such instruments do not reference a rate that is expected to be discontinued. The ASU was effective upon issuance and can generally be applied through December 31, 2022. The adoption of this ASU is not expected to have a material impact on the Company’s Consolidated Statements of Condition, results of operations, or cash flows.

RECONCILIATIONS OF SHAREHOLDERS’ EQUITY, COMMON STOCKHOLDERS’ EQUITY, AND TANGIBLE COMMON SHAREHOLDERS’ EQUITY; TOTAL ASSETS AND TANGIBLE ASSETS; AND THE RELATED MEASURES

While stockholders’ equity, common stockholders’ equity, total assets, and book value per common share are financial measures that are recorded in accordance with U.S. GAAP, tangible common stockholders’ equity, tangible assets, and tangible book value per common share are not. It is management’s belief that these non-GAAP measures should be disclosed in this report and others we issue for the following reasons:

goodwill impairment analysis.
1.
Tangible common stockholders’ equity is an important indication of the Company’s ability to grow organically and through business combinations, as well as its ability to pay dividends and to engage in various capital management strategies.

75

2.
Tangible book value per common share and the ratio of tangible common stockholders’ equity to tangible assets are among the capital measures considered by current and prospective investors, both independent of, and in comparison with, the Company’s peers.

Item7A.Quantitative and Qualitative Disclosures about Market Risk
Tangible common stockholders’ equity, tangible assets, and the related non-GAAP measures should not be considered in isolation or as a substitute for stockholders’ equity, common stockholders’ equity, total assets, or any other measure calculated in accordance with GAAP. Moreover, the manner in which we calculate these non-GAAP measures may differ from that of other companies reporting non-GAAP measures with similar names.

Reconciliations of our stockholders’ equity, common stockholders’ equity, and tangible common stockholders’ equity; our total assets and tangible assets; and the related financial measures for the respective periods follow:


At or for the
Twelve Months Ended
December 31,


(dollars in millions)


2021


2020


Stockholders’ Equity


$

7,044


$

6,842


Less: Goodwill


(2,426

)


(2,426

)

Preferred stock


(503

)


(503

)

Tangible common stockholders’ equity


$

4,115


$

3,913


Total Assets


$

59,527


$

56,306


Less: Goodwill


(2,426

)


(2,426

)

Tangible assets


$

57,101


$

53,880


Common stockholders’ equity to total assets


10.99

%


11.26

%

Tangible common stockholders’ equity to
   tangible assets


7.21


7.26


Book value per common share


$

14.07


$

13.66


Tangible book value per common share


8.85


8.43


74


ITEM 7A. QUANTITATIVE AND QUALITATIVE DISCLOSURES ABOUT MARKET RISK

We manage our assets and liabilities to reduce our exposure to changes in market interest rates. The asset and liability management process has three primary objectives: to evaluate the interest rate risk inherent in certain balance sheet accounts; to determine the appropriate level of risk, given our business strategy, operating environment, capital and liquidity requirements, and performance objectives; and to manage that risk in a manner consistent with guidelines approved by the Boards of Directors of the Company and the Bank.

Market Risk

As a financial institution, we are focused on reducing our exposure to interest rate volatility, which represents our primary market risk. Changes in market interest rates represent the greatest challenge to our financial performance, as such changes can have a significant impact on the level of income and expense recorded on a large portion of our interest-earning assets and interest-bearing liabilities, and on the market value of all interest-earning assets, other than those possessing a short term to maturity. To reduce our exposure to changing rates, the Board of Directors and management monitor interest rate sensitivity on a regular or as needed basis so that adjustments to the asset and liability mix can be made when deemed appropriate.

The actual duration of held-for-investment mortgage loans and mortgage-related securities can be significantly impacted by changes in prepayment levels and market interest rates. The level of prepayments may, in turn, be impacted by a variety of factors, including the economy in the region where the underlying mortgages were originated; seasonal factors; demographic variables; and the assumability of the underlying mortgages. However, the factors with the most significant impact on prepayments are market interest rates and the availability of refinancing opportunities.

In 2021, we

We managed our interest rate risk by taking the following actions: (1) We have continuedContinue to emphasizeincrease the origination and retentioninvestments portfolio with an overall shorter duration profile; (2) The use of intermediate-term assets, primarily in the form of multi-family and CRE loans; (2) We have continued the origination of certain C&I loans that feature floatingderivatives to manage our interest rates;rate position; (3) Increased the focus on retaining low costs deposits; and (4) Obtained new low costincreasing our branch deposits as part of the banking-as-a-service initiative.base.

LIBOR Transition Process and Phase Out

In 2017, the FCA, which is responsible for regulating LIBOR, announced that the publication of LIBOR is not guaranteed beyond 2021. In December 2020, the administrator of LIBOR announced its intention to : (i) cease the publication of one-week and two-month U.S. dollar LIBOR after December 31, 2021, and (ii) cease the publication of all other tenors of U.S. dollar LIBOR (one, three, six, and 12-month LIBOR) after June 30, 2023. The administrator for LIBOR announced on March 5, 2021, that it will permanently cease to publish most LIBOR settings beginning on January 1, 2022 and cease to publish the overnight, one-month, three-month, six-month, and 12-month U.S. dollar LIBOR settings on July 1, 2023. Accordingly, the FCA has stated that it does not intend to persuade or compel banks to submit to LIBOR after such respective dates. Until such time, however, FCA panel banks have agreed to continue to support LIBOR. In October 2021, the federal bank regulatory agencies issued a Joint Statement on Managing the LIBOR Transition. In that guidance, the agencies offered their regulatory expectations and outlined potential supervisory and enforcement consequences for banks that fail to adequately plan for and implement the transition away from LIBOR. The FRB established the Alternative Reference Rate Committee ("ARRC"), comprised of a group of private market participants and other members, representing banks and financial sector regulators, to identify a set of alternative reference rates for potential use as benchmarks. The FRB-NY established SOFR as its recommended alternative to LIBOR. In addition to SOFR, the Company is evaluating alternatives other than SOFR as a potential alternative to LIBOR.

The Bank established a sub-committee of ALCO to address issues related to the phase out and transition away from LIBOR. This sub-committee is led by our Chief Financial Officer and consists of personnel from various departments throughout the Bank including lending, loan administration, credit risk management, finance/treasury, including interest rate risk and liquidity management, information technology, and operations. The Company has LIBOR-based contracts that extend beyond June 30, 2023 included in loans and leases, securities, wholesale borrowings, derivative financial instruments, and long-term debt. The sub-committee has reviewed contract fallback language and noted that certain contracts will need updated provisions for the transition and is coordinating with impacted business lines. In complying with industry requirements, the Bank will not offer new LIBOR-based products after December 31, 2021.

75


Interest Rate Sensitivity Analysis

The matching of assets and liabilities may be analyzed by examining the extent to which such assets and liabilities are “interest rate sensitive” and by monitoring a bank’s interest rate sensitivity “gap.” An asset or liability is said to be interest rate sensitive within a specific time frame if it will mature or reprice within that period of time. The interest rate sensitivity gap is defined as the difference between the amount of interest-earning assets maturing or repricing within a specific time frame and the amount of interest-bearing liabilities maturing or repricing within that same period of time.

At December 31, 2021, our one-year gap was a negative 7.43%, as compared to a negative 4.94% at December 31, 2020. The change in our one-year gap from December 31, 2020, primarily reflects a decrease in loans repricing or maturing coupled with an increase in short term borrowings which was partially offset by an increase in cash and cash equivalents and decrease in maturing CD deposits.

In a rising interest rate environment, an institution with a negative gap would generally be expected, absent the effects of other factors, to experience a greater increase in the cost of its interest-bearing liabilities than it would in the yield on its interest-earning assets, thus producing a decline in its net interest income. Conversely, in a declining rate environment, an institution with a negative gap would generally be expected to experience a lesser reduction in the yield on its interest-earning assets than it would in the cost of its interest-bearing liabilities, thus producing an increase in its net interest income.

In a rising interest rate environment, an institution with a positive gap would generally be expected to experience a greater increase in the yield on its interest-earning assets than it would in the cost of its interest-bearing liabilities, thus producing an increase in its net interest income. Conversely, in a declining rate environment, an institution with a positive gap would generally be expected to experience a lesser reduction in the cost of its interest-bearing liabilities than it would in the yield on its interest-earning assets, thus producing a decline in its net interest income.

The table on the following page sets forth the amounts of interest-earning assets and interest-bearing liabilities outstanding at December 31, 2021 which, based on certain assumptions stemming from our historical experience, are expected to reprice or mature in each of the future time periods shown. Except as stated below, the amounts of assets and liabilities shown as repricing or maturing during a particular time period were determined in accordance with the earlier of (1) the term to repricing, or (2) the contractual terms of the asset or liability.

The table provides an approximation of the projected repricing of assets and liabilities at December 31, 2021 on the basis of contractual maturities, anticipated prepayments, and scheduled rate adjustments within a three-month period and subsequent selected time intervals. For residential mortgage-related securities, prepayment rates are forecasted at a weighted average CPR of 14.24% per annum; for multi-family and CRE loans, prepayment rates are forecasted at weighted average CPRs of 14.76% and 12.57% per annum, respectively. Borrowed funds were not assumed to prepay.

Savings, interest bearing checking and money market accounts were assumed to decay based on a comprehensive statistical analysis that incorporated our historical deposit experience. Based on the results of this analysis, savings accounts were assumed to decay at a rate of 68% for the first five years and 32% for years six through ten. Interest-bearing checking accounts were assumed to decay at a rate of 69% for the first five years and 31% for years six through ten. The decay assumptions reflect the prolonged low interest rate environment and the uncertainty regarding future depositor behavior. Including those accounts having specified repricing dates, money market accounts were assumed to decay at a rate of 80% for the first five years and 20% for years six through ten.

76


Interest Rate Sensitivity Analysis


At December 31, 2021


(dollars in millions)


Three
Months
or Less


Four to
Twelve
Months


More Than
One Year
to Three
Years


More Than
Three
Years to
Five Years


More Than
Five Years
to 10 Years


More Than
10 Years


Total


INTEREST-EARNING ASSETS:


Mortgage and other loans (1)


$


6,057


$


8,098


$


16,044


$


11,273


$


4,233


$


$


45,705


Mortgage-related securities (2)(3)


241


384


775


514


598


278


2,790


Other securities (2)


1,887


215


59


77


1,386


100


3,724


Interest-earning cash and cash equivalents


2,062


2,062


Total interest-earning assets


10,247


8,697


16,878


11,864


6,217


378


54,281


INTEREST-BEARING LIABILITIES:


Interest-bearing checking and money
   market accounts


7,210


357


1,611


614


3,417


13,209


Savings accounts


2,712


2,422


635


284


2,839


8,892


Certificates of deposit


3,441


4,013


905


65


8,424


Borrowed funds


1,039


2,175


4,675


250


8,280


143


16,562


Total interest-bearing liabilities


14,402


8,967


7,826


1,213


14,536


143


47,087


Interest rate sensitivity gap per period (4)


$


(4,155

)


$


(270

)


$


9,052


$


10,651


$


(8,319

)


$


235


$


7,194


Cumulative interest rate sensitivity gap


$


(4,155

)


$


(4,425

)


$


4,627


$


15,278


$


6,959


$


7,194


Cumulative interest rate sensitivity gap
   as a percentage of total assets


(6.98

)

%


(7.43

)

%


7.77


%


25.67


%


11.69


%


12.09


%


Cumulative net interest-earning assets as a
   percentage of net interest-bearing liabilities


71.15


%


81.06


%


114.83


%


147.14


%


114.82


%


115.28


%


(1)
For the purpose of the gap analysis, loans held for sale, non-performing loans and the allowance for loan losses have been excluded.
(2)
Mortgage-related and other securities, including FHLB stock, are shown at their respective carrying amounts.
(3)
Expected amount based, in part, on historical experience.
(4)
The interest rate sensitivity gap per period represents the difference between interest-earning assets and interest-bearing liabilities.

Prepayment and deposit decay rates can have a significant impact on our estimated gap. While we believe our assumptions to be reasonable, there can be no assurance that the assumed prepayment and decay rates noted above will approximate actual future loan and securities prepayments and deposit withdrawal activity.

To validate our prepayment assumptions for our multi-family and CRE loan portfolios, we perform a monthly analysis, during which we review our historical prepayment rates and compare them to our projected prepayment rates. We continually review the actual prepayment rates to ensure that our projections are as accurate as possible, since prepayments on these types of loans are not as closely correlated to changes in interest rates as prepayments on one-to-four family loans tend to be. In addition, we review the call provisions in our borrowings and investment portfolios and, on a monthly basis, compare the actual calls to our projected calls to ensure that our projections are reasonable.

As of December 31, 2021, the impact of a 100 bp decline in market interest rates for our loans would have had very little impact on prepayment speeds due to the current low interest rates and current coupons being floored at base rates. The impact of a 100 bp increase in market interest rates would have decreased our projected prepayment rates for multi-family and CRE loans by a constant prepayment rate of 3.23% per annum

Certain shortcomings are inherent in the method of analysis presented in the preceding Interest Rate Sensitivity Analysis. For example, although certain assets and liabilities may have similar maturities or periods to repricing, they may react in different degrees to changes in market interest rates. The interest rates on certain types of assets and liabilities may fluctuate in advance of the market, while interest rates on other types may lag behind changes in market interest rates. Additionally, certain assets, such as adjustable-rate loans, have features that restrict changes in interest rates both on a short-term basis and over the life of the asset. Furthermore, in the event of a change in interest rates, prepayment and early withdrawal levels would likely deviate from those assumed in calculating the table. Also, the ability of some borrowers to repay their adjustable-rate loans may be adversely impacted by an increase in market interest rates.

Interest rate sensitivity is also monitored through the use of a model that generates estimates of the change in our Economic Value of Equity (“EVE”)(EVE) over a range of interest rate scenarios. EVE is defined as the net present value

77


of expected cash flows from assets, liabilities, and off-balance sheet contracts. The EVE ratio, under any interest rate scenario, is defined as the EVE in that scenario divided by the market value of assets in the same scenario. The model assumes estimated loan and MBS prepayment rates, reinvestment rates,current market value spreads, and deposit decay rates similar to those utilized in formulating the preceding Interest Rate Sensitivity Analysis.and betas.


Based on the information and assumptions in effect at December 31, 2021,2023, the following table sets forth our EVE, assuming the changes in interest rates noted:

Change in Interest Rates (in basis points)Estimated Percentage Change in Economic Value of Equity
-200 shock(2.39)%
-100 shock(1.31)%
+100 shock(0.28)%
+200 shock(1.44)%
    

(dollars in millions)

Change in
Interest
Rates (in basis
points)
(1)


Market Value
of Assets


Market Value
of Liabilities


Economic
Value
of Equity


Net Change


Estimated
Percentage
Change in
Economic
Value of Equity


+ 200


$


55,740


$


49,932


$


5,808


$


(934

)


(13.85

)

%

+ 100


57,255


50,743


6,512


(230

)


(3.41

)


58,736


51,994


6,742


(1)
The impact of a 100-bp and a 200-bp reduction in interest rates is not presented in view of the current level of the federal funds rate and other short-term interest rates.

The net changes in EVE presented in the preceding table are within the parameters approved by the Boards of Directors of the Company and the Bank.


As with

Accordingly, while the Interest Rate Sensitivity Analysis, certain shortcomings are inherent in the methodology used in the precedingEVE analysis provides an indication of our interest rate risk measurements. exposure at a particular point in time, such measurements are not intended to, and do not, provide a precise forecast of the effect of changes in market interest rates on our net interest income, and may very well differ from actual results.

Interest Rate Risk is also monitored through the use of a model that generates Net Interest Income (NII) simulations over a range of interest rate scenarios.Modeling changes in EVENII requires that certain assumptions be made which may or may not reflect the manner in which actual yields and costs respond to changes in market interest rates. In this regard, the EVENII analysis presented abovebelow assumes that the composition of our interest rate sensitive assets and liabilities existing at the beginning of a period remains constant over the period being measured, and also assumes that a particular change in interest rates is reflected uniformly across the yield curve, regardless of the duration to maturity or repricing of specific assets and liabilities.

76


Furthermore, the model does not take into account the benefit of any strategic actions we may take to further reduce our exposure to interest rate risk. Accordingly, while the EVE analysis provides an indication of our interest rate risk exposure at a particular point in time, such measurements are not intended to, and do not, provide a precise forecast of the effect of changes in market interest rates on our net interest income, and may very well differ from actual results.

We also utilize an internal net interest income simulation to manage our sensitivity to interest rate risk. The simulation incorporates various market-based assumptions regarding the impact of changing interest rates on future levels of our financial assets and liabilities. The assumptions used in the net interest income simulation are inherently uncertain. Actual results may differ significantly from those presented in the following table, due to the frequency, timing, and magnitude of changes in interest rates; changes in spreads between maturity and repricing categories; and prepayments, among other factors, coupled with any actions taken to counter the effects of any such changes.


Based on the information and assumptions in effect at December 31, 2021,2023, the following table reflects the estimated percentage change in future net interest income for the next twelve months, assuming the changes in interest rates noted:

Change in Interest Rates
(in
(in basis points)
(1) (2)

Estimated Percentage Change in
Future Net Interest Income

-200 shock

(5.81)%
-100 shock(3.17)%
+100 over one yearshock

3.24%

(1.37

)

%

+200 over one yearshock

6.40%

(4.91

)


(1)
In general, short- and long-term rates are assumed to increase in parallel fashion across all four quartersinstantaneously and then remain unchanged.
(2)
The impact of a 100bp and a 200-bp reductionnet changes in interest rates is notNII presented in viewthe preceding table are within the parameters approved by the Boards of Directors of the current level ofCompany and the federal funds rate and other short-term interest rates.Bank.

78


Future changes in our mix of assets and liabilities may result in greater changes to our gap, NPV,EVE, and/or net interest income simulation.NII simulations.

In the event that our EVE and net interest income sensitivities were to breach our internal policy limits, we would undertake the following actions to ensure that appropriate remedial measures were put in place:


Our ALCO Committee would inform the Board of Directors of the variance, and present recommendations to the Board regarding proposed courses of action to restore conditions to within-policy tolerances.
In formulating appropriate strategies, the ALCO Committee would ascertain the primary causes of the variance from policy tolerances, the expected term of such conditions, and the projected effect on capital and earnings.

Our ALCO Committee would inform the Board of Directors of the variance, and present recommendations to the Board regarding proposed courses of action to restore conditions to within-policy tolerances.

Where temporary changes in market conditions or volume levels result in significant increases in risk, strategies may involve reducing open positions or employing synthetic hedging techniquesother balance sheet management activities including the potential use of derivatives to more immediately reduce the risk exposure. Where variance from policy tolerances is triggered by more fundamental imbalances in the risk profiles of core loan and deposit products, a remedial strategy may involve restoring balance through natural hedges to the extent possible before employing synthetic hedging techniques. Other strategies might include:

Asset restructuring, involving sales of assets having higher risk profiles, or a gradual restructuring of the asset mix over time to affect the maturity or repricing schedule of assets;

Liability restructuring, whereby product offerings and pricing are altered or wholesale borrowings are employed to affect the maturity structure or repricing of liabilities;

Expansion or shrinkage of the balance sheet to correct imbalances in the repricing or maturity periods between assets and liabilities; and/or

Use or alteration of off-balance sheet positions, including interest rate swaps, caps, floors, options, and forward purchase or sales commitments.

In connection with our net interest income simulation modeling, we also evaluate the impact of changes in the slope of the yield curve. At December 31, 2021,2023, our analysis indicated that an immediatea further inversion of the yield curve would be expected to result in an 8.14% decreasea 2.1 increase in net interest income; conversely, an immediate steepening of the yield curve would be expected to result in a 1.58% increase2.4 percent decrease in net interest income. It should be noted that the yield curveincome. Both scenarios are derived from immediate changes in these scenarios were updated, given the changing market rate environment, which resulted in an increase in the income sensitivity.to short-term rates.

79

77


ITEM 8. FINANCIAL STATEMENTS AND SUPPLEMENTARY DATA

Our

ITEM 8.FINANCIAL STATEMENTS AND SUPPLEMENTARY DATA
Index to Consolidated Financial Statements and Notes thereto and other supplementary data begin on the following page.


78

80


NEW YORK COMMUNITY BANCORP, INC.

CONSOLIDATED STATEMENTS OF CONDITION


December 31,


(in millions, except share data)


2021


2020


ASSETS:


Cash and cash equivalents


$

2,211


$

1,948


Securities:


Debt securities available-for-sale ($1,168 and $1,278 pledged at
   December 31, 2021 and 2020, respectively)


5,780


5,813


Equity investments with readily determinable fair values, at fair value


16


32


Total securities


5,796


5,845


Loans held for sale


117


Loans and leases held for investment, net of deferred loan fees and costs


45,738


42,884


Less: Allowance for credit losses on loans and leases


(199

)


(194

)

Total loans and leases, net


45,539


42,807


Federal Home Loan Bank stock, at cost


734


714


Premises and equipment, net


270


287


Operating lease right-of-use assets


249


267


Goodwill


2,426


2,426


Bank-owned life insurance


1,184


1,164


Other real estate owned and other repossessed assets


8


8


Other assets


1,110


840


Total assets


$

59,527


$

56,306


LIABILITIES AND STOCKHOLDERS’ EQUITY:


Deposits:


Interest-bearing checking and money market accounts


$

13,209


$

12,610


Savings accounts


8,892


6,416


Certificates of deposit


8,424


10,331


Non-interest-bearing accounts


4,534


3,080


Total deposits


35,059


32,437


Borrowed funds:


Wholesale borrowings:


Federal Home Loan Bank advances


15,105


14,628


Repurchase agreements


800


800


Total wholesale borrowings


15,905


15,428


Junior subordinated debentures


361


360


Subordinated notes


296


296


Total borrowed funds


16,562


16,084


Operating lease liabilities


249


267


Other liabilities


613


676


Total liabilities


52,483


49,464


Stockholders’ equity:


Preferred stock at par $0.01 (5,000,000 shares authorized): Series A (515,000 shares
   issued and outstanding)


503


503


Common stock at par $0.01 (900,000,000 shares authorized; 490,439,070 and 490,439,070
   shares issued; and
465,015,643 and 463,901,808 shares outstanding, respectively)


5


5


Paid-in capital in excess of par


6,126


6,123


Retained earnings


741


494


Treasury stock, at cost (25,423,427 and 26,537,262 shares, respectively)


(246

)


(258

)

Accumulated other comprehensive loss, net of tax:


Net unrealized (loss) gain on securities available for sale, net of tax of $17 and
   $(
25), respectively


(45

)


67


Net unrealized loss on pension and post-retirement obligations, net of tax of $12
   and $
22 respectively


(31

)


(59

)

Net unrealized loss on cash flow hedges, net of tax of $3 and $13, respectively


(9

)


(33

)

Total accumulated other comprehensive loss, net of tax


(85

)


(25

)

Total stockholders’ equity


7,044


6,842


Total liabilities and stockholders’ equity


$

59,527


$

56,306


New York Community Bancorp, Inc.
Consolidated Statements of Condition
December 31, 2023December 31, 2022
(in millions, except per share data)
ASSETS:
Cash and cash equivalents$11,475 $2,032 
Securities:
Debt Securities available-for-sale ($2,822 and $434 pledged at December 31, 2023 and December 31, 2022, respectively)9,1459,060
Equity investments with readily determinable fair values, at fair value1414
Total securities9,1599,074
Loans held for sale ($902 and $1,115 measured at fair value, respectively)1,1821,115
Loans and leases held for investment, net of deferred loan fees and costs84,61969,001
Less: Allowance for credit losses on loans and leases(992)(393)
Total loans and leases held for investment, net83,62768,608
Federal Home Loan Bank stock and Federal Reserve Bank stock, at cost1,3921,267
Premises and equipment, net652491
Core deposit and other intangibles625287
Goodwill2,426
Mortgage servicing rights1,1111,033
Bank-owned life insurance1,5801,561
Other assets3,2542,250
Total assets$114,057 $90,144 
LIABILITIES AND STOCKHOLDERS' EQUITY:
Deposits:
Interest-bearing checking and money market accounts$30,700 $22,511 
Savings accounts8,77311,645
Certificates of deposit21,55412,510
Non-interest-bearing accounts20,49912,055
Total deposits81,52658,721
Borrowed funds:
Federal Home Loan Bank and Federal Reserve Bank advances20,25020,325
Junior subordinated debentures579575
Subordinated notes438432
Total borrowed funds21,26721,332
Other liabilities2,8971,267
Total liabilities105,69081,320
Stockholders' equity:
Preferred stock at par $0.01 (5,000,000 shares authorized): Series A (515,000 shares issued and outstanding)503503
Common stock at par 0.01 (900,000,000 shares authorized; 744,155,791 and 705,429,386
   shares issued; and 722,066,370 and 681,217,334 shares outstanding, respectively)
77
Paid-in capital in excess of par8,2318,130
Retained earnings4431,041
Treasury stock, at cost ($22,089,421 and 24,212,052 shares, respectively)(218)(237)
Accumulated other comprehensive loss, net of tax:
Net unrealized loss on securities available for sale, net of tax of $225 and $240, respectively(581)(626)
Net unrealized loss on pension and post-retirement obligations, net of tax of $12 and $18, respectively(28)(46)
Net unrealized gain on cash flow hedges, net of tax of $(6) and $(20), respectively1052
Total accumulated other comprehensive loss, net of tax(599)(620)
Total stockholders’ equity8,3678,824
Total liabilities and stockholders’ equity$114,057 $90,144 
See accompanying notes to the consolidated financial statements.


79

New York Community Bancorp, Inc.
Consolidated Statements of (Loss) Income and Comprehensive (Loss) Income
For the Years Ended December 31,
(in millions, except per share data)202320222021
INTEREST INCOME:
Loans and leases$4,509 $1,848 $1,525 
Securities and money market investments982 244 164 
Total interest income5,491 2,092 1,689 
INTEREST EXPENSE:
Interest-bearing checking and money market accounts943 226 31 
Savings accounts169 60 28 
Certificates of deposit646 97 55 
Borrowed funds656 313 286 
Total interest expense2,414 696 400 
Net interest income3,077 1,396 1,289 
Provision for credit losses833 133 
Net interest income after provision for credit loan losses2,244 1,263 1,286 
NON-INTEREST INCOME:
Fee income172 27 23 
Bank-owned life insurance43 32 29 
Net loss on securities(1)(2)— 
Net return on mortgage servicing rights103 — 
Net gain on loan sales and securitizations89 — 
Net loan administration income82 — 
Bargain purchase gain2,131 159 — 
Other68 17 
Total non-interest income2,687 247 61 
NON-INTEREST EXPENSE:
Operating expenses:
Compensation and benefits1,149 354 303 
Occupancy and equipment200 92 88 
General and administrative750 158 127 
Total operating expense2,099 604 518 
Intangible asset amortization126 — 
Merger-related and restructuring expenses330 75 23 
Goodwill impairment2,426 — — 
Total non-interest expense4,981 684 541 
(Loss) Income before income taxes(50)826 806 
Income tax expense29 176 210 
Net (loss) income$(79)$650 $596 
Preferred stock dividends333333
Net (loss) income available to common stockholders$(112)$617 $563 
Basic (loss) earnings per common share$(0.16)$1.26 $1.20 
Diluted (loss) earnings per common share$(0.16)$1.26 $1.20 
Net (loss) income$(79)$650 $596 
Other comprehensive gain (loss), net of tax:
Change in net unrealized loss on securities available for sale, net of tax of $(15); $223 and $42, respectively45 (581)(112)
Change in pension and post-retirement obligations, net of tax of $(5); $6 and $(8), respectively12 (17)23 
Change in net unrealized gain on cash flow hedges, net of tax of $(3); $(24) and $(2), respectively64 
Reclassification adjustment for defined benefit pension plan, net of tax of $(1); $— and $(2), respectively
Reclassification adjustment for net (loss) gain on cash flow hedges included in net income, net of tax $17; $1 and $(7), respectively(48)(3)18 
Total other comprehensive gain (loss), net of tax21 (535)(60)
Total comprehensive (loss) income, net of tax$(58)$115 $536 
81


NEW YORK COMMUNITY BANCORP, INC.

CONSOLIDATED STATEMENTS OF INCOME AND COMPREHENSIVE INCOME


Years Ended December 31,


(in millions, except per share data)


2021


2020


2019


INTEREST INCOME:


Loans and leases


$

1,525


$

1,542


$

1,553


Securities and money market investments


164


166


252


Total interest income


1,689


1,708


1,805


INTEREST EXPENSE:


Interest-bearing checking and money market accounts


31


57


174


Savings accounts


28


32


36


Certificates of deposit


55


217


320


Borrowed funds


286


302


318


Total interest expense


400


608


848


Net interest income


1,289


1,100


957


Provision for credit losses


3


62


7


Net interest income after provision for credit loan losses


1,286


1,038


950


NON-INTEREST INCOME:


Fee income


23


22


29


Bank-owned life insurance


29


32


28


Net gain on securities


1


8


Other


9


6


19


Total non-interest income


61


61


84


NON-INTEREST EXPENSE:


Operating expenses:


Compensation and benefits


303


301


302


Occupancy and equipment


88


86


89


General and administrative


127


124


120


Total operating expense


518


511


511


Merger-related expenses


23


Total non-interest expense


541


511


511


Income before income taxes


806


588


523


Income tax expense


210


77


128


Net income


$

596


$

511


$

395


Preferred stock dividends


33


33


33


Net income available to common stockholders


$

563


$

478


$

362


Basic earnings per common share


$

1.20


$

1.02


$

0.77


Diluted earnings per common share


$

1.20


$

1.02


$

0.77


Net income


$

596


$

511


$

395


Other comprehensive income (loss), net of tax:


Change in net unrealized gain (loss) on securities available for sale,
   net of tax of $
42; $(16); and $(18), respectively


(112

)


42


46


Change in pension and post-retirement obligations, net of tax of
   $(
8); $2 and $(2)


6


(5

)


5


Change in net unrealized (loss) gain on cash flow hedges, net of tax
   of $(
2); $16 and $-, respectively


23


(42

)


1


Less: Reclassification adjustment for sales of available-for-sale
   securities, net of tax of $-; $-; and $
2, respectively


(1

)


(4

)

Reclassification adjustment for defined benefit pension plan,
   net of tax of $(
2); $(2) and $(2), respectively


5


5


7


Reclassification adjustment for net gain on cash flow hedges
   included in net income, net of tax $(
7); $(3) and $-, respectively


18


8


Total other comprehensive income (loss), net of tax


(60

)


7


55


Total comprehensive income, net of tax


$

536


$

518


$

450


See accompanying notes to the consolidated financial statements.

82


NEW YORK COMMUNITY BANCORP, INC.

CONSOLIDATED STATEMENTS OF CHANGES IN STOCKHOLDERS’ EQUITY

(in millions, except share data)


Shares
Outstanding


Preferred
Stock (Par
Value:
$0.01)


Common
Stock (Par
Value:
$0.01)


Paid-in
Capital in
excess
of Par


Retained
Earnings


Treasury
Stock, at
Cost


Accumulated
Other
Comprehensive
Loss, Net
of Tax


Total
Stockholders’
Equity


Twelve Months Ended December 31, 2021


Balance at December 31, 2020


463,901,808


$

503


$

5


$

6,123


$

494


$

(258

)


$

(25

)


$

6,842


Shares issued for restricted stock, net of forfeitures


2,515,942


(28

)


28


Compensation expense related to restricted stock awards


31


31


Net income


596


596


Dividends paid on common stock ($0.68)


(316

)


(316

)

Dividends paid on preferred stock ($63.76)


(33

)


(33

)

Purchase of common stock


(1,402,107

)


(16

)


(16

)

Other comprehensive income, net of tax


(60

)


(60

)

Balance at December 31, 2021


465,015,643


$

503


$

5


$

6,126


$

741


$

(246

)


$

(85

)


$

7,044


Twelve Months Ended December 31, 2020


Balance at December 31, 2019


467,346,781


$

503


$

5


$

6,115


$

342


$

(220

)


$

(33

)


$

6,712


Opening retained earnings adjustment (1)


(10

)


(10

)

Adjusted balance, beginning of period


332


6,702


Shares issued for restricted stock, net of forfeitures


2,321,105


(22

)


22


Compensation expense related to restricted stock awards


30


30


Net income


511


511


Dividends paid on common stock ($0.68)


(316

)


(316

)

Dividends paid on preferred stock ($63.76)


(33

)


(33

)

Purchase of common stock


(5,766,078

)


(60

)


(60

)

Other comprehensive loss, net of tax


8


8


Balance at December 31, 2020


463,901,808


$

503


$

5


$

6,123


$

494


$

(258

)


$

(25

)


$

6,842


Twelve Months Ended December 31, 2019


Balance at December 31, 2018


473,536,604


$

503


$

5


$

6,100


$

297


$

(162

)


$

(88

)


$

6,655


Shares issued for restricted stock, net of forfeitures


1,665,028


(17

)


17


Compensation expense related to restricted stock awards


32


32


Net income


395


395


Dividends paid on common stock ($0.68)


(317

)


(317

)

Dividends paid on preferred stock ($63.76)


(33

)


(33

)

Purchase of common stock


(7,854,851

)


0


(75

)


(75

)

Other comprehensive loss, net of tax


55


55


Balance at December 31, 2019


467,346,781


$

503


$

5


$

6,115


$

342


$

(220

)


$

(33

)


$

6,712


(1)
80

Amount represents a $10 million cumulative adjustment, net of tax, to retained earnings as of January 1, 2020, as a result of the adoption of ASU 2016-13, Financial Instruments - Credit Losses (Topic 326): Measurement of Credit Losses on Financial Instruments, which became effective January 1, 2020.


New York Community Bancorp, Inc.
Consolidated Statements of Changes in Stockholders' Equity

(in millions, except share data)Shares OutstandingPreferred Stock (Par Value: $0.01)Common Stock (Par Value: 0.01)Paid-in Capital in excess of ParRetained EarningsTreasury Stock, at CostAccumulated Other Comprehensive Loss, Net of TaxTotal Stockholders’ Equity
Year Ended December 31, 2023
Balance at December 31, 2022681,217,334$503 $$8,130 $1,041 $(237)$(620)$8,824 
Issuance and exercise of FDIC Equity appreciation instrument39,032,006— — 85 — — — 85 
Shares issued for restricted stock, net of forfeitures3,074,565— — (31)— 31 — — 
Compensation expense related to restricted stock awards— — — 47 — — — 47 
Net income— — — — (79)— — (79)
Dividends paid on common stock ($0.56)— — — — (486)— — (486)
Dividends paid on preferred stock ($63.76)— — — — (33)— — (33)
Purchase of common stock(1,257,535)— — — — (12)— (12)
Other comprehensive income, net of tax— — — — — — 21 21 
Balance at December 31, 2023722,066,370$503 $$8,231 $443 $(218)$(599)$8,367 
Year Ended December 31, 2022
Balance at December 31, 2021465,015,643$503 $$6,126 $741 $(246)$(85)$7,044 
Issuance and exercise of FDIC Equity appreciation instrument214,990,316— 2,008 — — — 2,010 
Shares issued for restricted stock, net of forfeitures3,548,310— — (33)— 33 — — 
Compensation expense related to restricted stock awards— — — 29 — — — 29 
Net income— — — — 650 — — 650 
Dividends paid on common stock ($0.68)— — — — (317)— — (317)
Dividends paid on preferred stock ($63.76)— — — — (33)— — (33)
Purchase of common stock(2,336,935)— — — — (24)— (24)
Other comprehensive loss, net of tax— — — — — — (535)(535)
Balance at December 31, 2022681,217,334$503 $$8,130 $1,041 $(237)$(620)$8,824 
Year Ended December 31, 2021
Balance at December 31, 2020463,901,808$503 $$6,123 $494 $(258)$(25)$6,842 
Shares issued for restricted stock, net of forfeitures2,515,942 — — (28)— 28 — — 
Compensation expense related to restricted stock awards— — — 31 — — — 31 
Net income— — — — 596 — — 596 
Dividends paid on common stock ($0.68)— — — — (316)— — (316)
Dividends paid on preferred stock ($63.76)— — — — (33)— — (33)
Purchase of common stock(1,402,107)— — — — (16)— (16)
Other comprehensive loss, net of tax— — — — — — (60)(60)
Balance at December 31, 2021465,015,643 $503 $$6,126 $741 $(246)$(85)$7,044 

See accompanying notes to the consolidated financial statements.

83


NEW YORK COMMUNITY BANCORP, INC.

CONSOLIDATED STATEMENTS OF CASH FLOWS


Years Ended December 31,


(in millions)


2021


2020


2019


CASH FLOWS FROM OPERATING ACTIVITIES:


Net income


$

596


$

511


$

395


Adjustments to reconcile net income to net cash provided by operating activities:


Provision for loan losses


3


62


7


Depreciation


21


24


27


Amortization of discounts and premiums, net


(5

)


11


8


Net (gain) loss on securities


(2

)


(8

)

Net loss (gain) on sales of loans


(1

)


Net gain on sales of fixed assets


(8

)

Stock-based compensation


31


29


32


Deferred tax expense


(13

)


219


101


Changes in operating assets and liabilities:


(Increase) decrease in other assets(1)


(284

)


(411

)


(56

)

Increase (decrease) in other liabilities(2)


(6

)


9


11


Purchases of securities held for trading


(110

)


(15

)


(43

)

Proceeds from sales of securities held for trading


110


15


43


Origination of loans held for sale


(52

)


(119

)


Proceeds from sales of loans originated for sale


Net cash provided by operating activities


290


334


510


CASH FLOWS FROM INVESTING ACTIVITIES:


Proceeds from repayment of securities available for sale


1,728


2,062


1,962


Proceeds from sales of securities available for sale


484


361


Purchase of securities available for sale


(1,796

)


(2,514

)


(2,503

)

Redemption of Federal Home Loan Bank stock


92


173


136


Purchases of Federal Home Loan Bank stock


(112

)


(239

)


(139

)

Proceeds from (purchases of) bank-owned life insurance, net


12


12


(138

)

Proceeds from sales of loans


37


3


115


Purchases of loans


(161

)


(95

)


(864

)

Other changes in loans, net


(2,558

)


(912

)


(998

)

Dispositions (purchases) of premises and equipment, net


(4

)


1


9


Net cash used in investing activities


(2,762

)


(1,025

)


(2,059

)

CASH FLOWS FROM FINANCING ACTIVITIES:


Net increase in deposits


2,622


780


893


Net increase in short-term borrowed funds


950


1,150


1,100


Proceeds from long-term borrowed funds


2,072


6,925


4,786


Repayments of long-term borrowed funds


(2,544

)


(6,550

)


(5,538

)

Cash dividends paid on common stock


(316

)


(316

)


(317

)

Cash dividends paid on preferred stock


(33

)


(33

)


(33

)

Treasury stock repurchased


(50

)


(67

)

Payments relating to treasury shares received for restricted stock award tax payments


(16

)


(9

)


(8

)

Net cash provided by financing activities


2,735


1,897


816


Net increase (decrease) in cash, cash equivalents, and restricted cash


263


1,206


(733

)

Cash, cash equivalents, and restricted cash at beginning of year


1,948


742


1,475


Cash, cash equivalents, and restricted cash at end of year


$

2,211


$

1,948


$

742


Supplemental information:


Cash paid for interest


$

402


$

633


$

813


Cash paid for income taxes


471


118


76


Non-cash investing and financing activities:


Transfers to repossessed assets from loans


$

1


$

1


$

5


Operating lease liabilities arising from obtaining right-of-use assets as
   of January 1, 2019


324


Securitization of residential mortgage loans to mortgage-backed securities
   available for sale


161


53


94


Transfer of loans from held for investment to held for sale


52


115


Transfer of loans from held for sale to held for investment


94


Disposition of premises and equipment


1


Shares issued for restricted stock awards


28


22


17


(1)
81

Includes $18 million, $20 million, and $38 million of net amortization of operating lease right-of-use assets for the twelve months ended December 31, 2021, December 31, 2020, and December 31, 2019, respectively.
(2)New York Community Bancorp, Inc.
Consolidated Statements of Cash Flows
For the Years Ended December 31,
(in millions)202320222021
CASH FLOWS FROM OPERATING ACTIVITIES:
Net (loss) income$(79)$650 $596 
Adjustments to reconcile net income to net cash provided by operating activities:
Provision for loan losses833 133 
Amortization of intangibles126 — 
Depreciation39 18 21 
Amortization of discounts and premiums, net221 (37)(5)
Net loss on securities— 
Net gain on sales of loans(89)(5)(1)
Net gain on sales of fixed assets— (2)— 
Gain on business acquisition(2,131)(159)— 
Goodwill Impairment2,426 — — 
Stock-based compensation47 29 31 
Deferred tax expense(187)(3)(13)
Changes in operating assets and liabilities:
(Increase) decrease in other assets(721)348 (284)
Decrease in other liabilities(255)(100)(6)
Purchases of securities held for trading(10)(75)(110)
Proceeds from sales of securities held for trading10 75 110 
Change in loans held for sale, net32 147 (52)
Net cash provided by operating activities263 1,026 290 
CASH FLOWS FROM INVESTING ACTIVITIES:
Proceeds from repayment of securities available for sale1,402 732 1,728 
Proceeds from sales of securities available for sale including loans that have been securitized1,858 228 — 
Purchase of securities available for sale(3,046)(2,242)(1,796)
Redemption of Federal Home Loan Bank stock1,501 635 92 
Purchases of Federal Home Loan Bank and Federal Reserve Bank stock(1,626)(839)(112)
Proceeds from bank-owned life insurance, net30 16 12 
Proceeds from sales of loans— — 37 
Purchases of loans— (162)(161)
Net proceeds from sales of MSR's50 — — 
Other changes in loans, net(4,331)(5,019)(2,558)
Purchases of premises and equipment, net(66)(3)(4)
Cash acquired in business acquisition24,901 331 — 
Net cash provided by (used in) investing activities20,673 (6,323)(2,762)
CASH FLOWS FROM FINANCING ACTIVITIES:
Net (decrease) increase in deposits(10,738)7,662 2,622 
Net (decrease) increase in short-term borrowed funds(550)2,550 950 
Proceeds from long-term borrowed funds19,850 9,479 2,072 
Repayments of long-term borrowed funds(19,374)(13,960)(2,544)
Net disbursement of payments of loans serviced for others(66)(189)— 
Cash dividends paid on common stock(486)(317)(316)
Cash dividends paid on preferred stock(33)(33)(33)
Treasury stock repurchased— (7)— 
Payments relating to treasury shares received for restricted stock award tax payments(12)(17)(16)
Net cash (used in) provided by financing activities(11,409)5,168 2,735 
Net increase (decrease) in cash, cash equivalents, and restricted cash (1)
9,527 (129)263 
Cash, cash equivalents, and restricted cash at beginning of year (1)
2,082 2,211 1,948 
Cash, cash equivalents, and restricted cash at end of year (1)
$11,609 $2,082 $2,211 
Includes $
82

18 million, $20 million, and $38 million of net amortization of operating lease liability for the twelve months ended December 31, 2021, December 31, 2020, and December 31, 2019, respectively.

Supplemental information:
Cash paid for interest$2,290 $657 $402 
Cash paid for income taxes54 17 471 
Non-cash investing and financing activities:
Transfers to repossessed assets from loans$$— $
Securitization of loans to mortgage-backed securities available for sale222 162 161 
Transfer of loans from held for investment to held for sale163 — 52 
Transfer of loans from held for sale to held for investment— — 94 
MSRs resulting from sale or securitization of loans— 19 — 
Shares issued for restricted stock awards31 33 28 
Business Combinations:
Fair value of tangible assets acquired37,384 24,449 — 
Intangible assets464 292 — 
Mortgage servicing rights— 1,012 — 
Liabilities assumed35,632 23,584 — 
Common Stock issued in business combination— 2,010 — 
Issuance of FDIC Equity appreciation instrument85 — — 
(1) For further information on restricted cash, see Note 2 - Summary of Significant Accounting Policies

See accompanying notes to the consolidated financial statements.

83


84


Note 1 - Description of Business, Organization and Basis of Presentation

Organization
NEW YORK COMMUNITY BANCORP, INC.

NOTES TO THE CONSOLIDATED FINANCIAL STATEMENTS

NOTE 1: ORGANIZATION AND BASIS OF PRESENTATION

Organization

New York Community Bancorp, Inc. (on a stand-alone basis, the “Parent Company” or, collectively with its subsidiaries, the “Company” or "we") was organized under Delaware law on July 20, 1993 and is the holding company for New York CommunityFlagstar Bank N.A. (hereinafter referred to as the “Bank”). The Company is headquartered in Hicksville, New York with regional headquarters in Troy, Michigan.


Founded on April 14, 1859

The Company is subject to regulation, examination and formerly known as Queens County Savingssupervision by the Federal Reserve. The Bank is a National Association, subject to federal regulation and oversight by the Bank converted from a state-chartered mutual savings bank to the capital stock form of ownership onOCC.

On November 23, 1993, at which date the Company issued its initial offering of common stock (par value: $0.01$0.01 per share) at a price of $25.00$25.00 per share ($($0.93 per share on a split-adjusted basis, reflecting the impact of nine stock splits between 1994 and 2004)2004).

The Company has grown organically and through a series of accretive mergers and acquisitions, culminating in its acquisition of Flagstar Bancorp, Inc., which closed on December 1, 2022 and the Signature Transaction which closed on March 20, 2023.


Flagstar Bank, N.A. currently operates 237420 branches across twelve states, including strong footholds in the Northeast and Midwest and exposure to markets in the Southeast and West Coast. Flagstar Mortgage operates nationally through eighta wholesale network of approximately 3,600 third-party mortgage originators. Flagstar Bank N.A. also operates through nine local divisions, each with a history of service and strength: New York Community Bank, Queens County Savings Bank, Roslyn Savings Bank, Richmond County Savings Bank, Roosevelt Savings Bank, and Atlantic Bank in New York; Garden State Community Bank in New Jersey; Ohio Savings Bank in Ohio; and AmTrust Bank in Arizona and Florida.

Liquidity

On a consolidated basis, our funding primarily stems from a combination of the following sources: retail, institutional, and brokered deposits; borrowed funds, primarily in the form of wholesale borrowings; cash flows generated through the repayment and sale of loans; and cash flows generated through the repayment and sale of securities.
We manage our liquidity to ensure that our cash flows are sufficient to support our operations, to compensate for any temporary mismatches between sources and uses of funds caused by variable loan and deposit demand, and to ensure that sufficient funds are available to meet our financial obligations. See Note 22 - Subsequent Events for further information on our recent capital raise.

Basis of Presentation


The following is a description of the significant accounting and reporting policies that the Company and its subsidiaries follow in preparing and presenting their consolidated financial statements, which conform to U.S. generally accepted accounting principles (“GAAP”) and to general practices within the banking industry. The preparation of financial statements in conformity with GAAP requires the Company to make estimates and judgments that affect the reported amounts of assets and liabilities and the disclosure of contingent assets and liabilities at the date of the consolidated financial statements, and the reported amounts of revenues and expenses during the reporting period. Estimates that are used in connection with the determination of the allowance for loancredit losses, mortgage servicing rights, the Flagstar acquisition and lease losses.the Signature Transaction.

The accompanying consolidated financial statements include the accounts of the Company and other entities in which the Company has a controlling financial interest. All inter-company accounts and transactions are eliminated in consolidation. The Company currently has certain unconsolidated subsidiaries in the form of wholly-owned statutory business trusts, which were formed to issue guaranteed capital securities. See Note 9, “Borrowed12 - Borrowed Funds for additional information regarding these trusts.

When necessary, certain reclassifications have been made to prior-year amounts to conform to the current-year presentation.

Loans
Dollar amounts are presented

84


Effective January 1, 2023, the Company adopted the provisions of Accounting Standards Update (ASU) No. 2022-02, "Financial Instruments - Credit Losses (Topic 326): Troubled Debt Restructurings and Vintage Disclosures" (ASU 2022-02), which eliminated the accounting for troubled debt restructurings (TDRs) while expanding loan modification and vintage disclosure requirements. Under ASU 2022-02, the Corporation assesses all loan modifications to determine whether one is granted to a borrower experiencing financial difficulty, regardless of whether the modified loan terms include a concession. Modifications granted to borrowers experiencing financial difficulty may be in millions,the form of an interest rate reduction, an other-than-insignificant payment delay, a term extension, principal forgiveness or a combination thereof (collectively referred to as comparedTroubled Debt Modifications or TDMs).
Prior to prior year filings which were presented in thousandsthe adoption of dollars.

ASU 2022-02, the Company accounted for certain loan modifications and restructurings as TDRs. In general, a modification or restructuring of a loan constituted a TDR if the Company granted a concession to a borrower experiencing financial difficulty.

NOTE 2: SUMMARY OF SIGNIF

Adoption of New Accounting Standards

StandardDescriptionEffective Date
ASU 2022-02- Financial Instruments - Credit Losses (Topic 326): Troubled Debt Restructurings and Vintage Disclosures Issued March 2022ASU 2022-02 eliminates prior accounting guidance for TDRs, while enhancing disclosure requirements for certain loan refinancings and restructurings by creditors when a borrower is experiencing financial difficulty. The standard also requires that an entity disclose current-period gross charge-offs by year of origination for financing receivables and net investments in leases.
The Company adopted ASU 2022-02 effective January 1, 2023 using a modified retrospective transition approach for the amendments related to the recognition and measurement of TDRs. The impact of the adoption resulted in an immaterial change to the allowance for credit losses ("ACL"), thus no adjustment to retained earnings was recorded. Disclosures have been updated to reflect information on loan modifications given to borrowers experiencing financial difficulty as presented in Note 6. TDR disclosures are presented for comparative periods only and are not required to be updated in current periods. Additionally, the current year vintage disclosure included in Note 6 has been updated to reflect gross charge-offs by year of origination for the three months ended September 30, 2023.
ASU 2023-02 Investments - Equity Method and Joint Ventures (Topic 323): Accounting for Investments in Tax Credit Structures Using the Proportional Amortization Method Issued: March 2023ASU 2023-02 permits reporting entities to elect to account for their tax equity investments, regardless of the tax credit program from which the income tax credits are received, using the proportional amortization method if certain conditions are met.The Company adopted ASU 2023-02 effective January 1, 2023 and it did not have a significant impact on the Company's consolidated financial statements.
ICANT ACCOUNTING POLICIES
Note 2 - Summary of Significant Accounting Policies

Cash and Cash Equivalents and Restricted Cash


For cash flow reporting purposes, cash and cash equivalents include cash on hand, amounts due from banks, and money market investments, which include federal funds sold and reverse repurchase agreements.agreements, if any. At December 31, 20212023 and 2020,2022, the Company’s cash and cash equivalents totaled $2.2$11.5 billion and $1.9$2.0 billion, respectively. Included in cash and cash equivalents at those dates were $1.7$10.7 billion and $$837 million1.6, billion, respectively, of interest-bearing deposits in other financial institutions, primarily consisting of balances due from the FRB-NY. There were 0no reverse repurchase agreements outstanding as of December 31, 2023 and $793 million of reverse repurchase agreements were outstanding at December 31, 2022. There were no federal funds sold outstanding at December 31, 20212023 or December 31, 2020. There was $4062022. Restricted cash totaled $134 million of reverse repurchase agreements outstandingand $50 million at December 31, 2021. There was $193 million reverse repurchase agreements outstanding at2023 and December 31, 2020.2022, respectively and includes cash that the Bank pledges as maintenance margin on centrally cleared derivatives and is included in other assets on the Consolidated Statements of Condition.

85


Debt Securities and Equity Investments with Readily Determinable Fair Values


The securities portfolio primarily consists of mortgage-related securities and, to a lesser extent, debt and equity securities. Securities that are classified as “available for sale” are carried at their estimated fair value, with any unrealized gains or losses, net of taxes, reported as accumulated other comprehensive income or loss in stockholders’ equity. Securities that the Company has the intent and ability to hold to maturity are classified as “held to maturity” and carried at amortized cost.

The fair values of our securities—and particularly our fixed-rate securities—are affected by changes in market interest rates and credit spreads. In general, as interest rates rise and/or credit spreads widen, the fair value of fixed-rate securities will decline. As interest rates fall and/or credit spreads tighten, the fair value of fixed-rate securities will rise.

85


The Company evaluates available-for-sale debt securities in unrealized loss positions at least quarterly to determine if an allowance for credit losses is required. Based on an evaluation of available information about past events, current conditions, and reasonable and supportable forecasts that are relevant to collectability, the Company has concluded that it expects to receive all contractual cash flows from each security held in its available-for-sale securities portfolio.

The Company first assessassesses whether (i) it intends to sell, or (ii) it is more likely than not that the Company will be required to sell the security before recovery of its amortized cost basis. If either of these criteria is met, any previously recognized allowances are charged off and the security’s amortized cost basis is written down to fair value through income. If neither of the aforementioned criteria are met, the Company evaluates whether the decline in fair value has resulted from credit losses or other factors. If this assessment indicates that a credit loss exists, the present value of cash flows expected to be collected from the security are compared to the amortized cost basis of the security. If the present value of cash flows expected to be collected is less than the amortized cost basis, a credit loss exists and an allowance for credit losses is recorded for the credit loss, limited by the amount that the fair value is less than the amortized cost basis. Any impairment that has not been recorded through an allowance for credit losses is recognized in other comprehensive income.

Management has made the accounting policy election to exclude accrued interest receivable on available-for-sale securities from the estimate of credit losses. Available-for-sale debt securities are placed on non-accrual status when the Company no longer expects to receive all contractual amounts due, which is generally at 90 days past due. Accrued interest receivable is reversed against interest income when a security is placed on non-accrual status.

Equity investments with readily determinable fair values are measured at fair value with changes in fair value recognized in net income.

Premiums and discounts on securities are amortized to expense and accreted to income over the remaining period to contractual maturity using a method that approximates the interest method, and are adjusted for anticipated prepayments. Dividend and interest income are recognized when earned. The cost of securities sold is based on the specific identification method.


Federal Home Loan Bank Stock

As a member of the FHLB-NY, the Company is required to hold shares of FHLB-NY stock, which is carried at cost. In addition, in connection with the Flagstar acquisition, the Company also holds shares of FHLB-Indianapolis stock, which is carried at cost. The Company’s holding requirement varies based on certain factors, including its outstanding borrowings from the FHLB-NY.FHLB-NY and FHLB-Indianapolis.

The Company conducts a periodic review and evaluation of its FHLB-NY stock to determine if any impairment exists. The factors considered in this process include, among others, significant deterioration in FHLB-NY earnings performance, credit rating, or asset quality; significant adverse changes in the regulatory or economic environment; and other factors that could raise significant concerns about the creditworthiness and the ability of the FHLB-NY to continue as a going concern.

Loans Held-for-Sale

The Company classifies loans as LHFS when we originate or purchase loans that we intend to sell. We have elected the fair value option for the majority of our LHFS. The Company estimates the fair value of mortgage loans based on quoted market prices for securities backed by similar types of loans, where available, or by discounting estimated cash flows using observable inputs inclusive of interest rates, prepayment speeds and loss assumptions for similar collateral. Changes in fair value are recorded to other noninterest income on the Consolidated Statements of Income and Comprehensive Income. LHFS that are recorded at the lower of cost or fair value may be carried at fair value on a nonrecurring basis when the fair value is less than cost. For further information, see

86


LoansNote 18 - Fair Value Measures.


Loans that are transferred into the LHFS portfolio from the LHFI portfolio, due to a change in intent, are recorded at the lower of cost or fair value. Gains or losses recognized upon the sale of loans are determined using the specific identification method.


86


Loans Held for Investment

Loans and leases, net, are carried at unpaid principal balances, including unearned discounts, purchase accounting (i.e., acquisition-date fair value) adjustments, net deferred loan origination costs or fees, and the allowance for credit losses on loans.loans and leases.

The Company recognizes interest income on loans using the interest method over the life of the loan. Accordingly, the Company defers certain loan origination and commitment fees, and certain loan origination costs, and amortizes the net fee or cost as an adjustment to the loan yield over the term of the related loan. When a loan is sold or repaid, the remaining net unamortized fee or cost is recognized in interest income.

Prepayment income on loans is recorded in interest income and only when cash is received. Accordingly, there are no assumptions involved in the recognition of prepayment income.

Two factors are considered in determining the amount of prepayment income: the prepayment penalty percentage set forth in the loan documents, and the principal balance of the loan at the time of prepayment. The volume of loans prepaying may vary from one period to another, often in connection with actual or perceived changes in the direction of market interest rates. When interest rates are declining, rising precipitously, or perceived to be on the verge of rising, prepayment income may increase as more borrowers opt to refinance and lock in current rates prior to further increases taking place.

A loan generally is classified as a “non-accrual” loan when it is 90 days or more past due or when it is deemed to be impaired because the Company no longer expects to collect all amounts due according to the contractual terms of the loan agreement. When a loan is placed on non-accrual status, management ceases the accrual of interest owed, and previously accrued interest is charged against interest income. A loan is generally returned to accrual status when the loan is current and management has reasonable assurance that the loan will be fully collectible. Interest income on non-accrual loans is recorded when received in cash.

Loans with Government Guarantees

The Company originates government guaranteed loans which are pooled and sold as Ginnie Mae MBS. Pursuant to Ginnie Mae servicing guidelines, the Company has the unilateral right to repurchase loans securitized in Ginnie Mae pools that are due, but unpaid, for three consecutive months. As a result, once the delinquency criteria have been met, and regardless of whether the repurchase option has been exercised, the Company accounts for the loans as if they had been repurchased. The Company recognizes the loans and corresponding liability as loans with government guarantees and loans with government guarantees repurchase options, respectively, in the Consolidated Statements of Condition. If the loan is repurchased, the liability is cash settled and the loan with government guarantee remains. Once repurchased, the Company works to cure the outstanding loans such that they are re-eligible for sale or may begin foreclosure and recover losses through a claims process with the government agency, as an approved lender.

Allowance for Credit Losses on Loans and Leases

The Company’s January 1, 2020, adoption of ASU No. 2016-13, “Measurement of Credit Losses on Financial Instruments,” resulted in a significant change to our methodology for estimating the allowance since December 31, 2019. ASU No. 2016-13 replaces the incurred loss methodology with an expected loss methodology that is referred to as the CECL methodology. The measurement of expected credit losses under CECL is applicable to financial assets measured at amortized cost, including loan receivables. It also applies to off-balance sheet exposures not accounted for as insurance and net investments in leases accounted for under ASC Topic 842. At December 31, 2020, the allowance for loan and lease losses totaled $
194 million. On January 1, 2020, the Company adopted the CECL methodology under ASU Topic 326 and recognized an increase in the ACL on loans and leases of $2 million as a “Day 1” transition adjustment from changes in methodology, with a corresponding decrease in retained earnings. Separately, at December 31, 2019, the Company had an allowance for unfunded commitments of $1 million. Upon adoption, the Company recognized an increase in the allowance for unfunded commitments of $13 million as a “Day 1” transition adjustment with a corresponding decrease in retained earnings.

The allowance for credit losses on loans and leases is deducted from the amortized cost basis of a financial asset or a group of financial assets so that the balance sheet reflects the net amount the Company expects to collect. Amortized cost is the unpaid loan balance, net of deferred fees and expenses, and includes negative escrow. Subsequent changes (favorable and unfavorable) in expected credit losses are recognized immediately in net income as a credit loss expense or a reversal of credit loss expense. Management estimates the allowance by projecting and multiplying together the probability-of-default, loss-given-defaultloss- given-default and exposure-at-default depending on economic parameters for each month of the remaining contractual term. Economicterm, as well as credit ratings for certain loans within the commercial and industrial portfolio. The Company loss drivers for certain loans in the commercial and industrial portfolio are derived using leverages economic projections including property market and prepayment forecasts from established independent third parties, as well as credit ratings for certain loans within the commercial and industrial portfolio, to inform its loss drivers in the forecast. The Company estimates the exposure-at-default using prepayment models which forecasts prepayments over the life of the loans and leases. The economic forecast and the related economic parameters are developed using available information relating to past events, current conditions, multiple economic forecasts scenarios, including related weightings, over the reasonable and supportable forecast period and macroeconomic assumptions. The Company’seconomic forecast scenarios and related economic parameters are sourced from independent third parties. The economic forecast over a reasonable and supportable period ofis 24 months, and afterwards the Company reverts to a historical average loss rate on a straight linestraight-line basis over a 12 month12-month period. Historical credit loss experience over the historical loss observation period provides the basis for the estimation of expected credit losses, with qualitative factor adjustments made

87


for differences in current loan-specific risk characteristics such as differences in underwriting standards, portfolio mix, current collateral valuations, delinquency levels and terms, as well as for changes in environmental conditions, such as changes in legislation, regulation, policies, administrative practices or other relevant factors. Expected credit losses are estimated

87


over the contractual term of the loans, adjusted for forecasted prepayments when appropriate. The contractual term excludes potential extensions or renewals. The methodology used in the estimation of the allowance for credit losses on loansloan and leases, which is performed at least quarterly, is designed to be dynamic and responsive to changes in portfolio credit quality and forecasted economic conditions. Each quarter the Company reassesses the appropriateness of the reasonable and supportableeconomic forecasting period, the reversion period and historical mean at the portfolio segment level, considering any required adjustments for differences in underwriting standards, portfolio mix, and other relevant data shifts over time.


The allowance for credit losses on loans and leases is measured on a collective (pool) basis when similar risk characteristics exist. The portfolio segment represents the level at which a systematic methodology is applied to estimate credit losses. Management believes the products within each of the entity’s portfolio segments exhibit similar risk characteristics. Smaller pools of homogenous financing receivables with homogeneous risk characteristics were modeled using the methodology selected for the portfolio segment. The macroeconomic data used in the quantitative models are based on a reasonable and supportable forecast period of 24 months. The Company leverages economic projections including property market and prepayment forecasts from established independent third parties, as well as credit ratings for certain loans within the commercial and industrial portfolio, to inform its loss drivers in the forecast. Beyond this forecast period, the Company reverts to a historical average loss rate. This reversion to the historical average loss rate is performed on a straight-line basis over 12 months.

Loans that do not share risk characteristics are evaluated on an individual basis. These include loans that are in nonaccrual status with balances above management determined materiality thresholds depending on loan class and also loans that are designated as TDR or “reasonably expected TDR” (criticized, classified, or maturing loans that will have a modification processed within the next three months). In addition, all taxi medallion loans are individually evaluated. If a loan is determined to be collateral dependent, or meets the criteria to apply the collateral dependent practical expedient, expected credit losses are determined based on the fair value of the collateral at the reporting date, less costs to sell as appropriate.

The Company maintains an allowance for credit losses on off-balance sheet credit exposures. At December 31, 2023 and December 31, 2022, the allowance for credit losses on off-balance sheet exposures was $52 million and $23 million, respectively. The Company estimates expected credit losses over the contractual period in which the Company is exposed to credit risk via a contractual obligation to extend credit, unless that obligation is unconditionally cancellable by the Company. The allowance for credit losses on off-balance sheet credit exposures is adjusted as a provision for credit losses expense. The estimate includes consideration of the likelihood that funding will occur and an estimate of expected credit losses on commitments expected to be funded over their estimated life. The Company examined historical credit conversion factor (“CCF”)CCF trends to estimate utilization rates, and chose an appropriate mean CCF based on both management judgment and quantitative analysis. Quantitative analysis involved examination of CCFs over a range of fund-up windows (between 12 and 36 months) and comparison of the mean CCF for each fund-up window with management judgment determining whether the highest mean CCF across fund-up windows made business sense. The Company applies the same standards and estimated loss rates to the credit exposures as to the related class of loans.

Allowance for Loan

When applying this critical accounting estimate, we incorporate several inputs and Lease Losses - 2019

At December 31, 2019,judgments that may be influenced by changes period to period. These include, but are not limited to changes in the methodology used foreconomic environment and forecasts, changes in the computationcredit profile and characteristics of the loan portfolio, and changes in prepayment assumptions which will result in provisions to or recoveries from the balance of the allowance for loancredit losses.


While changes to the economic environment forecasts and lease losses the Bank segregated their loss factors (used for both criticized and non-criticized loans) into a component that was primarily based on historical loss rates and a component that was primarily based on other qualitative factors thatportfolio characteristics will change from period to period, portfolio prepayments are probable to affect loan collectability. In determiningan integral assumption in estimating the allowance for loancredit losses on our commercial real estate (multi-family, CRE and lease losses, management considers the Bank’s current business strategies and credit processes, including compliance with applicable regulatory guidelines and with guidelines approved by the Boards of Directors with regard to credit limitations, loan approvals, underwriting criteria, and loan workout procedures.

The allowance for loan and lease losses is established based on management’s evaluation of incurred losses in theADC) portfolio in accordance with GAAP, and is comprised of both specific valuation allowances and a general valuation allowance.

Specific valuation allowances are established based on management’s analyses of individual loans that are considered impaired. If a loan is deemed to be impaired, management measures the extent of the impairment and establishes a specific valuation allowance for that amount. A loan is classified as impaired when, based on current information and/or events, it is probable that the Company will be unable to collect all amounts due under the

88


contractual termswhich comprises 60 percent of the loan agreement. The Company appliesportfolio at December 31, 2023. Portfolio prepayments are subject to estimation uncertainty and changes in this classification as necessaryassumption could have a material impact to loans individually evaluated for impairment in our portfolios. Smaller-balance homogenous loansestimation process. Prepayment assumptions are sensitive to interest rates and loans carried at the lower of cost or fair value are evaluated for impairment on a collective, rather than individual, basis. Loans to certain borrowers who have experienced financial difficulty and for which theexisting loan terms have been modified, resulting in a concession, are considered TDRs and are classified as impaired.

The Company primarily measures impairment on an individual loan and determine the extentweighted average life of the commercial mortgage loan portfolio. Excluding other factors, as the weighted average life of the portfolio increases or decreases, so will the required amount of the allowance for credit losses on commercial real estate.


Goodwill

The Company evaluates goodwill for impairment at least annually or when triggering events are identified. We utilize a market approach to which a specific valuation allowance is necessary by comparing the loan’s outstanding balance to eitherdetermine the fair value of our single reporting unit, which considers how a market participant would view a control premium, complemented by an income approach if deemed necessary. The resulting value is then compared to our book value and any shortfalls would be recorded as an impairment.


88


As of December 31, 2023, the collateral, lessCompany identified a triggering event and applied a market approach using the estimated costend of day stock price, control premium for completed bank acquisitions, and an adjustment for Company-specific risk considerations based on subsequent confirming market evidence. This adjusted market capitalization was then compared to the carrying value to determine the extent of any shortfall which was calculated to be in excess of the goodwill balance. The Company’s assessment concluded that goodwill from historical transactions (2007 and prior) was fully impaired as of December 31, 2023, as confirmed by the Company’s current market capitalization. As a result, the Company recorded an impairment charge of the entire goodwill balance of $2.4 billion. Additional information on the methodologies and assumptions used in the goodwill impairment analysis can be found in Note 16 - Intangible Assets.

Mortgage Servicing Rights

The Company purchases and originates mortgage loans for sale to the secondary market and sell the loans on either a servicing-retained or servicing-released basis. If the present value of expected cash flows, discountedCompany retains the right to service the loan, an MSR is created at the loan’s effective interest rate. Generally, whentime of sale which is recorded at fair value. The Company uses an internal valuation model that utilizes an option-adjusted spread, constant prepayment speeds, costs to service and other assumptions to determine the fair value of the collateral, netMSRs.

Management obtains third-party valuations of the estimated costMSR portfolio on a quarterly basis from independent valuation services to sell, orassess the presentreasonableness of the fair value calculated by our internal valuation model. Changes in the fair value of the expected cash flows is less than the recorded investment in the loan, any shortfall is promptly charged off.

An allowance for unfunded commitments is maintained separate from the allowance for loan and lease losses and is included in Other liabilities inour MSRs are reported on the Consolidated Statements of Condition.

GoodwillIncome and Comprehensive Income in net return on mortgage servicing. For further information, see

The Company adopted, on a prospective basis, ASU No. 2017-04, Intangibles—Goodwill and Other (Topic 350): Simplifying the Test for Goodwill Impairment on January 1, 2020. The Company has significant intangible assets related to goodwill and as of December 31, 2021, the Company had goodwill of $2.4Note 9 - Mortgage Servicing Rights billion. In connection with its acquisitions, the assets acquired and liabilities assumed are recorded at their estimated fair values. Goodwill represents the excess of the purchase price of its acquisitions over the fair value of identifiable net assets acquired, including other identified intangible assets. The Company tests goodwill for impairment at the reporting unit level. The Company has identified 1Note 18 - Fair Value Measures reporting unit which is the same as its operating segment and reportable segment. If the Company changes its strategy or if market conditions shift, its judgments may change, which may result in adjustments to the recorded goodwill balance..

The Company performs its goodwill impairment test in the fourth quarter of each year, or more often if events or circumstances warrant. For annual goodwill impairment testing, the Company has the option to first perform a qualitative assessment to determine whether it is more likely than not that the fair value of a reporting unit is less than its carrying amount, including goodwill and other intangible assets. If the Company concludes that this is the case, it would compare the fair value the reporting unit with its carrying amount and recognize an impairment charge for the amount by which the carrying amount exceeds the reporting unit’s fair value. The loss recognized, however, would not exceed the total amount of goodwill allocated to that reporting unit. Additionally, the Company would consider income tax effects from any tax deductible goodwill on the carrying amount of the reporting unit when measuring the goodwill impairment loss, if applicable. As of December 31, 2021, the Company’s goodwill was 0t impaired.


Premises and Equipment, Net

Premises, furniture, fixtures, and equipment are carried at cost, less the accumulated depreciation computed on a straight-line basis over the estimated useful lives of the respective assets (generally 20 years for premises and three to ten years for furniture, fixtures, and equipment). Leasehold improvements are carried at cost less the accumulated amortization computed on a straight-line basis over the shorter of the related lease term or the estimated useful life of the improvement.

Depreciation is included in “Occupancy and equipment expense” in the Consolidated Statements of Income and Comprehensive Income, and amounted to $21$39 million, $24$18 million, and $27$21 million, respectively, in the years ended December 31, 2021, 2020,2023, 2022, and 2019.2021. Accumulated depreciation as of December 31, 2023 and December 31, 2022 was $526 million and $434 million. The estimated useful lives for the principal classes of assets are as follows:

Premises and EquipmentUseful Lives
Buildings30
Furniture, fixtures and equipment, and building improvements13.5
Leasehold improvements10
ATMs7


Bank-Owned Life Insurance

The Company has purchased life insurance policies on certain employees. These BOLI policies are recorded in the Consolidated Statements of Condition at their cash surrender value. Income from these policies and changes in the cash surrender value are recorded in “Non-interest income” in the Consolidated Statements of Income and Comprehensive Income. At December 31, 20212023 and 2020,2022, the Company’s investment in BOLI was $1.2$1.6 billion. The Company’s investment in BOLI generated income of $29$43 million, $32$32 million, and $28$29 million, respectively, during the years ended December 31, 2021, 2020,2023, 2022, and 2019.2021.

Variable Interest Entities

An entity that has a controlling financial interest in a VIE is referred to as the primary beneficiary and consolidates the VIE. An entity is deemed to have a controlling financial interest and is the primary beneficiary of a VIE if it has both the power to direct the activities of the VIE that most significantly impact the VIE’s economic performance and an obligation to absorb losses or the right to receive benefits that could potentially be significant to the VIE. For further information, see Note 10 - Variable Interest Entities.

89


Repossessed Assets and OREO


89


Repossessed assets consist of any property or other assets acquired through, or in lieu of, foreclosure are sold or rented, and are recorded at fair value, less the estimated selling costs, at the date of acquisition. Following foreclosure, management periodically performs a valuation of the asset, and the assets are carried at the lower of the carrying amount or fair value, less the estimated selling costs. Expenses and revenues from operations and changes in valuation, if any, are included in “General and administrative expense” in the Consolidated Statements of Income and Comprehensive Income. At December 31, 2021,2023, the Company had $3$5 million of OREO, $4 million of taxi medallions and $5 million of repossessed specialty equipment. At December 31, 2022, the Company had $8 million of OREO and $5$4 million of taxi medallions. At December 31, 2020,

Servicing Fee Income

Servicing fee income, late fees and ancillary fees received on loans for which the Company had $2 millionowns the MSR are included in net return on mortgage servicing rights on the Consolidated Statements of OREOIncome and $7 millionComprehensive Income. The fees are based on the outstanding principal and are recorded as income when earned. Subservicing fees, which are included in loan administration income on the Consolidated Statements of taxi medallions.Income and Comprehensive Income, are based on a contractual monthly amount per loan including late fees and other ancillary income.


Income Taxes

Income tax expense consists of income taxes that are currently payable and deferred income taxes. Deferred income tax expense is determined by recognizing deferred tax assets and liabilities for future tax consequences attributable to temporary differences between the financial statement carrying amounts of existing assets and liabilities and their respective tax bases. Deferred tax assets and liabilities are measured using enacted tax rates that are expected to apply to taxable income in years in which those temporary differences are expected to be recovered or settled. The Company assesses the deferred tax assets and establishes a valuation allowance when realization of a deferred asset is not considered to be “more likely than not.” The Company considers its expectation of future taxable income in evaluating the need for a valuation allowance.

The Company estimates income taxes payable based on the amount it expects to owe the various tax authorities (i.e., federal, state, and local). Income taxes represent the net estimated amount due to, or to be received from, such tax authorities. In estimating income taxes, management assesses the relative merits and risks of the appropriate tax treatment of transactions, taking into account statutory, judicial, and regulatory guidance in the context of the Company’s tax position. In this process, management also relies on tax opinions, recent audits, and historical experience. Although the Company uses the best available information to record income taxes, underlying estimates and assumptions can change over time as a result of unanticipated events or circumstances such as changes in tax laws and judicial guidance influencing its overall tax position.


Derivative Instruments and Hedging Activities

The Company records all derivatives on the balance sheet at fair value. The accounting for changes in the fair value of derivatives depends on the intended use of the derivative, whether the Company has elected to designate a derivative in a hedging relationship and apply hedge accounting and whether the hedging relationship has satisfied the criteria necessary to apply hedge accounting. Derivatives designated and qualifying as a hedge of the exposure to changes in the fair value of an asset, liability, or firm commitment attributable to a particular risk, such as interest rate risk, are considered fair value hedges. Derivatives designated and qualifying as a hedge of the exposure to variability in expected future cash flows, or other types of forecasted transactions, are considered cash flow hedges. Hedge accounting generally provides for the matching of the timing of gain or loss recognition on the hedging instrument with the recognition of the changes in the fair value of the hedged asset or liability that are attributable to the hedged risk in a fair value hedge or the earnings effect of the hedged forecasted transactions in a cash flow hedge. The Company may enter into derivative contracts that are intended to economically hedge certain of its risks, even though hedge accounting does not apply or the Company elects not to apply hedge accounting.

The Company utilizes derivative instruments to manage the fair value changes in our MSRs, interest rate lock commitments and LHFS portfolio which are exposed to price and interest rate risk; facilitate asset/liability management; minimize the variability of future cash flows on long-term debt; and to meet the needs of our customers. All derivatives are recognized on the Consolidated Statements of Condition as other assets and liabilities, as applicable, at their estimated fair value.

The Company uses interest rate swaps, swaptions, futures and forward loan sale commitments to mitigate the impact of fluctuations in interest rates and interest rate volatility on the fair value of the MSRs. Changes in their fair value are reflected in current period earnings under the net return on mortgage servicing asset. These derivatives are valued based on quoted prices for similar assets in an active market with inputs that are observable.

90


The Company also enters into various derivative agreements with customers and correspondents in the form of interest rate lock commitments and forward purchase contracts which are commitments to originate or purchase mortgage loans whereby the interest rate on the loan is determined prior to funding and the customers have locked into that interest rate. The derivatives are valued using internal models that utilize market interest rates and other unobservable inputs. Changes in the fair value of these commitments due to fluctuations in interest rates are economically hedged through the use of forward loan sale commitments of MBS. The gains and losses arising from this derivative activity are reflected in current period earnings under the net gain on loan sales.

To assist customers in meeting their needs to manage interest rate risk, the Company enters into interest rate swap derivative contracts. To economically hedge this risk, the Company enters into offsetting derivative contracts to effectively eliminate the interest rate risk associated with these contracts.

For additional information regarding the accounting for derivatives, see Note 15 - Derivative and Hedging Activities

and for additional information on recurring fair value disclosures, see Note 18 - Fair Value Measures.


Representation and Warranty Reserve

When the Company sells mortgage loans into the secondary mortgage market, it makes customary representations and warranties to the purchasers about various characteristics of each loan. Upon the sale of a loan, the Company recognizes a liability for that guarantee at its fair value as a reduction of our net gain on loan sales. Subsequent to the sale, the liability is re-measured at fair value on an ongoing basis based upon an estimate of probable future losses. An estimate of the fair value of the guarantee associated with the mortgage loans is recorded in other liabilities in the Consolidated Statements of Condition, and was $12 million and $10 million at December 31, 2023 and December 31, 2022, respectively.

Stock-Based Compensation

Under the New York Community Bancorp, Inc. 2020 Omnibus Incentive Plan (the “2020 Incentive Plan”), which was approved by the Company’s shareholders at its Annual Meeting on June 3, 2020, shares are available for grant as restricted stock or other forms of related rights. At December 31, 2021,2023, the Company had 8,548,78316,143,893 shares available for grant under the 2020 Incentive Plan. Compensation cost related to restricted stock grants is recognized on a straight-line basis over the vesting period. For a more detailed discussion of the Company’s stock-based compensation, see Note 15, “Stock-Related Benefit14 - Stock-Related Benefits Plans.

Retirement Plans


The Company’s pension benefit obligations and post-retirement health and welfare benefit obligations, and the related costs, are calculated using actuarial concepts in accordance with GAAP. The measurement of such obligations

90


and expenses requires that certain assumptions be made regarding several factors, most notably including the discount rate and the expected rate of return on plan assets. The Company evaluates these assumptions on an annual basis. Other factors considered by the Company in its evaluation include retirement patterns and mortality rates.


Under GAAP, actuarial gains and losses, prior service costs or credits, and any remaining transition assets or obligations that have not been recognized under previous accounting standards must be recognized in AOCL until they are amortized as a component of net periodic benefit cost.


Earnings per Common Share (Basic and Diluted)

Basic EPS is computed by dividing the net income available to common shareholders by the weighted average number of common shares outstanding during the period. Diluted EPS is computed using the same method as basic EPS, however, the computation reflects the potential dilution that would occur if outstanding in-the-money stock options were exercised and converted into common stock.

Unvested stock-based compensation awards containing non-forfeitable rights to dividends paid on the Company’s common stock are considered participating securities, and therefore are included in the two-class method for calculating EPS. Under the two-class method, all earnings (distributed and undistributed) are allocated to common shares and participating securities based on their respective rights to receive dividends on the common stock. The Company grants restricted stock to certain employees under its stock-based compensation plan. Recipients receive cash dividends during the vesting periods of

91


these awards, including on the unvested portion of such awards. Since these dividends are non-forfeitable, the unvested awards are considered participating securities and therefore have earnings allocated to them.

91


The following table presents the Company’s computation of basic and diluted earnings per common share:


For the Years Ended December 31,
(in millions, except share and per share amounts)202320222021
Net (loss) income available to common stockholders$(112)$617 $563 
Less: Dividends paid on and earnings allocated to participating securities(5)(8)(7)
(Loss) earnings applicable to common stock$(117)$609 $556 
Weighted average common shares outstanding713,643,550483,603,395463,865,661
(Loss) basic earnings per common share$(0.16)$1.26 $1.20 
(Loss) earnings applicable to common stock$(117)$609 $556 
Weighted average common shares outstanding713,643,550483,603,395463,865,661
Potential dilutive common shares— 1,530,950767,058
Total shares for diluted (loss) earnings per common share computation713,643,550 485,134,345 464,632,719 
Diluted (loss) earnings per common share and common share equivalents$(0.16)$1.26 $1.20 
Note 3 - Business Combinations

Signature Bridge Bank

On March 20, 2023, the Company’s wholly owned bank subsidiary, Flagstar Bank N.A. (the “Bank”), entered into a Purchase and Assumption Agreement (the “Agreement”) with the Federal Deposit Insurance Corporation (“FDIC”), as receiver (the "FDIC Receiver") of Signature Bridge Bank, N.A. (“Signature”) to acquire certain assets and assume certain liabilities of Signature (the “Signature Transaction”). Headquartered in New York, New York, Signature Bank was a full-service commercial bank that operated 29 branches in New York, seven branches in California, two branches in North Carolina, one branch in Connecticut, and one branch in Nevada. In connection with the Signature Transaction the Bank assumed all of Signature’s branches. The Bank acquired only certain parts of Signature it believes to be financially and strategically complementary that are intended to enhance the Company’s future growth.

Pursuant to the terms of the Agreement, the Company was not required to make a cash payment to the FDIC on March 20, 2023 as consideration for the acquired assets and assumed liabilities. As the Company and the FDIC remain engaged in ongoing discussions which may impact the assets and liabilities acquired or assumed by the Company in the Signature Transaction. Any items identified that affect the bargain gain are recorded in the period they are identified. The Company may be required to make a payment to the FDIC or the FDIC may be required to make a payment to the Company on the Settlement Date, which will be one year after March 20, 2023, or as agreed upon by the FDIC and the Company.

In addition, as part of the consideration for the Signature Transaction, the Company granted the FDIC equity appreciation rights in the common stock of the Company under an equity appreciation instrument (the "Equity Appreciation Instrument"). On March 31, 2023, the Company issued 39,032,006 shares of Company common stock to the FDIC pursuant to the Equity Appreciation Instrument. On May 19, 2023, the FDIC completed the secondary offering of those shares.

The Company has determined that the Signature Transaction constitutes a business combination as defined by ASC 805, Business Combinations ("ASC 805"). ASC 805 establishes principles and requirements as to how the acquirer of a business recognizes and measures in its financial statements the identifiable assets acquired, the liabilities assumed and any non-controlling interest in the acquiree. Accordingly, the assets acquired and liabilities assumed have been recorded based on their preliminary estimated fair values as of March 20, 2023, which have been adjusted through December 31, 2023 based on changes to those preliminary estimates.

Under the Agreement, the Company is expected to provide certain services to the FDIC to assist the FDIC in its administration of certain assets and liabilities which were not assumed by the Company and which remain under the control of the FDIC (the “Interim Servicing”). The Interim Servicing includes activities related to the servicing of loan portfolios not acquired on behalf of the FDIC for a period of up to one year from the date of the Signature Transaction unless such loans are sold or transferred at an earlier time by the FDIC or until cancelled by the FDIC upon 60-days’ notice. The Interim Servicing

92


may include other ancillary services requested by the FDIC to assist in their administration of the remaining assets and liabilities of Signature Bank. The FDIC will reimburse the Company for costs associated with the Interim Servicing based upon an agreed upon fee which approximates the cost to provide such services. As the FDIC intends to reimburse the Company for the costs to service the loans, neither a servicing asset nor servicing liability was recognized as part of the Signature Transaction.

The Company did not enter into a loss sharing arrangement with the FDIC in connection with the Signature Transaction.

As the Company finalizes its analysis of the assets acquired and liabilities assumed, there may be adjustments to the recorded carrying values. In many cases, the determination of the fair value of the assets acquired and liabilities assumed required management to make estimates about discount rates, future expected cash flows, market conditions and other future events that are highly subjective in nature and subject to change. While the Company believes that the information available on December 31, 2023, provided a reasonable basis for estimating fair value, the Company may obtain additional information and evidence during the measurement period that may result in changes to the estimated fair value amounts. Fair values subject to change include, but are not limited to, those related to loans and leases, certain deposits, intangibles, deferred tax assets and liabilities and certain other assets and other liabilities.

A summary of the preliminary net assets acquired and related estimated fair value adjustments resulting in the bargain purchase gain is as follows:

(in millions)March 20, 2023
(preliminary)
Net assets acquired before fair value adjustments$2,973 
  Fair value adjustments:
    Loans(727)
    Core deposit and other intangibles464 
    Certificates of deposit27 
    Other net assets and liabilities39 
    FDIC Equity Appreciation Instrument(85)
Deferred tax liability(690)
Bargain purchase gain on Signature Transaction, as initially reported2,001 
Measurement period adjustments, excluding taxes28 
Change in deferred tax liability102 
Bargain purchase gain on Signature Transaction, as adjusted$2,131 

In connection with the Signature Transaction, the Company recorded a bargain purchase gain, as adjusted, of approximately $2.1 billion during the year ended December 31, 2023, which is included in non-interest income in the Company’s Consolidated Statement of Income and Comprehensive Income.

The bargain purchase gain represents the excess of the estimated fair value of the assets acquired (including cash payments received from the FDIC) over the estimated fair value of the liabilities assumed and is influenced significantly by the FDIC-assisted transaction process. Under the FDIC-assisted transaction process, only certain assets and liabilities are transferred to the acquirer and, depending on the nature and amount of the acquirers bid, the FDIC may be required to make a cash payment to the Company and the Company may be required to make a cash payment to the FDIC.

The assets acquired and liabilities assumed and consideration paid in the Signature Transaction were initially recorded at their estimated fair values based on management’s best estimates using information available at the date of the Signature Transaction, and are subject to adjustment for up to one year after the closing date of the Signature Transaction. The Company and the FDIC are engaged in ongoing discussions and settlement payments have been made that have impacted certain assets acquired or certain liabilities assumed by the Company on March 20, 2023 and are included as measurement period adjustments in the table below.

93


(in millions)Preliminary as Initially ReportedMeasurement Period AdjustmentsPreliminary as Adjusted
Purchase Price consideration$85 $85 
Fair value of assets acquired:
Cash & cash equivalents25,043 (142)24,901 
Loans held for sale232 232 
Loans held for investment:
Commercial and industrial10,102 (214)9,888 
Commercial real estate1,942 (262)1,680 
Consumer and other174 (1)173 
Total loans held for investment12,218 (477)11,741 
CDI and other intangible assets464 — 464 
Other assets679 (169)510 
Total assets acquired38,636 (788)37,848 
Fair value of liabilities assumed:
Deposits33,568 (61)33,507 
Other liabilities2,982 (857)2,125 
Total liabilities assumed36,550 (918)35,632 
Fair value of net identifiable assets2,086 130 2,216 
Bargain purchase gain$2,001 $130 $2,131 

During the year ended December 31, 2023, the Company recorded preliminary measurement period adjustments to adjust the estimated fair value of loans and leases acquired and adjust other assets and accrued expenses and other liabilities for balances ultimately retained by the FDIC. Additionally, $449 million of loans were returned to the FDIC in accordance with the purchase and sale agreement. The Company also recognized a net change in the deferred tax liability due to the measurement period adjustments and the secondary offering of shares completed by the FDIC.

The Company incurred $223 million in acquisition costs related to the Signature Transaction primarily for legal, advisory, and other professional services. These costs are recorded within Merger-related and restructuring expenses on the Consolidated Statements of Income and Comprehensive Income.

Fair Value of Assets Acquired and Liabilities Assumed

Fair value is defined as the price that would be received to sell an asset or paid to transfer a liability in an orderly transaction between market participants at the measurement date, reflecting assumptions that a market participant would use when pricing an asset or liability. In some cases, the estimation of fair values requires management to make estimates about discount rates, future expected cash flows, market conditions, and other future events that are highly subjective in nature and are subject to change. Described below are the methods used to determine the fair values of the significant assets acquired and liabilities assumed in the Signature Transaction.

Cash and Cash Equivalents

The estimated fair value of cash and cash equivalents approximates their stated face amounts, as these financial instruments are either due on demand or have short-term maturities.
Loans and leases

The fair value for loans was based on a discounted cash flow methodology that considered credit loss expectations, market interest rates and other market factors such as liquidity from the perspective of a market participant. Loans were grouped together according to similar characteristics and were treated in the aggregate when applying various valuation techniques. The probability of default, loss given default and prepayment assumptions were the key factors driving credit losses which were embedded into the estimated cash flows. These assumptions were informed by internal data on loan characteristics, historical loss experience, and current and forecasted economic conditions. The interest and liquidity component of the estimate was determined by discounting interest and principal cash flows through the expected life of each loan. The discount rates used for loans are based on current market rates for new originations of comparable loans and include adjustments for liquidity. The

94


discount rates do not include a factor for credit losses as that has been included as a reduction to the estimated cash flows. Acquired loans were marked to fair value and adjusted for any PCD gross up as of the date of the Signature Transaction.

Deposit Liabilities

The fair value of deposit liabilities with no stated maturity (i.e., non-interest-bearing and interest-bearing checking accounts) is equal to the carrying amounts payable on demand. The fair value of certificates of deposit represents contractual cash flows, discounted using interest rates currently offered on deposits with similar characteristics and remaining maturities.

Core Deposit Intangible

Core deposit intangible (“CDI”) is a measure of the value of non-interest-bearing and interest-bearing checking accounts, savings accounts, and money market accounts that are acquired in a business combination. The fair value of the CDI was determined using a discounted cashflow methodology which considered discount rate, customer attrition rates, and other relevant market assumptions. This method estimated the fair value by discounting the present value of the expected cost savings attributable to the core deposit funding, relative to an alternative source of funding. The CDI relating to the Signature Transaction will be amortized over an estimated useful life of 10 years using the sum of years digits depreciation method. The Company evaluates such identifiable intangibles for impairment when an indication of impairment exists. CDI does not significantly impact our liquidity or capital ratios.

PCD loans

Purchased loans that reflect a more than insignificant deterioration of credit from origination are considered PCD. For PCD loans and leases, the initial estimate of expected credit losses is recognized in the allowance for credit losses (“ACL”) on the date of acquisition using the same methodology as other loans and leases held-for-investment. The following table provides a summary of loans and leases purchased as part of the Signature Transaction with credit deterioration and the associated credit loss reserve at acquisition:

(in millions)Total
Par value (UPB)$583 
ACL at acquisition(13)
Non-credit (discount)(76)
Fair value$494 

Unaudited Pro Forma Information – Signature Transaction

The Company’s operating results for the year ended December 31, 2023 include the operating results of the acquired assets and assumed liabilities of Signature subsequent to the acquisition on March 20, 2023. Due to the use of multiple systems and integration of the operating activities into those of the Company, historical reporting for the former Signature operations is impracticable and thus disclosures of the revenue from the assets acquired and income before income taxes is impracticable for the period subsequent to acquisition.

Signature was only in operation from March 12, 2023 to March 20, 2023 and does not have historical financial information on which we could base pro forma information. Additionally, we did not acquire all assets or assume all liabilities of Signature and the historical operations are not consistent with the transaction. Therefore, it is impracticable to provide pro forma information on revenues and earnings for the Signature Transaction in accordance with ASC 805-10-50-2.


95


Flagstar Bancorp, Inc.

On December 1, 2022, the Company closed the acquisition of Flagstar Bancorp, Inc. (“Flagstar”) in an all-stock transaction (“Flagstar Transaction”). Flagstar was a savings and loan holding company headquartered in Troy, MI.

Pursuant to the terms of the Merger Agreement, each share of Flagstar common stock was converted into 4.0151 shares of the Company’s common shares at the effective time of the merger. In addition, the Company received approval from the Office of the Comptroller of the Currency (the “OCC") to convert Flagstar Bank, FSB to a national bank to be known as Flagstar Bank, N.A., and to merge New York Community Bank into Flagstar Bank, N.A. with Flagstar Bank, N.A. being the surviving entity. Flagstar Bank, FSB, provided commercial, small business, and consumer banking services through 158 branches in Michigan, Indiana, California, Wisconsin, and Ohio. It also provided home loans through a wholesale network of brokers and correspondents in all 50 states. The acquisition of Flagstar added significant scale, geographic diversification, improved funding profile, and a broader product mix to the Company.

The acquisition of Flagstar has been accounted for as a business combination. The Company recorded the preliminary estimate of fair value of the assets acquired and liabilities assumed December 1, 2022, which was subject to adjustment for up to one year after December 1, 2022. As of December 31, 2023, the Company finalized its review of the assets acquired and liabilities assumed, and did not record any material adjustments.

The following table provides an allocation of consideration paid for the fair value of assets acquired and liabilities and equity assumed from Flagstar as of December 1, 2022.

(in millions)December 1, 2022
Purchase Price consideration$2,010 
Fair value of assets acquired:
Cash & cash equivalents331 
Securities2,695 
Loans held for sale1,257 
Loans held for investment:
One-to-four family first mortgage5,438 
Commercial and industrial3,891 
Commercial real estate6,523 
Consumer and other2,156 
Total loans held for investment18,008 
CDI and other intangible assets292 
Mortgage servicing rights1,012 
Other assets2,158 
Total assets acquired25,753 
Fair value of liabilities assumed:
Deposits15,995 
Borrowings6,700 
Other liabilities889 
Total liabilities assumed23,584 
Fair value of net identifiable assets2,169 
Bargain purchase gain$159 

In connection with the acquisition, the Company recorded a bargain purchase gain of approximately $159 million.

The Company incurred $99 million in acquisition costs related to the Flagstar Transaction primarily for legal, advisory, and other professional services. These costs are recorded within Merger-related and restructuring expenses on the Consolidated Statements of Income and Comprehensive Income.


96


Fair Value of Assets Acquired and Liabilities Assumed

Fair value is defined as the price that would be received to sell an asset or paid to transfer a liability in an orderly transaction between market participants at the measurement date, reflecting assumptions that a market participant would use when pricing an asset or liability. In some cases, the estimation of fair values requires management to make estimates about discount rates, future expected cash flows, market conditions, and other future events that are highly subjective in nature and are subject to change. Described below are the methods used to determine the fair values of the significant assets acquired and liabilities assumed in the Flagstar acquisition.

Cash and Cash Equivalents

The estimated fair value of cash and cash equivalents approximates their stated face amounts, as these financial instruments are either due on demand or have short-term maturities.

Investment Securities and Federal Home Loan Bank Stock

Quoted market prices for the securities acquired were used to determine their fair values. If quoted market prices were not available for a specific security, then quoted prices for similar securities in active markets were used to estimate the fair value. The fair value of FHLB-Indianapolis stock is equivalent to the redemption amount.

Loans

Fair values for loans were based on a discounted cash flow methodology that considered credit loss expectations, market interest rates and other market factors such as liquidity from the perspective of a market participant. Loans were grouped together according to similar characteristics and were treated in the aggregate when applying various valuation techniques. The probability of default, loss given default and prepayment assumptions were the key factors driving credit losses which were embedded into the estimated cash flows. These assumptions were informed by internal data on loan characteristics, historical loss experience, and current and forecasted economic conditions. The interest and liquidity component of the estimate was determined by discounting interest and principal cash flows through the expected life of each loan. The discount rates used for loans are based on current market rates for new originations of comparable loans and include adjustments for liquidity. The discount rates do not include a factor for credit losses as that has been included as a reduction to the estimated cash flows. Acquired loans were marked to fair value and adjusted for any PCD gross up as of the merger date.

Core Deposit Intangible

CDI is a measure of the value of non-interest-bearing and interest-bearing checking accounts, savings accounts, and money market accounts that are acquired in a business combination. The fair value of the CDI stemming from any given business combination is based on the present value of the expected cost savings attributable to the core deposit funding, relative to an alternative source of funding. The CDI relating to the Flagstar acquisition will be amortized over an estimated useful life of 10 years using the sum of years digits depreciation method. The Company evaluates such identifiable intangibles for impairment when an indication of impairment exists.

Deposit Liabilities

The fair value of deposit liabilities with no stated maturity (i.e., non-interest-bearing and interest-bearing checking accounts) is equal to the carrying amounts payable on demand. The fair value of certificates of deposit represents contractual cash flows, discounted using interest rates currently offered on deposits with similar characteristics and remaining maturities.

Borrowed Funds

The estimated fair value of borrowed funds is based on bid quotations received from securities dealers or the discounted value of contractual cash flows with interest rates currently in effect for borrowed funds with similar maturities.


97


PCD loans

Purchased loans that reflect a more than insignificant deterioration of credit from origination are considered PCD. For PCD loans and leases, the initial estimate of expected credit losses is recognized in the ACL on the date of acquisition using the same methodology as other loans and leases held-for-investment. The following table provides a summary of loans and leases purchased as part of the Flagstar acquisition with credit deterioration and the associated credit loss reserve at acquisition:

(in millions)Total
Par value (UPB)$1,950 
ACL at acquisition(51)
Non-credit (discount)(33)
Fair value$1,866 

Unaudited Pro Forma Information

The Company’s results of operations for the year-ended December 31, 2022 and 2023 include the results of operations of Flagstar on and after December 1, 2022. Results for periods prior to December 1, 2022, do not include the results of operations of Flagstar.

The following pro forma financial information presents the unaudited consolidated results of operations of the Company and Flagstar as if the Flagstar Transaction occurred as of January 1, 2021 with pro forma adjustments. The pro forma adjustments give effect to any change in interest income due to the accretion of the net discounts from the fair value adjustments of acquired loans, any change in interest expense due to the estimated net premium from the fair value adjustments to acquired time deposits and other debt, and the amortization of intangibles had the deposits been acquired as of January 1, 2021. The pro forma amounts for the years ended December 31, 2022 and 2021 2020,do not reflect the anticipated cost savings that have not yet been realized. Acquisition costs incurred by the Company during the years ended December 31, 2022 and 2019:


Years Ended December 31,


(in millions, except share and per share amounts)


2021


2020


2019


Net income available to common stockholders


$

563


$

478


$

362


Less: Dividends paid on and earnings allocated
   to participating securities


(7

)


(6

)


(4

)

Earnings applicable to common stock


$

556


$

472


$

358


Weighted average common shares outstanding


463,865,661


462,605,341


465,380,010


Basic earnings per common share


$

1.20


$

1.02


$

0.77


Earnings applicable to common stock


$

556


$

472


$

358


Weighted average common shares outstanding


463,865,661


462,605,341


465,380,010


Potential dilutive common shares


767,058


676,061


283,322


Total shares for diluted earnings per common
   share computation


464,632,719


463,281,402


465,663,332


Diluted earnings per common share and
   common share equivalents


$

1.20


$

1.02


$

0.77


Impact of Recent Accounting Pronouncements

Recently Adopted Accounting Standards

The Company adopted ASU No. 2020-042021 are reflected in the first quarter of 2020 upon issuance.pro forma amounts. The amendments provide optional expedients and exceptions for certain contracts, hedging relationships, and other transactions that reference LIBOR or another reference rate expected to be discontinued because of rate reform. The guidance is effective frompro forma information does not necessarily reflect the date of issuance until December 31, 2022. If certain criteria are met, the amendments allow exceptions to the designation criteria of the hedging relationship and the assessment of hedge effectiveness during the transition period. To date, the guidance has not had a material impact on the Company’s Consolidated Statements of Condition, results of operations or cash flows. that would have occurred had the Flagstar Transaction occurred at the beginning of 2021.


For the Years Ended December 31,
(unaudited)
(in millions)20222021
Net interest income$2,278 $2,208 
Non-interest income650 1,105 
Net income804 1,207 
Net income available to common stockholders$771 $1,174 

98


Note 4 - Accumulated Other Comprehensive Income

The Company will continue to assessfollowing table sets forth the impact as the reference rate transition occurs. components in accumulated other comprehensive income:

92


NOTE 3: RECLASSIFICATIONS OUT OF ACCUMULATED OTHER COMPREHENSIVE LOSS

(in millions)

For the Twelve MonthsYear Ended December 31, 2021

Details about
Accumulated Other Comprehensive Loss

Amount
Reclassified
out of
Accumulated
Other
Comprehensive
Loss
(1)

Affected Line Item in the
Consolidated Statements of Income
and Comprehensive Income

Unrealized gains on available-for-sale
securities:

$


0

Net gain on securities

— 

0

Income tax expense

$


0

Net gain on securities, net of tax

Unrealized gains on cash flow hedges:

$

65 

(25

)

Interest expense

(17)

7

Income tax benefit

$

48 

(18

)

Net gain on cash flow hedges, net of tax

Amortization of defined benefit pension
plan items:

Past service liability

$


0

Included in the computation of net periodic credit(2)

Actuarial losses

(7)

(7

)

Included in the computation of net periodic cost(2)

(7)

(7

)

Total before tax

2

Income tax benefit

$

(6)

(5

)

Amortization of defined benefit pension plan items, net of tax

Total reclassifications for the period

$

42 

(23

)

(1)
Amounts in parentheses indicate expense items.
(2)
See Note 14, “Employee20 - Employee Benefits for additional information.


99


Note 5 - Investment Securities

93


NOTE 4: SECURITIES

The following tables summarize the Company’s portfolio of debt securities available for sale and equity investments with readily determinable fair values at December 31, 2021 and 2020:


December 31, 2021


(in millions)


Amortized
Cost


Gross
Unrealized
Gain


Gross
Unrealized
Loss


Fair
Value


Debt securities available-for-sale


Mortgage-Related Debt Securities:


GSE certificates


$


1,102


$


20


$


15


$


1,107


GSE CMOs


1,717


11


45


1,683


Total mortgage-related debt securities


$


2,819


$


31


$


60


$


2,790


Other Debt Securities:


U. S. Treasury obligations


$


45


$


$


$


45


GSE debentures


1,524


1


45


1,480


Asset-backed securities (1)


479


3


3


479


Municipal bonds


25


25


Corporate bonds


821


18


1


838


Foreign notes


25


1


26


Capital trust notes


96


8


7


97


Total other debt securities


$


3,015


$


31


$


56


$


2,990


Total debt securities available for sale


$


5,834


$


62


$


116


$


5,780


Equity securities:


Preferred stock


Mutual funds


16


16


Total equity securities


$


16


$


$


$


16


Total securities (2)


$


5,850


$


62


$


116


$


5,796


values:
December 31, 2023
(in millions)Amortized CostGross Unrealized GainGross Unrealized LossFair Value
Debt securities available-for-sale
Mortgage-Related Debt Securities:
GSE certificates$1,366 $$146 $1,221 
GSE CMOs5,495 48 381 5,162 
Private Label CMOs174 180 
Total mortgage-related debt securities$7,035 $56 $528 $6,563 
Other Debt Securities:
U. S. Treasury obligations$198 $— $— $198 
GSE debentures1,899 291 1,609 
Asset-backed securities (1)
307 — 302 
Municipal bonds— — 
Corporate bonds365 — 22 343 
Foreign notes35 — 34 
Capital trust notes97 12 90 
Total other debt securities$2,907 $$331 $2,582 
Total debt securities available for sale$9,942 $62 $859 $9,145 
Equity securities:
Mutual funds$16 $— $$14 
Total equity securities$16 $— $$14 
Total securities (2)
$9,958 $62 $861 $9,159 
(1)
The underlying assets of the asset-backed securities are substantially guaranteed by the U.S. Government..
(2)
Excludes accrued interest receivable of $15 million included in other assets in the Consolidated Statements of Condition.

94


December 31, 2020


(in millions)


Amortized
Cost


Gross
Unrealized
Gain


Gross
Unrealized
Loss


Fair
Value


Debt securities available-for-sale


Mortgage-Related Debt Securities:


GSE certificates


$

1,155


$

54


$


$

1,209


GSE CMOs


1,787


45


3


1,829


Total mortgage-related debt securities


$

2,942


$

99


$

3


$

3,038


Other Debt Securities:


U. S. Treasury obligations


$

65


$


$


$

65


GSE debentures


1,158


4


4


1,158


Asset-backed securities (1)


530


2


6


526


Municipal bonds


26


1


27


Corporate bonds


871


18


6


883


Foreign Notes


25


1


26


     'Capital trust notes


96


6


11


91


Total other debt securities


$

2,771


$

32


$

27


$

2,776


Total other securities available for sale


$

5,713


$

131


$

30


$

5,814


Equity securities:


Preferred stock


15


$

15


Mutual funds


16


16


Total equity securities


$

31


$


$


$

31


Total securities (2)


$

5,744


$

131


$

30


$

5,845


(1)
The underlying assets of the asset-backed securities are substantially guaranteed by the U.S. Government.
(2)
Excludes accrued interest receivable of $$38 million included in other assets in the Consolidated Statements of Condition.


100


December 31, 2022
(in millions)Amortized CostGross Unrealized GainGross Unrealized LossFair Value
Debt securities available-for-sale
Mortgage-Related Debt Securities:
GSE certificates$1,457 $— $160 $1,297 
GSE CMOs3,600 300 3,301 
Private Label CMOs185 — 191 
Total mortgage-related debt securities$5,242 $$460 $4,789 
Other Debt Securities:
U. S. Treasury obligations$1,491 $— $$1,487 
GSE debentures1,749 — 351 1,398 
Asset-backed securities (1)
375 — 14 361 
Municipal bonds30 — — 30 
Corporate bonds913 30 885 
Foreign Notes20 — — 20 
Capital trust notes97 12 90 
Total other debt securities$4,675 $$411 $4,271 
Total other securities available for sale$9,917 $14 $871 $9,060 
Equity securities:
Mutual funds$16 $— $$14 
Total equity securities$16 $— $$14 
Total securities (2)
$9,933 $14 $873 $9,074 
(1)15The underlying assets of the asset-backed securities are substantially guaranteed by the U.S. Government.
(2)Excludes accrued interest receivable of $31 million included in other assets in the Consolidated Statements of Condition.

At December 31, 20212023, the Company had $861 million and 2020, respectively,$329 million of FHLB-NY stock, at cost and FHLB-Indianapolis stock, at cost, respectively. At December 31, 2022, the Company had $734$762 million and $714$329 million of FHLB-NY stock, at cost.cost and FHLB-Indianapolis stock, at cost, respectively. The Company maintains an investment in FHLB-NY stock partly in conjunction with its membership in the FHLB and partly related to its access to the FHLB funding it utilizes. In addition, at December 31, 2023 and December 31, 2022, the Company had $203 million and $176 million of Federal Reserve Bank stock, respectively.

The following table summarizes the gross proceeds, gross realized gains, and gross realized losses from the sale of available-for-sale securities during the years ended December 31, 2021, 2020, and 2019:years-ended:


December 31,
( in millions)202320222021
Gross proceeds$1,637 $228 $— 
Gross realized gains— — 
Gross realized losses(3)— — 


December 31,


(in millions)


2021


2020


2019


Gross proceeds


$


$

484


$

361


Gross realized gains


2


5


Gross realized losses


1


Net

There were no unrealized gainslosses on equity securities recognized in earnings for the years ended December 31, 2023. For the years ended December 31, 2022 and 2021 2020, and 2019there were $0 million, $1unrealized losses on equity securities of $2 million and $zero recognized in earnings, respectively.

2
million, respectively.


101


The following table summarizes, by contractual maturity, the amortized cost of securities at December 31, 2021:2023:

95


Mortgage-
Related
Securities


U.S.
Government
and GSE
Obligations


State,
County,
and
Municipal


Other
Debt
Securities
(1)


Fair
Value


(dollars in millions)


Available-for-Sale Debt
   Securities:


Due within one year


$


27


$


45


$


$


5


$


77


Due from one to five years


142


22


408


594


Due from five to ten years


271


423


19


512


1,226


Due after ten years


2,379


1,079


6


496


3,883


Total debt securities available
   for sale


$


2,819


$


1,569


$


25


$


1,421


$


5,780


Mortgage- Related SecuritiesU.S. Government and GSE ObligationsState, County, and Municipal
Other Debt Securities (1)
Fair Value
( in millions)
Available-for-Sale Debt Securities:
Due within one year$— $448 $— $— $446 
Due from one to five years178 50 — 353 560 
Due from five to ten years316 1,502 105 1,597 
Due after ten years6,541 96 — 345 6,542 
Total debt securities available for sale$7,035 $2,096 $$803 $9,145 
(1)
Includes corporate bonds, capital trust notes, foreign notes, and asset-backed securities.


The following table presents securities having a continuous unrealized loss position for less than twelve months and for twelve months or longer as of December 31, 2021:2023:

Less than Twelve MonthsTwelve Months or LongerTotal
(in millions)Fair ValueUnrealized LossFair ValueUnrealized LossFair ValueUnrealized Loss
Temporarily Impaired Securities:
U. S. Treasury obligations$— $— $— $— $— $— 
U.S. Government agency and GSE obligations181 1,362 290 1,543 291 
GSE certificates312 843 141 1,155 146 
Private Label CMOs29 — — 29 
GSE CMOs1,835 77 1,312 304 3,147 381 
Asset-backed securities— — 228 228 
Municipal bonds— — — — 
Corporate bonds— — 343 22 343 22 
Foreign notes— — 
Capital trust notes— — 81 12 81 12 
Equity securities— — 14 14 
Total temporarily impaired securities$2,357 $84 $4,198 $777 $6,555 $861 


Less than Twelve Months


Twelve Months or Longer


Total


(in millions)


Fair Value


Unrealized
Loss


Fair Value


Unrealized
Loss


Fair Value


Unrealized
Loss


Temporarily Impaired Securities:


U. S. Treasury obligations


$


45


$


$


$


$


45


$


U.S. Government agency and GSE obligations


317


7


185


8


502


15


GSE certificates


846


28


293


17


1,139


45


GSE CMOs


491


8


926


37


1,417


45


Asset-backed securities


130


1


135


2


265


3


Municipal bonds


8


8


Corporate bonds


99


1


99


1


Foreign notes


5


5


Capital trust notes


37


7


37


7


Equity securities


12


12


Total temporarily impaired
   securities


$


1,846


$


44


$


1,683


$


72


$


3,529


$


116


The following table presents securities having a continuous unrealized loss position for less than twelve months and for twelve months or longer as of December 31, 2020:2022:

Less than Twelve MonthsTwelve Months or LongerTotal
(in millions)Fair ValueUnrealized LossFair ValueUnrealized LossFair ValueUnrealized Loss
Temporarily Impaired Securities:
U. S. Treasury obligations$1,487 $$— $— $1,487 $
U.S. Government agency and GSE obligations243 1,156 346 1,399 351 
GSE certificates871 46 420 114 1,291 160 
GSE CMOs2,219 36 925 264 3,144 300 
Asset-backed securities61 262 12 323 14 
Municipal bonds— — 16 — 
Corporate bonds698 27 97 795 30 
Foreign notes20 — — — 20 — 
Capital trust notes46 34 10 80 12 
Equity securities— 10 14 
Total temporarily impaired securities$5,658 $122 $2,911 $751 $8,569 $873 


Less than Twelve Months


Twelve Months or Longer


Total


(in millions)


Fair Value


Unrealized
Loss


Fair Value


Unrealized
Loss


Fair Value


Unrealized
Loss


Temporarily Impaired Securities:


U. S. Treasury obligations


$


$


$


$


$


$


U.S. Government agency and GSE obligations


59


59


GSE certificates


442


3


74


516


3


GSE CMOs


522


4


522


4


Asset-backed securities


364


6


364


6


Municipal bonds


9


9


Corporate bonds


72


3


246


3


318


6


Foreign notes


Capital trust notes


33


11


33


11


Equity securities


Total temporarily impaired
   securities


$

1,095


$

10


$

726


$

20


$

1,821


$

30


102


96


The investment securities designated as having a continuous loss position for twelve months or more at December 31, 20212023 consisted of 4eighty-four agency collateralized mortgage obligations, 5six capital trusts notes, 4note, eight asset-backed securities, 2twelve corporate bonds, 20thirty-seven US government agency bonds, 21three hundred two mortgage-backed securities, one mutual fund, one foreign debt, and 1one municipal bond.bond . The investment securities designated as having a continuous loss position for twelve months or more at December 31, 20202022 consisted of 4twenty three agency collateralized mortgage obligations, 5five capital trusts notes, 7seven asset-backed securities, 3two corporate bonds, thirty three US government agency bonds, one hundred thirty three mortgage-backed securities, one mutual fund, and 1one municipal bond.

The Company evaluates available-for-sale debt securities in unrealized loss positions at least quarterly to determine if an allowance for credit losses is required. Based on an evaluation of available information about past events, current conditions, and reasonable and supportable forecasts that are relevant to collectability, the Company has concluded that it expects to receive all contractual cash flows from each security held in its available-for-sale securities portfolio.

We firstalso assess whether (i) we intend to sell, or (ii) it is more likely than not that we will be required to sell the security before recovery of its amortized cost basis. If either of these criteria is met, any previously recognized allowances are charged off and the security’s amortized cost basis is written down to fair value through income. If neither of the aforementioned criteria are met, we evaluate whether the decline in fair value has resulted from credit losses or other factors. If this assessment indicates that a credit loss exists, the present value of cash flows expected to be collected from the security are compared to the amortized cost basis of the security. If the present value of cash flows expected to be collected is less than the amortized cost basis, a credit loss exists and an allowance for credit losses is recorded for the credit loss, limited by the amount that the fair value is less than the amortized cost basis. Any impairment that has not been recorded through an allowance for credit losses is recognized in other comprehensive income.


In the first quarter of 2023, the Company held a $20 million corporate bond in Signature Bank which was placed into receivership on March 12, 2023. We have taken a $20 million provision for credit loss and charged-off this security during the three months ended March 31, 2023.

None of the remaining unrealized losses identified as of December 31, 20212023 or December 31, 20202022 relates to the marketability of the securities or the issuers’ ability to honor redemption obligations. Rather, the unrealized losses relate to changes in interest rates relative to when the investment securities were purchased, and do not indicate credit-related impairment. Management based this conclusion on an analysis of each issuer including a detailed credit assessment of each issuer. The Company does not intend to sell, and it is not more likely than not that the Company will be required to sell the positions before the recovery of their amortized cost basis, which may be at maturity. As such, no allowance for credit losses was recordedremains with respect to debt securities as of or during the twelve months ended December 31, 2021.2023.

103


Note 6 - Loans and Leases
Management has made
The Company classifies loans that we have the accounting policy electionintent and ability to exclude accrued interest receivable on available-for-sale securities fromhold for the estimate of credit losses. Available-for-sale debt securities are placed on non-accrual status when we no longer expect to receive all contractual amounts due,foreseeable future or until maturity as LHFI. We report LHFI loans at their amortized cost, which is generally at 90 days past due. Accrued interest receivable is reversed against interest income when a security is placed on non-accrual status.

97


NOTE 5: LOANS AND LEASES

The following table sets forthincludes the composition of the loanoutstanding principal balance adjusted for any unamortized premiums, discounts, deferred fees and lease portfolio at the dates indicated:unamortized fair value adjustments for acquired loans:


December 31, 2021


December 31, 2020


(dollars in millions)

Amount


Percent of
Loans
Held for
Investment


Amount


Percent of
Loans
Held for
Investment


Loans and Leases Held for Investment:


Mortgage Loans:


Multi-family

$

34,603


75.75


%

$

32,236


75.28


%

Commercial real estate


6,698


14.66


6,836


15.96


One-to-four family


160


0.35


236


0.55


Acquisition, development, and construction


209


0.46


90


0.21


Total mortgage loans held for investment (1)


41,670


91.22


39,398


92.00


Other Loans:


Commercial and industrial


2,236


4.89


1,682


3.93


Lease financing, net of unearned income
   of $
95 and $116 respectively


1,770


3.88


1,735


4.05


Total commercial and industrial loans (2)


4,006


8.77


3,417


7.98


Other


5


0.01


7


0.02


Total other loans held for investment


4,011


8.78


3,424


8.00


Total loans and leases held for investment (1)

$

45,681


100.00


%

$

42,822


100.00


%

Net deferred loan origination costs


57


62


Allowance for loan and lease losses


(199

)


(194

)


Total loans and leases held for investment, net

$

45,539


$

42,690


Loans held for sale (3)


117


Total loans and leases, net

$

45,539


$

42,807


December 31, 2023December 31, 2022
(dollars in millions)AmountPercent of
Loans
Held for
Investment
AmountPercent of
Loans
Held for
Investment
Loans and Leases Held for Investment:
Mortgage Loans:
Multi-family$37,265 44.0 %$38,130 55.3 %
Commercial real estate10,47012.4 %8,52612.4 %
One-to-four family first mortgage6,0617.2 %5,8218.4 %
Acquisition, development, and construction2,9123.4 %1,9962.8 %
Total mortgage loans held for investment (1)
$56,708 67.0 %$54,473 78.9 %
Other Loans:
Commercial and industrial22,06526.1 %10,59715.4 %
Lease financing, net of unearned income of $258 and $85, respectively3,1893.8 %1,6792.4 %
Total commercial and industrial loans (2)
25,25429.9 %12,27617.8 %
Other2,6573.1 %2,2523.3 %
Total other loans held for investment27,91133.0 %14,52821.1 %
Total loans and leases held for investment (1)
$84,619 100.0 %$69,001 100.0 %
Allowance for credit losses on loans and leases(992)(393)
Total loans and leases held for investment, net83,62768,608
Loans held for sale1,182 1,115
Total loans and leases, net$84,809 $69,723 
(1)
Excludes accrued interest receivable of $199$423 million and $219$292 million at December 31, 20212023 and December 31, 2020,2022, respectively, which is included in other assets in the Consolidated Statements of Condition.
(2)
Includes specialty finance loans and leases of $3.5$5.2 billion and $3.0$4.4 billion respectively, at December 31, 20212023 and December 31, 2020, and other C&I loans of $527 million and $393 million, respectively, at December 31, 2021 and December 31, 2020.
(3)
Includes deferred loan origination fees of $2 million.2022, respectively.

Loans and Leaseswith Government Guarantees

Loans and Leases Held for Investment

The majority of the loans the Company originates for investment

Substantially all LGG are multi-family loans, most of which are collateralized by non-luxury apartment buildings in New York City with rent-regulated units and below-market rents. In addition, the Company originates CRE loans, most of which are collateralized by income-producing properties such as office buildings, retail centers, mixed-use buildings, and multi-tenanted light industrial properties that are located in New York City and on Long Island.

To a lesser extent, the Company also originates ADC loans for investment. One-to-four family loans held for investment were originated through the Company’s former mortgage banking operation and primarily consisted of jumbo prime adjustable rate mortgages made to borrowers with a solid credit history.

ADC loans are primarily originated for multi-family and residential tract projects in New York City and on Long Island. C&I loans consist of asset-based loans, equipment loans and leases, and dealer floor-plan loans (together, specialty finance loans and leases) that generally are made to large corporate obligors, many of which are publicly traded, carry investment gradeinsured or near-investment grade ratings, and participate in stable industries nationwide; and other C&I loans that primarily are made to small and mid-size businesses in Metro New York. Other C&I loans are typically made for working capital, business expansion, and the purchase of machinery and equipment.

98


The repayment of multi-family and CRE loans generally depends on the income producedguaranteed by the underlying properties which, in turn, depends on their successful operation and management. To mitigateFHA or the potential for credit losses, the Company underwrites itsU.S. Department of Veterans Affairs. Nonperforming repurchased loans in accordance with credit standards it considers to be prudent, looking firstthis portfolio earn interest at the consistency of the cash flows being produced by the underlying property. In addition, multi-family buildings, CRE properties, and ADC projects are inspected as a prerequisite to approval, and independent appraisers, whose appraisals are carefully reviewed by the Company’s in-house appraisers, perform appraisals on the collateral properties. In many cases, a second independent appraisal review is performed.

To further manage its credit risk, the Company’s lending policies limit the amount of credit granted to any one borrower and typically require conservative debt service coverage ratios and loan-to-value ratios. Nonetheless, the ability of the Company’s borrowers to repay these loans may be impacted by adverse conditions in the local real estate market, the local economy and changes in applicable laws and regulations. Accordingly, there can be no assurance that its underwriting policies will protect the Company from credit-related losses or delinquencies.

ADC loans typically involve a higher degree of credit risk than loans secured by improved or owner-occupied real estate. Accordingly, borrowers are required to provide a guarantee of repayment and completion, and loan proceeds are disbursed as construction progresses, as certified by in-house inspectors or third-party engineers. The Company seeks to minimize the credit risk on ADC loans by maintaining conservative lending policies and rigorous underwriting standards. However, if the estimate of value proves to be inaccurate, the cost of completion is greater than expected, or the length of time to complete and/or sell or lease the collateral property is greater than anticipated, the property could have a value upon completion that is insufficient to assure full repayment of the loan. This could have a material adverse effect on the quality of the ADC loan portfolio, and could result in losses or delinquencies. In addition, the Company utilizes the same stringent appraisal process for ADC loans as it does for its multi-family and CRE loans.

To minimize the risk involved in specialty finance lending and leasing, the Company participates in syndicated loans that are brought to it, and equipment loans and leases that are assigned to it, by a select group of nationally recognized sources who have had long-term relationships with its experienced lending officers. Each of these credits is secured with a perfected first security interest or outright ownership in the underlying collateral, and structured as senior debt or as a non-cancelable lease. To further minimize the risk involved in specialty finance lending and leasing, each transaction is re-underwritten. In addition, outside counsel is retained to conduct a further review of the underlying documentation.

To minimize the risks involved in other C&I lending, the Company underwrites such loans on the basis of the cash flows produced by the business; requires that such loans be collateralized by various business assets, including inventory, equipment, and accounts receivable, among others; and typically requires personal guarantees. However, the capacity of a borrower to repay such a C&I loan is substantially dependent on the degree to which the business is successful. In addition, the collateral underlying such loans may depreciate over time, may not be conducive to appraisal, or may fluctuate in value,rate based upon the results of operations of10-year U.S. Treasury note rate from the business.

Includedtime the underlying loan becomes 60 days delinquent until the loan is conveyed to HUD (if foreclosure timelines are met), which is not paid by the FHA until claimed. The Bank has a unilateral option to repurchase loans sold to GNMA if the loan is due, but unpaid, for three consecutive months (typically referred to as 90 days past due) and can recover losses through a claims process from the guarantor. These loans are recorded in loans held for investment and the liability to repurchase the loans is recorded in other liabilities on the Consolidated Statements of Condition. Certain loans within our portfolio may be subject to indemnifications and insurance limits which expose us to limited credit risk. As of December 31, 2023, LGG loans totaled $541 million and the repurchase liability was $456 million.


Repossessed assets and the associated net claims related to government guaranteed loans are recorded in other assets and was $14 million at December 31, 2021 and2023.

Loans Held-for-Sale

Loans held-for-sale at December 31, 2020, were loans of $62023 totaled $1.2 billion, up from $1.1 billion at December 31, 2022. The Signature Transaction contributed $360 million and $38 million, respectively, to officers, directors, and their related interests and parties. There were noin Small Business Administration ("SBA") loans to principal shareholders atthis increase. We classify loans as held for sale when we originate or purchase loans that date.we intend to sell. We have elected the fair value option for nearly all of this portfolio, except the SBA loans. We estimate the fair value of mortgage loans based on quoted market prices for securities backed by similar types of loans, where available, or by discounting estimated cash flows using observable inputs inclusive of interest rates, prepayment speeds and loss assumptions for similar collateral.

104


Asset Quality

All asset quality information excludes LGG that are insured by U.S government agencies.
A loan generally is classified as a non-accrual loan when it is 90 days or more past due or when it is deemed to be impaired because the Company no longer expects to collect all amounts due according to the contractual terms of the loan agreement. When a loan is placed on non-accrual status, management ceases the accrual of interest owed, and previously accrued interest is charged against interest income. A loan is generally returned to accrual status when the loan is current and management has reasonable assurance that the loan will be fully collectible. Interest income on non-accrual loans is recorded when received in cash. At December 31, 20212023 and December 31, 2020, all of our non-performing2022 we had no loans that were non-accrual loans.nonperforming and still accruing.

99


The following table presents information regarding the quality of the Company’s loans held for investment at December 31, 2021:

(in millions)


Loans
 30-89
Days
Past Due


Non-
Accrual
Loans


Loans 90
Days or
More
Delinquent
and Still
Accruing
Interest


Total
Past Due
Loans


Current
Loans


Total
Loans
Receivable


Multi-family


$

57


$

10


$


$

67


$

34,536


$

34,603


Commercial real estate


2


16


18


6,680


6,698


One-to-four family


8


1


9


151


160


Acquisition, development, and
   construction


209


209


Commercial and industrial(1) (2)


6


6


4,000


4,006


Other


5


5


Total


$

67


$

33


$


$

100


$

45,581


$

45,681


2023:
(in millions)Loans 30-89 Days Past DueNon- Accrual LoansTotal Past Due Loans
Current Loans (2)
Total Loans Receivable
Multi-family$121 $138 $259 $37,006 $37,265 
Commercial real estate28 128 156 10,314 10,470 
One-to-four family first mortgage40 95 135 5,926 6,061 
Acquisition, development, and construction2,908 2,912 
Commercial and industrial(1)
37 43 80 25,174 25,254 
Other22 22 44 2,613 2,657 
Total$250 $428 $678 $83,941 $84,619 
(1)
Includes $6 million of taxi medallion-related loans that were 90 days or more past due. There were 0 taxi medallion-related loans that were 30 to 89 days past due.
(2)
Includes lease financing receivables, allreceivables.
(2)Includes $207 million multi-family loans from one borrower that had a payment in the process of which were current.collection as of December 31, 2023 and subsequently settled on January 2, 2024.

The following table presents information regarding the quality of the Company’s loans held for investment at December 31, 2020:2022:

(in millions)


Loans
 30-89
Days
Past Due


Non-
Accrual
Loans


Loans 90
Days or
More
Delinquent
and Still
Accruing
Interest


Total
Past Due
Loans


Current
Loans


Total
Loans
Receivable


Multi-family


$

4


$

4


$


$

8


$

32,228


$

32,236


Commercial real estate


10


12


22


6,814


6,836


One-to-four family


2


2


4


232


236


Acquisition, development, and
   construction


90


90


Commercial and industrial(1) (2)


20


20


3,397


3,417


Other


7


7


Total


$

16


$

38


$


$

54


$

42,768


$

42,822


(in millions)Loans 30-89 Days Past DueNon- Accrual LoansTotal Past Due LoansCurrent LoansTotal Loans Receivable
Multi-family$34 $13 $47 $38,083 $38,130 
Commercial real estate20 22 8,504 8,526 
One-to-four family first mortgage21 92 113 5,708 5,821 
Acquisition, development, and construction— — — 1,996 1,996 
Commercial and industrial(1)
12,271 12,276 
Other11 13 24 2,228 2,252 
Total$70 $141 $211 $68,790 $69,001 
(1)
Includes $19 million of taxi medallion-related loans that were 90 days or more past due. There were 0 taxi medallion-related loans that were 30 to 89 days past due.
(2)
Includes lease financing receivables, all of which were current.

100


The following table summarizes the Company’s portfolio of loans held for investment by credit quality indicator at December 31, 2021:


Mortgage Loans


Other Loans


(in millions)


Multi-
Family


Commercial
Real Estate


One-to-
Four
Family


Acquisition,
Development,
and
Construction


Total
Mortgage
Loans


Commercial
and
Industrial
(1)


Other


Total
Other
Loans


Credit Quality Indicator:


Pass


$

33,011


$

5,874


$

137


$

204


$

39,226


$

3,959


$

5


$

3,964


Special mention


981


643


14


5


1,643


2


2


Substandard


611


181


9


801


45


��

45


Doubtful


Total


$

34,603


$

6,698


$

160


$

209


$

41,670


$

4,006


$

5


$

4,011


2023:
(1)
Mortgage LoansOther Loans
(in millions)Multi- FamilyCommercial Real EstateOne-to- Four FamilyAcquisition, Development, and ConstructionTotal Mortgage LoansCommercial and IndustrialOtherTotal Other Loans
Credit Quality Indicator:
Pass$34,170 $8,734 $5,328 $2,825 $51,057 $24,683 $2,634 $27,317 
Special mention768 367 — 57 1,192 335 — 335 
Substandard2,327 1,369 733 30 4,459 236 23 259 
Doubtful— — — — — — — — 
Total$37,265 $10,470 $6,061 $2,912 $56,708 $25,254 $2,657 $27,911 
Includes lease financing receivables, all of which were classified as Pass.

105


The following table summarizes the Company’s portfolio of loans held for investment by credit quality indicator at December 31, 2020:


Mortgage Loans


Other Loans


(in millions)


Multi-
Family


Commercial
Real Estate


One-to-
Four
Family


Acquisition,
Development,
and
Construction


Total
Mortgage
Loans


Commercial
and
Industrial
(1)


Other


Total
Other
Loans


Credit Quality Indicator:


Pass


$

31,220


$

5,884


$

222


$

68


$

37,394


$

3,388


$

7


$

3,395


Special mention


567


637


12


22


1,238


3


3


Substandard


449


315


2


766


26


26


Doubtful


Total


$

32,236


$

6,836


$

236


$

90


$

39,398


$

3,417


$

7


$

3,424


2022:
(1)
Mortgage LoansOther Loans
(in millions)Multi- FamilyCommercial Real EstateOne-to- Four FamilyAcquisition, Development, and ConstructionTotal Mortgage LoansCommercial and IndustrialOtherTotal Other Loans
Credit Quality Indicator:
Pass$36,622 $7,871 $5,710 $1,992 $52,195 $12,208 $2,238 $14,446 
Special mention864 230 1,106 18 — 18 
Substandard644 425 103 — 1,172 50 14 64 
Total$38,130 $8,526 $5,821 $1,996 $54,473 $12,276 $2,252 $14,528 
Includes lease financing receivables, all of which were classified as Pass.

The preceding classifications are the most current ones available and generally have been updated within the last twelve months. In addition, they follow regulatory guidelines and can generally be described as follows: pass loans are of satisfactory quality; special mention loans have potential weaknesses that deserve management’s close attention; substandard loans are inadequately protected by the current net worth and paying capacity of the borrower or of the collateral pledged (these loans have a well-defined weakness and there is a possibility that the Company will sustain some loss); and doubtful loans, based on existing circumstances, have weaknesses that make collection or liquidation in full highly questionable and improbable. In addition, one-to-four family loans are classified based on the duration of the delinquency.

101


The following table presents, by credit quality indicator, loan class, and year of origination, the amortized cost basis of the Company’s loans and leases as of December 31, 2021.2023:

Vintage Year
(in millions)20232022202120202019Prior To 2019Revolving LoansRevolving Loans Converted to Term LoansTotal
Pass$2,532 $13,295 $10,308 $8,438 $4,725 $9,670 $1,981 $108 $51,057 
Special Mention— 217 69 407 144 341 14 — 1,192 
Substandard45 98 258 336 809 2,910 — 4,459 
Doubtful— — — — — — — — — 
Total mortgage loans$2,577 $13,610 $10,635 $9,181 $5,678 $12,921 $1,995 $111 $56,708 
Current-period gross write-offs— (112)— — (2)(64)— — (178)
Pass(1)
$9,709 $3,598 $1,936 $1,141 $911 $941 $8,757 $324 $27,317 
Special Mention182 17 18 102 — 335 
Substandard10 39 45 28 40 40 46 11 259 
Doubtful— — — — — — — — — 
Total other loans$9,720 $3,819 $1,998 $1,178 $957 $999 $8,905 $335 $27,911 
Current-period gross write-offs$(2)$(10)$(5)$(8)$(2)$(18)$— $— $(45)
Total$12,297 $17,429 $— $12,633 $10,359 $6,635 $13,920 $10,900 $446 $84,619 


Vintage Year


(in millions)
 Risk Rating Group


2021


2020


2019


2018


2017


Prior To
2017


Revolving
Loans


Total


Pass


$

9,363


$

9,223


$

5,623


$

4,700


$

3,320


$

7,006


$

17


$

39,252


Special Mention


128


221


346


123


825


1


1,644


Substandard


23


108


145


93


432


801


Total mortgage loans


$

9,363


$

9,374


$

5,952


$

5,191


$

3,536


$

8,263


$

18


$

41,697


Pass


916


670


533


87


152


167


1,469


3,994


Special Mention


2


2


Substandard


2


2


1


1


13


26


45


Total other loans


916


672


535


88


153


180


1,497


4,041


Total


$

10,279


$

10,046


$

6,487


$

5,279


$

3,689


$

8,443


$

1,515


$

45,738


When management determines that foreclosure is probable, for loans that are individually evaluated the expected credit losses are based on the fair value of the collateral adjusted for selling costs. When the borrower is experiencing financial difficulty at the reporting date and repayment is expected to be provided substantially through the operation or sale of the collateral, the collateral-dependent practical expedient has been elected and expected credit losses are based on the fair value of the collateral at the reporting date, adjusted for selling costs as appropriate. For CRE loans, collateral properties include office buildings, warehouse/distribution buildings, shopping centers, apartment buildings, residential and commercial tract development. The primary source of repayment on these loans is expected to come from the sale, permanent financing or lease of the real property collateral. CRE loans are impacted by fluctuations in collateral values, as well as the ability of the borrower to obtain permanent financing.

106


The following table summarizes the extent to which collateral secures the Company’s collateral-dependent loans held for investment by collateral type as of December 31, 2021:2023:

Collateral Type
(in millions)Real PropertyOther
Multi-family$253 $— 
Commercial real estate256 — 
One-to-four family first mortgage105 — 
Commercial and industrial— 120 
Total collateral-dependent loans held for investment$614 $120 


Collateral Type


(in millions)


Real
Property


Other


Multi-family


$

9


$


Commercial real estate


30


One-to-four family


Acquisition, development, and construction


Commercial and industrial


6


Other


Total collateral-dependent loans held for investment


39


6


Other collateral type consists of taxi medallions, cash, accounts receivable and inventory.

There were no significant changes in the extent to which collateral secures the Company’s collateral-dependent financial assets during the twelve monthsyear ended December 31, 2021.2023.

At December 31, 20212023 and December 31, 2020,2022, the Company had0 $81 million and $121 million of residential mortgage loans in the process of foreclosure.foreclosure, respectively.

Included in loans held for investment at December 31, 2023 and December 31, 2022, were loans of $9 million and $101 million, respectively, to officers, directors, and their related interests and parties. There were no loans to principal shareholders at that date.

Modifications to Borrowers Experiencing Financial Difficulty


Effective January 1, 2023, the Company adopted ASU 2022-02- Financial Instruments - Credit Losses (Topic 326): Troubled Debt Restructurings and Vintage Disclosures. For additional information on the adoption, refer to Note 1 - Description of Business, Organization and Basis of Presentation.

When borrowers are experiencing financial difficulty, the Company may make certain loan modifications as part of loss mitigation strategies to maximize expected payment. Modifications in the form of principal forgiveness, an interest rate reduction, or an other-than-insignificant payment delay or a term extension that have occurred in the current reporting period to a borrower experiencing financial difficulty are disclosed along with the financial impact of the modifications.

The interest incomefollowing table summarizes the amortized cost basis of loans modified during the reporting period to borrowers experiencing financial difficulty, disaggregated by class of financing receivable and type of modification:

Amortized Cost
(dollars in millions)Interest Rate ReductionTerm ExtensionCombination - Interest Rate Reduction & Term ExtensionTotalPercent of Total Loan class
Year Ended December 31, 2023
Multi-family$122 $— $— $122 1.17 %
Commercial real estate102 — 103 0.98 %
One-to-four family first mortgage14 0.23 %
Commercial and Industrial— 19 21 0.08 %
Other Consumer$— $— $0.08 %
Total$227 $25 $10 $262 


107


The following table describes the financial effect of the modification made to borrowers experiencing financial difficulty:

Interest Rate ReductionTerm Extension
Weighted-average contractual interest rate
FromToWeighted-average Term (in years)
Year Ended December 31, 2023
Multi-family7.45 %6.02 %
Commercial real estate8.83 %4.56 %
One-to-four family first mortgage6.08 %4.79 %
Commercial and industrial8.44 %8.08 %0.58
Other Consumer9.09 %4.82 %

As of December 31, 2023, there were $4 million one-to-four family first mortgages that wouldwere modified for borrowers experiencing financial difficulty that received term extension and subsequently defaulted during the period and $4 million one-to-four family first mortgages that were combination modifications and subsequently defaulted during the period.

The performance of loans made to borrowers experiencing financial difficulty in which modifications were made is closely monitored to understand the effectiveness of modification efforts. Loans are considered to be in payment default at 90 or more days past due. The following table depicts the performance of loans that have been recorded undermodified during the original terms of non-accrual loans at the respective year-ends, and the interest income actually recorded on these loans in the respective years, is summarized below:reporting period:

December 31, 2023
(dollars in millions)Current30 - 89 Past Due90+ Past DueTotal
Commercial real estate— — 
One-to-four family first mortgage3811
Commercial and industrial39113
Other Consumer112
Total$$10 $$27 


December 31,


(in millions)


2021


2020


2019


Interest income that would have been recorded


$

3


$

5


$

5


Interest income actually recorded


(1

)


(1

)


(3

)

Interest income foregone


$

2


$

4


$

2


102


Troubled Debt Restructurings Prior to Adoption of ASU 2022-02

The

Prior to the adoption of ASU 2022-02, the Company is required to accountaccounted for certain loan modifications and restructurings as TDRs. In general, a modification or restructuring of a loan constitutesconstituted a TDR if the Company grantsgranted a concession to a borrower experiencing financial difficulty. A loan modified as a TDR was generally is placed on non-accrual status until the Company determinesdetermined that future collection of principal and interest is reasonably assured, which requires, among other things, that the borrower demonstrate performance according to the restructured terms for a period of at least six consecutive months. In determining the Company’s allowance for credit losses on loans and leases, reasonably expected TDRs were individually evaluated and consist of criticized, classified, or maturing loans that will have a modification processed within the next three months.

In an effort to proactively manage delinquent loans, the Company has selectively extended to certain borrowers concessions such as rate reductions, extension of maturity dates, and forbearance agreements. As of December 31, 2021,2022, loans on which concessions were made with respect to rate reductions and/or extension of maturity dates amounted to $$44 million.

29 million.

The CARES Act was enacted on March 27, 2020. Under the CARES Act, the Company made the election to deem that loan modifications do not result in TDRs if they are (1) related to the novel coronavirus disease (“COVID-19”); (2) executed on a loan that was not more than 30 days past due as of December 31, 2019; and (3) executed between March 1, 2020, and the earlier of (A) 60 days after the date of termination of the National Emergency or (B) December 31, 2020. This includes short-term (e.g., up to six months) modifications such as payment deferrals, fee waivers, extensions of repayment terms, or delays in payment that are insignificant. Borrowers considered current are those that are less than 30 days past due on their contractual payments at the time a modification program is implemented.

The following table presents information regarding the Company’sCompany's TDRs as of December 31, 2021 and 2020:


December 31, 2021


December 31, 2020


(in millions)


Accruing


Non-
Accrual


Total


Accruing


Non-
Accrual


Total


Loan Category:


Multi-family


$


$


7


$


7


$


$


$


Commercial real estate


16


16


15


15


One-to-four family


Acquisition, development, and
   construction


Commercial and industrial (1)


6


6


19


19


Total


$


16


$


13


$


29


$


15


$


19


$


34


2022:
(1)
December 31, 2022
(dollars in millions)AccruingNon- AccrualTotal
Loan Category:
Multi-family$— $$
Commercial real estate161935
Includes $
108

6 million and $18 million of taxi medallion-related loans at December 31, 2021 and 2020, respectively.
Commercial and industrial33
Total$16 $28 $44 

The eligibility of a borrower for work-out concessions of any nature depends upon the facts and circumstances of each loan, which may change from period to period, and involves judgment by Company personnel regarding the likelihood that the concession will result in the maximum recovery for the Company.

103


The financial effects of the Company’s TDRs for the twelve months ended December 31, 2021, 2020 and 20192022 are summarized as follows:


Weighted Average Interest Rate
(dollars in millions)Number of LoansPre- Modification Recorded InvestmentPost- Modification Recorded InvestmentPre- ModificationPost- ModificationCharge- off AmountCapitalized Interest
Loan Category:
Commercial real estate2$22 $19 6.00 %4.02 %$$— 


For the Twelve Months Ended December 31, 2021


Weighted Average
Interest Rate


(dollars in millions)


Number
of Loans


Pre-
Modification
Recorded
Investment


Post-
Modification
Recorded
Investment


Pre-
Modification


Post-
Modification


Charge-
off
Amount


Capitalized
Interest


Loan Category:


Commercial real estate


2


$

4


$

4


6.00


%

3.55

%

$


$


Multi-family


1


8


8


3.13


3.25


Total


3


$

12


$

12


$


$


For the Twelve Months Ended December 31, 2020


Weighted Average
Interest Rate


(dollars in millions)


Number
of Loans


Pre-
Modification
Recorded
Investment


Post-
Modification
Recorded
Investment


Pre-
Modification


Post-
Modification


Charge-
off
Amount


Capitalized
Interest


Loan Category:


Commercial real estate


1


$

15


$

15


8.00

%

3.50

%

$


$


Commercial and industrial


42


9


8


2.36


2.23


1


Total


43


$

24


$

23


$

1


$


For the Twelve Months Ended December 31, 2019


Weighted Average
Interest Rate


(dollars in millions)


Number
of Loans


Pre-
Modification
Recorded
Investment


Post-
Modification
Recorded
Investment


Pre-
Modification


Post-
Modification


Charge-
off
Amount


Capitalized
Interest


Loan Category:


One-to-four family


1


$


$


5.50


%


5.50


%

$


$


Commercial and industrial


72


35


31


4.31


4.37


4


Total


73


$

35


$

31


$

4


$


At December 31, 2021, 0 loans have been modified as TDR's that were in payment default during the twelve months ended at that date. December 31, 2020, C&I loans totaling $3 million that had been modified as a TDR during the twelve months ended at that date were in payment default. At December 31, 2019, C&I loans in the amount of $1 million that had been modified as a TDR during the twelve months ended at that date was in prepayment default.

The Company does not consider a payment to be in default when the loan is in forbearance, or otherwise granted a delay of payment, when the agreement to forebear or allow a delay of payment is part of a modification.

Subsequent to the modification, the loan is not considered to be in default until payment is contractually past due in accordance with the modified terms. However, the Company does consider a loan with multiple modifications or forbearance periods to be in default, and would also consider a loan to be in default if the borrower were in bankruptcy or if the loan were partially charged off subsequent to modification.

104


NOTE 6: ALLOWANCE FOR CREDIT LOSSES ON LOANS AND LEASES

Note 7 - Allowance for Credit Losses on Loans and Leases


Allowance for Credit Losses on Loans and Leases

The following table summarizes activity in the allowance for loan and leasecredit losses for the periods indicated:

For the Years Ended December 31,
20232022
(in millions)MortgageOtherTotalMortgageOtherTotal
Balance, beginning of period$290 $103 $393 $178 $21 $199 
Adjustment for Purchased PCD Loans1313213051
Charge-offs(178)(45)(223)(5)(2)(7)
Recoveries15154711
Provision for (recovery of) credit losses on loans and leases6441507949247139
Balance, end of period$756 $236 $992 $290 $103 $393 


Twelve Months Ended December 31,


2021


2020


(in millions)


Mortgage


Other


Total


Mortgage


Other


Total


Balance, beginning of period


$

176


$

18


$

194


$

123


$

25


$

148


Impact of CECL adoption


2


2


Adjusted balance, beginning of period


176


18


194


123


27


150


Charge-offs


(6

)


(7

)


(13

)


(2

)


(20

)


(22

)

Recoveries


2


13


15


1


2


3


Provision for (recovery of) credit
   losses on loans and leases


6


(3

)


3


54


9


63


Balance, end of period


$

178


$

21


$

199


$

176


$

18


$

194


At

As of December 31, 2021,2023, the allowance for credit losses on loans and leases totaled $199$992 million, up $5$599 million compared to December 31, 2020, driven by a provision for credit losses of $3 million coupled with net recoveries of $2 million during the year 2021.

At December 31, 2021 and 2020, the allowance for unfunded commitments totaled $12 million.

For the year ended December 31, 20212022. The increase in the allowance for credit losses on loans and leases remained relatively flatwas primarily duedriven by an increase in reserves to address weakness in the office sector, potential repricing risk in the multifamily portfolio and an increase in classified assets. Also contributing to the combination of macroeconomic factors and increased loan activity on the balance sheet. The key contributing forecasted macroeconomic and market level factors included relatively unchanged unemployment rates, slight increase in Gross Domestic Product (“GDP”) and improving Multi Family and Commercial Real Estate Property Prices reflecting the improving economic landscape as the COVID-19 pandemic begins to subside. In addition to these quantitative inputs, several qualitative factors were considered, including the risk that the economic decline proves to be more severe and/or prolonged than our baseline forecast which also increased our allowance for loancredit losses on loans and lease losses. Theleases was the day 1 impact of the unprecedented fiscal stimulusSignature Transaction that closed on March 20, 2023, which added $141 million to the reserve.


As of December 31, 2023 and changes to federalDecember 31, 2022, the allowance for unfunded commitments totaled $52 million and local laws and regulations, including changes to various government sponsored loan programs, was also considered.

$23 million, respectively.

The Company charges off loans, or portions of loans, in the period that such loans, or portions thereof, are deemed uncollectible. The collectability of individual loans is determined through an assessment of the financial condition and repayment capacity of the borrower and/or through an estimate of the fair value of any underlying collateral. For non-real estate-related consumer credits, the following past-due time periods determine when charge-offs are typically recorded: (1) closed-end credits are charged off in the quarter that the loan becomes 120 days past due; (2) open-end credits are charged off in the quarter that the loan becomes 180 days past due; and (3) both closed-end and open-end credits are typically charged off in the quarter that the credit is 60 days past the date the Company received notification that the borrower has filed for bankruptcy.


109

105


The following table presents additional information about the Company’s nonaccrual loans at December 31, 2021:2023:

(in millions)Recorded InvestmentRelated AllowanceInterest Income Recognized
Nonaccrual loans with no related allowance:
Multi-family$134 $— $
Commercial real estate532
One-to-four family first mortgage85
Acquisition, development, and construction
Other (includes C&I)22
Total nonaccrual loans with no related allowance$294 $— $
Nonaccrual loans with an allowance recorded:
Multi-family$$— $— 
Commercial real estate75173
One-to-four family first mortgage112
Acquisition, development, and construction
Other (includes C&I)4428
Total nonaccrual loans with an allowance recorded$134 $47 $
Total nonaccrual loans:
Multi-family$138 $— $
Commercial real estate128175
One-to-four family first mortgage962
Acquisition, development, and construction
Other (includes C&I)6628
Total nonaccrual loans$428 $47 $10 

(in millions)


Recorded
Investment


Related
Allowance


Interest
Income
Recognized


Nonaccrual loans with no related allowance:


Multi-family


$

9


$


$

1


Commercial real estate


14


One-to-four family


Acquisition, development, and construction


Other


6


Total nonaccrual loans with no related allowance


$

29


$


$

1


Nonaccrual loans with an allowance recorded:


Multi-family


$

1


$


$


Commercial real estate


2


One-to-four family


1


Acquisition, development, and construction


Other


Total nonaccrual loans with an allowance recorded


$

4


$


$


Total nonaccrual loans:


Multi-family


$

10


$


$

1


Commercial real estate


16


One-to-four family


1


Acquisition, development, and construction


Other


6


Total nonaccrual loans


$

33


$


$

1


106


The following table presents additional information about the Company’s nonaccrual loans at December 31, 20202022:

(in millions)Recorded InvestmentRelated AllowanceInterest Income Recognized
Nonaccrual loans with no related allowance:
Multi-family$13 $— $— 
Commercial real estate191
One-to-four family first mortgage90
Other (includes C&I)3
Total nonaccrual loans with no related allowance$125 $— $
Nonaccrual loans with an allowance recorded:
Commercial real estate$$— $— 
One-to-four family first mortgage2
Other (includes C&I)1314
Total nonaccrual loans with an allowance recorded$16 $14 $— 
Total nonaccrual loans:
Multi-family$13 $— $— 
Commercial real estate201
One-to-four family first mortgage92
Other (includes C&I)1614
Total nonaccrual loans$141 $14 $

Note 8 - Leases

(in millions)


Recorded
Investment


Related
Allowance


Interest
Income
Recognized


Nonaccrual loans with no related allowance:


Multi-family


$


$


$


Commercial real estate


2


One-to-four family


1


Acquisition, development, and construction


Other


20


1


Total nonaccrual loans with no related allowance


$

23


$


$

1


Nonaccrual loans with an allowance recorded:


Multi-family


$

4


$

1


$


Commercial real estate


10


One-to-four family


1


Acquisition, development, and construction


Other


Total nonaccrual loans with an allowance recorded


$

15


$

1


$


Total nonaccrual loans:


Multi-family


$

4


$

1


$


Commercial real estate


12


One-to-four family


2


Acquisition, development, and construction


Other


20


1


Total nonaccrual loans


$

38


$

1


$

1


NOTE 7. LEASES

Lessor Arrangements

The Company is a lessor in the equipment finance business where it has executed direct financing leases (“lease finance receivables”). The Company produces lease finance receivables through a specialty finance subsidiary that participates in syndicated loans that are brought to them, and equipment loans and leases that are assigned to them, by a select group of

110


nationally recognized sources, and are generally made to large corporate obligors, many of which are publicly traded, carry investment grade or near-investment grade ratings, and participate in stable industries nationwide. Lease finance receivables are carried at the aggregate of lease payments receivable plus the estimated residual value of the leased assets and any initial direct costs incurred to originate these leases, less unearned income, which is accreted to interest income over the lease term using the interest method.

The standard leases are typically repayable on a level monthly basis with terms ranging from 24 to 120 months. At the end of the lease term, the lessee usually has the option to return the equipment, to renew the lease or purchase the equipment at the then fair market value (“FMV”) price. For leases with a FMV renewal/purchase option, the relevant residual value assumptions are based on the estimated value of the leased asset at the end of the lease term, including evaluation of key factors, such as, the estimated remaining useful life of the leased asset, its historical secondary market value including history of the lessee executing the FMV option, overall credit evaluation and return provisions. The Company acquires the leased asset at fair market value and provides funding to the respective lessee at acquisition cost, less any volume or trade discounts, as applicable. Therefore, there is generally no selling profit or loss to recognize or defer at inception of a lease.

The residual value component of a lease financing receivable represents the estimated fair value of the leased equipment at the end of the lease term. In establishing residual value estimates, the Company may rely on industry data, historical experience, and independent appraisals and, where appropriate, information regarding product life cycle, product upgrades and competing products. Upon expiration of a lease, residual assets are remarketed, resulting in either an extension of the lease by the lessee, a lease to a new customer or purchase of the residual asset by the lessee or

107


another party. Impairment of residual values arises if the expected fair value is less than the carrying amount. The Company assesses its net investment in lease financing receivables (including residual values) for impairment on an annual basis with any impairment losses recognized in accordance with the impairment guidance for financial instruments. As such, net investment in lease financing receivables may be reduced by an allowance for credit losses with changes recognized as provision expense. On certain lease financings, the Company obtains residual value insurance from third parties to manage and reduce the risk associated with the residual value of the leased assets. At December 31, 20212023 and December 31, 2020,2022, the carrying value of residual assets with third-party residual value insurance for at least a portion of the asset value was $61$280 million and $71$32 million, respectively.

The Company uses the interest rate implicit in the lease to determine the present value of its lease financing receivables.

The components of lease income were as follows:

(in millions)


For the
Twelve
Months
Ended
December 31,
2021


For the
Twelve
Months
Ended
December 31,
2020


Interest income on lease financing (1)


$

53


$

52


For the Years Ended December 31,
(in millions)202320222021
Interest income on lease financing (1)
$119 $53 $53 
(1)
Included in Interest Income – Loans and leases in the Consolidated Statements of Income and Comprehensive Income.

At December 31, 20212023 and December 31, 2020,2022, the carrying value of net investment in leases, excluding purchase accounting adjustments was $1.9 billion. $3.5 billion and $1.7 billion, respectively. The components of net investment in direct financing leases, including the carrying amount of the lease receivables, as well as the unguaranteed residual asset were as follows:

(in millions)December 31, 2023December 31, 2022
Net investment in the lease - lease payments receivable$3,187 $1,685 
Net investment in the lease - unguaranteed residual assets321 60 
Total lease payments$3,508 $1,745 


111


(in millions)


December 31,
2021


December 31,
2020

Net investment in the lease - lease payments receivable


$1,790


$1,771

Net investment in the lease - unguaranteed residual assets


75


80

Total lease payments


$1,865


$1,851

The following table presents the remaining maturity analysis of the undiscounted lease receivables, as of December 31, 2021, as well as the reconciliation to the total amount of receivables recognized in the Consolidated Statements of Condition:


(in millions)December 31, 2023
2024549 
2025602 
2026874 
2027521 
2028293 
Thereafter669 
Total lease payments$3,508 
Plus: deferred origination costs15 
Less: unearned income(258)
Less: purchase accounting adjustment$(76)
Total lease finance receivables, net$3,189 

(in millions)


December 31,
2021


2022


$


22


2023


225


2024


275


2025


370


2026


399


Thereafter


574


Total lease payments


1,865


Plus: deferred origination costs


25


Less: unearned income


(95

)

Total lease finance receivables, net


$


1,795


108


Lessee Arrangements

The Company has operating leases for corporate offices, branch locations, and certain equipment. These leases generally have terms of 20 years or less, determined based on the contractual maturity of the lease, and include periods covered by options to extend or terminate the lease when the Company is reasonably certain that it will exercise those options. For the vast majority of the Company’s leases, we are not reasonably certain we will exercise our options to renew to the end of all renewal option periods. The Company determines if an arrangement is a lease at inception. Operating leases are included in operating lease right-of-useother assets and operating leaseother liabilities in the Consolidated Statements of Condition.

ROU assets represent the Company’s right to use an underlying asset for the lease term and lease liabilities represent the obligation to make lease payments arising from the lease. Operating lease ROU assets and liabilities are recognized at commencement date based on the present value of lease payments over the lease term. As mostthe vast majority of the leases do not provide an implicit rate, the incremental borrowing rate (FHLB borrowing rate) is used based on the information available at adoptioncommencement date in determining the present value of lease payments. The implicit rate is used when readily determinable. The operating lease ROU asset is measured at cost, which includes the initial measurement of the lease liability, prepaid rent and initial direct costs incurred by the Company, less incentives received. The lease terms include options to extend the lease when it is reasonably certain that we will exercise that option. For the vast majority of the Company’s leases, we are reasonably certain we will exercise our options to renew to the end of all renewal option periods. As such, substantially all of our future options to extend the leases have been included in the lease liability and ROU assets.

Variable costs such as the proportionate share of actual costs for utilities, common area maintenance, property taxes and insurance are not included in the lease liability and are recognized in the period in which they are incurred. Amortization of the ROU assets was $18million and $20 million for the twelve months ended December 31, 2021 and 2020, respectively.

The Company has operating leases for corporate offices, branch locations, and certain equipment. The Company’s leases have remaining lease terms of one year to approximately 25 years, the vast majority of which include one or more options to extend the leases for up to five years resulting in lease terms up to 40 years.

The components of lease expense were as follows:

For the Years Ended December 31,
(in millions)202320222021
Operating lease cost$86 $28 $27 
Total lease cost$86 $28 $27 

(in millions)


For the Twelve
Months Ended
December 31,
2021


For the Twelve
Months Ended
December 31,
2020


Operating lease cost


$

27


$

23


Sublease income


Total lease cost


$

27


$

23


Supplemental cash flow information related to the leases for the following periods:


(in millions)For the Years Ended December 31,
20232022
Cash paid for amounts included in the measurement of lease liabilities:
Operating cash flows from operating leases$64 $28 


(in millions)


For the Twelve
Months Ended
December 31,
2021


For the Twelve
Months Ended
December 31,
2020


Cash paid for amounts included in the measurement of lease liabilities:


Operating cash flows from operating leases


$

27


$

23


112


109


Supplemental balance sheet information related to the leases for the following periods:


(in millions, except lease term and discount rate)December 31, 2023December 31, 2022
Operating Leases:
Operating lease right-of-use assets (1)
$426 $119 
Operating lease liabilities (2)
$446 $122 
Weighted average remaining lease term11.2 years6 years
Weighted average discount rate percent4.71 %3.85 %
(1)Included in Other assets

(in millions, except lease term and discount rate)


December 31,
2021


December 31,
2020


Operating Leases:


Operating lease right-of-use assets


$

249


$

267


Operating lease liabilities


$

249


267


Weighted average remaining lease term


16 years


16 years


Weighted average discount rate%


3.05

%


3.12

%

in the Consolidated Statements of Condition.

(2)

(in millions)
Maturities of lease liabilities:


December 31,
2021


2022


$


26


2023


26


2024


25


2025


24


2026


23


Thereafter


197


Total lease payments


321


Less: imputed interest


(72

)

Total present value of lease liabilities


$


249


Included in Other liabilities in the Consolidated Statements of Condition.


(in millions)
December 31, 2023
Maturities of lease liabilities:
202471 
202565 
202658 
202752 
202845 
Thereafter296 
Total lease payments$587 
Less: imputed interest$(141)
Total present value of lease liabilities$446 

Note 9 - Mortgage Servicing Rights

The Company has investments in MSRs that result from the sale of loans to the secondary market for which we retain the servicing. The Company accounts for MSRs at their fair value. A primary risk associated with MSRs is the potential reduction in fair value as a result of higher than anticipated prepayments due to loan refinancing prompted, in part, by declining interest rates or government intervention. Conversely, these assets generally increase in value in a rising interest rate environment to the extent that prepayments are slower than anticipated. The Company utilizes derivatives as economic hedges to offset changes in the fair value of the MSRs resulting from the actual or anticipated changes in prepayments stemming from changing interest rate environments. There is also a risk of valuation decline due to higher than expected default rates, which we do not believe can be effectively managed using derivatives. For further information regarding the derivative instruments utilized to manage our MSR risks, see Note 15 - Derivative and Hedging Activities.

Changes in the fair value of residential first mortgage MSRs were as follows:
(in millions)Year Ended December 31, 2023
Balance at beginning of period$1,033 
Additions from loans sold with servicing retained208 
Reductions from sales(51)
Decrease in MSR fair value due to pay-offs, pay-downs, run-off, model changes, and other (1)
(80)
Changes in estimates of fair value due to interest rate risk (1) (2)
Fair value of MSRs at end of period$1,111 
(1)Changes in fair value are included within net return on mortgage servicing rights on the Consolidated Statements of Income and Comprehensive Income.
(2)Represents estimated MSR value change resulting primarily from market-driven changes which we manage through the use of derivatives.


113


The following table summarizes the hypothetical effect on the fair value of servicing rights using adverse changes of 10 percent and 20 percent to the weighted average of certain significant assumptions used in valuing these assets:

NOTE 8: DEPOSITS
December 31, 2023
Fair Value
(dollars in millions)Actual10% adverse change20% adverse change
Option adjusted spread5.4 %$1,091 $1,072 
Constant prepayment rate7.9 %1,073 1,040 
Weighted average cost to service per loan$69 $1,100 $1,090 

December 31, 2022
Fair Value
(dollars in millions)Actual10% adverse change20% adverse change
Option adjusted spread5.9 %$1,012 $992 
Constant prepayment rate7.9 %1,000 970 
Weighted average cost to service per loan$68 $1,023 $1,013 

The sensitivity calculations above are hypothetical and should not be considered to be predictive of future performance. Changes in fair value based on adverse changes in assumptions generally cannot be extrapolated because the relationship of the change in assumption to the change in fair value may not be linear. To isolate the effect of the specified change, the fair value shock analysis is consistent with the identified adverse change, while holding all other assumptions constant. In practice, a change in one assumption generally impacts other assumptions, which may either magnify or counteract the effect of the change. For further information on the fair value of MSRs, see Note 18 - Fair Value Measures

.


Contractual servicing and subservicing fees, including late fees and other ancillary income are presented below. Contractual servicing fees are included within net return on mortgage servicing rights on the Consolidated Statements of Income and Comprehensive Income. Contractual subservicing fees including late fees and other ancillary income are included within loan administration income on the Consolidated Statements of Income and Comprehensive Income. Subservicing fee income is recorded for fees earned on subserviced loans, net of third-party subservicing costs.

The following table summarizes income and fees associated with owned MSRs:

(in millions)Year Ended December 31, 2023Month Ended December 31, 2022
Net return on mortgage servicing rights
Servicing fees, ancillary income and late fees (1)
$227 $20 
Decrease in MSR fair value due to pay-offs, pay-downs, run-off, model changes and other(80)(8)
Changes in fair value due to interest rate risk10 
Gain on MSR derivatives (2)
(47)(16)
Net transaction costs— 
Total return included in net return on mortgage servicing rights$103 $
(1)Servicing fees are recorded on an accrual basis. Ancillary income and late fees are recorded on a cash basis.
(2)Changes in the derivatives utilized as economic hedges to offset changes in fair value of the MSRs.


114


The following table summarizes income and fees associated with our mortgage loans subserviced for others:
(in millions)Year Ended December 31, 2023Year Ended December 31, 2022
Loan administration income on mortgage loans subserviced
Servicing fees, ancillary income and late fees (1)
$154 $11 
Charges on subserviced custodial balances (2)
(168)(8)
Other servicing charges(3)
Total (loss) income on mortgage loans subserviced, included in loan administration income$(17)$
(1)Servicing fees are recorded on an accrual basis. Ancillary income and late fees are recorded on a cash basis.
(2)Charges on subserviced custodial balances represent interest due to MSR owner.

We also earned approximately $95 million in service fee income for loans being serviced for the FDIC related to the Signature transaction.

Note 10 - Variable Interest Entities
We have no consolidated VIEs as of December 31, 2023 and December 31, 2022.
In connection with our non-qualified mortgage securitization activities, we have retained a five percent interest in the investment securities of certain trusts ("other MBS") and are contracted as the subservicer of the underlying loans, compensated based on market rates, which constitutes a continuing involvement in these trusts. Although we have a variable interest in these securitization trusts, we are not their primary beneficiary due to the relative size of our investment in comparison to the total amount of securities issued by the VIE and our inability to direct activities that most significantly impact the VIE’s economic performance. As a result, we have not consolidated the assets and liabilities of the VIE in our Consolidated Statements of Condition. The Bank’s maximum exposure to loss is limited to our five percent retained interest in the investment securities that had a fair value of $180 million as of December 31, 2023 as well as the standard representations and warranties made in conjunction with the loan transfers.

Note 11 - Deposits
The following table sets forth the weighted average interest rates for each type of deposit at December 31, 20212023 and 2020:2022:

December 31,
20232022
(dollars in millions)AmountPercent of TotalWeighted Average Interest RateAmountPercent of TotalWeighted Average Interest Rate
Interest-bearing checking and money market accounts$30,700 37.66 %3.51 %$22,511 38.34 %2.66 %
Savings accounts8,773 10.76 %2.67 %11,645 19.83 %1.30 %
Certificates of deposit21,554 26.44 %4.42 %12,510 21.30 %2.04 %
Non-interest-bearing accounts20,499 25.14 %— %12,055 20.53 %— %
Total deposits$81,526 100.00 %2.79 %$58,721 100.00 %1.71 %


December 31,


2021


2020


(dollars in millions)

Amount


Percent
of Total


Weighted
Average
Interest
Rate


Amount


Percent
of Total


Weighted
Average
Interest
Rate


Interest-bearing checking and money
   market accounts

$

13,209


37.68

%


0.20

%


$

12,610


38.87

%


0.28

%

Savings accounts


8,892


25.36


0.35


6,416


19.78


0.41


Certificates of deposit


8,424


24.03


0.52


10,331


31.85


0.83


Non-interest-bearing accounts


4,534


12.93


3,080


9.50


Total deposits

$

35,059


100.00

%


0.29

%


$

32,437


100.00

%


0.45

%

At December 31, 20212023 and 2020,2022, the aggregate amount of time deposit accounts (including certificates of deposit) that meet or exceed the insured limit was $7.9 billion and $3.7 billion, respectively.

At December 31, 2023 and 2022, the aggregate amount of deposits that had been reclassified as loan balances (i.e., overdrafts) was $1.9$121 million and $2.3$4 million, respectively.

115


The scheduled maturities of certificates of deposit (“CDs”) at December 31, 20212023 were as follows:


(in millions)

1 year or less

$

17,321 

7,454

More than 1 year through 2 years

3,879 

410

More than 2 years through 3 years

229 

495

More than 3 years through 4 years

142 

26

More than 4 years through 5 years

7 

39

Over 5 years

3 

-

Total CDs

(1)

$

21,581 

8,424

(1) Excludes PAA

110


Included in total deposits at both December 31, 20212023 and 20202022 were brokered deposits of $5.7$9.5 billion and $5.3$5.1 billion with weighted average interest rates of .07%3.72 percent and .08%.49 percent at the respective year-ends. Brokered money market accounts represented $3.0$1.3 billion and $2.8 billion of the December 31, 20212023 and 20202022 totals, and brokered interest-bearing checking accounts represented $1.5$1.6 billion and $1.3$1.0 billion, respectively. Brokered CDs represented $1.2$6.6 billion and $1.0$1.3 billion of brokered deposits at December 31, 20212023 and 2020,2022, respectively.

Note 12 - Borrowed Funds

NOTE 9: BORROWED FUNDS

The following table summarizes the Company’s borrowed funds at December 31, 2021 and 2020:funds:


(in millions)December 31, 2023December 31, 2022
Wholesale borrowings:
FHLB advances$19,250 $20,325 
FRB term funding1,000 
Total wholesale borrowings$20,250 $20,325 
Junior subordinated debentures579 575
Subordinated notes438 432
Total borrowed funds$21,267 $21,332 


December 31,


(in millions)


2021


2020


Wholesale borrowings:


FHLB advances


$

15,105


$

14,628


Repurchase agreements


800


800


Total wholesale borrowings


$

15,905


$

15,428


Junior subordinated debentures


361


360


Subordinated notes


296


296


Total borrowed funds


$

16,562


$

16,084


Accrued interest on borrowed funds is included in “Other liabilities” in the Consolidated Statements of Condition and amounted to $18 $50 million and $19$37 million, respectively, at December 31, 2021 and 2020.2023, December 31, 2022.

FHLB Advances

The contractual maturities and the next call dates of FHLB advances outstanding at December 31, 20212023 were as follows:


Contractual Maturity


Earlier of Contractual
Maturity or Next Call Date


(dollars in millions)
Year


Amount


Weighted
Average
Interest
Rate
(1)


Amount


Weighted
Average
Interest
Rate
(1)


2022


$


3,750


0.50


%

$


11,030


1.53


%

2023


2,525


0.85


2,725


0.91


2024


1,350


0.85


1,350


0.85


2025


2026


2027


2028


4,350


2.40


2029


3,130


1.55


Total FHLB advances


$


15,105


1.36


$


15,105


1.36


Contractual MaturityEarlier of Contractual Maturity or Next Call Date
(dollars in millions) YearAmountWeighted Average Interest Rate (1)AmountWeighted Average Interest Rate (1)
20247,350 4.57 9,100 4.37 
20251,500 5.38 1,750 5.11 
20262,500 5.37 2,500 5.37 
20274,000 4.62 3,500 4.75 
20282,400 5.17 2,400 5.17 
20321,500 3.43 — — 
Total FHLB advances$19,250 $19,250 
(1)
Does not included the effect interest rate swap agreements.

FHLB advances include both straight fixed-rate advances and advances under the FHLB convertible advance program, which gives the FHLB the option of either calling the advance after an initial lock-out period of up to five years and quarterly thereafter until maturity, or a one-time call at the initial call date.

116


At December 31, 20212023 and 2020,2022, respectively, the Bank had unused lines of available credit with the FHLBFHLB-NY of up to $8.4$8.4 billion and $7.3$11.3 billion. The Company had 0did not have any overnight advances at December 31, 2021, or2023 and $2.8 billion at December 31, 2020.2022. During the twelve monthsyear ended December 31, 2021,2023, the average balance of overnight advances amounted to $6$624 million, with a weighted average interest rate of .36%.5.08 percent. During the twelve monthsyear ended December 31, 2020,2022, the average balancesbalance of overnight advances amounted to $2$318 million, with a weighted average interest ratesrate of 3.48 percent.

1.2%.

111


Total FHLB advances generated interest expense of $233$564 million, $246$251 million and $259$233 million, in the years ended December 31, 2023, 2022, and 2021, 2020, and 2019, respectively.

Federal Reserve Bank (FRB) Term Funding Program

At December 31, 2023, the Company had $1.0 billion in outstanding borrowings under the FRB Term Funding program. There were no such borrowings outstanding during the years ended 2022 or 2021.
Repurchase Agreements

The following table presents an analysis of the contractual maturities and next call dates of the Company’sCompany had no outstanding repurchase agreements accounted for as secured borrowings atof December 31, 2021:


Contractual Maturity


Earlier of Contractual
Maturity or Next
Call Date

(dollars in millions)
Year


Amount


Weighted
Average
Interest
Rate


Amount


Weighted
Average
Interest
Rate


2022


$


%

$


800


2.24


%

2023


2028


300


2.37


2029


500


2.16


$


800


2.24


$


800


2.24


The following table provides the contractual maturity2023 and weighted average interest rate of repurchase agreements, and the amortized cost and fair value of the securities collateralizing the repurchase agreements, at December 31, 2021:2022.


Mortgage-Related
and Other Securities


GSE Debentures and
U.S. Treasury
Obligations


(dollars in millions)
Period of Maturity


Amount


Weighted
Average
Interest
Rate


Amortized
Cost


Fair
Value


Amortized
Cost


Fair
Value


Greater than 90 days


$


800


2.24

%


$


345


$


343


$


549


$


570


The Company had 0no short-term repurchase agreements outstanding at December 31, 2021 or 2020.

At December 31, 20212023 and 2020, the2022.

There was no accrued interest on repurchase agreements amounted to $2 million.at December 31, 2023. The interest expense on repurchase agreements was $18$14 million and $18 million for each of the years ended December 31, 2022 and 2021, 2020, and 2019, respectively.

Federal Funds Purchased

There were 0no federal funds purchased outstanding at December 31, 2021 or 2020.2023 and December 31, 2022.

In 20212023 and 2020,2022, respectively, the average balances of federal funds purchased were $81$196 million and $180$466 million, with weighted average interest rates of 0.09%5.01 percent and 0.49%.1.65 percent. The interest expense produced by federal funds purchased was $0$10 million, $1$8 million and $0$0 million for the years ended December 31, 2023, 2022 and 2021, 2020 and 2019, respectively.

Junior Subordinated Debentures

At December 31, 20212023 and 2020,December 31, 2022, the Company had $361$609 million and $360$608 million, respectively, of outstanding junior subordinated deferrable interest debentures (“junior subordinated debentures”) held by statutory business trusts (the “Trusts”) that issued guaranteed capital securities.securities, excluding purchase accounting adjustments.

117


112


The Trusts are accounted for as unconsolidated subsidiaries, in accordance with GAAP. The proceedsfollowing table presents contractual terms of each issuance were invested in a series ofthe junior subordinated debentures of the Company and the underlying assets of each statutory business trust are the relevant debentures. The Company has fully and unconditionally guaranteed the obligations under each trust’s capital securities to the extent set forth in a guarantee by the Company to each trust. The Trusts’ capital securities are each subject to mandatory redemption, in whole or in part, upon repayment of the debentures at their stated maturity or earlier redemption.

The following junior subordinated debentures were outstanding at December 31, 2021:

Issuer


Interest Rate
of Capital
Securities
and
Debentures


Junior
Subordinated
Debentures
Amount
Outstanding


Capital
Securities
Amount
Outstanding


Date of
Original Issue


Stated
Maturity


First Optional
Redemption
Date


(dollars in millions)


New York Community Capital
   Trust V (BONUSESSM Units)


6.00

%


$


147


$


140


Nov. 4, 2002


Nov. 1, 2051


Nov. 4, 2007

(1)

New York Community Capital
   Trust X


1.80


124


120


Dec. 14, 2006


Dec. 15, 2036


Dec. 15, 2011

(2)

PennFed Capital Trust III


3.45


31


30


June 2, 2003


June 15, 2033


June 15, 2008

(2)

New York Community Capital
   Trust XI


1.87


59


58


April 16, 2007


June 30, 2037


June 30, 2012

(2)

Total junior subordinated debentures


$


361


$


348


2023:
IssuerInterest Rate of Capital Securities and Debentures
Junior Subordinated Debentures Amount Outstanding (3)
Capital Securities Amount OutstandingDate of Original IssueStated Maturity
(dollars in millions)
New York Community Capital Trust V (BONUSES Units) (1)6.00$147 $141 Nov. 4, 2002Nov. 1, 2051
New York Community Capital Trust X (2)7.25124 120 Dec. 14, 2006Dec. 15, 2036
PennFed Capital Trust III (2)8.9031 30 June 2, 2003June 15, 2033
New York Community Capital Trust XI (2)7.2459 58 April 16, 2007June 30, 2037
Flagstar Statutory Trust II (2)8.8726 25 Dec. 26, 2002Dec. 26, 2032
Flagstar Statutory Trust III (2)8.9126 25 Feb. 19, 2003April 7, 2033
Flagstar Statutory Trust IV (2)8.8426 25 Mar. 19, 2003Mar 19, 2033
Flagstar Statutory Trust V (2)7.6626 25 Dec 29, 2004Jan. 7, 2035
Flagstar Statutory Trust VI (2)7.6626 25 Mar. 30, 2005April 7, 2035
Flagstar Statutory Trust VII (2)7.4051 50 Mar. 29, 2005June 15, 2035
Flagstar Statutory Trust VIII (2)7.1626 25 Sept. 22, 2005Oct. 7, 2035
Flagstar Statutory Trust IX (2)7.1026 25 June 28, 2007Sept. 15, 2037
Flagstar Statutory Trust X (2)8.1515 15 Aug. 31, 2007Sept 15, 2037
Total junior subordinated debentures (3)
$609 $589 
(1)
Callable subject to certain conditions as described in the prospectus filed with the SEC on November 4, 2002.
(2)
Callable from this date forward.at any time.
(3)Excludes Flagstar Acquisition fair value adjustments of $30 million.

The Bifurcated Option Note Unit SecuritiESSM (“BONUSES units”) included in the preceding table were issued by the Company on November 4, 2002 at a public offering price of $50.00$50.00 per share. Each of the 5,500,000 BONUSES units offered consisted of a capital security issued by New York Community Capital Trust V, a trust formed by the Company, and a warrant to purchase 2.4953 shares of the common stock of the Company (for a total of approximately 13.714 million common shares) at an effective exercise price of $20.04$20.04 per share. Each capital security has a maturity of 49 years,, with a coupon, or distribution rate, of 6.00% percent on the $50.00$50.00 per share liquidation amount. The warrants and capital securities were non-callable for five years from the date of issuance and were not called by the Company when the five-year period passed on November 4, 2007.

The gross proceeds of the BONUSES units totaled $275.0$275 million and were allocated between the capital security and the warrant comprising such units in proportion to their relative values at the time of issuance. The value assigned to the warrants, $92.4$92.4 million, was recorded as a component of additional “paid-in capital” in the Company’s Consolidated Statements of Condition. The value assigned to the capital security component was $182.6$182.6 million. The $92.4$92.4 million difference between the assigned value and the stated liquidation amount of the capital securities was treated as an original issue discount, and is being amortized to interest expense over the 49-year life of the capital securities on a level-yield basis. At December 31, 2021,2023, this discount totaled $65$64 million.

The other threeremaining trust preferred securities noted in the preceding table were formed for the purpose of issuing Company Obligated Mandatorily Redeemable Capital Securities of Subsidiary Trusts Holding Solely Junior Subordinated Debentures (collectively, the “Capital Securities”). Dividends on the Capital Securities are payable either quarterly or semi-annually and are deferrable, at the Company’s option, for up to five years. As of December 31, 2021,2023, all dividends were current.

Interest expense on junior subordinated debentures was $18$48 million, $19$22 million, and $22$18 million, respectively, for the years ended December 31, 2021, 2020,2023, 2022, and 2019.2021.

118

113


Subordinated Notes

At December 31, 20212023 and 2020,December 31, 2022, the Company had $296a total of $438 million and $432 million subordinated notes outstanding; respectively, of fixed-to-floating rate subordinated notes outstanding:

Date of Original Issue


Stated Maturity


Interest Rate(1)


Original Issue
Amount


(dollars in millions)


Nov. 6, 2018


Nov. 6, 2028


5.90

%


$

300


Date of Original IssueStated MaturityInterest RateOriginal Issue Amount
November 6, 2018November 6, 2028 (1)5.900%$300
October 28, 2020November 1, 2030 (2)4.125%$150
(1)
From and including the date of original issuance to, but excluding November 6, 2023, the Notes will bear interest at an initial rate of 5.90% percent per annum payable semi-annually. Unless redeemed, from and including November 6, 2023 to but excluding the maturity date, the interest rate will reset quarterly to an annual interest rate equal to the then-current three-month LIBORSOFR rate plus 304.16 b278 basis pointasis points payable quarterly.

(2)From and including the date of original issuance, the Notes will bear interest at a fixed rate of 4.13 percent through October 31, 2025, and a variable rate tied to SOFR thereafter until maturity. The Company has the option to redeem all or a part of the Notes beginning on November 1, 2025, and on any subsequent interest expense on subordinated notes amounted to $payment date.
18
million for the years ended December 31, 2021 , 2020,
Note 13 - Federal, State, and 2019.

Local Taxes

NOTE 10: FEDERAL, STATE, AND LOCAL TAXES

The following table summarizes the components of the Company’s net deferred tax asset (liability) at December 31, 20212023 and 2020:2022

:


December 31,


(in millions)


2021


2020


Deferred Tax Assets:


Allowance for credit losses on loans and leases


$

55


$

53


Acquisition accounting and fair value adjustments on securities (including OTTI)


21


Compensation and related benefit obligations


17


21


Net operating loss carryforwards


1


6


Other


15


18


Gross deferred tax assets


109


98


Valuation allowance


Deferred tax asset after valuation allowance


$

109


$

98


Deferred Tax Liabilities:


Amortizable intangibles


$

(3

)


$

(3

)

Acquisition accounting and fair value adjustments on securities
   (including OTTI)


(13

)

Premises and equipment


(5

)


(6

)

Prepaid pension cost


(35

)


(25

)

Fair value adjustments on loans


(81

)


(92

)

Leases


(360

)


(370

)

Other


(9

)


(9

)

Gross deferred tax liabilities


$

(493

)


$

(518

)

Net deferred tax liability


$

(384

)


$

(420

)

December 31,
(in millions)20232022
Deferred Tax Assets:
Allowance for credit losses on loans and leases$253 $102 
Acquisition accounting and fair value adjustments on securities (including OTTI)188227 
Acquisition accounting and fair value adjustments on loans36 
Capitalized loan costs46 
Right of Use Liability32— 
Compensation and related benefit obligations3023 
Capitalized research and development costs10 
Accrued Expenses19— 
Net operating loss carryforwards815 
Other2218 
Gross deferred tax assets552 477 
Valuation allowance(5)(5)
Net deferred tax asset after valuation allowance$547 $472 
Deferred Tax Liabilities:
Leases$(492)$(328)
Mortgage servicing rights(79)(105)
Premises and equipment(44)(18)
Prepaid pension cost(35)(29)
Fair value adjustments on loans(210)— 
Amortizable intangibles(127)(71)
Acquisition accounting and fair value adjustments on deposits(2)(9)
Right of Use Asset(32)— 
Deferred Loan fees(13)— 
Acquisition accounting and fair value adjustments on debt(9)(10)
Other(21)(9)
Gross deferred tax liabilities$(1,064)$(579)
Net deferred tax liability$(517)$(107)

The deferred tax liability represents the anticipated federal, state, and local tax expenses or benefits that are expected to be realized in future years upon the utilization of the underlying tax attributes comprising said balances. The net deferred tax liability is included in “Other liabilities” in the Consolidated Statements of Condition at December 31, 20212023 and 2020.2022.

119

114


At December 31, 2021, the Company had a New York City net operating loss (“NOL”) carry forward of $21 million, which is available to offset future federal taxable income. The NOL may be carried forward for 20 years to any future calendar tax year after 2021.

The Company has determined that all deductible temporary differences and net operating loss carryforwards areevaluates the need for a deferred tax asset valuation allowances based on a more likely than not to provide a benefit in reducing future federal, state, and local tax liabilities, as applicable.standard. The Company has reached this determinationCompany’s evaluation is based on its history of reporting positive taxable income in all relevant tax jurisdictions, the length of time available to utilize the net operating loss carryforwards, and the recognition of taxable income in future periods from taxable temporary differences.
At December 31, 2023 and December 31, 2022, the Company had a state deferred tax asset for net operating losses (“NOL”) of $8 million and $15 million,

respectively (net of federal tax impact) which includes total state net operating loss carryforwards of $185 million at December 31, 2023, that expire if unused in calendar years through 2033. In connection with our ongoing assessment of deferred taxes, we analyzed each state net operating loss separately, determined the amount of net operating loss available and estimated the amount which we expected to expire unused. Based on that assessment, we recorded a valuation allowance of $5 million at December 31, 2023 and 2022 to reduce the DTA to the amount which is more likely than not to be realized.

The following table summarizes the Company’s income tax expense for the years ended December 31, 2021, 2020,2023, 2022, and 2019:2021:

December 31,
(in millions)202320222021
Federal – current$156 $147 $188 
State and local – current59 32 35 
Total current215 179 223 
Federal – deferred(137)(10)(28)
State and local – deferred(49)15 
Total deferred(186)(3)(13)
Income tax expense reported in net income29 176 210 
Income tax expense reported in stockholders’ equity related to:
Securities available-for-sale15 (223)(42)
Pension liability adjustments(6)10 
Cash flow hedge(14)23 
Total income taxes$36 $(30)$187 


December 31,


(in millions)


2021


2020


2019


Federal – current


$

188


$

(148

)


$

4


State and local – current


35


5


23


Total current


223


(143

)


27


Federal – deferred


(28

)


190


101


State and local – deferred


15


29


Total deferred


(13

)


219


101


Income tax expense reported in net income


210


77


128


Income tax expense reported in stockholders’ equity related to:


Securities available-for-sale


(42

)


16


16


Pension liability adjustments


10


5


Cash flow hedge


9


(13

)


Adoption of ASU 2016-13


(4

)


Total income taxes


$

187


$

76


$

149


The following table presents a reconciliation of statutory federal income tax expense (benefit) to combined actual income tax expense (benefit) reported in net income for the years ended December 31, 2021, 2020,2023, 2022, and 2019:


December 31,


(in millions)


2021


2020


2019


Statutory federal income tax at 21%, 21% and 21%, respectively


$

169


$

123


$

110


State and local income taxes, net of federal income tax effect


40


27


18


Effect of tax law changes


(73

)


Non-deductible FDIC deposit insurance premiums


9


8


7


Effect of tax deductibility of ESOP


(3

)


(3

)


(3

)

Non-taxable income and expense of BOLI


(6

)


(7

)


(6

)

Non-deductible merger expenses


3


Federal tax credits


(1

)


(1

)

Adjustments relating to prior tax years


(1

)


1


Other, net


(1

)


2


3


Total income tax expense


$

210


$

77


$

128


GAAP requires that the impact of tax legislation be recognized in the period in which the law was enacted. The CARES Act was enacted on March 27, 2020 to provide relief related to the COVID-19 pandemic. The CARES Act includes many measures to assist companies including the allowance of net operating losses originating in 2018, 2019 or 2020 to be carried back 2021:

December 31,
(in millions)202320222021
Statutory federal income tax at 21%$(10)$174 $169 
State and local income taxes, net of federal income tax effect31 40 
Tax Exempt income$(6)$— $— 
Non-taxable bargain gain(447)(33)— 
Non-deductible goodwill impairment$509 $— $— 
Non-deductible FDIC deposit insurance premiums16 10 
Effect of tax deductibility of deferred compensation$(3)$(3)$(3)
Non-taxable income and expense of BOLI(9)(7)(6)
Non-deductible merger expenses$— $$
Non-deductible compensation expense— 
Federal tax credits$(31)$(1)$— 
Adjustments relating to prior tax years(1)(1)
Other, net(1)(1)(1)
Total income tax expense$29 $176 $210 
five years
. The Company recorded $68.4 million in tax benefits for the year ended December 31, 2020 relating to the enactment of the CARES Act.

The Company invests in affordable housing projects through limited partnerships that generate federal Low Income Housing Tax Credits. The balances of these investments, which are included in “Other assets” in the

115


Consolidated Statements of Condition, were $76$372 million million and $85$304 million, respectively, at December 31, 20212023 and 2020,2022, and included commitments of $34$210 million and $54$183 million that are expected to be funded over the next three5 years. The Company elected to apply the proportional amortization method to these investments. Recognized in the determination of income tax (benefit) expense from operations for the years ended December 31, 2023, 2022, and 2021 2020, and 2019 were $9$34 million million, $8, $11 million, and $6$9 million, respectively,


120


of affordable housing tax credits and other tax benefits, and an offsetting $9$30 million, $6$10 million, and $5$9 million, respectively, for the amortization of the related investments. NaNNo impairment losses were recognized in relation to these investments for the years ended December 31, 2021, 2020,2023, 2022, and 20192021.

GAAP prescribes a recognition threshold and measurement attribute for use in connection with the obligation of a company to recognize, measure, present, and disclose in its financial statements uncertain tax positions that the Company has taken or expects to take on a tax return. As of December 31, 2021,2023 and 2022, the Company had $39$42 million and $40 million of unrecognized gross tax benefits.benefits, respectively. Gross tax benefits do not reflect the federal tax effect associated with state tax amounts. The total amount of net unrecognized tax benefits at December 31, 20212023 and 2022 that would have affected the effective tax rate, if recognized, was $30$34 million a million.nd $32 million, respectively.

Interest and penalties (if any) related to the underpayment of income taxes are classified as a component of income tax expense in the Consolidated Statements of Income and Comprehensive Income. During the years ended December 31, 2021, 2020,2023, 2022, and 2019,2021, the Company recognized income tax expense attributed to interest and penalties of $4$8 million million, $3, $4 million, and $3$4 million, respectively. Accrued interest and penalties on tax liabilities were $22$34 million and $18$26 million, respectively, at December 31, 20212023 and 2020.2022.

The following table summarizes changes in the liability for unrecognized gross tax benefits for the years ended December 31, 2021, 2020,2023, 2022, and 2019:2021

:


December 31,


(in millions)


2021


2020


2019


Uncertain tax positions at beginning of year


$

38


$

36


$

33


Additions for tax positions relating to current-year operations


2


1


1


Additions for tax positions relating to prior tax years


1


1


2


Subtractions for tax positions relating to prior tax years


(2

)


Reductions in balance due to settlements


Uncertain tax positions at end of year


$

39


$

38


$

36


December 31,
(in millions)202320222021
Uncertain tax positions at beginning of year$40 $39 $38 
Additions for tax positions relating to current-year operations
Additions for tax positions relating to prior tax years— 
Subtractions for tax positions relating to prior tax years(1)— (2)
Uncertain tax positions at end of year$42 $40 $39 

The Company and its subsidiaries have filed tax returns in many states. The following are the more significant tax filings that are open for examination:

Federal tax filings for tax years 20182019 through the present;
New York State tax filings for tax years 2010 through the present;
New York City tax filings for tax years 2011 through the present; and
New Jersey tax filings for tax years 20152018 through the present.

In addition to other state audits, the Company is currently under examination by the following taxing jurisdictions of significance to the Company:

Federal 2019-2020
New York State for the tax years 2010 through 2016; and
New York City for the tax years 2011 and 2014.

It is reasonably possible that there will be developments within the next twelve months that would necessitate an adjustment to the balance of unrecognized tax benefits, including decreases of up to $$21 million million due to completion of tax authorities’ exams and the expiration of statutes of limitations.

As a savings institution, theThe Bank is subject to a special federal tax provision regarding its frozen tax bad debt reserve. At December 31, 2021,2023, the Bank’s federal tax bad debt base-year reserve was $$62 million million,, with a related federal deferred tax liability of $13 $13 million, which has not been recognized since the Bank does not expect that this

116


reserve will become taxable in the foreseeable future. Events that would result in taxation of this reserve include redemptions of the Bank’s stock or certain excess distributions by the Bank to the Company.

NOTE 11. DERIVATIVE AND HEDGING ACTIVITIES


121


Note 14 - Stock-Related Benefits Plans

Stock Based Compensation

At December 31, 2023, the Company had a total of 16,143,893

shares available for grants as restricted stock, options, or other forms of related rights under the 2020 Incentive Plan, which includes the remaining shares available, converted at the merger conversion factor from the legacy Flagstar Bancorp, Inc. 2016 Stock Plan. The Company granted 9,995,495 shares of restricted stock, with an average fair value of $10.24 per share on the date of grant, during the year ended December 31, 2023.


The Company’s derivative financial instruments consistshares of interest rate swaps. restricted stock that were granted during the year ended December 31, 2023 and 2022, vest over a one to five years period. Compensation and benefits expense related to the RSAs grants is recognized on a straight-line basis over the vesting period and totaled $44 million, $25 million and $27 million for the years ended December 31, 2023, 2022 and 2021.

The following table provides a summary of activity with regard to restricted stock awards (RSAs):

Year Ended December 31, 2023
Number of SharesWeighted Average Grant Date Fair Value
Unvested at beginning of year9,576,602$10.92 
Granted9,995,49510.24 
Vested(3,105,582)10.99 
Forfeited(1,292,574)10.62 
Unvested at end of period15,173,941$10.49 


As of December 31, 2023, unrecognized compensation cost relating to unvested restricted stock totaled $119 million. This amount will be recognized over a remaining weighted average period of 2.7 years.
The following table provides a summary of activity with regard to Performance-Based Restricted Stock Units ("PSUs") in the year ended December 31, 2023:

Number of
Shares
Weighted
Average
Grant Date
Fair Value
Performance
Period
Expected
Vesting
Date
Outstanding at beginning of year794,984$10.73 
Granted566,6568.95 
Released(143,352)10.34 
Forfeited— 
Outstanding at end of period1,218,2889.95 January 1, 2022 - December 31, 2025March 31, 2023 - 2026

PSUs are subject to adjustment or forfeiture, based upon the achievement by the Company of certain performance standards. Compensation and benefits expense related to PSUs is recognized using the fair value as of the date the units were approved, on a straight-line basis over the vesting period and totaled $4 million, $3 million and $5 million for the for the years ended December 31, 2023, 2022 and 2021. As of December 31, 2023, unrecognized compensation cost relating to unvested restricted stock totaled $5 million. This amount will be recognized over a remaining weighted average period of 1.53 years. As of December 31, 2023, the Company believes it is probable that the performance conditions will be met.

Forfeitures of RSAs and PSUs are accounted for as they occur.
Note 15 - Derivative and Hedging Activities

The Company is exposed to certain risks arising from both its business operations and economic conditions. The Company principally manages its exposure to a wide variety of business and operational risks through management of its core business activities. The Company manages economic risks, including interest rate and liquidity risks, primarily by managing the amount, sources, and duration of its assets and liabilities and, from time to time, the use of derivative financial instruments. Specifically, the Company enters into derivative financial instruments to manage exposures that arise from business activities that result in the payment of future known and uncertain cash amounts, the value of which are determined by interest rates.

122


Title VII
Derivative financial instruments are recorded at fair value in other assets and other liabilities on the Consolidated Statements of Condition. The Company's policy is to present our derivative assets and derivative liabilities on the Consolidated Statement of Condition on a gross basis, even when provisions allowing for set-off are in place. However, for derivative contracts cleared through certain central clearing parties, variation margin payments are recognized as settlements. We are exposed to non-performance risk by the counterparties to our various derivative financial instruments. A majority of our derivatives are centrally cleared through a Central Counterparty Clearing House or consist of residential mortgage interest rate lock commitments further limiting our exposure to non-performance risk. We believe that the non-performance risk inherent in our remaining derivative contracts is minimal based on credit standards and the collateral provisions of the Dodd-Frank Wall Street Reform and Consumer Protection Actderivative agreements.

Derivatives not designated as hedging instruments. The Company maintains a derivative portfolio of 2010 (the “Dodd-Frank Act”) requires all standardized derivatives, including most interest rate swaps, foreign currency swaps, futures, swaptions and forward commitments used to be submitted for clearingmanage exposure to central counterpartieschanges in interest rates and MSR asset values and to reduce counterparty risk. Twomeet the needs of customers. The Company also enters into interest rate lock commitments, which are commitments to originate mortgage loans whereby the central counterparties areinterest rate on the Chicago Mercantile Exchange (“CME”)loan is determined prior to funding and the London Clearing House (“LCH”). As of December 31, 2021, all of the Company’s $4.3 billion notional derivative contracts were clearedcustomers have locked into that interest rate. Market risk on the LCH. Daily variation margin payments on derivatives cleared through the LCH are accounted for as legal settlement. For derivatives cleared through LCH, the net gain (loss) position includes the variation margin amounts as settlement of the derivativeinterest rate lock commitments and not collateral againstmortgage LHFS is managed using corresponding forward sale commitments and US Treasury futures. Changes in the fair value of derivatives not designated as hedging instruments are recognized on the derivative, which includes accrued interest; therefore, thoseConsolidated Statements of Income and Comprehensive Income.

Derivatives designated as hedging instruments. The Company has designated certain interest rate and derivative contractsswaps as cash flow hedges on overnight SOFR-based variable interest payments on federal home loan bank advances. Changes in the Company clears through the LCH are reported at a fair value of approximately zeroderivatives designated as cash flow hedges are recorded in other comprehensive income on the Consolidated Statements of Condition and reclassified into interest expense in the same period in which the hedged transaction is recognized in earnings. At December 31, 2023, the Company had $10 million (net-of-tax) of unrealized gains on derivatives classified as cash flow hedges recorded in accumulated other comprehensive loss. The Company had $52 million (net-of-tax) of unrealized gains on derivatives classified as cash flow hedges recorded in accumulated other comprehensive loss at December 31, 2021.2022.

The Company’s exposure

Derivatives that are designated in hedging relationships are assessed for effectiveness using regression analysis at inception and qualitatively thereafter, unless regression analysis is limited to the value of the derivative contracts in a gain position less any collateral helddeemed necessary. All designated hedge relationships were, and plus any collateral posted. When there is a net negative exposure, we consider our exposure to the counterpartyare expected to be, zero. Athighly effective as of December 31, 2021, the Company had a net negative exposure.2023.

Fair Value of Hedges of Interest Rate Risk

The Company is exposed to changes in the fair value of certain of its fixed-rate assets due to changes in interest rates. The Company uses interest rate swaps to manage its exposure to changes in fair value on these instruments attributable to changes in the designated benchmark interest rate. Interest rate swaps designated as fair value hedges involve the payment of fixed-rate amounts to a counterparty in exchange for the Company receiving variable-rate payments over the life of the agreements without the exchange of the underlying notional amount. Such derivatives were used to hedge the changes in fair value of certain of its pools of prepayable fixed rate assets. For derivatives designated and that qualify as fair value hedges, the gain or loss on the derivative as well as the offsetting loss or gain on the hedged item attributable to the hedged risk are recognized in interest income.

The Company has entered into an interest rate swapswaps with a notional amountamounts of $2.0$2.0 billion to hedge certain real estate loans.multi-family loans using the portfolio layer method. For the twelve monthsyear ended December 31, 2021,2023, the floating rate received related to the net settlement of thisthese interest rate swapswaps was lessgreater than the fixed rate payments. As such, interest income from Loansloans and leases in the accompanying Consolidated Statements of Income and Comprehensive Income was decreasedincreased by $49$24 million for the twelve monthsyear ended December 31, 2021. For2023 and decreased by $6 million for the twelve monthsyear ended December 31, 2020, the floating rate received related to the net settlement of this interest rate swap was less than the fixed rate payments. As such, interest income from Loans2022, respectively.

The fair value basis adjustment on our hedged real estate loans is included in loans and leases in the accompanyingheld for investment on our Consolidated Statements of Income and Comprehensive IncomeCondition. The carrying amount of our hedged loans was decreased by $$6.1 billion at 35 million for the twelve months ended December 31, 2020.2023

117


As, of which unrealized gains of $9 million were due to the fair value hedge relationship. We have designated $2.0 billion of this portfolio of loans in a hedging relationship as of December 31, 2021, the following amounts were recorded on the balance sheet related to cumulative basis adjustment for fair value hedges.2023.

(in millions)


December 31, 2021


December 31, 2020


Line Item in the Consolidated Statements of
   Condition in which the Hedge Item is Included


Carrying
Amount of
the Hedged
Assets


Cumulative
Amount of
Fair Value
Hedging
Adjustments
Included in
the Carrying
Amount of
the Hedged
Assets


Carrying
Amount of
the Hedged
Assets


Cumulative
Amount of
Fair Value
Hedging
Adjustments
Included in
the Carrying
Amount of
the Hedged
Assets


Total loans and leases, net (1)


$


2,025


$


25


$


2,073


$


73


(1)
123

These amounts include the amortized cost basis of closed portfolios used to designate hedging relationships in which the hedged item is the last layer expected to be remaining at the end of the hedging relationship. At December 31, 2021, the amortized cost basis of the closed portfolios used in these hedging relationships was $2.9 billion; the cumulative basis adjustments associated with these hedging relationships was $25 million; and the amount of the designated hedged items was $2.0 billion.

The following table setstables set forth information regarding the Company’s derivative financial instruments at December 31, 2021.instruments:


December 31, 2023
Fair Value
(in millions)Notional AmountOther AssetsOther LiabilitiesExpiration Dates
Derivatives designated as cash flow hedging instruments:
Interest rate swaps on FHLB advances$5,500 $— $2025-2028
Total5,500 — 
Derivatives designated as fair value hedging instruments:
Interest rate swaps on multi-family loans held for investment$2,000 $— $2025-2027
Derivatives not designated as hedging instruments:
Assets
Mortgage-backed securities forwards$1,012 $11 $— 2024
Rate lock commitments1,490 12 — 2024
Interest rate swaps and swaptions5,431 115 — 2024-2041
Total$7,933 $138 $— 
Liabilities
Futures$2,235 $— $2024
Mortgage-backed securities forwards1,048 $— 32 2024
Rate lock commitments772024
Interest rate swaps and swaptions2,72059 2024-2054
Total derivatives not designated as hedging instruments$6,080 $— $95 

December 31, 2022
Fair Value
(in millions)Notional AmountOther AssetsOther LiabilitiesExpiration Date
Derivatives designated as cash flow hedging instruments:
Interest rate swaps$3,750 $$— 2023-2027
Total3,750 — 
Derivatives not designated as hedging instruments:
Assets
Futures$1,205 $$— 2023
Mortgage-backed securities forwards1,065362023
Rate lock commitments1,53992023
Interest rate swaps and swaptions7,5941822023-2032
Total$11,403 $229 $— 
Liabilities
Mortgage-backed securities forwards$739 $— $61 2023
Rate lock commitments527102023
Interest rate swaps and swaptions2,445652023-2053
Total derivatives not designated as hedging instruments$3,711 $— $136 


December 31, 2021


Fair Value


(in millions)


Notional
Amount


Other
Assets


Other
Liabilities


Derivatives designated as fair value hedging instruments:


Interest rate swap


$

2,000


$


$


Total derivatives designated as fair value hedging instruments


$

2,000


$


$


124


The following table sets forthpresents the effectderivatives subject to a master netting agreement, including the cash pledged as collateral:

December 31, 2023
Gross Amounts Not Offset in the Statements of Condition
(in millions)Gross AmountGross Amounts Netted in the Statements of ConditionNet Amount Presented in the Statements of ConditionFinancial InstrumentsCash Collateral Pledged (Received)
Derivatives designated hedging instruments:
Interest rate swaps on FHLB advances$$— $$— $75 
Interest rate swaps on multi-family loans held for investment(1)
$$— $$— $27 
Derivatives not designated as hedging instruments:
Assets
Mortgage-backed securities forwards$11 $— $11 $— $(1)
Interest rate swaptions115 — 115 — (34)
Total derivative assets$126 $— $126 $— $(35)
Liabilities
Futures$$— $$— $
Mortgage-backed securities forwards32 — 32 — 57 
Interest rate swaps (1)
59 — 59 — 42 
Total derivative liabilities$92 $— $92 $— $102 
(1)Variation margin pledged to, or received from, a Central Counterparty Clearing House to cover the prior days fair value of open positions is considered settlement of the derivative instruments onposition for accounting purposes.

The following table presents the Consolidated Statementsderivatives subject to a master netting agreement, including the cash pledged as collateral:

December 31, 2022
Gross Amounts Not Offset in the Statements of Condition
(in millions)Gross AmountGross Amounts Netted in the Statements of ConditionNet Amount Presented in the Statements of ConditionFinancial InstrumentsCash Collateral Pledged (Received)
Derivatives designated hedging instruments:
Interest rate swaps on FHLB advances$$— $$$27 
Derivatives not designated as hedging instruments:
Assets
Mortgage-backed securities forwards$36 $— $36 $— $(9)
Interest rate swaptions182 — 182 — (36)
Futures
Total derivative assets$220 $— $220 $— $(44)
Liabilities
Mortgage-backed securities forwards$61 $— $61 $— $54 
Interest rate swaps (1)
65 — 65 — 29 
Total derivative liabilities$126 $— $126 $— $83 
(1)Variation margin pledged to, or received from, a Central Counterparty Clearing House to cover the prior days fair value of Income and Comprehensive Incomeopen positions is considered settlement of the derivative position for the periods indicated.accounting purposes.

(in millions)

For the Twelve
Months Ended
December 31, 2021


For the Twelve
Months Ended
December 31, 2020


Derivative – interest rate swap:


Interest income

$

48


$

(20

)

Hedged item – loans:


Interest income

$

(48

)


$

20


Cash Flow Hedges of Interest Rate Risk

The Company’s objectives in using interest rate derivatives are to add stability to interest expense and to manage its exposure to interest rate movements. Interest rate swaps designated as cash flow hedges involve the receipt of amounts subject to variability caused by changes in interest rates from a counterparty in exchange for the Company making fixed-rate payments over the life of the agreements without exchange of the underlying notional amount. Changes in the fair value of derivatives designated and that qualify as cash flow hedges are initially recorded in other comprehensive income and are subsequently reclassified into earnings in the period that the hedged transaction affects.affects earnings.


125


Interest rate swaps with notional amounts totaling $2.3$5.5 billion and $3.8 billion as of December 31, 20212023 and December 31, 2020,2022, were designated as cash flow hedges of certain FHLB borrowings.

118


The following table summarizes information about the interest rate swaps designated as cash flow hedges at December 31, 2021 and December 31, 2020:

(dollars in millions)


December 31,
2021


December 31,
2020


Notional amounts


$

2,250


$

2,250


Cash collateral posted


12


46


Weighted average pay rates


1.27

%


1.27

%

Weighted average receive rates


0.18

%


0.23

%

Weighted average maturity


0.9 years


1.9 years


The following table presents the effect of the Company’s cash flow derivative instruments on AOCL for the year ending December 31, 2021:AOCL:


For the Years Ended December 31,
(in millions)202320222021
Amount of gain (loss) recognized in AOCL$$88 $
Amount of reclassified from AOCL to interest expense$(65)$(4)$25 

(in millions)


For the Twelve
Months Ended
December 31, 2021


For the Twelve
Months Ended
December 31, 2020


Amount of (loss) gain recognized in AOCL


$

8


$

(58

)

Amount of reclassified from AOCL to interest expense


25


12


Gains (losses) included in the Consolidated Statements of Income related to interest rate derivatives designated as cash flow hedges during the twelve months ended December 31, 2021 was $25 million.

Amounts reported in AOCL related to derivatives will be reclassified to interest expense as interest payments are made on the Company’s variable-rate borrowings. During the next twelve months, the Company estimates that an additional $25interest expense reduction of $98 million willis expected to be reclassified to interest expense.

out of AOCL.

NOTE 12: COMMITMENTS AND CONTINGENCIES

Pledged Assets

The Company pledges securities to serve

Derivatives not Designated as collateral for its repurchase agreements, among other purposes. At December 31, 2021, the Company had pledged available for sale mortgage-related securities and other debt securities with carrying values of $Hedging Instruments

704 million and $464 million, respectively. At December 31, 2020, the Company had pledged available for sale mortgage-related securities and other debt securities with carrying values of $898 million and $380 million, respectively. In addition, the Company had $33.9 billion and $33.5 billion of loans pledged to the FHLB-NY to serve as collateral for its wholesale borrowings at the respective year-ends.

Loan Commitments and Letters of Credit

At December 31, 2021 and 2020, the Company had commitments to originate loans, including unused lines of credit, of $2.8 billion and $2.5 billion, respectively. The majority of the outstanding loan commitments at those dates were expected to close within 90 days. In addition, the Company had commitments to originate letters of credit totaling $291 million and $376 million at December 31, 2021 and 2020.

The following table summarizespresents the Company’s off-balance sheet commitmentsnet gain (loss) recognized in income on derivatives not designated as hedging instruments, net of the impact of offsetting positions:


For the Years Ended December 31,
(dollars in millions)20232022
Derivatives not designated as hedging instrumentsLocation of Gain (Loss)
FuturesNet return on mortgage servicing rights$$(1)
Interest rate swaps and swaptionsNet return on mortgage servicing rights(34)(11)
Mortgage-backed securities forwardsNet return on mortgage servicing rights(15)(4)
Rate lock commitments and US Treasury futuresNet gain on loan sales28 
Forward commitmentsOther noninterest income— (1)
Interest rate swaps (1)
Other non-interest income(1)— 
Total derivative (loss) gain$(47)$11 
(1) Includes customer-initiated commercial interest rate swaps.

Note 16 - Intangible Assets

Goodwill

We record goodwill in our consolidated statements of condition in connection with certain of our business combinations. Goodwill, which is tested at least annually for impairment, refers to originate loansthe difference between the purchase price and letters of credit at December 31, 2021:

(in millions)

Mortgage Loan Commitments:

Multi-family and commercial real estate

$

352

One-to-four family

Acquisition, development, and construction

168

Total mortgage loan commitments

$

520

Other loan commitments

2,301

Total loan commitments

$

2,821

Commercial, performance stand-by, and financial stand-by letters of credit

291

Total commitments

$

3,112

119


Financial Guarantees

The Company provides guarantees and indemnifications to its customers to enable them to complete a variety of business transactions and to enhance their credit standings. These guarantees are recorded at their respective fair values in “Other liabilities” in the Consolidated Statements of Condition. The Company deems the fair value of an acquired company’s assets, net of the guarantees to equal the consideration received.

The following table summarizes the Company’s guarantees and indemnifications atliabilities assumed. As of December 31, 2021:

(in millions)


Expires Within
One Year


Expires After
One Year


Total
Outstanding
Amount


Maximum
Potential
Amount of
Future Payments


Financial stand-by letters of credit


$


77


$


60


$


137


$


271


Performance stand-by letters of credit


3


3


3


Commercial letters of credit


7


1


8


17


Total letters of credit


$


87


$


61


$


148


$


291


The maximum potential amount2023, the Company identified a triggering event and applied a market approach using the end of future payments represents the notional amounts that could be funded under the guaranteesday stock price. We evaluated those conditions known and indemnifications if there were a total defaultknowable by the guaranteed parties or if indemnification provisions were triggered,company and how a market participant would view the control premium as applicable, without consideration of possible recoveries under recourse provisions or from collateral held or pledged.

The Company collects fees upon the issuance of commercial and stand-by letters of credit. Fees for stand-by letters of credit fees are initially recordedconfirmed by the Companysubsequent confirming market evidence. This adjusted market capitalization was then compared to the carrying value to determine the extent of the shortfall which was calculated to be in excess of the goodwill balance. The Company’s assessment concluded that goodwill from historical transactions (2007 and prior) was fully impaired as of December 31, 2023. As a liability, and are recognized as income periodically through the respective expiration dates. Fees for commercial letters of credit are collected and recognized as income at the time that they are issued and upon payment of each set of documents presented. In addition,result, the Company requires adequate collateral, typicallyrecorded an impairment charge of the entire goodwill balance of $2.4 billion.


Goodwill and related changes in the form of cash, real property, and/or personal guarantees upon its issuance of irrevocable stand-by letters of credit. Commercial letters of credit are primarily secured by the goods being purchased in the underlying transaction and are also personally guaranteed by the owner(s) of the applicant company.

At December 31, 2021, the Company had 0 commitments to purchase securities.

Legal Proceedings

Following the announcement of the Merger Agreement, the first of four lawsuits was filed on June 23, 2021 in United States Federal District Courts by alleged stockholders of NYCB against NYCB and the members of its board of directors challenging the accuracy or completeness of the disclosures contained in the Form S-4 filed on June 25, 2021 by NYCB with the SEC relating to the proposed Merger. Four additional lawsuits were filed by alleged Flagstar stockholders in state and federal courts against Flagstar and its board of directors (and, in one instance, NYCB and 615 Corp.) challenging the proposed Merger or Flagstar’s disclosures relating to the Merger, and those four lawsuits have since been resolved and dismissed. The complaints in the actions against NYCB allege, among other things, that the defendants caused a materially incomplete and misleading Form S-4 relating to the proposed Merger to be filed with the SEC in violation of Section 14(a) and Section 20(a) of the Securities Exchange Act of 1934, as amended, and Rule 14a-9 promulgated thereunder. None of NYCB defendants has been served with the complaint in any of these actions, and NYCB believes that these claims are without merit.

120


NOTE 13: INTANGIBLE ASSETS

Goodwill

Goodwill is presumed to have an indefinite useful life and is tested for impairment, rather than amortized, at the reporting unit level, at least once a year. There was 0 change in goodwillcarrying amount during the year ended December 31, 2021.

2023 are as follows:

NOTE 14: EMPLOYEE BENEFITS

(in millions)Gross Carrying Amount
Balance at December 31, 2022$2,426 
Impairment(2,426)
Balance at December 31, 2023$— 

Retirement Plan
126


Finite-lived Intangible Assets
The New York Community Bancorp, Inc. Retirement Plan (the “Retirement Plan”) covers substantially all employees who had attained minimum age, service, and employment status requirements prior to the date when the individual plans were frozen by the banks of origin. Once frozen, the individual plans ceased to accrue additional benefits, service, and compensation factors, and became closed to employees who would otherwise have met eligibility requirements after the “freeze” date.

The following table sets forth certain information regarding the Retirement Plan asAs a result of the dates indicated:Signature Transaction, the Company recorded


December 31,


(in millions)

2021


2020


Change in Benefit Obligation:


Benefit obligation at beginning of year

$

172


$

160


Interest cost


4


5


Actuarial loss (gain)


(9

)


15


Annuity payments


(6

)


(7

)

Settlements


(3

)


(1

)

Benefit obligation at end of year

$

158


$

172


Change in Plan Assets:


Fair value of assets at beginning of year

$

261


$

243


Actual return (loss) on plan assets


31


26


Contributions


Annuity payments


(6

)


(7

)

Settlements


(3

)


(1

)

Fair value of assets at end of year

$

283


$

261


Funded status (included in “Other assets”)

$

125


$

89


Changes recognized in other comprehensive income for the year ended
   December 31:


Amortization of prior service cost

$


$


Amortization of actuarial loss


(7

)


(7

)

Net actuarial (gain) loss arising during the year


(23

)


4


Total recognized in other comprehensive income for the year (pre-tax)

$

(30

)


$

(3

)

Accumulated other comprehensive loss (pre-tax) not yet recognized
   in net periodic benefit cost at December 31:


Prior service cost

$


$


Actuarial loss, net


43


73


Total accumulated other comprehensive loss (pre-tax)

$

43


$

73


In 2022, an estimated $2 $464 million of unrecognized net actuarial loss for the Retirement Plan will be amortized from AOCL into net periodic benefit cost. The comparable amount recognized as net periodic benefit cost in 2021 was $7 million. NaN prior service cost will be amortized in 2022core deposit intangible and other intangible assets that are amortizable.

NaN
was amortized in 2021. The discount rates used to determine the benefit obligation atAt December 31, 2021 and 2020 were 20232.6% and 2.2%, respectively.

The discount rate reflects rates at which the benefit obligation could be effectively settled. To determine this rate, the Company considers rates of return on high-quality fixed-income investments that are currently available and are expected to be available during the period until the pension benefits are paid. The expected future payments are

121


discounted based on a portfolio of high-quality rated bonds (AA or better) for which the Company relies on the Financial Times Stock Exchange (“FTSE”) Pension Liability Index that is published asintangible assets consisted of the measurement date.following:


December 31, 2023December 31, 2022
(in millions)Gross Carrying AmountAccumulated AmortizationNet Carrying ValueGross Carrying AmountAccumulated AmortizationNet Carrying Value
Core deposit intangible$700 $(113)$587 $250 $(4)$246 
Other intangible assets56(18)3842(1)41
Total other intangible assets$756 $(131)$625 $292 $(5)$287 

The components of net periodic pension (credit) expense were as follows for the years indicated:


Years Ended December 31,


(in millions)


2021


2020


2019


Components of net periodic pension expense (credit):


Interest cost


$

4


$

5


$

6


Expected return on plan assets


(16

)


(15

)


(14

)

Amortization of net actuarial loss


7


7


10


Net periodic pension (credit) expense


$

(5

)


$

(3

)


$

2


The following table indicates the weighted average assumptions used in determining the net periodic benefit cost for the years indicated:


Years Ended December 31,


2021


2020


2019


Discount rate


2.2

%


3.0

%


4.1

%

Expected rate of return on plan assets


6.3


6.5


6.8


As of December 31, 2021, Retirement Plan2023 the weighted average amortization period for core deposit intangible and other intangible assets were invested in two diversified investment portfoliosis 10 years and 5.1 years, respectively.


The estimated amortization expense of the Pentegra Retirement Trust (the “Trust”), a private placement investment fund.

The Company (in this context, the “Plan Sponsor”) chooses the specific asset allocationCDI and other intangible assets for the Retirement Plan withinnext five years is as follows:


(in millions)Amortization Expense
2024$132 
2025107 
202694 
202781 
202868 
Total$482 

Note 17 - Capital

The Bank is subject to regulation, examination, and supervision by the parameters set forthOCC and the Federal Reserve (the “Regulators”). The Bank is also governed by numerous federal and state laws and regulations, including the FDIC Improvement Act of 1991, which established five categories of capital adequacy ranging from “well capitalized” to “critically undercapitalized.” Such classifications are used by the FDIC to determine various matters, including prompt corrective action and each institution’s FDIC deposit insurance premium assessments. Capital amounts and classifications are also subject to the Regulators’ qualitative judgments about the components of capital and risk weightings, among other factors.

The quantitative measures established to ensure capital adequacy require that banks maintain minimum amounts and ratios of leverage capital to average assets and of common equity tier 1 capital, tier 1 capital, and total capital to risk-weighted assets (as such measures are defined in the Trust’s Investment Policy Statement. The long-term investment objectives areregulations). At December 31, 2023, our capital measures continued to maintain the Retirement Plan’s assets at a level that will sufficiently cover the Plan Sponsor’s long-term obligations, and to generate a return on those assets that will meet or exceed the rateminimum federal requirements for a bank holding company and for a bank. The following tables sets forth our common equity tier 1, tier 1 risk-based, total risk-based, and leverage capital amounts and ratios on a consolidated basis and for the Bank on a stand-alone basis, as well as the respective minimum regulatory capital requirements, at which the Plan Sponsor’s long-term obligations will grow.

The Retirement Plan allocates its assets in accordance with the following targets:

To hold 55% of its assets in equity securities via investment in the Trust’s Long-Term Growth—Equity (“LTGE”) Portfolio, a diversified portfolio that invests in a number of actively and passively managed equity mutual funds and collective trusts in order to gain exposure to both U.S. and non-U.S. equity markets;
date:
To hold 44% of its assets in intermediate-term investment-grade bonds via investment in the Long-Term Growth—Fixed Income (“LTGFI”) Portfolio, a diversified portfolio that invests in a number of fixed-income mutual funds and collective investment trusts, primarily including intermediate-term bond funds with a focus on U.S. investment grade securities and opportunistic allocations to below-investment grade and non-U.S. investments; and
To hold 1% in a cash equivalents portfolio for liquidity purposes.

In addition, the Retirement Plan holds Company shares, the value of which is approximately equal to 13% of the assets that are held by the Trust.

The LTGE and LTGFI portfolios are designed to provide long-term growth of equity and fixed-income assets with the objective of achieving an investment return in excess of the cost of funding the active life, deferred vesting, and all 30-year term and longer obligations of retired lives in the Trust. Risk and volatility are further managed in accordance with the distinct investment objectives of the Trust’s respective portfolios.

122


The following table presents information about the fair value measurementsactual capital amounts and ratios for the Company:


Risk-Based Capital
December 31, 2023Common Equity Tier 1Tier 1TotalLeverage Capital
(dollars in millions)AmountRatioAmountRatioAmountRatioAmountRatio
Total capital$8,009 9.05 %$8,512 9.62 %$10,415 11.77 %$8,512 7.75 %
Minimum for capital adequacy purposes3,983 4.50 5,310 6.00 7,081 8.00 4,392 4.00 
Excess$4,026 4.55 %$3,202 3.62 %$3,334 3.77 %$4,120 3.75 %
December 31, 2022
Total capital$6,335 9.06 %$6,838 9.78 %$8,154 11.66 %$6,838 9.70 %
Minimum for capital adequacy purposes3,146 4.50 4,195 6.00 5,593 8.00 2,819 4.00 
Excess$3,189 4.56 %$2,643 3.78 %$2,561 3.66 %$4,019 5.70 %

127


The following table presents the actual capital amounts and ratios for the Bank:

Risk-Based Capital
December 31, 2023Common Equity Tier 1Tier 1TotalLeverage Capital
(dollars in millions)AmountRatioAmountRatioAmountRatioAmountRatio
Total capital$9,305 10.52 %$9,305 10.52 %$10,271 11.61 %$9,305 8.48 %
Minimum for capital adequacy purposes3,980 4.50 5,307 6.00 7,076 8.00 4,389 4.00 
Excess$5,325 6.02 %$3,998 4.52 %$3,195 3.61 %$4,916 4.48 %
December 31, 2022
Total capital$7,653 10.96 %$7,653 10.96 %$7,982 11.43 %$7,653 10.87 %
Minimum for capital adequacy purposes3,142 4.50 4,189 6.00 5,585 8.00 2,817 4.00 
Excess$4,511 6.46 %$3,464 4.96 %$2,397 3.43 %$4,836 6.87 %

At December 31, 2023, our total risk-based capital ratio exceeded the minimum requirement for capital adequacy purposes by 377 basis points and the fully phased-in capital conservation buffer by 127 basis points.

The Bank also exceeded the minimum capital requirements to be categorized as “Well Capitalized.” To be categorized as well capitalized, a bank must maintain a minimum common equity tier 1 ratio of 6.50 percent; a minimum tier 1 risk-based capital ratio of 8 percent; a minimum total risk-based capital ratio of 10 percent; and a minimum leverage capital ratio of 5 percent.

Preferred Stock

On March 17, 2017, the Company issued 20,600,000 depositary shares, each representing a 1/40th interest in a share of the investments held byCompany’s Fixed-to-Floating Rate Series A Noncumulative Perpetual Preferred Stock, par value $0.01 per share, with a liquidation preference of $1.00 per share (equivalent to $25 per depositary share). Dividends will accrue on the Retirement Plan asdepositary shares at a fixed rate equal to 6.375 percent per annum until March 17, 2027, and a floating rate equal to Three-month LIBOR plus 382.1 basis points per annum beginning on March 17, 2027. Dividends will be payable in arrears on March 17, June 17, September 17, and December 17 of each year, which commenced on June 17, 2017.
Treasury Stock Repurchases

On October 23, 2018, the Board of Directors approved the repurchase of up to $300 million of the Company’s outstanding common stock. As of December 31, 2021:

(in millions)

Total


Quoted Prices
in Active
Markets for
Identical
Assets
(Level 1)


Significant Other
Observable Inputs
(Level 2)


Significant
Unobservable
Inputs
(Level 3)


Equity:


Large-cap value (1)

$


24


$


$


24


$


Large-cap growth (2)


27


27


Large-cap core (3)


17


17


Mid-cap value (4)


7


7


Mid-cap growth (5)


6


6


Mid-cap core (6)


6


6


Small-cap value (7)


3


3


Small-cap growth (8)


7


7


Small-cap core (9)


5


5


International equity (10)


37


37


Fixed Income Funds:


Fixed Income – U.S. Core (11)


77


77


Intermediate duration (12)


26


26


Equity Securities:


Company common stock


36


36


Cash Equivalents:


Money market *


5


1


4


$


283


$


37


$


246


$


* Includes cash equivalent investments in equity and fixed income strategies.

(1)
This category contains large-cap stocks with above-average yield. The portfolio typically holds between 60 and 70 stocks.
(2)
This category seeks long-term capital appreciation by investing primarily in large growth companies based in2023, the U.S.
(3)
This fund tracks the performanceCompany has repurchased a total of the S&P 500 Index by purchasing the securities represented in the Index in approximately the same weightings as the Index.
(4)
This category employs30 million shares at an indexing investment approach designed to track the performanceaverage price of the CRSP US Mid-Cap Value Index.
(5)
This category employs$9.61 or an indexing investment approach designed to track the performanceaggregate purchase of the CRSP US Mid-Cap Growth Index.
(6)
This category seeks to track the performance of the S&P Midcap 400 Index.
(7)
This category consists of a selection of investments based on the Russell 2000 Value Index.
(8)
This category consists of a mutual fund invested in small cap growth companies along with a fund invested in a selection of investments based on the Russell 2000 Growth Index.
(9)
This category consists of a mutual fund investing in readily marketable securities of U.S. companies with market capitalizations within the smallest 10% of the market universe, or smaller than the 1000th largest US company.
(10)
This category invests primarily in medium to large non-US companies in developed and emerging markets. Under normal circumstances, at least 80% of total assets will be invested in equity securities, including common stocks, preferred stocks, and convertible securities.
(11)
This category currently includes equal investments in 3 mutual funds, two of which usually hold at least 80% of fund assets in investment grade fixed income securities, seeking to outperform the Barclays US Aggregate Bond Index while maintaining

123


a similar duration to that index. The third fund targets investments of 50% or more in mortgage-backed securities guaranteed by the US government and its agencies.
(12)
This category consists of a mutual fund which invest in a diversified portfolio of high-quality bonds and other fixed income securities, including U.S. Government obligations, mortgage-related and asset backed securities, corporate and municipal bonds, CMOs, and other securities mostly rated A or better.

Current Asset Allocation

The asset allocations for the Retirement Plan as of December 31, 2021 and 2020 were as follows:


At December 31,


2021


2020


Equity securities


62

%


60

%

Debt securities


36


38


Cash equivalents


2


2


Total


100

%


100

%

Determination of Long-Term Rate of Return

The long-term rate of return on Retirement Plan assets assumption was based on historical returns earned by equities and fixed income securities, and adjusted to reflect expectations of future returns as applied to the Retirement Plan’s target allocation of asset classes. Equities and fixed income securities were assumed to earn long-term rates of return in the ranges of 6% to 8% and 3% to 5%, respectively, with an assumed long-term inflation rate of 2.5% reflected within these ranges. When these overall return expectations are applied to the Retirement Plan’s target allocations, the result is an expected rate of return of 5% to 7%.

Expected Contributions

$286 million. The Company does not expect to contribute to the Retirement Plan in 2022.

Expected Future Annuity Payments

The following annuity payments, which reflect expected future service, as appropriate, are expected to be paid by the Retirement Planhad no repurchases during the years indicated:

(in millions)


2022

$


8


2023


8


2024


8


2025


9


2026


8


2027 and thereafter


44


Total

$


85


Qualified Savings Plan (401(k) Plan)

The Company maintains a defined contribution qualified savings plan in the form of a 401(k) plan in which all salaried employees are able to participate after one month of service and having attained age 21. The Company instituted a safe harbor matching contribution program during2023. During the year ended December 31, 2020, and accordingly,2022, the Company matchesrepurchased 871,710 shares, at a portion of employee 401(k) plan contributions. Such expense totaled $6 million for the twelve months ended December 31, 2021 and 2020.

Post-Retirement Health and Welfare Benefits

The Company offers certain post-retirement benefits, including medical, dental, and life insurance (the “Health & Welfare Plan”) to retired employees, depending on age and years of service at the time of retirement. The costs of such benefits are accrued during the years that an employee renders the necessary service.

124


The Health & Welfare Plan is an unfunded plan and is not expected to hold assets for investment at any time. Any contributions made to the Health & Welfare Plan are used to immediately pay plan premiums and claims as they come due.

The following table sets forth certain information regarding the Health & Welfare Plan as of the dates indicated:


December 31,


(in millions)


2021


2020


Change in benefit obligation:


Benefit obligation at beginning of year


$


12


$

12


Interest cost


Actuarial gain


(2

)


Premiums and claims paid


Benefit obligation at end of year


$


10


12


Change in plan assets:


Fair value of assets at beginning of year


$


$


Employer contribution


1


Premiums and claims paid


(1

)

Fair value of assets at end of year


$


$


Funded status (included in “Other liabilities”)


$


(10

)


(12

)

Changes recognized in other comprehensive income for
   the year ended December 31:


Amortization of prior service cost


$


$


Amortization of actuarial gain


Net actuarial (gain) loss arising during the year


(2

)


Total recognized in other comprehensive income for the year (pre-tax)


$


(2

)


$


Accumulated other comprehensive loss (pre-tax) not yet recognized
   in net periodic benefit cost at December 31:


Prior service cost


$


$


Actuarial loss, net


1


Total accumulated other comprehensive income (pre-tax)


$


$

1


The discount rates used in the preceding table were 2.3% at December 31, 2021 and 2.0% at December 31, 2020.

The estimated net actuarial loss and the prior service liability that will be amortized from AOCL into net periodic benefit cost in 2022 are $0 and $0, respectively.

The following table presents the components of net periodic benefit cost for the years indicated:


Years Ended December 31,


(in millions)


2021


2020


2019


Components of Net Periodic Benefit Cost:


Service cost


$

0


$

0


$

0


Interest cost


0


0


0


Amortization of past-service liability


0


0


0


Amortization of net actuarial loss


0


0


0


Net periodic benefit cost


$

0


$

0


$

0


(1) All numbers round to zero.

125


The following table presents the weighted average assumptions used in determining the net periodic benefit cost for the years indicated:


Years Ended December 31,


2021


2020


2019


Discount rate


2.0


%


2.9


%


3.9

%

Current medical trend rate


6.5


6.5


6.5


Ultimate trend rate


5.0


5.0


5.0


Year when ultimate trend rate will be reached


2027


2026


2025


Expected Contributions

The Company expects to contribute $1 million to the Health & Welfare Plan to pay premiums and claims in the fiscal year ending December 31, 2022.

Expected Future Payments for Premiums and Claims

The following amounts are currently expected to be paid for premiums and claims during the years indicated under the Health & Welfare Plan:

(in millions)


2022

$


1


2023


1


2024


1


2025


1


2026


1


2027 and thereafter


2


Total

$


7


NOTE 15: STOCK-RELATED BENEFIT PLANS

New York Community Bank Employee Stock Ownership Plan

On December 6, 2021, the ESOP was terminated with the assets in the ESOP merged into the employee’s 401(k) plan. After the merger of the ESOP into the 401(k) plan, the Company allocated $4 million into eligible participant’s accounts.

In 2020 and 2019, the Company allocated 405,167 and 349,356 shares, respectively, to participants in the ESOP. For each of the years ended December 31, 2021, 2020, and 2019, the Company recorded expense of $4 million.

Supplemental Executive Retirement Plan

The Bank has established a Supplemental Executive Retirement Plan (“SERP”), which provided additional unfunded, non-qualified benefits to certain participants in the ESOP in the form of Company common stock. The SERP was frozen in 1999. Trust-held assets, consisting entirely of Company common stock, amounted to 1,006,186 and 2,191,915 shares, respectively, at December 31, 2021 and 2020, including shares purchased through dividend reinvestment. The cost of these shares is reflected as a reduction of paid-in capital in excess of par in the Consolidated Statements of Condition.$8 million.


Note 18 - Fair Value Measures

Stock Based Compensation

At December 31, 2021, the Company had a total of 8,548,783 shares available for grants as restricted stock, options, or other forms of related rights under the 2020 Incentive Plan, which was approved by the Company’s shareholders at its Annual Meeting on June 3, 2020. The Company granted 3,131,949 shares of restricted stock, with an average fair value of $11.20 per share on the date of grant, during the twelve months ended December 31, 2021.

126


During 2020 and 2019, the Company granted 2,421,345 shares and 2,031,198 shares, respectively, of restricted stock, which had average fair values of $11.61 and $10.45 per share on the respective grant dates. The shares of restricted stock that were granted during the years ended December 31, 2021, 2020, and 2019 vest over a period of five years. Compensation and benefits expense related to the restricted stock grants is recognized on a straight-line basis over the vesting period and totaled $27 million, $28 million, and $31 million, respectively, for the years ended December 31, 2021, 2020, and 2019.

The following table provides a summary of activity with regard to restricted stock awards in the year ended December 31, 2021:


For the Year Ended
December 31, 2021


Number of Shares


Weighted
Average
Grant Date
Fair Value


Unvested at beginning of year


6,228,048


$

12.43


Granted


3,131,949


11.20


Vested


(2,107,282

)


13.15


Canceled


(302,380

)


11.71


Unvested at end of year


6,950,335


11.68


As of December 31, 2021, unrecognized compensation cost relating to unvested restricted stock totaled $55 million. This amount will be recognized over a remaining weighted average period of 2.9 years.

The following table provides a summary of activity with regard to Performance-Based Restricted Stock Units ("PSUs") in the twelve months ended December 31, 2021:

Number of
Shares

Performance
Period

Expected
Vesting
Date

Outstanding at beginning of year

477,872

Granted

356,740

January 1, 2021 - December 31, 2023

March 31, 2024

Outstanding at end of period

834,612

PSUs are subject to adjustment or forfeiture, based upon the achievement by the Company of certain performance standards. Compensation and benefits expense related to PSUs is recognized using the fair value as of the date the units were approved, on a straight-line basis over the vesting period and totaled $5 million and $1 million for the twelve months ended December 31, 2021 and December 31, 2020. As of December 31, 2021, unrecognized compensation cost relating to unvested restricted stock totaled $5 million. This amount will be recognized over a remaining weighted average period of 1.4 years. As of December 31, 2021, the Company believes it is probable that the performance conditions will be met.

127


NOTE 16: FAIR VALUE MEASUREMENTS

GAAP sets forth a definition of fair value, establishes a consistent framework for measuring fair value, and requires disclosure for each major asset and liability category measured at fair value on either a recurring or non-recurring basis. GAAP also clarifies that fair value is an “exit” price, representing the amount that would be received when selling an asset, or paid when transferring a liability, in an orderly transaction between market participants. Fair value is thus a market-based measurement that should be determined based on assumptions that market participants would use in pricing an asset or liability. As a basis for considering such assumptions, GAAP establishes a three-tier fair value hierarchy, which prioritizes the inputs used in measuring fair value as follows:


Level 1 – Inputs to the valuation methodology are quoted prices (unadjusted) for identical assets or liabilities in active markets.
Level 2 – Inputs to the valuation methodology include quoted prices for similar assets and liabilities in active markets, and inputs that are observable for the asset or liability, either directly or indirectly, for substantially the full term of the financial instrument.
Level 3 – Inputs to the valuation methodology are significant unobservable inputs that reflect a company’s own assumptions about the assumptions that market participants use in pricing an asset or liability.

128


A financial instrument’s categorization within this valuation hierarchy is based upon the lowest level of input that is significant to the fair value measurement.

The following tables present assets and liabilities that were measured at fair value on a recurring basis as of December 31, 20212023 and 2020,December 31, 2022, and that were included in the Company’s Consolidated Statements of Condition at those dates:


December 31, 2023
(in millions)Quoted Prices in Active Markets for Identical Assets
(Level 1)
Significant Other Observable Inputs
(Level 2)
Significant Unobservable Inputs
(Level 3)
Netting AdjustmentsTotal Fair Value
Assets:
Mortgage-related Debt Securities Available for Sale:
GSE certificates$— $1,221 $— $— $1,221 
GSE CMOs— 5,162 — — 5,162 
Private Label CMOs— 148 32 — 180 
Total mortgage-related debt securities$— $6,531 $32 $— $6,563 
Other Debt Securities Available for Sale:
U. S. Treasury obligations$198 $— $— $— $198 
GSE debentures— 1,609 — — 1,609 
Asset-backed securities— 302 — — 302 
Municipal bonds— — — 
Corporate bonds— 343 — — 343 
Foreign notes— 34 — — 34 
Capital trust notes— 90 — — 90 
Total other debt securities$198 $2,384 $— $— $2,582 
Total debt securities available for sale$198 $8,915 $32 $— $9,145 
Equity securities:
Mutual funds and common stock— 14 — — 14 
Total equity securities— 14 — — 14 
Total securities$198 $8,929 $32 $— $9,159 
Loans held-for-sale
Residential first mortgage loans$— $770 $— $— $770 
Acquisition, development, and construction— 123 — — 123 
Commercial and industrial loans— — — — 
Derivative assets
Interest rate swaps and swaptions— 115 — — 115 
Futures— — — — — 
Rate lock commitments (fallout-adjusted)— — 12 — 12 
Mortgage-backed securities forwards— 11 — — 11 
Mortgage servicing rights— — 1,111 — 1,111 
Total assets at fair value$198 $9,957 $1,155 $— $11,310 
Derivative liabilities
Mortgage-backed securities forwards— 32 — — 32 
Futures— — — 
Interest rate swaps and swaptions— 59 — — 59 
Rate lock commitments (fallout-adjusted)— — — 
Total liabilities at fair value$— $92 $$— $95 


Fair Value Measurements at December 31, 2021


(in millions)

Quoted
Prices in
Active
Markets for
Identical
Assets
(Level 1)


Significant
Other
Observable
Inputs
(Level 2)


Significant
Unobservable
Inputs
(Level 3)


Netting
Adjustments


Total
Fair
Value


Assets:


Mortgage-related Debt Securities
   Available for Sale:


GSE certificates

$


$

1,107


$


$


$

1,107


GSE CMOs


1,683


1,683


Total mortgage-related debt securities

$


$

2,790


$


$


$

2,790


Other Debt Securities Available for Sale:


U. S. Treasury obligations

$

45


$


$


$


$

45


GSE debentures


1,480


1,480


Asset-backed securities


479


479


Municipal bonds


25


25


Corporate bonds


838


838


Foreign notes


26


26


Capital trust notes


97


97


Total other debt securities

$

45


$

2,945


$


$


$

2,990


Total debt securities available for sale

$

45


$

5,735


$


$


$

5,780


Equity securities:


Preferred stock

$


$


$


$


$


Mutual funds and common stock


16


16


Total equity securities

$


$

16


$


$


$

16


Total securities

$

45


$

5,751


$


$


$

5,796


128

129


Fair Value Measurements at December 31, 2020


(in millions)


Quoted
Prices
in Active
Markets for
Identical
Assets
(Level 1)


Significant
Other
Observable
Inputs
(Level 2)


Significant
Unobservable
Inputs
(Level 3)


Netting
Adjustments


Total
Fair Value


Assets:


Mortgage-Related Debt Securities
   Available for Sale:


GSE certificates


$


$

1,209


$

��


$


$

1,209


GSE CMOs


1,829


1,829


Total mortgage-related debt securities


$


$

3,038


$


$


$

3,038


Other Debt Securities Available
   for Sale:


U.S. Treasury obligations


$

65


$


$


$


$

65


GSE debentures


1,158


1,158


Asset-backed securities


527


527


Municipal bonds


26


26


Corporate bonds


882


882


Foreign notes


26


26


Capital trust notes


91


91


Total other debt securities


$

65


$

2,710


$


$


$

2,775


Total debt securities available for sale


$

65


$

5,748


$


$


$

5,813


Equity securities:


Preferred stock


$

15


$


$


$


$

15


Mutual funds and common stock


16


16


Total equity securities


$

15


$

16


$


$


$

31


Total securities


$

80


$

5,764


$


$


$

5,844


December 31, 2022
(in millions)Quoted Prices in Active Markets for Identical Assets
(Level 1)
Significant Other Observable Inputs
(Level 2)
Significant Unobservable Inputs
(Level 3)
Netting AdjustmentsTotal Fair Value
Assets:
Mortgage-related Debt Securities Available for Sale:
GSE certificates$— $1,297 $— $— $1,297 
GSE CMOs3,3013,301
Private Label CMOs191191
Total mortgage-related debt securities$— $4,789 $— $— $4,789 
Other Debt Securities Available for Sale:
U. S. Treasury obligations$1,487 $— $— $— $1,487 
GSE debentures1,3981,398
Asset-backed securities361361
Municipal bonds3030
Corporate bonds885885
Foreign notes2020
Capital trust notes9090
Total other debt securities$1,487 $2,784 $— $— $4,271 
Total debt securities available for sale$1,487 $7,573 $— $— $9,060 
Equity securities:
Mutual funds and common stock1414
Total equity securities1414
Total securities$1,487 $7,587 $— $— $9,074 
Loans held-for-sale
Residential first mortgage loans$— $1,115 $— $— $1,115 
Derivative assets
Interest rate swaps and swaptions— 182 — — 182 
Futures— — — 
Rate lock commitments (fallout-adjusted)— — — 
Mortgage-backed securities forwards— 36 — — 36 
Mortgage servicing rights— — 1,033 — 1,033 
Total assets at fair value$1,487 $8,922 $1,042 $— $11,451 
Derivative liabilities
Mortgage-backed securities forwards— 61 — — 61 
Interest rate swaps and swaptions— 65 — — 65 
Rate lock commitments (fallout-adjusted)— — 10 — 10 
Total liabilities at fair value$— $126 $10 $— $136 

The Company reviews and updates the fair value hierarchy classifications for its assets on a quarterly basis. Changes from one quarter to the next that are related to the observability of inputs for a fair value measurement may result in a reclassification from one hierarchy level to another.

A description of the methods and significant assumptions utilized in estimating the fair values of securities follows:

Where quoted prices are available in an active market, securities are classified within Level 1 of the valuation hierarchy. Level 1 securities include highly liquid government securities and exchange-traded securities.

If quoted market prices are not available for a specific security, then fair values are estimated by using pricing models. These pricing models primarily use market-based or independently sourced market parameters as inputs, including, but not limited to, yield curves, interest rates, equity or debt prices, and credit spreads. In addition to observable market information, models incorporate transaction details such as maturity and cash flow assumptions. Securities valued in this manner would generally be classified within Level 2 of the valuation hierarchy, and primarily include such instruments as mortgage-related and corporate debt securities.

130


Periodically, the Company uses fair values supplied by independent pricing services to corroborate the fair values derived from the pricing models. In addition, the Company reviews the fair values supplied by independent pricing services, as well as their underlying pricing methodologies, for reasonableness. The Company challenges pricing service valuations that appear to be unusual or unexpected.

129


While the Company believes its valuation methods are appropriate, and consistent with those of other market participants, the use of different methodologies or assumptions to determine the fair values of certain financial instruments could result in different estimates of fair values at a reporting date.

Fair Value Measurements Using Significant Unobservable Inputs

The following tables include a roll forward of the Consolidated Statements of Condition amounts (including the change in fair value) for financial instruments classified by us within Level 3 of the valuation hierarchy:

(dollars in millions)Balance at Beginning of YearTotal Gains / (Losses) Recorded in Earnings (1)Purchases / OriginationsSalesSettlementTransfers In (Out)Balance at End of Year
Year Ended December 31, 2023
Assets
Mortgage servicing rights (1)
$1,033 $(79)$208 $(51)$1,111 
Private Label CMOs— — — — — 32 32 
Rate lock commitments (net) (1)(2)
(1)(49)104 — — (45)
Totals$1,032 $(128)$312 $(51)$— $(13)$1,152 
(1)We utilized swaptions, futures, forward agency and loan sales and interest rate swaps to manage the risk associated with mortgage servicing rights and rate lock commitments. Gains and losses for individual lines do not reflect the effect of our risk management activities related to such Level 3 instruments.

(2)Rate lock commitments are reported on a fallout-adjusted basis. Transfers out of Level 3 represent the settlement value of the commitments that are transferred to LHFS, which are classified as Level 2 assets.

The following tables present the quantitative information about recurring Level 3 fair value financial instruments and the fair value measurements as of December 31, 2023:

Fair ValueValuation Technique
Unobservable Input (1)
Range
(Weighted Average)
(dollars in millions)
Assets
Mortgage servicing rights$1,111Discounted cash flowsOption adjusted spread5.0% - 21.7% 5.4%
Constant prepayment rate—% - 10.0% 7.9%
Weighted average cost to service per loan$65.0 - $90.0 $69.0
Private Label CMOs$32Discounted cash flowsConstant default rates0.10% - 0.30%
Weighted average life8.2 - 11.8
Rate lock commitments (net)$9Consensus pricingOrigination pull-through rate64.30%
(1)Unobservable inputs were weighted by their relative fair value of the instruments.

131


Assets Measured at Fair Value on a Non-Recurring Basis

Certain assets are measured at fair value on a non-recurring basis. Such instruments are subject to fair value adjustments under certain circumstances (e.g., when there is evidence of impairment). The following tables present assets that were measured at fair value on a non-recurring basis as of December 31, 20212023 and 2020,December 31, 2022, and that were included in the Company’s Consolidated Statements of Condition at those dates:


Fair Value Measurements at December 31, 2021 Using


(in millions)


Quoted Prices
in Active
Markets for
Identical
Assets
(Level 1)


Significant
Other
Observable
Inputs
(Level 2)


Significant
Unobservable
Inputs
(Level 3)


Total Fair
Value


Certain loans (1)


$


$


$

32


$

32


Other assets(2)


32


32


Total


$


$


$

64


$

64


Fair Value Measurements at December 31, 2023 Using
(in millions)Quoted Prices in Active Markets for Identical Assets (Level 1)Significant Other Observable Inputs (Level 2)Significant Unobservable Inputs (Level 3)Total Fair Value
Certain impaired loans (1)
$— $— $197 $197 
Other assets(2)
— — 50 50 
Total$— $— $247 $247 
(1)
Represents the fair value of certainimpaired loans, individually assessed for impairment, based on the value of the collateral.
(2)
Represents the fair value of repossessed assets, based on the appraised value of the collateral subsequent to its initial classification as repossessed assets and equity securities without readily determinable fair values. These equity securities are classified as Level 3 due to the infrequency of the observable prices and/or the restrictions on the shares.

Fair Value Measurements at December 31, 2022 Using
(in millions)Quoted Prices in Active Markets for Identical Assets (Level 1)Significant Other Observable Inputs (Level 2)Significant Unobservable Inputs (Level 3)Total Fair Value
Certain impaired loans (1)
$— $— $28 $28 
Other assets(2)
— — 41 41 
Total$— $— $69 $69 


Fair Value Measurements at December 31, 2020 Using


(in millions)


Quoted Prices
in Active
Markets for
Identical
Assets
(Level 1)


Significant
Other
Observable
Inputs
(Level 2)


Significant
Unobservable
Inputs
(Level 3)


Total Fair
Value


Certain impaired loans (1)


$


$


$

41


$

41


Other assets (2)


6


6


Total


$


$


$

47


$

47


(1)
RepresentsRepresents the fair value of impaired loans, based on the value of the collateral.
(2)
RepresentsRepresents the fair value of repossessed assets, based on the appraised value of the collateral subsequent to its initial classification as repossessed assets.assets and equity securities without readily determinable fair values. These equity securities are classified as Level 3 due to the infrequency of the observable prices and/or the restrictions on the shares.


The fair values of collateral-dependent impaired loans are determined using various valuation techniques, including consideration of appraised values and other pertinent real estate and other market data.

Other Fair Value Disclosures

For the disclosure of fair value information about the Company’s on- and off-balance sheet financial instruments, when available, quoted market prices are used as the measure of fair value. In cases where quoted market prices are not available, fair values are based on present-value estimates or other valuation techniques. Such fair values are significantly affected by the assumptions used, the timing of future cash flows, and the discount rate.

Because assumptions are inherently subjective in nature, estimated fair values cannot be substantiated by comparison to independent market quotes. Furthermore, in many cases, the estimated fair values provided would not necessarily be realized in an immediate sale or settlement of such instruments.

132


130


The following tables summarize the carrying values, estimated fair values, and fair value measurement levels of financial instruments that were not carried at fair value on the Company’s Consolidated Statements of Condition at December 31, 20212023 and 2020:December 31, 2022:


December 31, 2021


Fair Value Measurement Using


(in millions)


Carrying
Value


Estimated
Fair Value


Quoted Prices
in Active
Markets
for Identical
Assets
(Level 1)


Significant
Other
Observable
Inputs
(Level 2)


Significant
Unobservable
Inputs
(Level 3)


Financial Assets:


Cash and cash equivalents


$


2,211


$


2,211


$


2,211


$


$


FHLB stock (1)


734


734


734


Loans and leases, net


45,539


44,748


44,748


Financial Liabilities:


Deposits


$


35,059


$


35,051


$


26,635


  (2)


$


8,416


  (3)


$


Borrowed funds


16,562


17,169


17,169


December 31, 2023
Fair Value Measurement Using
(in millions)Carrying ValueEstimated Fair ValueQuoted Prices in Active Markets for Identical Assets (Level 1)Significant Other Observable Inputs (Level 2)Significant Unobservable Inputs (Level 3)
Financial Assets:
Cash and cash equivalents$11,475 $11,475 $11,475 $— $— 
FHLB and FRB stock (1)
$1,392 $1,392 $— $1,392 $— 
Loans and leases held for investment, net$83,627 $79,333 $— $— $79,333 
Financial Liabilities:
Deposits$81,526 $81,247 $59,972 (2)$21,275 (3)$— 
Borrowed funds$21,267 $21,082 $— $21,082 $— 
(1)
Carrying value and estimated fair value are at cost.
(2)
Interest-bearing checking and money market accounts, savings accounts, and non-interest-bearing accounts.
(3)
Certificates of deposit.


December 31, 2020


Fair Value Measurement Using


(in millions)


Carrying
Value


Estimated
Fair Value


Quoted Prices
in Active
Markets
for Identical
Assets
(Level 1)


Significant
Other
Observable
Inputs
(Level 2)


Significant
Unobservable
Inputs
(Level 3)


Financial Assets:


Cash and cash equivalents


$

1,948


$

1,948


$

1,947,931


$


$


FHLB stock (1)


714


714


714


Loans and leases, net


42,807


42,376


42,376


Financial Liabilities:


Deposits


$

32,437


$

32,466


$

22,106


  (2)


$

10,360


  (3)


$


Borrowed funds


16,084


16,794


16,794


December 31, 2022
Fair Value Measurement Using
(in millions)Carrying ValueEstimated Fair ValueQuoted Prices in Active Markets for Identical Assets (Level 1)Significant Other Observable Inputs (Level 2)Significant Unobservable Inputs (Level 3)
Financial Assets:
Cash and cash equivalents$2,032 $2,032 $2,032 $— $— 
FHLB and FRB stock (1)
$1,267 $1,267 $— $1,267 $— 
Loans and leases held for investment, net$68,608 $65,673 $— $— $65,673 
Financial Liabilities:
Deposits$58,721 $58,479 $46,211 (2)$12,268 (3)$— 
Borrowed funds$21,332 $21,231 $— $21,231 — 
(1)
CarryingCarrying value and estimated fair value are at cost.
(2)
Interest-bearing checking and money market accounts, savings accounts, and non-interest-bearing accounts.
(3)
Certificates of deposit.

The methods and significant assumptions used to estimate fair values for the Company’s financial instruments follow:

Cash and Cash Equivalents

Cash and cash equivalents include cash and due from banks and federal funds sold. The estimated fair values of cash and cash equivalents are assumed to equal their carrying values, as these financial instruments are either due on demand or have short-term maturities.

Securities

Securities

If quoted market prices are not available for a specific security, then fair values are estimated by using pricing models, quoted prices of securities with similar characteristics, or discounted cash flows. These pricing models primarily use market-based or independently sourced market parameters as inputs, including, but not limited to, yield curves, interest rates, equity or debt prices, and credit spreads. In addition to observable market information, pricing models also incorporate transaction details such as maturities and cash flow assumptions.

131


Federal Home Loan Bank Stock

Ownership in equity securities of the FHLB is generally restricted and there is no established liquid market for their resale. The carrying amount approximates the fair value.

133


Loans and leases
Loans

The Company discloses the fair value of loans measured at amortized cost using an exit price notion. The Company determined the fair value on substantially all of its loans for disclosure purposes, on an individual loan basis. The discount rates reflect current market rates for loans with similar terms to borrowers having similar credit quality on an exit price basis. The estimated fair values of non-performing mortgage and other loans are based on recent collateral appraisals. For those loans where a discounted cash flow technique was not considered reliable, the Company used a quoted market price for each individual loan.

MSRs

The significant unobservable inputs used in the fair value measurement of the MSRs are option adjusted spreads, prepayment rates and cost to service. Significant increases (decreases) in all three assumptions in isolation result in a significantly lower (higher) fair value measurement. Weighted average life (in years) is used to determine the change in fair value of MSRs. For December 31, 2023, the weighted average life (in years) for the entire portfolio was 6.83.

Rate lock commitments

The significant unobservable input used in the fair value measurement of the rate lock commitments is the pull through rate. The pull through rate is a statistical analysis of our actual rate lock fallout history to determine the sensitivity of the residential mortgage loan pipeline compared to interest rate changes and other deterministic values. New market prices are applied based on updated loan characteristics and new fallout ratios (i.e. the inverse of the pull through rate) are applied accordingly. Significant increases (decreases) in the pull through rate in isolation result in a significantly higher (lower) fair value measurement.

Deposits

The fair values of deposit liabilities with no stated maturity (i.e., interest-bearing checking and money market accounts, savings accounts, and non-interest-bearing accounts) are equal to the carrying amounts payable on demand. The fair values of CDs represent contractual cash flows, discounted using interest rates currently offered on deposits with similar characteristics and remaining maturities. These estimated fair values do not include the intangible value of core deposit relationships, which comprise a portion of the Company’s deposit base.

Borrowed Funds

The estimated fair value of borrowed funds is based either on bid quotations received from securities dealers or the discounted value of contractual cash flows with interest rates currently in effect for borrowed funds with similar maturities and structures.

Off-Balance Sheet Financial Instruments

The fair values of commitments to extend credit and unadvanced lines of credit are estimated based on an analysis of the interest rates and fees currently charged to enter into similar transactions, considering the remaining terms of the commitments and the creditworthiness of the potential borrowers. The estimated fair values of such off-balance sheet financial instruments were insignificant at December 31, 20212023 and 2020.

December 31, 2022.

NOTE 17: DIVIDEND RESTRICTIONS

Fair Value Option

We elected the fair value option for certain items as discussed throughout the Notes to the Consolidated Financial Statements to more closely align the accounting method with the underlying economic exposure. Interest income on LHFS is accrued on the principal outstanding primarily using the "simple-interest" method.
The Parentfollowing table reflects the change in fair value included in earnings of financial instruments for which the fair value option has been elected:
For the Years Ended December 31,
(dollars in millions)20232022
Assets
Loans held-for-sale
Net gain on loan sales$43 $

134


The following table reflects the difference between the aggregate fair value and aggregate remaining contractual principal balance outstanding for assets and liabilities for which the fair value option has been elected:

December 31, 2023
(dollars in millions)Unpaid Principal BalanceFair ValueFair Value Over / (Under) UPB
Assets:
Nonaccrual loans:
Loans held-for-sale$$$— 
Total non-accrual loans$$$— 
Other performing loans:
Loans held-for-sale$869 $894 $25 
Total other performing loans$869 $894 $25 
Total loans:
Loans held-for-sale$871 $896 $25 
Total loans$871 $896 $25 

December 31, 2022
(dollars in millions)Unpaid Principal BalanceFair ValueFair Value Over / (Under) UPB
Assets:
Other performing loans:
Loans held-for-sale$1,095 $1,115 $20 
Total other performing loans$1,095 $1,115 $20 
Total loans:
Loans held-for-sale$1,095 $1,115 $20 
Total loans$1,095 $1,115 $20 

Note 19 - Commitments and Contingencies

Pledged Assets

The Company pledges securities to serve as collateral for its repurchase agreements, among other purposes. We had pledged investment securities of $2.8 billion and $434 million at December 31, 2023 and December 31, 2022, respectively. In addition, the Company had $43.1 billion and $44.5 billion of loans pledged to the FHLB-NY to serve as collateral for its wholesale borrowings at the respective year-ends.

Loan Commitments and Letters of Credit

In the normal course of business, we have various commitments outstanding which are not included on our Consolidated Statements of Financial Condition. The majority of the outstanding loan commitments were expected to close within 90 days.

The following table summarizes the Company’s off-balance sheet commitments to originate loans and letters of credit:

December 31,
(in millions)20232022
Multi-family and commercial real estate$52 $216 
One-to-four family including interest rate locks1,694 2,066 
Acquisition, development, and construction3,926 3,539 
Warehouse loan commitments7,074 8,042 
Other loan commitments11,315 7,964 
Total loan commitments$24,061 $21,827 
Commercial, performance stand-by, and financial stand-by letters of credit915 541 
Total commitments$24,976 $22,368 

135


Financial Guarantees

The Company provides guarantees and indemnifications to its customers to enable them to complete a variety of business transactions and to enhance their credit standings. These guarantees are recorded at their respective fair values in “Other liabilities” in the Consolidated Statements of Condition. The Company deems the fair value of the guarantees to equal the consideration received.
The following table summarizes the Company’s guarantees and indemnifications at December 31, 2023:
(in millions)Expires Within One YearExpires After One YearTotal Outstanding AmountMaximum Potential Amount of Future Payments
Financial stand-by letters of credit$254 $288 $542 $639 
Performance stand-by letters of credit100 102 102 
Commercial letters of credit— 174 
Total letters of credit$357 $290 $647 $915 

The maximum potential amount of future payments represents the notional amounts that could be funded under the guarantees and indemnifications if there were a total default by the guaranteed parties or if indemnification provisions were triggered, as applicable, without consideration of possible recoveries under recourse provisions or from collateral held or pledged.
The Company collects fees upon the issuance of commercial and stand-by letters of credit. Stand-by letters of credit fees are initially recorded by the Company as a liability and are recognized as income periodically through the respective expiration dates. Fees for commercial letters of credit are collected and recognized as income at the time that they are issued and upon payment of each set of documents presented. In addition, the Company requires adequate collateral, typically in the form of cash, real property, and/or personal guarantees upon its issuance of irrevocable stand-by letters of credit. Commercial letters of credit are primarily secured by the goods being purchased in the underlying transaction and are also personally guaranteed by the owner(s) of the applicant company.
At December 31, 2023, the Company had no commitments to purchase securities.
Legal Proceedings

The Company is a separateinvolved in various legal entity fromactions arising in the Bankordinary course of its business, including stockholder class and must provide for its own liquidity. In additionderivative actions. All such actions in the aggregate involve amounts that are believed by management to operating expenses and any share repurchases, the Parent Company is responsible for paying any dividends declaredbe immaterial to the Company’s shareholders. Asfinancial condition and results of operations of the Company. The outcome of any pending litigation is uncertain. There can be no assurance (i) that we will not incur material losses due to damages, penalties, costs and/or expenses as a Delaware corporation,result of such litigation, (ii) that the Parentreserves we have established will be sufficient to cover such losses, or (iii) that such losses will not materially exceed such reserves and have a material impact on our financial condition or results of operations. The Company may incur significant legal expenses in defending the litigation described above during the pendency of these matters, and in connection with any other potential cases, including expenses for the potential reimbursement of legal fees of officers and directors under indemnification obligations.


136


Note 20 - Employee Benefits

Retirement Plan

The New York Community Bancorp, Inc. Retirement Plan (the “Retirement Plan”) covers substantially all employees who had attained minimum age, service, and employment status requirements prior to the date when the individual plans were frozen by the banks of origin. Once frozen, the individual plans ceased to accrue additional benefits, service, and compensation factors, and became closed to employees who would otherwise have met eligibility requirements after the “freeze” date.

The following table sets forth certain information regarding the Retirement Plan as of the dates indicated:
December 31,
(in millions)20232022
Change in Benefit Obligation:
Benefit obligation at beginning of year$116 $158 
Interest cost
Actuarial gain(38)
Annuity payments(7)(7)
Settlements(1)(1)
Benefit obligation at end of year$115 $116 
Change in Plan Assets:
Fair value of assets at beginning of year$228 $283 
Actual return (loss) on plan assets33 (47)
Annuity payments(7)(7)
Settlements(1)(1)
Fair value of assets at end of year$253 $228 
Funded status (included in “Other assets”)$138 $112 
Changes recognized in other comprehensive income for the year ended December 31:
Amortization of actuarial loss$(7)$(2)
Net actuarial (gain) loss arising during the year(18)26 
Total recognized in other comprehensive income for the year (pre-tax)$(25)$24 
Accumulated other comprehensive loss (pre-tax) not yet recognized in net periodic benefit cost at December 31:
Actuarial loss, net$41 $66 
Total accumulated other comprehensive loss (pre-tax)$41 $66 

In 2024 $3 million of unrecognized net actuarial loss for the Retirement Plan will be amortized from AOCL into net periodic benefit cost, respectively. The comparable amount recognized as net actuarial loss for the Retirement Plan in 2023 was $7 million and no prior service cost was amortized in 2022. The discount rates used to determine the benefit obligation at December 31, 2023 and 2022 were 4.7 percent and 4.9 percent, respectively.
The discount rate reflects rates at which the benefit obligation could be effectively settled. To determine this rate, the Company considers rates of return on high-quality fixed-income investments that are currently available and are expected to be available during the period until the pension benefits are paid. The expected future payments are discounted based on a portfolio of high-quality rated bonds (AA or better) for which the Company relies on the Financial Times Stock Exchange (“FTSE”) Pension Liability Index that is published as of the measurement date.
The components of net periodic pension (credit) expense were as follows for the years indicated:

Years Ended December 31,
(in millions)202320222021
Components of net periodic pension expense (credit):
Interest cost$$$
Expected return on plan assets(14)(16)(16)
Amortization of net actuarial loss
Net periodic pension credit$(2)$(10)$(5)


137


The following table indicates the weighted average assumptions used in determining the net periodic benefit cost for the years indicated:

Years Ended December 31,
202320222021
Discount rate4.9 %2.6 %2.2 %
Expected rate of return on plan assets6.3 6.0 6.3 

The primary long-term objective for the Plan is to maintain assets at a level that will sufficiently cover future beneficiary obligations. A secondary long-term objective is to achieve long-term growth in assets. The Plan will be structured to include a volatility reducing component (the fixed income commitment) and a growth component (the equity commitment).

To achieve the Companies (in this context, the "Plan Sponsor") long-term investment objectives, the Trustee will invest the assets of the Plan in a diversified combination of asset classes, investment strategies, and pooled vehicles. The asset allocation guidelines in the table below reflect the plan sponsor’s risk tolerance and long-term objectives for the Plan. These parameters will be reviewed on a regular basis and subject to change following discussions between the plan sponsor and the Trustee.

Initially, the following asset allocation targets and ranges will guide the Trustee in structuring the overall allocation in the Plan’s investment portfolio. The plan sponsor or the Trustee may amend these allocations to reflect the most appropriate standards consistent with changing circumstances. Any such fundamental amendments in strategy will be discussed between the
plan sponsor and the Trustee prior to implementation.

Based on the above considerations, the following asset allocation ranges will be implemented:
Asset Allocation Parameters by Asset Class
EquityMinimumTargetMaximum
U.S. Large-Cap27%
U.S. Mid-Cap7%
U.S. Small-Cap7%
Non-U.S.14%
Total - Equity45%55%65%
Total - Fixed Income/Cash Equivalents35%45%55%

The parameters for each asset class provide the Trustee with the latitude for managing the Plan within a minimum and maximum range. The Trustee will have full discretion to buy, sell, invest and reinvest in these asset segments based on these guidelines which includes allowing the underlying investments to fluctuate within the stated policy ranges. The Plan will maintain a cash equivalents component (not to exceed 3 percent under normal circumstances) within the fixed income allocation for liquidity purposes.

The Trustee will monitor the actual asset segment exposures of the Plan on a regular basis and, periodically, may adjust the asset allocation within the ranges set forth above as it deems appropriate. Periodic reallocation of assets will be based on the Trustee’s perception of the changing risk/return opportunities of the respective asset classes.


138


The following table presents information about the fair value measurements of the investments held by the Retirement Plan as of December 31, 2023:

(in millions)TotalQuoted Prices in Active Markets for Identical Assets (Level 1)Significant Other Observable Inputs (Level 2)Significant Unobservable Inputs (Level 3)
Equity:
  Large-cap value (1)
$12 $12 $— $— 
  Large-cap growth (2)
22 22 — — 
  Large-cap core (3)
17 17 — — 
  Mid-cap core (4)
15 15 — — 
  Small-cap core (5)
16 16 — — 
  International growth (6)
18 18 — — 
  International value (7)
10 10 — — 
Fixed Income Funds:
  Intermediate - Core Plus (8)
98 98 — — 
Equity Securities:
  Company common stock31 31 — — 
Common/Collective Trusts-Equity:
  Large cap value (9)
13 — 13 — 
Cash Equivalents:
  Money market (10)
— 
$253 $240 $13 $— 
(1)This category consists of a mutual fund holding 100-160 stocks, designed to track and outperform the Russell 1000 Value Index.
(2)This category consists of two mutual funds which invest primarily in large-cap U.S. - based growth companies, one concentrating on long-term capital growth, the other in long-term capital appreciation and current income.
(3)This category contains stocks of the S&P 500 Index. The stocks are maintained in approximately the same weightings as the index.
(4)This category contains stocks of the CRSP U.S. Mid Cap Index, a broadly diversified index of stocks of medium-size U.S. companies. The stocks are maintained.
(5)This category seeks long-term capital appreciation through investment primarily in common stock of small-capitalization companies, with similar risk levels and characteristics to the Russell 2000 Index.
(6)This category consists of investments with long-term growth potential located primarily in Europe, the Pacific Basin, and other developed and emerging markets.
(7)This category invests primarily in medium to large well-established non-US companies. Under normal circumstances, at least 80 percent of total assets will be invested in equity securities, including common stocks, preferred stocks, and convertible securities.
(8)This category currently includes equal investments in four mutual funds, seeking to outperform the Bloomberg Barclays U.S. Aggregate Bond Index. Two of the funds hold at least 80 percent in investment grade fixed-income securities while one other holds at least 65 percent; the fourth fund targets investments of 50 percent or more in mortgage-backed securities guaranteed by the US government and its agencies.
(9)This category contains large-cap stocks with above-average yield. The portfolio typically holds between 60 and 70 stocks.
(10)This category consists of a money market fund and is used for liquidity purposes.

Current Asset Allocation
The asset allocations for the Retirement Plan were as follows:
December 31,
20232022
Equity securities61 %60 %
Debt securities39 %38 %
Cash equivalents— %%
Total100 %100 %

Determination of Long-Term Rate of Return
The long-term rate of return on Retirement Plan assets assumption was based on historical returns earned by equities and fixed income securities, and adjusted to reflect expectations of future returns as applied to the Retirement Plan’s target allocation of asset classes. Equities and fixed income securities were assumed to earn long-term rates of return in the ranges of 6 percent to 8 percent and 3 percent to 5 percent, respectively, with an assumed long-term inflation rate of 2.5 percent reflected within these ranges. When these overall return expectations are applied to the Retirement Plan’s target allocations, the result is an expected rate of return of 5 percent to 7 percent.

139


Expected Contributions
The Company does not expect to contribute to the Retirement Plan in 2023.
Expected Future Annuity Payments
The following annuity payments, which reflect expected future service, as appropriate, are expected to be paid by the Retirement Plan during the years indicated:

(in millions)
2024$
2025
2026
2027
2028
2029 and thereafter43 
Total$83 

Qualified Savings Plan (401(k) Plan)

The Company maintains a defined contribution qualified savings plan in the form of a 401(k) plan in which all salaried employees are able to participate after one month of service and having attained age 21. The Company instituted a safe harbor matching contribution program during the year ended December 31, 2020, and accordingly, the Company matches a portion of employee 401(k) plan contributions. Such expense totaled $21 million and $7 million for the year ended December 31, 2023 and 2022, respectively. Flagstar also maintains a defined contribution qualified savings plan in the form of a 401(k) plan in which certain employees are able to participate.

Post-Retirement Health and Welfare Benefits

The Company offers certain post-retirement benefits, including medical, dental, and life insurance (the “Health & Welfare Plan”) to retired employees, depending on age and years of service at the time of retirement. The costs of such benefits are accrued during the years that an employee renders the necessary service.
The Health & Welfare Plan is an unfunded plan and is not expected to hold assets for investment at any time. Any contributions made to the Health & Welfare Plan are used to immediately pay dividends eitherplan premiums and claims as they come due.

140


The following table sets forth certain information regarding the Health & Welfare Plan as of the dates indicated:

December 31,
(in millions)20232022
Change in benefit obligation:
Benefit obligation at beginning of year$$10 
Interest cost— 
Actuarial gain(2)
Premiums and claims paid(1)(1)
Benefit obligation at end of year$$
Change in plan assets:
Fair value of assets at beginning of year$— $— 
Employer contribution
Premiums and claims paid(1)(1)
Fair value of assets at end of year$— $— 
Funded status (included in “Other liabilities”)$(8)$(7)
Changes recognized in other comprehensive income for the year ended December 31:
Amortization of prior service cost— 
Amortization of actuarial gain— 
Net actuarial (gain) loss arising during the year(2)
Total recognized in other comprehensive income for the year (pre-tax)$$(2)
Accumulated other comprehensive (gain) loss (pre-tax) not yet recognized in net periodic benefit cost at December 31:
Prior service cost— 
Actuarial (gain) loss, net(1)(2)
Total accumulated other comprehensive income (pre-tax)$(1)$(2)

The discount rates used in the preceding table were 4.6 percent at December 31, 2023 and 4.8 percent at December 31, 2022.
The estimated net actuarial loss and the prior service liability that will be amortized from surplus or,AOCL into net periodic benefit cost in case there is no surplus, from2024 are less than $1 million, respectively.
The net profitsperiodic benefit costs and all components thereof for the years-ended December 31, 2023 and 2022 were less than $1 million.

The following table presents the weighted average assumptions used in determining the net periodic benefit cost for the years indicated:
Years Ended December 31,
202320222021
Discount rate4.8%2.3%2.0%
Current medical trend rate6.56.56.5
Ultimate trend rate5.05.05.0
Year when ultimate trend rate will be reached202920282027

Expected Contributions
The Company expects to contribute $1 million to the Health & Welfare Plan to pay premiums and claims in the fiscal year in which the dividend is declared and/or the preceding fiscal year.ending

Various legal restrictions limit the extent to which the Company’s subsidiary bank can supply funds to the Parent Company and its non-bank subsidiaries. The Company’s subsidiary bank would require the approval of the Superintendent of the NYSDFS if the dividends they declared in any calendar year were to exceed the total of their respective net profits for that year combined with their respective retained net profits for the preceding two calendar years, less any required transfer to paid-in capital. The term “net profits” is defined as the remainder of all earnings from current operations plus actual recoveries on loans, investments, and other assets, after deducting from the total thereof all current operating expenses, actual losses if any, and all federal, state, and local taxes. In 2021, dividends of $380.0 million were paid by the Bank to the Parent Company. At December 31, 2021,2023.


141


Expected Future Payments for Premiums and Claims
The following amounts are currently expected to be paid for premiums and claims during the Bank could have paid additional dividends of $469 million toyears indicated under the Health & Welfare Plan:

(in millions)
2024$
2025
2026
2027
2028
2029 and thereafter
Total$

Note 21 - Parent Company without regulatory approval.Company-Only Financial Information

132


NOTE 18: PARENT COMPANY-ONLY FINANCIAL INFORMATION

The following tables present the condensed financial statements for New York Community Bancorp, Inc. (Parent Company only):

Condensed Statements of Condition

December 31,
(in millions)20232022
ASSETS:
Cash and cash equivalents$158 $121 
Investments in subsidiaries9,160 9,633 
Other assets80 85 
Total assets$9,398 $9,839 
LIABILITIES AND STOCKHOLDERS’ EQUITY:
Junior subordinated debentures$579 $575 
Subordinated notes438 432 
Other liabilities14 
Total liabilities$1,031 $1,015 
Stockholders’ equity$8,367 $8,824 
Total liabilities and stockholders’ equity$9,398 $9,839 


December 31,


(in millions)


2021


2020


ASSETS:


Cash and cash equivalents


$


139


151


Investments in subsidiaries


7,525


7,334


Receivables from subsidiaries


3


Other assets


45


23


Total assets


$


7,712


7,508


LIABILITIES AND STOCKHOLDERS’ EQUITY:


Junior subordinated debentures


$


361


360


Subordinated notes


296


296


Other liabilities


11


10


Total liabilities


668


666


Stockholders’ equity


7,044


6,842


Total liabilities and stockholders’ equity


$


7,712


7,508


Condensed Statements of Income


Years Ended December 31,
(in millions)202320222021
Dividends received from subsidiaries$580 $335 $380 
Other income160 
Gross income582 495 381 
Operating expenses108 55 50 
Income before income tax benefit and equity in undistributed
(loss) earnings of subsidiaries
474 440 331 
Income tax benefit25 14 14 
Income before equity in undistributed (loss) earnings of subsidiaries499 454 345 
Equity in undistributed (loss) earnings of subsidiaries(578)196 251 
Net (loss) income$(79)$650 $596 


Years Ended December 31,


(in millions)


2021


2020


2019


Interest income


$


$


$


Dividends received from subsidiaries


380


380


380


Other income


1


1


1


Gross income


381


381


381


Operating expenses


50


52


50


Income before income tax benefit and equity in underdistributed
   earnings of subsidiaries


331


329


331


Income tax benefit


14


14


14


Income before equity in underdistributed earnings of subsidiaries


345


343


345


Equity in underdistributed earnings of subsidiaries


251


168


50


Net income


$


596


$

511


$

395


142


133


Condensed Statements of Cash Flows


Years Ended December 31,
(in millions)202320222021
CASH FLOWS FROM OPERATING ACTIVITIES:
Net (loss) income$(79)$650 $596 
Change in other assets30 (3)(22)
Change in other liabilities(4)
Other, net65 (130)32 
Equity in undistributed (loss) earnings of subsidiaries578 (196)(251)
Net cash provided by operating activities$600 $317 $356 
CASH FLOWS FROM INVESTING ACTIVITIES:
Cash acquired in business acquisition— 34 — 
Change in receivable from subsidiaries, net(32)(3)
Net cash (used in) provided by investing activities$(32)$39 $(3)
CASH FLOWS FROM FINANCING ACTIVITIES:
Treasury stock repurchased(12)(24)(16)
Cash dividends paid on common and preferred stock(519)(350)(349)
Net cash used in financing activities(531)(374)(365)
Net increase (decrease) in cash and cash equivalents37 (18)(12)
Cash and cash equivalents at beginning of year121 139 151 
Cash and cash equivalents at end of year$158 $121 $139 

Note 22 - Subsequent Events


Years Ended December 31,


(in millions)


2021


2020


2019


CASH FLOWS FROM OPERATING ACTIVITIES:


Net income


$


596


$

511


$

395


Change in other assets


(22

)


Change in other liabilities


1


(2

)

Other, net


32


30


33


Equity in undistributed earnings of subsidiaries


(251

)


(168

)


(50

)

Net cash provided by operating activities


356


373


376


CASH FLOWS FROM INVESTING ACTIVITIES:


��


Change in receivable from subsidiaries, net


(3

)


2


4


Net cash (used in) provided by investing activities


(3

)


2


4


CASH FLOWS FROM FINANCING ACTIVITIES:


Treasury stock repurchased


(16

)


(59

)


(75

)

Cash dividends paid on common and preferred stock


(349

)


(348

)


(350

)

Net cash used in financing activities


(365

)


(407

)


(425

)

Net decrease in cash and cash equivalents


(12

)


(32

)


(45

)

Cash and cash equivalents at beginning of year


151


183


228


Cash and cash equivalents at end of year


$


139


$


151


$


183


Loan Sales


On February 29, 2024, the Company sold the commercial co-operative loan classified as held for sale at a gain. Additionally, on March 13, 2024 the Company completed a sale of consumer loans with a net book value of $899 million. These two sales will be recorded in the quarter ended March 31, 2024 and will result in a net gain.
134


Equity Capital Raise

NOTE 19: CAPITAL

On March 7, 2024, we entered into separate investment agreements with affiliates of funds managed by Liberty and certain other investors. The Investors invested an aggregate of approximately $1.05 billion in the Company is subject to examination, regulation,in exchange for the sale and periodic reporting underissuance by the Bank Holding Company Act of 1956,(a) 76,630,965 shares of our common stock, at a purchase price per share of $2.00, (b) 192,062 shares of a new series of our preferred stock, par value $0.01 per share, designated as amended,Series B Preferred Stock, at a price per share of $2,000, each share of which is administered byconvertible into 1,000 shares of common stock (or, in certain limited circumstances, one share of Series C Preferred Stock), (c) 256,307 shares of a new series of our preferred stock, par value $0.01 per share, designated as Series C Preferred Stock, at a price per share of $2,000, each share of which is convertible into 1,000 shares of common stock, and (d) warrants affording the FRB. The FRB has adopted capital adequacy guidelines for bank holding companies (on a consolidated basis) that are substantially similar to thoseholder thereof the right, until the seven-year anniversary of the FDICissuance of such warrant, to purchase for the Bank.

The following tables present the regulatory capital ratios for the Company at December 31, 2021 and 2020, in comparison with the minimum amounts and ratios required by the FRB for capital adequacy purposes:


Risk-Based Capital


At December 31, 2021


Common Equity
Tier 1


Tier 1


Total


Leverage Capital


(dollars in millions)


Amount


Ratio


Amount


Ratio


Amount


Ratio


Amount


Ratio


Total capital


$

4,226


9.68


%

$

4,729


10.83


%

$

5,558


12.73


%

$

4,729


8.46


%

Minimum for capital
   adequacy purposes


1,966


4.50


2,621


6.00


3,494


8.00


2,237


4.00


Excess


$

2,260


5.18


%

$

2,108


4.83


%

$

2,064


4.73


%

$

2,492


4.46


%


Risk-Based Capital


At December 31, 2020


Common Equity
Tier 1


Tier 1


Total


Leverage Capital


(dollars in millions)


Amount


Ratio


Amount


Ratio


Amount


Ratio


Amount


Ratio


Total capital


$

3,962


9.72


%

$

4,465


10.95


%

$

5,290


12.97


%

$

4,465


8.52


%

Minimum for capital
   adequacy purposes


1,834


4.50


2,446


6.00


3,262


8.00


2,096


4.00


Excess


$

2,128


5.22


%

$

2,019


4.95


%

$

2,028


4.97


%

$

2,369


4.52


%

At December 31, 2021, our total risk-based capital ratio exceeded the minimum requirement for capital adequacy purposes by 473 basis points and the fully phased-in capital conservation buffer by 223 basis points.

The Bank$2,500 per share, shares of Series D NVCE Stock, each share of Series D NVCE Stock is subject to regulation, examination, and supervision by the NYSDFS and the FDIC (the “Regulators”). The Bank is also governed by numerous federal and state laws and regulations, including the FDIC Improvement Act of 1991, which established five categories of capital adequacy ranging from “well capitalized” to “critically undercapitalized.” Such classifications are used by the FDIC to determine various matters, including prompt corrective action and each institution’s FDIC deposit insurance premium assessments. Capital amounts and classifications are also subject to the Regulators’ qualitative judgments about the components of capital and risk weightings, among other factors.

The quantitative measures established to ensure capital adequacy require that banks maintain minimum amounts and ratios of leverage capital to average assets andconvertible into 1,000 shares of common equity tier 1 capital, tier 1 capital, and total capital to risk-weighted assets (as such measures are definedstock (or, in the regulations). At December 31, 2021, the Bank exceeded all the capital adequacy requirements to which they were subject.

As of December 31, 2021, the Company and the Bank are categorized as “well capitalized” under the regulatory framework for prompt corrective action. To be categorized as well capitalized, a bank must maintain a minimum common equity tier 1 risk-based capital ratio of 6.50%; a minimum tier 1 risk-based capital ratio of 8.00%; a minimum total risk-based capital ratio of 10.00%; and a minimum leverage capital ratio of 5.00%. In the opinion of management, no conditions or events have transpired since December 31, 2021 to change these capital adequacy classifications.

135


The following tables present the actual capital amounts and ratios for the Bank at December 31, 2021 and 2020 in comparison to the minimum amounts and ratios required for capital adequacy purposes.


Risk-Based Capital


At December 31, 2021


Common
Equity
Tier 1


Tier 1


Total


Leverage
Capital


(dollars in millions)


Amount


Ratio


Amount


Ratio


Amount


Ratio


Amount


Ratio


Total capital


$

5,217


11.95


%

$

5,217


11.95


%

$

5,402


12.38


%

$

5,217


9.33


%

Minimum for capital adequacy
   purposes


1,964


4.50


2,619


6.00


3,491


8.00


2,236


4.00


Excess


$

3,253


7.45


%

$

2,598


5.95


%

$

1,911


4.38


%

$

2,981


5.33


%


Risk-Based Capital


At December 31, 2020


Common
Equity
Tier 1


Tier 1


Total


Leverage
Capital


(dollars in millions)


Amount


Ratio


Amount


Ratio


Amount


Ratio


Amount


Ratio


Total capital


$

4,964


12.18


%

$

4,964


12.18


%

$

5,145


12.62


%

$

4,964


9.48


%

Minimum for capital adequacy
   purposes


1,834


4.50


2,445


6.00


3,260


8.00


2,095


4.00


Excess


$

3,130


7.68


%

$

2,519


6.18


%

$

1,885


4.62


%

$

2,869


5.48


%

Preferred Stock

On March 17, 2017, the Company issued 20,600,000 depositary shares, each representing a 1/40th interest in acertain limited circumstances, one share of Series C Preferred Stock), and all of which shares of Series D NVCE Stock, upon issuance, will represent the Company’s Fixed-to-Floating Rate Series A Noncumulative Perpetual Preferred Stock, par value $0.01 per share, with a liquidation preferenceright (on an as converted basis) to receive 315,000,000 shares of $1.000 per share (equivalent to $25 per depositary share). Dividends will accrue on the depositary shares at a fixed rate equal to 6.375% per annum until March 17, 2027, and a floating rate equal to Three-month LIBOR plus 382.1 basis points per annum beginningcommon stock. The transaction closed on March 17, 2027. 11, 2024.


Dividends will be payable in arrears on March 17, June 17, September 17, and December 17 of each year, which commenced on June 17, 2017
143


.

Treasury Stock Repurchases

On October 23, 2018, the Board of Directors approved the repurchase of up to $300 million of the Company’s outstanding common stock. As of December 31, 2021, the Company has repurchased a total of 29 million shares at an average price of $9.63 or an aggregate purchase of $278 million. The Company had 0 repurchases during 2021. During the year ended December 31, 2020, the Company repurchased 5 million shares, at a cost of $50 million.

136


NOTE 20: PENDING ACQUISITION

Acquisition of Flagstar Bancorp, Inc.

On April 26, 2021, the Company announced it had entered into a definitive merger agreement (the "Merger Agreement") under which we would acquire Flagstar Bancorp, Inc. ("Flagstar") in a 100% stock transaction valued at the time, at $2.6 billion. Under terms of the Merger Agreement, which was unanimously approved by the Boards of Directors of both companies, Flagstar shareholders will receive 4.0151 shares of New York Community Bancorp, Inc. common stock for each Flagstar share they own. Following completion of the merger, New York Community shareholders are expected to own 68% of the combined company, while Flagstar shareholders are expected to own 32% of the combined company. The new company will have $85 billion in total assets, operate nearly 400 traditional branches in nine states, and 83 retail home lending offices across a 28-state footprint. It will be headquartered on Long Island, N.Y. with regional headquarters in Troy, Michigan, including Flagstar's mortgage operations.

Both sets of shareholders approved the merger on August 4, 2021. The transaction is subject to the satisfaction of certain other customary closing conditions, including approvals from the NYSDFS, the FDIC, and the FRB.

137


Report of Independent Registered Public Accounting Firm

Report of Independent Registered Public Accounting Firm
To the Stockholders and Board of Directors

New York Community Bancorp, Inc.:

Opinion on the Consolidated Financial Statements

We have audited the accompanying consolidated statements of condition of New York Community Bancorp, Inc. and subsidiaries (the Company) as of December 31, 20212023 and 2020,2022, the related consolidated statements of (loss) income and comprehensive (loss) income, changes in stockholders’ equity, and cash flows for each of the years in the three-year period ended December 31, 2021,2023, and the related notes (collectively, the consolidated financial statements). In our opinion, the consolidated financial statements present fairly, in all material respects, the financial position of the Company as of December 31, 20212023 and 2020,2022, and the results of its operations and its cash flows for each of the years in the three-year period ended December 31, 2021,2023, in conformity with U.S. generally accepted accounting principles.

We also have audited, in accordance with the standards of the Public Company Accounting Oversight Board (United States) (PCAOB), the Company’s internal control over financial reporting as of December 31, 2021,2023, based on criteria established in Internal Control – Integrated Framework (2013) issued by the Committee of Sponsoring Organizations of the Treadway Commission, and our report dated February 25, 2022March 14, 2024 expressed an unqualifiedadverse opinion on the effectiveness of the Company’s internal control over financial reporting.

Change in Accounting Principle

As discussed in Note 2 to the consolidated financial statements, the Company has changed its method of accounting for the recognition and measurement of credit losses as of January 1, 2020 due to the adoption of ASC Topic 326, Financial Instruments - Credit Losses.

Basis for Opinion

These consolidated financial statements are the responsibility of the Company’s management. Our responsibility is to express an opinion on these consolidated financial statements based on our audits. We are a public accounting firm registered with the PCAOB and are required to be independent with respect to the Company in accordance with the U.S. federal securities laws and the applicable rules and regulations of the Securities and Exchange Commission and the PCAOB.

We conducted our audits in accordance with the standards of the PCAOB. Those standards require that we plan and perform the audit to obtain reasonable assurance about whether the consolidated financial statements are free of material misstatement, whether due to error or fraud. Our audits included performing procedures to assess the risks of material misstatement of the consolidated financial statements, whether due to error or fraud, and performing procedures that respond to those risks. Such procedures included examining, on a test basis, evidence regarding the amounts and disclosures in the consolidated financial statements. Our audits also included evaluating the accounting principles used and significant estimates made by management, as well as evaluating the overall presentation of the consolidated financial statements. We believe that our audits provide a reasonable basis for our opinion.

Critical Audit MatterMatters

The critical audit mattermatters communicated below is a matterare matters arising from the current period audit of the consolidated financial statements that waswere communicated or required to be communicated to the audit committee and that: (1) relatesrelate to accounts or disclosures that are material to the consolidated financial statements and (2) involved our especially challenging, subjective, or complex judgments. The communication of a critical audit mattermatters does not alter in any way our opinion on the consolidated financial statements, taken as a whole, and we are not, by communicating the critical audit mattermatters below, providing a separate opinionopinions on the critical audit mattermatters or on the accounts or disclosures to which it relates.they relate.

Goodwill Impairment

As discussed in Notes 2 and 16 to the consolidated financial statements, the Company recorded an impairment charge of its entire goodwill balance of $2.4 billion as of December 31, 2023. The Company evaluates goodwill for impairment at least annually or when triggering events are identified. The Company utilizes a market approach to determine the fair value of its single reporting unit, which considers how a market participant would view a control premium, complemented by an income approach if deemed necessary. As of December 31, 2023, the Company identified a triggering event and applied a market approach using the end of day stock price, a control premium for recently completed bank acquisitions, and an adjustment for Company-specific risk considerations based on subsequent confirming market evidence. The adjusted market capitalization was then compared to the Company’s carrying value to determine the extent of any shortfall. The calculated shortfall was in excess of the goodwill balance as of December 31, 2023.


144


We identified the assessment of goodwill for impairment as a critical audit matter. A high degree of audit effort, including specialized skills and knowledge, and subjective and complex auditor judgment was involved in the evaluation of the market approach and significant unobservable assumptions which included the control premium and Company-specific risk considerations. There was also a high degree of subjectivity and potential for management bias related to the timing and magnitude of adjustments made to the key assumptions used in the valuation.

The following are the primary procedures we performed to address this critical audit matter. We evaluated the design and tested the operating effectiveness of certain internal controls related to the Company’s goodwill impairment analysis, including internal controls over the development of the market approach and the determination of the control premium and the impact of Company-specific risk considerations.

In addition, we involved valuation professionals with specialized skills and knowledge who assisted in:

evaluating the reasonableness of the valuation approach used for compliance with U.S. generally accepted accounting principles

evaluating the control premium assumption by comparing to data from recently completed peer bank acquisitions

evaluating the adjustment for Company-specific risk considerations based on confirming market evidence from events occurring after the measurement date.

Allowance for credit losses on loans and leases related to the multi-family and commercial real estate portfolio segments that are evaluated on a collective basis

As discussed in Notes 2 and 67 to the consolidated financial statements, the Company’s total allowance for credit losses (ACL) on loans and leases as of December 31, 20212023 was $199$992 million, a substantial portion of which is related to the one-to-four family first mortgage, multi-family, commercial and industrial, specialty finance, and commercial real estate portfolio segments. The allowance for credit losses on loans and

138


leases issegments measured on a collective basis when similar risk characteristics exist (collective ACL). Management estimates the collective ACL by projecting and multiplying together the probability-of-default (PD), loss-given-default (LGD) and exposure-at-default depending on economic parameters for each month of the remaining contractual term. ForThe loss drivers for certain loans within the multi-familycommercial and commercial real estate portfolios, theindustrial portfolio are derived using credit ratings. The Company estimates the exposure-at-default using a prepayment modelmodels which projectsforecasts prepayments over the life of the loans. Economicloans and leases. The economic forecast and the related economic parameters are developed using available information relating to past events, current conditions,multiple economic forecasts, and macroeconomic assumptions. Economic parameters are forecast scenarios, including related weightings, over athe reasonable and supportable forecast period. After the reasonable and supportable forecast period, the Company reverts to a historical average loss rate on a straight line basis.straight-line basis over 12 months. Historical credit loss experience over the historical loss observation period provides the basis for the estimation of expected credit losses, with qualitative factor adjustments made for differences in current loan-specific risk characteristics as well as for changes in environmental conditions.

We identified the assessment of the collective ACL on loans and leases related to the multi-family and commercial real estate portfolio segments as a critical audit matter. A high degree of audit effort, including specialized skills and knowledge, and subjective and complex auditor judgment was involved in the assessment due to significant measurement uncertainty. Specifically, the assessment encompassed the evaluation of the collective ACL methodology, including the methods and models used to estimate the PD, LGD, and prepayments and their significant assumptions. Such significant assumptions included portfolio segmentation, the selection of the multiple economic forecasts and macroeconomic assumptions,forecast scenarios including related weightings, economic parameters, credit ratings, the reasonable and supportable forecast period, the reversion period and the historical loss observation period. The assessment also included the evaluation of the qualitative factor adjustments and their significant assumptions for differences in loan-specific risk characteristics and changes in environmental factors.conditions. The assessment also included an evaluation of the conceptual soundness and performance of the PD, LGD, and prepaymentsprepayment models. In addition, auditor judgment was required to evaluate the sufficiency of audit evidence obtained.

The following are the primary procedures we performed to address this critical audit matter. We evaluated the design and tested the operating effectiveness ofcertain internal controls related to the Company’s measurement of the collective ACL on loans and leases related to multi-family and commercial real estate portfolio segments,estimate, including controls over the:

development of the collective ACL on loans and leases related to the multi-family and commercial real estate portfolio segments methodology

continued use and appropriateness of changes made tothe PD, LGD, and prepayment models

performance monitoring of the PD, LGD, and prepayment models


145


identification and determination of the significant assumptions used in the PD, LGD, and prepayment models

development of the qualitative factor adjustments, including the significant assumptions used in the measurement of the qualitative factors

performance monitoring of the PD, LGD, and prepayment models
analysis of the collective ACL on loans and leases related to the multi-family and commercial real estate portfolio segments results, trends, and ratiosratios.

We evaluated the Company’s process to develop the collective ACL on loans and leases related to the multi-family and commercial real estate portfolio segments estimate by testing certain sources of data, factors, and assumptions that the Company used, and considered the relevance and reliability of such data, factors, and assumptions. In addition, we involved credit risk and valuation professionals with specialized skills and knowledge, who assisted in:

evaluating the Company’s collective ACL methodology for compliance with U.S. generally accepted accounting principles

evaluating judgments made by the Company relative to the assessment and performance testing of the PD, LGD, and prepayment models by comparing them to relevant Company-specific metrics and trends and the applicable industry and regulatory practices

assessing the conceptual soundness and performance of the PD, LGD, and prepayment models by inspecting the model documentation to determine whether the models are suitable for their intended use

139


evaluating the selection of the multiple economic forecastsforecast scenarios including the related weightings, and underlying macroeconomic assumptionseconomic parameters by comparing itthem to the Company’s business environment and relevant industry practices

evaluating the length of the reasonable and supportable forecast period, the reversion period and the historical loss observation periodperiods by comparing them to specific portfolio risk characteristics and trends

testing individual credit ratings for a selection of certain borrower relationships by evaluating the financial performance of the borrower, sources of repayment, and any relevant guarantees or underlying collateral

determining whether the loan portfolio is segmented by similar risk characteristics by comparing to the Company’s business environment and relevant industry practicespractice

evaluating the methodology used to develop the qualitative factorsfactor adjustments and their significant assumptions and the effect of those factorsadjustments on the allowance for credit losses on loans and leasescollective ACL compared with relevant credit risk factors, current collateral valuations, and consistency with credit trends and identified limitations of the underlying quantitative models.

We also assessed the sufficiency of the audit evidence obtained related to the collective ACL on loans and leases related to the multi-family and commercial real estate portfolio segments estimate by evaluating the:

determination of cumulative results of the audit procedures

qualitative aspects of the Company’s accounting practices

potential bias in the accounting estimate.

Fair value measurements of acquired loans and core deposit intangible asset

As discussed in Note 3 to the consolidated financial statements, the Company acquired certain assets and assumed certain liabilities of Signature Bridge Bank, N.A. on March 20, 2023. The Company accounted for this transaction as a business combination with the assets acquired and liabilities assumed being measured based on their estimated fair values. As part of the acquisition, the Company acquired loans and established a core deposit intangible (CDI) asset with a fair value of $12.0 billion and $464 million, respectively. The fair value of acquired loans was based on a discounted cash flow methodology which incorporated discount rates, prepayment rates, probability of default and loss given default rates, and other market assumptions. The fair value of the CDI asset was measured using a discounted cash flow methodology which utilized discount rates, customer attrition rates, and other market assumptions.

We identified the assessment of the fair value measurements of acquired loans and the CDI asset at the acquisition date as a critical audit matter. A high degree of audit effort, including specialized skills and knowledge, and subjective and complex

146


img85695935_1.jpg 

auditor judgment was involved in the assessment of the fair value measurements due to significant measurement uncertainty. Specifically, the assessment of the fair value measurements involved an evaluation of the valuation methodologies and certain significant assumptions: including discount rates, prepayment rates, probability of default and loss given default rates for acquired loans; and discount rates and customer attrition rates for the CDI asset.

The following are the primary procedures we performed to address this critical audit matter. We have served asevaluated the design and tested the operating effectiveness of certain internal controls related to the Company’s fair value measurements of acquired loans and the CDI asset at the acquisition date. This included controls related to the (1) determination of certain significant assumptions used in the discounted cash flow methodologies for acquired loans and the CDI asset, and (2) assessment of the overall fair value measurement for acquired loans and the CDI asset. We evaluated the Company’s process to determine the estimated fair value of the CDI asset at the acquisition date by testing certain sources of data and subjective assumptions that the Company used and considered the relevance and reliability of such data and subjective assumptions. In addition, we involved valuation professionals with specialized skills and knowledge, who assisted in:

evaluating the Company’s fair value methodologies for compliance with U.S. generally accepted accounting principles

assessing the Company’s estimate of fair value of acquired loans by developing independent ranges of fair values, using market participant derived discount rates, prepayment rates, and probability of default and loss given default rates, and comparing them to the Company’s estimate of fair value and

evaluating the discount rates and customer attrition rates by comparing the information used to develop such assumptions to market data and deposit activity observed subsequent to the acquisition date.

Fair value measurement of mortgage servicing rights

As discussed in Notes 9 and 18 to the consolidated financial statements, the Company’s mortgage servicing rights (MSRs) as of December 31, 2023 was $1.1 billion. The Company purchases and originates mortgage loans for sale to the secondary market and sells certain of these loans on a servicing-retained basis. For these loans, the Company recognizes a MSR at the time of sale which is recorded at fair value. The Company uses an internal valuation model which utilizes an option-adjusted spread, constant prepayment rate, costs to service and other assumptions to determine the fair value of the MSRs. The Company obtains independent third-party valuations of the estimated fair value of MSRs on a quarterly basis to assess the reasonableness of the Company’s internal fair value estimate.

We identified the assessment of the fair value measurement of MSRs as a critical audit matter. A high degree of audit effort, including specialized skills and knowledge, and subjective and complex auditor since 1993.judgment was involved in the assessment of the internal valuation model and significant unobservable assumptions, which included option-adjusted spread and constant prepayment rate. There was also a high degree of subjectivity and potential for management bias related to the timing and magnitude of adjustments made to the significant assumptions used in the valuation.

The following are the primary procedures we performed to address this critical audit matter. We evaluated the design and tested the operating effectiveness of certain internal controls related to the Company’s fair value measurement of MSRs. This included controls related to:

assessment of the internal valuation model


evaluation of certain significant assumptions used in estimating the fair value

comparison of the MSR fair value to independent valuations.

We evaluated the Company’s process to determine the estimated fair value of MSRs by testing certain sources of data and subjective assumptions that the Company used and considered the relevance and reliability of such data and subjective assumptions. In addition, we involved valuation professionals with specialized skills and knowledge, who assisted in:

evaluating the design of the internal valuation model used to estimate the MSR fair value in accordance with relevant U.S. generally accepted accounting principles


147


evaluating the significant assumptions, including the timing of any significant updates made to the assumptions during the year, based on an analysis of backtesting results and a comparison of significant assumptions to available data for comparable entities and independent third-party valuations.


/s/ KPMG LLP

We have served as the Company’s auditor since 1993.
New York, New York

February 25, 2022March 14, 2024


140


148


Report of Independent Registered Public Accounting Firm

To the Stockholders and Board of Directors

New York Community Bancorp, Inc.:

Opinion on Internal Control Over Financial Reporting

We have audited New York Community Bancorp, Inc. and subsidiaries' (the Company) internal control over financial reporting as of December 31, 2021,2023, based on criteria established in Internal Control – Integrated Framework (2013) issued by the Committee of Sponsoring Organizations of the Treadway Commission. In our opinion, because of the effect of the material weaknesses, described below, on the achievement of the objectives of the control criteria, the Company has not maintained in all material respects, effective internal control over financial reporting as of December 31, 2021,2023, based on criteria established in Internal Control – Integrated Framework (2013) issued by the Committee of Sponsoring Organizations of the Treadway Commission.

We also have audited, in accordance with the standards of the Public Company Accounting Oversight Board (United States) (PCAOB), the consolidated statements of condition of the Company as of December 31, 20212023 and 2020,2022, the related consolidated statements of (loss) income and comprehensive (loss) income, changes in stockholders’ equity, and cash flows for each of the years in the three-year period ended December 31, 2021,2023, and the related notes (collectively, the consolidated financial statements), and our report dated February 25, 2022March 14, 2024 expressed an unqualified opinion on those consolidated financial statements.

A material weakness is a deficiency, or a combination of deficiencies, in internal control over financial reporting, such that there is a reasonable possibility that a material misstatement of the company’s annual or interim financial statements will not be prevented or detected on a timely basis. Material weaknesses related to the following have been identified and included in management’s assessment:

the Company's Board of Directors did not exercise sufficient oversight responsibilities, which led to the Company lacking a sufficient complement of qualified leadership resources to conduct effective risk assessment and monitoring activities,

the Company lacked effective periodic risk assessment processes to identify and timely respond to emerging risks in certain financial reporting processes and related internal controls, including internal loan review, that were responsive to changes in the business operations and regulatory and economic environments in which the Company operates,

the Company’s recurring monitoring activities over process level control activities, including internal loan review, were not operating effectively, and

the Company did not sufficiently maintain effective control activities related to internal loan review. Specifically, the Company’s internal loan review processes lacked an appropriate framework to ensure that ratings were consistently accurate, timely, and appropriately challenged. These ineffective controls impact the Company’s ability to accurately disclose loan rating classifications, identify problem loans, and ultimately the recognition of the allowance for credit losses on loans and leases.

The material weaknesses were considered in determining the nature, timing, and extent of audit tests applied in our audit of the 2023 consolidated financial statements, and this report does not affect our report on those consolidated financial statements.

The Company acquired Signature Bridge Bank, N.A. during 2023, and management excluded from its assessment of the effectiveness of the Company’s internal control over financial reporting as of December 31, 2023, Signature Bridge Bank, N.A.’s internal control over financial reporting associated with total acquired assets of approximately $38 billion and total revenues associated with the acquired assets and liabilities assumed of approximately $1 billion included in the consolidated financial statements of the Company as of and for the year ended December 31, 2023. Our audit of internal control over financial reporting of the Company also excluded an evaluation of the internal control over financial reporting of Signature Bridge Bank, N.A.


149


Basis for Opinion

The Company’s management is responsible for maintaining effective internal control over financial reporting and for its assessment of the effectiveness of internal control over financial reporting, included in the accompanying Management's Report on Internal Control over Financial Reporting. Our responsibility is to express an opinion on the Company’s internal control over financial reporting based on our audit. We are a public accounting firm registered with the PCAOB and are required to be independent with respect to the Company in accordance with the U.S. federal securities laws and the applicable rules and regulations of the Securities and Exchange Commission and the PCAOB.

We conducted our audit in accordance with the standards of the PCAOB. Those standards require that we plan and perform the audit to obtain reasonable assurance about whether effective internal control over financial reporting was maintained in all material respects. Our audit of internal control over financial reporting included obtaining an understanding of internal control over financial reporting, assessing the risk that a material weakness exists, and testing and evaluating the design and operating effectiveness of internal control based on the assessed risk. Our audit also included performing such other procedures as we considered necessary in the circumstances. We believe that our audit provides a reasonable basis for our opinion.

Definition and Limitations of Internal Control Over Financial Reporting

A company’s internal control over financial reporting is a process designed to provide reasonable assurance regarding the reliability of financial reporting and the preparation of financial statements for external purposes in accordance with generally accepted accounting principles. A company’s internal control over financial reporting includes those policies and procedures that (1) pertain to the maintenance of records that, in reasonable detail, accurately and fairly reflect the transactions and dispositions of the assets of the company; (2) provide reasonable assurance that transactions are recorded as necessary to permit preparation of financial statements in accordance with generally accepted accounting principles, and that receipts and expenditures of the company are being made only in accordance with authorizations of management and directors of the company; and (3) provide reasonable assurance regarding prevention or timely detection of unauthorized acquisition, use, or disposition of the company’s assets that could have a material effect on the financial statements.

Because of its inherent limitations, internal control over financial reporting may not prevent or detect misstatements. Also, projections of any evaluation of effectiveness to future periods are subject to the risk that controls may become inadequate because of changes in conditions, or that the degree of compliance with the policies or procedures may deteriorate.

img85695935_2.jpg 

/s/KPMG LLP

New York, New York

February 25, 2022March 14, 2024


141

150


Item 9.Changes in and Disagreement with Accountants on Accounting and Financial Disclosures
ITEM 9. CHANGES IN AND DISAGREEMENTS WITH ACCOUNTANTS ON ACCOUNTING AND FINANCIAL DISCLOSURE
None.

Item 9A.Controls and Procedures
None.

ITEM 9A. CONTROLS AND PROCEDURES

(a) Evaluation of Disclosure Controls and Procedures

Under the supervision, and with the participation, of our Chief Executive Officer and Chief Financial Officer, our management evaluated the effectiveness of the design and operation of the Company’s disclosure controls and procedures pursuant to Rule 13a-15(b), as adopted by the Securities and Exchange Commission (the “SEC”) under the Securities Exchange Act of 1934 (the “Exchange Act”). Based upon that evaluation, the Chief Executive Officer and Chief Financial Officer concluded that the Company’s disclosure controls and procedures were not effective as of the end of the period covered by this annual report.report because of the material weaknesses in internal control over financial reporting described below. Notwithstanding the material weaknesses, based on additional analyses and other procedures performed, management concluded that the financial statements included in this report fairly present in all material respects our financial position, results of operations, capital position, and cash flows for the periods presented in conformity with GAAP.

Disclosure

Per Rules 13a-15(e) and 15d-15(e), disclosure controls and procedures are the controls and other procedures that are designed to ensure that information required to be disclosed in the reports that the Company files or submits under the Exchange Act is recorded, processed, summarized, and reported within the time periods specified in the SEC’s rules and forms. Disclosure controls and procedures include, without limitation, controls and procedures designed to ensure that information required to be disclosed in the reports that the Company files or submits under the Exchange Act is accumulated and communicated to management, including the Chief Executive Officer and Chief Financial Officer, or persons performing similar functions, as appropriate, to allow timely decisions regarding required disclosure.

(b) Management’s Report on Internal Control over Financial Reporting

Management of the Company is responsible for establishing and maintaining adequate internal control over financial reporting.reporting (as defined in Rules 13a-15(f) and 15d-15(f) of the Exchange Act). Our system of internal control is designed under the supervision of management, including our Chief Executive Officer and Chief Financial Officer, to provide reasonable assurance regarding the reliability of our financial reporting and the preparation of the Company’s financial statements for external reporting purposes in accordance with U.S. generally accepted accounting principles (“GAAP”).

Our internal control over financial reporting includes policies and procedures that pertain to the maintenance of records that, in reasonable detail, accurately and fairly reflect transactions and dispositions of assets;assets of the Company; provide reasonable assurances that transactions are recorded as necessary to permit preparation of financial statements in accordance with GAAP, and that receipts and expenditures are made only in accordance with the authorization of management and the Boards of Directors of the Company and the Bank; and provide reasonable assurance regarding prevention or timely detection of unauthorized acquisition, use, or disposition of the Company’s assets that could have a material effect on our financial statements.

Because of its inherent limitations, internal control over financial reporting may not prevent or detect misstatements. ProjectionsAlso, projections of any evaluation of effectiveness to future periods are subject to the risk that the controls may become inadequate because of changes in conditions or that the degree of compliance with policies and procedures may deteriorate.

The Company acquired certain assets and assumed certain liabilities of Signature Bridge Bank, N.A. on March 20, 2023. The scope of management’s assessment of the effectiveness of the Company’s internal control over financial reporting as of December 31, 2023, excludes the internal control over financial reporting associated with total acquired assets of approximately $38 billion and total revenues associated with the acquired assets and liabilities assumed of approximately $1 billion included in the consolidated financial statements of the Company as of and for the year ended December 31, 2023.

As of December 31, 2021,2023, management assessed the effectiveness of the Company’s internal control over financial reporting based upon the framework established in Internal Control—Integrated Framework (2013) issued by the Committee of Sponsoring Organizations of the Treadway Commission (“COSO”). A material weakness (as defined in Rule 12b-2 under the Exchange Act) is a deficiency or combination of deficiencies, in internal control over financial reporting such that there is a reasonable possibility that a material misstatement in our annual or interim financial statements will not be prevented or detected on a timely basis.

151


Based upon itson this assessment, because of the following material weaknesses, management concluded that the Company’sCompany did not maintain effective internal control over financial reporting as of December 31, 2020 was2023.

Control environment – Our Board of Directors did not exercise sufficient oversight responsibilities, which led to us lacking a sufficient complement of qualified leadership resources to conduct effective using this criteria.risk assessment and monitoring activities.

Risk assessment – We lacked effective periodic risk assessment processes to identify and timely respond to emerging risks in certain financial reporting processes and related internal controls, including internal loan review, that were responsive to changes in the business operations and regulatory and economic environments in which the Company operates.

The effectiveness
Monitoring – Our recurring monitoring activities over process level control activities, including internal loan review, were not operating effectively.

Control activities – We did not sufficiently maintain effective control activities related to internal loan review. Specifically, our internal loan review processes lacked an appropriate framework to ensure that ratings were consistently accurate, timely, and appropriately challenged. These ineffective controls impact the Company’s ability to accurately disclose loan rating classifications, identify problem loans, and ultimately the recognition of the Company’sallowance for credit losses on loans and leases.

These control deficiencies create a reasonable possibility that a material misstatement to the consolidated financial statements will not be prevented or detected on a timely basis, and therefore we concluded that the deficiencies represent material weaknesses in our internal control over financial reporting and our internal control over financial reporting was not effective as of December 31, 2021 has been audited by KPMG LLP, an2023.

The Company’s independent registered public accounting firm, thatKPMG LLP, which audited the Company’s2023 consolidated financial statements as of and for the year ended December 31, 2020, as stated in their report, included in Item 8 on the preceding page, which expressesthis Form 10-K, has expressed an unqualifiedadverse opinion on the effectiveness of the Company’s internal control over financial reporting. KPMG LLP’s report appears on page 144 of this Annual Report on Form 10-K.

Remediation Status of Reported Material Weaknesses

The Company is currently working to remediate the material weaknesses described above, including assessing the need for additional remediation steps and implementing additional measures to remediate the underlying causes that gave rise to the material weaknesses. The Company is committed to maintaining a strong internal control environment and to ensuring that proper oversight and a consistent tone is communicated throughout the organization. The Company expects that existing deficiencies will be remediated through implementation of processes and controls designed to ensure strict compliance with U.S. GAAP.

Specifically, we are in the process of strengthening our internal control over financial reporting as follows:

Appointed several new members to the Board of December 31, 2021.Directors with extensive experience as financial experts in our industry and backgrounds in risk management. Additionally, several members of the Board of Directors resigned.

Appointed a new Chief Risk Officer and Chief Audit Executive, both of whom have large bank experience. We are in the process of identifying and appointing a new Director of Loan Review who has prior large bank commercial loan experience.

142

Increasing the frequency and nature of reporting from our internal loan review team and first line business units to the Board Risk Committee to support the Board's risk oversight role.

Expanding the use of independent credit analysis and reducing the Company's reliance on tools and analysis prepared by our lines of business.

Improving the internal loan review team's ability to independently challenge risk rating scorecard model methodologies and results.

Assessing the adequacy of staffing levels and expertise within the internal loan review program, taking into account, among other things, the size, complexity, and risk profile of the Company's loan portfolio.


152


Providing additional risk rating process training for all internal loan review employees.

We have enhanced our control environment, risk assessment and monitoring activities by addressing our Board composition and key members of executive management, including the Chief Risk Officer and Chief Audit Executive. Progress has been made on our remedial actions, but we are still in the process of developing and implementing enhanced processes, procedures and controls related to internal loan review. We believe our actions will be effective in remediating the material weaknesses, and we continue to devote significant time and attention to these efforts. In addition, the material weaknesses will not be considered remediated until the applicable remedial processes, procedures and controls have been in place for a sufficient period of time and management has concluded, through testing, that these controls are effective.

(c) Changes in Internal Control over Financial Reporting

There

The Company is working to integrate Signature into its overall internal control over financial reporting processes. Except for changes made in connection with this integration of Signature, and the material weaknesses in internal control over financial reporting noted above, there have not been any changes in the Company’s internal control over financial reporting (as such term is defined in Rules 13a-15(f) and 15d-15(f) under the Exchange Act) during the fiscal quarter to which this report relates that have materially affected, or are reasonably likely to materially affect, the Company’s internal control over financial reporting.

Item 9B.Other Information

During the fourth quarter ended December 31, 2023, none of our directors or officers informed us of the adoption or termination of a “Rule 10b5-1 trading arrangement or “non-Rule 10b5-1 trading arrangement,” as those terms are defined in Item 408 of Regulation S-K.
Item 9C.Disclosure Regarding Foreign Jurisdictions that Prevent Inspections
ITEM 9B. OTHER INFORMATION
None.

None.
153


ITEM 9C. DISCLOSURE REGARDING FOREIGN JURISDICTIONS THAT PREVENT INSPECTIONS

Not applicable

143


PART III

Item 10.Directors, Executive Officers of the Registrant and Corporate Governance

III

ITEM 10. DIRECTORS, EXECUTIVE OFFICERS, AND CORPORATE GOVERNANCE

Information regarding our directors, executive officers, and corporate governance appears in our Proxy Statement for the Annual Meeting of Shareholders to be held on June 1, 2022for fiscal year 2024 (hereafter referred to as our “2022“2024 Proxy Statement”) under the captions “Information with Respect to Nominees, Continuing Directors, and Executive Officers,” “Section 16(a) Beneficial Ownership Reporting Compliance,” “Meetings and Committees of the Board of Directors,” and “Corporate Governance,” and is incorporated herein by this reference.

A copy of our Code of Business Conduct and Ethics, which applies to our Chief Executive Officer, Chief Operating Officer, Chief Financial Officer, and Chief Accounting Officer as officers of the Company, and all other senior financial officers of the Company designated by the Chief Executive Officer from time to time, is available on the Investor Relations portion of our website: www.myNYCB.com and will be provided, without charge, upon written request to the Chief Corporate Governance Officer and Corporate Secretary at 102 Duffy Avenue, Hicksville, NY 11801.

Item 11.Executive Compensation

ITEM 11. EXECUTIVE COMPENSATION

Information regarding executive compensation appears in our 20222024 Proxy Statement under the captions “Compensation Committee Report,” “Compensation Committee Interlocks and Insider Participation,” “Compensation Discussion and Analysis,” “Executive Compensation and Related Information,” and “Director Compensation,” and is incorporated herein by this reference.

Item 12.Security Ownership of Certain Beneficial Owners and Management and Related Stockholder Matters

ITEM 12. SECURITY OWNERSHIP OF CERTAIN BENEFICIAL OWNERS AND MANAGEMENT, AND RELATED STOCKHOLDER MATTERS

The following table provides information regarding the Company’s equity compensation plans at December 31, 2021:2023:


Plan Category

Number of
Securities to Be
Issued Upon
Exercise

Weighted Average
Exercise Price (1)
Number of securities to beSecurities
issued upon exercise of
outstanding options,
warrants, and rights

Weighted-average
exercise price of
outstanding options,
warrants, and rights

Number of securities
remaining available
Remaining Available
for future issuanceFuture Issuance
under equityUnder Equity
compensation plans
(excluding securities
reflected
in column (a))
Compensation Plans

Plan category

(a)

(b)

(c)

Equity compensation plans
approved by security holders

$

16,143,893 

8,548,783

Equity compensation plans not
approved by security holders


Total


$

16,143,893 

8,548,783


Information relating to the security ownership of certain beneficial owners and management appears in our 20222024 Proxy Statement under the captions “Security Ownership of Certain Beneficial Owners” and “Information with Respect to Nominees, Continuing Directors, and Executive Officers.”

Item 13.Certain Relationship and Related Transactions, and Director Independence

144


Information regarding certain relationships and related transactions, and director independence, appears in our 20222024 Proxy Statement under the captions “Transactions with Certain Related Persons” and “Corporate Governance,” respectively, and is incorporated herein by this reference.

Item 14.Principal Accounting Fees and Services

ITEM 14. PRINCIPAL ACCOUNTING FEES AND SERVICES

Our independent registered public accounting firm is KPMG LLP,, New York, New York,, Auditor Firm ID: 185.

185.

Information regarding principal accounting fees and services appears in our 20222024 Proxy Statement under the caption “Audit and Non-Audit Fees,” and is incorporated herein by this reference.


154

145


PART IV

Item 15.Exhibits, Financial Statement Schedules
PART
IV

ITEM 15. EXHIBITS AND FINANCIAL STATEMENT SCHEDULES

(a) Documents Filed Asas Part of Thisthis Report

1. Financial Statements

The following are incorporated by reference from Item 8 hereof:

Reports of Independent Registered Public Accounting Firm;
Consolidated Statements of Condition at December 31, 20202023 and 2021;
2022;
Consolidated Statements of Income and Comprehensive Income for each of the years in the three-year period ended December 31, 2021;
2023;
Consolidated Statements of Changes in Stockholders’ Equity for each of the years in the three-year period ended December 31, 2021;
2023;
Consolidated Statements of Cash Flows for each of the years in the three-year period ended December 31, 2021;2023; and
Notes to the Consolidated Financial Statements.

The following are incorporated by reference from Item 9A hereof:

Management’s Report on Internal Control over Financial Reporting; and
Changes in Internal Control over Financial Reporting.

2. Financial Statement Schedules

Financial statement schedules have been omitted because they are not applicable or because the required information is provided in the Consolidated Financial Statements or Notes thereto.

3. Exhibits Required by Securities and Exchange Commission Regulation S-K

The following exhibits are filed as part of this Form 10-K, and this list includes the Exhibit Index.

Exhibit No.

2.1

  2.1

Agreement and Plan of Merger, dated as of April 24, 2021, by and among New York Community Bancorp, Inc., 615 Corp., a wholly-owned subsidiary and Flagstar Bancorp, Inc. (1)

2.2

2.3

2.4
2.5
3.1

Amended and Restated Certificate of Incorporation (2)(5)

3.2

  3.2

Certificates of Amendment of Amended and Restated Certificate of Incorporation (3)(6)

3.3

  3.3

Certificate of Amendment of Amended and Restated Certificate of Incorporation (4)(7)

3.4

  3.4

Certificate of Designations of the Registrant with respect to the Series A Preferred Stock, dated March 16, 2017, filed with the Secretary of State of the State of Delaware and effective March 16, 2017 (5)(8)

3.5

Certificate of Designations of the Registrant with respect to Series B Noncumulative Convertible Preferred Stock, dated March 11, 2024, filed with the Secretary of State of the State of Delaware and effective March 11, 2024 (9)

  3.53.6

Certificate of Designations of the Registrant with respect to Series C Noncumulative Convertible Preferred Stock, dated March 11, 2024, filed with the Secretary of State of the State of Delaware and effective March 11, 2024

(10)
3.7

Certificate of Designations of the Registrant with respect to Series D Non-Voting Common Equivalent Stock, dated March 11, 2024, filed with the Secretary of State of the State of Delaware and effective March 11, 2024 (11)
3.8

4.1

  4.1

Specimen Stock Certificate (7)(10)

4.2

  4.2

Deposit Agreement, dated as of March 16, 2017, by and among the Registrant, Computershare, Inc, and Computershare Trust Company, N.A., as joint depositary, and the holders from time to time of the depositary receipts described therein (8)(11)

4.3

  4.3

Form of certificate representing the Series A Preferred Stock (8)(11)


155


4.4

  4.4

Form of depositary receipt representing the Depositary Shares (8)(11)

4.5

Form of warrant agreement for shares of Series D Non-Voting Common Equivalent Stock (14)

146


4.5

Description of securities registered pursuant to Section 12 of the Securities and Exchange Act of 1934 (9)(12)

4.6

  4.6

Registrant will furnish, upon request, copies of all instruments defining the rights of holders of long-term debt instruments of the registrant and its consolidated subsidiaries.

10.1

Form of Employment Agreement between New York Community Bancorp, Inc. Robert Wann, Thomas R. Cangemi, James J. Carpenter, and John J. Pinto** Pinto(10) (13)

10.2(P)

Form of Change in Control Agreements among the Company, the Bank, and Certain Officers**Officers (11)(14)

10.3(P)

Form of Queens County Savings Bank Outside Directors’ Consultation and Retirement Plan**Plan (11)(14)

10.4(P)

Supplemental Benefit Plan of Queens County Savings Bank**Bank (12)(15)

10.5(P)

Excess Retirement Benefits Plan of Queens County Savings Bank**Bank (11)(14)

10.6(P)

Queens County Savings Bank Directors’ Deferred Fee Stock Unit Plan**Plan (11)(14)

10.7

New York Community Bancorp, Inc. Management Incentive Compensation Plan** (13)(16)

10.8

New York Community Bancorp, Inc. 2012 Stock Incentive Plan** (14)(17)

10.9

(18)

10.910.11

Underwriting Agreement, dated November 1, 2018, by and among the Registrant and Goldman Sachs & Co., Sandler O’Neill & Partners, L.P., Credit Suisse Securities (USA) LLC, Jeffries LLC, and Merrill Lynch, Pierce, Fenner & Smith Incorporated, as representatives of the several underwriters listed therein (15)

10.10

ConsultingEmployment Agreement between New York Community Bancorp, Inc. and James J. Carpenter** John T. Adams(16)(19)

10.12

(20)

10.1110.13

Flagstar Bancorp, Inc. 2016 Stock Award and Incentive Plan (as assumed by New York Community Bancorp, Inc., 2020 Omnibus Incentive Plan** effective December 1, 2022)(17)(21)

10.1210.14

10.15

10.16
10.17
10.18

10.19

(9)

21.010.20

Subsidiaries information incorporated hereinInvestment Agreement, dated as of March 7, 2024 (as amended on March 11, 2024), by reference to Part I, “Subsidiaries”and between New York Community Bancorp, Inc. and affiliates of funds managed by Reverence Capital Partners LLC(9)

10.21

(9)

22.021

22

23

23.0

Consent of KPMG LLP, dated February 25, 2022March 14, 2024 (attached hereto)

31.1

Rule 13a-14(a) Certification of Chief Executive Officer of the Company in accordance with Section 302 of the Sarbanes-Oxley Act of 2002 (attached hereto)

31.2

Rule 13a-14(a) Certification of Chief Financial Officer of the Company in accordance with Section 302 of the Sarbanes-Oxley Act of 2002 (attached hereto)

32

32.0

Section 1350 Certifications of the Chief Executive Officer and Chief Financial Officer of the Company in accordance with Section 906 of the Sarbanes-Oxley Act of 2002 (attached hereto)

97

101101.INS

The following materials fromXBRL Instance Document – the Company’s Annual Report on Form 10-K forinstance document does not appear in the year ended December 31, 2021, formatted inInteractive Data File because XBRL tags are embedded within the Inline XBRL (Extensible Business Reporting Language): (i) the Consolidated Statements of Condition, (ii) the Consolidated Statements of Income and Comprehensive Income, (iii) the Consolidated Statements of Changes in Stockholders’ Equity, (iv) the Consolidated Statements of Cash Flows, and (v) the Notes to the Consolidated Financial Statements.

document.

101.SCH

Inline XBRL Taxonomy Extension Schema Document.

101.CAL

Inline XBRL Taxonomy Extension Calculation Linkbase Document.
101.DEFInline XBRL Taxonomy Extension Definition Linkbase Document.
101.LABInline XBRL Taxonomy Extension Label Linkbase Document.
101.PREInline XBRL Taxonomy Extension Presentation Linkbase Document.
104

Cover Page Interactive Date File (formatted in Inline XBRL and contained in Exhibit 101)


*Pursuant to Item 601(b)(2) of Regulation S-K, certain schedules and similar attachments have been omitted. The

registrant hereby agrees to furnish a copy of any omitted schedule or similar attachment to the SEC upon request.


** Management plan or compensation plan arrangement.

(1)Incorporated by reference to Exhibits to the Company's Form 8-K filed with the Securities and Exchange Commission on

April 27, 2021 (File No. 1-31565)


156


(2)Incorporated by reference to Exhibits to the Company's Form 8-K filed with the Securities and Exchange Commission on April 27, 2022 (File No. 1-31565)
(3)Incorporated by reference to Exhibits to the Company’s Form 8-K filed with the Securities and Exchange Commission on October 28, 2022 (File No. 1-31565)
(4)Incorporated by reference to Exhibits filed with the Company’s Form 10-Q for the quarterly period ended March 31, 2023 (File No. 1-31565)
(5)Incorporated by reference to Exhibits filed with the Company’s Form 10-Q for the quarterly period ended March 31, 2001 (File No. 0-22278)
1-31565)
(3)(6)
Incorporated by reference to Exhibits filed with the Company’s Form 10-K for the year ended December 31, 2003 (File No. 1-31565)

147


(4)(7)
Incorporated by reference to Exhibits to the Company’s Form 8-K filed with the Securities and Exchange Commission on April 27, 2016 (File No. 1-31565)
(5)(8)
Incorporated herein by reference to Exhibit 3.4 of the Registrant’s Registration Statement on Form 8-A (File No. 333-210919), as filed with the Securities and Exchange Commission on March 16, 2017
(6)(9)
Incorporated herein by reference to Exhibits to the Registrant’s Current Report on Form 8-K (File No. 1-31565), as filed with the Company’s Form 10-K for the year ended December 31, 2016 (File No. 1-31565)
Securities and Exchange Commission on March 14, 2024
(7)(10)
Incorporated by reference to Exhibits filed with the Company’s Form 10-Q for the quarterly period ended September 30, 2017 (File No. 1-31565)
(8)(11)
Incorporated by reference to Exhibits filed with the Company’s Form 8-K filed with the Securities and Exchange Commission on March 17, 2017 (File No. 1-31565)
(9)(12)
Incorporated by reference to Exhibits filed with the Company’s Form 10-K for the year ended December 31, 2019 (File No. 1-31565)
(10)(13)
Incorporated by reference to Exhibits filed with the Company’s Form 8-K filed with the Securities and Exchange Commission on March 9, 2006 (File No. 1-31565)
(11)(14)
Incorporated by reference to Exhibits filed with the Company’s Registration Statement filed on Form S-1, Registration No. 33-66852
(12)(15)
Incorporated by reference to Exhibits filed with the 1995 Proxy Statement for the Annual Meeting of Shareholders held on April 19, 1995 (File No. 0-22278)
(13)(16)
Incorporated by reference to Exhibits filed with the 2006 Proxy Statement for the Annual Meeting of Shareholders held on June 7, 2006 (File No. 1-31565)
(14)(17)
Incorporated by reference to Exhibits filed with the 2012 Proxy Statement for the Annual Meeting of Shareholders held on June 7, 2012 (File No. 1-31565)
(15)(18)Incorporated by reference to Exhibits filed with the Company’s Registration Statement filed on Form S-8 filed, Registration No. 333-241023
(19)Incorporated by reference to Exhibits filed with the Company’s Form 10-Q for the quarterly period ended March 31, 2022 (File No. 001-31565)
(20)Incorporated by reference to Exhibits filed with the Company’s Form 8-K filed with the Securities and Exchange Commission on November 6, 2018December 1, 2022 (File No. 1-31565)
(16)(21)Incorporated by reference to Exhibit 10.1 to Flagstar Bancorp, Inc.’s Form 10-Q filed with the Securities and Exchange Commission on November 6, 2015 (File No. 1-16577)
(22)Incorporated by reference to Exhibits filed with the Company’s Form 10-K/A10-K for the year ended December 31, 20192022 (File No. 1-31565)
(17)(23)Incorporated by reference to Exhibits to the Company’s Current Report on Form 8-K (File No. 1-31565), as filed with the Securities and Exchange Commission on March 8, 2024
(24)Incorporated by reference to Exhibits filed with the Company’s Registration Statement filed on Form S-8 filed on August 5, 2020. Registration10-K for the year ended December 31, 2021 (File No. 333-2410231-31565)

Item 16.Form 10-K Summary

None.


157


SIGNATURES
ITEM 16. FORM 10-K SUMMARY

None.

148


SIGNATURES

Pursuant to the requirements of Section 13 or 15(d) of the Securities Exchange Act of 1934, the registrant has duly caused this report to be signed on its behalf by the undersigned, thereunto duly authorized.

February 25, 2022DATE:

March 14, 2024

New York Community Bancorp, Inc.

(Registrant)

/s/ Alessandro P. DiNello

/s/ Thomas R. Cangemi

Alessandro P. DiNello

Thomas R. Cangemi

Chairman, President and Chief Executive Officer

(Principal Executive Officer)


Pursuant to the requirements of the Securities Exchange Act of 1934, this report has been signed below by the following persons on behalf of the registrant and in the capacities and on the dates indicated.

/s/ Thomas R. CangemiAlessandro P. DiNello

2/25/22

3/14/24

/s/ John J. Pinto

2/25/22

3/14/24

Thomas R. CangemiAlessandro P. DiNello

John J. Pinto

Chairman, President and Chief Executive Officer

Chairman (Principal Executive Officer)

Senior Executive Vice President and Chief Financial Officer

(Principal Executive Officer)

(Principal Financial Officer)

/s/ Alessandro P. DiNello3/14/24/s/ Bryan L Marx3/14/24

Alessandro P. DiNello

Bryan L Marx

Director

Principal Accounting Officer
/s/ Dominick CiampaMarshall Lux

2/25/22

3/14/24

/s/ Hanif W. Dahya

2/25/22

Dominick Ciampa

Hanif W. Dahya

Director

Director

/s/ Leslie D. Dunn

2/25/22

/s/ James J. O’Donovan

2/25/22

Leslie D. Dunn

James J. O’Donovan

Director

Director

/s/ Lawrence Rosano, Jr.

2/25/22

/s/ Ronald A. Rosenfeld

2/25/22

Lawrence Rosano, Jr.

Ronald A. Rosenfeld

Director

Director

/s/ Lawrence J. Savarese

2/25/22

/s/ Robert Wann

2/25/22

3/14/24

Marshall Lux

Lawrence J. Savarese

Presiding Director

Director

Robert Wann/s/ Peter Schoels

3/14/24

/s/ David L. Treadwell

3/14/24

Peter Schoels

David L. Treadwell
Director

Director

Senior Executive Vice President,

Chief Operating Officer, and Director

/s/ Jennifer R. Whip

3/14/24

Jennifer R. Whip

Director


149


158