companies for which they work, and this broad community engagement assists our go-to-market strategy by enabling technical knowledge and adoption inside our customers’ organizations. As a result, 2024. continuous integration systems to test code. Once a developer is ready to push a change to production, there is a highly fragmented ecosystem of tools, and organizations often have custom-built solutions to manage the remaining lifecycle. Waypoint provides a standard workflow that is designed to be simple and prescriptive for developers, while being highly extensible to enable platform operators to integrate their existing tools and systems. This enables platform teams to hide the complexity of the underlying infrastructure and enable developers to have a consistent workflow for application delivery across environments. organization. Our business and operations have experienced periods of rapid growth and fluctuation, and if we do not appropriately manage future growth or change, if any, or are unable to improve our systems and processes, our business, financial condition, results of operations, and prospects will be adversely affected. including entry into new markets or growth in lower margin markets; entry into markets with different pricing and cost structures; pricing discounts; and increased price competition. Any one of these factors or the cumulative effects of certain of these factors may result in significant fluctuations in our gross margin and operating results. This variability and unpredictability could result in our failure to meet internal expectations or those of investors for a particular period. features and compliance capabilities to satisfy customer requirements. Our inability to meet those requirements could limit the revenue growth we achieve from our cloud offerings. quarter due to extended sales cycles. results. them. operations. results. the compensation obligations we have to our customers. from changes in gross domestic product growth, financial and credit market fluctuations, uncertain interest rates, inflationary pressures, interest rate increases, recessionary economic cycles, political turmoil, natural catastrophes, warfare, and terrorist attacks on the United States, Europe, the Asia-Pacific region, or elsewhere, could cause a decrease in business investments by our customers and potential customers, including spending on information technology, and negatively affect the growth of our business. For example, rising interest rates and high levels of inflation have affected businesses across many industries, which has significantly constrained and may continue to constrain the budgets of our customers and prospective customers. To the extent our offerings are perceived by customers and potential customers as discretionary, our revenue may be disproportionately affected by delays or reductions in general information technology spending. Also, customers may choose to develop in-house software as an alternative to using our products. Moreover, competitors may respond to market conditions by lowering prices. We cannot predict the timing, strength, or duration of any economic slowdown, instability, or recovery, generally or within any particular industry. If the economic conditions of the general economy or markets in which we operate do not improve, or worsen from present levels, our business, results of operations, and financial condition could be adversely affected. AI in our offerings and in our business may result in reputational harm or liability. receive or deliver the purchased software before the quarter ends. As a result, we may need to prioritize some orders over the United States unless the parties to the transfer have implemented specific safeguards to protect the transferred personal data. The safeguard on which we have primarily relied for such transfers has been implementation of the European Commission’s Standard Contractual Clauses, or SCCs, in our relevant data transfer agreements. We have undertaken certain efforts to conform transfers of personal data from the European Economic Area, or the EEA, to the United States and other jurisdictions based on our understanding of current regulatory obligations and the guidance of data protection authorities. The EU-U.S. Privacy Shield program administered by the U.S. Department of Commerce, to which we have self-certified, was invalidated other claims and penalties, and we could be required to fundamentally change our products or our business practices, which could have an adverse effect on our business. Any inability to adequately address privacy, data protection, and data security concerns, even if unfounded, or any actual or perceived failure to comply with applicable privacy, data protection, and data security laws, regulations, and other obligations, could result in additional cost and liability to us, damage our reputation, inhibit sales, and adversely affect our business. Furthermore, the costs of compliance with, and other burdens imposed by, the laws, regulations, and policies that are applicable to the businesses of our customers may limit the use and adoption of, and reduce the overall demand for, our products. Privacy, data protection, and data security concerns, whether valid or not valid, may inhibit market adoption of our products, particularly in certain industries and countries outside of the United States. If we are not able to adjust to changing laws, regulations, and standards related to the internet, our business may be harmed. procedures to address compliance with such laws, we cannot assure you that all of our employees, representatives, contractors, partners, and agents will not take actions in violation of our policies and applicable law, for which we may be ultimately held responsible. Any allegations or violation of the FCPA or other applicable anti-bribery, anti-corruption laws, and anti-money laundering laws could result in whistleblower complaints, adverse media coverage, investigations, loss of export privileges, severe criminal or civil sanctions, or suspension or debarment from U.S. government contracts, all of which may have an adverse effect on our reputation, business, operating results, and prospects. Responding to any investigation or action will likely result in a materially significant diversion of management’s attention and resources and significant defense costs and other professional fees. have limited experience and expertise regarding acquisitions, and we may devote resources to exploring larger and more complex acquisitions and investments than we have previously attempted. Any such acquisitions or investments may divert the attention of management and cause us to incur various expenses in identifying, investigating, and pursuing suitable opportunities, whether or not the transactions are completed, and may result in unforeseen operating difficulties and expenditures. In particular, we may encounter difficulties assimilating or integrating the businesses, technologies, products, personnel, or operations of any acquired companies, particularly if the key personnel of an acquired company choose not to work for us, their software is not easily adapted to work with our platform, or we have difficulty retaining the customers of any acquired business due to changes in ownership, management, or otherwise. In addition, we have limited experience in acquiring other businesses. If an acquired business fails to meet our expectations, our operating results, and business and financial position may suffer. We may not be able to find and identify desirable acquisition targets, we may incorrectly estimate the value of an acquisition target, and we may not be successful in entering into an agreement with any particular target. Further, any such transactions that we largely remote workforce. wider sanctions and take other actions should the conflict further escalate. It is not possible to predict the broader consequences of this conflict, which could include further sanctions, embargoes, regional instability, prolonged periods of higher inflation, geopolitical shifts, and adverse effects on macroeconomic conditions, currency exchange rates, and financial markets, all of which could have a material adverse effect on our business, financial condition, and results of operations. Our other co-founder Mitchell Hashimoto ceased to be an employee of HashiCorp in fiscal 2024 and has no significant influence on the voting power of our outstanding common stock. Our fiscal year ended January 31, 2023 is referred to as fiscal 2023, and our fiscal year ending January 31, 2024 is referred to as fiscal 2024. We also intend to continue to grow our base of large enterprises around the world. As of January 31, 2022 2021 2020 (dollars in millions) Total customers 2,715 1,473 831 Total customers with $100,000 or greater ARR 655 500 338 Subscription revenue from HCP (and its predecessor cloud offerings) $ 18.5 (1) $ 2.9 (1) $ 0.3 (1) Remaining performance obligations (RPOs) $ 428.8 $ 263.9 $ 152.1 Non-GAAP RPOs(2) $ 452.2 $ 286.1 $ 171.0 As of January 31, 2022 January 31, 2021 GAAP RPOs GAAP short-term RPOs $ 268,911 $ 165,798 GAAP long-term RPOs 159,923 98,131 Total GAAP RPOs $ 428,834 $ 263,929 Add: Customer deposits Customer deposits expected to be recognized within the next 12 months $ 20,324 $ 20,421 Customer deposits expected to be recognized after the next 12 months 3,059 1,798 Total customer deposits $ 23,383 $ 22,219 Non-GAAP RPOs Non-GAAP short-term RPOs $ 289,235 $ 186,219 Non-GAAP long-term RPOs 162,982 99,929 Total Non-GAAP RPOs $ 452,217 $ 286,148 Year Ended January 31, 2022 2021 2020 (in thousands) GAAP net cash used in operating activities $ (56,215 ) $ (39,623 ) $ (28,365 ) Add: purchases of property and equipment (214 ) (4,304 ) (980 ) Add: capitalized internal-use software (6,382 ) (2,920 ) - Free cash flow (used in) $ (62,811 ) $ (46,847 ) $ (29,345 ) GAAP net cash used in operating activities as a percentage of revenue (18 ) % (19 ) % (23 ) % Free cash flow as a % of revenue (20 ) % (22 ) % (24 ) % services and other revenue. Our software subscriptions are currently predominantly self-managed by users and customers who deploy it across public, private, and hybrid cloud environments. We also offer the HCP, our fully-managed cloud platform for multiple products. previous periods. Consequently, increases or decreases in new sales or renewals in any one period may not be immediately reflected as revenue for that period. Any downturn in sales, however, may negatively affect our revenue in future periods. Accordingly, the effect of downturns in sales and market acceptance of our products, and potential changes in our rate of renewals, may not be fully reflected in our results of operations until future periods. losses from foreign currency transactions, and realized gains and losses on short-term investments. Year Ended January 31, 2022 2021 2020 (in thousands) Consolidated Statements of Operations Data: Revenue: License $ 47,504 $ 36,208 $ 18,503 Support 247,566 165,607 96,820 Cloud-hosted services 18,613 4,092 2,339 Total subscription revenue 313,683 205,907 117,662 Professional services 7,086 5,947 3,599 Total revenue 320,769 211,854 121,261 Cost of revenue: Cost of license(1) 221 536 294 Cost of support(1) 38,080 27,194 17,704 Cost of cloud-hosted services(1) 14,031 4,811 1,390 Total cost of subscription revenue(1) 52,332 32,541 19,388 Cost of professional services(1) 11,108 8,511 4,527 Total cost of revenue(1) 63,440 41,052 23,915 Gross profit 257,329 170,802 97,346 Operating expenses: Sales and marketing(1) 269,504 141,018 89,308 Research and development(1) 165,031 65,248 40,118 General and administrative(1) 112,108 48,545 24,137 Total operating expenses 546,643 254,811 153,563 Loss from operations (289,314 ) (84,009 ) (56,217 ) Other income, net 162 756 3,382 Loss before income taxes (289,152 ) (83,253 ) (52,835 ) Provision for income taxes 986 262 535 Net loss $ (290,138 ) $ (83,515 ) $ (53,370 ) Year Ended January 31, 2022 2021 2020 (in thousands) Cost of revenue: Cost of license $ — $ — $ — Cost of support 8,073 1,056 401 Cost of cloud-hosted services 2,482 — — Total cost of subscription revenue 10,555 1,056 401 Cost of professional services 3,367 308 89 Total cost of revenue 13,922 1,364 490 Sales and marketing 64,991 11,286 2,466 Research and development 67,865 5,974 1,507 General and administrative 53,790 20,599 4,998 Total stock-based compensation expense $ 200,568 * $ 39,223 ** $ 9,461 ** Year Ended January 31, 2022 2021 2020 Revenue: License 15 % 17 % 15 % Support 77 78 80 Cloud-hosted services 6 2 2 Total subscription revenue 98 97 97 Professional services 2 3 3 Total revenue 100 100 100 Cost of revenue: Cost of license - - - Cost of support 12 13 15 Cost of cloud-hosted services 4 2 1 Total cost of subscription revenue 16 15 16 Cost of professional services 4 4 4 Total cost of revenue 20 19 20 Gross profit 80 81 80 Operating expenses: Sales and marketing 84 67 73 Research and development 51 31 33 General and administrative 35 23 20 Total operating expenses 170 121 126 Loss from operations (90 ) (40 ) (46 ) Other income, net - 1 2 Loss before income taxes (90 ) (39 ) (44 ) Provision for income taxes - - - Net loss (90 ) % (39 ) % (44 ) % Fiscal 2023 Year Ended January 31, Change 2022 2021 $ % (in thousands, except percentages) Revenue: License $ 47,504 $ 36,208 11,296 31 Support 247,566 165,607 81,959 49 Cloud-hosted services 18,613 4,092 14,521 355 Total subscription revenue 313,683 205,907 107,776 52 Professional services 7,086 5,947 1,139 19 Total revenue $ 320,769 $ 211,854 108,915 51 2024. The increase is offset by a $3.5 million decrease related to revenue recognized from a resale contract commitment in fiscal 2023. Year Ended January 31, Change 2022 2021 $ % (in thousands, except percentages) Cost of revenue: Cost of license $ 221 $ 536 (315 ) (59 ) Cost of support 38,080 27,194 10,886 40 Cost of cloud-hosted services 14,031 4,811 9,220 192 Total cost of subscription revenue 52,332 32,541 19,791 61 Cost of professional services 11,108 8,511 2,597 31 Total cost of revenue $ 63,440 $ 41,052 22,388 55 Year Ended January 31, 2022 2021 Gross margin License 100 % 99 % Support 85 % 84 % Cloud-hosted services 25 % (18 ) % Total subscription margin 83 % 84 % Professional services (57 ) % (43 ) % Total gross margin 80 % 81 % margin profile will change because we have a lower gross margin on cloud-hosted services due to headcount related to our cloud offering operations and cloud hosting fees. service. our professional services and other margin. Year Ended January 31, Change 2022 2021 $ % (in thousands, except percentages) Sales and marketing $ 269,504 $ 141,018 128,486 91 respectively. Year Ended January 31, Change 2022 2021 $ % (in thousands, except percentages) Research and development $ 165,031 $ 65,248 99,783 153 Year Ended January 31, Change 2022 2021 $ % (in thousands, except percentages) General and administrative $ 112,108 $ 48,545 63,563 131 Year Ended January 31, Change 2022 2021 $ % (in thousands, except percentages) Other income, net $ 162 $ 756 (594 ) (79 ) Year Ended January 31, Change 2022 2021 $ % (in thousands, except percentages) Provision for income taxes $ 986 $ 262 724 276 2024, fiscal Year Ended January 31, 2022 2021 2020 (in thousands) Net cash used in operating activities $ (56,215 ) $ (39,623 ) $ (28,365 ) Net cash provided by (used in) investing activities $ (6,596 ) $ 22,776 $ 46,020 Net cash provided by financing activities $ 1,147,846 $ 177,124 $ 1,071 and $26.4 million of cash inflows from maturities and sales of investments, respectively. equipment. Activities settlement. taxes related to net share settlement. Payment Due By Period Total Less Than 1-3 Years 3-5 Years More Than (in thousands) Operating leases $ 20,603 $ 3,781 $ 8,074 $ 7,471 $ 1,277 Hosting Infrastructure Commitments 29,638 6,569 23,069 - - Non-cancelable purchase obligations 29,883 16,820 13,063 - - Total $ 80,124 $ 27,170 $ 44,206 $ 7,471 $ 1,277 business payments of $10.5 million due in the next 12 months and $1.6 million due thereafter. We expect to fund these obligations with cash flows from operations and cash on our balance sheet. Critical accounting estimates are accounting estimates where the nature of the estimates is material due to the levels of subjectivity and judgment necessary to account for highly uncertain matters or the susceptibility of such matters to change, and the impact of the estimates on financial condition or operating performance is material. recognition. obtaining a contract with a customer. Sales commissions for Year Ended January 31, 2022 2021 2021 Expected volatility 49.0% - 50.2% 50.0% - 51.4% 47.3% - 54.1% Expected term (in years) 6.08 6.08 6.08 Risk-free interest rate 0.9% - 1.04% 0.5% - 0.6% 1.4% - 2.6% Dividend yield 0% 0% 0% pronouncements. There have been no material changes in our market risk exposures during fiscal 2024. Declines in interest rates, however, would reduce our future interest income. Internal Control—Integrated Framework (2013) issued by the Committee of Sponsoring Organizations of the Treadway Commission and our report dated March 20, 2024, expressed an unqualified opinion on the Company's internal control over financial reporting. Our audits included performing procedures to assess the risks of material misstatement of the financial statements, whether due to error or fraud, and performing procedures that respond to those risks. Such procedures included examining, on a test basis, evidence regarding the amounts and disclosures in the financial statements. Our audits also included evaluating the accounting principles used and significant estimates made by management, as well as evaluating the overall presentation of the financial statements. We believe that our audits provide a reasonable basis for our opinion. 20, 2024 As of January 31, 2022 2021 Assets Current assets Cash and cash equivalents $ 1,355,828 $ 270,793 Accounts receivable, net of allowance of $20 and $36, respectively 126,812 93,462 Deferred contract acquisition costs 32,205 15,275 Prepaid expenses and other current assets 17,744 4,574 Total current assets 1,532,589 384,104 Property and equipment, net 15,897 8,235 Operating lease right-of-use assets 15,420 15,766 Deferred contract acquisition costs, non-current 57,126 34,970 Other assets, non-current 2,643 2,189 Total assets $ 1,623,675 $ 445,264 Liabilities, Redeemable Convertible Preferred Stock, and Stockholders’ Equity (Deficit) Current liabilities: Accounts payable $ 14,267 $ 5,203 Accrued expenses and other current liabilities 4,542 2,138 Accrued compensation and benefits 56,939 19,213 Operating lease liabilities 3,130 2,389 Deferred revenue 206,416 136,091 Customer deposits 23,383 22,219 Total current liabilities 308,677 187,253 Deferred revenue, non-current 16,873 11,206 Operating lease liabilities, non-current 15,483 16,755 Other liabilities, non-current 351 2,741 Total liabilities 341,384 217,955 Commitments and contingencies (note 8) Redeemable convertible preferred stock Redeemable convertible preferred stock; $0.000015 par value; 0 and 94,127,984 shares authorized as of January 31, 2022 and 2021, respectively; 0 and 94,127,984 shares issued and outstanding as of January 31, 2022 and 2021, respectively; aggregate liquidation preference of $0 and $349,760 as of January 31, 2022 and 2021, respectively - 349,113 Stockholders’ equity (deficit) Preferred stock; $0.000015 par value; 100,000,000 and 0 shares authorized as of January 31, 2022 and 2021, respectively; 0 and 0 shares issued and outstanding as of January 31, 2022 and 2021, respectively - - Class A common stock, par value of $0.000015 per share; 1,000,000,000 and 0 shares authorized as of January 31, 2022 and 2021, respectively; 30,596,695 and 0 shares issued and outstanding as of January 31, 2022 and 2021, respectively 1 - Class B common stock, par value of $0.000015 per share; 200,000,000 and 192,000,000 shares authorized as of January 31, 2022 and 2021, respectively; 151,569,865 and 65,577,877 shares issued and outstanding as of January 31, 2022 and 2021, respectively 2 1 Additional paid-in capital 1,788,390 94,159 Accumulated deficit (506,102 ) (215,964 ) Total stockholders’ equity (deficit) 1,282,291 (121,804 ) Total liabilities, redeemable convertible preferred stock, and stockholders’ equity (deficit) $ 1,623,675 $ 445,264 Year Ended January 31, 2022 2021 2020 Revenue: License $ 47,504 $ 36,208 $ 18,503 Support 247,566 165,607 96,820 Cloud-hosted services 18,613 4,092 2,339 Total subscription revenue 313,683 205,907 117,662 Professional services 7,086 5,947 3,599 Total revenue 320,769 211,854 121,261 Cost of revenue: Cost of license 221 536 294 Cost of support 38,080 27,194 17,704 Cost of cloud-hosted services 14,031 4,811 1,390 Total cost of subscription revenue 52,332 32,541 19,388 Cost of professional services 11,108 8,511 4,527 Total cost of revenue 63,440 41,052 23,915 Gross profit 257,329 170,802 97,346 Operating expenses: Sales and marketing 269,504 141,018 89,308 Research and development 165,031 65,248 40,118 General and administrative 112,108 48,545 24,137 Total operating expenses 546,643 254,811 153,563 Loss from operations (289,314 ) (84,009 ) (56,217 ) Other income, net 162 756 3,382 Loss before income taxes (289,152 ) (83,253 ) (52,835 ) Provision for income taxes 986 262 535 Net loss $ (290,138 ) $ (83,515 ) $ (53,370 ) Net loss per share attributable to common stockholders, basic and diluted $ (3.48 ) $ (1.32 ) $ (0.90 ) Weighted-average shares used to compute net loss per share attributable to common stockholders, basic and diluted 83,276,526 63,375,470 59,161,264 COMPREHENSIVE LOSS thousands) Redeemable Convertible Preferred Stock Class A and Class B Additional Paid-in Accumulated Total Stockholders' Shares Amount Shares Amount Capital Deficit Equity (Deficit) Balance as of February 1, 2019 88,076,852 $ 174,389 58,967,390 $ 1 $ 41,509 $ (79,079 ) $ (37,569 ) Issuance of common stock upon exercise of stock options - - 2,289,774 - 1,048 - 1,048 Issuance of common stock related to early exercised stock options - - 190,000 - - - - Vesting of early exercised stock options - - - - 190 - 190 Stock-based compensation - - - - 9,461 - 9,461 Net loss - - - - - (53,370 ) (53,370 ) Balance as of January 31, 2020 88,076,852 $ 174,389 61,447,164 $ 1 $ 52,208 $ (132,449 ) $ (80,240 ) Issuance of Series E redeemable convertible preferred stock, net of issuance costs of $276 6,051,132 174,724 - - - - - Issuance of common stock upon exercise of stock options - - 4,130,713 - 2,629 - 2,629 Vesting of early exercised stock options - - - - 99 - 99 Stock-based compensation - - - - 39,223 - 39,223 Net loss - - - - (83,515 ) (83,515 ) Balance as of January 31, 2021 94,127,984 $ 349,113 65,577,877 $ 1 $ 94,159 $ (215,964 ) $ (121,804 ) Conversion of redeemable convertible preferred stock to common stock upon initial public offering (94,127,984 ) $ (349,113 ) 94,127,984 1 349,112 - 349,113 Issuance of common stock upon initial public offering, net of underwriting discounts and issuance costs - - 16,530,000 1 1,246,924 - 1,246,925 Issuance of common stock for restricted stock awards - - 10,564 - - - - Issuance of common stock upon exercise of stock options - - 2,961,753 - 5,036 - 5,036 Vesting of early exercised stock options - - - - 18 - 18 Issuance of common stock upon settlement of restricted stock units - - 4,355,635 - - - - Tax withholdings on settlement of restricted stock units - - (1,397,253 ) - (110,989 ) - (110,989 ) Stock-based compensation - - - - 204,130 - 204,130 Net loss - - - - - (290,138 ) (290,138 ) Balance as of January 31, 2022 - $ - 182,166,560 $ 3 $ 1,788,390 $ (506,102 ) $ 1,282,291 Year Ended January 31, 2022 2021 2020 Cash flows from operating activities Net loss $ (290,138 ) $ (83,515 ) $ (53,370 ) Adjustments to reconcile net loss to cash from operating activities: Stock-based compensation expense 200,568 39,223 9,461 Depreciation and amortization expense 2,498 888 235 Non-cash operating lease cost 2,382 2,098 1,263 Other 14 57 5 Changes in operating assets and liabilities: Accounts receivable (33,364 ) (41,407 ) (27,698 ) Deferred contract acquisition costs (39,086 ) (19,984 ) (15,920 ) Prepaid expenses and other assets (13,626 ) 2,653 (3,436 ) Accounts payable 8,464 1,093 2,423 Accrued expenses and other liabilities (895 ) 3,277 360 Accrued compensation and benefits 32,379 7,536 6,646 Operating lease liabilities (2,567 ) (1,789 ) (801 ) Deferred revenue 75,992 46,911 45,605 Customer deposits 1,164 3,336 6,862 Net cash used in operating activities (56,215 ) (39,623 ) (28,365 ) Cash flows from investing activities Purchases of property and equipment (214 ) (4,304 ) (980 ) Capitalized internal-use software (6,382 ) (2,920 ) - Purchase of short-term investments - (50,000 ) (120,000 ) Proceeds from maturities of short-term investments - 80,000 167,000 Net cash (used in) provided by investing activities (6,596 ) 22,776 46,020 Cash flows from financing activities Proceeds from initial public offering, net of underwriting discounts and commissions 1,252,974 - - Taxes paid related to net share settlement of equity awards (105,642 ) - - Payments of loan issuance costs - (229 ) - Proceeds from issuance of redeemable convertible preferred stock, net of issuance costs - 174,724 - Proceeds from issuance of common stock upon exercise of stock options 5,036 2,629 1,048 Proceeds from issuance of common stock related to early exercised stock options - - 23 Payments of deferred offering costs (4,522 ) - - Net cash provided by financing activities 1,147,846 177,124 1,071 Net increase in cash, cash equivalents, and restricted cash 1,085,035 160,277 18,726 Cash, cash equivalents, and restricted cash beginning of period 272,576 112,299 93,573 Cash, cash equivalents, and restricted cash end of period $ 1,357,611 $ 272,576 $ 112,299 Supplemental disclosure of cash flow information Cash paid for income taxes $ 739 $ 452 $ 119 Cash paid for operating lease liabilities $ 3,291 $ 2,479 $ 1,379 Supplemental disclosure of noncash investing and financing activities Purchase of property and equipment included in accounts payable $ - $ - $ 1,283 Operating lease right-of-use assets obtained in exchange for new lease obligations $ 2,036 $ - $ 10,829 Tenant allowance included in prepaid expenses and other current assets $ - $ - $ 1,666 Unpaid deferred offering costs $ 1,527 $ - $ - Unpaid taxes related to net share settlement of equity awards $ 5,347 $ - $ - Conversion of convertible preferred stock to common stock upon initial public offering $ 349,113 $ - $ - Capitalized stock-based compensation expense $ 3,562 $ - $ - Vesting of early exercised stock options $ 18 $ 99 $ 190 Basis of Presentation Principles of Consolidation Fiscal Year Foreign Currency Transactions Use of Estimates Cash and Cash Equivalents As of January 31, 2022 2021 2020 Cash and cash equivalents $ 1,355,828 $ 270,793 $ 110,519 Restricted cash included in other assets, non-current 1,783 1,783 1,780 Cash, cash equivalents, and restricted cash $ 1,357,611 $ 272,576 $ 112,299 Accounts Receivable and Allowance for Doubtful Accounts The allowance for credit losses reflects the Company’s best estimate of probable losses inherent in the Company’s receivables portfolio. Activity related to the Company’s allowance for doubtful accounts was as follows (in thousands): Year Ended January 31, 2022 2021 2020 Beginning balance $ 36 $ 6 $ 68 Bad debt expense 14 129 (62 ) Write-offs (30 ) (99 ) - Ending balance $ 20 $ 36 $ 6 Concentrations of Credit Risk and Significant Customers Property and Equipment, net Revenue Recognition services and other revenue. The software subscriptions are currently predominantly self-managed by users and customers who deploy it across public, private, and hybrid cloud environments. The Company also offers the HashiCorp Cloud Platform, or HCP, our fully-managed cloud platform for multiple products. substantial portion of the revenue that we report in each period is attributable to the recognition of deferred revenue relating to agreements that we entered into during previous periods. Consequently, increases or decreases in new sales or renewals in any one period may not be immediately reflected as revenue for that period. Any downturn in sales, however, may negatively affect our revenue in future periods. Accordingly, the effect of downturns in sales and market acceptance of our products, and potential changes in our rate of renewals, may not be fully reflected in our results of operations until future periods. Contract Balances Deferred Contract Acquisition Costs Leases Cost of Revenue Sales and Marketing Research and Development General and Administrative Capitalized Software Development Costs Advertising Costs Impairment of Long-Lived Assets The Company has master netting agreements with each of its counterparties, which permit net settlement of multiple, separate derivative contracts with a single payment. The Company does not have collateral requirements with any of its counterparties. Although the Company is allowed to present the fair value of derivative instruments on a net basis according to master netting arrangements, the Company has elected to present its derivative instruments on a gross basis in the consolidated financial statements. Net Loss per Share Attributable to Common Stockholders outstanding for the period using the treasury stock method or the if-converted method based on the nature of such securities. Diluted net loss per share is the same as basic net loss per share in periods when the effects of potentially dilutive shares of common stock are anti-dilutive. Accumulated Other Comprehensive Segments Fair Value Measurements Employee Benefit Plan Recent Accounting Pronouncements Not Yet Adopted Revenue The following table presents revenue by category (dollars in thousands): Year Ended January 31, 2022 2021 2020 Amount % of Total Amount % of Total Amount % of Total Revenue License $ 47,504 15 % $ 36,208 17 % $ 18,503 15 % Support 247,566 77 165,607 78 96,820 80 Cloud-hosted services 18,613 6 4,092 2 2,339 2 Total subscription revenue 313,683 98 205,907 97 117,662 97 Professional services 7,086 2 5,947 3 3,599 3 Total revenue $ 320,769 100 % $ 211,854 100 % $ 121,261 100 % Year Ended January 31, 2022 2021 2020 Amount % of Total Amount % of Total Revenue Amount % of Total Revenue United States $ 235,428 73 % $ 157,916 75 % $ 92,771 77 % Rest of the world 85,341 27 53,938 25 28,490 23 Total $ 320,769 100 % $ 211,854 100 % $ 121,261 100 % Changes in deferred revenue and unbilled accounts receivable were as follows (in thousands): Year Ended January 31, 2022 2021 2020 Balance, beginning of period $ 147,297 $ 100,386 $ 54,781 Billings, excluding billings for customer deposits 364,365 228,498 149,139 Reclassification to deferred revenue from customer deposits 30,788 29,046 18,331 Recognition of revenue, net of change in unbilled accounts receivable* (319,161 ) (210,633 ) (121,865 ) Balance, end of period $ 223,289 $ 147,297 $ 100,386 * Reconciliation to Revenue Reported per Consolidated Statements of Operations: Revenue billed as of the end of the period $ 319,161 $ 210,633 $ 121,865 Increase (decrease) in total unbilled accounts receivable 1,608 1,221 (604 ) Revenue Reported per Consolidated Statements of Operations $ 320,769 $ 211,854 $ 121,261 The following tables summarize the fair values of the Company’s short-term investments (in thousands): As of January 31, 2022 2021 Within the next 12 months $ 20,324 $ 20,421 After the next 12 months 3,059 1,798 Total $ 23,383 $ 22,219 The Company does not hold any marketable securities that have been in a continuous unrealized loss position for over 12 months. For short-term investments with an unrealized loss at January 31, 2024, the unrealized losses were not due to credit-related factors, the Company does not intend to sell these short-term investments, and it is more likely than not that the Company will hold these short-term investments until maturity or a recovery of the cost basis. Therefore, no allowance for expected credit losses was recorded as of January 31, 2024. Realized gains (losses) were not material during the year ended January 31, 2024. The following table sets forth the financial assets, measured at fair value, by level within the fair value hierarchy on a recurring basis As of January 31, 2022 Level 1 Level 2 Level 3 Total Cash and cash equivalents Money market funds $ 1,129,436 $ 0 $ 0 $ 1,129,436 Total cash and cash equivalents 1,129,436 0 0 1,129,436 Total assets measured at fair value $ 1,129,436 $ 0 $ 0 $ 1,129,436 Included in cash and cash equivalents $ 1,129,436 As of January 31, 2021 Level 1 Level 2 Level 3 Total Cash and cash equivalents Money market funds $ 151,657 $ 0 $ 0 $ 151,657 Total cash and cash equivalents 151,657 0 0 151,657 Total assets measured at fair value $ 151,657 $ 0 $ 0 $ 151,657 Included in cash and cash equivalents $ 151,657 Property and equipment, net are comprised of the following (in thousands): Estimated As of January 31, Useful life 2022 2021 Furniture and fixtures 5 years $ 1,266 $ 1,224 Computers, equipment and software 3 years 532 389 Capitalized internal-use software development costs 5 years 12,209 2,920 Leasehold improvements Shorter of useful life or lease term 5,008 4,979 Construction in progress(1) 655 - Total property and equipment 19,670 9,512 Less: accumulated depreciation and amortization (3,773 ) (1,277 ) Property and equipment - net $ 15,897 $ 8,235 Accrued expenses and other liabilities are comprised of the following (in thousands): As of January 31, 2022 2021 Accrued expenses $ 3,925 $ 569 Accrued income taxes payable 611 354 Liability for early exercise of unvested stock options 6 24 Sales tax payable - 1,191 Total accrued expenses and other liabilities $ 4,542 $ 2,138 Accrued compensation and benefits are comprised of the following (in thousands): As of January 31, 2022 2021 Accrued commissions $ 15,993 $ 9,862 Accrued bonus 2,632 1,725 Accrued vacation 15,970 1,900 Accrued payroll and withholding taxes 18,885 5,296 ESPP employee contribution 2,709 - Other 750 430 Total accrued compensation and benefits $ 56,939 $ 19,213 The following table summarizes the activity of the deferred contract acquisition costs (in thousands): Year Ended January 31, 2022 2021 2020 Beginning balance $ 50,245 $ 30,261 $ 14,341 Capitalization of contract acquisition costs 64,834 33,821 22,668 Amortization of deferred contract acquisition costs (25,748 ) (13,837 ) (6,748 ) Ending balance $ 89,331 $ 50,245 $ 30,261 Deferred contract acquisition costs, current $ 32,205 $ 15,275 $ 8,754 Deferred contract acquisition costs, non-current 57,126 34,970 21,507 Total deferred contract acquisition costs $ 89,331 $ 50,245 $ 30,261 Lease costs were as follows (in thousands): Year Ended January 31, 2022 2021 2020 Short-term lease costs $ 333 $ 227 $ 98 Operating lease costs 3,106 2,898 1,842 Total lease costs $ 3,439 $ 3,125 $ 1,940 Lease term and discount rate information are summarized as follows: As of January 31, 2022 2021 2020 Weighted average remaining lease terms (in years) 5.1 6.3 7.3 Weighted average discount rate 3.8 % 3.9 % 3.9 % Years Ending January 31, Amount 2023 $ 3,781 2024 3,924 2025 4,150 2026 3,734 2027 3,737 Thereafter 1,277 Total minimum lease payments 20,603 Less imputed interest (1,990 ) Present value of future minimum lease payments 18,613 Less current lease liabilities (3,130 ) Operating lease liabilities, non-current $ 15,483 spaces. Litigation Years Ending January 31, Minimum Hosting Other Total (in thousands) 2023 $ 3,781 $ 6,569 $ 7,386 $ 17,736 2024 3,924 9,246 7,076 20,246 2025 4,150 9,656 4,823 18,629 2026 3,734 4,167 - 7,901 2027 3,737 - - 3,737 Thereafter 1,277 - - 1,277 Total $ 20,603 $ 29,638 $ 19,285 $ 69,526 Shares Authorized Issued and Outstanding Carrying Value Liquidation Preference Issue Price per Share Series Seed 8,418,228 8,418,228 $ 560 $ 560 $ 0.07 Series A 23,575,316 23,575,316 10,114 10,200 $ 0.43 Series B 34,434,922 34,434,922 23,927 24,000 $ 0.70 Series C 12,625,844 12,625,844 39,909 40,000 $ 3.17 Series D 9,022,542 9,022,542 99,879 100,000 $ 11.08 Series E 6,051,132 6,051,132 174,724 175,000 $ 28.92 Total 94,127,984 94,127,984 $ 349,113 $ 349,760 The Company reserved shares of common stock for future issuance as As of January 31, 2022 2021 Series Seed convertible preferred stock - 8,418,228 Series A convertible preferred stock - 23,575,316 Series B convertible preferred stock - 34,434,922 Series C convertible preferred stock - 12,625,844 Series D convertible preferred stock - 9,022,542 Series E convertible preferred stock - 6,051,132 2014 Stock Plan: Options outstanding - 15,575,113 Restricted stock units outstanding - 8,616,594 Remaining shares available for future issuance under the 2014 Plan - 637,212 2021 Equity Incentive Plan: Options outstanding 12,381,134 - Restricted stock units outstanding 10,406,294 - Remaining shares available for future issuance under the 2021 Plan 17,560,879 - 2021 Employee Stock Purchase Plan 1,900,000 - Total 42,248,307 118,956,903 As of January 31, 2022 2021 Available at beginning of period 637,212 208,924 Awards authorized 23,051,200 5,654,722 Options granted (69,700 ) (54,500 ) Options cancelled 301,926 269,326 RSUs granted (7,106,578 ) (5,858,686 ) RSUs cancelled 961,243 417,426 Termination of the 2014 Plan (1,611,677 ) - Shares withheld related to net share settlement of RSUs 1,397,253 - Available at end of period 17,560,879 637,212 Stock Options The following table summarizes stock option activity for the Options Outstanding Number of Options Outstanding Weighted- Average Exercise Price Weighted- Average Remaining Contractual Term (in Years) Aggregate Intrinsic Value Balance as of January 31, 2021 15,575,113 $ 1.77 6.7 $ 372,671 Stock options granted 69,700 $ 28.34 Stock options exercised (2,961,753 ) $ 1.68 $ 168,258 Stock options cancelled/forfeited/expired (301,926 ) $ 2.12 Balance as of January 31, 2022 12,381,134 $ 1.93 5.7 $ 798,374 Exercisable as of January 31, 2022 10,536,517 $ 1.39 5.5 $ 684,903 The weighted-average grant-date fair values of option awards granted during fiscal 2022 The Company’s summary of RSUs activity under the 2014 Plan and the 2021 Plan is as Number of Awards Weighted-Average Grant Date Fair Value Outstanding and unvested at January 31, 2021 8,616,594 $ 15.78 RSUs granted 7,106,578 $ 48.88 RSUs released (4,355,635 ) $ 16.32 RSUs cancelled (961,243 ) $ 23.33 Outstanding and unvested at January 31, 2022 10,406,294 $ 37.46 The fair value of the purchase rights granted under the ESPP was estimated on the date of grant using the Black-Scholes option pricing model. The following table summarizes the assumptions used in the Black-Scholes option-pricing model Total stock-based compensation expense recognized in the Company’s consolidated statements of operations is as follows (in thousands): Year Ended January 31, 2022 2021 2020 Cost of license $ - $ - $ - Cost of support 8,073 1,056 401 Cost of cloud-hosted services 2,482 - - Cost of professional services 3,367 308 89 Sales and marketing 64,991 11,286 2,466 Research and development 67,865 5,974 1,507 General and administrative 53,790 20,599 4,998 Stock-based compensation expenses $ 200,568 $ 39,223 $ 9,461 Capitalized stock-based compensation 3,562 - - Total stock-based compensation expense $ 204,130 $ 39,223 $ 9,461 Year Ended January 31, 2022 2021 2020 Cost of license $ - $ - $ - Cost of support - 650 - Cost of cloud-hosted services - - - Cost of professional services - 210 - Sales and marketing - 8,895 - Research and development - 4,199 - General and administrative - 18,097 1,524 Stock-based compensation expense $ - $ 32,051 $ 1,524 Capitalized stock-based compensation - - - Total stock-based compensation $ - $ 32,051 $ 1,524 Year Ended January 31, 2022 2021 2020 Cost of license $ - $ - $ - Cost of support 8,073 406 401 Cost of cloud-hosted services 2,482 - - Cost of professional services 3,367 98 89 Sales and marketing 64,991 2,391 2,466 Research and development 67,865 1,775 1,507 General and administrative 53,790 2,502 3,474 Stock-based compensation expense $ 200,568 $ 7,172 $ 7,937 Capitalized stock-based compensation 3,562 - - Total stock-based compensation $ 204,130 $ 7,172 $ 7,937 As of January 31, Year Ended January 31, 2022 2021 2020 Fair value of common stock $28.94 - $47.07 $16.52-$23.37 $5.44 - $10.34 Expected volatility 49.0% - 50.2% 50.0% - 51.4% 47.3% - 54.1% Expected term (in years) 6.08 6.08 6.08 Risk-free interest rate 0.9% - 1.04% 0.5% - 0.6% 1.4% - 2.6% Dividend yield 0% 0% 0% Year Ended January 31, 2022 2021 2020 Numerator: Net loss $ (290,138 ) $ (83,515 ) $ (53,370 ) Denominator: Weighted-average shares used to compute net loss per share attributable to Class A and Class B common stockholders, basic and diluted 83,276,526 63,375,470 59,161,264 Net loss per share attributable to Class A and Class B common stockholders, basic and diluted $ (3.48 ) $ (1.32 ) $ (0.90 ) The following outstanding potentially dilutive shares of common stock were excluded from the computation of diluted net loss per share attributable to common stockholders for the periods presented because the impact of including them would have been Year Ended January 31, 2022 2021 2020 Redeemable convertible redeemable preferred stock - 94,127,984 88,076,852 Stock awards 22,787,428 24,191,707 23,095,986 Share purchase rights under the ESPP 703,862 - - Class A and Class B common stock subject to repurchase 5,250 40,052 397,910 Total 23,496,540 118,359,743 111,570,748 The Company’s loss before income taxes was as follows (in thousands): Year Ended January 31, 2022 2021 2020 Domestic $ (294,299 ) $ (86,845 ) $ (54,236 ) International 5,147 3,592 1,401 Loss before income taxes $ (289,152 ) $ (83,253 ) $ (52,835 ) Year Ended January 31, 2022 2021 2020 Current provisions for income taxes: Federal $ - $ - $ - State 48 9 15 Foreign 1,125 401 520 Total current tax expense 1,173 410 535 Deferred tax expense: Federal - - - State - - - Foreign (187 ) (148 ) - Total deferred tax expense (187 ) (148 ) - Provision for income taxes $ 986 $ 262 $ 535 Year Ended January 31, 2022 2021 2020 U.S. federal tax benefit at statutory rate 21.0 % 21.0 % 21.0 % State income taxes, net of federal benefit 8.2 6.9 4.8 Foreign earnings taxed at different rate 0.6 0.6 (0.4 ) Stock-based compensation 13.1 8.0 (0.7 ) Non-deductible expenses and other (0.7 ) (0.2 ) (1.1 ) Research and development credits 2.9 1.9 2.0 Change in valuation allowance, net (45.4 ) (38.5 ) (26.6 ) Effective tax rate (0.3 ) % (0.3 ) % (1.0 ) % Year Ended January 31, 2022 2021 2020 Deferred tax assets: Net operating losses $ 167,218 $ 62,279 $ 28,920 Deferred revenue 2,687 3,493 3,279 Lease liability 4,772 4,943 5,449 Other accruals 5,542 2,436 479 Stock-based compensation 25,772 1,963 1,459 Credit carryforwards 18,883 6,468 4,829 Total deferred tax assets $ 224,874 $ 81,582 $ 44,415 Year Ended January 31, 2022 2021 2020 Deferred tax liabilities: Fixed assets $ (2,837 ) $ (943 ) $ (489 ) Right-of-use asset (3,953 ) (4,071 ) (4,650 ) Deferred commissions (22,900 ) (12,974 ) (7,877 ) Total deferred tax liabilities $ (29,690 ) $ (17,988 ) $ (13,016 ) Net deferred tax assets $ 195,184 $ 63,594 $ 31,399 Valuation allowance (194,850 ) (63,446 ) (31,399 ) Deferred tax assets, net of valuation allowance $ 334 $ 148 $ - The Company’s reconciliation of the total amounts of unrecognized tax benefits was as follows (in thousands): Year Ended January 31, 2022 2021 Unrecognized tax benefits as of the beginning of the year $ 1,730 $ 1,236 Increases related to prior year tax provisions 475 - Decrease related to prior year tax provisions - (56 ) Increase related to current year tax provisions 2,644 550 Unrecognized tax benefits as of the end of the year $ 4,849 $ 1,730 this Annual Report on Form 10-K. Exhibit Description Form File No. Exhibit Filing Date Number 3.1 Amended and Restated Certificate of Incorporation of the Registrant. 8-K 001-41121 3.1 12/13/2021 3.2 8-K 001-41121 3.2 12/13/2021 4.1 S-1 333-260757 4.1 11/04/2021 4.2 S-1/A 333-260757 4.2 11/17/2021 4.3* 10.1+ S-1 333-260757 10.1 11/4/2021 10.2+ 2014 Stock Plan, as amended, and forms of agreement thereunder. S-1 333-260757 10.2 11/4/2021 10.3+ 2021 Equity Incentive Plan and forms of agreement thereunder. S-1 333-260757 10.3 11/4/2021 10.4+ S-1 333-260757 10.4 11/4/2021 10.5+ Confirmatory Offer Letter between the Registrant and Armon Dadgar. S-1 333-260757 10.5 11/4/2021 10.6+ Confirmatory Offer Letter between the Registrant and Marc Holmes. S-1 333-260757 10.6 11/4/2021 10.7+ Confirmatory Offer Letter between the Registrant and David McJannet. S-1 333-260757 10.7 11/4/2021 10.8+ Confirmatory Offer Letter between the Registrant and Brandon Sweeney. S-1 333-260757 10.8 11/4/2021 10.9+ Confirmatory Offer Letter between the Registrant and Navam Welihinda. S-1 333-260757 10.9 11/4/2021 10.10+ S-1 333-260757 10.10 11/4/2021 10.11+ S-1/A 333-260757 10.10 11/17/2021 10.12+ S-1 333-260757 10.11 11/04/2021 10.13 S-1 333-260757 10.12 11/04/2021 21.1* 23.1* Consent of Deloitte & Touche LLP, independent registered public accounting firm. 31.1* 32.1*† 32.2*† 104 Cover Page Interactive Data File (formatted as inline XBRL with applicable taxonomy extension information contained in Exhibits 101). Date: March By: /s/ Navam Welihinda Navam Welihinda /s/ David McJannet Chief Executive Officer and Chairman of the Board March, David McJannet (Principal Executive Officer) /s/ Navam Welihinda Chief Financial Officer March, Navam Welihinda (Principal Financial and Accounting Officer) /s/ Armon Dadgar Director March, Armon Dadgar /s/ Susan St. Ledger Director March, Susan St. Ledger Todd Ford Director David Henshall Director March, Glenn Solomon /s/ Sigal Zarmi Director March, Sigal ZarmiConsulBoundary is the basis for a complete Zero Trust security architecture with identity-driven controls, offering a full range of authentication, authorization, and access management for human users or machines, like servers or applications. We continue to innovate and deliver additional emerging products to supplement these core capabilities and provide adjacent solutions.thatto further acceleratesaccelerate enterprise cloud migration by addressing resource and skills gaps, improving operational efficiency, and speeding up deployment time for customers.3companies of all sizes and industries use our products which wereare ubiquitous in the largest enterprises. Our products have been downloaded over 250 million times duringand are used in 85% of the fiscal year endedFortune 500 as of January 31, 2022, or fiscal 2022. While we are pleased with this result, we also note that the number of downloads of our open-source products can fluctuate significantly from year-to-year due to various factors, including the timing of new product and feature releases.a key IT deployment decision makermakers at many enterprises, standardize on our platform over time as they build their cloud adoption strategies and programs around their chosen cloud vendors and HashiCorp in concert with their cloud service providers of choice and existing ISVs. Enabling users to work within their existing infrastructure vendors creates a strong network effect with our products. We had over 2,0003,900 providers and integrations and more than 8501060 partners, including over 200320 ISVs, as of January 31, 2022,2024, and thesethese numbers continue to grow as we become mission critical to our customers and increasingly integral to their entire ecosystem.20222024 and January 31, 20212023 our last four quarterfour-quarter average net dollar retention rate wasrates were 115% and 131% and 123%, respectively. We are still in the early stages of our expansion and extension journey with our customers. Our focus on winning lighthouse accounts in the Forbes Global 2000 accelerates our practitioner adoption by adding new users and driving partners to integrate our ecosystem, creating a powerful flywheel helping to drive our business.655, 500897, 798, and 338655 customers with $100,000 or greater annual recurring revenue, or ARR as of January 31, 2024, 2023, and 2022 2021 and 2020, respectively. We served over 375480 of the Forbes Global 2000 companies as of January 31, 2022.2024. Our revenue was $583.1 million, $475.9 million, and $320.8 million $211.9 million,for the fiscal year ended January 31, 2024, or fiscal 2024, the fiscal year ended January 31, 2023, or fiscal 2023, and $121.3 million for the fiscal year ended January 31, 2022, or fiscal 2022, the fiscal year ended January 31, 2021, or fiscal 2021, and the fiscal year ended January 31, 2020, or fiscal 2020, respectively, representing period-over-period growth of 51%23% and 75%48%, respectively. Customers with $100,000 or greater ARR represented 88%89%, 83%88%, and 71%88% of revenue for fiscal 2022, 2021,2024, fiscal 2023, and 2020,fiscal 2022, respectively. We incurred net losses of $290.1$190.7 million, $83.5$274.3 million, and $53.4$290.1 million for fiscal 2022, 2021,2024, fiscal 2023, and 2020,fiscal 2022, respectively. We expect we will incur net losses for the foreseeable future as we continue to invest into the market opportunity ahead of us.industries.industries. Our HashiCorp User Groups, or HUGs, are self-organizing chapters of users that advocate for our products, which include over 38,00051,000 members in more than 140180 chapters across over 5060 countries as of January 31, 2022.2024.516,00055,000 of whom have completed our certification programs as of January 31, 2022.2024. By leveraging our products, customers can more easily hire new employees, train and certify existing employees, and ensure their organizations retain expertise in managing their systems.customers.customers. We served 2,7154,423 total customers as of January 31, 2022,2024, including over 375480 of the Forbes Global 2000. We believe that nearly all organizations will adopt a cloud strategy, resulting in a substantial opportunity to continue growing our customer base. Nearly all of our paid product adoption began with open-source usage. As we continue to cultivate those users and turn them into paid customers, we also intend to drive new paying customer additions by expanding our sales and marketing efforts and our product portfolio.6Consumption-basedThe HashiCorp Flex pricing allowsprogram initially launched in March 2022, offers certain customers consumption-based pricing, which in turn enables them to align spend with usage and also provides an organic way to increase monetization with thenaturally expand their adoption and usage of our products.thethe top systems integrators and resellers around the world, helps accelerate the adoption of our products and platform. In addition, we maintain and manage hundredsthousands of integrations, like our Terraform Providers. These include more than 30 official providers (created by us), more than 180320 verified providers (created by our community and verified by us), and more than 1,6003,500 community providers (created by our community) as of January 31, 2022.2024. We plan to continue investing in building out our partner program to drive more consumption through our platform, broaden our distribution footprint, and create greater awareness of our platform.27% of our revenue30% and 25%27% of our revenue for fiscal 20222024 and 2021,2023, respectively. We plan to make investments in sales and marketing and customer support in geographic areas of focus, and we believe there is a large opportunity to increase our global presence over time.implementadopt a cloud operating model that provides consistent workflows and a standardized approach to automating the critical processes involved in deliveringprovisioning, security, networking, and application delivery to deliver applications to any environment. Our offerings require multiple foundational capabilities that span all environments. We organize our products around four primary functionalities:at scaleat-scale automation by codifying how infrastructure is configured and deployed, along with the security and governance controls that provide guardrails.7not to evolve,be relatively consistent over time, while technology continues to change at a blistering pace. Making the products extensible and pluggable to support new technologies as they evolve keeps our products relevant and increases their utility for customers, who can embrace legacy and modern systems today and hedge against new systems emerging in the future.VaultWaypoint products are available as managed services through HCP, while our Packer product is available as a beta service through HCP. We believe enterprise customers will become increasingly comfortable, over the long term, with infrastructure services being provided by a third party, and SMB customers will benefit from the ease of adopting fully-managed products. Our ability to reduce operational complexity, speed up deployment and adoption times, provide multi-cloud consistency, and address the skills gap will be a critical driver of adoption. The shared identity and unified experience provided by the platform enable us to deeply integrate our products, creating a more powerful experience that drives additional usage of each product, as well as adoption of new products and services.inside sales leadinside-sales led motion to drive high velocity deals. Cloud customers can spend significantly less time focused on product deployment and immediately start product adoption, which enables higher retention and expansion.Nomad,Packer, are earlier in the commercialization process,cycle, while our community products are focused on product development, market maturity, and community adoption. This framework enables us to continue innovating and adding new products to our portfolio while simultaneously executing on a go-to-market strategy for our commercial products. 8infrastructure provisioninginfrastructure-provisioning product and empowers practitioners to create and manage infrastructure at scale for any public cloud andor private cloud environment. Terraform takes an infrastructure-as-code approach to provisioning and lifecycle management, transforming these workflows from ticket-based manual processes into end-to-end self-service infrastructure automation.TheseThe companies that use APIs often build providers for their own technologies to connect with HashiCorp. As of January 31, 2022,2024, Terraform has more than 30 official providers (created by us), more than 180320 verified providers (created by our community and verified by us), and more than 1,6003,500 community providers (created by our community).EnterpriseEnterprise are commercial offerings that provide a centralized way for users to collaborate on infrastructure, define and share reusable modules, provide central visibility, and enforce policy controls. The open-source Terraform product is focused on solving the technical challenge of provisioning, and our HashiCorp community provides thousands of provider integrations and shared blueprints in a public registry, allowing for the advancement of these products. Terraform Cloud and Terraform Enterprise, our commercial offerings, enable enterprises to operationalize Terraform, and pricing is based on the number of workspaces managed by our product. Key use cases include enabling self-service infrastructure, enabling multi-cloud consistency, and enforcing policy and governance.production worthyproduction-worthy artifact. Depending on the environment, that artifact could be a virtual machine, or VM, image for an on-premises infrastructure, a Cloud VM image, a container, or serverless package. Packer provides a consistent way to define the process of transforming the raw source inputs into a production worthy artifact, across any environment or packaging format. This allows for a consistent approach to packaging that handles the nuances and variations in packaging for each environment.9microsegmentation,micro-segmentation, reducing the risk of a network compromise through lateral attacker movement. This focus on identity-based controls reduces the total number of controls that need to be managed and reduces the operational burden of static controls in dynamic cloud environments. Security teams can apply a consistent approach to network segmentation across all their environments regardless of the hardware or network fabric.102022,2024, we had 2,7154,423 total customers, including over 375480 of the Forbes Global 2000. As of January 31, 2022,2024, we had 655897 customers with $100,000 or greater in ARR and 72120 customers with $1.0 million or greater in ARR. For fiscal 2022,2024, no single customer accounted for more than 10% 10% of our total revenue. Our percentage of revenue generated by customers outside of the U.S. was 27%30%, 25%27%, and 23%27% for fiscal 2024, fiscal 2023, and fiscal 2022, 2021, and 2020, respectively.2022,2024, we had more than 38,00051,000 members in our user groups spanning over 5060 countries.32%36% of those who took certification exams stated they were required to by their employer. We also provide experiences,experiences, such as our annual HashiConf and HashiDays community conferences in Europe and the United States, with online viewership of approximately 7,0005,000 participants, including both virtual and in-person attendees, at the Europe event in June 20212023 and approximately 9,00013,000 attendees at the U.S.-based global event in October 2021.2023. We also support our HUGs and other community efforts globally.generation,generation, due to the mission-critical nature of our platform. On our platform, users naturally demonstrate the value of our products to their organizations, as use of our platform scales with their cloud-adoption journeys. In this process, users drive further11programsprograms based on their chosen cloud vendors and HashiCorp in concert with their cloud service providers of choice and existing ISVs.2022,2024, we had more than 850 employees860 employees in our sales and marketing organizations.2022,2024, we had more than 500680 employees in our research and development organization. We intend to continue to invest in our research and development capabilities to extend our platform. Research and development expenses totaled $165.0$222.6 million, $65.2$195.4 million, and $40.1$165.0 million for fiscal 2024, fiscal 2023, and fiscal 2022, 2021, and 2020, respectively. Red Hat, CyberArk, VMware, and IBM. We also compete with alternative open-source projects such as Google Istio.12principalprincipal purpose of our share incentive plans is to attract, retain, and reward personnel through the granting of share-based compensation awards in order to increase stockholder value and the success of our company by motivating such individuals to perform to the best of their abilities and achieve our objectives.2022,2024, we had over 1,8502200 employees operating across the world. We recognize that everyone deserves respect and equal treatment, regardless of gender, race, ethnicity, age, disability, sexual orientation, gender identity, cultural background, or religious belief and we strive to emphasize this equality as part of our core values to create a diverse,diverse, equitable, and inclusive work environment. We believe that kindness should be extended at every opportunity, to our peers, users, partners, and customers. An internal environment that is friendly, kind, and forgiving of mistakes is positive and productive. None of our employees are represented by a labor union. In certain countries in which we operate, such as France, we are subject to, and comply with, local labor law requirements, which may automatically make our employees subject to industry-wide collective bargaining agreements. We have not experienced any work stoppages, and we consider our relations with our employees to be good.2022,2024, we held six18 issued U.S. patents, had onethree other U.S. patent applicationapplications allowed, and had at least 22eight pending U.S. patent applications, with several more patent applications in the pipeline. We have no pending or issued patents in any jurisdiction outside of the United States. Our issued patents are scheduled to expire between 2039-2040.2022,2024, we held ninetwelve registered trademarks in the United States, and also held 5785 registered trademarks in foreign jurisdictions. As of January 31, 2022,2024, we held threeno pending U.S. trademark applications and 283 pending foreign trademark applications. We continually review our development efforts to assess the existence and patentability of new intellectual property.1314Risk Factorsfactorfactors summary contains a high-level summary of risks associated with our business. It does not contain all of the information that may be important to you, and you should read this risk factorfactors summary together with the more detailed discussion of risks and uncertainties set forth following this summary. A summary of our risks includes, but is not limited to, the following:Because ofThe license for our free community edition products places certain limits on competitive use, but the permissive rights accorded tounder our legacy open-source licenses makes it possible for third parties underto offer and build upon older open-source versions of our open-source and source available licenses, there are limited technological barriers to entry into the markets in which we compete andproducts. Those competing versions could make it is, and may continue to be, relatively easy for competitors including public cloud operators, to enter our markets and compete with us.to useusing our products and renewrenewing their subscriptions, it could have an adverse effect on our business and results of operations.•ability to increase salescustomers’ usage of our products is highly dependent on the quality of our customer support, and our failure to offer high-quality support would have an adverse effect on our business, reputation, and results of operations.•If we do not effectively focus our product development efforts, our business, results of operations, and financial condition could be adversely affected.•We have limited experience with respect to determining the optimal prices for our products.•We target enterprise customers, and sales to these customers involve risks that differ from risks associated with sales to smaller entities.•The length of our sales cycles can be unpredictable, and our sales effortsrenewal rates may require considerable time and expense.15•Our revenue growth depends in part on the success of our strategic relationships with our ecosystem of partners and the continued performance of these partners.•The estimates of market opportunity and forecasts of market growth included in our public disclosures may prove to be inaccurate, and even if the market in which we compete achieves the forecasted growth, our business could fail to grow at similar rates, if at all.•The markets for some of our products are new, unproven, and evolving, and our future success depends on the growth and expansion of these markets and our ability to adapt and respond effectively to evolving markets.•We face competition that we expect to become more intense over time, and which could adversely affect our business, financial condition, and results of operations.•Problems with our internal systems, networks,decline or data, including actual or perceived breaches or failures by us or our partners, could cause our products to be perceived as insecure, underperforming, or unreliable, our reputation to be damaged, and our financial results to be negatively impacted.•If our self-managed offerings do not meet our customers’ performance or support expectations or if we fail to meet service-level availability commitments made to our cloud platform customers, we could face subscription terminations and a reduction in renewals, which could significantly affect our current and future revenue.•If we are not able to keep pace with technological and competitive developments or fail to integrate our products with a variety of technologies that are developed by others, our products may become less marketable, less competitive, or obsolete, and our results of operations may be adversely affected.•Failure of our products to satisfy customer demands or to achieve increased market acceptance could adversely affect our business, results of operations, financial condition, and growth prospects.•Unfavorable conditions in our industry or the global economy or reductions in spending for products like ours could limit our ability to grow our business and negatively affect our results of operations.•Uncertainty regarding ongoing hostility between Russia and Ukraine and the related impact on macroeconomic conditionsfluctuate as a result of such conflict.•not ableunable to maintainmake our paid products sufficiently compelling to business customers as compared to our free community versions, we may have limited success selling paid subscriptions and enhanceretaining our brand, especially among practitioners, our business and operating results may be adversely affected.•We depend on cooperating with public cloud operators. Changes to arrangements with such operators may significantly harm our customer retention, new customer acquisition, and product extension or expansion, or require us to change our business models, operations, practices, or advertising activities, which could restrict our ability to maintain our platform through these clouds and would adversely impact our business.•We rely upon public cloud operators to operate our platform and any disruption of or interference with our use of these operators’ services would adversely affect our business, results of operations, and financial condition.•Interruptions or performance problems associated with our technology and infrastructure, and our reliance on technologies from third parties, may adversely affect our business operations and financial results.16Risks Related to Our Business and Operations2021, and 2020 were $320.8$583.1 million, $211.9$475.9 million and $121.3$320.8 million, respectively, representing an annual growth rate of 51%23% from fiscal 20212023 to fiscal 2022,2024, and 75%48% from fiscal 20202022 to fiscal 2021.2023. In addition, we have experienced fluctuation in our growth rates over time. You should not rely on the revenue growth of any prior quarterly or annual period or combined periods as an indication of our future performance. Even if our revenue continues to increase, we expect our revenue growth rate to decline in future periods. We expect to continue growing our headcount significantly forin the near future. The growth and expansion of our business and products place a continuous significant strain on our management, operational, and financial resources. In addition, as customers use more of our products for an increasing number of use cases, we have had to support more complex commercial relationships. We must continue to improve and expand our information technology and financial infrastructure, our operating and administrative systems, our relationships withrapid growth and the complexity of our multi-product business may make it difficult to evaluate our future prospects. Our ability to forecast our future results of operations is subject to a number of uncertainties, including our ability to effectively plan for and model future growth. We have encountered in the past, and may encounter in the future, risks and uncertainties frequently experienced by growing companies in rapidly changing industries. If we fail to achieve the necessary level of efficiency in our organization as it grows, or if we are not able to accurately forecast future growth, our business wouldwill be harmed. Moreover, if the assumptions that we use to plan our business are incorrect or change in reaction to changes in our market or business, or we are unable to maintain consistent revenue or revenue growth, our share price could be volatile, and it may be difficult to achieve and maintain profitability.future.future, or as quickly as we expect. If we cannot achieve or sustain profitability or positive cash flows, or are slow to do so, our business, financial condition, and results of operations may suffer.$290.1$190.7 million, $83.5$274.3 million, and $53.4$290.1 million in fiscal 2022, 2021,2024, fiscal 2023, and 2020,fiscal 2022, respectively. We had an accumulated deficit of $506.1$971.1 million as of January 31, 20222024, and $216.0$780.4 million as of January 31, 2021.2023. We anticipate that our operating expenses will increase in the foreseeable future as we continue to enhance our products, grow our relationships with existing customers, broaden our customer base, expand our sales and marketing activities, expand our operations, hire additional employees, and continue to develop our technology. These efforts may prove more expensive than we currently anticipate, and we may not succeed in increasing our revenue sufficiently, or at all, to offset these higher expenses. Because the markets for our products are rapidly evolving, it is difficult for us to predict our future results of operations. Revenue growth may slow or revenue may decline for a number of possible reasons, including slowing demand for our products or increasing competition. Any failure to increase our revenue as we grow our business could prevent us from achieving consistent profitability or positive cash flow at all, or on a consistent basis,in the time frame we expect, which could cause our business, financial condition, and results of operations to suffer.2013. We2013, but only began commercializing our software in 2016, so2016. Consequently, much of our growth has occurred in recent years. Our limited operating history makes it difficult to evaluate our current business and our future prospects, including our ability to plan for and model future growth. We have encountered and will continue to encounter risks and difficulties frequently experienced by rapidly growing companies in evolving industries. If we do not address these risks successfully, our business and results of operations will be adversely affected.17introduceenter our markets with new products or services, that compete with ours, we may be unable to attract new customers or convert open-sourcecommunity users to paying customers on terms or based on pricing models that we have used historically. In the future, we may be required to reduce our prices or be unable to increase our prices, or it may be necessary for us to increase ourprovide more products without additional revenue to remain competitive, all of which could harm our results of operations and financial condition.and retain new customers;18Because ofaccorded to third parties under our open-source licenses prior to the change makes it possible for third parties to offer and source available licenses, there are limited technological barriers to entry intobuild upon open-source versions of our products as they existed before the markets in which we compete andlicense change. Those competing versions could make it is, and may continue to be, relatively easy for competitors, including public cloud operators, to enter our markets and compete with us.One ofcharacteristics of open-source is that the governing license terms generally allow liberal modifications of the code and distribution thereof to a wide group of companies and/or individuals. Our open-source licenses allowMozilla Public License, which allows anyone, subject to compliance with the conditions of the applicable license, to redistribute our software and share certain source code components in modified or unmodified form and use it to build products that compete in our markets. Such competition can develop without the degree of overhead and lead time required by traditional proprietary software companies, due to the rights granted to licensees of open-source and source available software. ItUnder our historical Mozilla Public License, it is possible for competitors and new entrants to develop their own software, including software based on open-source or our products, and for public cloud operators to expand their offerings to compete directly with ours, potentially reducing the demand for our products and putting pricing pressure on our subscriptions. For example, a new or existing competitor may dedicate its developers to building competing offerings based on open-source and source-availablesource available software provided by us or third parties, and such offerings may reduce the demand for our offerings. be able to compete successfully against current and future competitors that use the open-sourcesource available nature of our products to compete against us,develop competitive offerings, or that we will be able to effectively enforce licensing restrictions on the competitive use of our community versions, or that competitive pressure or the availability of new software will not result in price reductions, reduced operating margins, andor loss of market share, any one of which would harm our business, financial condition, results of operations, and cash flows.a number ofseveral factors, including the mix of our subscriptions for different products and our professional services and other revenue. For example, while Terraform and Vault are our most established products with commercial offerings at scale and make up the majority of our revenues, generating collectively over 88% and 85% of our revenues for each of fiscal 20222024 and 2021,fiscal 2023, respectively, we believe that our emerging and community products represent a significant growth opportunity. Currently, our self-managed offerings represent the majority of our revenues. However, weWe also believe that HCP, our fully managed cloud platform, represents a significant growth opportunity for our business, particularly as an increasing number of our customers look for a fully managed offering. Shifts in our business mix from quarter to quarter could produce substantial variation in the revenue wemixcomposition and costs as we shift further to cloud models,managed offerings, together with numerous other factors,19If we are unable to increase sales of subscriptions to our products to new customers, sell additional subscriptions to our products to our existing customers, or expand the value of our existing customers’ subscriptions to our products, our future revenue and results of operations will be harmed.We offer certain features of our products as open-source software with no payment required. Customers purchase subscriptions to our products in order to gain access to additional functionality and support. Our future success depends on our ability to sell our subscriptions to new customers and to extend the deployment of our products with existing customers by selling paid subscriptions to our existing users and expanding the value and number of existing customers’ subscriptions. Our ability to sell new subscriptions depends on a number of factors, including the prices of our products, prices offered by our competitors, and the budgets of our customers, as well as their desire and ability to create new features and perform their own support relying on our publicly available open-source software products. We also face competition from public cloud operators, who may use our open-source software products to provide and support hosted offerings that compete with our own. We rely in large part on our customers to identify new use cases for our products and new products to meet a broader set of their needs in order to expand such deployments and grow our business. If our customers do not recognize the potential of our products, our business would be materially and adversely affected. If our efforts to sell subscriptions to new customers and to expand deployments at existing customers are not successful, our total revenue and revenue growth rate may decline and our business will suffer.If our existing customers do not continue to use our products and renew their subscriptions, it could have an adverse effect on our business and results of operations.We expect to derive a significant portion of our revenue from renewals of existing subscriptions for our products. As a result, achieving a high renewal rate of our subscriptions will be critical to our business. Our customers have no contractual obligation to renew their subscriptions after the completion of their subscription term. Terms of our subscriptions typically range from one to three years.Our customers’ usage of our products and renewal rates may decline or fluctuate as a result of a number of factors, including their satisfaction with our products and our customer support, our products’ ability to integrate with new and changing technologies, the frequency and severity of product outages, our product uptime or latency, the pricing of our, or competing, products, and our customers’ own budget priorities and fluctuations in spending. Even if our customers renew their subscriptions, they may renew for shorter subscription terms or on other terms that are less economically beneficial to us. We have limited historical data with respect to rates of customer renewals, so we may not accurately predict future renewal trends. If our customers do not renew their subscriptions, or renew on less favorable terms, our revenue may grow slower than expected or decline and our net expansion rate may decline.grow salesretain them or expand our relationship with them.20the significant number of our currentmultiple products and advancing theour new product pipeline may overextend our workforce and negatively affect product quality and development schedules. Enhancements and new products that we develop may not be introduced in a timely or cost-effective manner, may contain errors or defects, may require reworking features and capabilities, may have interoperability difficulties with our platform or other products, or may not achieve the broad market acceptance necessary to generate significant revenue. Not allSome new products we develop may becomefail commercially, successful, and we may incorrectly prioritize the development of products that do not become commercially successful over products which may have had a better chance of attaining commercial success. Workforce productivity spent on theseunsuccessful product development efforts may not be recouped in the form of sales to customers.recovered. Furthermore, our ability to increase the usage of our products depends, in part, on the development of new use cases for our products, which is typically driven by our developer community and may be outside of our control. In addition, adoption of new products or enhancements may put additional strain on our customer support team, which could shift the team’s resources away from supporting our current products or require us to make additional expenditures related to further hiring and training. If we are unable to timely and successfully enhance our existing products to meet evolving customer requirements, increase adoption and usage of our products, develop new products, or if our efforts do not render the outcomes we expect, then our business, results of operations, and financial condition wouldwill be adversely affected.products.products ormodel,models, which could adversely affectmaterially harm our business, results of operations, and financial condition.involvecarry risks that may not be present or that are present to a lesser extentexceed those associated with sales to smaller entities, such as longer sales cycles, more complex and demanding customer requirements and contract negotiations, substantial upfront sales costs, and less predictability in completing some of our sales. For example, enterprise customers may require considerable time to evaluate and test our solutions and those of our competitors prior tobefore making a purchase decision and placing an order. A number ofMultiple factors influence the length and variability of our sales cycle, including the need to educate potential customers about the uses and benefits of our solutions, economic pressure or uncertainty that prompts customers to seek cost savings on software purchases, the discretionary nature of purchasing and budget cycles, and the competitive nature of evaluation and purchasing approval processes. As a result, the length of our sales cycle, from identification of the opportunity to deal closure, may vary significantly from customer to customer, with sales to large enterprises typically taking longer to complete. Moreover, large enterprise customers often begin to deploy our products on a limited basis, but nevertheless demand integration services and pricing negotiations, with no guarantee that they will deploy our products widely across their organization.21Contentssubsequent to thosethan we anticipated,expected, or have not occurred at all. The loss or delay of one or more large transactions in a quarter could affect our cash flows and results of operations for that quarter and for future quarters. Customers often view a subscription to our products as a strategic decision and significant investment and, as a result, frequently require considerable time to evaluate, test, and qualify our products before entering intopurchasing or expanding a subscription. During the sales cycle, we expend significant time and money on sales and marketing and contract negotiation activities which may not result in a sale. Because a substantial proportion of our expenses are relatively fixedwillmay suffer if revenue falls below our expectations in a particular quarter. with our partners are generally non-exclusive, meaning our partners may offer customers the offerings of several different companies, including offerings that compete with ours, or may themselves be or become competitors. If our partners do not effectively market and sell our offerings, choose to use greater efforts to market and sell their own offerings or those of our competitors, or fail to meet the needs of our customers, our ability to grow our business and sell our offerings may be harmed. Our partners may cease marketing our offerings with limited or no notice and with little or no penalty. The loss of a substantial number of our partners, our possible inability to replace them, or the failure to recruit additional partners could harm our results of operations. Likewise, because the success of our products depends on integrations with partners’ technologies, if partners decide to no longer implement or support such integrations, or if they partner with our competitors and devote greater resources to implement and support the products of competitors, our business may be harmed.achieve revenue growth in the future will depend in partacquire and retain customers depends heavily on our success in developing and maintaining successful relationships with our partners and in helping our partners enhance their ability to marketoffer effective professional services to customers, and sell our subscriptions.effectiveness in cultivating a sufficient network of partners to provide high quality professional services for our products. At times we have had trouble meeting customer demand for professional services. If we are unable to build and maintain enough professional services capacity to meet customer demand, either directly or through our relationships with these partners, we will be at risk of increased customer attrition, slowing sales, and reputational damage from failed implementations, all of which could materially damage our business results of operations,and our financial condition, or cash flows could be harmed. to be inaccurate, and even if the market in which we compete achieves the forecasted growth, our business could fail to grow at similar rates, if at all.not prove to be accurate,inaccurate, including the risks described herein. Even if the market in which we compete achieves the forecasted growth, our business could fail to grow at similar rates, if at all.any particular number or percentageestimates of addressable users or companies covered by our market opportunity estimates will purchasecorrespond to actual sales of our products at all or generate any particular level of revenue for us.revenue. For example, negative conditions in the general economy both in the United States and abroad, including conditions resulting from uncertain interest rates, inflation, and geopolitical tensions, could diminish growth expectations in the U.S. economy and our market opportunity estimates. Any expansion in our market depends on a number ofmultiple factors, including the cost, performance, and perceived value associated with our products and the products provided by our competitors. Even if the market in which we compete meets the size estimates and growth forecastedforecasts included in our public disclosures, our business could fail to grow at similar rates, if at all.rates. Our growth is subject to many factors,variables, including our success in implementing our business strategy, which is subject tocarries many assumptions, risks and uncertainties. Accordingly, the forecasts of market growth included in our public disclosures shouldmay not be taken as indicative of our future growth.evolving markets. for these products, customers’ demand for these products, the size, growth rate, expansion, and longevity of these markets, the entry of competitive products, or the success of existing competitive products. Our ability to penetrate these new and evolving markets depends on a number of factors, including the cost, performance, and perceived value associated with our products. If these markets do not continue to grow as expected, or if we are unable to anticipate or react to changes in these markets, our competitive position would weaken, which would adversely affect our business and results of operations.become more intenseintensify over time, and which could adversely affect our business, financial condition, and results of operations.ourwe expect competition is expected to increase over time. Our business is impacted by rapid changes in technology, customer needs, frequent introductions of new offerings, and improvements to existing offerings, all of which may increase the competitive pressures that we face. We provide offerings to address the needs of a wide variety of prospective customers that compete with other approaches and solutions. For example, internal IT teams sometimes attempt to “do it themselves” using open-sourcesource available software. While individuals and small teams can sometimes use our open-sourcecommunity products to solve their technical problems, larger enterprises face more complex needs that require our commercial products. For select companies adopting a single-cloud solution, we compete with the well-established public cloud providers such as Amazon Web Services, or AWS, and their in-house offerings. We also compete with similar in-house offerings from Microsoft Azure, Google Cloud Platform, and other cloud providers; legacy providers with point products such as Red Hat, CyberArk, VMware, and IBM; and alternative open-source projects, such as Google Istio.cases supported;cases; ability to integrate with existing IT infrastructure, cloud platforms, and on-premises environments; offering consistency of offerings across clouds; ability to implement multi-cloud provisioning, security, networking, and application deployment; speed of implementation and time to achieving value; ability to scale up and down dynamically on demand; robustness of professional services and customer support; price and total cost of ownership; adherence to certifications; size of customer base and level of user adoption; strength of sales and marketing efforts; offering anscope of vendor ecosystem of vendors integrated with the products; creatingability to create new products and expanding the existing platform; ability to innovate around a cloud-delivered architecture; brand awareness, recognition, and reputation, particularly within the open-sourcedeveloper community; and ability to engage the community of open-source users and partners. If we fail to innovate and improve our products and professional services to address these factors, we may become vulnerable to increased competition and therefore fail to attract new customers or lose or fail to renew existing customers, which would causeharm our business and results of operations to suffer.our offerings.ours. These companies may have advantages over us, such as longer operating histories, more established relationships with current and potential customers and commercial partners, significantly greater financial, technical, marketing, or other resources, stronger brand recognition, larger intellectual property portfolios, and broader global distribution and presence. OurIn addition, our business model alsolargely assumes that our customers are committed to a multi-cloud strategy and will not bundle their cloud services.services with a single provider. However, if this assumption does not accurately reflectinaccurately reflects the decisions of our customers, our business maywill suffer. Some of our larger potential competitors and other cloud providers have substantially greater resources than we do and therefore may afford to bundle competitively priced related products and services, which may allow them to leverage existing commercial relationships, incorporate functionality into existing products, sell products with which we compete at zero or negative margins, offer fee waivers and reductions or other economic and non-economic concessions, maintain closed technology platforms, or render our products unable to interoperate with such platforms. Our actual or potential customers may prefer to bundle their cloud services with one of our potential competitors even if such competitors’ individual products have more limited functionality compared to our software. These larger potential competitors are also often in a better position to withstand any significant reduction in technology spending and will therefore not be as susceptible to competition or economic downturns. Our potential competitors may also be able to respond more quickly and effectively than we can to new or changing opportunities, technologies, standards, or customer requirements. In addition, some potential competitors may offer products or services that address one or a limited number of functions at lower prices, with greater depth than our products or in geographies23of these reasons, we may not be able to compete successfully against our current or potential competitors. to be damaged, and our financial results to be negatively impacted.our or our customers’ or other third parties’ highly sensitive, proprietary, and confidential information.information we receive from our customers, our employees, and other third parties. In addition to threats from traditional attackers and insider threats, we also face security threats from malicious third parties, including individual hackers, sophisticated criminal groups, nation states, and state-sponsored organizations, that could disrupt or interrupt, or introduce ransomware, viruses, or other malicious code into our products, services, systems, or networks, obtain unauthorized access to our internal systems, networks, and data, as well as systems of organizations using our cloud products and services, and the information they store and process. Users and organizations using our services may also disclose or leak their passwords, API keys, or secrets that could lead to unauthorized access to their accounts and data within our products. Such incidents have become more prevalent in our industry, particularly against cloud services, and may in the future result in unauthorized, unlawful, or inappropriate access to, inability to access, disclosure of, or loss or other unauthorized processing of the sensitive, proprietary, and confidential information that we own, process, or control, such as customer information and proprietary data and information, including source code and trade secrets. In addition, the risks of data security failures has increased significantly based upon the growing number of new data protection laws throughout the world and intensive scrutiny from regulatory bodies. It is virtually impossible for us to entirely mitigate the risk of these security threats. While we have implemented security measures internally and have integrated security measures into our products, these measures may not function as expected and may not detect or prevent all unauthorized activity, prevent all security breaches and incidents, mitigate all security breaches or incidents, or protect against all attacks or incidents. Moreover, our products incorporate a variety of third-party components (including open-sourcesource available software components) which may expose us to additional security threats, and vulnerabilities in those components may be difficult or impossible to detect, control, and manage. We may also experience security breaches and other incidents that may remain undetected for an extended period and, therefore, may have a greater impact on our products, the networks and systems used in our business, and the proprietary and other confidential data contained on such networks and systems. We expect to incur significant costs in our efforts to detect and prevent security breaches and other security-related incidents, and we may face increased costs in the event of an actual or perceived security breach or other security-related incident. These cybersecurity risks pose a particularly significant risk to a business like ours that is focused on providing highly secure products to customers. Additionally, as a remote-firsthybrid remote company, much of our workforce functions in a remote work environment that requires remote access to our corporate network, which in turn imposes additional risks to our business, including increased risk of industrial espionage, theft of assets, phishing, and other cybersecurity attacks, and inadvertent or unauthorized access to or dissemination of sensitive, proprietary, or confidential information.24ContentsOurour offerings, and may continue to incorporate additional AI features into our offerings in the future. The use of AI may result in security incidents and our integration of AI and the use of AI features by our customers, and the use of AI solutions and offerings by our personnel, may create additional cybersecurity risks or increase cybersecurity risks, including risks of security breaches and incidents. Further, AI technologies may be used in connection with certain cybersecurity attacks, resulting in heightened risks of security breaches and incidents. In addition, our products may experience errors, failures, vulnerabilities, or bugs that cause our products not to perform as intended. Any such errors, failures, vulnerabilities, or bugs may not be found until after they are deployed to our customers and may create the perception that our platform and products are insecure, underperforming, or unreliable. We also provide frequent updates and fundamental enhancements to our platform and products, which increase the possibility of errors. Our quality assurance procedures and efforts to report, track, and monitor issues with our products may not be sufficient to ensure we detect any such defects in a timely manner. There can be no assurance that our software code is or will remain free from actual or perceived errors, failures, vulnerabilities, or bugs.our Vault and our other products, we believe that such products could be targets for hackers and others, and that an actual or perceived breach of, or security incident affecting, our security products and customers, could be especiallyparticularly detrimental to our reputation, customer confidence in our security products, and our business. The potential for an attack is compounded now that our Vault product is includedoffered as a cloud offering.service. Additionally, our products are designed to operate with little or no downtime. If a breach or security incident were to impact the availability of our products, our business, results of operations, and financial condition, as well as our reputation, could be adversely affected.increasingly largeincreasing amounts of data.Additionally, we cannot be certain that our insurance coverage will be adequate or otherwise protect us with respect to claims, expenses, fines, penalties, business loss, data loss, litigation, regulatory actions, or other impacts arising from security breaches, or that such coverage will continue to be available on acceptable terms or at all. Any of these results could adversely affect our business, financial condition, and results of operations. self-managed offerings do not meet our customers’ performance or support expectations or if we fail to meet service-level availability commitments made to our cloud platform customers, we could face subscription terminations and a reduction in renewals, which could significantly affect our current and future revenue.self-managed customers have for our products, or the service-level availability commitments we have made to our cloud platform customers, then we may not retain our customers or renew them expected rates. With respect to service-level availability commitments, we may be obligated to pay monetary penalties to the impacted cloud customers. Additionally, we may be contractually obligated to provide cloud customers with additional capacity and reputationally obligated to provide self-managed customers with additional support, each of which could significantly affect our revenue.interruptions.25Tableinterruptions, or we may have limited rights that fall short of Contentsnot ableunable to keep pace with technological and competitive developments or fail to integrate our products with a variety of technologies that are developed by others, our products may become less marketable, less competitive, or obsolete, and our results of operations may be adversely affected.cost-effectivecost-open-sourcedeveloper community, and growth or contraction in our market or the overall economy. We expect the growth and proliferation of data to lead to an increase in the data analyses demands of our customers and we may not be able to scale and perform to meet those demands or may not be chosen by users for those needs. If we are unable to continue to meet customer demands or to achieve more widespread market acceptance of our products, our business operations, financial results, and growth prospects will be materially and adversely affected.2627%30% and 25%27% of our revenue outside of the United States in fiscal 20222024 and 2021,fiscal 2023, respectively. Our ability to expand internationally involves various risks, including the need to invest significant resources in such expansion, and the possibility that returns on such investments will not be achieved in the near future or at all in these less familiar competitive environments. We may also choose to conduct our international business through partnerships. If we are unable to identify partners or negotiate favorable terms, our international growth may be limited. In addition, we have incurred and may continue to incur significant expenses in advance of generating material revenue as we attempt to establish our presence in particular international markets. Additional risks associated with our international operations include:conditions;27Failure by usOur failure to effectively provide training and implementation services to our customers could result in lost opportunities for follow-on sales to these customers and decrease subscriptions by new customers, and adversely affect our business and growth prospects.cooperatingcooperation with public cloud operators. Changes to arrangements with such operators may significantly harm our customer retention, new customer acquisition, and product extension or expansion, or require us to change our business models, operations, practices, or advertising activities, which could restrict our ability to maintain our platform through these clouds and would adversely impact our business. our products to our customers. Because of the significant use of our platform on public clouds, our solutions must remain interoperable with them. Further, we are subject to the standard agreements, policies, and terms of service of these public clouds, as well as agreements, policies, and terms of service of the various application stores that make our solutions available to our developers, creators, customers, and users. These agreements, policies, and terms of service govern the availability, promotion, distribution, content, and operation generally of applications and experiences on such public clouds. As a result, we may not successfully cultivate relationships with key industry participants or develop products that operate effectively with these technologies, systems, networks, regulations, or standards. If it becomes more difficult for our customers or users to access and engage with our platform on the public clouds they are already using, if our customers choose not to access or use our platform application on their cloud accounts, or if our customers or users choose to use public clouds that do not offer or discontinue access to our platform, our business and customer retention, new customer acquisition, and product extension or expansion could be significantly harmed.28have experienced that it takescan take significant time to adjust such technologies to function with these public clouds, impacting the adoption of our new technologies and features, and we expect this trend to continue. be able to access our platform at any time, without interruption or degradation of performance. Public cloud operators run their own platforms that we access, and we are, therefore, vulnerable to service interruptions of these platforms. We have experienced, and expect that in the future we may experience, interruptions, delays, and outages in service and availability from time to time due to a variety of factors, including infrastructure changes, human or software errors,for are cloud-based server capacity and, to a lesser extent, storage and other optimization offerings. Public cloud operators allow us to order and reserve server capacity in varying amounts and sizes distributed across multiple regions. We access public cloud operator infrastructure through standard IP connectivity. Public cloud operators provide us with computing and storage capacity pursuant to an agreementunder agreements that continuescontinue until terminated by either party. Public cloud operators may terminate the agreementagreements by providing 30 days’a set amount of prior written notice and may in some cases may terminate the agreementagreements immediately for cause upon notice. Although we expect that we could receive similar services from other third parties, if any of our arrangements with public cloud operators are terminated, we could experience interruptions on our platform and in our ability to make our products available to customers, as well as delays and additional expenses in arranging alternative cloud infrastructure services.29open-sourcesource available software and reliance on other third-party services may increase this risk. For example, we are dependentdepend on our relationship with a third-party processor for installation and packaging solutions in one of our products. If our website is unavailable or our users are unable to download our products or order subscriptions or services within a reasonable amount of time or at all, our business could be harmed. We expect to continue to make significant investments to maintain and improve website performance and to enable rapid releases of new features and applications for our products. To the extent that we do not effectively upgrade our systems as needed and continually develop our technology to accommodate actual and anticipated changes in technology, our business and results of operations may be harmed.wouldmay be similarly be interrupted. An interruption in our services to our customers could cause our customers’ internal and consumer-facing applications to fail to function properly, which could have a material adverse effect on our business, operations, financial results, customer relationships, and reputation. In addition, we rely on cloud technologies from third parties in order to operate critical functions of our business, including financial management services, customer relationship management services, and lead generation management services. Accordingly, if these services become unavailable due to extended outages or interruptions or because they are no longer available on commercially reasonable terms or prices, our expenses could increase, our ability to manage our finances could be interrupted, our processes for managing sales of our products and supporting our customers could be impaired, and our ability to generate and manage sales leads could be weakened until equivalent services, if available, are identified, obtained, and implemented, all of which could harm our business and results of operations.that we carry may be insufficient to cover all liabilities incurred by uswe incur in connection with any privacy or cybersecurity incidents or may not cover the kinds of incidents for which we submit claims. For example, insurers may consider cyberattacks by a nation-state as an “act of war” and any associated damages as uninsured. We also cannot be certain that our insurance coverage will be adequate for data handling or data security liabilities actually incurred, that insurance will continue to be available to us on economically reasonable terms, or at all, or that any insurer will not denyaccept coverage as to any future claim. The successful assertion of one or more large claims against us that exceed available insurance coverage, or the occurrence of changes in our insurance policies, including premium increases or the imposition of large deductible or co-insurance requirements, could have a material adverse effect on our business, results of operations, and financial condition, as well as our reputation.30Contentsplanplans and to identify and pursue new opportunities and product innovations. The loss of services of senior management could significantly delay or prevent the achievement of our development and strategic objectives, which could adversely affect our business, financial condition, and results of operations.Both thein which we operate and the San Francisco Bay Area, where our headquarters is located, are generally characterized by significant competition for skilled personnel as well as high employee attrition. Additionally, many of the companies with which we compete for experienced personnel have greater resources than we have and may provide higher levels of compensation. We have from time to time experienced, and we expect to continue to experience,experiencing, difficulty in hiring and retaining employees with appropriate qualifications. Also, to the extent we hire personnel from competitors, we may be subject to allegations that they have been improperly solicited, that they have divulged proprietary or other confidential information, or that their former employers own their inventions or other work product.a large percentage of our sales force is new to our company. New hiresnewly hired employees require significant training and may take significant time before theyto achieve full productivity. Our recent hires and planned hires may not become productive as quickly as we expect, and we may be unable to hire or retain sufficient numbers of qualified individuals in the markets where we do business or plan to do business. In addition,at which we may prove unsuccessful.not manage successfully. If we are unable to hire and train a sufficient number of effective sales personnel, we are ineffective at overseeing a growing sales force, or the sales personnel we hire are otherwise unsuccessful in obtaining new customers or increasing sales to our existing customer base, our business will be adversely affected.Any failure to successfully attract, integrate, train, or retain qualified personnel to fulfill our current or future needs could materially and adversely affect our business, results of operations, and financial condition. that our culture has been and will continue to be a key contributor to our success. If we do not continue to maintain our corporate culture as we grow, we may be unable to foster the innovation, creativity, and entrepreneurial spirit we believe we need to support our growth. Any failure to preserve our culture also could further harm our ability to retain and recruit personnel, innovate and create new products, operate effectively, and execute on our business strategy.remote-firsthybrid remote company may make it difficult for us to preserve our corporate culture, have a negative impact on workforce morale and productivity, and harm our future success, including our ability to retain and recruit personnel, innovate and operate effectively, and execute on our business strategy.remote-firsthybrid remote company since incorporation. This subjects us to heightened operational risks. For example, technologies in our employees’ and service providers’ homes may not be as robust as in our offices and could cause the networks, information systems, applications, and other tools available to employees and service providers to be more limited or less reliable than in our offices. Further, because the security systems in place at our employees’ and service providers’ homes may be less secure than those used in our offices, we may be subject to increased cybersecurity risk, which could expose us to risks of data or financial loss and disrupt our business operations. There is no guarantee that our data security and privacy safeguards will be completely effective or that we will not encounter risks associated with employees and service providers accessing company data and systems remotely.31as a remote-first company as an increasing number of our employees choose tohybrid work remotely due to the COVID-19 pandemicenvironment may make it more difficult for us to preserve our corporate culture, and our employees may have decreased opportunities to collaborate in meaningful ways. Further, we cannot guarantee that an increasing number working remotely will not have a negative impact ondamage workforce morale and productivity. Any failure to preserve our corporate culture and foster collaboration could harm our future success, including our ability to retain and recruit personnel, innovate and operate effectively, and execute on our business strategy.providing services toworking in a remote-firsthybrid remote company allows employees to move freely while undertaking their work responsibilities. On occasion, employees have and may continue to fail to inform us of changes to their work location in a timely manner. Conducting business in certain geographies may expose use to risks associated with that location, including compliance with local laws and regulations or exposure to compromised internet infrastructure. If employees fail to inform us of changes in their work location, we may be exposed to various risks without our knowledge. For example, if employees create intellectual property on our behalf while residing in a jurisdiction with weak or uncertain intellectual property laws, our ownership of such intellectual property may be questioned. Similarly, if employees access our resources through unsecured internet infrastructure, they may expose us to a heightened risk of data theft or cyberattack.COVID-19 pandemic and uncertainties about the future,macroeconomic environment, including the effectiveness of vaccines against various strains of the virus and macroeconomic impacts of the Russia/Ukraineglobal military conflict.conflicts, inflationary pressures, or recessionary economic cycles. Episodic experiences may also contribute to fluctuations in our quarterly results of operations. As our business matures, other seasonal trends may develop, or existing seasonal trends may become more extreme.pre-requisiteprerequisite to recognizing revenue under applicable software accounting rules. If we are unable to deliver our software to a new customer before the quarter ends, we cannot recognize any revenue from the sale during the quarter in which the customer placed its order. Instead, we must wait until the quarter in which we actually delivered the software to begin recognizing revenue. In quarters where we have a high volume of late-quarter sales, we may be unable to sign or process a significant number of the orders we32have recently started sellingsell to U.S. federal governmental agency customers. Sales to such entities currently constitute a small portion of our revenue. Selling to such entities can be highly competitive, expensive, and time-consuming, often requiring significant upfront time and expense without any assurance that these efforts will generate meaningful sales. Government certification or other requirements for products like ours may change, thereby restricting our ability to sell into the government sector until we have attained such revised certification or certifications.updated the necessary certifications or satisfy other applicable requirements. Government demand and payment for our products may be affected by public sector budgetary cycles and funding authorizations, with funding reductions or delays adversely affecting public sector demand for our products. Additionally, any actual or perceived privacy, data protection, or data security incident, or even any perceived defect with regard toregarding our practices or measures in these areas, may negatively impact public sector demand for our products.in doing socould restrict our ability to sell into the government sector until we have met government-mandated requirements, which may require significant upfront cost, time, and resources. If we do not achieve and maintain government requirements, it may harm our competitive position against larger enterprises whose competitive offerings are able to meet these requirements. ThereWe also can also beprovide no assurance that we will secure commitments or contracts with government entities even following efforts toif we meet government requirements, which could harm our margins, business, financial condition, and results of operations. Further, government demand and payment for our offerings are affected by public sector budgetary cycles and funding authorizations, with funding reductions or delays adversely affecting public sector demand for our offering.open-sourcesource available and proprietary technologies incorporate third-party open-source software, and we expect to continue to incorporateusing third-party open-source software in our products in the future, and itwhich may be necessary to utilizerequire using new and upgraded versions of these software applications. There can be no assurance that new versions of the third-party open-source projects we currently use will continue to be licensed under open-source licenses, or that necessarynew versions will not contain different open-source licenses will be availablethat carry unacceptable limitations on distribution. In addition, where buying proprietary licenses is they only way to avoid onerous open-source distribution limitations, we may not succeed in obtaining those proprietary licenses on acceptable terms or under open-source licenses permitting redistribution in our open-source and proprietary offerings, if at all. Theterms. Our inability to obtain certain licenses or other rights or to obtain such licenses or rights on favorable terms, could result in delays in product releases until equivalent technology can be identified, licensed, or developed, if at all, and integrated into our products, andwhich may have a material adverse effect on our business, resultsthat these licenses could be construed in a manner that could adversely impact our interests and the interests of our customers, both with respect to our use of third-party open-source as well as our distribution of our own software under open-sourcesource available licenses, including by imposing unanticipated conditions or restrictions on our ability to commercialize our products, or limiting our ability to enforce our rights in the manner we had anticipated. Moreover, we cannot ensure that our software does not include open-source software that we are unaware of, or that we have not incorporated additional open-source software in our software in a manner that is inconsistent with the terms of the applicable license or our current policies and procedures, including requiring us to make some or all of our software available under an open-source license that is unacceptable to us or to our customers. If we incorporate third-party open-source software into our software products, then in certain circumstances, we and our customers may be subject to certain requirements, including requirements that we offer our solutions that incorporate such third-party open-source software under license terms that are inconsistent with our intended license, such as requiring portions of our products we create based upon, derived from, incorporating, or using such open-source software (and in turn, portions of our customers’ products that they create which are based upon, derived from, incorporating, or using our products) be made available for no cost and for the purpose of making and redistributing such software (including in source code form) and derivatives thereof. If an author or other third party that distributes such open-source software were to allege that we had not complied with the conditions of one or more of these licenses, we could be required to incur significant legal expenses defending against such allegations and could be subject to significant damages, enjoined from the sale of our products that contained the open-source software, and required to comply with onerous conditions or restrictions on these products, which could disrupt the distribution and sale of these products.wereis made with respect to a third-party open-source component included in our products, we and our customers could be required to seek licenses from third parties in order to continue offering our products, and to re-engineer our respective products or discontinue the sale of our respective products in the event re-engineering cannot be accomplished on a timely basis. We and our customers may also be subject to suits by parties claiming infringement, misappropriation or violation due to the reliance by our solutions on certain open-source software, and such litigation could be costly for us to defend or subject us to certain types of equitable remedies, such as an injunction. Some open-source projects have known vulnerabilities and architectural instabilities and are provided on an as-is basis, which, if not properly addressed, could negatively affect the performance of our product. Any of the foregoing could require us to devote additional research and development resources to re-engineer our solutions, provide an advantage to our competitors or other entrants to the market, create new security vulnerabilities, or highlight existing security vulnerabilities in products, result in customer dissatisfaction, and may adversely affect our business, results of operations, and financial condition. We cannot ensure that our processes for identifying and controlling our use of open-source software in our platform and products will be effective.use third-party open-sourcedevelop our products in a source available software environment, which could negatively affect our ability to sell our offerings, or make it easier for competitors, some of whom may have greater resources than we have, to enter our markets and compete with us.is developed in open-source,has its source code available, allowing our partners and third parties to give feedback directly, report issues, contribute features, and fix bugs, which we may accept and integrate into our products. Our partners are able to integrate their technology solutions and validate their integrations with continuous development. We plan to continue to develop our products in this open-sourcesource available environment, and enabling third-party contributions, and the integration of open-source software from third parties into our codebase. While these open-source software licenses state that any work of authorship licensed under it may be reproduced and distributed provided that certain conditions are met, we may nevertheless be subject to suits by parties claiming ownership rights in what we believe to be permissively licensed open-source software or claiming non-compliance with the applicable open-source licensing terms.34 patents, contractual restrictions, and other intellectual property laws and confidentiality procedures to establish and protect our proprietary rights. However, the steps we take to obtain, maintain, protect, and enforce our intellectual property rights may be inadequate. Our intellectual property rights may not protect our competitive position if we are unable to enforce our rights or if we do not detect unauthorized use of our intellectual property rights, or if others are successful in designing around the protections our intellectual property rights afford. If we fail to protect our intellectual property rights adequately, our competitors may gain access to our proprietary technology, develop and commercialize substantially identical products, services, or technologies, and our business may be harmed. In addition, defending our intellectual property rights might entail significant expense.No assurance can be given thatWe cannot assure these agreements will be effective in controlling access to and distribution of our proprietary information. Further, these agreements may not prevent our competitors from independently developing technologies that are substantially equivalent or superior to our products. These agreements may be breached, and we may not have adequate remedies for any such breach.35 For example, recently we and a number of other companies were sued by a non-practicing entity in Delaware federal court alleging patent infringement with respect to certain patents relating to power savings in data centers and cloud networking management, and we are vigorously defending against this lawsuit. Further, the software industry is characterized by the existence of a large number of patents, copyrights, trademarks, trade secrets, and other intellectual and proprietary rights. Companies in the software industry are often required to defend against litigation claims based on allegations of infringement, misappropriation, or other violations of intellectual property rights. Our technologies may not be able to withstand any third-party claims against their use. In addition, many companies have the capability to dedicate substantially greater resources to enforce their intellectual property rights and to defend claims that may be brought against them.and thiswhich could further exhauststrain our financial and management resources.as a result of anydue to intellectual property infringement, misappropriation, or violation claims against us or any obligation to indemnify our customers for such claims, such payments or actions could harm our business.36gainsell more traction with our cloud offerings. We process certain personal data as part of our business operations, and our Vault product is specifically designed to assist our customers with management of their private and sensitive information. As we develop our cloud offerings and are able to process more data in the cloud, these issues become more significant. The regulatory frameworks for privacy, data protection, and data security issues worldwide are rapidly evolving and are likely to remain uncertain for the foreseeable future, particularly for data processed in the cloud. Federal, state, and non-U.S. government bodies or agencies have in the past adopted, and may in the future adopt, new laws and regulations or may make amendments to existing laws and regulations affecting data protection, data privacy, and/or data security and/or regulating the use of the internet as a commercial medium. Industry organizations also regularly adopt and advocate for new standards in these areas, and we are bound by certain contractual obligations relating to our use, storage, security, and other processing of personal data and other personally identifiable information. We also post privacy policies and have made, and may make, other representations regarding our privacy and data security practices. If we fail to comply with any of these laws, regulations, standards, or other obligations, or such public representations, or are alleged to have done so, we may be subject to investigations, enforcement actions, civil litigation, fines, and other penalties, all of which may generate negative publicity and have a negative impact on our business.adoptedamended and expanded the CCPA with a new law, the California Privacy Rights Act of 2020, or CPRA, that will substantially expand the CCPA effectivewhich came into effect as of January 1, 2023. Additionally, other U.S. states continue to propose, and in certain cases adopt, privacy-focused legislation. For example, Virginia, Colorado, Utah, and Connecticut have enacted comprehensive privacy legislation such as Coloradothat has gone into effect in 2023; Florida, Montana, Oregon, and Virginia.Texas have enacted similar legislation that will go into effect in 2024; Delaware Iowa, New Jersey, and Tennessee have enacted similar legislation that will go into effect in 2025; and Indiana has enacted similar legislation that will go into effect in 2026. Aspects of these state laws remain unclear, resulting in further uncertainty and potentially requiring us to modify our data practices and policies and to incur substantial additional costs and expenses in an effort to comply. A patchwork of differing state privacy and data security requirements wouldwill increase the cost and complexity of operating our business and increase our exposure to liability. Similarly, regulatory37in the “Schrems II” decision issued by the Court of Justice of the European Union, or CJEU, on July 16, 2020. On September 8, 2020, theThe Swiss Federal Data Protection and Information Commissioner invalidated the Swiss-U.S. Privacy Shield on similar grounds. In its July 16, 2020 opinion, the CJEU imposed additional obligations on companies when relying on SCCs to transfer personal data. The CJEU decision may result in European data protection regulators applying differing standards for, and requiring ad hoc verification of, transfers of personal data from Europe to the U.S. The European Commission has published revised SCCs addressing the CJEU concerns on June 4, 2021, that are required to be implemented over time.implemented. The United Kingdom also has adopted new standard contractual clauses, or the UK SCCs, that are anticipated to becomebecame effective as of March 21, 2022, and which are required to be implemented over time.implemented. The United States and European Union announced an “agreement in principle” to replace the EU-U.S. Privacy Shield transfer framework with the Trans-Atlantic Data Privacy Framework, or EU-U.S. DPF, on March 25, 2022. On July 10, 2023, the European Commission adopted an adequacy decision in relation to the EU-U.S. DPF, allowing the EU-U.S. DPF to be utilized as a means of legitimizing EU-U.S. personal data transfers for participating entities, including us. We also have self-certified under a UK Extension to the EU-U.S. DPF and the Swiss-U.S. Data Privacy Framework, or the Swiss-U.S. DPF. The EU-U.S. DPF already has faced legal challenges, and the CJEU’s Schrems II decision, the revised SCCs and UK SCCs, guidance and opinions of regulators, and other developments relating to cross-border data transfer, including the EU-U.S. DPF, the UK Extension to the EU-U.S. DPF, and the Swiss-U.S. DPF may be subject to challenges, future reviews, suspension, amendment, repeal, or limitations, and may require us to implement additional contractual and technical safeguards for any personal data transferred out of Europe, which may increase compliance costs, lead to increased regulatory scrutiny or liability, and which may adversely impact our business, financial condition and operating results. in May 2018 that substantially implements the GDPR, and has implemented legislation referred to as the “UK GDPR”GDPR,” that generally provides forsubstantially implements the GDPR to be implemented in the United Kingdom following Brexit and the transition period that ended on December 31, 2020. This legislation provides for substantial penalties for noncompliance of up to the greater of £17.5 million or four percent of worldwide revenues. While the EU has deemed the United Kingdom an “adequate country” to which personal data could be exported from the EEA, this decision is required to be renewed after four years of being in effect and may be modified, revoked, or challenged in the interim, creating uncertainty regarding transfers of personal data to the United Kingdom from the EEA. Some countries also are considering or have passed legislation requiring local storage and processing of data, or similar requirements, which could increase the cost and complexity of delivering our products.38softwareproducts and services may be subject to U.S. export control laws and regulations including the Export Administration Regulations, or EAR, and trade and economic sanctions maintained by the Office of Foreign Assets Control, or OFAC. As such, an export license may be required to export or re-export our products and services to certain countries, end-users, and end-uses. Because we incorporate encryption functionality into some of our products, we also are subject to certain U.S. export control laws that apply to encryption items. If we were to fail to comply with such U.S. export controls laws and regulations, U.S. economic sanctions, or other similar laws, we could be subject to both civil and criminal penalties, including substantial fines, possible incarceration for employees and managers for willful violations, and the possible loss of our export or import privileges. Obtaining the necessary export license for a particular sale or offering may not be possible and may be time-consuming and may result in the delay or loss of sales opportunities. Furthermore, U.S. export control laws and economic sanctions prohibit the export of products and services to certain U.S. embargoed or sanctioned countries governments and persons, as well as for prohibited end-uses. For example, following Russia’s invasion of Ukraine, the United States and other countries imposed economic sanctions and severe export control restrictions against Russia and Belarus and could impose wider sanctions and export restrictions and take other actions should the conflict continue to escalate. While we currently do not have any significant exposure, any exports or sales of our software or services into Russia and Belarus may be impacted by these restrictions. Monitoring and ensuring compliance with these complex U.S. export control laws is particularly challenging because our offerings are widely distributed throughout the world and are available for download without registration. Even though we take precautions to ensure that we and our partners comply with all relevant export control laws and regulations, any failure by us or our partners to comply with such laws and regulations could have negative consequences for us, including reputational harm, government investigations, and penalties.Additionally, export restrictions recently imposed on Russia and Belarus limit the export of encryption software and related source code and technology to these locations which limits our ability to provide our software and, in some cases services, to these countries. Changes in our products and services or changes in export and import regulations in such countries may create delays in the introduction of our products into international markets, prevent our end-customers with international operations from deploying our products globally, or, in some cases, prevent or delay the export or import of our products to certain countries, governments, or persons altogether. Any change in export or import laws or regulations, economic sanctions, or related legislation, shift in the enforcement or scope of existing export, import, or sanctions laws or regulations, or change in the countries, governments, persons, or technologies targeted by such export, import, or sanctions laws or regulations, could result in decreased use of our products by, or in our decreased ability to export or sell our products and services to, existing or potential end-customers with international operations. Any decreased use of our products or services or limitation on our ability to export to or sell our products and services in international markets could adversely affect our business, financial condition, and operating results.39the use of the internet is reduced as a result ofby these or other issues, then demand for our products could decline, which could adversely affect our business, results of operations, and financial condition.torts,employment, securities, employment, contractual rights, torts, or other legal claims. Such matters can be time-consuming, divert management’s attention and resources, cause us to incur significant expenses or liability, or require us to change our business practices.agreeing toentering into settlement agreements. Any of the foregoing could adversely affect our business, financial condition, and results of operations.402022,2024, we had U.S. federal and state net operating loss carryforwards of $647.8$690.4 million and $498.3$602.2 million, respectively, which may be utilized against future income taxes and beginrespectively. The Federal NOL does not expire since all balances relate to expire in 2034 and 2025 for federal andlosses incurred after January 1, 2018, whereas state purposes,NOL will start expiring from 2026, respectively. Limitations imposed by the applicable jurisdictions on our ability to utilize net operating loss carryforwards could cause income taxes to be paid earlier than would be paid if such limitations were not in effect and could cause such net operating loss carryforwards to expire unused, in each case reducing or eliminating the benefit of such net operating loss carryforwards. Furthermore, we may not be able to generate sufficient taxable income to utilize our net operating loss carryforwards before they expire. If any of these events occur, we may not derive some or all of the expected benefits from our net operating loss carryforwards.utilize the aforementioneduse our net operating loss carryforwards and other tax attributes may be limited.utilize suchuse those carryforwards in tax years beginning after December 31, 2020, to 80% of taxable income for the tax years beginning after December 31, 2020.year. Net operating loss carryforwards generated before January 1, 2018, (which represent the substantial majority of our net operating losses as of January 31, 2021) will not be subject to the Tax Act’s 80% taxable income limitation, andbut will continue to have a twenty-year carryforward period. Nevertheless,As such, our net operating loss carryforwards and other tax assets could expire before utilization and could be subject to limitations, which could harm our business, revenue, and financial results.as a result ofdue to changes in the applicable tax principles, including increased tax rates, new tax laws, or revised interpretations of existing tax laws and precedents. In addition, the authorities in the jurisdictions in which we operate through our subsidiaries could review our tax returns or require us to file tax returns in jurisdictions in which we are not currently filing, and could impose additional tax, interest, and penalties. These authorities could also claim that various withholding requirements apply to us or our subsidiaries, assert that benefits of tax treaties are not available to us or our subsidiaries, or challenge our methodologies for valuing developed technology or intercompany arrangements, including our transfer pricing. The relevant taxing authorities may determine that the manner in which we operate our business does not achieve the intended tax consequences. If such a disagreement was to occur, and our position was not sustained, we could be required to pay additional taxes, and interest, and penalties. Such authorities could claim that various withholding requirements apply to us or our subsidiaries or assert that benefits of tax treaties are not available to us or our subsidiaries. Any increase in the amount of taxes we pay or that are imposed on us could increase our worldwide effective tax rate and harm our business and results of operations.41of taxation of international business activitiesand other jurisdictions or the adoption of other tax reform policies could materially impact our financial position and results of operations.U.S. tax laws including those that increaseof the U.S. corporate tax rate,United States and other jurisdictions could impact the tax treatment of our earnings. For example, the Tax Act has eliminated the option to deduct research and development expenditures currently and instead requires taxpayers to capitalize and amortize such expenditures over five or fifteen years, for U.S.-based and non-U.S. based research expenditures, respectively, beginning in 2022. However, recently proposed tax legislation, if enacted, would restore the ability to deduct currently U.S.-based research expenditures through 2025 and would retroactively restore this benefit for 2022 and 2023. Further, the United States recently enacted the Inflation Reduction Act of 2022, or the IRA, which introduced a 15% minimum tax on adjusted book income over one billion, and a 1% excise tax on stock buybacks. We do not currently expect the IRA will have a material impact on our income tax liability. Further, the Organization for Economic Cooperation and Development has proposed implementing a global minimum tax of 15%, which has been agreed to by over 136 countries. The Council of the European Union has adopted this proposed 15% global minimum tax, which has been implemented into the domestic laws of some jurisdictions, effective for fiscal years beginning on or after December 31, 2023. Due to expansion of our international business activities, such proposed changes, as well as regulations and legal decisions interpreting and applying these changes may increase our worldwide effective tax rate and adversely affect our financial position and results of operations.could affect the reporting of transactions completed before the announcement of a change. Additionally, if there are changes to certain of our facts-and-circumstances or if regulators changed their interpretation, we might be required to change the way we report our financial results. seek to acquire or invest in businesses, joint ventures, and platform technologies that we believe could complement or expand our platform, enhance our technology, or otherwise offer growth opportunities. We42are able to completeclose may not result in the synergies or other benefits we expect to achieve, including the introduction of new products or enhancements to existing products, which could result in substantial impairment charges. These transactions could also result in dilutive issuances of equity securities or the incurrence of debt, which could adversely affect our results of operations.or prevent fraud, or comply with applicable regulations, and investor confidence may, therefore, be adversely affected.Our credit facility provides our lender with a first-priority lien against substantially all of our assets and contains restrictive covenants which could limit our operational flexibility and otherwise adversely affect our financial condition.Our revolving credit facility allows us to borrow up to $50.0 million, and we have not borrowed any amounts under this agreement. In the event we borrow amounts under our credit facility, we will become subject to a number of covenants that may limit our ability to, among other things, transfer or dispose of assets, pay dividends or make distributions, incur additional indebtedness, create liens, make investments, loans and acquisitions, engage in transactions with affiliates, merge or consolidate with other companies, and sell substantially all of our assets. Our credit facility is secured by substantially all of our assets. The terms of our credit facility may restrict our current and future operations and could adversely affect our ability to finance our future operations or capital needs, execute preferred business strategies, make it more difficult for us to successfully execute our business strategy, and compete against companies who are not subject to such restrictions. Additionally, any obligations to repay principal and interest on our indebtedness make us vulnerable to economic or market downturns.43Our failure to comply with the covenants or payment requirements, or other events specified in our credit facility, could result in an event of default and our lender may accelerate our obligations under our credit facility and foreclose upon the collateral, or we may be forced to sell assets, restructure our indebtedness, or seek additional equity capital, which would dilute our stockholders’ interests. Our failure to comply with any covenant could result in an event of default under the agreement and the lender could make the entire debt immediately due and payable. If this occurs, we might not be able to repay our debt or borrow sufficient funds to refinance it. Even if new financing is available, it may not be on terms that are acceptable to us. According to the U.S. Department of Labor, the annual inflation rate for the United States was approximately 7.0% for the 12 months ended December 31, 2021. If the inflation rate continues to increase, such as increases in the costs of labor and supplies, it will affect our expenses, such as employee compensation which accounts for a significant portion of our operating expenses. Additionally, the United States is experiencing an acute workforce shortage,historically low unemployment rates, which in turn, has createdcreates a hyper-competitivecompetitive wage environment that may increase our operating costs. To the extent inflation results inleads to rising interest rates, resulting in higher borrowing costs to us, and has other adverse effects on the market, it may adversely affect our consolidated financial condition and results of operations.result of the COVID-19 pandemic.the aforementionedthese risks may beincrease further increased if our course of action in response to catastrophic events prove to beproves inadequate.44 including the COVID-19 pandemic, have had, and could in the future have an adverse impact on our business, operations, and the markets and communities in which we, our partners, and customers operate. including the COVID-19 pandemic, impacting the markets and communities in which we, our partners, and customers operate. The ongoing global COVID-19 pandemic has adversely impacted, and may continue to adversely impact, certain parts of our business. In industries that were heavily impacted by the pandemic, such as travel and hospitality, we experienced a slowdown in customer spending on our products. Additionally, we also took responsive measures to the pandemic that impacted our business. For example, we suspended non-essential travel by our employees, required events to be held virtually, and temporarily closed our offices. These responsive measures negatively impacted our in-person conferences, the length and variability of our sales cycles, the rate of sales to new customers, our international operations, and the hiring and onboarding of new employees across the organization.The pandemic wasalso ledcould lead to existing and potential customers accelerating transitions for some customers to the cloud. As a result, we believe the value of our offering has become increasingly relevant during the course of the pandemic, which may result in a positive impact on our business over the long term. However, if customers do not transition to the cloud at anticipated rates, we may not experience these anticipated benefits.the COVID-19 pandemichealth epidemics on our customers and our customers’ response to the COVID-19 pandemicepidemics is difficult to assess or predict, and we may be unable to accurately forecast our revenues or financial results, especially given thatwhen the long-term impact of the pandemic remainsepidemic is uncertain. Our results of operations could be materially above or below our forecasts, which could adversely affect our results of operations, disappoint analysts and investors, and/or cause our stock price to decline.The global impact of COVID-19 continues to evolve, and we will continue to monitor the situation closely. the COVID-19 pandemic or a similar health epidemicepidemics is highly uncertain and subject to change. We do not yet know the full extent of potential delays or impacts on our business, operations, ability to access capital, or the global economy as a whole. While the spread of COVID-19 may be contained or mitigated, thereThere is also no guarantee that a future outbreak of this or any other widespread epidemics will not occur, or that the global economy will recover, either of which could harm our business.45the expiration of contractual lock-up agreements and sales of shares of our Class A common stock by us or our stockholders;•2022,2024, our executive officers and directors and their affiliates together hold and/or control approximately 37.6%43% of the voting power of our outstanding common stock, and Armon Dadgar, and Mitchell Hashimoto, our co-founders, together holdco-founder, holds and/or controlcontrols approximately 22.4%18% of the voting power of our outstanding common stock. As a result, our executive officers, directors, and other affiliates have significant influence over our management and affairs and over all matters requiring stockholder approval, including election of directors and significant corporate transactions, such as a merger or other sale of the company or our assets, for the foreseeable future.46and Standard & Poor’s dodoes not allow most newly public companies utilizingwith dual or multi-class capital structures to be included in their indices. Affected indices include the Russell 2000 and the S&P 500, S&P MidCap 400, and S&P SmallCap 600, which together make up the S&P Composite 1500. Also, in 2017, MSCI, a leading stock index provider, opened public consultations on its treatment of no-vote and multi-class structures and temporarily barred new multi-class listings from certain of its indices; however, in October 2018, MSCI announced its decision to include equity securities “with unequal voting structures” in its indices and to launch a new index that specifically includes voting rights in its eligibility criteria. Under the announced policies, our dual-class capital structure makes us ineligible for inclusion in certain indices, and as a result, mutual funds, exchange-traded funds, and other investment vehicles that attempt to passively track these indices will not be investing in our stock. In addition, we cannot assure you that other stock indices will not take similar actions. Given the sustained flow of investment funds into passive strategies that seek to track certain indices, exclusion from certain stock indices would likely preclude investment by many of these funds and would make our Class A common stock less attractive to other investors. As a result, the trading price, volume, and liquidity of our Class A common stock could be adversely affected.theour initial public offering, or IPO, have substantial unrecognized gains on the value of the equity they hold based on recent market prices of our shares of Class A common stock, and therefore, they may take steps to sell their shares or otherwise secure the unrecognized gains on those shares. We are unable to predict the timing of or the effect that such sales may have on the prevailing market price of our Class A common stock.2022,2024, up to 7,017,9204,484,297 shares of our Class B common stock and up to 15,769,50813,945,779 shares of our Class A common stock may be issued upon exercise of outstanding stock options or vesting and settlement of outstanding restricted stock units, or RSUs, and 17,560,87929,058,446 shares of our Class A common stock are available for future issuance under our 2021 Equity Incentive Plan and 2021 Employee Stock Purchase Plan, and 2014 Stock Plan, and will become eligible for sale in the public market to the extent permitted by the provisions of various vesting schedules, exercise limitations, and Rule 144 and Rule 701 under the Securities Act of 1933, as amended, or the Securities Act. We have registered all of the shares of Class A common stock issuable upon exercise of outstanding options and all of the shares of Class A common stock issuable upon vesting and settlement of RSUs, as well as other equity incentive awards we may grant in the future for public resale under the Securities Act. Shares of Class A common stock will become eligible for sale in the public market to the extent such options are exercised and RSUs settle, subject to compliance with applicable securities laws. If these additional shares of Class A common stock are sold, or if it is perceived that they will be sold, in the public market, the trading price of our Class A common stock could decline.47We are an “emerging growth company” and we cannot be certain if the reduced disclosure requirements applicable to emerging growth companies will make our Class A common stock less attractive to investors.We are an “emerging growth company,” as defined in the JOBS Act, and have the option to utilize certain exemptions from various reporting requirements that are applicable to other public companies that are not emerging growth companies including, but not limited to, not being required to comply with the auditor attestation requirements of Section 404, reduced disclosure obligations regarding executive compensation in our periodic reports and proxy statements, and exemptions from the requirements of holding a nonbinding advisory vote on executive compensation and stockholder approval of any golden parachute payments not previously approved. We may take advantage of these reporting exemptions until we are no longer an emerging growth company. We will remain an emerging growth company until the earlier of (i) the last day of the fiscal year (A) following the fifth anniversary of our IPO, (B) in which we have total annual revenue of at least $1.07 billion, or (C) in which we are deemed to be a large accelerated filer, with at least $700 million of equity securities held by non-affiliates as of the prior June 30th, and (ii) the date on which we have issued more than $1 billion in non-convertible debt during the prior three-year period.Under the JOBS Act, emerging growth companies can also delay adopting new or revised accounting standards until such time as those standards apply to private companies. We have irrevocably elected not to avail ourselves of this exemption from new or revised accounting standards and, therefore, we will be subject to the same new or revised49accounting standards as other public companies that are not emerging growth companies. However, we may take advantage of some of the other reduced regulatory and reporting requirements that will be available to us so long as we qualify as an emerging growth company.Among other things, this means that our independent registered public accounting firm will not be required to provide an attestation report on the effectiveness of our internal control over financial reporting so long as we qualify as an emerging growth company, which may increase the risk that weaknesses or deficiencies in our internal control over financial reporting go undetected. Likewise, so long as we qualify as an emerging growth company, we may elect not to provide you with certain information, including certain financial information and certain information regarding compensation of our executive officers, that we would otherwise have been required to provide in filings we make with the SEC, which may make it more difficult for investors and securities analysts to evaluate our company. As a result, investor confidence in our company and the market price of our Class A common stock may be adversely affected. Further, we cannot predict if investors will find our Class A common stock less attractive because we will rely on these exemptions. If some investors find our Class A common stock less attractive as a result, there may be a less active trading market for our Class A common stock and our stock price may be more volatile.Comments.CommentsNoneThis includes the deployment of technical security monitoring and alerting measures to identify potential incidents. In the event of a cybersecurity incident, the Security organization and relevant teams throughout the company follow a formalized, documented incident response plan. This plan includes immediate actions to assess and mitigate the impact of an incident, as well as subsequent actions to remediate and help prevent future incidents of a similar nature.remote-firsthybrid remote company with a global distributed workforce.7,11, "Commitments and Contingencies" each included elsewhere in this Annual Report on Form 10-K.21, 2022,14, 2024, there were 59785 stockholders of record of our common stock, and the closing price of our common stock was $48.44$25.74 per share as reported on the Nasdaq Global Select Market. Because many shares of our Class A common stock are held by brokers and other institutions as record holders and on behalf of stockholders, we are unable to estimate the total number of stockholders represented by these record holders.S&P 500NASDAQ Composite Index and the S&P 500 Information TechnologyNASDAQ Computer Index. The graph assumes $100 was invested at the market close on December 9, 2021, which was our initial trading day, in our Class A common stock.stock through January 31, 2024. Data for the S&P 500NASDAQ Composite Index and the S&P 500 Information TechnologyNASDAQ Computer Index assume reinvestment of dividends. Our offering price of our Class A common stock in our IPO, which had a closing stock price of $85.19 on December 9, 2021, was $80.00 per share.Comparison of Cumulative Total Returns
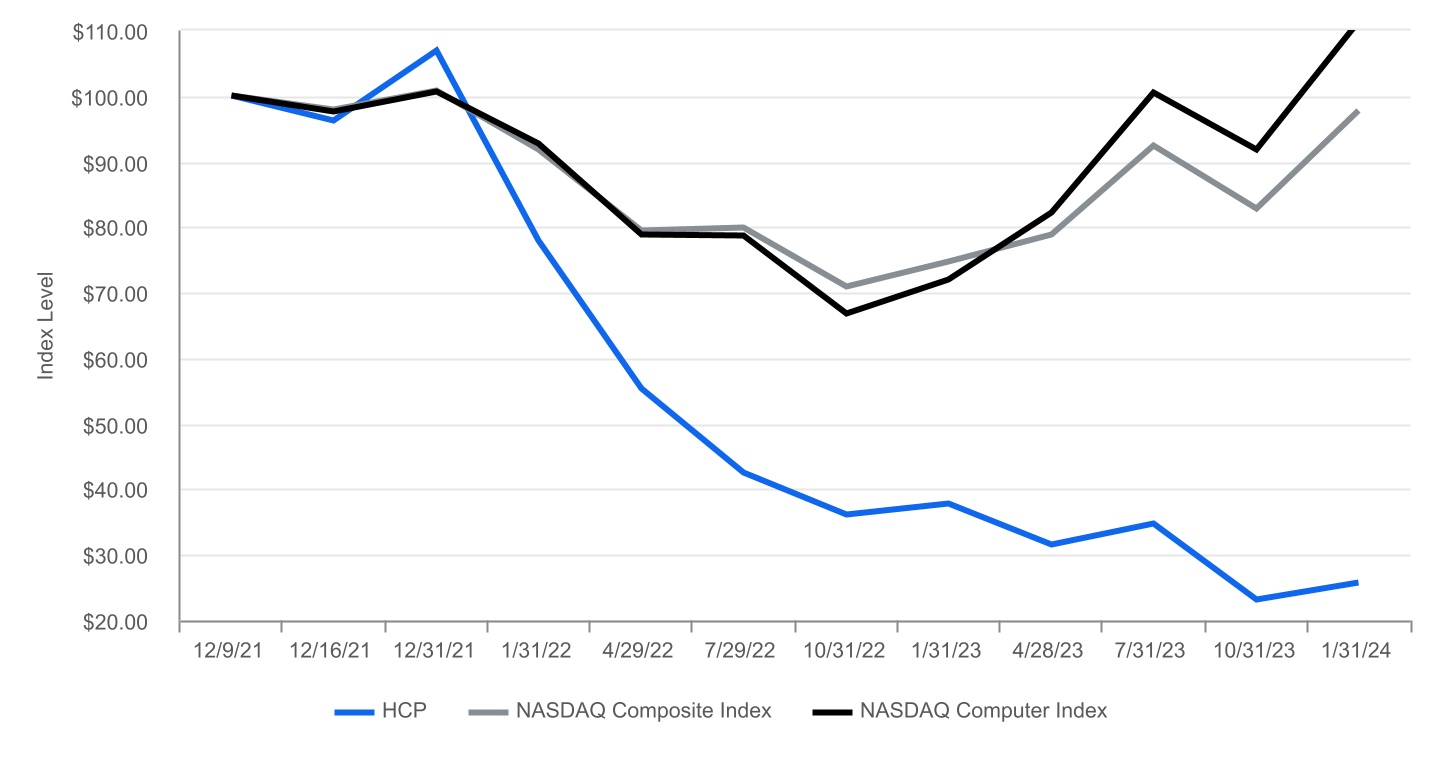
open-sourcefree, source available community products and our proprietary software. We are committed to an open-sourcea model in which we maintain free open-sourcecommunity offerings while developing proprietary features for paid tiers of our software. These proprietary features include collaboration modules, governance and policy modules, enterprise use cases, and premium support and services. We provide our software under a licensing model that protects our intellectual property, grows our adoption, and supports our business.platform, available on all of the leading cloud providers.platform. These two core offerings can be leveraged independently or together, spanning the various public cloud, private cloud, and on-premises environments in which our customers operate.53Customers of our fully-managed cloud platform, can eithercustomers use our offering with no minimum commitment where they pay based on the consumption of resources,a consumption-based model, or can purchase annual subscription contracts with a minimum commitment.contracts. Customers who are on no-minimum commitmentconsumption-based contracts are predominantly billed in advance for committed consumption and revenue from them is recognized based on usage. Today, customersactual consumption of resources. Customers with minimum commitmentsannual subscriptions are typically billed annually in advance for their subscriptions and we typically recognize all revenue from such subscriptions ratably over the subscription term. We intend to transition a segment of our new contracts to a usage-based model. Our pricing schedule lists the hourly rate when deploying HCP for our various products, and actual usage is metered and calculated on a per-hour basis for increased accuracy.amountnumber of business-critical processes, applications, and large volumes of data to the cloud. Ultimately, we believe all enterprises will need to transition to the cloud to reduce operational burden, improve scalability and elasticity, and increase agility. We plan to continue to invest in our direct sales force to grow our large enterprise base both domestically and internationally.open-sourcesource available model allows developers and individuals focused on operations, IT, and security, or practitioners, to engage with and evaluate our software in a frictionless manner, which we believe has contributed to our software’s popularity. This open-source leadership and the wider ecosystem around us, compels practitioners to adopt and implement our software in the enterprise. As organizations recognize the value of our products, our inside and field sales teams can nurture leads and develop direct relationships with key stakeholders across all segments. HCP has accelerated our self-service approach, as practitioners can now quickly deploy and experiment with our paid offering with a fully-managed cloud solution and no minimum commitments.open-sourcesource available engagement and self-serve cloud motion help us identify and accelerate initial product adoption and use cases in an account. Our enterprise sales teams land these customers with subscription contracts for our software. Our expansion motion focuses on up-selling additional modules and increasing the footprint of usage of a given product, including across multiple buying centers within our customers’ organizations. The multiple capabilities of our deep product portfolio allow us to extend by cross-selling additional integrated products to our customers. For example, a company may initially adopt an open-sourcea free community version use case of Terraform. After initial use of the open-sourcesource available product, we frequently land their first paid use of Terraform to add enterprise functionality and support mission-critical cloud workloads. As customers grow their cloud presence to support additional cloud-based workloads, they frequently expand the amount of Terraform they consume. In addition to this increased Terraform usage, customers also frequently extend into additional products such as Vault or Consul. This combination of adopt, land, expand, and extend affords us considerable growth opportunitiesopportunities within our customer base, and we focus our go-to-market strategy on developing and cultivating long-term customer relationships. The increased use of our platform by our customers is evidenced by our high net dollar retention rate. As of January 31, 2022, January 31, 2021,2024, 2023 and January 31, 2020,2022, our last four quarterfour-quarter average net dollar retention rate was 131%115%, 123%,131% and 131%, respectively. We estimate that approximately 12,000 organizations have downloaded at least one of our products since HashiCorp’s inception.542022,2024, we served over 2,7004,400 customers spanning organizations of a broad range of sizes and industries, compared to over 1,4003,800 and over 8002,700 customers as of January 31, 20212023 and 2020,2022, respectively.open-sourcedeveloper community, and effectiveness of our marketing and community-building efforts. As of January 31, 2022, over 3752024, 483 of the Forbes Global 2000 were our customers. We believe this demonstrates that our products have been adopted by many of the largest enterprises, and that there is a substantial opportunity to further cultivate these large customers. both do more with existing use cases and realize new use cases. At the same time, we often see customers extend to multiple products across our wider product portfolio as they realize the potential of integrating more of our products to better solve use cases. We intend to continue to invest in enhancing awareness of our brand and developing more products, features, and functionality, which we believe are important factors in achieving widespread adoption of our offerings. Our ability to increase sales to existing customers will depend on a number of factors, including our customers’ satisfaction with our products, the technical capabilities and security of our products, our customers’ progress on their cloud journey, competition, pricing, and overall changes in our customers’ spending levels.monthly, or consumption-based customers the annualannualized value of their last three month’s spend. For our monthly customers, we calculate ARR according to the annualized value of their last month's spend. In the fourth quarter of fiscal 2024 we changed the definition of ARR for consumption-based customers from the annualized value of their last month's spend to the annualized value of their last three month's spend to better reflect longer term usage patterns. A further indication of the propensity of customer relationships to expand over time is our dollar-based net retention rate, which compares ARR from the same set of customers in one period relative to the prior year period. We define dollar-based net retention rate as the ARR at the end of a period for a base set of customers from which we generated ARR in the year prior to the date of calculation, divided by the ARR one year prior to the date of the calculation for that same set of customers. As of January 31, 2022, January 31, 2021,2024, 2023 and January 31, 2020,2022, our last four quarterfour-quarter average net dollar retention rate was 131%115%, 123%131%, and 131%, respectively. We believe this demonstrates the stickiness of our products, and our offerings as a whole.hashave allowed us to better address the needs of potential customers looking for a fully-managed offering. We believe that as organizations increasingly look for a fully-managed cloud infrastructure platform, they will continue to adopt HCP. We expect HCP to continue to grow and represent an increasing percentage of our total revenue over time. For the fiscal year ended January 31, 2022,2024, HCP subscription revenue was $18.5$76.1 million.is dependentdepends on our ability to sustain innovation and technology leadership in order toand maintain our competitive advantage. We have built highly differentiated products that we believe have the ability tocan adapt and evolve with the support of our engineering expertise, our approach to innovation, our open-sourcedeveloper community, and our ecosystem of partners. HashiCorp is a critical part of the daily operations of practitioners and our free products make HashiCorp frictionless to adopt. We have proven initial success of our modular approach with multiple innovations and product launches, including the launch of HCP in fiscal 2021, and launch of Boundary and Waypoint in September 2020.2020, launch of HCP Boundary in June 2022, launch of HCP Consul in October 2022, and launch of HCP Vault in June 2023. We see continued adoption from our customers in our new products and innovations and as of January 31, 2022,2024, 45% of our customers with $100,000 or greater ARR were licensing more than one product.55expandexpand usage of our products outside of the United States as enterprises globally look to take advantage of cloud computing and look to adopt a cloud operating model across multiple clouds. For fiscal 2024, fiscal 2023, and fiscal 2022, 2021 and 2020,30%, 27%, 25%, and 23%27% of our revenue, respectively, was generated by customers We monitor the key business metrics set forth below to help us evaluate our business and growth trends, establish budgets, measure our performance, and make strategic decisions. The calculation of the key metrics discussed below may differ from other similarly titled metrics used by other companies, securities analysts, or investors.As of January 31, 2024 2023 2022 (dollars in millions) Total customers 4,423 3,870 (3) 2,715 Total customers with $100,000 or greater ARR 897 798 655 Subscription revenue from HCP (and its predecessor cloud offerings) $ 76.1 (1) $ 46.9 (1) $ 18.5 (1) GAAP Remaining Performance Obligations (RPOs) $ 775.8 $ 647.1 $ 428.8 $ 801.4 $ 673.8 $ 452.2 2022,2024, January 31, 2021,2023, and January 31, 2020section.sectioninat the end of the period indicated. Users of our free products are not included in the total customers. A single organization with multiple divisions, segments, or subsidiaries is generally counted as a single customer.customer, however, in some cases we may count separate divisions, segments, or subsidiaries as multiple customers in cases where they have separate billing terms. Our customer count may also fluctuate due to acquisitions, consolidations, spin-offs, and other market activity.monthly, or consumption-based customers, the annualannualized value of their last three month’s spend. For our monthly customers, we calculate ARR according to the annualized value of their last month's spend. In the fourth quarter of fiscal 2024 we changed the definition of ARR for consumption-based customers from the annualized value of their last month's spend to the annualized value of their last three month's spend to better reflect longer term usage patterns. This change in definition had no material effect on the amount of total customers with $100,000 or greater ARR. Relationships with large enterprise customers lead to scale and operating leverage in our business model, as large enterprise customers present a greater opportunity for us to sell additional usage and modules because they have larger budgets, a wider range of potential use cases, and greater potential for expanding to other products in our offering. As such, we count the number of customers contributing $100,000 or greater ARR as a measure of our ability to scale with our customers and attractattract large enterprise customers to our product offerings. For each applicable financial reporting period, we calculate revenue from customers with $100,000 or greater ARR by aggregating the quarterly revenue attributable to such customers within such period. Customers with $100,000 or greater ARR represented 88%89%, 83%,88% and 71%88% of revenue for fiscal 2024, fiscal 2023, and fiscal 2022, 2021, and 2020, respectively.RevenueRevenue from HCPor RPOs,("RPOs") represent the amount of contracted future revenue that has not yet been recognized, including both deferred revenue and non-cancelable contracted amounts that will be invoiced and recognized as revenue in future periods. RPOs exclude customer deposits, which are refundable amounts that are expected to be recognized as revenue in future periods. As of January 31, 20222024 and January 31, 2021,2023, our RPOs were $428.8$775.8 million and $263.9$647.1 million, respectively. As of January 31, 2022,2024, we expect to recognize approximately 63%59% of RPOs as revenue over the next 12 months, and the remainder thereafter. The portion of RPOs that is expected to be recognized as revenue over the next 12 months represents an estimated minimum level of revenue for the applicable period and is not necessarily indicative of future product revenue growth because it does not account for revenue from customer renewals or new customer contracts. Moreover, RPOs are influenced by a number of factors, including the timing of renewals, average contract terms, seasonality and dollar amounts of customer contracts. Due to these factors, it is important to review RPOs in conjunction with revenue and other financial metrics disclosed elsewhere herein. For a further discussion of RPOs, seesee Note 35 to our consolidated financial statements included elsewhere in Annual Report on Form 10-K.20222024 and January 31, 2021,2023, non-GAAP RPOs were $452.2$801.4 million and $286.1$673.8 million, respectively. As of January 31, 2022,2024, we expect to recognize 64%60% of our non-GAAP RPOs as revenue over the next 12 months, and the remainder thereafter.57non-GAAPGAAP RPOs to our GAAPNon-GAAP RPOs for the periods presented (in thousands):As of January 31, 2024 January 31, 2023 GAAP RPOs GAAP short-term RPOs $ 460,170 $ 375,072 GAAP long-term RPOs 315,580 271,992 Total GAAP RPOs $ 775,750 $ 647,064 Add: Customer deposits Customer deposits expected to be recognized within the next 12 months $ 22,882 $ 22,657 Customer deposits expected to be recognized after the next 12 months 2,745 4,042 Total customer deposits $ 25,627 $ 26,699 Non-GAAP RPOs Non-GAAP short-term RPOs $ 483,052 $ 397,729 Non-GAAP long-term RPOs 318,325 276,034 Total Non-GAAP RPOs $ 801,377 $ 673,763 flowsflow for the periods presented and a reconciliation of free cash flow and free cash flow margin to net cash provided by (used in) operating activities, the most directly comparable financial measure calculated in accordance with GAAP:Year Ended January 31, 2024 2023 2022 (in thousands) GAAP net cash used in operating activities $ (10,851) $ (84,462) $ (56,215) Add: purchases of property and equipment (697) (252) (214) Add: capitalized internal-use software (11,333) (8,746) (6,382) Free cash outflow $ (22,881) $ (93,460) $ (62,811) GAAP net cash used in operating activities as a percentage of revenue (2) % (18) % (18) % Free cash flow as a % of revenue (4) % (20) % (20) % 58Impact of COVID-19The ongoing COVID-19 pandemic has caused business disruption worldwide. The extent to which the COVID-19 pandemic will directly or indirectly impact our business, results of operations, cash flows, financial condition or our customers will depend on many factors, including the duration and continued spread of COVID-19; public health measures; national, state, and local government responses; and the impact of the pandemic on the global economy, all of which remain uncertain.During 2020, 2021, and through the date of this Annual Report on Form 10-K, we experienced, and may continue to experience, adverse impacts on certain parts of our business as a result of the pandemic and our responsive measures. In industries that were heavily impacted by the pandemic, such as travel and hospitality, we experienced a slowdown in customer spending on our products. Additionally, we also took responsive measures to the pandemic that impacted our business. For example, we suspended non-essential travel by our employees, required events to be held virtually, and temporarily closed our offices. These responsive measures negatively impacted our in-person conferences, the length and variability of our sales cycles, the rate of sales to new customers, our international operations, and the hiring and onboarding of new employees across the organization.The pandemic was a contributing factor that also led to existing and potential customers accelerating transitions to the cloud. As a result, we believe the value of our offering has become increasingly relevant during the course of the pandemic, which may result in a positive impact on our business over the long term. The global impact of COVID-19 continues to rapidly evolve, and while the broader implications of the ongoing COVID-19 pandemic remain uncertain, we will continue to monitor the situation and the effects on our business and operations.services. Licensesandthat provide the customer with a right to use the software for a fixed term commencing upon delivery to the customer.customer, bundled with support and maintenance for the term of the license period. Support and maintenance revenue (collectively referred to as Support Revenue in the consolidated statements of operations) are bundled withnot sold on a stand-alone basis. Our self-managed Subscription Revenue is disaggregated into License Revenue and Support Revenue in the consolidated statement of operations. The Company does not have observable standalone sales to determine the Standalone Selling Price, or SSP, for its licenses or its support as they are not sold separately. HashiCorp developed a model to estimate relative SSP for each license subscription forperformance obligation using an “expected cost-plus margin” approach. This model uses observable data points to develop the termmain assumptions including the estimated useful life of the license period. intellectual property and appropriate margins.. Professional services and other revenue consistsconsist of revenue from professional services, and training services, which were generallyare predominantly sold on a time-and-materialsfixed-fee basis priorand any other services provided to fiscal 2021. Commencing in fiscal 2021 we began to sell professional services on a predominantly fixed-fee basis.our customers. Revenue for professional services, and training services, and other is recognized as these services are delivered. Professional services are services utilized by some of our self-managed customers to accelerate the deployment of our products.59Services.Services and other. Cost of professional services and other revenue primarily includes personnel-related costs, such as salaries, bonuses and benefits, and stock-based compensation for employees associated with our professional services, costs of third-party contractors, and allocated overhead. We expect our cost of professional services and other revenue to increase as our professional services and other revenue increases.Marketing.MarketingDevelopment.Development. Income,Expenses, Netincome,expense, net consists primarily of interest income, interest expense, and foreign exchange gains and losses.assets, which includes net operating loss carryforwards and tax credits.assets. We expect to maintain this full valuation allowance on our U.S. deferred tax assets for the foreseeable future as it is more likely than not that some or all of those deferred tax assets may not be realized based on our history of losses.Year Ended January 31, 2024 2023 2022 Consolidated Statements of Operations: Revenue: License $ 67,612 $ 64,273 $ 47,504 Support 420,948 349,855 247,566 Cloud-hosted services 76,086 46,860 18,613 Total subscription revenue 564,646 460,988 313,683 Professional services and other 18,491 14,901 7,086 Total revenue 583,137 475,889 320,769 Cost of revenue: Cost of license 1,968 1,753 221 58,208 48,112 38,080 30,447 22,589 14,031 90,623 72,454 52,332 18,076 14,515 11,108 108,699 86,969 63,440 Gross profit 474,438 388,920 257,329 Operating expenses: 369,164 355,826 269,504 222,553 195,384 165,031 136,999 134,997 112,108 Total operating expenses 728,716 686,207 546,643 Loss from operations (254,278) (297,287) (289,314) Interest Income 65,159 26,367 319 Other expenses, net (510) (2,365) (157) Loss before income taxes (189,629) (273,285) (289,152) Provision for income taxes 1,039 1,013 986 Net loss $ (190,668) $ (274,298) $ (290,138) 61Year Ended January 31, 2024 2023 2022 (in thousands) Cost of revenue: Cost of support $ 9,819 $ 8,485 $ 8,073 Cost of cloud-hosted services 2,195 2,761 2,482 Total cost of subscription revenue 12,014 11,246 10,555 Cost of professional services and other 2,654 2,555 3,367 Total cost of revenue 14,668 13,801 13,922 Sales and marketing 54,861 58,205 64,991 Research and development 49,401 46,255 67,865 General and administrative 51,687 52,900 53,790 Total stock-based compensation expense, net of amounts capitalized $ 170,617 $ 171,161 $ 200,568 * SeeSee Note 1012 to our consolidated financial statements included elsewhere in this Annual Report on Form 10-K for further details.** In connection with tender offers and secondary salesTable of our common stock, stock-based compensation expense for fiscal 2021 and fiscal 2020 included $32.1 million and $1.5 million of expense, respectively, related to the amount paid in excess of the estimated fair value of common stock as of the date of the transactions. There were no tender offers or secondary sales for fiscal 2022. See Note 10 to our consolidated financial statements included elsewhere in this Annual Report on Form 10-K for further details.Contentsdata expressed as a percentage of revenue for the periods indicated:Year Ended January 31, 2024 2023 2022 Revenue: License 12 % 14 % 15 % Support 72 % 73 % 77 % Cloud-hosted services 13 % 10 % 6 % Total subscription revenue 97 % 97 % 98 % Professional services and other 3 % 3 % 2 % Total revenue 100 % 100 % 100 % Cost of revenue: Cost of license - % - % - % Cost of support 10 % 10 % 12 % Cost of cloud-hosted services 5 % 5 % 4 % Total cost of subscription revenue 16 % 15 % 16 % Cost of professional services and other 3 % 3 % 4 % Total cost of revenue 19 % 18 % 20 % Gross profit 81 % 82 % 80 % Operating expenses: Sales and marketing 63 % 75 % 84 % Research and development 38 % 41 % 51 % General and administrative 23 % 28 % 35 % Total operating expenses 125 % 144 % 170 % Loss from operations (44) % (62) % (90) % Interest income 11 % 6 % - % Other expenses, net - % (1) % - % Loss before income taxes (33) % (57) % (90) % Provision for income taxes - % 1 % - % Net loss (33) % (58) % (90) % 6220222024 and 2021Year Ended January 31, Change 2024 2023 $ % (in thousands, except percentages) Revenue: License $ 67,612 $ 64,273 $ 3,339 5 % Support 420,948 349,855 71,093 20 % Cloud-hosted services 76,086 46,860 29,226 62 % Total subscription revenue 564,646 460,988 103,658 22 % Professional services and other 18,491 14,901 3,590 24 % Total revenue $ 583,137 $ 475,889 $ 107,248 23 % $107.8$103.7 million, or 52%22%, for fiscal 20222024 compared to fiscal 2021.2023. This increase is attributable to the addition of new customers, which contributed $45.1$47.0 million for fiscal 2022,2024, as we increased our customercustomer base by 84%14% from January 31, 20212023 to January 31, 2022.2024. The remainderremaining $56.7 million of this increase in revenue is attributable to expanded product adoption among existing customers, as reflected by our average net dollar retention rate of 131%115% for thethe trailing four quarters ended January 31, 2022.$1.1$3.6 million, or 19%24%, for fiscal 20222024 compared to fiscal 2021.2023. This was primarilyincrease is mainly attributable to a $7.0 million increase due to increased delivery of professional services and the completion of certain professional services projects.Year Ended January 31, Change 2024 2023 $ % (in thousands, except percentages) Cost of revenue: Cost of license $ 1,968 $ 1,753 $ 215 12 % Cost of support 58,208 48,112 10,096 21 % Cost of cloud-hosted services 30,447 22,589 7,858 35 % Total cost of subscription revenue 90,623 72,454 18,169 25 % Cost of professional services and other 18,076 14,515 3,561 25 % Total cost of revenue $ 108,699 $ 86,969 $ 21,730 25 % Year Ended January 31, 2024 2023 Gross margin License 97 % 97 % Support 86 % 86 % Cloud-hosted services 60 % 52 % Total subscription margin 84 % 84 % Professional services and other 2 % 3 % Total gross margin 81 % 82 % $19.8$18.2 million, or 61%25%, forfor fiscal 20222024 compared to fiscal 2021.2023. The increase in cost of subscription revenue was driven by an increase in employee-related expenses of $15.7$12.5 million due to a 13% increaseincreases in headcount in our customer support organization from January 31, 2021 to January 31, 2022,organization. These employee-related expenses included a $9.5$0.8 million increase inrelated to stock-based compensation expense, and a $1.2 million one-time accrual of paid time off, or PTO, balances as we transitioned to a PTO model in the United States. expense. The increase in stock-based compensation expense is primarily related to RSUs subject to service-based and performance-based vesting conditions, which conditions were satisfied in connection with our IPO, and related to the ESPP which commenced in the quarter ended January 31, 2022. The increase in stock-based compensation expense is net of a $0.7 million decrease in stock-based compensation expense from secondary sales of our common stock during fiscal 2021. The increase in headcount reflects the net increase after certain roles transitioned from a technical support function to a sales relationship management function, which resulted in expenses being classified as sales and marketing compared to cost of revenue in the prior period resulting in support margins increasing by 6%, total subscription margins increasing by 4%, and total gross margins increasing by 4% for the period. These percentages include stock-based compensation expense which increased support margins by 2%, total subscription margins by 1%, and total gross margins by 1% for the period. The increase in cost of subscription revenue was also attributable to a $2.4$0.7 million increase in cloud hosting fees, as well asand a $1.4$5.0 million increase in amortization of internal-use software. We launched cloud-hosted versions of our products during fiscal 2020software and 2021.acquired technology. As cloud becomes a larger portion of our revenue, our gross63$2.6$3.6 million, or 31%25%, for fiscal 20222024 compared to fiscal 2021.2023. The increase in cost of professional services and other was driven by a $3.6$2.7 million increase in employee-related expenses due to a $3.1and $0.9 million increaseincreased in stock-based compensation expense primarily related to RSUs subject to service-based and performance-based vesting conditions which were satisfied in connection with our IPO, and related to the ESPP which commenced in the quarter ended January 31, 2022. The increase in stock-based compensation expense includes a $0.2 million decrease in stock-based compensation expense from secondary sales of our common stock during fiscal 2021. The increases were partially offset by fewer partner service hours driving a $1.0 million decrease in partner costs. Ourspending on professional services gross margin has been negative, and will continue to be negative for the near-term. Our professional services are generally priced at a low margin which, combined with allocated overhead, has resulted in a negative margin.80% for fiscal 2022 from 81% for fiscal 2021,2024 from 82% for fiscal 2023, primarily due to the increasedecreases in stock-based compensation expense, partially offset by the 4% increase due to the impact of certain roles transitioning from a technical support function to a sales relationship management function, as noted above.Year Ended January 31, Change 2024 2023 $ % (in thousands, except percentages) Sales and marketing $ 369,164 $ 355,826 $ 13,338 4 % $128.5$13.3 million, or 91%4%, for fiscal 20222024 compared to fiscal 2021.2023. The increase was primarily driven by a $121.0$6.9 million increase in employee-related costs due to a 72% increase in headcount in our sales and marketing organization from January 31, 2021 to January 31, 2022 partially attributable to certain roles transitioning from a technical support function to a sales relationship management function, which resulted in expenses being classified as sales and marketing compared to cost of revenue in the prior period, a $53.7 million increase in stock-based compensation expense, and a $4.8 million one-time accrual of PTO balances as we transitioned to a PTO model in the United States. The increase in stock-based compensation expense is primarily related to RSUs subject to service-based and performance-based vesting conditions which were satisfied in connection with our IPO, and related to the ESPP which commenced in the quarter ended January 31, 2022. The increase in stock-based compensation expense includes a decrease of $8.9 million from secondary sales of our common stock during fiscal 2021.costs. The increase in employee-related costs also includes a $11.2$12.1 million net increase in amortization of deferred contract acquisition costs driven by our increase in revenue. Marketing expenses increased $3.2revenue offset by a $3.3 million driven primarily by increasesdecrease in advertisingstock-based compensation expense and sponsorships.$3.0 million decrease in payroll due to decreases in sales and marketing headcount from the reduction in workforce in the quarter ended July 31, 2023. The remainder of the increase in sales and marketing expenses was attributable to a $2.2 million increase in softwaremarketing expenses and a $1.5professional services by $3.9 million increase in allocated overhead due to increased headcount and partially offset by a $0.8$2.0 million, decrease in employee development primarily due to company events being held virtually during the COVID-19 pandemic.Year Ended January 31, Change 2024 2023 $ % (in thousands, except percentages) Research and development $ 222,553 $ 195,384 $ 27,169 14 % $99.8$27.2 million, or 153%14%, for fiscal 2022 compared2024 compared to fiscal 20212023 as we continued toto develop and enhance the functionality of our existing products and release new products. This increase was primarily driven by a $102.5$23.3 million increase in employee-related costs due to a 63%costs. The increase in researchthese employee-related costs includes a $16.1 million increase in payroll and development headcount from January 31, 2021 to January 31, 2022,benefit, a $61.9$5.0 million increase in stock-based compensation expense, net of amounts capitalized to internal-use software, and a $3.6$0.9 million one-time accrual of PTO balances as we transitioned to a PTO model in the United States. The increase in stock-based compensation expense is primarily related to RSUs subject to service-based and performance-based vesting conditions which were satisfied in connection with our IPO, and related to the ESPP which commenced in the quarter ended January 31, 2022. The increase in stock-based compensation expense was partially offset by $4.2 million from secondary sales of our common stock during fiscal 2021.severance. The remainder of the increase in research and development expenses was attributable to increased software and subscription expenses of $3.0$0.6 million, and aincreased spending on employee development of $0.8 million.Year Ended January 31, Change 2024 2023 $ % (in thousands, except percentages) General and administrative $ 136,999 $ 134,997 $ 2,002 1 % million increase in allocated overhead driven primarily by the increase in headcount, partially offset by $7.0 million in higher research and development costs capitalized to internal-use software for our cloud platform compared to fiscal 2021, of which $3.6 million was capitalized stock-based compensation.General and Administrative$63.6$2.0 million, or 131%1%, for fiscal 2022fiscal 2024 compared to fiscal 2021.2023. The increase was primarily driven by a $51.4$0.3 million increase in employee-related costs, due toincluding a 166% increase in general and administrative headcount from January 31, 2021 to January 31, 2022, a $33.2$0.9 million increase in stock-based compensationpayroll expense, a $0.6 million increase in severance, and a $1.1$0.2 million one-time accrual of PTO balances as we transitioned to a PTO modelincrease in the United States. payroll taxes. The increase in these employee-related costs was reduced by $1.3 million decrease in stock-based compensation expense is primarilyexpense. The remaining increase was attributable to increase in expenses related to RSUs subjectfacility allocation, software and subscription, employee development, and professional service by $2.6 million, $1.1 million, $0.5 million, and $0.2 million, respectively, and offset by a $2.5 million decrease in insurance costs.Year Ended January 31, Change 2024 2023 $ % (in thousands, except percentages) Interest income $ 65,159 $ 26,367 $ 38,792 147 % service-based and performance-based vesting conditions which were satisfied in connection with our IPO, and relatedfiscal 2023. The increase was attributable to the ESPP which commencedinterest income earned from cash equivalents and available-for-sale investments, and increases in the quarter ended January 31, 2022. The increase in stock-based compensation expense includes a decrease of $18.1 millionyields resulting from secondary sales of our common stock during fiscal 2021. Professional service and consulting fees increased $5.0 million, net of capitalized costs related to our IPO. Softwarethe Federal Reserve's interest rate increases.Year Ended January 31, Change 2024 2023 $ % (in thousands, except percentages) Other expenses, net $ (510) $ (2,365) $ 1,855 (78) % increased $2.4 million and employee development expenses increased $3.0 million due to increased headcount and costs related to events.Other Income, NetOther income, net decreased by $0.6$1.9 million, or 79%(78)%, for fiscal 2022in fiscal 2024 compared to fiscal 2021.2023. The decrease waschanges were primarily attributeddue to a changechanges in foreign currency gains and losses on our cash balances in foreign jurisdictions due to changes in the mix of our investment portfolio coupled with lower yields on balances invested in money market funds and the weakening of the U.S.US dollar against other major currencies.Year Ended January 31, Change 2024 2023 $ % (in thousands, except percentages) Provision for income taxes $ 1,039 $ 1,013 $ 26 3 % $0.7 million,de minimis, or 276%3%, for fiscal 2022in fiscal 2024 compared to fiscal 2021,2023. The changes were primarily due to a partial release of valuation allowance, of which $0.4 million tax benefit was directly related to the acquisition of BluBracket, Inc. In connection with the BluBracket acquisition, we recorded a net deferred tax liability which provides an additional source of taxable income in foreignto support the realization of the pre-existing deferred tax jurisdictions.assets and, accordingly, during fiscal 2024, we released a total of $0.4 million of our U.S. valuation allowance. We continue to maintain a full valuation allowance on our U.S. deferred tax assets, and the significant components of the tax expense recorded are current cash tax expenses in various jurisdictions. Current cash tax expenses are impacted by each jurisdiction’s individual tax rates, laws on the timing of recognition of income and deductions, and availability of net operating losses and tax credits. Our effective tax rate may fluctuate significantly on a quarterly basis and could be adversely affected to the extent earnings are lower than anticipated in countries that have lower statutory rates and higher than anticipated in countries that have higher statutory rates.To date, we have financed our operations principally through private placements of our equity securities, as well as payments received from customers using our products and services. In December 2021, we completed our IPO, which resulted in proceeds of $1.2 billion, after deducting underwriting discounts and commissions of $69.4 million and offering expenses of $6.0 million.2022,2024, we had cash, and cash equivalents, and short-term investments of $1.4 billion and restricted cash of $1.8$1,278.6 million. Our cash and cash equivalents primarily consist of cash on hand, and highly liquid investments in money market funds.funds, and available-for-sale investments with an original maturity date of three months or less. Our restricted cash constitutes cash on deposit with financial institutions in supportshort-term investments consist of lettersU.S. treasury securities, corporate notes and bonds, U.S. agency obligations, commercial paper, and certificates of credit in favor of landlords for non-cancelable operating lease agreements.deposit. We have generated significant operating losses from our operations as reflected in our accumulated deficit of $506.1$971.1 million as of January 31, 2022,2024, and negative cash flows from operations in fiscal 2022,652021,2023, and fiscal 2020. Wefiscal 2022. While we expect to continue to incur operating losses and generate negativein the foreseeable future, we have generated positive cash flows from operations forin recent quarters. We may continue to have positive cash flows in the foreseeable future, due to the investments we intend to make as described above, and as a resultor we may require additional capital resources to execute strategic initiatives to grow our business.On November 23, 2020, we entered into a loan and security agreement with HSBC Ventures USA Inc, or the Loan Agreement. The Loan Agreement provides us a revolving line of credit, which expires November 23, 2023. Under the Loan Agreement, we are able to borrow up to $50.0 million. Interest on any drawdown under the revolving line of credit accrues at the adjusted LIBOR plus 3.00%. We also incur a commitment fee of 0.30% for any unused portion of the credit facility. As of January 31, 2022, we had no balance outstanding under the Loan Agreement. The Loan Agreement includes customary restrictive covenants and in the event we borrow amounts under the agreement, we will become subject to a number of covenants that may limit our ability to, among other things, transfer or dispose of assets, pay dividends or make distributions, incur additional indebtedness, create liens, make investments, loans and acquisitions, engage in transactions with affiliates, merge or consolidate with other companies, and sell substantially all of our assets. We are currently in compliance with all covenants under the Loan Agreement. that our existing cash and cash equivalents will be sufficient to fund our operating and capital needs for at least the next 12 months.months, including our repurchases of common stock pursuant to our stock repurchase program. Our assessment of the period of time through which our financial resources will be adequate to support our operations is a forward-looking statement and involves risks and uncertainties. Our actual results could vary as a result of, and our future capital requirements, both near-term and long-term, will depend on many factors, including our growth rate, the timing and extent of spending to support our research and development efforts, the expansion of sales and marketing and international operating activities, the timing of new introductions of solutions or features, and the continuing market acceptance of our services. We may in the future enter into arrangements to acquire or invest in complementary businesses, services and technologies, including intellectual property rights. We have based this estimate on assumptions that may prove to be wrong, and we could use our available capital resources sooner than we currently expect. We may be required to seek additional equity or debt financing. In the event that additional financing is required from outside sources, we may not be able to raise it on terms acceptable to us or at all. If we are unable to raise additional capital when desired, or if we cannot expand our operations or otherwise capitalize on our business opportunities because we lack sufficient capital, our business, operating results and financial condition would be adversely affected.To satisfy tax withholding obligations associated with the vesting and settlement of outstanding RSUs for which the service-based vesting condition was satisfied and for which the liquidity-based vesting condition was satisfied in connection with our IPO, we withheld the number of shares necessary to satisfy the tax obligations based on the IPO price. We used a portion of the net proceeds we received from the IPO to satisfy the minimum anticipated tax withholding and remittance obligations of $111.0 million during the fourth quarter of fiscal 2022 related to the RSU Settlement based upon the IPO price per share of $80.00.Year Ended January 31, 2024 2023 2022 Net cash used in operating activities $ (10,851) $ (84,462) $ (56,215) Net cash used in investing activities $ (535,171) $ (8,998) $ (6,596) Net cash provided by financing activities $ 23,302 $ 21,983 $ 1,147,846 multi-yearmulti-years in advance. Therefore, a substantial source of our cash is from such prepayments, which are included on our consolidated balance sheets in deferred revenue and customer deposits. We generally experience seasonality in terms of when we enter into agreements with our customers, particularly in our fourth fiscal quarter due to increased buying patterns of our enterprise customers and in our second fiscal quarter due to the summer vacation slowdown that impacts many of our customers. Given the seasonality in our business as discussed above, the operating cash flow benefit from increased collections from our customers generally occurs in the subsequent one to two quarters after billing. We expect seasonality, timing of billings, and collections from our customers to have a material impact on our cash flow from operating activities from period to period. Our primary uses of cash from operating activities are for personnel-related expenses, software and subscription expenses, sales and marketing expenses, third-party cloud infrastructure costs, professional services expenses, and overhead expenses.20222024 was $56.2$10.9 million, which resulted from a net loss of $290.1$190.7 million, adjusted for non-cash charges of $205.5$170.2 millionand net cash inflow of $28.5$9.7 million from changes in operating assets and liabilities. Non-cash charges primarily consisted of $200.6$170.6 million for stock-based compensation expense, $2.5$9.5 million for depreciation and amortization expense, and $2.4$3.1 million for non-cash operating lease costs. costs, offset by $12.7 million for accretion of discounts on investments and $0.4 million for deferred income taxes. The net cash inflow from$76.0$59.3 million increase in deferred revenue due to increased billings and $1.2 million increase in customer deposits from advance invoicing in accordance with our subscription contracts, a $32.4$0.4 million increase in accrued compensationexpenses and benefits primarily due to accrued sales commissions and accrued payroll taxes, and a $8.5 million increase in accounts payable. Theother liabilities. These cash inflow wasinflows were partially offset by a $33.4$20.4 million increase in accountsaccount receivable due to higher billings and timing of collections from our customers, a $39.1$12.7 million increase in prepaid expenses and other assets, a $6.2 million increase in deferred contract acquisition costs as our sales commission payments increased due to addition of new customers and expansion of our existing customer subscriptions, a $13.6 million increase in prepaid expenses and other assets, a $0.9$3.7 million decrease in accrued expenses and otheraccount payable due to timing of payments to our vendors, a $3.4 million decrease in lease liabilities anddue to payments to our landlords, a $2.6 million decrease in operating lease liabilities.Net cash used in operating activities during fiscal 2021 was $39.6 million, which resulted from a net loss of $83.5 million, adjusted for non-cash charges of $42.3 million and net cash inflow of $1.6 million from changes in operating assets and liabilities. Non-cash charges primarily consisted of $39.2 million for stock-based compensation expense, $0.9 million for depreciation and amortization expense, and $2.1 million for non-cash operating lease costs. The net cash inflow from changes in operating assets and liabilities was primarily the result of a $46.9 million increase in deferred revenue and $3.3 million increase in customer deposits from advance invoicing in accordance with our subscription contracts, a $7.5 million increase in accrued compensation and benefits primarily due to accrued sales commissions and accrued payroll taxes, a $3.3 million increase in accrued expenses and other liabilities, a $2.7 million decrease in prepaid expenses and other assets, and a $1.1 million increasedecrease in accounts payable. Thecustomer deposits from advance invoicing in accordance with our subscription contracts.partially offset byprimarily the result of a $41.4$35.6 million increase in accountsaccount receivable due to higher billings and timing of collections from our customers, a $20.0$34.8 million increase in deferred contract acquisition costs as our sales commission payments increased due to addition of new customers and expansion of our existing customer subscriptions, a $3.1 million decrease in lease liabilities due to payments to our landlords, and a $1.8 million decrease in operating lease liabilities.account payable due to timing of payments to our vendors. These cash outflows were partially offset by a $79.0 million increase in deferred revenue due to increased billings, a $3.3 million increase in customer deposits from advance invoicing in accordance with our subscription contracts, a $2.6 million increase in accrued expenses and other liabilities, a $1.7 million increase in accrued compensation and benefits primarily due to accrued sales commissions and accrued payroll taxes, and a $0.1 million decrease in prepaid expenses and other assets.20222024 of $6.6$535.2 million resulted primarily from $0.2was due to a $811.8 million cash outflow in purchases of propertyshort-term investments, a $20.9 million cash outflow in a business combination, and equipment and $6.4a $11.3 million outflow in capitalized internal-use software for our cloud platform.platform, offset by a $283.2 millionprovided byused in investing activities during fiscal 20212023 of $22.8$9.0 million resultedwas primarily from $80.0comprised of $8.7 million in proceeds from maturity of short-term investments net of $50.0 million in purchases of short-term investments,capitalized internal-use software for our cloud platform and offset by $4.3$0.3 million in purchases of property and equipment and $2.9 million in capital expenditures for our cloud platform.Activity$1.1 billion$23.3 million during fiscal 20222024 was due to $1.3 billion of$17.6 million proceeds from our IPO,stock purchased by employees under the 2021 Employee Stock Purchase Plan ("ESPP"), and $6.0 million net of underwriting discounts and commissions, and $5.0 million of proceeds from the exercise of stock options. The cash inflow was partiallyoptions, offset by $105.6$0.3 million outflow for payment of taxes paid related to net share settlement of equity awards, and $4.5 million of payments for capitalized costs related to the IPO.$177.1$22.0 million during fiscal 20212023 was primarily due to $174.7$17.2 million in proceeds from stock purchased by employees under the issuance of redeemable convertible preferred stock,ESPP, and $5.0 million net of issuance costs, $2.6 millionproceeds from the exercise of stock options, and offset by $0.2 million usedoutflow for paymentspayment of loan issuance costs for our credit facility.The following table summarizes our contractual2022:
1 Year
5 Years67in the tabledescribed above are associated with agreements that are enforceable and legally binding. Obligations under contracts that we can cancel without a significant penalty are not included in the table above. in the table above, as our purchase orders represent authorizations to purchase rather than binding agreements.PoliciesEstimatesEstimatesOur financial statements are prepared in accordance with U.S. GAAP. The preparationresults of these financial statements requires usoperations and require the most difficult, subjective, or complex judgments, often as a result of the need to make estimates and assumptionsabout the effect of matters that affect the reported amounts of assets, liabilities, revenue and expenses, as well as related disclosures. We evaluate ourare inherently uncertain. These estimates and assumptions on an ongoing basis. Our estimates are developed based on historical experience and various other assumptions that we believe to be reasonable under the circumstances. Our actual results could differ from these estimates.We generate revenue primarily from subscriptions which include licensesproprietary features, support and maintenance revenue, and cloud-hosted services. Licenses for self-managed software consist of term licenses and provide the customer with a right to use the software upon delivery to the customer. Revenue on committed cloud-hosted services is recognized ratably when we satisfy the performance obligation over the contract period, whereas revenue from non-committed, pay-as-you-go cloud-hosted services are recognized when usage occurs. Support and maintenance are bundled with the license subscription for the term of the license period. Cloud-hosted services are provided on a committed basis or non-committed basis and give customers accessSignificant Accounting Policies, to our cloud solutions, which include related customer support. We also generateconsolidated financial statements included elsewhere in this Annual Report on Form 10-K for information regarding our significant accounting policies over revenue from professional services revenue which consist of professional services and training.We recognize revenue when our customer obtains control of promised goods or services in an amount that reflects the consideration that we expect to receive in exchange for those goods or services. In determining the appropriate amount of revenue to be recognized as we fulfill our obligations under each of our agreements, we perform the following steps:(i) identification of the contract with a customer;We contract with our customers typically through order forms or purchase orders which in most cases are governed by master sales agreements. At contract inception we evaluate whether two or more contracts should be combined and accounted for as a single contract and identify the different performance obligations accordingly.(ii) determination of whether the promised goods or services are performance obligations;Performance obligations promised in a contract are identified based on the products and services that will be transferred to the customer that are both capable of being distinct and distinct in the context of the contract. self-managed subscriptions include both an obligation to provide the customer with the right to use our proprietary software, as well as an obligation to provide support (on both open-source and proprietary software) and maintenance. Certain arrangements with customers include a renewal option that is separately evaluated for a material right.Our cloud-hosted services products provide access to hosted software as well as support, which we consider to be a single performance obligation.Professional services are not integral to the functionality of the subscription services and are generally distinct from the other performance obligations.We have concluded that our contracts with customers do notoften contain warranties that give rise to a separatemultiple performance obligation.68(iii) measurement of the transaction price;The transaction price is determined based on the consideration to whichobligations. For these contracts, we expect to be entitled in exchange for transferring services and products to the customer. We record our revenue net of any value added or sales tax.Variable consideration is included in the transaction price if, in our judgment, it is probable that a significant future reversal of cumulative revenue under the contract will not occur. None of our contracts contain a significant financing component.(iv) allocation ofallocate the transaction price to theeach performance obligations; andWe measure the transaction price with reference to theobligation on a relative standalone selling price or(“SSP”) basis. We consider our determination of SSP of the variousto be a critical accounting estimate. SSP is established based on multiple factors, including prices at which we separately sell standalone subscriptions and services. For license and support performance obligations, inherent within a contract. Management determines the SSP based on an observable standalone selling price when it is available, as well as other factors, including the price charged to customers, discounting practices, and overall pricing objectives, while maximizing observable inputs.We do not have observable SSP for our licenses or our support as they are not sold separately. Wewe developed a model to estimate relative SSP for each performance obligation using an “expectedexpected cost-plus margin”margin approach. This model uses observable data points to develop the main assumptions including the estimated useful life of the intellectual property and appropriate margins.If a contract contains a single performance obligation, the entire transaction price is allocatedmargins by allocating costs between enterprise and open-source features. There may be more than one SSP for individual subscriptions and services due to the single performance obligation. For contracts that contain multiple performance obligations, we allocate the transaction price to each performance obligation based on their relative SSP.stratification of subscription support tiers and services. We also consider if there are any additional material rights inherent in a contract, and if so, we allocate a portion ofrevenue to the transaction price to such rights based on its relative SSP.For our contracts with customers which include a material right of renewal each month, we use the practical alternative to allocate value to the future optional renewal of software and related mandatory support services. As we expect renewals over the full contractually stated term, the entire transaction price is allocated evenly to each monthly renewal option.(v) recognition of revenue when we satisfy eachas a performance obligation.Revenue is recognized at the time the related performance obligation is satisfied by transferring the promised product or service to the customer. Our self-managed subscriptions include both upfront revenue recognition when the license is delivered as well as revenue recognized ratably over the contract period for support and maintenance based on the stand-ready nature of these elements. When arrangements include material rights associated with monthly renewal options, we recognize revenue each month equal to the allocated value of a one-month term license and one-month support and maintenance services.In the event that the customer cancels support, the customer receives a refund for the remaining contractual balance of support while any remaining nonrefundable software balance is immediately recognized as revenue. The amount of refundable contractual balance is included in customer deposits within the consolidated balance sheets.Revenue on our cloud-hosted services product is recognized ratably over the contract period when we satisfy the performance obligation. Cloud-hosted contracts are generally nonrefundable.Revenue from professional services and training are recognized as these services are performed.We sell directly through our sales team and through our channel partners. Sales to channel partners are made at a discount and revenues are recorded at this discounted price once all the revenue recognition criteria above are met.represent costs that are incremental to the acquisition of customer contracts, which consist mainly ofinclude sales commissions and associated payroll taxes. We determine whether costs should be deferred based onearned by our sales compensation plans by determining if the commissionsforce which are in factconsidered incremental and would not have occurred absent the customer contract.69Tablerecoverable costs of Contentsthe renewal of a contract are not considered commensurate with the commissions paid for the acquisition of the initial contract given the substantive difference in commission rates in proportion to their respective contract values. Commissions paid upon the initial acquisition of a contract are amortized over an estimated period of benefit of five years while commissions paid for renewal contracts are amortized over the contractual term of the renewals. Amortization of deferred contract acquisition costs is recognizedand then amortized commensurate with the pattern of revenue recognition over a period of benefit, determined to be five years. Significant judgment is required in arriving at this period of benefit. We determined the period of benefit by taking into consideration our customer contracts, technology, and included inother factors. Amounts anticipated to be recognized within one year of the balance sheet date are recorded as deferred contract acquisition costs, with the remaining portion recorded as deferred contract acquisition costs, non-current, on the consolidated balance sheets. Amortization expense of deferred contract costs is recorded as sales and marketing expense in the consolidated statements of operations.We determine the period of benefit for commissions paid for the acquisition of the initial contract by taking into consideration the expected contract term and expected renewals of customer contracts, the duration of relationships with our customers, customer retention data, our technology development lifecycle, and other factors. Management periodically reviews the carrying amount of deferred contract acquisition costs to determine whether events or changes in circumstances have occurred that could impact the period of benefit of these deferred costs.Stock-Based CompensationWe estimate the fair value of share-based awards on the date of grant. For service-based awards, the related stock-based compensation expense is recognized over the vesting period of the entire award using the straight-line attribution method. For awards that include both a performance and service condition, we amortize stock-based compensation expense on a graded vesting basis over the vesting period, after assessing the probability of achieving requisite performance. We recognize forfeitures as they occur.We selected the Black-Scholes option-pricing model as the method for determining the estimated fair value for stock options. The Black-Scholes option-pricing model requires the use of management assumptions, which determine the fair value of share-based awards, including the fair value of common stock, the option’s expected term and the price volatility of the underlying stock. The assumptions used in our option-pricing model represent management’s best estimates. These estimates involve inherent uncertainties and the application of management’s judgment. If factors change and different assumptions are used, our stock-based compensation expense could be materially different in the future.We recognize excess tax benefits from stock-based compensation in our provision for income taxes as a discrete item in the reporting period in which they occur.These assumptions are estimated as follows:•Fair Value of Common Stock. Prior to our IPO, our board of directors considered numerous objective and subjective factors to determine the fair value of our common stock at each meeting in which awards were approved as discussed in more detail under “—Common Stock Valuations” below. After our IPO, the fair value of our common stock is determined by the closing price of our common stock on the date of grant, which is traded on the Nasdaq Global Select Market.•Expected Term. The expected term represents the period that the stock-based awards are expected to be outstanding. For option grants that are considered to be “plain vanilla,” we determine the expected term using the simplified method as provided by the SEC. The simplified method deems the term to be the average of the time-to-vesting and the contractual life of the option.•Risk-Free Interest Rate. The risk-free interest rate is based on the U.S. Treasury yield curve in effect at the time of grant for zero-coupon U.S. Treasury notes with maturities approximately equal to the option’s expected term.•Expected Volatility. The expected volatility is based on the historical and implied volatility of similar companies whose stock or option prices are publicly available, after considering the industry, stage of life cycle, size, market capitalization, and financial leverage of the other companies.•Dividend Rate. The expected dividend is assumed to be zero, as we have never paid dividends and have no current plans to do so.70The following table summarizes the assumptions used in the Black-Scholes option pricing model to determine the fair value of our stock options:We also assess the need to record stock-based compensation expense when certain of our affiliated stockholders purchase shares from our employees and founders in excess of fair value. We recognize any such excess fair value as stock-based compensation expense in our consolidated statements of operations at the time of purchase. We recorded 32.1 million and $1.5 million of stock-based compensation expense in fiscal 2021, and fiscal 2020, respectively, related to tender offers and secondary sales of our common stock. There were no tender offers or secondary sales included in stock-based compensation expense for fiscal 2022.Common Stock ValuationsPrior to our IPO, the fair value of the common stock underlying our stock-based awards had historically been determined by our board of directors, with input from management and reference to contemporaneous independent third-party valuations. We believed that our board of directors had the relevant experience and expertise to determine the fair value of our common stock. Given the absence of a public trading market of our common stock, and in accordance with the American Institute of Certified Public Accountants Practice Aid, Valuation of Privately-Held Company Equity Securities Issued as Compensation, our board of directors exercised reasonable judgment and considered numerous objective and subjective factors to determine the best estimate of the fair value of our common stock at each grant date. These factors included:•the prices, rights, preferences, and privileges of our redeemable convertible preferred stock relative to those of our common stock;•the prices paid for common or redeemable convertible preferred stock sold to third-party investors by us and prices paid in tender offers or secondary transactions;•lack of marketability of our common stock;•our operating and financial performance;•current business conditions and projections;•hiring of key personnel and the experience of our management;•the history of our company and the introduction of new products;•our stage of development;•likelihood of achieving a liquidity event, such as an initial public offering, a merger, or acquisition of our company given prevailing market conditions;•the market performance of comparable publicly traded companies; and•U.S. and global capital market conditions.The fair value of our common stock was determined using various valuation methods, including a combination of the income and market approach. The income approach estimated value based on the expectation of future cash flows that we would generate. These future cash flows were discounted to their present values using a discount rate that was derived from an analysis of the cost of capital of comparable publicly traded companies in our industry or those with similar business operations and was adjusted to reflect the risks inherent in our cash flows. The market approach estimated value based on a comparison of our company to comparable public companies in a similar line of business. From the comparable companies, a representative market value multiple was determined and then applied to our financial forecasts to estimate the value of our company.For each valuation, the fair value, or equity value, of our business determined by the income and market approaches was then allocated to the common stock using either the option-pricing method, or OPM, or the probability-weighted71expected return method, or PWERM, or both. Our valuations prior to July 31, 2019 were allocated based on the OPM. Beginning July 31, 2019, our valuations were allocated based on the PWERM and the OPM.In addition, we also considered any secondary transactions involving our capital stock. In our evaluation of those transactions, we considered the facts and circumstances of each transaction to determine the extent to which they represented a fair value exchange. Factors considered include transaction volume, timing, whether the transactions occurred among willing and unrelated parties, and whether the transactions involved investors with access to our financial information. When affiliated stockholders acquire shares from our employees at a price in excess of fair value, we recognized such excess value as stock-based compensation expense.Application of these approaches and methodologies involves the use of estimates, judgments, and assumptions that are highly complex and subjective, such as those regarding our expected future revenue, expenses, and future cash flows, discount rates, market multiples, the selection of comparable public companies, and the probability of and timing associated with possible future events.JOBS Act Accounting ElectionWe are an emerging growth company, as defined in the JOBS Act. The JOBS Act provides that an emerging growth company can take advantage of an extended transition period for complying with new or revised accounting standards. This provision allows an emerging growth company to delay the adoption of some accounting standards until those standards would otherwise apply to private companies. We have irrevocably elected not to avail ourselves of this exemption from new or revised accounting standards and, therefore, we will be subject to the same new or revised accounting standards as other public companies that are not emerging growth companies.Recently IssuedRecent Accounting Pronouncementspronouncements adopted.72handhand and highly liquid investments in money market funds. As of January 31, 2022,2024, we had cash, and cash equivalents, and short-term investments of $1.4 billion and restricted cash of $1.8$1,278.6 million. The carrying amount of our cash equivalents reasonably approximates fair value due to the short maturities of these instruments. The primary objectives of our investment activities are the preservation of capital, the fulfillment of liquidity needs, and the fiduciary control of cash and investments. We doAs of fiscal 2024, we have not enterentered into investments for trading or speculative purposes. Our investments are exposed to market risk due to fluctuationspurposes, but we may do so in interest rates, which may affect our interest income.the future. Due to the short-term nature of our investment portfolio and type of investments included in our portfolio, we do not believe an immediate 10% increase or decrease in interest rates would have a material effect on the fair market value of our portfolio. We, therefore, do not expect our operating results or cash flows to be materially affected by a sudden change in market interest rates.Dollar, Singaporean Dollar, Japanese Yen, and Indian Rupee.Dollar. Fluctuations in foreign currency exchange rates may cause us to recognize transaction gains and losses in our consolidated statements of operations. AsIf the impactU.S. dollar weakened by 10%, our operating expense could increase by approximately 2%.exchange rates has not been material to our historical operating results, to date we have notrisk management program and entered into foreign currency forward contracts to hedge a portion of our forecasted foreign currency-denominated expenses. These foreign currency derivative contracts have a maturity up to 12 months or hedging transactions; we may do so in the future ifless and are designated as cash flow hedges to protect our exposureearnings subjected to foreign currency becomes more significant.risk. We expect that the effect of a hypothetical 10% relative change in foreign exchange rates, after considering our hedging program, would not have a material impact on our financial condition, results of operations, or cash flows for the periods presented. As our international operations grow, we will continue to reassess our approach to manage our risk relating to fluctuations in foreign exchange rates.Page PageINDEPENDENT AUDITORS’ REPORTReport of Independent Registered Public Accounting Firm (PCAOB ID No. 34)34)7576CONSOLIDATED FINANCIAL STATEMENTS:Consolidated Financial Statements:7678777978817982808320222024 and 2021,2023, the related consolidated statements of operations, consolidated statements ofcomprehensive loss, redeemable convertible preferred stock and stockholders’ equity (deficit), and cash flows, for each of the three years in the period ended January 31, 2022,2024, and the related notes (collectively referred to as the "financial statements"). In our opinion, the financial statements present fairly, in all material respects, the financial position of the Company as of January 31, 20222024 and 2021,2023, and the results of its operations and its cash flows for each of the three years in the period ended January 31, 2022,2024, in conformity with accounting principles generally accepted in the United States of America.Public Company Accounting Oversight Board (United States) (PCAOB)PCAOB and are required to be independent with respect to the Company in accordance with the U.S. federal securities laws and the applicable rules and regulations of the Securities and Exchange Commission and the PCAOB.The Company is not required to have, nor were we engaged to perform, an audit of its internal control over financial reporting. As part of our audits, we are required to obtain an understanding of internal control over financial reporting but not for the purpose of expressing an opinion on the effectiveness of the Company’s internal control over financial reporting. Accordingly, we express no such opinion.DeloitteDELOITTE & ToucheTOUCHE LLP25, 2022share and per share data)January 31, 2024 2023 Assets Current assets Cash and cash equivalents $ 763,414 $ 1,286,134 Short-term investments 515,163 — Accounts receivable, net of allowance 182,614 162,369 Deferred contract acquisition costs 50,285 42,812 Prepaid expenses and other current assets 30,075 17,683 Total current assets 1,541,551 1,508,998 Property and equipment, net 33,933 24,594 Operating lease right-of-use assets 11,508 12,560 Deferred contract acquisition costs, non-current 80,055 81,286 Acquisition-related intangible assets, net 11,611 — Goodwill 12,197 — Other assets, non-current 1,092 902 Total assets $ 1,691,947 $ 1,628,340 Liabilities and Stockholders’ Equity Current liabilities: Accounts payable $ 9,081 $ 12,450 Accrued expenses and other current liabilities 11,118 6,783 Accrued compensation and benefits 56,007 58,628 Operating lease liabilities 4,025 3,380 Deferred revenue 334,894 272,909 Customer deposits 25,627 26,699 Total current liabilities 440,752 380,849 Deferred revenue, non-current 26,659 29,335 Operating lease liabilities, non-current 10,008 12,093 Other liabilities, non-current 1,535 713 Total liabilities 478,954 422,990 Commitments and contingencies (Note 11) Stockholders’ equity: Class A common stock, par value of $0.000015 per share; 1,000,000 and 1,000,000 shares authorized as of January 31, 2024 and January 31, 2023, respectively; 125,333 and 88,823 shares issued and outstanding as of January 31, 2024 and January 31, 2023, respectively 1 1 Class B common stock, par value of $0.000015 per share; 200,000 and 200,000 shares authorized as of January 31, 2024 and January 31, 2023, respectively; 73,921 and 101,145 shares issued and outstanding as of January 31, 2024 and January 31, 2023, respectively 2 2 Additional paid-in capital 2,184,451 1,985,747 Accumulated other comprehensive loss (393) — Accumulated deficit (971,068) (780,400) Total stockholders’ equity 1,212,993 1,205,350 Total liabilities and stockholders’ equity $ 1,691,947 $ 1,628,340 share and per share data)Year Ended January 31, 2024 2023 2022 Revenue: License $ 67,612 $ 64,273 $ 47,504 Support 420,948 349,855 247,566 Cloud-hosted services 76,086 46,860 18,613 Total subscription revenue 564,646 460,988 313,683 Professional services and other 18,491 14,901 7,086 Total revenue 583,137 475,889 320,769 Cost of revenue: Cost of license 1,968 1,753 221 Cost of support 58,208 48,112 38,080 Cost of cloud-hosted services 30,447 22,589 14,031 Total cost of subscription revenue 90,623 72,454 52,332 Cost of professional services and other 18,076 14,515 11,108 Total cost of revenue 108,699 86,969 63,440 Gross profit 474,438 388,920 257,329 Operating expenses: Sales and marketing 369,164 355,826 269,504 Research and development 222,553 195,384 165,031 General and administrative 136,999 134,997 112,108 Total operating expenses 728,716 686,207 546,643 Loss from operations (254,278) (297,287) (289,314) Interest income 65,159 26,367 319 Other expenses, net (510) (2,365) (157) Loss before income taxes (189,629) (273,285) (289,152) Provision for income taxes 1,039 1,013 986 Net loss $ (190,668) $ (274,298) $ (290,138) Net loss per share attributable to common stockholders, basic and diluted $ (0.98) $ (1.47) $ (3.48) Weighted-average shares used to compute net loss per share attributable to common stockholders, basic and diluted 193,825 186,029 83,277 REDEEMABLE CONVERTIBLE PREFERRED STOCK AND STOCKHOLDERS’ EQUITY (DEFICIT)thousands, except share data)Year Ended January 31, 2024 2023 2022 Net loss $ (190,668) $ (274,298) $ (290,138) Other comprehensive loss, net of tax: Available-for-sale investments: Unrealized gains on available-for-sale investments 107 — — Foreign currency forward contracts: Unrealized losses on foreign currency forward contracts (500) — — Other comprehensive loss, net of tax (393) — — Total comprehensive loss $ (191,061) $ (274,298) $ (290,138)
Common StockRedeemable Convertible Preferred Stock Class A and Class B
Common StockAdditional Paid-in Capital Accumulated Other Comprehensive Loss Accumulated Deficit Shares Shares Amount Balance as of January 31, 2021 94,128 $ 349,113 65,578 $ 1 $ 94,159 $ — $ (215,964) $ (121,804) Conversion of redeemable convertible preferred stock to common stock upon initial public offering (94,128) (349,113) 94,128 1 349,112 — — 349,113 Issuance of common stock upon initial public offering, net of underwriting discounts and issuance costs — — 16,530 1 1,246,924 — — 1,246,925 Issuance of common stock for restricted stock awards — — 11 — — — — — Issuance of common stock upon exercise of stock options — — 2,962 — 5,036 — — 5,036 Vesting of early exercised stock options — — — — 18 — — 18 Issuance of common stock upon settlement of restricted stock units — — 4,355 — — — — — Tax withholdings on settlement of restricted stock units — — (1,397) — (110,989) — — (110,989) Stock-based compensation — — — — 204,130 — — 204,130 Net loss — — — — — — (290,138) (290,138) Balance as of January 31, 2022 — $ — 182,167 $ 3 $ 1,788,390 $ — $ (506,102) $ 1,282,291 Issuance of common stock upon exercise of stock options — — 2,856 — 5,034 — — 5,034 Vesting of early exercised stock options — — — — 6 — — 6 Issuance of common stock upon settlement of restricted stock units — — 4,244 — — — — — Tax withholdings on settlement of restricted stock units — — (13) — (248) — — (248) Issuance of common stock under employee stock purchase plan — — 714 — 17,197 — — 17,197 Stock-based compensation — — — — 175,368 — — 175,368 Net loss — — — — — — (274,298) (274,298) Balance as of January 31, 2023 — $ — 189,968 $ 3 $ 1,985,747 $ — $ (780,400) $ 1,205,350 Issuance of common stock upon exercise of stock options — — 2,934 — 6,003 — — 6,003 Issuance of common stock upon settlement of restricted stock units — — 5,556 — — — — — Tax withholdings on settlement of restricted stock units — — (9) — (269) — — (269) Issuance of common stock under employee stock purchase plan — — 805 — 17,568 — — 17,568 Stock-based compensation — — — — 175,402 — — 175,402 Other comprehensive loss — — — — — (393) — (393) Net loss — — — — — — (190,668) (190,668) Balance as of January 31, 2024 — $ — 199,254 $ 3 $ 2,184,451 $ (393) $ (971,068) $ 1,212,993 Year Ended January 31, 2024 2023 2022 Cash flows from operating activities Net loss $ (190,668) $ (274,298) $ (290,138) Adjustments to reconcile net loss to cash from operating activities: Stock-based compensation expense, net of amounts capitalized 170,617 171,161 200,568 Depreciation and amortization expense 9,506 4,588 2,498 Non-cash operating lease cost 3,054 2,860 2,382 Accretion of discounts on marketable securities (12,738) — — Deferred income taxes (414) — — Other 138 (1) 14 Changes in operating assets and liabilities: Accounts receivable (20,392) (35,556) (33,364) Deferred contract acquisition costs (6,242) (34,767) (39,086) Prepaid expenses and other assets (12,656) (61) (13,626) Accounts payable (3,668) (1,817) 8,464 Accrued expenses and other liabilities 438 2,609 (895) Accrued compensation and benefits (2,621) 1,689 32,379 Operating lease liabilities (3,442) (3,140) (2,567) Deferred revenue 59,309 78,955 75,992 Customer deposits (1,072) 3,316 1,164 Net cash used in operating activities (10,851) (84,462) (56,215) Cash flows from investing activities Business combination, net of cash acquired (20,860) — — Purchases of property and equipment (697) (252) (214) Capitalized internal-use software (11,333) (8,746) (6,382) Purchases of short-term investments (811,838) — — Proceeds from sales of short-term investments 26,372 — — Proceeds from maturities of short-term investments 283,185 — — Net cash used in investing activities (535,171) (8,998) (6,596) Cash flows from financing activities Proceeds from initial public offering, net of underwriting discounts and commissions — — 1,252,974 Taxes paid related to net share settlement of equity awards (269) (248) (105,642) Proceeds from issuance of common stock upon exercise of stock options 6,003 5,034 5,036 Proceeds from issuance of common stock under employee stock purchase plan 17,568 17,197 — Payments of deferred offering costs — — (4,522) Net cash provided by financing activities 23,302 21,983 1,147,846 Net increase (decrease) in cash, cash equivalents, and restricted cash (522,720) (71,477) 1,085,035 Cash, cash equivalents, and restricted cash beginning of period 1,286,134 1,357,611 272,576 Cash, cash equivalents, and restricted cash end of period $ 763,414 $ 1,286,134 $ 1,357,611 Supplemental disclosure of cash flow information Cash paid for income taxes, net of refund received $ 1,430 $ 999 $ 739 Cash paid for operating lease liabilities $ 4,047 $ 3,781 $ 3,291 Supplemental disclosure of noncash investing and financing activities Operating lease right-of-use assets obtained in exchange for new lease obligations $ 2,002 $ — $ 2,036 Unpaid deferred offering costs — — 1,527 Unpaid taxes related to net share settlement of equity awards — — 5,347 Conversion of convertible preferred stock to common stock upon initial public offering — — 349,113 Unpaid acquisition holdback $ 4,100 $ — $ — Capitalized stock-based compensation expense $ 4,784 $ 4,207 $ 3,562 HashiCorp, Inc.The Company is headquartered in San Francisco, California and has wholly owned subsidiaries around the world, or collectively, the Company.world. The Company’s foundational technologies solve the core infrastructure challenges of cloud adoption by enabling an operating model that unlocks the full potential of modern public and private clouds. The Company’s cloud operating model provides consistent workflows and a standardized approach to automating the critical processes involved in delivering applications in the cloud: infrastructure provisioning, security, networking, and application deployment. The Company’s primary commercial products are HashiCorp Terraform, Vault, Consul, and Nomad. The Company’s software is predominantly self-managed by users and customers who deploy it across public, private, and hybrid cloud environments. The Company also offers a fully managedfully-managed cloud platform for multiple products that further accelerates enterprise cloud migration by addressing resource and skills gaps, improving operational efficiency, and speeding up deployment time for customers. Additionally, the Company provides premium support and services.GAAP.Initial Public OfferingIn December 2021, the Company completed its initial public offering, or IPO, in which the Company issued and sold 16,530,000 of its Class A common stock at a public offering price of $80.00 per share, which included 1,230,000 shares issued upon the exercise of the underwriters' overallotment option to purchase additional shares in January 2022. The Company received net proceeds of $1,247 million after deducting underwriting discounts and commissions of $69.4 million and offering expenses of $6.0 million. Immediately prior to the closing of the IPO, all 94,127,984 shares of the Company’s outstanding redeemable convertible preferred stock automatically converted into an equal number of shares of Class B common stock.Upon the consummation of the IPO:•$349.1 million of redeemable convertible preferred stock were reclassified into Class B common stock and additional paid-in capital.•$6.0 million of deferred offering costs were reclassified into stockholders’ equity (deficit) as an offset against the IPO proceeds.•$190.5 million in cumulative stock-based compensation expense related to the outstanding RSUs through January 31, 2022 was recognized.2022,2024, for example, refer to the fiscal year ended January 31, 2022.2024.80NonmonetaryNon monetary assets and liabilities denominated in foreign currencies have been remeasured into U.S. dollar using historical exchange rates. Remeasurement gains and losses are included within other income, net in the accompanying consolidated statements of operations. Remeasurement gains and losses were not material to the consolidated financial statements for fiscal 2022, 2021,2024, fiscal 2023, and 2020.fiscal 2022.Stock SplitOn November 1, 2020, the Company effected a 2-for-1 stock split of its capital stock. All of the share and per share information referenced throughout the consolidated financial statements and notes to the consolidated financial statements have been retroactively adjusted to reflect this stock split.discount rates used for operating leases, the fair value of share-based awards, software development costs, the estimated period of benefit of deferred contract acquisition costs, the fair value of share-based awards, capitalization of software development costs, discount rates used to measure operating leases, valuation of acquired intangible assets and accounting for income taxes, includinggoodwill, and the valuation allowance on deferred tax assetsCOVID-19The novel coronavirus, or COVID-19, pandemic has created, and may continue to create, significant uncertainty in macroeconomic conditions. The full extent to which the COVID-19 pandemic will directly or indirectly impact the global economy, the lasting social effects, and impact on the Company’s business, results of operations, and financial condition will depend on future developments that are highly uncertain and cannot be accurately predicted. As of the date of issuance of the consolidated financial statements, the Company is not aware of any specific event or circumstance related to COVID-19 that would require it to update its estimates or judgments or adjust the carrying value of its assets or liabilities. Actual results could differ from those estimates and any such differences may be material to the consolidated financial statements. As events continue to evolve and additional information becomes available, the Company’s estimates and assumptions may change materially in future periods. Cash and cash equivalents are recorded at cost, which approximates fair value.Restricted CashRestricted cash constitutes letters of credit established according to the requirements under certain non-cancellable operating lease agreements and is included in other assets, non-current in the consolidated balance sheets. As of January 31, 2022, January 31, 2021, and January 31, 2020, the Company maintained $1.8 million, $1.8 million, and $1.8 million in restricted cash, respectively.81The following table provides a reconciliation of cash, cash equivalents, and restricted cash reported within the consolidated balance sheets that sum to the total of the same such amounts shown in the consolidated statements of cash flows (in thousands):Year Ended January 31, 2024 2023 2022 Beginning balance $ 13 $ 20 $ 36 Bad debt expense — — 14 Write-offs, net of recoveries (13) (7) (30) Ending balance $ — $ 13 $ 20 short-term investments, and trade accounts receivable. Although the Company deposits its cash with multiple financial institutions, the deposits, at times, may exceed federally insured limits. The Company invests its excess cash in highly-rated money market funds. The Company extends credit to customerscustomers in the normal course of business. The Company monitors for uncollectible accounts on an ongoing basis. There were 0no customers that individually exceeded 10% of the Company’s revenue for fiscal 2022, 2021,2024, fiscal 2023, and 2020. fiscal 2022.20222024 and 2021, 02023, one cloud service provider marketplace represented 20% and 11%, respectively, of accounts receivable, net. As of January 31, 2023, one customer represented 11%, of accounts receivable, net and no customer represented 10% or more of accounts receivable, net.net as of January 31, 2024.years.years. Leasehold improvements are amortized using the straight-line method over the shorter of the estimated useful lives of the respective assets or the lease term. Expenditures for maintenance and repairs are expensed as incurred and significant improvements and bettermentsbetterment that substantially enhance the life of an asset are capitalized.services.82 Licensesandthat provide the customer with a right to use the software for a fixed term commencing upon delivery to the customer.customer, bundled with support and maintenance for the term of the license period. Support and maintenance revenue (collectively referred to as Support Revenue in the consolidated statements of operations) are bundled withnot sold on a stand-alone basis. Our self-managed Subscription Revenue is disaggregated into License Revenue and Support Revenue in the consolidated statement of operations. The Company does not have observable standalone sales to determine the Standalone Selling Price, or SSP, for its licenses or its support as they are not sold separately. The Company developed a model to estimate relative SSP for each license subscription forperformance obligation using an “expected cost-plus margin” approach. This model uses observable data points to develop the termmain assumptions including the estimated useful life of the license period. intellectual property and appropriate margins.the Company’sour cloud solutions, which include related customer support.services.services and other revenue. Professional services and other revenue consists of revenue from professional services, and training services, which were generallyare predominantly sold on a timefixed-fee basis and materials basis priorany other services provided to fiscal 2021. Commencing in fiscal 2021 the Company began to sellour customers. Revenue for professional services, ontraining services and other is recognized as these services are delivered. Professional services are services utilized by some of our self-managed customers to accelerate the deployment of our products.fixed fee basis.(i) identification of the contract with a customer;(ii) determination of whether the promised goods or services are performance obligations;(iii) measurement of the transaction price;(iv) allocation of the transaction price to the performance obligations; and83(v) recognition of revenue when the Company satisfies each performance obligation.training servicesother is recognized as these services are delivered. Professional services and other are services utilized by some self-managed customers to accelerate the deployment of the Company’s products.Support and maintenance revenue and cloud-hosted services make up the majority of our revenue and are typically recognized ratably over the terms of our subscription contracts. Therefore, a substantial portion of the revenue reported in each period is attributable to the recognition of deferred revenue relating to agreements entered into during previous periods. Consequently, increases or decreases in new sales or renewals in any one period may not be immediately reflected as revenue for that period. Any downturn in sales, however, may negatively affect revenue in future periods. Accordingly, the effect of downturns in sales and market acceptance of the Company’s products, and potential changes in the Company’s rate of renewals, may not be fully reflected in the Company’s results of operations until future periods.years.years. Customers are typically invoiced annually in advance and, to a lesser extent, multiple years in advance.84$2.9$3.8 million and $1.3$4.9 million as of January 31, 20222024 and January 31, 2021,2023, respectively, and are included in accounts receivable, net in the consolidated balance sheets. Lease terms may include options to extend or terminate the lease when it is reasonably certain that the Company will exercise that option. Lease expense for minimum lease payments is recognized on a straight-line basis over the lease term. The Company accounts for lease components and non-lease components as a single lease component. The Company applies the practical expedient to not recognize lease assets and lease liabilities for leases with an original term of 12 months or less.within the currency in which the arrangement is denominated over a similar term.85Deferred Offering CostsDeferred offering costs consist of direct incremental legal, accounting, consulting, and other fees related to the Company’s IPO which were included in other assets, non-current before the IPO. Upon consummation of the IPO in December 2021, $6.0 million of deferred offering costs were reclassified to stockholders' equity (deficit) and recorded against the proceeds from the offering.2022, 2021,2024, fiscal 2023 and 2020.fiscal 2022. All software development costs have been charged to research and development expense in the consolidated statements of operations as incurred.NaN amounts were capitalized for fiscal 2020 as internal-use software costs were immaterial. The Company capitalized $9.9 million and $2.9 million, in internal-use software for fiscal 2022 and 2021, respectively. Amortization expense was $1.4 million and de minimis for fiscal 2022 and 2021, respectively. There was 0 amortization expense for fiscal 2020.86andwhen incurred, are included in sales and marketing expense in the consolidated statements of operations, when incurred,and were $6.3$15.4 million, $2.2$11.1 million, and $2.6$6.3 million for fiscal 2024, fiscal 2023, and fiscal 2022, 2021, and 2020, respectively.appraisals.appraisals, as considered necessary. For the fiscal years presented, there were no impairment losses recognized for any long-lived assets.was has been no such adjustment as of January 31, 2024.fiscal 2022, 2021,which the hedged transaction2020.does not exclude any component of the changes in fair value of the derivative instruments for effectiveness testing purposes. The Company classifies cash flows related to its cash flow hedges as operating activities in its consolidated statements of cash flows. restricted stock awards ("RSA"), restricted stock units ("RSU") and ESPP participation). For awards with a service-based vesting condition, the related stock-based compensation expense is recognized over the vesting period of the entire award using the straight-line attribution method. For awards that include both a performance and service condition, the Company amortizes stock-based compensation expense on a graded vesting basis over the vesting period, after assessing the probability of achieving requisite performance. The Company recognizes forfeitures as they occur.The Company selected the Black-Scholes option-pricing model as the method for determining the estimated fair value for stock options. The Black-Scholes option-pricing model requires the use of management assumptions, which determine the fair value of stock-based awards, including the fair value of common stock, the option’s expected term, and the price volatility of the underlying stock. RSA and RSU award is based on the fair value of the underlying common stock as of the grant date. each option and stock purchase right granted under the ESPP is estimated on the grant date using the Black-Scholes option pricing model. The Black-Scholes option pricing model requires the input of highly subjective assumptions, including the fair value of the underlying common stock, the expected term of the award, the expected volatility of the price of our common stock, risk-free interest rates, and the expected dividend yield of our common stock. We account for forfeitures as they occur instead of estimating the number of awards expected to be forfeited.computescalculates basic net loss per share using the two-class method required for participating securities. The two-class method requires income available to common stockholders for the period to be allocated between common stock and participating securities based upon their respective rights to receive dividends as if all income for the period had been distributed. The Company considers convertible redeemable preferred stock and unvested common stock, which includes early exercised stock options, to be participating securities as holders of such securities have non-forfeitable dividend rights in the event of the declaration of a dividend for shares of common stock. These participating securities do not contractually require the holders of such shares to participate in the Company’s losses. As such, net loss for the periods presented was not allocated to participating securities.Basic and diluted net loss per share is calculated by dividing net loss attributable to common stockholders by the weighted-average number of shares of common stock outstanding. Net loss is allocated based on the weighted-average shares outstanding for each class of common stock. As the Company has net losses for the periods presented, all potentially dilutive common stock, which are comprised of convertible redeemable preferred stock, stock options, RSUs, and early exercised options, and ESPP rights, are anti-dilutive. Diluted net loss per share is calculated by giving effect to all potentially dilutive securities87LossComprehensive loss consists ofGain (Loss)net loss. Other comprehensive loss refersunrealized losses related to revenue, expenses, gains and losses that are recordedthe effective portion of changes in the fair value of foreign currency forward contracts designated as an element of stockholders’ deficit but are excluded from net loss. The Company did not have any other comprehensive loss transactions during the period presented. Accordingly, comprehensive loss is equal to net loss.cash flow hedges.1one operating and 1one reportable segment. Substantially all of the Company’s long-lived assets were held in the United States as of January 31, 20222024 and 2021.2023. The Company presents revenue by region in Note 35 to the consolidated financial statements.20222024 and 2021,2023, the Company has recorded a full valuation allowance against its net U.S. federal and state deferred tax assets.Company recognizesCompany’s policy is to recognize interest and penalties related to incomeassociated with uncertain tax mattersbenefits as a componentpart of the income tax provision and include accrued interest and penalties with the related income tax liability on the Company’s consolidated balance sheets. To date, the Company has not recognized any interest and penalties in its consolidated statements of operations, nor has it accrued for or made payments for interest and penalties.Fairaccounting is applied for all assets and liabilities. Fair value is defined as the price that would be received to sell an asset or paid to transfer a liability in an orderly transaction between market participants at the measurement date. The Company follows the established framework for measuringwhich approximates fair value in accordance with GAAP.due to the short time to the expected receipt or payment date. See "Note 7. Fair Value Measurements" for additional information.0no employer contributions under this plan to date.88Recent Accounting Pronouncements AdoptedIn December 2019, the FASB issued ASU 2019-12, Income Taxes (Topic 740): Simplifying the Accounting for Income Taxes, which modifies and eliminates certain exceptions to the general principles of ASC 740, Income taxes. For public entities, this ASU is effective for interim and annual periods beginning after December 15, 2020. The Company adopted this guidance in the first quarter of fiscal 2022, and the impact of this ASU on its consolidated financial statements was not material as the Company records a full valuation allowance on its U.S. deferred tax assets.March 2020,November 2023, the FASBFinancial Accounting Standards Board (the "FASB") issued ASU 2020-04, Reference Rate Reform—Facilitation of the Effects of Reference Rate Reform on FinancialAccounting Standards Update ("ASU") 2023-07, Segment Reporting (Topic 848),280): Improvements to Reportable Segment Disclosures, which provides temporary optional expedients and exceptionsis intended to improve reportable segment disclosure requirements, primarily through enhanced disclosures about significant expenses. The amendments will require public entities to disclose significant segment expenses that are regularly provided to the GAAP guidance on contract modificationschief operating decision maker and hedge accountingincluded within segment profit and loss. The amendments are effective for the Company's annual periods beginning January 31, 2024, and interim periods beginning April 30, 2025, with early adoption permitted, and will be applied retrospectively to easeall prior periods presented in the financial reporting burdens of the expected market transition from LIBOR and other interbank offered rates to alternative reference rates such as the Secured Overnight Financing Rate, or SOFR. This guidance is effective upon issuance and generally can be applied through the end of calendar year 2022. The Company will adopt this guidance in fiscal 2023.statements. The Company is currently evaluating the ASU to determine its impact on the Company’s disclosures.applicabilitydisaggregation of this new standard. rate reconciliation categories and income taxes paid by jurisdiction. The amendments are effective for the Company’s annual periods beginning January 31, 2025, with early adoption permitted, and should be applied either prospectively or retrospectively. The Company is currently evaluating the ASU to determine its impact on the Company’s disclosures.Net liabilities $ (224) Developed technology 12,500 Customer relationship 1,000 Deferred tax liabilities (482) Goodwill 12,265 Total purchase consideration $ 25,059 Balance as of January 31, 2023 $ — BluBracket, Inc. (Note 3) 12,265 Less: Measurement period adjustment (68) Balance as of January 31, 2024 $ 12,197 Gross Carrying Amount Accumulated Amortization Net Carrying Amount Weighted Average Remaining Useful Life
(in years)Developed technology $ 12,500 $ 1,668 $ 10,832 4.3 Customer relationship $ 1,000 $ 221 $ 779 2.3 Year ending January 31, Amount 2025 $ 2,833 2026 2,833 2027 2,612 2028 2,500 2029 and thereafter 833 Total $ 11,611 revenue
Revenue
RevenueYear Ended January 31, 2024 2023 2022 Amount % of Total
RevenueAmount % of Total
RevenueAmount % of Total
RevenueLicense $ 67,612 12 % $ 64,273 14 % $ 47,504 15 % Support 420,948 72 349,855 73 247,566 77 Cloud-hosted services 76,086 13 46,860 10 18,613 6 Total subscription revenue 564,646 97 460,988 97 313,683 98 Professional services and other 18,491 3 14,901 3 7,086 2 Total revenue $ 583,137 100 % $ 475,889 100 % $ 320,769 100 % CompanyCompany's products and services (dollars in thousands)(in thousands, except percentages):
RevenueYear Ended January 31, 2024 2023 2022 Amount % of Total Revenue Amount % of Total Revenue Amount % of Total Revenue United States $ 408,211 70 % $ 345,973 73 % $ 235,428 73 % Rest of the world 174,926 30 129,916 27 85,341 27 Total $ 583,137 100 % $ 475,889 100 % $ 320,769 100 % BalanceBalancesYear Ended January 31, 2024 2023 2022 Balance, beginning of period $ 302,244 $ 223,289 $ 147,297 Deferred revenue billings including reclassification to deferred revenue from customer deposits 643,541 552,799 395,153 Recognition of revenue, net of change in unbilled accounts receivable* (584,232) (473,844) (319,161) Balance, end of period $ 361,553 $ 302,244 $ 223,289 * Reconciliation to Revenue Reported per Consolidated Statements of Operations: Revenue billed as of the end of the period $ 584,232 $ 473,844 $ 319,161 Increase in total unbilled accounts receivable (1,095) 2,045 1,608 Revenue reported per Consolidated Statements of Operations $ 583,137 $ 475,889 $ 320,769 years.years. RPOs include both deferred revenue and non-cancelable contracted amounts that will be invoiced and recognized as revenue in future periods. As of January 31, 20222024 and 2021,2023, the Company had $428.8$775.8 million, and $263.9$647.1 million, respectively, of remaining performance20222024 and January 31, 2021,2023, the Company expected to recognize approximately 63%59% and 63%58%, respectively, of its remaining performance obligations as revenue over the next 12 months and the remainder thereafter.daysdays' written notice. The customer deposit balance is amortized to revenue over the term of the underlying contract as the customer’s right to cancel expires. If no contracts with customers are cancelled, the existing customer deposit balance will be recognized to revenue over the remaining stated term of the underlying contract which may be over the next 12 months or longer as follows (in thousands):As of January 31, 2024 2023 Within the next 12 months $ 22,882 $ 22,657 After the next 12 months 2,745 4,042 Total $ 25,627 $ 26,699 As of January 31, 2024 Amortized Cost Unrealized Gains Unrealized Losses Fair Value U.S. treasury securities $ 244,778 $ 150 $ (141) $ 244,787 U.S. agency obligations 79,693 50 (23) 79,720 Corporate notes and bonds 103,552 141 (70) 103,623 Commercial paper 46,523 — — 46,523 Certificates of deposit 40,510 — — 40,510 Total short-term investments $ 515,056 $ 341 $ (234) $ 515,163 4.As of January 31, 2024 Amortized Cost Fair Value Due within one year $ 447,001 $ 446,902 Due after one year through five years 68,055 68,261 Total $ 515,056 $ 515,163 • Level 1—Inputs are quoted prices (unadjusted) in active markets for identical assets or liabilities that the Company has the ability to access at the measurement date.usingand indicates the above input categoriesfair value hierarchy of the valuation inputs used to determine such fair value (in thousands):Fair Value Measurement As of January 31, 2024 Fair Value Level Amortized Cost Gross Unrealized Gains Gross Unrealized Losses Estimated Fair Value Assets: Cash and cash equivalents: Money market funds Level 1 $ 63,137 $ — $ — $ 63,137 U.S. treasury securities Level 2 9,495 — — 9,495 Commercial paper Level 2 10,981 — — 10,981 Total assets measured at fair value included in cash and cash equivalents $ 83,613 $ — $ — $ 83,613 Short-term Investments: U.S. treasury securities Level 2 $ 244,778 150 (141) $ 244,787 U.S. agency obligations Level 2 79,693 50 (23) 79,720 Corporate notes and bonds Level 2 103,552 141 (70) 103,623 Commercial paper Level 2 46,523 — — 46,523 Certificates of deposit Level 2 40,510 — — 40,510 Total short-term investments $ 515,056 $ 341 $ (234) $ 515,163 Derivative instruments: Foreign currency forward contracts Level 2 — — 18 18 Total assets measured at fair value $ 598,669 $ 341 $ (216) $ 598,794 Liabilities: Derivative instruments: Foreign currency forward contracts Level 2 $ — $ — $ 518 $ 518 Total derivative instruments — — 518 518 Total liabilities measured at fair value $ — $ — $ 518 $ 518 91Fair Value Measurement As of January 31, 2023 Fair Value Level Amortized Cost Gross Unrealized Gains Gross Unrealized Losses Estimated Fair Value Assets: Cash and cash equivalents: Money market funds Level 1 $ 169,904 $ — $ — $ 169,904 Total cash and cash equivalents 169,904 — — 169,904 Total assets measured at fair value $ 169,904 — — $ 169,904 20222024 and January 31, 2021,2023, do not include any nonrecurring fair value measurements relating to assets or liabilities. There were 0no transfers between fair value measurement levels during the year ended January 31, 2022. During2024 and January 31, 2023.Balance Sheet Location As of January 31, 2024 Derivative Assets: Foreign currency forward contracts designated as hedging instruments Prepaid expenses and other current assets $ 18 Total derivative assets 18 Derivative Liabilities: Foreign currency forward contracts designated as hedging instruments Accrued expenses and other liabilities $ 518 Total derivative liabilities $ 518 Year Ended January 31, 2024 Beginning balance $ — Net losses recognized in other comprehensive income (754) Net gains reclassified from AOCI to earnings 254 Ending balance $ (500) 2021, the certificates of deposit matured and the Company transferred $30.0 million to cash and cash equivalents in the consolidated balance sheets.2024.5.Estimated
Useful lifeAs of January 31, 2024 2023 Furniture and fixtures 5 years $ 1,394 $ 1,292 Computers, equipment and software 3 years 684 581 Capitalized internal-use software development costs 5 years 41,934 25,817 Leasehold improvements Shorter of useful life or lease term 5,725 5,138 — 47 Total property and equipment 49,737 32,875 Less: accumulated depreciation and amortization (15,804) (8,281) Property and equipment, net $ 33,933 $ 24,594 2021, and 2020 was $2.5$7.6 million, $0.9$4.5 million, and $0.2$2.5 million, respectively.As of January 31, 2024 2023 Acquisition holdback, current $ 3,554 $ — Accrued expenses 1,969 3,552 Customer overpayment 2,058 670 Sales tax payable 1,841 1,480 Accrued income taxes payable 1,178 1,081 Derivative liabilities 518 — Total accrued expenses and other current liabilities $ 11,118 $ 6,783 As of January 31, 2024 2023 Accrued commissions $ 15,366 $ 16,932 Accrued bonus 4,028 3,220 Accrued vacation 21,446 20,614 Accrued payroll and withholding taxes 8,911 11,574 ESPP employee contributions 3,293 4,247 Other 2,963 2,041 Total accrued compensation and benefits $ 56,007 $ 58,628 92Year Ended January 31, 2024 2023 2022 Beginning balance $ 124,098 $ 89,331 $ 50,245 Capitalization of contract acquisition costs 60,754 78,146 64,834 Amortization of deferred contract acquisition costs (54,512) (43,379) (25,748) Ending balance $ 130,340 $ 124,098 $ 89,331 Deferred contract acquisition costs, current $ 50,285 $ 42,812 $ 32,205 Deferred contract acquisition costs, non-current 80,055 81,286 57,126 Total deferred contract acquisition costs $ 130,340 $ 124,098 $ 89,331 0no impairment losses recognized for deferred contract acquisition costs during fiscal 2022, 2021,2024, fiscal 2023, and 2020.936. Credit FacilityOn November 23, 2020, the Company entered into a loan and security agreement with HSBC Ventures USA Inc., or the Loan Agreement. This Loan Agreement provides the Company a revolving line of credit, which expires on November 23, 2023. Under the Loan Agreement, the Company is able to borrow up to $50.0 million. Interest on any drawdown under the revolving line of credit accrues at the adjusted LIBOR rate plus 3.00%. The Company also incurs a commitment fee of 0.30% for any unused portion of the credit facility. As of January 31, 2022 and 2021, the Company had 0 balance outstanding under the Loan Agreement. The Loan Agreement includes customary restrictive covenants and in the event the Company borrows amounts under the agreement, the Company will become subject to a number of covenants that may limit the Company’s ability to, among other things, transfer or dispose of assets, pay dividends or make distributions, incur additional indebtedness, create liens, make investments, loans and acquisitions, engage in transactions with affiliates, merge or consolidate with other companies, and sell substantially all of the Company’s assets. The Company is in compliance with all covenants as of January 31,fiscal 2022.7.noncancelablenon-cancelable operating lease agreements, which expire at various dates through 2027.2029. The Company is required to pay property taxes, insurance, and normal maintenance costs for certain of these facilities. Operating lease cost for these leases is recognized on a straight-line basis over the lease term, with variable lease costs recognized in the period incurred. These lease agreements do not contain residual value guarantees or restrictive covenants.In September 2021, the Company entered into a sublessee agreement with a minimum lease commitment of $2.1 million over 3.5 years.Year Ended January 31, 2024 2023 2022 Short-term lease costs $ 654 $ 320 $ 333 Operating lease costs 3,647 3,512 3,106 Total lease costs $ 4,301 $ 3,832 $ 3,439 The variablesignificantmaterial for the years ended January 31, 2022, 2021,2024, 2023, and 2020.2022. There were no other lease components for the periods presented.As of January 31, 2024 2023 2022 Weighted average remaining lease terms (in years) 3.4 4.2 5.1 Weighted average discount rate 5.0 % 3.8 % 3.8 % noncancelablenon-cancelable operating leases on an undiscounted cash flow basis as of January 31, 20222024 are as follows (in thousands):Years Ending January 31, 2025 $ 4,646 2026 4,256 2027 4,285 2028 1,852 2029 447 Total minimum lease payments 15,486 Less imputed interest (1,453) Present value of future minimum lease payments 14,033 Less current lease liabilities (4,025) Operating lease liabilities, non-current $ 10,008 948.There were no operating right-of-use asset impairment losses in fiscal 2024, fiscal 2023 and fiscal 2022.Thehashad one letter of credit outstanding which is not material. As of January 31, 2023 the Company had a total of $1.8$1.8 million in letters of credit outstanding as security deposits for the Company’s leased office spaces as of January 31, 2022 and 2021.2022,2024, the Company had outstanding non-cancelable office lease, hosting infrastructure commitments, and other commitments with a remaining term of 12 months or longer as follows (in thousands):Years Ending January 31, Hosting Infrastructure Commitments Other Commitments Total 2025 $ 7,093 $ 10,496 $ 17,589 2026 2,907 1,329 4,236 2027 — 231 231 Total $ 10,000 $ 12,056 $ 22,056
Lease
Payments
Infrastructure
Commitments
CommitmentsLitigation20222024 and 2021.2023.959.Redeemable Convertible Preferred StockIn March 2020, the Company entered into a Series E redeemable convertible preferred stock purchase agreement, which provided for the sale and issuance of up to 6,051,132 shares of Series E redeemable convertible preferred stock at a price of $28.9202 per share. The Company sold 6,051,132 shares of Series E redeemable convertible preferred stock for total gross proceeds of $175.0 million and included related issuance costs of $0.3 million.Upon completion of the IPO in December 2021, all of the Company's redeemable convertible preferred stock outstanding, totaling 94,127,984 shares, were automatically converted into an equivalent number of class B common stock on a one-to-one basis and their carrying value of $349.1 million was reclassified into stockholders’ equity (deficit). As of January 31, 2022, there were 0 shares of redeemable convertible preferred stock issued and outstanding.Redeemable convertible preferred stock consisted of the following as of January 31, 2021 (in thousands except share and per share data):The holders of Series Seed, Series A, Series B, Series C, Series D, and Series E redeemable convertible preferred stock had various rights and preferences as follows:VotingEach share of redeemable convertible preferred stock had voting rights equal to an equivalent number of shares of common stock into which it is convertible and votes together as one class with the common stock, except as below:As long as at least 9,000,000 shares (as adjusted for stock splits, stock dividends, reclassification and the like) of preferred stock were outstanding, holders of Series Seed, Series A, Series B, Series C, Series D, and Series E preferred stock, voting together as a single class on an as-converted basis, were entitled to certain protective provisions which required a majority of holders of preferred stock to approve, among other actions, a liquidation event, an amendment, waiver, or repeal of provisions of the Company’s Certificate of Incorporation or Bylaws, a change to the number of authorized directors of the Company, and a declaration or payment of a dividend with respect to any shares of the Company.As long as at least 6,750,000 shares (as adjusted for stock splits, stock dividends, reclassification and the like) of Series A preferred stock were outstanding, the holders of a majority of such then-outstanding shares of Series A preferred stock, voting together as a separate series, were entitled to elect one member of the board of directors.As long as at least 3,945,670 shares (as adjusted for stock splits, stock dividends, reclassification and the like) of Series B preferred stock were outstanding, the holders of a majority of such then-outstanding shares of Series B preferred stock, voting together as a separate series, were entitled to elect one member of the board of directors.Holders of common stock, voting as a separate class, were entitled to elect three members to the board of directors.96DividendsEach holder of Series Seed, Series A, Series B, Series C, Series D, and Series E redeemable convertible preferred stock were entitled to receive, out of any funds legally available, noncumulative dividends at the rate of $0.005323335, $0.034612335, $0.055757335, $0.253448000, $0.886668, and $2.3136 per share, respectively, per annum, payable in preference and priority to any payment of any dividends on common stock when and as declared by the board of directors. After payment of such dividends, any additional dividends or distributions were to be distributed among all holders of common stock and preferred stock in proportion to the number of shares of common stock that would be held by each such holder if all shares of preferred stock were converted to common stock at the then-effective conversion rate. NaN dividends were ever declared or paid.Liquidation PreferenceIn the event of any liquidation, dissolution, or winding-up of the Company, the holders of preferred stock were entitled to receive, prior and in preference to any distribution of the assets or funds of the Company to the holders of the common stock, an amount equal to the issuance price per share of $0.0665335, $0.4326665, $0.6969665, $3.1681, $11.08335, and $28.92015 for Series Seed, Series A, Series B, Series C, Series D, and Series E redeemable convertible preferred stock, respectively, as adjusted for stock splits, stock dividends, combinations, recapitalizations, and similar transactions, plus any declared but unpaid dividends, or the Liquidation Preference. If the Company had insufficient assets to permit payment of the Liquidation Preference in full to all holders of preferred stock, then the assets of the Company were to be distributed ratably to the holders of preferred stock in proportion to the Liquidation Preference such holders would otherwise be entitled to receive.After payment of the Liquidation Preference to the holders of preferred stock, the remaining assets of the Company were to be distributed ratably to the holders of common stock. If the holders of preferred stock would have been entitled to a larger distribution had they converted their shares to common stock, then the preferred stock was to be deemed to have converted to common stock.RedemptionSeries Seed, Series A, Series B, Series C, Series D, and Series E convertible preferred stock did not have mandatory redemption provisions.ConversionEach share of preferred stock is convertible, at the option of its holder, into the number of fully paid and non-assessable shares of common stock at the applicable conversion price per share on the date that the share certificate was surrendered for conversion. As of January 31, 2021, the conversion prices per share for all shares of preferred stock were equal to the original issue prices, and the rate at which each share converted into common stock was one-for-one. As discussed above, upon completion of the IPO, all outstanding shares of convertible preferred stock were automatically converted to common stock.Antidilution ProtectionsSeries Seed, Series A, Series B, Series C, Series D, and Series E redeemable convertible preferred stock had antidilution protection. If the antidilution protection for the preferred stock was triggered, the conversion price would be subject to a broad-based weighted-average adjustment to reduce dilution.Classification of Redeemable Convertible Preferred StockAlthough the Company’s redeemable convertible preferred stock was not mandatorily redeemable, it was classified outside of stockholders’ equity (deficit) because it was contingently redeemable upon certain events outside of the Company’s control. Accordingly, redeemable convertible preferred stock was presented outside of permanent equity in the mezzanine section of the consolidated balance sheets.9710.12. Common Stock and Stockholders' Equity (Deficit)Preferred StockIn connection with the IPO, the Company’s amended and restated certificate of incorporation became effective, which authorized the issuance of 100,000,000 shares of undesignated preferred stock with a par value of $0.000015 per share with rights and preferences, including voting rights, designated from time to time by the board of directors. Class B common stock. In connection with the IPO, the Company’s amended and restated certificate of incorporation authorized the issuance of 1,000,000,000 shares of Class A common stock and 200,000,000 shares of Class B common stock. The shares of Class A common stock and Class B common stock are identical, except with respect to voting, converting, and transfer rights. Each share of Class A common stock is entitled to one vote.vote. Each share of Class B common stock is entitled to ten votesvotes.. Class A and Class B common stock have a par value of $0.000015 per share, and are referred to as common stock throughout the notes to the consolidated financial statements, unless otherwise noted. Holders of common stock are entitled to receive any dividends as may be declared from time to time by the board of directors. Future transfers by holders of shares of Class B common stock will generally result in those shares converting to Class A common stock (including any Upon exercise, release, or transfer to a broker, equity plan administrator or other nominee, regardlessholders of whether there is a corresponding change in beneficial ownership), subjectshares of Class B common stock can convert Class B common stock to limited exceptions, including, but not limited to, certain transfers effected for estate planning purposes, and transfers among affiliates, to the extent the transferor continues to remain an affiliate.Class A common stock. Once converted or transferred and converted into Class A common stock, the Class B common stock may not be reissued. For the year ended January 31, 2024, a total of 27,223,638 shares of Class B common stock have been converted into Class A common stock.follows:follows (in thousands):As of January 31, 2024 2023 Options outstanding 6,364 9,315 Restricted stock units outstanding 12,067 11,588 Remaining shares available for future issuance under the 2021 Plan 24,956 21,466 2021 Employee Stock Purchase Plan 4,102 3,008 Total 47,489 45,377 Stock AwardsIn June 2014, the Company adopted the 2014 Stock Plan, or the 2014 Plan, pursuant to which the boarddirectors may grant incentive stock options to purchase29,058,446 shares of the Company’s Class A common stock nonstatutory stock options to purchase shares of the Company’s common stock, restricted stock awards, or RSAs, unrestricted stock awards, and98restricted stock units, or RSUs. As of January 31, 2022, the 2014 Plan was replaced byare available for issuance under the 2021 Equity Incentive Plan or the ("2021 Plan,Plan") and any remaining shares available for future issuance under the 2014 Plan were terminated.In November 2021, in connection with the IPO, the board of directors adopted, and the stockholders approved, the 2021 Plan as a successor to the 2014 Plan. Under the 2021 Plan:•18,330,000 shares of Class A common stock are reserved for future issuance, which includes certain RSUs issued prior to the IPO, as well as any automatic increases in the number of shares of Class A common stock reserved for future issuance under the 2021 Plan.•1,900,000 shares of Class A common stock are reserved for future issuance under the 2021 Employee Stock Purchase Plan, or the ESPP as well as any automatic increases in the number of sharesJanuary 31, 2024.•Any shares subject to stock options, RSUs or similar awards granted under the 2014 Plan that, on or after the date that the 2014 Plan is terminated, are cancelled, expire or otherwise terminate without having been exercised or issued in full, are tendered to or withheld by the Company for payment of an exercise price or for tax withholding obligations, or are forfeited to or repurchased by the Company due to failure to vest.The equity awards available for grant for the 2014 and 2021 Plans for the periods presented are as follows:4,721,200 shares were authorized under the 2014 Plan and 18,330,000 shares were authorized under the 2021 Plan for fiscal 2022.20142021 Plan (number of options outstanding and 2021 Plans (aggregate intrinsic value in thousands):The aggregate intrinsic value of options exercised represents the difference between the estimated fair value of common stock on the date of exercise and the exercise price of the options.are in thousands):Options Outstanding Weighted- Average Exercise
PriceBalance as of January 31, 2023 9,315 $ 1.92 4.6 $ 281,837 Stock options exercised (2,934) $ 2.05 $ 67,598 Stock options cancelled/forfeited/expired (17) $ 23.62 Balance as of January 31, 2024 6,364 $ 1.81 3.6 $ 127,898 Exercisable as of January 31, 2024 6,351 $ 1.75 3.6 $ 127,896 10,531,2676,350,960 shares that are vested and 5,250as of January 31, 2024. All shares with an early exercise provision that are unvestedhave fully vested as of January 31, 2024.2021 and 2020 were $18.46, $10.10, and $3.45$18.46 per share, respectively.$6.5$1.1 million, $10.5$4.6 million and $4.5$6.5 million during fiscal 2024, fiscal 2023 and fiscal 2022, 2021 and 2020, respectively.2021 and 2020 were $168.3$67.6 million, $81.5$94.1 million and $19.3$168.3 million, respectively.Early Exercise of Employee OptionsThe 2014 Plan allows for the early exercise of stock options for certain individuals as determined by the board of directors. The consideration received for the early exercise of an option is considered to be a deposit of the exercise price and the related dollar amount is recorded as a liability and reflected as accrued expenses and other current liabilities in the consolidated balance sheets. This liability is reclassified to additional paid-in capital and common stock as the awards vest. If a stock option is early exercised, the unvested shares may be repurchased by the Company in case of employment termination for any reason, including death and disability, at the price paid by the purchaser for such shares. In fiscal 2020 the Company issued 190,000 shares of common stock for total proceeds of $0.2 million and less than $0.1 million related to early exercised stock options. There were 0 early exercises in fiscal 2022 and 2021. There were 0 shares repurchased during any periods presented. As of January 31, 2022 and 2021, the number of shares of common stock subject to repurchase was 5,250 and 40,052 shares with an aggregate repurchase price of de minimis.CompanyCompany recognized a cumulative $190.5$190.5 million stock-based compensation expense related to the outstanding RSUs through January 31, 2022, inclusive of the RSU modifications discussed below.2022.follows:follows (shares in thousands):Number of Awards Weighted-Average Grant Date Fair
ValueOutstanding and unvested at January 31, 2023 11,588 $ 42.48 RSUs granted 8,524 $ 28.16 RSUs released (5,556) $ 38.28 RSUs cancelled (2,489) $ 36.70 Outstanding and unvested at January 31, 2024 12,067 $ 35.48 $71.1$212.7 million, $144.3 million, and $71.1 million during the year ended January 31, 2024, 2023 and 2022.Restricted Stock AwardsThe fair value of RSAs is estimated based on the fair value of the Company’s common stock on the date of grant. RSAs convert into common stock when they vest and settle.100In March 2021, the Company granted 5,314 shares of RSAs outside of the 2014 Stock Plan at a weighted-average grant date fair value of $28.94 to certain employees. In August 2021, the Company granted 5,250 shares of RSAs outside of the 2014 Stock Plan at a weighted-average grant date fair value of $47.07 to certain employees. Stock-based compensation related to RSAs was not material as of January 31, 2022.ModificationOn November 20, 2019, the Company amended the 2014 Stock Plan to restrict the ability of a successor entity in a change in control transaction to cancel unvested awards. The amendment modified 3,208,340 RSUs in which the Company have reassessed the original grant date fair value as of the modification date. The weighted-average grant date fair value before modification was $7.24 and after modification was $9.13. The Company recognized approximately $22.0 million of stock-based compensation expense during fiscal 2022, and will recognize an additional $1.6 million over the remaining life of such RSUs through the fiscal year ending January 31, 2024.In November 2021, the Company modified certain RSUs by adding a vesting acceleration condition in the event of employee termination upon a change in control. The amendment modified 414,632 RSUs in which the Company have reassessed the original grant date fair value as of the modification date. The weighted-average grant-date fair value before modification was $23.95 and after modification was $80.00. The Company recognized approximately $21.8 million of stock-based compensation expense during fiscal 2022, and will recognize an additional $11.3 million over the remaining life of such RSUs through the fiscal year ending January 31, 2025.2021 Employee Stock Purchase Plan ("ESPP"),ESPP, which became effective upon completion of the IPO. A total of 1,900,0004,102,133 and 3,007,528 shares of Class A common stock are available for sale under the ESPP. In addition, subjectESPP as of January 31, 2024 and January 31, 2023. For the year ended January 31, 2024, the Company recognized $13.1 million of stock-based compensation expense related to the adjustment provisions of the ESPP, the ESPP also provides for annual increases in the number of shares of Class A common stock that will be available for sale under the ESPP on the first day of each fiscal year beginning on the first day of fiscal 2023 and ending on (and inclusive of) the first day of fiscal 2032, equal to the least of:•5,700,000 shares of Class A common stock;•1% of the outstanding shares of all classes of common stock as of the last day of the immediately preceding fiscal year; or•such other amount as the administrator may determine as of no later than the last day or our immediately preceding fiscal year.The ESPP provides for consecutive offering periods that will typically have a duration of approximately 24 months in length and is comprised of 4 purchase periods of approximately six months in length. The offering periods are scheduled to start on the first trading day on or after June 15 and December 15 of each year. The first offering period commenced on December 23, 2021 and is scheduled to end on the first trading day on or after June 15, 2022.ESPP. As of January 31, 2022, 2024, unrecognized stock-based compensation expense related to the ESPP was approximately 0$18.9 million, which is expected to be recognized over a weighted-average period of approximately 1.9 years. The Company’s current offering period began December 15, 2023 and is expected to end December 15, 2025. have been issued under the ESPP.Under our current ESPP, Class A common stock will be purchased for the accounts of employees participating in the ESPP at a price per share equal to the lesser of (1) 85% of the fair market value of a share of our Class A common stock on the first date of an offering or (2) 85% of the fair market value of a share of our Class A common stock on the date of purchase. No employee may purchase shares under the ESPP at a ratepurchase price of $23.97 and $19.47 per share, resulting in excesstotal cash proceeds of $25,000 worth$10.2 million and $7.4 million. ESPP employee payroll contributions accrued as of our Class A common stock basedJanuary 31, 2024 and January 31, 2023 were $3.3 million and $4.2 million, respectively, and are reported within accrued compensation and benefits in the consolidated balance sheets. Payroll contributions accrued as of January 31, 2024 will be used to purchase shares at the end of the current purchase period ending on June 15, 2024. Payroll contributions ultimately used to purchase shares will be reclassified as stockholders’ equity on the fair market value per share of our Class A common stock at the beginning ofpurchase date.each calendar year such purchase rightas a modification to the original offering and resulted in incremental compensation cost of $4.9 million. Another ESPP rollover occurred when the Company’s closing stock price on December 15, 2022 was below the closing stock price on June 15, 2022, triggering a new 24-month offering period through December 15, 2024. This rollover was accounted for as a modification to the original offering and resulted in incremental compensation cost of $5.2 million. Subsequently, another ESPP rollover occurred when the Company's closing stock price on December 15, 2023 was below the closing stock price on June 15, 2023, triggering a new 24-month offering period through December 15, 2025 and resulting in incremental compensation cost of $10.9 million. The unrecognized compensation cost from the original offering plus the incremental compensation cost as a result of the modification is outstanding or 2,000 shares. The 2021 ESPP provides for, at maximum, 24 monthsrecognized over the requisite service period of the new 24-month offering periods with four offering dates, generally in June andthrough December of each year.15, 2025.withto determine fair value of the following assumptions:Company’s common shares to be issued under the ESPP for the offering periods beginning in December 2021:Year Ended January 31,2022 Expected term (in years)0.5 - 2.0 Expected volatility44.49% - 54.92% Risk-free interest rate0.16% - 0.68% Dividend yield0%Year Ended January 31, 2024 2023 Expected term (in years) 0.5 - 2.0 0.5 - 2.0 Expected volatility 44.49% - 83.80% 44.49% - 69.11% Risk-free interest rate 0.16% - 5.26% 0.16% - 4.64% Dividend yield 0% 0% There were no secondary transactions in fiscal 2022. In fiscal 2021 and 2020, the Company recorded $32.1 million and $1.5 million of stock-based compensation expense in the consolidated statements of operations associated with secondary stock purchase transactions, respectively. These transactions were executed among certain employees, non-employees, non-related investors and certain affiliated stockholders of the Company. The Company concluded that affiliated stockholders acquired shares from its employees at a price in excess of fair value. Accordingly, the Company recognized such excess value as stock-based compensation expense.Total stock-based compensation expense recognized in the Company’s consolidated statements of operations for these secondary transactions is as follows (in thousands):Year Ended January 31, Year Ended January 31, 2024 2024 2023 2022 Cost of professional services and other Stock-based compensation expenses, net of amounts capitalized Total stock-based compensation expense 102Total stock-based compensation expense recognized in the Company’s consolidated statements of operations exclusive of charges related to secondary sales is as follows (in thousands):20222024 and 2021,2023, total unrecognized stock-based compensation expense related to the RSUs was approximately $287.7$339.6 million and $136.0$352.2 million, respectively. This unrecognized stock-based compensation expense is expected to be recognized over a weighted-average period of approximately 2.52.7 years and 1.92.6 years, respectively.20222024, and 2021,2023, total unrecognized stock-based compensation expense related to outstanding unvested stock options for employees that are expected to vest was approximately $5.2$0.2 million and 10.3$1.3 million, respectively, which are expected to be recognized over a weighted-average period of approximately 1.61.0 year and 1.2 years, and 1.9 years, respectively.As of January 31, 2022, unrecognized stock-based compensation expense related to ESPP was approximately $21.1 million, which are expected to be recognized over a weighted-average period of approximately 1.9 years.Stock Option ValuationThe Company estimates the fair value of stock options to employees on the date of grant using the Black-Scholes option-pricing model. The Black-Scholes option-pricing model requires estimates of highly subjective assumptions, which greatly affect the fair value of each stock option. The assumptions used to estimate the fair value of stock options granted were as follows: `Fair Value of Common Stock—The fair value of the common stock underlying the Company’s stock options is determined by our board of directors. The board of directors, with input from management, exercises significant judgment and considers numerous objective and subjective factors to determine the fair value of common stock at each grant date.Expected Term—The expected term represents the period that the stock-based awards are expected to be outstanding. For option grants that are considered to be “plain vanilla,” the Company determines the expected term using the simplified method as provided by the Securities and Exchange Commission. The simplified method deems the term to be the average of the time-to-vesting and the contractual life of the options.Risk-Free Interest Rate—The risk-free interest rate is based on the U.S. Treasury yield curve in effect at the time of grant for zero-coupon U.S. Treasury notes with maturities approximately equal to the option’s expected term.Expected Volatility—Since the Company’s stock is not publicly traded, the expected volatility is based on the historical and implied volatility of similar companies whose stock or option prices are publicly available, after considering the industry, stage of life cycle, size, market capitalization, and financial leverage of the other companies.Dividend Rate—The expected dividend is assumed to be 0, as the Company has never paid dividends and has no current plans to do so.103There were 0 option grants to nonemployees and stock-based compensation was not significant for nonemployees during the years ended January 31, 2022, 2021, and 2020.11.share and per share data):Year Ended January 31, 2024 2023 2022 Numerator: Net loss $ (190,668) $ (274,298) $ (290,138) Denominator: Weighted-average shares used to compute net loss per share attributable to Class A and Class B common stockholders, basic and diluted 193,825 186,029 83,277 Net loss per share attributable to Class A and Class B common stockholders, basic and diluted $ (0.98) $ (1.47) $ (3.48) antidilutive:antidilutive (in thousands):Year Ended January 31, 2024 2023 2022 Stock awards 18,431 20,903 22,788 Share purchase rights under the ESPP 1,437 1,761 704 Class A and Class B common stock subject to repurchase — — 5 Total 19,868 22,664 23,497 12.14. Reduction In Workforce and Related ChargesYear Ended January 31, 2024 2023 2022 Domestic $ (198,734) $ (279,675) $ (294,299) International 9,105 6,390 5,147 Loss before income taxes $ (189,629) $ (273,285) $ (289,152) 104Year Ended January 31, 2024 2023 2022 Current provisions for income taxes: Federal $ 22 $ — $ — State 163 54 48 Foreign 1,326 1,118 1,125 Total current tax expense 1,511 1,172 1,173 Deferred tax expense: Federal (415) — — State — — — Foreign (57) (159) (187) Total deferred tax expense (472) (159) (187) Provision for income taxes $ 1,039 $ 1,013 $ 986 Year Ended January 31, 2024 2023 2022 U.S. federal tax benefit at statutory rate 21.0 % 21.0 % 21.0 % State income taxes, net of federal benefit 5.1 % 4.5 % 8.2 % Foreign earnings taxed at different rate 0.6 % 0.5 % 0.6 % Stock-based compensation (9.1) % (4.2) % 13.1 % Non-deductible expenses and other 1.1 % 1.2 % (0.7) % Research and development credits 6.6 % 4.6 % 2.9 % Change in valuation allowance, net (25.9) % (28.0) % (45.4) % Effective tax rate (0.6) % (0.4) % (0.3) % Year Ended January 31, 2024 2023 Deferred tax assets: Net operating losses $ 183,614 $ 172,911 Sec 174 Capitalization 86,649 58,099 Deferred revenue 17,595 9,679 Lease liability 3,004 3,909 Other accruals 5,517 5,030 Stock-based compensation 12,490 21,988 Credit carryforwards 58,054 39,697 Total deferred tax assets $ 366,923 $ 311,313 Due to its historyTable of operating losses, theContentsYear Ended January 31, 2024 2023 Deferred tax liabilities: Fixed assets $ (9,665) $ (5,064) Right-of-use asset (2,380) (3,171) Deferred commissions (32,379) (31,332) Total deferred tax liabilities $ (44,424) $ (39,567) Net deferred tax assets $ 322,499 $ 271,746 Valuation allowance (321,944) (271,244) Deferred tax assets, net of valuation allowance $ 555 $ 502 not recorded any income tax expense for the year ended January 31, 2022 except for $1.12024 in the amount of $1.0 million of tax expense for U.S. states as well as its foreign subsidiaries which are profitable as a result of intercompany compensation, immaterial state minimum taxes, and $0.1compensation. The Company also recorded income tax benefits of $0.4 million due to the acquisition of deferred tax benefits.BluBracket for the year ended January 31, 2024. Recognition of deferred tax assets is appropriate when realization of such assets is more likely than not. A valuation allowance has been provided by the Company against federal and state deferred tax assets. Overall, the valuation allowance increased by $131.4$50.7 million and $32.0$76.4 million for fiscal 20222024 and 2021,fiscal 2023, respectively.1052022,2024, the Company has U.S. federal and state net operating loss ("NOL") carryforwards of approximately $647.8$690.4 million and $498.3$602.2 million, respectively, which beginrespectively. The federal NOL does not expire since all balances relate to expire in 2034 and 2025 for federal andlosses incurred after January 1, 2018, whereas the state purposes, respectively.NOL will start expiring from 2026. The Company also has federal and state research credit carryforwards of $17.7$56.4 million and $6.6$19.7 million respectively. The federal tax credit carryforwards will begin to expire in 2033,2035, if not utilized. The state credit carryforwards have no expiration date.subject to incomefully offset with a valuation allowance.United States, California, and other various domestic and international jurisdictions. Carryover attributes beginning January 2016 remain open to adjustment byinvestments in foreign subsidiaries, as well as the U. S. and state authorities. The U.S., state, and foreign jurisdictions have statutesunrecognized deferred tax liability, are not material for the periods presented.Year Ended January 31, 2024 2023 2022 Unrecognized tax benefits as of the beginning of the year $ 10,402 $ 4,849 $ 1,730 Increases related to prior year tax provisions 868 1,333 475.00 Decrease related to prior year tax provisions — — — Increase related to current year tax provisions 4,063 4,220 2,644 Unrecognized tax benefits as of the end of the year $ 15,333 $ 10,402 $ 4,849 $4.8$15.3 million and $1.7$10.4 million, respectively, as of January 31, 20222024 and 20212023 which are attributable to federal and state research credits. These unrecognized tax benefits, if recognized, would not affect the effective tax rate and would be offset by the reversal of related deferred tax assets which are subject to a full valuation allowance. The Company has not accrued any interest or penalties.Recognition of the unrecognized tax benefits would not have an impact on the effective tax because they would be offset by the reversal of related deferred tax assets which are subject to a full valuation allowance. 13. Related Party TransactionsCertain membersThe Company’s policy is to recognize interest and penalties associated with uncertain tax benefits as part of the Company’s board of directors serveincome tax provision and include accrued interest and penalties with the related income tax liability on the boardCompany’s consolidated balance sheets. To date, the Company has not recognized any interest and penalties in its consolidated statements of directorsoperations, nor has it accrued for or made payments for interest and penalties. The Company is subject to income tax in the United States, certain states, and various foreign countries. Due to the history of and/or are executive officers of,net operating losses, the Company is subject to United States federal, state, and in some cases, are investors in, companies that are customers or vendors of the Company. Aggregate revenue from sales to these companies was $0.5 million, $0.4 million, and $0.2 millionlocal examinations by tax authorities for fiscal 2022, 2021, and 2020, respectively. There was $0.1 million of accounts receivable due from these companies asall years since incorporation. As of January 31, 2022 compared to $0.4 million as of January 31, 2021. An aggregate of $0.4 million, $0.1 million, and $0.2 million in expenses related to purchases from these companies was recorded during fiscal 2022, 2021 and 2020, respectively. There were $0.3 million accounts payable due to these companies as of January 31, 2022 compared to de minimis as of January 31, 2021.10614.25, 2022,20, 2024, which is the date the audited consolidated financial statements were available to be issued.2022, the number of shares reserved under the 2021 Plan and ESPP were increased by 9,108,328 and 1,821,665, respectively, pursuant to the annual evergreen increases under each such plan.In March 2022,2024, the Company granted RSUssigned an agreement with a cloud service provider. Under that agreement the Company has minimum spend commitments of $18.5 million in the 12 months ending February 2025, and $20.0 million in the 12 months ending February 2026, $22.5 million in the 12 months ending February 2027, $24.0 million in the 12 months ending February 2028, and $25.0 million in the 12 months ending February 2029.an aggregateup to $250.0 million of 702,526 shares ofthe Company's common stock to its employees with service-based conditions. stock.2022,2023, our disclosure controls and procedures were effective to provide reasonable assurance that the information required to be disclosed by us in this Annual Report on Form 10-K was (a) reported within the same periods specified by SEC rules and regulations and (b) communicated to our management, including our Chief Executive Officer and Chief Financial Officer, to allow timely decisions regarding any required disclosure.This Annual Report on Form 10-K does not include a reportOur management is responsible for establishing and maintaining adequate “internal control over financial reporting,” as defined in Rule 13a-15(f) and Rule 15d-15(f) under the Exchange Act. Our management conducted an evaluation of management's assessment regardingthe effectiveness of our internal control over financial reporting or an attestation reportas of January 31, 2024 based on the criteria established in Internal Control Integrated Framework (2013) issued by the Committee of Sponsoring Organizations of the Treadway Commission.due to a transition period established by the rulesas stated in its report which is included in Part II, Item 8 of SEC for newly public companies.None.20222024 annual general meeting of stockholders (the "Proxy Statement"), which will be filed with the SEC within 120 days after the end of our year ended January 31, 2022,2024, and is incorporated herein by reference.20222024 Proxy Statement and is incorporated herein by reference.20222024 Proxy Statement and is incorporated herein by reference.20222024 Proxy Statement and is incorporated herein by reference.20222024 Proxy Statement and is incorporated herein by reference.Exhibit
NumberDescription Form File No. Exhibit Filing Date 3.1 8-K 001-41121 3.1 12/13/2021 3.2 8-K 001-41121 3.1 02/29/2024 4.1 S-1 333-260757 4.1 11/04/2021 4.2 S-1/A 333-260757 4.2 11/17/2021 4.3 10-K 001-41121 4.3 03/25/2022 10.1+ S-1 333-260757 10.1 11/4/2021 10.2+ S-1 333-260757 10.2 11/4/2021 10.3+ S-1 333-260757 10.3 11/4/2021 10.4+ S-1 333-260757 10.4 11/4/2021 10.5+ S-1 333-260757 10.5 11/4/2021 10.6+ S-1 333-260757 10.6 11/4/2021 11110.7+ S-1 333-260757 10.7 11/4/2021 10.8+ S-1 333-260757 10.8 11/4/2021 10.9+ S-1 333-260757 10.9 11/4/2021 10.10+ 10-Q 001-41121 10.10 12/7/2023 10.11*+ 10.12+ S-1 333-260757 10.10 11/4/2021 10.13+ S-1/A 333-260757 10.10 11/17/2021 10.14+ 10-K 001-41121 10.12 3/27/2023 21.1* 23.1* 31.1* 31.2* 101.INS97.1*+101 The following financial information from HashiCorp, Inc.'s Annual Report on Form 10-K for the year ended January 31, 2024 formatted in Inline XBRL Instance Document(Extensible Business Reporting Language) includes: (i) the Consolidated Balance Sheets, (ii) the Consolidated Statements of Operations, (iii) the Consolidated Statements of Comprehensive Loss, (iv) the Consolidated Statements of Redeemable Convertible Preferred Stock and Stockholders’ Equity (Deficit), (v) the Consolidated Statements of Cash Flows, and (vi) Notes to the Consolidated Financial Statements.101.SCHInline XBRL Taxonomy Extension Schema Document101.CALInline XBRL Taxonomy Extension Calculation Linkbase Document101.DEFInline XBRL Taxonomy Extension Definition Linkbase Document101.LABInline XBRL Taxonomy Extension Label Linkbase Document101.PREInline XBRL Taxonomy Extension Presentation Linkbase Document25, 2022Signature Title Date SignatureTitleDate25, 202220, 202425, 202220, 2024Co-Founder, Chief Technology Officer and Director25, 202220, 2024/s/ Todd FordDirectorMarch, 25, 2022Todd Ford25, 202220, 2024/s/ Todd Ford Director March, 20, 2024 /s/ David Henshall March, 20, 2024 /s/ Glenn Solomon 25, 202220, 202425, 202220, 2024114