DOCUMENTS INCORPORATED BY REFERENCE
The information required to be furnished pursuant to Part III of this Form 10-K will be set forth in, and incorporated by reference from, the registrant’s definitive proxy statement for the annual meeting of stockholders (the “2022“2023 Proxy Statement”), which will be filed with the Securities and Exchange Commission not later than 120 days after the end of the fiscal year ended December 31, 2022.2023.
TABLE OF CONTENTS
|
|
| Page | |
| 3 | |||
|
|
|
|
|
|
|
| ||
|
|
|
|
|
Item 1. |
|
| 4 | |
|
|
|
|
|
Item 1A. |
|
|
| |
|
|
|
|
|
Item 1B. |
| 22 | ||
Item 1C. |
| 23 | ||
|
|
|
|
|
Item 2. |
|
| 24 | |
|
|
|
|
|
Item 3. |
|
| 26 | |
|
|
|
|
|
Item 4. |
|
| 26 | |
|
|
|
|
|
|
|
|
| |
|
|
|
|
|
Item 5. |
|
| 27 | |
|
|
|
|
|
Item 6. |
|
| 29 | |
|
|
|
|
|
Item 7. |
| Management’s Discussion and Analysis of Financial Condition and Results of Operations |
| 30 |
|
|
|
|
|
Item 7A. |
|
| 45 | |
|
|
|
|
|
Item 8. |
|
|
| |
|
|
|
|
|
Item 9. |
| Changes in and Disagreements with Accountants on Accounting and Financial Disclosure |
|
|
|
|
|
|
|
Item 9A. |
|
|
| |
|
|
|
|
|
Item 9B. |
|
|
| |
|
|
|
|
|
|
| |||
|
|
|
|
|
Item 10. |
|
|
| |
|
|
|
|
|
Item 11. |
|
|
| |
|
|
|
|
|
Item 12. |
| Security Ownership of Certain Beneficial Owners and Management and Related Stockholder Matters |
|
|
|
|
|
|
|
Item 13. |
| Certain Relationships and Related Transactions, and Director Independence |
|
|
|
|
|
|
|
Item 14. |
|
|
| |
|
|
|
|
|
PART IV |
|
| ||
|
|
|
|
|
Item 15. |
|
|
| |
|
|
|
|
|
|
| |||
2
SPECIAL NOTE REGARDING FORWARD-LOOKING STATEMENTS
This Annual Report contains “forward-looking statements.” Such statements can be identified by the use of forward-looking terminology such as “objectives,” “goals,” “preliminary,” “range,” “believes,” “expects,” “may,” “estimates,” “will,” “should,” “plans” or “anticipates” or the negative thereof or other variations thereon or comparable terminology, or by discussions of strategy. Readers are cautioned that any such forward-looking statements are not guarantees of future performance and may involve significant risks and uncertainties, and that actual results may vary materially from those anticipated or implied in the forward-looking statements as a result of various factors. Among the factors that significantly impact the metals distribution industry and our business are:
These risks and uncertainties could cause actual results to differ materially from those suggested by the forward-looking statements. Forward-looking statements should, therefore, be considered in light of various factors, including those set forth in this Annual Report under “Risk Factors” and the caption “Industry and Operating Trends” included in “Management’s Discussion and Analysis of Financial Condition and Results of Operations” and elsewhere in this Annual Report. Moreover, we caution you not to place undue reliance on these forward-looking statements, which speak only as of the date they were made. We do not undertake any obligation to revise or publicly release any revisions to these forward-looking statements to reflect events or circumstances after the date of this Annual Report or to reflect the occurrence of unanticipated events.
3
PART I
ITEM 1. BUSINESS.
Ryerson Holding Corporation (“Ryerson Holding”), a Delaware corporation, is the parent company of Joseph T. Ryerson & Son, Inc. (“JT Ryerson”), a Delaware corporation. Affiliates of Platinum Equity, LLC (“Platinum”) own approximately 15,924,4783,924,478 shares of our common stock, which is approximately 43%11.5% of our issued and outstanding common stock.
We are a leading value-added processor and distributor of industrial metals with operations in the United States ("U.S"U.S.") through JT Ryerson and other U.S. subsidiaries, in Canada through our indirect wholly-owned subsidiary Ryerson Canada, Inc., a Canadian corporation (“Ryerson Canada”), and in Mexico through our indirect wholly-owned subsidiary Ryerson Metals de Mexico, S. de R.L. de C.V., a Mexican corporation (“Ryerson Mexico”). In addition to our North American operations, we conduct metal processing and distribution operations in China through an indirect wholly-owned subsidiary, Ryerson China Limited, a Chinese limited liability company (“Ryerson China”). Unless the context indicates otherwise, Ryerson Holding, JT Ryerson, Ryerson Canada, Ryerson Mexico, and Ryerson China together with their subsidiaries, are collectively referred to herein as “Ryerson,” “we,” “us,” “our,” or the “Company.”
Our Company
We are one of the largest value-add processors and distributors of industrial metals in North America measured in terms of sales. We have approximately 4,2004,600 employees across 96110 facilities in North America and four facilities in China. Through this network we serve approximately 40,000 customers across a wide range of manufacturing end-markets. Our customers range from local, independently owned fabricators and machine shops to large, international original equipment manufacturers. We carry a full line of nearlyapproximately 75,000 products in stainless steel, aluminum, carbon steel, and alloy steels and a limited line of nickel and red metals in various shapes and forms. In addition to our metals products, we offer numerous value-added processing and fabrication services, and nearly 80% of the products we sell are processed to meet customer requirements.
Our business strategy includes providing a superior level of customer service and responsiveness, technical services, and inventory management solutions while maintaining low operating costs in order to maximize financial results. Our growth strategy is based on increasing our operating results through organic growth activities and strategic acquisitions.
To that end, we continue to focus on our interconnected network, systems, and enhancing our value-added services and online presence to provide increased access, functionality, and flexibility to our customers. We are using advanced analytics to improve pricing and inventory utilization. Our service centers are strategically located near our customers, which permits us to quickly process and deliver our products and services, often the day after receiving an order. We own, lease, or contract a fleet of tractors and trailers, allowing us to efficiently meet our customers’ delivery demands. Our range of products together with our breadth of services allows us to service a diverse customer base and to create long-term partnerships with our customers and enhances our profitability.
We focus on strategic acquisitions that complement and enhance our product, customer, and geographic diversification. Ryerson’s M&A strategy includes both transformative turnaround acquisitions and value-add, bolt-on acquisitions. Recently, Ryerson has focused on bolt-on acquisitions. In 2022,2023, Ryerson's larger acquisitions included Excelsior, Inc. (“Excelsior”)BLP Holdings, LLC, Norlen Incorporated, TSA Processing, and Howard Precision Metals, Inc. (“Howard”). Excelsior is a full-service fabrication and machining company based in Fresno, California with advanced processing capabilities including machining centers, laser and waterjet cutting, welding, and complex assemblies that are a value-add to Ryerson's processing capabilities. Howard, based in Milwaukee, Wisconsin, is one of the largest aluminum distributors in the Midwest, specializing in value-added processing services including high-quality precision-cut aluminum plate and saw-cut extruded aluminum bar distribution.Hudson Tool Steel Corporation. Please refer to the Section titled “Acquisitions” of Item 7, “Management’s Discussion and Analysis of Financial Conditions and Results of Operations,” and Note 2 — “Acquisitions” of Part II, Item 8 "Financial Statements and Supplementary Data" for further information regarding all acquisitions made in 2022.2023.
Industry Overview
Metals service centers serve as key intermediaries between metal producers and end users of metal products. They purchase in scale and sell in smaller quantities. End-users often look for “one-stop” suppliers that offer lower order volumes, shorter lead times, more reliable delivery, and processing services. Metal producers mainly sell metals in the form of standard-sized coils, sheets, plates, structurals, bars, and tubes in large quantities, with longer lead times, and limited inventory. Metal service centers serve as key intermediaries closing the gap between metal producers’ supply and end-users’ demand.
By aggregating end-users’ demand and purchasing metal in bulk to take advantage of economies of scale, metals service centers may purchase, process, and deliver metal to end‑users in a more efficient and cost‑effective manner than the end‑user may achieve by
4
dealing directly with the primary producer. Further, specialized metals processing equipment is costly and requires high‑volume production to be cost effective, and many customers are not able or willing to invest in the necessary technology, equipment, and warehousing of inventory to efficiently and effectively perform metal processing for their own operations. Due to this, many customers have reduced their in-house processing capabilities, opting to source processed metal from service centers like us. This
4
saves our customers time, labor, and expense, reducing their overall manufacturing costs, while permitting us to increasingly focus on value-added services and expanding our mix of fabrication products, which typically sell at higher margins. This supports our capital expenditures on processing equipment to grow annual gross profit margin.
Our industry is highly fragmented with the largest companies accounting for only a small percentage of total market share. The majority of metals services companies have limited product lines and inventories, with customers located in a specific geographic area. In general, competition is based on quality, service, price, and geographic proximity. We primarily compete with other metals service centers and to a lesser extent with metal producers.
The metals service center industry typically experiences cash flow trends that are counter-cyclical to the revenue and volume growth of the industry. During an industry downturn, companies generally reduce working capital assets and generate cash as inventory and accounts receivable balances decline, and as a result, operating cash flow and liquidity tend to increase during a downturn.
Competitive Strengths
Leading Market Position in North America.
Based on sales, we are one of the largest service center companies for carbon, stainless steel, and aluminum in the North American market where we have a broad geographic presence with 96110 facilities.
Our service centers are located near our customer locations, enabling us to timely deliver to customers across numerous geographic markets. Additionally, our widespread network of locations in the U.S., Canada, and Mexico helps us to utilize our expertise to efficiently serve customers with complex supply chain requirements across multiple manufacturing locations. We believe this is a key differentiator for customers who need a supplier that can reliably and consistently support them. Our ability to transfer inventory among our facilities better enables us to timely and profitably source and process specialized items at regional locations throughout our network than if we were required to maintain inventory of all products and specialized equipment at each location.
Broad Geographic Reach Across Attractive End Markets.
Our operations serve a diverse range of industries including commercial ground transportation, metal fabrication and machine shops, industrial machinery and equipment manufacturing, consumer durable equipment, HVAC manufacturing, construction equipment manufacturing, food processing and agricultural equipment manufacturing, and oil and gas. We believe this broad range of industries in which we sell our products and services reduces our risk related to a downturn in a specific industry. We believe that our ability to quickly adjust our offerings based on regional and industry specific trends creates stability while also providing the opportunity to access specific growth markets. We are focused on expanding our presence within growing, secular markets, including electric vehicles and renewable energy.
Established Platform for Organic and Acquisition Growth.
Our growth strategy is based on increasing our operating results through organic growth activities and strategic acquisitions that enhance our service, product, customer, and geographic diversification. Our strategies include investing in value-added processing capabilities, analytically targeting attractive customers and end markets with our supply chain optimization service model, industry consolidation through targeted M&A, and providing customers faster and easier solutions to their metal needs, which we believe will provide us with growth opportunities.
Given the highly fragmented nature of the metals service center industry, we believe there are numerous additional opportunities to acquire businesses and incorporate them into our existing infrastructure. When integrating acquired businesses into our operational model, we may draw on our large scale and geographic reach to improve operational and financial performance through greater purchasing power, improved expense and working capital management, increased access to additional end markets, and broadening product mix.
5
Lean Operating Structure Providing Operating Leverage.
We have demonstrated the ability to effectively manage expenses through tactical productivity and spending improvements. In a stronger demand environment for metals service centers characterized by increases in shipments and/or pricing, we believe that most additional expenses to service higher revenues and margin would come from leveraging economies of scale across our fixed expenses. In 2022, our warehousing, selling, general, and administrative expenses increased by $24.0 million compared to 2021, but decreased as a percentage of sales by 90 basis points, illustrating our ability to manage cost pressures and realize expense leverage.
Extensive Breadth of Products and Services for Diverse Customer Base.
We believe our broad product mix and marketing approach provides customers with a “one-stop shop” solution few other metals service center companies are able to offer. We provide a broad range of processing and fabrication services to meet the needs of our approximately 40,000 customers and typically fulfill more thanapproximately 1,000,000 orders per year. We provide supply chain solutions, including just-in-time delivery and value-added processing, to many original equipment manufacturing customers.
5
For the year ended December 31, 2022,2023, no single customer, including their subcontractors, accounted for more than 6%8% of our sales, and our top 10 customers, including their subcontractors accounted for less than 16% of our sales.
Strong Relationships with Suppliers.
We are among the largest purchasers of metals in North America and have long-term relationships with many of our North American suppliers. We believe we are frequently one of the largest customers of our suppliers and that concentrating our orders among a core group of suppliers is effective for obtaining favorable pricing and service. We believe we have the opportunity to further leverage this strength through continued focus on price and volume using an analytics-driven approach to procurement. In addition, we view our strategic suppliers as supply chain partners. We focus on logistics, lead times, rolling schedules, and scrap return programs to drive value-based buying that is advantageous for us. Metals producers worldwide are consolidating, and large, geographically diversified customers, such as Ryerson, are desirable partners for these larger suppliers. Our relationships with suppliers often provide us with access to metals when supply is constrained. Through our knowledge of the global metals marketplace and capabilities of specific mills, we believe we have developed an advantageous global purchasing strategy.
Experienced Management Team with Deep Industry Knowledge.
Our senior management team has extensive industry and operational experience and has been instrumental in optimizing and implementing our strategy. Our senior management has an average of more than 30 years of experience in the metals or service center industries. Our Chief Executive Officer (“CEO”) and President, Mr. Edward Lehner, who joined the Company in August 2012 as Chief Financial Officer (“CFO”) and became CEO in June 2015, has 3132 years of experience, predominantly in the metals industry. Mr. Mike Burbach, our Chief Operating Officer, has over 3940 years of experience with the Company and previously served as the President of the North-West Region of the Company. Mr. Jim Claussen, Executive Vice President & CFO, has 2829 years of industry experience.
Industry Outlook
The Institute for Supply Management’s Purchasing Managers’ Index (“PMI”) reported slowing growth for most of 2022contracting factory activity throughout 2023 with readings decreasing, yet still above 50%, indicating expansion in factory activity. This downwardconsistently below the growth threshold of 50. The contractionary trend continuedindicated by PMI began with readings turningdropping below 50%50 starting in November 2022 and continued intocontinuing through December of 2023, marking 14 consecutive months, with athe most recent reading of 47.4%47.4 for January.December 2023. The PMI measures the economic health of the manufacturing sector and is a composite index based on five indicators: new orders, inventory levels, production, supplier deliveries, and the employment environment. PMI readings can be a good indicator of industrial activity and general economic growth.
Additionally, theThe Department of Commerce announced that real GDP increased 2.12.5 percent in 20222023 and the Federal Reserve Bank of Philadelphia projected that the median growth rate in real GDP would be 0.7%, 1.8%,1.7 percent, 1.8 percent, and 2.2%2.1 percent for 2023, 2024, 2025, and 2025,2026, respectively.
Steel demand in North America is largely dependent on growth of the automotive, industrial equipment, consumer appliance, and construction end markets. Our end markets are supported byreflect the strengthperformance of the manufacturing economy, and according to the latest Livingston Survey, published by the Federal Reserve Bank of Philadelphia, U.S. industrial production is expected to have expanded by 4.3%0.3 percent in 20222023 and is further expected to grow by 0.5%0.5 percent in 20232024 and 2.2%1.4 percent in 2024.2025.
6
We carry a full line of carbon steel, stainless steel, alloy steels, and aluminum, and a limited line of nickel and red metals. These materials are stocked in a number of shapes, including coils, sheets, rounds, hexagons, square and flat bars, plates, structurals, and tubing.
We also provide a wide variety of processing services to meet our customers’ needs. Most of the products that we carry require expensive specialized equipment for material handling and processing. We believe few of our customers have the capability to process the metal into the desired sizes, forms, or finishes or they are unwilling to incur the significant capital expenditures to acquire the necessary equipment. We are growing and diversifying our product mix mainly as a result of our targeted growth strategy to provide increased levels of value-added processing services. We believe our enhanced processing capabilities will increase our ability to sell higher-margin metals processing services to a larger group of customers. We expect this, together with our focus on maintaining pricing discipline related to our processing services, will increase our gross profit margin.
We had capital expenditures of $274.6$358.1 million in the five-year period ended December 31, 2022.2023. We are increasing our investments in processing equipment to offer more value-added processing to our customers in an effort to increase our margins and profitability. We currently perform processing services on nearly 80% of the materials sold by us.
6
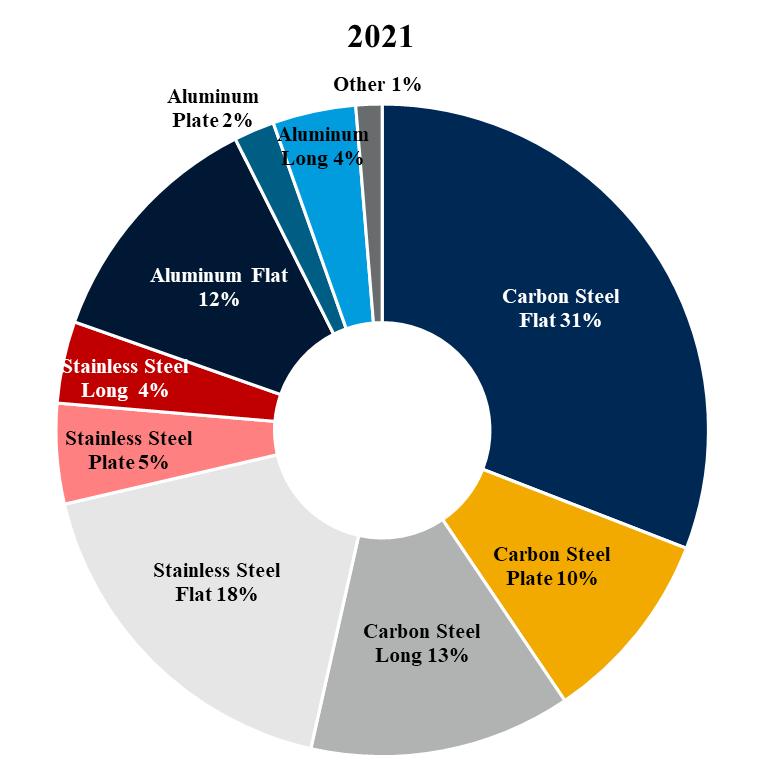
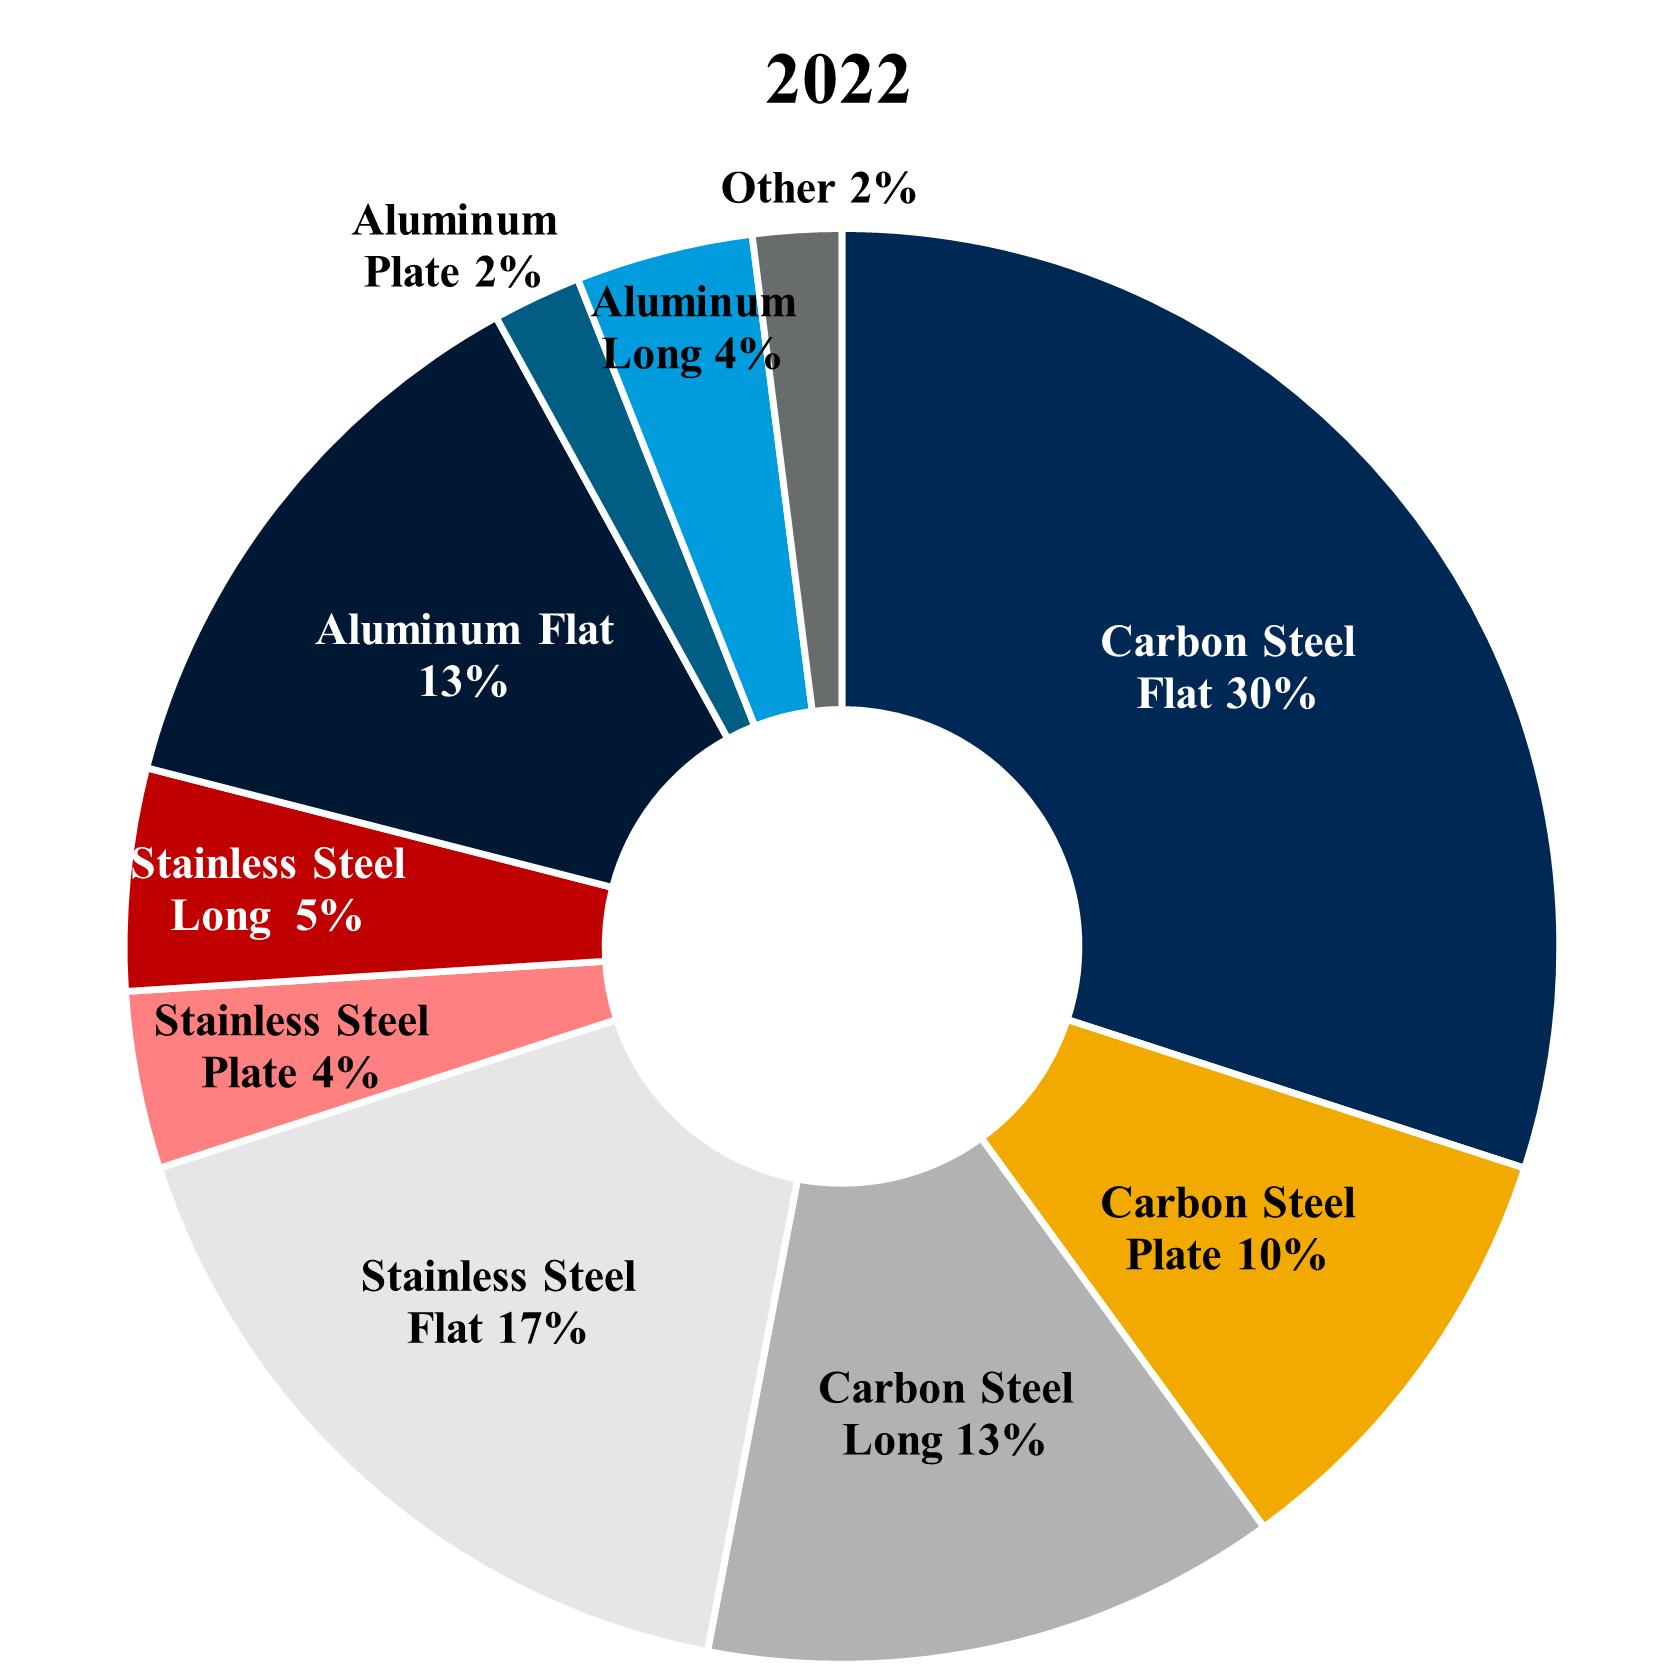
The following pie charts show our percentage of sales by major product lines for 20222023 and 2021:2022:


We are not dependent on any particular customer group or industry because we process and distribute a variety of metals. This diversity of product type and material reduces our exposure to fluctuations or other weaknesses in the financial or economic stability of particular customers or industries. We are also less dependent on any particular suppliers as a result of our product diversification. See pie charts showing our sales by metal consuming industry within “Customers and Markets” discussion below.
Customers and Markets
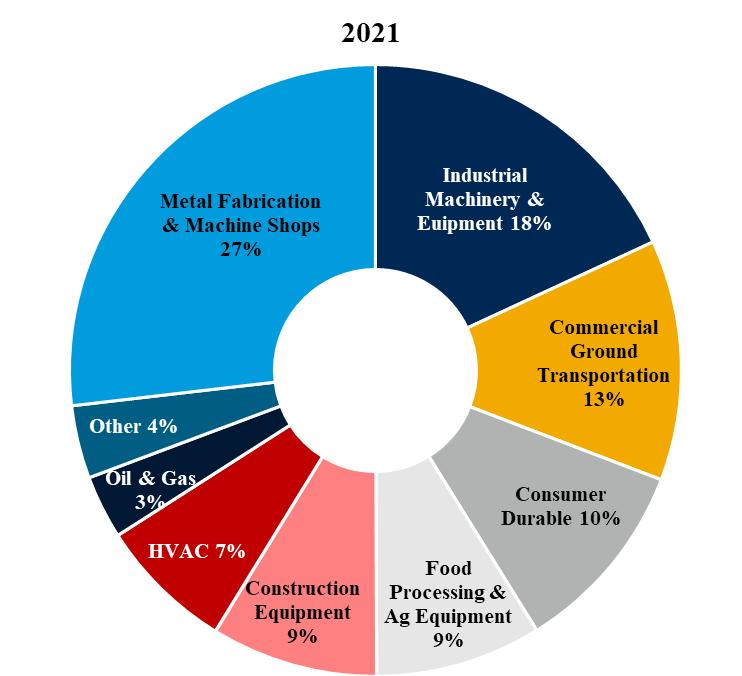
Our customer base is diverse, numbering approximately 40,000 in a variety of industries, including metal fabrication and machine shops, industrial machinery and equipment, commercial ground transportation, consumer durable, food processing and agricultural equipment, construction equipment, HVAC, and HVAC.oil & gas. Although we sell directly to many large original equipment manufacturers, the majority of our sales are to smaller customers, including small machine shops and fabricators, in small quantities with frequent deliveries, helping them manage their working capital and credit needs more efficiently.
7
For the year ended December 31, 2022,2023, no single customer, including their subcontractors, accounted for more than 6%8% of our sales, and our top 10 customers, including their subcontractors, accounted for approximatelyless than 16% of our sales. Substantially all of our sales are attributable to our U.S. operations and substantially all of our long-lived assets are located in the U.S.
7
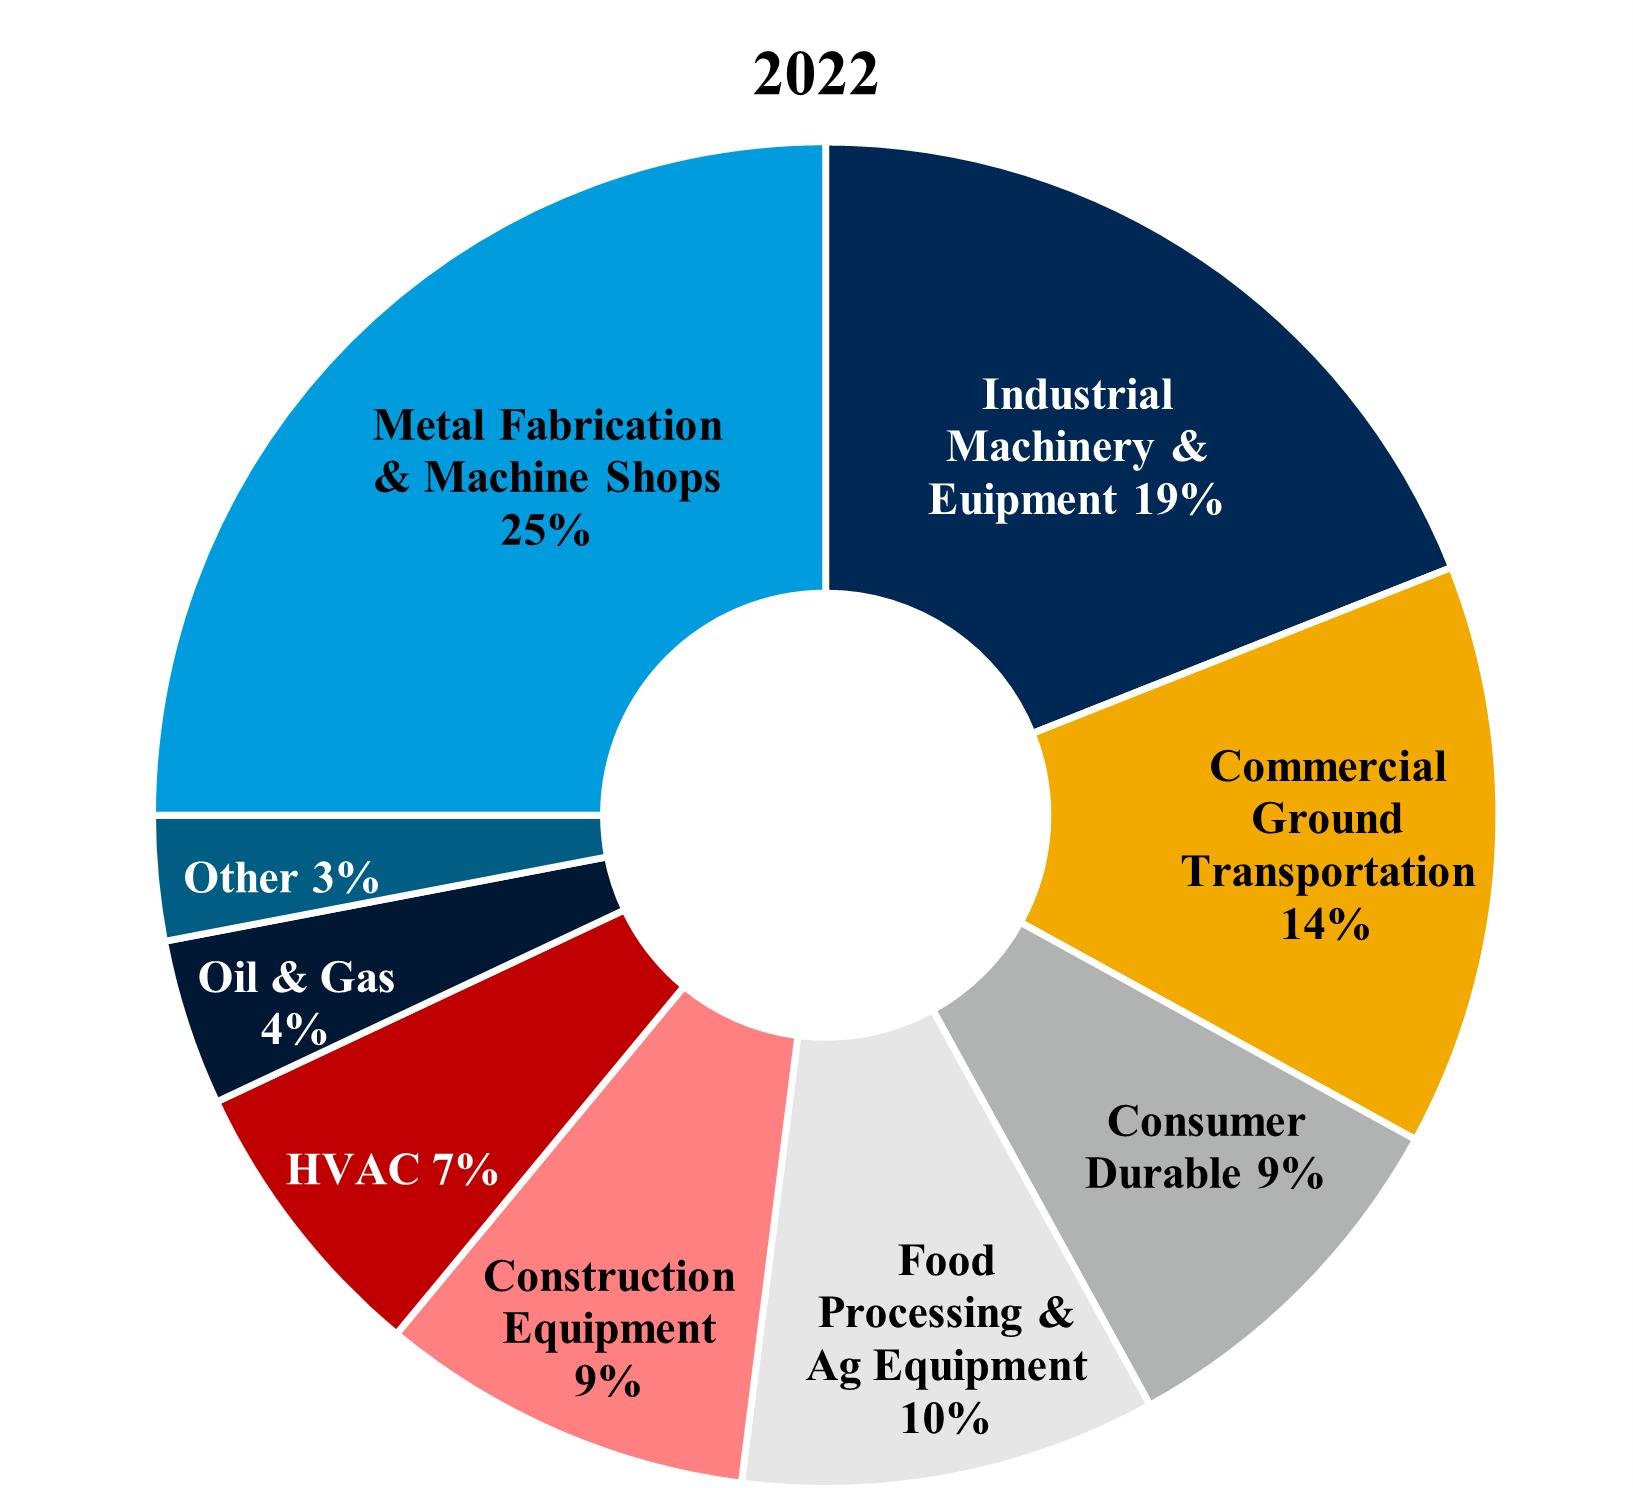
The following pie charts show the Company’s percentage of sales by metal consuming industry for 20222023 and 2021:2022:


Our customers are primarily located throughout the U.S., but we also have international customers. Our decentralized operating structure and facilities located near or close to most of our customers enable an efficient delivery system capable of handling a high frequency of short lead time orders. We transport our products directly to customers via our in-house and dedicated truck fleet, which further supports the just-in-time delivery requirements of our customers, and via third-party trucking firms.
We process our metals to specific customer orders as well as for stocking programs. Many of our larger customers commit to purchase on a regular basis at agreed upon or indexed prices for periods ranging from three to twelve months. To help mitigate price volatility risks, these price commitments are generally matched with corresponding supply arrangements, or to a lesser degree by commodity hedges. Customers notify us of specific release dates for processed products. Customers typically notify us of release dates anywhere from on a just-in-time basis to one month before the release date. Consequently, we are required to carry sufficient inventory to meet the short lead time and just-in-time delivery requirements of our customers.
We also have international facilities located in Canada, Mexico, and China. Net sales of our international locations (based on where the shipments originated) accounted for 8.8%9.1% of our consolidated 20222023 net sales, or $558.6$466.4 million. See Note 1413 — “Segment information” of Part II, Item 8 “Financial Statements and Supplementary Data” for further information on U.S. and foreign revenues and assets.
Customer demand may change from time to time based on, among other things, general economic conditions and industry capacity. Many of the industries in which our customers compete are cyclical in nature. We believe that our various and diverse offerings, ways-to-markets,ways-to-market, and end markets reduce the volatility of our business in the aggregate, thus somewhat reducing earnings volatility. A portion of our customers experience seasonal slowdowns. Our sales, as measured in tonnage sold, in the months of July, November, and December traditionally have been lower than in other months because of a reduced number of shipping days and holiday or vacation closures for some customers. Consequently, our sales in the first two quarters of the year are usually higher than in the third and fourth quarters.
Suppliers
We purchase the majority of our inventories from key domestic metals suppliers. Because of our total volume of purchases and our long‑term relationships with our suppliers, we believe that we are generally able to purchase inventory at the best prices offered by our suppliers.
8
For the year ended December 31, 2022,2023, our top 25 suppliers, including their subcontractors, accounted for approximately 78% of our purchase dollars. We are generally able to meet our materials requirements because we use many suppliers, there is a substantial overlap of product offerings from these suppliers, and there are several other suppliers able to provide identical or similar
8
products. While the metals producing supply base has experienced significant consolidation and supply interruptions in the past, we believe both our size and our long-term relationships with our suppliers has enabled us to meet our material requirements and will continue to allow us to do so in the future.
Sales and Marketing
We maintain our own professional sales force. In addition to our office sales staff, we market and sell our products through the use of our field sales force that we believe has extensive product and customer knowledge and offers a comprehensive catalog of our products. Our office and field sales staff, which together consist of approximately 850 employees, include technical personnel. Additionally, we offer our customers the ability to purchase our products through our e-commerce website.
Because much of our business is relationship-based, we operate under many different trade names. Businesses we acquire often have strong customer relationships and solid reputations, and we will often continue to use the acquired business name to maintain existing customer relationships.
Capital Expenditures
In 2022,2023, we continued to focus on organic growth by expanding and modernizing existing facilities, adding new state-of -the-art facilities, and adding processing equipment.equipment to support value-added business. Investments by us in property, plant, and equipment, together with asset retirements for the five years ended December 31, 2022,2023, excluding the initial purchase price of acquisitions are set forth below. The net capital change during such period aggregated to an increase of $134.6$223.2 million.
|
| Additions |
|
| Retirements |
|
| Net |
|
| Additions |
|
| Retirements |
|
| Net |
| ||||||
|
| (In millions) |
|
| (In millions) |
| ||||||||||||||||||
2023 |
| $ | 121.9 |
|
| $ | 0.4 |
|
| $ | 121.5 |
| ||||||||||||
2022 |
| $ | 105.1 |
|
| $ | 8.3 |
|
|
| 96.8 |
|
|
| 105.1 |
|
|
| 8.3 |
|
|
| 96.8 |
|
2021 |
|
| 59.3 |
|
|
| 68.5 |
|
|
| (9.2 | ) |
|
| 59.3 |
|
|
| 68.5 |
|
|
| (9.2 | ) |
2020 |
|
| 26.0 |
|
|
| 0.2 |
|
|
| 25.8 |
|
|
| 26.0 |
|
|
| 0.2 |
|
|
| 25.8 |
|
2019 |
|
| 45.8 |
|
|
| 57.5 |
|
|
| (11.7 | ) |
|
| 45.8 |
|
|
| 57.5 |
|
|
| (11.7 | ) |
2018 |
|
| 38.4 |
|
|
| 5.5 |
|
|
| 32.9 |
| ||||||||||||
The net reductions in 2019 and 2021 are related to sale lease-back transactions. See Part II, Item 8, Note 5: Property, Plant, and Equipment for additional information on the 2021 sale-leaseback transactions. The lower amount of additions in 2020 was caused by capital expenditures deferred to 2021 and 2022 as spending was reduced due to uncertainties surrounding the COVID-19 pandemic. We currently anticipate capital expenditures, excluding acquisitions, of up to approximately $95$110 million for 2023,2024, much of which is related to purchases geared towards highly accretive projects focused on strategic initiatives, IT infrastructure investment, and growth, along with maintenance projects. We expect all of the 20232024 capital expenditures to be funded using proceeds from the cash generated by operations and borrowings on our $1.3 billion revolving credit facility (“the Ryerson Credit Facility”).operations. We will continue to evaluate and execute each growth project in light of the economic conditions and outlook at the time of investment and may significantly reduce our capital expenditures if economic conditions warrant a more conservative approach to capital allocation. For the long term, we expect capital expenditures to normalize to a rate that approximates depreciation.
Environmental, Health, and Safety Matters
Our facilities and operations are subject to many federal, state, local, and foreign laws and regulations relating to the protection of the environment and to health and safety. In particular, our operations are subject to requirements relating to waste disposal, recycling, air and water emissions, the handling of regulated materials, remediation, underground storage tanks, asbestos-containing building materials, workplace exposure, and other matters. We believe that our operations are currently in compliance with all such laws and do not presently anticipate substantial expenditures in the foreseeable future in order to meet environmental, workplace health or safety requirements, or to pay for any investigations, corrective action, or claims. However, claims, enforcement actions, or investigations regarding personal injury, property damage, or violation of environmental laws could result in substantial costs to us, divert our management’s attention, and result in significant liabilities, fines, or the suspension or interruption of our facilities.
We continue to analyze and implement safeguards to mitigate any environmental, health, and safety risks we may face. As a result, additional costs and liabilities may be incurred to comply with future requirements, including California and the proposed SEC climate disclosure requirements, or to address newly discovered conditions, and these costs and liabilities could have a material adverse effect on the results of operations, financial condition, or cash flows. For
9
example, there is increasing likelihood that additional regulation of greenhouse gas emissions will occur at the federal, state, local, and foreign level, which could affect us, our suppliers, and our customers. While the costs of compliance could be significant, given the uncertain outcome and timing of future action by the U.S. federal government and states on this issue, we cannot accurately predict the full financial impact of current and future greenhouse gas regulations on our operations or our customers at this time. We do not currently anticipate any new programs disproportionately impacting us compared to our competitors.
9
Some of the properties currently or previously owned or leased by us are located in industrial areas or have a long history of heavy industrial use. We may incur environmental liabilities with respect to these properties in the future including costs of investigations, corrective action, claims for natural resource damages, claims by third parties relating to property damages, or claims relating to contamination at sites where we have sent waste for treatment or disposal. Based on currently available information we do not expect any investigation, remediation matters, or claims related to properties presently or formerly owned, operated, or to which we have sent waste for treatment or disposal would have a material adverse effect on our financial condition, results of operations, or cash flows.
In October 2011, the United States Environmental Protection Agency (the “EPA”) named JT Ryerson as one of more than 100 businesses that may be a potentially responsible party (“PRP”) for the Portland Harbor Superfund Site (the “PHS Site”). On January 6, 2017,Site. See Note 12: Commitments and Contingencies in the EPA issued an initial Record of Decision (“ROD”) regarding the site. The ROD includes a combination of dredging, capping, and enhanced natural recovery that would take approximately thirteen years to construct plus additional time for monitored natural recovery, at an estimated present value cost of $1.05 billion. At a December 4, 2018 meeting with the Portland Harbor Participation and Common Interest Group (“PCI Group”), of which JT Ryerson is a member, the EPA indicated that it expected PRPs to submit a plan during 2019 to start remediation of the river and harbor per the ROD within the next two to three years. As set forth more fully below, those dates have been extended until 2024 and 2025.
The EPA met with various PRPs throughout 2019 and 2020 regarding remedial design. The EPA did not include JT Ryerson in those meetings. It did include Schnitzer Steel, which is developing a remedial design plan for the river area which includes the area where the former JT Ryerson facilities were located. Schnitzer Steel’s 2020 disclosures filed with the EPA acknowledged that Schnitzer Steel is the legal successornotes to the prior operators (including JT Ryerson)consolidated financial statements included in the designated area. Schnitzer Steel has also indicated that JT Ryerson was not a significant contributorPart II, Item 8 of any contaminants of concern.
On February 12, 2021, the EPA announced that one hundred percent of the PHS Site is now in the active remedial design phase.
In June 2021, the EPA issued a Fact Sheet setting forth the status of the entire site. The primary area of relevance for JT Ryerson is River Mile 3.5 East, with Swan Island Basin being of secondary interest. For River Mile 3.5 East, remedial design work is ongoing; the Sufficiency Assessment and the Pre-Design Investigation work plans are finalized, and design investigation sampling is underway. Schnitzer Steel and MMGL Corp. are the working parties for River Mile 3.5 East. For Swan Island, remedial design is just beginning, with Daimler Trucks, Shipyard Commerce, and various government entities as the working parties. JT Ryerson has not been asked to participate in the remedial design phase.
The PCI Group has engaged a third party to prepare cost estimates for each of the Sediment Management Areas at the site. That work is still in progress. In the meantime, the voting parties of the PCI Group (which does not include JT Ryerson) have begun the “advocacy process,” during which the voting parties submit written arguments to the Allocation Team regarding how costs should be allocated among the various PRPs.
Once that advocacy process is completed, the Allocation Team will prepare a proposed Joint Preliminary Allocationthis Report (“JPAR”) of costs among the PRPs. The current timeline projects that the draft JPAR will be issued in June 2024, with a 90-day comment period to conclude in September 2024 and the final JPAR to be issued by the end of 2024. Once the final JPAR is issued, a six-month mediation period will commence. All PRPs, including JT Ryerson, will participate in this mediation process, during which the PRPs will attempt to agree on a final cost allocation. These dates are subject to change.
The Advocacy Group, a subset representing the interests of the PCI Group, met with the EPA on November 8, 2022, at which time the EPA set forth its desire for a single overarching Consent Decree to include implementation of the various proposed remedial design plans. That consent decree would set forth the plan for sequencing and costs of and payment for all work to be done at the site with all settling defendants to agree to site-wide covenants not to sue. The EPA would like this consent decree to be signed by the summer of 2025.
In the meantime, the EPA is preparing an updated Draft Sequencing Scenario for Current Project Areas to be issued in or around the first quarter of 2023. The EPA indicated that it anticipates that Special Notice Letters (“SNL”), which give PRPs information as to why the EPA thinks they are liable as well as clean up plans, will be issued to PRPs between the end of 2023 and mid-2024.
10
The EPA has stated that it is willing to consider de minimis settlements, which JT Ryerson is trying to pursue; however, the EPA has not begun meeting with any of the smaller parties who have requested de minimis or de micromis status, stating that it does not have sufficient information to determine whether any parties meet such criteria and does not intend to begin those considerations until after the remedial design work is completed and the SNLs are issued. It has met with selected parties that we believe to be larger targets. JT Ryerson has not been invited to meet with the EPA. As a result of the ongoing negotiations and filings over the ROD and the EPA’s decision not to meet with smaller parties, we cannot determine how allocations will be made and whether a de minimis settlement can be reached with the EPA.
Form 10-K. As the EPA has not yet allocated responsibility for the contamination among the potentially responsible parties, including JT Ryerson, we do not currently have sufficient information available to us to determine whether the RODRecord of Decision will be executed as currently stated, whether and to what extent JT Ryerson may be held responsible for any of the identified contamination, and how much (if any) of the final plan’s costs might ultimately be allocated to JT Ryerson. Therefore, management cannot predict the ultimate outcome of this matter or estimate a range of potential loss at this time.
There are various other claims and pending actions against the Company. The amount of liability, if any, for those claims and actions as of December 31, 20222023 is not determinable but, in the opinion of management, such liability, if any, will not have a material adverse effect on the Company’s financial position, results of operations, or cash flows. We maintain liability insurance coverage to assist in protecting our assets from losses arising from or related to activities associated with business operations.
Our U.S. operations are also subject to the Department of Transportation Federal Motor Carrier Safety Regulations. We operate a private trucking motor fleet for making deliveries to some of our customers. Our drivers do not carry any material quantities of hazardous materials. Our foreign operations are subject to similar regulations. Future regulations could increase maintenance, replacement, and fuel costs for our fleet. These costs could have a material adverse effect on our results of operations, financial condition, or cash flows.
Intellectual Property
We own several U.S. and foreign trademarks, service marks, and copyrights. Certain of the trademarks are registered with the U.S. Patent and Trademark Office and, in certain circumstances, with the trademark offices of various foreign countries. We consider certain other information owned by us to be trade secrets. We protect our trade secrets by, among other things, entering into confidentiality agreements with our employees regarding such matters and implementing measures to restrict access to sensitive data and computer software source code on a need-to-know basis. We believe that these safeguards adequately protect our proprietary rights and we vigorously defend these rights. While we consider all our intellectual property rights as a whole to be important, we do not consider any single right to be essential to our operations as a whole.
Environmental, Social, and GovernanceSustainability
In 2022,December 2023, Ryerson released its second Sustainability Report. The report builds on the Company’s inaugural Environmental, Social,2022 report and Governance ("ESG") report, which outlines our commitment to operating sustainably, transparently,provides an update on ongoing sustainability efforts, the investments being made in its people and responsiblyservice center network, and how it is serving its communities. Similar to the betterment of all stakeholders. Theinaugural report, also includes our Materiality Matrix, the product of a materiality assessment which was developed by forming a list of ESG topics, benchmarking priorities against industry leaders, conducting stakeholder interviews, and reviewing findings with Company leadership. Ryerson is utilizing insights from2023 edition illustrates the Matrix to target improvement in certain categories, includingCompany’s focus on energy and emissions reductions, sustainable products, data security, diversity, equity, and inclusion ("DEI"), and talent and future workforce. Discussionsworkforce while also providing updates on Ryerson’s advancement in these categories. A few achievements include Ryerson’s recognition by Forbes as one of DEIAmerica’s best mid-sized companies to work for, its launch of the award-winning Ryerson Illuminator app, and talent and future workforce are included withinits continued role in the Human Capital section directly below.circular metals economy.
Our ESGAdditionally, the Sustainability Report includes important content on our governance practices, including how we continuously monitor and analyze ourselves and our supply-chain relationships in order to operate with a high level of integrity.integrity and how we protect Company and stakeholder information through strong cybersecurity practices. We strive, and expect our suppliers, to comply with all applicable laws and regulations as well as Ryerson's Human Rights Policy, Conflict Minerals Policy, and Code of Ethics and Business Conduct.
Human Capital
In order to provide best in class customer experiences, it is crucial that we continue to work to attract and retain top talent. To facilitate talent attraction and retention, we strive to create a diverse, inclusive, and safe workplace, with opportunities for our
10
employees to grow and develop in their careers, supported by strong compensation, benefits, and wellness programs, and by programs that build connections between our employees and their communities.
11
Talent and Future Workforce. Our recruitment and talent management teams lead our mission to attract, retain and develop diverse talent. These teams are organized under our newly formed Talent Management Office ("TMO"), which includes our Chief Human Resources Officer, our Director of Talent Management, and other senior leaders. The TMO is responsible for our recruiting efforts, attracting the best talent, increasing diversity and hiring efficiencies, facilitating onboarding, and continuing education opportunities to engage employees as they join Ryerson and build their careers with us.
As part of retaining and developing talent, Ryerson offers employees competitive compensation, expanded benefits including a newly implemented parental leave policy, career growth through its learning platform, mentorship and tuition reimbursement programs, and engagement through all-employee surveys conducted periodically.
Diversity and Inclusion. Ryerson is embracing diversity and inclusion via our Diversity, Equity, and Inclusion council ("DEI Council") that focuses on employee engagement, DEI training, and community outreach efforts with the mission of fostering an environment across the organization that values diversity of experiences and perspectives and encourages inclusivity in all aspects of the business.
Additionally, Ryerson leadership is updating policiesIn 2023, Ryerson’s DEI Council announced the establishment of three employee resource groups ("ERGs") to be available to employees in 2024: Women in Search of Excellence (WISE), Next Generation of Leaders (NextGen), and programsLeveraging All Diversity (LEAD). These ERGs are voluntary, employee-led groups that work to support DEI practices. Aside from the formationfoster a more inclusive workplace by uniting people with common interests, identities, or backgrounds. Each of the three ERGs established is purposefully aligned with Ryerson’s DEI Council, these include the Company’s Code of Ethics & Business Conduct, Anti-harassment policy, Equal Employment Opportunity policy, Sponsorship Program,mission and Mentoring Program. As part of our commitment to improving our DEI, Ryerson was excited to announce its new parental leave policy in 2021. This new policy ensures that all parents have equal access to parental leave benefits and the opportunity to spend time with their new child. Equal rights and access to parental leave are vital elements to promoting gender equality in the workplace. strategic goals.
Further, Ryerson is invested in DEI training by providing employees with training on being inclusive, avoiding bias, and workplace intervention. Additional trainingTraining is also available at any time on the Company’s learning platform, where employees can select from a growing catalog of DEI courses.
Employee Health, Wellness, and Safety. Health, safety, and wellness are fundamental expectations of our Board, executives, employees, and our customers. Our safety standards, which go beyond industry standards and the minimum legal requirements, have helped protect the well-being of our people and prevent workplace injuries. Our commitment towards a zero-injury workplace is constant and driven by an Environmental, Health, and Safety policy that reinforces the goal. Our 20222023 performance at our facilities, measured as the number of OSHA recordable injuries per 200,000 labor hours, was 3.03,2.26, which was better than the industry average as reported by the Bureau of Labor Statistics.
We provide our employees and their families with access to a variety of innovative, flexible, and convenient health and wellness programs, including benefits that provide protection and security so they can have peace of mind concerning events that may require time away from work or that impact their financial well-being; that support their physical and mental health by providing tools and resources to help them improve or maintain their health status, and encourage engagement in healthy behaviors; and that offer choice where possible so they can customize their benefits to meet their needs and the needs of their families.
Compensation and Benefits. We provide robust compensation and benefits programs to help meet the financial needs of our employees. In addition to salaries, we provide annual and quarterly sales incentive plans, healthcare and insurance benefits, health savings and flexible spending accounts, retirement savings contribution matching, paid time off, parental leave, employee assistance programs, and tuition assistance. Additionally, we have targeted equity-based grant programs with vesting conditions to facilitate retention of personnel, particularly those with critical skills and experience.
Employee Headcount and Unions. See Item 1A, Risks Related to Operating our Business, sub-section "Any significant work stoppages can harm our business", as well as Note 13:12: Commitments and Contingencies within Part II, Item 8 "Financial Statements and Supplementary Data" for further information.
Available Information
All periodic and current reports and other filings that we are required to file with the Securities and Exchange Commission (“SEC”), including our annual report on Form 10-K, quarterly reports on Form 10-Q, current reports on Form 8-K, and amendments to those reports filed or furnished pursuant Section 15(d) of the Securities Exchange Act of 1934, as amended, are available free of charge from the SEC’s website (www.sec.gov) or through our Investor Relations website at http://ir.ryerson.com. Such documents are available as soon as reasonably practicable after electronic filing of the material with the SEC. Copies of these reports (excluding
11
exhibits) may also be obtained free of charge, upon written request to: Investor Relations, Ryerson Holding Corporation, 227 W. Monroe St., 27th Floor, Chicago, Illinois 60606.
The Company also posts its Code of Ethics on its website. See Part III, Item 10 for more information regarding our Code of Ethics.
12
Our website address is included in this report for informational purposes only. Our website and the information contained therein or connected thereto are not incorporated into this annual report on Form 10-K.
ITEM 1A. RISK FACTORS.
Our business faces many risks. You should carefully consider the risks and uncertainties described below, together with the other information in this report, including the consolidated financial statements and notes to consolidated financial statements. We cannot assure you that any of the events discussed in the risk factors below will not occur. These risks could have a material and adverse impact on our business, results of operations, financial condition, and cash flows.
RISKS RELATED TO OUR INDUSTRY
Weakness in the economy, market trends, and other conditions affecting the profitability and financial stability of our customers could negatively impact our sales growth and results of operations.
Economic and industry trends affect our business environments. We serve several metals-consuming industries in which the demand for our products and services is sensitive to the production activity, capital spending, and demand for products and services of our customers. Many of these customers operate in markets that are subject to highly cyclical fluctuations resulting from seasonality, market uncertainty, costs of goods sold, currency exchange rates, foreign competition, offshoring of production, oil and natural gas prices, geopolitical developments, and a variety of other factors beyond our control. Any of these factors could cause customers to idle or close facilities, delay purchases, reduce production levels, or experience reductions in the demand for their own products or services.
Any of these events could impair the ability of our customers to make full and timely payments or reduce the volume of products and services these customers purchase from us and could cause increased pressure on our selling prices and terms of sale.
We do not expect the cyclical nature of our industry to change and any downturn in our customers’ industries could reduce our revenues and profitability or a significant or prolonged slowdown in activity in the U.S., Canada, or any other major world economy, or a segment of any such economy, could negatively impact our sales growth and results of operations.
The metals services business is very competitive and increased competition could reduce our revenues and gross margins.
We face competition in all markets we serve, from metals producers that sell directly to certain customers or segments of the market, to other metal services companies. The metals services industry itself is highly fragmented and competitive. There are a few large competitors, but most of the market is served by small local and regional competitors. Competition is based principally on price, service, quality, production capabilities, inventory availability, and timely delivery.
We are experiencing increased pressure from online businesses that compete with price transparency. We expect technological advancements and the increased use of e-commerce solutions within the industry to continue to evolve at a rapid pace. As a result, our ability to effectively compete requires us to respond and adapt to new industry trends and developments, and implement new technology and innovations that may result in unexpected costs or may take longer than expected.
To remain competitive, we must be willing and able to respond to market pressures.pressures timely. These pressures, and the implementation, timing, and results of our strategic pricing and other responses, could have a material effect on our sales and profitability. If we are unable to grow sales or reduce costs, among other actions, to wholly or partially offset the effect on profitability of our pricing actions, our results of operations and financial condition may be adversely affected.
Changing metals prices may have a significant impact on our liquidity, net sales, gross margins, operating income, and net income.
The metals services industry as a whole is cyclical and, at times, pricing and availability of metal can be volatile due to numerous factors beyond our control, including, but not limited to, general domestic and international economic conditions, labor costs, sales levels, competition, levels of inventory held by other metals service centers, consolidation of metals producers, higher raw material costs for the producers of metals, import duties and tariffs, and currency exchange rates. This volatility can significantly
12
affect the availability and cost of materials for us. Our ability to pass on increases in costs in a timely manner depends on market conditions and may result in lower gross margins. In addition, higher prices could impact demand for theseour products, resulting in lower sales volumes. Moreover, we maintain substantial inventories of metal to accommodate the short lead times and just-in-time delivery requirements of our customers. Accordingly, we purchase metals in an effort to maintain inventory at levels that we believe to be appropriate to satisfy the anticipated needs of our customers based upon historic buying practices, contracts with customers, and market conditions. Commitments for metal purchases are generally at prevailing market prices in effect at the time orders are placed or at the time of shipment. During periods of rising metal prices, we may be negatively impacted by delays between the time of increases in the cost of
13
metals to us and increases in the prices that we charge for our products if we are unable to pass these increased costs on to our customers. In addition, when metal prices decline, this could result in lower selling prices for our products and, as we use existing inventory that we purchased at higher metal prices, lower gross profit margins. Declines in prices or reductions in sales volumes could adversely impact our ability to maintain our liquidity and to remain in compliance with certain financial covenants under our $1.3 billion revolving credit facility (“the Ryerson Credit Facility”), as well as result in us incurring inventory or goodwill impairment charges. Consequently, changing metals prices could significantly impact our liquidity, net sales, gross margins, operating income, and net income.
Unexpected product shortages could negatively impact customer relationships, resulting in an adverse impact on results of operations.
Disruptions could occur due to factors beyond our control, including economic downturns, political unrest, port slowdowns, trade issues, including increased export or import duties or trade restrictions, health crises, climate related disruptions, and other factors, anyfactors. Recent unrest in the Red Sea has increased both shipping times and costs presenting new challenges to the metals industry. Any of whichthe aforementioned items could adversely affect a supplier’s ability to manufacture or deliver products to us. Public health problems may result in quarantines, business closures, transportation restrictions, import and export complications, and otherwise cause shortages in the supply of materials, higher costs for available supplies, or cause other disruptions within our operations and supply chain. Public health problems may cause increased costs of certain supplies and disruptions and delays within our supply chain, and may expose us to unanticipated liability or require us to change our business practices.
Any disruption resulting from these events could cause significant delays in shipments of products or difficulties in obtaining products, any of which may expose us to unanticipated liability or require us to change our business practices in a manner materially adverse to our business, results of operations, and financial condition. For our sources of lower cost products from Asia and other areas of the world, the effect of disruptions is typically increased due to the additional lead time required and distances involved. Further, the risk of disruption is increased due to the current political climate seeking trade reform. In addition, we have strategic relationships with a number of vendors. In the event we are unable to maintain those relations, there might be a loss of competitive pricing advantages which could, in turn, adversely affect results of operations.
Changes in customer or product mix could cause our gross margin percentage to decline.
From time to time, we experience changes in customer and product mix that affect gross margin. Changes in customer and product mix result primarily from business acquisitions, changes in customer demand, customer acquisitions, selling and marketing activities, and competition. If rapid growth with lower margin customers occurs, we will face pressure to maintain current gross margins, as these customers receive more discounted pricing due to their higher sales volume. There can be no assurance that we will be able to maintain historical gross margins in the future.
We may not be able to retain or expand our customer base if the North American manufacturing industry erodes through acquisition and merger or consolidation activity in our customers’ industries.
Our customer base primarily includes manufacturing and industrial firms. Some of our customers operate in industries that are undergoing consolidation through acquisition and merger activity and some customers have closed as they were unable to compete successfully with overseas competitors. Our facilities are predominately located in the U.S. and Canada. To the extent that our customers cease U.S. operations or relocate to regions in which we do not have a presence, we could lose their business. Acquirers of manufacturing and industrial firms may have suppliers of choice that do not include us, which could impact our customer base and market share.
Global metal overcapacity and imports of metal products into the United States have adversely affected, and may again adversely affect, United States metal prices, which could impact our sales and results of operations.
At times, global metal production capacity may exceed global consumption of metal products. Such excess capacity sometimes results in metal manufacturers in certain countries exporting steel at prices that are lower than prevailing domestic prices and sometimes at or below their cost of production. Excessive imports of metal into the U.S. have exerted and may exert in the future, downward pressure on U.S. steel prices which may negatively affect our results of operations.
13
Lead time and the cost of our products could increase if we were to lose one of our primary suppliers.
If, for any reason, our primary suppliers of aluminum, carbon steel, stainless steel, or other metals should curtail or discontinue their delivery of such metals in the quantities needed and at prices that are competitive, our business could suffer. The number of available suppliers could be reduced by factors such as industry consolidation and bankruptcies affecting steel and metal producers. For the year ended December 31, 2022,2023, our top 25 suppliers represented approximately 78% of our purchases. We could be
14
significantly and adversely affected if delivery were disrupted from a major supplier. If, in the future, we were unable to obtain sufficient amounts of the necessary metals at competitive prices and on a timely basis from our traditional suppliers, we may not be able to obtain such metals from alternative sources at competitive prices to meet our delivery schedules, which could have a material adverse effect on our sales and profitability.
RISKS RELATED TO MARKET AND ECONOMIC VOLATILITY
Changes in inflation may adversely affect financial performance.
Fluctuations in inflation could result in, and recent inflationary pressures have resulted in, lower revenues, higher costs, and decreased margins, profits, and earnings. Rapid or significant inflation could continue to increase the costs we incur to procure, process, package, and deliver our metal to customers and we may not be able to increase selling prices to customers at the same rate, resulting in decreased margins and operating profits. Prolonged periods of deflation could adversely affect the degree to which we are able to maintain or increase selling prices resulting in decreased revenues, margins, and operating profits. Additionally, prolonged deflation could impact our availability on the Ryerson Credit Facility as the value of our accounts receivable and inventory decreases.
In addition, we rely on arrangements with third-party shipping and freight companies for the delivery of our products. Freight and shipping costs may increase due to inflation, and any such increases could adversely affect our margins unless we are able to increase selling prices at the same rate.
We monitor the risk that the principal markets in which we operate could continue to experience increased inflationary conditions. The onset, duration, and severity of an inflationary period cannot be estimated with precision.
The volatility of the market could result in a material impairment of goodwill.
We evaluate goodwill annually on October 1 and whenever events or changes in circumstances indicate potential impairment. Events or changes in circumstances that could trigger an impairment review include significant underperformance relative to our historical or projected future operating results, significant changes in the manner or the use of our assets or the strategy for our overall business, and significant negative industry or economic trends. We test for impairment of goodwill by assessing various qualitative factors with respect to developments in our business and the overall economy and calculating the fair value of a reporting unit using a combination of an income approach based on discounted future cash flows and a market approach at the date of valuation, as necessary. Under the discounted cash flow method, the fair value of each reporting unit is estimated based on expected future economic benefits discounted to a present value at a rate of return commensurate with the risk associated with the investment. Projected cash flows are discounted to present value using an estimated weighted average cost of capital, which considers both returns to equity and debt investors. Please refer to the Section titled “Critical Accounting Estimates - Goodwill,” of Item 7, “Management’s Discussion and Analysis of Financial Conditions and Results of Operations,” and Note 1 — “Summary of Accounting and Financial Policies” of Part II, Item 8 "Financial Statements and Supplementary Data" for further information.
Poor investment performance or other factors could require us to make significant unplanned contributions to our pension plan and future funding for postretirement employee benefits other than pensions also may require substantial payments from current cash flow.
We provide defined benefit pension plans for certain eligible employees and retirees. The performance of the debt and equity markets affect the value of plan assets. A decline in the market value may increase the funding requirements for these plans. The cost of providing pension benefits is also affected by other factors, including interest rates used to measure the required minimum funding levels, the rate of return on plan assets, discount rates used in determining future benefit obligations, future government regulation, and prior contributions to the plans. Significant unanticipated changes in any of these factors may have an adverse effect on our financial condition, results of operations, liquidity, and cash flows.
14
RISKS RELATED TO EXPANSION AND INTERNATIONAL OPERATIONS
We may not be able to successfully consummate and complete the integration of future acquisitions, and if we are unable to do so, it could disrupt operations and cause unanticipated increases in costs and/or decreases in revenues and results of operations.
We have grown through a combination of internal expansion, acquisitions, and joint ventures. We intend to continue to grow through selective acquisitions, but we may not be able to identify appropriate acquisition candidates, obtain financing on satisfactory terms, consummate acquisitions, or integrate acquired businesses effectively and profitably into our existing operations. Restrictions contained in the agreements governing the Ryerson Credit Facility, or our other existing or future debt may also inhibit our ability to make certain investments, including acquisitions, and participations in joint ventures.
15
Acquisitions, partnerships, joint ventures, and other business combination transactions, both foreign and domestic, involve various inherent risks, such as uncertainties in assessing value, strengths, weaknesses, liabilities, and potential profitability. There is also risk relating to our ability to achieve identified operating and financial synergies anticipated to result from the transactions. Additionally, problems could arise from the integration of acquired businesses, including unanticipated changes in the business or industry or general economic conditions that affect the assumptions underlying the acquisition. Our future success will depend on our ability to complete the integration of these future acquisitions successfully into our operations. Specifically, after any acquisition, customers may choose to diversify their supply chains to reduce reliance on a single supplier for a portion of their metals needs. We may not be able to retain all of our and an acquisition’s customers, which may adversely affect our business and sales. Integrating acquisitions, particularly large acquisitions, requires us to enhance our operational and financial systems and employ additional qualified personnel, management, and financial resources, and may adversely affect our business by diverting management away from day-to-day operations. Further, failure to successfully integrate acquisitions may adversely affect our profitability by creating significant operating inefficiencies that could increase our operating expenses as a percentage of sales and reduce our operating income. In addition, we may not realize expected cost savings from acquisitions. Any one or more of these factors could cause us to not realize the benefits anticipated or have a negative impact on the fair value of the reporting units. Accordingly, goodwill and intangible assets recorded as a result of acquisitions could become impaired.
Certain of our operations are located outside of the United States, which subjects us to risks associated with international activities.
Certain of ourWe have certain operations which are located outside of the U.S., primarily in Canada, China, and Mexico. We are subject to the Foreign Corrupt Practices Act (“FCPA”), which generally prohibits U.S. companies and their intermediaries from making corrupt payments or otherwise corruptly giving anything of value to foreign officials for the purpose of obtaining or keeping business or otherwise obtaining favorable treatment, and requires companies to maintain adequate record-keeping and internal accounting practices. The FCPA applies to covered companies, individual directors, officers, employees, and agents. Under the FCPA, U.S. companies may be held liable for some actions taken by strategic or local partners or representatives. If we or our intermediaries fail to comply with the requirements of the FCPA, governmental authorities in the U.S. could seek to impose civil and/or criminal penalties.
Our international operations and potential joint ventures may cause us to incur costs and risks that may distract management from effectively operating our North American business, and such operations or joint ventures may not be profitable.
We maintain foreign operations in Canada, China, and Mexico. International operations are subject to certain risks inherent in conducting business in, and with, foreign countries, including price controls, exchange controls, export controls, economic sanctions, duties, tariffs, limitations on participation in local enterprises, nationalization, expropriation and other governmental action, and changes in currency exchange rates. In addition, we may be subject to business disruptions created by health crises and outbreaks of communicable diseases. While we believe that our current arrangements with local partners provide us with experienced business partners in foreign countries, events or issues, including disagreements with our partners, may occur that require attention of our senior executives and may result in expenses or losses that erode the profitability of our foreign operations or cause our capital investments abroad to be unprofitable.
We may be adversely affected by currency fluctuations in the U.S. dollar versus the Canadian dollar, the Chinese renminbi, the Hong Kong dollar, and the Mexican peso.
We have significant operations in Canada which incur the majority of their metal supply costs in U.S. dollars but earn the majority of their sales in Canadian dollars. Additionally, we have significant assets in China. We alsoChina and conduct businessoperations in Mexico. We may from time to time experience losses when the value of the U.S. dollar strengthens against the Canadian dollar, the Chinese renminbi, the Hong Kong dollar, or the Mexican peso, which could have a material adverse effect on our results of operations. In addition, we are subject to translation risk when we consolidate our Canadian, Chinese, and Mexican subsidiaries’ net assets into our balance sheet. Fluctuations in the value of the U.S. dollar versus the Canadian dollar, Chinese renminbi, the Hong Kong dollar, or the Mexican peso could reduce the value of these assets as reported in our financial statements, which could, as a result, reduce our stockholders’ equity.
15
The Chinese government exerts substantial influence over the manner in which we must conduct our business activities, particularly with regards to the land our facilities are located on.
The Chinese government has exercised and continues to exercise substantial control over the Chinese economy through regulation and state ownership. Our ability to operate in China may be harmed by changes in its laws and regulations, including those relating to taxation, import and export tariffs, environmental regulations, land use rights, property, and other matters. We believe that our operations in China are in material compliance with all applicable legal and regulatory requirements. However, the central or local governments of the jurisdictions in which we operate may impose new, stricter regulations or interpretations of existing regulations that would require additional expenditures and efforts on our part to ensure our compliance with such regulations or interpretations.
16
Moreover, the Chinese court system does not provide the same property and contract right guarantees as do courts in the U.S. and, accordingly, disputes may be protracted and resolution of claims may result in significant economic loss.
Additionally, there is no private ownership of land in China and all land ownership is held by the government of China, its agencies, and collectives, which issue land use rights that are generally renewable. We lease the land where our Chinese facilities are located from the Chinese government. If the Chinese government decided to terminate our land use rights agreements, our assets could become impaired and our ability to meet customer orders could be impacted.
RISKS RELATED TO CYBERSECURITY AND INFORMATION TECHNOLOGY
Damage to our information technology infrastructure could harm our business.
The unavailability of any of our computer-based systems for any significant period of time could have a material adverse effect on our operations. In particular, our ability to manage inventory levels successfully largely depends on the efficient operation of our computer hardware and software systems. We use management information systems to track inventory information at individual facilities, provide pricing recommendations for sales quotes, communicate customer information, and aggregate daily sales, margin, and promotional information. Difficulties associated with upgrades, installations of major software or hardware, and integration with new systems could have a material adverse effect on results of operations. We could be required to expend substantial resources to upgrade our information systems or integrate them with the systems of companies we have acquired. The upgrade or integration of these systems may disrupt our business or lead to operating inefficiencies. In addition, these systems are vulnerable to, among other things, damage or interruption from fire, flood, tornado, and other natural disasters, power loss, computer system and network failures, operator negligence, physical and electronic loss of data, or security breaches and computer viruses.
We are subject to cybersecurity risks and may incur increasing costs in an effort to minimize those risks.
We depend on the proper functioning and availability of our information technology platform, including communications and data processing systems, in operating our business. These systems include software programs that are integral to the efficient operation of our business. We have established security measures, controls, and procedures, including established recovery procedures for critical systems and business functions, to safeguard our information technology systems and to prevent unauthorized access to such systems and any data processed or stored in such systems, and we periodically evaluate and test the adequacy of such systems, measures, controls, and procedures; however, there can be no guarantee that such systems, measures, controls, and procedures will be effective. Security breaches could expose us to a risk of loss or misuse of our information, litigation, and potential liability. In addition, cyber incidents that impact the availability, reliability, speed, accuracy, or other proper functioning of these systems could have a significant impact on our operations, and potentially on our results. We may not have the resources or technical sophistication to anticipate or prevent rapidly evolving types of cyberattacks. A significant cyber incident, including system failure, security breach, disruption by malware, or other damage could interrupt or delay our operations, result in a violation of applicable privacy and other laws, damage our reputation, cause a loss of customers, or give rise to monetary fines and other penalties, which could be significant. Refer to Item 1C: "Cybersecurity" for further information on our Cybersecurity processes, policies, and programs.
RISKS RELATED TO OPERATING OUR BUSINESS
Any significant work stoppages can harm our business.
As of December 31, 2022,2023, we employed approximately 3,9004,300 persons in North America and 300 persons in China. Our North American workforce was comprised of approximately 1,8001,900 office employees and approximately 2,1002,400 plant employees. Sixteen percent of our plant employees were members of various unions, including the United Steel Workers and The International Brotherhood of Teamsters.
FourEight renewal contracts covering 98160 employees were successfully negotiated in 2022. Six2023. Eight contracts covering 120152 employees are currently scheduled to expire in 2023.2024.
16
Certain employee retirement benefit plans are underfunded and the actual cost of those benefits could exceed current estimates, which would require us to fund the shortfall.
As of December 31, 2022,2023, our pension plan had an unfunded liability of $73.0$63.9 million and our other postretirement benefits plan had an unfunded liability of $35.7 million. Our actual costs for benefits required to be paid may exceed those projected and future actuarial assessments. Under those circumstances, the adjustments required to be made to our recorded liability for these benefits could have a material adverse effect on our results of operations and financial condition and cash payments to fund these plans could have a material adverse effect on our cash flows. We may be required to make substantial future contributions to improve the plan’s funded status.
17
Any prolonged disruption of our processing centers could harm our business.
We have dedicated processing centers that permit us to produce standardized products in large volumes while maintaining low operating costs. We may suffer prolonged disruption in the operations of any of these facilities, whether due to labor or technical difficulties, destruction, or damage sustained as a result of natural disasters or climate-related events to any of the facilities or otherwise, which could adversely affect our operating results.
If we are unable to retain, attract, and motivate management and key personnel, it may adversely affect our business.
In order to compete and have continued growth, we must attract, retain, and motivate executives and other key employees, including those in managerial, technical, sales, marketing, and support positions. We believe that our success is due, in part, to our experienced management team. Losing the services of one or more members of our management team such as our CEO, Edward J. Lehner, could adversely affect our business and possibly prevent us from improving our operational, financial, and information management systems and controls. We compete to hire employees and then must train them and develop their skills and competencies. In the future, we may need to retain and hire additional qualified sales, marketing, administrative, operating, and technical personnel, and to train and manage new personnel. Our ability to implement our business plan is dependent on our ability to retain, hire, and train a large number of qualified employees each year. Our results of operations could be adversely affected by increased costs due to increased competition for employees, higher employee turnover, or increased employee benefit costs.
Our risk management strategies may result in losses.
From time to time, we may use fixed-price and/or fixed-volume supplier contracts to offset contracts with customers. Some of our existing supply agreements have required minimum purchase quantities. Under adverse economic conditions, those minimums may exceed our needs. Absent exceptions for force majeure and other circumstances affecting the legal enforceability of the agreements, these minimum purchase requirements may compel us to purchase quantities of raw materials that could significantly exceed our anticipated needs or pay damages to the supplier for shortfalls. In these circumstances, we would attempt to negotiate agreements for new purchase quantities. There is a risk, however, that we would not be successful in reducing purchase quantities, either through negotiation or litigation. If that occurred, we would likely be required to purchase more of a particular raw material in a particular year than we need, negatively affecting our results of operations and cash flows.
Additionally, we may use commodity contracts, foreign exchange contracts, and interest rate swaps to manage our exposure to commodity price risk, foreign currency exchange risk, and interest rate risk. These risk management strategies pose certain risks, including the risk that losses on a hedge position may exceed the amount invested in such instruments. Moreover, a party in a hedging transaction may be unavailable or unwilling to settle our obligations, which could cause us to suffer corresponding losses. A hedging instrument may not be effective in eliminating all of the risks inherent in any particular position. Our profitability may be adversely affected during any period as a result of the use of such instruments.
RISKS RELATED TO REGULATORY AND LEGAL MATTERS
We could incur substantial costs related to environmental, health, and safety laws.
Our operations are subject to increasingly stringent environmental, health, and safety laws. These include laws that impose limitations on the discharge of pollutants into the air and water and establish standards for the treatment, storage, and disposal of regulated materials, and the investigation and remediation of contaminated soil, surface water, and groundwater. Failure to maintain or achieve compliance with these laws or with the permits required for our operations could result in substantial increases in operating costs and capital expenditures. In addition, we may be subject to fines and civil or criminal sanctions, third party claims for property damage or personal injury, worker’s compensation or personal injury claims, cleanup costs, or temporary or permanent discontinuance of operations. Certain of our facilities are located in industrial areas, have a history of heavy industrial use, and have been in operation for many years and, over time, we and other predecessor operators of these facilities have generated, used, handled, and disposed of
17
hazardous and other regulated wastes. Environmental liabilities could exist, including cleanup obligations at these facilities or at off-site locations where materials from our operations were disposed of, which could result in future expenditures that cannot be currently quantified and which could have a material adverse effect on our financial position, results of operations, or cash flows. Such liabilities may be imposed without regard to fault or the legality of a party’s conduct and may, in certain circumstances, be joint and several. Future changes to environmental, health, and safety laws, including those related to climate change, could result in material liabilities and costs, constrain operations, or make such operations more costly for us, our suppliers, and our customers.
In October 2011, the United States Environmental Protection Agency (the “EPA”) named JT Ryerson as one of more than 100 businesses that may be a potentially responsible party for the Portland Harbor Superfund Site. See Note 13:12: Commitments and Contingencies in the notes to the consolidated financial statements included in Part II, Item 8 of this Report on Form 10-K. As the EPA has not yet allocated responsibility for the contamination among the potentially responsible parties, including JT Ryerson, we do not currently have sufficient information available to us to determine whether the Record of Decision will be executed as currently
18
stated, whether and to what extent JT Ryerson may be held responsible for any of the identified contamination, and how much (if any) of the final plan’s costs might ultimately be allocated to JT Ryerson. Therefore, management cannot predict the ultimate outcome of this matter or estimate a range of potential loss at this time.
Environmental, social, and governance matters, and any related reporting obligation may impact our business
Our business is subject to evolving corporate governance and public disclosure regulations and expectations, including with respect to environmental, social, and governance matters ("ESG"), that could expose us to numerous risks. These rules and regulations continue to evolve in scope and complexity, and many new requirements have been created in response to laws enacted by Congress, making compliance more difficult and uncertain. In addition, increasingly regulators, customers, investors, employees, and other stakeholders are focusing on ESG type matters and related disclosures. Our implementation of these evolving rules and regulations will require additional resources and implementation of new practices and reporting processes, all entailing additional compliance risk. Moreover, the progress and disclosure of our initiatives within the ESG scope could be criticized for accuracy, adequacy, and completeness, or may not advance at a sufficient pace. If our ESG-related data, processes, and reporting are incomplete or inaccurate, or if we fail to achieve progress with respect to our sustainability goals, or at all, our reputation, business, financial performance, and growth could be adversely affected.
Overall increased emphasis of ESG in itself and ESG reporting has increased stakeholder focus, including by U.S. and foreign governmental authorities, investors, and customers on environmental sustainability matters, such as climate change, the reduction of greenhouse gases, and water consumption. Legislative, regulatory, or other efforts to combat climate change or other environmental concerns could result in future increases in taxes, restrictions on or increases in the costs of supplies, transportation, and utilities, any of which could increase our operating costs, and necessitate future investments in facilities and equipment. Further, the customers we serve may impose emissions reduction or other environmental standards and requirements. As a result, we may experience increased compliance burdens and costs and the sourcing of our products may be adversely affected. These risks also include the increased pressure to make commitments, set targets, or establish additional goals and take actions to meet them, which could expose us to market, operational, execution, and reputation costs or risks.
Regulations related to conflict-free minerals may force us to incur additional expenses and place us at a competitive disadvantage.
On August 22, 2012, under the Dodd-Frank Wall Street Reform and Consumer Protection Act of 2010 (the “Dodd-Frank Act”), the SEC adopted new requirements for reporting companies that use certain minerals and metals, known as “conflict minerals”, in their products, whether or not these products are manufactured by third parties. These requirements require companies to diligence, disclose, and report whether or not such minerals originate from the Democratic Republic of Congo and adjoining countries. Since our supply chain is complex, we may not be able to conclusively verify the origins for all metals used in our products and we may face reputational challenges with our customers. Additionally, as there may be only a limited number of suppliers offering “conflict free” metals, we cannot be sure that we will be able to obtain necessary metals from such suppliers in sufficient quantities or at competitive prices. Accordingly, we could incur significant costs related to the compliance process, including potential difficulty or added costs in satisfying the disclosure requirements. Moreover, we may encounter challenges to satisfy those customers who require that all of the components of our products be certified as conflict free which could place us at a competitive disadvantage if we are unable to do so.
Tax changes could affect our effective tax rate, the value of our deferred tax assets, and future profitability.
Our future results could be adversely affected by changes in the effective tax rate or changes in the treatment of deferred tax assets as a result of changes in Ryerson’s overall profitability, changes in the mix of earnings in countries with differing statutory tax rates, changes in tax legislation, the results of the examination of previously filed tax returns, and continuing assessment of the Company’s tax exposures. In particular, although the passage of the Tax Cut and Jobs Act of 2017 reduced the U.S. tax rate to 21%, our future earnings could be negatively impacted by changes in tax legislation including changing tax rates and tax base such as
18
limiting, phasing-out, or eliminating deductions or tax credits, changing rules for earnings repatriations, and changing other tax laws in the U.S. or other countries.
We are subject to litigation that could strain our resources and distract management.
From time to time, we are involved in a variety of claims, lawsuits, and other disputes arising in the ordinary course of business. These suits concern issues including product liability, contract disputes, employee-related matters, and personal injury matters. It is not feasible to predict the outcome of all pending suits and claims, and the ultimate resolution of these matters as well as future lawsuits that could have a material adverse effect on our business, financial condition, results of operations, cash flows, or reputation.
We may face product liability claims that are costly and create adverse publicity.
If any of the products that we sell cause harm to any of our customers, we could be exposed to product liability lawsuits. If we were found liable under product liability claims, we could be required to pay substantial monetary damages. Further, even if we successfully defended ourselves against this type of claim, we could be forced to spend a substantial amount of money in litigation expenses, our management could be required to spend valuable time in the defense against these claims, and our reputation could suffer.
RISKS RELATED TO OWNERSHIP OF OUR COMMON STOCK
Our stock price has fluctuated in the past, has recently been volatile, and may be volatile in the future, and as a result, investors in our common stock could incur substantial losses.
Our stock price has fluctuated in the past, has recently been volatile, and may be volatile in the future. We may incur rapid and substantial decreases in our stock price in the foreseeable future that are unrelated to our operating performance or prospects.
As a result of this volatility, investors may experience losses on their investment in our common stock. The market price for our common stock may be influenced by many factors, including the following:
19
In the past, following periods of volatility in the market, securities class-action litigation has often been instituted against companies. Such litigation, if instituted against us, could result in substantial costs and diversion of management's attention and resources, which could materially and adversely affect our business, financial condition, results of operations, and growth prospects.
19
There can be no guarantee that our stock price will remain at current levels or that future sales of our common stock will not be at prices lower than those sold to investors.
We paid cash dividends on our common stock in each quarter of 2022,2023, but any future dividend payments are at the discretion of our Board of Directors.
WeSince the third quarter of 2021 we have recently paid regular quarterly cash dividends on our common stock. Any declaration and payment of cash dividends on our common stock in the future, whether at current levels or at all, will be at the discretion of our Board of Directors and will depend upon our results of operations, earnings, capital requirements, financial condition, future prospects, contractual restrictions, and other factors deemed relevant by our Board of Directors. Therefore, you should not rely on dividend income from shares of our common stock. For more information, see “Dividend Policy.”"Dividend Policy" of Part II, Item 5 "Market for Registrant's Common Equity, Related Stockholder Matters, and Issuer Purchases of Equity Securities". Your only opportunity to achieve a return on your investment in us may be if the market price of our common stock appreciates and you sell your shares at a profit, but there is no guarantee that the market price for our common stock will ever exceed the price that you pay for our common stock.
Our corporate documents and Delaware law contain provisions that could discourage, delay, or prevent a change in control of the Company.
Our amended and restated certificate of incorporation and amended and restated bylaws contain provisions that may make the acquisition of our company more difficult without the approval of our Board of Directors. These provisions:
20
These anti-takeover provisions and other provisions under Delaware law could discourage, delay, or prevent a transaction involving a change in control of our company, even if doing so would benefit our stockholders. These provisions could also discourage proxy contests and make it more difficult for our stockholders to elect directors of their choosing and to cause us to take other corporate actions they desire.choosing.
Any issuance of preferred stock could make it difficult for another company to acquire us or could otherwise adversely affect holders of our common stock, which could depress the price of our common stock.
Our Board of Directors has the authority to issue preferred stock and to determine the preferences, limitations, and relative rights of shares of preferred stock and to fix the number of shares constituting any series and the designation of such series, without any further vote or action by our stockholders. Our preferred stock could be issued with voting, liquidation, dividend, and other rights superior to the rights of our common stock. The potential issuance of preferred stock may delay or prevent a change in control of us, discouraging bids for our common stock at a premium over the market price, and adversely affect the market price and the voting and other rights of the holders of our common stock.
RISKS RELATED TO OUR CAPITAL STRUCTURE
We have indebtedness under our Ryerson Credit Facility, which could adversely affect our financial position and prevent us from fulfilling our financial obligations.
As of December 31, 2022,2023, our total indebtedness under the Ryerson Credit Facility was $367$433 million and we had approximately $826$560 million of unused capacity underon the Ryerson Credit Facility.facility. Our indebtedness may:
20
We may also incur additional indebtedness in the future. The terms of the Ryerson Credit Facility restrict but do not prohibit us from doing so, and the indebtedness incurred in compliance with these restrictions could be substantial. If new indebtedness is added to our current debt levels, the related risks that we now face could intensify.
The covenants in the Ryerson Credit Facility and covenants contained in agreements governing indebtedness that we incur in the future may impose restrictions that may limit our operating and financial flexibility.
The Ryerson Credit Facility contains a number of significant restrictions and covenants that limit our ability and the ability of our restricted subsidiaries, including JT Ryerson, to:
The terms of the Ryerson Credit Facility require that, in the event availability under the facility declines to a certain level, we maintain a minimum fixed charge coverage ratio at the end of each fiscal quarter. Total credit availability is limited by the amount of eligible accounts receivable, inventory, and qualified cash pledged as collateral under the agreement insofar as the Company is subject to a borrowing base comprised of the aggregate of these three amounts, less applicable reserves. As of December 31, 2022,2023, total credit availability under the Ryerson Credit Facility was $826$560 million. See discussion regarding the Ryerson Credit Facility in Note 10:
21
“Debt”9: “Debt” of Part II, Item 8 “Financial Statements and Supplementary Data” as well as the discussion within the “Liquidity and Capital Resources” section of Item 7 “Management’s Discussion and Analysis of Financial Condition and Results of Operations.”
Our future indebtedness may contain covenants more restrictive in certain respects than the restrictions contained in the Ryerson Credit Facility. Operating results below current levels or other adverse factors, including a significant increase in interest rates, could result in our being unable to comply with financial covenants that are contained in the Ryerson Credit Facility or that may be contained in any future indebtedness. In addition, complying with these covenants may also cause us to take actions that are not favorable to our stockholders and may make it more difficult for us to successfully execute our business strategy and compete against companies that are not subject to such restrictions.
We may not be able to generate sufficient cash to service all of our indebtedness.
Our ability to make payments on our indebtedness depends on our ability to generate cash in the future. Balances outstanding on the Ryerson Credit Facility and our other outstanding indebtedness are expected to account for significant cash interest expenses. Accordingly, we will have to generate significant cash flows from operations to meet our debt service requirements. If we do not generate sufficient cash flow to meet our debt service and working capital requirements, we may be required to sell assets, seek additional capital, reduce capital expenditures, restructure or refinance all or a portion of our existing indebtedness, or seek additional financing. Moreover, insufficient cash flow may make it more difficult for us to obtain financing on terms that are acceptable to us, or at all.
Because the majority of our indebtedness bears interest at rates that fluctuate with changes in certain prevailing short-term interest rates, we are vulnerable to interest rate increases.
The majority of our indebtedness, including the Ryerson Credit Facility, bears interest at rates that fluctuate with changes in certain short-term prevailing interest rates. As of December 31, 2022,2023, we had $365.0$433.0 million of outstanding borrowings under the Ryerson Credit Facility, with an additional $826$560 million available for borrowing under such facility. Assuming a consistent level of
21
debt through-out 20222023 a 100 basis point increase in the interest rate on our floating rate debt effective from the beginning of the year would increase our interest expense under the Ryerson Credit Facility and the China credit facility by approximately $4.3$4.7 million, on an annual basis. The Federal Reserve has increasedcontinued to increase interest rates throughout 2022 and earlyin 2023, increasing our interest expense on the Ryerson Credit Facility. The expectation is that additional rate hikes will occur in 2023. If interest rates increase dramatically,continue to rise in the future, we could be unable to service our debt, which could have a material adverse effect on our business, financial condition, results of operations, or cash flows.
22
Changes in our credit ratings and outlook may reduce access to capital and increase borrowing costs.
Our credit ratings are based on a number of factors, including our financial strength and factors outside of our control, such as conditions affecting our industry generally or the introduction of new rating practices and methodologies. We cannot provide assurances that our current credit ratings will remain in effect or that the ratings will not be lowered, suspended, or withdrawn entirely by the rating agencies. If rating agencies lower, suspend, or withdraw the ratings, the market price or marketability of our securities may be adversely affected. In addition, any negative change in ratings could make it more difficult for us to raise capital on acceptable terms, impact the ability to obtain adequate financing, and result in higher interest costs for our existing credit facilities, including the Ryerson Credit Facility, or on future financings.
RISKS RELATED TO OUR STOCKHOLDER BASE
Platinum owns a significantsubstantial percentage of our stock and has the right to nominate a majority of thetwo members of the Corporation’s board and will be able to exert controlinfluence over matters subject to stockholder approval.
Platinum owns approximately 15,924,4783,924,478 shares of our common stock, which is approximately 43%11.5% of our issued and outstanding common stock. Therefore, Platinum may be able to determineinfluence all matters requiring stockholder approval. For example, Platinum may be able to controlinfluence elections of directors, amendments of our organizational documents, or approval of any merger, sale of assets, or other major corporate transaction. This may prevent or discourage unsolicited acquisition proposals or offers for our common stock that our stockholders may believe are in their best interest as stockholders.
The Company is party to an investor rights agreement (the “Investor Rights Agreement”) with certain affiliates of Platinum which provides, among other things, that for so long as Platinum collectively beneficially owns (i) at least 30% of the voting power of the outstanding capital stock of the Company, Platinum will have the right to nominate for election to the board of directors of the Company no fewer than that number of directors that would constitute a majority of the number of directors if there were no vacancies on the board, (ii) at least 15% but less than 30% of the voting power of the outstanding capital stock of the Company, Platinum will have the right to nominate two directors, and (iii) at least 5% but less than 15% of the voting power of the outstanding capital stock of the Company, Platinum will have the right to nominate one director. The agreement also provides that if the size of the board of directors is increased or decreased at any time, Platinum’s nomination rights will be proportionately increased or decreased, respectively, rounded up to the nearest whole number. As a resultBased on Platinum's current voting power of Platinum’s ownership of a significant portion of the Company’s outstanding capital stock as well its board nomination rightsof the Company and the current size of the Board, Platinum has the right to nominate up to two directors pursuant to the Investor Rights Agreement,Agreement. As a result, Platinum may significantly influence or effectively control our policies and operations, including the appointment of management, future issuances of our common stock or other securities, and the payment of dividends. In addition, Platinum has significant control over ourdividends, as well as impact decisions to enter into any other corporate transaction.
The interests of Platinum may not in all cases be aligned with the interests of the other holders of our common stock. For example, a sale of a substantial number of shares of stock in the future by Platinum could cause our stock price to decline. Further, Platinum could cause us to make acquisitions that increase the amount of the indebtedness that is secured or senior to the Company’s existing debt or sell revenue-generating assets, impairing our ability to make payments under such debt. Additionally, Platinum is in the business of making investments in companies and may from time to time acquire and hold interests in businesses that compete directly or indirectly with us. Accordingly, Platinum may also pursue acquisition opportunities that may be complementary to our business, and as a result, those acquisition opportunities may not be available to us. In addition, Platinum may have an interest in pursuing acquisitions, divestitures, and other transactions that, in their judgment, could enhance their equity investment, even though such transactions might involve risks to holders of our common stock.
ITEM 1B. UNRESOLVED STAFF COMMENTS.
Not applicable.
22
ITEM 1C. CYBERSECURITY.
We are committed to protecting Company information and the confidential information of our employees, customers, partners, and suppliers. To that end, we have in place various policies, procedures, and processes to identify, assess, manage, and prevent potential cybersecurity risk's, and to timely detect the occurrence, and mitigate the effects of, cyberattacks and data breaches. Our Chief Information Officer ("CIO"), who has more than 25 years of information security and cybersecurity experience, manages cybersecurity, and oversees a team of dedicated cybersecurity personnel with various experience and certifications in information security and cybersecurity. Our personnel, along with external parties engaged to assess the sufficiency of our risk management processes (e.g., through penetration testing), continuously work to maintain and improve our cybersecurity program and the security and integrity of our information systems and infrastructure through our ongoing risk management program, including (i) by conducting cybersecurity assessments and audits to address threats and to stay in step with emerging malicious trends, and (ii) by performing due diligence on partners and suppliers to ensure similar values and appropriate security standards and safeguards are maintained by such partners and suppliers with respect to our information security assets and to third-party systems on which we rely. In addition, our Incident Response Team is trained to identify, quarantine, and remediate cybersecurity threats, and all of our employees are regularly trained to increase awareness of threats and to identify how to spot and avoid them.
Cybersecurity is a formal component of our overall risk management program, and our management, including our Chief Information Officer, regularly update the Audit Committee of the Board of the status of our cybersecurity program. In the event that management identifies significant cybersecurity risk exposures, it will present such exposures to the Audit Committee, which oversees the actions, security, and risk mitigation efforts taken across our cybersecurity framework. With this input from management, the Audit Committee evaluates our cybersecurity risks and the responses implemented to prevent and/or mitigate any such risks.
We have adopted an incident response plan that applies in the event of a cybersecurity incident involving a breach of our information technology systems and applications. Pursuant to this response plan, in the event of an incident, a multi-disciplinary team is assembled that is led by our CIO. The team in turn may leverage the expertise of third-party consultants, external legal counsel, and other resources. The plan includes procedures designed to facilitate containment of, and responses to, a cybersecurity incident, which are based on the type of incident, the location of the incident, and the breadth of the incident. The plan also establishes procedures for escalating incidents depending on severity and for notifying any impacted parties, including our customers, law enforcement and regulatory authorities, third-party vendors, and insurance providers. Our CIO will provide periodic updates to the Audit Committee and, when appropriate, the Board of Directors during this process. In addition to internal resources, we utilize third-party service providers to supplement and maintain our cybersecurity and our information technology systems.
As of the date of this report, we are not aware of any material risks from cybersecurity threats, including as a result of any cybersecurity incident, which have materially affected, or are reasonably likely to materially affect, us, our business strategy, our results of operations, or our financial condition.
23
ITEM 2. PROPERTIES.
As of December 31, 2022,2023, the Company’s facilities are set forth below:
Operations in the United States
JT Ryerson and its U.S. affiliates maintain 8296 operational facilities, including 810 locations that are dedicated to administration services. All of our metals service center facilities are in good condition and are adequate for JT Ryerson’s existing operations. Approximately 66%67% of these facilities are leased. The lease terms expire at various times through 2042.2043. JT Ryerson’s properties and facilities are adequate to serve its present and anticipated needs.
24
| |||||||||||||||||||||||||||||||||||||||||||||||||||||||||||||||||||||||||||||||||||||||||||||||||||||||||||||||||||||||||||||||||||||||||||||||||||||||||||||||||||||||||||||||||||||||||||||||||||||||||||||||||||||||||||||||||||||||||||||||||||||||||||||||||||||||||||||||||||||||||||||||||||||||||||||||||||||||||||||||||||||||||||||||||||||||||||||||||||||||||||||||||||||||||||||||||||||||||||||||||||||||||||||||||||||||||||||||||||||||||||||||||||||||||||||||||||||||||||||||||||||||||||||||||||||||||||||||||||||||||||||||||||||||||||||||||||||||||||||||||||||||||||||||||||||||||||||||||||||||||||||||||||||||||||||||||||||||||||||||||||||||||||||||||||||||||||||||||||||||||||||||||||||||||||||||||||||||||||||||||||||||||||||||||||||||||||||||||||||||||||||||||||||||||||||||||||||||||||||||||||||||||||||||||||||||||||||||||||||||||||||||||||||||||||||||||||||||||||||||||||||||||||||||||||||||||||||||||||||||||||||||||||||||||||||||||||||||||||||||||||||||||||||||||||||||||||||||||||||||
Las Vegas, NV |
* Office space only ** Processing centers ***Toll Processing centers 25 Operations in Canada Ryerson Canada, a wholly-owned indirect Canadian subsidiary of Ryerson Holding, has ten operational facilities in Canada. All of the metals service center facilities are in good condition and are adequate for Ryerson Canada’s existing and anticipated operations. Five facilities are leased. The lease terms expire at various times through 2027.
Operations in China Ryerson China, an indirect wholly-owned subsidiary of Ryerson Holding, has four service and processing centers in China, in Guangzhou, Dongguan, Kunshan, and Tianjin, performing coil processing, sheet metal fabrication, and plate processing. Ryerson
China’s headquarters office building is located in Kunshan. We own all of our China facilities and have purchased the related land use rights. All of the facilities are in good condition and are adequate for Ryerson China’s existing and anticipated operations. Operations in Mexico Ryerson Mexico, an indirect wholly-owned subsidiary of Ryerson Holding, has four facilities in Mexico. We have service centers in Monterrey, Tijuana, Hermosillo, and Queretaro, all of which are leased. The lease terms expire at various times through 2029. The facilities are in good condition and are adequate for Ryerson Mexico’s existing and anticipated operations. ITEM 3. LEGAL PROCEEDINGS. For information concerning legal proceedings as of December 31, ITEM 4. MINE SAFETY DISCLOSURES. Not applicable. 26
PART II ITEM 5. MARKET FOR REGISTRANT’S COMMON EQUITY, RELATED STOCKHOLDER MATTERS, AND ISSUER PURCHASES OF EQUITY SECURITIES. Market Information for Common Stock Our common stock has been listed on the New York Stock Exchange under the symbol “RYI” and was first traded on August 13, 2014. Holders As of February Dividend Policy We paid cash dividends on our common stock in all four quarters of 27
Performance Graph The following graph and accompanying table show the cumulative total return to stockholders of Ryerson Holding’s common stock relative to the cumulative total returns of the S&P 500 and a metals service center peer group (the “Peer Group”). The graph tracks the performance of a $100 investment in each of the indices (with reinvestment of dividends) from December 31, Comparison of 5 Year Cumulative Total Return Assumes Initial Investment of $100
This graph is not deemed to be “filed” with the SEC or subject to the liabilities of Section 18 of the Securities Exchange Act of 1934 (“the Exchange Act”), and should not be deemed to be incorporated by reference into any of our prior or subsequent filings under the Securities Act of 1933 or the Exchange Act.
28 Purchases of Equity Securities by the Issuer and Affiliated Purchasers
2023. Our share repurchase activity during the three months ended December 31,
Recent Sale of Unregistered Securities and Use of Proceeds None. ITEM 6. RESERVED. 29 ITEM 7. MANAGEMENT’S DISCUSSION AND ANALYSIS OF FINANCIAL CONDITION AND RESULTS OF OPERATIONS. The following discussion and analysis should be read in conjunction with the audited Consolidated Financial Statements of Ryerson Holding Corporation and Subsidiaries and the Notes thereto in Item 8. “Financial Statements and Supplementary Data.” This discussion contains forward-looking statements that involve risks and uncertainties. See the section entitled “Special Note Regarding Forward-Looking Statements.” Our actual results and the timing of selected events could differ materially from those discussed in these forward-looking statements as a result of certain factors, including those discussed in Item 1A. “Risk Factors” and elsewhere in this Form 10-K. This section of this Form 10-K generally discusses 2023 and 2022 items and year-over-year comparisons between 2023 and 2022. Discussions of 2021 items and year-over-year comparisons between 2022 and Overview Business Ryerson Holding Corporation (“Ryerson Holding”), a Delaware corporation, is the parent company of Joseph T. Ryerson & Son, Inc. (“JT Ryerson”), a Delaware corporation. Affiliates of Platinum Equity, LLC (“Platinum”) own approximately We are a leading value-added processor and distributor of industrial metals with operations in the United States (" Industry and Operating Trends We are a metals service center providing value-added processing and distribution of industrial metals with operations in the U.S., Canada, Mexico, and China. We purchase large quantities of metal products from primary producers and sell these materials in smaller quantities to a wide variety of metals-consuming industries. We carry a full line of Similar to other metals service centers, we maintain substantial inventories of metals to accommodate the short lead times and just-in-time delivery requirements of our customers. Accordingly, we purchase metals to maintain our inventory at levels that we believe to be appropriate to satisfy the anticipated needs of our customers based upon customer forecasts, historic buying practices, supply agreements with customers, mill lead times, and market conditions. Our commitments to purchase metals are generally at prevailing market prices in effect at the time we place our orders. At the request of our customers, we have entered into swaps in order to mitigate our customers’ risk of volatility in the price of metals and we have entered into metals hedges to mitigate our own risk of volatility in the price of metals. We have no long-term, fixed-price metals purchase contracts. When metals prices decline, customer demands for lower prices and our competitors’ responses to those demands could result in lower sale prices and, consequently, lower gross profits and earnings as we sell existing metals inventory. When metals prices increase, competitive conditions will influence how much of the price increase we may pass on to our customers. The metals service center industry is cyclical and volatile in both demand and pricing, and difficult to predict. In 30
Throughout According to the Metal Service Center Institute, North American service center volumes
These key metrics illustrate Ryerson’s financial performance for the full year
A reconciliation of diluted EPS to adjusted diluted EPS is provided below.
31
To provide greater insight into the Company’s
Ryerson generated cash from operating activities of Ryerson’s Ryerson’s market strategy focuses on providing excellent customer experiences consistently with speed at scale. Our culture is based on our trademarked “say yes, figure it out” mantra as we strive to grow volume and sustainably expand margins by increasing our fabrication business, transactional sales and improving our speed through our use of both tools and analytics. Ryerson’s financial strategy includes a focus on generating cash from operating activities and continuously improving a “through the cycle” operating model in order to maintain a strong balance sheet, re-invest in the growth of the business, and generate returns to shareholders.
During the year, the Company invested in optimizing its service center network through organic growth investments as well as strategic acquisitions. In 2024. In addition, Ryerson augmented its service center network through the acquisition of four companies, During 2023, the Company repurchased $113.9 million of its common stock including 32
In December of 2023, Ryerson published its In 2023, the Company progressed in its financial strategy. In adherence with a core pillar of our financial priorities announced at our investor day in 2022, we maintained our leverage ratio within the target range between 0.5x to 2.0x throughout the year. In recognition of the Company’s substantial reduction in debt in 2022, achieved by retiring the remaining $300 million of the 2028 Notes, Ryerson received a credit upgrade from Fitch in February of 2023. Two of its covering agencies also gave the Company an upgrade in 2022. Moody’s upgraded Ryerson’s corporate rating to Ba3 from B1, Standard & Poor’s (“S&P”) upgraded it to BB- from B+, and Fitch issued an upgrade to BB from BB-. The following table summarizes the Company’s current ratings by agency.
Industry Developments On February 24, 2023, the US government announced trade actions targeting goods and entities from Russia, which included a proclamation to impose 200% ad valorem tariffs on Russian-origin aluminum products and derivative products and other articles made from Russian primary aluminum or Russian aluminum castings. The duties will be imposed under section 232 of the Trade Expansion Act ("Section 232") and cited by the White House due to (1) challenges faced by US aluminum producers in the face of high levels of aluminum imports and high energy prices; (2) recent increases in imports of aluminum from Russia, whose market is especially export-oriented, by 53 percent between March and July 2022; and (3) the fact that the Russian aluminum industry is a key part of Russia's defense industrial base. Ryerson has communicated to all vendors that we will not accept any Russian originating metal. The trade actions announced by the US government should support prices for Ryerson's product sales mix prices as the underlying domestic and North American supply-demand balance is protected from oversupply. After the Russian forces invaded Ukraine on February 24, 2022, the Biden administration issued executive orders prohibiting the importation of goods from covered regions related to Ukraine and Russia. Ryerson takes this very seriously and has reviewed our direct and indirect material purchases to ensure compliance. On April 8, 2022, President Biden signed into law the Suspending Normal Trade Relations with Russia and Belarus Act, which denies "most-favored nation" tariff treatment to products of Russia and Belarus and extends the President’s authority to impose sanctions under the Global Magnitsky Human Rights Accountability Act. Beginning April 9, 2022, the Act imposes a 10.5% import duty on unalloyed primary aluminum and 11.0% on value-add aluminum products. The import duties are not expected to have a meaningful impact on the availability of aluminum for Ryerson. In not purchased material from Russia or the named Ukrainian regions and has no open purchases orders issued to Russian suppliers as of December 31,
On March 1,
On October 2, 2023, JT Ryerson acquired Norlen. Based out of Schofield, Wisconsin, Norlen is a full-service metal fabricator, providing stamping, machining, painting, and additional value-added fabrication services to industries including agriculture, HVAC, and defense. The total amount paid by JT Ryerson, net of cash acquired, for the acquisition amounted to $30.5 million. On November 1, 33 On December 1, 2023, JT Ryerson acquired Hudson. Hudson is headquartered in Cerritos, California, with Additionally, during the first six months of 2023, JT Ryerson completed the purchase of certain assets from ExOne Operating, LLC. The total amount paid by JT Ryerson for the acquired assets was $9.7 million. The 2023 acquisitions strengthen and expand JT Ryerson's valued-add services within our industry-leading stainless and aluminum franchises as well as our tool steel capabilities Components of Results of Operations We generate substantially all of our revenue from sales of our metals products. The majority of revenue is recognized upon delivery of product to customers. The timing of shipment is substantially the same as the timing of delivery to customers given the proximity of our distribution sites to our customers. Revenues associated with products which we believe have no alternative use, and where the Company has an enforceable right to payment, are recognized on an over-time basis. Over-time revenues are recorded in proportion with the progress made toward completing the performance obligation.
Sales, cost of materials sold, gross profit, and operating expense control are the principal factors that impact our profitability: Net Sales. Our sales volume and pricing are driven by market demand, which is largely determined by overall industrial production and conditions in specific industries in which our customers operate. Sales prices are also primarily driven by market factors such as overall demand and availability of product. Our net sales include revenue from product sales, net of returns, allowances, customer discounts, and incentives. Cost of materials sold. Cost of materials sold includes metal purchase and in-bound freight costs, third-party processing costs, and direct and indirect internal processing costs. The cost of materials sold fluctuates with our sales volume and our ability to purchase metals at competitive prices. Increases in sales volume generally enable us to improve purchasing leverage with suppliers as we buy larger quantities of metals inventories. Gross profit. Gross profit is the difference between net sales and the cost of materials sold. Our sales prices to our customers are subject to market competition. Achieving acceptable levels of gross profit is dependent on our acquiring metals at competitive prices, our ability to manage the impact of changing prices, and efficiently managing our internal and external processing costs. Operating expenses. Optimizing business processes and asset utilization to lower fixed expenses such as employee, facility, and truck fleet costs, which cannot be rapidly reduced in times of declining volume, and maintaining low fixed cost structure in times of increasing sales volume, have a significant impact on our profitability. Operating expenses include costs related to warehousing and distributing our products as well as selling, general, and administrative expenses. 34 Results of Operations The following table sets forth our Consolidated Statements of Operations data (certain percentages may not calculate due to rounding):
35
The following charts show the Company’s percentage of sales by major product lines for
Comparison of the year ended December 31, Net Sales
Revenue for the year ended December 31, 36
Cost of Materials Sold
The During 2023, LIFO income was $98 million related to decreases in pricing for all product lines, with the largest impact from carbon products, slightly offset by the liquidation of older LIFO layers for stainless and aluminum products that were at a net higher cost. During 2022, LIFO income was $58 million related to a decrease in pricing for carbon product lines, partially offset by increases in pricing in stainless and aluminum products as well as the impact of a reduction in carbon tons in inventory, which led to the liquidation of older LIFO layers that were at a higher cost. Gross Profit
Gross profit dollars Operating Expenses
Warehousing, delivery, selling, general, and administrative expenses increased • higher reorganization costs of $28.7 million in 2023 primarily due to increased system conversion activity as well as start up costs associated with our new state of the art University Park location; • higher employee benefit costs of $8.3 million in 2023, primarily due to higher medical costs and stock compensation; • higher salaries and wage expense of $4.9 million in 2023 primarily due to compensation increases; • higher operating expenses of $4.3 million in 2023 primarily due to higher repair & maintenance costs, higher information technology expenses, and higher insurance expense; and • higher selling, general, and administrative expenses of 37
• partially offset by lower incentive compensation In 2022, we recorded a gain on sale of assets of $3.8 million from the sale of a facility in Texas that Ryerson had an option to purchase. On a per ton basis, total operating expenses increased to $408 per ton in 2023 from $360 per ton in Operating Profit
Our operating profit Other Expenses
Interest and other expense on debt The other income and (expense), net in 2023 includes a $0.8 million gain on the curtailment of certain Central Steel & Wire ("CSW") pension and other post-employment benefit plans. The curtailment is due to a reduction in future years of service resulting from workforce reductions at CSW as the CSW headquarters is closing and operations are moving to a new facility in University Park, IL. The other income and (expense), net in 2022 includes foreign currency translation losses of $1.3 million. In addition, the year 2022 includes losses of $21.3 million on the redemption and repurchase of $300.0 million of the 2028 Notes. Provision for Income Taxes The
Noncontrolling Interest In both Earnings Per Share Basic and diluted earnings per share was 38 well as having fewer shares outstanding in 2023 after the repurchase in 2023 of 3,253,313 shares of common stock, including 2,882,720 shares from Platinum, in addition to the repurchase of 1,700,766 shares of common stock during 2022. Liquidity and Capital Resources The Company’s primary sources of liquidity are cash and cash equivalents, cash flows from operations, and borrowing availability under the Ryerson Credit We had cash and cash equivalents of $54.3 million at December 31,2023, compared to $39.2 million at December Below is a reconciliation of cash and cash equivalents to total liquidity:
Below is a reconciliation of total debt to net debt:
Of the total cash and cash equivalents, as of December 31, 39
The following table summarizes the Company’s cash flows:
Operating activities. Investing activities. The Company's main investing activities are acquisitions, capital expenditures, and proceeds from the sale of property, plant, and equipment. Capital expenditures increased year-over-year to $121.9 million in 2023 compared to $105.1 million in 2022, 40
Financing activities. The Company's main source of liquidity to fund working capital requirements is borrowings on our credit facility. In 2023, acquisitions and capital expenditures, as well as share repurchases and dividends paid, were in excess of cash from operations, which increased borrowings on the Ryerson Credit Facility. In 2022, we repurchased, redeemed, and retired $300.0 million principal of our 2028 Notes, which was partially offset by an increase of $49.0 million in Credit Facility borrowings. In the normal course of business with customers, vendors, and others, we have entered into off-balance sheet arrangements, such as letters of credit, which totaled Total Debt Total debt at December 31, Total debt outstanding as of December 31, Pension Funding The Company made contributions of $8.8 million in 2023, $6.8 million in 2022, and $23.7 million in 2021 Changes in returns on plan assets may affect our plan funding, cash flows, and financial condition. Differences between actual plan asset returns and the expected long-term rate of return on plan assets impact the measurement of the following year’s pension expense and pension funding requirements. However, we believe that cash flow from operations and the Ryerson Credit Facility described above will provide sufficient funds to make the minimum required contributions. Income Tax Payments The Company made income tax payments of $6.2 million in 2023, $176.9 million in 2022, and $70.2 million in Material Cash Requirements The Company expects to make approximately The Company expects to pay approximately 41 The Company leases various assets including real estate, trucks, trailers, cars, mobile equipment, processing equipment, and IT equipment. We have noncancelable operating leases expiring at various times through
months. Purchase obligations with suppliers are entered into when we receive firm sales commitments with certain of our customers. As of December 31,
Deferred Tax Amounts At December 31, In accordance with ASC Topic 740, “Income Taxes,” the Company assesses the realizability of its deferred tax assets. The Company records a valuation allowance when, based upon the evaluation of all available evidence, it is more-likely-than-not that all or a portion of the deferred tax assets will not be realized. In making this determination, we analyze, among other things, our recent history of earnings, the nature and timing of reversing book-tax temporary differences, tax planning strategies, and future income. As of December 31, As described in Note 1 to the Consolidated Financial Statements, the Company assesses the need for a valuation allowance considering all available positive and negative evidence, including past operating results, projections of future taxable income, and the feasibility of ongoing tax planning strategies. The Company will continue to maintain a valuation allowance on certain U.S. federal and foreign deferred tax assets until such time as in management’s judgment, considering all available positive and negative evidence, the Company determines that these deferred tax assets are more likely than not realizable. Critical Accounting Estimates Preparation of this Form 10-K requires us to make estimates and assumptions that affect the reported amount of assets and liabilities, disclosure of contingent assets and liabilities at the date of our financial statements, and the reported amounts of sales and
expenses during the reporting period. Our critical accounting policies, including the assumptions and judgments underlying them, are disclosed in Item 8 within Note 1: Summary of Accounting and Financial Policies. These policies have been consistently applied and address such matters as revenue recognition, depreciation methods, inventory valuation, asset impairment recognition, and pension and postretirement expense. While policies associated with estimates and judgments may be affected by different assumptions or conditions, we believe our estimates and judgments associated with the reported amounts are appropriate in the circumstances. Actual results may differ from those estimates. We consider the policies discussed below as critical to an understanding of our financial statements, as application of these policies places the most significant demands on management’s judgment, with financial reporting results relying on estimation of matters that are uncertain. Provision for allowances, claims, and doubtful accounts: We perform ongoing credit evaluations of customers and set credit limits based upon review of the customers’ current credit information, payment history, and the current economic and industry environments. We monitor customer payments and maintain a provision for estimated credit losses based on historical experience and specific customer collection issues that we have identified. Estimation of such losses requires adjusting historical loss experience for current economic conditions and judgments about the probable effects of economic conditions on certain customers. We cannot guarantee that the rate of future credit losses will be similar to past experience. Provisions for allowances and claims are based upon 42 historical rates, expected trends, and estimates of potential returns, allowances, customer discounts, and incentives. We consider all available information when assessing the adequacy of the provision for allowances, claims, and doubtful accounts. Inventory valuation: Our inventories are stated at the lower of cost or market. The valuation of our inventories at the lower of cost or market could be subject to certain estimates; however, the measurement is primarily based on historical purchasing and sales information rather than forecasted metals pricing. Inventory costs reflect metal and in-bound freight purchase costs, third-party processing costs, and internal direct and allocated indirect processing costs. Cost is primarily determined by the LIFO method. We regularly review inventory on hand and record provisions for obsolete and slow-moving inventory based on historical and current sales trends. Changes in product demand and our customer base may affect the value of inventory on hand which may require higher provisions for obsolete inventory. Income Taxes: Our income tax expense, deferred tax assets and liabilities, and reserve for uncertain tax positions reflect our best estimate of taxes to be paid. The Company is subject to income taxes in the U.S. and several foreign jurisdictions. The determination of the consolidated income tax expense requires judgment and estimation by management. It is possible that actual results could differ from the estimates that management has used to determine its consolidated income tax expense. We record operating loss and tax credit carryforwards and the estimated effect of temporary differences between the tax basis of assets and liabilities and the reported amounts in the Consolidated Balance Sheets. We follow detailed guidelines in each tax jurisdiction when reviewing tax assets recorded on the balance sheet and provide for valuation allowances as required. Deferred tax assets are reviewed for recoverability based on historical taxable income, the expected reversals of existing temporary differences, tax planning strategies, and on forecasts of future taxable income. The forecasts of future taxable income require assumptions regarding volume, selling prices, margins, expense levels, and industry cyclicality. If we are unable to generate sufficient future taxable income in certain tax jurisdictions, we may be required to record additional valuation allowances against our deferred tax assets related to those jurisdictions. The Company’s income tax provisions are based on calculations and assumptions that are subject to examination by the Internal Revenue Service and other tax authorities. Although the Company believes that the positions taken on filed tax returns are reasonable, it has established tax and interest reserves in recognition that various taxing authorities may challenge the positions taken. For uncertain tax positions, the Company applies the provisions of relevant authoritative guidance, which requires application of a “more likely than not” threshold to the recognition and derecognition of tax positions. The Company’s ongoing assessments of the more likely than not outcomes of tax authority examinations and related tax positions require significant judgment and can increase or decrease the Company’s effective tax rate. Long-lived Assets and Other Intangible Assets: Long-lived assets held and used are reviewed for impairment whenever events or changes in circumstances indicate that the carrying amount of an asset may not be recoverable. We estimate the future cash flows expected to result from the use of the asset and its eventual disposition. If the sum of the expected future cash flows (undiscounted and without interest charges) is less than the carrying amount of the asset, an impairment is recognized. Determining whether an impairment has occurred typically requires various estimates and assumptions, including determining which undiscounted cash flows are directly related to the potentially impaired asset, the useful life over which cash flows will occur, their amount, and the asset’s residual value, if any. Any related impairment loss is calculated based upon comparison of the fair value to the carrying value of the asset. Separate intangible assets that have finite useful lives are amortized over their useful lives. An impaired long-lived or intangible
asset would be written down to fair value, based on various available valuation techniques, including the discounted cash flow method. Goodwill: We assess the recoverability of the carrying value of recorded goodwill annually in the fourth quarter of each year or whenever indicators of potential impairment exist. We test for impairment of goodwill by assessing various qualitative factors with respect to developments in our business and the overall economy. Factors that may be considered indicators of impairment include: deterioration in general economic conditions; declines in the market conditions of our products, including metals prices; a sustained significant decline in our share price and market capitalization; reduced future cash flow estimates; and slower growth rates in our industry, among others. If we determine that it is more likely than not that the fair value of a reporting unit is less than the carrying value based on our qualitative assessment, we will proceed to the goodwill impairment test. We compare the fair value of the reporting unit in which goodwill resides to its carrying value. If the carrying amount exceeds the fair value, an impairment loss is recognized in an amount equal to that excess, not to exceed the carrying amount of the goodwill. The fair value of the reporting unit is estimated using a combination of an income approach and a market approach as this combination is deemed to be the most indicative of our fair value in an orderly transaction between market participants. An income approach based on discounted future cash flows requires us to estimate income from operations based on projected results and discount rates based on a weighted average cost of capital of comparable companies. A market approach estimates fair value using market multiples of various financial measures of comparable public companies. If these estimates or their related assumptions for commodity prices and demand change in the future, we may be required to record impairment charges for these assets. 43 Based on the impairment test performed on October 1, Purchase Price Accounting: Business combinations are accounted for using the acquisition method of accounting. This method requires the Company to record assets and liabilities of the business acquired at their estimated fair market values as of the acquisition date. Any excess of the cost of the acquisition over the fair value of the net assets acquired is recorded as goodwill. Any shortfall in the cost of the acquisition compared to the fair value of the net assets acquired is recorded in the Consolidated Statements of Operations as a bargain purchase gain. The Company uses valuation specialists, where necessary, to perform appraisals and assist in the determination of the fair values of the assets acquired and liabilities assumed. These valuations require management to make estimates and assumptions that are critical in determining the fair values of the assets and liabilities. Assets acquired and liabilities assumed that do not constitute a business are accounted for using the cost accumulation and allocation model under which the cost of the acquisition is allocated to the assets acquired and liabilities assumed. Pension and postretirement benefit plan assumptions: We sponsor various benefit plans covering a portion of our employees for pension and postretirement medical costs. Statistical methods are used to anticipate future events when calculating expenses and liabilities related to the plans. The statistical methods include assumptions about, among other things, the discount rate, expected return on plan assets, rate of increase of health care costs, and the rate of future compensation increases. Our actuarial consultants also use subjective factors such as withdrawal and mortality rates when estimating expenses and liabilities. The discount rate used for U.S. plans reflects the market rate for high-quality fixed-income investments on our annual measurement date (December 31) and is subject to change each year. The discount rate When calculating pension expense for Future pension obligations for the U.S. plans were discounted using rates between of
The calculation of other postretirement benefit obligations requires the use of a number of assumptions, including the assumed discount rate between 4.63% and 5.06% at December 31, 2023 for measuring future payment obligations. A decrease in the weighted average discount rate of 50 basis points would increase the postretirement benefit liability by approximately $2 million. The assumptions used in the actuarial calculation of expenses and liabilities may differ materially from actual results due to changing market and economic conditions, higher or lower withdrawal rates, or longer or shorter life spans of participants. These differences may result in a significant impact on the amount of pension or postretirement benefit expense we may record in the future. Legal contingencies: We are involved in a number of legal and regulatory matters including those discussed in Item 8 within Note 44 Recent Accounting Pronouncements Recent accounting pronouncements are discussed within Note 1: Summary of Accounting and Financial Policies in Part II, Item 8 Financial Statements and Supplementary Data. ITEM 7A. QUANTITATIVE AND QUALITATIVE DISCLOSURES ABOUT MARKET RISK. Our primary areas of market risk include changes in interest rates, foreign currency exchange rates, and commodity prices. We continually monitor these risks and develop strategies to manage them. Interest rate risk Market risk is the potential loss arising from adverse changes in market rates and prices, such as interest rates. We are exposed to market risk related to our fixed-rate and variable-rate long-term debt. We may use interest rate swaps to manage our exposure to interest rate
Approximately 1% of our debt is at fixed interest rates as of December 31, Foreign exchange rate risk We are subject to foreign currency risks primarily through our operations in Canada, Mexico, and China and we use foreign currency exchange contracts to reduce our exposure to currency price fluctuations. Foreign currency contracts are principally used to purchase U.S. dollars. We had foreign currency contracts with a U.S. dollar notional amount of
underlying the foreign currency contracts from the market rate as of December 31, The currency effects of translating the financial statements of our foreign subsidiaries are included in accumulated other comprehensive loss and will not be recognized in the statement of operations until there is a liquidation or sale of those foreign subsidiaries. Commodity price risk In general, we purchase metals in an effort to maintain our inventory at levels that we believe to be appropriate to satisfy the anticipated needs of our customers based upon historic buying practices, customer contracts, and market conditions. Our commitments to purchase metals are generally at prevailing market prices in effect at the time we place our orders. Metal prices can fluctuate significantly due to several factors including changes in foreign and domestic production capacity, raw material availability, metals consumption, and foreign currency rates. Derivative financial instruments have been used to manage a limited portion of our exposure to fluctuations in the cost of certain commodities. No derivatives are held for trading purposes. As of December 31, A hypothetical strengthening or weakening of 10% in the commodity prices underlying the commodity derivative contracts from the market rate as of December 31,
ITEM 8. FINANCIAL STATEMENTS AND SUPPLEMENTARY DATA.
Index to Consolidated Financial Statements
MANAGEMENT’S REPORT ON INTERNAL CONTROL OVER FINANCIAL REPORTING
The management of Ryerson Holding Corporation (“the Company”) is responsible for establishing and maintaining adequate internal control over financial reporting. The Company’s internal control system was designed to provide reasonable assurance to the Company’s management and Board of Directors regarding the reliability of financial reporting and the preparation of financial statements for external purposes in accordance with accounting principles generally accepted in the United States of America.
Because of its inherent limitations, internal control over financial reporting may not prevent or detect misstatements under all potential conditions. Therefore, effective internal control over financial reporting provides only reasonable, and not absolute, assurance with respect to the preparation and presentation of financial statements.
The Company’s management assessed the effectiveness of the Company’s internal control over financial reporting as of December 31,
Ernst & Young LLP, an independent registered public accounting firm, has audited the Company’s internal control over financial reporting as of December 31,
REPORT OF INDEPENDENT REGISTERED PUBLIC ACCOUNTING FIRM
To the Stockholders and the Board of Directors of Ryerson Holding Corporation and Subsidiary Companies
Opinion on the Financial Statements
We have audited the accompanying consolidated balance sheets of Ryerson Holding Corporation and
We also have audited, in accordance with the standards of the Public Company Accounting Oversight Board (United States) (PCAOB), the Company's internal control over financial reporting as of December 31,
Basis for Opinion
These financial statements are the responsibility of the Company's management. Our responsibility is to express an opinion on the Company’s financial statements based on our audits. We are a public accounting firm registered with the PCAOB and are required to be independent with respect to the Company in accordance with the U.S. federal securities laws and the applicable rules and regulations of the Securities and Exchange Commission and the PCAOB.
We conducted our audits in accordance with the standards of the PCAOB. Those standards require that we plan and perform the audit to obtain reasonable assurance about whether the financial statements are free of material misstatement, whether due to error or fraud. Our audits included performing procedures to assess the risks of material misstatement of the financial statements, whether due to error or fraud, and performing procedures that respond to those risks. Such procedures included examining, on a test basis, evidence regarding the amounts and disclosures in the financial statements. Our audits also included evaluating the accounting principles used and significant estimates made by management, as well as evaluating the overall presentation of the financial statements. We believe that our audits provide a reasonable basis for our opinion.
Critical Audit Matter
The critical audit matter communicated below is a matter arising from the current period audit of the financial statements that was communicated or required to be communicated to the audit committee and that: (1) relates to accounts or disclosures that are material to the financial statements and (2) involved our especially challenging, subjective, or complex judgments. The communication of the critical audit matter does not alter in any way our opinion on the consolidated financial statements, taken as a whole, and we are not, by communicating the critical audit matter below, providing a separate opinion on the critical audit matter or on the account or disclosure to which it relates.
/s/ Ernst & Young LLP
We have served as the Company’s auditor since 2006.
Chicago, Illinois February
Report of Independent Registered Public Accounting Firm
To the Stockholders and the Board of Directors of Ryerson Holding Corporation and Subsidiary Companies
Opinion on Internal Control
We have audited Ryerson Holding Corporation and As indicated in the accompanying Management’s Report on Internal Control over Financial Reporting, management’s assessment of and conclusion on the effectiveness of internal control over financial reporting did not include the internal controls of BLP Holdings, LLC, Norlen Incorporated, TSA Processing, and Hudson Tool Steel Corporation, which are included in the 2023 consolidated financial statements of the Company and constituted 7.0% and 1.8% of total assets and total liabilities, respectively, as of December 31, 2023 and 0.8% and 1.2% of net sales and net income, respectively, for the year then ended. Our audit of internal control over financial reporting of the Company also did not include an evaluation of the internal control over financial reporting of BLP Holdings, LLC, Norlen Incorporated, TSA Processing, and Hudson Tool Steel Corporation.
We also have audited, in accordance with the standards of the Public Company Accounting Oversight Board (United States) (PCAOB), the
Basis for Opinion
The Company’s management is responsible for maintaining effective internal control over financial reporting and for its assessment of the effectiveness of internal control over financial reporting included in the accompanying Management’s Report on Internal Control over Financial Reporting. Our responsibility is to express an opinion on the Company’s internal control over financial reporting based on our audit. We are a public accounting firm registered with the PCAOB and are required to be independent with respect to the Company in accordance with the U.S. federal securities laws and the applicable rules and regulations of the Securities and Exchange Commission and the PCAOB.
We conducted our audit in accordance with the standards of the PCAOB. Those standards require that we plan and perform the audit to obtain reasonable assurance about whether effective internal control over financial reporting was maintained in all material respects.
Our audit included obtaining an understanding of internal control over financial reporting, assessing the risk that a material weakness exists, testing and evaluating the design and operating effectiveness of internal control based on the assessed risk, and performing such other procedures as we considered necessary in the circumstances. We believe that our audit provides a reasonable basis for our opinion.
Definition and Limitations of Internal Control
A company’s internal control over financial reporting is a process designed to provide reasonable assurance regarding the reliability of financial reporting and the preparation of financial statements for external purposes in accordance with generally accepted accounting principles. A company’s internal control over financial reporting includes those policies and procedures that (1) pertain to the maintenance of records that, in reasonable detail, accurately and fairly reflect the transactions and dispositions of the assets of the company; (2) provide reasonable assurance that transactions are recorded as necessary to permit preparation of financial statements in accordance with generally accepted accounting principles, and that receipts and expenditures of the company are being made only in accordance with authorizations of management and directors of the company; and (3) provide reasonable assurance regarding prevention or timely detection of unauthorized acquisition, use, or disposition of the company’s assets that could have a material effect on the financial statements.
Because of its inherent limitations, internal control over financial reporting may not prevent or detect misstatements. Also, projections of any evaluation of effectiveness to future periods are subject to the risk that controls may become inadequate because of changes in conditions, or that the degree of compliance with the policies or procedures may deteriorate.
50 /s/ Ernst & Young LLP
Chicago, Illinois February
RYERSON HOLDING CORPORATION AND SUBSIDIARY COMPANIES CONSOLIDATED STATEMENTS OF OPERATIONS (In millions, except per share data)
See Notes to Consolidated Financial Statements
RYERSON HOLDING CORPORATION AND SUBSIDIARY COMPANIES CONSOLIDATED STATEMENTS OF COMPREHENSIVE INCOME (In millions)
See Notes to Consolidated Financial Statements
RYERSON HOLDING CORPORATION AND SUBSIDIARY COMPANIES CONSOLIDATED STATEMENTS OF CASH FLOWS (In millions)
See Notes to Consolidated Financial Statements
RYERSON HOLDING CORPORATION AND SUBSIDIARY COMPANIES CONSOLIDATED BALANCE SHEETS (In millions, except shares and per share data)
See Notes to Consolidated Financial Statements
RYERSON HOLDING CORPORATION AND SUBSIDIARY COMPANIES CONSOLIDATED STATEMENTS OF STOCKHOLDERS’ EQUITY (In millions, except shares in thousands)
See Notes to Consolidated Financial Statements
NOTES TO CONSOLIDATED FINANCIAL STATEMENTS Note 1: Summary of Accounting and Financial Policies Business Description and Basis of Presentation. Ryerson Holding Corporation (“Ryerson Holding”), a Delaware corporation, is the parent company of Joseph T. Ryerson & Son, Inc. (“JT Ryerson”), a Delaware corporation. Affiliates of Platinum Equity, LLC (“Platinum”) own approximately We are a leading value-added processor and distributor of industrial metals with operations in the U.S. through JT Ryerson and other U.S. subsidiaries, in Canada through our indirect wholly-owned subsidiary Ryerson Canada, Inc., a Canadian corporation (“Ryerson Canada”), and in Mexico through our indirect wholly-owned subsidiary Ryerson Metals de Mexico, S. de R.L. de C.V., a Mexican corporation (“Ryerson Mexico”). In addition to our North American operations, we conduct materials processing and distribution operations in China through an indirect wholly-owned subsidiary, Ryerson China Limited, a Chinese limited liability company (“Ryerson China”). Unless the context indicates otherwise, Ryerson Holding, JT Ryerson, Ryerson Canada, Ryerson Mexico, and Ryerson China together with their subsidiaries, are collectively referred to herein as “Ryerson,” “we,” “us,” “our,” or the “Company.” Principles of Consolidation. The Company consolidates entities in which it owns or controls more than 50% of the voting shares. All significant intercompany balances and transactions have been eliminated in consolidation. Equity Investments. Investments in affiliates in which the Company’s ownership is 20% to 50% and investments in limited partnerships are accounted for by the equity method. Equity income is reported in other income and (expense), net in the Consolidated Statements of Operations. Equity loss amounted to $0.1 million for the year ended December 31, 2023. Equity income during the years ended December 31, 2022 and 2021 Business Segments. Financial Accounting Standards Board (“FASB”) Accounting Standards Codification (“ASC”) 280, “Segment Reporting” (“ASC 280”), establishes standards for reporting information on operating segments in interim and annual financial statements. Our Board of Directors, which includes our Chief Executive Officer, serve as our Chief Operating Decision Maker (“CODM”). Our CODM reviews our financial information for purposes of making operational decisions and assessing financial performance. The CODM views our business globally as metals service centers. We have one operating and reportable segment, metal service centers, in accordance with the criteria set forth in ASC 280. Use of Estimates. The preparation of financial statements in conformity with Generally Accepted Accounting Principles (“GAAP”) in the U.S. requires management to make estimates and assumptions that affect the amounts reported in the consolidated financial statements and related notes to the financial statements. Changes in such estimates may affect amounts reported in future periods. Revenue Recognition. Revenue is recognized in accordance with FASB ASC 606, “Revenue from Contracts with Customers” (“ASC 606”). Revenue is recognized based on the consideration expected to be received for delivery of as-is or processed metal products when, or as, the Company satisfies its contractual obligation to transfer control of a product to a customer, which we refer to as a performance obligation. See Note Provision for allowances, claims, and doubtful accounts. The Company follows the guidance under ASC 326 “Financial Instruments – Credit Losses” (“ASC 326”). The Company monitors customer payments and maintains a provision for estimated credit losses based on historical experience and specific customer collection issues that the Company has identified. Estimation of such losses requires adjusting historical loss experience for current economic conditions and judgments about the probable effects of economic conditions on certain customers. See Note Shipping and Handling Fees and Costs. Shipping and handling fees billed to customers are classified in net sales in our Consolidated Statement of Operations. Shipping and handling costs are classified in warehousing, delivery, selling, general, and administrative expenses in our Consolidated Statement of Operations. These costs totaled $ 56 elected to treat shipping and handling costs as an activity necessary to fulfill the performance obligation to transfer product to the customer and not as a separate performance obligation. Shipping and handling costs are estimated at quarter end in proportion to revenue recognized for transactions where actual costs are not yet known.
Benefits for Retired Employees. The Company recognizes the funded status of its defined benefit pension and other postretirement plans in the Consolidated Balance Sheets, with changes in the funded status recognized through accumulated other comprehensive income (loss), in the year in which the changes occur. Service cost is included in warehousing, delivery, selling, general, and administrative expenses and all other components of net benefit costs are recognized in other income and (expense), net, in the Consolidated Statement of Operations. The estimated cost of the Company’s defined benefit pension plan and its postretirement medical benefits are determined annually or upon plan remeasurement after considering information provided by consulting actuaries. Key factors used in developing estimates of these liabilities include assumptions related to discount rates, rates of return on investments, mortality rates, future compensation costs, healthcare cost trends, benefit payment patterns, and other factors. The cost of these benefits for retirees is accrued during their term of employment. Pensions are funded primarily in accordance with the requirements of the Employee Retirement Income Security Act (“ERISA”) of 1974 and the Pension Protection Act of 2006. Costs for retired employee medical benefits are funded when claims are submitted. Certain employees are covered by a defined contribution plan, for which the cost is expensed in the period earned. Cash Equivalents. Cash equivalents reflected in the financial statements are highly liquid, short-term investments with original maturities of three months or less. Checks issued in excess of funds on deposit at the bank represent “book” overdrafts. We reclassified $ Inventory Valuation. Inventories are stated at the lower of cost or market value. We primarily use the last-in, first-out (“LIFO”) method for valuing our domestic inventories. We use the moving average cost and the specific cost methods for valuing our foreign inventories. Property, Plant, and Equipment. Property, plant, and equipment, including land use rights and finance lease assets, are depreciated for financial reporting purposes using the straight-line method over the estimated useful lives of the assets. The provision for depreciation in all periods presented is based on the following estimated useful lives of the assets:
Expenditures for normal repairs and maintenance are charged against income in the period incurred. Internal-Use Software. Software is recognized in accordance with FASB ASC 350-40, Leases. Leases are recognized in accordance with FASB ASC 842, “Leases” (“ASC 842”). The Company leases various assets including real estate, trucks, trailers, mobile equipment, processing equipment, and IT equipment. See Note 6: Leases, for further details. 57 Goodwill. In accordance with FASB ASC 350, “Intangibles – Goodwill and Other” (“ASC 350”), goodwill is reviewed at least annually for impairment or whenever indicators of potential impairment exist. We test for impairment of goodwill by assessing various qualitative factors with respect to developments in our business and the overall economy. If we determine that it is more likely than not that the fair value of a reporting unit is less than the carrying value based on our qualitative assessment, we will proceed to
the quantitative goodwill impairment test, in which we compare the fair value of the reporting unit where the goodwill resides to its carrying value. If the carrying amount of goodwill exceeds its implied fair value, an impairment loss is recognized in an amount equal to that excess, not to exceed the carrying amount of the goodwill. The fair value of the reporting unit is estimated using a combination of an income approach and a market approach as this combination is deemed to be the most indicative of fair value in an orderly transaction between market participants. Long-lived Assets and Other Intangible Assets. Long-lived assets held and used by the Company are reviewed for impairment whenever events or changes in circumstances indicate that the carrying amount of an asset may not be recoverable.
Deferred Financing Costs. Deferred financing costs associated with the issuance of debt are being amortized using either the effective interest method or straight line method over the life of the debt in accordance with FASB ASC 470, “Debt” (“ASC 470”). Deferred financing costs related to a recognized debt liability are presented in the balance sheet as a direct deduction from the carrying amount of the related debt liability. Foreign Currency. The Company translates assets and liabilities of its foreign subsidiaries, where the functional currency is the local currency, into U.S. dollars at the current rate of exchange on the last day of the reporting period. Revenues and expenses are translated at the average monthly exchange rates prevailing during the year. For foreign currency transactions, the Company translates these amounts to the Company’s functional currency at the exchange rate effective on the invoice date. If the exchange rate changes between the time of purchase and the time actual payment is made, a foreign exchange transaction gain or loss results which is included in determining net income Income Taxes. Deferred tax assets or liabilities reflect temporary differences between amounts of assets and liabilities for financial and tax reporting. Such amounts are adjusted, as appropriate, to reflect changes in enacted tax rates expected to be in effect when the temporary differences reverse. A valuation allowance is established to offset any deferred tax assets if, based upon the available evidence, it is more likely than not that some or all of the deferred tax assets will not be realized. The determination of the amount of a valuation allowance to be provided on recorded deferred tax assets involves estimates regarding (1) the timing and amount of the reversal of taxable temporary differences, (2) expected future taxable income, (3) the impact of tax planning strategies, and (4) the ability to carry back tax losses to offset prior taxable income. In assessing the need for a valuation allowance, the Company considers all available positive and negative evidence, including past operating results, projections of future taxable income, and the feasibility of ongoing tax planning strategies. The projections of future taxable income include a number of estimates and assumptions regarding volume, pricing, costs, and industry cyclicality. Significant judgment is required in determining income tax provisions and in evaluating tax positions. In the normal course of business, the Company and its subsidiaries are examined by various federal, state, and foreign tax authorities. The Company records the impact of a tax position, if that position is more likely than not (i.e., greater than 50% likely) to be sustained in audit, based on the technical merits of the position. The Company regularly assesses the potential outcomes of these examinations and any future examinations for the current or prior years in determining the adequacy of our provision for income taxes. The Company continually assesses the likelihood and amount of potential adjustments and adjusts the income tax provision, the current tax liability, and deferred taxes in the period in which the facts that give rise to a revision become known. The Company recognizes the benefit of tax positions when a benefit is more likely than not to be sustained on its technical merits. Recognized tax benefits are measured at the largest amount that is more likely than not to be sustained, based on cumulative probability, in final settlement of the position. The Company recognizes interest and penalties related to unrecognized tax benefits as a component of income tax expense.
Earnings Per Share Data. Basic earnings per share (“EPS”) is computed by dividing net earnings available to common stockholders by the weighted average number of common shares outstanding for the period. Diluted earnings per share is computed by giving effect to all dilutive potential common shares that were outstanding during the period, unless inclusion of the potential common shares would have an antidilutive effect. Basic earnings per share excludes the dilutive effect of common stock equivalents such as stock options and warrants, while diluted earnings per share, assuming dilution, includes such dilutive effects. Stock-Based Compensation. All of our stock-based compensation plans are classified as equity awards. The fair value of restricted stock units (“RSUs”) and performance stock units (“PSUs”) is determined based on the fair value of our common stock on the grant date. The fair value of stock options is estimated based on a Monte Carlo simulation and considers variables such as volatility, dividend yield, risk-free rate, and the expected exercise multiple in computing the value of the options. The fair value of stock options, RSUs, and PSUs is expensed on a straight-line basis over their respective vesting periods. We have elected to recognize forfeitures as they occur. See Note
Recent Accounting Pronouncements Impact of Recently Issued Accounting Standards–Adopted No accounting pronouncements have been issued that impact our financial statements. Impact of Recently Issued Accounting Standards–Not Yet Adopted In November 2023, FASB issued Accounting Standard Update (“ASU”) 2023-07, “Segment Reporting (Topic 280)”. The amendments in this update require public entities to enhance segment disclosures on both an interim and annual basis. These disclosures include, among others, significant segment expenses regularly reviewed by the chief operating decision maker (CODM), an amount for other segment items, and title and position of the CODM and how the CODM uses this information in assessing performance. The ASU is effective for fiscal years beginning after December 15, 2023 and interim periods of fiscal years beginning after December 15, 2024 and should be adopted retrospectively to all prior periods presented in the financial statements. We In December 2023, FASB issued ASU 2023-09, “Income Taxes (Topic 740)”. The amendments in this update require public businesses to disclose specific categories in the rate reconciliation and further information for reconciling items that meet a quantitative threshold. This update also requires further disclosures of income taxes paid disaggregated by federal, state, and foreign jurisdictions as well as by the individual jurisdiction in which income taxes are Note 2: Acquisitions 2023 Acquisitions On On October 2, 2023, JT Ryerson acquired Norlen Incorporated ("Norlen"). Based out of Schofield, Wisconsin, Norlen is a full-service metal fabricator, providing stamping, machining, painting, and additional value-added fabrication services to industries including agriculture, HVAC, and defense. On November 1, 2023, JT Ryerson acquired TSA Processing ("TSA"). Headquartered in Houston, Texas, with five other locations across the Midwest and Southern United States, TSA is a stainless steel and aluminum coil and sheet processor. On December 1, 2023, JT Ryerson acquired Hudson Tool Steel Corporation ("Hudson"). Hudson is headquartered in Cerritos, California, with two facilities located in the Midwest and Northeast. Hudson is a supplier of tool steels and high-speed, carbon, and alloy steels. 59 The 2023 acquisitions will strengthen and expand JT Ryerson's valued-add services within our industry-leading stainless and aluminum franchises as well as our tool steel capabilities which will allow us to increase our offerings to better serve our diverse customer base across our entire network. We paid a total of $127.5 million, net of cash acquired, as of December 31, 2023 for the 2023 acquisitions. As of December 31, 2023, there was $2.1 million of unpaid purchase consideration accrued on the Consolidated Balance Sheet relating to holdback payments expected to be paid within 18 months, working capital true ups, and contingent consideration. We deemed the 2023 acquisitions individually immaterial, yet significant in the aggregate to the Consolidated Balance Sheet. Included in our Statement of Operations for the year-ended December 31, 2023 were net sales of $43.2 million and net income of $1.8 million related to the 2023 acquisitions. The Consolidated Statement of Operations as of December 31, 2023 includes revenues and expenses of each acquisition since its respective acquisition date. The 2023 acquisitions are insignificant to the Company's Consolidated Statement of Operations for the year-ended December 31, 2023. The preliminary allocations of the total purchase price from our combined 2023 acquisitions to the fair values of the assets acquired and liabilities assumed were as follows:
The purchase price allocations for our 2023 acquisitions are pending the completion of The 2023 acquisitions discussed above were all accounted for under the acquisition method of accounting and, accordingly, the purchase price for each transaction has been allocated to the assets acquired and liabilities assumed based on the estimated fair values at the date of each acquisition. As needed, for each transaction the Company used a Included in As part of the purchase price allocations for the 2023 acquisitions, we allocated $7.6 million to trade names and 2023 Asset Acquisition During the first six months of 2023, JT Ryerson completed the purchase of certain assets from ExOne Operating, LLC. The total amount paid by JT Ryerson
60
2022 Acquisition Activity On November 1, 2022, JT Ryerson paid $31.8 million to acquire Excelsior, Inc. Note 3: Cash, Cash Equivalents, and Restricted Cash The following table provides a reconciliation of cash, cash equivalents, and restricted cash reported within the Consolidated Balance Sheets that sum to the total of the beginning and ending cash balances shown in the Consolidated Statements of Cash Flows:
We had cash restricted for the purposes of covering letters of credit that can be presented for potential insurance claims. Note 4: Inventories The Company primarily uses the last-in, first-out
If current cost had been used to value inventories, such inventories would have been $ The Company has consignment inventory at certain customer locations, which totaled $ Note 5: Property, Plant, and Equipment Property, plant, and equipment consisted of the following at December 31,
61
During the year ended December 31, 2021, the Company completed several asset sales in the form of sale-leasebacks to generate cash proceeds that were, in part, utilized to redeem a portion of the 8.50% senior secured notes due 2028 (the “2028 Notes”), and also in a continued effort to optimize our facility footprint. Each of these sale-leasebacks were for varying periods of time, ranging from 21 months to 15 years, and therefore the Company recorded right of use assets of $95.1 million and lease liabilities of $86.4 million. See Note 6: Leases for further discussion of the individually significant leaseback transaction. As a result of these transactions, $65.4 million of land and building assets, net of accumulated depreciation, were sold for net cash proceeds of $163.2 million, resulting in a total gain of $107.7 million. The Company also had normal course asset sale activity which generated additional cash proceeds of $ Note 6: Leases The Company leases various assets including real estate, trucks, trailers, cars, mobile equipment, processing equipment, and IT equipment. The Company has noncancelable operating leases expiring at various times through Policy Elections & Practical Expedients The Company has made an accounting policy election not to record leases with an initial term of twelve months or less (“short term leases”) on the balance sheet as allowed within ASC 842. Short term lease expense is recognized on a straight-line basis over the lease term. The Company has elected to apply the practical expedient that allows for the combination of lease and non-lease components for all asset classes. Significant Judgments Many of our real estate leases include one or more options to renew, with renewal terms that can extend the lease term from one to 5 years or more. To determine the expected lease term, we include any noncancelable periods within the lease agreement as well as any periods covered by an option to extend the lease if we are reasonably certain to exercise the option. The equipment leases do not typically include options for renewal but may include options for purchase at the end of the lease. We determine the likelihood of exercising the option for purchase by assessing the option price versus the estimated fair value at the end of the lease term to determine if the option price is advantageous enough that we are reasonably certain to exercise it. The depreciable life of finance lease assets and leasehold improvements are limited by the expected lease term, unless there is a transfer of title or purchase option reasonably certain of exercise. Lease payments include fixed payments, the exercise price of a purchase option that is reasonably certain of exercise, variable payments based on a known index, and the amount probable that the Company will owe under a residual value guarantee. Variable lease payments that are not based on a known index are not included in lease payments and are expensed as incurred. The discount rate used to determine the amount of right of use assets, lease liabilities, and lease classification is the interest rate implicit in the lease, when known. If the rate implicit in the lease is not known, the Company will use its incremental borrowing rate defined as the interest rate swap rate that approximates the lease term plus the long-term expected spread on the $1.3 billion revolving credit facility amended as of June 29, 2022 (the “Ryerson Credit Facility”). In June 2021, we sold and leased back a group of service center properties located in Delaware, Florida, Kentucky, Minnesota, Missouri, Oklahoma, Pennsylvania, Tennessee, Texas, and Virginia for net proceeds of approximately $104 million. The total annual rent for the properties starts at approximately $6.4 million per year, with the amount increasing
In the third quarter of 2022, a long-term operating lease commenced for a new state-of-the-art facility in Centralia, Washington. The starting annual rent is approximately $2.8 million per year, with annual increases of 2.25% over the 20-year lease term and any renewal terms. The lease includes two renewal options of five years each. Under the terms of the lease agreement, the Company is responsible for all taxes, insurance, and utilities, as well as adequately maintaining the property for the lease term. The initial right of
use asset and operating lease liability recorded in the Consolidated Balance Sheet was $51.2 million and $46.1 million, respectively, the difference of $5.1 million is related to a lease prepayment. 62 In the second quarter of 2023, a long-term operating lease commenced for a new state-of-the-art service center facility in University Park, Illinois. The starting annual rent is approximately $7.3 million per year, with annual increases of 2.2% over the 15-year and 4-month lease term. The lease includes four renewal options of five years each at fair market value. Under the terms of the lease agreement, the Company is responsible for all taxes, insurance, and property management fees. The initial right of use asset and operating lease liability recorded in the Condensed Consolidated Balance Sheet was $99.9 million. The following table summarizes the location and amount of lease assets and lease liabilities reported in our Consolidated Balance Sheets as of December 31,
(a) Finance lease assets are recorded net of accumulated amortization of $ The following table summarizes the location and amount of lease expense reported in our Consolidated Statements of Operations for the twelve months ended December 31, 2023, 2022
63
The following table presents the maturity analysis of lease liabilities at December 31,
(a) There were no operating leases with options to extend lease terms that are reasonably certain of being exercised, and (b) Calculated using the discount rate for each lease. (c) Includes the current portion of $ The following table shows the weighted-average remaining lease term and discount rate for operating and finance leases, respectively, at December 31,
Information reported in our Consolidated Statement of Cash Flows for the twelve months ended December 31, 2023, 2022,
64
Note 7: Definite-Lived Intangible Assets The following summarizes the components of definite-lived intangible assets at December 31,
Amortization expense related to intangible assets reported in warehousing, delivery, selling, general, and administrative expense in our Consolidated Statements of Operations for the years ended December 31, 2023, 2022, Estimated amortization expense related to intangible assets at December 31, 2023, for each of the years in the five year period ending December 31,
Note 8: Goodwill Goodwill represents the excess of cost over the fair value of net assets acquired. The following is a summary of changes in the carrying amount of goodwill for the years ended December 31,
In Pursuant to ASC 350, “Intangibles – Goodwill and Other,” we review the recoverability of goodwill annually as of October 1 or whenever significant events or changes occur which might impair the recovery of recorded amounts. Based on our October 1, annual goodwill impairment test, we determined there was no goodwill impairment in 65
Note Long-term debt consisted of the following at December 31,
The principal payments required to be made on debt during the next five fiscal years are shown below:
Ryerson Credit Facility On June 29, 2022, Ryerson entered into a fifth amendment of its revolving credit facility to among other things, increase the facility size from $1.0 billion to $1.3 billion and to extend the maturity date from November 5, 2025 to June 29, 2027 (as amended, the “Ryerson Credit Facility” or “Credit Facility”). This fifth amendment maintains the ability to convert up to $100 million of commitments under the Ryerson Credit Facility into a “first-in, last-out” sub-facility (the “FILO Facility”). Subject to certain limitations, such conversion can be made from time to time (but no more than twice in the aggregate) prior to the date that is two years after June 29, 2022. At December 31, Amounts outstanding under the Ryerson Credit Facility bear interest at (i) a rate determined by reference to (A) the base rate (the highest of the Federal Funds Rate plus 0.50%, Bank of America’s prime rate, and the Term Secured Overnight Financing Rate (“SOFR”) plus 1.00%) or (B) a Term SOFR rate or (ii) for Ryerson Holding’s Canadian subsidiary that is a borrower, (A) the prime rate or base rate (the highest of the Federal Funds Rate plus 0.50%, Bank of America-Canada Branch’s commercial loan rate, and the Term SOFR rate plus 1.00%), (B) a Term SOFR rate (for loans denominated in Dollars), or (C) the Canadian Dollar Offered Rate (“CDOR”) (for loans denominated in Canadian Dollars). The spread over the base rate is between 0.25% and 0.50% and the spread over the SOFR and CDOR rates is between 1.25% and 1.50%, depending on the amount available to be borrowed under the Ryerson Credit Facility; provided that such spreads shall be reduced by 0.125% if the leverage ratio set forth in the most recently delivered 66 compliance certificate is less than or equal to 3.50 to 1.00. The spread with respect to the FILO Facility, if any, will be determined at the time the commitments under the Ryerson Credit Facility are converted into such FILO Facility. Ryerson also pays commitment fees on amounts not borrowed at a rate of 0.20%. Overdue amounts and all amounts owed during the existence of a default bear interest at 2.00% above the rate otherwise applicable thereto. Loans advanced under the FILO Facility may only be prepaid if all then outstanding revolving loans are repaid in full.
Borrowings under the Ryerson Credit Facility are secured by first-priority liens on all of the inventory, accounts receivables, lockbox accounts, and related assets of the borrowers and the guarantors.
The Ryerson Credit Facility also contains covenants that, among other things, restrict Ryerson Holding and its restricted subsidiaries with respect to the incurrence of debt, the creation of liens, transactions with affiliates, mergers and consolidations, sales of assets, and acquisitions. The Ryerson Credit Facility also requires that, if availability under the Ryerson Credit Facility declines to a certain level, Ryerson maintain a minimum fixed charge coverage ratio as of the end of each fiscal quarter. The Ryerson Credit Facility contains events of default with respect to, among other things, default in the payment of principal when due or the payment of interest, fees, and other amounts due thereunder after a specified grace period, material misrepresentations, failure to perform certain specified covenants, certain bankruptcy events, the invalidity of certain security agreements or guarantees, material judgments, the occurrence of a change of control of Ryerson, and a cross-default to other financing arrangements. If such an event of default occurs, the lenders under the Ryerson Credit Facility will be entitled to various remedies, including acceleration of amounts outstanding under the Ryerson Credit Facility and all other actions permitted to be taken by secured creditors. The lenders under the Ryerson Credit Facility could reject a borrowing request if any event, circumstance, or development has occurred that has had or could reasonably be expected to have a material adverse effect on the Company. If Ryerson Holding, JT Ryerson, any of the other borrowers, or any restricted subsidiaries of JT Ryerson becomes insolvent or commences bankruptcy proceedings, all amounts borrowed under the Ryerson Credit Facility will become immediately due and payable. Net
On July 22, 2020, JT Ryerson issued $500 million in aggregate principal amount of its 2028 Senior Secured Notes. The
During the fourth quarter of 2020, JT Ryerson completed a partial redemption of $50 million of aggregate principal amount of During 2022, the
expense. Foreign Debt At December 31, 2023, Ryerson China’s total foreign borrowings were $5.4 million, which were owed to banks in Asia at a weighted average interest rate of 3.4% per annum and secured by inventory and property, plant, and equipment. Ryerson China had 67 additional $0.6 million debt related to letter of credit drawdowns that incur service charges (an initiation fee ranging between 0.15% and 0.30% and a redemption fee ranging from zero and 0.13% per month), rather than interest. These balances are not secured with any of Ryerson China's assets. At December 31, 2022, Ryerson China’s total foreign borrowings were $4.0 million, which were owed to banks in Asia at a weighted average interest rate of 3.6% per annum and secured by inventory and property, plant, and equipment. Availability under Ryerson China’s credit facility was $ Note The Company accounts for its pension and postretirement plans in accordance with FASB ASC 715, “Compensation – Retirement Benefits” (“ASC 715”). In addition to requirements for an employer to recognize in its Consolidated Balance Sheet an asset for a plan’s overfunded status or a liability for a plan’s underfunded status and to recognize changes in the funded status of a defined benefit postretirement plan in the year in which the changes occur, ASC 715 requires an employer to measure a plan’s assets and its obligations that determine its funded status as of the end of the employer’s fiscal year. Prior to January 1, 1998, the Company’s non-contributory defined benefit pension plan (“Ryerson Pension Plan” or “RPP”) covered certain employees, retirees, and their beneficiaries. Benefits provided to participants of the plan were based on pay and years of service for salaried employees and years of service and a fixed rate or a rate determined by job grade for all wage employees, including employees under collective bargaining agreements. Effective January 1, 1998, the Company froze the benefits accrued under its defined benefit pension plan for certain salaried employees and instituted a defined contribution plan. Effective March 31, 2000, benefits for certain salaried employees of J. M. Tull Metals Company and AFCO Metals, subsidiaries that were merged into JT Ryerson, were similarly frozen, with the employees becoming participants in the Company’s defined contribution plan. Employees who vested in their benefits accrued under the defined benefit plan at December 31, 1997 and March 31, 2000, are entitled to those benefits upon retirement. The Company offers a defined contribution plan to eligible employees. For the years ended December 31, 2023, 2022,
Effective September 24, 2021, the Ryerson Pension Plan purchased $206.6 million of annuities on behalf of a portion of plan participants which, due to the size of the transaction, resulted in settlement accounting. The pension plan was remeasured as of September 30, 2021. The remeasurement resulted in a settlement loss of $98.3 million. As a result of the remeasurement, the discount rate increased from 2.42% to 2.80% and the expected long-term rate of return on pension assets decreased from 5.05% to 4.35%.
Central Steel and Wire Company (“CSW”), a subsidiary of JT Ryerson, also has a non-contributory defined benefit pension plan (“Central Steel and Wire Retirement Plan” or “CSWPP”), which covers certain employees, retirees, and their beneficiaries. CSWPP paid $ Due to the in progress closure of CSW's headquarters in Chicago, IL and move to University Park, IL, a significant reduction in the future service years of employees is expected due to headcount reductions between the fourth quarter of 2023 and first quarter of 2024, triggering curtailment accounting. Since the curtailment accounting is resulting in a net gain, the gain is required to be reflected in the periods as they are realized, resulting in a curtailment gain of $0.5 million recognized in the fourth quarter of 2023 for those terminated during that period. An additional curtailment gain is expected in the first quarter of 2024 as the remaining headcount reductions occur. See Note 20: Subsequent Events for details of pension related activity occurring after December 31, 2023. The Company’s U.S. other postretirement benefit plans include the Ryerson Postretirement Welfare Plans (“Ryerson OPEB”) and Central Steel and Wire Postretirement Medical Plan (“CSW OPEB”). Related to the CSW move to University Park discussed above, curtailment accounting has also been applied for the CSW OPEB plan, The curtailment gain recognized in the fourth quarter of 2023 is $0.3 million, with an additional gain expected to be recognized in the first quarter of 2024. 68 The Company has other deferred employee benefit plans, including supplemental pension plans, the liability for which totaled $ Summary of Assumptions and Activity The tables included below provide reconciliations of benefit obligations and fair value of plan assets of the Company plans as well as the funded status and components of net periodic benefit costs for each period related to each plan. The Company uses a December 31 measurement date to determine the pension and other postretirement benefit information. The Company had an additional measurement The assumptions used to determine benefit obligations at the end of the periods and net periodic benefit costs for the
The expected rate of return on plan assets is
The assumptions used to determine benefit obligations at the end of the periods and net periodic benefit costs for the Other Postretirement Benefits, primarily health care, for U.S. plans were as follows:
The assumptions used to determine benefit obligations at the end of the periods and net periodic benefit costs for the Pension Benefits for Canadian plans were as follows:
The expected rate of return on Canadian plan assets for
The assumptions used to determine benefit obligations at the end of the periods and net periodic benefit costs for the Other Postretirement Benefits, primarily healthcare, for Canadian plans were as follows:
Canadian benefit obligations represented $ The pension benefit obligations recorded as of December 31, Amounts recognized in accumulated other comprehensive income (loss) at December 31,
Amounts recognized in other comprehensive income (loss) for the years ended December 31,
For benefit obligation measurement purposes for Ryerson U.S. plans at December 31, 2023, the annual rate of increase in the per capita cost of covered health care benefits for participants under 65 was 7.1 percent, grading down to 4.5 percent in 2032, the level at which it is expected to remain. The rate for participants over 65 was 7.5 percent grading down to 4.5 percent in 2032. For measurement purposes for U.S. plans at December 31, 2022, the annual rate of increase in the per capita cost of covered health care benefits for participants under 65 was 7.3 percent, grading down to 4.5 percent in 2031, the level at which it is expected to remain. The rate for participants over 65 was 7.8 percent grading down to 4.5 percent in 2031. For benefit obligation measurement purposes for Canadian plans, at both December 31, 2023 and December 31, 2022, the annual rate of increase in the per capita cost of covered health care benefits ranged from 4.5 to 4.9 percent per annum, grading up to a range of 5.3 to 5.6 percent in 2026, and then down to 4.1 percent in 2040, the level at which it is expected to remain. The components of the Company’s net periodic benefit cost for the years ended December 31, 2023, 2022,
The assumed health care cost trend rate has an effect on the amounts reported for the health care plans. For purposes of determining net periodic benefit cost for U.S plans, the annual rate of increase in the per capita cost of covered health care benefits for pre-65 and post-65 participants was Pension Trust Assets The expected long-term rate of return on pension trust assets is
The Company’s pension trust asset allocations at December 31,
The investment policies and plan asset target allocations are established by Ryerson’s internal management Employee Benefits Committee, as delegated by the Board of Directors, in consultation with investment advisors. The Employee Benefits Committee provides on-going oversight of the plan assets in accordance with the approved policies and asset allocation ranges and has the authority to appoint and dismiss investment managers. The investment policy objectives are to seek a competitive rate of return relative to an appropriate level of risk depending on the funded status of each plan and the timing of expected benefit payments. As plan funded status improves, the asset allocations will move along a predetermined, de-risking glide path that reallocates capital from growth assets to fixed income assets in order to preserve asset gains and reduce funded status volatility. The currently approved asset investment classes are cash, fixed income, domestic equities, international equities, real estate, private equities, and hedge funds of funds. The approved weighted-average target ranges and allocations as of the December 31,
Fair Value Measurements To increase consistency and comparability in fair value measurements, FASB ASC 820 "Fair Value Measurement" ("ASC 820") establishes a fair value hierarchy that prioritizes the inputs to valuation techniques used to measure fair value into three levels as follows: 1. Level 1 – quoted prices (unadjusted) in active markets for identical assets or liabilities that the Company has the ability to access as of the reporting date. 2. Level 2 – inputs other than quoted prices included within Level 1 that are directly observable for the asset or liability or indirectly observable through corroboration with observable market data. 3. Level 3 – unobservable inputs, such as internally-developed pricing models for the asset or liability due to little or no market activity for the asset or liability. 73 The fair value of our pension plan assets at December 31, 2023 by asset category are as follows:
The fair value of our pension plan assets at December 31, 2022 by asset category are as
The pension assets classified as Level 2 investments in Certain investments that are measured at fair value using the net asset value per share practical expedient have not been classified in the fair value hierarchy in accordance with ASU 2015-07, “Disclosures for Investments in Certain Entities That Calculate Net Asset Value per Share (or Its Equivalent).” Securities listed on one or more national securities exchanges are valued at their last reported sales price on the date of valuation. If no sale occurred on the valuation date, the security is valued at the mean of the last “bid” and “ask” prices on the valuation date. Corporate and government bonds which are not listed or admitted to trading on any securities exchanges are valued at the average mean of the last bid and ask prices on the valuation date based on quotations supplied by recognized quotation services or by reputable broker dealers. The non-publicly traded securities, other securities, or instruments for which reliable market quotations are not available are valued at each investment manager’s discretion. Valuations will depend on facts and circumstances known as of the valuation date and application of certain valuation methods. Contributions The Company contributed $ 74 Estimated Future Benefit Payments
Multiemployer Pension and Other Postretirement Plans We participate in two multiemployer pension plans covering Note Under the 2014 Omnibus Incentive Plan (“2014 Plan”), as amended, which is the Company’s only equity compensation plan, we may grant stock options and other equity-based awards, including RSUs and PSUs, to certain employees. At December 31, Compensation expense for stock options, RSUs, and PSUs is recognized ratably over the service period of the award and reflects forfeitures as they occur. Compensation expense for RSUs and PSUs is based on the market price of the shares underlying the awards on the grant date, and further for PSUs, reflects the estimated level of performance condition attainment. Compensation expense and total recognized tax benefit related to stock options, RSUs, and PSUs are as follows:
On March 31, 2021, the Company granted 125,000 market condition options to certain employees under the 2014 Plan. The options are subject to a graded vesting schedule over a four-year period provided two vesting conditions are both satisfied on each applicable vesting date, with a fifth year catch up provision that allows for vesting if any of the four individual vesting tranche conditions are not met. Once vested, the employee can exercise the option in exchange for one share of the Company’s common stock. Options expire 10 years from the grant date, or generally within 90 days of employee termination. Options, whether vested or unvested, do not participate in dividends. The fair value of options is estimated based on a Monte Carlo simulation. The Monte Carlo simulation considers variables such as volatility, dividend yield, risk-free rate, and the expected exercise multiple in computing the value of the options. No stock options 75 were granted in The assumptions used in the Monte Carlo simulation were as follows:
Stock option activity under the plan is as follows:
In 2023, 2022, The fair value of the 2023, 2022, A summary of the status of our unvested RSUs and PSUs as of December 31,
(1) The RSU shares granted line includes dividend shares declared after the grant date that will vest with their respective RSU tranche. The total fair value of RSUs and PSUs vested during 2023, 2022, and 2021 76 As of December 31, In 2023, 2022, Note Purchase Obligations To fulfill contractual requirements for certain customers, the Company entered into certain fixed price noncancellable contractual obligations. At December 31,
Concentrations of Various Risks The Company’s financial instruments consist of cash and cash equivalents, accounts receivable, derivative instruments, accounts payable, and long-term debt. In the case of cash, accounts receivable, accounts payable, and long-term debt, the carrying amount on the balance sheet approximates the fair value due to the short-term nature of these instruments. The underlying borrowings on the Ryerson Credit Facility are typically for terms of 30 to 60 days. The derivative instruments are marked to market each period, see Note The Company’s financial instruments that are exposed to concentrations of credit risk consist primarily of derivative financial instruments and trade accounts receivable. Our derivative financial instruments are contracts placed with major financial institutions. Credit is generally extended to customers based upon an evaluation of each customer’s financial condition, with terms consistent in the industry and no collateral required. Concentrations of credit risk with respect to trade accounts receivable are limited due to the large number of customers and their dispersion across geographic areas and industries. Approximately 8% of our total labor force is covered by collective bargaining agreements. There are collective bargaining agreements that will expire in Litigation In October 2011, the United States Environmental Protection Agency (the “EPA”) named JT Ryerson as one of more than 100 businesses that may be a potentially responsible party (“PRP”) for the Portland Harbor Superfund Site (the “PHS Site”). There are sixteen project areas identified within the PHS Site; JT Ryerson’s identification as a One hundred percent of the PHS Site is currently in the active remedial design phase, with plans being developed by various members of the Portland Harbor Participation and Common Interest Group (“PCI Group”)
77 point a six-month mediation period will commence. All PRPs, including JT Ryerson, The
The EPA has stated that it is willing to consider de minimis settlements, which JT Ryerson is trying to pursue; however, the EPA has As the EPA has not yet allocated responsibility for the contamination among the potentially responsible parties, including JT Ryerson, we do not currently have sufficient information available to us to determine whether the ROD will be executed as currently stated, whether and to what extent JT Ryerson may be held responsible for any of the identified contamination, and how much (if any) of the final plan’s costs might ultimately be allocated to JT Ryerson. Therefore, management cannot predict the ultimate outcome of this matter or estimate a range of potential loss at this time. There are various other claims and pending actions against the Company. The amount of liability, if any, for those claims and actions as of December 31, Note We have one operating and reportable segment, metals service centers. The Company derives substantially all of its sales from the distribution of metals. See Note No customer, including their subcontractors, accounted for more than The following tables summarize consolidated financial information of our operations by geographic location based on where sales originated or where the assets are held:
Note Derivatives The Company may use derivatives to partially offset its business exposure to commodity price, foreign currency, and interest rate fluctuations and their related impact on expected future cash flows and certain existing assets and liabilities. However, the Company may choose not to hedge certain exposures for a variety of reasons including, but not limited to, Company policy, accounting considerations, or the prohibitive economic cost of hedging particular exposures. There can be no assurance the hedges will offset more than a portion of the financial impact resulting from movements in commodity pricing, foreign currency exchange, or interest rates. Interest rate swaps At times we may have receive variable, pay fixed, interest rate swaps to manage the exposure to variable interest rates of the Ryerson Credit Facility. In June 2019, we entered into a forward agreement for $60 million of “pay fixed” interest at 1.729% through June 2022 and in November 2019, we entered into a forward agreement for $100 million of “pay fixed” interest at 1.539% through November 2022. In August 2022, we terminated our $100 million forward agreement, therefore, no interest rate swaps In the fourth quarter of 2020, in connection with the redemption options under the 2028 Notes, the Company recorded an embedded derivative in other current assets on its Consolidated Balance Sheet, with changes in value recorded within other income and (expense), net within the Consolidated Statements of Operations. When the 2028 Notes were fully redeemed and repurchased in 2022, the embedded derivative value was adjusted to zero. The Company currently does not account for its commodity contracts and foreign exchange derivative contracts as hedges but rather marks them to market with a corresponding offset to current earnings. The Company regularly reviews the creditworthiness of its derivative counterparties and does not expect to incur a significant loss from the failure of any counterparties to perform under any agreements.
The following table summarizes the location and fair value amount of our derivative instruments reported in our Consolidated Balance Sheets as of December 31, 2023 and 2022. As of December 31, 2023, and 2022, all derivative instruments held by the Company were subject to master netting arrangements with various financial institutions. The Company’s accounting policy is to not offset these positions in its Consolidated Balance Sheets. The gross derivative assets and
79 The following table presents the volume of the Company’s activity in derivative instruments as of December 31,
The following table summarizes the location and amount of gains and losses on derivatives not designated as hedging instruments reported in our Consolidated Statements of Operations for the years ended December 31, 2023, 2022,
Fair Value Measurements
The estimated fair value of the Company’s cash and cash equivalents, restricted cash, receivables less provisions, and accounts payable approximate their carrying amounts due to the short-term nature of these financial instruments.
80 Note The following table details the changes in accumulated other comprehensive income (loss) for the years ended December 31,
The following tables detail the reclassifications out of accumulated other comprehensive income (loss) for the years ended December 31,
Note We are a leading value-added processor and distributor of industrial metals with operations in the U.S., Canada, Mexico, and China. We purchase large quantities of metal products from primary producers and sell these materials in smaller quantities to a wide variety of metals-consuming industries. Nearly 80% of the metals products sold are processed by us by bending, beveling, blanking, blasting, burning, cutting-to-length, drilling, embossing, flattening, forming, grinding, laser cutting, machining, notching, painting, perforating, polishing, punching, rolling, sawing, scribing, shearing, slitting, stamping, tapping, threading, welding, or other techniques to process materials to a specified thickness, length, width, shape, and surface quality pursuant to specific customer orders. Revenue Accounting Policy Revenue is recognized based on the consideration expected to be received for delivery of as-is or processed metal products when, or as, the Company satisfies its contractual obligation to transfer control of a product to a customer, which we refer to as a performance obligation. Predominately all of our contracts contain a single performance obligation. The majority of our revenue is recognized at a point in time. The Company has determined that the most definitive demonstration that control has transferred to a customer is physical delivery, with the exception of bill and hold and consignment transactions. The Company’s bill-and-hold transactions are arrangements where a customer requests that we bill them for a product even though we retain physical possession of the product until it is subsequently delivered to the customer. Bill and hold revenue is recorded when all of the criteria within ASC 606 are met. Consignment transactions are arrangements where the Company transfers product to a customer location but retains ownership and control of such product until it is used by the customer. Revenue for consignment arrangements is recognized upon the customer’s usage. Revenues associated with products which we believe have no alternative use, and where the Company has an enforceable right to payment, are recognized on an over time basis. Products with no alternative use include products made from unique alloys, custom extrusions, non-standard gauges, items that have been processed to a custom size that cannot be cost effectively reworked to a standard size, or items processed to customer specific drawings or specifications. Over-time revenues are recorded in proportion with the progress made toward completing the performance obligation. Ryerson uses both input and output methods of measuring progress towards completion based on the type and extent of processing completed. Input methods are used for complex processing with multiple steps occurring over multiple days. Under the input method, the measure of performance, commonly called percentage of completion, is the ratio of costs incurred to date to the total estimated costs at completion for the products. Output methods are used for products with minimal processing where the normal pattern of production is less than one day. In these cases, the progress towards completion is measured based on the number of products on hand and ready for delivery in comparison to the total number of products in the order. Significant judgment is required in determining which products qualify for over time revenue recognition, the methodology to be used in calculating the progress toward completion, and estimating the costs incurred to date and the total cost at completion. Revenue is recorded net of returns, allowances, customer discounts, and incentives. Sales taxes collected from customers and remitted to governmental authorities are accounted for on a net (excluded from revenues) basis. Prices are generally fixed at the time of order confirmation. At each quarter end, the Company calculates an estimate of potential cash discounts and returns and allowances that could be taken by customers that are associated with outstanding accounts receivable, as well as estimates of customer rebates. Cash discounts and returns and allowances are calculated based on historical experience. Customer rebates are estimated based on actual sales and projections over the rebate period. The Company has elected to treat shipping and handling costs as an activity necessary to fulfill the performance obligation to transfer product to the customer and not as a separate performance obligation. Shipping and handling costs are estimated at quarter end in proportion to revenue recognized for transactions where actual costs are not yet known. Shipping and handling costs are included in warehousing, delivery, selling, general, and administrative expense. The balance recognized related to accrued shipping and handling costs was The Company’s performance obligations are typically short-term in nature. As a result, the Company has elected the practical expedient that provides an exemption of the disclosure requirements regarding information about remaining performance obligations on contracts that have original expected durations of one year or less.
Disaggregated Revenue We have one operating and reportable segment, metals service centers. The Company derives substantially all of its sales from the distribution of metals. The following table shows the Company’s percentage of sales by major product line:
A significant majority of the Company’s sales are attributable to its U.S. operations. The only operations attributed to foreign countries relate to the Company’s subsidiaries in Canada, China, and Mexico. See Note Revenue is recognized either at a point in time or over time based on if the contract has an enforceable right to payment and the type of product that is being sold to the customer with products that are determined to have no alternative use being recognized over time. The following table summarizes revenues by the type of item sold:
Contract Balances A receivable is recognized in the period in which an invoice is issued, which is generally when the product is delivered to the customer. Payment terms on invoiced amounts are typically 30 days from the invoice date. We do not have any contracts with significant financing components. Receivables, which are included in accounts receivables within the Consolidated Balance Sheets, from contracts with customers were $ Contract assets, which consist primarily of revenues recognized over time that have not yet been invoiced and
liabilities within the Consolidated Balance Sheets. Contract assets amounted to $18.8
Note Provisions for allowances and claims on accounts receivables and contract assets are based upon historical rates, expected trends, and estimates of potential returns, allowances, customer discounts, and incentives. The Company considers all available information when assessing the adequacy of the provision for allowances, claims, and doubtful accounts. 83 The Company performs ongoing credit evaluations of customers and sets credit limits based upon review of the customers’ current credit information, payment history, and the current economic and industry environments. The Company’s credit loss reserve consists of two parts: a) a provision for estimated credit losses based on historical experience and b) a reserve for specific customer collection issues that the Company has identified. Estimation of credit losses requires adjusting historical loss experience for current economic conditions and judgments about the probable effects of economic conditions on certain customers. The following table provides a reconciliation of the provision for credit losses reported within the Consolidated Balance Sheets as of December 31,
Note The elements of the provision
Income taxes differ from the amounts computed by applying the federal tax rate as follows:
84 The U.S. Tax Cuts and Jobs Act subjects a US shareholder to tax on global intangible low-taxed income (“GILTI”) earned by certain foreign subsidiaries. The FASB Staff Q&A, Topic 740, No. 5, Accounting for Global Intangible Low-Taxed Income, states that an entity can make an accounting policy election to either recognize deferred taxes for temporary basis differences expected to reverse as GILTI in future years or provide for the tax expense related to GILTI in the year the tax is incurred. After considering the two options, the Company has elected to provide for the tax expense related to GILTI in the year the tax will occur. For the year ended December 31, On August 16, 2022 the U.S. government enacted the Inflation Reduction Act (“IRA”). The IRA includes, among other provisions, a 1 percent excise tax on share repurchases as well as a 15 percent corporate alternative minimum tax (“CAMT”) on corporations with “adjusted financial statement income” in excess of $1 billion for any 3-year period ending with 2022 or later. Currently, we do not meet the requirements for CAMT and do not expect any excise tax that may be due on future stock repurchases to have a material adverse impact to our financial statements. As of December 31, 2023, the Company has accrued $1.0 million for excise tax payable on stock repurchases. Both provisions of the IRA are effective for periods after December 31, 2022. Certain amounts as of December 31, 2022 in the table below have been adjusted to include the presentation of gross deferred tax assets and liabilities associated with the operating lease assets and operating lease liabilities. The components of the deferred income tax assets and liabilities arising under FASB ASC 740, “Income Taxes” (“ASC 740”) were as follows:
The Company will maintain a valuation allowance on certain deferred tax assets until such time as in management’s judgment, considering all available positive and negative evidence, the Company determines that these deferred tax assets are more likely than
not realizable. The Company’s deferred tax assets include $ Earnings from the Company’s foreign subsidiaries are considered to be indefinitely reinvested and, accordingly, no provision for U.S. federal and state income taxes or foreign withholding tax has been made in our consolidated financial statements related to the indefinitely reinvested earnings. At December 31, 85 The Company accounts for uncertain income tax positions in accordance with ASC 740. A reconciliation of the beginning and ending amount of unrecognized tax benefits is as follows:
The Company and its subsidiaries are subject to U.S. federal income tax as well as income tax of multiple state and foreign jurisdictions. The Company has substantially concluded all U.S. federal income tax matters for all years through We recognize interest and penalties related to uncertain tax positions in income tax expense. We had approximately $ Note
Basic earnings
The following table sets forth the calculation of basic and diluted earnings
Note Bargaining Unit Pension Plan Termination. In the first quarter of 2024, the Ryerson Canada Bargaining Unit Pension Plan made $1.2 million of lump sum payments to plan participants and purchased $5.0 million of annuities on behalf of plan participants. The lump sum payments and annuity purchases consisted of all of the existing liabilities of the Ryerson Canada Bargaining Unit 86 Pension Plan, resulting in the termination of the plan. The Ryerson Canada Bargaining Unit Pension Plan was fully funded as of the termination date, and as such, all lump sum payments and annuity purchases were funded with pension plan assets. As a result, the Company recorded a $2.2 million settlement loss in the first quarter of 2024. Dividends.On February
RYERSON HOLDING CORPORATION AND SUBSIDIARY COMPANIES SCHEDULE II—VALUATION AND QUALIFYING ACCOUNTS FOR THE YEARS ENDED DECEMBER 31, 2023, 2022, (In millions)
NOTES: (A) Bad debts written off of $ (B) Adjustment to foreign tax credits and corresponding valuation allowance. (C) Reversals of valuation allowances due to change in realizability of state and foreign net operating loss deferred tax assets.
88 ITEM 9. CHANGES IN AND DISAGREEMENTS WITH ACCOUNTANTS ON ACCOUNTING AND FINANCIAL DISCLOSURE. None. ITEM 9A. CONTROLS AND PROCEDURES. Evaluation of Disclosure Controls and Procedures We maintain disclosure controls and procedures that are designed to ensure that information required to be disclosed in our reports filed under the Securities Exchange Act of 1934, as amended, is recorded, processed, summarized, and reported within the time periods specified in the SEC’s rules and forms and that such information is accumulated and communicated to our management, including our Chief Executive Officer and Chief Financial Officer, as appropriate, to allow for timely decisions regarding required disclosure. In designing and evaluating the disclosure controls and procedures, management recognizes that any controls and procedures, no matter how well designed and operated, can provide only reasonable assurance of achieving the desired control objectives, and management is required to apply its judgment in evaluating the cost-benefit relationship of possible controls and procedures. As required by SEC Rule 15d-15(b), we carried out an evaluation, under the supervision and with the participation of our management, including the Chief Executive Officer and Chief Financial Officer, of the effectiveness of the design and operation of our disclosure controls and procedures pursuant to SEC Rule 13a-15 as of the end of the period covered by this report. Based on the foregoing, our Chief Executive Officer and Chief Financial Officer concluded that our disclosure controls and procedures were effective as of December 31, Management’s Annual Report on Internal Control Over Financial Reporting and Attestation Report of Independent Registered Public Accounting Firm The report of management on our internal control over financial reporting as of December 31, Changes in Internal Control over Financial Reporting There have been no changes in the Company’s internal controls over financial reporting that has materially affected or is reasonably likely to materially affect the Company’s internal controls over financial reporting during the quarter ended December 31, ITEM 9B. OTHER INFORMATION.
PART III ITEM 10. DIRECTORS, EXECUTIVE OFFICERS, AND CORPORATE GOVERNANCE. The information required by this item is incorporated by reference to our Proxy Statement for the Code of Ethics Our Board of Directors has adopted a Code of Ethics and Business Conduct applicable to all officers, directors, and employees, which contains the ethical principles by which our Chief Executive Officer, Chief Financial Officer, and General Counsel, among others, are expected to conduct themselves when carrying out their duties and responsibilities. A copy of our Code of Ethics may be found on our Investor Relations website under “Governance Documents” at http://ir.ryerson.com. Our website is not incorporated by reference into this Annual Report. We will provide a copy of our Code of Ethics to any person, without charge, upon request, by writing to the Compliance Officer, Ryerson Holding Corporation, 227 West Monroe Street, 27th Floor, Chicago, Illinois 60606 (telephone number (312) 292-5000). We intend to satisfy the disclosure requirement under Item 5.05 of Form 8-K regarding an amendment to, or waiver from, a provision of our Code of Ethics and Business Conduct by posting such information on our website at http://ir.ryerson.com or by filing a Form 8-K with the SEC. We have an insider trading policy that governs the purchase, sale, and other dispositions of our securities by our directors, officers, and employees, and by the Company itself, that we believe is reasonably designed to promote compliance with insider trading laws, rules, and regulations and New York Stock Exchange listing standards. The insider trading policy is filed as Exhibit 19.1 to this Annual Report. ITEM 11. EXECUTIVE COMPENSATION. Information concerning compensation of our executive officers and directors for the year ended December 31, Information concerning compensation committee interlocks is presented under the caption “Compensation Committee—Compensation Committee Interlocks and Insider Participation” in our proxy statement and is incorporated herein by reference. The report of our Compensation Committee can be found under the caption “Compensation Committee Report” in our proxy statement and is incorporated herein by reference. ITEM 12. SECURITY OWNERSHIP OF CERTAIN BENEFICIAL OWNERS AND MANAGEMENT AND RELATED STOCKHOLDER MATTERS. Information concerning the security ownership of certain beneficial owners as of February Information concerning the security ownership of our directors and executive officers as of February Securities Authorized for Issuance under Equity Compensation Plans Our stockholders have approved our 2014 Omnibus Incentive Plan, or 2014 Plan, which is the Company’s only equity compensation plan.
Securities Authorized for Issuance under Equity Compensation Plans The following table sets forth, as of December 31,
(1) Includes (i) (2) Once vested, each stock option can be exercised at a price of $16.50 in exchange for one share of the Company’s common stock. (3) All the shares of common stock that Information concerning the independence of our directors, certain relationships, and related transactions during ITEM 14. PRINCIPAL ACCOUNTANT FEES AND SERVICES. Information concerning principal accountant fees and services is set forth under the captions “Items You May Vote On—Ratification of the Appointment of Independent Registered Public Accounting Firm,” “Audit Committee—Audit, Audit-Related, and Other Non-Audit Services,” and “Audit Committee—Pre-Approval Policies” in our proxy statement and is incorporated herein by reference.
PART IV ITEM 15. EXHIBITS AND FINANCIAL STATEMENT SCHEDULES. (a) Financial Statements and Schedules The following financial statements and schedules listed below are included in this Form 10-K: Financial Statements (See Item 8) Schedule II All other schedules are omitted because the required information is not present or is not present in amounts sufficient to require submission of the schedules. (b) Exhibits EXHIBIT INDEX
94
* Schedules and exhibits have been omitted pursuant to Item 601(b)(2) of Regulation S-K. Ryerson agrees to furnish supplementally to the Securities and Exchange Commission a copy of any omitted schedule or exhibit upon request, subject to Ryerson’s right to request confidential treatment of any requested schedule or exhibit. ** Furnished herewith.
SIGNATURES Pursuant to the requirements of Section 13 or 15(d) of the Securities Exchange Act of 1934, Ryerson Holding Corporation has duly caused this report to be signed on its behalf by the undersigned, thereunto duly authorized.
Date: February Pursuant to the requirements of the Securities Exchange Act of 1934, this report has been signed below by the following persons on behalf of the registrant and in the capacities and on the dates indicated.
| ||||||||||||||||||||||||||||||||||||||||||||||||||||||||||||||||||||||||||||||||||||||||||||||||||||||||||||||||||||||||||||||||||||||||||||||||||||||||||||||||||||||||||||||||||||||||||||||||||||||||||||||||||||||||||||||||||||||||||||||||||||||||||||||||||||||||||||||||||||||||||||||||||||||||||||||||||||||||||||||||||||||||||||||||||||||||||||||||||||||||||||||||||||||||||||||||||||||||||||||||||||||||||||||||||||||||||||||||||||||||||||||||||||||||||||||||||||||||||||||||||||||||||||||||||||||||||||||||||||||||||||||||||||||||||||||||||||||||||||||||||||||||||||||||||||||||||||||||||||||||||||||||||||||||||||||||||||||||||||||||||||||||||||||||||||||||||||||||||||||||||||||||||||||||||||||||||||||||||||||||||||||||||||||||||||||||||||||||||||||||||||||||||||||||||||||||||||||||||||||||||||||||||||||||||||||||||||||||||||||||||||||||||||||||||||||||||||||||||||||||||||||||||||||||||||||||||||||||||||||||||||||||||||||||||||||||||||||||||||||||||||||||||||||||||||||||||||||||||||||